| FREE WRITING PROSPECTUS | ||
| FILED PURSUANT TO RULE 433 | ||
| REGISTRATION FILE NO.: 333-226943-07 | ||
July 8, 2020
FREE WRITING PROSPECTUS
COLLATERAL TERM SHEET
BENCHMARK 2020-B18 |
Deutsche Mortgage & Asset Receiving Corporation
Depositor
| Deutsche Bank Securities | Citigroup | Goldman Sachs & Co. LLC | J.P. Morgan |
| Co-Lead Managers and Joint Bookrunners | |||
The depositor has filed a registration statement (including the prospectus) with the Securities and Exchange Commission (File No. 333-226943) for the offering to which this communication relates. Before you invest, you should read the prospectus in the registration statement and other documents the depositor has filed with the Securities and Exchange Commission for more complete information about the depositor, the issuing entity and this offering. You may get these documents for free by visiting EDGAR on the Securities and Exchange Commission website at www.sec.gov. Alternatively, the depositor or Deutsche Bank Securities Inc., any other underwriter, or any dealer participating in this offering will arrange to send you the prospectus if you request it by calling toll-free 1-800-503-4611 or by emailing: prospectus.cpdg@db.com. The offered certificates referred to in these materials, and the asset pool backing them, are subject to modification or revision (including the possibility that one or more classes of certificates may be split, combined or eliminated at any time prior to issuance or availability of a final prospectus) and are offered on a “when, as and if issued” basis. You understand that, when you are considering the purchase of these certificates, a contract of sale will come into being no sooner than the date on which the relevant class has been priced and we have verified the allocation of certificates to be made to you; any “indications of interest” expressed by you, and any “soft circles” generated by us, will not create binding contractual obligations for you or us. This free writing prospectus does not contain all information that is required to be included in the prospectus.
1
STATEMENT REGARDING ASSUMPTIONS AS TO SECURITIES, PRICING ESTIMATES AND OTHER INFORMATION
This material is for your information, and none of Deutsche Bank Securities Inc., J.P. Morgan Securities LLC, Citigroup Global Markets Inc., Goldman Sachs & Co. LLC or any other underwriter, (the “Underwriters”) are soliciting any action based upon it. This material is not to be construed as an offer to sell or the solicitation of any offer to buy any security in any jurisdiction where such an offer or solicitation would be illegal.
Neither this document nor anything contained herein shall form the basis for any contract or commitment whatsoever. The information contained herein is preliminary as of the date hereof. These materials are subject to change, completion or amendment from time to time. The information contained herein will be superseded by similar information delivered to you as part of the preliminary prospectus relating to the Benchmark 2020-B18 Mortgage Trust Commercial Mortgage Pass-Through Certificates, Series 2020-B18 (the "Offering Document"). The information contained herein supersedes any such information previously delivered and should be reviewed only in conjunction with the entire Offering Document. All of the information contained herein is subject to the same limitations and qualifications contained in the Offering Document. The information contained herein does not contain all relevant information relating to the underlying mortgage loans or mortgaged properties. Such information is described elsewhere in the Offering Document. The information contained herein will be more fully described elsewhere in the Offering Document. The information contained herein should not be viewed as projections, forecasts, predictions or opinions with respect to value. Prior to making any investment decision, prospective investors are strongly urged to read the Offering Document its entirety. Neither the Securities and Exchange Commission nor any state securities commission has approved or disapproved of these securities or determined if this free writing prospectus is truthful or complete. Any representation to the contrary is a criminal offense.
The attached information contains certain tables and other statistical analyses (the “Computational Materials”) which have been prepared in reliance upon information furnished by the Mortgage Loan Sellers. Numerous assumptions were used in preparing the Computational Materials, which may or may not be reflected herein. As such, no assurance can be given as to the Computational Materials’ accuracy, appropriateness or completeness in any particular context; or as to whether the Computational Materials and/or the assumptions upon which they are based reflect present market conditions or future market performance. The Computational Materials should not be construed as either projections or predictions or as legal, tax, financial or accounting advice. You should consult your own counsel, accountant and other advisors as to the legal, tax, business, financial and related aspects of a purchase of these securities. Any weighted average lives, yields and principal payment periods shown in the Computational Materials are based on prepayment and/or loss assumptions, and changes in such prepayment and/or loss assumptions may dramatically affect such weighted average lives, yields and principal payment periods. In addition, it is possible that prepayments or losses on the underlying assets will occur at rates higher or lower than the rates shown in the attached Computational Materials. The specific characteristics of the securities may differ from those shown in the Computational Materials due to differences between the final underlying assets and the preliminary underlying assets used in preparing the Computational Materials. The principal amount and designation of any security described in the Computational Materials are subject to change prior to issuance. None of the Underwriters or any of their respective affiliates makes any representation or warranty as to the actual rate or timing of payments or losses on any of the underlying assets or the payments or yield on the securities.
This document contains forward-looking statements. Those statements are subject to certain risks and uncertainties that could cause the success of collections and the actual cash flow generated to differ materially from the information set forth herein. While such information reflects projections prepared in good faith based upon methods and data that are believed to be reasonable and accurate as of the dates thereof, the depositor undertakes no obligation to revise these forward-looking statements to reflect subsequent events or circumstances. Individuals should not place undue reliance on forward-looking statements and are advised to make their own independent analysis and determination with respect to the forecasted periods, which reflect the issuer’s view only as of the date hereof.
| IMPORTANT NOTICE RELATING TO AUTOMATICALLY GENERATED EMAIL DISCLAIMERS |
Any legends, disclaimers or other notices that may appear at the bottom of the email communication to which this free writing prospectus is attached relating to (1) these materials not constituting an offer (or a solicitation of an offer), (2) no representation being made that these materials are accurate or complete and may not be updated or (3) these materials possibly being confidential, are not applicable to these materials and should be disregarded. Such legends, disclaimers or other notices have been automatically generated as a result of these materials having been sent via Bloomberg or another system.
2
Various Various, Various | Loan Specific Premarketing Term Sheet Agellan Portfolio | Cut-off Date Balance: Cut-off Date LTV: U/W NCF DSCR: U/W NOI Debt Yield: | $172,000,000 73.1% 1.78x 9.0% |
3
Various Various, Various | Loan Specific Premarketing Term Sheet Agellan Portfolio | Cut-off Date Balance: Cut-off Date LTV: U/W NCF DSCR: U/W NOI Debt Yield: | $172,000,000 73.1% 1.78x 9.0% |
4
Various Various, Various | Loan Specific Premarketing Term Sheet Agellan Portfolio | Cut-off Date Balance: Cut-off Date LTV: U/W NCF DSCR: U/W NOI Debt Yield: | $172,000,000 73.1% 1.78x 9.0% |
5
Various Various, Various | Loan Specific Premarketing Term Sheet Agellan Portfolio | Cut-off Date Balance: Cut-off Date LTV: U/W NCF DSCR: U/W NOI Debt Yield: | $172,000,000 73.1% 1.78x 9.0% |
6
Various Various, Various | Loan Specific Premarketing Term Sheet Agellan Portfolio | Cut-off Date Balance: Cut-off Date LTV: U/W NCF DSCR: U/W NOI Debt Yield: | $172,000,000 73.1% 1.78x 9.0% |
| Mortgage Loan Information | |
| Loan Seller: | JPMCB |
| Loan Purpose: | Refinance |
| Credit Assessment | |
| (Fitch/S&P/KBRA): | [ ](sf) / [ ](sf) / [ ](sf) |
| Borrower Sponsor(1): | Elad Canada, Inc. |
| Borrowers(1): | Various |
| Original Balance(2): | $172,000,000 |
| Cut-off Date Balance(2): | $172,000,000 |
| % by Initial UPB: | [ ]% |
| Interest Rate: | 4.4000% |
| Payment Date: | 7th of each month |
| First Payment Date: | September 7, 2020 |
| Maturity Date: | August 7, 2025 |
| Amortization: | Interest Only |
| Additional Debt(2)(3) : | $231,000,000 Pari Passu Debt; $31,000,000 Mezzanine Debt |
| Call Protection(4): | L(24), D(33), O(4) |
| Lockbox / Cash Management: | Hard / In Place |
| Reserves(5) | |||
| Initial | Monthly | Cap | |
| Taxes: | $0 | Springing | NAP |
| Insurance: | $0 | Springing | NAP |
| Common Charges: | $0 | Springing | NAP |
| Required Repairs: | $2,985,266 | NAP | NAP |
| Replacement: | $0 | $101,570 | $3,656,506 |
| TI/LC: | $6,410,963 | $431,671 | $15,540,151 |
| Working Capital Reserve: | $2,000,000 | $0 | NAP |
| Gap Rent Reserve: | $172,050 | $0 | NAP |
| Property Information | ||
| Single Asset / Portfolio: | Portfolio of 46 properties | |
| Property Type: | Various | |
| Collateral: | Fee Simple | |
| Location: | Various | |
| Year Built / Renovated: | Various / Various | |
| Total Sq. Ft.(6): | 6,094,177 | |
| Property Management(7): | Various | |
| Underwritten NOI(8): | $36,198,452 | |
| Underwritten NCF(8): | $32,909,376 | |
| Appraised Value(9): | $551,000,000 | |
| Appraisal Date: | Various | |
| Historical NOI | ||
| Most Recent NOI(10): | NAV | |
| 2019 NOI: | $40,473,151 (December 31, 2019) | |
| 2018 NOI(11): | $38,961,287 (December 31, 2018) | |
| 2017 NOI(11): | $33,762,598 (December 31, 2017) | |
| Historical Occupancy | ||
| Most Recent Occupancy(12): | 90.4% (June 1, 2020) | |
| 2019 Occupancy: | 96.2% (December 31, 2019) | |
| 2018 Occupancy: | 96.1% (December 31, 2018) | |
| 2017 Occupancy: | 94.7% (December 31, 2017) | |
| Financial Information | ||||||
| Tranche | Cut-off Date Balance | Balance per Sq. Ft. Cut-off / Balloon | LTV Cut-off / Balloon | U/W DSCR NOI / NCF | U/W Debt Yield NOI / NCF | U/W Debt Yield at Balloon NOI / NCF |
| Mortgage Loan | $100,000,000 | |||||
| Pari Passu Notes | $131,000,000 | |||||
| Total Senior Notes | $231,000,000 | $38 / $38 | 41.9% / 41.9% | 3.34x / 3.04x | 15.7% / 14.2% | 15.7% / 14.2% |
| B Note | $172,000,000 | |||||
| Whole Loan | $403,000,000 | $66 / $66 | 73.1% / 73.1% | 1.96x / 1.78x | 9.0% / 8.2% | 9.0% / 8.2% |
| Mezzanine Loan | $31,000,000 | |||||
| Total Debt | $434,000,000 | $71 / $71 | 78.8% / 78.8% | 1.70x / 1.54x | 8.3% / 7.6% | 8.3% / 7.6% |
| (1) | For a description of the Borrowers (as defined below) and the Borrower Sponsor (as defined below) see “The Borrowers / Borrower Sponsor” herein. |
| (2) | Represents the principal balance of the controlling subordinate note B. The Agellan Portfolio Whole Loan (as defined below), is expected to be evidenced by eight senior pari passu notes and a controlling subordinate note B, with an aggregate outstanding principal balance as of the Cut-off Date of $403.0 million. For additional information, see “The Loan” herein. |
| (3) | See “Current Mezzanine or Subordinate Indebtedness" herein. |
| (4) | The lockout period will be at least 24 payments beginning with and including the first payment date of September 7, 2020. The Borrowers have the option to defease the full $403.0 million Agellan Portfolio Whole Loan after the earlier to occur of (i) two years after the closing date of the securitization that includes the last note to be securitized and (ii) the third anniversary of the first payment date. The actual lockout period may be longer. The interest only period and Call Protection presented in the Mortgage Loan Information above are inclusive of the additional September 2020 interest payment to be deposited by JPMCB. |
| (5) | See “Initial and Ongoing Reserves” herein. |
| (6) | Total Sq. Ft. is exclusive of 344 sq. ft. associated with remeasurements. |
| (7) | For a description of the Property Managers (as defined below) see “Property Management” below. |
| (8) | Underwritten NOI and Underwritten NCF are inclusive of contractual rent steps taken through June 1, 2021 and includes the ALDI, Inc. expansion of approximately 24,597 sq. ft. and HCSC (as defined below) relocation at the Naperville Woods Office Center property. U/W Base Rent has been further adjusted to account for a 10.0% stress to tenants who missed full or partial rent payments in April, May and/or June or have requested rent relief during the COVID-19 pandemic. The total stress to U/W Base Rent is $241,419. An additional stress loss adjustment of 10.0% was applied to total reimbursements for any tenants that missed full rent payments in April, May and/or June. The total stress to reimbursements is $85,560. All U/W Base Rent figures herein are exclusive of rent attributable to vacant space. |
| (9) | The Appraised Value is based on an aggregate “as-is” value of the Agellan Properties (as defined below) and is inclusive of excess land value that is defined in each individual Agellan Property appraisal and serves as collateral for the Agellan Portfolio Whole Loan. The excess vacant land parcels are associated with the Sarasota Distribution Hub and Supervalu properties may be released pursuant to satisfying conditions set forth in “Partial Release” below. |
| (10) | Most Recent NOI is not available as the Borrowers are only required to report financials on an annual basis. |
| (11) | The increase from 2018 NOI and 2017 NOI is due to the increase of assets in the Agellan Portfolio from 41 to 46. |
| (12) | Most Recent Occupancy is reflective of the exclusion of known vacancies and tenants that have gone dark at the Agellan Properties. Occupancy inclusive of such tenant spaces is approximately 93.4%. |
7
Various Various, Various | Loan Specific Premarketing Term Sheet Agellan Portfolio | Cut-off Date Balance: Cut-off Date LTV: U/W NCF DSCR: U/W NOI Debt Yield: | $172,000,000 73.1% 1.78x 9.0% |
Executive Summary.
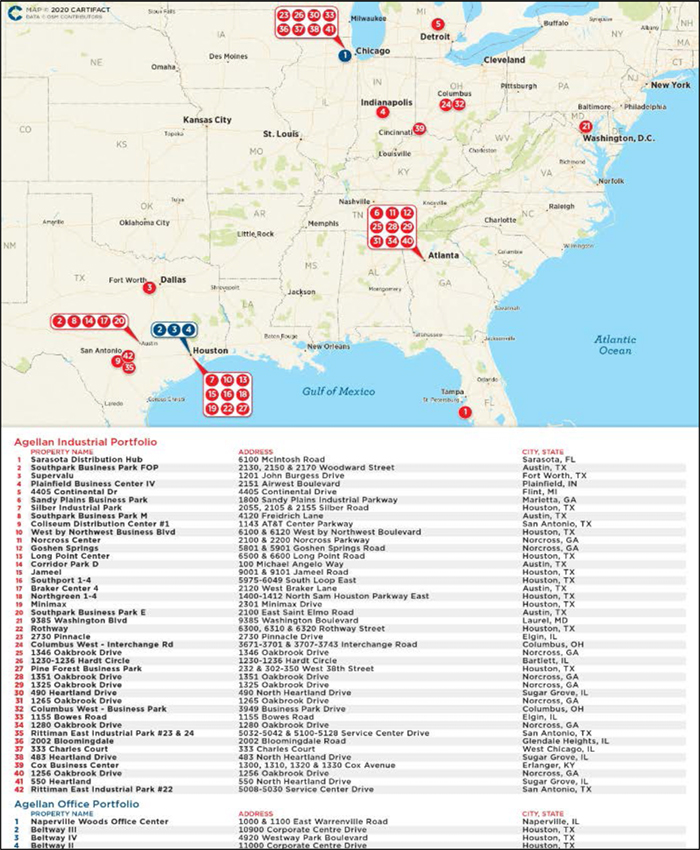
| ■ | The Whole Loan. JPMorgan Chase Bank is providing an aggregate $434.0 million five-year, fixed-rate, interest only whole loan and mezzanine financing secured by the fee simple interest in the Agellan Portfolio, a 46-property portfolio of industrial and office properties in the aggregate comprising 6,094,177 sq. ft. located throughout nine states The Agellan Portfolio Whole Loan, along with $31.0 million in mezzanine debt will be used to pay off existing debt of $418.6 million, fund upfront reserves for outstanding tenant improvements and leasing commissions, working capital, capital expenditures, deferred maintenance, gap rent and cover closing costs. |
| ■ | Collateral Summary. The Agellan Portfolio Whole Loan is secured by a portfolio of 46 properties that are diversified across nine states throughout 12 distinct markets. The Agellan Properties were constructed between 1967 and 2010 and are generally located in primary and secondary markets in suburban infill locations with good access to transportation. |
| - | Industrial Concentrated Portfolio: The Agellan Portfolio is comprised of 42 industrial properties (5,248,373 sq. ft.; 86.1% of NRA; 71.3% of U/W Base Rent) and four office properties (845,804 sq. ft.; 13.9% of NRA; 28.7% of U/W Base Rent). |
| o | The largest office property, Naperville Woods Office Center, is located in Naperville, Illinois and accounts for 12.8% of the Whole Loan ALA. The property is currently 95.4% occupied by 13 tenants and has a maintained an average occupancy of 93.8% since 2013. |
Property and Tenant Granularity: As of June 1, 2020, the Agellan Portfolio is approximately 93.4% leased (90.4% leased excluding dark tenants and known vacates) and consists of approximately 250 tenants across approximately 5.5 million sq. ft. of occupied space, with a weighted average lease term of 2.9 years.
| o | No individual Agellan Property accounts for more than 13.0% of Whole Loan ALA or 14.9% of NRA. |
| o | The largest tenant, Health Care Service Corp. (Moody's/Fitch/S&P: A3/A-/AA-), accounts for only 6.9% of U/W Base Rent. Health Care Service Corporation is an Independent Licensee of the Blue Cross and Blue Shield Associations and the largest customer-owned health insurer in the United States. |
| o | Four of the top ten tenants (Health Care Service Corp., General Motors LLC, Life Technologies Corporation and Allstate Insurance Co.) have investment grade credit ratings by one or more of Moody’s, Fitch or S&P and account for approximately 12.4% and 18.3% of the Agellan Portfolio’s Total NRA and U/W Base Rent, respectively. |
| - | Stable Occupancy: The Agellan Portfolio has demonstrated consistent occupancy with an average occupancy rate of approximately 93.5% since 2013. |
| - | Consistent Historic Operating Performance: The Agellan Portfolio has demonstrated consistent NOI growth year-over-year with an NOI CAGR from 2015 to 2019 for same reporting assets ranging from 2.2% to 7.0%. |
| - | Strong Leasing Momentum: Since May 2019, the Borrower Sponsor has executed 38 new, renewal and expansion leases for approximately 470,218 sq. ft. Renewal leases have had weighted average rent increases of approximately 8.7% and newly executed leases have had weighted average rent increases of 8.3%. |
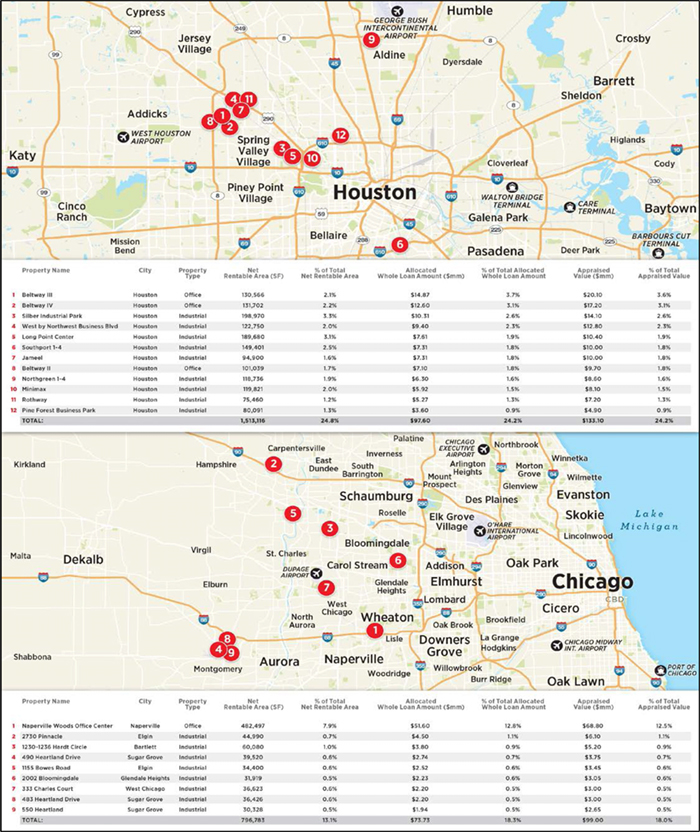
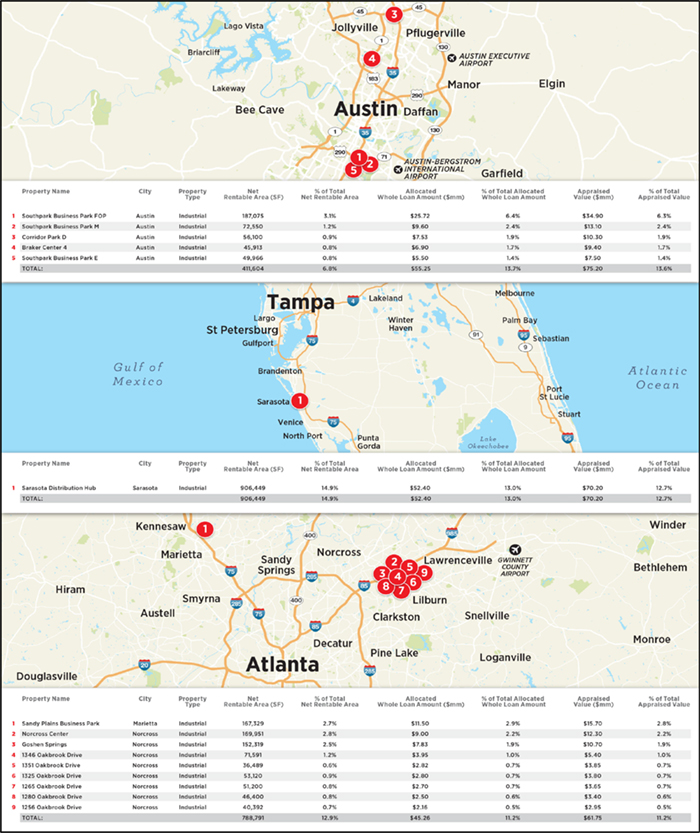
| - | Geographic Diversity Across Markets: The portfolio is diversified across 12 distinct markets. The top five markets by U/W Base Rent are Houston (23.2%), Chicago (22.9%), Austin (12.9%), Tampa (11.7%) and Atlanta (10.9%). |
| - | COVID-19 Resiliency: The Agellan Portfolio has achieved significant rent collections during the COVID-19 pandemic. Of the 250 unique tenants occupying the Agellan Portfolio, the Borrower Sponsor received approximately 97.0% rent collections for June 2020 and approximately 97.0% rent collections for both April and May 2020. The top ten tenants, representing 38.5% of NRA and 41.0% of U/W Base Rent have paid rent and have not requested rent relief. |
| - | On-going Reserves: To mitigate rollover during the term of the Agellan Portfolio Whole Loan, the Agellan Portfolio Whole Loan is structured with an on-going TI/LC collections of $0.85 per sq. ft. per year and replacements reserves of $0.33 per sq. ft. per year, both of which will be capped at 3 years of collections. The reserves equate to approximately $5.8 million in annual collections and capped at approximately $19.2 million. |
| - | Sponsor Equity: The Borrower Sponsor acquired 42 of the assets in early 2019 and four of the assets in early 2020 and has a current cost basis of approximately $507.8 million. The Borrower Sponsor’s total cash equity in the Agellan Portfolio will be approximately $185.5 million. |
8
Various Various, Various | Loan Specific Premarketing Term Sheet Agellan Portfolio | Cut-off Date Balance: Cut-off Date LTV: U/W NCF DSCR: U/W NOI Debt Yield: | $172,000,000 73.1% 1.78x 9.0% |
The Loan. The Agellan Portfolio mortgage loan, with an aggregate outstanding balance of $403.0 million (the “Agellan Portfolio Whole Loan”), is expected to be originated on or about July 15, 2020 (the “Origination Date”). We cannot assure you that all or any portion of the Agellan Portfolio Whole Loan will be originated. Furthermore, the terms of the final Agellan Portfolio Whole Loan documents may differ, and in some cases, materially differ, from the terms as described herein.
The Agellan Portfolio Whole Loan is expected to be a fixed rate loan secured by first mortgages encumbering the borrowers’ fee simple interests in a 46 property portfolio of industrial and office properties in the aggregate comprising of approximately 6,094,177 sq. ft. located throughout nine states (the “Agellan Portfolio” or the “Agellan Properties”). The Agellan Portfolio Whole Loan is expected to be evidenced by (i) seven senior pari passu notes with an aggregate Cut-off Date principal balance of $231.0 million (the “Agellan Portfolio Senior Notes”) and (ii) a controlling subordinate fixed rate Note B with a Cut-off Date principal balance of $172.0 million (the “Agellan Portfolio Subordinate Note”). The Agellan Portfolio Senior Notes will be senior to the Agellan Portfolio Subordinate Note. The Agellan Portfolio Subordinate Note and two of the Agellan Portfolio Senior Notes, Note A-1 and Note A-5 will be contributed to the Benchmark 2020-B18 mortgage trust, but the Agellan Portfolio Subordinate Note will not be included in the mortgage pool. Payments allocated to the Agellan Portfolio Subordinate Note will be paid to the holders of the Loan-Specific Certificates as described in “Description of the Mortgage Pool—The Whole Loans—The Serviced AB Whole Loan—The Agellan Portfolio Whole Loan” in the Preliminary Prospectus.
The relationship between the holders of the Agellan Portfolio Whole Loan will be governed by a co-lender agreement as described under “Description of the Mortgage Pool—The Whole Loans—The Serviced AB Whole Loan—Agellan Portfolio Whole Loan” in the Preliminary Prospectus.
| Total Debt Summary | |||||
| Note | Original Balance | Cut-off Date Balance | Note Holder | Controlling Piece | |
| Note A-1 | $75,000,000 | $75,000,000 | Benchmark 2020-B18 | No | |
| Note A-2 | 50,000,000 | 50,000,000 | JPMCB(1) | No | |
| Note A-3 | 30,000,000 | 30,000,000 | JPMCB(1) | No | |
| Note A-4 | 30,000,000 | 30,000,000 | JPMCB(1) | No | |
| Note A-5 | 25,000,000 | 25,000,000 | JPMCB(1) | No | |
| Note A-6 | 11,000,000 | 11,000,000 | JPMCB(1) | No | |
| Note A-7 | 10,000,000 | 10,000,000 | JPMCB(1) | No | |
| Total Senior Notes | $231,000,000 | $231,000,000 | |||
| Note B(2) | $172,000,000 | $172,000,000 | BMARK 2020-B18 | Yes(3) | |
| Whole Loan | $403,000,000 | $403,000,000 | |||
| Mezzanine Loan | $31,000,000 | $31,000,000 | Third Party | No | |
| Total Debt | $434,000,000 | $434,000,000 | |||
| (1) | Expected to be contributed to one or more future securitizations. |
| (2) | The Agellan Portfolio Subordinate Note will be subordinate in right of payment to the Agellan Portfolio Senior Notes. |
| (3) | The controlling Note B will be contributed to the issuing entity but will not be included in the mortgage pool. Payments allocated to the Agellan Portfolio Subordinate Note will be paid to the holders of the Loan-Specific Certificates as described in “Description of the Mortgage Pool—The Whole Loans—The Serviced AB Whole Loan—The Agellan Portfolio Whole Loan” in the Preliminary Prospectus. |
The Agellan Portfolio Whole Loan has a 61-month interest-only term. The Agellan Portfolio Senior Notes accrue interest a fixed rate of approximately 4.62820% per annum and the Agellan Portfolio Subordinate Note accrue interest at fixed rate of approximately 4.40000% per annum. The proceeds of the Agellan Portfolio Whole Loan were used to pay off existing debt encumbering 46 of the Agellan Properties of approximately $418.9 million, pay closing costs of approximately $5.7 million and fund escrows of approximately $11.6 million. As of year-end 2019, the Borrower Sponsor had a cost basis of approximately $507.8 million. The Borrower Sponsor’s total cash equity in the Agellan Portfolio will be approximately $185.5 million.
| Sources and Uses | ||||||
| Sources | Proceeds | % of Total | Uses | Proceeds | % of Total | |
| Senior Notes | $231,000,000 | 53.0% | Loan Payoff(1) | $418,924,922 | 95.7% | |
| Subordinate Note | 172,000,000 | 39.4% | TI/LC Reserve | 6,410,963 | 1.5% | |
| Mezzanine Loan | 31,000,000 | 7.1% | Required Repairs Reserve | 2,985,266 | 0.7% | |
| Sponsor Equity | 2,163,638 | 0.5% | Working Capital Reserve | 2,000,000 | 0.5% | |
| Gap Rent Reserve | 172,050 | 0.0% | ||||
| Closing Costs | 5,670,436 | 1.3% | ||||
| Total Sources | $436,163,638 | 100.0% | Total Uses | $436,163,638 | 100.0% | |
| (1) | Represents the refinance of the 42 of the Agellan Properties that were previously securitized in the MSC 2019-AGLN transaction and the balance sheet financing associated with the Sponsors’ recent acquisition of four of the Agellan Properties. |
9
Various Various, Various | Loan Specific Premarketing Term Sheet Agellan Portfolio | Cut-off Date Balance: Cut-off Date LTV: U/W NCF DSCR: U/W NOI Debt Yield: | $172,000,000 73.1% 1.78x 9.0% |
The Borrowers / Borrower Sponsor. The borrowers are Chicago Industrial Properties 1 LP, a Delaware limited partnership, Corridor Park LP, a Delaware limited partnership, Norcross Springs LP, a Delaware limited partnership, 6100 McIntosh LP, a Delaware limited partnership, 6100 McIntosh Vacant LP, a Delaware limited partnership, Agellan Commercial REIT U.S. L.P., a Delaware limited partnership, Continental Drive LP, a Delaware limited partnership, 9385 Washington Blvd. L.P., a Delaware limited partnership, Agellan Warrenville L.P., a Delaware limited partnership, 1300 Cox Avenue LP, a Delaware limited partnership and San Antonio Industrial One LP, a Delaware limited partnership each structured to be a bankruptcy-remote entity with two independent directors in its organizational structure (collectively, the “Borrowers”). Legal counsel to the Borrowers delivered a non-consolidation opinion in connection with the origination of the Agellan Portfolio Whole Loan. The Borrowers are indirectly owned and controlled by Elad Canada, Inc. (the “Borrower Sponsor” or “ELAD Canada”), a privately held, commercial real estate company specializing in the acquisition and development of commercial and residential properties. ELAD Canada was founded in 1997 and is based in Toronto, Canada. ELAD Canada has focused its business in central Canada, acquiring income producing properties, as well as development sites. As of 2020, ELAD Canada has 7.4 million square feet of income producing space, as well as 4.4 million square feet of construction in the pipeline and 6,000 residential units under development. Under the terms of the loan documents, Elad Genesis Limited Partnership, a subsidiary of the Borrower Sponsor, is the non-recourse carveout guarantor for the Agellan Portfolio Whole Loan and is required to maintain a minimum net worth of $100 million during the term of the loan. ELAD Canada is a part of the ELAD Group. Founded in 1992, ELAD Group is a real estate conglomerate with development projects in North America, Europe and Israel. ELAD Group has developed successful condominiums, hotels and mixed-use projects making its mark as a significant developer of ultra-luxury properties in New York City, like the Plaza Hotel. ELAD Group is focused on the acquisition, development and conversion of architecturally significant residential and commercial properties in key markets throughout North America.
The Borrower Sponsor has notified JPMCB that the controlling shareholder of the entity that owns ELAD Canada Realty Inc., has entered into a non-binding memorandum of understanding (“MOU”) to sell certain shares in Elad Canada Realty Inc., including and initial 37% of such shares to a joint venture between Plaza Partners and Argent Ventures. The non-binding MOU includes a call option in favor of the buyers and a put option in favor of the seller for the remaining 63% of ELAD Group. If the purchase of the 37% stake occurs, the buyers will take over day-to-day operations of ELAD Canada Realty Inc. In the event the transaction moves forward, the Borrower Sponsor anticipates the closing to occur in September 2020, assuming receipt of required regulatory and other approvals. Argent Ventures is a vertically-integrated, diversified real estate investment and development firm specializing in opportunistic, and value-add transactions through the United States. Founded in 1997 and headquartered in New York City, Argent Ventures pursues debt- and equity- related investments in multiple asset classes. Since its inception, Argent Ventures has purchased over $2.5 billion in real estate assets and debt instruments in major markets in the United States and Europe. Founded in 1981, Plaza Partners is a real estate developer and asset manager that focuses on rezoning and developing residential properties in strong urban locations within the greater Toronto area. Plaza Partners’ current portfolio includes approximately four million square feet of potential density. Under the terms of the loan agreement, the lender is expected to have the right to consent to the proposed sale.
10
Various Various, Various | Loan Specific Premarketing Term Sheet Agellan Portfolio | Cut-off Date Balance: Cut-off Date LTV: U/W NCF DSCR: U/W NOI Debt Yield: | $172,000,000 73.1% 1.78x 9.0% |
COVID-19 Update. As of June 1, 2020, the Agellan Properties have remained open; however, many office tenants have chosen to work remotely. The underwritten rent rolls as of the June 1, 2020, the Agellan Properties were approximately 93.4% occupied (inclusive of dark tenants and known vacates). For April, May and June of 2020, tenants representing approximately 97.7%, 96.7% and 97.0% of net rentable area, respectively, have paid rent in-full, with the Borrower Sponsor having collected approximately 97.8%, 97.8% and 96.6% of underwritten base rent, respectively. The top ten tenants, representing 38.6% of NRA and 41.0% of underwritten rent, had no issues with rent payment. 32 tenants representing approximately 5.5% of the underwritten base rent and 5.4% of the Agellan Properties net rentable have requested rent relief or have partial or no collections for the months of April, May and June. The five largest tenants that have put in formal requests for relief represent approximately 2.0% of NRA and approximately 1.8% of U/W Base Rent.
As of June 2020, none of the tenants have been granted a rent deferral and 25 tenants (totaling 5.4% of NRA) are in discussions with the borrowers for rent relief.
| COVID-19 Impact on Rent Collections | |||||||||||||
| No. | Property | Market | Property Type | Impacted Tenant Sq. Ft. | % of Total Sq.Ft. | Lease Expiration | U/W Potential Gross Rent | U/W Gross Rent Loss | % Unpaid April Gross Rent | % Unpaid May Gross Rent | % Unpaid June Gross Rent | Formal Relief Request (Yes/No) | |
| 26 | Rothway | Houston | Industrial | 29,230 | 0.5% | 2/28/2021 | $405,904 | $40,590 | 0.0% | 0.0% | 0.0% | Yes | |
| 38 | Cox Business Center | Cincinnati | Industrial | 27,040 | 0.4% | 4/30/2024 | $171,271 | $17,127 | 100.0% | 77.0% | 0.0% | Yes | |
| 16 | Long Point Center | Houston | Industrial | 24,482 | 0.4% | 9/30/2022 | $156,103 | $15,610 | 0.0% | 77.0% | 100.0% | Yes | |
| 14 | Norcross Center | Atlanta | Industrial | 19,848 | 0.3% | 5/31/2021 | $133,557 | $13,356 | 100.0% | 59.5% | 59.5% | Yes | |
| 13 | West by Northwest Business Blvd | Houston | Industrial | 18,790 | 0.3% | 1/31/2023 | $180,886 | $18,089 | 100.0% | 100.0% | 0.0% | No | |
| 23 | Minimax | Houston | Industrial | 17,500 | 0.3% | 11/30/2020 | $103,332 | $10,333 | 0.0% | 100.0% | 100.0% | Yes | |
| 12 | Southpark Business Park M | Austin | Industrial | 14,361 | 0.2% | 1/31/2022 | $255,120 | $25,512 | 0.0% | 0.0% | 69.0% | No | |
| 16 | Long Point Center | Houston | Industrial | 13,500 | 0.2% | 10/31/2020 | $87,699 | $8,770 | 0.0% | 0.0% | 0.0% | Yes | |
| 25 | 9385 Washington Blvd | Baltimore | Industrial | 10,800 | 0.2% | 8/31/2021 | $140,888 | $14,089 | 0.0% | 0.0% | 100.0% | No | |
| 25 | 9385 Washington Blvd | Baltimore | Industrial | 10,800 | 0.2% | 9/30/2022 | $122,654 | $12,265 | 100.0% | 88.6% | 23.8% | Yes | |
| 14 | Norcross Center | Atlanta | Industrial | 10,706 | 0.2% | 9/30/2023 | $83,966 | $8,397 | 100.0% | 100.0% | 0.0% | Yes | |
| 16 | Long Point Center | Houston | Industrial | 9,900 | 0.2% | 9/30/2022 | $79,757 | $7,976 | 0.0% | 77.0% | 100.0% | Yes | |
| 11 | Silber Industrial Park | Houston | Industrial | 9,746 | 0.2% | 6/30/2022 | $99,599 | $9,960 | 0.0% | 0.0% | 0.0% | Yes | |
| 28 | Columbus West - Interchange Rd | Columbus | Industrial | 9,500 | 0.2% | 9/30/2023 | $68,537 | $6,854 | 0.0% | 0.0% | 0.0% | Yes | |
| 12 | Southpark Business Park M | Austin | Industrial | 9,153 | 0.2% | 12/31/2020 | $182,305 | $18,231 | 100.0% | 100.0% | 100.0% | Yes | |
| 25 | 9385 Washington Blvd | Baltimore | Industrial | 9,000 | 0.1% | 4/30/2024 | $92,786 | $9,279 | 0.0% | 0.0% | 24.7% | No | |
| 25 | 9385 Washington Blvd | Baltimore | Industrial | 9,000 | 0.1% | 6/30/2024 | $94,934 | $9,493 | 0.0% | 0.0% | 100.0% | No | |
| 25 | 9385 Washington Blvd | Baltimore | Industrial | 8,990 | 0.1% | 12/31/2022 | $94,829 | $9,483 | 100.0% | 85.7% | 100.0% | Yes | |
| 18 | Southport 1-4 | Houston | Industrial | 8,385 | 0.1% | 5/31/2021 | $79,190 | $7,919 | 100.0% | 98.3% | 0.0% | No | |
| 18 | Southport 1-4 | Houston | Industrial | 7,937 | 0.1% | 12/31/2022 | $62,968 | $6,297 | 0.0% | 0.0% | 100.0% | Yes | |
| 9 | Sandy Plains Business Park | Atlanta | Industrial | 6,586 | 0.1% | 5/31/2021 | $73,210 | $7,321 | 100.0% | 100.0% | 100.0% | Yes | |
| 9 | Sandy Plains Business Park | Atlanta | Industrial | 6,422 | 0.1% | 8/31/2021 | $72,827 | $7,283 | 100.0% | 100.0% | 100.0% | Yes | |
| 15 | Goshen Springs | Atlanta | Industrial | 6,391 | 0.1% | 7/31/2020 | $41,231 | $4,123 | 100.0% | 100.0% | 100.0% | Yes | |
| 21 | Braker Center 4 | Austin | Industrial | 5,390 | 0.1% | 10/31/2023 | $117,169 | $11,717 | 0.0% | 0.0% | 0.0% | Yes | |
| 9 | Sandy Plains Business Park | Atlanta | Industrial | 4,550 | 0.1% | 11/30/2021 | $55,218 | $5,522 | 0.0% | 0.0% | 0.0% | Yes | |
| 22 | Northgreen 1-4 | Houston | Industrial | 3,969 | 0.1% | 12/31/2021 | $41,690 | $4,169 | 100.0% | 100.0% | 100.0% | Yes | |
| 11 | Silber Industrial Park | Houston | Industrial | 3,884 | 0.1% | 6/30/2022 | $39,693 | $3,969 | 0.0% | 0.0% | 0.0% | Yes | |
| 18 | Southport 1-4 | Houston | Industrial | 3,600 | 0.1% | 1/31/2023 | $34,889 | $3,489 | 0.0% | 0.0% | 0.0% | Yes | |
| 11 | Silber Industrial Park | Houston | Industrial | 2,950 | 0.0% | 10/31/2020 | $25,369 | $2,537 | 66.0% | 100.0% | 36.2% | No | |
| 32 | 1351 Oakbrook Drive | Atlanta | Industrial | 2,700 | 0.0% | 7/31/2021 | $25,478 | $2,548 | 100.0% | 100.0% | 100.0% | Yes | |
| 32 | 1351 Oakbrook Drive | Atlanta | Industrial | 2,300 | 0.0% | 2/28/2022 | $26,715 | $2,672 | 0.0% | 100.0% | 100.0% | Yes | |
| 22 | Northgreen 1-4 | Houston | Industrial | 1,950 | 0.0% | 6/30/2021 | $20,015 | $2,001 | 0.0% | 95.1% | 100.0% | Yes | |
| Total | 329,360 | 5.4% | $3,269,792 | $326,979 | |||||||||
11
Various Various, Various | Loan Specific Premarketing Term Sheet Agellan Portfolio | Cut-off Date Balance: Cut-off Date LTV: U/W NCF DSCR: U/W NOI Debt Yield: | $172,000,000 73.1% 1.78x 9.0% |
The Properties.
The Agellan Portfolio consists of the fee simple interests in a 46 property portfolio of industrial and office properties comprising approximately 6,094,177 sq. ft. in the aggregate located throughout nine states and 12 different markets. The Agellan Portfolio is comprised of 42 industrial properties (5,248,373 sq. ft.; 86.1% of NRA; 71.3% of U/W Base Rent) and four office properties (845,804 sq. ft.; 13.9% of NRA; 28.7% of U/W Base Rent). The tenancy spans a variety of industries including health care, food services, automotive parts, insurance, and technology.
As of June 1, 2020, the Agellan Portfolio is 93.4% leased (90.4% leased excluding dark tenants and known vacates) to 250 unique tenants with no single tenant accounting for more than 6.9% of U/W Base Rent. Three of the top ten tenants (Health Care Service Corp., General Motors LLC and Allstate Insurance Co.) have investment grade credit ratings by one or more of Moody’s, Fitch or S&P and account for approximately 10.7% and 15.0% of the Agellan Portfolio’s Total NRA and U/W Base Rent, respectively. The Agellan Properties have a weighted average remaining lease term of approximately 2.9 years.
| Portfolio Summary | |||||||||||||||||||
| No. | Property Name | City, State | Property Type | Net Rentable Area | Whole Loan Allocated Loan Amount | (%) Whole Loan Allocated Loan Amount | U/W Base Rent(1) | % of UW Base Rent | Appraised Value | % of Appraised Value | |||||||||
| 1 | Sarasota Distribution Hub | Sarasota, FL | Industrial | 906,449 | $52,400,000 | 13.0% | $4,804,386 | 11.7% | $70,200,000 | 12.7% | |||||||||
| 2 | Naperville Woods Office Center | Naperville, IL | Office | 482,497 | $51,600,000 | 12.8% | $7,480,569 | 18.2% | $68,800,000 | 12.5% | |||||||||
| 3 | Southpark Business Park FOP | Austin, TX | Industrial | 187,075 | $25,720,000 | 6.4% | $2,478,202 | 6.0% | $34,900,000 | 6.3% | |||||||||
| 4 | Supervalu | Fort Worth, TX | Industrial | 253,800 | $19,540,000 | 4.8% | $1,573,560 | 3.8% | $26,720,000 | 4.8% | |||||||||
| 5 | Plainfield Business Center IV | Plainfield, IN | Industrial | 434,354 | $17,630,000 | 4.4% | $1,385,853 | 3.4% | $24,100,000 | 4.4% | |||||||||
| 6 | Beltway III | Houston, TX | Office | 130,566 | $14,870,000 | 3.7% | $2,347,444 | 5.7% | $20,100,000 | 3.6% | |||||||||
| 7 | 4405 Continental Dr | Flint, MI | Industrial | 400,000 | $13,880,000 | 3.4% | $2,097,244 | 5.1% | $18,750,000 | 3.4% | |||||||||
| 8 | Beltway IV | Houston, TX | Office | 131,702 | $12,600,000 | 3.1% | $1,714,514 | 4.2% | $17,200,000 | 3.1% | |||||||||
| 9 | Sandy Plains Business Park | Marietta, GA | Industrial | 167,329 | $11,500,000 | 2.9% | $1,141,184 | 2.8% | $15,700,000 | 2.8% | |||||||||
| 10 | Silber Industrial Park | Houston, TX | Industrial | 198,970 | $10,310,000 | 2.6% | $882,818 | 2.2% | $14,100,000 | 2.6% | |||||||||
| 11 | Southpark Business Park M | Austin, TX | Industrial | 72,550 | $9,600,000 | 2.4% | $958,626 | 2.3% | $13,100,000 | 2.4% | |||||||||
| 12 | Coliseum Distribution Center #1 | San Antonio, TX | Industrial | 208,000 | $9,540,000 | 2.4% | $942,656 | 2.3% | $15,900,000 | 2.9% | |||||||||
| 13 | West by Northwest Business Blvd | Houston, TX | Industrial | 122,750 | $9,400,000 | 2.3% | $823,053 | 2.0% | $12,800,000 | 2.3% | |||||||||
| 14 | Norcross Center | Norcross, GA | Industrial | 169,951 | $9,000,000 | 2.2% | $942,051 | 2.3% | $12,300,000 | 2.2% | |||||||||
| 15 | Goshen Springs | Norcross, GA | Industrial | 152,319 | $7,830,000 | 1.9% | $718,035 | 1.8% | $10,700,000 | 1.9% | |||||||||
| 16 | Long Point Center | Houston, TX | Industrial | 189,680 | $7,610,000 | 1.9% | $741,097 | 1.8% | $10,400,000 | 1.9% | |||||||||
| 17 | Corridor Park D | Austin, TX | Industrial | 56,100 | $7,530,000 | 1.9% | $674,322 | 1.6% | $10,300,000 | 1.9% | |||||||||
| 18 | Southport 1-4 | Houston, TX | Industrial | 149,401 | $7,310,000 | 1.8% | $658,567 | 1.6% | $10,000,000 | 1.8% | |||||||||
| 19 | Jameel | Houston, TX | Industrial | 94,900 | $7,310,000 | 1.8% | $684,408 | 1.7% | $10,000,000 | 1.8% | |||||||||
| 20 | Beltway II | Houston, TX | Office | 101,039 | $7,100,000 | 1.8% | $214,432 | 0.5% | $9,700,000 | 1.8% | |||||||||
| 21 | Braker Center 4 | Austin, TX | Industrial | 45,913 | $6,900,000 | 1.7% | $579,872 | 1.4% | $9,400,000 | 1.7% | |||||||||
| 22 | Northgreen 1-4 | Houston, TX | Industrial | 118,736 | $6,300,000 | 1.6% | $474,118 | 1.2% | $8,600,000 | 1.6% | |||||||||
| 23 | Minimax | Houston, TX | Industrial | 119,821 | $5,920,000 | 1.5% | $568,098 | 1.4% | $8,100,000 | 1.5% | |||||||||
| 24 | Southpark Business Park E | Austin, TX | Industrial | 49,966 | $5,500,000 | 1.4% | $587,600 | 1.4% | $7,500,000 | 1.4% | |||||||||
| 25 | 9385 Washington Blvd | Laurel, MD | Industrial | 57,590 | $5,340,000 | 1.3% | $426,784 | 1.0% | $7,300,000 | 1.3% | |||||||||
| 26 | Rothway | Houston, TX | Industrial | 75,460 | $5,270,000 | 1.3% | $297,597 | 0.7% | $7,200,000 | 1.3% | |||||||||
| 27 | 2730 Pinnacle | Elgin, IL | Industrial | 44,990 | $4,500,000 | 1.1% | $454,404 | 1.1% | $6,100,000 | 1.1% | |||||||||
| 28 | Columbus West - Interchange Rd | Columbus, OH | Industrial | 91,200 | $4,130,000 | 1.0% | $404,218 | 1.0% | $5,650,000 | 1.0% | |||||||||
| 29 | 1346 Oakbrook Drive | Norcross, GA | Industrial | 71,591 | $3,950,000 | 1.0% | $441,662 | 1.1% | $5,400,000 | 1.0% | |||||||||
| 30 | 1230-1236 Hardt Circle | Bartlett, IL | Industrial | 60,080 | $3,800,000 | 0.9% | $287,187 | 0.7% | $5,200,000 | 0.9% | |||||||||
| 31 | Pine Forest Business Park | Houston, TX | Industrial | 80,091 | $3,600,000 | 0.9% | $106,122 | 0.3% | $4,900,000 | 0.9% | |||||||||
| 32 | 1351 Oakbrook Drive | Norcross, GA | Industrial | 36,489 | $2,820,000 | 0.7% | $188,866 | 0.5% | $3,850,000 | 0.7% | |||||||||
| 33 | 1325 Oakbrook Drive | Norcross, GA | Industrial | 53,120 | $2,800,000 | 0.7% | $299,472 | 0.7% | $3,800,000 | 0.7% | |||||||||
| 34 | 490 Heartland Drive | Sugar Grove, IL | Industrial | 39,520 | $2,740,000 | 0.7% | $304,704 | 0.7% | $3,750,000 | 0.7% | |||||||||
| 35 | 1265 Oakbrook Drive | Norcross, GA | Industrial | 51,200 | $2,700,000 | 0.7% | $287,275 | 0.7% | $3,650,000 | 0.7% | |||||||||
| 36 | Columbus West - Business Park(2) | Columbus, OH | Industrial | 92,618 | $2,600,000 | 0.6% | $0 | 0.0% | $3,500,000 | 0.6% | |||||||||
| 37 | 1155 Bowes Road(3) | Elgin, IL | Industrial | 34,400 | $2,520,000 | 0.6% | $0 | 0.0% | $3,450,000 | 0.6% | |||||||||
| 38 | 1280 Oakbrook Drive | Norcross, GA | Industrial | 46,400 | $2,500,000 | 0.6% | $261,118 | 0.6% | $3,400,000 | 0.6% | |||||||||
| 39 | Rittiman East Industrial Park #23 & 24 | San Antonio, TX | Industrial | 50,806 | $2,320,000 | 0.6% | $308,606 | 0.8% | $3,870,000 | 0.7% | |||||||||
| 40 | 2002 Bloomingdale | Glendale Heights, IL | Industrial | 31,919 | $2,230,000 | 0.6% | $194,877 | 0.5% | $3,050,000 | 0.6% | |||||||||
| 41 | 333 Charles Court | West Chicago, IL | Industrial | 36,623 | $2,200,000 | 0.5% | $277,441 | 0.7% | $3,000,000 | 0.5% | |||||||||
| 42 | 483 Heartland Drive | Sugar Grove, IL | Industrial | 36,426 | $2,200,000 | 0.5% | $172,234 | 0.4% | $3,000,000 | 0.5% | |||||||||
| 43 | Cox Business Center | Erlanger, KY | Industrial | 52,040 | $2,180,000 | 0.5% | $247,686 | 0.6% | $3,350,000 | 0.6% | |||||||||
| 44 | 1256 Oakbrook Drive | Norcross, GA | Industrial | 40,392 | $2,160,000 | 0.5% | $191,411 | 0.5% | $2,950,000 | 0.5% | |||||||||
| 45 | 550 Heartland | Sugar Grove, IL | Industrial | 30,328 | $1,940,000 | 0.5% | $203,700 | 0.5% | $2,650,000 | 0.5% | |||||||||
| 46 | Rittiman East Industrial Park #22 | San Antonio, TX | Industrial | 37,026 | $1,600,000 | 0.4% | $184,961 | 0.5% | $2,610,000 | 0.5% | |||||||||
| Total | 6,094,177 | $403,000,000 | 100.0% | $41,013,036 | 100.0% | $551,000,000 | 100.0% | ||||||||||||
| (1) | U/W Base Rent has been further adjusted to account for a 10.0% stress to tenants who missed full or partial rent payments in April, May and/or June or have requested rent relief during the COVID-19 pandemic. The total stress to U/W Base Rent is $241,419. An additional stress loss adjustment of 10.0% was applied to reimbursements for any tenants that missed full rent payments in April, May and/or June. The total stress to reimbursements is $85,560. |
| (2) | The Columbus West – Business Park property is currently 100.0% vacant and has been underwritten as such. |
| (3) | The 1155 Bowes Road property is leased to a single tenant that is currently dark. The tenant is underwritten as vacant. |
12
Various Various, Various | Loan Specific Premarketing Term Sheet Agellan Portfolio | Cut-off Date Balance: Cut-off Date LTV: U/W NCF DSCR: U/W NOI Debt Yield: | $172,000,000 73.1% 1.78x 9.0% |
| Portfolio Summary (continued) | |||||||||||
| No. | Property Name | Market | Property Type | Property Sub-Type | Net Rentable Area | Property Occupancy | Year Built | Year Renovated | Ceiling Height | Percent Office | Appraisal Cap Rate(1) |
| 1 | Sarasota Distribution Hub | Tampa | Industrial | Warehouse/Distribution | 906,449 | 100.0% | 1981 | 2007 | 28' | 5.0% | 6.75% |
| 2 | Naperville Woods Office Center | Chicago | Office | Suburban | 482,497 | 95.4% | 1981, 1988 | 2007 | NAP | 100.0% | 8.25% |
| 3 | Southpark Business Park FOP | Austin | Industrial | Flex | 187,075 | 100.0% | 1982 | NAP | 16' | 96.0% | 6.25% |
| 4 | Supervalu | Dallas | Industrial | Warehouse/Distribution | 253,800 | 100.0% | 1996 | NAP | 32' | 7.0% | 6.50% |
| 5 | Plainfield Business Center IV | Indianapolis | Industrial | Warehouse/Distribution | 434,354 | 100.0% | 1999 | NAP | 30' | 3.5% | 5.75% |
| 6 | Beltway III | Houston | Office | CBD | 130,566 | 100.0% | 2005 | NAP | NAP | 100.0% | 8.00% |
| 7 | 4405 Continental Dr | Flint | Industrial | Warehouse/Distribution | 400,000 | 100.0% | 1999 | 2006 | 30' | 2.0% | 9.50% |
| 8 | Beltway IV | Houston | Office | CBD | 131,702 | 72.6% | 2006 | NAP | NAP | 100.0% | 8.50% |
| 9 | Sandy Plains Business Park | Atlanta | Industrial | Flex | 167,329 | 94.3% | 1986 | NAP | 20' | 40.0% - 95.0% | 7.00% |
| 10 | Silber Industrial Park | Houston | Industrial | Warehouse/Distribution | 198,970 | 90.4% | 1978 | NAP | 21' - 24' | 13.0% | 6.50% |
| 11 | Southpark Business Park M | Austin | Industrial | Flex | 72,550 | 100.0% | 1983 | NAP | 16' | 96.0% | 6.75% |
| 12 | Coliseum Distribution Center #1 | San Antonio | Industrial | Warehouse/Distribution | 208,000 | 100.0% | 1978 | NAP | 26.5' | 5.0% | 6.00% |
| 13 | West by Northwest Business Blvd | Houston | Industrial | Flex | 122,750 | 91.5% | 1983 | NAP | 19' | 34.0% | 7.00% |
| 14 | Norcross Center | Atlanta | Industrial | Flex | 169,951 | 100.0% | 1988 | NAP | 20' | 33.0% | 7.00% |
| 15 | Goshen Springs | Atlanta | Industrial | Flex | 152,319 | 95.3% | 1986 | NAP | 26' | 33.0% | 6.25% / 6.75% |
| 16 | Long Point Center | Houston | Industrial | Warehouse/Distribution | 189,680 | 94.3% | 1979 | NAP | 24' | 11.0% | 7.50% / 7.25% |
| 17 | Corridor Park D | Austin | Industrial | Flex | 56,100 | 100.0% | 1999 | 2016 | 24' | 100.0% | 6.50% |
| 18 | Southport 1-4 | Houston | Industrial | Flex | 149,401 | 77.7% | 1980 | NAP | 16' | 33.0% | 8.00% |
| 19 | Jameel | Houston | Industrial | Flex | 94,900 | 87.5% | 1983 | NAP | 19' | 50.0% | 6.75% |
| 20 | Beltway II | Houston | Office | CBD | 101,039 | 13.3% | 2003 | NAP | NAP | 100.0% | 9.00% |
| 21 | Braker Center 4 | Austin | Industrial | Flex | 45,913 | 90.3% | 1984 | 1999 | 16' | 95.0% | 6.50% |
| 22 | Northgreen 1-4 | Houston | Industrial | Flex | 118,736 | 61.7% | 1982 | NAP | 12’ – 18’ | 35.0% | 8.00% |
| 23 | Minimax | Houston | Industrial | Warehouse/Distribution | 119,821 | 100.0% | 1967 | NAP | 20' | 13.0% | 6.50% |
| 24 | Southpark Business Park E | Austin | Industrial | Flex | 49,966 | 100.0% | 1982 | 1992 | 16' | 100.0% | 6.75% |
| 25 | 9385 Washington Blvd | Baltimore | Industrial | Flex | 57,590 | 92.2% | 1988 | 2007 | 18' | 20.0% | 6.00% |
| 26 | Rothway | Houston | Industrial | Flex | 75,460 | 43.8% | 1983 | NAP | 14' | 90.0% | 7.00% |
| 27 | 2730 Pinnacle | Chicago | Industrial | Warehouse/Distribution | 44,990 | 100.0% | 2005 | 2007 | 20' | 45.0% | 7.50% |
| 28 | Columbus West - Interchange Rd | Columbus | Industrial | Flex | 91,200 | 89.5% | 1974 | NAP | 22' | 20.0% | 8.00% |
| 29 | 1346 Oakbrook Drive | Atlanta | Industrial | Flex | 71,591 | 100.0% | 1985 | NAP | 14' | 85.0% | 7.25% |
| 30 | 1230-1236 Hardt Circle | Chicago | Industrial | Warehouse/Distribution | 60,080 | 75.1% | 2008 | NAP | 24' | 10.0% | 6.25% |
| 31 | Pine Forest Business Park | Houston | Industrial | Warehouse/Distribution | 80,091 | 30.9% | 1980 | NAP | 20' - 22' | 14.0% | 7.00% |
| 32 | 1351 Oakbrook Drive | Atlanta | Industrial | Flex | 36,489 | 68.5% | 1985 | NAP | 12' | 72.0% | 7.00% |
| 33 | 1325 Oakbrook Drive | Atlanta | Industrial | Flex | 53,120 | 100.0% | 1986 | NAP | 20' | 21.0% | 7.00% |
| 34 | 490 Heartland Drive | Chicago | Industrial | Warehouse/Distribution | 39,520 | 100.0% | 2002 | NAP | 20' | 20.0% | 7.50% |
| 35 | 1265 Oakbrook Drive | Atlanta | Industrial | Flex | 51,200 | 100.0% | 1985 | NAP | 18' | 21.0% | 7.00% |
| 36 | Columbus West - Business Park | Columbus | Industrial | Flex | 92,618 | 0.0% | 1996 | 2005 | 25' | 20.0% | 8.00% |
| 37 | 1155 Bowes Road | Chicago | Industrial | Warehouse/Distribution | 34,400 | 0.0% | 2006 | NAP | 26' | 20.0% | 6.50% |
| 38 | 1280 Oakbrook Drive | Atlanta | Industrial | Flex | 46,400 | 100.0% | 1986 | NAP | 19' | 27.0% | 7.25% |
| 39 | Rittiman East Industrial Park #23 & 24 | San Antonio | Industrial | Flex | 50,806 | 90.6% | 1983 | NAP | 16’ - 18' | 19.0% | 7.50% |
| 40 | 2002 Bloomingdale | Chicago | Industrial | Warehouse/Distribution | 31,919 | 100.0% | 1998 | NAP | 23' | 15.0% | 6.00% |
| 41 | 333 Charles Court | Chicago | Industrial | Warehouse/Distribution | 36,623 | 100.0% | 2007 | NAP | 20' | 20.0% | 7.25% |
| 42 | 483 Heartland Drive | Chicago | Industrial | Warehouse/Distribution | 36,426 | 84.1% | 2010 | NAP | 24' | 10.0% | 6.50% |
| 43 | Cox Business Center | Cincinnati | Industrial | Warehouse/Distribution | 52,040 | 100.0% | 1987 | NAP | 15' - 19' | 10.0% | 7.25% |
| 44 | 1256 Oakbrook Drive | Atlanta | Industrial | Flex | 40,392 | 87.5% | 1985 | NAP | 20' | 28.0% | 7.00% |
| 45 | 550 Heartland | Chicago | Industrial | Warehouse | 30,328 | 100.0% | 2000 | 2007 | 20' | 15.0% | 6.50% |
| 46 | Rittiman East Industrial Park #22 | San Antonio | Industrial | Warehouse/Distribution | 37,026 | 83.8% | 1983 | NAP | 18' | 14.0% | 7.50% |
| (1) | Napverville Woods Office Center, Goshen Spring and Long Point Center have multiple buildings that were appraised separately. |
| Property Distribution | ||||||||||
| Property Type | Number of Properties | Total Sq. Ft. | % of Total Sq. Ft. | Allocated Whole Loan Amount | (%) Allocated Whole Loan Amount | U/W Base Rent | % of U/W Base Rent | Appraised Value | % of Appraised Value | |
| Industrial | 42 | 5,248,373 | 86.1% | $316,830,000 | 78.6% | $29,256,078 | 71.3% | $435,200,000 | 79.0% | |
| Warehouse / Distribution | 18 | 3,164,189 | 51.9% | $164,400,000 | 40.8% | $15,225,330 | 37.1% | $226,680,000 | 41.1% | |
| Flex | 23 | 2,053,856 | 33.7% | $150,490,000 | 37.3% | $13,827,048 | 33.7% | $205,870,000 | 37.4% | |
| Warehouse | 1 | 30,328 | 0.5% | $1,940,000 | 0.5% | $203,700 | 0.5% | $2,650,000 | 0.5% | |
| Office | 4 | 845,804 | 13.9% | $86,170,000 | 21.4% | $11,756,958 | 28.7% | $115,800,000 | 21.0% | |
| Suburban | 1 | 482,497 | 7.9% | $51,600,000 | 12.8% | $7,480,569 | 18.2% | $68,800,000 | 12.5% | |
| CBD | 3 | 363,307 | 6.0% | $34,570,000 | 8.6% | $4,276,389 | 10.4% | $47,000,000 | 8.5% | |
| Portfolio Total | 46 | 6,094,177 | 100.0% | $403,000,000 | 100.0% | $41,013,036 | 100.0% | $551,000,000 | 100.0% | |
Since May 2019, the Borrower Sponsor has executed 38 new, renewal and expansion leases for approximately 470,218 sq. ft. Renewal leases totaled approximately 342,447 sq. ft. and had weighted average rent increases of approximately 8.7%. Renewal and expansion leases totaled approximately 43,983 sq. ft. and had weighted average rent increases of 16.1%. New leases accounted for approximately 78,344 sq. ft. and had weighted average rent increases of 8.3%.
| Portfolio Leasing Spreads(1) | ||||||
| Lease Type | Expiring sq. ft. | Expiring Rent per sq. ft. | New sq. ft. | Rent per sq. ft. | Leasing Spread $ | Leasing Spread % |
| Renew | 342,447 | $8.58 | 342,447 | $9.32(2) | $0.75 | 8.7% |
| Renew & Expansion | 28,284 | $6.23 | 43,983 | $7.24 | $1.01 | 16.1% |
| Expansion | 11,252 | $6.00 | 5,444 | $5.84 | ($0.16)(3) | (2.7%)(3) |
| New | 109,848 | $6.71 | 78,344 | $7.27 | $0.56 | 8.3% |
| (1) | Since May 2019. |
| (2) | The leasing spread for Dish Network, Inc. is calculated based a gross renewal rent of $8.70 per sq. ft. |
| (3) | International Valve at the 483 Heartland Drive property expanded and took 5,444 sq. ft. of the 11,252 sq. ft. of vacated space. The expansion increased the tenant’s footprint to 11,032 sq. ft. and the rent for the NRA occupied prior to the expansion (5,588 sq. ft.) also increased $0.16 per sq. ft. or 2.4%. |
13
Various Various, Various | Loan Specific Premarketing Term Sheet Agellan Portfolio | Cut-off Date Balance: Cut-off Date LTV: U/W NCF DSCR: U/W NOI Debt Yield: | $172,000,000 73.1% 1.78x 9.0% |
| Historical and Current Portfolio Occupancy(1)(2)(3) | ||||||||||
| 2013 | 2014 | 2015 | 2016 | 2017 | 2018 | 2019 | Current(4) | Current W/ Dark Tenants(5) | Current W/ Dark Tenants and Known Vacates(6) | |
| # of Assets(7) | 21 | 21 | 28 | 31 | 40 | 42 | 42 | 46 | 46 | 46 |
| Portfolio NRA Sq. ft. (mm) | 3,224 | 3,224 | 3,689 | 4,917 | 5,631 | 5,745 | 5,745 | 6,094 | 6,094 | 6,094 |
| % Occupancy | 91.8% | 91.0% | 94.4% | 93.3% | 94.7% | 96.1% | 96.2% | 90.4% | 92.1% | 93.4% |
| (1) | Historical occupancy data for the four recent acquisitions is not available. |
| (2) | Historical occupancy for 2013 – 2019 is reflective of quarterly averages for each respective year. |
| (3) | Historical occupancy for 2013 – 2019 includes any applicable leased dark space. |
| (4) | Current occupancy is based on the underwritten rent roll dated June 1, 2020 and excludes dark, known vacate, and bankrupt tenants. |
| (5) | Current W/ Dark Tenants occupancy is inclusive of dark tenants. |
| (6) | Current W/ Dark Tenants and Known Vacates occupancy is inclusive of dark and known vacate tenants. |
| (7) | # of Assets may vary from the “Portfolio Operating History” below as certain properties have not provided occupancy history. |
| Top 10 Tenant Summary(1) | |||||||
| Tenant | Property Type | Credit Rating (Moody's/Fitch/S&P)(2) | Net Rentable Area (Sq. Ft.) | % of Net Rentable Area | U/W Base Rent PSF(3) | % of Total U/W Base Rent | Lease Expiration |
| Health Care Service Corp.(4)(5) | Office | A3/A-/AA- | 177,114 | 2.9% | $16.00 | 6.9% | 11/30/2025 |
| United Natural Foods Inc.(6) | Industrial | B2/NR/B | 463,172 | 7.6% | $5.66 | 6.4% | 7/31/2022 |
| ALDI, Inc.(4)(7) | Office | NR/NR/NR | 137,986 | 2.3% | $16.09 | 5.4% | 12/31/2028 |
| General Motors LLC(8) | Industrial | Baa3/BBB-/BBB | 400,000 | 6.6% | $5.24 | 5.1% | 8/31/2021 |
| Moran Foods LLC(9) | Industrial | B3/NR/B- | 253,800 | 4.2% | $6.20 | 3.8% | 9/30/2025 |
| Life Technologies Corporation(10) | Industrial | Baa1/NR/BBB+ | 103,645 | 1.7% | $13.00 | 3.3% | 6/30/2025 |
| Allstate Insurance Co.(11) | Office | Aa3/A+/AA- | 75,623 | 1.2% | $16.00 | 3.0% | 5/31/2024 |
| Ceva Freight LLC(12) | Industrial | B1/NR/B+ | 333,397 | 5.5% | $3.09 | 2.5% | 8/31/2022 |
| Beall's, Inc. (13) | Industrial | NR/NR/NR | 200,000 | 3.3% | $4.80 | 2.3% | 9/30/2021 |
| VTech Communications, Inc.(14) | Industrial | NR/NR/NR | 208,000 | 3.4% | $4.53 | 2.3% | 7/31/2022 |
| Total Major Tenants | 2,352,737 | 38.6% | $7.16 | 41.0% | |||
| Other Tenants | 3,156,625 | 51.8% | $7.66 | 59.0% | |||
| Total Occupied | 5,509,362 | 90.4% | $7.44 | 100.0% | |||
| Vacant | 584,815 | 9.6% | |||||
| Total / Wtd. Avg. | 6,094,177 | 100.0% | $7.44 | 100.0% | |||
| (1) | Based on the underwritten rent roll. |
| (2) | In certain instances, ratings provided are those of the parent company of the entity shown, whether or not the parent company guarantees the lease. |
| (3) | U/W Base Rent PSF is inclusive of contractual rent steps taken through June 1, 2021. |
| (4) | ALDI, Inc. reflects an expansion option for 24,597 sq. ft. that was exercised in February 2020. The expansion space is currently occupied by HCSC. HCSC will be relocated within the Naperville Wood Office Center property as part of the ALDI, Inc. expansion, which will allow HCSC to have all of its office space in one building. Additionally, HCSC’s overall footprint will increase slightly with the relocation space from 175,080 sq. ft. to 177,114 sq. ft. The expansion and relocation are estimated to occur in June/July 2021. |
| (5) | Health Care Service Corp. has one, five-year renewal option at market rent. |
| (6) | United Natural Foods, Inc. has one, five-year renewal option at market rent. |
| (7) | ALDI, Inc. has one, five-year renewal option at market rent. |
| (8) | General Motors LLC has two, five-year renewal options at the greater of market rent or 90% of the then-current base rent. |
| (9) | Moran Foods LLC has two, seven-year renewal options at $6.75 per sq. ft. and market rent, respectively. |
| (10) | Life Technologies Corporation has one, five-year renewal option beginning at $13.00 per sq. ft. |
| (11) | Allstate Insurance Co. has two, five-year renewal options upon nine months’ notice at 95% of market rent. Allstate Insurance also has a one-time termination option as of any month end between May 2022 and May 2023. |
| (12) | Ceva Freight LLC has two, five-year renewal options at market rent. |
| (13) | In May 2018 Beall’s Inc. vacated and subleased their space to United Natural Foods Inc. Beall’s Inc. has one, three-year renewal option at $5.30 per sq. ft. |
| (14) | VTech Communications, Inc. has one, five-year renewal option at market rent. |
14
Various Various, Various | Loan Specific Premarketing Term Sheet Agellan Portfolio | Cut-off Date Balance: Cut-off Date LTV: U/W NCF DSCR: U/W NOI Debt Yield: | $172,000,000 73.1% 1.78x 9.0% |
| Lease Rollover Schedule(1)(2) | ||||||||
| Year | # of Leases Expiring | Total Expiring Sq. Ft. | % of Total Sq. Ft. Expiring | Cumulative Sq. Ft. Expiring | Cumulative % of Sq. Ft. Expiring | Annual U/W Base Rent per sq. ft.(3) | % U/W Base Rent Rolling | Cumulative % of U/W Base Rent |
| 2020 & MTM | 43 | 460,033 | 7.5% | 460,033 | 7.5% | $5.87 | 6.6% | 6.6% |
| 2021(4) | 61 | 1,264,748 | 20.8% | 1,724,781 | 28.3% | $6.24 | 19.3% | 25.8% |
| 2022(5) | 45 | 1,523,829 | 25.0% | 3,248,610 | 53.3% | $5.64 | 20.9% | 46.8% |
| 2023 | 38 | 470,932 | 7.7% | 3,719,542 | 61.0% | $8.73 | 10.0% | 56.8% |
| 2024 | 33 | 633,520 | 10.4% | 4,353,062 | 71.4% | $7.11 | 11.0% | 67.8% |
| 2025 | 18 | 786,447 | 12.9% | 5,139,509 | 84.3% | $10.09 | 19.3% | 87.1% |
| 2026 | 3 | 50,301 | 0.8% | 5,189,810 | 85.2% | $9.02 | 1.1% | 88.2% |
| 2027 | 5 | 112,643 | 1.8% | 5,302,453 | 87.0% | $15.54 | 4.3% | 92.5% |
| 2028 | 3 | 202,643 | 3.3% | 5,505,096 | 90.3% | $14.60 | 7.2% | 99.7% |
| 2029 | 0 | 0 | 0.0% | 5,505,096 | 90.3% | $0.00 | 0.0% | 99.7% |
| 2030 & Thereafter | 1 | 4,266 | 0.1% | 5,509,362 | 90.4% | $26.98 | 0.3% | 100.0% |
| Vacant | NAP | 584,815 | 9.6% | 6,094,177 | 100.0% | NAP | NAP | |
| Total / Wtd. Avg. | 250 | 6,094,177 | 100.0% | $7.44 | 100.0% | |||
| (1) | Based on the underwritten rent roll. |
| (2) | Certain tenants may have lease termination options that are exercisable prior to the stated expiration date of the subject lease or leases which are not considered in the lease rollover schedule. |
| (3) | Annual U/W Base Rent per sq. ft. is inclusive of (i) contractual rent steps taken through June 1, 2021 and includes the ALDI, Inc. expansion of approximately 24,597 sq. ft. and HCSC relocation at the Naperville Woods Office Center property. U/W Base Rent has been further adjusted to account for a 10.0% stress to tenants who missed full or partial April and/or May rent payments and/or have requested rent relief during the COVID-19 pandemic. The total stress to U/W Base Rent is $241,419. |
| (4) | General Motors, LLC leases will expire in 2021 and has two, five-year renewal options at the greater of market rent or 90% of the then-current base rent. General Motors, LLC has occupied the property since 1998. General Motors has expressed interest to renew and is expecting to receive a formal proposal with renewal terms from the Sponsor. |
| (5) | Both United Natural Foods, Inc. and Ceva Freight LLC leases will expire in 2022. United Natural Foods, Inc. has one, five-year renewal option at market rent. Ceva Freight LLC has two, five-year renewal options at market rent. United Natural Foods Inc. and Ceva Freight have both engaged the Borrower Sponsor about potentially expanding at expiration if any space were to become vacant at the respective properties. |
Ongoing Reserves.
TI/LC Reserve. The Borrowers are required to deposit into the TI/LC reserve, on a monthly basis 1/12 of $0.85 per sq. ft. of the Agellan Properties then encumbered by the lien of the Agellan Portfolio Whole Loan (approximately $431,671 as of the Origination Date), subject to a cap of the amount equal to 36 times the required monthly deposit (approximately $15.5 million as of the Origination Date).
Replacement Reserve. The Borrowers are required to deposit into the replacement reserve, on a monthly basis 1/12 of $0.20 per sq. ft. of the Agellan Properties then encumbered by the lien of the Agellan Portfolio Whole Loan (approximatelt $101,570 as of the Origination Date), subject to a cap of the amount equal to 36 times the required monthly deposit (approximately $3.7 million as of the Origination Date).
The ongoing TI/LC Reserve and Replacement Reserve are among other reserves as more fully described in the “Initial and Ongoing Reserves” section below.
Major Tenants.
The top five tenants occupying the Agellan Properties by U/W Base Rent are Health Care Service Crop. (177,114 sq. ft.; 2.9% of NRA; 6.9% of U/W Base Rent), United Natural Foods, Inc. (463,172 sq. ft.; 7.6% of NRA; 6.4% of U/W Base Rent), ALDI, Inc. (137,986 sq. ft.; 2.3% of NRA; 5.4% of U/W Base Rent), General Motors LLC (400,000 sq. ft.; 6.6% of NRA; 5.1% of U/W Base Rent) and Moran Foods LLC (253,800 sq. ft.; 4.2% of NRA; 3.8% of U/W Base Rent).
Health Care Service Corp. (177,114 sq. ft.; 2.9% of NRA; 6.9% of U/W Base Rent). Health Care Service Corp. (“HCSC”) is an independent licensee of the Blue Cross and Blue Shield Association. HCSC is the largest customer-owned health insurer in the United States and fifth largest overall. Health Care Service Corp operates through Blue Cross and Blue Shield Plans in Illinois, Montana, New Mexico, Oklahoma and Texas. HCSC affiliates and subsidiaries such as Dearborn National, Medecision and Dental Network of America offer group life, disability and dental solutions, as well as a range of other individual solutions. The company, founded in 1936, serves more than 16 million members across five states and employs more than 23,000 people in over 60 local offices. A portion of the space occupied by HCSC will be relocated within the Naperville Wood Office Center property in conjunction with the ALDI, Inc. expansion, which will allow HCSC to have all of its office space in one building. Additionally, HCSC’s overall footprint will increases slightly with the relocation space from 175,080 sq. ft. to 177,114 sq. ft. The expansion and relocation are estimated to occur in June/July 2021. Health Care Service Corp. has one, five-year renewal option at market rent.
United Natural Foods, Inc. (463,172 sq. ft.; 7.6% of NRA; 6.4% of U/W Base Rent). United Natural Foods, Inc. engages in the distribution
15
Various Various, Various | Loan Specific Premarketing Term Sheet Agellan Portfolio | Cut-off Date Balance: Cut-off Date LTV: U/W NCF DSCR: U/W NOI Debt Yield: | $172,000,000 73.1% 1.78x 9.0% |
of natural, organic, and specialty foods and non-food products. The company is headquartered in Providence, Rhode Island. United Natural Foods, Inc. has one, five-year renewal option at market rent.
ALDI, Inc. (137,986 sq. ft.; 2.3% of NRA; 5.4% of U/W Base Rent). ALDI, Inc. owns and operates grocery stores throughout the U.S. ALDI, Inc. offers grocery, meat, fresh produce, wine and beer, beverages, and other home products. ALDI, Inc. is located in Batavia, Illinois. ALDI, Inc. has approximately 3,000 total employees across all of its locations and generates approximately $4.32 billion in sales annually. ALDI, Inc. operated approximately 1,955 stores in across 36 states. In February 2020, ALDI, Inc. exercised an expansion option for an additional 24,597 sq. ft. ALDI, Inc. has one, five-year renewal option at market rent.
General Motors LLC (400,000 sq. ft.; 6.6% of NRA; 5.1% of U/W Base Rent). General Motors LLC is the fourth largest automaker globally and the largest in the U.S. with approximately $246.6 billion in total assets. Headquartered in Detroit, Michigan, General Motors LLC’s brands include Chevrolet, Buick, GMC and Cadillac. General Motors LLC has two, five-year renewal options at the greater of market rent or 90% of the then-current base rent.
Moran Foods LLC (253,800 sq. ft.; 4.2% of NRA; 3.8% of U/W Base Rent). Moran Foods LLC is the parent company of Save-A-Lot Holdings, LLC (“Save-A-Lot”). Save-A-Lot is an American discount grocery store chain with approximately 1,300 stores across 36 states with over $4.0 billion in annual sales. Headquartered in St. Louis, Missouri, Save-A-Lot’s stores carry most grocery products, including an assortment of fresh, canned and frozen produce as well as meat, meal products, household items and everyday groceries. Moran Foods LLC has two, seven-year renewal options at $6.75 per sq. ft. and market rent, respectively.
The Market. The Agellan Portfolio is geographically diverse with properties located across nine states which include the top five states by U/W Base Rent, Texas (46.1% of Whole Loan allocated loan amount (“Whole Loan ALA”); 43.4% of U/W Base Rent), Illinois (18.3% of Whole Loan ALA; 22.9% of U/W Base Rent), Florida (13.0% of Whole Loan ALA; 11.7% of U/W Base Rent), Georgia (11.2% of Whole Loan ALA; 10.9% of U/W Base Rent) and Michigan (3.4% of Whole Loan ALA; 5.1% of U/W Base Rent).
| Geographic Distribution | ||||||||||
| State | Number of Properties | Total Sq. Ft. | % of Total Sq. Ft. | Allocated Whole Loan Amount | (%) Allocated Whole Loan Amount | U/W Base Rent | % of U/W Base Rent | Appraised Value | % of Appraised Value | |
| Texas | 21 | 2,474,352 | 40.6% | $185,850,000 | 46.1% | $17,800,674 | 43.4% | $257,400,000 | 46.7% | |
| Illinois | 9 | 796,783 | 13.1% | 73,730,000 | 18.3% | 9,375,116 | 22.9% | 99,000,000 | 18.0% | |
| Florida | 1 | 906,449 | 14.9% | 52,400,000 | 13.0% | 4,804,386 | 11.7% | 70,200,000 | 12.7% | |
| Georgia | 9 | 788,791 | 12.9% | 45,260,000 | 11.2% | 4,471,074 | 10.9% | 61,750,000 | 11.2% | |
| Michigan | 1 | 400,000 | 6.6% | 13,880,000 | 3.4% | 2,097,244 | 5.1% | 18,750,000 | 3.4% | |
| Indiana | 1 | 434,354 | 7.1% | 17,630,000 | 4.4% | 1,385,853 | 3.4% | 24,100,000 | 4.4% | |
| Ohio | 2 | 183,818 | 3.0% | 6,730,000 | 1.7% | 404,218 | 1.0% | 9,150,000 | 1.7% | |
| Maryland | 1 | 57,590 | 0.9% | 5,340,000 | 1.3% | 426,784 | 1.0% | 7,300,000 | 1.3% | |
| Kentucky | 1 | 52,040 | 0.9% | 2,180,000 | 0.5% | 247,686 | 0.6% | 3,350,000 | 0.6% | |
| Portfolio Total | 46 | 6,094,177 | 100.0% | $403,000,000 | 100.0% | $41,013,036 | 100.0% | $551,000,000 | 100.0% | |
The Agellan Portfolio is located across 12 U.S. markets which include the top five markets by U/W Base Rent, Houston (24.2% of Whole Loan ALA; 23.2% of U/W Base Rent), Chicago (18.3% of Whole Loan ALA; 22.9% of U/W Base Rent), Austin (13.7% of Whole Loan ALA; 12.9% of U/W Base Rent), Tampa (13.0% of Whole Loan ALA; 11.7% of U/W Base Rent) and Atlanta (11.2% of Whole Loan ALA; 10.9% of U/W Base Rent).
| Market Overview | |||||||||
| Market | Number of Properties | Total Sq. Ft. | % of Total Sq. Ft. | Allocated Whole Loan Amount | (%) Allocated Whole Loan Amount | U/W Base Rent | % of U/W Base Rent | Appraised Value | % of Appraised Value |
| Houston | 12 | 1,513,116 | 24.8% | $97,600,000 | 24.2% | $9,512,268 | 23.2% | $133,100,000 | 24.2% |
| Chicago | 9 | 796,783 | 13.1% | 73,730,000 | 18.3% | 9,375,116 | 22.9% | 99,000,000 | 18.0% |
| Austin | 5 | 411,604 | 6.8% | 55,250,000 | 13.7% | 5,278,622 | 12.9% | 75,200,000 | 13.6% |
| Tampa | 1 | 906,449 | 14.9% | 52,400,000 | 13.0% | 4,804,386 | 11.7% | 70,200,000 | 12.7% |
| Atlanta | 9 | 788,791 | 12.9% | 45,260,000 | 11.2% | 4,471,074 | 10.9% | 61,750,000 | 11.2% |
| Flint | 1 | 400,000 | 6.6% | 13,880,000 | 3.4% | 2,097,244 | 5.1% | 18,750,000 | 3.4% |
| Dallas | 1 | 253,800 | 4.2% | 19,540,000 | 4.8% | 1,573,560 | 3.8% | 26,720,000 | 4.8% |
| San Antonio | 3 | 295,832 | 4.9% | 13,460,000 | 3.3% | 1,436,224 | 3.5% | 22,380,000 | 4.1% |
| Indianapolis | 1 | 434,354 | 7.1% | 17,630,000 | 4.4% | 1,385,853 | 3.4% | 24,100,000 | 4.4% |
| Baltimore | 1 | 57,590 | 0.9% | 5,340,000 | 1.3% | 426,784 | 1.0% | 7,300,000 | 1.3% |
| Columbus | 2 | 183,818 | 3.0% | 6,730,000 | 1.7% | 404,218 | 1.0% | 9,150,000 | 1.7% |
| Cincinnati | 1 | 52,040 | 0.9% | 2,180,000 | 0.5% | 247,686 | 0.6% | 3,350,000 | 0.6% |
| Portfolio Total | 46 | 6,094,177 | 100.0% | $403,000,000 | 100.0% | $41,013,036 | 100.0% | $551,000,000 | 100.0% |
16
Various Various, Various | Loan Specific Premarketing Term Sheet Agellan Portfolio | Cut-off Date Balance: Cut-off Date LTV: U/W NCF DSCR: U/W NOI Debt Yield: | $172,000,000 73.1% 1.78x 9.0% |
Major Markets.
Houston. Per an industry data provider, the Houston Industrial market ended first quarter 2020 with a vacancy rate of 7.6%. The reported market vacancy rates for logistics and flex properties were 8.4% and 10.0%, respectively. The existing market inventory is made up of 74.6% logistics properties and 8.1% flex properties based on total sq. ft. Rental rates ended the first quarter at $7.42 per sq. ft. The average quoted rates for logistics and flex properties were $6.91 per sq. ft. and $10.61 per sq. ft., respectively. The 12-month net absorption ending in first quarter 2020 was 8,621,259 sq. ft. for logistics properties and -49,931 sq. ft. for flex properties.
Per an industry data provider, the Houston Office market ended first quarter 2020 with a vacancy rate of 16.8%. The reported vacancy rates for Class A and Class B buildings were 19.6% and 17.1%, respectively. The existing market inventory is comprised of 44.5% Class A, 42.8% Class B, and 12.6% Class C based on total sq. ft. The average quoted rental rate in first quarter 2020 for all classes was $28.36 per sq. ft. The average quoted rental rate for Class A and B was $34.07 per sq. ft. and $24.25 per sq. ft., respectively. The 12-month net absorption ending in first quarter 2020 for Class A & B in the market was 1,251,779 sq. ft. and -1,448,622 sq. ft., respectively.
| Historical Market Occupancy - Industrial(1) | ||||||||||||
| 2008 | 2009 | 2010 | 2011 | 2012 | 2013 | 2014 | 2015 | 2016 | 2017 | 2018 | 2019 | |
| 93.9% | 93.1% | 93.7% | 94.3% | 95.0% | 94.5% | 95.1% | 94.9% | 94.6% | 94.8% | 94.3% | 93.3% | |
| (1) | Source: Industry data provider. |
| Historical Market Occupancy - Office(1) | ||||||||||||
| 2008 | 2009 | 2010 | 2011 | 2012 | 2013 | 2014 | 2015 | 2016 | 2017 | 2018 | 2019 | |
| 88.4% | 86.7% | 86.9% | 87.2% | 88.4% | 88.6% | 89.4% | 87.1% | 85.5% | 84.0% | 83.8% | 83.4% | |
| (1) | Source: Industry data provider. |
Chicago. Per an industry data provider, the Chicago Industrial market ended first quarter 2020 with a vacancy rate of 6.2%. The reported market vacancy rates for logistics and flex properties were 7.1% and 7.6%, respectively. The existing market inventory is made up of 66.1% logistics properties and 5.8% flex properties based on total sq. ft. Rental rates ended the first quarter of 2020 at $7.36 per sq. ft. The average quoted rates for logistics and flex properties were $6.87 per sq. ft. and $12.24 per sq. ft., respectively. The 12-month net absorption ending in first quarter 2020 was 535,853 sq. ft. for flex properties and 14,631,591 sq. ft. for logistics properties.
Per an industry data provider, the Chicago Office market ended first quarter 2020 with a vacancy rate of 12.2%. The reported vacancy rates for Class A and Class B buildings were 15.2% and 11.7%, respectively. The existing market inventory is comprised of 39.0% Class A, 44.2% Class B, and 16.7% Class C based on total sq. ft. The average quoted rental rate in first quarter 2020 for all classes was $29.44 per sq. ft. The average quoted rental rate for Class A and B was $37.39 per sq. ft. and $25.20 per sq. ft., respectively. The 12-month net absorption ending in first quarter 2020 for Class A and B in the market was 3,566,358 sq. ft. and -457,122 sq. ft., respectively.
| Historical Market Occupancy - Industrial(1) | |||||||||||
| 2008 | 2009 | 2010 | 2011 | 2012 | 2013 | 2014 | 2015 | 2016 | 2017 | 2018 | 2019 |
| 89.8% | 88.1% | 88.2% | 89.1% | 90.6% | 91.3% | 92.6% | 93.2% | 93.8% | 93.7% | 94.2% | 94.1% |
| (1) | Source: Industry data provider. |
| Historical Market Occupancy - Office(1) | ||||||||||||
| 2008 | 2009 | 2010 | 2011 | 2012 | 2013 | 2014 | 2015 | 2016 | 2017 | 2018 | 2019 | |
| 87.4% | 85.0% | 85.2% | 85.6% | 86.1% | 86.6% | 87.3% | 88.0% | 87.7% | 88.0% | 88.4% | 87.9% | |
| (1) | Source: Industry data provider. |
Austin. The reported market vacancy rates for logistics and flex properties were 9.8% and 7.3%, respectively. The existing market inventory is made up of 60.5% logistics properties and 20.9% flex properties based on total sq. ft. Rental rates ended the first quarter at $11.30 per sq. ft. The average quoted rates for logistics and flex properties were $9.93 per sq. ft. and $14.31 per sq. ft., respectively. The 12-month net absorption ending in first quarter 2020 was 1,113,224 sq. ft. for logistics properties and 744,867 sq. ft. for flex properties. According to an industry data provider, Austin is expected to outperform the state of Texas and nation in 2020, with a high number of technology companies and housing at the forefront. Long term, Austin is viewed as a market with a well-educated labor force, high concentration of technology businesses and a relatively low cost of living compared to other high technology based industries which is anticipated to fuel a high population growth for the market.
| Historical Market Occupancy - Industrial(1) | ||||||||||||
| 2008 | 2009 | 2010 | 2011 | 2012 | 2013 | 2014 | 2015 | 2016 | 2017 | 2018 | 2019 | |
| 90.2% | 87.8% | 88.5% | 89.6% | 91.3% | 93.5% | 93.5% | 95.6% | 95.6% | 93.6% | 93.6% | 92.8% | |
| (1) | Source: Industry data provider. |
17
Various Various, Various | Loan Specific Premarketing Term Sheet Agellan Portfolio | Cut-off Date Balance: Cut-off Date LTV: U/W NCF DSCR: U/W NOI Debt Yield: | $172,000,000 73.1% 1.78x 9.0% |
Tampa. Per an industry data provider, the Tampa Bay Industrial market ended first quarter 2020 with a vacancy rate of 5.0%. The reported market vacancy rates for logistics properties was 5.4%. The existing market inventory is made up of 66.3% logistics properties based on total sq. ft. Rental rates ended the first quarter at $7.72 per sq. ft. The average quoted rates for logistics properties was $7.11 per sq. ft. The 12-month net absorption ending in first quarter 2020 for logistics properties was 2,025,279 sq. ft. According to an industry data provider as of year-end 2019, Tampa’s industrial sector outpaced the industrial sectors in the state of Florida in relation to demand growth at approximately 2.8 million sq. ft. of absorbed space. Tampa was the only market in the state that saw improved growth from approximately 2.7 million sq. ft. of positive net absorption year over year.
| Historical Market Occupancy - Industrial(1) | ||||||||||||
| 2008 | 2009 | 2010 | 2011 | 2012 | 2013 | 2014 | 2015 | 2016 | 2017 | 2018 | 2019 | |
| 92.3% | 89.4% | 89.3% | 89.8% | 90.2% | 91.6% | 92.3% | 93.8% | 95.0% | 95.1% | 95.3% | 95.1% | |
| (1) | Source: Third party data provider. |
Atlanta. Per an industry data provider, the Atlanta Industrial market ended first quarter 2020 with a vacancy rate of 6.1%. The reported market vacancy rates for logistics and flex properties were 6.7% and 5.5%, respectively. The existing market inventory is made up of 77.4% logistics properties and 9.1% flex properties based on total sq. ft. Rental rates ended the first quarter at $6.17 per sq. ft. The average quoted rates for logistics and flex properties were $5.52 per sq. ft. and $11.03 per sq. ft., respectively. The 12-month net absorption ending in first quarter 2020 was 11,337,139 sq. ft. for logistics properties and -202,543 sq. ft. for flex properties. According to an industry data provider, the Atlanta market is seen as Georgia’s main growth engine and one of the strongest economies in the nation. Job growth, in the Atlanta market outsize business services and has averaged approximately 2.0% as of year end 2019, which has been one of the best in the nation for nine consecutive years.
| Historical Market Occupancy - Industrial(1) | |||||||||||
| 2008 | 2009 | 2010 | 2011 | 2012 | 2013 | 2014 | 2015 | 2016 | 2017 | 2018 | 2019 |
| 87.5% | 86.4% | 85.6% | 86.9% | 87.5% | 88.7% | 91.5% | 93.1% | 93.0% | 94.1% | 94.6% | 94.4% |
| (1) | Source: Industry data provider. |
Environmental Matters. The Phase I environmental reports dated February 26, 2020 through March 26, 2020 recommended no further action at the Agellan Portfolio.
Cash Flow Analysis.
| Portfolio Operating History | ||||||
| 2015 | 2016 | 2017 | 2018 | 2019 | 2020 Budget | |
| 2015 Reporting Assets | ||||||
| Number of Properties | 27 | 27 | 27 | 27 | 27 | 27 |
| Effective Gross Revenue | $40,377,590 | $41,938,945 | $40,607,440 | $42,687,111 | $43,265,751 | $44,216,063 |
| Operating Expenses | $15,493,935 | $15,426,605 | $15,832,843 | $16,065,442 | $16,124,634 | $16,800,898 |
| Net Operating Income | $24,883,655 | $26,512,341 | $24,774,596 | $26,621,670 | $27,141,118 | $27,415,165 |
| Year-over-Year Change | - | 6.5% | -6.6% | 7.5% | 2.0% | 1.0% |
| 2016 Reporting Assets | ||||||
| Number of Properties | 31 | 31 | 31 | 31 | 31 | |
| Effective Gross Revenue | $43,483,706 | $50,440,354 | $52,850,050 | $54,478,273 | $55,355,348 | |
| Operating Expenses | $15,881,067 | $19,253,268 | $19,685,230 | $20,636,890 | $20,967,544 | |
| Net Operating Income | $27,602,639 | $31,187,086 | $33,164,820 | $33,841,384 | $34,387,804 | |
| Year-over-Year Change | - | 13.0% | 6.3% | 2.0% | 1.6% | |
| 2017 Reporting Assets | ||||||
| Number of Properties | 41 | 41 | 41 | 41 | ||
| Effective Gross Revenue | $53,679,748 | $58,304,052 | $60,181,340 | $61,115,986 | ||
| Operating Expenses | $19,917,149 | $20,981,732 | $22,007,429 | $22,423,094 | ||
| Net Operating Income | $33,762,598 | $37,322,320 | $38,173,911 | $38,692,892 | ||
| Year-over-Year Change | - | 10.5% | 2.3% | 1.4% | ||
| 2018 Reporting Assets | ||||||
| Number of Properties | 46 | 46 | 46 | |||
| Effective Gross Revenue | $60,700,041 | $63,486,372 | $64,626,262 | |||
| Operating Expenses | $21,738,754 | $23,013,221 | $23,452,522 | |||
| Net Operating Income | $38,961,287 | $40,473,151 | $41,173,740 | |||
| Year-over-Year Change | - | 3.9% | 1.7% | |||
18
Various Various, Various | Loan Specific Premarketing Term Sheet Agellan Portfolio | Cut-off Date Balance: Cut-off Date LTV: U/W NCF DSCR: U/W NOI Debt Yield: | $172,000,000 73.1% 1.78x 9.0% |
| Cash Flow Analysis | |||||||
| 2016 | 2017 | 2018 | 2019(1) | U/W(1)(2) | U/W PSF | ||
| Agellan Properties Included | 31 | 41 | 46 | 46 | 46 | ||
| Base Rent | $30,444,923 | $36,778,978 | $40,209,368 | $42,047,666 | $41,013,036 | 6.73 | |
| Vacant Income(3) | $0 | $0 | $0 | $0 | $5,239,985 | 0.86 | |
| Gross Potential Rent | $30,444,923 | $36,778,978 | $40,209,368 | $42,047,666 | $46,253,021 | 7.59 | |
| Total Reimbursements(4) | $12,782,653 | $16,793,058 | $19,551,436 | $21,118,949 | $20,324,317 | 3.34 | |
| Gross Potential Income | $43,227,576 | $53,572,036 | $59,760,803 | $63,166,615 | $66,577,338 | 10.92 | |
| Less: Vacancy(5) | ($53,002) | ($16,561) | ($50,095) | ($101,504) | ($7,119,051) | (1.17) | |
| Other Income | $309,133 | $124,273 | $989,333 | $421,261 | $571,000 | 0.09 | |
| Effective Gross Income | $43,483,706 | $53,679,748 | $60,700,041 | $63,486,372 | $60,029,287 | 9.85 | |
| Total Fixed Expenses | $7,331,761 | $8,981,519 | $10,147,809 | $10,478,429 | $11,331,286 | 1.86 | |
| Total Operating Expenses | $8,549,306 | $10,935,630 | $11,590,945 | $12,534,792 | $12,499,549 | 2.05 | |
| Total Expenses | $15,881,067 | $19,917,149 | $21,738,754 | $23,013,221 | $23,830,835 | 3.91 | |
| Net Operating Income | $27,602,639 | $33,762,598 | $38,961,287 | $40,473,151 | $36,198,452 | 5.94 | |
| TI/LC | $0 | $0 | $0 | $0 | $2,595,079 | 0.43 | |
| Capital Expenditures | $0 | $0 | $0 | $0 | $693,998 | 0.11 | |
| Net Cash Flow | $27,602,639 | $33,762,598 | $38,961,287 | $40,473,151 | $32,909,376 | 5.40 | |
| (1) | The change from 2019 Net Operating Income to U/W Net Operating Income is largely attributable to adjustments made in relation to dark and known to be vacating tenants. |
| (2) | U/W Base Rent is inclusive of contractual rent steps taken through June 1, 2021 and includes the ALDI, Inc. expansion of approximately 24,597 sq. ft. and HCSC relocation at the Naperville Woods Office Center property. U/W Base Rent has been further adjusted to account for a 10.0% stress to tenants who missed full or partial rent payments in April, May and/or June or have requested rent relief during the COVID-19 pandemic. The total stress to U/W Base Rent is $241,419. |
| (3) | Vacant Income includes all applicable dark tenants as well as known vacates. |
| (4) | Total Reimbursements include reimbursements to lease terms of each tenant. An additional stress loss adjustment of 10.0% was applied to any tenants that missed full rent payments in April, May and/or June. The total stress to reimbursements is $85,560. |
| (5) | Vacancy is underwritten to 10.7%, which represents the sum of economic vacancy of the Agellan Portfolio, inclusive of a minimum vacancy of 5.0% for all Agellan Properties. |
Property Management. The Agellan Portfolio is managed by 11 individual managers which include Agellan Management LP, Colliers International Management - Atlanta, LLC, Colliers International Greater Columbus Region, PCR Property Services, LLC d/b/a NAI Partners, Jones Lang LaSalle Americas, Inc., NAI Hiffman Asset Management, LLC, Stream Realty Partners-Austin, L.P., Stream Realty Partners-Houston, L.P., Stream Realty-Illinois, L.L.C., Hiffman Asset Management, LLC d/b/a Hiffman National, LLC, Stream Realty Partners - Central TX, L.P.
Lockbox / Cash Management. The Agellan Portfolio Whole Loan documents require a hard lockbox and in-place cash management. At loan origination, the Borrowers were required to deliver tenant direction letters within 30 days following the loan origination date to the existing tenants at the Agellan Portfolio Properties, directing each tenant to remit its rent checks directly to the lender-controlled lockbox. All funds in the lockbox account are required to be swept to a lender-controlled cash management account every business day. Provided no Cash Sweep Period (as defined below) is continuing, all funds remaining in the cash management account will be transferred into the Borrowers’ operating account. During a Cash Sweep Period, all excess cash in the cash management account after payment of debt service, required reserves, operating expenses, approved extraordinary expenses and mezzanine debt service will be retained by the lender as additional collateral for the Agellan Portfolio Whole Loan.
A “Cash Sweep Period” will commence upon the occurrence of (i) an event of default under the Agellan Portfolio Whole Loan documents, (ii) a bankruptcy action of any individual Borrower or any general partner or managing member, as applicable, of an individual Borrower, (iii) the date that is 30 days following any bankruptcy action of any property manager (unless as of such date such property manager has been replaced with a qualified manager under a replacement amanagement agreement in accordance with the Agellan Portfolio Whole Loan documents), (iv) the debt service coverage ratio for any calendar quarter (based upon Agellan Portfolio Whole Loan and Agellan Portfolio Mezzanine Loan (as defined below) assuming a 30-year amortization on the trailing three-month period immediately preceding the end of such calendar quarter) being less than 1.15x, or (v) an event of default under the Agellan Portfolio Mezzanine Loan documents.
A Cash Sweep Period will cease to exist upon the following events (each, a “Cash Sweep Event Cure”): with respect to (a) clause (i) or (v) above, a cure of such event of default, (b) clause (iii) above, the replacement of the property manager with a qualified manager under a replacement management agreement in accordance with the Agellan Portfolio Whole Loan documents, or (c) clause (iv) above, the achievement of a debt service coverage ratio of 1.15x or greater for any calendar quarter based upon a 30-year amortization on the trailing three-month period immediately preceding the end of such calendar quarter; provided (1) no other event of default is continuing under any Agellan Portfolio Whole Loan documents or Agellan Portfolio Mezzanine Loan documents, and (2) the Borrowers will have paid all of the lender’s reasonable and actual out-of-pocket costs and expenses and the mezzanine borrowers will have paid all of Mezzanine Lender’s (as defined below) reasonable and actual out-of-pocket costs and expenses, in each case, incurred by the lender or
19
Various Various, Various | Loan Specific Premarketing Term Sheet Agellan Portfolio | Cut-off Date Balance: Cut-off Date LTV: U/W NCF DSCR: U/W NOI Debt Yield: | $172,000,000 73.1% 1.78x 9.0% |
Mezzanine Lender, as applicable, in connection with such Cash Sweep Event Cure including, reasonable and actual out-of-pocket attorney’s fees and expenses.
Initial and Ongoing Reserves. At loan origination, the Borrowers deposited (i) $6,410,963 for outstanding TI/LC obligations and free rent, (ii) $2,000,000 into a working capital reserve, (iii) $2,985,266 into the required repair reserve for deferred maintenance and (iv) $172,050 into the gap rent reserve.
Tax Reserve. The Borrowers are required to deposit into a tax reserve, on a monthly basis, 1/12th of the estimated (a) annual real estate taxes, and (b) during a Cash Sweep Period, annual maintenance charges, impositions and any other charges levied or assessed against the Agellan Portfolio Properties unless Borrowers deliver evidence reasonably acceptable to lender that such amounts have or will be paid directly by a tenant.
Insurance Reserve. The Borrowers are required to deposit into an insurance reserve, on a monthly basis, 1/12th of estimated insurance premiums. In the event the Borrowers obtain and maintain a blanket insurance policy that otherwise complies with the requirements of the Agellan Portfolio Whole Loan documents and the Borrowers provide evidence acceptable to the lender that premiums payable in connection therewith have been prepaid for not less than one year in adcance, the requirement for monthly deposits into the insurance reserve will be waived.
Replacement Reserve. The Borrowers are required to deposit into the replacement reserve, on a monthly basis, 1/12 of $0.20 per sq. ft. of the Agellan Properties then encumbered by the lien of the Agellan Portfolio Whole Loan (approximately $101,570 as of the Origination Date), subject to a cap of the amount equal to 36 times the required monthly deposit (approximately $3.7 million as of the Origination Date).
TI/LC Reserve. The Borrowers are required to deposit into the TI/LC reserve, on a monthly basis, approximately $431,671 (1/12 of $0.85 per sq. ft.), subject to a cap of the amount equal to 36 times the required monthly deposit (approximately $15.5 million).
Common Charges Funds Reserve. During the continuance of a Cash Sweep Period, the Borrowers are required to deposit into the common charges reserve, on a monthly basis, an amount equal to one-twelfth of the fees, dues, charges and assessments payable under the condominium documents (the “Common Charges”) that the lender estimates will be payable during the next ensuing 12 months in order to accumulate sufficient funds to pay all such Common Charges at least 30 days prior to their respective due dates.
Current Mezzanine or Secured Subordinate Indebtedness. Concurrently with the funding of the Agellan Portfolio Whole Loan, the lender (in such capacity, the “Mezzanine Lender”) also funded a mezzanine loan in the amount of $31.0 million (the “Agellan Portfolio Mezzanine Loan”). The Agellan Portfolio Mezzanine Loan is secured by the pledge of the direct or indirect equity interest in the borrowers and is coterminous with the Agellan Portfolio Whole Loan. The Agellan Portfolio Mezzanine Loan accrues interest at a rate of 9.00000% per annum. Based on the Agellan Portfolio Whole Loan and the Agellan Portfolio Mezzanine Loan, the cumulative Cut-off Date LTV is 78.8%, the cumulative U/W NCF DSCR is 1.54x and the cumulative U/W NOI Debt Yield is 8.3%. The rights of the Mezzanine Lender under the Agellan Portfolio Mezzanine Loan are further described under “Description of the Mortgage Pool—Additional Indebtedness—Mezzanine Indebtedness” in the Preliminary Prospectus.
Future Mezzanine or Subordinate Indebtedness Permitted. None.
Other Indebtedness. Each of Agellan Commercial REIT U.S. L.P., 9385 Washington Blvd LP, 6100 McIntosh LP, Agellan Warrenville LP, Continental Drive LP, Norcross Springs LP, Corridor Park LP, Chicago Industrial Properties 1 LP (collectively, the “Intercompany Loan Lenders”) is a lender under a intercompany loan (each, an “Intercompany Loan”) to Piper Commercial Holdings LLC, an indirect parent company of the Intercompany Loan Lenders. The Intercompany Loans are fully funded, non-interest bearing, and collectively have an aggregate outstanding amount of $152,880,751. Each Intercompany Loan is unsecured and subject and subordinate to the Agellan Portfolio Loan in all respects. The borrower under each Intercompany Loan has agreed that so long as the Mortgage Loan remains outstanding, it will not (i) commence any legal or equitable proceedings against an Intercompany Loan Lender or otherwise in connection with such Intercompany Loan or (ii) assert any claims or demands whatsoever under applicable law against the Intercompany Loan Lender.
Partial Releases. Under the Agellan Portfolio Whole Loan documents, the Borrowers have the right to the release an individual Agellan Portfolio Property (each, an “Individual Property”) from the lien of the mortgage, provided that the Borrowers satisfy certain terms and conditions set forth in the loan agreement (the “Individual Loan Repayment Conditions”), including among other things (i) no event of default under the loan documents has occurred and is continuing (other than an event of default that would be cured by the release of such individual Agellan Portfolio Property); (ii) the applicable individual Borrower (each such Borrower, an “Individual Borrower”) will make a voluntary prepayment of the Agellan Portfolio Whole Loan in an amount equal to the Release Price (as defined below) for the Individual Property; (iii) after giving effect to the release of the applicable Individual Property (including the portion of the Agellan Portfolio Whole Loan prepaid pursuant to the terms of the loan agreement), the debt service coverage ratio for the Agellan Portfolio Properties then remaining subject to the liens of the mortgages (excluding the Individual Property requested to be released) based on the trailing 12-month period immediately preceding the release of the applicable Individual Property will be equal to or greater than the greater of (A) the Release Debt Service Coverage Ratio (as defined below), and (B) the debt service coverage ratio for all of the Agellan Portfolio
20
Various Various, Various | Loan Specific Premarketing Term Sheet Agellan Portfolio | Cut-off Date Balance: Cut-off Date LTV: U/W NCF DSCR: U/W NOI Debt Yield: | $172,000,000 73.1% 1.78x 9.0% |
Properties then remaining subject to the liens of the mortgages (including the Individual Property requested to be released) immediately preceding the release of the applicable Individual Property based on the trailing 12 month period immediately preceding the release of the applicable Individual Property (such greater amount, the “Required Release DSCR”), provided that the Borrowers will have the right to do any one or a combination of the following to achieve the Required Release DSCR in accordance with the Agellan Portfolio Whole Loan documents make a prepayment of the Agellan Portfolio Whole Loan, deliver a letter of credit and/or deposit cash collateral with lender; and (iv) to the extent the Individual Property is released and conveved to an affiliate of the Borrowers. the Borrowers will deliver an additional insolvency opinion. The Agellan Portfolio Whole Loan documents also provide that if the loan-to-value ratio exceeds or would exceed 125% immediately after the release, no release will be permitted unless the principal balance of the Agellan Portfolio Whole Loan is prepaid by an amount set forth in the Agellan Portfolio Whole Loan documents or the Borrower delivers a REMIC opinion.
“Release Debt Service Coverage Ratio” means a debt service coverage ratio of 1.70 to 1.00..
“Release Price” means, with respect to any Individual Property being released, (i) until an amount equal to 60,450,000.00 has been prepaid in connection with Partial Releases in accordance with the Agellan Portfolio Whole Loan documents, 110% of the Agellan Portfolio Whole Loan amount allocated to such Individual Property and (ii) thereafter,115% of the Agellan Portfolio Whole Loan amount allocated to such Individual Property.
Outparcel Release. In addition, the Agellan Portfolio Whole Loan documents provide that the Borrowers may release certain non-income producing outparcels comprising a portion of Sarasota Distribution Hub, Supervalu and Naperville Woods Office Center properties upon satisfaction of certain conditions set forth in the Agellan Portfolio Whole Loan documents, including, without limitation, the payment of a release price.
Condominium Structure. One of the Agellan Properties, owned by Chicago Industrial Properties 1 LP (the “Chicago Industrial Borrower”), is subject to a condominium declaration. The Chicago Industrial Borrower has an approximately 81.15% ownership in common elements, and controls the condominium association’s board of directors. Please see “Description of the Mortgage Pool—Mortgage Pool Characteristics—Fee & Leasehold Estates; Ground Leases” in the Preliminary Prospectus for additional information.
Top 10 Assets.
Sarasota Distribution Hub. The largest property by Whole Loan ALA, Sarasota Distribution Hub is comprised of 906,449 sq. ft. Class B industrial warehouse and distribution center across two buildings located in Sarasota, Florida. The site sits on approximately 57.1 acres and represents 13.0% of the Whole Loan ALA. The subject is located adjacent to Interstate 75 and north of Central Sarasota Parkway. The property was built in 1981 and was renovated in 2007. The Sarasota Distribution Hub is currently 100.0% leased to four tenants at an average underwritten base rent of approximately $5.30 per sq. ft. The largest tenant at the property is United Natural Foods, Inc., which occupies 463,172 sq. ft. with its lease expiring in July 2022 accounting for 54.6% of the Sarasota Distribution Hub’s underwritten rent. The property is located in the Sarasota industrial submarket, which contains approximately 17.11 million sq. ft. of industrial space with an overall vacancy rate of 2.6% and average asking rents for warehouse distribution properties of $6.65 per sq. ft. as of the fourth quarter of 2019. | 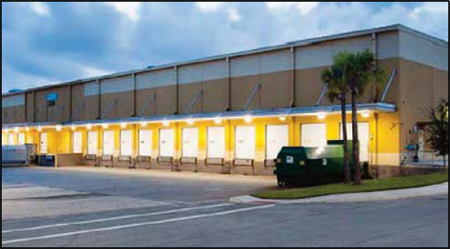 |
| Property Overview – Sarasota Distribution Hub | ||||||
| Property Address | City, State | Built / Renovated | Sq. Ft. | % Leased(1) | Appraised Value | Appraisal Cap Rate |
| 6100 McIntosh Road | Sarasota, FL | 1981 / 2007 | 906,449 | 100.0% | $70,200,000 | 6.75% |
| (1) | Based on the underwritten rent roll. |
| Historical Occupancy – Sarasota Distribution Hub | |||||||
| 2013 | 2014 | 2015 | 2016 | 2017 | 2018 | 2019 | Current(1) |
| NAV | NAV | NAV | 100.0% | 100.0% | 100.0% | 100.0% | 100.0% |
| (1) | Based on the underwritten rent roll. |
21
Various Various, Various | Loan Specific Premarketing Term Sheet Agellan Portfolio | Cut-off Date Balance: Cut-off Date LTV: U/W NCF DSCR: U/W NOI Debt Yield: | $172,000,000 73.1% 1.78x 9.0% |
| Major Tenant Summary – Sarasota Distribution Hub (1) | ||||||
| Tenant | Credit Rating (Moody's/Fitch/S&P)(2) | Net Rentable Area (Sq. Ft.) | % of Net Rentable Area | U/W Base Rent PSF(3) | % of Total U/W Base Rent | Lease Expiration |
| United Natural Foods, Inc. | B2/NR/B | 463,172 | 51.1% | $5.66 | 54.6% | 7/31/2022(4) |
| Beall’s, Inc. | NR/NR/NR | 200,000 | 22.1% | $4.80 | 20.0% | 9/30/2021(5) |
| Access USA | NR/NR/NR | 163,277 | 18.0% | $4.89 | 16.6% | 9/30/2024 |
| Albert’s Organics | B2/NR/B | 80,000 | 8.8% | $5.30 | 8.8% | 2/28/2025(6) |
| Total Major Tenants | 906,449 | 100.0% | $5.30 | 100.0% | ||
| Other Tenants | 0 | 0.0% | $0.00 | 0.0% | ||
| Vacant Space | 0 | 0.0% | ||||
| Total/Wtd. Avg. Tenants | 906,449 | 100.0% | $5.30 | 100.0% | ||
| (1) | Based on the underwritten rent roll. |
| (2) | Certain ratings provided are for the parent company of the tenant whether or not the parent company guarantees the lease. |
| (3) | U/W Base Rent PSF is inclusive of contractual rent steps taken through June 1, 2021. |
| (4) | United Natural Foods, Inc. has one, five-year renewal option at market rent. |
| (5) | In May 2018 Beall’s vacated and subleased their space to United Natural Foods, Inc. Beall’s Inc. has one, three-year renewal option at $5.30 per sq. ft. |
| (6) | Albert’s Organics has two, five-year options at 103% of the then-current base rent. |
| Naperville Woods Office Center. The second largest property by Whole Loan ALA, Naperville Woods Office Center is a four-story, 482,497 sq. ft. office building located in Naperville, Illinois approximately 28.0 miles from the Chicago central business district, and represents 12.8% of the Whole Loan ALA. The subject is located just north of Interstate 88 which is adjacent to the property. The property was built in 1981 and was renovated in 1988 and 2007. The Naperville Woods Office Center includes a cafeteria, a conference room, fitness center and a parking with 1,052 surface spaces (approximately 3.93 spaces per 1,000 sq. ft.). The Naperville Woods Office Center is currently 95.4% occupied by 13 tenants at an average underwritten base rent of $16.25 per sq. ft. The largest tenant at the property is Heath Care Service Corp, which currently occupies 175,080 sq. ft. (177,114 sq. ft. after relocation), with its lease expiring in November 2025 accounting for 37.9% of the property’s underwritten rent. HCSC will be relocated as part of the ALDI, Inc. expansion, which will allow HCSC to have all of its office space in one building at the property. Aldi, Inc., the second largest tenant recently exercised an expansion option and is taking an additional 24,597 sq. ft. at the property. The property is located in the Western East/West Corridor submarket, which contains approximately 41.22 million sq. ft. of office space with an overall vacancy rate of 10.4% and average asking rents of $20.34 per sq. ft. as of the fourth quarter of 2019. | 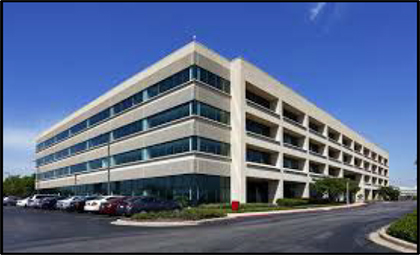 |
| Property Overview – Naperville Woods Office Center | ||||||
| Property Address | City, State | Built / Renovated | Sq. Ft. | % Leased(1) | Appraised Value | Appraisal Cap Rate |
| 1000 & 1100 East Warrenville Road | Naperville, IL | 1981; 1988 / 2007 | 482,497 | 95.4% | $68,800,000 | 8.25% |
| (1) | % Leased of 95.4% reflects an ALDI, Inc. lease expansion and relocation and expansion of Health Care Service Corp. ALDI exercised an expansion option for 24,597 sq. ft. in February 2020. The expansion space is currently occupied by HCSC. HCSC will be relocated as part of the ALDI expansion, which will allow HCSC to have all of its office space in one building. Additionally, HCSC’s overall footprint will increases slightly with the relocation space from 175,080 sq. ft. to 177,114 sq. ft. The expansion and relocation are estimated to occur in June/July 2021 and included in the underwriting. |
| Historical Occupancy – Naperville Woods Office Center | |||||||
| 2013 | 2014 | 2015 | 2016 | 2017 | 2018 | 2019 | Current(1) |
| 96.5% | 97.0% | 97.0% | 91.5% | 87.8% | 89.9% | 95.1% | 95.4% |
| (1) | Based on the underwritten rent roll. Current Occupancy reflects an ALDI, Inc. lease expansion and relocation and expansion of Health Care Service Corp. as discussed in footnote 1 above. |
22
Various Various, Various | Loan Specific Premarketing Term Sheet Agellan Portfolio | Cut-off Date Balance: Cut-off Date LTV: U/W NCF DSCR: U/W NOI Debt Yield: | $172,000,000 73.1% 1.78x 9.0% |
| Major Tenant Summary- Naperville Woods Office Center(1) | ||||||
| Tenant | Credit Rating (Moody's/Fitch/S&P)(2) | Net Rentable Area (Sq. Ft.) | % of Net Rentable Area | U/W Base Rent PSF(3) | % of Total U/W Base Rent | Lease Expiration |
| Health Care Service Corp. | A3/A-/AA- | 177,114 | 36.7% | $16.00 | 37.9% | 11/30/2025(4) |
| Aldi, Inc. | NR/NR/NR | 137,986 | 28.6% | $16.09 | 29.7% | 12/31/2028(5) |
| IMEG Corp | NR/NR/NR | 32,205 | 6.7% | $17.00 | 7.3% | 5/31/2025(6) |
| U.S. Bank | A1/AA-/A+ | 33,936 | 7.0% | $15.00 | 6.8% | 7/31/2027(7) |
| Equian, LLC | NR/NR/NR | 19,585 | 4.1% | $14.50 | 3.8% | 9/30/2028(8) |
| Total Major Tenants | 400,826 | 83.1% | $15.95 | 85.5% | ||
| Other Tenants | 59,510 | 12.3% | $18.25 | 14.5% | ||
| Vacant Space | 22,161 | 4.6% | ||||
| Total/Wtd. Avg. Tenants(9) | 482,497 | 100.0% | $16.25 | 100.0% | ||
| (1) | Based on the underwritten rent roll. |
| (2) | In certain instances, ratings provided are those of the parent company of the entity shown, whether or not the parent company guarantees the lease. |
| (3) | U/W Base Rent PSF is inclusive of contractual rent steps taken through June 1, 2021. |
| (4) | Health Care Service Corp. has one, five-year renewal option at market rent. |
| (5) | ALDI, Inc. has one, five-year renewal option at market rent. |
| (6) | IMEG Corp has one, five-year renewal option at market rent. IMEG Corp also has a one-time termination option as of May 31, 2022 with 365 days’ notice and a termination payment. |
| (7) | U.S. Bank has one, five-year renewal option at market rent. U.S. Bank also has a one-time termination option as of July 31, 2023 with 365 days’ notice and a termination payment. |
| (8) | Equian, LLC has three, five-year renewal options at market rent. |
| (9) | Wtd. Avg. Underwritten Base Rent PSF excludes vacant space. |
Southpark Business Park FOP. The third largest property by Whole Loan ALA, the Southpark Business Park FOP is comprised of three industrial flex warehouse buildings totaling 187,075 sq. ft. located in Austin, Texas. The site sits on approximately 13.6 acres and represents 6.4% of the Whole Loan ALA. The subject has primary access to Interstate 35 to the west and State Highway 71 to the north. The property was built in 1982 and is currently 100.0% leased to three tenants at an average underwritten base rent of $13.25 per sq. ft. The largest tenant at the property is Life Technologies Corporation which occupies 103,645 sq. ft. with its lease expiring in June 2025 accounts for 54.4% of underwritten base rent. In February 2020 Life Technologies Corporation executed a five year extension option. The property is located in the Southeast industrial submarket, which contains approximately 13.48 million sq. ft. of industrial space with an overall vacancy rate of 11.1% and average NNN asking rents of $8.86 per sq. ft. as of the fourth quarter of 2019. | 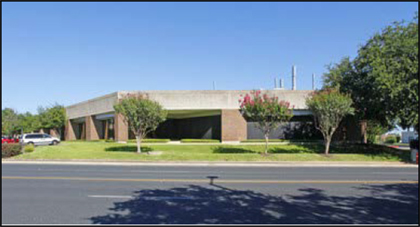 |
| Property Overview – Southpark Business Park FOP | ||||||
| Property Address | City, State | Built / Renovated | Sq. Ft. | % Leased(1) | Appraised Value | Appraisal Cap Rate |
| 2130, 2150 & 2170 Woodward Street | Austin, TX | 1982 / NAP | 187,075 | 100.0% | $34,900,000 | 6.25% |
| (1) | Based on the underwritten rent roll. |
| Historical Occupancy – Southpark Business Park FOP | |||||||
| 2013 | 2014 | 2015 | 2016 | 2017 | 2018 | 2019 | Current(1) |
| 100.0% | 100.0% | 100.0% | 100.0% | 100.0% | 100.0% | 100.0% | 100.0% |
| (1) | Based on the underwritten rent roll. |
| Major Tenant Summary – Southpark Business Park FOP (1) | ||||||
| Tenant | Credit Rating (Moody’s/Fitch/S&P)(2) | Net Rentable Area (Sq. Ft.) | % of Net Rentable Area | U/W Base Rent PSF(3) | % of Total U/W Base Rent | Lease Expiration |
| Life Technologies Corporation | Baa1/NR/BBB+ | 103,645 | 55.4% | $13.00 | 54.4% | 6/30/2025 |
| Asuragen | NR/NR/NR | 69,638 | 37.2% | $13.20 | 37.1% | 8/31/2023 |
| Total Major Tenants | 173,283 | 92.6% | $13.08 | 91.5% | ||
| Other Tenants | 13,792 | 7.4% | $15.34 | 8.5% | ||
| Vacant Space | 0 | 0.0% | ||||
| Total/Wtd. Avg. Tenants. | 187,075 | 100.0% | $13.25 | 100.0% | ||
| (1) | Based on the underwritten rent roll. |
| (2) | In certain instances, ratings provided are those of the parent company of the entity shown, whether or not the parent company guarantees the lease. |
| (3) | U/W Base Rent PSF is inclusive of contractual rent steps taken through June 1, 2021. |
23
Various Various, Various | Loan Specific Premarketing Term Sheet Agellan Portfolio | Cut-off Date Balance: Cut-off Date LTV: U/W NCF DSCR: U/W NOI Debt Yield: | $172,000,000 73.1% 1.78x 9.0% |
| Supervalu. The fourth largest property by Whole Loan ALA, Supervalu is comprised of 253,800 sq. ft. industrial warehouse distribution building located in Fort Worth, Texas. The site sits on approximately 24.37 acres and represents 4.8% of the Whole Loan ALA. The subject has primary access to Highway 287 and is approximately fifteen minutes from the Fort Worth Central Business District. The property was built in 1996 and is currently 100.0% leased to a single tenant with an average underwritten base rent of $6.20 per sq. ft. The sole tenant at the property is Moran Foods LLC which has a lease expiring in September 2025. The property is located in the South Central Tarrant County industrial submarket, which contains approximately 23.04 million sq. ft. of industrial space with an overall vacancy rate of 8.8% and average NNN asking rents of $4.50 per sq. ft. as of the fourth quarter of 2019. | 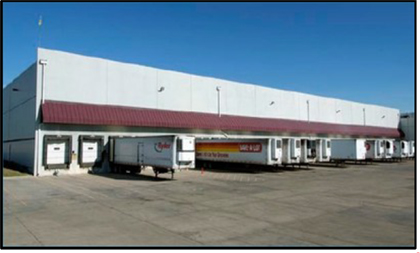 |
| Property Overview - Supervalu | ||||||
| Property Address | City, State | Built / Renovated | Sq. Ft. | % Leased(1) | Appraised Value | Appraisal Cap Rate |
| 1201 John Burgess Drive | Fort Worth, TX | 1996 / NAP | 253,800 | 100.0% | $26,720,000 | 6.50% |
| (1) | Based on the underwritten rent roll. |
| Historical Occupancy - Supervalu | |||||||
| 2013 | 2014 | 2015 | 2016 | 2017 | 2018 | 2019 | Current(1) |
| 100.0% | 100.0% | 100.0% | 100.0% | 100.0% | 100.0% | 100.0% | 100.0% |
| (1) | Based on the underwritten rent roll. |
| Major Tenant Summary - Supervalu (1) | ||||||
| Tenant | Credit Rating (Moody’s/Fitch/S&P)(2) | Net Rentable Area (Sq. Ft.) | % of Net Rentable Area | U/W Base Rent PSF(3) | % of Total U/W Base Rent | Lease Expiration |
| Moran Foods LLC | B3/NR/B- | 253,800 | 100.0% | $6.20 | 100.0% | 9/30/2025(4) |
| Total Major Tenants | 253,800 | 100.0% | $6.20 | 100.0% | ||
| Other Tenants | 0 | 0.0% | $0.00 | 0.0% | ||
| Vacant Space | 0 | 0.0% | ||||
| Total/Wtd. Avg. Tenant | 253,800 | 100.0% | $6.20 | 100.0% | ||
| (1) | Based on the underwritten rent roll. |
| (2) | In certain instances, ratings provided are those of the parent company of the entity shown, whether or not the parent company guarantees the lease. |
| (3) | U/W Base Rent PSF is inclusive of contractual rent steps taken through June 1, 2021. |
| (4) | Moran Foods LLC has two, seven-year renewal options at $6.75 per sq. ft. and market rent, respectively. |
| Plainfield Business Center IV. The fifth largest property by Whole Loan ALA, Plainfield Business Center IV is comprised of 434,354 sq. ft. Class A industrial warehouse/distribution building located in Plainfield, Indiana. The site sits on approximately 25.17 acres and represents 4.4% of the Whole Loan ALA. The subject is located adjacent to the Indianapolis International Airport with Interstate 70 to the south and US 40 to the north. The property was built in 1999 and is currently 100.0% leased to two tenants with an average underwritten base rent of $3.19 per sq. ft. The largest tenant at the property is Ceva Freight LLC has been a tenant since 2001 and currently occupies two spaces totaling 333,397 sq. ft. Ceva Freight LLC has a lease expiration date of August 2022 and accounts for 74.2% of the underwritten base rent at the property. The second largest tenant at the property Burlington Mattress Co. LLC occupies 100,957 sq. ft. and recently extended their lease for an additional three years to December 2022.The property is located in the Plainfield industrial submarket, which contains approximately 43.84 million sq. ft. of industrial space with an overall vacancy rate of 6.1% and average NNN asking rents of $4.24 per sq. ft. as of the fourth quarter of 2019. | 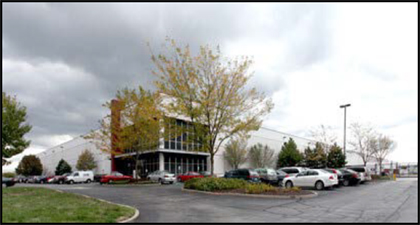 |
| Property Overview – Plainfield Business Center IV | ||||||
| Property Address | City, State | Built / Renovated | Sq. Ft. | % Leased(1) | Appraised Value | Appraisal Cap Rate |
| 2151 Airwest Boulevard | Plainfield, IN | 1999 / NAP | 434,354 | 100.0% | $24,100,000 | 5.75% |
| (1) | Based on the underwritten rent roll. |
24
Various Various, Various | Loan Specific Premarketing Term Sheet Agellan Portfolio | Cut-off Date Balance: Cut-off Date LTV: U/W NCF DSCR: U/W NOI Debt Yield: | $172,000,000 73.1% 1.78x 9.0% |
| Historical Occupancy – Plainfield Business Center IV | |||||||
| 2013 | 2014 | 2015 | 2016 | 2017 | 2018 | 2019 | Current(1) |
| 88.0% | 88.0% | 82.3% | 79.8% | 100.0% | 100.0% | 100.0% | 100.0% |
| (1) | Based on the underwritten rent roll. |
| Major Tenant Summary – Plainfield Business Center IV (1) | ||||||
| Tenant | Credit Rating (Moody’s/Fitch/S&P)(2) | Net Rentable Area (Sq. Ft.) | % of Net Rentable Area | U/W Base Rent PSF(3) | % of Total U/W Base Rent | Lease Expiration |
| CEVA Freight LLC | B1/NR/B+ | 333,397 | 76.8% | $3.09 | 74.2% | 8/31/2022(4) |
| Burlington Mattress Co. LLC | NR/NR/NR | 100,957 | 23.2% | $3.54 | 25.8% | 12/31/2022 |
| Total Major Tenants | 434,354 | 100.0% | $3.19 | 100.0% | ||
| Other Tenants | 0 | 0.0% | $0.00 | 0.0% | ||
| Vacant Space | 0 | 0.0% | ||||
| Total/Wtd. Avg. Tenants | 434,354 | 100.0% | $3.19 | 100.0% | ||
| (1) | Based on the underwritten rent roll. |
| (2) | Certain ratings provided are for the parent company of the tenant whether or not the parent company guarantees the lease. |
| (3) | U/W Base Rent PSF is inclusive of contractual rent steps taken through June 1, 2021. |
| (4) | CEVA Freight LLC has two, five-year renewal options at market rent. |
| Beltway III. The sixth largest property by Whole Loan ALA, Beltway III is comprised of 130,566 sq. ft. Class B office property located in Houston, Texas. The site sits on approximately 11.01 acres and represents 3.7% of the Whole Loan ALA. The subject has primary access to the Sam Houston Parkway and is approximately 20 minutes from the Houston Central Business District. The property was built in 2005 and is currently 100.0% leased to four tenants with an average underwritten base rent of $17.98 per sq. ft. The largest tenant at the property is Disa Global Solutions, Inc. which occupies 34,919 sq. ft. at the property and has a lease expiration date of August 2027 and accounts for 23.7% of the underwritten base rent at the property. Beltway III is the corporate headquarters for Disa Global Solutions, Inc. The property is located in the West Belt office submarket, which contains approximately 6.3 million sq. ft. of office with an overall vacancy rate of 19.0% and average gross rents of $24.59 per sq. ft. as of the fourth quarter of 2019. | 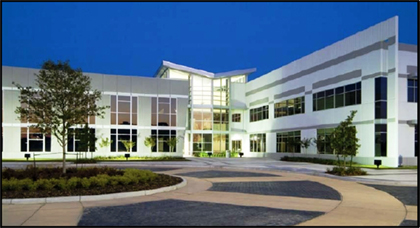 |
| Property Overview – Beltway III | ||||||
| Property Address | City, State | Built / Renovated | Sq. Ft. | % Leased(1) | Appraised Value | Appraisal Cap Rate |
| 10900 Corporate Centre Drive | Houston, TX | 2005 / NAP | 130,566 | 100.0% | $20,100,000 | 8.00% |
| (1) | Based on the underwritten rent roll. |
| Historical Occupancy – Beltway III | |||||||
| 2013(1) | 2014 | 2015 | 2016 | 2017 | 2018 | 2019 | Current(2) |
| 98.0% | 98.0% | 98.0% | 85.8% | 93.5% | 100.0% | 100.0% | 100.0% |
| (1) | Represents 2013 year end occupancy. |
| (2) | Based on the underwritten rent roll. |
| Major Tenant Summary – Beltway III (1) | ||||||
| Tenant | Credit Rating (Moody’s/Fitch/S&P)(2) | Net Rentable Area (Sq. Ft.) | % of Net Rentable Area | U/W Base Rent PSF(3) | % of Total U/W Base Rent | Lease Expiration |
| Disa Global Solutions, Inc. | NR/NR/NR | 34,919 | 26.7% | $15.92 | 23.7% | 8/31/2027(4) |
| Community Health Choice, Inc. | NR/NR/NR | 32,884 | 25.2% | $16.00 | 22.4% | 11/30/2023 |
| Convergent Outsourcing, Inc. | NR/NR/NR | 31,709 | 24.3% | $16.50 | 22.3% | 11/30/2027(5) |
| BBVA Compass Bank | NR/NR/BBB+ | 31,054 | 23.8% | $23.90 | 31.6% | 7/31/2022(6) |
| Total Major Tenants | 130,566 | 100.0% | $17.98 | 100.0% | ||
| Other Tenants | 0 | 0.0% | $0.00 | 0.0% | ||
| Vacant Space | 0 | 0.0% | ||||
| Total/Wtd. Avg. Tenants | 130,566 | 100.0% | $17.98 | 100.0% | ||
| (1) | Based on the underwritten rent roll. |
| (2) | Certain ratings provided are for the parent company of the tenant whether or not the parent company guarantees the lease. |
| (3) | U/W Base Rent PSF is inclusive of contractual rent steps taken through June 1, 2021. BBVA Compass Bank’s U/W Base Rent PSF is modified gross and the other tenants are triple net. |
| (4) | Disa Global Solutions, Inc. has one, five-year renewal option at market rent. |
| (5) | Convergent Outsourcing, Inc. has a one-time termination option as of July 31, 2024 with 305 days’ notice and a termination payment of $550,000. |
| (6) | BBVA Compass Bank has one, 10-year renewal option (or two five-year renewals, at tenant’s option) at 95% of market rent. |
25
Various Various, Various | Loan Specific Premarketing Term Sheet Agellan Portfolio | Cut-off Date Balance: Cut-off Date LTV: U/W NCF DSCR: U/W NOI Debt Yield: | $172,000,000 73.1% 1.78x 9.0% |
| 4405 Continental Dr. The seventh largest property by Whole Loan ALA, 4405 Continental Dr, is a 400,000 sq. ft. warehouse/distribution industrial property located in Flint, Michigan, representing approximately 3.4% of Whole Loan ALA. The property is located approximately 56.4 miles from the Detroit central business district and is west of I-75 which provides access to Detroit. Built in 1999 and renovated in 2006, the property’s sole tenant is General Motors LLC, which lease is expiring in August 2021, and has two 5-year renewal options. According to the Borrower Sponsor the tenant has expressed interest in renewing and the Borrower Sponsor is working to provide the tenant with a formal proposal with renewal terms. The property features 103 surface parking space, representing a parking ratio of approximately 0.26 spaces per 1,000 sq. ft. | 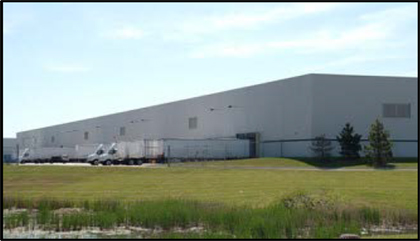 |
| Property Overview – 4405 Continental Drive | ||||||
| Property Address | City, State | Built / Renovated | Sq. Ft. | % Leased(1) | Appraised Value | Appraisal Cap Rate |
| 4405 Continental Drive | Flint, MI | 1999 / 2006 | 400,000 | 100.0% | $18,750,000 | 9.50% |
| (1) | Based on the underwritten rent roll. |
| Historical Occupancy – 4405 Continental Drive | |||||||
| 2013 | 2014 | 2015 | 2016 | 2017 | 2018 | 2019 | Current(1) |
| NAV | NAV | NAV | NAV | 100.0% | 100.0% | 100.0% | 100.0% |
| (1) | Based on the underwritten rent roll. |
| Major Tenant Summary – 4405 Continental Drive (1) | ||||||
| Tenant | Credit Rating (Moody’s/Fitch/S&P)(2) | Net Rentable Area (Sq. Ft.) | % of Net Rentable Area | U/W Base Rent PSF(3) | % of Total U/W Base Rent | Lease Expiration |
| General Motors, LLC | Baa3/BBB-/BBB | 400,000 | 100.0% | $5.24 | 100.0% | 8/31/2021(4) |
| Total Major Tenants | 400,000 | 100.0% | $5.24 | 100.0% | ||
| Other Tenants | 0 | 0.0% | $0.00 | 0.0% | ||
| Vacant Space | 0 | 0.0% | ||||
| Total/Wtd. Avg. Tenants(3) | 400,000 | 100.0% | $5.24 | 100.0% | ||
| (1) | Based on the underwritten rent roll. |
| (2) | Certain ratings provided are for the parent company of the tenant whether or not the parent company guarantees the lease. |
| (3) | U/W Base Rent PSF is inclusive of contractual rent steps taken through June 1, 2021. |
| (4) | General Motors, LLC has two, five-year renewal options at the greater of market rent or 90% of the then-current base rent. The tenant has expressed interest in renewing and the Borrower Sponsor is working to provide the tenant with a formal proposal with renewal terms. |
| Beltway IV. The eighth largest property by Whole Loan ALA, Beltway IV is comprised of 131,702 sq. ft. Class B office property located in Houston, Texas. The site sits on approximately 10.91 acres and represents 3.1% of the Whole Loan ALA. The subject has primary access to the Sam Houston Parkway and is approximately 20 minutes from the Houston Central Business District and 25 minutes from the George Bush Intercontinental Airport. The property was built in 2006 and is currently 72.6% leased to two tenants with an average underwritten base rent of $17.93 per sq. ft. The largest tenant at the property is Allstate Insurance Co., which occupies two spaces at the property totaling 75,623 sq. ft. with a lease expiration date of May 2024 and accounts for 70.9% of the underwritten base rent at the property. The property is located in the West Belt office submarket, which contains approximately 6.3 million sq. ft. of office space with an overall vacancy rate of 19.0% and average gross rents of $24.59 per sq. ft. as of the fourth quarter of 2019. | 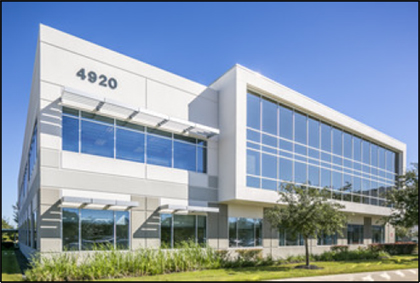 |
| Property Overview – Beltway IV | ||||||
| Property Address | City, State | Built / Renovated | Sq. Ft. | % Leased(1) | Appraised Value | Appraisal Cap Rate |
| 4920 Westway Park Boulevard | Houston, TX | 2006 / NAP | 131,702 | 72.6% | $17,200,000 | 8.50% |
| (1) | Based on the underwritten rent roll. |
26
Various Various, Various | Loan Specific Premarketing Term Sheet Agellan Portfolio | Cut-off Date Balance: Cut-off Date LTV: U/W NCF DSCR: U/W NOI Debt Yield: | $172,000,000 73.1% 1.78x 9.0% |
| Historical Occupancy – Beltway IV | |||||||
| 2013(1) | 2014 | 2015 | 2016 | 2017 | 2018 | 2019 | Current(2) |
| 100.0% | 100.0% | 100.0% | 100.0% | 79.3% | 72.7% | 72.6% | 72.6% |
| (1) | Represents 2013 year end occupancy |
| (2) | Based on the underwritten rent roll. |
| Major Tenant Summary – Beltway IV (1) | ||||||
| Tenant | Credit Rating (Moody’s/Fitch/S&P)(2) | Net Rentable Area (Sq. Ft.) | % of Net Rentable Area | U/W Base Rent PSF(3) | % of Total U/W Base Rent | Lease Expiration |
| Allstate Insurance Co. | Aa3/A+/AA- | 75,623 | 57.4% | $16.00 | 70.9% | 5/31/2024(4) |
| Walgreens Co. | Baa2/BBB-/BBB | 19,982 | 15.2% | $25.25 | 29.4% | 9/6/2022(5) |
| Total Major Tenants | 95,605 | 72.6% | $17.93 | 100.0% | ||
| Other Tenants | 0 | 0.0% | $0.00 | 0.0% | ||
| Vacant Space | 36,097 | 27.4% | ||||
| Total/Wtd. Avg. Tenants(6) | 131,702 | 100.0% | $17.93 | 100.0% | ||
| (1) | Based on the underwritten rent roll. |
| (2) | Certain ratings provided are for the parent company of the tenant whether or not the parent company guarantees the lease. |
| (3) | U/W Base Rent PSF is inclusive of contractual rent steps taken through June 1, 2021. Allstate Insurance Co., U/W Base Rent PSF is triple net, while Walgreens Co, is modified gross. |
| (4) | Allstate Insurance Co. has two, five-year renewal options upon nine months’ notice at 95% of market rent. Allstate Insurance also has a one-time termination option as of any month end between May 2022 and May 2023. |
| (5) | Walgreens Co. has two, five-year renewal options at market rent pursuant to a nine month notice. |
| (6) | Wtd. Avg. Underwritten Base Rent PSF excludes vacant space. |
| Sandy Plains Business Park. The ninth largest property by Whole Loan ALA, Sandy Plains Business Park, is a three building, 167,329 sq. ft. flex industrial property located in Marietta, Georgia representing approximately 2.9% of Whole Loan ALA. The property is located approximately 18.5 miles from the Atlanta central business district and is east of Interstate 75 which provides direct access to Atlanta. Built in 1986, the property features 535 surface parking spaces, which results in parking ratio of approximately 3.20 spaces per 1,000 sq. ft. The property is currently 94.3% occupied by 18 tenants at an underwritten base rent of approximately $7.23 per sq. ft. The largest tenant at the property is Softtouch Medical LLC, which occupies 22,624 sq. ft. with its lease expiring in April 2021. Softtouch Medical LLC has one five year renewal option and accounts for approximately 12.8% of the property’s underwritten rent. The property is located in the NE Cobb County/Marietta submarket which contains approximately 6.3 million sq. ft. of industrial space with an overall vacancy of 5.7% as of the fourth quarter of 2019. |  |
| Property Overview – Sandy Plains Business Park | ||||||
| Property Address | City, State | Built / Renovated | Sq. Ft. | % Leased(1) | Appraised Value | Appraisal Cap Rate |
| 1800 Sandy Plains Industrial Parkway | Marietta, GA | 1986 / NAP | 167,329 | 94.3% | $15,700,000 | 7.00% |
| (1) | Based on the underwritten rent roll. |
| Historical Occupancy – Sandy Plains Business Park | |||||||
| 2013 | 2014 | 2015(1) | 2016 | 2017 | 2018 | 2019 | Current(2) |
| NAV | NAV | 97.5% | 98.3% | 93.0% | 97.2% | 94.8% | 94.3% |
| (1) | Represents average occupancy for the third and fourth quarters of 2015. |
| (2) | Based on the underwritten rent roll. |
27
Various Various, Various | Loan Specific Premarketing Term Sheet Agellan Portfolio | Cut-off Date Balance: Cut-off Date LTV: U/W NCF DSCR: U/W NOI Debt Yield: | $172,000,000 73.1% 1.78x 9.0% |
| Major Tenant Summary – Sandy Plains Business Park (1) | ||||||
| Tenant | Credit Rating (Moody’s/Fitch/S&P)(2) | Net Rentable Area (Sq. Ft.) | % of Net Rentable Area | U/W Base Rent PSF(3) | % of Total U/W Base Rent | Lease Expiration |
| Softtouch Medical LLC | NR/NR/NR | 22,624 | 13.5% | $6.45 | 12.8% | 4/30/2021(4) |
| Dish Network Service LLC | NR/NR/NR | 19,848 | 11.9% | $6.95 | 12.1% | 1/31/2025(5) |
| Kone, Inc | NR/NR/NR | 15,384 | 9.2% | $6.07 | 8.2% | 12/31/2024(6) |
| Absolute Printing | NR/NR/NR | 13,928 | 8.3% | $5.92 | 7.2% | 10/31/2020(7) |
| Vaperite Inc | NR/NR/NR | 13,194 | 7.9% | $6.19 | 7.2% | 3/31/2022 |
| Total Major Tenants | 84,978 | 50.8% | $6.37 | 47.4% | ||
| Other Tenants | 72,771 | 43.5% | $8.24 | 52.6% | ||
| Vacant Space | 9,580 | 5.7% | ||||
| Total/Wtd. Avg. Tenants(8) | 167,329 | 100.0% | $7.23 | 100.0% | ||
| (1) | Based on the underwritten rent roll. |
| (2) | Certain ratings provided are for the parent company of the tenant whether or not the parent company guarantees the lease. |
| (3) | U/W Base Rent PSF is inclusive of contractual rent steps taken through June 1, 2021. |
| (4) | Softtouch Medical LLC has one, five-year renewal option at market rent. |
| (5) | Dish Network Service LLC has one, three-year renewal option at market rent. |
| (6) | Kone, Inc. has one, five-year renewal option at market rent. Kone also has a one-time termination option as of July 31, 2020 with 365 days’ notice and a termination payment. |
| (7) | Absolute Printing has one, two-year renewal option at market rent. |
| (8) | Wtd. Avg. Underwritten Base Rent PSF excludes vacant space. |
| Silber Industrial Park. The tenth largest property by ALA, Silber Industrial Park, is a three building, 198,970 sq. ft. warehouse/distribution industrial property located in Houston, Texas. The property is located approximately 7.2 miles from the Houston central business district, and represents approximately 2.6% of the ALA. The subject is located north of Interstate 10, which connects the property to the Houston central business district. Built in 1978, the property features 196 parking space, which results in a parking ratio of approximately 0.99 spaces per 1,000 sq. ft. The property is currently 90.4% occupied by 10 tenants at an average underwritten base rent of $4.91 per sq. ft. The largest tenant at the property is RedCo Distribution, LLC., which occupies 53,663 sq. ft. with its lease expiring in May 2024 accounting for approximately 27.0% of the property’s underwritten rent. The property is located in the Northwest Inner Loop industrial submarket which contains approximately 54.6 million sq. ft. of industrial space with an overall vacancy of 5.9% and average NNN asking rents of $6.91 per sq. ft. as of the fourth quarter of 2019. |  |
| Property Overview – Silber Industrial Park | ||||||
| Property Address | City, State | Built / Renovated | Sq. Ft. | % Leased(1) | Appraised Value | Appraisal Cap Rate |
| 2055, 2105 & 2155 Silber Road | Houston, TX | 1978 / NAP | 198,970 | 90.4% | $14,100,000 | 6.50% |
| (1) | Based on the underwritten rent roll. |
| Historical Occupancy – Silber Industrial Park | |||||||
| 2013 | 2014 | 2015 | 2016 | 2017 | 2018 | 2019 | Current(1) |
| 99.0% | 99.0% | 99.0% | 99.0% | 99.0% | 99.2% | 94.8% | 90.4% |
| (1) | Based on the underwritten rent roll. |
28
Various Various, Various | Loan Specific Premarketing Term Sheet Agellan Portfolio | Cut-off Date Balance: Cut-off Date LTV: U/W NCF DSCR: U/W NOI Debt Yield: | $172,000,000 73.1% 1.78x 9.0% |
| Major Tenant Summary – Silber Industrial Park (1) | ||||||
| Tenant | Credit Rating (Moody’s/Fitch/S&P) | Net Rentable Area (Sq. Ft.) | % of Net Rentable Area | U/W Base Rent PSF(2) | % of Total U/W Base Rent | Lease Expiration |
| RedCo Distribution, LLC. | NR/NR/NR | 53,663 | 27.0% | $4.03 | 24.5% | 5/31/2024(3) |
| Veritrust Corporation | NR/NR/NR | 41,937 | 21.1% | $4.14 | 19.7% | 4/30/2023(4) |
| Schindler Elevator Corporation | NR/NR/NR | 23,885 | 12.0% | $4.92 | 13.3% | 12/31/2022(5) |
| Pilkington North America, Inc. | NR/NR/NR | 16,127 | 8.1% | $4.56 | 8.3% | 5/31/2021(6) |
| Audio Visual Services Group | NR/NR/NR | 13,630 | 6.9% | $7.40 | 11.4% | 6/30/2022 |
| Total Major Tenants | 149,242 | 75.0% | $4.57 | 77.3% | ||
| Other Tenants | 30,556 | 15.4% | $6.57 | 22.7% | ||
| Vacant Space | 19,172 | 9.6% | ||||
| Total/Wtd. Avg. Tenants(7) | 198,970 | 100.0% | $4.91 | 100.0% | ||
| (1) | Based on the underwritten rent roll. |
| (2) | U/W Base Rent PSF is inclusive of contractual rent steps taken through June 1, 2021. |
| (3) | RedCo Distribution, LLC has one, five-year renewal option at market rent. |
| (4) | Veritrust Corporation has one, five-year renewal option at market rent. |
| (5) | Schindler Elevator Corporation has one, five-year renewal option at market rent. |
| (6) | Pilkington North America, Inc. has one, five-year renewal option at market rent. |
| (7) | Wtd. Avg. Underwritten Base Rent PSF excludes vacant space. |
29