| FREE WRITING PROSPECTUS | ||
| FILED PURSUANT TO RULE 433 | ||
| REGISTRATION FILE NO.: 333-226943-07 | ||
July 20, 2020
FREE WRITING PROSPECTUS
STRUCTURAL AND COLLATERAL TERM SHEET
$934,463,108
(Approximate Total Mortgage Pool Balance)
$636,912,000
(Approximate Offered Certificates)
BENCHMARK 2020-B18 |
Deutsche Mortgage & Asset Receiving Corporation
Depositor
German American Capital Corporation
JPMorgan Chase Bank, National Association
Goldman Sachs Mortgage Company
Citi Real Estate Funding Inc.
Sponsors and Mortgage Loan Sellers
| Deutsche Bank Securities | Goldman Sachs & Co. LLC | Citigroup | J.P. Morgan |
| |||
| Drexel Hamilton | AmeriVet Securities |
| Co-Managers | |
The depositor has filed a registration statement (including the prospectus) with the Securities and Exchange Commission (File No. 333-226943) for the offering to which this communication relates. Before you invest, you should read the prospectus in the registration statement and other documents the depositor has filed with the Securities and Exchange Commission for more complete information about the depositor, the issuing entity and this offering. You may get these documents for free by visiting EDGAR on the Securities and Exchange Commission website at www.sec.gov. Alternatively, the depositor or Deutsche Bank Securities Inc., any other underwriter, or any dealer participating in this offering will arrange to send you the prospectus if you request it by calling toll-free 1-800-503-4611 or by emailing: prospectus.cpdg@db.com. The offered certificates referred to in these materials, and the asset pool backing them, are subject to modification or revision (including the possibility that one or more classes of certificates may be split, combined or eliminated at any time prior to issuance or availability of a final prospectus) and are offered on a “when, as and if issued” basis. You understand that, when you are considering the purchase of these certificates, a contract of sale will come into being no sooner than the date on which the relevant class has been priced and we have verified the allocation of certificates to be made to you; any “indications of interest” expressed by you, and any “soft circles” generated by us, will not create binding contractual obligations for you or us. This free writing prospectus does not contain all information that is required to be included in the prospectus.
Capitalized terms used but not defined herein have the meanings assigned to them in the Preliminary Prospectus expected to be dated July 20, 2020 relating to the offered certificates (hereinafter referred to as the “Preliminary Prospectus”).
| KEY FEATURES OF SECURITIZATION |
| Offering Terms: | ||
| Co-Lead Managers and Joint Bookrunners: | Deutsche Bank Securities Inc., J.P. Morgan Securities LLC, Goldman Sachs & Co. LLC and Citigroup Global Markets Inc. | |
| Co-Managers: | Drexel Hamilton, LLC and AmeriVet Securities, Inc. | |
| Sponsors and Mortgage Loan Sellers: | German American Capital Corporation* (“GACC”) (23.3%), JPMorgan Chase Bank, National Association (“JPMCB”) (30.8%), Goldman Sachs Mortgage Company (“GSMC”) (24.4%) and Citi Real Estate Funding Inc. (“CREFI”) (21.5%) *An indirect wholly owned subsidiary of Deutsche Bank AG | |
| Master Servicer: | Midland Loan Services, a Division of PNC Bank, National Association | |
| Operating Advisor: | Park Bridge Lender Services LLC | |
| Asset Representations Reviewer: | Park Bridge Lender Services LLC | |
| Special Servicer: | Midland Loan Services, a Division of PNC Bank, National Association | |
| Certificate Administrator: | Wells Fargo Bank, National Association | |
| Trustee: | Wells Fargo Bank, National Association | |
| Rating Agencies: | Fitch Ratings, Inc. (“Fitch”), Kroll Bond Rating Agency, LLC (“KBRA”) and Standard & Poor’s Financial Services (“S&P”). | |
| Credit Risk Retention: | For a discussion on the manner in which the U.S. credit risk retention requirements are being satisfied by GACC, as retaining sponsor, see “Credit Risk Retention” in the Preliminary Prospectus. Note that this securitization transaction is not being structured to satisfy EU risk retention and due diligence requirements. | |
| Determination Date: | 11th day of each month, or if such 11th day is not a business day, the immediately following business day, commencing in August 2020. | |
| Distribution Date: | 4th business day following the Determination Date in each month, commencing in August 2020. | |
| Cut-off Date: | With respect to each mortgage loan, the later of the related payment date of such mortgage loan in July 2020 (or, in the case of any mortgage loan that has its first due date subsequent to July 2020, the date that would have been its due date in July 2020 under the terms of that mortgage loan if a monthly payment were scheduled to be due in that month) and the date of origination of such mortgage loan. Unless otherwise noted, all mortgage loan statistics are based on balances as of the Cut-off Date. | |
| Closing Date: | On or about July 31, 2020 | |
| Settlement Terms: | DTC, Euroclear and Clearstream, same day funds, with accrued interest. | |
| ERISA Eligible: | All of the Offered Certificates are expected to be ERISA eligible. | |
| SMMEA Eligible: | None of the Offered Certificates will be SMMEA eligible. | |
| Day Count: | 30/360 | |
| Tax Treatment: | REMIC | |
| Rated Final Distribution Date: | July 2053 | |
| Minimum Denominations: | $10,000 (for each class of offered principal balance certificates) and $100,000 (for each class of offered interest-only certificates) and in each case in multiples of $1 thereafter. | |
| Clean-up Call: | 1% (with certain exceptions described under “Pooling and Servicing Agreement—Termination; Retirement of Certificates” in the Preliminary Prospectus) | |
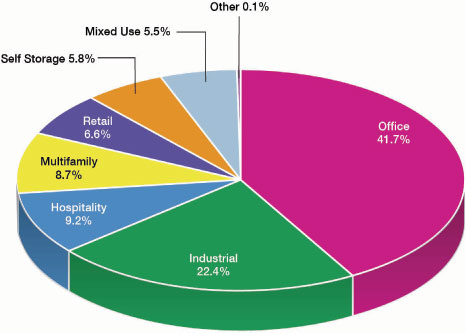
| Distribution of Collateral by Property Type |
THE INFORMATION IN THIS STRUCTURAL AND COLLATERAL TERM SHEET IS NOT COMPLETE AND MAY BE AMENDED PRIOR TO THE TIME OF SALE. THIS TERM SHEET IS NOT AN OFFER TO SELL THESE SECURITIES AND IT IS NOT A SOLICITATION OF AN OFFER TO BUY THESE SECURITIES IN ANY JURISDICTION WHERE THE OFFER OR SALE IS NOT PERMITTED.
2
Benchmark 2020-B18 Mortgage Trust
|
| OVERVIEW OF MORTGAGE POOL CHARACTERISTICS |
| Mortgage Loan Sellers | Number of Mortgage Loans | Number of Mortgaged Properties | Aggregate Cut-off Date Balance | % of Initial Outstanding Pool Balance | |
| German American Capital Corporation | 6 | 73 | $161,500,000 | 17.3% | |
| JPMorgan Chase Bank, National Association | 9 | 54 | $238,608,108 | 25.5% | |
| Goldman Sachs Mortgage Company | 4 | 6 | $227,700,000 | 24.4% | |
| Citi Real Estate Funding Inc. | 15 | 17 | $140,805,000 | 15.1% | |
| Citi Real Estate Funding Inc. / German American Capital Corporation(1) | 1 | 2 | $65,000,000 | 7.0% | |
| German American Capital Corporation / JPMorgan Chase Bank, National Association(2) | 1 | 1 | $62,850,000 | 6.7% | |
| JPMorgan Chase Bank, National Association / Citi Real Estate Funding Inc. (3) | 1 | 1 | $38,000,000 | 4.1% | |
| Total: | 37 | 154 | $934,463,108 | 100.0% | |
Collateral Facts | |||||
| Initial Outstanding Pool Balance: | $934,463,108 | ||||
| Number of Mortgage Loans: | 37 | ||||
| Number of Mortgaged Properties: | 154 | ||||
| Average Mortgage Loan Cut-off Date Balance: | $25,255,760 | ||||
| Weighted Average Mortgage Rate: | 3.7750% | ||||
| Weighted Average Mortgage Loan Original Term to Maturity Date or ARD (months)(4): | 106 | ||||
| Weighted Average Mortgage Loan Remaining Term to Maturity Date or ARD (months)(4): | 104 | ||||
| Weighted Average Mortgage Loan Seasoning (months)(4): | 2 | ||||
| % of Mortgaged Properties Leased to a Single Tenant: | 38.3% | ||||
Credit Statistics(5)(6)(7) | |||||
| Weighted Average Mortgage Loan U/W NCF DSCR(8): | 3.07x | ||||
| Weighted Average Mortgage Loan Cut-off Date LTV(9): | 50.8% | ||||
| Weighted Average Mortgage Loan Maturity Date or ARD LTV(9): | 49.4% | ||||
| Weighted Average U/W NOI Debt Yield(8): | 12.1% | ||||
Amortization Overview | |||||
| % Mortgage Loans which pay Interest Only through Maturity or ARD Date: | 84.5% | ||||
| % Mortgage Loans which pay Interest Only followed by Amortization through Maturity Date or ARD: | 10.8% | ||||
| % Mortgage Loans which pay with Amortization followed by Interest Only through Maturity Date or ARD: | 4.1% | ||||
| % Mortgage Loans with Amortization through Maturity Date or ARD: | 0.7% | ||||
| Weighted Average Remaining Amortization Term (months)(10): | 360 | ||||
Amortization Overview | |||||
| % Mortgage Loans with Upfront or Ongoing Tax Reserves: | 44.8% | ||||
| % Mortgage Loans with Upfront or Ongoing Replacement Reserves(11): | 50.0% | ||||
| % Mortgage Loans with Upfront or Ongoing Insurance Reserves: | 18.0% | ||||
| % Mortgage Loans with Upfront or Ongoing TI/LC Reserves(12): | 64.9% | ||||
| % Mortgage Loans with In Place Hard Lockboxes: | 82.5% | ||||
| % Mortgage Loans with Cash Traps Triggered at DSCR Levels ≥ 1.10x: | 64.9% | ||||
| % Mortgage Loans with Cash Traps Triggered at Debt Yield Levels ≥ 5.75%: | 30.5% | ||||
| Prepayment Provisions(13) | |||||
| % Mortgage Loans with Prepayment Only After a Lockout Period and Prior to an Open Period with Defeasance: | 66.3% | ||||
| % Mortgage Loans with Prepayment Only After a Lockout Period and Prior to an Open Period with Defeasance or Yield Maintenance Charge: | 10.2% | ||||
| % Mortgage Loans with Prepayment Prior to an Open Period with a Yield Maintenance Charge or Defeasance: | 9.2% | ||||
| % Mortgage Loans with Prepayment Prior to an Open Period with a Yield Maintenance Charge: | 7.5% | ||||
| % Mortgage Loans with Prepayment Only After a Lockout Period and Prior to an Open Period with a Yield Maintenance Charge: | 6.8% | ||||
| (1) | Includes the $65.0 million pari passu portion of the MGM Grand & Mandalay Bay mortgage loan, as to which CREFI is acting as mortgage loan seller of the $43,333,333 Note A-13-1 and GACC is acting as the mortgage loan seller of the $21,666,667 Note A-15-1. |
| (2) | Includes the $62.85 million pari passu portion of the 1633 Broadway mortgage loan, as to which GACC is acting as mortgage loan seller of the $35.0 million Note A-2-C-6 and JPMCB is acting as the mortgage loan seller of the $27.85 million Note A-3-C-1-A. |
| (3) | Includes the $38.0 million pari passu portion of the 420 Taylor Street mortgage loan, as to which JPMCB is acting as mortgage loan seller of the $21,590,909 Note A-2 and CREFI is acting as the mortgage loan seller of the $16,409,091 Note A-4. |
| (4) | With respect to 6 mortgage loans (19.4%), under the terms of the related mortgage loan documents, the first payment date is in September 2020. However, due to the fact that the related mortgage loan seller will contribute an Initial Interest Deposit Amount to the Issuing Entity on the Closing Date to cover an amount that represents one-month’s interest that would have accrued with respect to the mortgage loan at the related Net Mortgage Rate with respect to an August 2020 payment date, such Mortgage Loan is being treated as having a First Due Date in August 2020, and the Original Term to Maturity Date or ARD, Remaining Term to Maturity Date or ARD and Loan Seasoning are shown in the Annex A-1 to reflect this. |
THE INFORMATION IN THIS STRUCTURAL AND COLLATERAL TERM SHEET IS NOT COMPLETE AND MAY BE AMENDED PRIOR TO THE TIME OF SALE. THIS TERM SHEET IS NOT AN OFFER TO SELL THESE SECURITIES AND IT IS NOT A SOLICITATION OF AN OFFER TO BUY THESE SECURITIES IN ANY JURISDICTION WHERE THE OFFER OR SALE IS NOT PERMITTED.
3
Benchmark 2020-B18 Mortgage Trust
|
| OVERVIEW OF MORTGAGE POOL CHARACTERISTICS |
| (5) | The LTV, DSCR and Debt Yield calculations include any related pari passu companion loan(s) and exclude any related subordinate companion loan(s) and/or mezzanine loan(s). |
| (6) | With respect to Chase Center Tower I mortgage loan and Chase Center Tower II mortgage loan (collectively, the “Chase Center Tower mortgage loans”), the mortgage loans are cross-collateralized and cross-defaulted. As such the calculations are based on the aggregate Cut-off Date Balance, Maturity or ARD Balance, U/W NOI, U/W NCF and Debt Services of these loans. |
| (7) | The BX Industrial Portfolio mortgage loan is part of a whole loan with an aggregate principal balance as of the Cut-off Date of approximately $649.428 million that is split between (i) a 17-month floating rate loan with five, one-year extension options (the “BX Industrial Portfolio Floating Rate Loan”) with an aggregate Cut-off Date principal balance of approximately $99.428 million, and (ii) a 77-month fixed rate loan (the “BX Industrial Portfolio Fixed Rate Loan”) with an aggregate Cut-off Date principal balance of $550.0 million that is comprised of (A) a senior fixed rate loan (the “BX Industrial Portfolio Senior Fixed Rate Loan”), with an aggregate Cut-off Date principal balance of $322.4 million and (B) a subordinate fixed rate loan (the “BX Industrial Portfolio Subordinate Fixed Rate Loan”), with an aggregate Cut-off Date principal balance of $227.6 million. The BX Industrial Portfolio Senior Fixed Rate Loan is senior to the BX Industrial Portfolio Subordinate Fixed Rate Loan and the BX Industrial Portfolio mortgage loan is comprised of a portion of the BX Industrial Portfolio Senior Fixed Rate Loan. The interest rate on the BX Industrial Portfolio Floating Rate Loan is LIBOR (subject to a floor of 0.000%) plus a spread of 1.450%. The BX Industrial Portfolio Fixed Rate Loan and the BX Industrial Portfolio Floating Rate Loan are pari passu, provided that voluntary prepayments are applied first to the BX Industrial Portfolio Floating Rate Loan until paid in full, and then to the BX Industrial Portfolio Fixed Rate Loan. The financial information presented in the Collateral Characteristics section above reflects the BX Industrial Portfolio Senior Fixed Rate Loan and approximately $58.283 million of the Cut-off Date principal balance of the BX Industrial Portfolio Floating Rate Loan, and excludes the remaining approximately $41.145 million of the Cut-off Date principal balance of the BX Industrial Portfolio Floating Rate Loan and the BX Industrial Portfolio Subordinate Fixed Rate Loan. For purposes of all calculations herein, LIBOR is assumed to be 0.500%. |
| (8) | With respect to the 968-970 Gates Ave mortgage loan (0.7%) the U/W NCF DSCR and U/W NOI Debt Yield is calculated based on the Cut-off Date Balance net a holdback reserve. |
| (9) | With respect to 7 mortgage loans (29.2%) (including Moffett Towers Buildings A, B & C, MGM Grand & Mandalay Bay, 280 North Bernardo, 420 Taylor Street, Chase Center Towers and Bellagio Hotel and Casino), the Cut-off Date LTV and Maturity Date or ARD LTV have been calculated using a value other than the “As Is” appraised values. For additional information please see the footnotes to Annex A-1 in the Preliminary Prospectus. |
| (10) | Excludes mortgage loans which are interest only for the full loan term. |
| (11) | Includes FF&E reserves. |
| (12) | Represents the percent of the allocated Initial Outstanding Pool Balance of office, retail, industrial and mixed use properties only structured with TI/LC reserves. |
| (13) | Please see Annex A-1 of the Preliminary Prospectus for more information. |
THE INFORMATION IN THIS STRUCTURAL AND COLLATERAL TERM SHEET IS NOT COMPLETE AND MAY BE AMENDED PRIOR TO THE TIME OF SALE. THIS TERM SHEET IS NOT AN OFFER TO SELL THESE SECURITIES AND IT IS NOT A SOLICITATION OF AN OFFER TO BUY THESE SECURITIES IN ANY JURISDICTION WHERE THE OFFER OR SALE IS NOT PERMITTED.
4
Benchmark 2020-B18 Mortgage Trust
|
| STRUCTURE SUMMARY |
OFFERED CERTIFICATES
| Class(1) | Ratings (S&P/Fitch/KBRA) | Initial Certificate Balance or Notional Amount(2) | Initial Subordination | Weighted Average Life (years)(4) | Principal Window (months)(4) | Certificate Principal to Value Ratio(5) | Certificate Underwritten NOI Debt Yield(6) | |
| Class A-1 | AAA(sf)/AAAsf/AAA(sf) | $7,467,000 | 30.000% | 2.69 | 1 – 55 | 35.6% | 17.3% | |
| Class A-3 | AAA(sf)/AAAsf/AAA(sf) | $67,056,000 | 30.000% | 6.21 | 75 – 75 | 35.6% | 17.3% | |
| Class A-SB | AAA(sf)/AAAsf/AAA(sf) | $8,738,000 | 30.000% | 7.32 | 61 – 113 | 35.6% | 17.3% | |
| Class A-4 | AAA(sf)/AAAsf/AAA(sf) | (7) | 30.000% | (7) | (7) | 35.6% | 17.3% | |
| Class A-5 | AAA(sf)/AAAsf/AAA(sf) | (7) | 30.000% | (7) | (7) | 35.6% | 17.3% | |
| Class X-A(8) | NR/AAAsf/AAA(sf) | $732,914,000 | (9) | N/A | N/A | N/A | N/A | N/A |
| Class A-M | NR/AAAsf/AAA(sf) | $106,300,000 | 18.125% | 9.96 | 120 – 120 | 41.6% | 14.8% | |
| Class B | NR/AA-sf/AA-(sf) | $33,569,000 | 14.375% | 9.96 | 120 – 120 | 43.5% | 14.1% | |
| Class C | NR/A-sf/A-(sf) | $34,687,000 | 10.500% | 9.96 | 120 – 120 | 45.5% | 13.5% | |
NON-OFFERED CERTIFICATES
| Class(1) | Ratings (S&P/Fitch/KBRA) | Initial Certificate Balance or Notional Amount(2) | Initial Subordination | Weighted Average Life (years)(4) | Principal Window | Certificate Principal to Value Ratio(5) | Certificate Underwritten NOI Debt Yield(6) | |
| Class A-2 | AAA(sf)/AAAsf/AAA(sf) | $164,258,000 | 30.000% | 4.80 | 55 – 61 | 35.6% | 17.3% | |
| Class X-B(8) | NR/AA-sf/AAA(sf) | $33,569,000 | (9) | N/A | N/A | N/A | N/A | N/A |
| Class X-D(8) | NR/BBB-sf/BBB-(sf) | $40,283,000 | (9) | N/A | N/A | N/A | N/A | N/A |
| Class X-F(8)(10) | NR/BB-sf/NR | $15,665,000 | (9) | N/A | N/A | N/A | N/A | N/A |
| Class D | NR/BBBsf/BBB+(sf) | $23,499,000 | 7.875% | 10.03 | 120 – 121 | 46.8% | 13.1% | |
| Class E | NR/BBB-sf/BBB-(sf) | $16,784,000 | 6.000% | 10.04 | 121 – 121 | 47.8% | 12.9% | |
| Class F(10) | NR/BB-sf/NR | $15,665,000 | 4.250% | 10.04 | 121 – 121 | 48.6% | 12.6% | |
| Class G-RR(10)(11) | NR/B-sf/NR | $8,952,000 | 3.250% | 10.04 | 121 – 121 | 49.1% | 12.5% | |
| Class H-RR(10)(11) | NR/NR/NR | $29,093,108 | 0.000% | 10.04 | 121 – 121 | 50.8% | 12.1% | |
NON-OFFERED LOAN-SPECIFIC CERTIFICATES
| Class(1) | Ratings (Fitch) | Initial Certificate Balance or Notional Amount(2) | Initial Subordination | Weighted Average Life (years)(4) | Principal Window (months)(4) | Certificate Principal to Value Ratio(12) | Certificate Underwritten NOI Debt Yield(13) | |
| Class AGN-X(14)(15) | B-sf | $121,775,000 | N/A | N/A | N/A | N/A | N/A | |
| Class AGN-D(14) | BBB-sf | $27,900,000 | 35.392% | 5.04 | 61 – 61 | 47.3% | 13.9% | |
| Class AGN-E(14) | BB-sf | $42,875,000 | 24.194% | 5.04 | 61 – 61 | 55.4% | 11.9% | |
| Class AGN-F(14) | B-sf | $51,000,000 | 10.872% | 5.04 | 61 – 61 | 65.2% | 10.1% | |
| Class AGN-G(14) | NR | $41,625,000 | 0.000% | 5.04 | 61 – 61 | 73.1% | 9.0% | |
NON-OFFERED VERTICAL RISK RETENTION INTEREST
| Non-Offered Vertical Risk Retention Interest | Ratings (S&P/Fitch/KBRA) | Initial Certificate Balance or Interest Balance | Initial Subordination | Weighted Average Life (years)(16) | Principal Window (months)(16) | Certificate Principal to Value Ratio | Certificate Underwritten NOI Debt Yield | |
| Class RR Certificates(17)(18) | NR/NR/NR | $29,723,796 | (19) | N/A | 8.50 | 1 - 121 | N/A | N/A |
| RR Interest(17)(18) | NR/NR/NR | $9,576,204 | (19) | N/A | 8.50 | 1 - 121 | N/A | N/A |
| AGN-VRR Interest(14)(18)(20) | NR/NR/NR | $8,600,000 | N/A | 5.04 | 61 - 61 | N/A | N/A | |
| (1) | The pass-through rates applicable to the Class A-1, Class A-2, Class A-3, Class A-SB, Class A-4, Class A-5, Class A-M, Class B, Class C, Class D, Class E, Class F, Class G-RR and Class H-RR certificates (the “Pooled Principal Balance Certificates”) will equal one of: (i) a fixed per annum rate, (ii) the weighted average of the net mortgage rates on the mortgage loans (in each case, adjusted, if necessary, to accrue on the basis of a 360-day year consisting of twelve 30-day months) as of their respective due dates in the month preceding the month in which the related Distribution Date occurs (the “WAC Rate”), (iii) a rate equal to the lesser of a specified pass-through rate and the WAC Rate or (iv) the WAC Rate less a specified rate. The pass-through rates applicable to the Class AGN-D, Class AGN-E, Class AGN-F and Class AGN-G certificates, in each case, will equal one of the following per annum rates: (i) a fixed rate, (ii) the net mortgage rate on the trust subordinate companion loan related to the Agellan Portfolio mortgage loan (the “Trust Subordinate Companion Loan”), (iii) the lesser of a specified rate and the rate described in clause (ii), or (iv) the rate described in clause (ii) less a specified rate. |
| (2) | Approximate; subject to a permitted variance of plus or minus 5%. Neither the VRR Interest Balance of the VRR Interest nor the interest balance of the AGN-VRR Interest is included in the Certificate Balance or Notional Amount of any Class of Certificates set forth under "Offered Certificates", "Non-Offered Certificates" or “Non-Offered Loan-Specific Certificates” in the table above. In addition, the Certificate Balance of each Class of Pooled Principal Balance Certificates (and correspondingly, the initial Notional Amount of each Class of Class X Certificates, as described in footnote (9) below) is subject to change as described in footnote (19) below. |
| (3) | The initial subordination levels for the Class A-1, Class A-2, Class A-3, Class A-SB, Class A-4 and Class A-5 (the “Senior Pooled Principal Balance Certificates”) certificates are represented in the aggregate. The approximate initial credit support percentage for each class of Pooled Principal Balance Certificates does not include the subordination provided by the Trust Subordinate Companion Loan. None of the Class AGN-D, Class AGN-E, Class AGN-F or Class AGN-G certificates (the “Loan-Specific Principal Balance Certificates”), the Class AGN-X certificates (together with the Loan-Specific Principal Balance Certificates, the “Loan-Specific Certificates”) or the AGN-VRR Interest will provide credit support to any other class of certificates, except to the extent of the subordination of the Trust Subordinate Companion Loan (in which the Loan-Specific Certificates and the AGN-VRR Interest each represent an interest) to the Agellan Portfolio mortgage loan. The initial credit support percentages of the Loan-Specific Certificates are based on the Agellan Portfolio whole loan. The approximate initial credit support percentages shown in the table above do not take into account the VRR Interest or the AGN-VRR Interest. However, losses incurred on the mortgage loans will be allocated between the VRR Interest, on the one hand, and the Pooled Principal Balance Certificates, on the other hand, pro rata in accordance with their respective outstanding balances, and losses incurred on the Trust Subordinate Companion Loan will be allocated between the AGN-VRR Interest, on the one hand, and the Loan Specific Certificates, on the other hand, pro rata in accordance with their respective outstanding interest balance or Certificate Balances. |
| (4) | The weighted average life and principal window during which distributions of principal would be received as set forth in the table with respect to each class of Pooled Principal Balance Certificates (and the Loan-Specific Principal Balance Certificates) are based on (i) modeling assumptions described in the Preliminary Prospectus and Loan-Specific PPM, as applicable, and (ii) assumptions that there are no prepayments, delinquencies or losses on the mortgage loans (or, in the case of the Loan-Specific Principal Balance Certificates, the Trust Subordinate Companion Loan) and that there are no extensions or forbearances of maturity dates or anticipated repayment dates. The weighted average life and principal window of the Class A-4 and Class A-5 certificates are expected to be within the applicable ranges reflected in the chart set forth in footnote (7) below. |
THE INFORMATION IN THIS STRUCTURAL AND COLLATERAL TERM SHEET IS NOT COMPLETE AND MAY BE AMENDED PRIOR TO THE TIME OF SALE. THIS TERM SHEET IS NOT AN OFFER TO SELL THESE SECURITIES AND IT IS NOT A SOLICITATION OF AN OFFER TO BUY THESE SECURITIES IN ANY JURISDICTION WHERE THE OFFER OR SALE IS NOT PERMITTED.
5
Benchmark 2020-B18 Mortgage Trust
|
| STRUCTURE SUMMARY |
| (5) | “Certificate Principal to Value Ratio” for any class of Pooled Principal Balance Certificates is calculated as the product of (a) the weighted average mortgage loan Cut-off Date LTV of the mortgage loans, and (b) a fraction, the numerator of which is the total initial Certificate Balance of the related class of Pooled Principal Balance Certificates and all other classes of Pooled Principal Balance Certificates, if any, that are senior to such class (and the VRR Interest Balance of any portion of the VRR Interest that is considered to be pari passu or senior to such class), and the denominator of which is the total initial Certificate Balance of all classes of Pooled Principal Balance Certificates and the initial VRR Interest Balance of the VRR Interest. The Certificate Principal to Value Ratios of each class of Senior Pooled Principal Balance Certificates are calculated in the aggregate for those classes as if they were a single class. |
| (6) | “Certificate Underwritten NOI Debt Yield” for any class of Pooled Principal Balance Certificates is calculated as the product of (a) the weighted average Underwritten NOI Debt Yield for the mortgage loans, and (b) a fraction, the numerator of which is the total initial Certificate Balance of all classes of Pooled Principal Balance Certificates and the initial VRR Interest Balance of the VRR Interest and the denominator of which is the total initial Certificate Balance of such class of Pooled Principal Balance Certificates and all other classes of Pooled Principal Balance Certificates, if any, that are senior to such class (and the VRR Interest Balance of any portion of the VRR Interest that is considered to be pari passu or senior to such class). The Underwritten NOI Debt Yields of each class of Senior Pooled Principal Balance Certificates are calculated in the aggregate for those classes as if they were a single class. |
| (7) | The exact initial Certificate Balances of the Class A-4 and Class A-5 certificates are unknown and will be determined based on the final pricing of those classes of certificates. However, the respective initial Certificate Balances, weighted average lives and principal windows of the Class A-4 and Class A-5 certificates are expected to be within the applicable ranges reflected in the following chart. The aggregate initial Certificate Balance of the Class A-4 and Class A-5 certificates is expected to be approximately $379,095,000, subject to a variance of plus or minus 5.0%. |
| Class of Certificates | Expected Range of Initial Certificate Balance | Expected Range of Weighted Avg. Life (years) | Expected Range of Principal Window (months) |
| Class A-4 | $75,000,000 - $119,000,000 | 9.38 – 9.41 | 113-113 / 113-115 |
| Class A-5 | $260,095,000 - $304,095,000 | 9.68 – 9.64 | 115-120 / 113-120 |
| (8) | As further described in the Preliminary Prospectus, the pass-through rate applicable to the Class X-A, Class X-B, Class X-D and Class X-F certificates (collectively, the “Class X Certificates” and, together with the Pooled Principal Balance Certificates and the Class S Certificates, the “Pooled Certificates”) for each Distribution Date will generally be equal to the excess of (i) the WAC Rate over (ii)(A) with respect to the Class X-A certificates, the weighted average of the pass-through rates of the Class A-1, Class A-2, Class A-3, Class A-SB, Class A-4, Class A-5 and Class A-M certificates (based on their respective Certificate Balances outstanding immediately prior to such Distribution Date), (B) with respect to the Class X-B certificates, the pass-through rate of the Class B certificates, (C) with respect to the Class X-D certificates, the weighted average of the pass-through rates of the Class D and Class E certificates (based on their respective Certificate Balances immediately prior to such Distribution Date) and (D) with respect to the Class X-F certificates, the pass-through rate of the Class F certificates. |
| (9) | The Class X Certificates will not have Certificate Balances. None of the Class X Certificates will be entitled to distributions of principal. The interest accrual amounts on the Class X-A certificates will be calculated by reference to a notional amount equal to the aggregate Certificate Balances of the Class A-1, Class A-2, Class A-3, Class A-SB, Class A-4, Class A-5 and Class A-M certificates. The interest accrual amounts on the Class X-B certificates will be calculated by reference to a notional amount equal to the Certificate Balances of the Class B certificates. The interest accrual amounts on the Class X-D certificates will be calculated by reference to a notional amount equal to the aggregate Certificate Balances of the Class D and Class E certificates. The interest accrual amounts on the Class X-F certificates will be calculated by reference to a notional amount equal to the Certificate Balance of the Class F certificates. The notional amount of each class of the Class X Certificates is subject to change depending upon the final pricing of the Pooled Principal Balance Certificates, as follows: (1) if as a result of such pricing the pass-through rate of any class of Pooled Principal Balance Certificates whose Certificate Balance comprises such notional amount is equal to the WAC Rate, the Certificate Balance of such class of Pooled Principal Balance Certificates may not be part of and will reduce accordingly, such notional amount of the related Class X Certificates (or, if as a result of such pricing the pass-through rate of the related Class X Certificates is equal to zero, such Class X Certificates may not be issued on the Closing Date), and/or (2) if as a result of such pricing the pass-through rate of any class of Pooled Principal Balance Certificates that does not comprise such notional amount of the related Class X Certificates is equal to less than the WAC Rate, such class of Pooled Principal Balance Certificates may become a part of, and will increase accordingly, such notional amount of the related Class X Certificates. |
| (10) | The initial Certificate Balance of each of the Class F, Class G-RR and Class H-RR certificates, and the notional amount of the Class X-F certificates, is subject to change based on final pricing of all Pooled Certificates, the final determination of the Class G-RR and Class H-RR certificates (collectively, the “HRR Certificates”) that will be retained by the retaining third-party purchaser and the final determination of the VRR Interest that will be retained as described under “Credit Risk Retention” in the Preliminary Prospectus to satisfy the U.S. risk retention requirements of German American Capital Corporation, as retaining sponsor. For more information regarding the methodology and key inputs and assumptions used to determine the sizing of the HRR Certificates, see “Credit Risk Retention” in the Preliminary Prospectus. |
| (11) | The HRR Certificates are expected to be retained by Eightfold Real Estate Capital Fund V, L.P. or its affiliate, in partial satisfaction of the risk retention obligations of German American Capital Corporation in its capacity as the retaining sponsor in accordance with the credit risk retention rules applicable to the pooled securitization transaction. For more information regarding the methodology and key inputs and assumptions used to determine the sizing of the HRR Certificates, see “Credit Risk Retention” in the Preliminary Prospectus. |
| (12) | The “Certificate Principal to Value Ratio” for any class of Loan-Specific Principal Balance Certificates is calculated as the product of (a) the Cut-off Date LTV of the Agellan Portfolio Whole Loan and (b) a fraction, the numerator of which is the sum of (i) the initial Certificate Balance of such class of Loan-Specific Principal Balance Certificates and all other classes of Loan-Specific Principal Balance Certificates, if any, that are senior to such class (including any portions of the AGN-VRR Interest that is considered to be pari passu or senior to such class) and (ii) the principal balance as of the Cut-off Date of the Agellan Portfolio Senior Loan, and the denominator of which is the total initial Certificate Balance of all classes of Loan-Specific Principal Balance Certificates and the AGN-VRR Interest and the principal balance as of the Cut-off Date of Agellan Portfolio Senior Loan. |
| (13) | The “Certificate Underwritten NOI Debt Yield” for any class of Loan-Specific Principal Balance Certificates is calculated as the product of (a) the Underwritten NOI Debt Yield for the Agellan Portfolio Whole Loan and (b) a fraction, the numerator of which is the total initial Certificate Balance of all classes of Loan-Specific Principal Balance Certificates and the AGN-VRR Interest and the principal balance as of the Cut-off Date of Agellan Portfolio Senior Loan and the denominator of which is the total initial Certificate Balance of such class of Loan-Specific Principal Balance Certificates and all other classes of Loan-Specific Principal Balance Certificates, if any, that are senior to such class (and any portions of the AGN-VRR Interest that is considered to be pari passu or senior to such class) and the principal balance as of the Cut-off Date of Agellan Portfolio Senior Loan. |
| (14) | The Loan-Specific Certificates and the AGN-VRR Interest will only be entitled to receive distributions from, and will only incur losses with respect to, the Trust Subordinate Companion Loan. The Trust Subordinate Companion Loan will be included as an asset of the issuing entity but will not be part of the mortgage pool backing the Pooled Certificates. No class of Pooled Certificates will have any interest in the Trust Subordinate Companion Loan. See “Description of the Mortgage Pool—The Whole Loans—Agellan Portfolio Whole Loan” in the Preliminary Prospectus. |
| (15) | The Class AGN-X certificates will not have a certificate balance and will not be entitled to distributions of principal. The Class AGN-X certificates will accrue interest on its notional amount and at its pass-through rate as described in “Description of the Certificates—Distributions—Pass-Through Rates” in the Preliminary Prospectus. |
| (16) | The weighted average life and principal window during which distributions of principal would be received as set forth in the foregoing table with respect to the VRR Interest (as defined below) and the AGN-VRR Interest are based on the assumptions set forth under “Yield and Maturity Considerations—Weighted Average Life” in the Preliminary Prospectus and modeling assumptions in the Loan-Specific PPM, as applicable, and on the assumptions that there are no prepayments, modifications or losses in respect of the mortgage loans or the Trust Subordinate Companion Loan, as applicable, and that there are no extensions or forbearances of maturity dates or anticipated repayment dates. |
| (17) | German American Capital Corporation, as the retaining sponsor, is expected to acquire from the depositor, on the Closing Date, an “eligible vertical interest” (as defined in Regulation RR) comprised of the Class RR certificates and the RR interest (collectively, the “VRR Interest”), representing a specified percentage (to be determined as described in footnote (19) below) of all classes of Pooled Principal Balance Certificates and the VRR Interest. A portion of the VRR Interest will be retained by each of German American Capital Corporation or its “majority-owned affiliate” and JPMCB, Goldman Sachs Bank USA and CREFI in accordance with the credit risk retention rules applicable to the pooled securitization transaction. See “Credit Risk Retention” in the Preliminary Prospectus. |
| (18) | Although it does not have a specified pass-through rate (other than for tax reporting purposes), the effective interest rate for the VRR Interest will be the WAC rate. The effective interest rate for the AGN-VRR Interest will be the net mortgage rate of the Trust Subordinate Companion Loan. |
| (19) | The initial VRR Interest Balance of the VRR Interest is subject to change depending on the final pricing of all classes of Pooled Certificates with the final VRR Interest Balance of the VRR Interest determined such that, upon initial issuance, the percentage of the fair value of the HRR Certificates and the percentage of the VRR Interest (in the aggregate) will equal at least 5. If the initial VRR Interest balance is reduced, the initial Certificate Balance of each class of Pooled Principal Balance Certificates (and correspondingly, the initial notional amount of each class of Class X Certificates) will be increased on a pro rata basis (based on the initial Certificate Balance set forth in the table above) in an aggregate amount equal to such reduction in the initial VRR Interest Balance of the VRR Interest. If the initial VRR Interest Balance of the VRR Interest is increased, the initial Certificate Balance of each class of Pooled Principal Balance Certificates (and correspondingly, the initial notional amount of each class of Class X Certificates) will be decreased on a pro rata basis (based on the initial Certificate Balance set forth in the table above) in an aggregate amount equal to such increase in the initial VRR Interest Balance of the VRR Interest. For a further description, see “Credit Risk Retention” in the Preliminary Prospectus. |
| (20) | JPMCB is expected to acquire from the depositor, on the Closing Date, an “eligible vertical interest” (as defined in Regulation RR) in the form of a single vertical security with an expected aggregate initial Interest Balance of $8,600,000 (the “AGN-VRR Interest”), which is expected to represent approximately 5.00% of all Classes of Loan-Specific Principal Balance Certificates and AGN-VRR Interest. The AGN-VRR Interest will be retained by JPMCB or its “majority-owned affiliate” in accordance with the credit risk retention rules applicable to the securitization transaction relating to the Loan-Specific Certificates. |
THE INFORMATION IN THIS STRUCTURAL AND COLLATERAL TERM SHEET IS NOT COMPLETE AND MAY BE AMENDED PRIOR TO THE TIME OF SALE. THIS TERM SHEET IS NOT AN OFFER TO SELL THESE SECURITIES AND IT IS NOT A SOLICITATION OF AN OFFER TO BUY THESE SECURITIES IN ANY JURISDICTION WHERE THE OFFER OR SALE IS NOT PERMITTED.
6
Benchmark 2020-B18 Mortgage Trust
|
| STRUCTURE SUMMARY |
| Class A-2 Principal Paydown(1) |
| Class | Mortgage Loan Seller | Mortgage Loan | Property Type | Cut-off Date Balance | Remaining Term to Maturity (Mos.) | Cut-off Date LTV Ratio | U/W NCF DSCR | U/W NOI Debt Yield |
| A-2 | JPMCB | Agellan Portfolio(2) | Various | $75,000,000 | 61 | 41.9% | 3.04x | 15.7% |
| A-2 | JPMCB | 3000 Post Oak | Office | $35,000,000 | 56 | 55.6% | 2.19x | 12.0% |
| A-2 | JPMCB | Chase Center Tower I(3)(4) | Office | $18,213,750 | 56 | 31.3% | 3.87x | 13.9% |
| A-2 | JPMCB | Chase Center Tower II(3)(4) | Office | $15,536,250 | 56 | 31.3% | 3.87x | 13.9% |
| A-2 | JPMCB | Apollo Education Group HQ Campus | Office | $26,500,000 | 55 | 47.2% | 4.15x | 14.9% |
| (1) | This table reflects the mortgage loans whose balloon payments will be applied to pay down the Class A-2 certificates, assuming (i) that none of the mortgage loans experience prepayments, defaults or losses, (ii) there are no extensions of maturity dates and (iii) each mortgage loan is paid in full on its stated maturity date. See “Yield and Maturity Considerations—Yield Considerations” in the Preliminary Prospectus. |
| (2) | With respect to the Agellan Portfolio mortgage loan, under the terms of the related mortgage loan documents, the first payment date is in September 2020. However, due to the fact that the related mortgage loan seller will contribute an Initial Interest Deposit Amount to the Issuing Entity on the Closing Date to cover an amount that represents one-month’s interest that would have accrued with respect to the mortgage loan at the related Net Mortgage Rate with respect to an August 2020 payment date, such Mortgage Loan is being treated as having a First Due Date in August 2020, and the Remaining Term to Maturity Date (Mos.) reflect this. |
| (3) | With respect to the Chase Center Towers mortgage loans, the Cut-off Date LTV have been calculated based on the appraised values other than “As Is”. For additional information please see the footnotes to Annex A-1 in the Preliminary Prospectus. |
| (4) | With respect to the Chase Center Tower mortgage loans, the mortgage loans are cross-collateralized and cross-defaulted. As such the calculations are based on the aggregate Cut-off Date Balances, U/W NOI, U/W NCF and Debt Services of these loans |
| Class A-3 Principal Paydown(1) |
| Class | Mortgage Loan Seller | Mortgage Loan | Property Type | Cut-off Date Balance | Remaining Term to Maturity (Mos.) | Cut-off Date LTV Ratio | U/W NCF DSCR | U/W NOI Debt Yield | |
| A-3 | GACC | BX Industrial Portfolio(2) | Various | $70,000,000 | 75 | 39.6% | 3.57x | 12.8% | |
| (1) | This table reflects the mortgage loans whose balloon payments will be applied to pay down the Class A-3 certificates, assuming (i) that none of the mortgage loans experience prepayments, defaults or losses, (ii) there are no extensions of maturity dates and (iii) each mortgage loan is paid in full on its stated maturity date. See “Yield and Maturity Considerations—Yield Considerations” in the Preliminary Prospectus. |
| (2) | The BX Industrial Portfolio mortgage loan is part of a whole loan with an aggregate principal balance as of the Cut-off Date of approximately $649.428 million that is split between (i) a 17-month floating rate loan with five, one-year extension options (the “BX Industrial Portfolio Floating Rate Loan”) with an aggregate Cut-off Date principal balance of approximately $99.428 million, and (ii) a 77-month fixed rate loan (the “BX Industrial Portfolio Fixed Rate Loan”) with an aggregate Cut-off Date principal balance of $550.0 million that is comprised of comprised of (A) a senior fixed rate loan (the “BX Industrial Portfolio Senior Fixed Rate Loan”), with an aggregate Cut-off Date principal balance of $322.4 million and (B) a subordinate fixed rate loan (the “BX Industrial Portfolio Subordinate Fixed Rate Loan”), with an aggregate Cut-off Date principal balance of $227.6 million. The BX Industrial Portfolio Senior Fixed Rate Loan is senior to the BX Industrial Portfolio Subordinate Fixed Rate Loan and the BX Industrial Portfolio mortgage loan is comprised of a portion of the BX Industrial Portfolio Senior Fixed Rate Loan. The interest rate on the BX Industrial Portfolio Floating Rate Loan is LIBOR (subject to a floor of 0.000%) plus a spread of 1.450%. The BX Industrial Portfolio Fixed Rate Loan and the BX Industrial Portfolio Floating Rate Loan are pari passu, provided that voluntary prepayments are applied first to the BX Industrial Portfolio Floating Rate Loan until paid in full, and then to the BX Industrial Portfolio Fixed Rate Loan. The financial information presented in the table above reflects the BX Industrial Portfolio Senior Fixed Rate Loan and approximately $58.283 million of the Cut-off Date principal balance of the BX Industrial Portfolio Floating Rate Loan, and excludes the remaining approximately $41.145 million of the Cut-off Date principal balance of the BX Industrial Portfolio Floating Rate Loan and the BX Industrial Portfolio Subordinate Fixed Rate Loan. For purposes of all calculations herein, LIBOR is assumed to be 0.500%. |
THE INFORMATION IN THIS STRUCTURAL AND COLLATERAL TERM SHEET IS NOT COMPLETE AND MAY BE AMENDED PRIOR TO THE TIME OF SALE. THIS TERM SHEET IS NOT AN OFFER TO SELL THESE SECURITIES AND IT IS NOT A SOLICITATION OF AN OFFER TO BUY THESE SECURITIES IN ANY JURISDICTION WHERE THE OFFER OR SALE IS NOT PERMITTED.
7
Benchmark 2020-B18 Mortgage Trust
|
| OVERVIEW OF MORTGAGE POOL CHARACTERISTICS |
| Ten Largest Mortgage Loans | |||||||||
| Mortgage Loan | Mortgage Loan Seller | City, State | Property Type | Mortgage Loan Cut-off Date | % of Initial Outstanding Pool Balance | Cut-off Date Balance per NRA/Room(1) | Cut-off Date LTV(1)(2) | U/W NCF DSCR after IO(1) | U/W NOI Debt Yield(1) |
| Agellan Portfolio | JPMCB | Various, Various | Various | $75,000,000 | 8.0% | $38 | 41.9% | 3.04x | 15.7% |
| Moffett Towers Buildings A, B & C | GSMC | Sunnyvale, CA | Office | 75,000,000 | 8.0% | $466 | 38.7% | 3.63x | 13.1% |
| Tropical Distribution Center | GSMC | Las Vegas, NV | Industrial | 75,000,000 | 8.0% | $88 | 68.2% | 2.10x | 7.7% |
| BX Industrial Portfolio(3) | GACC | Various, Various | Various | 70,000,000 | 7.5% | $34 | 39.6% | 3.57x | 12.8% |
| MGM Grand & Mandalay Bay | CREFI/GACC | Las Vegas, NV | Hospitality | 65,000,000 | 7.0% | $167,645 | 35.5% | 4.95x | 17.9% |
| 1633 Broadway | GACC/JPMCB | New York, NY | Office | 62,850,000 | 6.7% | $391 | 41.7% | 3.84x | 11.9% |
| 711 Fifth Avenue | GSMC | New York, NY | Mixed Use | 45,000,000 | 4.8% | $1,603 | 54.5% | 2.90x | 9.4% |
| 280 North Bernardo | GACC | Mountain View, CA | Office | 40,000,000 | 4.3% | $639 | 59.2% | 2.27x | 9.3% |
| 420 Taylor Street | JPMCB/CREFI | San Francisco, CA | Office | 38,000,000 | 4.1% | $757 | 61.3% | 1.67x | 9.4% |
| 3000 Post Oak | JPMCB | Houston, TX | Office | 35,000,000 | 3.7% | $181 | 55.6% | 2.19x | 12.0% |
| Total/Weighted Average | $580,850,000 | 62.2% | 48.1% | 3.15x | 12.3% | ||||
| (1) | The Cut-off Date Balance per NRA/Room Cut-off Date LTV, U/W NCF DSCR after IO and U/W NOI Debt Yield calculations include any related pari passu companion loan(s) and exclude any related subordinate companion loan(s) and/or mezzanine loan(s). |
| (2) | With respect to the Moffett Towers Buildings A, B & C, MGM Grand & Mandalay Bay, 280 North Bernardo and 420 Taylor Street mortgage loans, the Cut-off Date LTV have been calculated based on the appraised values other than “As Is”. For additional information please see the footnotes to Annex A-1 in the Preliminary Prospectus. |
| (3) | The BX Industrial Portfolio mortgage loan is part of a whole loan with an aggregate principal balance as of the Cut-off Date of approximately $649.428 million that is split between (i) a 17-month floating rate loan with five, one-year extension options (the “BX Industrial Portfolio Floating Rate Loan”) with an aggregate Cut-off Date principal balance of approximately $99.428 million, and (ii) a 77-month fixed rate loan (the “BX Industrial Portfolio Fixed Rate Loan”) with an aggregate Cut-off Date principal balance of $550.0 million that is comprised of comprised of (A) a senior fixed rate loan (the “BX Industrial Portfolio Senior Fixed Rate Loan”), with an aggregate Cut-off Date principal balance of $322.4 million and (B) a subordinate fixed rate loan (the “BX Industrial Portfolio Subordinate Fixed Rate Loan”), with an aggregate Cut-off Date principal balance of $227.6 million. The BX Industrial Portfolio Senior Fixed Rate Loan is senior to the BX Industrial Portfolio Subordinate Fixed Rate Loan and the BX Industrial Portfolio mortgage loan is comprised of a portion of the BX Industrial Portfolio Senior Fixed Rate Loan. The interest rate on the BX Industrial Portfolio Floating Rate Loan is LIBOR (subject to a floor of 0.000%) plus a spread of 1.450%. The BX Industrial Portfolio Fixed Rate Loan and the BX Industrial Portfolio Floating Rate Loan are pari passu, provided that voluntary prepayments are applied first to the BX Industrial Portfolio Floating Rate Loan until paid in full, and then to the BX Industrial Portfolio Fixed Rate Loan. The financial information presented in the table above reflects the BX Industrial Portfolio Senior Fixed Rate Loan and approximately $58.283 million of the Cut-off Date principal balance of the BX Industrial Portfolio Floating Rate Loan, and excludes the remaining approximately $41.145 million of the Cut-off Date principal balance of the BX Industrial Portfolio Floating Rate Loan and the BX Industrial Portfolio Subordinate Fixed Rate Loan. For purposes of all calculations herein, LIBOR is assumed to be 0.500%. |
| Existing Mezzanine Debt Summary | ||||||||||
| Mortgage Loan | Mortgage Loan Cut-off Date Balance | Pari Passu/ | Mezzanine Debt Cut-off Date Balance | Trust U/W NCF DSCR | Total Debt U/W NCF DSCR(1) | Trust Cut-off Date LTV | Total Debt Cut-off Date LTV(1) | Trust U/W NOI Debt Yield | Total Debt U/W NOI Debt Yield(1) | |
| Agellan Portfolio | $75,000,000 | $328,000,000 | $31,000,000 | 3.04x | 1.54x | 41.9% | 78.8% | 15.7% | 8.3% | |
| 3000 Post Oak | $35,000,000 | $45,000,000 | $20,000,000 | 2.19X | 1.46x | 55.6% | 69.5% | 12.0% | 9.6% | |
| Kings Plaza | $14,108,108 | $472,891,892 | $53,000,000 | 3.07x | 1.73x | 54.1% | 60.0% | 10.7% | 9.6% | |
| (1) | Total Debt U/W NCF DSCR, Total Debt Cut-off Date LTV and Total Debt U/W NOI Debt Yield calculations include any related pari passu companion loan(s), any related subordinate companion loan(s) and/or any related mezzanine loan(s). |
| Subordinate Debt Summary | |||||||||
| Mortgage Loan | Mortgage Loan Cut-off Date Balance | Pari Passu | Subordinate Debt Cut-off Date Balance | Trust U/W NCF DSCR | Total Debt U/W NCF DSCR(1) | Trust Cut-off Date LTV(2) | Total Debt Cut-off Date LTV(1) | Trust U/W NOI Debt Yield | Total Debt U/W NOI Debt Yield(1) |
| Agellan Portfolio | $75,000,000 | $156,000,000 | $172,000,000 | 3.04x | 1.54x | 41.9% | 78.8% | 15.7% | 8.3% |
| Moffett Towers Buildings A, B & C | $75,000,000 | $368,000,000 | $327,000,000 | 3.63x | 2.09x | 38.7% | 67.2% | 13.1% | 7.5% |
| BX Industrial Portfolio(3) | $70,000,000 | $310,682,660 | $268,744,955 | 3.57x | 2.09x | 39.6% | 67.6% | 12.8% | 7.5% |
| MGM Grand & Mandalay Bay | $65,000,000 | $1,569,200,000 | $1,365,800,000 | 4.95x | 2.70x | 35.5% | 65.2% | 17.9% | 9.7% |
| 1633 Broadway | $62,850,000 | $938,150,000 | $249,000,000 | 3.84x | 3.08x | 41.7% | 52.1% | 11.9% | 9.5% |
| Chase Center Tower I(4) | $18,213,750 | $127,496,250 | $178,090,000 | 3.87x | 1.36x | 31.3% | 69.5% | 13.9% | 6.2% |
| Chase Center Tower II(4) | $15,536,250 | $108,753,750 | $151,910,000 | 3.87x | 1.36x | 31.3% | 69.5% | 13.9% | 6.2% |
| Bellagio Hotel and Casino | $21,250,000 | $1,654,950,000 | $1,333,800,000 | 8.42x | 4.06x | 39.3% | 70.7% | 28.3% | 15.7% |
| (1) | Total Debt U/W NCF DSCR, Total Debt Cut-off Date LTV and Total Debt U/W NOI Debt Yield calculations include any related pari passu companion loan(s), related subordinate companion loan(s) and/or related mezzanine loan(s). |
| (2) | With respect to the Moffett Towers Buildings A, B & C, MGM Grand & Mandalay Bay, Chase Center Towers and Bellagio Hotel and Casino mortgage loans, the Cut-off Date LTV have been calculated based on the appraised values other than “As Is”. For additional information please see the footnotes to Annex A-1 in the Preliminary Prospectus. |
| (3) | The BX Industrial Portfolio mortgage loan is part of a whole loan with an aggregate principal balance as of the Cut-off Date of approximately $649.428 million that is split between (i) a 17-month floating rate loan with five, one-year extension options (the “BX Industrial Portfolio Floating Rate Loan”) with an aggregate Cut-off Date principal balance of approximately $99.428 million, and (ii) a 77-month fixed rate loan (the “BX Industrial Portfolio Fixed Rate Loan”) with an aggregate Cut-off Date principal balance of $550.0 million that is comprised of comprised of (A) a senior fixed rate loan (the “BX Industrial Portfolio Senior Fixed Rate Loan”), with an aggregate Cut-off Date principal balance of $322.4 million and (B) a subordinate fixed rate loan (the “BX Industrial Portfolio Subordinate Fixed Rate Loan”), with an aggregate Cut-off Date principal balance of $227.6 million. The BX Industrial Portfolio Senior Fixed Rate Loan is senior to the BX Industrial Portfolio Subordinate Fixed Rate Loan and the BX Industrial Portfolio mortgage loan is comprised of a portion of the BX Industrial Portfolio Senior Fixed Rate Loan. The interest rate on the BX Industrial Portfolio Floating Rate Loan is LIBOR (subject to a floor of 0.000%) plus a spread of 1.450%. The BX Industrial Portfolio Fixed Rate Loan and the BX Industrial Portfolio Floating Rate Loan are pari passu, provided that voluntary prepayments are applied first to the BX Industrial Portfolio Floating Rate Loan until paid in full, and then to the BX Industrial Portfolio Fixed Rate Loan. The financial information presented in the table above reflects the BX Industrial Portfolio Senior Fixed Rate Loan and approximately $58.283 million of the Cut-off Date principal balance of the BX Industrial Portfolio Floating Rate Loan, and excludes the remaining approximately $41.145 million of the Cut-off Date principal balance of the BX Industrial Portfolio Floating Rate Loan and the BX Industrial Portfolio Subordinate Fixed Rate Loan. For purposes of all calculations herein, LIBOR is assumed to be 0.500%. |
| (4) | With respect to the Chase Center Tower mortgage loans, the mortgage loans are cross-collateralized and cross-defaulted. As such the calculations are based on the aggregate Cut-off Date Balances, U/W NOI, U/W NCF and Debt Services of these loans. |
THE INFORMATION IN THIS STRUCTURAL AND COLLATERAL TERM SHEET IS NOT COMPLETE AND MAY BE AMENDED PRIOR TO THE TIME OF SALE. THIS TERM SHEET IS NOT AN OFFER TO SELL THESE SECURITIES AND IT IS NOT A SOLICITATION OF AN OFFER TO BUY THESE SECURITIES IN ANY JURISDICTION WHERE THE OFFER OR SALE IS NOT PERMITTED.
8
Benchmark 2020-B18 Mortgage Trust
|
| OVERVIEW OF MORTGAGE POOL CHARACTERISTICS |
| Loan No. | Mortgage Loan | Note(s) | Original Balance ($) | Cut-off Date Balance ($) | Holder of Note(1) | Lead Servicer for Whole Loan (Y/N) | Master Servicer Under Lead Securitization | Special Servicer Under Lead Securitization |
| 1 | Agellan Portfolio | A-1 | $75,000,000 | $75,000,000 | Benchmark 2020-B18 | No | ||
| A-2, A-3, A-4, A-5, A-6, A-7 | $156,000,000 | $156,000,000 | JPMCB | No | ||||
| Total Senior Notes | $231,000,000 | $231,000,000 | ||||||
| Note B | $172,000,000 | $172,000,000 | Benchmark 2020-B18 | Yes | Midland | Midland | ||
| Total | $403,000,000 | $403,000,000 | ||||||
| 2 | Moffett Towers Buildings A, B & C | A-1-C-3, A-1-C-7, A-1-C-10 | $53,100,000 | $53,100,000 | GSBI | No | ||
| A-1-S-1, A-2-S-1, A-3-S-1 | $1,000,000 | $1,000,000 | MOFT 2020-ABC | No | ||||
| A-2-C-2, A-3-C-2, A-3-C-4 | $69,450,000 | $69,450,000 | Benchmark 2020-IG2 | No | ||||
| A-1-C-4, A-2-C-1 | $80,000,000 | $80,000,000 | Benchmark 2020-IG3 | No | ||||
| A-1-C-1, A-1-C-8 | $65,000,000 | $65,000,000 | GSMS 2020-GC47 | No | ||||
| A-1-C-5 | $20,000,000 | $20,000,000 | JPMDB 2020-COR7 | No | ||||
| A-2-C-3, A-2-C-4, A-3-C-1, A-3-C-3 | $79,450,000 | $79,450,000 | Benchmark 2020-B17 | No | ||||
| A-1-C-2, A-1-C-6, A-1-C-9 | $75,000,000 | $75,000,000 | Benchmark 2020-B18 | No | ||||
| Total Senior Notes | $443,000,000 | $443,000,000 | ||||||
| B-1, B-2, B-3 | $327,000,000 | $327,000,000 | MOFT 2020-ABC | Yes | KeyBank | Situs | ||
| Total | $770,000,000 | $770,000,000 | ||||||
| 4 | BX Industrial Portfolio | A-1-A-1 | $80,000,000 | $80,000,000 | Benchmark 2020-IG3 | No | ||
| A-1-A-2 | $70,000,000 | $70,000,000 | Benchmark 2020-B18 | No | ||||
| A-1-A-5, A-1-A-8 | $37,400,000 | $37,400,000 | JPMDB 2020-COR7 | No | ||||
| A-1-A-3, A-1-A-4, A-1-A-6, A-1-A-7 | $135,000,000 | $135,000,000 | DBRI | No | ||||
| Total Senior Fixed Rate Notes | $322,400,000 | $322,400,000 | ||||||
| A-1-B | $72,600,000 | $72,600,000 | Benchmark 2020-IG3 | No | ||||
| A-1-C-1, A-1-C-2 | $110,000,000 | $110,000,000 | Unaffiliated Third Party | No | ||||
| A-1-D | $45,000,000 | $45,000,000 | Unaffiliated Third Party | Yes | Midland | Situs | ||
| Total Fixed Rate Notes | $550,000,000 | $550,000,000 | ||||||
| A-2 (Floating Rate Note) | $99,427,615 | $99,427,615 | Deutsche Bank, AG London | |||||
| Total | $649,427,615 | $649,427,615 | ||||||
| 5 | MGM Grand & Mandalay Bay | A-13-1, A-15-1 | $65,000,000 | $65,000,000 | Benchmark 2020-B18 | No | ||
| A-5, A-9 | $610,078,611 | $610,078,611 | CREFI | No | ||||
| A-6, A-10 | $326,705,972 | $326,705,972 | Barclays Bank PLC | No | ||||
| A-7, A-11 | $305,039,305 | $305,039,305 | DBRI | No | ||||
| A-8, A-12 | $326,705,972 | $326,705,972 | SGFC | No | ||||
| A-1, A-2, A-3, A-4 | $670,139 | $670,139 | BX 2020-VIVA | No | ||||
| Total Senior Notes | $1,634,200,000 | $1,634,200,000 | ||||||
| B-1-A, B-2-A, B-3-A, B-4-A, B-1-B, B-2-B, B-3-B, B-4-B | $329,861 | $329,861 | BX 2020-VIVA | No | ||||
| B-5-A, B-9-A, B-5-B | $321,628,056 | $321,628,056 | CREFI | No | ||||
| B-6-A, B-10-A, B-6-B | $160,814,028 | $160,814,028 | Barclays Bank PLC | No | ||||
| B-7-A, B-11-A, B-7-B | $160,814,028 | $160,814,028 | DBRI | No | ||||
| B-8-A, B-12-A, B-8-B | $160,814,028 | $160,814,028 | SGFC | No | ||||
| C-1, C-2, C-3, C-4 | $561,400,000 | $561,400,000 | BX 2020-VIVA | Yes | KeyBank | Situs | ||
| Total | $3,000,000,000 | $3,000,000,000 |
THE INFORMATION IN THIS STRUCTURAL AND COLLATERAL TERM SHEET IS NOT COMPLETE AND MAY BE AMENDED PRIOR TO THE TIME OF SALE. THIS TERM SHEET IS NOT AN OFFER TO SELL THESE SECURITIES AND IT IS NOT A SOLICITATION OF AN OFFER TO BUY THESE SECURITIES IN ANY JURISDICTION WHERE THE OFFER OR SALE IS NOT PERMITTED.
9
Benchmark 2020-B18 Mortgage Trust
|
| OVERVIEW OF MORTGAGE POOL CHARACTERISTICS |
| Loan No. | Mortgage Loan | Note(s) | Original Balance ($) | Cut-off Date Balance ($) | Holder of Note(1) | Lead Servicer for Whole Loan (Y/N) | Master Servicer Under Lead Securitization | Special Servicer Under Lead Securitization |
| 6 | 1633 Broadway | A-1-S-1, A-2-S-1, A-3-S-1, A-4-S-1 | $1,000,000 | $1,000,000 | BWAY 2019-1633 | No | ||
| A-1-C-1, A-1-C-5, A-2-C-1-A | $110,000,000 | $110,000,000 | CGCMT 2020-GC46 | No | ||||
| A-1-C-2, A-2-C-5 | $60,000,000 | $60,000,000 | GSMS 2020-GC45 | No | ||||
| A-1-C-3, A-1-C-6 | $65,000,000 | $65,000,000 | GSMS 2020-GC47 | No | ||||
| A-1-C-4-B, A-2-C-2-B, A-3-C-7 | $57,500,000 | $57,500,000 | JPMDB 2020-COR7 | No | ||||
| A-1-C-4-A | $30,000,000 | $30,000,000 | GSBI | No | ||||
| A-2-C-1-B, A-3-C-1-B | $45,000,000 | $45,000,000 | Benchmark 2020-B16 | No | ||||
| A-2-C-6, A-3-C-1-A | $62,850,000 | $62,850,000 | Benchmark 2020-B18 | No | ||||
| A-2-C-3-A, A-2-C-4-B, A-2-C-4-C, A-2-C-4-D | $55,000,000 | $55,000,000 | DBRI | No | ||||
| A-2-C-3-B, A-3-C-2 | $64,650,000 | $64,650,000 | Benchmark 2020-IG1 | No | ||||
| A-2-C-2-A, A-3-C-3 | $70,000,000 | $70,000,000 | Benchmark 2020-IG2 | No | ||||
| A-1-C-7, A-2-C-4-A, A-2-C-7, A-3-C-4 | $80,000,000 | $80,000,000 | Benchmark 2020-IG3 | No | ||||
| A-3-C-5, A-3-C-6 | $50,000,000 | $50,000,000 | Benchmark 2020-B17 | No | ||||
| A-4-C-1, A-4-C-2 | $100,000,000 | $100,000,000 | BANK 2020-BNK25 | No | ||||
| A-4-C-6, A-4-C-7 | $40,000,000 | $40,000,000 | BANK 2020-BNK26 | No | ||||
| A-4-C-3 | $40,000,000 | $40,000,000 | BANK 2020-BNK27 | No | ||||
| A-4-C-4, A-4-C-5 | $70,000,000 | $70,000,000 | WFCM 2020-C55 | No | ||||
| Total Senior Notes | $1,001,000,000 | $1,001,000,000 | ||||||
| B-1, B-2, B-3, B-4 | $249,000,000 | $249,000,000 | BWAY 2019-1633 | Yes | KeyBank | Situs | ||
| Total | $1,250,000,000 | $1,250,000,000 | ||||||
| 7 | 711 Fifth Avenue | A-1-1, A-1-10 | $62,500,000 | $62,500,000 | GSMS 2020-GC47 | Yes | Wells Fargo | KeyBank |
| A-1-2, A-1-3, A-1-4, A-1-5, A-1-11, A-1-12, A-1-14, A-1-15, A-1-16, A-1-17 | $234,000,000 | $234,000,000 | GSBI | No | ||||
| A-1-8, A-1-9, A-1-13 | $45,000,000 | $45,000,000 | Benchmark 2020-B18 | No | ||||
| A-1-6, A-1-7 | $40,000,000 | $40,000,000 | JPMDB 2020-COR7 | No | ||||
| A-2-1, A-2-3, A-2-4 | $120,500,000 | $120,500,000 | BANA | No | ||||
| A-2-2 | $43,000,000 | $43,000,000 | BANK 2020-BNK27 | No | ||||
| Total | $545,000,000 | $545,000,000 | ||||||
| 8 | 280 North Bernardo | A-1 | $40,000,000 | $40,000,000 | Benchmark 2020-B18 | Yes | Midland | Midland |
| A-2 | $31,000,000 | $31,000,000 | DBRI | No | ||||
| Total | $71,000,000 | $71,000,000 | ||||||
| 9 | 420 Taylor Street | A-1 | $28,409,091 | $28,409,091 | JPMCB | No | ||
| A-2, A-4 | $38,000,000 | $38,000,000 | Benchmark 2020-B18 | Yes(2) | Midland | Midland | ||
| A-3 | $21,590,909 | $21,590,909 | CREFI | No | ||||
| Total | $88,000,000 | $88,000,000 | ||||||
| 10 | 3000 Post Oak | A-1 | $35,000,000 | $35,000,000 | Benchmark 2020-B18 | Yes | Midland | Midland |
| A-2 | $15,000,000 | $15,000,000 | JPMCB | No | ||||
| A-3 | $30,000,000 | $30,000,000 | Benchmark 2020-B17 | No | ||||
| Total | $80,000,000 | $80,000,000 | ||||||
| 11 | Chase Center Tower I | A-1-A, A-1-B, A-1-C | $54,641,250 | $54,641,250 | Benchmark 2020-IG2 | No | ||
| A-1-D, A-1-E | $36,427,500 | $36,427,500 | Benchmark 2020-IG3 | No | ||||
| A-1-F | $18,213,750 | $18,213,750 | JPMDB 2020-COR7 | No | ||||
| A-1-G | $18,213,750 | $18,213,750 | JPMCB | No | ||||
| A-1-H | $18,213,750 | $18,213,750 | Benchmark 2020-B18 | No | ||||
| Total Senior Notes | $145,710,000 | $145,710,000 | ||||||
| B-1 | $83,637,000 | $83,637,000 | Benchmark 2020-IG2 | Yes | Midland | Midland | ||
| C-1 | $94,453,000 | $94,453,000 | Unaffiliated Third Party | No | ||||
| Total | $323,800,000 | $323,800,000 | ||||||
| 12 | Chase Center Tower II | A-2-A, A-2-B, A-2-C | $46,608,750 | $46,608,750 | Benchmark 2020-IG2 | No | ||
| A-2-D, A-2-E | $31,072,500 | $31,072,500 | Benchmark 2020-IG3 | No | ||||
| A-2-F | $15,536,250 | $15,536,250 | JPMDB 2020-COR7 | No | ||||
| A-2-G | $15,536,250 | $15,536,250 | JPMCB | No | ||||
| A-2-H | $15,536,250 | $15,536,250 | Benchmark 2020-B18 | No | ||||
| Total Senior Notes | $124,290,000 | $124,290,000 | ||||||
| B-2 | $71,363,000 | $71,363,000 | Benchmark 2020-IG2 | Yes | Midland | Midland | ||
| C-2 | $80,547,000 | $80,547,000 | Unaffiliated Third Party | No | ||||
| Total | $276,200,000 | $276,200,000 |
THE INFORMATION IN THIS STRUCTURAL AND COLLATERAL TERM SHEET IS NOT COMPLETE AND MAY BE AMENDED PRIOR TO THE TIME OF SALE. THIS TERM SHEET IS NOT AN OFFER TO SELL THESE SECURITIES AND IT IS NOT A SOLICITATION OF AN OFFER TO BUY THESE SECURITIES IN ANY JURISDICTION WHERE THE OFFER OR SALE IS NOT PERMITTED.
10
Benchmark 2020-B18 Mortgage Trust
|
| OVERVIEW OF MORTGAGE POOL CHARACTERISTICS |
| Loan No. | Mortgage Loan | Note(s) | Original Balance ($) | Cut-off Date Balance ($) | Holder of Note(1) | Lead Servicer for Whole Loan (Y/N) | Master Servicer Under Lead Securitization | Special Servicer Under Lead Securitization |
| 13 | Brass Professional Center | A-1 | $32,700,000 | $32,700,000 | Benchmark 2020-B18 | Yes | Midland | Midland |
| A-2 | $25,000,000 | $25,000,000 | GSBI | No | ||||
| Total | $57,700,000 | $57,700,000 | ||||||
| 15 | Apollo Education Group HQ Campus | A-1 | $50,000,000 | $50,000,000 | Benchmark 2020-B17 | Yes | Midland | Midland |
| A-2 | $26,500,000 | $26,500,000 | Benchmark 2020-B18 | No | ||||
| A-3 | $15,000,000 | $15,000,000 | JPMDB 2020-COR7 | No | ||||
| Total | $91,500,000 | $91,500,000 | ||||||
| 16 | Bellagio Hotel & Casino | A-1-C1 | $100,000,000 | $100,000,000 | BANK 2020-BNK25 | No | ||
| A-2-C1 | $60,000,000 | $60,000,000 | GSMS 2020-GC45 | No | ||||
| A-1-S1, A-1-S2, A-2-S1, A-2-S2, A-3-S1, A-3-S2 | $716,000,000 | $716,000,000 | BX 2019-OC11 | Yes | KeyBank | Situs | ||
| A-2-C2, A-3-C2 | $60,000,000 | $60,000,000 | Benchmark 2020-B16 | No | ||||
| A-1-RL, A-2-RL, A-3-RL | $360,200,000 | $360,200,000 | Third party investor | No | ||||
| A-1-C3 | $65,000,000 | $65,000,000 | MSC 2020-L4 | No | ||||
| A-1-C4, A-1-C6 | $39,000,000 | $39,000,000 | MSNBA | No | ||||
| A-2-C4 | $20,000,000 | $20,000,000 | CGCMT 2020-GC46 | No | ||||
| A-2-C3, A-3-C5 | $55,000,000 | $55,000,000 | Benchmark 2020-IG1 | No | ||||
| A-3-C1 | $40,000,000 | $40,000,000 | Benchmark 2020-B17 | No | ||||
| A-3-C6 | $21,250,000 | $21,250,000 | Benchmark 2020-B18 | No | ||||
| A-1-C5 | $35,000,000 | $35,000,000 | BANK 2020-BNK26 | No | ||||
| A-1-C2 | $61,000,000 | $61,000,000 | BANK 2020-BNK27 | No | ||||
| A-3-C3, A-3-C4 | $43,750,000 | $43,750,000 | BBCMS 2020-C6 | No | ||||
| Total Senior Notes | $1,676,200,000 | $1,676,200,000 | ||||||
| B-1-S, B-2-S, B-3-S | $510,700,000 | $510,700,000 | BX 2019-OC11 | No | ||||
| B-1-RL, B-2-RL, B-3-RL | $139,800,000 | $139,800,000 | Third party investor | No | ||||
| C-1-S, C-2-S, C-3-S | $683,300,000 | $683,300,000 | BX 2019-OC11 | No | ||||
| Total | $3,010,000,000 | $3,010,000,000 | ||||||
| 17 | Southcenter Mall | A-1 | $60,000,000 | $60,000,000 | GSMS 2020-GC45 | Yes | Midland | Midland |
| A-2 | $50,000,000 | $50,000,000 | Benchmark 2020-IG1 | No | ||||
| A-3, A-5 | $59,000,000 | $59,000,000 | CGCMT 2020-GC46 | No | ||||
| A-4 | $29,000,000 | $29,000,000 | DBRI | No | ||||
| A-6 | $20,000,000 | $20,000,000 | Benchmark 2020-B18 | No | ||||
| Total | $218,000,000 | $218,000,000 | ||||||
| 22 | Kings Plaza | A-1-1-A | $32,000,000 | $32,000,000 | Benchmark 2020-B17 | Yes | Midland | Midland |
| A-1-1-B-2 | $14,108,108 | $14,108,108 | Benchmark 2020-B18 | No | ||||
| A-1-2 | $50,000,000 | $50,000,000 | Benchmark 2020-B16 | No | ||||
| A-1-3, A-1-4 | $55,000,000 | $55,000,000 | Benchmark 2020-IG1 | No | ||||
| A-2-1 | $60,000,000 | $60,000,000 | BBCMS 2020-C6 | No | ||||
| A-1-1-B-1 | $20,000,000 | $20,000,000 | JPMCB | No | ||||
| A-2-2, A-2-3, A-2-4 | $97,945,946 | $97,945,946 | SGFC | No | ||||
| A-3-1, A-3-4 | $75,000,000 | $75,000,000 | BANK 2020-BNK25 | No | ||||
| A-3-2, A-3-3 | $82,945,946 | $82,945,946 | WFCM 2020-C55 | No | ||||
| Total | $487,000,000 | $487,000,000 |
| (1) | The identification of a securitization trust means we have identified another securitization trust that has closed or as to which a preliminary prospectus (or preliminary offering circular) or final prospectus (or final offering circular) has printed that has or is expected to include the identified Mortgage Note(s). |
| (2) | With respect to the 420 Taylor Street whole loan, servicing is expected to shift to a future securitization if greater than $38,000,000 aggregate principal balance of the related pari passu companion loans are included together in such future securitization. |
THE INFORMATION IN THIS STRUCTURAL AND COLLATERAL TERM SHEET IS NOT COMPLETE AND MAY BE AMENDED PRIOR TO THE TIME OF SALE. THIS TERM SHEET IS NOT AN OFFER TO SELL THESE SECURITIES AND IT IS NOT A SOLICITATION OF AN OFFER TO BUY THESE SECURITIES IN ANY JURISDICTION WHERE THE OFFER OR SALE IS NOT PERMITTED.
11
Benchmark 2020-B18 Mortgage Trust
|
| OVERVIEW OF MORTGAGE POOL CHARACTERISTICS |
| COVID-19 Update | ||||||||||||||
| No. | Property Name | Mortgage Loan Seller | Information as of Date | Property Type | First Payment Date | June Debt Service Payment Received (Yes/No) | July Debt Service Payment Received (Yes/No) | Forbearance or Other Debt Service Relief Requested (Yes/No) | Other Loan Modification Requested (Yes/No) | Lease Modification or Rent Relief Requested (Yes/No) | Occupied SF or Unit Count Making Full May Rent Payment (%) | UW Base Rent Paid (%) | Occupied SF or Unit Count Making Full June Rent Payment (%) | UW Base Rent Paid (%) |
| 1 | Agellan Portfolio(1) | JPMCB | 7/7/2020 | Various | 8/7/2020 | NAP | NAP | No | No | No | 96.7% | 96.8% | 97.0% | 96.6% |
| 2 | Moffett Towers Buildings A, B & C(2) | GSMC | 7/1/2020 | Office | 3/6/2020 | Yes | Yes | No | No | Yes | 98.8% | 96.3% | 98.8% | 96.3% |
| 3 | Tropical Distribution Center | GSMC | 7/1/2020 | Industrial | 8/6/2020 | NAP | NAP | No | No | No | 100.0% | 100.0% | 100.0% | 100.0% |
| 4 | BX Industrial Portfolio(3) | GACC | 7/13/2020 | Various | 6/9/2020 | Yes | Yes | No | No | No | 98.1% | 97.2% | 98.7% | 99.2% |
| 5 | MGM Grand & Mandalay Bay | CREFI/GACC | 7/10/2020 | Hospitality | 4/5/2020 | Yes | Yes | No | No | No | 100.0% | 100.0% | 100.0% | 100.0% |
| 6 | 1633 Broadway(4) | GACC/JPMCB | 7/8/2020 | Office | 1/6/2020 | Yes | Yes | No | No | Yes | 86.5% | 89.9% | 85.2% | 89.4% |
| 7 | 711 Fifth Avenue(5)(6) | GSMC | 7/8/2020 | Mixed Use | 4/6/2020 | Yes | Yes | No | No | Yes | 100.0% | 72.4% | 100.0% | 76.8% |
| 8 | 280 North Bernardo(7) | GACC | 7/13/2020 | Office | 8/6/2020 | NAP | NAP | No | No | No | 100.0% | 100.0% | 100.0% | 100.0% |
| 9 | 420 Taylor Street(8) | JPMCB/CREFI | 7/6/2020 | Office | 8/6/2020 | NAP | NAP | No | No | No | NAP | NAP | NAP | NAP |
| 10 | 3000 Post Oak | JPMCB | 7/10/2020 | Office | 4/1/2020 | Yes | Yes | No | No | No | 100.0% | 100.0% | 100.0% | 100.0% |
| 11 | Chase Center Tower I | JPMCB | 7/10/2020 | Office | 5/10/2020 | Yes | Yes | No | No | No | 100.0% | 100.0% | 100.0% | 100.0% |
| 12 | Chase Center Tower II | JPMCB | 7/5/2020 | Office | 5/10/2020 | Yes | Yes | No | No | No | 100.0% | 100.0% | 100.0% | 100.0% |
| 13 | Brass Professional Center(9) | GSMC | 7/10/2020 | Office | 8/6/2020 | NAP | NAP | No | No | Yes | 82.7% | 89.7% | 84.3% | 87.1% |
| 14 | Flushing Commons(10) | CREFI | 7/10/2020 | Retail | 4/6/2020 | Yes | Yes | No | No | Yes | 100.0% | 100.0% | 100.0% | 100.0% |
| 15 | Apollo Education Group HQ Campus | JPMCB | 7/5/2020 | Office | 3/5/2020 | Yes | Yes | No | No | No | 100.0% | 100.0% | 100.0% | 100.0% |
| 16 | Bellagio Hotel and Casino | JPMCB | 7/5/2020 | Hospitality | 1/5/2020 | Yes | Yes | No | No | No | 100.0% | 100.0% | 100.0% | 100.0% |
| 17 | Southcenter Mall(11)(12) | GACC | 7/10/2020 | Retail | 2/1/2020 | Yes | Yes | Yes | Yes | Yes | 28.4% | 29.0% | 27.3% | 31.0% |
| 18 | CityLine Augusta Portfolio(13) | CREFI | 7/10/2020 | Self Storage | 8/6/2020 | NAP | NAP | No | No | No | (13) | (13) | (13) | (13) |
| 19 | 364 Lincoln(14) | JPMCB | 7/1/2020 | Multifamily | 8/1/2020 | NAP | NAP | No | No | No | NAV | 94.2% | NAV | 94.4% |
| 20 | Jasmine Cove | JPMCB | 7/1/2020 | Multifamily | 8/1/2020 | NAP | NAP | No | No | No | 100.0% | 100.0% | NAV | 99.5% |
| 21 | Battery Park Lofts(15) | GACC | 7/9/2020 | Multifamily | 8/6/2020 | NAP | NAP | No | No | No | 98.6% | 98.0% | 94.3% | 94.6% |
| 22 | Kings Plaza(16)(17) | JPMCB | 7/1/2020 | Retail | 2/1/2020 | Yes | Yes | No | No | No | NAV | 18.0% | NAV | 29.1% |
| 23 | 84 14th Street | CREFI | 7/10/2020 | Office | 8/6/2020 | NAP | NAP | No | No | No | 100.0% | 100.0% | 100.0% | 100.0% |
| 24 | Edge 32 Apartments(18) | GACC | 7/9/2020 | Multifamily | 8/6/2020 | NAP | NAP | No | No | No | 98.1% | 97.4% | 92.3% | 93.6% |
| 25 | Cambridge Club Apartments | CREFI | 7/10/2020 | Multifamily | 8/6/2020 | NAP | NAP | No | No | No | 100.0% | 100.0% | 100.0% | 100.0% |
| 26 | 1725 N Commerce Parkway | CREFI | 7/10/2020 | Office | 8/6/2020 | NAP | NAP | No | No | No | 100.0% | 100.0% | 100.0% | 100.0% |
| 27 | CityLine Hattiesburg(19) | CREFI | 7/10/2020 | Self Storage | 8/6/2020 | NAP | NAP | No | No | No | (19) | (19) | (19) | (19) |
| 28 | OrthoSouth | CREFI | 7/10/2020 | Office | 8/6/2020 | NAP | NAP | No | No | No | 100.0% | 100.0% | 100.0% | 100.0% |
| 29 | Strathmore Apartments(20) | GACC | 7/15/2020 | Multifamily | 8/6/2020 | NAP | NAP | No | No | No | 98.6% | 98.6% | 97.3% | 97.2% |
| 30 | 630 W Lake(21) | CREFI | 7/10/2020 | Mixed Use | 5/6/2020 | Yes | Yes | No | No | No | (21) | (21) | (21) | (21) |
| 31 | 2 Laurel Drive | CREFI | 7/10/2020 | Industrial | 8/6/2020 | NAP | NAP | No | No | Yes | 85.2% | 85.0% | 73.5% | 74.0% |
| 32 | CityLine Flagstaff(22) | CREFI | 7/10/2020 | Self Storage | 8/6/2020 | NAP | NAP | No | No | No | 100.0% | 100.0% | 100.0% | 100.0% |
| 33 | 968-970 Gates Ave | CREFI | 7/10/2020 | Multifamily | 8/6/2020 | NAP | NAP | No | No | No | 100.0% | 100.0% | 100.0% | 100.0% |
| 34 | CityLine Wisconsin(23) | CREFI | 7/10/2020 | Self Storage | 8/6/2020 | NAP | NAP | No | No | No | (23) | (23) | (23) | (23) |
| 35 | StorQuest Self Storage - Modesto(24) | CREFI | 7/10/2020 | Self Storage | 8/6/2020 | NAP | NAP | No | No | No | (24) | (24) | (24) | (24) |
| 36 | StorQuest Self Storage - Ceres(25) | CREFI | 7/10/2020 | Self Storage | 8/6/2020 | NAP | NAP | No | No | No | (25) | (25) | (25) | (25) |
| 37 | Castle Rock Self Storage(26) | CREFI | 7/10/2020 | Self Storage | 8/6/2020 | NAP | NAP | No | No | No | (26) | (26) | (26) | (26) |
| (1) | Agellan Portfolio - As of June 2020, none of the tenants have been granted a rent deferral and 25 tenants (totaling 5.4% of NRA) are in discussions with the borrowers for rent relief. The Top 10 tenants have paid July rent in full. Collection reports will be available at the end of the month. |
| (2) | Moffett Towers Buildings A, B & C - The percentage of Total SF or Unit Count Making Full June Rent Payment and percentage of UW Base Rent Paid are based on the percentage of underwritten tenant leases with rent due in June. Based on the underwritten rent roll, there are a total of 6 tenant leases at the Moffett Towers Buildings A, B & C Mortgaged Property and 4 of those tenant leases owed rent for June. Of those 4 tenant leases, 1 tenant lease, representing approximately 4% of the expected June rent collection, did not pay. Two tenants, Google and Comcast, have executed leases: however, rent was not due under those leases for June. Google is currently in build out of additional leased premises and Comcast is scheduled to relocate at the Moffett Towers Buildings A, B & C Mortgaged Property. Google has executed leases for Buildings B and C, representing approximately 56% of UW Base Rent. Google is expected to take possession of Building B in January 2021. Google has taken possession of its premises in Building C in 2 phases: 96,282 SF was taken possession of in March 2020 and 84,914 SF was taken possession of in July 2020. Google is expected to begin paying rent for Building B and Building C in June 2021 and September 2020, respectively. Comcast has executed a lease extension and relocation for Building C and is expected to take possession of the relocation space in November 2020 and begin paying rent on both the existing space and relocation space in March 2021, representing approximately 13% of UW Base Rent. |
| (3) | BX Industrial Portfolio– As of the June collections period, 3 tenants, representing approximately 1.3% of occupied net rentable area and 0.8% of the underwritten base rent, either did not pay rent or paid a portion of their scheduled rent amount. |
| (4) | 1633 Broadway - One tenant, representing approximately 8% of UW Base Rent, paid reduced May rent and has signed an amendment for reduced rent through year end 2020. The difference between the underwritten contractual rent per the original lease and the reduced rent pursuant to signed amendment, is required to be repaid over a 36-month period beginning January 1, 2021 at an imputed interest rate of 3.75% (from April 1, 2020) on the amount of rent deferred. One tenant, representing approximately 4.7% of the UW Base Rent, has agreed to a three month rent deferral for the months of April, May and June 2020. |
| (5) | 711 Fifth Avenue - One retail tenant, representing approximately 4.2% of the SF and 37.3% of UW Base Rent, agreed with the borrower sponsor to pay 50% abated rent for April, May and June 2020 with 50% recaptured by year end 2020 and the remaining 50% recaptured by the end of the first quarter 2021. The borrower sponsor is in the process of finalizing an agreement for rent relief with respect to the Polo Bar space (7,436 SF of the total Ralph Lauren 38,638 SF and 1.4% of the total Ralph Lauren underwritten base rent) which is temporarily closed. The agreement includes a $250,000 rent abatement and $250,000 rent deferral for May 2020 and a $250,000 rent deferral for June 2020 (totaling $750,000). |
| (6) | 711 Fifth Avenue - Includes one tenant, representing 4.2% of the SF and 37.3% of UW Base Rent of the 711 Fifth Avenue property who paid their rent in accordance with an agreement to pay 50% abated rent for the month of May and one tenant, representing 11.4% of the SF and 41.1% of the UW Base Rent of the 711 Fifth Avenue property who is in the process of executing an agreement with the borrower sponsor. |
THE INFORMATION IN THIS STRUCTURAL AND COLLATERAL TERM SHEET IS NOT COMPLETE AND MAY BE AMENDED PRIOR TO THE TIME OF SALE. THIS TERM SHEET IS NOT AN OFFER TO SELL THESE SECURITIES AND IT IS NOT A SOLICITATION OF AN OFFER TO BUY THESE SECURITIES IN ANY JURISDICTION WHERE THE OFFER OR SALE IS NOT PERMITTED.
12
Benchmark 2020-B18 Mortgage Trust
|
| OVERVIEW OF MORTGAGE POOL CHARACTERISTICS |
| (7) | 280 North Bernardo – One tenant, representing 100% of the UW Base Rent received a 3-month forbearance period from the landlord. The forborne rent will be amortized over the remainder of the lease term. The tenant did not request any form of rent relief, and the forbearance was offered by the landlord given the tenant could not complete their buildout by the original scheduled completion date as a result of COVID-19 pandemic stay-at-home orders. |
| (8) | 420 Taylor Street - NextDoor began paying rent on the upper level on July 11th and the lower level LCD is 120 days following the delivery date (1/1/2021). A two month free rent period will begin on the January 1, 2021 rent commencement date. |
| (9) | Brass Professional Center - 16 tenants representing approximately 14.1% of the UW Base Rent have requested rent relief. |
| (10) | Flushing Commons - One tenant, representing approximately 41.5% of net rentable area and 25.2% of UW base rent, entered into a rent deferral arrangement with the borrowers for March through June. The tenant agreed to pay 100% of their base rent for March through June in exchange for 50% concessions on common charges for those months, which accounts for approximately 85% of their gross rent. All of the tenants by count, square footage and underwritten base rent have paid rent for July. |
| (11) | Southcenter Mall - On April 7, 2020, the borrower requested (i) a debt service forbearance of at least four months until the related mortgaged property is no longer affected by the COVID 19 pandemic, (ii) lender acknowledgement of the property manager’s right to negotiate amendments with tenants and scale the operations at the related mortgaged property, (iii) the waiver of any events of default under the loan documents attributable to the scale of operations at the related mortgaged property due to COVID-19, and (iv) the waiver of all material covenants in the loan documents with respect to performance of the related mortgaged property, including covenants arising from debt service coverage ratio and debt yield trigger events. A trigger event would, among other things, trigger a cash sweep and require the borrower to fund reserves for taxes, insurance, parking rent, replacements, and tenant improvements and leasing commissions. On May 22, 2020, the lender agreed to waive such debt service coverage ratio and debt yield trigger events for a six month period through November 22, 2020, and the property-related financial and leasing tests will resume at the end of the final calendar quarter of 2020 for the period ending December 31, 2020. The lender rejected the remainder of the borrower’s requests. |
| (12) | Southcenter Mall – 84 tenants, representing approximately 13.6% of net rentable area and 35.8% of UW base rent have requested rent relief. 125] tenants, representing approximately 36.4% of net rentable area and 52.2% of UW Base Rent have not paid rent for April through June. 40 tenants, representing approximately 53.3% of net rentable area and 55.4% of UW base rent have not made their June rent payment. 125 tenants, representing approximately 27.2% of net rentable area and 25.0% of UW base rent have paid partial rent for April through June, with the other noted requests rejected by the lender. |
| (13) | CityLine Augusta Portfolio - Given the timing of collection and reporting, an accurate estimate of the percentage of tenants who have not paid is not available. For the month of May, rent collections on a portfolio basis were 6.2% below UW Base Rent. For the month of June, rent collections on a portfolio basis were 1.2% greater than UW Base Rent. |
| (14) | 364 Lincoln - Total SF or Unit Count Making Full Rent Payment for May and June was not reported for the 364 Lincoln Loan. |
| (15) | Battery Park Lofts – The calculations are based on the number of units for which rent was fully paid divided by the total number of occupied units. As of the June collections period, four tenants representing 5.4% of the underwritten base rent have not paid for June. |
| (16) | Kings Plaza - The Borrower has not granted any rent relief or abatements to tenants as they are waiting for the property to open up to assess each individual tenants need on an on a real time basis in response to the pandemic and recent protests effect on the property. On July 8th NYC Governor Cuomo announced that malls may reopen Friday July 10th across NY State if the region is either in stage four or the final stage of its recovery schedule. Kings Plaza falls within the NYC region which is currently in stage three of its recovery schedule and has not yet opened. |
| (17) | Kings Plaza - Although May and June collections were reported, an accurate estimate of the percentage of Total SF or Unit Count Making Full Rent Payment for May and June is not available for the Kings Plaza loan based on rent collection reports received from the borrower sponsor. |
| (18) | Edge 32 Apartments – The calculations are based on the number of units for which rent was fully paid divided by the total number of occupied units. As of the June collections period, four tenants representing 6.4% of the underwritten base rent have not paid for June. |
| (19) | CityLine Hattiesburg - Given the timing of collection and reporting, an accurate estimate of the percentage of tenants who have not paid is not available. For the month of May, rent collections were reported to be 3.1% greater than UW Base Rent. For the month of June, rent collections were reported to be approximately 3.0% below UW Base Rent. |
| (20) | Strathmore Apartments – The calculations are based on the number of units for which rent was fully paid divided by the total number of occupied units. As of the June collections period, two tenants representing 2.8% of the underwritten base rent have not paid for June. |
| (21) | 630 W Lake - Three of the retail tenants, representing approximately 34.3% of net rentable area and 29.6% of underwritten base rent have requested rent relief. One tenant, representing approximately 14.8% of net rentable area and 11.4% of UW Base Rent has not paid rent for April through June. One tenant, representing approximately 11.7% of net rentable area and 11.0% of UW base rent has not made their June rent payment. One tenant, representing approximately 7.8% of net rentable area and 7.3% of base rent has paid 50% of all rent for April through June. The borrower is in discussions with all tenants and is confident they will reach a resolution. |
| (22) | CityLine Flagstaff – Given the timing of collection and reporting, an accurate estimate of the percentage of tenants who have not paid is not available. For the month of May, rent collections were reported to be 1.9% below UW Base Rent. For the month of June, rent collections were reported to be 1.9% greater than UW Base Rent. |
| (23) | CityLine Wisconsin – Given the timing of collection and reporting, an accurate estimate of the percentage of tenants who have not paid is not available. For the months of May and June, collections were 2.1% and 1.2% below UW Base Rent, respectively. |
| (24) | StorQuest Self Storage – Modesto - Given the timing of collection and reporting, an accurate estimate of the percentage of tenants who have not paid is not available. For the months of May and June, rent collections were reported to be 4.7% and 4.0% below UW Base Rent, respectively. |
| (25) | StorQuest Self Storage – Ceres - Given the timing of collection and reporting, an accurate estimate of the percentage of tenants who have not paid is not available. For the months of May and June, rent collections were reported to be 2.7% and 7.6% below UW Base Rent, respectively. |
| (26) | Castle Rock Self Storage - Given the timing of collection and reporting, an accurate estimate of the percentage of tenants who have not paid is not available. For the months of May and June, rent collections were reported to be 0.2% and 0.1% below UW Base Rent, respectively. |
THE INFORMATION IN THIS STRUCTURAL AND COLLATERAL TERM SHEET IS NOT COMPLETE AND MAY BE AMENDED PRIOR TO THE TIME OF SALE. THIS TERM SHEET IS NOT AN OFFER TO SELL THESE SECURITIES AND IT IS NOT A SOLICITATION OF AN OFFER TO BUY THESE SECURITIES IN ANY JURISDICTION WHERE THE OFFER OR SALE IS NOT PERMITTED.
13
Benchmark 2020-B18 Mortgage Trust
|
| OVERVIEW OF MORTGAGE POOL CHARACTERISTICS |
| Distribution of Cut-off Date Balances(1)(2)(3) | ||||||||||
| Range of Cut-off Date Balances | Number of Mortgage Loans | Aggregate Cut-off Date Balance | % of Initial Pool | Weighted Averages | ||||||
| Mortgage Rate | Stated Remaining Term (Mos.) | U/W NCF DSCR(4) | Cut-off Date LTV(5) | Maturity Date or ARD LTV(5) | ||||||
| $4,000,000 | - | $7,499,999 | 9 | $52,975,000 | 5.7% | 4.0452% | 120 | 2.21x | 59.0% | 55.7% |
| $7,500,000 | - | $14,999,999 | 8 | $85,738,108 | 9.2% | 4.0184% | 119 | 1.99x | 62.0% | 57.0% |
| $15,000,000 | - | $24,999,999 | 7 | $127,700,000 | 13.7% | 3.6395% | 101 | 4.16x | 45.1% | 44.4% |
| $25,000,000 | - | $49,999,999 | 7 | $245,200,000 | 26.2% | 3.9069% | 103 | 2.38x | 58.7% | 56.2% |
| $50,000,000 | - | $75,000,000 | 6 | $422,850,000 | 45.3% | 3.6562% | 100 | 3.48x | 44.6% | 44.6% |
| Total/Weighted Average | 37 | $934,463,108 | 100.0% | 3.7750% | 104 | 3.07x | 50.8% | 49.4% | ||
| Distribution of Mortgage Rates(1)(2)(3) | ||||||||||
| Range of Mortgage Rates | Number of Mortgage Loans | Aggregate Cut-off Date Balance | % of Initial Pool | Weighted Averages | ||||||
| Mortgage Rate | Stated Remaining Term (Mos.) | U/W NCF DSCR(4) | Cut-off Date LTV(5) | Maturity Date or ARD LTV(5) | ||||||
| 2.8800% | - | 3.9999% | 22 | $665,728,108 | 71.2% | 3.4791% | 107 | 3.47x | 47.8% | 47.4% |
| 4.0000% | - | 4.2499% | 7 | $75,230,000 | 8.1% | 4.1555% | 120 | 1.63x | 63.9% | 58.0% |
| 4.2500% | - | 4.7499% | 6 | $125,805,000 | 13.5% | 4.5225% | 85 | 2.52x | 51.4% | 50.1% |
| 4.7500% | - | 4.9875% | 2 | $67,700,000 | 7.2% | 4.8728% | 87 | 1.76x | 64.0% | 58.3% |
| Total/Weighted Average | 37 | $934,463,108 | 100.0% | 3.7750% | 104 | 3.07x | 50.8% | 49.4% | ||
| Property Type Distribution(1)(2)(3)(7) | |||||||||||
| Property Type | Number of Mortgaged Properties | Aggregate Cut-off Date Balance | % of Initial Outstanding Pool Balance | Number of NRA/Units/Rooms | Weighted Averages | ||||||
Cut-off Date NRA/Units/Rooms | Mortgage Rate | Stated Remaining Term (Mos.) | Occupancy | U/W NCF DSCR(4) | Cut-off Date LTV(5) | Maturity Date or ARD LTV(5) | |||||
| Office | 20 | $389,338,731 | 41.7% | 6,953,542 | $399 | 3.8050% | 100 | 97.7% | 2.93x | 49.3% | 47.6% |
| Suburban | 9 | $193,425,579 | 20.7% | 2,835,032 | $362 | 3.8482% | 106 | 96.9% | 2.96x | 51.0% | 49.0% |
| CBD | 9 | $188,313,151 | 20.2% | 4,088,604 | $442 | 3.7468% | 92 | 98.3% | 2.94x | 47.6% | 46.4% |
| Medical | 2 | $7,600,000 | 0.8% | 29,906 | $256 | 4.1500% | 121 | 100.0% | 1.81x | 47.6% | 40.3% |
| Industrial | 106 | $208,898,793 | 22.4% | 17,213,098 | $59 | 3.8865% | 89 | 93.8% | 2.83x | 51.3% | 50.9% |
| Warehouse/Distribution | 60 | $158,053,294 | 16.9% | 12,328,260 | $61 | 3.8006% | 96 | 97.1% | 2.69x | 54.6% | 54.1% |
| Flex | 35 | $38,376,429 | 4.1% | 3,398,762 | $50 | 4.3399% | 65 | 91.9% | 3.18x | 41.3% | 41.3% |
| Warehouse/Storage | 3 | $5,995,166 | 0.6% | 723,662 | $54 | 3.5500% | 75 | 21.0% | 3.57x | 39.6% | 39.6% |
| Manufacturing | 4 | $3,413,199 | 0.4% | 428,799 | $44 | 3.5500% | 75 | 94.6% | 3.57x | 39.6% | 39.6% |
| Warehouse | 3 | $2,700,260 | 0.3% | 295,111 | $46 | 3.6942% | 73 | 89.8% | 3.50x | 39.9% | 39.9% |
| R&D/Flex | 1 | $360,446 | 0.0% | 38,504 | $51 | 3.5500% | 75 | 100.0% | 3.57x | 39.6% | 39.6% |
| Hospitality | 3 | $86,250,000 | 9.2% | 13,681 | $231,871 | 3.4624% | 115 | 91.5% | 5.80x | 36.4% | 36.4% |
| Full Service | 3 | $86,250,000 | 9.2% | 13,681 | $231,871 | 3.4624% | 115 | 91.5% | 5.80x | 36.4% | 36.4% |
| Multifamily | 7 | $81,000,000 | 8.7% | 583 | $191,225 | 4.1084% | 120 | 92.2% | 1.64x | 66.0% | 61.2% |
| Mid Rise | 4 | $48,700,000 | 5.2% | 213 | $259,902 | 4.1533% | 120 | 90.0% | 1.53x | 67.2% | 61.1% |
| Garden | 3 | $32,300,000 | 3.5% | 370 | $87,677 | 4.0408% | 120 | 95.5% | 1.81x | 64.2% | 61.4% |
| Retail | 3 | $62,108,108 | 6.6% | 1,624,865 | $646 | 3.2457% | 115 | 86.5% | 3.90x | 46.3% | 46.3% |
| Super Regional Mall | 2 | $34,108,108 | 3.7% | 1,594,865 | $411 | 3.0780% | 114 | 89.3% | 5.10x | 35.4% | 35.4% |
| Unanchored | 1 | $28,000,000 | 3.0% | 30,000 | $933 | 3.4500% | 116 | 83.0% | 2.45x | 59.6% | 59.6% |
| Self Storage | 8 | $53,805,000 | 5.8% | 775,173 | $71 | 4.2662% | 121 | 85.8% | 2.11x | 60.5% | 57.4% |
| Mixed Use | 2 | $51,720,000 | 5.5% | 360,296 | $1,438 | 3.2276% | 116 | 79.6% | 2.81x | 55.8% | 55.8% |
| Office/Retail | 1 | $45,000,000 | 4.8% | 340,024 | $1,603 | 3.1600% | 116 | 76.5% | 2.90x | 54.5% | 54.5% |
| Multifamily/Retail | 1 | $6,720,000 | 0.7% | 20,272 | $331 | 3.6800% | 117 | 100.0% | 2.22x | 64.6% | 64.6% |
| Other – Leased Fee | 5 | $1,342,476 | 0.1% | NAP | NAP | 3.5500% | 75 | NAP | 3.57x | 39.6% | 39.6% |
| Total/Weighted Average | 154 | $934,463,108 | 100.0% | 3.7750% | 104 | 93.2% | 3.07x | 50.8% | 49.4% | ||
| Geographic Distribution(1)(2)(3) | ||||||||
| State/Location | Number of Properties | Aggregate Cut-off Date Balance | % of Initial Outstanding Pool Balance | Weighted Averages | ||||
| Mortgage Rate | Stated Remaining Term (Mos.) | U/W NCF DSCR(4) | Cut-off Date LTV(5) | Maturity Date or ARD LTV(5) | ||||
| California | 10 | $196,018,495 | 21.0% | 3.6573% | 107 | 3.00x | 46.2% | 45.0% |
| Northern | 10 | $196,018,495 | 21.0% | 3.6573% | 107 | 3.00x | 46.2% | 45.0% |
| New York | 8 | $194,058,108 | 20.8% | 3.3808% | 116 | 2.92x | 53.1% | 53.1% |
| New York City | 7 | $186,758,108 | 20.0% | 3.3648% | 116 | 2.94x | 52.8% | 52.8% |
| New York State | 1 | $7,300,000 | 0.8% | 3.7900% | 120 | 2.41x | 60.6% | 60.6% |
| Nevada | 4 | $161,250,000 | 17.3% | 3.5232% | 117 | 4.08x | 51.2% | 51.2% |
| Texas | 27 | $106,886,643 | 11.4% | 4.7413% | 78 | 2.25x | 55.8% | 52.2% |
| Other | 105 | $276,249,862 | 29.6% | 3.9085% | 94 | 2.97x | 50.3% | 47.8% |
| Total/Weighted Average | 154 | $934,463,108 | 100.0% | 3.7750% | 104 | 3.07x | 50.8% | 49.4% |
THE INFORMATION IN THIS STRUCTURAL AND COLLATERAL TERM SHEET IS NOT COMPLETE AND MAY BE AMENDED PRIOR TO THE TIME OF SALE. THIS TERM SHEET IS NOT AN OFFER TO SELL THESE SECURITIES AND IT IS NOT A SOLICITATION OF AN OFFER TO BUY THESE SECURITIES IN ANY JURISDICTION WHERE THE OFFER OR SALE IS NOT PERMITTED.
14
Benchmark 2020-B18 Mortgage Trust
|
| OVERVIEW OF MORTGAGE POOL CHARACTERISTICS |
| Distribution of Cut-off Date LTVs(1)(2)(3) | ||||||||||
| Range of Cut-off Date LTVs | Number of Mortgage Loans | Aggregate Cut-off Date Balance | % of Initial Outstanding Pool Balance | Weighted Averages | ||||||
| Mortgage Rate | Stated Term | U/W NCF DSCR(4) | Cut-off Date LTV(5) | Maturity Date or ARD LTV(5) | ||||||
| 22.2% | - | 54.9% | 16 | $529,058,108 | 56.6% | 3.5554% | 95 | 3.96x | 40.6% | 40.5% |
| 55.0% | - | 59.9% | 4 | $112,250,000 | 12.0% | 4.1348% | 99 | 2.33x | 58.1% | 58.1% |
| 60.0% | - | 64.9% | 8 | $103,375,000 | 11.1% | 4.0119% | 120 | 1.84x | 62.2% | 58.8% |
| 65.0% | - | 69.9% | 6 | $134,600,000 | 14.4% | 3.8506% | 120 | 1.87x | 67.4% | 65.4% |
| 70.0% | - | 72.9% | 3 | $55,180,000 | 5.9% | 4.5204% | 121 | 1.36x | 71.7% | 60.2% |
| Total/Weighted Average | 37 | $934,463,108 | 100.0% | 3.7750% | 104 | 3.07x | 50.8% | 49.4% | ||
| Distribution of Maturity Date or ARD LTVs(1)(2)(3) | ||||||||||
| Range of Maturity Date or ARD LTVs | Number of Mortgage Loans | Aggregate Cut-off Date Balance | % of Initial Outstanding Pool Balance | Weighted Averages | ||||||
| Mortgage Rate | Stated Term | U/W NCF DSCR(4) | Cut-off Date LTV(5) | Maturity Date or ARD LTV(5) | ||||||
| 22.2% | - | 49.9% | 14 | $469,950,000 | 50.3% | 3.5991% | 93 | 4.09x | 38.9% | 38.8% |
| 50.0% | - | 54.9% | 3 | $65,738,108 | 7.0% | 3.2914% | 116 | 2.82x | 55.4% | 54.0% |
| 55.0% | - | 59.9% | 10 | $202,275,000 | 21.6% | 4.0703% | 109 | 1.97x | 61.0% | 57.5% |
| 60.0% | - | 68.2% | 10 | $196,500,000 | 21.0% | 4.0533% | 120 | 1.87x | 67.2% | 64.9% |
| Total/Weighted Average | 37 | $934,463,108 | 100.0% | 3.7750% | 104 | 3.07x | 50.8% | 49.4% | ||
| Distribution of Underwritten NCF Debt Service Coverages(1)(2)(3) | ||||||||||
| Range of Underwritten NCF Debt Service Coverages | Number of Mortgage Loans | Aggregate Cut-off Date Balance | % of Initial Outstanding Pool Balance | Weighted Averages | ||||||
| Mortgage Rate | Stated Remaining Term (Mos.) | U/W NCF DSCR(4) | Cut-off Date LTV(5) | Maturity Date or ARD LTV(5) | ||||||
| 1.31x | - | 1.44x | 4 | $63,500,000 | 6.8% | 4.4897% | 121 | 1.34x | 70.9% | 59.3% |
| 1.45x | - | 1.49x | 2 | $21,225,000 | 2.3% | 4.0956% | 120 | 1.48x | 64.6% | 58.8% |
| 1.50x | - | 1.74x | 3 | $64,280,000 | 6.9% | 3.9329% | 121 | 1.66x | 63.9% | 59.3% |
| 1.75x | - | 2.49x | 12 | $254,750,000 | 27.3% | 3.9974% | 111 | 2.13x | 62.1% | 61.5% |
| 2.50x | - | 3.49x | 6 | $151,358,108 | 16.2% | 3.9841% | 89 | 2.99x | 48.1% | 48.1% |
| 3.50x | - | 8.42x | 10 | $379,350,000 | 40.6% | 3.3779% | 98 | 4.36x | 37.9% | 37.9% |
| Total/Weighted Average | 37 | $934,463,108 | 100.0% | 3.7750% | 104 | 3.07x | 50.8% | 49.4% | ||
| Original Terms to Maturity or ARD(1)(2)(3)(6) | ||||||||||
| Original Terms to Maturity or ARD | Number of Mortgage Loans | Aggregate Cut-off Date Balance | % of Initial Outstanding Pool Balance | Weighted Averages | ||||||
| Mortgage Rate | Stated Remaining Term (Mos.) | U/W NCF DSCR(4) | Cut-off Date LTV(5) | Maturity Date or ARD LTV(5) | ||||||
| 59 | - | 59 | 2 | $33,750,000 | 3.6% | 3.5220% | 56 | 3.87x | 31.3% | 31.3% |
| 60 | - | 61 | 3 | $136,500,000 | 14.6% | 4.4722% | 59 | 3.04x | 46.4% | 46.4% |
| 77 | - | 77 | 1 | $70,000,000 | 7.5% | 3.5500% | 75 | 3.57x | 39.6% | 39.6% |
| 120 | - | 121 | 31 | $694,213,108 | 74.3% | 3.6729% | 118 | 2.99x | 53.7% | 51.8% |
| Total/Weighted Average | 37 | $934,463,108 | 100.0% | 3.7750% | 104 | 3.07x | 50.8% | 49.4% | ||
| Distribution of Remaining Terms to Maturity or ARD(1)(2)(3)(6) | ||||||||||
| Range of Remaining Terms to Maturity or ARD | Number of Mortgage Loans | Aggregate Cut-off Date Balance | % of Initial Outstanding Pool Balance | Weighted Averages | ||||||
| Mortgage Rate | Stated Remaining Term (Mos.) | U/W NCF DSCR(4) | Cut-off Date LTV(5) | Maturity Date or ARD LTV(5) | ||||||
| 55 | - | 56 | 4 | $95,250,000 | 10.2% | 4.0127% | 56 | 3.33x | 44.7% | 44.7% |
| 61 | - | 61 | 1 | $75,000,000 | 8.0% | 4.6282% | 61 | 3.04x | 41.9% | 41.9% |
| 75 | - | 75 | 1 | $70,000,000 | 7.5% | 3.5500% | 75 | 3.57x | 39.6% | 39.6% |
| 113 | - | 121 | 31 | $694,213,108 | 74.3% | 3.6729% | 118 | 2.99x | 53.7% | 51.8% |
| Total/Weighted Average | 37 | $934,463,108 | 100.0% | 3.7750% | 104 | 3.07x | 50.8% | 49.4% | ||
| Distribution of Underwritten NOI Debt Yields(1)(2)(3)(4) | ||||||||||
| Range of Underwritten NOI Debt Yields | Number of Mortgage Loans | Aggregate Cut-off Date Balance | % of Initial Outstanding Pool Balance | Weighted Averages | ||||||
| Mortgage Rate | Stated Remaining Term (Mos.) | U/W NCF DSCR(4) | Cut-off Date LTV(5) | Maturity Date or ARD LTV(5) | ||||||
| 7.1% | - | 8.9% | 12 | $222,020,000 | 23.8% | 3.8920% | 119 | 1.93x | 65.6% | 63.6% |
| 9.0% | - | 9.9% | 7 | $177,505,000 | 19.0% | 3.8781% | 119 | 2.07x | 61.7% | 57.6% |
| 10.0% | - | 12.4% | 7 | $139,438,108 | 14.9% | 3.7195% | 100 | 3.05x | 49.1% | 48.0% |
| 12.5% | - | 14.9% | 7 | $214,250,000 | 22.9% | 3.5152% | 85 | 3.70x | 39.1% | 39.1% |
| 15.0% | - | 28.3% | 4 | $181,250,000 | 19.4% | 3.8806% | 93 | 4.74x | 37.1% | 37.1% |
| Total/Weighted Average | 37 | $934,463,108 | 100.0% | 3.7750% | 104 | 3.07x | 50.8% | 49.4% | ||
THE INFORMATION IN THIS STRUCTURAL AND COLLATERAL TERM SHEET IS NOT COMPLETE AND MAY BE AMENDED PRIOR TO THE TIME OF SALE. THIS TERM SHEET IS NOT AN OFFER TO SELL THESE SECURITIES AND IT IS NOT A SOLICITATION OF AN OFFER TO BUY THESE SECURITIES IN ANY JURISDICTION WHERE THE OFFER OR SALE IS NOT PERMITTED.
15
Benchmark 2020-B18 Mortgage Trust
|
| OVERVIEW OF MORTGAGE POOL CHARACTERISTICS |
| Amortization Types(1)(2)(3) | ||||||||
| Amortization Type | Number of Mortgage Loans | Aggregate Cut-off Date Balance | % of Initial Outstanding Pool Balance | Weighted Averages | ||||
| Mortgage Rate | Stated Term | U/W NCF DSCR(4) | Cut-off Date LTV(5) | Maturity Date or ARD LTV(5) | ||||
| Interest Only | 25 | $649,228,108 | 69.5% | 3.7250% | 97 | 3.35x | 46.9% | 46.9% |
| Interest Only, ARD | 2 | $140,000,000 | 15.0% | 3.5768% | 118 | 3.42x | 53.0% | 53.0% |
| Interest Only, then Amortizing | 8 | $100,605,000 | 10.8% | 4.3653% | 120 | 1.43x | 67.7% | 57.9% |
| Amortizing, then Interest Only | 1 | $38,000,000 | 4.1% | 3.7500% | 121 | 1.67x | 61.3% | 55.4% |
| Amortizing Balloon | 1 | $6,630,000 | 0.7% | 4.0400% | 120 | 1.76x | 63.8% | 50.7% |
| Total/Weighted Average | 37 | $934,463,108 | 100.0% | 3.7750% | 104 | 3.07x | 50.8% | 49.4% |
Footnotes:
| (1) | The U/W NCF DSCR, Cut-off Date LTV Ratio, Maturity Date or ARD LTV, Underwritten NOI Debt Yield and Cut-off Date Balance per # of NRA/Units/Rooms calculations include any related pari passu companion loan(s) and exclude any related subordinate companion loan(s) and/or mezzanine loan(s). |
| (2) | The BX Industrial Portfolio mortgage loan is part of a whole loan with an aggregate principal balance as of the Cut-off Date of approximately $649.428 million that is split between (i) a 17-month floating rate loan with five, one-year extension options (the “BX Industrial Portfolio Floating Rate Loan”) with an aggregate Cut-off Date principal balance of approximately $99.428 million, and (ii) a 77-month fixed rate loan (the “BX Industrial Portfolio Fixed Rate Loan”) with an aggregate Cut-off Date principal balance of $550.0 million that is comprised of comprised of (A) a senior fixed rate loan (the “BX Industrial Portfolio Senior Fixed Rate Loan”), with an aggregate Cut-off Date principal balance of $322.4 million and (B) a subordinate fixed rate loan (the “BX Industrial Portfolio Subordinate Fixed Rate Loan”), with an aggregate Cut-off Date principal balance of $227.6 million. The BX Industrial Portfolio Senior Fixed Rate Loan is senior to the BX Industrial Portfolio Subordinate Fixed Rate Loan and the BX Industrial Portfolio mortgage loan is comprised of a portion of the BX Industrial Portfolio Senior Fixed Rate Loan. The interest rate on the BX Industrial Portfolio Floating Rate Loan is LIBOR (subject to a floor of 0.000%) plus a spread of 1.450%. The BX Industrial Portfolio Fixed Rate Loan and the BX Industrial Portfolio Floating Rate Loan are pari passu, provided that voluntary prepayments are applied first to the BX Industrial Portfolio Floating Rate Loan until paid in full, and then to the BX Industrial Portfolio Fixed Rate Loan. The financial information presented in the tables above reflects the BX Industrial Portfolio Senior Fixed Rate Loan and approximately $58.283 million of the Cut-off Date principal balance of the BX Industrial Portfolio Floating Rate Loan, and excludes the remaining approximately $41.145 million of the Cut-off Date principal balance of the BX Industrial Portfolio Floating Rate Loan and the BX Industrial Portfolio Subordinate Fixed Rate Loan. For purposes of all calculations herein, LIBOR is assumed to be 0.500%. |
| (3) | With respect to Chase Center Tower I mortgage loan and Chase Center Tower II mortgage loan (collectively, the “Chase Center Tower mortgage loans”), the mortgage loans are cross-collateralized and cross-defaulted. As such the calculations are based on the aggregate Cut-off Date Balance, Maturity or ARD Balance, U/W NOI, U/W NCF and Debt Services of these loans. |
| (4) | With respect to the 968-970 Gates Ave mortgage loan (0.7%) the U/W NCF DSCR and U/W NOI Debt Yield is calculated based on the Cut-off Date Balance net a holdback reserve. |
| (5) | With respect to 7 mortgage loans (29.2%) (including Moffett Towers Buildings A, B & C, MGM Grand & Mandalay Bay, 280 North Bernardo, 420 Taylor Street, Chase Center Towers and Bellagio Hotel and Casino), the Cut-off Date LTV and Maturity Date or ARD LTV have been calculated using a value other than the “As Is” appraised values. For additional information please see the footnotes to Annex A-1 in the Preliminary Prospectus. |
| (6) | With respect to 6 mortgage loans (19.4%), under the terms of the related mortgage loan documents, the first payment date is in September 2020. However, due to the fact that the related mortgage loan seller will contribute an Initial Interest Deposit Amount to the Issuing Entity on the Closing Date to cover an amount that represents one-month’s interest that would have accrued with respect to the mortgage loan at the related Net Mortgage Rate with respect to an August 2020 payment date, such Mortgage Loan is being treated as having a First Due Date in August 2020, and the Original Term to Maturity Date or ARD, Remaining Term to Maturity Date or ARD and Loan Seasoning are shown in the Annex A-1 to reflect this. |
| (7) | Reflects allocated loan amount for properties securing multi-property Mortgage Loans. |
THE INFORMATION IN THIS STRUCTURAL AND COLLATERAL TERM SHEET IS NOT COMPLETE AND MAY BE AMENDED PRIOR TO THE TIME OF SALE. THIS TERM SHEET IS NOT AN OFFER TO SELL THESE SECURITIES AND IT IS NOT A SOLICITATION OF AN OFFER TO BUY THESE SECURITIES IN ANY JURISDICTION WHERE THE OFFER OR SALE IS NOT PERMITTED.
16
Benchmark 2020-B18 Mortgage Trust
|
| STRUCTURE OVERVIEW |
| Allocation between VRR Interest and the Non-VRR Certificates: | The aggregate amount available for distribution to holders of the Pooled Certificates and the VRR Interest on each Distribution Date will be: (i) the gross amount of interest, principal, yield maintenance charges and prepayment premiums collected with respect to the Mortgage Loans in the applicable one-month collection period (other than any excess interest accrued after the related anticipated repayment date on any mortgage loan with an anticipated repayment date), net of specified expenses of the issuing entity, including fees payable therefrom to, and losses, liabilities, costs and expenses reimbursable or indemnifiable therefrom to, the Master Servicer, the Special Servicer, the Certificate Administrator, the Trustee, the Operating Advisor, the Asset Representations Reviewer and CREFC®; and (ii) allocated to amounts available for distribution to the owners of the VRR Interest, on the one hand, and amounts available for distribution to the holders of the remaining Pooled Certificates (the “Non-VRR Certificates”), on the other hand. On each Distribution Date, the portion of such pooled aggregate available funds allocable to: (a) the VRR Interest will be the product of such pooled aggregate available funds multiplied by a fraction, expressed as a percentage, the numerator of which is the initial VRR Interest Balance, and the denominator of which is the sum of the aggregate initial Certificate Balances of the Pooled Principal Balance Certificates and the initial VRR Interest Balance of the VRR Interest (the “VRR Percentage”); and (b) the Non-VRR Certificates will at all times be the product of such pooled aggregate available funds multiplied by the difference between 100% and the VRR Percentage (such difference, the “Non-VRR Percentage”). See “Credit Risk Retention” and “Description of the Certificates” in the Preliminary Prospectus. |
| Principal Payments: | Payments in respect of the Non-VRR Percentage of principal on the Non-VRR Certificates will be distributed, first, to the Class A-SB certificates, until the Certificate Balance of such class is reduced to the planned principal balance for the related Distribution Date set forth on Annex G to the Preliminary Prospectus, then, to the Class A-1, Class A-2, Class A-3, Class A-4, Class A-5, Class A-SB, Class A-M, Class B, Class C, Class D, Class E, Class F, Class G-RR and Class H-RR certificates, in that order, until the Certificate Balance of each such class is reduced to zero. Notwithstanding the foregoing, if the total Certificate Balance of the Class A-M, Class B, Class C, Class D, Class E, Class F, Class G-RR and Class H-RR certificates have been reduced to zero as a result of loss allocation, payments in respect of principal of the certificates will be distributed, first, to the Class A-1, Class A-2, Class A-3, Class A-SB, Class A-4 and Class A-5 certificates, on a pro rata basis, based on the Certificate Balance of each such class, then, to the extent of any recoveries on realized losses, to the Class A-M, Class B, Class C, Class D, Class E, Class F, Class G-RR and Class H-RR certificates, in that order, in each case until the Certificate Balance of each such class is reduced to zero (or previously allocated realized losses have been fully reimbursed).
Each class of Class X Certificates will not be entitled to receive distributions of principal; however, (i) the notional amount of the Class X-A certificates will be reduced by the aggregate amount of principal distributions and realized losses allocated to the Class A-1, Class A-2, Class A-3, Class A-SB, Class A-4, Class A-5 and Class A-M certificates; (ii) the notional amount of the Class X-B certificates will be reduced by the amount of principal distributions and realized losses allocated to the Class B certificates; (iii) the notional amount of the Class X-D certificates will be reduced by the aggregate amount of principal distributions and realized losses allocated to the Class D and Class E certificates; and (iv) the notional amount of the Class X-F certificates will be reduced by the principal distributions and realized losses allocated to the Class F certificates.
The holders of the Loan-Specific Certificates and the AGN-VRR Interest will only be entitled to distributions from amounts paid or advanced on and allocated to the Trust Subordinate Companion Loan in accordance with the PSA and co-lender agreement relating to the Agellan Portfolio Whole Loan and no class of Pooled Certificates will be entitled to distributions paid or advanced on and allocable to the Trust Subordinate Companion Loan.
|
Interest Payments: | On each Distribution Date, interest accrued for each class of Non-VRR Certificates at the applicable pass-through rate will be distributed in the following order of priority, to the extent of the Non-VRR Percentage of the pooled aggregate available funds (exclusive of any portion thereof that represents the Non-VRR Percentage of any yield maintenance charges and prepayment premiums): first, to the Class A-1, Class A-2, Class A-3, Class A-SB, Class A-4, Class A-5, Class X-A, Class X-B, Class X-D and Class X-F certificates, on a pro rata basis, based on the accrued and unpaid interest on each such class and then, to the Class A-M, Class B, Class C, Class D, Class E, Class F, Class G-RR and Class H-RR certificates, in that order, in each case until the interest payable to each such class is paid in full. |
THE INFORMATION IN THIS STRUCTURAL AND COLLATERAL TERM SHEET IS NOT COMPLETE AND MAY BE AMENDED PRIOR TO THE TIME OF SALE. THIS TERM SHEET IS NOT AN OFFER TO SELL THESE SECURITIES AND IT IS NOT A SOLICITATION OF AN OFFER TO BUY THESE SECURITIES IN ANY JURISDICTION WHERE THE OFFER OR SALE IS NOT PERMITTED.
17
Benchmark 2020-B18 Mortgage Trust
|
| STRUCTURE OVERVIEW |
The pass-through rates applicable to the Class A-1, Class A-2, Class A-3, Class A-SB, Class A-4, Class A-5, Class A-M, Class B, Class C, Class D, Class E, Class F, Class G-RR and Class H-RR certificates for each Distribution Date will equal one of: (i) a fixed per annum rate, (ii) the WAC Rate, (iii) a rate equal to the lesser of a specified pass-through rate and the WAC Rate or (iv) the WAC Rate less a specified rate.
As further described in the Preliminary Prospectus, the pass-through rates applicable to the Class X Certificates for each Distribution Date will generally be equal to the excess of (i) the WAC Rate over (ii) (A) with respect to the Class X-A certificates, the weighted average of the pass-through rates of the Class A-1, Class A-2, Class A-3, Class A-SB, Class A-4, Class A-5 and Class A-M certificates (weighted based on their respective Certificate Balances outstanding immediately prior to that Distribution Date), (B) with respect to the Class X-B certificates, the pass-through rate of the Class B certificates, (C) with respect to the Class X-D certificates, the weighted average of the pass-through rates of the Class D and Class E certificates (weighted based on their respective Certificate Balances outstanding immediately prior to that Distribution Date) and (D) with respect to the Class X-F certificates, the pass-through rate of the Class F certificates.
No class of Pooled Certificates will be entitled to distributions paid or advanced on and allocable to the Trust Subordinate Companion Loan. The holders of the Loan-Specific Certificates and the AGN-VRR Interest will only be entitled to distributions from amounts paid or advanced on and allocated to the Trust Subordinate Companion Loan in accordance with the PSA and co-lender agreement relating to the Agellan Portfolio Whole Loan.
| |
| Prepayment Interest Shortfalls: | Prepayment interest shortfalls will be allocated pro rata based on interest entitlements, in reduction of the interest otherwise payable with respect to each of the interest-bearing classes of certificates. |
| Loss Allocation: | The Non-VRR Percentage of losses on the Mortgage Loans will be allocated to each class of Non-VRR Certificates entitled to principal in reverse alphabetical order starting with Class H-RR certificates through and including Class A-M certificates and then to Class A-1, Class A-2, Class A-3, Class A-SB, Class A-4 and Class A-5 certificates on a pro rata basis based on the Certificate Balance of each such class. The notional amount of any class of Class X Certificates will be reduced by the aggregate amount of realized losses allocated to the class(es) of certificates that are component(s) of the notional amount of such class of Class X Certificates.
Losses realized on the Trust Subordinate Companion Loan generally will be allocated to the Loan-Specific Principal Balance Certificates and the AGN-VRR Interest. The notional amount of Class AGN-X certificates will be reduced by the aggregate amount of realized losses allocated to the Class AGN-D, Class AGN-E and Class AGN-F certificates.
|
Prepayment Premiums:
| A percentage of the Non-VRR Percentage of all prepayment premiums (either fixed prepayment premiums or yield maintenance amounts) collected on the Mortgage Loans will be allocated to each of the Class A-1, Class A-2, Class A-3, Class A-SB, Class A-4, Class A-5, Class A-M, Class B, Class C, Class D and Class E certificates (the “YM P&I Certificates”) then entitled to principal distributions, which percentage will be equal to the product of (a) a fraction, not greater than one, the numerator of which is the amount of principal distributed to such class on such Distribution Date and the denominator of which is the total amount of principal distributed to the holders of the Class A-1, Class A-2, Class A-3, Class A-SB, Class A-4, Class A-5, Class A-M, Class B, Class C, Class D, Class E, Class F, Class G-RR and Class H-RR certificates on such Distribution Date, and the Base Interest Fraction.
The “Base Interest Fraction” for any principal prepayment on any Mortgage Loan and for:
(A) any of the Class A-1 through Class E certificates with a Pass-Through Rate equal to either the WAC Rate or the WAC Rate less a specified rate, will be a fraction (not greater than one)(a) whose numerator is the greater of zero and the amount, if any, by which (i) the Pass-Through Rate on such class of certificates exceeds (ii) the yield rate (as provided by the master servicer) used in calculating the prepayment premium or yield maintenance charge, as applicable, with respect to such principal prepayment and (b) whose denominator is the amount, if any, by which (i) the Net Mortgage Rate on such Mortgage Loan during the related interest accrual period exceeds (ii) the yield rate (as provided by the master servicer) used in calculating the prepayment premium or yield maintenance charge, as applicable, with respect to such principal prepayment; provided, however, that if such yield rate is greater than or equal to the Net Mortgage Rate on such Mortgage Loan during the related interest accrual period, then the respective Base Interest Fraction will be zero; provided, further, that if such yield rate is greater |
THE INFORMATION IN THIS STRUCTURAL AND COLLATERAL TERM SHEET IS NOT COMPLETE AND MAY BE AMENDED PRIOR TO THE TIME OF SALE. THIS TERM SHEET IS NOT AN OFFER TO SELL THESE SECURITIES AND IT IS NOT A SOLICITATION OF AN OFFER TO BUY THESE SECURITIES IN ANY JURISDICTION WHERE THE OFFER OR SALE IS NOT PERMITTED.
18
Benchmark 2020-B18 Mortgage Trust
|
| STRUCTURE OVERVIEW |
| than or equal to the Net Mortgage Rate on such Mortgage Loan during the related interest accrual period, but less than the Pass-Through Rate described in clause (a)(i) above, then the respective Base Interest Fraction will be one; and | |
| (B) any of the Class A-1 through Class E certificates with a Pass-Through Rate equal to a fixed per annum rate, will be a fraction (not greater than one)(a) whose numerator is the greater of zero and the amount, if any, by which (i) the Pass-Through Rate on such class of certificates exceeds (ii) the yield rate (as provided by the master servicer) used in calculating the prepayment premium or yield maintenance charge, as applicable, with respect to such principal prepayment and (b) whose denominator is the amount, if any, by which (i) the Mortgage Rate on such Mortgage Loan (without regard to any increase in the interest rate of any ARD Loan after the related Anticipated Repayment Date, and net of the Administrative Cost Rate) during the related interest accrual period multiplied by 365/360 exceeds (ii) the yield rate (as provided by the master servicer) used in calculating the prepayment premium or yield maintenance charge, as applicable, with respect to such principal prepayment; provided, however, that if such yield rate is greater than or equal to the amount set forth in clause (b)(i) above, then the respective Base Interest Fraction will be zero; provided, further, that if such yield rate is greater than or equal to the amount set forth in clause (b)(i) above, but less than the Pass-Through Rate described in clause (a)(i) above, then the respective Base Interest Fraction will be one. | |
The remaining percentage of the Non-VRR Percentage of prepayment premiums will be allocated to the Class X-A, Class X-B and Class X-D certificates in the manner described in the Preliminary Prospectus. In general, this formula provides for an increase in the percentage of prepayment premiums allocated to the YM P&I Certificates then entitled to principal distributions relative to the Class X-A, Class X-B and Class X-D certificates as Discount Rates decrease and a decrease in the percentage allocated to such classes as Discount Rates rise.
| |
| Whole Loans: | The mortgaged properties identified on Annex A-1 to the Preliminary Prospectus as Agellan Portfolio, Moffett Towers Buildings A, B & C, BX Industrial Portfolio, MGM Grand & Mandalay Bay, 1633 Broadway, 711 Fifth Avenue, 280 North Bernardo, 420 Taylor Street, 3000 Post Oak, Chase Center Tower I, Chase Center Tower II, Brass Professional Center, Apollo Education Group HQ Campus, Bellagio Hotel and Casino, Southcenter Mall and Kings Plaza each secure both a mortgage loan to be included in the trust fund and one or more other companion loans that will not be included in the trust fund, each of which will be pari passu or subordinate in right of payment with the mortgage loan included in the trust fund. We refer to each such group of related loans as a “whole loan”.
As of the Closing Date, the pari passu companion loans and the subordinate companion loans are expected to be held by the party identified in “—Companion Loan Summary” above and the table titled “Whole Loan Control Notes and Non-Control Notes” in “Description of the Mortgage Pool—The Whole Loans—General” in the Preliminary Prospectus.
|
| Control Rights and Directing Holder: | With respect to any Serviced Mortgage Loan and any related Serviced Companion Loan, the Directing Holder will generally be entitled to direct the Special Servicer to take, or refrain from taking, certain actions with respect to each Serviced Mortgage Loan and any related Serviced Companion Loans. Furthermore, the Directing Holder will also have the right to receive notice and consent to certain material actions that the Master Servicer and the Special Servicer proposes to take with respect to each Serviced Mortgage Loan and any related Serviced Companion Loans.
The “Directing Holder” will be: (i) with respect to each Serviced Mortgage Loan (other than the Agellan Portfolio Mortgage Loan and any Servicing Shift Mortgage Loan), the certificateholder (or its representative) selected by more than 50% of the Controlling Class, by Certificate Balance, as determined by the certificate registrar from time to time (the “Trust Directing Holder”); (ii) with respect to the Agellan Portfolio Whole Loan, (a) for so long as no Agellan Portfolio Control Appraisal Period exists, the certificateholder (or its representative) selected by more than 50% of the controlling class of the Loan-Specific Certificates and (b) for so long as an Agellan Portfolio Control Appraisal Period exists, the certificateholder selected by more than 50% of the Controlling Class, by Certificate Balance; and (iii) with respect to any Servicing Shift Mortgage Loan, the related Loan-Specific Directing Holder prior to the related Servicing Shift Securitization Date.
With respect to the 420 Taylor Street Mortgage Loan, the Trust Directing Holder will be the Directing Holder with respect to such Mortgage Loan, provided, however, if greater than $38,000,000 aggregate principal balance of the related pari passu companion loans are included together in a future securitization, the 420 Taylor Street Mortgage Loan is expected to become |
THE INFORMATION IN THIS STRUCTURAL AND COLLATERAL TERM SHEET IS NOT COMPLETE AND MAY BE AMENDED PRIOR TO THE TIME OF SALE. THIS TERM SHEET IS NOT AN OFFER TO SELL THESE SECURITIES AND IT IS NOT A SOLICITATION OF AN OFFER TO BUY THESE SECURITIES IN ANY JURISDICTION WHERE THE OFFER OR SALE IS NOT PERMITTED.
19
Benchmark 2020-B18 Mortgage Trust
|
| STRUCTURE OVERVIEW |
a Non-Serviced Mortgage Loan, the “controlling note” under the related co-lender agreement will be the note with the largest principal balance in such other securitization and the directing holder under the related pooling and servicing agreement for such other securitization will become the “directing holder” for the 420 Taylor Street Mortgage Loan.
It is expected that Eightfold Real Estate Capital Fund V, L.P. or its affiliate will be the initial Directing Holder with respect to each Serviced Mortgage Loan (other than the Agellan Portfolio Mortgage Loan) and any related Serviced Companion Loans.
An “Agellan Portfolio Control Appraisal Period” will exist with respect to the Agellan Portfolio Whole Loan, if and for so long as the initial principal balance of the Trust Subordinate Companion Loan (taking into account any appraisal reduction amounts or realized losses allocated to the Trust Subordinate Companion Loan) is less than 25% of the initial principal balance of the Trust Subordinate Companion Loan less any principal payment allocated to and received by the holder.
For a description of the directing holder for each Non-Serviced Whole Loan, see “Description of the Mortgage Pool—The Whole Loans” and “Pooling and Servicing Agreement—The Directing Holder” in the Preliminary Prospectus.
| |
| Control Eligible Pooled Certificates: | Class F, Class G-RR and Class H-RR certificates.
|
| Controlling Class: | The Controlling Class will be the most subordinate class of Control Eligible Certificates then outstanding that has an aggregate Certificate Balance, as notionally reduced by any appraisal reduction amounts and any collateral deficiency amounts allocable to such class, equal to at least 25% of the initial Certificate Balance of such class; provided that if at any time the Certificate Balances of all Control Eligible Certificates, as notionally reduced by any appraisal reduction amounts (but without regard to any collateral deficiency amounts) allocable to such classes, have been reduced to zero, then the “Controlling Class” will be the most subordinate class of Control Eligible Certificates that has an aggregate principal balance greater than zero; provided, further that if at any time the Certificate Balances of the Class A-1, Class A-2, Class A-3, Class A-SB, Class A-4, Class A-5, Class A-M, Class B, Class C, Class D and Class E certificates have been reduced to zero as a result of the allocation of principal payments on the Mortgage Loans, then the Controlling Class will be the most subordinate class of Control Eligible Certificates that has an aggregate Certificate Balance greater than zero (without regard to the application of appraisal reduction amounts or any collateral deficiency amounts to notionally reduce the Certificate Balance of such class).
The Controlling Class as of the Closing Date will be the Class H-RR certificates.
|
| Appraised-Out Class: | Any class of Control Eligible Certificates that has been determined, as a result of appraisal reductions amounts and collateral deficiency amounts allocable to such class, to no longer be the Controlling Class.
|
| Remedies Available to Holders of an Appraised-Out Class: | Holders of the majority of any class of Control Eligible Certificates that is determined at any time of determination to no longer be the Controlling Class as a result of an allocation of appraisal reduction amounts and collateral deficiency amounts in respect of such class will have the right, at their sole expense, to require the Special Servicer to order a second appraisal for any Serviced Mortgage Loan for which an appraisal reduction event has occurred or as to which there exists a collateral deficiency amount. Upon receipt of the second appraisal, the Special Servicer will be required to send the appraisal to the Master Servicer, who will be required to recalculate the appraisal reduction amount or collateral deficiency amount based on the second appraisal, and if required by such recalculation, the Special Servicer will reinstate the Appraised-Out Class as the Controlling Class. The Holders of an Appraised-Out Class requesting a second appraisal will not be entitled to exercise any rights of the Controlling Class until such time, if any, as the class is reinstated as the Controlling Class.
|
Control Termination Event: | Will occur (a) with respect to any Mortgage Loan (other than the Agellan Portfolio Mortgage Loan or any Servicing Shift Mortgage Loan) or Serviced Whole Loan (other than the Agellan Portfolio Whole Loan or any Servicing Shift Mortgage Loan), when the Class F certificates have a Certificate Balance (taking into account the application of any appraisal reduction amounts and collateral deficiency amounts to notionally reduce the Certificate Balance of such class) of less than 25% of the initial Certificate Balance of that class; and |
THE INFORMATION IN THIS STRUCTURAL AND COLLATERAL TERM SHEET IS NOT COMPLETE AND MAY BE AMENDED PRIOR TO THE TIME OF SALE. THIS TERM SHEET IS NOT AN OFFER TO SELL THESE SECURITIES AND IT IS NOT A SOLICITATION OF AN OFFER TO BUY THESE SECURITIES IN ANY JURISDICTION WHERE THE OFFER OR SALE IS NOT PERMITTED.
20
Benchmark 2020-B18 Mortgage Trust
|
| STRUCTURE OVERVIEW |
(b) with respect to the Agellan Portfolio Whole Loan, when both an Agellan Portfolio Control Appraisal Period has occurred and is continuing, and the events described in clause (a) above are occurring.
With respect to Excluded Loans related to the Directing Holder, a Control Termination Event will be deemed to exist.
Upon the occurrence and the continuance of a Control Termination Event, the Directing Holder will no longer have any control rights. The Directing Holder will no longer have the right to direct certain actions of the Special Servicer and will no longer have consent rights with respect to certain material actions that the Master Servicer or Special Servicer proposes to take with respect to a Serviced Mortgage Loan and any related Serviced Companion Loans.
Upon the occurrence and continuation of a Control Termination Event, the Directing Holder will retain non-binding consultation rights with respect to certain material actions that the Special Servicer proposes to take with respect to a Serviced Mortgage Loan and any related Serviced Companion Loans. Such consultation rights will continue until the occurrence of a Consultation Termination Event. | |
| Consultation Termination Event: | Will occur (a) with respect to any Mortgage Loan (other than the Agellan Portfolio Mortgage Loan and any Servicing Shift Loan) or Serviced Whole Loan (other than the Agellan Portfolio Whole Loan and any Servicing Shift Loan), when there is no class of Control Eligible Certificates that has a then-outstanding Certificate Balance (without regard to the application of any appraisal reduction amounts or collateral deficiency amounts) equal to at least 25% of the initial Certificate Balance of that class; and
(b) with respect to the Agellan Portfolio Whole Loan, when both an Agellan Portfolio Control Appraisal Period has occurred and is continuing, and the events in clause (a) above are occurring.
With respect to Excluded Loans related to the Directing Holder, a Consultation Termination Event will be deemed to exist.
Upon the occurrence and continuance of a Consultation Termination Event, the Directing Holder will have no rights under the PSA other than those rights that all Certificateholders have.
|
| Risk Retention Consultation Party: | The risk retention consultation parties will have certain non-binding consultation rights with respect to certain material servicing actions. Each holder of the VRR Interest, which is expected to be transferred on the Closing Date by GACC to Deutsche Bank AG, New York Branch (“DBNY”), JPMCB, Goldman Sachs Bank USA (“GS Bank”) and CREFI, will be entitled to appoint a risk retention consultation party with respect to the pooled securitization transaction, and each of DBNY, JPMCB, GSMC and CREFI are expected to be appointed as the initial risk retention consultation parties. JPMCB will be entitled to appoint, and is expected to be, the risk retention consultation party with respect to the securitization relating to the Loan-Specific Certificates. |
| Appointment and Replacement of Special Servicer: | The Directing Holder will appoint the initial Special Servicer with respect to each Serviced Mortgage Loan and any related Serviced Companion Loans as of the Closing Date. Prior to the occurrence and continuance of a Control Termination Event, the Directing Holder generally may replace the Special Servicer with respect to each Serviced Mortgage Loan and any related Serviced Companion Loans with or without cause at any time.
Upon the occurrence and during the continuance of a Control Termination Event, the Directing Holder will no longer have the right to replace the Special Servicer and such replacement (other than with respect to the Non-Serviced Whole Loans) will occur based on a vote of holders of all voting eligible classes of certificates as described below. See “Description of the Mortgage Pool—The Whole Loans” and “Pooling and Servicing Agreement” in the Preliminary Prospectus for a description of the special servicer appointment and replacement rights with respect to Non-Serviced Whole Loans.
|
| Replacement of Special Servicer by Vote of Certificateholders: | Other than with respect to Non-Serviced Whole Loans and the Agellan Portfolio Whole Loan, if a Control Termination Event has occurred and is continuing, upon (i) the written direction of holders of certificates evidencing not less than 25% of the voting rights of all classes of Pooled Principal Balance Certificates and the Class RR Certificates (taking into account the application |
THE INFORMATION IN THIS STRUCTURAL AND COLLATERAL TERM SHEET IS NOT COMPLETE AND MAY BE AMENDED PRIOR TO THE TIME OF SALE. THIS TERM SHEET IS NOT AN OFFER TO SELL THESE SECURITIES AND IT IS NOT A SOLICITATION OF AN OFFER TO BUY THESE SECURITIES IN ANY JURISDICTION WHERE THE OFFER OR SALE IS NOT PERMITTED.
21
Benchmark 2020-B18 Mortgage Trust
|
| STRUCTURE OVERVIEW |
of appraisal reduction amounts to notionally reduce the Certificate Balances of classes to which such appraisal reduction amounts are allocable) and requesting a vote to replace the Special Servicer with a replacement special servicer, (ii) payment by such requesting holders to the Certificate Administrator of all reasonable fees and expenses to be incurred by the Certificate Administrator in connection with administering such vote and (iii) delivery by such holders to the Certificate Administrator and Trustee of written confirmations from each Rating Agency that the appointment of the replacement Special Servicer will not result in a downgrade of the certificates, the Certificate Administrator will be required to promptly post notice of such request on the Certificate Administrator’s website and concurrently provide written notice of such request by mail to all Certificateholders of such request and conduct the solicitation of votes of all certificates in such regard. Upon the written direction (within 180 days) of (i) holders of Pooled Principal Balance Certificates and the Class RR Certificates evidencing at least 66 2/3% of a Certificateholder Quorum or (ii) holders of Pooled Principal Balance Certificates and the Class RR Certificates evidencing more than 50% of the aggregate voting rights of Pooled Principal Balance Certificates and the Class RR Certificates outstanding that has not been reduced to less than 25% of its initial Certificate Balance through the application of appraisal reduction amounts and realized losses), the Trustee will immediately replace the Special Servicer with the replacement Special Servicer (other than with respect to Non-Serviced Whole Loans).
“Certificateholder Quorum” means, in connection with any solicitation of votes in connection with the replacement of the Special Servicer as described above or the Asset Representations Reviewer as described below, the holders of certificates evidencing at least 50% of the aggregate voting rights (taking into account other than with respect to the termination of the Asset Representations Reviewer, the application of any appraisal reduction amounts to notionally reduce the Certificate Balance of the certificates) of all Pooled Principal Balance Certificates and the Class RR Certificates, on an aggregate basis.
At no time will holders of the Certificates be permitted to replace the special servicer without cause with respect to the Agellan Portfolio Whole Loan, other than certain of the Loan-Specific Certificates for so long as they are the Directing Holder of the Agellan Portfolio Whole Loan.
In addition, if at any time the Operating Advisor determines, in its sole discretion exercised in good faith, that (1) the Special Servicer is not performing its duties as required under the PSA or is otherwise not acting in accordance with the Servicing Standard and (2) the replacement of the Special Servicer would be in the best interest of the Certificateholders as a collective whole, then the Operating Advisor will have the right to recommend the replacement of the Special Servicer. The Operating Advisor’s recommendation to replace the Special Servicer (other than with respect Non-Serviced Whole Loans and the Agellan Portfolio Whole Loan) must be confirmed by a majority of a quorum of Certificateholders (which, for this purpose, is the holders of Certificates that (i) evidence at least 20% of the Voting Rights (taking into account the application of any appraisal reduction amounts to notionally reduce the respective Certificate Balances) of all Pooled Principal Balance Certificates and the Class RR Certificates on an aggregate basis, and (ii) consist of at least three Certificateholders or Certificate Owners that are not risk retention affiliated with each other) within 180 days from the time such recommendation is posted to the Certificate Administrator website and is subject to the receipt of written confirmations from each Rating Agency that the appointment of the replacement Special Servicer will not result in a downgrade of the certificates.
See “Description of the Mortgage Pool—The Whole Loans” and “Pooling and Servicing Agreement” in the Preliminary Prospectus for a description of the special servicer appointment and replacement rights with respect to Non-Serviced Whole Loans. | |
| Cap on Workout and Liquidation Fees: | The workout fees and liquidation fees payable to a Special Servicer under the PSA will be an amount equal to the lesser of: (1) 1.0% of each collection of interest and principal following a workout or liquidation, subject to a minimum of $25,000 and (2) $1,000,000 per workout or liquidation. All Modification Fees actually paid to the Special Servicer in connection with a workout or liquidation or in connection with any prior workout or partial liquidation that occurred within the prior 18 months will be deducted from the total workout fee (only after receipt by the Special Servicer of workout fees of $25,000) and/or liquidation fees payable (other than Modification Fees earned while the Mortgage Loan was not in special servicing). In addition, the total amount of workout and liquidation fees actually payable by the Trust under the PSA will be capped in the aggregate at $1,000,000 for each related Mortgage Loan. If a new special servicer begins servicing the related Mortgage Loan, all amounts paid to the prior special servicer will be disregarded for purposes of calculating the cap. |
THE INFORMATION IN THIS STRUCTURAL AND COLLATERAL TERM SHEET IS NOT COMPLETE AND MAY BE AMENDED PRIOR TO THE TIME OF SALE. THIS TERM SHEET IS NOT AN OFFER TO SELL THESE SECURITIES AND IT IS NOT A SOLICITATION OF AN OFFER TO BUY THESE SECURITIES IN ANY JURISDICTION WHERE THE OFFER OR SALE IS NOT PERMITTED.
22
Benchmark 2020-B18 Mortgage Trust
|
| STRUCTURE OVERVIEW |
| Special Servicer Compensation: | The special servicing fee will equal 0.25% per annum of the stated principal balance of the related specially serviced loan or REO property. The Special Servicer and its affiliates will be prohibited from receiving or retaining any compensation or any other remuneration under the PSA (including, without limitation, in the form of commissions, brokerage fees, rebates, or as a result of any other fee-sharing arrangement) from any person (including, without limitation, the issuing entity, any borrower, any manager, any guarantor or indemnitor in respect of a Serviced Mortgage Loan and any related Serviced Companion Loans, and any purchaser of any Serviced Mortgage Loan and any related Serviced Companion Loan or REO Property) in connection with the disposition, workout or foreclosure of any Serviced Mortgage Loan and any related Serviced Companion Loans, the management or disposition of any REO Property, or the performance of any other special servicing duties under the PSA, other than as expressly permitted in the PSA and other than commercially reasonable treasury management fees, banking fees, property condition report fees, customary title agent fees and insurance commissions or fees received or retained by the Special Servicer or any of its Affiliates in connection with any services performed by such party with respect to any Mortgage Loan, Serviced Whole Loan or REO Property. Subject to certain limited exceptions, the Special Servicer will also be required to report any compensation or other remuneration the Special Servicer or its affiliates have received from any person and such information will be disclosed in the Certificateholders’ monthly distribution date statement.
|
| Operating Advisor: | With respect to the Serviced Mortgage Loans and any related Serviced Companion Loans the Operating Advisor will have access to any final asset status report and all information available with respect to the transaction on the Certificate Administrator’s website and will have certain monitoring responsibilities on behalf of the entire trust. After the occurrence and during the continuance of an Operating Advisor Consultation Event, the Operating Advisor will have consultation rights with respect to certain major decisions.
The Operating Advisor will be subject to termination if holders of at least 15% of the aggregate voting rights of the Pooled Certificates (in connection with termination and replacement relating to the Mortgage Loans) vote to terminate and replace the Operating Advisor and such vote is approved by holders of more than 50% of the applicable voting rights that exercise their right to vote (in the case of each of such vote and approval, taking into account Realized Losses and the application of any appraisal reduction amounts to notionally reduce the Certificate Balance of the certificates), provided that holders of at least 50% of the applicable voting rights have exercised their right to vote. The holders initiating such vote will be responsible for the fees and expenses in connection with the vote and replacement.
An “Operating Advisor Consultation Event” will occur upon the earlier of (i) the aggregate Certificate Balances of the HRR Certificates (taking into account the application of any appraisal reduction amounts and any collateral deficiency amounts to notionally reduce the Certificate Balance of any such class of certificates) is 25% or less of the initial aggregate Certificate Balances of the HRR Certificates and (ii) a Control Termination Event has occurred and is continuing (or a Control Termination Event would occur and be continuing if not for the last proviso in the definition of Control Termination Event).
The Operating Advisor will not have consultation rights in respect of Non-Serviced Mortgage Loans.
|
| Asset Representations Reviewer: | The Asset Representations Reviewer will be required to review certain delinquent Mortgage Loans after a specified delinquency threshold has been exceeded and the required percentage of Certificateholders vote to direct a review of such delinquent Mortgage Loans. An asset review will occur when either (1) Mortgage Loans with an aggregate outstanding principal balance of 25% or more of the aggregate outstanding principal balance of all of the Mortgage Loans (including any REO loans (or a portion of any REO loan in the case of a whole loan)) held by the issuing entity as of the end of the applicable collection period are delinquent loans or (2)(A) prior to and including the second anniversary of the Closing Date, at least 10 Mortgage Loans are delinquent loans as of the end of the applicable collection period and the outstanding principal balance of such delinquent loans in the aggregate constitutes at least 15% of the aggregate outstanding principal balance of all of the Mortgage Loans (including any REO loans (or a portion of any REO loan in the case of a whole loan)) held by the issuing entity as of the end of the applicable collection period, or (B) after the second anniversary of the Closing Date, at least 15 Mortgage Loans are delinquent loans as of the end of the applicable collection period and the outstanding principal balance of such delinquent loans in the aggregate constitutes at least 20% of the aggregate outstanding principal balance of all of the Mortgage Loans (including any REO |
THE INFORMATION IN THIS STRUCTURAL AND COLLATERAL TERM SHEET IS NOT COMPLETE AND MAY BE AMENDED PRIOR TO THE TIME OF SALE. THIS TERM SHEET IS NOT AN OFFER TO SELL THESE SECURITIES AND IT IS NOT A SOLICITATION OF AN OFFER TO BUY THESE SECURITIES IN ANY JURISDICTION WHERE THE OFFER OR SALE IS NOT PERMITTED.
23
Benchmark 2020-B18 Mortgage Trust
|
| STRUCTURE OVERVIEW |
loans (or a portion of any REO loan in the case of a whole loan)) held by the issuing entity as of the end of the applicable collection period.
The Asset Representations Reviewer may be terminated and replaced without cause. Upon (i) the written direction of Certificateholders evidencing not less than 25% of the voting rights (taking into account Realized Losses, but without regard to the application of any appraisal reduction amounts to notionally reduce the Certificate Balance of the certificates) requesting a vote to terminate and replace the Asset Representations Reviewer with a proposed successor asset representations reviewer that is an eligible asset representations reviewer, and (ii) payment by such holders to the Certificate Administrator of the reasonable fees and expenses to be incurred by the Certificate Administrator in connection with administering such vote, the Certificate Administrator will promptly provide notice to all Certificateholders and the Asset Representations Reviewer of such request by posting such notice on its internet website, and by mailing such notice to all Certificateholders and the Asset Representations Reviewer. Upon the written direction of Certificateholders evidencing at least 75% of a Certificateholder Quorum, the Trustee will terminate all of the rights and obligations of the Asset Representations Reviewer under the PSA by written notice to the Asset Representations Reviewer, and the proposed successor Asset Representations Reviewer will be appointed. See “Pooling and Servicing Agreement—The Asset Representations Reviewer” in the Preliminary Prospectus. | |
| Dispute Resolution Provisions: | Each Mortgage Loan Seller will be subject to the dispute resolution provisions set forth in the PSA to the extent those provisions are triggered with respect to any Mortgage Loan sold to the depositor by such Mortgage Loan Seller and such Mortgage Loan Seller will be obligated under the related mortgage loan purchase agreement to comply with all applicable provisions and to take part in any mediation or arbitration proceedings that may result.
Generally, in the event that a repurchase request as described in the Preliminary Prospectus is not “Resolved” within 180 days after the related Mortgage Loan Seller receives such Repurchase Request, then the enforcing servicer will be required to send a notice to the initial requesting Certificateholder (if any) indicating the enforcing servicer’s intended course of action with respect to the Repurchase Request. If (a) the enforcing servicer’s intended course of action with respect to the Repurchase Request does not involve pursuing further action to exercise rights against the related Mortgage Loan Seller with respect to the Repurchase Request and the initial requesting Certificateholder, if any, or any other Certificateholder or Certificate Owner wishes to exercise its right to refer the matter to mediation (including nonbinding arbitration) or arbitration, or (b) the enforcing servicer’s intended course of action is to pursue further action to exercise rights against the related Mortgage Loan Seller with respect to the Repurchase Request but the initial requesting Certificateholder, if any, or any other Certificateholder or Certificate Owner does not agree with the dispute resolution method selected by the enforcing servicer, then the initial requesting Certificateholder, if any, or such other Certificateholder or Certificate Owner may deliver a written notice to the enforcing servicer indicating its intent to exercise its right to refer the matter to either mediation or arbitration.
“Resolved” means, with respect to a Repurchase Request, (i) that the related material defect or material breach has been cured, (ii) the related Mortgage Loan has been repurchased in accordance with the related mortgage loan purchase agreement, (iii) a mortgage loan has been substituted for the related Mortgage Loan in accordance with the related mortgage loan purchase agreement, (iv) the applicable Mortgage Loan Seller made the loss of value payment, (v) a contractually binding agreement is entered into between the enforcing servicer, on behalf of the issuing entity, and the related Mortgage Loan Seller that settles the related Mortgage Loan Seller’s obligations under the related mortgage loan purchase agreement, or (vi) the related Mortgage Loan is no longer property of the issuing entity as a result of a sale or other disposition in accordance with the PSA. See “Pooling and Servicing Agreement—Dispute Resolution Provisions” in the Preliminary Prospectus.
|
| Liquidated Loan Waterfall: | On liquidation of any Mortgage Loan, all net liquidation proceeds will be applied according to the PSA, so that amounts allocated as a recovery of accrued and unpaid interest will not, in the first instance, include (a) any amount by which the interest portion of P&I Advances previously made was reduced as a result of appraisal reduction amounts and (b) Accrued AB Loan Interest. After the adjusted interest amount is so allocated, any remaining net liquidation proceeds will be allocated to pay principal on the Mortgage Loan until the unpaid principal amount of the Mortgage Loan has been reduced to zero. Any remaining liquidation proceeds would then be allocated as a recovery of (a) accrued and unpaid interest corresponding to the amount by which the interest portion of P&I Advances previously made was reduced as a result of appraisal reduction amounts and (b) any Accrued AB Loan Interest. |
THE INFORMATION IN THIS STRUCTURAL AND COLLATERAL TERM SHEET IS NOT COMPLETE AND MAY BE AMENDED PRIOR TO THE TIME OF SALE. THIS TERM SHEET IS NOT AN OFFER TO SELL THESE SECURITIES AND IT IS NOT A SOLICITATION OF AN OFFER TO BUY THESE SECURITIES IN ANY JURISDICTION WHERE THE OFFER OR SALE IS NOT PERMITTED.
24
(THIS PAGE INTENTIONALLY LEFT BLANK)
25
Various Various, Various | Collateral Asset Summary – Loan No. 1 Agellan Portfolio | Cut-off Date Balance: Cut-off Date LTV: U/W NCF DSCR: U/W NOI Debt Yield: | $75,000,000 41.9% 3.04x 15.7% |
THE INFORMATION IN THIS STRUCTURAL AND COLLATERAL TERM SHEET IS NOT COMPLETE AND MAY BE AMENDED PRIOR TO THE TIME OF SALE. THIS TERM SHEET IS NOT AN OFFER TO SELL THESE SECURITIES AND IT IS NOT A SOLICITATION OF AN OFFER TO BUY THESE SECURITIES IN ANY JURISDICTION WHERE THE OFFER OR SALE IS NOT PERMITTED.
26
Various Various, Various | Collateral Asset Summary – Loan No. 1 Agellan Portfolio | Cut-off Date Balance: Cut-off Date LTV: U/W NCF DSCR: U/W NOI Debt Yield: | $75,000,000 41.9% 3.04x 15.7% |
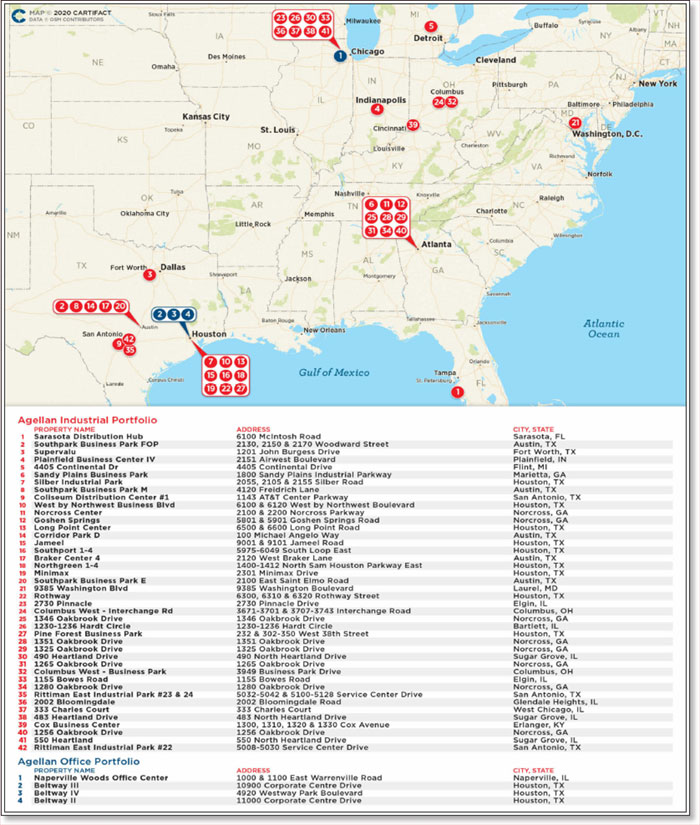
THE INFORMATION IN THIS STRUCTURAL AND COLLATERAL TERM SHEET IS NOT COMPLETE AND MAY BE AMENDED PRIOR TO THE TIME OF SALE. THIS TERM SHEET IS NOT AN OFFER TO SELL THESE SECURITIES AND IT IS NOT A SOLICITATION OF AN OFFER TO BUY THESE SECURITIES IN ANY JURISDICTION WHERE THE OFFER OR SALE IS NOT PERMITTED.
27
Various Various, Various | Collateral Asset Summary – Loan No. 1 Agellan Portfolio | Cut-off Date Balance: Cut-off Date LTV: U/W NCF DSCR: U/W NOI Debt Yield: | $75,000,000 41.9% 3.04x 15.7% |
| Mortgage Loan Information | |
| Loan Seller: | JPMCB |
| Loan Purpose: | Refinance |
| Credit Assessment | |
| (Fitch/KBRA/S&P)(13): | A-sf / BBB+(sf) / N/A |
| Borrower Sponsor(1): | Elad Canada Realty Inc. |
| Borrowers(1): | Various |
| Original Balance(2): | $75,000,000 |
| Cut-off Date Balance(2): | $75,000,000 |
| % by Initial UPB: | 8.0% |
| Interest Rate: | 4.62820% |
| Payment Date: | 7th of each month |
| First Payment Date: | August 7, 2020 |
| Maturity Date: | August 7, 2025 |
| Amortization: | Interest Only |
| Additional Debt(2)(3) : | $156,000,000 Pari Passu Debt; $172,000,000 Subordinate Debt; $31,000,000 Mezzanine Debt |
| Call Protection(4): | L(24), D(33), O(4) |
| Lockbox / Cash Management: | Hard / In Place |
| Reserves(5) | |||
| Initial | Monthly | Cap | |
| Taxes: | $0 | Springing | NAP |
| Insurance: | $0 | Springing | NAP |
| Common Charges: | $0 | Springing | NAP |
| TI/LC: | $6,410,963 | $431,671 | $15,540,151 |
| Required Repairs: | $2,985,266 | NAP | NAP |
| Working Capital Reserve: | $2,000,000 | $0 | NAP |
| Gap Rent Reserve: | $172,050 | $0 | NAP |
| Replacement: | $0 | $101,570 | $3,656,506 |
| Property Information | |
| Single Asset / Portfolio: | Portfolio of 46 properties |
| Property Type: | Various |
| Collateral: | Fee Simple |
| Location: | Various |
| Year Built / Renovated: | Various / Various |
| Total Sq. Ft.(6): | 6,094,177 |
| Property Management(7): | Various |
| Underwritten NOI(8): | $36,224,356 |
| Underwritten NCF(8): | $32,906,361 |
| Appraised Value(9): | $551,000,000 |
| Appraisal Date: | Various |
| Historical NOI | |
| Most Recent NOI(10): | NAV |
| 2019 NOI: | $40,473,151 (December 31, 2019) |
| 2018 NOI(11): | $38,961,287 (December 31, 2018) |
| 2017 NOI(11): | $33,762,598 (December 31, 2017) |
| Historical Occupancy | |
| Most Recent Occupancy(12): | 90.4% (Various) |
| 2019 Occupancy: | 96.2% (December 31, 2019) |
| 2018 Occupancy: | 96.1% (December 31, 2018) |
| 2017 Occupancy: | 94.7% (December 31, 2017) |
| Financial Information(2)(3) | ||||||
| Tranche | Cut-off Date Balance | Balance per Sq. Ft. Cut-off / Balloon | LTV Cut-off / | U/W DSCR NOI / NCF | U/W Debt Yield NOI / NCF | U/W Debt Yield at Balloon NOI / NCF |
| Mortgage Loan | $75,000,000 | |||||
| Pari Passu Notes | $156,000,000 | |||||
| Total Senior Notes | $231,000,000 | $38 / $38 | 41.9% / 41.9% | 3.34x / 3.04x | 15.7% / 14.2% | 15.7% / 14.2% |
| B Note | $172,000,000 | |||||
| Whole Loan | $403,000,000 | $66 / $66 | 73.1% / 73.1% | 1.96x / 1.78x | 9.0% / 8.2% | 9.0% / 8.2% |
| Mezzanine Loan | $31,000,000 | |||||
| Total Debt | $434,000,000 | $71 / $71 | 78.8% / 78.8% | 1.70x / 1.54x | 8.3% / 7.6% | 8.3% / 7.6% |
| (1) | For a description of the Borrowers (as defined below) and the Borrower Sponsor (as defined below) see “The Borrowers / Borrower Sponsor” herein. |
| (2) | Represents the principal balance of the non-controlling Note A-1, which will be included in the Benchmark 2020-B18 securitization trust. The Agellan Portfolio Whole Loan (as defined below), is evidenced by seven senior pari passu notes and a controlling subordinate Note B, with an aggregate outstanding principal balance as of the Cut-off Date of $403.0 million. For additional information, see “The Loan” herein. |
| (3) | See “Current Mezzanine or Subordinate Indebtedness" herein. |
| (4) | The lockout period will be at least 24 payments beginning with and including the first payment date of August 7, 2020. The Borrowers have the option to defease the full $403.0 million Agellan Portfolio Whole Loan after the earlier to occur of (i) two years after the closing date of the securitization that includes the last note to be securitized and (ii) the third anniversary of the first payment date. The actual lockout period may be longer. The interest only period and Call Protection presented in the Mortgage Loan Information above are inclusive of the additional August 2020 interest payment to be deposited by JPMorgan Chase Bank, National Association. |
| (5) | See “Initial and Ongoing Reserves” herein. |
| (6) | Total Sq. Ft. is exclusive of 344 sq. ft. associated with re-measurements. |
| (7) | For a description of the Property Managers (as defined below) see “Property Management” herein. |
| (8) | Underwritten NOI and Underwritten NCF are inclusive of contractual rent steps taken through June 1, 2021 and includes the ALDI, Inc. expansion of approximately 24,597 sq. ft. and HCSC (as defined below) relocation at the Naperville Woods Office Center property. U/W Base Rent has been further adjusted to account for a 10.0% stress to tenants who missed full or partial rent payments in April, May and/or June or have requested rent relief during the COVID-19 pandemic. The total stress to U/W Base Rent is $223,074. An additional stress loss adjustment of 10.0% was applied to total reimbursements for any tenants that missed full rent payments in April, May and/or June. The total stress to reimbursements is $77,899. All U/W Base Rent figures herein are exclusive of rent attributable to vacant space. |
| (9) | The Appraised Value is based on an aggregate “as-is” value of the Agellan Properties (as defined below) and is inclusive of excess land value that is defined in each individual Agellan Property appraisal and serves as collateral for the Agellan Portfolio Whole Loan. The excess vacant land parcels are associated with the Sarasota Distribution Hub and Supervalu properties may be released pursuant to satisfying conditions set forth in “Partial Release” below. |
| (10) | Most Recent NOI is not available as the Borrowers are only required to report financials on an annual basis. |
| (11) | The increase from 2018 NOI and 2017 NOI is due to the increase of assets in the Agellan Portfolio from 41 to 46 properties. |
| (12) | Most Recent Occupancy is reflective of the exclusion of known vacancies and tenants that have gone dark at the Agellan Properties. Occupancy inclusive of such tenant spaces is approximately 93.4%. |
| (13) | Fitch and KBRA provided the listed assessments for the Agellan Portfolio Loan in the context of its inclusion in the mortgage pool. |
THE INFORMATION IN THIS STRUCTURAL AND COLLATERAL TERM SHEET IS NOT COMPLETE AND MAY BE AMENDED PRIOR TO THE TIME OF SALE. THIS TERM SHEET IS NOT AN OFFER TO SELL THESE SECURITIES AND IT IS NOT A SOLICITATION OF AN OFFER TO BUY THESE SECURITIES IN ANY JURISDICTION WHERE THE OFFER OR SALE IS NOT PERMITTED.
28
Various Various, Various | Collateral Asset Summary – Loan No. 1 Agellan Portfolio | Cut-off Date Balance: Cut-off Date LTV: U/W NCF DSCR: U/W NOI Debt Yield: | $75,000,000 41.9% 3.04x 15.7% |
The Loan. The Agellan Portfolio mortgage loan (the “Agellan Portfolio Loan”) is part of a fixed rate whole loan secured by first mortgages encumbering the borrowers’ fee simple interests in a 46-property portfolio of industrial and office properties in the aggregate comprising approximately 6,094,177 sq. ft. located throughout nine states (the “Agellan Portfolio” or the “Agellan Properties”). The Agellan Portfolio Loan is evidenced by the non-controlling fixed rate Note A-1 with an original principal balance and outstanding principal balance as of the Cut-off Date of $75.0 million. The Agellan Portfolio Loan is part of a $403.0 million whole loan (the “Agellan Portfolio Whole Loan”) that is evidenced by seven pari passu notes with an aggregate Cut-off Date principal balance of $231.0 million (the “Agellan Portfolio Senior Notes”) and a controlling subordinate fixed rate note (the “Agellan Portfolio Subordinate Note”), with an aggregate Cut-off Date principal balance of $172.0 million. The Agellan Portfolio Senior Notes are senior to the Agellan Portfolio Subordinate Note. Only the Agellan Portfolio Loan will be included in the mortgage pool for the Benchmark 2020-B18 trust.
The relationship between the holders of the Agellan Portfolio Whole Loan will be governed by a co-lender agreement as described under “Description of the Mortgage Pool—The Whole Loans—The Serviced AB Whole Loan—The Agellan Portfolio Whole Loan” in the Preliminary Prospectus.
| Total Debt Summary | |||||
| Note | Original Balance | Cut-off Date Balance | Note Holder | Controlling Piece | |
| Note A-1 | $75,000,000 | $75,000,000 | Benchmark 2020-B18 | No | |
| Note A-2 | 50,000,000 | 50,000,000 | JPMCB(1) | No | |
| Note A-3 | 30,000,000 | 30,000,000 | JPMCB(1) | No | |
| Note A-4 | 30,000,000 | 30,000,000 | JPMCB(1) | No | |
| Note A-5 | 25,000,000 | 25,000,000 | JPMCB(1) | No | |
| Note A-6 | 11,000,000 | 11,000,000 | JPMCB(1) | No | |
| Note A-7 | 10,000,000 | 10,000,000 | JPMCB(1) | No | |
| Total Senior Notes | $231,000,000 | $231,000,000 | |||
| Note B(2) | $172,000,000 | $172,000,000 | Benchmark 2020-B18 (loan-specific certificates) | Yes(3) | |
| Whole Loan | $403,000,000 | $403,000,000 | |||
| Mezzanine Loan | $31,000,000 | $31,000,000 | Third Party | No | |
| Total Debt | $434,000,000 | $434,000,000 | |||
| (1) | Expected to be contributed to one or more future securitizations. |
| (2) | The Agellan Portfolio Subordinate Note will be subordinate in right of payment to the Agellan Portfolio Senior Notes. |
| (3) | The controlling Note B will be contributed to the issuing entity but will not be included in the mortgage pool. Payments allocated to the Agellan Portfolio Subordinate Note will be paid to the holders of the Loan-Specific Certificates as described in “Description of the Mortgage Pool—The Whole Loans—The Serviced AB Whole Loan—The Agellan Portfolio Whole Loan” in the Preliminary Prospectus. Following a control appraisal period with respect to Note B, control will shift to the directing certificateholder for the Benchmark 2020-B18 transaction. |
The Agellan Portfolio Whole Loan has a 61-month interest-only term. The Agellan Portfolio Senior Notes accrue interest a fixed rate of approximately 4.62820% per annum and the Agellan Portfolio Subordinate Note accrue interest at fixed rate of approximately 4.40000% per annum. The proceeds of the Agellan Portfolio Whole Loan were used to pay off existing debt encumbering 46 of the Agellan Properties of approximately $418.9 million, pay closing costs of approximately $5.7 million and fund escrows of approximately $11.6 million. As of year-end 2019, the Borrower Sponsor had a cost basis of approximately $507.8 million. The Borrower Sponsor’s total cash equity in the Agellan Portfolio will be approximately $185.5 million.
| Sources and Uses | ||||||
| Sources | Proceeds | % of Total | Uses | Proceeds | % of Total | |
| Senior Notes | $231,000,000 | 53.0% | Loan Payoff(1) | $418,924,922 | 96.0% | |
| Subordinate Note | 172,000,000 | 39.4 | Upfront Reserves | 11,568,279 | 2.7 | |
| Mezzanine Loan | 31,000,000 | 7.1 | Closing Costs | 5,670,436 | 1.3 | |
| Sponsor Equity | 2,163,638 | 0.5 | ||||
| Total Sources | $436,163,638 | 100.0% | Total Uses | $436,163,638 | 100.0% | |
| (1) | Represents the refinance of the 42 of the Agellan Properties that were previously securitized in the MSC 2019-AGLN transaction and the balance sheet financing associated with the Sponsors’ recent acquisition of four of the Agellan Properties. |
The Borrowers / Borrower Sponsor. The borrowers are Chicago Industrial Properties 1 LP, a Delaware limited partnership, Corridor Park LP, a Delaware limited partnership, Norcross Springs LP, a Delaware limited partnership, 6100 McIntosh LP, a Delaware limited partnership, 6100 McIntosh Vacant LP, a Delaware limited partnership, Agellan Commercial REIT U.S. L.P., a Delaware limited partnership, Continental Drive LP, a Delaware limited partnership, 9385 Washington Blvd. L.P., a Delaware limited partnership, Agellan Warrenville L.P., a Delaware limited partnership, 1300 Cox Avenue LP, a Delaware limited partnership and San Antonio Industrial One LP, a Delaware limited partnership each structured to be a bankruptcy-remote entity with two independent directors in its organizational structure (collectively, the “Borrowers”). Legal counsel to the Borrowers delivered a non-consolidation opinion in connection with the origination of the Agellan Portfolio Whole Loan. The Borrowers are owned and controlled by Elad Canada Realty Inc. (the “Borrower Sponsor” or “ELAD Canada”), a privately held, commercial real estate company specializing in the acquisition and development of commercial and residential properties. ELAD Canada was founded in 1997 and is based in Toronto, Canada. The firm operates as a
THE INFORMATION IN THIS STRUCTURAL AND COLLATERAL TERM SHEET IS NOT COMPLETE AND MAY BE AMENDED PRIOR TO THE TIME OF SALE. THIS TERM SHEET IS NOT AN OFFER TO SELL THESE SECURITIES AND IT IS NOT A SOLICITATION OF AN OFFER TO BUY THESE SECURITIES IN ANY JURISDICTION WHERE THE OFFER OR SALE IS NOT PERMITTED.
29
Various Various, Various | Collateral Asset Summary – Loan No. 1 Agellan Portfolio | Cut-off Date Balance: Cut-off Date LTV: U/W NCF DSCR: U/W NOI Debt Yield: | $75,000,000 41.9% 3.04x 15.7% |
subsidiary of Elad US Holding, Inc. ELAD Canada has focused its business in central Canada, acquiring income producing properties, as well as development sites. As of 2020, ELAD Canada has 7.4 million square feet of income producing space, as well as 4.4 million square feet of construction in the pipeline and over 6,000 residential units under development. Under the terms of the Agellan Whole Loan documents, Elad Genesis Limited Partnership, a subsidiary of the Borrower Sponsor, is the non-recourse carveout guarantor for the Agellan Portfolio Whole Loan and is required to maintain a minimum net worth of $100 million during the term of the loan. ELAD Canada is a part of the ELAD Group. Founded in 1992, ELAD Group is a real estate conglomerate with development projects in North America, Europe and Israel. ELAD Group has developed successful condominiums, hotels and mixed-use projects making its mark as a significant developer of ultra-luxury properties in New York City, like the Plaza Hotel. ELAD Group is focused on the acquisition, development and conversion of architecturally significant residential and commercial properties in key markets throughout North America.
The aggregate liability of the Guarantor with respect to the matters that constitute full recourse carveouts (each, a “Full Recourse Event”) under the Agellan Portfolio Whole Loan documents may not exceed an amount equal to (x) 20% of the outstanding principal balance of the Agellan Portfolio Whole Loan as of the first occurrence of a Full Recourse Event plus (y) any and all reasonable third-party costs incurred by the lender (including reasonable and out-of-pocket attorney’s fees and costs) in connection with the enforcement of the Full Recourse Event thereunder and the collection of amounts due thereunder.
The Borrower Sponsor has notified JPMCB that, Yitzhak Tshuva, the controlling shareholder of the entities that own ELAD Canada, has entered into a non-binding memorandum of understanding (“MOU”) to sell certain assets, including 37% of ELAD Canada to a joint venture between Plaza Partners and Argent Ventures. The non-binding MOU includes a call option in favor of the buyers and a put option in favor of the seller for the remaining 63% of ELAD Canada. If the purchase of the 37% stake occurs, the buyers will take over day-to-day operations of ELAD Canada. In the event the transaction moves forward, the Borrower Sponsor anticipates the closing to occur in September 2020. Argent Ventures is a vertically-integrated, diversified real estate investment and development firm specializing in opportunistic, and value-add transactions through the United States. Founded in 1997 and headquartered in New York City, Argent Ventures pursues debt- and equity- related investments in multiple asset classes. Since its inception, Argent Ventures has purchased over $2.5 billion in real estate assets and debt instruments in major markets in the United States and Europe. Founded in 1981, Plaza Partners is a real estate developer and asset manager that focuses on rezoning and developing residential properties in strong urban locations within the greater Toronto area. Plaza Partners’ current portfolio includes approximately four million square feet of potential density. Under the terms of the loan agreement, the lender is expected to have the right to consent to the proposed sale.
See “Risk Factors—Risks Related to the Mortgage Loans—The Performance of a Mortgage Loan and Its Related Mortgaged Property Depends in Part on Who Controls the Borrower and Mortgaged Property” in the Preliminary Prospectus.
COVID-19 Update. As of June 1, 2020, the Agellan Properties have remained open; however, many office tenants have chosen to work remotely. Based on the underwritten rent rolls as of the June 1, 2020, the Agellan Properties were approximately 93.4% occupied (inclusive of dark tenants and known vacates). For April, May and June of 2020, tenants representing approximately 97.7%, 96.7% and 97.0% of net rentable area, respectively, have paid rent in-full, with the Borrower Sponsor having collected approximately 97.8%, 97.8% and 96.6% of underwritten base rent, respectively. The top ten tenants, representing 38.6% of NRA and 41.0% of underwritten rent, had no issues with rent payment. 32 tenants representing approximately 5.5% of the underwritten base rent and 5.4% of the Agellan Properties net rentable have requested rent relief or have partial or no collections for the months of April, May and June. The five largest tenants that have put in formal requests for relief in aggregate represent approximately 2.0% of NRA and approximately 1.8% of U/W Base Rent. As of June 2020, none of the tenants have been granted a rent deferral and 25 tenants (totaling 5.4% of NRA) are in discussions with the borrowers for rent relief.
The Properties. The Agellan Portfolio consists of the fee simple interests in a 46 property portfolio of industrial and office properties comprising approximately 6,094,177 sq. ft. in the aggregate located throughout nine states and 12 different markets. The Agellan Portfolio is comprised of 42 industrial properties (5,248,373 sq. ft.; 86.1% of NRA; 71.3% of U/W Base Rent) and four office properties (845,804 sq. ft.; 13.9% of NRA; 28.7% of U/W Base Rent). The tenancy spans a variety of industries including health care, food services, automotive parts, insurance, and technology.
As of June 1, 2020, the Agellan Portfolio is 93.4% leased (90.4% leased excluding dark tenants and known vacates) to 250 unique tenants with no single tenant accounting for more than 6.9% of U/W Base Rent. Four of the top ten tenants (Health Care Service Corp., General Motors LLC, Life Technologies Corporation and Allstate Insurance Co.) have investment grade credit ratings by one or more of Moody’s, Fitch or S&P and account for approximately 12.4% and 18.3% of the Agellan Portfolio’s Total NRA and U/W Base Rent, respectively. The Agellan Properties have a weighted average remaining lease term of approximately 2.9 years.
THE INFORMATION IN THIS STRUCTURAL AND COLLATERAL TERM SHEET IS NOT COMPLETE AND MAY BE AMENDED PRIOR TO THE TIME OF SALE. THIS TERM SHEET IS NOT AN OFFER TO SELL THESE SECURITIES AND IT IS NOT A SOLICITATION OF AN OFFER TO BUY THESE SECURITIES IN ANY JURISDICTION WHERE THE OFFER OR SALE IS NOT PERMITTED.
30
Various Various, Various | Collateral Asset Summary – Loan No. 1 Agellan Portfolio | Cut-off Date Balance: Cut-off Date LTV: U/W NCF DSCR: U/W NOI Debt Yield: | $75,000,000 41.9% 3.04x 15.7% |
| Portfolio Summary | ||||||||||
| No. | Property Name | City, State | Property Type | Net Rentable Area | Allocated Loan Amount | % Allocated Loan Amount | U/W Base Rent(1) | % of UW Base Rent | Appraised Value | % of Appraised Value |
| 1 | Sarasota Distribution Hub | Sarasota, FL | Industrial | 906,449 | $9,452,233 | 12.6% | $4,804,386 | 11.7% | $70,200,000 | 12.7% |
| 2 | Naperville Woods Office Center | Naperville, IL | Office | 482,497 | $9,387,097 | 12.5% | $7,480,569 | 18.2% | $68,800,000 | 12.5% |
| 3 | Southpark Business Park FOP | Austin, TX | Industrial | 187,075 | $4,762,407 | 6.3% | $2,478,202 | 6.0% | $34,900,000 | 6.3% |
| 4 | Supervalu | Fort Worth, TX | Industrial | 253,800 | $3,593,672 | 4.8% | $1,573,560 | 3.8% | $26,720,000 | 4.8% |
| 5 | Plainfield Business Center IV | Plainfield, IN | Industrial | 434,354 | $3,288,462 | 4.4% | $1,385,853 | 3.4% | $24,100,000 | 4.4% |
| 6 | Beltway III | Houston, TX | Office | 130,566 | $2,743,176 | 3.7% | $2,347,444 | 5.7% | $20,100,000 | 3.6% |
| 7 | 4405 Continental Dr | Flint, MI | Industrial | 400,000 | $2,558,933 | 3.4% | $2,097,244 | 5.1% | $18,750,000 | 3.4% |
| 8 | Beltway IV | Houston, TX | Office | 131,702 | $2,346,774 | 3.1% | $1,714,514 | 4.2% | $17,200,000 | 3.1% |
| 9 | Sandy Plains Business Park | Marietta, GA | Industrial | 167,329 | $2,169,975 | 2.9% | $1,141,184 | 2.8% | $15,700,000 | 2.8% |
| 10 | Silber Industrial Park | Houston, TX | Industrial | 198,970 | $1,924,318 | 2.6% | $882,818 | 2.2% | $14,100,000 | 2.6% |
| 11 | Southpark Business Park M | Austin, TX | Industrial | 72,550 | $1,786,600 | 2.4% | $958,626 | 2.3% | $13,100,000 | 2.4% |
| 12 | Coliseum Distribution Center #1 | San Antonio, TX | Industrial | 208,000 | $2,142,060 | 2.9% | $942,656 | 2.3% | $15,900,000 | 2.9% |
| 13 | West by Northwest Business Blvd | Houston, TX | Industrial | 122,750 | $1,745,658 | 2.3% | $835,905 | 2.0% | $12,800,000 | 2.3% |
| 14 | Norcross Center | Norcross, GA | Industrial | 169,951 | $1,678,660 | 2.2% | $942,051 | 2.3% | $12,300,000 | 2.2% |
| 15 | Goshen Springs | Norcross, GA | Industrial | 152,319 | $1,459,057 | 1.9% | $718,035 | 1.7% | $10,700,000 | 1.9% |
| 16 | Long Point Center | Houston, TX | Industrial | 189,680 | $1,418,114 | 1.9% | $741,097 | 1.8% | $10,400,000 | 1.9% |
| 17 | Corridor Park D | Austin, TX | Industrial | 56,100 | $1,405,087 | 1.9% | $674,322 | 1.6% | $10,300,000 | 1.9% |
| 18 | Southport 1-4 | Houston, TX | Industrial | 149,401 | $1,364,144 | 1.8% | $684,408 | 1.7% | $10,000,000 | 1.8% |
| 19 | Jameel | Houston, TX | Industrial | 94,900 | $1,364,144 | 1.8% | $664,060 | 1.6% | $10,000,000 | 1.8% |
| 20 | Beltway II | Houston, TX | Office | 101,039 | $1,323,201 | 1.8% | $214,432 | 0.5% | $9,700,000 | 1.8% |
| 21 | Braker Center 4 | Austin, TX | Industrial | 45,913 | $1,282,258 | 1.7% | $579,872 | 1.4% | $9,400,000 | 1.7% |
| 22 | Northgreen 1-4 | Houston, TX | Industrial | 118,736 | $1,172,457 | 1.6% | $474,118 | 1.2% | $8,600,000 | 1.6% |
| 23 | Minimax | Houston, TX | Industrial | 119,821 | $1,105,459 | 1.5% | $568,098 | 1.4% | $8,100,000 | 1.5% |
| 24 | Southpark Business Park E | Austin, TX | Industrial | 49,966 | $1,023,573 | 1.4% | $587,600 | 1.4% | $7,500,000 | 1.4% |
| 25 | 9385 Washington Blvd | Laurel, MD | Industrial | 57,590 | $995,658 | 1.3% | $426,784 | 1.0% | $7,300,000 | 1.3% |
| 26 | Rothway | Houston, TX | Industrial | 75,460 | $982,630 | 1.3% | $297,597 | 0.7% | $7,200,000 | 1.3% |
| 27 | 2730 Pinnacle | Elgin, IL | Industrial | 44,990 | $831,886 | 1.1% | $454,404 | 1.1% | $6,100,000 | 1.1% |
| 28 | Columbus West - Interchange Rd | Columbus, OH | Industrial | 91,200 | $770,471 | 1.0% | $404,218 | 1.0% | $5,650,000 | 1.0% |
| 29 | 1346 Oakbrook Drive | Norcross, GA | Industrial | 71,591 | $736,973 | 1.0% | $441,662 | 1.1% | $5,400,000 | 1.0% |
| 30 | 1230-1236 Hardt Circle | Bartlett, IL | Industrial | 60,080 | $709,057 | 0.9% | $287,187 | 0.7% | $5,200,000 | 0.9% |
| 31 | Pine Forest Business Park | Houston, TX | Industrial | 80,091 | $668,114 | 0.9% | $106,122 | 0.3% | $4,900,000 | 0.9% |
| 32 | 1351 Oakbrook Drive | Norcross, GA | Industrial | 36,489 | $524,814 | 0.7% | $188,866 | 0.5% | $3,850,000 | 0.7% |
| 33 | 1325 Oakbrook Drive | Norcross, GA | Industrial | 53,120 | $519,231 | 0.7% | $299,472 | 0.7% | $3,800,000 | 0.7% |
| 34 | 490 Heartland Drive | Sugar Grove, IL | Industrial | 39,520 | $511,787 | 0.7% | $304,704 | 0.7% | $3,750,000 | 0.7% |
| 35 | 1265 Oakbrook Drive | Norcross, GA | Industrial | 51,200 | $498,759 | 0.7% | $287,275 | 0.7% | $3,650,000 | 0.7% |
| 36 | Columbus West - Business Park(2) | Columbus, OH | Industrial | 92,618 | $478,288 | 0.6% | $0 | 0.0% | $3,500,000 | 0.6% |
| 37 | 1155 Bowes Road(3) | Elgin, IL | Industrial | 34,400 | $470,844 | 0.6% | $0 | 0.0% | $3,450,000 | 0.6% |
| 38 | 1280 Oakbrook Drive | Norcross, GA | Industrial | 46,400 | $463,400 | 0.6% | $261,118 | 0.6% | $3,400,000 | 0.6% |
| 39 | Rittiman East Industrial Park #23 & 24 | San Antonio, TX | Industrial | 50,806 | $528,536 | 0.7% | $308,606 | 0.8% | $3,870,000 | 0.7% |
| 40 | 2002 Bloomingdale | Glendale Heights, IL | Industrial | 31,919 | $416,873 | 0.6% | $194,877 | 0.5% | $3,050,000 | 0.6% |
| 41 | 333 Charles Court | West Chicago, IL | Industrial | 36,623 | $409,429 | 0.5% | $277,441 | 0.7% | $3,000,000 | 0.5% |
| 42 | 483 Heartland Drive | Sugar Grove, IL | Industrial | 36,426 | $409,429 | 0.5% | $172,234 | 0.4% | $3,000,000 | 0.5% |
| 43 | Cox Business Center | Erlanger, KY | Industrial | 52,040 | $457,816 | 0.6% | $247,686 | 0.6% | $3,350,000 | 0.6% |
| 44 | 1256 Oakbrook Drive | Norcross, GA | Industrial | 40,392 | $401,985 | 0.5% | $191,411 | 0.5% | $2,950,000 | 0.5% |
| 45 | 550 Heartland | Sugar Grove, IL | Industrial | 30,328 | $361,042 | 0.5% | $203,700 | 0.5% | $2,650,000 | 0.5% |
| 46 | Rittiman East Industrial Park #22 | San Antonio, TX | Industrial | 37,026 | $355,459 | 0.5% | $184,961 | 0.5% | $2,610,000 | 0.5% |
| Total | 6,094,177 | $75,000,000 | 100.0% | $41,031,381 | 100.0% | $551,000,000 | 100.0% | |||
| (1) | U/W Base Rent has been further adjusted to account for a 10.0% stress to tenants who missed full or partial rent payments in April, May and/or June or have requested rent relief during the COVID-19 pandemic. The total stress to U/W Base Rent is $223,074. An additional stress loss adjustment of 10.0% was applied to reimbursements for any tenants that missed full rent payments in April, May and/or June. The total stress to reimbursements is $77,899. |
| (2) | The Columbus West – Business Park property is currently 100.0% vacant and has been underwritten as such. |
| (3) | The 1155 Bowes Road property is leased to a single tenant that is currently dark. The tenant is underwritten as vacant. |
THE INFORMATION IN THIS STRUCTURAL AND COLLATERAL TERM SHEET IS NOT COMPLETE AND MAY BE AMENDED PRIOR TO THE TIME OF SALE. THIS TERM SHEET IS NOT AN OFFER TO SELL THESE SECURITIES AND IT IS NOT A SOLICITATION OF AN OFFER TO BUY THESE SECURITIES IN ANY JURISDICTION WHERE THE OFFER OR SALE IS NOT PERMITTED.
31
Various Various, Various | Collateral Asset Summary – Loan No. 1 Agellan Portfolio | Cut-off Date Balance: Cut-off Date LTV: U/W NCF DSCR: U/W NOI Debt Yield: | $75,000,000 41.9% 3.04x 15.7% |
| Portfolio Summary (continued) | |||||||||||
| No. | Property Name | Market | Property Type | Property Sub-Type | Net Rentable Area | Property Occupancy | Year Built | Year Renovated | Ceiling Height | Percent Office | Appraisal Cap Rate(1) |
| 1 | Sarasota Distribution Hub | Tampa | Industrial | Warehouse/Distribution | 906,449 | 100.0% | 1981 | 2007 | 28' | 5.0% | 6.75% |
| 2 | Naperville Woods Office Center | Chicago | Office | Suburban | 482,497 | 95.4% | 1981, 1988 | 2007 | NAP | 100.0% | 8.25% |
| 3 | Southpark Business Park FOP | Austin | Industrial | Flex | 187,075 | 100.0% | 1982 | NAP | 16' | 96.0% | 6.25% |
| 4 | Supervalu | Dallas | Industrial | Warehouse/Distribution | 253,800 | 100.0% | 1996 | NAP | 32' | 7.0% | 6.50% |
| 5 | Plainfield Business Center IV | Indianapolis | Industrial | Warehouse/Distribution | 434,354 | 100.0% | 1999 | NAP | 30' | 3.5% | 5.75% |
| 6 | Beltway III | Houston | Office | CBD | 130,566 | 100.0% | 2005 | NAP | NAP | 100.0% | 8.00% |
| 7 | 4405 Continental Dr | Flint | Industrial | Warehouse/Distribution | 400,000 | 100.0% | 1999 | 2006 | 30' | 2.0% | 9.50% |
| 8 | Beltway IV | Houston | Office | CBD | 131,702 | 72.6% | 2006 | NAP | NAP | 100.0% | 8.50% |
| 9 | Sandy Plains Business Park | Atlanta | Industrial | Flex | 167,329 | 94.3% | 1986 | NAP | 20' | 40.0% - 95.0% | 7.00% |
| 10 | Silber Industrial Park | Houston | Industrial | Warehouse/Distribution | 198,970 | 90.4% | 1978 | NAP | 21' - 24' | 13.0% | 6.50% |
| 11 | Southpark Business Park M | Austin | Industrial | Flex | 72,550 | 100.0% | 1983 | NAP | 16' | 96.0% | 6.75% |
| 12 | Coliseum Distribution Center #1 | San Antonio | Industrial | Warehouse/Distribution | 208,000 | 100.0% | 1978 | NAP | 26.5' | 5.0% | 6.00% |
| 13 | West by Northwest Business Blvd | Houston | Industrial | Flex | 122,750 | 91.5% | 1983 | NAP | 19' | 34.0% | 7.00% |
| 14 | Norcross Center | Atlanta | Industrial | Flex | 169,951 | 100.0% | 1988 | NAP | 20' | 33.0% | 7.00% |
| 15 | Goshen Springs | Atlanta | Industrial | Flex | 152,319 | 95.3% | 1986 | NAP | 26' | 33.0% | 6.25% / 6.75% |
| 16 | Long Point Center | Houston | Industrial | Warehouse/Distribution | 189,680 | 94.3% | 1979 | NAP | 24' | 11.0% | 7.50% / 7.25% |
| 17 | Corridor Park D | Austin | Industrial | Flex | 56,100 | 100.0% | 1999 | 2016 | 24' | 100.0% | 6.50% |
| 18 | Southport 1-4 | Houston | Industrial | Flex | 149,401 | 77.7% | 1980 | NAP | 16' | 33.0% | 8.00% |
| 19 | Jameel | Houston | Industrial | Flex | 94,900 | 87.5% | 1983 | NAP | 19' | 50.0% | 6.75% |
| 20 | Beltway II | Houston | Office | CBD | 101,039 | 13.3% | 2003 | NAP | NAP | 100.0% | 9.00% |
| 21 | Braker Center 4 | Austin | Industrial | Flex | 45,913 | 90.3% | 1984 | 1999 | 16' | 95.0% | 6.50% |
| 22 | Northgreen 1-4 | Houston | Industrial | Flex | 118,736 | 61.7% | 1982 | NAP | 12’ – 18’ | 35.0% | 8.00% |
| 23 | Minimax | Houston | Industrial | Warehouse/Distribution | 119,821 | 100.0% | 1967 | NAP | 20' | 13.0% | 6.50% |
| 24 | Southpark Business Park E | Austin | Industrial | Flex | 49,966 | 100.0% | 1982 | 1992 | 16' | 100.0% | 6.75% |
| 25 | 9385 Washington Blvd | Baltimore | Industrial | Flex | 57,590 | 92.2% | 1988 | 2007 | 18' | 20.0% | 6.00% |
| 26 | Rothway | Houston | Industrial | Flex | 75,460 | 43.8% | 1983 | NAP | 14' | 90.0% | 7.00% |
| 27 | 2730 Pinnacle | Chicago | Industrial | Warehouse/Distribution | 44,990 | 100.0% | 2005 | 2007 | 20' | 45.0% | 7.50% |
| 28 | Columbus West - Interchange Rd | Columbus | Industrial | Flex | 91,200 | 89.5% | 1974 | NAP | 22' | 20.0% | 8.00% |
| 29 | 1346 Oakbrook Drive | Atlanta | Industrial | Flex | 71,591 | 100.0% | 1985 | NAP | 14' | 85.0% | 7.25% |
| 30 | 1230-1236 Hardt Circle | Chicago | Industrial | Warehouse/Distribution | 60,080 | 75.1% | 2008 | NAP | 24' | 10.0% | 6.25% |
| 31 | Pine Forest Business Park | Houston | Industrial | Warehouse/Distribution | 80,091 | 30.9% | 1980 | NAP | 20' - 22' | 14.0% | 7.00% |
| 32 | 1351 Oakbrook Drive | Atlanta | Industrial | Flex | 36,489 | 68.5% | 1985 | NAP | 12' | 72.0% | 7.00% |
| 33 | 1325 Oakbrook Drive | Atlanta | Industrial | Flex | 53,120 | 100.0% | 1986 | NAP | 20' | 21.0% | 7.00% |
| 34 | 490 Heartland Drive | Chicago | Industrial | Warehouse/Distribution | 39,520 | 100.0% | 2002 | NAP | 20' | 20.0% | 7.50% |
| 35 | 1265 Oakbrook Drive | Atlanta | Industrial | Flex | 51,200 | 100.0% | 1985 | NAP | 18' | 21.0% | 7.00% |
| 36 | Columbus West - Business Park | Columbus | Industrial | Flex | 92,618 | 0.0% | 1996 | 2005 | 25' | 20.0% | 8.00% |
| 37 | 1155 Bowes Road | Chicago | Industrial | Warehouse/Distribution | 34,400 | 0.0% | 2006 | NAP | 26' | 20.0% | 6.50% |
| 38 | 1280 Oakbrook Drive | Atlanta | Industrial | Flex | 46,400 | 100.0% | 1986 | NAP | 19' | 27.0% | 7.25% |
| 39 | Rittiman East Industrial Park #23 & 24 | San Antonio | Industrial | Flex | 50,806 | 90.6% | 1983 | NAP | 16’ - 18' | 19.0% | 7.50% |
| 40 | 2002 Bloomingdale | Chicago | Industrial | Warehouse/Distribution | 31,919 | 100.0% | 1998 | NAP | 23' | 15.0% | 6.00% |
| 41 | 333 Charles Court | Chicago | Industrial | Warehouse/Distribution | 36,623 | 100.0% | 2007 | NAP | 20' | 20.0% | 7.25% |
| 42 | 483 Heartland Drive | Chicago | Industrial | Warehouse/Distribution | 36,426 | 84.1% | 2010 | NAP | 24' | 10.0% | 6.50% |
| 43 | Cox Business Center | Cincinnati | Industrial | Warehouse/Distribution | 52,040 | 100.0% | 1987 | NAP | 15' - 19' | 10.0% | 7.25% |
| 44 | 1256 Oakbrook Drive | Atlanta | Industrial | Flex | 40,392 | 87.5% | 1985 | NAP | 20' | 28.0% | 7.00% |
| 45 | 550 Heartland | Chicago | Industrial | Warehouse | 30,328 | 100.0% | 2000 | 2007 | 20' | 15.0% | 6.50% |
| 46 | Rittiman East Industrial Park #22 | San Antonio | Industrial | Warehouse/Distribution | 37,026 | 83.8% | 1983 | NAP | 18' | 14.0% | 7.50% |
| (1) | Naperville Woods Office Center, Goshen Spring and Long Point Center have multiple buildings that were appraised separately. |
THE INFORMATION IN THIS STRUCTURAL AND COLLATERAL TERM SHEET IS NOT COMPLETE AND MAY BE AMENDED PRIOR TO THE TIME OF SALE. THIS TERM SHEET IS NOT AN OFFER TO SELL THESE SECURITIES AND IT IS NOT A SOLICITATION OF AN OFFER TO BUY THESE SECURITIES IN ANY JURISDICTION WHERE THE OFFER OR SALE IS NOT PERMITTED.
32
Various Various, Various | Collateral Asset Summary – Loan No. 1 Agellan Portfolio | Cut-off Date Balance: Cut-off Date LTV: U/W NCF DSCR: U/W NOI Debt Yield: | $75,000,000 41.9% 3.04x 15.7% |
| Property Distribution | ||||||||||
| Property Type | No. of Properties | Total Sq. Ft. | % of Total Sq. Ft. | Allocated Loan Amount | (%) Allocated Loan Amount | U/W Base Rent | % of U/W Base Rent | Appraised Value | % of Appraised Value | |
| Industrial | 42 | 5,248,373 | 86.1% | $59,199,752 | 78.9% | $29,274,423 | 71.3% | $435,200,000 | 79.0% | |
| Warehouse / Distribution | 18 | 3,164,189 | 51.9% | $30,723,945 | 41.0% | $15,225,330 | 37.1% | $226,680,000 | 41.1% | |
| Flex | 23 | 2,053,856 | 33.7% | $28,114,764 | 37.5% | $13,845,394 | 33.7% | $205,870,000 | 37.4% | |
| Warehouse | 1 | 30,328 | 0.5% | $361,042 | 0.5% | $203,700 | 0.5% | $2,650,000 | 0.5% | |
| Office | 4 | 845,804 | 13.9% | $15,800,248 | 21.1% | $11,756,958 | 28.7% | $115,800,000 | 21.0% | |
| Suburban | 1 | 482,497 | 7.9% | $9,387,097 | 12.5% | $7,480,569 | 18.2% | $68,800,000 | 12.5% | |
| CBD | 3 | 363,307 | 6.0% | $6,413,151 | 8.6% | $4,276,389 | 10.4% | $47,000,000 | 8.5% | |
| Portfolio Total | 46 | 6,094,177 | 100.0% | $75,000,000 | 100.0% | $41,031,381 | 100.0% | $551,000,000 | 100.0% | |
Since May 2019, the Borrower Sponsor has executed 38 new, renewal and expansion leases for approximately 470,218 sq. ft. Renewal leases totaled approximately 342,447 sq. ft. and had weighted average rent increases of approximately 8.7%. Renewal and expansion leases totaled approximately 43,983 sq. ft. and had weighted average rent increases of 16.1%. New leases accounted for approximately 78,344 sq. ft. and had weighted average rent increases of 8.3%.
| Portfolio Leasing Spreads(1) | ||||||
| Lease Type | Expiring sq. ft. | Expiring Rent per sq. ft. | New sq. ft. | Rent per sq. ft. | Leasing Spread $ | Leasing Spread % |
| Renew | 342,447 | $8.58 | 342,447 | $9.32(2) | $0.75 | 8.7% |
| Renew & Expansion | 28,284 | $6.23 | 43,983 | $7.24 | $1.01 | 16.1% |
| Expansion | 11,252 | $6.00 | 5,444 | $5.84 | ($0.16)(3) | (2.7%)(3) |
| New | 109,848 | $6.71 | 78,344 | $7.27 | $0.56 | 8.3% |
| (1) | Since May 2019. |
| (2) | The leasing spread for Dish Network, Inc. is calculated based a gross renewal rent of $8.70 per sq. ft. |
| (3) | International Valve at the 483 Heartland Drive property expanded and took 5,444 sq. ft. of the 11,252 sq. ft. of vacated space. The expansion increased the tenant’s footprint to 11,032 sq. ft. and the rent for the NRA occupied prior to the expansion (5,588 sq. ft.) also increased $0.16 per sq. ft. or 2.4%. |
| Historical and Current Portfolio Occupancy(1)(2)(3) | ||||||||||
| 2013 | 2014 | 2015 | 2016 | 2017 | 2018 | 2019 | Current(4) | Current With Dark Tenants(5) | Current With Dark Tenants and Known Vacates(6) | |
| # of Assets(7) | 21 | 21 | 28 | 31 | 40 | 42 | 42 | 46 | 46 | 46 |
| Portfolio NRA Sq. ft. (mns) | 3,224 | 3,224 | 3,689 | 4,917 | 5,631 | 5,745 | 5,745 | 6,094 | 6,094 | 6,094 |
| % Occupancy | 91.8% | 91.0% | 94.4% | 93.3% | 94.7% | 96.1% | 96.2% | 90.4% | 92.1% | 93.4% |
| (1) | Historical occupancy data for the four recent acquisitions is not available. |
| (2) | Historical occupancy for 2013 – 2019 is reflective of quarterly averages for each respective year. |
| (3) | Historical occupancy for 2013 – 2019 includes any applicable leased dark space. |
| (4) | Current occupancy is based on the underwritten rent roll and excludes dark, known vacate, and bankrupt tenants. |
| (5) | Current W/ Dark Tenants occupancy is inclusive of dark tenants. |
| (6) | Current W/ Dark Tenants and Known Vacates occupancy is inclusive of dark and known vacate tenants. |
| (7) | # of Assets may vary from the “Portfolio Operating History” below as certain properties have not provided occupancy history. |
THE INFORMATION IN THIS STRUCTURAL AND COLLATERAL TERM SHEET IS NOT COMPLETE AND MAY BE AMENDED PRIOR TO THE TIME OF SALE. THIS TERM SHEET IS NOT AN OFFER TO SELL THESE SECURITIES AND IT IS NOT A SOLICITATION OF AN OFFER TO BUY THESE SECURITIES IN ANY JURISDICTION WHERE THE OFFER OR SALE IS NOT PERMITTED.
33
Various Various, Various | Collateral Asset Summary – Loan No. 1 Agellan Portfolio | Cut-off Date Balance: Cut-off Date LTV: U/W NCF DSCR: U/W NOI Debt Yield: | $75,000,000 41.9% 3.04x 15.7% |
| Top 10 Tenant Summary(1) | |||||||
| Tenant | Property Type | Credit Rating (Moody's/Fitch/S&P)(2) | Net Rentable Area (Sq. Ft.) | % of Net Rentable Area | U/W Base Rent Per Sq. Ft.(3) | % of Total U/W Base Rent | Lease Expiration |
| Health Care Service Corp.(4)(5) | Office | A3/A-/AA- | 177,114 | 2.9% | $16.00 | 6.9% | 11/30/2025 |
| United Natural Foods Inc.(6) | Industrial | B2/NR/B | 463,172 | 7.6% | $5.66 | 6.4% | 7/31/2022 |
| ALDI, Inc.(4)(7) | Office | NR/NR/NR | 137,986 | 2.3% | $16.09 | 5.4% | 12/31/2028 |
| General Motors LLC(8) | Industrial | Baa3/BBB-/BBB | 400,000 | 6.6% | $5.24 | 5.1% | 8/31/2021 |
| Moran Foods LLC(9) | Industrial | NR/NR/B- | 253,800 | 4.2% | $6.20 | 3.8% | 9/30/2025 |
| Life Technologies Corporation(10) | Industrial | Baa1/BBB/BBB+ | 103,645 | 1.7% | $13.00 | 3.3% | 6/30/2025 |
| Allstate Insurance Co.(11) | Office | Aa3/A+/AA- | 75,623 | 1.2% | $16.00 | 2.9% | 5/31/2024 |
| Ceva Freight LLC(12) | Industrial | B1/NR/B+ | 333,397 | 5.5% | $3.09 | 2.5% | 8/31/2022 |
| Beall's, Inc. (13) | Industrial | NR/NR/NR | 200,000 | 3.3% | $4.80 | 2.3% | 9/30/2021 |
| VTech Communications, Inc.(14) | Industrial | NR/NR/NR | 208,000 | 3.4% | $4.53 | 2.3% | 7/31/2022 |
| Total Major Tenants | 2,352,737 | 38.6% | $7.16 | 41.0% | |||
| Other Tenants | 3,156,625 | 51.8% | $7.67 | 59.0% | |||
| Total Occupied | 5,509,362 | 90.4% | $7.45 | 100.0% | |||
| Vacant | 584,815 | 9.6% | |||||
| Total / Wtd. Avg. | 6,094,177 | 100.0% | |||||
| (1) | Based on the underwritten rent roll. |
| (2) | In certain instances, ratings provided are those of the parent company of the entity shown, whether or not the parent company guarantees the lease. |
| (3) | U/W Base Rent Per Sq. Ft. is inclusive of contractual rent steps taken through June 1, 2021. |
| (4) | ALDI, Inc. reflects an expansion option for 24,597 sq. ft. that was exercised in February 2020. The expansion space is currently occupied by HCSC. HCSC will be relocated within the Naperville Wood Office Center property as part of the ALDI, Inc. expansion, which will allow HCSC to have all of its office space in one building. Additionally, HCSC’s overall footprint will increase slightly with the relocation space from 175,080 sq. ft. to 177,114 sq. ft. The expansion and relocation are estimated to occur in June/July 2021. |
| (5) | Health Care Service Corp. has one, five-year renewal option at market rent. |
| (6) | United Natural Foods, Inc. has one, five-year renewal option at market rent. |
| (7) | ALDI, Inc. has one, five-year renewal option at market rent. |
| (8) | General Motors LLC has two, five-year renewal options at the greater of market rent or 90% of the then-current base rent. |
| (9) | Moran Foods LLC has two, seven-year renewal options at $6.75 per sq. ft. and market rent, respectively. |
| (10) | Life Technologies Corporation has one, five-year renewal option beginning at $13.00 per sq. ft. |
| (11) | Allstate Insurance Co. has two, five-year renewal options upon nine months’ notice at 95% of market rent. Allstate Insurance also has a one-time termination option as of any month end between May 2022 and May 2023. |
| (12) | Ceva Freight LLC has two, five-year renewal options at market rent. |
| (13) | In May 2018 Beall’s Inc. vacated and subleased their space to United Natural Foods Inc. Beall’s Inc. has one, three-year renewal option at $5.30 per sq. ft. |
| (14) | VTech Communications, Inc. has one, five-year renewal option at market rent. |
| Lease Rollover Schedule(1)(2) | ||||||||
| Year | # of Leases Expiring | Total Expiring Sq. Ft. | % of Total Sq. Ft. Expiring | Cumulative Sq. Ft. Expiring | Cumulative % of Sq. Ft. Expiring | Annual U/W Base Rent per sq. ft.(3) | % U/W Base Rent Rolling | Cumulative % of U/W Base Rent |
| 2020 & MTM | 43 | 460,033 | 7.5% | 460,033 | 7.5% | $5.87 | 6.6% | 6.6% |
| 2021(4) | 61 | 1,264,748 | 20.8% | 1,724,781 | 28.3% | $6.25 | 19.3% | 25.8% |
| 2022(5) | 45 | 1,523,829 | 25.0% | 3,248,610 | 53.3% | $5.64 | 20.9% | 46.8% |
| 2023 | 38 | 470,932 | 7.7% | 3,719,542 | 61.0% | $8.76 | 10.0% | 56.8% |
| 2024 | 33 | 633,520 | 10.4% | 4,353,062 | 71.4% | $7.11 | 11.0% | 67.8% |
| 2025 | 18 | 786,447 | 12.9% | 5,139,509 | 84.3% | $10.09 | 19.3% | 87.1% |
| 2026 | 3 | 50,301 | 0.8% | 5,189,810 | 85.2% | $9.02 | 1.1% | 88.2% |
| 2027 | 5 | 112,643 | 1.8% | 5,302,453 | 87.0% | $15.54 | 4.3% | 92.5% |
| 2028 | 3 | 202,643 | 3.3% | 5,505,096 | 90.3% | $14.60 | 7.2% | 99.7% |
| 2029 | 0 | 0 | 0.0% | 5,505,096 | 90.3% | $0.00 | 0.0% | 99.7% |
| 2030 & Thereafter | 1 | 4,266 | 0.1% | 5,509,362 | 90.4% | $26.98 | 0.3% | 100.0% |
| Vacant | NAP | 584,815 | 9.6% | 6,094,177 | 100.0% | NAP | NAP | NAP |
| Total / Wtd. Avg. | 250 | 6,094,177 | 100.0% | $7.45 | 100.0% | |||
| (1) | Based on the underwritten rent roll. |
| (2) | Certain tenants may have lease termination options that are exercisable prior to the stated expiration date of the subject lease or leases which are not considered in the lease rollover schedule. |
| (3) | Annual U/W Base Rent per sq. ft. is inclusive of (i) contractual rent steps taken through June 1, 2021 and includes the ALDI, Inc. expansion of approximately 24,597 sq. ft. and HCSC relocation at the Naperville Woods Office Center property. U/W Base Rent has been further adjusted to account for a 10.0% stress to tenants who missed full or partial April and/or May rent payments and/or have requested rent relief during the COVID-19 pandemic. The total stress to U/W Base Rent is $241,419. |
| (4) | General Motors, LLC leases will expire in 2021 and has two, five-year renewal options at the greater of market rent or 90% of the then-current base rent. General Motors, LLC has occupied the property since 1998. General Motors has expressed interest to renew and is expecting to receive a formal proposal with renewal terms from the Borrower Sponsor. |
| (5) | Both United Natural Foods, Inc. and Ceva Freight LLC leases will expire in 2022. United Natural Foods, Inc. has one, five-year renewal option at market rent. Ceva Freight LLC has two, five-year renewal options at market rent. United Natural Foods Inc. and Ceva Freight have both engaged the Borrower Sponsor about potentially expanding at expiration if any space were to become vacant at the respective properties. |
THE INFORMATION IN THIS STRUCTURAL AND COLLATERAL TERM SHEET IS NOT COMPLETE AND MAY BE AMENDED PRIOR TO THE TIME OF SALE. THIS TERM SHEET IS NOT AN OFFER TO SELL THESE SECURITIES AND IT IS NOT A SOLICITATION OF AN OFFER TO BUY THESE SECURITIES IN ANY JURISDICTION WHERE THE OFFER OR SALE IS NOT PERMITTED.
34
Various Various, Various | Collateral Asset Summary – Loan No. 1 Agellan Portfolio | Cut-off Date Balance: Cut-off Date LTV: U/W NCF DSCR: U/W NOI Debt Yield: | $75,000,000 41.9% 3.04x 15.7% |
Major Tenants. The top five tenants occupying the Agellan Properties by U/W Base Rent are Health Care Service Crop. (177,114 sq. ft.; 2.9% of NRA; 6.9% of U/W Base Rent), United Natural Foods, Inc. (463,172 sq. ft.; 7.6% of NRA; 6.4% of U/W Base Rent), ALDI, Inc. (137,986 sq. ft.; 2.3% of NRA; 5.4% of U/W Base Rent), General Motors LLC (400,000 sq. ft.; 6.6% of NRA; 5.1% of U/W Base Rent) and Moran Foods LLC (253,800 sq. ft.; 4.2% of NRA; 3.8% of U/W Base Rent).
Health Care Service Corp. (177,114 sq. ft.; 2.9% of NRA; 6.9% of U/W Base Rent). Health Care Service Corp. (“HCSC”) is an independent licensee of the Blue Cross and Blue Shield Association. HCSC is the largest customer-owned health insurer in the United States and fifth largest overall. Health Care Service Corp operates through Blue Cross and Blue Shield Plans in Illinois, Montana, New Mexico, Oklahoma and Texas. HCSC affiliates and subsidiaries such as Dearborn National, Medecision and Dental Network of America offer group life, disability and dental solutions, as well as a range of other individual solutions. The company, founded in 1936, serves more than 16 million members across five states and employs more than 23,000 people in over 60 local offices. A portion of the space occupied by HCSC will be relocated within the Naperville Wood Office Center property in conjunction with the ALDI, Inc. expansion, which will allow HCSC to have all of its office space in one building. Additionally, HCSC’s overall footprint will increase slightly with the relocation space from 175,080 sq. ft. to 177,114 sq. ft. The expansion and relocation are estimated to occur in June/July 2021. Health Care Service Corp. has one, five-year renewal option at market rent.
United Natural Foods, Inc. (463,172 sq. ft.; 7.6% of NRA; 6.4% of U/W Base Rent). United Natural Foods, Inc. engages in the distribution of natural, organic, and specialty foods and non-food products. The company is headquartered in Providence, Rhode Island. United Natural Foods, Inc. has one, five-year renewal option at market rent.
ALDI, Inc. (137,986 sq. ft.; 2.3% of NRA; 5.4% of U/W Base Rent). ALDI, Inc. owns and operates grocery stores throughout the U.S. ALDI, Inc. offers grocery, meat, fresh produce, wine and beer, beverages, and other home products. ALDI, Inc. is located in Batavia, Illinois. ALDI, Inc. has approximately 3,000 total employees across all of its locations and generates approximately $4.32 billion in sales annually. ALDI, Inc. operated more than 1,900 stores in across 36 states. In February 2020, ALDI, Inc. exercised an expansion option for an additional 24,597 sq. ft. ALDI, Inc. has one, five-year renewal option at market rent.
General Motors LLC (400,000 sq. ft.; 6.6% of NRA; 5.1% of U/W Base Rent). General Motors LLC is the fourth largest automaker globally and the largest in the U.S. with approximately $246.6 billion in total assets as of March 31, 2020. Headquartered in Detroit, Michigan, General Motors LLC’s brands include Chevrolet, Buick, GMC and Cadillac. General Motors LLC has two, five-year renewal options at the greater of market rent or 90% of the then-current base rent.
Moran Foods LLC (253,800 sq. ft.; 4.2% of NRA; 3.8% of U/W Base Rent). Moran Foods LLC is the parent company of Save-A-Lot Holdings, LLC (“Save-A-Lot”). Save-A-Lot is an American discount grocery store chain with approximately 1,300 stores across 36 states with over $4.0 billion in annual sales. Headquartered in St. Louis, Missouri, Save-A-Lot’s stores carry most grocery products, including an assortment of fresh, canned and frozen produce as well as meat, meal products, household items and everyday groceries. Moran Foods LLC has two, seven-year renewal options at $6.75 per sq. ft. and market rent, respectively.
Environmental Matters. The Phase I environmental reports dated February 26, 2020 through March 26, 2020 recommended no further action at the Agellan Portfolio.
The Market. The Agellan Portfolio is geographically diverse with properties located across nine states which include the top five states by U/W Base Rent, Texas (46.7% of allocated loan amount (“ALA”); 43.4% of U/W Base Rent), Illinois (18.0% of ALA; 22.8% of U/W Base Rent), Florida (12.6% of ALA; 11.7% of U/W Base Rent), Georgia (11.3% of ALA; 10.9% of U/W Base Rent) and Michigan (3.4% of ALA; 5.1% of U/W Base Rent).
| Geographic Distribution | |||||||||
| State | Number of Properties | Total Sq. Ft. | % of Total Sq. Ft. | Allocated Loan Amount | (%) Allocated Loan Amount | U/W Base Rent | % of U/W Base Rent | Appraised Value | % of Appraised Value |
| Texas | 21 | 2,474,352 | 40.6% | $35,037,841 | 46.7% | $17,819,019 | 43.4% | $257,400,000 | 46.7% |
| Illinois | 9 | 796,783 | 13.1% | 13,507,444 | 18.0% | 9,375,116 | 22.8% | 99,000,000 | 18.0% |
| Florida | 1 | 906,449 | 14.9% | 9,452,233 | 12.6% | 4,804,386 | 11.7% | 70,200,000 | 12.7% |
| Georgia | 9 | 788,791 | 12.9% | 8,452,854 | 11.3% | 4,471,074 | 10.9% | 61,750,000 | 11.2% |
| Michigan | 1 | 400,000 | 6.6% | 2,558,933 | 3.4% | 2,097,244 | 5.1% | 18,750,000 | 3.4% |
| Indiana | 1 | 434,354 | 7.1% | 3,288,462 | 4.4% | 1,385,853 | 3.4% | 24,100,000 | 4.4% |
| Ohio | 2 | 183,818 | 3.0% | 1,248,759 | 1.7% | 404,218 | 1.0% | 9,150,000 | 1.7% |
| Maryland | 1 | 57,590 | 0.9% | 995,658 | 1.3% | 426,784 | 1.0% | 7,300,000 | 1.3% |
| Kentucky | 1 | 52,040 | 0.9% | 457,816 | 0.6% | 247,686 | 0.6% | 3,350,000 | 0.6% |
| Portfolio Total | 46 | 6,094,177 | 100.0% | $75,000,000 | 100.0% | $41,031,381 | 100.0% | $551,000,000 | 100.0% |
THE INFORMATION IN THIS STRUCTURAL AND COLLATERAL TERM SHEET IS NOT COMPLETE AND MAY BE AMENDED PRIOR TO THE TIME OF SALE. THIS TERM SHEET IS NOT AN OFFER TO SELL THESE SECURITIES AND IT IS NOT A SOLICITATION OF AN OFFER TO BUY THESE SECURITIES IN ANY JURISDICTION WHERE THE OFFER OR SALE IS NOT PERMITTED.
35
Various Various, Various | Collateral Asset Summary – Loan No. 1 Agellan Portfolio | Cut-off Date Balance: Cut-off Date LTV: U/W NCF DSCR: U/W NOI Debt Yield: | $75,000,000 41.9% 3.04x 15.7% |
The Agellan Portfolio is located across 12 U.S. markets which include the top five markets by U/W Base Rent, Houston (24.2% of ALA; 23.2% of U/W Base Rent), Chicago (18.0% of; 22.8% of U/W Base Rent), Austin (13.7% of ALA; 12.9% of U/W Base Rent), Tampa (12.6% of ALA; 11.7% of U/W Base Rent) and Atlanta (11.3% of ALA; 10.9% of U/W Base Rent).
| Market Overview | |||||||||
| Market | Number of Properties | Total Sq. Ft. | % of Total Sq. Ft. | Allocated Loan Amount | (%) Allocated Loan Amount | U/W Base Rent | % of U/W Base Rent | Appraised Value | % of Appraised Value |
| Houston | 12 | 1,513,116 | 24.8% | $18,158,189 | 24.2% | $9,530,614 | 23.2% | $133,100,000 | 24.2% |
| Chicago | 9 | 796,783 | 13.1% | 13,507,444 | 18.0% | 9,375,116 | 22.8% | 99,000,000 | 18.0% |
| Austin | 5 | 411,604 | 6.8% | 10,259,926 | 13.7% | 5,278,622 | 12.9% | 75,200,000 | 13.6% |
| Tampa | 1 | 906,449 | 14.9% | 9,452,233 | 12.6% | 4,804,386 | 11.7% | 70,200,000 | 12.7% |
| Atlanta | 9 | 788,791 | 12.9% | 8,452,854 | 11.3% | 4,471,074 | 10.9% | 61,750,000 | 11.2% |
| Flint | 1 | 400,000 | 6.6% | 2,558,933 | 3.4% | 2,097,244 | 5.1% | 18,750,000 | 3.4% |
| Dallas | 1 | 253,800 | 4.2% | 3,593,672 | 4.8% | 1,573,560 | 3.8% | 26,720,000 | 4.8% |
| San Antonio | 3 | 295,832 | 4.9% | 3,026,055 | 4.0% | 1,436,224 | 3.5% | 22,380,000 | 4.1% |
| Indianapolis | 1 | 434,354 | 7.1% | 3,288,462 | 4.4% | 1,385,853 | 3.4% | 24,100,000 | 4.4% |
| Baltimore | 1 | 57,590 | 0.9% | 995,658 | 1.3% | 426,784 | 1.0% | 7,300,000 | 1.3% |
| Columbus | 2 | 183,818 | 3.0% | 1,248,759 | 1.7% | 404,218 | 1.0% | 9,150,000 | 1.7% |
| Cincinnati | 1 | 52,040 | 0.9% | 457,816 | 0.6% | 247,686 | 0.6% | 3,350,000 | 0.6% |
| Portfolio Total | 46 | 6,094,177 | 100.0% | $75,000,000 | 100.0% | $41,031,381 | 100.0% | $551,000,000 | 100.0% |
Major Markets.
Houston. According to a third party report, the Houston Industrial market ended the first quarter 2020 with a vacancy rate of 7.6%. The reported market vacancy rates for logistics and flex properties were 8.4% and 10.0%, respectively. The existing market inventory is made up of 74.6% logistics properties and 8.1% flex properties based on total sq. ft. Rental rates ended the first quarter of 2020 at $7.42 per sq. ft. The average quoted rates for logistics and flex properties were $6.91 per sq. ft. and $10.61 per sq. ft., respectively. The 12-month net absorption ending in the first quarter 2020 was 8,621,259 sq. ft. for logistics properties and -49,931 sq. ft. for flex properties.
According to a third party report, the Houston Office market ended the first quarter 2020 with a vacancy rate of 16.8%. The reported vacancy rates for Class A and Class B buildings were 19.6% and 17.1%, respectively. The existing market inventory is comprised of 44.5% Class A, 42.8% Class B, and 12.6% Class C based on total sq. ft. The average quoted rental rate in the first quarter 2020 for all classes was $28.36 per sq. ft. The average quoted rental rate for Class A and B was $34.07 per sq. ft. and $24.25 per sq. ft., respectively. The 12-month net absorption ending in the first quarter 2020 for Class A & B in the market was 1,251,779 sq. ft. and -1,448,622 sq. ft., respectively.
| Historical Market Occupancy - Industrial(1) | |||||||||||
| 2008 | 2009 | 2010 | 2011 | 2012 | 2013 | 2014 | 2015 | 2016 | 2017 | 2018 | 2019 |
| 93.9% | 93.1% | 93.7% | 94.3% | 95.0% | 94.5% | 95.1% | 94.9% | 94.6% | 94.8% | 94.3% | 93.3% |
| (1) | Source: Third party report. |
| Historical Market Occupancy - Office(1) | |||||||||||
| 2008 | 2009 | 2010 | 2011 | 2012 | 2013 | 2014 | 2015 | 2016 | 2017 | 2018 | 2019 |
| 88.4% | 86.7% | 86.9% | 87.2% | 88.4% | 88.6% | 89.4% | 87.1% | 85.5% | 84.0% | 83.8% | 83.4% |
| (1) | Source: Third party report. |
Chicago. According to a third party report, the Chicago Industrial market ended the first quarter 2020 with a vacancy rate of 6.2%. The reported market vacancy rates for logistics and flex properties were 7.1% and 7.6%, respectively. The existing market inventory is made up of 66.1% logistics properties and 5.8% flex properties based on total sq. ft. Rental rates ended the first quarter of 2020 at $7.36 per sq. ft. The average quoted rates for logistics and flex properties were $6.87 per sq. ft. and $12.24 per sq. ft., respectively. The 12-month net absorption ending in the first quarter 2020 was 535,853 sq. ft. for flex properties and 14,631,591 sq. ft. for logistics properties.
According to a third party report, the Chicago Office market ended the first quarter 2020 with a vacancy rate of 12.2%. The reported vacancy rates for Class A and Class B buildings were 15.2% and 11.7%, respectively. The existing market inventory is comprised of 39.0% Class A, 44.2% Class B, and 16.7% Class C based on total sq. ft. The average quoted rental rate in the first quarter 2020 for all classes was $29.44 per sq. ft. The average quoted rental rate for Class A and B was $37.39 per sq. ft. and $25.20 per sq. ft., respectively. The 12-month net absorption ending in the first quarter 2020 for Class A and B in the market was 3,566,358 sq. ft. and -457,122 sq. ft., respectively.
THE INFORMATION IN THIS STRUCTURAL AND COLLATERAL TERM SHEET IS NOT COMPLETE AND MAY BE AMENDED PRIOR TO THE TIME OF SALE. THIS TERM SHEET IS NOT AN OFFER TO SELL THESE SECURITIES AND IT IS NOT A SOLICITATION OF AN OFFER TO BUY THESE SECURITIES IN ANY JURISDICTION WHERE THE OFFER OR SALE IS NOT PERMITTED.
36
Various Various, Various | Collateral Asset Summary – Loan No. 1 Agellan Portfolio | Cut-off Date Balance: Cut-off Date LTV: U/W NCF DSCR: U/W NOI Debt Yield: | $75,000,000 41.9% 3.04x 15.7% |
| Historical Market Occupancy - Industrial(1) | |||||||||||
| 2008 | 2009 | 2010 | 2011 | 2012 | 2013 | 2014 | 2015 | 2016 | 2017 | 2018 | 2019 |
| 89.8% | 88.1% | 88.2% | 89.1% | 90.6% | 91.3% | 92.6% | 93.2% | 93.8% | 93.7% | 94.2% | 94.1% |
| (1) | Source: Third party report. |
| Historical Market Occupancy - Office(1) | |||||||||||
| 2008 | 2009 | 2010 | 2011 | 2012 | 2013 | 2014 | 2015 | 2016 | 2017 | 2018 | 2019 |
| 87.4% | 85.0% | 85.2% | 85.6% | 86.1% | 86.6% | 87.3% | 88.0% | 87.7% | 88.0% | 88.4% | 87.9% |
| (1) | Source: Third party report. |
Austin. According to a third party report, the market vacancy rates for logistics and flex properties were 9.8% and 7.3%, respectively. The existing market inventory is made up of 60.5% logistics properties and 20.9% flex properties based on total sq. ft. Rental rates ended the first quarter of 2020 at $11.30 per sq. ft. The average quoted rates for logistics and flex properties were $9.93 per sq. ft. and $14.31 per sq. ft., respectively. The 12-month net absorption ending in the first quarter 2020 was 1,113,224 sq. ft. for logistics properties and 744,867 sq. ft. for flex properties. According to a third party report, Austin is expected to outperform the state of Texas and nation in 2020, with a high number of technology companies and housing at the forefront. Long term, Austin is viewed as a market with a well-educated labor force, high concentration of technology businesses and a relatively low cost of living compared to other high technology based industries which is anticipated to fuel a high population growth for the market.
| Historical Market Occupancy - Industrial(1) | |||||||||||
| 2008 | 2009 | 2010 | 2011 | 2012 | 2013 | 2014 | 2015 | 2016 | 2017 | 2018 | 2019 |
| 90.2% | 87.8% | 88.5% | 89.6% | 91.3% | 93.5% | 93.5% | 95.6% | 95.6% | 93.6% | 93.6% | 92.8% |
| (1) | Source: Third party report. |
Tampa. According to a third party report, the Tampa Bay Industrial market ended the first quarter 2020 with a vacancy rate of 5.0%. The reported market vacancy rates for logistics properties was 5.4%. The existing market inventory is made up of 66.3% logistics properties based on total sq. ft. Rental rates ended the first quarter at $7.72 per sq. ft. The average quoted rates for logistics properties was $7.11 per sq. ft. The 12-month net absorption ending in the first quarter 2020 for logistics properties was 2,025,279 sq. ft. According to a third party report, as of year-end 2019, Tampa’s industrial sector outpaced the industrial sectors in the state of Florida in relation to demand growth at approximately 2.8 million sq. ft. of absorbed space. Tampa was the only market in the state that saw improved growth from approximately 2.7 million sq. ft. of positive net absorption year over year.
| Historical Market Occupancy - Industrial(1) | |||||||||||
| 2008 | 2009 | 2010 | 2011 | 2012 | 2013 | 2014 | 2015 | 2016 | 2017 | 2018 | 2019 |
| 92.3% | 89.4% | 89.3% | 89.8% | 90.2% | 91.6% | 92.3% | 93.8% | 95.0% | 95.1% | 95.3% | 95.1% |
| (1) | Source: Third party report. |
Atlanta. According to a third party report, the Atlanta Industrial market ended the first quarter 2020 with a vacancy rate of 6.1%. The reported market vacancy rates for logistics and flex properties were 6.7% and 5.5%, respectively. The existing market inventory is made up of 77.4% logistics properties and 9.1% flex properties based on total sq. ft. Rental rates ended the first quarter at $6.17 per sq. ft. The average quoted rates for logistics and flex properties were $5.52 per sq. ft. and $11.03 per sq. ft., respectively. The 12-month net absorption ending in the first quarter 2020 was 11,337,139 sq. ft. for logistics properties and -202,543 sq. ft. for flex properties. According to a third party report, the Atlanta market is seen as Georgia’s main growth engine and one of the strongest economies in the nation. Job growth, in the Atlanta market outsize business services and has averaged approximately 2.0% as of year-end 2019, which has been one of the best in the nation for nine consecutive years.
| Historical Market Occupancy - Industrial(1) | |||||||||||
| 2008 | 2009 | 2010 | 2011 | 2012 | 2013 | 2014 | 2015 | 2016 | 2017 | 2018 | 2019 |
| 87.5% | 86.4% | 85.6% | 86.9% | 87.5% | 88.7% | 91.5% | 93.1% | 93.0% | 94.1% | 94.6% | 94.4% |
| (1) | Source: Third party report. |
THE INFORMATION IN THIS STRUCTURAL AND COLLATERAL TERM SHEET IS NOT COMPLETE AND MAY BE AMENDED PRIOR TO THE TIME OF SALE. THIS TERM SHEET IS NOT AN OFFER TO SELL THESE SECURITIES AND IT IS NOT A SOLICITATION OF AN OFFER TO BUY THESE SECURITIES IN ANY JURISDICTION WHERE THE OFFER OR SALE IS NOT PERMITTED.
37
Various Various, Various | Collateral Asset Summary – Loan No. 1 Agellan Portfolio | Cut-off Date Balance: Cut-off Date LTV: U/W NCF DSCR: U/W NOI Debt Yield: | $75,000,000 41.9% 3.04x 15.7% |
Cash Flow Analysis.
| Portfolio Operating History | ||||||||||
| 2015 | 2016 | 2017 | 2018 | 2019 | 2020 Budget | |||||
| 2015 Reporting Assets | ||||||||||
| Number of Properties | 27 | 27 | 27 | 27 | 27 | 27 | ||||
| Effective Gross Revenue | $40,377,590 | $41,938,945 | $40,607,440 | $42,687,111 | $43,265,751 | $44,216,063 | ||||
| Operating Expenses | $15,493,935 | $15,426,605 | $15,832,843 | $16,065,442 | $16,124,634 | $16,800,898 | ||||
| Net Operating Income | $24,883,655 | $26,512,341 | $24,774,596 | $26,621,670 | $27,141,118 | $27,415,165 | ||||
| Year-over-Year Change | - | 6.5% | -6.6% | 7.5% | 2.0% | 1.0% | ||||
| 2016 Reporting Assets | ||||||||||
| Number of Properties | 31 | 31 | 31 | 31 | 31 | |||||
| Effective Gross Revenue | $43,483,706 | $50,440,354 | $52,850,050 | $54,478,273 | $55,355,348 | |||||
| Operating Expenses | $15,881,067 | $19,253,268 | $19,685,230 | $20,636,890 | $20,967,544 | |||||
| Net Operating Income | $27,602,639 | $31,187,086 | $33,164,820 | $33,841,384 | $34,387,804 | |||||
| Year-over-Year Change | - | 13.0% | 6.3% | 2.0% | 1.6% | |||||
| 2017 Reporting Assets | ||||||||||
| Number of Properties | 41 | 41 | 41 | 41 | ||||||
| Effective Gross Revenue | $53,679,748 | $58,304,052 | $60,181,340 | $61,115,986 | ||||||
| Operating Expenses | $19,917,149 | $20,981,732 | $22,007,429 | $22,423,094 | ||||||
| Net Operating Income | $33,762,598 | $37,322,320 | $38,173,911 | $38,692,892 | ||||||
| Year-over-Year Change | - | 10.5% | 2.3% | 1.4% | ||||||
| 2018 Reporting Assets | ||||||||||
| Number of Properties | 46 | 46 | 46 | |||||||
| Effective Gross Revenue | $60,700,041 | $63,486,372 | $64,626,262 | |||||||
| Operating Expenses | $21,738,754 | $23,013,221 | $23,452,522 | |||||||
| Net Operating Income | $38,961,287 | $40,473,151 | $41,173,740 | |||||||
| Year-over-Year Change | - | 3.9% | 1.7% | |||||||
THE INFORMATION IN THIS STRUCTURAL AND COLLATERAL TERM SHEET IS NOT COMPLETE AND MAY BE AMENDED PRIOR TO THE TIME OF SALE. THIS TERM SHEET IS NOT AN OFFER TO SELL THESE SECURITIES AND IT IS NOT A SOLICITATION OF AN OFFER TO BUY THESE SECURITIES IN ANY JURISDICTION WHERE THE OFFER OR SALE IS NOT PERMITTED.
38
Various Various, Various | Collateral Asset Summary – Loan No. 1 Agellan Portfolio | Cut-off Date Balance: Cut-off Date LTV: U/W NCF DSCR: U/W NOI Debt Yield: | $75,000,000 41.9% 3.04x 15.7% |
| Cash Flow Analysis | ||||||
| 2016 | 2017 | 2018 | 2019(1) | U/W(1)(2) | U/W PSF | |
| Agellan Properties Included | 31 | 41 | 46 | 46 | 46 | |
| Base Rent | $30,444,923 | $36,778,978 | $40,209,368 | $42,047,666 | $41,031,381 | $6.73 |
| Vacant Income(3) | 0 | 0 | 0 | 0 | 5,221,640 | $0.86 |
| Gross Potential Rent | $30,444,923 | $36,778,978 | $40,209,368 | $42,047,666 | $46,253,021 | $7.59 |
| Total Reimbursements(4) | 12,782,653 | 16,793,058 | 19,551,436 | 21,118,949 | 20,332,677 | $3.34 |
| Gross Potential Income | $43,227,576 | $53,572,036 | $59,760,803 | $63,166,615 | $66,585,698 | $10.93 |
| Less: Vacancy(5) | (53,002) | (16,561) | (50,095) | (101,504) | (7,100,706) | ($1.17) |
| Other Income | 309,133 | 124,273 | 989,333 | 421,261 | 571,000 | $0.09 |
| Effective Gross Income | 43,483,706 | $53,679,748 | $60,700,041 | $63,486,372 | $60,055,992 | $9.85 |
| Total Fixed Expenses | $7,331,761 | $8,981,519 | $10,147,809 | $10,478,429 | $11,331,286 | $1.86 |
| Total Operating Expenses | $8,549,306 | $10,935,630 | $11,590,945 | $12,534,792 | $12,500,350 | $2.05 |
| Total Expenses | $15,881,067 | $19,917,149 | $21,738,754 | $23,013,221 | $23,831,636 | $3.91 |
| Net Operating Income | $27,602,639 | $33,762,598 | $38,961,287 | $40,473,151 | $36,224,356 | $5.94 |
| TI/LC | 0 | 0 | 0 | 0 | 2,623,997 | $0.43 |
| Capital Expenditures | 0 | 0 | 0 | 0 | 693,998 | $0.11 |
| Net Cash Flow | $27,602,639 | $33,762,598 | $38,961,287 | $40,473,151 | $32,906,361 | $5.40 |
| (1) | The change from 2019 Net Operating Income to U/W Net Operating Income is largely attributable to adjustments made in relation to dark and known to be vacating tenants. |
| (2) | U/W Base Rent is inclusive of contractual rent steps taken through June 1, 2021 and includes the ALDI, Inc. expansion of approximately 24,597 sq. ft. and HCSC relocation at the Naperville Woods Office Center property. U/W Base Rent has been further adjusted to account for a 10.0% stress to tenants who missed full or partial rent payments in April, May and/or June or have requested rent relief during the COVID-19 pandemic. The total stress to U/W Base Rent is $223,074. |
| (3) | Vacant Income includes all applicable dark tenants as well as known vacates. |
| (4) | Total Reimbursements include reimbursements to lease terms of each tenant. An additional stress loss adjustment of 10.0% was applied to any tenants that missed full rent payments in April, May and/or June. The total stress to reimbursements is $77,899. |
| (5) | Vacancy is underwritten to 10.7%, which represents the sum of economic vacancy of the Agellan Portfolio, inclusive of a minimum vacancy of 5.0% for all Agellan Properties. |
Property Management. The Agellan Portfolio is managed by 11 individual managers which include Agellan Management LP, Colliers International Management - Atlanta, LLC, Adena Commercial LLC d/b/a Colliers International Greater Columbus Region, PCR Property Services, LLC d/b/a NAI Partners, Jones Lang LaSalle Americas, Inc., NAI Hiffman Asset Management, LLC, Stream Realty Partners-Austin, L.P., Stream Realty Partners-Houston, L.P., Stream Realty-Illinois, L.L.C., Hiffman Asset Management, LLC d/b/a Hiffman National, LLC, and Stream Realty Partners - Central TX, L.P.
Lockbox / Cash Management. The Agellan Portfolio Whole Loan documents require a hard lockbox and in-place cash management. At loan origination, the Borrowers were required to deliver tenant direction letters within 30 days following the loan origination date to the existing tenants at the Agellan Portfolio Properties, directing each tenant to remit its rent checks directly to the lender-controlled lockbox. All funds in the lockbox account are required to be swept to a lender-controlled cash management account every business day. Provided no Cash Sweep Period (as defined below) is continuing, all funds in the cash management account will be transferred into the Borrowers’ operating account. During a Cash Sweep Period, all excess cash in the cash management account after payment of debt service, required reserves, operating expenses, approved extraordinary expenses and mezzanine debt service will be retained by the lender as additional collateral for the Agellan Portfolio Whole Loan and disbursed to the Borrowers for payment of certain permitted amounts, including the payment of shortfalls in debt service and mezzanine debt service and payment of capital expenditure work.
A “Cash Sweep Period” will commence upon the occurrence of (i) an event of default under the Agellan Portfolio Whole Loan documents, (ii) a bankruptcy action of any individual Borrower or any general partner or managing member, as applicable, of an individual Borrower, (iii) the date that is 30 days following any bankruptcy action of any property manager (unless as of such date the manager has been replaced in accordance with the Agellan Portfolio Whole Loan documents), (iv) the debt service coverage ratio for any calendar quarter (based upon Agellan Portfolio Whole Loan and Agellan Portfolio Mezzanine Loan (as defined below) assuming a 30-year amortization on the trailing three-month period immediately preceding the end of such calendar quarter) being less than 1.15x, or (v) an event of default under the Agellan Portfolio Mezzanine Loan documents.
A Cash Sweep Period will cease to exist upon the following events (each, a “Cash Sweep Event Cure”): with respect to (a) clause (i) or (v) above, a cure of such event of default, (b) clause (iii) above, the replacement of the property manager with a qualified manager under a replacement management agreement in accordance with the Agellan Portfolio Whole Loan documents, or (c) clause (iv) above, the achievement of a debt service coverage ratio of 1.15x or greater for any calendar quarter based upon a 30-year amortization on the trailing three-month period immediately preceding the end of such calendar quarter; provided (1) no other event of default is continuing under any Agellan Portfolio Whole Loan documents or Agellan Portfolio Mezzanine Loan documents, and (2) the Borrowers will have paid all of the lender’s reasonable and actual out-of-pocket costs and expenses and the mezzanine borrowers will have paid all of Mezzanine Lender’s (as defined below) reasonable and actual out-of-pocket costs and expenses, in each case, incurred by the lender or
THE INFORMATION IN THIS STRUCTURAL AND COLLATERAL TERM SHEET IS NOT COMPLETE AND MAY BE AMENDED PRIOR TO THE TIME OF SALE. THIS TERM SHEET IS NOT AN OFFER TO SELL THESE SECURITIES AND IT IS NOT A SOLICITATION OF AN OFFER TO BUY THESE SECURITIES IN ANY JURISDICTION WHERE THE OFFER OR SALE IS NOT PERMITTED.
39
Various Various, Various | Collateral Asset Summary – Loan No. 1 Agellan Portfolio | Cut-off Date Balance: Cut-off Date LTV: U/W NCF DSCR: U/W NOI Debt Yield: | $75,000,000 41.9% 3.04x 15.7% |
Mezzanine Lender, as applicable, in connection with such Cash Sweep Event Cure including, reasonable and actual out-of-pocket attorney’s fees and expenses.
Initial and Ongoing Reserves. At loan origination, the Borrowers deposited (i) $6,410,963 for outstanding TI/LC obligations and free rent, (ii) $2,985,266 into the required repair reserve for deferred maintenance, (iii) $2,000,000 into a working capital reserve for shortfalls in debt service and operating expenses and the payment of any replacements, leasing costs, taxes, other charges and/or insurance premiums and (iv) $172,050 into the gap rent reserve.
Tax Reserve. The Borrowers are required to deposit into a tax reserve, on a monthly basis, 1/12 of the estimated (a) annual real estate taxes, and (b) during a Cash Sweep Period, annual maintenance charges, impositions and any other charges levied or assessed against the Agellan Portfolio Properties, unless the Borrowers deliver evidence reasonably acceptable to lender that such amounts required for real estate taxes and maintenance charges, impositions and any other charges have or will be paid directly by a tenant. As of the origination date, the requirement for the payment of monthly real estate taxes for tenants have been paid directly by the Borrowers, with the exception of a small portion of the Supervalu property which was paid directly by the tenant.
Insurance Reserve. The Borrowers are required to deposit into an insurance reserve, on a monthly basis, 1/12 of estimated insurance premiums. In the event the borrowers obtain and maintain a blanket insurance policy that complies with the requirements of the Agellan Portfolio Whole Loan documents, the requirement for monthly deposits into the insurance reserve will be waived. As of the origination date, an acceptable blanket policy was in place.
Replacement Reserve. The Borrowers are required to deposit into the replacement reserve, on a monthly basis, approximately $101,570 (1/12 of $0.20 per sq. ft.), subject to a cap of the amount equal to 36 times the required monthly deposit (approximately $3.7 million).
TI/LC Reserve. The Borrowers are required to deposit into the TI/LC reserve, on a monthly basis, approximately $431,671 (1/12 of $0.85 per sq. ft.), subject to a cap of the amount equal to 36 times the required monthly deposit (approximately $15.5 million).
Working Capital Reserve. Provided no event of default exists, lender will make disbursements from the working capital reserve for (i) the payment of shortfalls in the payment of debt service of mezzanine debt service, (ii) the payment of shortfalls for any documented operating expenses, (iii) the payment of any replacements at any Agellan Portfolio Property, (iv) the payment of any leasing costs at any Agellan Portfolio Property to the extent amounts in the TI/LC reserve are insufficient to pay such amounts and (v) the payment of taxes, other charges and insurance premiums at any Agellan Portfolio Property to the extent amounts in the taxes and insurance reserves are insufficient to pay such amounts.
Common Charges Funds Reserve. During the continuance of a Cash Sweep Period, the Borrowers are required to deposit into the common charges reserve, on a monthly basis, an amount equal to 1/12 of the fees, dues, charges and assessments payable under the condominium documents (the “Common Charges”) that the lender estimates will be payable during the next ensuing 12 months in order to accumulate sufficient funds to pay all such Common Charges at least 30 days prior to their respective due dates.
Current Mezzanine or Secured Subordinate Indebtedness. Concurrently with the funding of the Agellan Portfolio Whole Loan, the lender (in such capacity, the “Mezzanine Lender”) also funded a mezzanine loan in the amount of $31.0 million (the “Agellan Portfolio Mezzanine Loan”). The Agellan Portfolio Mezzanine Loan is secured by the pledge of the direct or indirect equity interest in the borrowers and is coterminous with the Agellan Portfolio Whole Loan. The Agellan Portfolio Mezzanine Loan accrues interest at a rate of 9.00000% per annum. Based on the Agellan Portfolio Whole Loan and the Agellan Portfolio Mezzanine Loan, the cumulative Cut-off Date LTV is 78.8%, the cumulative U/W NCF DSCR is 1.54x and the cumulative U/W NOI Debt Yield is 8.3%. The rights of the Mezzanine Lender under the Agellan Portfolio Mezzanine Loan are further described under “Description of the Mortgage Pool—Additional Indebtedness—Mezzanine Indebtedness” in the Preliminary Prospectus.
Future Mezzanine or Subordinate Indebtedness Permitted. None.
Other Indebtedness. Each of Agellan Commercial REIT U.S. L.P., 9385 Washington Blvd LP, 6100 McIntosh LP, Agellan Warrenville LP, Continental Drive LP, Norcross Springs LP, Corridor Park LP and Chicago Industrial Properties 1 LP (collectively, the “Intercompany Loan Lenders”) is a lender under a intercompany loan (each, an “Intercompany Loan”) to Piper Commercial Holdings LLC, an indirect parent company of the Intercompany Loan Lenders. The Intercompany Loans are fully funded, non-interest bearing, and collectively have an aggregate outstanding amount of $152,880,751. Each Intercompany Loan is unsecured and subject and subordinate to the Agellan Portfolio Loan in all respects. The borrower under each Intercompany Loan has agreed that so long as the Mortgage Loan remains outstanding, it will not (i) commence any legal or equitable proceedings against an Intercompany Loan Lender or otherwise in connection with such Intercompany Loan or (ii) assert any claims or demands whatsoever under applicable law against the Intercompany Loan Lender.
Partial Releases. Under the Agellan Portfolio Whole Loan documents, the Borrowers have the right to the release an individual Agellan Portfolio Property (each, an “Individual Property”) from the lien of the mortgage, provided that the Borrowers satisfy certain terms and conditions set forth in the Agellan Portfolio Whole Loan documents (the “Individual Loan Repayment Conditions”), including among other
THE INFORMATION IN THIS STRUCTURAL AND COLLATERAL TERM SHEET IS NOT COMPLETE AND MAY BE AMENDED PRIOR TO THE TIME OF SALE. THIS TERM SHEET IS NOT AN OFFER TO SELL THESE SECURITIES AND IT IS NOT A SOLICITATION OF AN OFFER TO BUY THESE SECURITIES IN ANY JURISDICTION WHERE THE OFFER OR SALE IS NOT PERMITTED.
40
Various Various, Various | Collateral Asset Summary – Loan No. 1 Agellan Portfolio | Cut-off Date Balance: Cut-off Date LTV: U/W NCF DSCR: U/W NOI Debt Yield: | $75,000,000 41.9% 3.04x 15.7% |
things (i) no event of default under the Agellan Portfolio Whole Loan documents has occurred and is continuing (other than an event of default that would be cured by the release of such individual Agellan Portfolio Property); (ii) the applicable individual Borrower (each such Borrower, an “Individual Borrower”) will make a voluntary prepayment of the Agellan Portfolio Whole Loan in an amount equal to the Release Price (as defined below) for the Individual Property; (iii) after giving effect to the release of the applicable Individual Property (including the portion of the Agellan Portfolio Whole Loan prepaid pursuant to the terms of the Agellan Portfolio Whole Loan documents), the debt service coverage ratio for the Agellan Portfolio Properties then remaining subject to the liens of the mortgages (excluding the Individual Property requested to be released) based on the trailing 12-month period immediately preceding the release of the applicable Individual Property will be equal to or greater than the greater of (A) the Release Debt Service Coverage Ratio (as defined below), and (B) the debt service coverage ratio for all of the Agellan Portfolio Properties then remaining subject to the liens of the mortgages (including the Individual Property requested to be released) immediately preceding the release of the applicable Individual Property based on the trailing 12 month period immediately preceding the release of the applicable Individual Property (such greater amount, the “Required Release DSCR”), provided that the Borrowers will have the right to do any one or a combination of the following to achieve the Required Release DSCR in accordance with the Agellan Portfolio Whole Loan documents make a prepayment of the Agellan Portfolio Whole Loan, deliver a letter of credit or deposit cash collateral with the lender; and (iv) subsequent to such release, each Individual Borrower will continue to be a special purpose entity. The Agellan Portfolio Whole Loan documents also provide that if the loan-to-value ratio exceeds or would exceed 125% immediately after the release, no release will be permitted unless the principal balance of the Agellan Portfolio Whole Loan is prepaid by an amount set forth in the Agellan Portfolio Whole Loan documents or the borrower delivers a REMIC opinion.
“Release Debt Service Coverage Ratio” means the debt service coverage of 1.70x.
“Release Price” means, with respect to any Individual Property being released, (i) until an amount equal to $60,450,000 has been prepaid in connection with Partial Releases in accordance with the Agellan Portfolio Whole Loan documents, 110% of the Agellan Portfolio Whole Loan amount allocated to such Individual Property and (ii) thereafter, 115% of the Agellan Portfolio Whole Loan amount allocated to such Individual Property.
Outparcel Release. In addition, the Agellan Portfolio Whole Loan documents provide that the Borrowers may release certain non-income producing parcels comprising a portion of Sarasota Distribution Hub, Supervalu and Naperville Woods Office Center properties upon satisfaction of certain conditions set forth in the Agellan Portfolio Whole Loan documents, including, without limitation, the payment of a release price set forth herein.
Condominium Structure. One of the Agellan Properties, owned by Chicago Industrial Properties 1 LP (the “Chicago Industrial Borrower”), is subject to a condominium declaration. The Chicago Industrial Borrower has an approximately 81.15% ownership in common elements, and controls the condominium association’s board of directors. Please see “Description of the Mortgage Pool—Mortgage Pool Characteristics—Fee & Leasehold Estates; Ground Leases” in the Preliminary Prospectus for additional information.
THE INFORMATION IN THIS STRUCTURAL AND COLLATERAL TERM SHEET IS NOT COMPLETE AND MAY BE AMENDED PRIOR TO THE TIME OF SALE. THIS TERM SHEET IS NOT AN OFFER TO SELL THESE SECURITIES AND IT IS NOT A SOLICITATION OF AN OFFER TO BUY THESE SECURITIES IN ANY JURISDICTION WHERE THE OFFER OR SALE IS NOT PERMITTED.
41
1000, 1020 and 1050 Enterprise Way Sunnyvale, CA 94089 | Collateral Asset Summary – Loan No. 2 Moffett Towers Buildings A, B & C | Cut-off Date Balance: Cut-off Date LTV: U/W NCF DSCR: U/W NOI Debt Yield(7): | $75,000,000 38.7% 3.63x 13.1% |

THE INFORMATION IN THIS STRUCTURAL AND COLLATERAL TERM SHEET IS NOT COMPLETE AND MAY BE AMENDED PRIOR TO THE TIME OF SALE. THIS TERM SHEET IS NOT AN OFFER TO SELL THESE SECURITIES AND IT IS NOT A SOLICITATION OF AN OFFER TO BUY THESE SECURITIES IN ANY JURISDICTION WHERE THE OFFER OR SALE IS NOT PERMITTED.
42
1000, 1020 and 1050 Enterprise Way Sunnyvale, CA 94089 | Collateral Asset Summary – Loan No. 2 Moffett Towers Buildings A, B & C | Cut-off Date Balance: Cut-off Date LTV: U/W NCF DSCR: U/W NOI Debt Yield(7): | $75,000,000 38.7% 3.63x 13.1% |
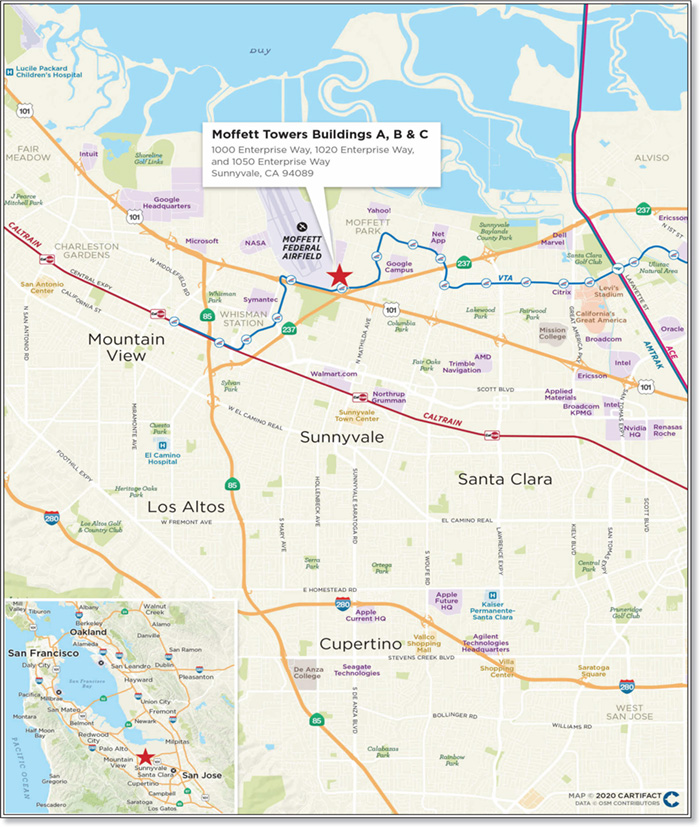
THE INFORMATION IN THIS STRUCTURAL AND COLLATERAL TERM SHEET IS NOT COMPLETE AND MAY BE AMENDED PRIOR TO THE TIME OF SALE. THIS TERM SHEET IS NOT AN OFFER TO SELL THESE SECURITIES AND IT IS NOT A SOLICITATION OF AN OFFER TO BUY THESE SECURITIES IN ANY JURISDICTION WHERE THE OFFER OR SALE IS NOT PERMITTED.
43
1000, 1020 and 1050 Enterprise Way Sunnyvale, CA 94089 | Collateral Asset Summary – Loan No. 2 Moffett Towers Buildings A, B & C | Cut-off Date Balance: Cut-off Date LTV: U/W NCF DSCR: U/W NOI Debt Yield(7): | $75,000,000 38.7% 3.63x 13.1% |
| Mortgage Loan Information | |
| Loan Sellers(1): | GSMC |
| Loan Purpose: | Refinance |
| Credit Assessment | |
| (Fitch/KBRA/S&P)(10): | BBB-sf / BBB(sf) / N/A |
| Borrower Sponsor: | Jay Paul |
| Borrower: | MT1 ABC LLC |
| Original Balance(1)(2): | $75,000,000 |
| Cut-off Date Balance(1)(2): | $75,000,000 |
| % by Initial UPB: | 8.0% |
| Interest Rate: | 3.49000% |
| Payment Date: | 6th of each month |
| First Payment Date: | March 6, 2020 |
| Maturity Date: | February 6, 2030 |
| Amortization: | Interest Only |
| Additional Debt(2)(3): | $368,000,000 Pari Passu Debt; $327,000,000 Subordinate Debt |
| Call Protection(4): | L(24), YM1(5), DorYM1(84), O(7) |
| Lockbox / Cash Management: | Hard / In Place |
| Reserves(5) | |||
| Initial | Monthly | Cap | |
| Taxes: | $0 | $282,271 | NAP |
| Insurance: | $0 | Springing | NAP |
| Replacement: | $0 | $15,858 | NAP |
| TI/LC: | $53,688,909 | $0 | NAP |
| Rent Concessions: | $34,016,766 | NAP | NAP |
| Property Information | ||
| Single Asset / Portfolio: | Portfolio of three properties | |
| Property Type: | Suburban Office | |
| Collateral: | Fee Simple | |
| Location: | Sunnyvale, CA | |
| Year Built / Renovated: | 2008 / NAP | |
| Total Sq. Ft.: | 951,498 | |
| Property Management: | Paul Holdings, Inc. d/b/a Jay Paul Company | |
| Underwritten NOI(6)(7): | $58,061,321 | |
| Underwritten NCF(7): | $56,850,031 | |
| Appraised Value(7)(8): | $1,145,000,000 | |
| Appraisal Date(8): | October 1, 2021 | |
| Historical NOI | ||
| Most Recent NOI(6): | $38,037,092 (December 31, 2019) | |
| 2018 NOI(9): | $37,570,355 (December 31, 2018) | |
| 2017 NOI(9): | $31,545,149 (December 31, 2017) | |
| 2016 NOI: | NAV | |
| Historical Occupancy | ||
| Most Recent Occupancy(7): | 100.0% (January 1, 2021) | |
| 2019 Occupancy: | 100.0% (December 31, 2019) | |
| 2018 Occupancy: | 100.0% (December 31, 2018) | |
| 2017 Occupancy: | 100.0% (December 31, 2017) | |
| Financial Information(1)(2)(7) | ||||||
| Tranche | Cut-off Date Balance | Balance per Sq. Ft. Cut-off / Balloon | LTV Cut-off / Balloon | U/W DSCR NOI / NCF | U/W Debt Yield NOI / NCF | U/W Debt Yield at Balloon NOI / NCF |
| Mortgage Loan | $75,000,000 | |||||
| Pari Passu Notes | 368,000,000 | |||||
| Total Senior Notes | $443,000,000 | $466 / $466 | 38.7% / 38.7% | 3.70x / 3.63x | 13.1% / 12.8% | 13.1% / 12.8% |
| Subordinate Debt | 327,000,000 | |||||
| Whole Loan | $770,000,000 | $809 / $809 | 67.2% / 67.2% | 2.13x / 2.09x | 7.5% / 7.4% | 7.5% / 7.4% |
| (1) | The Moffett Towers Buildings A, B & C Whole Loan (as defined below) was co-originated by Goldman Sachs Banks USA (“GSBI”), JPMorgan Chase Bank, National Association (“JPMCB”), and DBR Investments Co. Limited (“DBRI”). GSMC will be contributing Notes A-1-C-2, A-1-C-6 and A-1-C-9, with an aggregate original principal balance of $75,000,000, to the Benchmark 2020-B18 securitization (together, the “Moffett Towers A, B & C Loan”). |
| (2) | The Moffett Towers Buildings A, B & C Loan is part of a whole loan evidenced by 21 senior pari passu notes and three pari passu subordinate notes, with an aggregate outstanding principal balance as of the Cut-off Date of $770.0 million. For additional information, see “The Loan” herein. |
| (3) | See “Current Mezzanine or Subordinate Indebtedness" herein. |
| (4) | The defeasance lockout period will be at least 29 payments beginning with and including the first payment date of March 6, 2020. The borrower has the option to defease the entire $770.0 million Moffett Towers Buildings A, B & C Whole Loan in whole (and not in part) after the earlier to occur of (i) two years after the closing date of the securitization that includes the last note to be securitized and (ii) February 6, 2023. The assumed defeasance lockout period of 29 months is based on the expected closing date of the Benchmark 2020-B18 securitization in July 2020. The actual lockout period may be longer. In addition, on and after the payment date in March 2022, the Moffett Towers Buildings A, B & C Whole Loan may be voluntarily prepaid with a prepayment fee equal to the greater of the yield maintenance amount or 1% of the unpaid principal balance of the Moffett Towers Buildings A, B & C Whole Loan as of the prepayment date. |
| (5) | For a full description of reserves, please refer to “Initial and Ongoing Reserves” herein. |
| (6) | The increase from Most Recent NOI to Underwritten NOI is primarily attributable to the signing of four new leases since August 2019 and includes the straight line average of contractual rent step increments over the lease term for investment grade tenants. |
| (7) | All NOI, NCF and occupancy information, as well as the appraised value, were determined prior to the emergence of the novel coronavirus pandemic, and the economic disruption resulting from measures to combat the pandemic, and all DSCR, LTV and Debt Yield metrics were calculated, and the Moffett Towers Buildings A, B &C Whole Loan was underwritten, based on such prior information. See “Risk Factors—Coronavirus Pandemic Has Adversely Affected the Global Economy and Will Likely Adversely Affect the Performance of the Mortgage Loans” in the Preliminary Prospectus. |
| (8) | Based on the “As-Stabilized” portfolio value of $1,145,000,000 as of October 1, 2021. The “As-Stabilized” value assumes that both Google and Comcast accept delivery at the Moffett Towers Buildings A, B & C Property and are paying unabated rent as of October 1, 2021. The appraiser also concluded an “As-Is” appraised value of $995,000,000, which results in a Cut-Off Date LTV and Balloon LTV of 44.5% for the Moffett Towers Buildings A, B & C Senior Notes (as defined below) and 77.4% for the Moffett Towers Buildings A, B & C Whole Loan. |
| (9) | The increase in NOI from 2017 to 2018 is attributable to Google’s lease in Building A which commenced on July 26, 2017. The 2018 NOI represents a full year with Google paying unabated rent in Building A. |
| (10) | Fitch and KBRA provided the listed assessments for the Moffett Towers Buildings A, B & C Loan in the context of its inclusion in the mortgage pool. |
THE INFORMATION IN THIS STRUCTURAL AND COLLATERAL TERM SHEET IS NOT COMPLETE AND MAY BE AMENDED PRIOR TO THE TIME OF SALE. THIS TERM SHEET IS NOT AN OFFER TO SELL THESE SECURITIES AND IT IS NOT A SOLICITATION OF AN OFFER TO BUY THESE SECURITIES IN ANY JURISDICTION WHERE THE OFFER OR SALE IS NOT PERMITTED.
44
1000, 1020 and 1050 Enterprise Way Sunnyvale, CA 94089 | Collateral Asset Summary – Loan No. 2 Moffett Towers Buildings A, B & C | Cut-off Date Balance: Cut-off Date LTV: U/W NCF DSCR: U/W NOI Debt Yield(7): | $75,000,000 38.7% 3.63x 13.1% |
The Loan. The Moffett Towers Buildings A, B & C Loan is part of a whole loan with an aggregate outstanding principal balance as of the Cut-off Date of $770.0 million (the “Moffett Towers Buildings A, B & C Whole Loan”), which is secured by the borrower’s fee simple interest in three, eight-story Class A office buildings located in Sunnyvale, California (the “Moffett Towers Buildings A, B & C Property”). The Moffett Towers Buildings A, B & C Whole Loan is comprised of (i) a senior loan, comprised of 21 senior pari passu notes with an aggregate principal balance as of the Cut-off Date of $443.0 million (the “Moffett Towers Buildings A, B & C Senior Notes”), three of which (Notes A-1-C-2, A-1-C-6 and A-1-C-9) with an aggregate outstanding principal balance as of the Cut-off Date of $75.0 million are being contributed to the Benchmark 2020-B18 trust and constitute the Moffett Towers Buildings A, B & C Loan, and (ii) three pari passu subordinate notes with an aggregate outstanding principal balance as of the Cut-off Date of $327.0 million (collectively, the “Moffett Towers Buildings A, B & C Subordinate Companion Notes”) as detailed in the note summary table below. The relationship between the holders of the Moffett Towers Buildings A, B & C Senior Notes and Moffett Towers Buildings A, B & C Subordinate Companion Notes is governed by a co-lender agreement as described under “Description of the Mortgage Pool—The Whole Loans—The Non-Serviced AB Whole Loans—The Moffett Towers Buildings A, B & C Whole Loan” in the Preliminary Prospectus. The Moffett Towers Buildings A, B & C Whole Loan was co-originated by GSBI, DBRI, and JPMCB. The Moffett Towers Buildings A, B & C Whole Loan has a ten-year term and will be interest-only for its entire term.
The Moffett Towers Buildings A, B & C Whole Loan proceeds were used to refinance the existing debt on the Moffett Towers Buildings A, B & C Property, return equity to the borrower sponsor, pay leasing commissions, fund upfront reserves and pay origination costs.
| Whole Loan Summary | ||||
| Note | Original Balance | Cut-off Date Balance | Note Holder | Controlling Piece |
| A-1-C-2, A-1-C-6, A-1-C-9 | $75,000,000 | $75,000,000 | Benchmark 2020-B18(1) | No |
| A-1-C-3, A-1-C-7, A-1-C-10, | 53,100,000 | 53,100,000 | GSBI(2) | No |
| A-1-C-4, A-2-C-1 | 80,000,000 | 80,000,000 | Benchmark 2020-IG3 | No |
| A-1-C-5 | 20,000,000 | 20,000,000 | JPMDB 2020-COR7 | No |
| A-1-S-1, A-2-S-1, A-3-S-1 | 1,000,000 | 1,000,000 | MOFT 2020-ABC | No |
| A-1-C-1, A-1-C-8 | 65,000,000 | 65,000,000 | GSMS 2020-GC47(3) | No |
| A-2-C-2. A-3-C-2, A-3-C-4 | 69,450,000 | 69,450,000 | Benchmark 2020-IG2 | No |
| A-2-C-3, A-2-C-4, A-3-C-1, A-3-C-3 | 79,450,000 | 79,450,000 | Benchmark 2020-B17 | No |
| Senior Notes | $443,000,000 | $443,000,000 | ||
| Notes B-1, B-2, B-3 | 327,000,000 | 327,000,000 | MOFT 2020-ABC | Yes(3) |
| Whole Loan | $770,000,000 | $770,000,000 | ||
| (1) | GSMC will be contributing Notes A-1-C-2, A-1-C-6 and A-1-C-9, with an aggregate original principal balance of $75,000,000, to the Benchmark 2020-B18 securitization. |
| (2) | Expected to be contributed to future securitizations. |
| (3) | The initial controlling notes are Note B-1, B-2 and B-3, so long as no Moffett Towers Buildings A, B & C control appraisal period has occurred and is continuing. If and for so long as a Moffett Towers Buildings A, B & C control appraisal period has occurred and is continuing, then the controlling note will be the Note A-1-C-1. See “Description of the Mortgage Pool—The Whole Loans—The Non-Serviced AB Whole Loans—The Moffett Towers Buildings A, B & C Whole Loan” in the Preliminary Prospectus. The Moffett Towers Buildings A, B & C Whole Loan is being serviced pursuant to the MOFT 2020-ABC trust and servicing agreement. For so long as no Moffett Towers Buildings A, B & C control appraisal period has occurred and is continuing, the control rights of the Moffett Towers Buildings A, B & C Subordinate Companion Notes will be exercisable by the controlling class under the MOFT 2020-ABC trust and servicing agreement. |
THE INFORMATION IN THIS STRUCTURAL AND COLLATERAL TERM SHEET IS NOT COMPLETE AND MAY BE AMENDED PRIOR TO THE TIME OF SALE. THIS TERM SHEET IS NOT AN OFFER TO SELL THESE SECURITIES AND IT IS NOT A SOLICITATION OF AN OFFER TO BUY THESE SECURITIES IN ANY JURISDICTION WHERE THE OFFER OR SALE IS NOT PERMITTED.
45
1000, 1020 and 1050 Enterprise Way Sunnyvale, CA 94089 | Collateral Asset Summary – Loan No. 2 Moffett Towers Buildings A, B & C | Cut-off Date Balance: Cut-off Date LTV: U/W NCF DSCR: U/W NOI Debt Yield(7): | $75,000,000 38.7% 3.63x 13.1% |
| Sources and Uses | |||||||
| Sources | Proceeds | % of Total | Uses | Proceeds | % of Total | ||
| Senior Notes | $443,000,000 | 57.5% | Payoff Existing Debt | $364,012,737 | 47.3% | ||
| Subordinate Debt | 327,000,000 | 42.5 | Return of Equity | 314,083,651 | 40.8 | ||
| Upfront Reserves | 87,705,675 | 11.4 | |||||
| Closing Costs | 2,715,794 | 0.4 | |||||
| Leasing Commissions | 1,482,143 | 0.2 | |||||
| Total Sources | $770,000,000 | 100.0% | Total Uses | $770,000,000 | 100.0% | ||
The Borrower / Borrower Sponsor. The borrower is MT1 ABC LLC, a Delaware limited liability company. The company is structured to be a single purpose bankruptcy-remote entity with the borrower having two independent directors in its organizational structure.
The borrower sponsor is Jay Paul Company and the non-recourse carveout guarantor is Paul Guarantor LLC. Founded in 1975, Jay Paul Company is a privately-held real estate firm based in San Francisco, California that concentrates on the acquisition, development and management of commercial properties throughout California with a specific focus on creating projects for technology firms. Jay Paul Company has developed over 13.0 million sq. ft. of institutional quality space including projects for Apple, Amazon, Facebook, Google, Microsoft, HP, Rambus, Nokia, Tencent and DreamWorks. Jay Paul Company owns 25 office buildings in Moffett Park, totaling nearly 7.2 million sq. ft. including Moffett Place, Moffett Gateway, Technology Corner, Moffett Towers and Moffett Towers II.
The Properties. The Moffett Towers Buildings A, B & C Property consists of three, eight-story office buildings totaling 951,498 sq. ft. of Class A office space located in Sunnyvale, California. The buildings were built by the borrower sponsor in 2008. As of January 1, 2021, the Moffett Towers Buildings A, B & C Property had an UW Occupancy of 100.0% and according to a third party market research report as of year-end 2019, has maintained an average historical occupancy of approximately 98.1% since 2014. The Moffett Towers Buildings A, B & C Property is a part of a larger seven-building campus known as Moffett Towers (the “Moffett Towers Campus”) which includes approximately 2.0 million sq. ft. of Class A office space, an approximately 48,207 sq. ft. amenities facility, a swimming pool, a café, an outdoor common area space, and two parking structures.
The Moffett Towers Campus is 100.0% leased as of February 6, 2020 with Google leasing the entirety of Building A and Building B, four tenants leasing Building C (including Google), and Amazon leasing Buildings D, E, F and G, which are not part of the collateral. The Moffett Towers Buildings A, B & C Property features access to the amenities facility and the enclosed parking structure (the “Moffett Towers Common Area Spaces”). Use of and access to the Moffett Towers Common Area Spaces is governed by certain declarations of covenants, conditions, restrictions, easements and charges agreements (collectively, the “Moffett Towers Lot 1 CCR&Es”) made by the borrower as the sole member of the Moffett Towers Lot I Association LLC and a certain declaration of covenants, conditions, restrictions, easements and charges agreement (the “Moffett Towers Amenities Parcel CCR&E” and together with the Lot 1 CCR&E, collectively, the “Moffett Towers CCR&E”) made by the then-current members of the Moffett Towers Building H & Amenities Parcel Association LLC (each a “Moffett Towers Association” and collectively, the “Moffett Towers Associations”). The borrower is the sole member of the Moffett Towers Lot I Association LLC and the borrower and the owners of the non-collateral buildings at the Moffett Towers Campus are the members of the Moffett Towers Building H & Amenities Parcel Association LLC.
The Moffett Towers CCR&Es grant the borrower non-exclusive easement rights over the Moffett Towers Common Area Spaces. The Moffett Towers Associations are obligated to maintain insurance coverage over the Moffett Towers Common Area Spaces and are also responsible for maintenance of the Moffett Towers Common Area Spaces, subject to the terms of the leases. The Moffett Towers CCR&Es delineate shares of the voting interests in the Moffett Towers Associations based on the number of buildings at the Moffett Towers Campus, with each completed building entitled to a proportionate share of the voting interest. In the Moffett Towers Building H & Amenities Parcel Association LLC, the Moffett Towers Buildings A, B & C Property (collectively among all three buildings) is entitled to a 47.595% share of the voting interest in the applicable Moffett Towers Association as of the loan origination date. In the Moffett Towers Lot I Association LLC, each building is entitled to one-third share of the voting interest in the applicable Moffett Towers Association as of the loan origination date.
COVID-19 Update. As of July 1, 2020, the Moffett Towers Buildings A, B & C Property is open, however most, if not all, tenants are working remotely. Based on the underwritten rent roll, there are a total of 6 tenant leases at the Moffett Towers Buildings A, B & C Mortgaged Property and 4 of those tenant leases owed rent for June 2020. Of those 4 tenant leases, 1 tenant lease, representing approximately 4% of the expected June 2020 rent collection, did not pay. Two tenants, Google and Comcast, have executed leases but had no rent due under those leases for June 2020. Google is currently in build out of additional leased premises and Comcast is scheduled to relocate at the Moffett Towers Buildings A, B & C Mortgaged Property. Google has executed leases for Buildings B and C, representing approximately 56% of UW Base Rent. Google is expected to take possession of Building B in January 2021. Google has taken possession of its premises in Building C in 2 phases: 96,282 SF in March 2020 and 84,914 SF in July 2020. Google is expected to begin paying rent for Building B, Building C (Phase I) and Building C (Phase II) in October 2021, September 2020 and February 2021, respectively. Comcast has executed a lease extension and relocation for Building C and is expected to take possession of the relocation space in November 2020 and begin paying rent on both the existing space and relocation space in March 2021, representing approximately 13% of UW Base Rent. Approximately 98.8% of the occupied SF paid rent for June 2020, representing 96.3% of the UW Base Rent. As of July 1, 2020, the Moffett Towers Buildings A, B & C Whole Loan is not subject to any modification or forbearance request related to the COVID-19 pandemic. The July debt service payment has been made.
THE INFORMATION IN THIS STRUCTURAL AND COLLATERAL TERM SHEET IS NOT COMPLETE AND MAY BE AMENDED PRIOR TO THE TIME OF SALE. THIS TERM SHEET IS NOT AN OFFER TO SELL THESE SECURITIES AND IT IS NOT A SOLICITATION OF AN OFFER TO BUY THESE SECURITIES IN ANY JURISDICTION WHERE THE OFFER OR SALE IS NOT PERMITTED.
46
| 1000, 1020 and 1050 Enterprise Way Sunnyvale, CA 94089 | Collateral Asset Summary – Loan No. 2 Moffett Towers Buildings A, B & C | Cut-off Date Balance: Cut-off Date LTV: U/W NCF DSCR: U/W NOI Debt Yield(7): | $75,000,000 38.7% 3.63x 13.1% |
| Tenant / Building(1) | ||||||
| Tenant / Building | Ratings (Moody’s/Fitch/S&P)(2) | Net Rentable Area (Sq. Ft.)(3) | % of Net Rentable Area | U/W Base Rent per Sq. Ft.(4) | % of Total U/W Base Rent(4) | Lease Expiration |
| Google (Building B)(5) | Aa2 / NR / AA+ | 317,166 | 33.3% | $60.00 | 35.5% | 12/31/2030 |
| Google (Building A) | Aa2 / NR / AA+ | 317,166 | 33.3% | $49.57 | 29.3% | 6/30/2026 |
| Google (Building C)(6) | Aa2 / NR / AA+ | 181,196 | 19.0% | $59.40 | 20.1% | 9/30/2027 |
| Comcast(7) | A3 / A- / A- | 111,707 | 11.7% | $60.00 | 12.5% | 10/31/2027 |
| Level 10 Construction | NR / NR / NR | 12,944 | 1.4% | $55.62 | 1.3% | 2/29/2024 |
| Acuitus, Inc | NR / NR / NR | 11,319 | 1.2% | $63.65 | 1.3% | 8/31/2024 |
| Total / Wtd. Avg. Occupied | 951,498 | 100.0% | $56.39 | 100.0% | ||
| Vacant | 0 | 0.0% | ||||
| Total | 951,498 | 100.0% | ||||
| (1) | Based on the underwritten rent roll dated as of January 1, 2021. |
| (2) | Certain ratings are those of the parent company whether or not the parent guarantees the lease. |
| (3) | Net Rentable Area (Sq. Ft.) does not include each tenant’s pro-rata share of the amenities facility. The Moffett Towers Buildings A, B & C Property is part of the Moffett Towers Campus. The Moffett Towers Campus includes a certain common area amenities parcel, which is owned by the Moffett Towers Building H & Amenities Parcel Association LLC. The Moffett Towers Campus also includes a Lot 1 common area, which is owned by the Moffett Towers Lot 1 Association LLC. Building owners within the Moffett Towers Campus are members of the associations and share the right to use these areas by virtue of such membership. There is no allocation of the common area amenities to any particular building, and the common areas are not included in the collateral. |
| (4) | U/W Base Rent per Sq. Ft. and % of Total U/W Base Rent excludes the base rent payable on each tenant’s pro-rata share of the amenities facility, with rent steps through February 28, 2021. |
| (5) | Google has executed a lease for Building B but has not yet accepted delivery or begun paying rent. Google is expected to take possession of Building B in January 2021. Additionally, the ongoing COVID-19 pandemic may delay the delivery of the space that Google is expected to take in Building B, which would impact and/ or delay the rent commencement date for the remaining space. We cannot assure you if or when Google will begin paying rent on their delivered space. |
| (6) | Google took possession of the initial phase of their space in Building C (96,282 sq. ft. of the total 181,196) on March 1, 2020 and took possession of the remaining space in Building C (84,914 sq. ft. of the total 181,196) on July 1, 2020. |
| (7) | Comcast has executed a lease extension and relocation for 111,707 sq. ft. The relocation space consists of 40,296 sq. ft. and Comcast is expected to take possession of the relocation space in November 2020 and begin paying rent on both the existing space and relocation space in March 2021. We cannot assure you that Comcast will take occupancy and commence paying rent as expected or at all. |
| Lease Rollover Schedule(1)(2) | ||||||||
| Year | # of Leases Expiring | Total Expiring Sq. Ft.(3) | % of Total Sq. Ft. Expiring | Cumulative Expiring | Cumulative % Sq. Ft. Expiring | Annual U/W Base Rent per Sq. Ft. Expiring(4) | % U/W Base Rent Expiring(4) | Cumulative % of U/W Base Rent Expiring(4) |
| MTM | 0 | 0 | 0.0% | 0 | 0.0% | $0.00 | 0.0% | 0.0% |
| 2020 | 0 | 0 | 0.0% | 0 | 0.0% | $0.00 | 0.0% | 0.0% |
| 2021 | 0 | 0 | 0.0% | 0 | 0.0% | $0.00 | 0.0% | 0.0% |
| 2022 | 0 | 0 | 0.0% | 0 | 0.0% | $0.00 | 0.0% | 0.0% |
| 2023 | 0 | 0 | 0.0% | 0 | 0.0% | $0.00 | 0.0% | 0.0% |
| 2024 | 2 | 24,263 | 2.5% | 24,263 | 2.5% | $59.37 | 2.7% | 2.7% |
| 2025 | 0 | 0 | 0.0% | 24,263 | 2.5% | $0.00 | 0.0% | 2.7% |
| 2026 | 1 | 317,166 | 33.3% | 341,429 | 35.9% | $49.57 | 29.3% | 32.0% |
| 2027 | 2 | 292,903 | 30.8% | 634,332 | 66.7% | $59.63 | 32.5% | 64.5% |
| 2028 | 0 | 0 | 0.0% | 634,332 | 66.7% | $0.00 | 0.0% | 64.5% |
| 2029 | 0 | 0 | 0.0% | 634,332 | 66.7% | $0.00 | 0.0% | 64.5% |
| 2030 | 1 | 317,166 | 33.3% | 951,498 | 100.0% | $60.00 | 35.5% | 100.0% |
| 2031 & Thereafter | 0 | 0 | 0.0% | 951,498 | 100.0% | $0.00 | 0.0% | 100.0% |
| Vacant | NAP | 0 | 0.0% | 951,498 | 100.0% | NAP | NAP | NAP |
| Total / Wtd. Avg. | 6 | 951,498 | 100.0% | $56.39 | 100.0% | |||
| (1) | Based on the underwritten rent roll dated January 1, 2021. |
| (2) | Certain tenants may have termination or contraction options (which may become exercisable prior to the originally stated expiration date of the tenant lease) that are not considered in the above Lease Rollover Schedule. |
| (3) | Total Expiring Sq. Ft. does not include each tenant’s pro-rata share of the amenities facility. The Moffett Towers Campus includes a certain common area amenities parcel, which is owned by the Moffett Towers Building H & Amenities Parcel Association LLC. The Moffett Towers Campus also includes a Lot 1 common area, which is owned by the Moffett Towers Lot 1 Association LLC. Building owners within the Moffett Towers Campus are members of the associations and share the right to use these areas by virtue of such membership. There is no allocation of the common area amenities to any particular building, and the common areas are not included in the collateral. |
| (4) | Annual U/W Base Rent per Sq. Ft. Expiring, % of U/W Base Rent Expiring, and Cumulative % of U/W Base Rent Expiring include rent steps through February 28, 2021. |
THE INFORMATION IN THIS STRUCTURAL AND COLLATERAL TERM SHEET IS NOT COMPLETE AND MAY BE AMENDED PRIOR TO THE TIME OF SALE. THIS TERM SHEET IS NOT AN OFFER TO SELL THESE SECURITIES AND IT IS NOT A SOLICITATION OF AN OFFER TO BUY THESE SECURITIES IN ANY JURISDICTION WHERE THE OFFER OR SALE IS NOT PERMITTED.
47
1000, 1020 and 1050 Enterprise Way Sunnyvale, CA 94089 | Collateral Asset Summary – Loan No. 2 Moffett Towers Buildings A, B & C | Cut-off Date Balance: Cut-off Date LTV: U/W NCF DSCR: U/W NOI Debt Yield(7): | $75,000,000 38.7% 3.63x 13.1% |
Major Tenants. The largest tenant, Google (815,528 sq. ft.; 85.7% of NRA; 84.8% of U/W Base Rent) leases a total of 815,528 sq. ft. at the Moffett Towers Buildings A, B & C Property via three separate leases with a weighted average remaining lease term of 8.3 years as of the origination date. Google originally leased a portion of Building A via a subsidiary in 2012 and Google has since expanded, now leasing the entirety of Buildings A & B, and 57.1% of Building C. Each of Google’s leases is triple-net, features a seven-year extension option and does not include any early termination rights.
Google has executed a lease for Building B but has not yet accepted delivery or begun paying rent. Google is expected to take possession of Building B in January 2021. Additionally, the ongoing COVID-19 pandemic may delay the delivery of the remaining space that Google is expected to take in Building B, which would impact and/or delay the rent commencement date for such space. We cannot assure you if or when the space will be delivered or when Google will begin paying rent on their delivered space.
Google took possession of the initial phase of their space in Building C (96,282 SF of the total 181,196) on March 1, 2020 and took possession of the remaining space in Building C (84,914 sq. ft. of the total 181,196) on July 1, 2020.
Google, through an affiliate, has occupied the Moffett Towers Buildings A, B & C Property in some capacity since 2012 and is currently in the process of its third expansion. The Moffett Towers Buildings A, B & C Property is located just four miles east of Google’s world headquarters in Mountain View, California. Further, the Moffett Towers Buildings A, B & C Property is across the street from the NASA-owned Moffett Naval Airfield. In 2014, Google entered into a 60-year lease of Moffett Naval Airfield, an approximate total obligation of more than $1.1 billion. Google reportedly is in the process of investing more than $200 million to renovate the airfield, including major renovations to the three hangars, and has expressed that it plans to use the facility for research, development, assembly and testing in various emerging technologies. Google also uses the facility as a private airport for their corporate planes for the founders and top executives.
The second largest tenant, Comcast (111,707 sq. ft.; 11.7% of NRA; 12.5% of U/W Base Rent) leases 111,707 sq. ft. through October 31, 2027. Comcast’s lease is triple-net, includes 3.0% annual rent increases, features one five-year extension option and no early termination rights. Comcast began leasing space at the Moffett Towers Buildings A, B & C Property in 2011 via an affiliate (Plaxo, Inc.). Comcast has executed a lease extension and relocation for a total of 111,707 sq. ft. and has not yet accepted delivery or begun paying rent on the 40,296 sq. ft. of relocation space. Comcast is expected to begin paying rent on both the existing space and relocation premises in March 2021. We cannot assure you that Comcast will take occupancy and commence paying rent as expected or at all.
Environmental Matters. According to the Phase I environmental report dated January 14, 2020, there are no recognized environmental conditions or recommendations for further action at the Moffett Towers Buildings A, B & C Property.
The Market. The Moffett Towers Buildings A, B & C Property is located in Moffett Park, in Sunnyvale, California which is located in Silicon Valley. Moffett Park is an approximately 519-acre area comprised of office spaces and research and development buildings. Notable technology firms currently in Moffett Park include Google, Hewlett Packard, Juniper Networks, Amazon, Lockheed-Martin, Microsoft, NetApp and Rambus. The Moffett Towers Buildings A, B & C Property is north of State Highway 237, which forms the southern border of the Moffett Park area and provides access from Interstate 680 and Interstate 280 to the northeast and U.S. Highway 101 in Sunnyvale to the southwest. U.S. Highway 101 runs northward through San Francisco and southward through San Jose, terminating in the city of Los Angeles. The Santa Clara County Transit System station is located within approximately one mile from the Moffett Towers Campus and services the surrounding residential communities.
According to the appraisal, the Moffett Park office submarket contains 11.2 million sq. ft. and recorded an average asking rent of $67.80 per sq. ft. annually as of January 7, 2020. The submarket’s vacancy rate was noted at 3.4% and has not exceeded 7.1% since 2012. According to the appraisal, Moffett Park contains approximately 9.0 million sq. ft. of four and five star office properties which recorded an average asking rent of $71.64 per sq. ft. annually as of January 7, 2020. The Class A segment of the submarket features a vacancy rate of 1.5%.
THE INFORMATION IN THIS STRUCTURAL AND COLLATERAL TERM SHEET IS NOT COMPLETE AND MAY BE AMENDED PRIOR TO THE TIME OF SALE. THIS TERM SHEET IS NOT AN OFFER TO SELL THESE SECURITIES AND IT IS NOT A SOLICITATION OF AN OFFER TO BUY THESE SECURITIES IN ANY JURISDICTION WHERE THE OFFER OR SALE IS NOT PERMITTED.
48
1000, 1020 and 1050 Enterprise Way Sunnyvale, CA 94089 | Collateral Asset Summary – Loan No. 2 Moffett Towers Buildings A, B & C | Cut-off Date Balance: Cut-off Date LTV: U/W NCF DSCR: U/W NOI Debt Yield(7): | $75,000,000 38.7% 3.63x 13.1% |
The appraisal identified five comparable office leases that had NNN base rents ranging from $50.40 to $72.00 per sq. ft. with a weighted average of $60.24 per sq. ft. The appraiser concluded to a NNN market rent of $60.00 per sq. ft.
| Comparable Office Leases(1) | |||||||
| Property Name / Location | Year Built | Stories | Tenant Name | Tenant Leased Space | Lease Date | Lease Term (years) | Base Rent per Sq. Ft. |
| Moffett Towers Buildings A, B & C | 2008 | 8 | Various | 951,498 | Various | Various | $56.39(2) |
190 & 200 Mathilda Pl Sunnyvale, CA | 2002 | 5 | Uber Technologies, Inc. | 290,926 | June-20 | 10.5 | $72.00 |
620 National Ave Mountain View, CA | 2016 | 4 | Google, Inc. | 151,998 | Dec-18 | 10.0 | $59.40 |
625 N Mary Ave Sunnyvale, CA | 2020 | 3 | Proofpoint, Inc. | 242,400 | Nov-18 | 10.6 | $57.60 |
520 Almanor Ave Sunnyvale, CA | 2019 | 4 | Nokia, Inc. | 231,000 | Sep-18 | 12.5 | $50.40 |
221 N Mathilda Ave Sunnyvale, CA | 2019 | 3 | 23andMe, Inc. | 154,987 | Jun-18 | 12.0 | $60.00 |
| (1) | Source: Appraisal. |
| (2) | Based on the underwritten rent roll dated January 1, 2021. |
Cash Flow Analysis.
| Cash Flow Analysis(1) | |||||
| 2017 | 2018 | 2019 | U/W(2) | U/W PSF | |
| Base Rent(3) | $31,760,276 | $37,874,365 | $37,993,927 | $58,967,821 | $61.97 |
| Total Reimbursement Revenue | 11,793,732 | 11,467,503 | 12,298,701 | 11,126,970 | $11.69 |
| Total Other Income | 0 | 0 | 0 | 1,302,777 | $1.37 |
| Gross Revenue | $43,554,008 | $49,341,867 | $50,292,627 | $71,397,567 | $75.04 |
| Vacancy Loss | 0 | 0 | 0 | (2,141,927) | $(2.25) |
| Effective Gross Revenue | $43,554,008 | $49,341,867 | $50,292,627 | $69,255,640 | $72.79 |
| Total Operating Expenses | 12,008,858 | 11,771,512 | 12,255,535 | 11,194,319 | $11.76 |
| Net Operating Income(4)(5) | $31,545,149 | $37,570,355 | $38,037,092 | $58,061,321 | $61.02 |
| Tenant Improvements | 0 | 0 | 0 | 510,495 | $0.54 |
| Leasing Commissions | 0 | 0 | 0 | 510,495 | $0.54 |
| Replacement Reserves | 0 | 0 | 0 | 190,300 | $0.20 |
| Net Cash Flow | $31,545,149 | $37,570,355 | $38,037,092 | $56,850,031 | $59.75 |
| (1) | Certain items such as straight line rent, interest expense, interest income, lease cancellation income, depreciation, amortization, debt service payments and any other non-recurring or non-operating items were excluded from the historical presentation and are not considered for the underwritten cash flow. |
| (2) | U/W cash flow based on annualized in-place rents as of January 1, 2021, with rent steps through February 28, 2021. For avoidance of doubt, no COVID-19 specific adjustments have been incorporated in the lender U/W. |
| (3) | Base Rent includes $5,182,847 of straight line office rent steps over the lease term for investment grade tenants (Google and Comcast) and $125,834 of straight line amenities facility rent steps through February 28, 2021. |
| (4) | The increase in NOI from 2017 to 2018 is attributable to Google’s lease in Building A which commenced on July 26, 2017. The 2018 NOI represents a full year with Google paying unabated rent in Building A. |
| (5) | The increase from 2019 NOI to U/W NOI is primarily attributable to the signing of four new leases since August 2019 and includes the straight line average of contractual rent step increments over the lease term for investment grade tenants (Google and Comcast). |
Property Management. The Moffett Towers Buildings A, B & C Property is managed by Paul Holdings, Inc. d/b/a Jay Paul Company, the borrower sponsor.
Initial and Ongoing Reserves. At loan origination, the borrower deposited approximately (i) $53,688,909 into a tenant improvement allowances and leasing commissions reserve and (ii) approximately $34,016,766 into a rent concessions reserve, which includes approximately $11,268,221 for free rent and approximately $22,748,545 for gap rent.
Tax Reserve. The borrower is required to deposit into a real estate tax reserve, on a monthly basis, 1/12 of the estimated annual real estate taxes (initially estimated at $282,271).
Insurance Reserve. The borrower is required to deposit into an insurance reserve, on a monthly basis, 1/12 of estimated insurance premiums, unless an acceptable blanket policy is in effect. As of the origination date, an acceptable blanket policy was in place.
Replacement Reserve. The borrower is required to deposit into a replacement reserve, on a monthly basis, an amount equal to approximately $15,858 for replacement reserves.
Lease Sweep Reserve. During a Lease Sweep Period (as defined below), all excess cash flow after payment of debt service, required reserves and budgeted operating expenses is required to be deposited into a lease sweep reserve until amounts on deposit equal the
THE INFORMATION IN THIS STRUCTURAL AND COLLATERAL TERM SHEET IS NOT COMPLETE AND MAY BE AMENDED PRIOR TO THE TIME OF SALE. THIS TERM SHEET IS NOT AN OFFER TO SELL THESE SECURITIES AND IT IS NOT A SOLICITATION OF AN OFFER TO BUY THESE SECURITIES IN ANY JURISDICTION WHERE THE OFFER OR SALE IS NOT PERMITTED.
49
1000, 1020 and 1050 Enterprise Way Sunnyvale, CA 94089 | Collateral Asset Summary – Loan No. 2 Moffett Towers Buildings A, B & C | Cut-off Date Balance: Cut-off Date LTV: U/W NCF DSCR: U/W NOI Debt Yield(7): | $75,000,000 38.7% 3.63x 13.1% |
Lease Sweep Cap Amount (as defined below). In the event that excess cash flow is not sufficient to meet the Required Minimum Monthly Lease Sweep Deposit Amount (as defined below), the borrower is required to deposit such minimum required amount.
A “Required Minimum Monthly Lease Sweep Deposit Amount” means, during a Lease Sweep Period, an amount equal to (i) with respect to a Lease Sweep Period continuing due to a lease sweep trigger relating to Google lease (Building A), $875,044.76, (ii) with respect to a Lease Sweep Period continuing due to a lease sweep trigger relating to Google lease (Building B), $875,044.76 and (iii) with respect to a Lease Sweep Period continuing due to a lease sweep trigger relating to Google lease (Building C), $499,910.49; provided, that, to the extent a Lease Sweep Period is continuing due to a lease sweep trigger relating to more than one Google lease, such amounts set forth above will be aggregated based on all Google leases then in a Lease Sweep Period on the monthly payment date in question (i.e., if, on a monthly payment date, one or more Lease Sweep Periods are continuing which affect all Google leases, the Required Minimum Monthly Lease Sweep Deposit Amount for such monthly payment date will be $2,250,000.01).
Additionally, during the continuance of a Trigger Period (as defined below) other than a Lease Sweep Period, all amounts in excess of the monthly debt service payment, required reserves and budgeted operating expenses are required to be reserved in a cash collateral reserve, capped, if such Trigger Period was caused by a Low DSCR Event, at $47,574,900.
Lockbox / Cash Management. The Moffett Towers Buildings A, B & C Whole Loan is structured with a hard lockbox and in place cash management. The borrower is required to direct all existing tenants of the Moffett Towers Buildings A, B & C Property to directly deposit all rents into a deposit account controlled by the lender. Funds in the deposit account are required to be applied and disbursed in accordance with the Moffett Towers Buildings A, B & C Whole Loan documents. During a Trigger Period, all excess cash after payment of the monthly debt service on the Moffett Towers Buildings A, B & C Whole Loan, all required reserves and budgeted operating expenses, and certain other items in the payment waterfall described in the Moffett Towers Buildings A, B & C Whole Loan documents will be reserved as additional collateral for the Moffett Towers Buildings A, B & C Whole Loan.
A “Trigger Period” will be continuing (i) upon an event of default under the Moffett Towers Buildings A, B & C Whole Loan until cured, (ii) upon the debt service coverage ratio as calculated in the Moffett Towers Buildings A, B & C Whole Loan documents being less than 1.15x (assuming amortization) (a “Low DSCR Event”) until the earlier of the date (a) the Moffett Towers Buildings A, B & C Property achieves a debt service coverage ratio of at least 1.15x (assuming amortization) for one calendar quarter or (b) amounts on deposit in the cash collateral reserve equal $47,574,900, or (iii) during the continuance of a Lease Sweep Period.
A “Lease Sweep Period” will be in effect upon the earliest to occur (a) of October 1, 2025 with respect to Building A or the date that is nine months prior to the date any Google Tenant (or any replacement tenant of space leased by Google Tenant) lease expires with respect to Building B and Building C and Google Tenant (or any replacement tenant of space leased by Google Tenant) has not given notice of its intent to renew until either the Reserve Requirement is met or a Renewal or Re-tenanting occurs, (b) the date on which the Google Tenant (or any replacement tenant of 75% or more of the space leased by the Google Tenant) surrenders, cancels or terminates or gives notice of its intent to surrender, cancel or terminate any of its leases at the Moffett Towers Buildings A, B & C Property unless a replacement lease to one or more entities (or subsidiary of such entity) that is rated investment grade by at least two of Moody’s, S&P or Fitch (an “Investment Grade Tenant”) has been entered into until either the Reserve Requirement is met or a Renewal or Re-tenanting occurs, (c) the date on which the Google Tenant (or any replacement tenant of 75% or more of the space leased by the Google Tenant) ceases operating its business in 20.0% or more of the space in a building subject to its leases (the “Dark Space”) (unless such tenant ceasing to operate (1) is the Google Tenant, (2) is an Investment Grade Tenant or (3) has subleased such space to one or more Investment Grade Tenants who has accepted delivery of such space, and is paying unabated rent at a contract rate no less than the contract rate required under the applicable lease until either the Reserve Requirement is met or a Renewal or Re-tenanting occurs, (d) upon the occurrence of default under any lease by the Google Tenant (or any replacement tenant of 75% or more of the space leased by the Google Tenant) until either such default is cured and no other default occurs for three consecutive months or the Reserve Requirement is met, (e) a bankruptcy of the Google Tenant or any parent entity under the applicable lease until the related bankruptcy proceedings have terminated and the applicable lease has been affirmed, assumed or assigned in a manner satisfactory to the lender, and (f) the date on which the Google Tenant (or any replacement tenant of space leased by the Google Tenant) is no longer an Investment Grade Tenant until one of (1) such tenant becomes an Investment Grade Tenant again, (2) the Reserve Requirement is met or (3) a Renewal or Re-tenanting occurs.
The “Google Tenant” means the Google entity that is the tenant under the leases existing on the origination date.
A “Renewal or Re-tenanting” means the Google Tenant irrevocably renews its lease or at least 75% of the space demised under such lease has been re-tenanted pursuant to one or more leases meeting certain requirements under the mortgage loan agreement, as applicable.
A “Reserve Requirement” means funds equal to the applicable Lease Sweep Cap Amount (as defined below) have been deposited into the lease sweep reserve or the borrower has delivered an acceptable letter of credit in such applicable amount to the lender for such amount.
THE INFORMATION IN THIS STRUCTURAL AND COLLATERAL TERM SHEET IS NOT COMPLETE AND MAY BE AMENDED PRIOR TO THE TIME OF SALE. THIS TERM SHEET IS NOT AN OFFER TO SELL THESE SECURITIES AND IT IS NOT A SOLICITATION OF AN OFFER TO BUY THESE SECURITIES IN ANY JURISDICTION WHERE THE OFFER OR SALE IS NOT PERMITTED.
50
1000, 1020 and 1050 Enterprise Way Sunnyvale, CA 94089 | Collateral Asset Summary – Loan No. 2 Moffett Towers Buildings A, B & C | Cut-off Date Balance: Cut-off Date LTV: U/W NCF DSCR: U/W NOI Debt Yield(7): | $75,000,000 38.7% 3.63x 13.1% |
A “Lease Sweep Cap Amount” means the largest amount applicable to the Lease Sweep Periods then occurring as follows:
| i. | with respect to a Lease Sweep Period continuing solely pursuant to clause (a) or (b), $45.00 per rentable square foot under the applicable lease (or if Building B has been released in accordance with the terms of the Moffett Towers Buildings A, B & C Whole Loan documents, $45.00 per rentable square foot that is leased pursuant to the applicable lease and every other lease existing at the Moffett Towers Buildings A, B & C Property with the same tenant or its affiliates, until such time as one of the remaining Google leases has been renewed or replaced, at which time, the Lease Sweep Cap Amount will revert back to $45.00 per rentable square foot under the applicable lease); |
| ii. | with respect to a Lease Sweep Period continuing solely pursuant to clause (d), an amount equal to $35.00 per rentable square foot under the applicable lease); |
| iii. | with respect to a Lease Sweep Period continuing pursuant to clause (c), whether or not a Lease Sweep Period pursuant to any other clause is concurrently continuing, $50.00 per rentable square foot of the dark space demised under the applicable lease; and |
| iv. | with respect to a Lease Sweep Period continuing pursuant to a clause (f), whether or not a Lease Sweep Period pursuant to any other clause is concurrently continuing, an amount equal to $50.00 per rentable square foot under all leases with such downgraded tenant. |
Current Mezzanine or Subordinate Indebtedness. The Moffett Towers Buildings A, B & C Subordinate Companion Notes have an aggregate outstanding principal balance as of the Cut-off Date of $327.0 million, and accrue interest at a fixed rate of 3.49000% per annum. The Moffett Towers Buildings A, B & C Subordinate Companion Notes have a ten-year term and are interest-only for the full term. For additional information, see “Description of the Mortgage Pool—The Whole Loans—The Non-Serviced AB Whole Loans—The Moffett Towers Buildings A, B & C Whole Loan” in the Preliminary Prospectus.
Future Mezzanine or Subordinate Indebtedness Permitted. None.
Partial Release. At any time on or after the payment date in March 2022, the borrower is permitted to obtain the release of up to two (but not more than two) individual buildings that comprise the Moffett Towers Buildings A, B & C Property from the lien of the mortgage in connection with a bona fide third-party sale of such building or a transfer of such building to an affiliate for purposes of refinancing such building upon, among other conditions, (a) payment of the applicable Release Price, (b) no event of default under the Moffett Towers Buildings A, B & C Whole Loan documents is continuing, (c) after giving effect to the release, the debt service coverage ratio is no less than the greater of the debt service coverage ratio immediately prior to such release and 1.44x, (d) after giving effect to the release, the debt yield is no less than the greater of the debt yield immediately preceding such release and 7.75%, (e) after giving effect to the release, the loan to value ratio is not more than the lesser of the loan to value ratio immediately preceding such release and 70.0% and (f) delivery of customary REMIC opinions.
“Release Price” means an amount equal to (a) with respect to the release of Building A or Building C, the greater of (1) 100% of the net sales proceeds of a sale or refinance of such parcel and (2) 115% of the allocated loan amount and (b) with respect to the release of Building B, the greater of (1) 100% of the net sales proceeds of a sale or refinance of such parcel and (2) 125% of the allocated loan amount, in each case together with the payment of any accrued and unpaid interest and any applicable prepayment fee.
Common Area Subdivision. The borrower has the right to cause the Moffett Towers Lot I Association LLC to subdivide and release a portion of the Lot 1 Common Area in connection with the construction of another office building that may be approximately nine stories tall and contain approximately 326,666 rentable square feet so long as, among other conditions in the Moffett Towers Buildings A, B & C Whole Loan documents, such subdivision and release will not materially adversely affect the Moffett Towers Buildings A, B & C Property or its use or operation and is in compliance with the terms of other material documents related to the Moffett Towers Buildings A, B & C Property such as any leases or reciprocal easement agreements. See “Description of the Mortgage Pool—Condominium and Other Shared Interests” in the Preliminary Prospectus. In addition, the borrower has recently requested that the lender consent to an amendment to the operating agreement of Moffett Towers Building H & Amenities Parcel Association LLC (the “Amenities Parcel Association”), which is the owner of the Lot 3 Common Area, to allow the Amenities Parcel Association to subdivide and release a portion of the Lot 3 Common Area in connection with the construction of another office building on such parcel that may be no more than nine stories tall and contain no more than 326,666 rentable square feet, subject to certain conditions set forth in such operating agreement. The lender is still reviewing this request.
The “Lot 1 Common Area” comprises all of the Moffett Towers Buildings A, B & C Property that makes up lot 1 of the Moffett Towers Campus, other than the three buildings that comprise the collateral for the Moffett Towers Buildings A, B & C Whole Loan. The Lot 1 Common Area includes two parking structures and certain surface parking spaces in lot 1 of the Moffett Towers Campus, together with the landscaping, sidewalks, driveways and roadways within lot 1 of the Moffett Towers Campus. The “Lot 3 Common Area” comprises all of the property that makes up lot 3 of the Moffett Towers Campus, other than the four office buildings that are located on such lot 3 and are collateral for other loans.
THE INFORMATION IN THIS STRUCTURAL AND COLLATERAL TERM SHEET IS NOT COMPLETE AND MAY BE AMENDED PRIOR TO THE TIME OF SALE. THIS TERM SHEET IS NOT AN OFFER TO SELL THESE SECURITIES AND IT IS NOT A SOLICITATION OF AN OFFER TO BUY THESE SECURITIES IN ANY JURISDICTION WHERE THE OFFER OR SALE IS NOT PERMITTED.
51
6001 East Tropical Parkway Las Vegas, NV 89115 | Collateral Asset Summary – Loan No. 3 Tropical Distribution Center | Cut-off Date Balance: Cut-off Date LTV: U/W NCF DSCR: U/W NOI Debt Yield: | $75,000,000 68.2% 2.10x 7.7% |
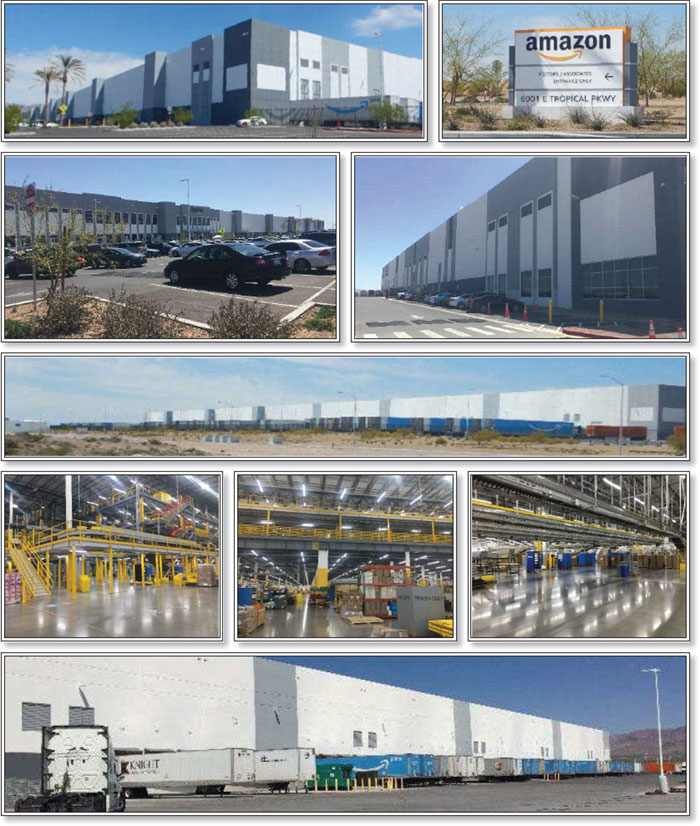
THE INFORMATION IN THIS STRUCTURAL AND COLLATERAL TERM SHEET IS NOT COMPLETE AND MAY BE AMENDED PRIOR TO THE TIME OF SALE. THIS TERM SHEET IS NOT AN OFFER TO SELL THESE SECURITIES AND IT IS NOT A SOLICITATION OF AN OFFER TO BUY THESE SECURITIES IN ANY JURISDICTION WHERE THE OFFER OR SALE IS NOT PERMITTED.
52
6001 East Tropical Parkway Las Vegas, NV 89115 | Collateral Asset Summary – Loan No. 3 Tropical Distribution Center | Cut-off Date Balance: Cut-off Date LTV: U/W NCF DSCR: U/W NOI Debt Yield: | $75,000,000 68.2% 2.10x 7.7% |
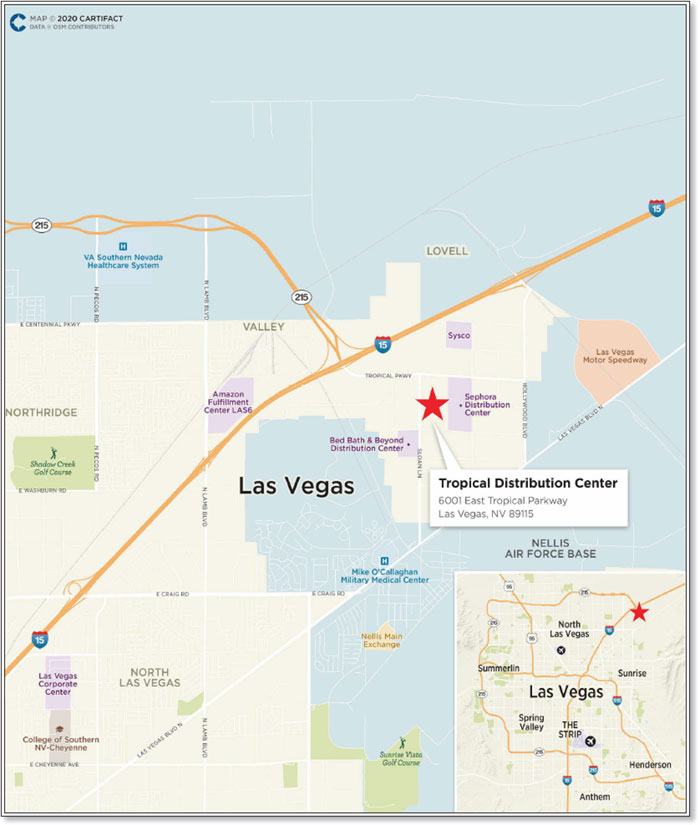
THE INFORMATION IN THIS STRUCTURAL AND COLLATERAL TERM SHEET IS NOT COMPLETE AND MAY BE AMENDED PRIOR TO THE TIME OF SALE. THIS TERM SHEET IS NOT AN OFFER TO SELL THESE SECURITIES AND IT IS NOT A SOLICITATION OF AN OFFER TO BUY THESE SECURITIES IN ANY JURISDICTION WHERE THE OFFER OR SALE IS NOT PERMITTED.
53
6001 East Tropical Parkway Las Vegas, NV 89115 | Collateral Asset Summary – Loan No. 3 Tropical Distribution Center | Cut-off Date Balance: Cut-off Date LTV: U/W NCF DSCR: U/W NOI Debt Yield: | $75,000,000 68.2% 2.10x 7.7% |
| Mortgage Loan Information | |
| Loan Seller: | GSMC |
| Loan Purpose: | Refinance |
| Borrower Sponsors: | Brett Michael Lipman; Farshid Steve Shokouhi |
| Borrower: | Preylock Tropical Distribution Center, LLC |
| Original Balance: | $75,000,000 |
| Cut-off Date Balance: | $75,000,000 |
| % by Initial UPB: | 8.0% |
| Interest Rate(1): | 3.59300% |
| Payment Date: | 6th of each month |
| First Payment Date: | August 6, 2020 |
| Anticipated Repayment Date: | July 6, 2030 |
| Final Maturity Date: | June 6, 2034 |
| Amortization: | Interest Only, ARD |
| Additional Debt: | None |
| Call Protection: | L(24), D(91), O(5) |
| Lockbox / Cash Management: | Hard / Springing |
| Reserves(2) | |||
| Initial | Monthly | Cap | |
| Taxes: | $0 | Springing | NAP |
| Insurance: | $0 | Springing | NAP |
| Replacement: | $0 | Springing | NAP |
| TI/LC: | $0 | $0 | NAP |
| Unfunded Obligations: | $0 | Springing | NAP |
| Property Information | |
| Single Asset / Portfolio: | Single Asset |
| Property Type: | Warehouse/Distribution Industrial |
| Collateral: | Fee Simple |
| Location: | Las Vegas, NV |
| Year Built / Renovated: | 2019 / NAP |
| Total Sq. Ft.: | 855,000 |
| Property Management: | Preylock Holdings, Inc. |
| Underwritten NOI: | $5,773,329 |
| Underwritten NCF: | $5,730,579 |
| Appraised Value: | $110,000,000 |
| Appraisal Date: | April 14, 2020 |
Historical NOI(3) | |
| Most Recent NOI: | NAV |
| 2019 NOI: | NAV |
| 2018 NOI: | NAP |
| 2017 NOI: | NAP |
| Historical Occupancy(3) | |
| Most Recent Occupancy: | 100.0% (July 1, 2020) |
| 2019 Occupancy: | NAV |
| 2018 Occupancy : | NAP |
| 2017 Occupancy: | NAP |
| Financial Information | ||||||
| Tranche | Cut-off Date Balance | Balance per Sq. Ft. Cut-off / Balloon | LTV Cut-off / Balloon | U/W DSCR NOI / NCF | U/W Debt Yield NOI / NCF | U/W Debt Yield at Balloon NOI / NCF |
| Mortgage Loan | $75,000,000 | $88 / $88 | 68.2% / 68.2% | 2.11x / 2.10x | 7.7% / 7.6% | 7.7% / 7.6% |
| (1) | From and after July 6, 2030, (i) the Tropical Distribution Center Loan (as defined below) accrues interest at the greater of (x) 6.09300% and (y) the 10-year swap rate as of July 6, 2030 plus 250 basis points (not to exceed the maximum rate permitted by applicable law) (the “Adjusted Interest Rate”) and requires monthly payments of interest only at 3.59300%, and (ii) the excess of the interest accruing at the Adjusted Interest Rate over interest accruing at the Initial Interest Rate will be deferred, accrue interest at the Adjusted Interest Rate to the extent permitted by applicable law, and paid after the remaining principal balance of the Tropical Distribution Center Loan (as defined below) has reached zero. |
| (2) | See “Initial and Ongoing Reserves” herein. |
| (3) | The Tropical Distribution Center Property (as defined below) was built in 2019, and therefore Historical NOI and Historical Occupancy information is not available. |
THE INFORMATION IN THIS STRUCTURAL AND COLLATERAL TERM SHEET IS NOT COMPLETE AND MAY BE AMENDED PRIOR TO THE TIME OF SALE. THIS TERM SHEET IS NOT AN OFFER TO SELL THESE SECURITIES AND IT IS NOT A SOLICITATION OF AN OFFER TO BUY THESE SECURITIES IN ANY JURISDICTION WHERE THE OFFER OR SALE IS NOT PERMITTED.
54
6001 East Tropical Parkway Las Vegas, NV 89115 | Collateral Asset Summary – Loan No. 3 Tropical Distribution Center | Cut-off Date Balance: Cut-off Date LTV: U/W NCF DSCR: U/W NOI Debt Yield: | $75,000,000 68.2% 2.10x 7.7% |
The Loan. The Tropical Distribution Center mortgage loan (the “Tropical Distribution Center Loan”) is a fixed rate loan secured by a first deed of trust encumbering the borrower’s fee simple interest in a warehouse/distribution industrial property located in Las Vegas, Nevada (the “Tropical Distribution Center Property”). The Tropical Distribution Center Loan is evidenced by a promissory note with an original principal balance and outstanding principal balance as of the Cut-off Date of $75,000,000.
The Tropical Distribution Center Loan has an anticipated repayment date of the payment date in July 2030 (the “ARD”) and a final maturity date of the payment date in June 2034 (“Final Maturity Date”). Prior to the ARD, the Tropical Distribution Center Loan accrues interest at a fixed rate equal to 3.59300% per annum (the “Initial Interest Rate”) and requires monthly payments of interest only at the Initial Interest Rate. From and after the ARD, (i) the Tropical Distribution Center Loan accrues interest at the greater of (x) 6.09300% and (y) the 10-year swap rate as of the ARD plus 250 basis points (not to exceed the maximum rate permitted by applicable law) and requires monthly payments of interest only at the Initial Interest Rate, and (ii) the excess of the interest accruing at the Adjusted Interest Rate over interest accruing at the Initial Interest Rate will be deferred, accrue interest at the Adjusted Interest Rate to the extent permitted by applicable law, and paid after the remaining principal balance of the Tropical Distribution Center Loan has reached zero.
The Tropical Distribution Center Loan proceeds were used to refinance existing debt on the Tropical Distribution Center Property. The most recent prior financing of the Tropical Distribution Center Property was not included in a securitization.
| Sources and Uses | ||||||
| Sources | Proceeds | % of Total | Uses | Proceeds | % of Total | |
| Mortgage Loan | $75,000,000 | 100.0% | Loan Payoff | $68,238,200 | 91.0% | |
| Return of Equity | 6,326,569 | 8.4 | ||||
| Closing Costs | 435,231 | 0.6 | ||||
| Total Sources | $75,000,000 | 100.0% | Total Uses | $75,000,000 | 100.0% | |
The Borrower / Borrower Sponsors. The borrower is Preylock Tropical Distribution Center, LLC, a Delaware limited liability company and single purpose entity with two independent directors. Legal counsel to the borrower delivered a non-consolidation opinion in connection with the origination of the Tropical Distribution Center Loan.
The borrower sponsors and non-recourse carveout guarantors are Brett Michael Lipman and Farshid Steve Shokouhi. Mr. Lipman and Mr. Shokouhj are two of the founding members of Preylock. Preylock is a real estate acquisition and management company with over $2.0 billion of assets under management.
The Property. The Tropical Distribution Center Property is a single-story warehouse/distribution industrial building totaling approximately 855,000 sq. ft. located in Las Vegas, Nevada. The Tropical Distribution Center Property was constructed in 2019 on a 71.5-acre site and features 40-foot clear height, 68 dock high doors and two drive in doors. The borrower purchased the Tropical Distribution Center Property for $110 million in May 2020. Additionally, the Tropical Distribution Center Property contains 2,945 total parking spaces, including 2,477 regular parking spaces, 36 handicap parking spaces, 424 trailer spaces, and 8 motorcycle spaces (0.5 spaces per 1,000 sq. ft.).
Sole Tenant. Amazon.com Services LLC (855,000 sq. ft.; 100.0% of NRA; 100.0% of U/W Base Rent). Incorporated in 2002 and based in Seattle, Washington, Amazon.com Services LLC (“Amazon Services”) distributes consumer products, which are later sold by Amazon.com, Inc. (“Amazon”) through its website. Amazon Services operates as a wholly owned subsidiary of Amazon and employs 1,800 employees. Founded in 1994, Amazon is a multinational technology company focusing in e-commerce, cloud computing, and artificial intelligence, and is headquartered in Seattle, Washington. At the Tropical Distribution Center Property, Amazon Services leases 855,000 sq. ft. under a triple net lease expiring on June 30, 2034. The payment obligations under the Amazon Services lease are guaranteed by Amazon pursuant to a Limited Payment Guaranty and the Amazon Services lease has three, five-year renewal options remaining.
COVID-19 Update. As of July 1, 2020 the Tropical Distribution Center Property is open. For May and June 2020, 100% of the sq. ft. and UW Base Rent payments were collected.
| Tenant Summary(1) | ||||||
| Tenant | Ratings (Fitch/Moody’s/S&P)(2) | Net Rentable Area (Sq. Ft.) | % of Net Rentable Area | U/W Base Rent Per Sq. Ft. | % of Total U/W Base Rent | Lease Expiration |
| Amazon.com Services LLC(3) | A+ / A2 / AA- | 855,000 | 100.0% | $5.98 | 100.0% | 6/30/2034 |
| Total / Wtd. Avg. Occupied | 855,000 | 100.0% | $5.98 | 100.0% | ||
| Vacant Space | 0 | 0.0 | ||||
| Total / Wtd. Avg. | 855,000 | 100.0% | ||||
| (1) | Based on the underwritten rent roll dated as of July 1, 2020 with rent steps through July 31, 2021. |
| (2) | Certain ratings are those of the parent company whether or not the parent guarantees the lease. |
| (3) | Amazon.com Services LLC has three, five-year renewal options. |
THE INFORMATION IN THIS STRUCTURAL AND COLLATERAL TERM SHEET IS NOT COMPLETE AND MAY BE AMENDED PRIOR TO THE TIME OF SALE. THIS TERM SHEET IS NOT AN OFFER TO SELL THESE SECURITIES AND IT IS NOT A SOLICITATION OF AN OFFER TO BUY THESE SECURITIES IN ANY JURISDICTION WHERE THE OFFER OR SALE IS NOT PERMITTED.
55
6001 East Tropical Parkway Las Vegas, NV 89115 | Collateral Asset Summary – Loan No. 3 Tropical Distribution Center | Cut-off Date Balance: Cut-off Date LTV: U/W NCF DSCR: U/W NOI Debt Yield: | $75,000,000 68.2% 2.10x 7.7% |
| Lease Rollover Schedule(1) | ||||||||
| Year | # of Leases Expiring | Total Expiring Sq. Ft. | % of Total Sq. Ft. Expiring | Cumulative Expiring | Cumulative % Sq. Ft. Expiring | Annual U/W Base Rent Per Sq. Ft. | % U/W Base Rent Rolling | Cumulative % of U/W Base Rent |
| MTM | 0 | 0 | 0.0% | 0 | 0.0% | $0.00 | 0.0% | 0.0% |
| 2020 | 0 | 0 | 0.0% | 0 | 0.0% | $0.00 | 0.0% | 0.0% |
| 2021 | 0 | 0 | 0.0% | 0 | 0.0% | $0.00 | 0.0% | 0.0% |
| 2022 | 0 | 0 | 0.0% | 0 | 0.0% | $0.00 | 0.0% | 0.0% |
| 2023 | 0 | 0 | 0.0% | 0 | 0.0% | $0.00 | 0.0% | 0.0% |
| 2024 | 0 | 0 | 0.0% | 0 | 0.0% | $0.00 | 0.0% | 0.0% |
| 2025 | 0 | 0 | 0.0% | 0 | 0.0% | $0.00 | 0.0% | 0.0% |
| 2026 | 0 | 0 | 0.0% | 0 | 0.0% | $0.00 | 0.0% | 0.0% |
| 2027 | 0 | 0 | 0.0% | 0 | 0.0% | $0.00 | 0.0% | 0.0% |
| 2028 | 0 | 0 | 0.0% | 0 | 0.0% | $0.00 | 0.0% | 0.0% |
| 2029 | 0 | 0 | 0.0% | 0 | 0.0% | $0.00 | 0.0% | 0.0% |
| 2030 | 0 | 0 | 0.0% | 0 | 0.0% | $0.00 | 0.0% | 0.0% |
| 2031 & Thereafter | 1 | 855,000 | 100.0% | 855,000 | 100.0% | $5.98 | 100.0% | 100.0% |
| Vacant | NAP | 0 | 0.0% | 855,000 | 100.0% | NAP | NAP | NAP |
| Total / Wtd. Avg. | 1 | 855,000 | 100.0% | $5.98 | 100.0% | |||
| (1) | Based on the underwritten rent roll dated as of July 1, 2020 with rent steps through July 31, 2021. |
Environmental Matters. The Phase I environmental report dated April 21, 2020 identified no recognized environmental conditions at the Tropical Distribution Center Property.
The Market. According to the appraisal, the Tropical Distribution Center Property is located within the Las Vegas industrial market and Northeast Las Vegas submarket. As of year-end 2019, the Las Vegas warehouse/distribution market had approximately 92.3 million sq. ft. of industrial space with a vacancy of 7.1%. The Northeast Las Vegas submarket had approximately 19.6 million sq. ft. of industrial space with a vacancy of 15.5%. The Northeast Las Vegas submarket absorbed approximately 1.7 million net sq. ft. as of year-end 2019. Average rental rates in the submarket were reported at $6.36 per sq. ft.
The appraisal identified five comparable industrial leases for the Tropical Distribution Center Property that had base rents ranging from $4.65 to $8.25 per sq. ft.
| Comparable Industrial Leases(1) | ||||||
| Property Name / Location | Year Built | Tenant Name | Tenant Leased Space | Lease Date | Lease Term (years) | Base Rent Per Sq. Ft. |
Tropical Distribution Center Property Las Vegas, NV | 2019 | Amazon.com Services LLC(2) | 855,000(2) | June-19(2) | 15.0(2) | $5.98(2) |
Industrial Building Henderson, NV | 2019 | Confidential | 616,388 | June-20 | 15.0 | $8.25 |
LogistiCenter at Las Vegas Blvd. North Las Vegas, NV | 2017 | Sofidel America Corp. | 546,480 | March-18 | 5.0 | $4.68 |
Amazon North Las Vegas, NV | 2017 | Amazon | 813,120 | August-17 | 10.0 | $4.65 |
Northgate Distribution Center North Las Vegas, NV | 2017 | Confidential | 500,000 | August-17 | 10.0 | $4.77 |
Northgate Business Park North Las Vegas, NV | 2016 | Confidential | 400,000 | May-17 | 10.0 | $5.24 |
| (1) | Source: Appraisal. |
| (2) | Based on the underwritten rent roll dated as of July 1, 2020. Base Rent Per Sq. Ft. includes rental revenue as of May 1, 2020, with rent steps through July 31, 2021. |
THE INFORMATION IN THIS STRUCTURAL AND COLLATERAL TERM SHEET IS NOT COMPLETE AND MAY BE AMENDED PRIOR TO THE TIME OF SALE. THIS TERM SHEET IS NOT AN OFFER TO SELL THESE SECURITIES AND IT IS NOT A SOLICITATION OF AN OFFER TO BUY THESE SECURITIES IN ANY JURISDICTION WHERE THE OFFER OR SALE IS NOT PERMITTED.
56
6001 East Tropical Parkway Las Vegas, NV 89115 | Collateral Asset Summary – Loan No. 3 Tropical Distribution Center | Cut-off Date Balance: Cut-off Date LTV: U/W NCF DSCR: U/W NOI Debt Yield: | $75,000,000 68.2% 2.10x 7.7% |
Cash Flow Analysis.
| Cash Flow Analysis(1) | ||
| U/W | U/W PSF | |
| Base Rent(2) | $5,114,610 | $5.98 |
| Contractual Rent Steps(3) | 835,529 | 0.98 |
| Total Reimbursement Revenue | 1,122,265 | 1.31 |
| Gross Revenue | $7,072,404 | $8.27 |
| Vacancy Loss(4) | (176,810) | (0.21) |
| Effective Gross Revenue | $6,895,594 | $8.07 |
| Total Operating Expenses | 1,122,265 | 1.31 |
| Net Operating Income | $5,773,329 | $6.75 |
| TI/LC | 0 | 0.00 |
| Replacement Reserves | 42,750 | 0.05 |
| Net Cash Flow | $5,730,579 | $6.70 |
| (1) | Historical cash flows and occupancy are not available as the Tropical Distribution Center Property was constructed in 2019. |
| (2) | U/W Base Rent is based on the underwritten rent roll dated as of July 1, 2020 inclusive of rent steps through July 31, 2021. |
| (3) | Present value of contractual rent steps through the lease term. |
| (4) | U/W Vacancy Loss includes an adjustment of 2.5%. The Tropical Distribution Center Property is 100.0% occupied as of July 1, 2020. |
Property Management. The Tropical Distribution Center Property is managed by Preylock Holdings, Inc., an affiliate of the borrower.
Lockbox / Cash Management. The Tropical Distribution Center Loan is structured with a hard lockbox and springing cash management. The related loan documents require that the borrower cause all rents relating to the Tropical Distribution Center Property to be deposited directly in the deposit account. On each business day following the ARD or during the continuance of a Tropical Distribution Center Trigger Period (as defined below), all amounts in the deposit account are required to be remitted to a lender-controlled cash management account. Upon the occurrence and during the continuance of the ARD or a Tropical Distribution Center Trigger Period, all funds in the cash management account are to be applied and disbursed for payment of taxes, insurance premiums, operating expenses, debt service, reserves, and other amounts payable in accordance with the Tropical Distribution Center Loan documents, and all excess cash flow funds remaining in the cash management account after the application of such funds in accordance with the Tropical Distribution Center Loan documents are required (x) prior to the ARD, to be held by the lender in an excess cash flow reserve account as additional collateral for the Tropical Distribution Center Loan or (y) following the ARD, applied to pay down the principal balance of the Tropical Distribution Center Loan. Upon the occurrence and during the continuance of an event of default under the Tropical Distribution Center Loan documents, the lender may apply funds to the debt in such priority as it may determine.
A “Tropical Distribution Center Trigger Period” means, until the ARD, each period (x) commencing upon the earliest of (i) an event of default under the Tropical Distribution Center Loan, (ii) the debt yield as of the first day of any calendar quarter is less than 6.50% for the previous calendar quarter and (iii) the occurrence of a Tropical Distribution Center Lease Sweep Period (as defined below) and (y) expiring, provided that no other Tropical Distribution Center Trigger Period has commenced and is then continuing, (a) with regard to clause (i) above, upon the cure or waiver of such event of default, (b) with regard to clause (ii) above, upon the date on which (1) the debt yield is at least 6.50% for the immediately preceding calendar quarter as of the first day of two consecutive calendar quarters or (2) the borrower defeases a portion of the Tropical Distribution Center Loan equal to (A) 105% multiplied by (B) the portion of the Tropical Distribution Center Loan such that the debt yield would be at least 6.50% following the defeasance of such amount, or (c) with regard to clause (iii) above, upon the termination of such Tropical Distribution Center Lease Sweep Period.
A “Tropical Distribution Center Lease Sweep Period” means the period (x) commencing upon (a) the early termination, cancellation or surrender of the Amazon Services lease or the borrower’s receipt of notice from Amazon Services of its intent to effect an early termination, cancellation or surrender of its lease; (b) the date upon which Amazon Services has gone dark in all or substantially all of its space for 60 consecutive days without the intent of re-occupying its space (excluding events related to a casualty or condemnation of the Tropical Distribution Center Property or renovations permitted under the Amazon Services lease); (c) any (1) material non-monetary default by the Amazon Services under the Amazon Services lease which continues beyond any applicable notice and cure period and for which landlord delivers a termination notice to Amazon Services or (2) material monetary default under the Amazon Services lease Amazon Services beyond applicable notice and cure periods; (d) Amazon Services or Amazon becomes a debtor under a voluntary or involuntary bankruptcy petition that is not dismissed within 90 days of such filing (unless and until the Amazon Services lease is affirmed in such bankruptcy proceeding); or (e) upon a decline in the credit rating of Amazon’s long term debt rating below “BBB+” by S&P or any other equivalent rating by any other rating agency; and (y) ending upon (1) with respect to clause (b) above, Amazon Services resuming occupancy of the space demised under its lease for two consecutive calendar quarters; (2) with respect to clause (c) above, such default has been cured; (3) with respect to clause (d) above, such bankruptcy proceeding has been dismissed or otherwise terminated in a manner reasonably satisfactory to the lender and the related lease has been affirmed; and (4) with respect to clause (e) above, the long-term debt rating for Amazon is upgraded to “BBB+” or higher by S&P or upgraded to an equivalent rating by the rating agency whose action triggered the Tropical Distribution Center Lease Sweep Period described in clause (e) above.
THE INFORMATION IN THIS STRUCTURAL AND COLLATERAL TERM SHEET IS NOT COMPLETE AND MAY BE AMENDED PRIOR TO THE TIME OF SALE. THIS TERM SHEET IS NOT AN OFFER TO SELL THESE SECURITIES AND IT IS NOT A SOLICITATION OF AN OFFER TO BUY THESE SECURITIES IN ANY JURISDICTION WHERE THE OFFER OR SALE IS NOT PERMITTED.
57
6001 East Tropical Parkway Las Vegas, NV 89115 | Collateral Asset Summary – Loan No. 3 Tropical Distribution Center | Cut-off Date Balance: Cut-off Date LTV: U/W NCF DSCR: U/W NOI Debt Yield: | $75,000,000 68.2% 2.10x 7.7% |
Initial and Ongoing Reserves.
Real Estate Taxes and Insurance Reserves. On each payment date during the continuance of a Tropical Distribution Center Trigger Period, the borrower is required to make monthly deposits of: (i) a tax reserve in an amount equal to 1/12 of the amount that the lender estimates will be necessary to pay taxes over the then succeeding 12-month period and (ii) an insurance reserve in an amount equal to 1/12 of the amount that the lender estimates will be necessary to cover premiums to renew the insurance policies for the Tropical Distribution Center Property upon expiration thereof.
Replacement Reserve. On each payment date during the continuance of a Tropical Distribution Center Trigger Period, the borrower is required to make monthly deposits of $3,562.50 for a replacement reserve.
Unfunded Obligations Reserve. On each payment date during the continuance of a Tropical Distribution Center Trigger Period, the borrower is required to make monthly deposits of approximately $35,625.00.
Current Mezzanine or Subordinate Indebtedness. None.
Future Mezzanine or Subordinate Indebtedness Permitted. None.
Partial Release. None.
THE INFORMATION IN THIS STRUCTURAL AND COLLATERAL TERM SHEET IS NOT COMPLETE AND MAY BE AMENDED PRIOR TO THE TIME OF SALE. THIS TERM SHEET IS NOT AN OFFER TO SELL THESE SECURITIES AND IT IS NOT A SOLICITATION OF AN OFFER TO BUY THESE SECURITIES IN ANY JURISDICTION WHERE THE OFFER OR SALE IS NOT PERMITTED.
58
(THIS PAGE INTENTIONALLY LEFT BLANK)
59
| Various | Collateral Asset Summary – Loan No. 4 BX Industrial Portfolio | Cut-off Date Balance: Cut-off Date LTV: U/W NCF DSCR: U/W NOI Debt Yield: | $70,000,000 39.6% 3.57x 12.8% |
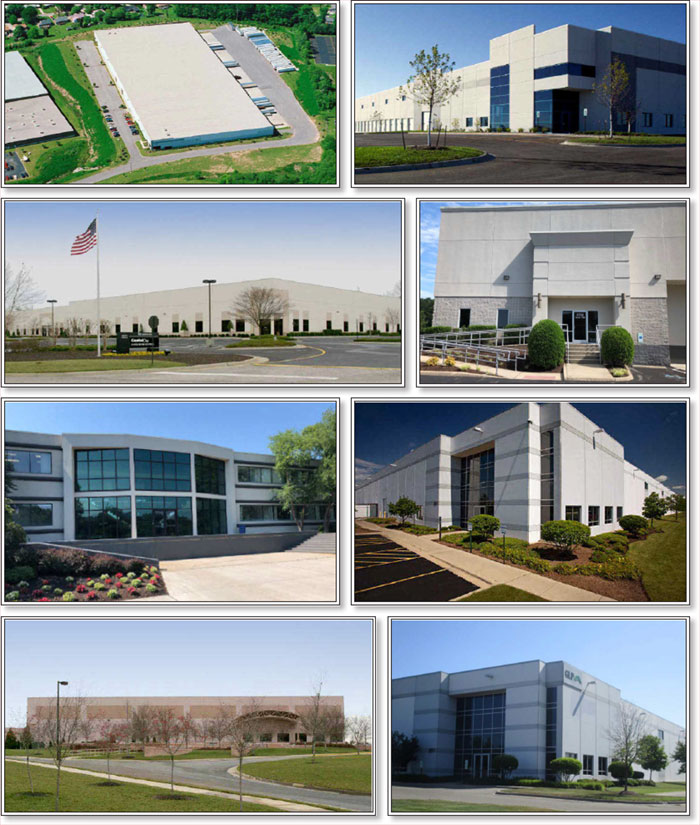
THE INFORMATION IN THIS STRUCTURAL AND COLLATERAL TERM SHEET IS NOT COMPLETE AND MAY BE AMENDED PRIOR TO THE TIME OF SALE. THIS TERM SHEET IS NOT AN OFFER TO SELL THESE SECURITIES AND IT IS NOT A SOLICITATION OF AN OFFER TO BUY THESE SECURITIES IN ANY JURISDICTION WHERE THE OFFER OR SALE IS NOT PERMITTED.
60
| Various | Collateral Asset Summary – Loan No. 4 BX Industrial Portfolio | Cut-off Date Balance: Cut-off Date LTV: U/W NCF DSCR: U/W NOI Debt Yield: | $70,000,000 39.6% 3.57x 12.8% |
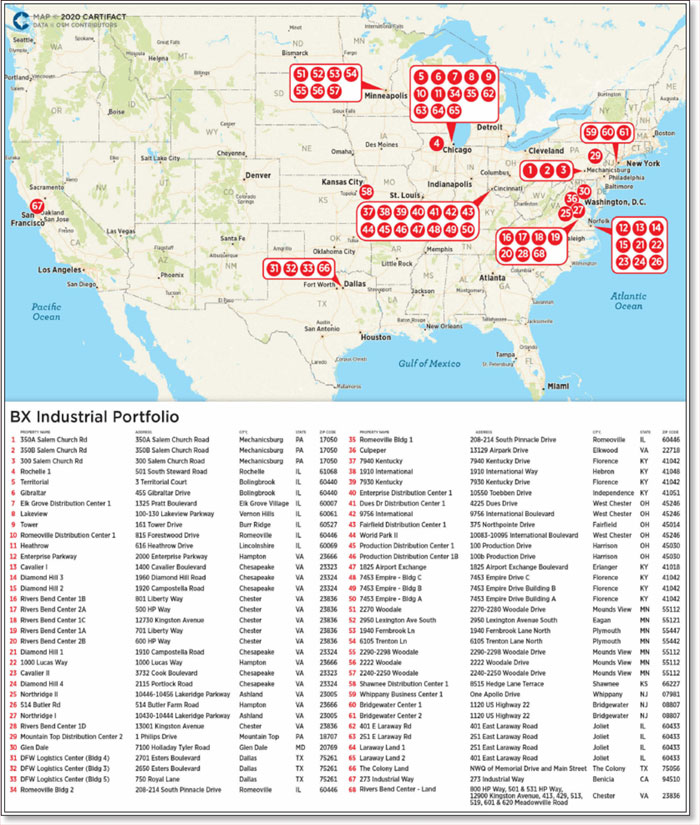
THE INFORMATION IN THIS STRUCTURAL AND COLLATERAL TERM SHEET IS NOT COMPLETE AND MAY BE AMENDED PRIOR TO THE TIME OF SALE. THIS TERM SHEET IS NOT AN OFFER TO SELL THESE SECURITIES AND IT IS NOT A SOLICITATION OF AN OFFER TO BUY THESE SECURITIES IN ANY JURISDICTION WHERE THE OFFER OR SALE IS NOT PERMITTED.
61
| Various | Collateral Asset Summary – Loan No. 4 BX Industrial Portfolio | Cut-off Date Balance: Cut-off Date LTV: U/W NCF DSCR: U/W NOI Debt Yield: | $70,000,000 39.6% 3.57x 12.8% |
| Mortgage Loan Information | |
| Loan Seller: | GACC |
| Loan Purpose: | Refinance |
| Credit Assessment | |
| (Fitch/KBRA/S&P)(10): | BBB-sf / BBB(sf) / N/A |
| Borrower Sponsor(1): | BREIT Industrial Holdings LLC |
| Borrowers(2): | Various |
| Original Balance(3): | $70,000,000 |
| Cut-off Date Balance(3): | $70,000,000 |
| % by Initial UPB: | 7.5% |
| Interest Rate(4): | 3.55000% |
| Payment Date: | 9th of each month |
| First Payment Date: | June 9, 2020 |
| Maturity Date: | October 9, 2026 |
| Amortization: | Interest Only |
| Additional Debt(3)(5): | $252,400,000 Pari Passu Debt; $72,600,000 B-Note; $110,000,000 C-Notes; $45,000,000 D-Note $99,427,615 Floating Rate Debt |
| Call Protection(6): | YM1(70), O(7) |
| Lockbox / Cash Management: | Hard / Springing |
| Reserves(7) | |||
| Initial | Monthly | Cap | |
| Taxes: | $0 | Springing | NAP |
| Insurance: | $0 | Springing | NAP |
| Replacement: | $0 | Springing | (7) |
| TI/LC: | $4,048,428 | Springing | (7) |
| Ground Rent | $0 | Springing | NAP |
| Property Information | |
| Single Asset / Portfolio: | Portfolio of 68 Properties |
| Property Type: | Various |
| Collateral: | Fee Simple / Leasehold |
| Location: | Various |
| Year Built / Renovated: | Various / Various |
| Total Sq. Ft.: | 11,097,713 |
| Property Management: | Link Industrial Management LLC |
| Underwritten NOI(8): | $48,898,094 |
| Underwritten NCF(8): | $45,568,781 |
| Appraised Value(8)(9): | $960,750,000 |
| Appraisal Date: | Various |
| Historical NOI | |
| Most Recent NOI: | $50,958,160 (T-12 March 31, 2020) |
| 2019 NOI: | $48,315,634 (December 31, 2019) |
| 2018 NOI: | $42,169,941 (December 31, 2018) |
| 2017 NOI: | $43,221,019 (December 31, 2017) |
| Historical Occupancy | |
| Most Recent Occupancy: | 87.3% (March 31, 2020) |
| 2019 Occupancy: | 92.4% (December 31, 2019) |
| 2018 Occupancy: | 89.4% (December 31, 2018) |
| 2017 Occupancy: | 84.7% (December 31, 2017) |
| Financial Information(3)(4)(8) | ||||||||
Tranche (Fixed Rate) | Cut-off Date Balance | Tranche (Floating Rate) | Balance per Unit Cut-off / Balloon | LTV Cut-off / Balloon | U/W DSCR NOI / NCF | U/W Debt Yield NOI / NCF | U/W Debt Yield at Balloon NOI / NCF | |
| Mortgage Loan | $70,000,000 | $99,427,615 Floating Rate Debt | ||||||
| Pari Passu Notes | $252,400,000 | |||||||
| Total Senior Fixed Rate Notes | $322,400,000 | $34 / $34 | 39.6% / 39.6% | 3.83x / 3.57x | 12.8% / 12.0% | 12.8% / 12.0% | ||
| B-Note | $72,600,000 | $42 / $42 | 48.5% / 48.5% | 3.13x / 2.92x | 10.5% / 9.8% | 10.5% / 9.8% | ||
| C-Notes | $110,000,000 | $54 / $54 | 62.1% / 62.1% | 2.45x / 2.28x | 8.2% / 7.6% | 8.2% / 7.6% | ||
| D-Note | $45,000,000 | $59 / $59 | 67.6% / 67.6% | 2.25x / 2.09x | 7.5% / 7.0% | 7.5% / 7.0% | ||
| Whole Loan | $649,427,615 | $59 / $59 | 67.6% / 67.6% | 2.25x / 2.09x | 7.5% / 7.0% | 7.5% / 7.0% | ||
| (1) | The borrower sponsor is affiliated with the borrowers of the mortgage loans identified on Annex A-1 to the Preliminary Prospectus as MGM Grand & Mandalay Bay and Bellagio Hotel and Casino, which have a Cut-Off Date Balance of $65.00 million and $21.25 million, respectively. |
| (2) | Please see “The Borrowers / Borrower Sponsor” herein. |
| (3) | The BX Industrial Portfolio Loan (as defined below) is part of a whole loan (the “BX Industrial Portfolio Whole Loan”) evidenced by 13 notes, with an aggregate outstanding principal balance as of the Cut-off Date of approximately $649.4 million. The BX Industrial Portfolio Whole Loan is split between (i) a 17-month revolving floating rate loan with five, one-year extension options (the “BX Industrial Portfolio Floating Rate Loan”) with an aggregate Cut-off Date principal balance of approximately $99.4 million, and (ii) a 77-month fixed rate componentized loan (the “BX Industrial Portfolio Fixed Rate Loan”) comprised of (A) a senior fixed rate loan (the “BX Industrial Portfolio Senior Fixed Rate Loan”), with an aggregate Cut-off Date principal balance of $322.4 million evidenced by eight A-Notes, and (B) a subordinate fixed rate loan (the “BX Industrial Portfolio Subordinate Fixed Rate Loan”), with an aggregate Cut-off Date principal balance of $227.6 million, evidenced by Note A-1-B, Note A-1-C-1 and Note A-1-C-2, and Note A-1-D, each of which is subordinate to all notes with a prior alphabetical designation. The BX Industrial Portfolio Senior Fixed Rate Loan is senior to the BX Industrial Portfolio Subordinate Fixed Rate Loan. The interest rate on the BX Industrial Portfolio Floating Rate Loan is LIBOR plus a spread of 1.45000%. The financial information presented in the table above relating to the Senior Fixed Rate Notes reflects the BX Industrial Portfolio Senior Fixed Rate Loan and approximately $58.283 million of the Cut-off Date balance of the BX Industrial Portfolio Floating Rate Loan (which is assumed to pay pro rata with the BX Industrial Portfolio Senior Fixed Rate Loan). The financial information above related to the B-Note, C-Notes and D-Note calculations, include a pro-rata Cut-off Date Balance of the BX Industrial Portfolio Floating Rate Loan for each respective note. For purposes of the debt service coverage ratio calculations above and herein, LIBOR is assumed to be 0.50000%. See “The Loan” and “Current Mezzanine or Subordinate Indebtedness” herein. |
| (4) | Interest Rate is reflective of BX Industrial Portfolio Fixed Rate Loan interest rate. The applicable interest rate for the BX Industrial Portfolio Floating Rate Loan (as defined below) is LIBOR (subject to a floor of 0.00000%) plus a spread of 1.45000%. For purposes of all calculations herein, LIBOR is assumed to be 0.50000%. Based on the LIBOR Cap of 4.00000%, the BX Industrial Portfolio Whole Loan NOI DSCR and NCF DSCR are 1.93x and 1.80x, respectively. |
| (5) | See “Current Mezzanine or Subordinate Indebtedness" herein. |
| (6) | All voluntary prepayments are required to be allocated to the BX Industrial Portfolio Floating Rate Loan until repaid in full, and then to the BX Industrial Portfolio Fixed Rate Loan. The first $57.8 million of the BX Industrial Portfolio Floating Rate Loan may be prepaid without any yield maintenance premium or prepayment fee. |
| (7) | See “Initial and Ongoing Reserves” herein. |
| (8) | All NOI, NCF and occupancy information, as well as the appraised value, were determined prior to the emergence of the novel coronavirus, and the economic disruption resulting from measures to combat the coronavirus, and all DSCR, LTV and Debt Yield metrics were calculated, and the BX Industrial Portfolio Whole Loan was underwritten, based on such prior information. See "Risk Factors- Coronavirus Pandemic Has Adversely Affected the Global Economy and Will Likely Adversely Affect the Performance of the Mortgage Loans" in the Preliminary Prospectus. |
| (9) | The Appraised Value is based on an aggregate “As-Is” value of the BX Industrial Properties (as defined below). |
| (10) | Fitch and KBRA provided the listed assessments for the BX Industrial Loan in the context of its inclusion in the mortgage pool. |
THE INFORMATION IN THIS STRUCTURAL AND COLLATERAL TERM SHEET IS NOT COMPLETE AND MAY BE AMENDED PRIOR TO THE TIME OF SALE. THIS TERM SHEET IS NOT AN OFFER TO SELL THESE SECURITIES AND IT IS NOT A SOLICITATION OF AN OFFER TO BUY THESE SECURITIES IN ANY JURISDICTION WHERE THE OFFER OR SALE IS NOT PERMITTED.
62
| Various | Collateral Asset Summary – Loan No. 4 BX Industrial Portfolio | Cut-off Date Balance: Cut-off Date LTV: U/W NCF DSCR: U/W NOI Debt Yield: | $70,000,000 39.6% 3.57x 12.8% |
The Loan. The BX Industrial Portfolio mortgage loan (the “BX Industrial Portfolio Loan”) is part of a fixed and floating rate whole loan (the “BX Industrial Portfolio Whole Loan”) secured by the borrowers’ fee simple or leasehold interests in 68 industrial properties totaling approximately 11.1 million sq. ft. (the “BX Industrial Portfolio Property” or “BX Industrial Portfolio Properties”, and the portfolio comprised of all such properties, the “BX Industrial Portfolio”). The BX Industrial Portfolio Whole Loan is evidenced by 13 notes, with an aggregate outstanding principal balance as of the Cut-off Date of approximately $649.4 million. The BX Industrial Portfolio Loan is evidenced by the fixed rate Note A-1-A-2 with an original principal balance and outstanding principal balance as of the Cut-off Date of $70.0 million. The BX Industrial Portfolio Whole Loan is split between (i) a 17-month floating rate loan with five, one-year extension options (the “BX Industrial Portfolio Floating Rate Loan”) with an aggregate Cut-off Date principal balance of approximately $99.4 million, and (ii) a 77-month fixed rate loan (the “BX Industrial Portfolio Fixed Rate Loan”) comprised of (A) a senior fixed rate loan (the “BX Industrial Portfolio Senior Fixed Rate Loan”), with an aggregate Cut-off Date principal balance of $322.4 million evidenced by eight A-Notes, including the BX Industrial Portfolio Loan, and (B) a subordinate fixed rate loan (the “BX Industrial Portfolio Subordinate Fixed Rate Loan”) consisting of a B-Note in the Cut-off Date principal balance of $72.6 million (the “BX Industrial Portfolio B-Note”), two C-Notes in the aggregate Cut-off Date principal balance of $110.0 million (the “BX Industrial Portfolio C-Notes”) and a D-Note in the Cut-off Date principal balance of $45.0 million (the “BX Industrial Portfolio D-Note”), with an aggregate Cut-off Date principal balance of $227.6 million.
The loan documents permit the borrowers to prepay the BX Industrial Portfolio Floating Rate Loan and, subject to the satisfaction of certain conditions set forth in the loan agreement, subsequently re-borrow such amounts pursuant to a request for an additional advance (a “Revolving Advance”) from the holder of the BX Industrial Portfolio Floating Rate Loan up to the initial principal balance of the BX Industrial Portfolio Floating Rate Loan; provided that prepayments in connection with the following are considered permanent and may not be re-borrowed: (a) individual BX Industrial Portfolio Property releases, including both regular releases and releases upon an event of default, (b) mandatory prepayments and/or releases made in connection with casualty or condemnation, (c) prepayments to avoid a cash management period caused by failure to satisfy a debt yield test, (d) a voluntary prepayment for which the borrowers has elected that such prepayment will permanently reduce the available amount of the BX Industrial Portfolio Floating Rate Loan and (e) any prepayment made during the continuance of an event of default. In the event that the holder of the BX Industrial Portfolio Floating Rate Loan does not fund a Revolving Advance, the loan documents provide that the borrowers may not reduce, discharge or release any obligations due on the BX Industrial Portfolio Fixed Rate Loan via offset of the disputed amount associated with the Revolving Advance.
The BX Industrial Portfolio Fixed Rate Loan has a 77-month interest-only term and will accrue interest at a fixed rate of 3.55000% per annum. The BX Industrial Portfolio Floating Rate Loan has a 17-month interest-only term with five, one-year extension options and will accrue interest at a rate of one-month LIBOR (subject to a floor of 0.00000%) plus a spread of 1.45000% per annum. The BX Industrial Portfolio Whole Loan was primarily used to refinance existing debt secured by the BX Industrial Portfolio Properties, fund upfront reserves and pay closing costs.
The relationship between the holders of the BX Industrial Portfolio Whole Loan is governed by a co-lender agreement as described under “Description of the Mortgage Pool—The Whole Loans—The Non-Serviced AB Whole Loans—The BX Industrial Portfolio Whole Loan” in the Preliminary Prospectus.
| Whole Loan Summary | |||||
| Note | Original Balance (Fixed) | Cut-off Date Balance (Fixed) | Note Holder | Controlling Piece | Cut-off Date Balance (Floating)(4) |
| A-1-A-1 | $80,000,000 | $80,000,000 | Benchmark 2020-IG3 | No(1) | A-2 $99,427,615 Floating Rate Loan |
| A-1-A-2 | 70,000,000 | 70,000,000 | Benchmark 2020-B18 | No | |
| A-1-A-5, A-1-A-8 | 37,400,000 | 37,400,000 | JPMDB 2020-COR7 | No | |
| A-1-A-3, A-1-A-4, A-1-A-6, A-1-A-7 | 135,000,000 | 135,000,000 | DBRI(2) | No | |
| Senior Fixed Rate Notes | $322,400,000 | $322,400,000 | |||
| A-1-B | 72,600,000 | 72,600,000 | Benchmark 2020-IG3 (loan-specific certificates) | No(1) | |
| A-1-C-1, A-1-C-2 | 110,000,000 | 110,000,000 | Unaffiliated Third Party Investor | No(1) | |
| A-1-D | 45,000,000 | 45,000,000 | Unaffiliated Third Party Investor | Yes(1) | |
| Whole Loan(3) | $649,427,615 | $649,427,615 | |||
| (1) | The initial controlling note is the BX Industrial Portfolio A-1-D note, so long as no control appraisal period with respect to the A-1-D note is continuing. If and for so long as a control appraisal period with respect to the A-1-D note has occurred and is continuing, then the controlling notes will be the A-1-C-1 and A-1-C-2 notes. If a control appraisal period with respect to the A-1-C-1 and A-1-C-2 notes has occurred and is continuing, then the controlling note will be the A-1-B note. If a control appraisal period with respect to the A-1-B note has occurred and is continuing, then the controlling note will be the A-1-A-1 note. See “Description of the Mortgage Pool—The Whole Loans—The Non-Serviced AB Whole Loan—The BX Industrial Portfolio Whole Loan”. |
| (2) | Expected to be contributed to one or more future securitization transactions. |
| (3) | The Whole Loan amount represents the sum of the balances of the BX Industrial Portfolio Floating Rate Loan and the BX Industrial Portfolio Fixed Rate Loan. |
| (4) | Note A-2 is held by Deutsche Bank AG, London Branch. |
Sources and Uses. In November 2019, Blackstone Group acquired assets from three Global Logistics Properties (“GLP”) funds for a total purchase price of $18.7 billion. The overall acquisition encompasses approximately 179.0 million SF of urban, infill logistics assets located across the United States. The acquisition of industrial assets from GLP (including properties that are part of the BX Industrial
THE INFORMATION IN THIS STRUCTURAL AND COLLATERAL TERM SHEET IS NOT COMPLETE AND MAY BE AMENDED PRIOR TO THE TIME OF SALE. THIS TERM SHEET IS NOT AN OFFER TO SELL THESE SECURITIES AND IT IS NOT A SOLICITATION OF AN OFFER TO BUY THESE SECURITIES IN ANY JURISDICTION WHERE THE OFFER OR SALE IS NOT PERMITTED.
63
| Various | Collateral Asset Summary – Loan No. 4 BX Industrial Portfolio | Cut-off Date Balance: Cut-off Date LTV: U/W NCF DSCR: U/W NOI Debt Yield: | $70,000,000 39.6% 3.57x 12.8% |
Portfolio) by certain Blackstone entities includes, among other things, the following (i) an acquisition purchase price of approximately $10.6 billion, (ii) total transaction closings costs of approximately $543.6 million and (iii) approximately $2.6 billion of sponsor equity. The BX Industrial Portfolio Whole Loan is a refinance of part of the existing debt used to finance the overall acquisition.
The Borrowers / Borrower Sponsors. The borrowers, listed in Annex-A-1 to the Preliminary Prospectus, are each a single purpose Delaware limited liability company structured to be bankruptcy remote with two independent directors in the organizational structure. Legal counsel to the borrowers delivered a non-consolidation opinion in connection with the origination of the BX Industrial Portfolio Whole Loan. The borrower sponsor and nonrecourse carve-out guarantor is BREIT Industrial Holdings LLC, an affiliate of the Blackstone Group, L.P. The liability of the non-recourse carveout guarantor in the event of a bankruptcy action by or against the related borrowers or guarantor is limited to 10% of the then-outstanding principal balance of the BX Industrial Portfolio Whole Loan, plus the enforcement cost relating to such bankruptcy action. In addition, for so long as the borrowers maintains the environmental insurance policy required under the loan agreement, the non-recourse carveout guarantor will have no liability under the related environmental indemnity agreement, and such guarantor’s liability relating to the borrowers’ failure to maintain the environmental insurance policy is capped at the amount of coverage required for such policy.
The Blackstone Group, L.P. (NYSE: BX) is an investment firm with approximately $538 billion of assets under management as of March 31, 2020 across real estate funds, private equity funds, credit businesses and hedge fund solutions. Blackstone Group’s Real Estate group was founded in 1991 and has over $161 billion of real estate assets under management. The global team consists of over 550 Blackstone Real Estate professionals around the world, with both investments and people in North America, Europe, Asia, and Latin America.
The Property. The BX Industrial Portfolio consists of 68 industrial properties totaling approximately 11.1 million sq. ft. located throughout 11 states. The largest state concentrations are in Virginia (25.1% of total net rentable area, 28.7% of U/W Base Rent) and Illinois (23.2% of total net rentable area, 22.8% of U/W Base Rent), with no other state comprising more than 10.7% of the total net rentable area or more than 14.0% of the U/W Base Rent. On a property level, no single BX Industrial Portfolio Property comprises more than 6.8% of the allocated loan amount or more than 6.0% of the U/W Base Rent. In addition, five of the BX Industrial Portfolio Properties are leased fee and account for 1.9% of the total allocated loan amount. These five properties are not included in square footage calculations and do not comprise any U/W Base Rent.
As of March 31, 2020, the BX Industrial Portfolio was 87.3% leased to over 125 tenants with no single tenant accounting for more than 6.3% of the BX Industrial Portfolio’s net rentable area. The BX Industrial Portfolio’s ten largest tenants comprise 33.6% of net rentable area and 29.7% of the U/W Base Rent. The top three tenants in the BX Industrial Portfolio, which comprise 15.8% of total net rentable area and 16.0% of U/W Base Rent, have an investment grade credit rating.
COVID-19 Update. As of July 13, 2020, the BX Industrial Portfolio Properties have remained open. For May and June of 2020, tenants representing approximately 98.1% and 98.7% of the net rentable area, respectively, have paid in rent in-full, with the borrowers having collected approximately 97.2% and 99.2% of the underwritten base rent, respectively. The BX Industrial Portfolio Whole Loan is current through the July 9, 2020 payment date. As of July 9, 2020, the BX Industrial Portfolio Whole Loan is not subject to any modification or forbearance request.
THE INFORMATION IN THIS STRUCTURAL AND COLLATERAL TERM SHEET IS NOT COMPLETE AND MAY BE AMENDED PRIOR TO THE TIME OF SALE. THIS TERM SHEET IS NOT AN OFFER TO SELL THESE SECURITIES AND IT IS NOT A SOLICITATION OF AN OFFER TO BUY THESE SECURITIES IN ANY JURISDICTION WHERE THE OFFER OR SALE IS NOT PERMITTED.
64
| Various | Collateral Asset Summary – Loan No. 4 BX Industrial Portfolio | Cut-off Date Balance: Cut-off Date LTV: U/W NCF DSCR: U/W NOI Debt Yield: | $70,000,000 39.6% 3.57x 12.8% |
| Tenant Summary(1)(2) | |||||||
| Tenant | Property Name | Ratings (Moody’s/Fitch/S&P)(3) | Net Rentable Area (Sq. Ft.) | % of Net Rentable Area | U/W Base Rent Per Sq. Ft. | % of Total U/W Base Rent | Lease Expiration(4) |
| Amazon | Various | A2 / A+ / AA- | 695,780 | 6.3% | $4.31 | 6.1% | Various(5) |
| DHL | Various | A3 / BBB+ / NR | 659,600 | 5.9% | $4.71 | 6.3% | 7/31/2021 |
| Signify North America Corp | Mountain Top Distribution Center 2 | Baa3 / NR / BBB- | 400,000 | 3.6% | $4.48 | 3.6% | 4/30/2022 |
| National Distribution Centers, LLC | 251 E Laraway Rd | NR / NR / NR | 374,460 | 3.4% | $3.90 | 3.0% | 6/30/2021 |
| Del Monte Foods, Inc. | Rochelle 1 | Caa1 / NR / CCC | 312,750 | 2.8% | $3.09 | 2.0% | 4/30/2021 |
| Wayne/Scott Fetzer Company | Various | NR / NR / NR | 308,880 | 2.8% | $2.15 | 1.3% | 4/30/2023 |
| Qualis Automotive, L.L.C. | 1910 International | NR / NR / NR | 300,000 | 2.7% | $3.75 | 2.3% | 10/31/2022 |
| Clarkwestern Dietrich Building Systems LLC | Rochelle 1 | NR / NR / NR | 266,825 | 2.4% | $3.63 | 2.0% | 10/14/2028 |
| Ford Motor Company | Shawnee Distribution Center 1 | Ba2 / BB+ / BB+ | 223,200 | 2.0% | $4.06 | 1.8% | 9/30/2023 |
| Taylor Logistics, Inc. | 9756 International | NR / NR / NR | 192,000 | 1.7% | $3.69 | 1.4% | 1/31/2024 |
| Total / Wtd. Avg. Major Tenants | 3,733,495 | 33.6% | $3.94 | 29.7% | |||
| Remaining Tenants | 5,956,511 | 53.7% | $5.84 | 70.3% | |||
| Total / Wtd. Avg. Occupied | 9,690,006 | 87.3% | $5.11 | 100.0% | |||
| Vacant Space | 1,407,707 | 12.7% | |||||
| Total | 11,097,713 | 100.0% | |||||
| (1) | Based on the underwritten rent roll as of March 31, 2020. |
| (2) | The BX Industrial Portfolio includes five leased fee properties that are not included in square footage calculations and do not comprise any U/W Base Rent. |
| (3) | Certain ratings are those of the parent company whether or not the parent guarantees the lease. |
| (4) | There are no termination options associated with the leases of the top 10 tenants at the BX Industrial Portfolio. |
| (5) | Amazon occupies (i) 475,104 sq. ft. at the 401 E Laraway Rd property with a lease expiration date of July 31, 2025, (ii) 93,048 sq. ft. at the Romeoville Bldg 1 with a lease expiration date of July 31, 2029, (iii) 75,980 sq. ft. at the Diamond Hill 2 property with a lease expiration date of September 30, 2026 and (iv) 51,648 sq. ft. at the 6105 Trenton Ln property with a lease expiration date of May 31, 2025. |
| Lease Rollover Schedule(1)(2)(3) | ||||||||
| Year | # of Leases Expiring | Total Expiring Sq. Ft. | % of Total Sq. Ft. Expiring | Cumulative Sq. Ft. Expiring | Cumulative % of Sq. Ft. Expiring | Annual U/W Base Rent Per Sq. Ft. | % U/W Base Rent Rolling | Cumulative % of U/W Base Rent |
| MTM & 2020 | 22 | 955,206 | 8.6% | 955,206 | 8.6% | $5.27 | 10.2% | 10.2% |
| 2021 | 28 | 2,232,795 | 20.1% | 3,188,001 | 28.7% | $4.54 | 20.5% | 30.7% |
| 2022 | 29 | 1,688,748 | 15.2% | 4,876,749 | 43.9% | $5.21 | 17.8% | 48.5% |
| 2023 | 22 | 1,649,237 | 14.9% | 6,525,986 | 58.8% | $5.02 | 16.7% | 65.2% |
| 2024 | 18 | 846,761 | 7.6% | 7,372,747 | 66.4% | $4.55 | 7.8% | 73.0% |
| 2025 | 10 | 758,426 | 6.8% | 8,131,173 | 73.3% | $4.72 | 7.2% | 80.3% |
| 2026 | 6 | 275,895 | 2.5% | 8,407,068 | 75.8% | $5.38 | 3.0% | 83.3% |
| 2027 | 9 | 355,367 | 3.2% | 8,762,435 | 79.0% | $4.84 | 3.5% | 86.7% |
| 2028 | 11 | 783,933 | 7.1% | 9,546,368 | 86.0% | $7.23 | 11.5% | 98.2% |
| 2029 | 1 | 93,048 | 0.8% | 9,639,416 | 86.9% | $5.00 | 0.9% | 99.1% |
| 2030 | 1 | 42,822 | 0.4% | 9,682,238 | 87.2% | $6.65 | 0.6% | 99.7% |
| 2031 &Thereafter | 2 | 7,768 | 0.1% | 9,690,006 | 87.3% | $18.37 | 0.3% | 100.0% |
| Vacant | NAP | 1,407,707 | 12.7% | 11,097,713 | 100.0% | NAP | NAP | NAP |
| Total / Wtd. Avg. | 159 | 11,097,713 | 100.0% | $5.11 | 100.0% | |||
| (1) | Based on the underwritten rent roll as of March 31, 2020. |
| (2) | The BX Industrial Portfolio includes five leased fee properties that are not included in square footage calculations and do not comprise any U/W Base Rent. |
| (3) | Certain tenants may have lease termination options that are not reflected in the Lease Rollover Schedule. |
THE INFORMATION IN THIS STRUCTURAL AND COLLATERAL TERM SHEET IS NOT COMPLETE AND MAY BE AMENDED PRIOR TO THE TIME OF SALE. THIS TERM SHEET IS NOT AN OFFER TO SELL THESE SECURITIES AND IT IS NOT A SOLICITATION OF AN OFFER TO BUY THESE SECURITIES IN ANY JURISDICTION WHERE THE OFFER OR SALE IS NOT PERMITTED.
65
| Various | Collateral Asset Summary – Loan No. 4 BX Industrial Portfolio | Cut-off Date Balance: Cut-off Date LTV: U/W NCF DSCR: U/W NOI Debt Yield: | $70,000,000 39.6% 3.57x 12.8% |
| Portfolio Summary – Top 20(1)(2) | ||||||||
| Property Name | City, State | Property Sub-Type | Year Built / Renovated | Sq. Ft. | Clear Height | Occupancy | % of Allocated Loan Amount | % of Total U/W Base Rent |
| Bridgewater Center 1(3) | Bridgewater, NJ | Warehouse/Storage | 1951 / 1994 | 437,117 | 29 | 0.5% | 6.8% | 0.1% |
| 401 E Laraway Rd | Joliet, IL | Warehouse/Distribution | 2005 / NAP | 475,104 | 30 | 100.0% | 4.4% | 3.7% |
| Rochelle 1 | Rochelle, IL | Warehouse/Distribution | 2005 / NAP | 579,575 | 32 | 100.0% | 3.6% | 3.9% |
| 350A Salem Church Rd | Mechanicsburg, PA | Warehouse/Distribution | 1990 / NAP | 405,100 | 28 | 100.0% | 3.5% | 4.0% |
| Romeoville Bldg 1 | Romeoville, IL | Warehouse/Distribution | 2016 / NAP | 199,924 | 32 | 100.0% | 3.2% | 2.0% |
| 251 E Laraway Rd | Joliet, IL | Warehouse/Distribution | 2005 / NAP | 374,460 | 30 | 100.0% | 3.1% | 3.0% |
| 7940 Kentucky | Florence, KY | Flex | 1992 / NAP | 128,077 | 18 | 94.7% | 3.0% | 6.0% |
| Mountain Top Distribution Center 2 | Mountain Top, PA | Warehouse/Distribution | 1992 / NAP | 400,000 | 29 | 100.0% | 2.5% | 3.6% |
| Enterprise Parkway | Hampton, VA | Flex | 1996 / NAP | 402,652 | 49 | 76.6% | 2.5% | 2.2% |
| Cavalier I | Chesapeake, VA | Warehouse/Distribution | 1969 / NAP | 300,117 | 28 | 77.0% | 2.4% | 2.6% |
| 1910 International | Hebron, KY | Warehouse/Distribution | 1990 / 2004 | 300,000 | 24 | 100.0% | 2.2% | 2.3% |
| Glen Dale | Glen Dale, MD | Warehouse/Distribution | 1968 / NAP | 314,590 | 21 | 53.5% | 2.0% | 1.4% |
| Romeoville Bldg 2 | Romeoville, IL | Warehouse/Distribution | 2016 / NAP | 199,924 | 32 | 30.9% | 2.0% | 0.8% |
| Enterprise Distribution Center 1 | Independence, KY | Warehouse/Distribution | 2005 / NAP | 275,000 | 28 | 100.0% | 1.8% | 2.0% |
| 2270 Woodale | Mounds View, MN | Warehouse | 1990 / NAP | 144,783 | 22 | 100.0% | 1.8% | 2.0% |
| 2950 Lexington Ave South | Eagan, MN | Warehouse/Storage | 1979 / NAP | 184,545 | 24 | 100.0% | 1.8% | 1.8% |
| Rivers Bend Center 1B | Chester, VA | Warehouse/Distribution | 1998 / NAP | 170,800 | 24 | 100.0% | 1.8% | 1.8% |
| DFW Logistics Center (Bldg 4) | Dallas, TX | Warehouse/Distribution | 2018 / NAP | 144,000 | 28 | 100.0% | 1.7% | 1.8% |
| Rivers Bend Center 1C | Chester, VA | Flex | 2001 / NAP | 158,400 | 24 | 100.0% | 1.7% | 2.5% |
| Territorial | Bolingbrook, IL | Manufacturing | 2001 / NAP | 125,448 | 24 | 100.0% | 1.6% | 2.1% |
| Subtotal | 5,719,616 | 53.4% | 49.4% | |||||
| Remaining Properties | 5,378,097 | 46.6% | 50.6% | |||||
| Total | 11,097,713 | 100.0% | 100.0% | |||||
| (1) | Based on the underwritten rent roll as of March 31, 2020. |
| (2) | The BX Industrial Portfolio includes five leased fee properties that are not included in square footage calculations and do not comprise any U/W Base Rent. The leased fee properties account for 1.9% of the total allocated loan amount. |
| (3) | The largest tenant at Bridgewater Center 1 property, Baker & Taylor (410,350 sq. ft.) recently vacated in March 2020. On April 28, 2020, the borrower sponsor executed a 6-month lease with Salson Logistics to occupy 349,054 sq. ft. at a monthly base rent of $289,424 and a lease expiration date of October 31, 2020. The Salson Logistics base rent is not included in the lender’s underwriting. |
THE INFORMATION IN THIS STRUCTURAL AND COLLATERAL TERM SHEET IS NOT COMPLETE AND MAY BE AMENDED PRIOR TO THE TIME OF SALE. THIS TERM SHEET IS NOT AN OFFER TO SELL THESE SECURITIES AND IT IS NOT A SOLICITATION OF AN OFFER TO BUY THESE SECURITIES IN ANY JURISDICTION WHERE THE OFFER OR SALE IS NOT PERMITTED.
66
| Various | Collateral Asset Summary – Loan No. 4 BX Industrial Portfolio | Cut-off Date Balance: Cut-off Date LTV: U/W NCF DSCR: U/W NOI Debt Yield: | $70,000,000 39.6% 3.57x 12.8% |
| Property Sub-Type Summary(1)(2) | ||||||||
| Property Sub-Type | # of Properties | Sq. Ft. | % of Total | Occupancy | Allocated Loan Amount | % of Total | UW Base Rent | % of Total |
| Warehouse/Distribution | 40 | 8,235,571 | 74.2% | 91.0% | $423,977,413 | 65.3% | $32,470,428 | 65.6% |
| Flex | 12 | 1,344,906 | 12.1% | 90.9% | $95,202,976 | 14.7% | $10,102,835 | 20.4% |
| Warehouse/Storage | 3 | 723,662 | 6.5% | 39.9% | $55,620,377 | 8.6% | $1,546,381 | 3.1% |
| Manufacturing | 4 | 428,799 | 3.9% | 93.7% | $31,666,080 | 4.9% | $2,910,094 | 5.9% |
| Warehouse | 2 | 264,783 | 2.4% | 88.5% | $21,702,184 | 3.3% | $1,936,291 | 3.9% |
| Suburban | 1 | 61,488 | 0.6% | 12.6% | $5,459,669 | 0.8% | $124,430 | 0.3% |
| R&D/Flex | 1 | 38,504 | 0.3% | 100.0% | $3,344,047 | 0.5% | $387,350 | 0.8% |
| Leased Fee | 5 | NAP | 0.0% | 0.0% | $12,454,870 | 1.9% | $0 | 0.0% |
| Total | 68 | 11,097,713 | 100.0% | 87.3% | $649,427,615 | 100.0% | $49,477,809 | 100.0% |
| (1) | Based on the underwritten rent roll as of March 31, 2020. |
| (2) | The BX Industrial Portfolio includes five leased fee properties that are not included in square footage calculations and do not comprise any U/W Base Rent. The leased fee properties account for 1.9% of the total allocated loan amount. |
Environmental Matters. The Phase I environmental reports dated from between July 19, 2019 and September 24, 2019 identified recognized environmental conditions at certain of the BX Industrial Portfolio Properties. Please see “Description of the Mortgage Pool- Environmental Considerations” in the Preliminary Prospectus for more information.
The Market. The BX Industrial Portfolio Properties are located throughout 11 states which include the following top five states by sq. ft., Virginia (25.1% of NRA; 28.7% of U/W Base Rent), Illinois (23.2% of NRA; 22.8% of U/W Base Rent), Kentucky (10.7% of NRA; 14.0% of U/W Base Rent), Ohio (10.6% of NRA; 5.5% of U/W Base Rent) and Pennsylvania (9.5% of NRA; 9.9% of U/W Base Rent).
| Geographic Summary(1)(2) | ||||||||
| State | # of Properties | Sq. Ft. | % of Total | Occupancy | Allocated Loan Amount | % of Total | UW Base Rent | % of Total |
| VA | 19 | 2,783,855 | 25.1% | 88.6% | $162,083,920 | 25.0% | $14,178,600 | 28.7% |
| IL | 14 | 2,579,841 | 23.2% | 93.6% | $158,603,381 | 24.4% | $11,279,283 | 22.8% |
| KY | 8 | 1,187,058 | 10.7% | 99.4% | $67,870,509 | 10.5% | $6,921,518 | 14.0% |
| OH | 6 | 1,174,650 | 10.6% | 78.0% | $37,603,470 | 5.8% | $2,743,658 | 5.5% |
| PA | 4 | 1,059,600 | 9.5% | 100.0% | $53,914,230 | 8.3% | $4,898,077 | 9.9% |
| MN | 7 | 735,645 | 6.6% | 93.4% | $51,457,379 | 7.9% | $4,015,681 | 8.1% |
| NJ | 3 | 659,117 | 5.9% | 29.4% | $54,187,214 | 8.3% | $1,614,361 | 3.3% |
| TX | 4 | 380,157 | 3.4% | 100.0% | $38,490,666 | 5.9% | $2,212,521 | 4.5% |
| MD | 1 | 314,590 | 2.8% | 53.5% | $13,103,205 | 2.0% | $707,917 | 1.4% |
| KS | 1 | 223,200 | 2.0% | 100.0% | $9,622,666 | 1.5% | $906,192 | 1.8% |
| CA | 1 | NAP | 0.0% | 0.0% | $2,490,974 | 0.4% | $0 | 0.0% |
| Total | 68 | 11,097,713 | 100.0% | 87.3% | $649,427,615 | 100.0% | $49,477,809 | 100.0% |
| (1) | Based on the underwritten rent roll as of March 31, 2020. |
| (2) | The BX Industrial Portfolio includes five leased fee properties that are not included in square footage calculations and do not comprise any U/W Base Rent. The leased fee properties account for 1.9% of the total allocated loan amount. |
THE INFORMATION IN THIS STRUCTURAL AND COLLATERAL TERM SHEET IS NOT COMPLETE AND MAY BE AMENDED PRIOR TO THE TIME OF SALE. THIS TERM SHEET IS NOT AN OFFER TO SELL THESE SECURITIES AND IT IS NOT A SOLICITATION OF AN OFFER TO BUY THESE SECURITIES IN ANY JURISDICTION WHERE THE OFFER OR SALE IS NOT PERMITTED.
67
| Various | Collateral Asset Summary – Loan No. 4 BX Industrial Portfolio | Cut-off Date Balance: Cut-off Date LTV: U/W NCF DSCR: U/W NOI Debt Yield: | $70,000,000 39.6% 3.57x 12.8% |
| Market Summary(1)(2) | |||||||||
| Market | # of Properties | Sq. Ft. | % of Total | Allocated Loan Amount | % of Total | UW Base Rent | Occupancy | Market Rent Per Sq. Ft.(2) | Market Vacancy(2) |
| South Virginia | 19 | 2,783,855 | 25.1% | $162,083,920 | 25.0% | $14,178,600 | 88.6% | $7.42 | 3.6% |
| Chicago | 14 | 2,579,841 | 23.2% | $158,603,381 | 24.4% | $11,279,283 | 93.6% | $7.37 | 6.1% |
| Cincinnati | 14 | 2,361,708 | 21.3% | $105,473,979 | 16.2% | $9,665,176 | 88.8% | $5.32 | 5.2% |
| Northern NJ | 3 | 659,117 | 5.9% | $54,187,214 | 8.3% | $1,614,361 | 29.4% | $10.12 | 4.1% |
| Eastern / Central PA | 4 | 1,059,600 | 9.5% | $53,914,230 | 8.3% | $4,898,077 | 100.0% | $5.78 | 8.0% |
| Minneapolis | 7 | 735,645 | 6.6% | $51,457,379 | 7.9% | $4,015,681 | 93.4% | $6.98 | 3.4% |
| Dallas/Fort Worth | 4 | 380,157 | 3.4% | $38,490,666 | 5.9% | $2,212,521 | 100.0% | $6.77 | 6.3% |
| Washington DC | 1 | 314,590 | 2.8% | $13,103,205 | 2.0% | $707,917 | 53.5% | $12.05 | 6.1% |
| Kansas City | 1 | 223,200 | 2.0% | $9,622,666 | 1.5% | $906,192 | 100.0% | $5.43 | 4.9% |
| Bay Area | 1 | NAP | NAP | $2,490,974 | 0.4% | $0 | NAP | NAP | NAP |
| Total | 68 | 11,097,713 | 100.0% | $649,427,615 | 100.0% | $49,477,809 | 87.3% | $7.01 | 5.2% |
| (1) | Based on the underwritten rent roll as of March 31, 2020. |
| (2) | The BX Industrial Portfolio includes five leased fee properties that are not included in square footage calculations and do not comprise any U/W Base Rent. The leased fee properties account for 1.9% of the total allocated loan amount. The Bay Area Market includes the 273 Industrial Way property which is a leased fee property with no attributable rent or sq. ft. |
| Top 20 Properties - Submarket Analysis(1) | ||||||||
| Property Name | Allocated Loan Amount | % of Total | U/W Base Rent | % of Total | Market(2) | Submarket(2) | Submarket Rent Per Sq. Ft.(2) | Submarket Vacancy(2) |
| Bridgewater Center 1 | $44,155,072 | 6.8% | $28,567 | 0.1% | Northern NJ | Central New Jersey Warehouse/Distribution | $7.28 | 1.9% |
| 401 E Laraway Rd | $28,867,999 | 4.4% | $1,824,886 | 7.5% | Chicago | Interstate 80 Corridor | $3.85 | 10.0% |
| Rochelle 1 | $23,613,068 | 3.6% | $1,934,972 | 7.9% | Chicago | Interstate 39 Corridor | $3.08 | 4.9% |
| 350A Salem Church Rd | $22,521,134 | 3.5% | $1,972,837 | 8.1% | Eastern / Central PA | I-81/I-78 Corridor | $4.82 | 6.8% |
| Romeoville Bldg 1 | $20,542,004 | 3.2% | $985,726 | 4.0% | Chicago | Interstate 55 | $4.72 | 9.7% |
| 251 E Laraway Rd | $19,859,546 | 3.1% | $1,460,394 | 6.0% | Chicago | Interstate 80 Corridor | $3.85 | 10.0% |
| 7940 Kentucky | $19,791,300 | 3.0% | $2,951,805 | 12.1% | Cincinnati | Florence/Richwood Industrial | $4.02 | 1.3% |
| Mountain Top Distribution Center 2 | $16,447,253 | 2.5% | $1,792,000 | 7.3% | Eastern / Central PA | Mountain Top | $4.95 | 4.2% |
| Enterprise Parkway | $15,969,532 | 2.5% | $1,077,433 | 4.4% | South Virginia | Copeland | $6.64 | 1.9% |
| Cavalier I | $15,764,794 | 2.4% | $1,272,656 | 5.2% | South Virginia | Cavalier | $7.51 | 4.7% |
| 1910 International | $14,195,139 | 2.2% | $1,125,000 | 4.6% | Cincinnati | Airport Industrial | $4.51 | 3.9% |
| Glen Dale | $13,103,205 | 2.0% | $707,917 | 2.9% | Washington DC | Suburban Maryland Industrial | $8.30 | 8.8% |
| Romeoville Bldg 2 | $12,898,468 | 2.0% | $396,043 | 1.6% | Chicago | Interstate 55 | $4.72 | 9.7% |
| Enterprise Distribution Center 1 | $11,943,026 | 1.8% | $975,150 | 4.0% | Cincinnati | Florence/Richwood Industrial | $4.02 | 1.3% |
| 2270 Woodale | $11,670,042 | 1.8% | $987,996 | 4.0% | Minneapolis | North Central | $6.69 | 4.2% |
| 2950 Lexington Ave South | $11,465,305 | 1.8% | $880,314 | 3.6% | Minneapolis | South Central | $5.24 | 4.9% |
| Rivers Bend Center 1B | $11,397,059 | 1.8% | $890,195 | 3.6% | South Virginia | Southeast Richmond | $5.18 | 3.6% |
| DFW Logistics Center (Bldg 4) | $11,192,321 | 1.7% | $885,773 | 3.6% | Dallas/Fort Worth | DFW Airport Industrial | $4.63 | 4.4% |
| Rivers Bend Center 1C | $10,782,846 | 1.7% | $1,253,768 | 5.1% | South Virginia | Southeast Richmond | $5.18 | 3.6% |
| Territorial | $10,578,108 | 1.6% | $1,041,051 | 4.3% | Chicago | Interstate 55 | $4.72 | 9.7% |
| Total | $346,757,221 | 53.4% | $24,444,483 | 100.0% | ||||
| (1) | Based on the underwritten rent roll as of March 31, 2020. |
| (2) | Source: Appraisal. |
THE INFORMATION IN THIS STRUCTURAL AND COLLATERAL TERM SHEET IS NOT COMPLETE AND MAY BE AMENDED PRIOR TO THE TIME OF SALE. THIS TERM SHEET IS NOT AN OFFER TO SELL THESE SECURITIES AND IT IS NOT A SOLICITATION OF AN OFFER TO BUY THESE SECURITIES IN ANY JURISDICTION WHERE THE OFFER OR SALE IS NOT PERMITTED.
68
| Various | Collateral Asset Summary – Loan No. 4 BX Industrial Portfolio | Cut-off Date Balance: Cut-off Date LTV: U/W NCF DSCR: U/W NOI Debt Yield: | $70,000,000 39.6% 3.57x 12.8% |
Cash Flow Analysis.
| Cash Flow Analysis(1) | ||||||
| 2017 | 2018 | 2019 | T-12 3/31/2020 | U/W | U/W PSF | |
| Base Rent | $43,755,073 | $43,647,125 | $50,879,764 | $51,531,584 | $49,477,809 | $4.46 |
| Contractual Rent Steps | 0 | 0 | 0 | 0 | 1,340,873 | $0.12 |
| Value of Vacant Space | 0 | 0 | 0 | 0 | 11,899,234 | $1.07 |
| Gross Potential Rent | $43,755,073 | $43,647,125 | $50,879,764 | $51,531,584 | $62,717,915 | $5.65 |
| Total Reimbursement Revenue | 14,024,977 | 14,425,751 | 16,951,400 | 16,820,366 | 17,301,645 | $1.56 |
| Other Income | 1,961,648 | 2,043,742 | 309,016 | 330,389 | 99,533 | $0.01 |
| Less: Bad Debt/Abatements | (834,770) | (1,307,105) | (1,377,111) | (635,171) | 0 | $0.00 |
| Less: Vacancy | 0 | 0 | 0 | 0 | (11,899,234) | ($1.07) |
| Effective Gross Income | $58,906,928 | $58,809,513 | $66,763,069 | $68,047,168 | $68,219,859 | $6.15 |
| Real Estate Taxes | 8,152,906 | 8,193,458 | 8,932,002 | 8,705,953 | 10,366,547 | $0.93 |
| Insurance | 656,152 | 636,196 | 668,401 | 665,525 | 611,507 | $0.06 |
| Management Fees | 807,687 | 813,304 | 1,679,835 | 789,265 | 907,868 | $0.08 |
| Total Other Expenses | $6,069,165 | $6,996,614 | $7,167,196 | $6,928,265 | $7,435,842 | $0.67 |
| Total Operating Expenses | $15,685,910 | $16,639,572 | $18,447,435 | $17,089,007 | $19,321,765 | $1.74 |
| Net Operating Income | $43,221,019 | $42,169,941 | $48,315,634 | $50,958,160 | $48,898,094 | $4.41 |
| TI/LC | 0 | 0 | 0 | 0 | 2,219,543 | $0.20 |
| Capital Expenditures | 0 | 0 | 0 | 0 | 1,109,771 | $0.10 |
| Net Cash Flow | $43,221,019 | $42,169,941 | $48,315,634 | $50,958,160 | $45,568,781 | $4.11 |
| (1) | U/W Base Rent is based on the underwritten rent roll as of March 31, 2020. For avoidance of doubt, no COVID-19 specific adjustments have been incorporated in the lender U/W. |
Property Management. The BX Industrial Portfolio Property is managed by Link Industrial Management LLC, an affiliate of the borrowers, and sub-managed by third party sub-managers.
Lockbox / Cash Management. The BX Industrial Portfolio Whole Loan is structured with a hard lockbox and springing cash management. The borrowers are required to cause all rents to be deposited directly into a lender approved lockbox account. All funds received by such borrowers or the manager are required to be deposited in a lockbox account within two business days following receipt. During the continuance of a Trigger Period (as defined below), all funds on deposit in the lockbox account are required to be swept not less than twice per week into a lender-controlled cash management account and applied on each payment date and disbursed in accordance with the loan agreement. Provided no Trigger Period is continuing, funds on deposit in the lockbox accounts will be disbursed to the borrowers’ operating account.
A “Trigger Period” means a period commencing upon the occurrence of: (i) an event of default under the BX Industrial Portfolio Whole Loan or (ii) a Low Debt Yield Period (as defined below).
A Trigger Period may be cured (a) with respect to clause (i) above, upon the acceptance by the lender of a cure of such event of default, and (b) with respect to clause (ii) above, the Low Debt Yield Period has been cured as set forth below.
A “Low Debt Yield Period” will commence upon (i) the debt yield of the BX Industrial Portfolio Whole Loan being less than 6.50% as of the last day of any calendar quarter during the period up to and including November 9, 2022 and (ii) the debt yield of the BX Industrial Portfolio Whole Loan being less than 6.75% as of the last day of two consecutive calendar quarters at any time thereafter (collectively, the “Debt Yield Threshold”), and will end if (i) the BX Industrial Portfolio exceeds the applicable Debt Yield Threshold for two consecutive quarters or (ii) the borrowers make a prepayment such that the debt yield is at least equal to the Debt Yield Threshold in accordance with the terms of the loan agreement.
Initial and Ongoing Reserves. At loan origination, the borrowers deposited approximately $4,048,428 into a rollover reserve account for existing tenant improvements and leasing costs.
Tax Reserve. On each payment date during the continuance of a Trigger Period, the borrowers are required to deposit into a real estate tax reserve, on a monthly basis, 1/12 of the estimated annual real estate taxes payable during the next 12 months.
Insurance Reserve. On each payment date during the continuance of a Trigger Period, the borrowers are required to deposit into an insurance reserve, on a monthly basis, 1/12 of estimated annual insurance premiums.
Replacement Reserve. On each payment date during the continuance of a Trigger Period, the borrowers are required to deposit into a replacement reserve, on a monthly basis, an amount equal to $0.15 per sq. ft. for replacement reserves, subject to a cap of twelve times the monthly deposit amount.
THE INFORMATION IN THIS STRUCTURAL AND COLLATERAL TERM SHEET IS NOT COMPLETE AND MAY BE AMENDED PRIOR TO THE TIME OF SALE. THIS TERM SHEET IS NOT AN OFFER TO SELL THESE SECURITIES AND IT IS NOT A SOLICITATION OF AN OFFER TO BUY THESE SECURITIES IN ANY JURISDICTION WHERE THE OFFER OR SALE IS NOT PERMITTED.
69
| Various | Collateral Asset Summary – Loan No. 4 BX Industrial Portfolio | Cut-off Date Balance: Cut-off Date LTV: U/W NCF DSCR: U/W NOI Debt Yield: | $70,000,000 39.6% 3.57x 12.8% |
Rollover Reserves. On each payment date during the continuance of a Trigger Period, the borrowers are required to deposit $0.35 per sq. ft. into a rollover reserve for tenant improvements and leasing commissions, subject to a cap of twelve times the monthly deposit amount.
Ground Rent Reserves. On each payment date during the continuance of a Trigger Period, the borrowers are required to deposit the applicable ground rent amount required under the ground leases into a ground rent reserve.
Current Mezzanine or Subordinate Indebtedness. The BX Industrial Portfolio Subordinate Fixed Rate Loan is comprised of (i) the BX Industrial Portfolio B-Note in the amount of $72.6 million, the BX Industrial Portfolio C-Notes in the amount of $110.0 million and the BX Industrial Portfolio D-Note in the amount of $45.0 million. The BX Industrial Portfolio B-Note will accrue interest at a fixed rate of 3.55000%. The BX Industrial Portfolio C-Notes will accrue interest at a fixed rate of 3.55000% and were sold to an unaffiliated third party investor. The BX Industrial Portfolio D-Note will accrue interest at a fixed rate of 3.55000% and was sold to an unaffiliated third party investor.
For additional information, see “Description of the Mortgage Pool—The Whole Loans—The Non-Serviced AB Whole Loans—The BX Industrial Portfolio Whole Loan” in the Preliminary Prospectus.
Future Mezzanine or Subordinate Indebtedness Permitted. None.
Partial Release. The borrowers are permitted to prepay a portion of the BX Industrial Portfolio Floating Rate Loan in an aggregate amount not to exceed $57,800,000 at any time without a spread maintenance payment. Any voluntary prepayment will first be allocated to the BX Industrial Portfolio Floating Rate Loan until it is prepaid in full and then to the BX Industrial Portfolio Fixed Rate Loan.
The borrowers may obtain the release of an individual property upon, among other terms and conditions outlined in the loan documents, (i) prepayment by the borrowers of the Adjusted Release Amount (as defined below) for the individual property to be released, (ii) no event of default is continuing; (iii) the debt yield with respect to the remaining properties following the release must be equal to or greater than the greater of (1) 7.5% and (2) the lesser of (a) the debt yield immediately prior to such release and (b) 8.5%, and (iv) satisfaction of REMIC related conditions. Any such prepayment allocable to the BX Industrial Portfolio Floating Rate Loan prior to October 9, 2020, will require a spread maintenance premium equal to the product of (x) 1.450%, (y) the amount prepaid and (z) a fraction, the numerator of which is the number of days from the date of prepayment to and including October 9, 2020, and the denominator of which is 360. Any such prepayment allocable to the BX Industrial Portfolio Fixed Rate Loan prior to March 9, 2026 will require a yield maintenance premium in an amount equal to the greater of (a) 1.00% of the amount prepaid and (b) a yield maintenance premium. In addition, the borrowers are permitted to obtain the release of an individual BX Industrial Portfolio Property in order to (a) cure an event of default relating to such property or (b) for a ground leased BX Industrial Portfolio Property, cure an event of default relating to a default under such a ground lease. In each instance, satisfaction of the debt yield requirement above is not required to obtain such a release, and such a release will not trigger any prepayment or yield maintenance premiums. See “Description of the Mortgage Pool—Certain Terms of the Mortgage Loans—Partial Releases” in the Preliminary Prospectus.
“Adjusted Release Amount” means for any individual BX Industrial Portfolio Property to be released, the sum of (a) the Amortized Release Amount for such property and (b) the applicable Release Price Premium for such property.
“Amortized Release Amount” means, for any individual BX Industrial Portfolio Property, the original allocated loan amount for such property, as such amount may be reduced by certain prepayments permitted under the loan documents.
“Release Price Premium” means, for each individual BX Industrial Portfolio Property, an amount equal to (a) 5% of the Amortized Release Amount for the applicable property until 30% of the original principal balance of the BX Industrial Portfolio Whole Loan has been prepaid in accordance with the loan documents and (b) thereafter, 10% of the Amortized Release Amount for the applicable property.
THE INFORMATION IN THIS STRUCTURAL AND COLLATERAL TERM SHEET IS NOT COMPLETE AND MAY BE AMENDED PRIOR TO THE TIME OF SALE. THIS TERM SHEET IS NOT AN OFFER TO SELL THESE SECURITIES AND IT IS NOT A SOLICITATION OF AN OFFER TO BUY THESE SECURITIES IN ANY JURISDICTION WHERE THE OFFER OR SALE IS NOT PERMITTED.
70
(THIS PAGE INTENTIONALLY LEFT BLANK)
71
3799 & 3950 South Las Vegas Boulevard Las Vegas, NV Various | Collateral Asset Summary – Loan No. 5 MGM Grand & Mandalay Bay | Cut-off Date Balance: Cut-off Date LTV: U/W NCF DSCR: U/W NOI Debt Yield: | $65,000,000 35.5% 4.95x 17.9% |

THE INFORMATION IN THIS STRUCTURAL AND COLLATERAL TERM SHEET IS NOT COMPLETE AND MAY BE AMENDED PRIOR TO THE TIME OF SALE. THIS TERM SHEET IS NOT AN OFFER TO SELL THESE SECURITIES AND IT IS NOT A SOLICITATION OF AN OFFER TO BUY THESE SECURITIES IN ANY JURISDICTION WHERE THE OFFER OR SALE IS NOT PERMITTED.
72
3799 & 3950 South Las Vegas Boulevard Las Vegas, NV Various | Collateral Asset Summary – Loan No. 5 MGM Grand & Mandalay Bay | Cut-off Date Balance: Cut-off Date LTV: U/W NCF DSCR: U/W NOI Debt Yield: | $65,000,000 35.5% 4.95x 17.9% |
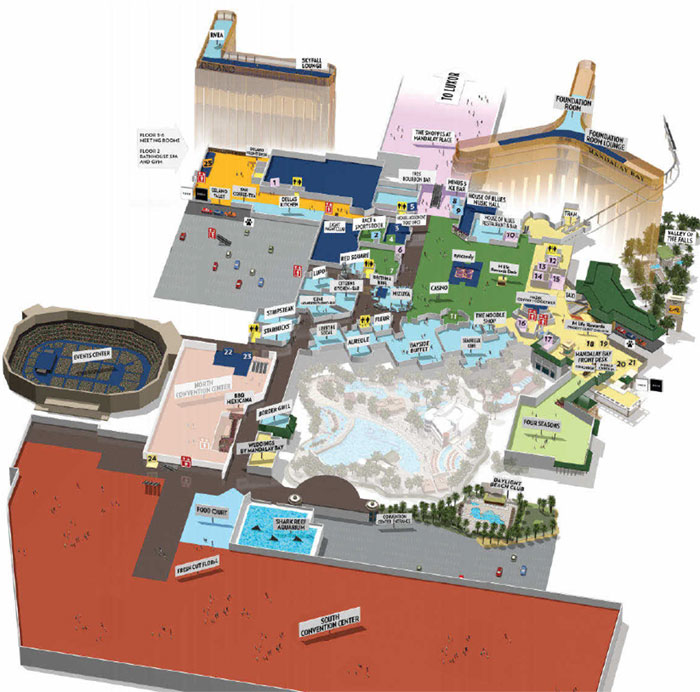
THE INFORMATION IN THIS STRUCTURAL AND COLLATERAL TERM SHEET IS NOT COMPLETE AND MAY BE AMENDED PRIOR TO THE TIME OF SALE. THIS TERM SHEET IS NOT AN OFFER TO SELL THESE SECURITIES AND IT IS NOT A SOLICITATION OF AN OFFER TO BUY THESE SECURITIES IN ANY JURISDICTION WHERE THE OFFER OR SALE IS NOT PERMITTED.
73
3799 & 3950 South Las Vegas Boulevard Las Vegas, NV Various | Collateral Asset Summary – Loan No. 5 MGM Grand & Mandalay Bay | Cut-off Date Balance: Cut-off Date LTV: U/W NCF DSCR: U/W NOI Debt Yield: | $65,000,000 35.5% 4.95x 17.9% |
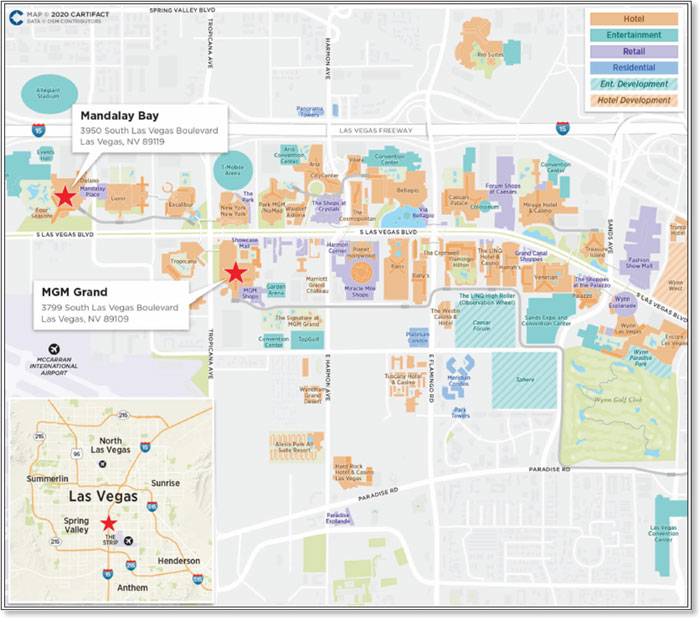
THE INFORMATION IN THIS STRUCTURAL AND COLLATERAL TERM SHEET IS NOT COMPLETE AND MAY BE AMENDED PRIOR TO THE TIME OF SALE. THIS TERM SHEET IS NOT AN OFFER TO SELL THESE SECURITIES AND IT IS NOT A SOLICITATION OF AN OFFER TO BUY THESE SECURITIES IN ANY JURISDICTION WHERE THE OFFER OR SALE IS NOT PERMITTED.
74
3799 & 3950 South Las Vegas Boulevard Las Vegas, NV Various | Collateral Asset Summary – Loan No. 5 MGM Grand & Mandalay Bay | Cut-off Date Balance: Cut-off Date LTV: U/W NCF DSCR: U/W NOI Debt Yield: | $65,000,000 35.5% 4.95x 17.9% |
| Mortgage Loan Information | |
| Loan Sellers(1): | CREFI/GACC |
| Loan Purpose(2): | Acquisition |
| Credit Assessment | |
| (Fitch/KBRA/S&P)(11): | BBB+sf / AA-(sf) / N/A |
| Borrower Sponsors: | BREIT Operating Partnership L.P.; MGM Growth Properties Operating Partnership LP |
| Borrowers(3): | MGM Grand PropCo, LLC; Mandalay PropCo, LLC |
| Original Balance(4): | $65,000,000 |
| Cut-off Date Balance(4): | $65,000,000 |
| % by Initial UPB: | 7.0% |
| Interest Rate: | 3.55800% |
| Payment Date: | 5th of each month |
| First Payment Date: | April 5, 2020 |
| Anticipated Repayment Date(5): | March 5, 2030 |
| Final Maturity Date(5): | March 5, 2032 |
| Amortization: | Interest Only, ARD (to the extent of Excess Cash Flow) |
| Additional Debt(4): | $1,569,200,000 Pari Passu Debt; $804,400,000 B-Notes; $561,400,000 C-Notes; Future Mezzanine Debt Permitted |
| Call Protection(6): | YM0.5(28), DorYM0.5(85), O(7) |
| Lockbox / Cash Management: | Hard / Springing |
| Reserves(7) | |||
| Initial | Monthly | Cap | |
| Taxes: | $0 | Springing | NAP |
| Insurance: | $0 | Springing | NAP |
| FF&E: | $0 | Springing | NAP |
| Property Information | ||
| Single Asset / Portfolio: | Portfolio of two properties | |
| Property Type: | Full Service Hospitality | |
| Collateral: | Fee Simple | |
| Location: | Las Vegas, NV | |
| Year Built / Renovated(8): | Various / NAP | |
| Total Rooms(9): | 9,748 | |
| Property Management: | Self-Managed | |
| Underwritten NOI: | $520,080,353 | |
| Underwritten NCF: | $487,305,761 | |
| Appraised Value(10): | $4,600,000,000 | |
| Appraisal Date(10): | January 10, 2020 | |
| Historical NOI(2) | ||
| Most Recent NOI: | $486,845,706 (T-12 March 31, 2020) | |
| 2019 NOI: | $520,080,353 (December 31, 2019) | |
| 2018 NOI: | $617,369,266 (December 31, 2018) | |
| 2017 NOI: | $605,037,208 (December 31, 2017) | |
| Historical Occupancy(9) | ||
| Most Recent Occupancy: | 91.0% (March 31, 2020) | |
| 2019 Occupancy: | 92.1% (December 31, 2019) | |
| 2018 Occupancy: | 91.5% (December 31, 2018) | |
| 2017 Occupancy: | 91.0% (December 31, 2017) | |
| Financial Information(4) | ||||||
| Tranche | Cut-off Date Balance | Balance per Room Cut-off / Balloon(5) | LTV(5)(10) Cut-off / Balloon | U/W DSCR(2) Master Lease Rent | U/W Debt Yield(2) Master Lease Rent | U/W Debt Yield at Balloon(2) Master Lease Rent |
| Mortgage Loan | $65,000,000 | |||||
| Pari Passu Notes | $1,569,200,000 | |||||
| Total A Notes | $1,634,200,000 | $167,645 / $167,645 | 35.5% / 35.5% | 4.95x | 17.9% | 17.9% |
| B Notes | $804,400,000 | |||||
| C Notes | $561,400,000 | |||||
| Whole Loan | $3,000,000,000 | $307,755 / $307,755 | 65.2% / 65.2% | 2.70x | 9.7% | 9.7% |
| (1) | The MGM Grand & Mandalay Bay Whole Loan (as defined below) was co-originated by Citi Real Estate Funding Inc. (“CREFI”), Barclays Capital Real Estate Inc. (“BCREI”), Deutsche Bank AG, New York Branch (“DBNY”) and Société Générale Financial Corporation (“SGFC”). CREFI will be contributing Note A-13-1 with an outstanding principal balance of $43,333,333 and GACC will be contributing Note A-15-1 with an outstanding principal balance of $21,666,667 to the Benchmark 2020-B18 securitization. |
| (2) | On January 14, 2020, MGM Growth Properties Operating Partnership LP (“MGP OP”), an affiliate of BREIT Operating Partnership L.P. (“BREIT OP”; and together with MGP OP, the “Sponsors”, as more particularly referred to as the “Borrower Sponsors”) and certain other parties entered into an agreement to, among other things, form a joint venture (50.1% indirectly owned by MGP OP and 49.9% indirectly owned by BREIT OP) (the “Joint Venture”) to acquire the MGM Grand & Mandalay Bay Properties (as defined below) for a purchase price of $4.60 billion ($471,892 per room). Contemporaneously with the acquisition, the MGM Grand & Mandalay Bay Borrowers (as defined below), as landlord entered into a 30-year triple-net master/operating lease (the “MGM/Mandalay Lease” or “Master Lease”) with two, 10-year renewal options with MGM Lessee II, LLC (“MGM Tenant”), a wholly owned subsidiary of MGM Resorts International (“MGM”). Financial and other information presented in this Term Sheet is presented on a “look through” basis, based on the rents and receipts of the MGM Grand & Mandalay Bay Properties. For so long as the MGM/Mandalay Lease is in effect, the MGM Grand & Mandalay Bay Borrowers will be entitled only to the rent due under the MGM/Mandalay Lease and not to the underlying rent and other income from the MGM Grand & Mandalay Bay Properties. The LTV Cut-off / Balloon, U/W DSCR Master Lease Rent, U/W Debt Yield Master Lease Rent and U/W Debt Yield at Balloon Master Lease Rent presented in the chart above are based on the initial MGM/Mandalay Lease annual rent of $292,000,000. The U/W NCF DSCR, U/W NCF Debt Yield and U/W NCF Debt Yield at Balloon for the MGM Grand & Mandalay Bay A Notes (based on the U/W NCF of $487.3 million) are 8.27x, 29.8% and 29.8%, respectively. On May 1, 2020, MGM Resorts International reported that, as a result of the temporary closure of its domestic properties (which includes the MGM Grand & Mandalay Bay Properties) following the outbreak of COVID-19, its domestic properties (which includes the MGM Grand & Mandalay Bay Properties) were effectively generating no revenue, there were high levels of room and convention cancellation through the third quarter of 2020, and that, following the re-opening of its domestic properties (which includes the MGM Grand & Mandalay Bay Properties), it expected weakened demand in light of consumer fears and general economic uncertainty, among other things. The March 2020 TTM financials presented above reflect the suspension of operations at the MGM Grand & Mandalay Bay Properties from March 17, 2020 through the end of the first calendar quarter of 2020 (although operations at the MGM Grand Property remained suspended until June 4, 2020 and operations at The Shoppes at Mandalay Bay Place and the Mandalay Bay resort remained suspended through June 24, 2020 and June 30, 2020, respectively). The $486.8 million presented above represents the adjusted March 2020 TTM EBITDAR, which takes into account an adjustment for a combined net extraordinary loss add-back of approximately $20.6 million during the March 2020 TTM period (primarily comprised of furloughed employee payroll expenses and corporate allocations and net of a combined extraordinary gain of approximately $0.7 million related to a reversal of certain accrued benefit expenses) related to the temporary closure of the MGM Grand & Mandalay Bay Properties following the outbreak of COVID-19. The Lender UW presented above is based on 2019 financials, which reflect a full year of uninterrupted operations at the MGM Grand & Mandalay Bay Properties. Please see the “Historical EBITDAR” and “Historical Performance” tables herein, and the footnotes thereto, for more detailed underwritten cash flow information. |
| (3) | The borrower sponsors are affiliated with the borrowers of the mortgage loans identified on Annex A-1 to the Preliminary Prospectus as BX Industrial Portfolio and Bellagio Hotel and Casino, which have a Cut-Off Date Balance of $70.00 million and $21.25 million, respectively. |
| (4) | The MGM Grand & Mandalay Bay Mortgage Loan (as defined below) is part of the MGM Grand & Mandalay Bay Whole Loan (as defined below), which is comprised of (i) 14 pari passu senior promissory notes with an aggregate Cut-off Date balance of $1,634,200,000 (the “MGM Grand & Mandalay Bay Senior Notes,” and collectively, the “MGM Grand & Mandalay Bay Senior Loan”) and (ii) 24 promissory notes with an aggregate Cut-off Date balance of $1,365,800,000 consisting of multiple subordination levels, which are subordinate to the MGM Grand & Mandalay Bay Senior Notes (the “MGM Grand & Mandalay Bay Junior Notes”). The MGM Grand Property has an allocated mortgage loan amount (“ALA”) of $1,635,000,000 and the Mandalay Bay Property has an ALA equal to $1,365,000,000. |
THE INFORMATION IN THIS STRUCTURAL AND COLLATERAL TERM SHEET IS NOT COMPLETE AND MAY BE AMENDED PRIOR TO THE TIME OF SALE. THIS TERM SHEET IS NOT AN OFFER TO SELL THESE SECURITIES AND IT IS NOT A SOLICITATION OF AN OFFER TO BUY THESE SECURITIES IN ANY JURISDICTION WHERE THE OFFER OR SALE IS NOT PERMITTED.
75
3799 & 3950 South Las Vegas Boulevard Las Vegas, NV Various | Collateral Asset Summary – Loan No. 5 MGM Grand & Mandalay Bay | Cut-off Date Balance: Cut-off Date LTV: U/W NCF DSCR: U/W NOI Debt Yield: | $65,000,000 35.5% 4.95x 17.9% |
| (5) | The MGM Grand & Mandalay Bay Whole Loan is structured with an Anticipated Repayment Date (“ARD”) of March 5, 2030 and a Final Maturity Date of March 5, 2032. After the ARD, the following structure will apply: (i) the interest rate will increase by 200 basis points over the greater of (x) 3.55800%, and (y) (1) the ARD Treasury Note Rate in effect on the ARD plus (2) 1.77000%, (ii) amounts in the Excess Cash Flow Reserve (as defined below) will be applied first to pay monthly additional interest amounts which, to the extent not paid (such amount not paid, together with accrued interest thereon at the Adjusted Interest Rate, the “Accrued Interest”), will be deferred and added to the principal balance of the MGM Grand & Mandalay Bay Whole Loan, and (iii) a full cash flow sweep to the extent of remaining amounts in the Excess Cash Flow Reserve will be applied to the principal of the MGM Grand & Mandalay Bay Whole Loan. The metrics presented in the Financial Information chart above for Balance per Room Cut-off / Balloon and LTV Cut-off / Balloon are calculated based on the ARD. |
| (6) | The defeasance lockout period will be 28 payments beginning with and including the first payment date of April 5, 2020. The MGM Grand & Mandalay Bay Borrowers have the option to defease the MGM Grand & Mandalay Bay Whole Loan, in whole or in part, after the earlier to occur of (i) two years after the closing date of the securitization that includes the last note to be securitized and (ii) February 14, 2023. The MGM Grand & Mandalay Bay Whole Loan may be prepaid in whole or in part at any time, subject to payment of the applicable yield maintenance premium if such prepayment occurs prior to September 5, 2029 (provided no yield maintenance will be due in connection with mandatory prepayments arising out of any casualty, condemnation or in connection with a Special Release (as defined below) or a Default Release (as defined below). |
| (7) | See “Initial and Ongoing Reserves” herein. |
| (8) | The MGM Grand Property was built in 1993 and the Mandalay Bay Property was built in 1999. The MGM Grand Property has benefited from capital investment of approximately $480.0 million (approximately $96,000 per room) since 2010, $144.0 million of which was spent on a full rooms’ renovation from 2010 to 2013. Additionally, approximately $118.9 million was recently spent on an expansion and renovation of the convention center completed in December 2018 which is expected to expand the group business at the MGM Grand Property. The Mandalay Bay Property (including the Delano) underwent a substantial rooms’ renovation for approximately $159.7 million from 2012 to 2016 and, inclusive of the Four Seasons, has received a total of approximately $510.6 million (approximately $107,500 per room) of capital investment since 2010. |
| (9) | Size and Occupancy are based solely on the hotel at the MGM Grand & Mandalay Bay Properties. As of the trailing twelve months ending March 31, 2020, approximately 30.3% of revenues were generated by rooms, 18.0% of revenues were from gaming, 29.7% from food & beverage and 22.0% from other sources. |
| (10) | The Appraised Value of $4,600,000,000 as of January 10, 2020, set forth above is the appraised value solely with respect to real property at the MGM Grand & Mandalay Bay Properties, excluding personal property and intangible property attributable to the MGM Grand & Mandalay Bay Properties (the “Aggregate Real Property Appraised Value”). The appraisal also includes an “As Leased-Sale-Leaseback Appraised Value,” which is equal to the Aggregate Real Property Appraised Value. The appraised value of $7,352,600,000 (“Aggregate As-Is Appraised Value”) as of January 10, 2020, includes personal property and intangible property attributable to the MGM Grand & Mandalay Bay Properties. The personal property and intangible property relating to the MGM Grand & Mandalay Bay Properties is owned by the MGM Tenant or certain sublessees at the MGM Grand & Mandalay Bay Properties that are wholly owned subsidiaries of MGM (the “MGM/Mandalay Operating Subtenants”) (as more particularly provided in the Master Lease), which granted a security interest in certain property of the MGM Tenant and the MGM/Mandalay Operating Subtenants (with certain exclusions, including an exclusion for the intellectual property of MGM Tenant as more particularly described in the Master Lease); and provided that the FF&E is only transferred to the MGM Grand & Mandalay Bay Borrowers at no cost in the event of a termination of the Master Lease due to an event of default by the MGM Tenant thereunder) in favor of the MGM Grand & Mandalay Bay Borrowers, and such security interest was collaterally assigned by the MGM Grand & Mandalay Bay Borrowers to the mortgage lender. The LTV Cut-off / Balloon based on the Aggregate As-Is Appraised Value are 22.2% and 22.2%, respectively, based on the MGM Grand & Mandalay Bay Senior Loan. The LTV Cut-off / Balloon based on the Aggregate As-Is Appraised Value are 40.8% and 40.8%, respectively, based on the MGM Grand & Mandalay Bay Whole Loan. |
| (11) | Fitch and KBRA provided the listed assessments for the MGM Grand & Mandalay Bay Loan in the context of its inclusion in the mortgage pool |
The Loan. The MGM Grand & Mandalay Bay mortgage loan (the “MGM Grand & Mandalay Bay Mortgage Loan”) is part of a fixed rate whole loan secured by the borrowers’ fee simple interests in MGM Grand resort (the “MGM Grand Property”) and Mandalay Bay resort (the “Mandalay Bay Property”) (each a “Property” and together, the “MGM Grand & Mandalay Bay Properties”) located in Las Vegas, Nevada. The MGM Grand & Mandalay Bay Mortgage Loan is evidenced by the non-controlling Notes A-13-1 and A-15-1 with an aggregate original principal balance and outstanding principal balance as of the Cut-off Date of $65.0 million. The MGM Grand & Mandalay Bay Mortgage Loan is part of a $3.0 billion whole loan that is evidenced by 38 promissory notes (the “MGM Grand & Mandalay Bay Whole Loan”). Only the MGM Grand & Mandalay Bay Mortgage Loan will be included in the mortgage pool for the Benchmark 2020-B18 mortgage trust.
The relationship between the holders of the MGM Grand & Mandalay Bay Whole Loan will be governed by a co-lender agreement as described under “Description of the Mortgage Pool—The Whole Loans—The Non-Serviced AB Whole Loans—The MGM Grand & Mandalay Bay Whole Loan” in the Preliminary Prospectus.
| Whole Loan Summary | ||||||
| Note | Original Balance | Cut-off Date Balance | Note Holder | Controlling Piece | ||
| A-13-1, A-15-1 | $65,000,000.00 | $65,000,000.00 | Benchmark 2020-B18(1) | No | ||
| A-5, A-9 | $610,078,611.40 | $610,078,611.40 | CREFI(2) | No(3) | ||
| A-6, A-10 | $326,705,972.20 | $326,705,972.20 | Barclays Bank PLC(2) | No | ||
| A-7, A-11 | $305,039,305.20 | $305,039,305.20 | DBRI(2) | No | ||
| A-8, A-12 | $326,705,972.20 | $326,705,972.20 | SGFC(2) | No | ||
| A-1, A-2, A-3, A-4 | $670,139.00 | $670,139.00 | BX 2020-VIVA | No | ||
| Total Senior Notes | $1,634,200,000.00 | $1,634,200,000.00 | ||||
| B-1-A, B-2-A, B-3-A, B-4-A, B-1-B, B-2-B, B-3-B, B-4-B(4) | $329,861.00 | $329,861.00 | BX 2020-VIVA | No | ||
| B-5-A, B-9-A, B-5-B(4) | $321,628,055.60 | $321,628,055.60 | CREFI(2) | No(3) | ||
| B-6-A, B-10-A, B-6-B (4) | $160,814,027.80 | $160,814,027.80 | Barclays Bank PLC(2) | No | ||
| B-7-A, B-11-A, B-7-B(4) | $160,814,027.80 | $160,814,027.80 | DBRI(2) | No | ||
| B-8-A, B-12-A, B-8-B (4) | $160,814,027.80 | $160,814,027.80 | SGFC(2) | No | ||
| C-1, C-2, C-3, C-4(4) | $561,400,000.00 | $561,400,000.00 | BX 2020-VIVA | Yes(3) | ||
| Whole Loan | $3,000,000,000.00 | $3,000,000,000.00 | ||||
| (1) | CREFI will be contributing Note A-13-1 which has an outstanding principal balance of $43,333,333 to the Benchmark 2020-B18 securitization. GACC will be contributing Note A-15-1 which has an outstanding principal balance of $21,666,667 to the Benchmark 2020-B18 securitization. |
| (2) | Expected to be contributed to one or more future securitization transactions. |
| (3) | The initial controlling note is Note C-1, so long as no related control appraisal period with respect to Note C-1 and the related pari passu C notes has occurred and is continuing. If and for so long as a control appraisal period has occurred and is continuing, then the controlling note will be as described under “Description of the Mortgage Pool—The Whole Loans—The Non-Serviced AB Whole Loans—The MGM Grand & Mandalay Bay Whole Loan” in the Preliminary Prospectus. |
| (4) | The MGM Grand & Mandalay Bay Junior Notes are subordinate to the MGM Grand & Mandalay Bay Senior Notes. |
THE INFORMATION IN THIS STRUCTURAL AND COLLATERAL TERM SHEET IS NOT COMPLETE AND MAY BE AMENDED PRIOR TO THE TIME OF SALE. THIS TERM SHEET IS NOT AN OFFER TO SELL THESE SECURITIES AND IT IS NOT A SOLICITATION OF AN OFFER TO BUY THESE SECURITIES IN ANY JURISDICTION WHERE THE OFFER OR SALE IS NOT PERMITTED.
76
3799 & 3950 South Las Vegas Boulevard Las Vegas, NV Various | Collateral Asset Summary – Loan No. 5 MGM Grand & Mandalay Bay | Cut-off Date Balance: Cut-off Date LTV: U/W NCF DSCR: U/W NOI Debt Yield: | $65,000,000 35.5% 4.95x 17.9% |
The MGM Grand & Mandalay Bay Whole Loan has a 10-year interest-only term through the ARD of March 5, 2030. After the ARD, through and including March 5, 2032 (the “Maturity Date”), the following structure would apply: (i) the interest rate will increase by 200 basis points over the greater of (x) 3.55800%, and (y)(1) the ARD Treasury Note Rate in effect on the ARD (such new rate, the “Adjusted Interest Rate”) plus (2) 1.77000%, (ii) amounts in the Excess Cash Flow Reserve (as defined below) will be applied first to pay monthly additional interest amounts which, to the extent not paid, will be deferred (together with interest accrued thereon at the Adjusted Interest Rate) and added to the principal balance of the MGM Grand & Mandalay Bay Whole Loan, and (iii) a full cash flow sweep to the extent of remaining amounts in the Excess Cash Flow Reserve will be applied to principal of the MGM Grand & Mandalay Bay Whole Loan. For the period from the origination date through the ARD, the MGM Grand & Mandalay Bay Senior Notes and Junior Notes accrue at the rate of 3.55800% per annum. The MGM Grand & Mandalay Bay Whole Loan proceeds along with borrower sponsor equity were used to purchase the MGM Grand & Mandalay Bay Properties for $4.6 billion.
“ARD Treasury Note Rate” means the rate of interest per annum calculated by the linear interpolation of the yields, as reported in Federal Reserve Statistical Release H.15 Selected Interest Rates under the heading “U.S. Government Securities/Treasury Constant Maturities” for the business day ending immediately prior to the ARD, of “U.S. Government Securities/Treasury Constant Maturities” with maturity dates (one longer and one shorter) most nearly approximating the Maturity Date. In the event Federal Reserve Statistical Release H.15 Selected Interest Rates is no longer published or in the event Federal Reserve Statistical Release H.15 Selected Interest Rates no longer publishes “U.S. Government Securities/Treasury Constant Maturities”, the mortgage lender will select a comparable publication to determine such “U.S. Government Securities/Treasury Constant Maturities” and the applicable ARD Treasury Note Rate. The mortgage lender’s determination of the ARD Treasury Note Rate will be final absent manifest error.
Based on the contractual Master Lease rents in years 11 and 12 of $356 million and $363 million (rental payments fully guaranteed by MGM (Fitch: BB- / Moody’s: Ba3 / S&P: BB-), respectively, and a 5.55800% interest rate, the MGM Grand & Mandalay Bay Whole Loan would generate approximately $401 million of amortization in those two years (so long as the MGM Grand & Mandalay Bay Whole Loan remains outstanding during that period). The amortization will result in a year 12 loan-to-cost ratio of 56.3%, a debt yield of 20.0% (based on the year-end December 2019 EBITDAR) and a mortgage loan basis of approximately $266,572 per room.
Based on the Aggregate As-Is Appraised Value of approximately $7.35 billion as of January 10, 2020, the LTV Cut-off / Balloon for the MGM Grand & Mandalay Bay Senior Loan are 22.2% and 22.2%, respectively. Based on the Aggregate Real Property Appraised Value of $4.6 billion as of January 10, 2020, the LTV Cut-off / Balloon for the MGM Grand & Mandalay Bay Senior Loan are 35.5% and 35.5%, respectively.
| Sources and Uses | ||||||
| Sources | Proceeds | % of Total | Uses | Proceeds | % of Total | |
| Senior Notes | $1,634,200,000 | 35.4% | Purchase Price | $4,600,000,000 | 99.6% | |
| Junior Notes | 1,365,800,000 | 29.6 | Closing Costs | 17,792,163 | 0.4% | |
| Sponsor Equity(1) | 1,617,792,163 | 35.0 | ||||
| Total Sources | $4,617,792,163 | 100.0% | Total Uses | $4,617,792,163 | 100.0% | |
| (1) | Includes MGM’s approximately $80.0 million of retained equity interest in the MGM Grand & Mandalay Bay Properties after the sale-leaseback, by virtue of operating partnership units in MGP OP issued to MGM on the origination date of the MGM Grand & Mandalay Bay Whole Loan. |
The Borrowers / Borrower Sponsors. On January 14, 2020, MGM Growth Properties Operating Partnership LP (“MGP OP”), an affiliate of BREIT Operating Partnership L.P. (“BREIT OP” and together with MGP OP, the “Sponsors”, as more particularly referred to as the “Borrower Sponsors”), and certain other parties entered into an agreement to, among other things, form a joint venture (50.1% indirectly owned by MGP OP and 49.9% indirectly owned by BREIT OP) (the “Joint Venture”) to acquire the MGM Grand & Mandalay Bay Properties in Las Vegas for a purchase price of $4.60 billion ($471,892 per room). The borrowers under the MGM Grand & Mandalay Bay Whole Loan are MGM Grand PropCo, LLC and Mandalay PropCo, LLC (individually, a “MGM Grand & Mandalay Bay Borrower” and, collectively, the “MGM Grand & Mandalay Bay Borrowers” or the “Borrowers”), which are subsidiaries of the Joint Venture. The MGM Grand & Mandalay Bay Borrowers are Delaware limited liability companies and single purpose entities with two independent directors. Blackstone Real Estate Income Trust, Inc. (“BREIT”) is a non-traded real estate investment trust focused on investing in commercial real estate properties diversified by sector with an emphasis on providing investors with access to Blackstone’s institutional real estate investment platform. BREIT seeks to directly own stabilized income-generating United States commercial real estate across the key property types, including multifamily, industrial, retail, hotel, healthcare and office. BREIT is managed by an external advisor, BX REIT Advisors L.L.C., which is an affiliate of The Blackstone Group Inc. (“Blackstone”). Blackstone’s real estate investor capital under management totals approximately $161.0 billion as of March 31, 2020 and includes prime assets such as the Bellagio, Cosmopolitan Las Vegas, Hotel Del Coronado, Grand Wailea, Arizona Biltmore, Ritz Carlton Kapalua, and Turtle Bay Resort.
MGM Growth Properties LLC (“MGP”) is one of the leading publicly traded real estate investment trusts engaged in the acquisition, ownership and leasing of large-scale destination entertainment and leisure resorts. MGP currently owns a portfolio of properties, consisting of 12 premier destination resorts in Las Vegas and elsewhere across the United States, with over 27,400 rooms, as well as MGM Northfield Park in Northfield, OH, Empire Resort Casino in Yonkers, NY, and a retail and entertainment district, The Park, in Las Vegas.
THE INFORMATION IN THIS STRUCTURAL AND COLLATERAL TERM SHEET IS NOT COMPLETE AND MAY BE AMENDED PRIOR TO THE TIME OF SALE. THIS TERM SHEET IS NOT AN OFFER TO SELL THESE SECURITIES AND IT IS NOT A SOLICITATION OF AN OFFER TO BUY THESE SECURITIES IN ANY JURISDICTION WHERE THE OFFER OR SALE IS NOT PERMITTED.
77
3799 & 3950 South Las Vegas Boulevard Las Vegas, NV Various | Collateral Asset Summary – Loan No. 5 MGM Grand & Mandalay Bay | Cut-off Date Balance: Cut-off Date LTV: U/W NCF DSCR: U/W NOI Debt Yield: | $65,000,000 35.5% 4.95x 17.9% |
MGP OP and BREIT OP (together, individually or collectively as the context may require, the “Guarantor”), are the non-recourse carveout guarantors on a several basis in proportion to each Guarantor’s Liability Percentage (as defined below). The Liability Percentage of each Guarantor will be automatically increased or decreased from time to time, as applicable, to the extent any direct and/or indirect equity interest in the Borrowers is transferred by one Guarantor (or its affiliates) to the other Guarantor (or its affiliates) with the transferring Guarantor’s Liability Percentage increasing by the amount of such transferred interests and the transferee Guarantor’s Liability Percentage decreasing by such amount. In no event will the Liability Percentage of the Guarantors in the aggregate be less than or greater than one hundred percent (100%). For the avoidance of doubt, transfers by a Guarantor (or its affiliates) to a third party that is not an affiliate of the other Guarantor will not result in an adjustment to the Liability Percentage of either Guarantor. For illustrative purposes, if BREIT OP transfers a twenty-five percent (25%) indirect equity interest in Borrower to a third party that is not an Affiliate of MGP OP and subsequently transfers a ten percent (10%) indirect equity interest in Borrower to MGP OP, the adjustments required to be made as a result of such transfers will be: (i) a decrease of ten percentage points to BREIT OP's Liability Percentage and (ii) an increase of ten percentage points to MGP OP's Liability Percentage.
The Guarantor’s liability for full recourse events is capped at an amount equal to 10% of the aggregate outstanding principal balance of the MGM Grand & Mandalay Bay Whole Loan as of the date of the event. In addition, only the Borrowers are liable for breaches of environmental covenants; provided, however, that if the Borrowers fail to maintain an environmental insurance policy required under the MGM Grand & Mandalay Bay Whole Loan documents, the Guarantor is liable for losses other than (x) for any amounts in excess of the applicable coverage amounts under the environmental policy had the same been renewed, replaced or extended as required under the loan agreement and (y) for any amounts recovered under the environmental policy. In addition, recourse for transfers of the MGM Grand & Mandalay Bay Properties or controlling equity interests in the MGM Grand & Mandalay Bay Borrowers is loss recourse, rather than full recourse.
“Liability Percentage” means, initially, (x) with respect to BREIT OP, 49.9% and (y) with respect to MGP OP, 50.1%.
The Properties.
MGM Grand (54.5% of Mortgage ALA and Master Lease Rent)
Built in 1993, the MGM Grand Property is a full-service luxury resort and casino property located on the Las Vegas Strip, situated between Tropicana Boulevard and Harmon Avenue. According to World Atlas, the MGM Grand Property is the third largest hotel in the world by room count. The MGM Grand Property is also a recipient of the AAA Four Diamond award. The MGM Grand Property covers approximately 101.9 acres and consists of 4,998 hotel rooms: 4,270 standard rooms, 554 suites, 88 luxury suites, 51 SKYLOFTS suites (excluding one additional office unit), 30 mansion villas (Mediterranean-themed villas targeted for high-end gamblers, celebrities and casino-invited guests on the strip) (the “Mansion Villas”) and four entourage rooms associated with the Mansion Villas. The MGM Grand Property contains approximately 177,268 square feet (“sq. ft.”) of casino space, featuring 1,553 slot machines and 128 gaming tables, over 748,000 sq. ft. of meeting space, 18 restaurants, an approximately 22,858 sq. ft. spa, four swimming pools and approximately 41,800 sq. ft. of rentable retail space (featuring 31 retailers). The MGM Grand Property is home to Cirque du Soleil’s “Kà”, an acrobatic theater production that has been in residence at the MGM Grand Property since October 2004. The MGM Grand Property also includes the David Copperfield Theatre, Hakkasan Nightclub and the MGM Grand Garden Arena, which has a seating capacity of over 16,000 and hosts premier concerts, award shows, sporting events including championship boxing, and other special events.
Room sizes range from 346 sq. ft. to 11,517 sq. ft. and offer one to four bedrooms. Standard room amenities include air conditioning, in-room dining service, minibar, telephone, hair dryer, in-room safe, and high-speed internet. SKYLOFTS at MGM Grand, a AAA Four-Diamond, Forbes Five Star hotel, occupies the top two floors of the main building. The hotel has 51 lofts ranging from 1,401 to 6,040 sq. ft. per loft. SKYLOFTS is also a member of The Leading Hotels of the World. The Mansion at the MGM Grand Property contains 30 Mansion Villas ranging from 2,358 to 11,517 sq. ft. per villa and $5,000 to $35,000 per night.
Since 2010, the MGM Grand Property has benefited from total capital investment of approximately $480.0 million (approximately $96,036 per room). Notable capital expenditures from this time period include an approximately $144.0 million full rooms renovation from 2010 to 2013 and a recent $118.9 million expansion and renovation of the conference center, which was completed in December 2018.
Mandalay Bay (45.5% of Mortgage ALA and Master Lease Rent)
Built in 1999, the Mandalay Bay Property is a full-service luxury resort and casino property located as the first major resort on the strip to greet visitors arriving by automobile from Southern California. The AAA Four Diamond award winning resort is a premier conference hotel in Las Vegas with approximately 2.2 million sq. ft. of convention, ballroom and meeting space, making it the fifth single largest event space in the United States. The Mandalay Bay Property is immediately across Interstate 15 from Allegiant Stadium, the new home stadium of the National Football League’s (“NFL”) Raiders, which is expected to open in August 2020. The Mandalay Bay Property covers approximately 124.1 acres and consists of 4,750 hotel rooms. Also included within the Mandalay Bay Property are: (i) the Delano, which is an all-suite hotel tower within the complex and (ii) a Four Seasons hotel, each of which has its own lobby, restaurants and pool and spa. In addition to the significant meeting space, the Mandalay Bay Property contains approximately 152,159 sq. ft. of casino space, featuring approximately 1,232 slot machines and 71 gaming tables, 27 total restaurants, an approximately 30,000 sq. ft. spa, ten swimming
THE INFORMATION IN THIS STRUCTURAL AND COLLATERAL TERM SHEET IS NOT COMPLETE AND MAY BE AMENDED PRIOR TO THE TIME OF SALE. THIS TERM SHEET IS NOT AN OFFER TO SELL THESE SECURITIES AND IT IS NOT A SOLICITATION OF AN OFFER TO BUY THESE SECURITIES IN ANY JURISDICTION WHERE THE OFFER OR SALE IS NOT PERMITTED.
78
3799 & 3950 South Las Vegas Boulevard Las Vegas, NV Various | Collateral Asset Summary – Loan No. 5 MGM Grand & Mandalay Bay | Cut-off Date Balance: Cut-off Date LTV: U/W NCF DSCR: U/W NOI Debt Yield: | $65,000,000 35.5% 4.95x 17.9% |
pools and approximately 54,000 sq. ft. of rentable retail space featuring 41 retailers. The Mandalay Bay Property is also the home to Cirque du Soleil’s Michael Jackson “ONE”, which has been in residence at the Mandalay Bay Property in an approximately 1,805-seat showroom since 2013, an approximately 12,000-seat special events arena, the House of Blues (which features an arena seating up to 2,500 people) and the Shark Reef Aquarium. Additionally, Mandalay Bay Property’s expansive pool and beach area plays host to an array of evening open air concerts during the pool season, a large wave pool, and Moorea, a European-style “ultra” beach and Daylight Beach Club.
Room sizes range from 400 to 5,605 sq. ft. and the Mandalay Bay Property offers one- to four-bedroom rooms. Standard room amenities include air conditioning, in-room dining service, minibar, telephone, hair dryer, in-room safe, and high-speed internet. Floors 60–62 are designed as penthouse suites, with a penthouse lounge on level 62 for guests staying in the penthouses. Floors numbered 35–39 of the main hotel building are occupied by the five-star and AAA Four-Diamond Four Seasons Hotel Las Vegas. Located at the resort's 43-story second tower, the Delano Las Vegas is comprised of 45 rooms and 1,072 suites. Each suite at the Delano is at least 725 sq. ft.
The Mandalay Bay Property (including the Delano) underwent a substantial rooms’ renovation of approximately $159.7 million (approximately $35,150 per room) from 2012 to 2016 and has received a total of approximately $510.6 million (approximately $107,485 per room) of capital investment since 2010.
Cirque du Soleil performances at the MGM Grand & Mandalay Bay Properties scheduled through July 31, 2020 have been cancelled. On June 29, 2020, Cirque du Soleil Entertainment Group (“Cirque”) announced that it and certain of its affiliated companies have filed in Canada for protection from creditors under the Companies’ Creditors Arrangement Act in order to restructure its capital structure and that, if the court grants the initial order sought, Cirque will seek its immediate provisional recognition in the United States under Chapter 15 of the U.S. Bankruptcy Code in the United States Bankruptcy Court.
COVID-19 Update. According to a press release issued on March 15, 2020, MGM Resorts International (“MGM”) announced that it would suspend operations at all of its Las Vegas properties, including the MGM Grand & Mandalay Bay Properties, until further notice, effective as of March 17, 2020, and that casino operations would close on March 16, 2020, followed by hotel operations on March 17, 2020. MGM cited the coronavirus discussed below as a pandemic that had intensified in the United States, requiring major collective action to slow its progression. MGM stated that it cancelled all reservations at its Las Vegas properties prior to May 21, 2020. MGM further reported that it incurred substantial operating losses in March 2020 and did not expect to see a material improvement until more is known regarding the duration and severity of the pandemic, including when MGM’s properties can reopen to the public. On May 1, 2020, MGM reported that as a result of the government-mandated closure, its domestic properties (which includes the MGM Grand & Mandalay Bay Properties and several properties which are not part of the collateral for the MGM Grand & Mandalay Bay Whole Loan) were effectively generating no revenue. In addition, MGM Resorts International reported high levels of room and convention cancellation across its domestic properties through the third quarter of 2020 with some tentative re-bookings in the fourth quarter and into 2021, and it indicated that when it is able to re-open its domestic properties, it expects weakened demand in light of continued domestic and international travel restrictions or warnings, consumer fears and reduced consumer discretionary spending and general economic uncertainty. As of June 4, 2020, the MGM Grand Property was reopened, with limited amenities and certain COVID-19 mitigation procedures. MGM reopened The Shoppes at Mandalay Bay Place on June 25, 2020 and the Mandalay Bay resort on July 1, 2020, both with limited amenities and certain COVID-19 mitigation procedures.
Revenue Streams. The MGM Grand & Mandalay Bay Properties benefit from a diverse set of revenue streams with a substantial contribution from non-gaming sources (only 18.0% of combined year-end (“YE”) December 2019 revenues derived from casino) and offer nearly 2.8 million sq. ft. of combined meeting and convention space.
As of YE December 2019, the MGM Grand Property generated 77.8% of net revenues from rooms, food and beverage, retail, entertainment and other operations. The gaming segment contributed 22.2% of net revenue (approximately $257.9 million), representing a decline from the 2018 level of 29.8% of net revenue (of approximately $365.7 million). A portion of the decline can be attributed to a renovation of the Mansion Villas in 2019, which serve as the MGM Grand Property’s main attractant to high-end gamblers. Nearly all departments at the MGM Grand Property (including rooms, F&B, retail and entertainment) experienced continued growth in the YE December 2019 period despite the decline in casino revenue.
The Mandalay Bay Property has a much smaller casino department as a percentage of total net revenue (12.9% as of YE December 2019) than most casinos on the Las Vegas strip. The Mandalay Bay Property revenues are primarily driven by (i) the focus on group and convention business (according to the appraisal, the Mandalay Bay Property had a 2019 penetration factor of 134.8% for group business) and (ii) the fact that two of the three room types are operated as non-casino focused third party franchises (the Delano and Four Seasons). As of YE December 2019, 64.1% of total revenues at the Mandalay Bay Property were derived from rooms’ revenue (34.1%) and food & beverage revenue (30.0%).
As of YE December 2019, the MGM Grand Property achieved occupancy, ADR and RevPAR of 91.4%, $190.29 and $173.85, respectively. As of YE December 2019, the Mandalay Bay Property achieved occupancy, ADR and RevPAR of 92.8%, $202.98 and $188.40, respectively.
THE INFORMATION IN THIS STRUCTURAL AND COLLATERAL TERM SHEET IS NOT COMPLETE AND MAY BE AMENDED PRIOR TO THE TIME OF SALE. THIS TERM SHEET IS NOT AN OFFER TO SELL THESE SECURITIES AND IT IS NOT A SOLICITATION OF AN OFFER TO BUY THESE SECURITIES IN ANY JURISDICTION WHERE THE OFFER OR SALE IS NOT PERMITTED.
79
3799 & 3950 South Las Vegas Boulevard Las Vegas, NV Various | Collateral Asset Summary – Loan No. 5 MGM Grand & Mandalay Bay | Cut-off Date Balance: Cut-off Date LTV: U/W NCF DSCR: U/W NOI Debt Yield: | $65,000,000 35.5% 4.95x 17.9% |
| Historical EBITDAR | ||||||||||||||||
| EBITDAR ($ mns) | 2006 | 2007 | 2008 | 2009 | 2010 | 2011 | 2012 | 2013 | 2014 | 2015 | 2016 | 2017 | 2018 | 2019 | March 2020 TTM(3) | UW |
| MGM Grand | $329 | $396 | $271 | $214 | $163 | $149 | $181 | $236 | $255 | $281 | $332 | $345 | $372 | $283 | $263 | $283 |
| Mandalay Bay | $282 | $291 | $251 | $160 | $125 | $169 | $147 | $167 | $176 | $204 | $237 | $260 | $246 | $237 | $224 | $237 |
| Total Collateral | $611 | $688 | $522 | $374 | $288 | $318 | $327 | $403 | $431 | $485 | $569 | $605 | $617 | $520 | $487 | $520 |
| Debt Yield(1) | 20.4% | 22.9% | 17.4% | 12.5% | 9.6% | 10.6% | 10.9% | 13.4% | 14.4% | 16.2% | 19.0% | 20.2% | 20.6% | 17.3% | 16.2% | 17.3% |
| Rent Coverage(2) | 2.1x | 2.4x | 1.8x | 1.3x | 1.0x | 1.1x | 1.1x | 1.4x | 1.5x | 1.7x | 1.9x | 2.1x | 2.1x | 1.8x | 1.7x | 1.8x |
| (1) | Debt Yield metrics presented above are based on the MGM Grand & Mandalay Bay Whole Loan Cut-off Date balance of $3.0 billion and the EBITDAR of each respective time period. |
| (2) | Rent Coverage ratios presented above are based on the initial Master Lease Rent of $292.0 million and the EBITDAR of each respective time period. |
| (3) | The March 2020 TTM financials presented above reflect the suspension of operations at the MGM Grand & Mandalay Bay Properties from March 17, 2020 through the end of the first calendar quarter of 2020 (although operations at the MGM Grand Property remained suspended until June 4, 2020 when the Property reopened with limited amenities and operations at the Mandalay Bay Shoppes and the Mandalay Bay resort remained suspended through June 24, 2020 and June 30, 2020, respectively, when the Mandalay Bay Property reopened with limited amenities). The lender UW presented above is based on 2019 financials, which reflects a full-year of uninterrupted operations at the MGM Grand & Mandalay Bay Properties. |
| Historical Performance – MGM Grand(1) | |||||||||||||||
| 2006 | 2007 | 2008 | 2009 | 2010 | 2011 | 2012 | 2013 | 2014 | 2015 | 2016 | 2017 | 2018 | 2019 | March 2020 TTM(2) | |
| RevPAR | $154 | $162 | $145 | $112 | $112 | $128 | $136 | $138 | $151 | $155 | $162 | $167 | $169 | $174 | $172 |
| Net Revenue ($ bns) | $1.19 | $1.32 | $1.22 | $1.09 | $1.03 | $1.05 | $1.07 | $1.15 | $1.21 | $1.16 | $1.15 | $1.18 | $1.23 | $1.16 | $1.10 |
| EBITDAR Margin | 28% | 30% | 22% | 20% | 16% | 14% | 17% | 21% | 21% | 24% | 29% | 29% | 30% | 24% | 24% |
| (1) | Any financial information contained in this Term Sheet for the MGM Grand Property which relates to any period prior to 2015 has not been recast to reflect the adoption of ASC 606 revenue recognition under GAAP and thus, any financial information provided for periods prior to 2015 may not be comparable to periods on or after 2015 with respect to which recasting has been applied. |
| (2) | The March 2020 TTM financials presented above reflect the suspension of operations at the MGM Grand & Mandalay Bay Properties from March 17, 2020 through the end of the first calendar quarter of 2020 (although operations at the MGM Grand Property remained suspended until June 4, 2020 when the MGM Grand Property reopened with limited amenities, and operations at The Shoppes at Mandalay Bay Place and the Mandalay Bay resort remained suspended through June 24, 2020 and June 30, 2020, respectively, when the Mandalay Bay Property reopened with limited amenities). The lender UW presented above is based on 2019 financials, which reflects a full-year of uninterrupted operations at the MGM Grand & Mandalay Bay Properties. |
| Historical Performance – Mandalay Bay(1) | ||||||||||||||||
| 2006 | 2007 | 2008 | 2009 | 2010 | 2011 | 2012 | 2013 | 2014 | 2015 | 2016 | 2017 | 2018 | 2019 | March 2020 TTM(2) | ||
| RevPAR | $199 | $213 | $193 | $142 | $142 | $160 | $162 | $164 | $176 | $177 | $185 | $186 | $184 | $188 | $188 | |
| Net Revenue ($ bns) | $0.99 | $1.02 | $0.95 | $0.79 | $0.78 | $0.84 | $0.78 | $0.86 | $0.95 | $0.94 | $0.97 | $0.98 | $0.97 | $0.94 | $0.90 | |
| EBITDAR Margin | 29% | 28% | 26% | 20% | 16% | 20% | 19% | 19% | 19% | 22% | 24% | 27% | 25% | 25% | 25% | |
| (1) | Any financial information contained in this Term Sheet for the Mandalay Bay Property which relates to any period prior to 2015 has not been recast to reflect the adoption of ASC 606 revenue recognition under GAAP and thus, any financial information provided for periods prior to 2015 may not be comparable to periods on or after 2015 with respect to which recasting has been applied. |
| (2) | The March 2020 TTM financials presented above reflect the suspension of operations at the MGM Grand & Mandalay Bay Properties from March 17, 2020 through the end of the first calendar quarter of 2020 (although operations at the MGM Grand Property remained suspended until June 4, 2020 when the MGM Grand Property reopened with limited amenities, and operations at The Shoppes at Mandalay Bay Place and the Mandalay Bay resort remained suspended through June 24, 2020 and June 30, 2020, respectively, when the Mandalay Bay Property reopened with limited amenities). The lender UW presented above is based on 2019 financials, which reflects a full-year of uninterrupted operations at the MGM Grand & Mandalay Bay Properties. |
Master Lease. The MGM Grand & Mandalay Bay Properties are master-leased to MGM Lessee II, LLC (the “MGM Tenant”), a wholly-owned subsidiary of MGM under a 30-year, triple-net master and operating lease with two, ten-year renewal options. In turn, the MGM Tenant has subleased a portion of the MGM Grand & Mandalay Bay Properties to each of MGM Grand Hotel, LLC, a Nevada limited liability company (the “Grand Operating Subtenant”), Mandalay Bay, LLC, a Nevada limited liability company (the “Mandalay Bay Subtenant”) and Mandalay Place, LLC, a Nevada limited liability company (“Mandalay Place Subtenant”; and, together with Grand Operating Subtenant and Mandalay Bay Subtenant, individually or collectively as the context may require, together with any person to whom all or any portion of a Property is sublet by MGM Tenant pursuant to an MGM/Mandalay Operating sublease pursuant to the express terms and conditions of the MGM/Mandalay Lease, each an “MGM/Mandalay Operating Subtenant”). Each MGM/Mandalay Operating Subtenant executed a joinder to the MGM/Mandalay Lease for the purpose of (x) agreeing to be bound by the terms and provisions of the MGM/Mandalay Lease regarding the disposition of any portion of MGM Tenant’s Property owned by such MGM/Mandalay Operating Subtenant and (y) granting a security interest to the Borrowers in the portion of the MGM Tenant’s pledged property owned by such MGM/Mandalay Operating Subtenant and certain reserve funds under the MGM/Mandalay Lease. The MGM Tenant and each MGM/Mandalay Operating Subtenant is not a borrower or an obligor under the MGM Grand & Mandalay Bay Mortgage Loan documents.
Under the Master Lease, the MGM Tenant is required to pay to the Borrowers an initial lease rent of $292.0 million per annum ($159.0 million allocated to the MGM Grand Property and $133.0 million allocated to the Mandalay Bay Property, the “Master Lease Rent”), subject to annual increases of (i) 2.0% in years 2 through 15 of the initial lease term, and (ii) thereafter, the greater of 2.0% or CPI (CPI capped at 3.0%) for the remainder of the initial lease term. Additionally, MGM will be required to continue to invest in the MGM Grand & Mandalay Bay Properties, with (x) a minimum aggregate capital investment requirement of 3.5% of actual net revenues every five years (the first such period beginning January 1, 2020 and expiring December 31, 2024, and the second such period beginning January 1, 2021
THE INFORMATION IN THIS STRUCTURAL AND COLLATERAL TERM SHEET IS NOT COMPLETE AND MAY BE AMENDED PRIOR TO THE TIME OF SALE. THIS TERM SHEET IS NOT AN OFFER TO SELL THESE SECURITIES AND IT IS NOT A SOLICITATION OF AN OFFER TO BUY THESE SECURITIES IN ANY JURISDICTION WHERE THE OFFER OR SALE IS NOT PERMITTED.
80
3799 & 3950 South Las Vegas Boulevard Las Vegas, NV Various | Collateral Asset Summary – Loan No. 5 MGM Grand & Mandalay Bay | Cut-off Date Balance: Cut-off Date LTV: U/W NCF DSCR: U/W NOI Debt Yield: | $65,000,000 35.5% 4.95x 17.9% |
and expiring December 31, 2025, and each five-year period thereafter on a rolling basis) in the aggregate for the MGM Grand & Mandalay Bay Properties (such amount not to be less than 2.5% of the actual net revenue of any individual Property) (collectively, the “Required CapEx”) and (y) a monthly reserve equal to 1.5% of actual net revenues which may be used for FF&E and on qualifying capital expenditures in satisfaction of the Required CapEx spend. Upon early termination of the Master Lease due to an event of default by MGM Tenant thereunder, the FF&E will be transferred to the Borrowers at no cost.
Beginning with the first full calendar quarter after the origination date for the MGM Grand & Mandalay Bay Whole Loan and continuing thereafter, if either (a) (x) EBITDAR to Rent Ratio (as defined in the Master Lease) for the prior four fiscal quarters is less than 1.60x and (y) MGM’s market cap is less than $6.0 billion or (b) (x) MGM is no longer publicly traded and listed on NYSE, AMEX or NASDAQ and (y) the EBITDAR to Rent Ratio for the prior four fiscal quarters is less than 2.0x, then MGM Tenant will be required to provide one or more letters of credit or fund a cash escrow in an aggregate amount equal to the following year’s rent (taking into account the applicable escalations).
No intellectual property is licensed to the Borrowers and the Borrowers have no option to purchase upon expiration of the Master Lease. Upon the expiration of the Master Lease term or earlier termination of Master Lease, MGM Tenant will be obligated to provide up to 18 months of transition services to permit the continuous and uninterrupted operation of the Property.
MGM (NYSE: MGM, rated Ba3/BB-/BB- by Moody’s, Fitch and S&P) guarantees to the Borrowers the payment and performance of all monetary obligations and certain other obligations of the MGM Tenant under the Master Lease. In addition to the lease guaranty, MGM (in such capacity, “Shortfall Collection Guarantor”) has executed a shortfall guaranty for the benefit of mortgage lender for the MGM Grand & Mandalay Bay Mortgage Loan, pursuant to which MGM has guaranteed to mortgage lender the unpaid portion of the initial principal amount of the MGM Grand & Mandalay Bay Mortgage Loan (without giving effect to any future amendments that may increase the principal balance) and all interest accrued and unpaid thereon. For the avoidance of doubt, the Shortfall Collection Guarantor does not guarantee any Accrued Interest or any additional principal as a result of an unpaid Accrued Interest after the ARD. Transfers of interests in MGM are not restricted under the MGM Grand & Mandalay Bay Mortgage Loan documents and any bankruptcy or other adverse event with respect to the Shortfall Collection Guarantor does not constitute a default under the MGM Grand & Mandalay Bay Mortgage Loan documents. Neither MGM nor its affiliates (including, without limitation, MGM Tenant) are considered an affiliate of the Borrowers for any purpose under the MGM Grand & Mandalay Bay Mortgage Loan documents so long as such person does not control Borrower. There is no continuing net worth requirement with respect to MGM in connection with the shortfall guaranty. As of the origination of the MGM Grand & Mandalay Bay Mortgage Loan, neither MGM nor MGM Tenant controlled the Borrower.
As of December 31, 2019, MGM had a market capitalization of approximately $16.7 billion, full-year 2019 revenue of approximately $12.9 billion and consolidated, adjusted earnings before interest, taxes, depreciation and amortization (“EBITDA”) of approximately $3.0 billion. As of March 31, 2020, MGM reported revenue of approximately $2.3 billion for the first quarter of 2020. This represents a 29% decrease to the first quarter of 2019 which was primarily driven by MGM’s temporary suspension of its domestic and Macau casino operations related to the COVID-19 pandemic. MGM had $6.0 billion of cash and cash equivalents as of March 31, 2020, which included $1.8 billion at MGP and $381 million at MGM China. In addition, on April 23, 2020, MGM commenced a private offering of $750 million in aggregate principal amount of 6.75% coupon senior notes due in 2025, which further added to MGM’s cash position. As of June 30, 2020, MGM had a market capitalization of approximately $8.3 billion.
MGM Tenant is a casino owner-operator for 29 unique hotel offerings totaling over 44,000 rooms across Las Vegas, United States regional markets and Macau. MGM Tenant has managed the MGM Grand & Mandalay Bay Properties for more than 27 and 18 years, respectively.
THE INFORMATION IN THIS STRUCTURAL AND COLLATERAL TERM SHEET IS NOT COMPLETE AND MAY BE AMENDED PRIOR TO THE TIME OF SALE. THIS TERM SHEET IS NOT AN OFFER TO SELL THESE SECURITIES AND IT IS NOT A SOLICITATION OF AN OFFER TO BUY THESE SECURITIES IN ANY JURISDICTION WHERE THE OFFER OR SALE IS NOT PERMITTED.
81
3799 & 3950 South Las Vegas Boulevard Las Vegas, NV Various | Collateral Asset Summary – Loan No. 5 MGM Grand & Mandalay Bay | Cut-off Date Balance: Cut-off Date LTV: U/W NCF DSCR: U/W NOI Debt Yield: | $65,000,000 35.5% 4.95x 17.9% |
Cash Flow Analysis.
| Cash Flow Analysis | ||||||||
| 2015 | 2016 | 2017 | 2018 | 2019 | March 2020 TTM | U/W | U/W Per Room(1) | |
| Occupancy | 92.5% | 92.4% | 91.0% | 91.5% | 92.1% | 91.0% | 92.1% | |
| ADR | $179.08 | $187.27 | $193.58 | $192.62 | $196.52 | $197.34 | $196.52 | |
| RevPAR | $165.56 | $172.97 | $176.24 | $176.18 | $180.94 | $179.62 | $180.94 | |
| Hotel Revenue | $576,193,751 | $611,611,719 | $621,671,255 | $619,356,266 | $635,408,160 | $606,668,725 | $635,408,160 | $65,183 |
| Casino Revenue | 461,726,103 | 438,253,825 | 459,676,698 | 492,001,712 | 379,532,959 | 360,473,304 | 379,532,959 | $38,934 |
| F&B Revenue | 578,021,518 | 598,992,505 | 608,876,978 | 604,859,218 | 629,566,379 | 595,230,085 | 629,566,379 | $64,584 |
| Other Revenue | 480,778,051 | 465,818,022 | 471,735,234 | 475,323,334 | 461,787,990 | 439,510,211 | 461,787,990(2) | $47,373 |
| Total Revenue | $2,096,719,423 | $2,114,676,071 | $2,161,960,165 | $2,191,540,530 | $2,106,295,488 | $2,001,882,325 | $2,106,295,488 | $216,075 |
| Hotel Expense | 230,915,708 | 235,477,994 | 249,304,637 | 255,303,612 | 265,201,312 | 257,963,997 | 265,201,312 | $27,206 |
| Casino Expense | 253,918,628 | 213,245,938 | 229,109,011 | 226,996,812 | 223,320,361 | 221,472,073 | 223,320,361 | $22,909 |
| F&B Expense | 428,952,166 | 429,128,035 | 433,970,578 | 437,033,184 | 449,487,794 | 431,691,583 | 449,487,794 | $46,111 |
| Other Expense | 349,547,741 | 323,328,025 | 322,504,168 | 316,078,620 | 304,747,043 | 287,669,084 | 304,747,043 | $31,263 |
| Total Departmental Expenses | $1,263,334,243 | $1,201,179,992 | $1,234,888,394 | $1,235,412,228 | $1,242,756,510 | $1,198,796,737 | $1,242,756,510 | $127,488 |
| Property Maintenance | 112,218,119 | 110,725,189 | 95,208,961 | 101,449,888 | 103,270,469 | 100,546,661 | 103,270,469 | $10,594 |
| Property Administration(3) | 137,822,533 | 128,394,200 | 125,525,316 | 126,382,088 | 126,766,300 | 124,473,327 | 126,766,300 | $13,004 |
| Marketing & Advertising | 28,265,267 | 22,728,610 | 26,584,722 | 29,655,331 | 28,082,648 | 27,654,837 | 28,082,648 | $2,881 |
| Total Undistributed Expenses | $278,305,919 | $261,847,999 | $247,318,999 | $257,487,307 | $258,119,417 | $252,674,825 | $258,119,417 | $26,479 |
| Management Fee | 46,463,959 | 59,835,056 | 53,171,104 | 56,764,258 | 57,698,013 | 55,999,303 | 57,698,013 | $5,919 |
| Real Estate Taxes | 16,605,853 | 16,929,584 | 15,852,622 | 17,309,478 | 18,451,931 | 18,768,123 | 18,451,931 | $1,893 |
| Insurance | 6,711,471 | 6,110,026 | 5,691,838 | 7,197,993 | 9,189,264 | 9,350,526 | 9,189,264 | $943 |
| Total Fixed & Other Expenses | 69,781,283 | 82,874,666 | 74,715,564 | 81,271,729 | 85,339,208 | 104,670,847(5) | 85,339,208 | $8,755 |
| EBITDAR | $485,297,978 | $568,773,414 | $605,037,208 | $617,369,266 | $520,080,353 | $486,845,706(6) | $520,080,353 | $53,353 |
| FF&E(4) | 0 | 0 | 0 | 0 | 0 | 0 | 32,774,592 | 3,362 |
| Net Cash Flow | $485,297,978 | $568,773,414 | $605,037,208 | $617,369,266 | $520,080,353 | $486,845,706(6) | $487,305,761 | $49,990 |
| (1) | Based on 9,748 guest rooms. |
| (2) | The most recent available breakout of the Signature Condo-Hotel revenue as a component of Other Revenue was from the November 2019 trailing 12-month period. |
| (3) | 2018 Property Administration expense was adjusted for the Mandalay Bay Property to exclude $21.8 million of one-time business interruption proceeds related to the October 1, 2017 shooting at a country concert in Las Vegas. |
| (4) | U/W FF&E is based on the 1.5% contractual FF&E reserve based on total net revenues (excluding net revenues associated with the Signature Condo-Hotel development at the MGM Grand Property for which FF&E is not reserved under the Master Lease). With respect to the Mandalay Bay Property, 5.0% FF&E Reserve was underwritten for the revenues associated with the closing date Four Seasons Management Agreement. |
| (5) | Total Fixed & Other Expenses includes a net combined extraordinary loss from the MGM Grand & Mandalay Bay Properties of approximately $20.6 million during the March 2020 TTM period (primarily comprised of furloughed employee payroll expenses and corporate allocations and net of a combined extraordinary gain of approximately $0.7 million related to a reversal of certain accrued benefit expenses) related to the temporary closure of the MGM Grand & Mandalay Bay Properties following the outbreak of COVID-19. The March 2020 TTM EBITDAR of approximately $486.8 million represents the combined adjusted EBITDAR as calculated per the Master Lease (after taking into account the extraordinary loss add-back for the March 2020 TTM period). |
| (6) | On May 1, 2020, MGM reported that, as a result of the temporary closure of its domestic properties (which includes the MGM Grand & Mandalay Bay Properties) following the outbreak of COVID-19, its domestic properties (which includes the MGM Grand & Mandalay Bay Properties) were effectively generating no revenue, there were high levels of room and convention cancellation through the third quarter of 2020, and that, following the re-opening of its domestic properties (which includes the MGM Grand & Mandalay Bay Properties), it expected weakened demand in light of consumer fears and general economic uncertainty, among other things. The March 2020 TTM financials presented above reflect the suspension of operations at the MGM Grand & Mandalay Bay Properties from March 17, 2020 through the end of the first calendar quarter of 2020 (although operations at the MGM Grand Property remained suspended until June 4, 2020 when the Property reopened with limited amenities and operations at the Mandalay Bay Shoppes and the Mandalay Bay resort remained suspended through June 24, 2020 and June 30, 2020, respectively, when the Mandalay Bay Property reopened with limited amenities). The Lender UW presented above is based on 2019 financials, which reflects a full-year of uninterrupted operations at the MGM Grand & Mandalay Bay Properties. |
Environmental Matters. Due to the presence of underground storage tanks, the MGM Grand & Mandalay Bay Borrowers purchased, and are required to maintain under the MGM Grand & Mandalay Bay Mortgage Loan agreement, an environmental insurance policy.
The Market. The MGM Grand & Mandalay Bay Properties are located on the Las Vegas Strip in the heart of Las Vegas, Nevada. Visitor volume and airport passenger traffic into the Las Vegas region have more than doubled from 1990 to 2019. In connection with the financial downturn in 2008 and 2009, the Las Vegas market generally experienced a contraction. During 2010, the market began to rebound and visitation has returned to or near peak levels. McCarran International Airport welcomed 51.5 million passengers in 2019 (surpassing the 2018 passenger count of approximately 49.6 million).
THE INFORMATION IN THIS STRUCTURAL AND COLLATERAL TERM SHEET IS NOT COMPLETE AND MAY BE AMENDED PRIOR TO THE TIME OF SALE. THIS TERM SHEET IS NOT AN OFFER TO SELL THESE SECURITIES AND IT IS NOT A SOLICITATION OF AN OFFER TO BUY THESE SECURITIES IN ANY JURISDICTION WHERE THE OFFER OR SALE IS NOT PERMITTED.
82
3799 & 3950 South Las Vegas Boulevard Las Vegas, NV Various | Collateral Asset Summary – Loan No. 5 MGM Grand & Mandalay Bay | Cut-off Date Balance: Cut-off Date LTV: U/W NCF DSCR: U/W NOI Debt Yield: | $65,000,000 35.5% 4.95x 17.9% |
Since 2010, annual convention attendance in Las Vegas has grown by over 2 million people (4.0% CAGR). With an estimated local population of 2.3 million people as of 2019, an additional approximately 42.5 million tourists visiting the metropolitan Las Vegas area annually and recent investment in Las Vegas by major sports leagues, the amount of existing gaming activity has increased steadily since the 2009 trough. In Clark County, gaming revenue has increased approximately 17.2% through 2019 since the gaming revenue trough in 2009.
| Market Overview(1) | ||||||||||||
| Category | 1990 | 2009 | 2010 | 2011 | 2012 | 2013 | 2014 | 2015 | 2016 | 2017 | 2018 | 2019 |
| Visitor Volume (thousands) | 20,954 | 36,351 | 37,335 | 38,929 | 39,727 | 39,668 | 41,127 | 42,312 | 42,936 | 42,214 | 42,117 | 42,524 |
| YoY % Change | NAP | -3.0% | 2.7% | 4.3% | 2.1% | -0.1% | 3.7% | 2.9% | 1.5% | -1.7% | -0.2% | 1.0% |
| Clark County Gaming Revenues ($mm) | $4,104 | $8,838 | $8,909 | $9,223 | $9,400 | $9,674 | $9,554 | $9,618 | $9,714 | $9,979 | $10,250 | $10,355 |
| YoY % Change | NAP | -9.8% | 0.8% | 3.5% | 1.9% | 2.9% | -1.2% | 0.7% | 1.0% | 2.7% | 2.7% | 1.0% |
| Hotel / Motel Rooms Inventory | 73,730 | 148,941 | 148,935 | 150,161 | 150,481 | 150,593 | 150,544 | 149,213 | 149,339 | 148,896 | 149,158 | 149,422 |
| YoY % Change | NAP | 6.0% | 0.0% | 0.8% | 0.2% | 0.1% | 0.0% | -0.9% | 0.1% | -0.3% | 0.2% | 0.2% |
| Airport Passenger Traffic (thousands) | 19,090 | 40,469 | 39,757 | 41,481 | 41,668 | 41,857 | 42,885 | 45,319 | 47,368 | 48,430 | 49,645 | 51,538 |
| YoY % Change | NAP | -8.2% | -1.8% | 4.3% | 0.4% | 0.5% | 2.5% | 5.7% | 4.5% | 2.2% | 2.5% | 3.8% |
| Convention Attendance (thousands) | 1,742 | 4,492 | 4,473 | 4,865 | 4,944 | 5,107 | 5,195 | 5,891 | 6,311 | 6,646 | 6,502 | 6,649 |
| YoY % Change | NAP | -23.9% | -0.4% | 8.8% | 1.6% | 3.3% | 1.7% | 13.4% | 7.1% | 5.3% | -2.2% | 2.3% |
| (1) | Source: Las Vegas Convention and Visitors Authority. |
The Las Vegas Strip hotel average occupancy has been approximately 90% over the last three years. The Las Vegas Strip average 2019 occupancy was 90.4% and average 2018 occupancy was 89.5%. The Las Vegas Strip average 2019 ADR of $143.31 increased 3.3% relative to the average 2018 ADR of $138.71.
| Historical Occupancy, ADR, RevPAR – Competitive Set | |||||||||
| MGM Grand Resort(1) | Competitive Set(2)(3) | MGM Grand Penetration Factor(2) | |||||||
| Year | Occupancy | ADR | RevPAR | Occupancy | ADR | RevPAR | Occupancy | ADR | RevPAR |
| December 31, 2017 | 92.1% | $181.76 | $167.36 | 92.0% | $181.95 | $167.10 | 100.2% | 100.0% | 100.3% |
| December 31, 2018 | 92.7% | $182.10 | $168.76 | 93.0% | $187.63 | $173.66 | 100.1% | 97.4% | 97.6% |
| December 31, 2019 | 91.4% | $190.29 | $173.85 | 94.0% | $193.23 | $181.41 | 98.7% | 98.6% | 97.3% |
| (1) | Source: Historical operating statements. |
| (2) | Source: Appraisal. |
| (3) | Includes: The Mirage, New York New York, Luxor, Caesars, Planet Hollywood, and Venetian/Palazzo. |
| Historical Occupancy, ADR, RevPAR – Competitive Set | |||||||||
| Mandalay Bay Resort(1) | Competitive Set(2)(3) | Mandalay Bay Penetration Factor(2) | |||||||
| Year | Occupancy | ADR | RevPAR | Occupancy | ADR | RevPAR | Occupancy | ADR | RevPAR |
| December 31, 2017 | 90.0% | $206.28 | $185.57 | 92.0% | $177.98 | $164.06 | 98.0% | 113.2% | 110.9% |
| December 31, 2018 | 90.2% | $203.96 | $183.96 | 93.0% | $183.94 | $171.13 | 97.4% | 109.2% | 106.4% |
| December 31, 2019 | 92.8% | $202.98 | $188.40 | 94.0% | $190.09 | $178.15 | 96.6% | 108.8% | 105.1% |
| (1) | Source: Historical operating statements. |
| (2) | Source: Appraisal. |
| (3) | Includes: The Mirage, New York New York, Luxor, Caesars, Planet Hollywood, and Venetian/Palazzo. |
Additional group business is expected to enter the market as a result of the expected delivery of Allegiant Stadium in August 2020 (across the street from the Mandalay Bay Property) which will serve as the home stadium for the Raiders NFL team. Non-gaming revenue in the Las Vegas market was approximately 65% of total revenue in 2019 compared to pre-recession levels of approximately 59% in 2007.
Each of the MGM Grand & Mandalay Bay Properties share the same competitive set. The primary competitive set for the MGM Grand & Mandalay Bay Properties consists of six hotels, which range in size from 2,024 to 7,117 rooms and collectively contain an aggregate 23,058 rooms. According to the appraisal, there are two mega resorts in the construction phase with planned delivery between 2021 and 2022. Resorts World Las Vegas is a 59-story Chinese-themed mega resort under construction the former Stardust Resort and Casino site on the northern Las Vegas Strip with scheduled delivery by summer of 2021 according to the appraisal. The Drew is a 735-foot tall, 75% completed mega casino resort scheduled to be delivered by 2022.
THE INFORMATION IN THIS STRUCTURAL AND COLLATERAL TERM SHEET IS NOT COMPLETE AND MAY BE AMENDED PRIOR TO THE TIME OF SALE. THIS TERM SHEET IS NOT AN OFFER TO SELL THESE SECURITIES AND IT IS NOT A SOLICITATION OF AN OFFER TO BUY THESE SECURITIES IN ANY JURISDICTION WHERE THE OFFER OR SALE IS NOT PERMITTED.
83
3799 & 3950 South Las Vegas Boulevard Las Vegas, NV Various | Collateral Asset Summary – Loan No. 5 MGM Grand & Mandalay Bay | Cut-off Date Balance: Cut-off Date LTV: U/W NCF DSCR: U/W NOI Debt Yield: | $65,000,000 35.5% 4.95x 17.9% |
| Comparable Properties(1) | |||||||
| Property Name | No. of Rooms | Year Opened | Meeting Space (sq. ft.) | Casino Space (sq. ft.) | Estimated 2019 Occ. | Estimated 2019 ADR | Estimated 2019 RevPAR |
| MGM Grand(2) | 4,998 | 1993 | 748,325 | 177,268 | 91.4% | $190.29 | $173.85 |
| Mandalay Bay(2) | 4,750 | 1999 | 2,100,000 | 152,159 | 92.8% | $202.98 | $188.40 |
| The Mirage | 3,044 | 1989 | 170,000 | 94,000 | 94.6% | $178.00 | $168.39 |
| New York New York | 2,024 | 1997 | 30,500 | 81,000 | 95.5% | $151.00 | $144.21 |
| Luxor | 4,397 | 1993 | 20,000 | 120,000 | 95.0% | $119.00 | $113.05 |
| Caesar’s Palace | 3,976 | 1966 | 300,000 | 124,200 | 93.0% | $221.00 | $205.53 |
| Planet Hollywood | 2,500 | 2000 | 20,000 | 64,500 | 90.0% | $185.00 | $166.50 |
| Venetian/Palazzo | 7,117 | 1999 | 450,000 | 335,878 | 94.6% | $237.00 | $224.20 |
| (1) | Source: Appraisal, unless otherwise indicated. |
| (2) | Source: Underwriting and Borrower Sponsor provided information. |
Property Management. The MGM Grand & Mandalay Bay Properties are currently managed by the MGM Tenant and/or the applicable MGM/Mandalay Operating Subtenant, and there are no management agreements currently in effect with the Borrowers and, other than the management agreement with respect to the Four Seasons hotel and the management agreement with respect to certain signature hotel units (which, for the avoidance of doubt, are not part of the MGM Grand & Mandalay Bay Properties), for which management fees related thereto are included as part of the collateral, there are no management agreements currently in effect with respect to the MGM Grand & Mandalay Bay Properties.
Lockbox / Cash Management. The MGM Grand & Mandalay Bay Whole Loan is subject to a hard lockbox with springing cash management. Amounts on deposit in the lockbox account will be disbursed to the Borrower’s operating account in accordance with the clearing account agreement. After the occurrence and during the continuation of a MGM Grand & Mandalay Bay Trigger Period (as defined below), the Borrowers will establish a cash management account and, at least two times per week, the clearing account bank will sweep funds from the lockbox accounts into the cash management account in accordance with the clearing account agreement and the cash management bank will apply funds on deposit in the order of priority described in the MGM Grand & Mandalay Bay Whole Loan documents, with the remaining excess cash flow (the “Excess Cash Flow Reserve”) to be held as additional collateral for the MGM Grand & Mandalay Bay Whole Loan (and, after the ARD, all amounts in the Excess Cash Flow Reserve account will be used to pay the monthly additional interest amount and applied to the principal of the MGM Grand & Mandalay Bay Whole Loan).
A “MGM Grand & Mandalay Bay Trigger Period” means a period (A) commencing upon the occurrence of any of the following: (i) the Debt Service Coverage Ratio (“DSCR”) falling below 2.50x (the “DSCR Threshold”) for two consecutive quarters (a “DSCR Trigger”), (ii) the MGM Tenant is subject to a bankruptcy action (an “OpCo Bankruptcy”), (iii) an event of default under the MGM Grand & Mandalay Bay Whole Loan has occurred and is continuing (an “EOD Trigger”), (iv) an OpCo Trigger Event (as defined below) or (v) the Borrowers fail to repay the MGM Grand & Mandalay Bay Whole Loan in full on or before the ARD and (B) terminating upon (i) in the event of a DSCR Trigger, either such time that the DSCR exceeds the DSCR Threshold for two consecutive quarters or the Borrowers make voluntary prepayments of the MGM Grand & Mandalay Bay Whole Loan in accordance with the terms of the MGM Grand & Mandalay Bay Whole Loan documents in amounts necessary to achieve a DSCR greater than or equal to the DSCR Threshold (without any obligation to wait two consecutive quarters), (ii) in the event of an OpCo Bankruptcy, the assumption of the Master Lease in such bankruptcy proceeding or the replacement of the MGM Tenant as provided in the MGM Grand & Mandalay Bay Whole Loan documents (or in the event the Master Lease is terminated and not replaced, the DSCR is equal to or greater than the DSCR Threshold or the Borrowers make voluntary prepayments of the MGM Grand & Mandalay Bay Whole Loan in accordance with the terms of the MGM Grand & Mandalay Bay Whole Loan documents in amounts necessary to achieve a DSCR greater than or equal to the DSCR Threshold (without any obligation to wait two consecutive quarters)), (iii) in the event of an OpCo Trigger Period, any OpCo Trigger Event Cure (as defined below) and (iv) in the event of an EOD Trigger, no other events of default exist and are continuing and the mortgage lender will have accepted a cure by the Borrowers of such event of default. For the avoidance of doubt, in no instance will an MGM Grand & Mandalay Bay Trigger Period caused by the failure of the Borrowers to repay the MGM Grand & Mandalay Bay Whole Loan in full on or before the ARD be capable of being cured or deemed to expire.
An “OpCo Trigger Event” means the occurrence and continuance of all of the following conditions simultaneously: (i) an event of default under the Master Lease has occurred and is continuing; (ii) (x) the managing member of the Joint Venture is an affiliate of the Borrowers other than MGP or MGP OP that is controlled by MGP or MGP OP and (y) MGP OP is controlled by MGM and (iii) such managing member is permitted under the terms of the Joint Venture agreement to take any of the following actions without the consent of (x) BCORE Windmill Parent LLC (the member of the Joint Venture that is affiliated with BREIT OP) (a) granting any consent, approval or wavier or making any election under the Master Lease, Lease Guaranty or other related lease documents, (b) entering into any amendment, supplement or modification to the Master Lease, Lease Guaranty or other related lease documents, or (c) declaring an event of default under the Master Lease, Lease Guaranty or other related lease documents or (y) if applicable, a Qualified Transferee (as defined in the MGM Grand & Mandalay Bay Whole Loan documents) that is not an affiliate of MGM Tenant which owns a 15% or greater direct and/or indirect interest in the Borrowers.
THE INFORMATION IN THIS STRUCTURAL AND COLLATERAL TERM SHEET IS NOT COMPLETE AND MAY BE AMENDED PRIOR TO THE TIME OF SALE. THIS TERM SHEET IS NOT AN OFFER TO SELL THESE SECURITIES AND IT IS NOT A SOLICITATION OF AN OFFER TO BUY THESE SECURITIES IN ANY JURISDICTION WHERE THE OFFER OR SALE IS NOT PERMITTED.
84
3799 & 3950 South Las Vegas Boulevard Las Vegas, NV Various | Collateral Asset Summary – Loan No. 5 MGM Grand & Mandalay Bay | Cut-off Date Balance: Cut-off Date LTV: U/W NCF DSCR: U/W NOI Debt Yield: | $65,000,000 35.5% 4.95x 17.9% |
“Lease Guaranty” means that certain Guaranty of Lease Documents dated as of February 14, 2020, made by MGM in favor of the Borrowers.
An “OpCo Trigger Event Cure” means, as applicable, (i) the Borrowers have provided evidence to the mortgage lender of the cure of the event of default under the Master Lease, (ii) the Borrowers have waived the event of default under the Master Lease, provided that such waiver was approved by the mortgage lender, or (iii) in the event that the event of default results in the termination of the Master Lease, either (a) (I) the Borrowers and MGM Tenant have entered into a new lease on terms and conditions substantially similar to those contained in the Master Lease as of the origination of the MGM Grand & Mandalay Bay Whole Loan and (II) the Master Lease opinion delivery requirements have been satisfied, or (b) after giving effect to the termination of the Master Lease the DSCR is equal to or greater than 2.50x for two consecutive quarters or the Borrowers make voluntary prepayments in accordance with the terms of the MGM Grand & Mandalay Bay Whole Loan documents in an amount necessary to achieve a DSCR equal to or greater than 2.50x.
Initial and Ongoing Reserves. At loan origination, the Borrowers were not required to deposit any initial reserves. For so long as the MGM Grand & Mandalay Bay Properties are subject to the Master Lease, there are no ongoing reserves required under the MGM Grand & Mandalay Bay Whole Loan documents.
Under the Master Lease, the MGM Tenant is obligated to make monthly deposits of 1.50% of net revenues at an eligible institution to be used for FF&E and qualifying capital expenditures (the “OpCo FF&E Reserve Account”). MGM Tenant granted the Borrowers a security interest in the OpCo FF&E Reserve Account, and the Borrowers collaterally assigned the Borrowers’ security interest in the OpCo FF&E Reserve Account to the mortgage lender.
Real Estate Taxes Reserve. For so long as the MGM Grand & Mandalay Bay Properties are subject to the Master Lease, no reserves for real estate taxes are required under the loan documents. If the MGM Grand & Mandalay Bay Properties are not subject to the Master Lease, solely if a MGM Grand & Mandalay Bay Trigger Period is in effect, the loan documents provide for ongoing monthly reserves for real estate taxes in an amount equal to 1/12 of the real estate taxes that the lender estimates will be payable during the next 12 months at least 30 days prior to their respective due dates. Notwithstanding the foregoing, the requirement for such monthly reserves will be reduced dollar for dollar by any taxes paid or reserved for by a brand manager or casino operator pursuant to a brand management or casino management agreement relating to the MGM Grand & Mandalay Bay Properties.
Insurance Reserve. For so long as the MGM Grand & Mandalay Bay Properties are subject to the Master Lease, no reserves for insurance premiums are required under the loan documents. If the MGM Grand & Mandalay Bay Properties are not subject to the Master Lease, solely if a MGM Grand & Mandalay Bay Trigger Period is in effect, the loan documents provide for ongoing monthly reserves for insurance premiums in an amount equal to 1/12 of the insurance premiums that the lender estimates will be payable for the renewal of the insurance policies at least 30 days prior to the expiration thereof. Notwithstanding the foregoing, the requirement for such monthly reserves will be reduced dollar for dollar by any insurance premiums paid or reserved for by a brand manager or casino operator pursuant to a brand management or casino management agreement relating to the MGM Grand & Mandalay Bay Properties. In addition, such monthly reserves will not be required so long as (i) no event of default is continuing, and (ii) the insurance coverage for the MGM Grand & Mandalay Bay Properties are included in a blanket policy reasonably acceptable to the lender.
Replacement Reserve. For so long as the MGM Grand & Mandalay Bay Properties are not subject to the Master Lease, (i) on each Payment Date during a MGM Grand & Mandalay Bay Trigger Period, the Borrowers will be required to make a deposit equal to (a) 4.0% of net revenue from guest rooms and Borrower-managed food and beverage operations and (b) 0.5% of all other net revenue (other than non-recurring items), in each case for the calendar month that is two months prior to the calendar month in which the applicable deposit to the replacement reserve fund is to be made (the sum of (a) and (b), the “Replacement Reserve Monthly Deposit”), and (ii) if a MGM Grand & Mandalay Bay Trigger Period does not exist, on the first Payment Date of each calendar quarter, an amount equal to the lesser of (x) the Replacement Reserve Current Year Lookback Deficiency and (y) the Replacement Reserve Five Year Lookback Deficiency (as defined below) (the lesser of (x) and (y), the “Replacement Reserve Quarterly Deposit”), provided that for so long as any individual Property is managed by (x) a Brand Manager pursuant to a brand management agreement and/or (y) a casino operator pursuant to a casino management agreement, the amounts required to be funded as a Replacement Reserve Monthly Deposit or a Replacement Reserve Quarterly Deposit will be reduced on a dollar-for-dollar basis by any amounts deposited into a manager account for replacements, PIP work or brand mandated work for the applicable calendar months as set forth in the annual budget and required pursuant to the terms of the brand management agreement and/or casino management agreement if the Borrowers deliver evidence reasonably satisfactory to the mortgage lender that such deposit has been made.
“Replacement Reserve Current Year Lookback Deficiency” means an amount equal to (x) the aggregate amount of Replacement Reserve Monthly Deposits which would have been funded from the beginning of the then calendar year to the date of determination had a MGM Grand & Mandalay Bay Trigger Period been in effect for the entirety of such period less (y) the sum of (1) the aggregate amount expended on replacements, PIP work and brand mandated work during such calendar year to date and (2) the aggregate amount funded into the Replacement Reserve Fund during such calendar year to date; provided, if the foregoing calculation results in a negative number, the Replacement Reserve Current Year Lookback Deficiency will be deemed to be zero.
“Replacement Reserve Five Year Lookback Deficiency” means (i) zero, with respect to any period before December 31, 2024, and (ii) from and after January 1, 2025, an amount equal to (x) 4.0% of net revenue from guest rooms and Borrower-managed food and beverage
THE INFORMATION IN THIS STRUCTURAL AND COLLATERAL TERM SHEET IS NOT COMPLETE AND MAY BE AMENDED PRIOR TO THE TIME OF SALE. THIS TERM SHEET IS NOT AN OFFER TO SELL THESE SECURITIES AND IT IS NOT A SOLICITATION OF AN OFFER TO BUY THESE SECURITIES IN ANY JURISDICTION WHERE THE OFFER OR SALE IS NOT PERMITTED.
85
3799 & 3950 South Las Vegas Boulevard Las Vegas, NV Various | Collateral Asset Summary – Loan No. 5 MGM Grand & Mandalay Bay | Cut-off Date Balance: Cut-off Date LTV: U/W NCF DSCR: U/W NOI Debt Yield: | $65,000,000 35.5% 4.95x 17.9% |
operations and 0.5% of all other net revenues (other than non-recurring items) during the Replacement Reserve Five Year Lookback Period (as defined below) less (y) the sum of (1) the aggregate amount expended on replacements, PIP Work and brand mandated work during the Replacement Reserve Five Year Lookback Period (including amounts expended by MGM Tenant pursuant to the express terms and conditions of the Master Lease) and (2) the aggregate amounts funded into the Replacement Reserve Fund during such Replacement Reserve Five Year Lookback Period; provided, if the foregoing calculation results in a negative number, the Replacement Reserve Five Year Lookback Deficiency will be deemed to be zero.
“Replacement Reserve Five Year Lookback Period” means each five (5) year period (on a rolling basis) with the first period commencing on January 1, 2020 and expiring on December 31, 2024 and the second period commencing on January 1, 2021 and expiring on December 31, 2025.
Current Mezzanine or Subordinate Indebtedness. In addition to the MGM Grand & Mandalay Bay Mortgage Loan, the MGM Grand & Mandalay Bay Properties also secure the MGM Grand & Mandalay Bay Senior Notes not included in the Benchmark 2020-B18 securitization trust, which have an aggregate Cut-off Date principal balance of $1,569,200,000, and the MGM Grand & Mandalay Bay Junior Notes (which have an aggregate Cut-off Date principal balance of $1,365,800,000). The MGM Grand & Mandalay Bay Senior Notes not included in the Benchmark 2020-B18 trust and the MGM Grand & Mandalay Bay Junior Notes accrue interest at the same rate as the MGM Grand & Mandalay Bay Mortgage Loan. The MGM Grand & Mandalay Bay Mortgage Loan is entitled to payments of interest and principal on a pro rata and pari passu basis with the MGM Grand & Mandalay Bay Senior Notes not included in the Benchmark 2020-B18 securitization trust. The MGM Grand & Mandalay Bay Mortgage Loan and the MGM Grand & Mandalay Bay Senior Notes not included in the Benchmark 2020-B18 securitization trust are generally senior to the MGM Grand & Mandalay Bay Junior Notes.
Future Mezzanine or Subordinate Indebtedness Permitted. The MGM Grand & Mandalay Bay Borrowers have a one-time right to borrow a mezzanine loan subordinate to the MGM Grand & Mandalay Bay Whole Loan (“Mezzanine Loan”), subject to credit and legal criteria specified in the MGM Grand & Mandalay Bay Whole Loan documents, including, without limitation: (i) a combined maximum loan to value ratio (based on appraisals ordered by the lender in connection with the closing of the Mezzanine Loan and calculated based on the outstanding principal balance of the MGM Grand & Mandalay Bay Whole Loan and the initial principal amount of the Mezzanine Loan) of 67.0%, (ii) a debt service coverage ratio at the closing of the Mezzanine Loan at least equal to 4.81x, in each case, inclusive of the additional mezzanine debt and (iii) an intercreditor agreement reasonably satisfactory to the lender. The lender’s receipt of a rating agency confirmation will not be required in connection with the Mezzanine Loan.
Notwithstanding the foregoing, (1) during a MGM Grand & Mandalay Bay Trigger Period (and for so long as no event of default has occurred and is continuing), in the event that the Mezzanine Loan (or any portion thereof) is directly or indirectly or beneficially owned by the MGM Grand & Mandalay Bay Borrowers, mezzanine borrower or a “broad affiliate” (as defined in the MGM Grand & Mandalay Whole Loan documents) of the Borrowers or mezzanine borrower (an “Affiliated Mezzanine Lender”), in no instance will the Affiliated Mezzanine Lender be permitted to receive late charges, principal (other than the pro rata prepayment of the Mezzanine Loan upon the release of an individual Property or prepayment of the MGM Grand & Mandalay Bay Whole Loan in accordance with the terms and conditions of the MGM Grand & Mandalay Bay Whole Loan documents and the Mezzanine Loan documents) or interest at the default rate, even if an event of default has occurred and is continuing under the Mezzanine Loan and such Affiliated Mezzanine Lender will only be permitted to receive interest at the non-default rate on a monthly basis, (2) during a MGM Grand & Mandalay Bay Trigger Period (and for so long as no event of default has occurred and is continuing under the MGM Grand & Mandalay Bay Whole Loan documents), for so long as the whole Mezzanine Loan is not directly or indirectly or beneficially owned by an Affiliated Mezzanine Lender, the mezzanine lender will receive on a monthly basis interest at the non-default rate and, if an event of default has occurred and is continuing under the Mezzanine Loan, funds sufficient to pay any other amounts then due under the Mezzanine Loan and the Mezzanine Loan documents (other than the payment of the outstanding principal amount of the Mezzanine Loan on the maturity date of the Mezzanine Loan whether on the scheduled date for such payment or earlier due to an acceleration of the Mezzanine Loan) and (3) after the ARD, in no instance will any mezzanine lender be permitted to receive any payments whatsoever.
Partial Release. So long as no event of default has occurred and is continuing (other than as set forth below), the Borrowers may at any time release an individual Property from the MGM Grand & Mandalay Bay Whole Loan by prepaying the applicable Release Percentage (as defined below) of the ALA of the subject individual Property (including any yield maintenance premium, if required), and subject to the terms and conditions in the MGM Grand & Mandalay Bay Whole Loan documents, including, without limitation: (i) the DSCR after giving effect to such release is at least equal to 4.81x; (ii) continued compliance with the single purpose entity requirements contained in the MGM Grand & Mandalay Bay Whole Loan documents; (iii) payment to an agent or servicer of the then current and customary fee by such persons for such releases in an amount not to exceed $2,000.00 and any reasonable legal fees or other out-of-pocket costs incurred by the lender to effect the release and any applicable prepayment premiums (provided the legal fees may not exceed $10,000.00); (iv) payment of all recording charges, filing fees, taxes or other similar expenses payable in connection therewith; (v) if the MGM Grand & Mandalay Bay Whole Loan is securitized in a REMIC trust, compliance with applicable REMIC requirements relating to the REMIC 125% LTV test for release which may be satisfied by delivery of any of the following if permitted by REMIC requirements: an existing or updated appraisal, a broker’s price opinion or other written determination of value using a commercially reasonable valuation method, in each case satisfactory to the lender, but will be based solely on the value of real property and will exclude personal property and going-concern value; and (vi) if the Property is subject to the Master Lease, the Borrowers removing the released individual Property from the Master
THE INFORMATION IN THIS STRUCTURAL AND COLLATERAL TERM SHEET IS NOT COMPLETE AND MAY BE AMENDED PRIOR TO THE TIME OF SALE. THIS TERM SHEET IS NOT AN OFFER TO SELL THESE SECURITIES AND IT IS NOT A SOLICITATION OF AN OFFER TO BUY THESE SECURITIES IN ANY JURISDICTION WHERE THE OFFER OR SALE IS NOT PERMITTED.
86
3799 & 3950 South Las Vegas Boulevard Las Vegas, NV Various | Collateral Asset Summary – Loan No. 5 MGM Grand & Mandalay Bay | Cut-off Date Balance: Cut-off Date LTV: U/W NCF DSCR: U/W NOI Debt Yield: | $65,000,000 35.5% 4.95x 17.9% |
Lease and entering into a new triple-net lease with respect to the remaining individual Property on substantially the same terms as the Master Lease (collectively, the “Release Conditions”).
“Release Percentage” means, with respect to any individual Property, 105.0% until such time as the outstanding principal balance of the MGM Grand & Mandalay Bay Whole Loan is reduced to $2,250,000,000 (the “Release Percentage Threshold”), and 110.0% thereafter. In calculating the Release Amount for an individual Property, the Release Percentage may initially be one hundred and five percent (105%) until the application of a portion of such prepayment would reach the Release Percentage Threshold and with respect to any remaining prepayment for such individual Property, the Release Percentage would be one hundred and ten percent (110%).
Notwithstanding the foregoing, in the event that the DSCR following the release would not satisfy the DSCR requirement in clause (i) of the Release Conditions, and such release is in connection with an arms’ length transaction with an unrelated third party, the Borrowers will be permitted to release the subject Property and the amount that will be required to be prepaid (or defeased) in connection with such Release will equal the greater of (I) the Release Percentage of the ALA for such individual Property, together with, to the extent the release does not occur in connection with a partial defeasance, any yield maintenance premium required (if any) and (II) the lesser of (x) one hundred percent (100.0%) of the net sales proceeds for the sale of such individual Property (net of reasonable and customary closing costs associated with the sale of such individual Property) and (y) an amount necessary to, after giving effect to such release of the individual Property, achieve the DSCR requirement in the preceding paragraph.
The Borrowers may release any defaulting individual Property, without the payment of any yield maintenance premium, in order to cure a default or an event of default related to such individual Property, subject to the satisfaction of other terms and conditions in the MGM Grand & Mandalay Bay Whole Loan documents (including, without limitation, Release Conditions (other than clause (i))) (a “Default Release”). In addition, the Borrowers may release an individual Property (including to an affiliate) if the estimated net proceeds following any casualty or condemnation at such individual Property will be equal to or greater than (x) 25.0% of its allocated whole loan amount, or (y) 5.0% of its ALA (subject to the satisfaction of other terms and conditions in the MGM Grand & Mandalay Bay Whole Loan documents) upon satisfaction of clauses (iii), (iv) and (v) of the Release Conditions above and prepayment of the MGM Grand & Mandalay Bay Whole Loan in an amount equal to the net proceeds (up to an amount equal to the Release Percentage) for such individual Property (a “Special Release”).
THE INFORMATION IN THIS STRUCTURAL AND COLLATERAL TERM SHEET IS NOT COMPLETE AND MAY BE AMENDED PRIOR TO THE TIME OF SALE. THIS TERM SHEET IS NOT AN OFFER TO SELL THESE SECURITIES AND IT IS NOT A SOLICITATION OF AN OFFER TO BUY THESE SECURITIES IN ANY JURISDICTION WHERE THE OFFER OR SALE IS NOT PERMITTED.
87
1633 Broadway New York, NY 10019 | Collateral Asset Summary – Loan No. 6 1633 Broadway | Cut-off Date Balance: Cut-off Date LTV: U/W NCF DSCR: U/W NOI Debt Yield: | $62,850,000 41.7% 3.84x 11.9% |
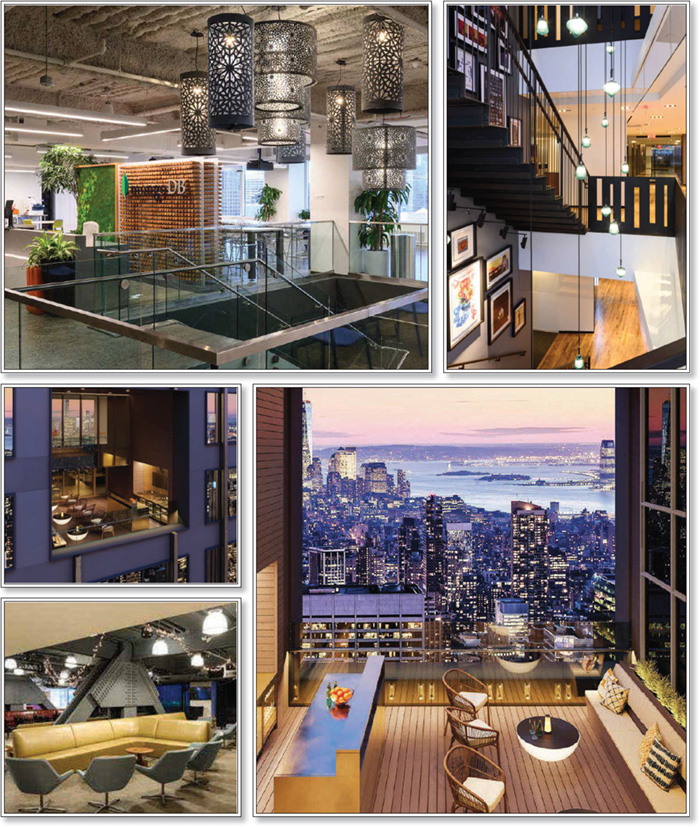
THE INFORMATION IN THIS STRUCTURAL AND COLLATERAL TERM SHEET IS NOT COMPLETE AND MAY BE AMENDED PRIOR TO THE TIME OF SALE. THIS TERM SHEET IS NOT AN OFFER TO SELL THESE SECURITIES AND IT IS NOT A SOLICITATION OF AN OFFER TO BUY THESE SECURITIES IN ANY JURISDICTION WHERE THE OFFER OR SALE IS NOT PERMITTED.
88
1633 Broadway New York, NY 10019 | Collateral Asset Summary – Loan No. 6 1633 Broadway | Cut-off Date Balance: Cut-off Date LTV: U/W NCF DSCR: U/W NOI Debt Yield: | $62,850,000 41.7% 3.84x 11.9% |
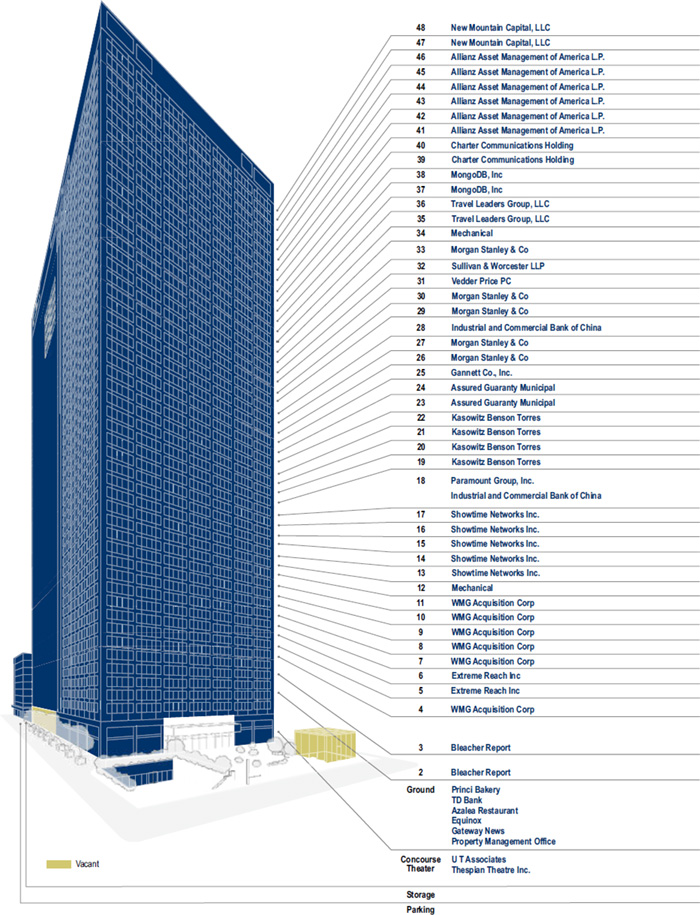
THE INFORMATION IN THIS STRUCTURAL AND COLLATERAL TERM SHEET IS NOT COMPLETE AND MAY BE AMENDED PRIOR TO THE TIME OF SALE. THIS TERM SHEET IS NOT AN OFFER TO SELL THESE SECURITIES AND IT IS NOT A SOLICITATION OF AN OFFER TO BUY THESE SECURITIES IN ANY JURISDICTION WHERE THE OFFER OR SALE IS NOT PERMITTED.
89
1633 Broadway New York, NY 10019 | Collateral Asset Summary – Loan No. 6 1633 Broadway | Cut-off Date Balance: Cut-off Date LTV: U/W NCF DSCR: U/W NOI Debt Yield: | $62,850,000 41.7% 3.84x 11.9% |
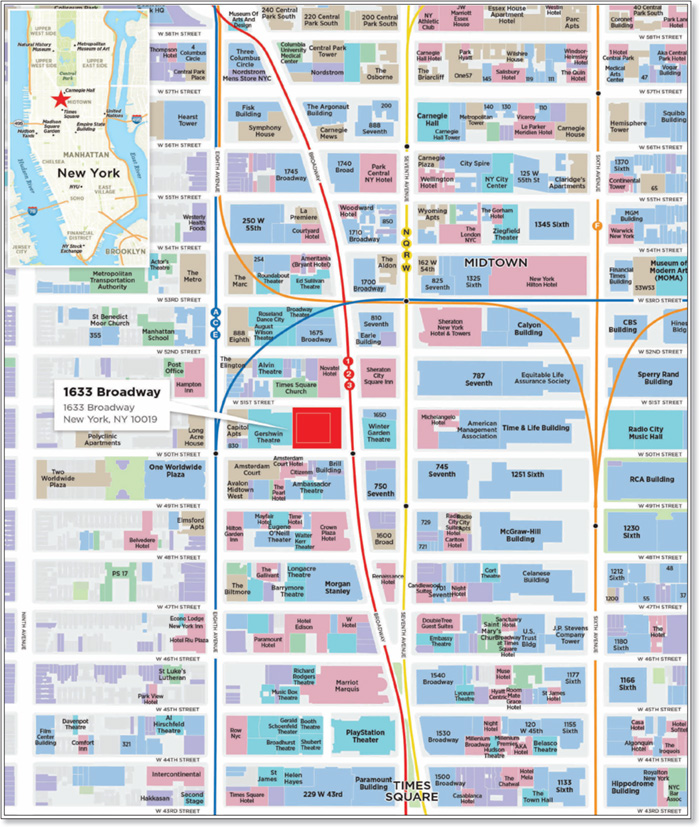
THE INFORMATION IN THIS STRUCTURAL AND COLLATERAL TERM SHEET IS NOT COMPLETE AND MAY BE AMENDED PRIOR TO THE TIME OF SALE. THIS TERM SHEET IS NOT AN OFFER TO SELL THESE SECURITIES AND IT IS NOT A SOLICITATION OF AN OFFER TO BUY THESE SECURITIES IN ANY JURISDICTION WHERE THE OFFER OR SALE IS NOT PERMITTED.
90
1633 Broadway New York, NY 10019 | Collateral Asset Summary – Loan No. 6 1633 Broadway | Cut-off Date Balance: Cut-off Date LTV: U/W NCF DSCR: U/W NOI Debt Yield: | $62,850,000 41.7% 3.84x 11.9% |
| Mortgage Loan Information | |
| Loan Sellers(1): | GACC/JPMCB |
| Loan Purpose: | Refinance |
| Credit Assessment | |
| (Fitch/KBRA/S&P)(8): | BBB-sf / A(sf) / N/A |
| Borrower Sponsor(2): | Paramount Group Operating Partnership LP |
| Borrowers: | PGREF I 1633 Broadway Land, L.P.; 1633 Broadway Owner I, LP; 1633 Broadway Owner II, LP |
| Original Balance(3): | $62,850,000 |
| Cut-off Date Balance(3): | $62,850,000 |
| % by Initial UPB: | 6.7% |
| Interest Rate: | 2.99000% |
| Payment Date: | 6th of each month |
| First Payment Date: | January 6, 2020 |
| Maturity Date: | December 6, 2029 |
| Amortization: | Interest Only |
| Additional Debt(3): | $938,150,000 Pari Passu Debt; $249,000,000 Subordinate Debt |
| Call Protection(4): | L(31), D(82), O(7) |
| Lockbox / Cash Management: | Hard / Springing |
| Reserves(5) | |||
| Initial | Monthly | Cap | |
| Taxes: | $0 | Springing | NAP |
| Insurance: | $0 | Springing | NAP |
| Replacement: | $0 | Springing | $1,024,605 |
| TI/LC: | $0 | Springing | $5,123,024 |
| Unfunded Obligations: | $36,389,727 | $0 | NAP |
| Property Information | |
| Single Asset / Portfolio: | Single Asset |
| Property Type: | CBD Office |
| Collateral: | Fee Simple |
| Location: | New York, NY |
| Year Built / Renovated: | 1972 / 2013 |
| Total Sq. Ft.: | 2,561,512 |
| Property Management: | Paramount Group Property-Asset Management LLC |
| Underwritten NOI(6): | $119,150,163 |
| Underwritten NCF(6): | $116,677,727 |
| Appraised Value(6): | $2,400,000,000 |
| Appraisal Date(6): | October 24, 2019 |
| Historical NOI(6) | |
| Most Recent NOI: | $110,826,000 (T-12 May 31, 2020) |
| 2018 NOI(7): | $109,098,450 (December 31, 2018) |
| 2017 NOI(7): | $94,190,007 (December 31, 2017) |
| 2016 NOI: | $93,821,386 (December 31, 2016) |
| Historical Occupancy(6) | |
| Most Recent Occupancy: | 98.4% (October 31, 2019) |
| 2018 Occupancy: | 95.4% (December 31, 2018) |
| 2017 Occupancy: | 95.4% (December 31, 2017) |
| 2016 Occupancy: | 86.3% (December 31, 2016) |
| Financial Information(1)(3)(6) | ||||||
| Tranche | Cut-off Date Balance | Balance per Sq. Ft. Cut-off / Balloon | LTV Cut-off / Balloon | U/W DSCR NOI / NCF | U/W Debt Yield NOI / NCF | U/W Debt Yield at Balloon NOI / NCF |
| Mortgage Loan | $62,850,000 | |||||
| Pari Passu Notes | $938,150,000 | |||||
| Total Senior Notes | $1,001,000,000 | $391 / $391 | 41.7% / 41.7% | 3.93x / 3.84x | 11.9% / 11.7% | 11.9% / 11.7% |
| Subordinate Notes | $249,000,000 | |||||
| Whole Loan | $1,250,000,000 | $488 / $488 | 52.1% / 52.1% | 3.14x / 3.08x | 9.5% / 9.3% | 9.5% / 9.3% |
| (1) | The 1633 Broadway Whole Loan (as defined below) was co-originated by Goldman Sachs Bank USA (“GSBI”), JPMorgan Chase Bank, National Association (“JPMCB”), DBR Investments Co. Limited (“DBRI”) and Wells Fargo Bank, National Association (“WFB”). JPMCB is contributing Note A-3-C-1-A with a Cut-off Date Balance of $27,850,000, and GACC is contributing Note A-2-C-6 with a Cut-off Date Balance of $35,000,000. |
| (2) | There is no non-recourse carveout guarantor or separate environmental indemnitor with respect to the 1633 Broadway Whole Loan. |
| (3) | The 1633 Broadway Loan is part of a whole loan consisting of 40 senior pari passu promissory notes with an aggregate original principal balance of $1,001,000,000, and four pari passu subordinate notes with an aggregate original principal balance of $249,000,000. For additional information, see “The Loan” herein. |
| (4) | The defeasance lockout period will be at least 31 payments beginning with and including the first payment date of January 6, 2020. At any time after the earlier to occur of (i) November 25, 2022 and (ii) the second anniversary of the closing date of the securitization into which the last note of the 1633 Broadway Whole Loan is deposited, the 1633 Broadway Whole Loan may be defeased in whole (or in part) with direct, non-callable obligations of the United States of America. The actual lockout period may be longer. |
| (5) | See “Initial and Ongoing Reserves” herein. |
| (6) | All NOI, NCF and occupancy information, as well as the appraised value, were determined prior to the emergence of the novel coronavirus pandemic, and the economic disruption resulting from measures to combat the pandemic, and all DSCR, LTV and Debt Yield metrics were calculated, and the 1633 Broadway Whole Loan was underwritten, based on such prior information. See “Risk Factors—Coronavirus Pandemic Has Adversely Affected the Global Economy and Will Likely Adversely Affect the Performance of the Mortgage Loans” in the Preliminary Prospectus. |
| (7) | The increase in NOI between 2017 and 2018 is largely due to new leases being signed. |
| (8) | Fitch and KBRA provided the listed assessments for the 1633 Broadway Loan in the context of its inclusion in the mortgage pool. |
THE INFORMATION IN THIS STRUCTURAL AND COLLATERAL TERM SHEET IS NOT COMPLETE AND MAY BE AMENDED PRIOR TO THE TIME OF SALE. THIS TERM SHEET IS NOT AN OFFER TO SELL THESE SECURITIES AND IT IS NOT A SOLICITATION OF AN OFFER TO BUY THESE SECURITIES IN ANY JURISDICTION WHERE THE OFFER OR SALE IS NOT PERMITTED.
91
1633 Broadway New York, NY 10019 | Collateral Asset Summary – Loan No. 6 1633 Broadway | Cut-off Date Balance: Cut-off Date LTV: U/W NCF DSCR: U/W NOI Debt Yield: | $62,850,000 41.7% 3.84x 11.9% |
The Loan. The mortgage loan (the “1633 Broadway Loan”) is part of a whole loan (the “1633 Broadway Whole Loan”) consisting of 40 senior pari passu promissory notes with an aggregate original principal balance of $1,001,000,000 (the “1633 Broadway Senior Notes”) and four subordinate pari passu notes with an aggregate original principal balance of $249,000,000 (the “1633 Broadway Subordinate Companion Loan”). The 1633 Broadway Whole Loan has an aggregate original principal balance of $1,250,000,000 and is secured by a first mortgage encumbering the borrowers’ fee simple interest in an office building in New York, New York (the “1633 Broadway Property”).
The 1633 Broadway Whole Loan was co-originated by GSBI, JPMCB, DBRI and WFB on November 25, 2019. The 1633 Broadway Whole Loan has a 10-year interest-only term and accrues interest at a rate of 2.99000% per annum. The relationship between the holders of the 1633 Broadway Whole Loan is governed by a co-lender agreement as described under “Description of the Mortgage Pool–The Whole Loans—The Non-Serviced AB Whole Loans—The 1633 Broadway Whole Loan” in the Preliminary Prospectus.
The borrowers utilized the proceeds of the 1633 Broadway Whole Loan to refinance existing debt on the 1633 Broadway Property, fund reserves, pay origination costs and return equity to the borrower sponsor. Based on the “As Is” appraised value of $2.4 billion as of October 24, 2019 and the Cut-off Date balance of the 1633 Broadway Loan, the Cut-off Date LTV Ratio is 41.7% for the 1633 Broadway Senior Notes and 52.1% for the 1633 Broadway Whole Loan.
| Whole Loan Summary | |||||
| Note | Original Balance | Cut-off Date Balance | Note Holder | Controlling Piece | |
| A-2-C-6, A-3-C-1-A | $62,850,000 | $62,850,000 | Benchmark 2020-B18(3) | No | |
| A-1-S-1, A-2-S-1, A-3-S-1, A-4-S-1 | 1,000,000 | 1,000,000 | BWAY 2019-1633 | No | |
| A-1-C-1, A-1-C-5, A-2-C-1-A | 110,000,000 | 110,000,000 | CGCMT 2020-GC46 | No(1) | |
| A-1-C-2, A-2-C-5 | 60,000,000 | 60,000,000 | GSMS 2020-GC45 | No | |
| A-2-C-1-B, A-3-C-1-B | 45,000,000 | 45,000,000 | Benchmark 2020-B16 | No | |
| A-3-C-5, A-3-C-6 | 50,000,000 | 50,000,000 | Benchmark 2020-B17 | No | |
| A-3-C-2, A-2-C-3-B | 64,650,000 | 64,650,000 | Benchmark 2020-IG1 | No | |
| A-4-C-1, A-4-C-2 | 100,000,000 | 100,000,000 | BANK 2020-BNK25 | No | |
| A-4-C-6, A-4-C-7 | 40,000,000 | 40,000,000 | BANK 2020-BNK26 | No | |
| A-4-C-4, A-4-C-5 | 70,000,000 | 70,000,000 | WFCM 2020-C55 | No | |
| A-1-C-3, A-1-C-6 | 65,000,000 | 65,000,000 | GSMS 2020-GC47 | No | |
| A-2-C-2-A, A-3-C-3 | 70,000,000 | 70,000,000 | Benchmark 2020-IG2 | No | |
| A-1-C-7, A-2-C-4-A, A-2-C-7, A-3-C-4 | 80,000,000 | 80,000,000 | Benchmark 2020-IG3 | No | |
| A-4-C-3 | 40,000,000 | 40,000,000 | BANK 2020-BNK27 | No | |
| A-1-C-4-B, A-2-C-2-B, A-3-C-7 | 57,500,000 | 57,500,000 | JPMDB 2020-COR7 | No | |
| A-2-C-3-A, A-2-C-4-B, A-2-C-4-C, A-2-C-4-D | 55,000,000 | 55,000,000 | DBRI(2) | No | |
| A-1-C-4-A | 30,000,000 | 30,000,000 | GSBI(2) | No | |
| Total Senior Notes | $1,001,000,000 | $1,001,000,000 | |||
| B-1, B-2, B-3, B-4 | 249,000,000 | 249,000,000 | BWAY 2019-1633 | Yes(1) | |
| Total | $1,250,000,000 | $1,250,000,000 | |||
| (1) | During the continuance of a control appraisal period relating to the BWAY 2019-1633 securitization transaction (i.e., when the most senior class of certificates in such transaction have been control appraised out), Note A-1-C-1 will be the controlling note. See “Description of the Mortgage Pool—The Whole Loans—The Non-Serviced AB Whole Loans—The 1633 Broadway Whole Loan” in the Preliminary Prospectus. |
| (2) | Expected to be contributed to one or more future securitization transactions. |
| (3) | GACC is contributing Note A-2-C-6 with an outstanding principal balance as of the Cut-off Date of $35,000,000 and JPMCB is contributing Note A-3-C-1-A with an outstanding principal balance as of the Cut-off Date of $27,850,000. |
| Sources and Uses | ||||||
| Sources | Proceeds | % of Total | Uses | Proceeds | % of Total | |
| Senior Notes | $1,001,000,000 | 80.1% | Loan Payoff | $1,052,884,467 | 84.2% | |
| Subordinate Notes | 249,000,000 | 19.9 | Return of Equity | 139,885,652 | 11.2 | |
| Reserves | 36,389,727 | 2.9 | ||||
| Closing Costs | 20,840,154 | 1.7 | ||||
| Total Sources | $1,250,000,000 | 100.0% | Total Uses | $1,250,000,000 | 100.0% | |
The Borrower / Borrower Sponsors. At the time of origination of the 1633 Broadway Whole Loan, PGREF I 1633 Broadway Land, L.P. owned the 1633 Broadway Property entirely in fee and also ground leased the 1633 Broadway Property to PGREF I 1633 Broadway Tower, L.P. (i.e., both landlord and tenant interests in the ground lease were pledged as collateral, in addition to the fee interest in the 1633 Broadway Property); however, effective May 26, 2020, such ground lease was eliminated (such that collateral for the 1633 Broadway Whole Loan consists entirely of the fee interest in the 1633 Broadway Property) and PGREF I 1633 Broadway Land, L.P. transferred undivided tenant in common interests in the 1633 Broadway Property to each of the additional tenant-in-common borrowers. Legal counsel to the borrowers delivered a non-consolidation opinion in connection with the origination of the 1633 Broadway Whole Loan. There is no non-recourse carveout guarantor or separate environmental indemnitor with respect to the 1633 Broadway Whole Loan.
THE INFORMATION IN THIS STRUCTURAL AND COLLATERAL TERM SHEET IS NOT COMPLETE AND MAY BE AMENDED PRIOR TO THE TIME OF SALE. THIS TERM SHEET IS NOT AN OFFER TO SELL THESE SECURITIES AND IT IS NOT A SOLICITATION OF AN OFFER TO BUY THESE SECURITIES IN ANY JURISDICTION WHERE THE OFFER OR SALE IS NOT PERMITTED.
92
1633 Broadway New York, NY 10019 | Collateral Asset Summary – Loan No. 6 1633 Broadway | Cut-off Date Balance: Cut-off Date LTV: U/W NCF DSCR: U/W NOI Debt Yield: | $62,850,000 41.7% 3.84x 11.9% |
The borrower sponsor is Paramount Group Operating Partnership LP, which indirectly owns and controls the borrowers. Paramount Group, Inc. (NYSE: PGRE), an approximately 92.0% general partner of the borrower sponsor, is a real estate investment trust that currently owns and/or manages a 13.4 million sq. ft. portfolio of 18 Class A office and retail buildings in New York, Washington, D.C., and San Francisco. Paramount Group, Inc. has a New York portfolio that includes: 1633 Broadway, 1301 Avenue of the Americas, 1325 Avenue of the Americas, 31 West 52nd Street, 900 Third Avenue, 712 Fifth Avenue, 60 Wall Street, 745 Fifth Avenue, 718 Fifth Avenue, and 0 Bond Street.
The Property. The 1633 Broadway Property is an approximately 2.6 million sq. ft., 48-story office tower that is situated with a full block of Broadway frontage between 50th and 51st Streets in Midtown Manhattan. The 1633 Broadway Property contains views of the Hudson River, Central Park, and Midtown from above the 36th floor. In addition to the office space, the 1633 Broadway Property includes retail space (anchored by Equinox), a parking garage across three levels below grade, two theaters comprising a total of 145,192 sq. ft. (the Gershwin Theatre and Circle in the Square Theatre) and storage space comprising 18,384 sq. ft.
The 1633 Broadway Property is located on a 90,400 sq. ft. parcel comprising the entire western block front of Broadway between West 50th and West 51st Streets within the Westside office submarket of Midtown Manhattan. The 1633 Broadway Property was constructed in 1972 and was most recently renovated in 2013. Since 2010, the borrower sponsor has invested a total of approximately $41.6 million in lobby renovations, plaza redevelopment, and retail renovations. In addition, the borrower sponsor has invested approximately $230.0 million in tenant improvements and leasing commissions since 2010. Going forward, the borrower sponsor provided a 10-year renovation budget which totals approximately $55.98 million; the renovation budget is anticipated to be utilized for items including a roof replacement, structural upgrades, fire alarm system upgrades, Gershwin Theatre upgrades, completion of the terrace on the 47th and 48th floors, and development of the Retail Cube. Such renovations are not required by the 1633 Broadway Whole Loan documents, and have not been reserved for. We cannot assure you that such renovations will proceed as expected or at all.
The 1633 Broadway Property comprises 2,561,512 sq. ft. and was 98.4% leased as of October 31, 2019. The 1633 Broadway Property office component is currently 100.0% leased to 18 tenants. The retail space within the 1633 Broadway Property totals approximately 80,000 sq. ft. of net rentable area and is anchored by Equinox (25,458 sq. ft.) through February 2040. Approximately 94.3% of the underwritten rent is from office tenants.
The parking component within the 1633 Broadway Property consists of a 250-space parking garage across three levels below grade and comprises 64,158 sq. ft. The space is currently leased to ABM Parking Services, Inc., a parking garage operator, through July 2026. The operator is responsible for a contract rent of approximately $2.39 million, or $9,560 per space, which will increase by 1.50% per annum throughout the remainder of the lease term.
COVID-19 Update. As of July 8, 2020, the 1633 Broadway Property is open, however some retail tenants and the two theaters are closed and most, if not all, office tenants are working remotely. Tenants who paid rent for May and June 2020, in part or in full, represent approximately 95% and 93% of the square footage, respectively and approximately 94% and 94% of the rent, respectively. One of those tenants, representing approximately 8% of underwritten base rent, has signed an amendment reducing rent through year end 2020, and paid rent required under such amendment for May and June 2020; therefore, this tenant is treated as having paid rent in full for the purpose of the percentages in the preceding sentence. The difference between the underwritten contractual rent per the original lease and the reduced rent pursuant to signed amendment is required to be repaid over a 36-month period beginning on January 1, 2021 at an imputed interest rate of 3.75% (from April 1, 2020) on the amount of rent deferred. One tenant, representing approximately 4.7% of the underwritten base rent, has agreed to a three month rent deferral for the months of April, May and June 2020. The 1633 Broadway Whole Loan is current through the July 6, 2020 payment date. As of July 8, 2020, the 1633 Broadway Whole Loan is not subject to any modification or forbearance request.
Major Tenants.
Allianz Asset Management of America L.P. (“Allianz”) (320,911 sq. ft.; 12.5% of NRA; 15.7% of U/W base rent) Allianz occupies six suites with leases expiring in January 2031. Allianz is an asset manager with over 800 investment professionals in 25 offices worldwide and manages assets for individuals, families and institutions. The 1633 Broadway Property serves as the United States headquarters for Allianz.
Morgan Stanley & Co (“Morgan Stanley”) (260,829 sq. ft.; 10.2% of NRA; 11.1% of U/W base rent) Morgan Stanley occupies five suites with leases expiring in March 2032. Morgan Stanley, a financial holding company, provides various financial products and services to corporations, governments, financial institutions and individuals in the Americas, Europe, the Middle East, Africa and Asia. The company operates through three segments: Institutional Securities, Wealth Management and Investment Management.
WMG Acquisition Corp (“Warner Music Group”) (293,888 sq. ft. 11.5% of NRA; 10.4% of U/W base rent) Warner Music Group is an American multinational entertainment and record label conglomerate. It is one of the “Big Three” recording companies and the third largest in the global music industry, next to Universal Music Group and Sony Music Entertainment. Warner Music Group is headquartered at the 1633 Broadway Property.
THE INFORMATION IN THIS STRUCTURAL AND COLLATERAL TERM SHEET IS NOT COMPLETE AND MAY BE AMENDED PRIOR TO THE TIME OF SALE. THIS TERM SHEET IS NOT AN OFFER TO SELL THESE SECURITIES AND IT IS NOT A SOLICITATION OF AN OFFER TO BUY THESE SECURITIES IN ANY JURISDICTION WHERE THE OFFER OR SALE IS NOT PERMITTED.
93
1633 Broadway New York, NY 10019 | Collateral Asset Summary – Loan No. 6 1633 Broadway | Cut-off Date Balance: Cut-off Date LTV: U/W NCF DSCR: U/W NOI Debt Yield: | $62,850,000 41.7% 3.84x 11.9% |
The 1633 Broadway Property features two theatres that comprise 5.7% of the total net rentable area and account for 1.2% of the underwritten rental revenue. The larger of the two theatres is the U. T. Associates of the Gershwin Theatre (“Gershwin Theatre”), which is notable for hosting Wicked since 2003. The Gershwin Theatre contains three, five-year renewal options that could potentially extend the term through May 2042. The 1633 Broadway Property contains an additional theatre, where Thespian Theatre, Inc. is the tenant, known as the Circle in the Square, which comprises approximately 800 seats and 34,570 SF and most recently hosted the show OKLAHOMA! The 1633 Broadway Property also houses the Circle in the Square Theatre School, the only accredited training conservatory associated with a Broadway theatre, which offers two, two-year training programs, in acting and musical theatre. Thespian Theatre, Inc. currently pays a total contract rent of $864,250, or $25.00 per SF through September 2021.
| Tenant Summary(1) | |||||||
| Tenant | Credit Rating (Fitch/Moody’s/S&P)(2) | Net Rentable Area (Sq. Ft.) (3) | % of Net Rentable Area | U/W Base Rent Per Sq. Ft. | % of Total U/W Base Rent | Lease Expiration | |
| Allianz(4) | AA- / Aa3 / AA | 320,911 | 12.5% | $82.66 | 15.7% | 1/31/2031 | |
| Morgan Stanley(5) | A / A3 / BBB+ | 260,829 | 10.2% | $71.61 | 11.1% | 3/31/2032 | |
| WMG Acquisition Corp(6) | NR / NR / NR | 293,888 | 11.5% | $59.62 | 10.4% | 7/31/2029 | |
| Showtime Networks Inc | BBB / Baa2 / BBB | 261,196 | 10.2% | $55.28 | 8.6% | 1/31/2026 | |
| Kasowitz Benson Torres(7) | NR / NR / NR | 203,394 | 7.9% | $68.00 | 8.2% | 3/31/2037 | |
| New Mountain Capital, LLC(8) | NR / NR / NR | 108,374 | 4.2% | $86.00 | 5.5% | 10/15/2035 | |
| Charter Communications Holding | NR / Ba2 / BB+ | 106,176 | 4.1% | $84.00 | 5.3% | 12/15/2025 | |
| MongoDB, Inc. | NR / NR / NR | 106,230 | 4.1% | $76.00 | 4.8% | 12/31/2029 | |
| Travel Leaders Group, LLC | NR / NR / B+ | 107,205 | 4.2% | $74.58 | 4.7% | 12/31/2033 | |
| Assured Guaranty Municipal | NR / NR / A | 103,838 | 4.1% | $69.88 | 4.3% | 2/28/2032 | |
| Ten Largest Tenants | 1,872,041 | 73.1% | $70.81 | 78.5% | |||
| Remaining Occupied | 649,710 | 25.4% | $55.74 | 21.5% | |||
| Total / Wtd. Avg. Occupied Collateral | 2,521,751 | 98.4% | $66.93 | 100.0% | |||
| Vacant | 39,761 | 1.6% | |||||
| Total | 2,561,512 | 100.0% | |||||
| (1) | Based on the underwritten rent roll dated October 31, 2019. |
| (2) | Certain ratings are those of the parent company whether or not the parent guarantees the lease. |
| (3) | Borrowers’ owned space. Does not include non-owned anchors or outparcels. |
| (4) | Allianz subleases 20,600 sq. ft. of suite 4600 (totaling 54,118 sq. ft.) to Triumph Hospitality at a base rent of $46.80 per sq. ft. through December 30, 2030. Triumph Hospitality further subleases 3,000 sq. ft. of suite 4600 to Stein Adler Dabah & Zelkowitz at a base rent of $41.33 per sq. ft. through July 31, 2022. U/W base rent is based on the contractual rent under the prime lease. |
| (5) | Morgan Stanley has the option to terminate its lease as to all or any portion (but not less than one full floor) of its space at any time after April 1, 2027, upon 18 months’ notice and payment of a termination fee. |
| (6) | WMG Acquisition Corp subleases 3,815 sq. ft. of suite 0400 (totaling 36,854 sq. ft.) to Cooper Investment Partners LLC at a base rent of $58.37 per sq. ft. on a month-to-month basis. U/W base rent is based on the contractual rent under the prime lease. |
| (7) | Kasowitz Benson Torres subleases a collective 32,487 sq. ft. of Suite 2200 (totaling 50,718 sq. ft.) to three tenants. Delcath Systems, Inc. subleases 6,877 sq. ft. and pays a rent of $68.50 per sq. ft. through February 28, 2021; Avalonbay Communities subleases 12,145 sq. ft. through October 31, 2026 and pays a current rent of $74.00 per sq. ft.; Cresa New York subleases 13,195 sq. ft. and pays a rent of $65.00 per sq. ft. through April 30, 2021. Kasowitz Benson Torres has the right to terminate all or any portion of one full floor of the premises located on the uppermost or lowermost floors (provided that the terminated space is in a commercially reasonable configuration), effective as of March 31, 2024, upon notice by March 31, 2023 and payment of a termination fee. U/W base rent is based on the contractual rent under the prime lease. |
| (8) | New Mountain Capital, LLC has executed a lease but has not yet taken occupancy or begun paying rent. We cannot assure you that they will take occupancy or begin paying rent as expected or at all. |
THE INFORMATION IN THIS STRUCTURAL AND COLLATERAL TERM SHEET IS NOT COMPLETE AND MAY BE AMENDED PRIOR TO THE TIME OF SALE. THIS TERM SHEET IS NOT AN OFFER TO SELL THESE SECURITIES AND IT IS NOT A SOLICITATION OF AN OFFER TO BUY THESE SECURITIES IN ANY JURISDICTION WHERE THE OFFER OR SALE IS NOT PERMITTED.
94
1633 Broadway New York, NY 10019 | Collateral Asset Summary – Loan No. 6 1633 Broadway | Cut-off Date Balance: Cut-off Date LTV: U/W NCF DSCR: U/W NOI Debt Yield: | $62,850,000 41.7% 3.84x 11.9% |
| Lease Rollover Schedule(1)(2)(3) | ||||||||
| Year | # of Leases Expiring | Total Expiring Sq. Ft. | % of Total Sq. Ft. Expiring | Cumulative Sq. Ft. Expiring | Cumulative % of Sq. Ft. Expiring | Annual U/W Base Rent Per Sq. Ft. | % U/W Base Rent Rolling | Cumulative % of U/W Base Rent |
| MTM | 10 | 9,482 | 0.4% | 9,482 | 0.4% | $67.30 | 0.4% | 0.4% |
| 2020 | 2 | 960 | 0.0% | 10,442 | 0.4% | $30.00 | 0.0% | 0.4% |
| 2021 | 2 | 34,570 | 1.3% | 45,012 | 1.8% | $25.00 | 0.5% | 0.9% |
| 2022 | 4 | 116,337 | 4.5% | 161,349 | 6.3% | $24.18 | 1.7% | 2.6% |
| 2023 | 2 | 38,550 | 1.5% | 199,899 | 7.8% | $33.72 | 0.8% | 3.3% |
| 2024 | 1 | 51,276 | 2.0% | 251,175 | 9.8% | $91.00 | 2.8% | 6.1% |
| 2025 | 1 | 106,176 | 4.1% | 357,351 | 14.0% | $84.00 | 5.3% | 11.4% |
| 2026 | 4 | 435,474 | 17.0% | 792,825 | 31.0% | $55.78 | 14.4% | 25.8% |
| 2027 | 2 | 55,247 | 2.2% | 848,072 | 33.1% | $82.98 | 2.7% | 28.5% |
| 2028 | 2 | 90,001 | 3.5% | 938,073 | 36.6% | $67.15 | 3.6% | 32.1% |
| 2029 | 3 | 399,717 | 15.6% | 1,337,790 | 52.2% | $63.99 | 15.2% | 47.2% |
| 2030 | 0 | 0 | 0.0% | 1,337,790 | 52.2% | $0.00 | 0.0% | 47.2% |
| 2031 & Thereafter | 10 | 1,183,961 | 46.2% | 2,521,751 | 98.4% | $75.21 | 52.8% | 100.0% |
| Vacant | NAP | 39,761 | 1.6% | 2,561,512 | 100.0% | NAP | NAP | NAP |
| Total / Wtd. Avg. | 43 | 2,561,512 | 100.0% | $66.93 | 100.0% | |||
| (1) | Based on the underwritten rent roll dated October 31, 2019. |
| (2) | Certain tenants may have lease termination or contraction options (which may become exercisable prior to the originally stated expiration date of the tenant lease) that are not considered in the above Lease Rollover Schedule. |
| (3) | Calculated based on approximate square footage occupied by the tenants. |
Environmental Matters. According to a Phase I environmental report, dated October 30, 2019, there are no recognized environmental conditions or recommendations for further action at the 1633 Broadway Property, other than the development and implementation of an asbestos operations and maintenance program.
The Market. The 1633 Broadway Property is located in the Times Square neighborhood of Midtown Manhattan, a commercial corridor that produces approximately 15% of New York City’s economic output. The neighborhood is bounded by 41st Street to the south and 52nd Street to the north between Avenue of the Americas and Eighth Avenue. The 1633 Broadway Property is located within one block of the 50th Street/Broadway, 50th Street and 49th Street subway stations, which serve the 1, 2, C, E, N, R and W lines.
According to the appraisal, the 1633 Broadway Property is located within the Westside office submarket of Midtown within the Manhattan market. Historically, the submarket has benefitted from the office space located around the boundaries of Central Park along major corridors such as West 57th Street, Broadway and Seventh Avenue, which consist primarily of Class A office product that take advantage of protected Central Park Views. The area’s proximity to these locations has assisted with the historically low vacancy and availability rates exhibited by this submarket since 2010. As of the third quarter of 2019, the Westside office submarket had an existing inventory of approximately 25.7 million sq. ft., a vacancy rate of 5.4% and an average asking rent of $66.21 per sq. ft. As of the third quarter of 2019, the Manhattan office market had an existing inventory of approximately 456.1 million sq. ft., a vacancy rate of 5.9% and an average asking rent of $79.25 per sq. ft.
THE INFORMATION IN THIS STRUCTURAL AND COLLATERAL TERM SHEET IS NOT COMPLETE AND MAY BE AMENDED PRIOR TO THE TIME OF SALE. THIS TERM SHEET IS NOT AN OFFER TO SELL THESE SECURITIES AND IT IS NOT A SOLICITATION OF AN OFFER TO BUY THESE SECURITIES IN ANY JURISDICTION WHERE THE OFFER OR SALE IS NOT PERMITTED.
95
1633 Broadway New York, NY 10019 | Collateral Asset Summary – Loan No. 6 1633 Broadway | Cut-off Date Balance: Cut-off Date LTV: U/W NCF DSCR: U/W NOI Debt Yield: | $62,850,000 41.7% 3.84x 11.9% |
The following table presents certain information relating to comparable office leases for the 1633 Broadway Property:
| Comparable Office Leases(1) | ||||||
| Property Name | Tenant Name | Lease Date | Tenant Leased Space | Lease Term (years) | Lease Type | Base Rent per Sq. Ft. |
| 1633 Broadway | Various | |||||
| 1155 Avenue of the Americas | BKD, LLC | September 2019 | 20,899 | 13.5 Yrs. | Modified Gross | $77.00 |
| 1 Rockefeller Plaza | Veteran Advisers, Inc. | September 2019 | 2,552 | 7.7 Yrs. | Modified Gross | $83.50 |
| 1675 Broadway | Davis & Gilbert LLP | August 2019 | 85,852 | 16.0 Yrs. | Modified Gross | $72.00 |
| 142 West 57th Street | Wedbush Securities Inc. | August 2019 | 15,626 | 10.8 Yrs. | Modified Gross | $65.00 |
| 1251 Avenue of the Americas | IHI Americas, Inc | July 2019 | 9,438 | 10.3 Yrs. | Modified Gross | $70.50 |
| 1345 Avenue of the Americas | Global Infrastructure Partners | June 2019 | 84,856 | 17.0 Yrs. | Modified Gross | $89.50 |
| 810 Seventh Avenue | Colonial Consulting LLC | May 2019 | 17,320 | 12.5 Yrs. | Modified Gross | $71.00 |
| 1271 Avenue of the Americas | Greenhill & Company | May 2019 | 77,622 | 15.3 Yrs. | Modified Gross | $91.00 |
| 1271 Avenue of the Americas | AIG - American International Group, Inc. | April 2019 | 320,237 | 16.5 Yrs. | Modified Gross | $97.13 |
| 1700 Broadway | Excel Sports Management, LLC | April 2019 | 17,078 | 7.6 Yrs. | Modified Gross | $79.00 |
| 1325 Avenue of the Americas | Dominus Capital, L.P. | March 2019 | 9,361 | 10.5 Yrs. | Modified Gross | $75.00 |
| 1290 Avenue of the Americas | Linklaters, LLP | March 2019 | 90,508 | 16.1 Yrs. | Modified Gross | $84.00 |
| 1177 Avenue of the Americas | Mill Point Capital | January 2019 | 11,644 | 10.5 Yrs. | Modified Gross | $87.00 |
| 1700 Broadway | M. Arthur Gensler, Jr. & Associates, Inc. | January 2019 | 13,237 | 9.9 Yrs. | Modified Gross | $71.00 |
| 114 West 47th Street | IFM Investments | October 2018 | 18,000 | 15.0 Yrs. | Modified Gross | $68.00 |
| (1) | Source: Appraisal. |
The following table presents certain information relating to the comparable retail leases for the 1633 Broadway Property:
| Comparable Retail Leases(1) | ||||||
| Property Name | Tenant Name | Lease Date | Tenant Leased Space | Lease Term (years) | Lease Type | Base Rent per Sq. Ft. |
| 1633 Broadway | Various | |||||
| 1740 Broadway | Sweetgreen | Q2 2019 | 2,706 | 10.6 Yrs. | Modified Gross | $215.00 |
| 1700 Broadway | Confidential Restaurant | Q1 2019 | 1,914 | 12.5 Yrs. | Modified Gross | $235.11 |
| 1290 Sixth Avenue | Just Salad | Q1 2019 | 1,795 | 10.0 Yrs. | Modified Gross | $255.00 |
| 1865 Broadway | Target | Q4 2018 | Grd. Fl. 1,546 LL 20,125 Sub LL 13,930 | 11.2 Yrs. | Modified Gross | $735.16 $100.00 $50.00 |
| 1619 Broadway | CVS | Q4 2018 | Grd. Fl. 4,299 LL 2,577 2nd Fl. 12,164 | 15.5 Yrs. | Modified Gross | $531.80 $75.00 |
| 129 West 52nd | Bulldozer Restaurant Group | Q4 2018 | 5,200 | 15.0 Yrs. | Modified Gross | $125.00 $150.00 |
| 120 West 55th | Quality Branded | Q4 2018 | Grd. Fl. 6,500 LL 2,500 | 10.0 Yrs. | Modified Gross | $175.00 $25.00 |
| 850 Eighth Avenue | Dunkin Donuts | Q2 2018 | Grd. Fl. 850 LL 250 | 10.0 Yrs. | Modified Gross | $411.18 $30.00 |
| 1674 Broadway | Flash Dancers | Q2 2018 | 1,800 | 10.0 Yrs. | Modified Gross | $375.00 |
| 1360 Avenue of the Americas | Bank of America | Q1 2018 | 1,346 | 10.0 Yrs. | Modified Gross | $350.00 |
| 1695 Broadway | Hen Penny Chicken | Q4 2017 | Grd. Fl. 1,250 LL 1,000 | 10.0 Yrs. | Modified Gross | $297.00 $25.00 |
| 787 Seventh Avenue | Citibank | Q3 2017 | 3,874 | 10.0 Yrs. | Modified Gross | $283.94 |
| (1) | Source: Appraisal. |
THE INFORMATION IN THIS STRUCTURAL AND COLLATERAL TERM SHEET IS NOT COMPLETE AND MAY BE AMENDED PRIOR TO THE TIME OF SALE. THIS TERM SHEET IS NOT AN OFFER TO SELL THESE SECURITIES AND IT IS NOT A SOLICITATION OF AN OFFER TO BUY THESE SECURITIES IN ANY JURISDICTION WHERE THE OFFER OR SALE IS NOT PERMITTED.
96
1633 Broadway New York, NY 10019 | Collateral Asset Summary – Loan No. 6 1633 Broadway | Cut-off Date Balance: Cut-off Date LTV: U/W NCF DSCR: U/W NOI Debt Yield: | $62,850,000 41.7% 3.84x 11.9% |
Cash Flow Analysis.
| Cash Flow Analysis(1) | |||||||
| 2016 | 2017 | 2018 | T-12 9/30/2019 | T-12 5/31/2020 | U/W | U/W PSF | |
| Base Rent(2) | $141,156,682 | $143,219,431 | $160,621,035 | $161,646,240 | $164,097,000 | $168,770,601 | $65.89 |
| Credit Tenant Rent Steps(3) | 0 | 0 | 0 | 0 | 0 | 7,558,579 | 2.95 |
| Potential Income from Vacant Space | 0 | 0 | 0 | 0 | 0 | 2,879,875 | 1.12 |
| Reimbursements | 9,150,315 | 11,228,307 | 13,952,510 | 16,874,074 | 17,589,000 | 15,267,588 | 5.96 |
| Gross Potential Rent | $150,306,997 | $154,447,738 | $174,573,545 | $178,520,314 | $181,686,000 | $194,476,643 | $75.92 |
| Other Income(4) | 5,692,549 | 5,017,065 | 4,645,691 | 4,240,034 | 2,761,000 | 4,279,853 | 1.67 |
| Concessions | 0 | 0 | 0 | 0 | 0 | 0 | 0.00 |
| Vacancy & Credit Loss | (309,756) | 0 | 0 | 0 | 0 | (8,170,549) | (3.19) |
| Effective Gross Income | $155,689,790 | $159,464,803 | $179,219,236 | $182,760,348 | $184,447,000 | $190,585,947 | $74.40 |
| Real Estate Taxes | 35,413,254 | 38,391,946 | 41,366,170 | 43,693,114 | 45,484,000 | 45,478,153 | 17.75 |
| Insurance | 1,061,417 | 908,564 | 1,009,544 | 1,082,131 | 1,170,000 | 1,069,190 | 0.42 |
| Management Fee | 2,507,162 | 2,981,306 | 3,149,432 | 3,287,347 | 3,413,000 | 1,000,000 | 0.39 |
| Total Other Expenses | 22,886,571 | 22,992,980 | 24,595,640 | 23,888,441 | 23,554,000 | 23,888,441 | 9.33 |
| Total Operating Expenses | $61,868,404 | $65,274,796 | $70,120,786 | $71,951,033 | $73,621,000 | $71,435,784 | $27.89 |
| Net Operating Income | $93,821,386 | $94,190,007 | $109,098,450 | $110,809,315 | $110,826,000 | $119,150,163 | $46.52 |
| TI/LC | 0 | 0 | 0 | 0 | 0 | 2,011,364 | 0.79 |
| Replacement Reserves | 0 | 0 | 0 | 0 | 0 | 461,072 | 0.18 |
| Net Cash Flow(5) | $93,821,386 | $94,190,007 | $109,098,450 | $110,809,315 | $110,826,000 | $116,677,727 | $45.55 |
| (1) | The historical cash flows have been adjusted to remove rent abatements (for 2016, $34,935,925; for 2017, $11,971,070; for 2018, $16,606,621; for T-12 09/30/2019, $16,408,451; and for T-12 05/31/2020 $15,228,000), bad debt, lease termination income, interest income, and other non-recurring items. |
| (2) | U/W Base Rent reflects annualized in-place rents as of October 31, 2019 ($167,497,806), with contractual rent steps through November 30, 2020 ($1,272,795). For avoidance of doubt, no COVID-19 specific adjustments have been incorporated in the lender U/W. |
| (3) | Reflects the net present value of contractual rent step increments over the lease term using a discount rate of 7.0% (for investment grade tenants). |
| (4) | Other Income consists of overage rent, storage income, parking income, lease termination income, tenant work order income and other miscellaneous income. |
| (5) | The increase in Net Cash Flow between 2017 and 2018 is largely due to new leases being signed. |
Property Management. The 1633 Broadway Property is currently managed by Paramount Group Property-Asset Management LLC, an affiliate of the borrowers.
Lockbox and Cash Management. The 1633 Broadway Whole Loan is structured with a hard lockbox and springing cash management. The borrowers are required to direct each tenant at the 1633 Broadway Property to deposit rents directly into a lender-controlled lockbox account. In addition, the borrowers are required to cause all cash revenues relating to the 1633 Broadway Property and all other money received by the borrowers or the property manager with respect to the 1633 Broadway Property (other than tenant security deposits) to be deposited into the lockbox account or a lender-controlled cash management account within one business day of receipt. On each business day during the continuance of a 1633 Broadway Trigger Period (as defined below) or an event of default under the 1633 Broadway Whole Loan, all amounts in the lockbox account are required to be remitted to the cash management account. On each business day that no 1633 Broadway Trigger Period or event of default under the 1633 Broadway Whole Loan is continuing, all funds in the lockbox account are required to be swept into a borrower-controlled operating account.
On each due date during the continuance of a 1633 Broadway Trigger Period or, at the lender’s discretion, during an event of default under the 1633 Broadway Whole Loan, all funds on deposit in the cash management account after payment of debt service, required reserves and budgeted operating expenses are required to be reserved as additional collateral for the 1633 Broadway Whole Loan.
A “1633 Broadway Trigger Period” means each period (i) commencing when the debt yield (as calculated under the 1633 Broadway Whole Loan documents), determined as of the last day of each of two consecutive fiscal quarters, is less than 5.75%, and concluding when the debt yield (as calculated under the 1633 Broadway Whole Loan documents), determined as of the last day of each of two consecutive fiscal quarters thereafter, is at least 5.75%, and (ii) commencing upon the borrowers’ failure to deliver annual, quarterly or monthly financial reports as and when required under the 1633 Broadway Whole Loan documents and concluding when such reports are delivered and indicate that no other 1633 Broadway Trigger Period is ongoing.
Provided no event of default under the 1633 Broadway Whole Loan documents is continuing, the borrowers have the right to avoid the commencement, or terminate the continuance, of a 1633 Broadway Trigger Period by delivering to the lender additional collateral in the form of a guaranty, letter of credit and/or cash that is reasonably acceptable to the lender and that would, when subtracted from the then-outstanding principal balance of the 1633 Broadway Whole Loan, result in a debt yield (as calculated under the 1633 Broadway Whole Loan documents) equal to or greater than 5.75%.
THE INFORMATION IN THIS STRUCTURAL AND COLLATERAL TERM SHEET IS NOT COMPLETE AND MAY BE AMENDED PRIOR TO THE TIME OF SALE. THIS TERM SHEET IS NOT AN OFFER TO SELL THESE SECURITIES AND IT IS NOT A SOLICITATION OF AN OFFER TO BUY THESE SECURITIES IN ANY JURISDICTION WHERE THE OFFER OR SALE IS NOT PERMITTED.
97
1633 Broadway New York, NY 10019 | Collateral Asset Summary – Loan No. 6 1633 Broadway | Cut-off Date Balance: Cut-off Date LTV: U/W NCF DSCR: U/W NOI Debt Yield: | $62,850,000 41.7% 3.84x 11.9% |
Initial and Ongoing Reserves. On the loan origination date, the borrowers provided a guaranty from Paramount Group Operating Partnership LP of up to $4,000,000 and funded a reserve of approximately $36,389,727 with respect to unfunded tenant improvements, tenant allowance and leasing commissions and free rent obligations consisting of (a) $24,105,228 for certain outstanding tenant improvements, (b) $804,393 for certain outstanding leasing commissions and (c) $15,480,107 for certain outstanding free rent. Subsequently, the borrowers substituted a letter of credit for the cash on reserve in such reserve account. The borrower has requested a reduction of the amount outstanding with regards to the letter of credit. The requested reduction amount is $15,248,699, which would reduce the letter of credit to $17,427,359.
On each due date during the continuance of a 1633 Broadway Trigger Period, the borrowers are required to fund (i) a tax and insurance reserve in an amount equal to 1/12 of the taxes and insurance premiums that the lender reasonably estimates will be payable during the next ensuing 12 months, unless in the case of insurance premiums, the borrowers are maintaining a blanket policy in accordance with the related 1633 Broadway Whole Loan documents; (ii) a tenant improvement and leasing commission reserve in an amount equal to $213,459.33 (capped at $5,123,024); and (iii) a capital expenditure reserve in an amount equal to $42,691.87 (capped at $1,024,604.80).
Current Mezzanine or Subordinate Secured Indebtedness. The 1633 Broadway Subordinate Companion Loan, with an aggregate outstanding principal balance as of the Cut-off Date of $249.0 million, accrues interest at a fixed rate of 2.99000% per annum. The 1633 Broadway Subordinate Companion Loan has a 120-month term and is interest only for the full term. For additional information, see “Description of the Mortgage Pool—The Whole Loans—The Non-Serviced AB Whole Loans—The 1633 Broadway Whole Loan” in the Preliminary Prospectus.
Future Mezzanine or Subordinate Indebtedness Permitted. On or after November 25, 2020, the owner of the direct or indirect equity interests of the borrowers are permitted to incur mezzanine debt (the “1633 Broadway Permitted Mezzanine Loan”) secured by a pledge of direct or indirect equity interests in the borrowers, provided that certain conditions set forth in the 1633 Broadway Whole Loan documents are satisfied, including, without limitation: (i) the loan-to-value ratio (as calculated under the 1633 Broadway Whole Loan documents and taking into account the mezzanine loan and the 1633 Broadway Whole Loan) is no greater than 52.08%, (ii) the debt service coverage ratio (as calculated under the 1633 Broadway Whole Loan documents and taking into account the mezzanine loan and the 1633 Broadway Whole Loan) is at least 3.08x, (iii) the debt yield (as calculated under the 1633 Broadway Whole Loan documents and taking into account the mezzanine loan and the 1633 Broadway Whole Loan) is at least 9.35%, (iv) the execution of a subordination and intercreditor agreement that is reasonably acceptable to the lender, and (v) receipt of a rating agency confirmation. The 1633 Broadway Permitted Mezzanine Loan may bear a floating rate of interest (subject to an interest rate cap agreement with a “reasonable strike price”), and may alternately take the form of debt-like preferred equity.
Partial Release. None.
THE INFORMATION IN THIS STRUCTURAL AND COLLATERAL TERM SHEET IS NOT COMPLETE AND MAY BE AMENDED PRIOR TO THE TIME OF SALE. THIS TERM SHEET IS NOT AN OFFER TO SELL THESE SECURITIES AND IT IS NOT A SOLICITATION OF AN OFFER TO BUY THESE SECURITIES IN ANY JURISDICTION WHERE THE OFFER OR SALE IS NOT PERMITTED.
98
(THIS PAGE INTENTIONALLY LEFT BLANK)
99
711 5th Avenue New York, NY 10022 | Collateral Asset Summary – Loan No. 7 711 Fifth Avenue | Cut-off Date Balance: Cut-off Date LTV: U/W NCF DSCR: U/W NOI Debt Yield: | $45,000,000 54.5% 2.90x 9.4% |
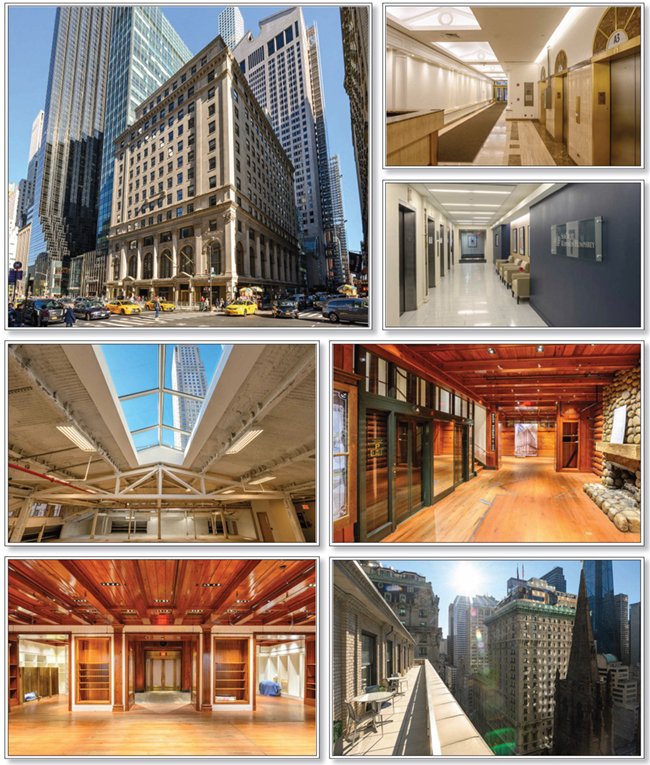
THE INFORMATION IN THIS STRUCTURAL AND COLLATERAL TERM SHEET IS NOT COMPLETE AND MAY BE AMENDED PRIOR TO THE TIME OF SALE. THIS TERM SHEET IS NOT AN OFFER TO SELL THESE SECURITIES AND IT IS NOT A SOLICITATION OF AN OFFER TO BUY THESE SECURITIES IN ANY JURISDICTION WHERE THE OFFER OR SALE IS NOT PERMITTED.
100
711 5th Avenue New York, NY 10022 | Collateral Asset Summary – Loan No. 7 711 Fifth Avenue | Cut-off Date Balance: Cut-off Date LTV: U/W NCF DSCR: U/W NOI Debt Yield: | $45,000,000 54.5% 2.90x 9.4% |

THE INFORMATION IN THIS STRUCTURAL AND COLLATERAL TERM SHEET IS NOT COMPLETE AND MAY BE AMENDED PRIOR TO THE TIME OF SALE. THIS TERM SHEET IS NOT AN OFFER TO SELL THESE SECURITIES AND IT IS NOT A SOLICITATION OF AN OFFER TO BUY THESE SECURITIES IN ANY JURISDICTION WHERE THE OFFER OR SALE IS NOT PERMITTED.
101
711 5th Avenue New York, NY 10022 | Collateral Asset Summary – Loan No. 7 711 Fifth Avenue | Cut-off Date Balance: Cut-off Date LTV: U/W NCF DSCR: U/W NOI Debt Yield: | $45,000,000 54.5% 2.90x 9.4% |

THE INFORMATION IN THIS STRUCTURAL AND COLLATERAL TERM SHEET IS NOT COMPLETE AND MAY BE AMENDED PRIOR TO THE TIME OF SALE. THIS TERM SHEET IS NOT AN OFFER TO SELL THESE SECURITIES AND IT IS NOT A SOLICITATION OF AN OFFER TO BUY THESE SECURITIES IN ANY JURISDICTION WHERE THE OFFER OR SALE IS NOT PERMITTED.
102
711 5th Avenue New York, NY 10022 | Collateral Asset Summary – Loan No. 7 711 Fifth Avenue | Cut-off Date Balance: Cut-off Date LTV: U/W NCF DSCR: U/W NOI Debt Yield: | $45,000,000 54.5% 2.90x 9.4% |
Mortgage Loan Information | |
| Loan Sellers(1): | GSMC |
| Loan Purpose: | Refinance |
| Borrower Sponsors: | Bayerische Versorgungskammer; Deutsche Finance America LLC; DF Deutsche Finance Holding AG; Hessen Lawyers Pension Fund |
| Borrower: | 711 Fifth Ave Principal Owner LLC |
| Original Balance(2): | $45,000,000 |
| Cut-off Date Balance(2): | $45,000,000 |
| % by Initial UPB: | 4.8% |
| Interest Rate: | 3.16000% |
| Payment Date: | 6th of each month |
| First Payment Date: | April 6, 2020 |
| Maturity Date: | March 6, 2030 |
| Amortization: | Interest Only |
| Additional Debt(2): | $500,000,000 Pari Passu Debt; Future Mezzanine Debt Permitted |
| Call Protection(3): | L(28), D(85), O(7) |
| Lockbox / Cash Management: | Hard / Springing |
| Reserves | |||
| Initial | Monthly | Cap | |
| Taxes: | $0 | Springing | NAP |
| Insurance: | $0 | Springing | NAP |
| Replacement: | $0 | Springing | $170,012 |
| TI/LC: | $0 | Springing | $1,020,072 |
| Other(4): | $3,048,024 | Springing | NAP |
Property Information | |
| Single Asset / Portfolio: | Single Asset |
| Property Type: | Mixed Use – Office/Retail |
| Collateral: | Fee Simple |
| Location: | New York, NY |
| Year Built / Renovated: | 1927 / 2013-2019 |
| Total Sq. Ft.: | 340,024 |
| Property Management: | SHVO Property Management LLC and Jones Lang LaSalle Americas, Inc. |
| Underwritten NOI: | $51,304,783 |
| Underwritten NCF: | $50,675,427 |
| Appraised Value: | $1,000,000,000 |
| Appraisal Date: | January 23, 2020 |
| Historical NOI | |
| Most Recent NOI: | $47,288,255 (T-12 March 31, 2020) |
| 2019 NOI: | $48,596,349 (December 31, 2019) |
| 2018 NOI: | $44,088,566 (December 31, 2018) |
| 2017 NOI: | $45,365,518 (December 31, 2017) |
| Historical Occupancy | |
| Most Recent Occupancy: | 76.5% (January 31, 2020) |
| 2019 Occupancy: | 66.9% (December 31, 2019) |
| 2018 Occupancy: | 67.4% (December 31, 2018) |
| 2017 Occupancy: | 73.7% (December 31, 2017) |
| Financial Information(1)(2) | ||||||
| Tranche | Cut-off Date Balance | Balance per Sq. Ft. Cut-off / Balloon | LTV Cut-off / Balloon | U/W DSCR NOI / NCF | U/W Debt Yield NOI / NCF | U/W Debt Yield at Balloon NOI / NCF |
| Mortgage Loan | $45,000,000 | |||||
| Pari Passu Notes | $500,000,000 | |||||
| Whole Loan | $545,000,000 | $1,603 / $1,603 | 54.5% / 54.5% | 2.94x / 2.90x | 9.4% / 9.3% | 9.4% / 9.3% |
| (1) | The 711 Fifth Avenue Whole Loan (as defined below) was co-originated by Goldman Sachs Bank USA (“GSBI”) and Bank of America, N.A. (“BANA”). |
| (2) | The Cut-off Date Balance of $45,000,000 represents the aggregate outstanding principal balance of the non-controlling notes A-1-8, A-1-9 and A-1-13, which are part of the 711 Fifth Avenue Whole Loan consisting of 21 senior pari passu promissory notes with an aggregate original principal balance of $545,000,000. |
| (3) | The defeasance lockout period, with respect to a defeasance of the 711 Fifth Avenue Whole Loan, will be at least 28 payment dates beginning with and including the first payment date of April 6, 2020. Defeasance of the 711 Fifth Avenue Whole Loan is permitted after the date that is the earlier of (i) two years from the closing date of the securitization that includes the last note to be securitized and (ii) March 6, 2023. Prepayment in whole, but not in part, of the 711 Fifth Avenue Whole Loan is permitted on or after the payment date in September 2029 without the payment of a yield maintenance premium (such period, the “Prepayment Period”). |
| (4) | Other Initial Reserves include a Temporary Certificate of Occupancy Reserve ($2,000,000) and an Unfunded Obligations Reserve ($1,048,024.18). See “Initial and Ongoing Reserves” herein. The 711 Fifth Avenue Borrower (as defined below) obtained a new temporary certificate of occupancy in April 2020, and the $2,000,000 has been disbursed to the 711 Fifth Avenue Borrower. |
THE INFORMATION IN THIS STRUCTURAL AND COLLATERAL TERM SHEET IS NOT COMPLETE AND MAY BE AMENDED PRIOR TO THE TIME OF SALE. THIS TERM SHEET IS NOT AN OFFER TO SELL THESE SECURITIES AND IT IS NOT A SOLICITATION OF AN OFFER TO BUY THESE SECURITIES IN ANY JURISDICTION WHERE THE OFFER OR SALE IS NOT PERMITTED.
103
711 5th Avenue New York, NY 10022 | Collateral Asset Summary – Loan No. 7 711 Fifth Avenue | Cut-off Date Balance: Cut-off Date LTV: U/W NCF DSCR: U/W NOI Debt Yield: | $45,000,000 54.5% 2.90x 9.4% |
The Loan. The 711 Fifth Avenue mortgage loan (the “711 Fifth Avenue Loan”) is part of a whole loan with an aggregate outstanding principal balance as of the Cut-off Date of $545,000,000 (the “711 Fifth Avenue Whole Loan”), which is secured by a first mortgage encumbering the 711 Fifth Avenue Borrower’s fee simple interest in an approximately 340,024 net rentable square foot office and retail building located in New York, New York (the “711 Fifth Avenue Property”). The 711 Fifth Avenue Whole Loan is comprised of 21 pari passu promissory notes, three of which, having an aggregate outstanding principal balance as of the Cut-off Date of $45,000,000, are being contributed to the Benchmark 2020-B18 trust and constitute the 711 Fifth Avenue Loan, and the remainder of which have been or are expected to be contributed to one or more other securitization trusts. The relationship between the holders of the promissory notes are governed by a co-lender agreement as described under “Description of the Mortgage Pool—The Whole Loans—The Serviced Pari Passu Whole Loans” in the Preliminary Prospectus.
The 711 Fifth Avenue Whole Loan was co-originated by GSBI and BANA on March 6, 2020. The 711 Fifth Avenue Whole Loan has an interest rate of 3.16000% per annum. The 711 Fifth Avenue Borrower utilized the proceeds of the 711 Fifth Avenue Whole Loan and the principal’s cash contribution to refinance existing debt on the 711 Fifth Avenue Property, fund reserves and pay origination costs.
The 711 Fifth Avenue Whole Loan has a 10-year term and will be interest-only for its entire term. The 711 Fifth Avenue Loan had an initial term of 120 months and has a remaining term of 116 months as of the Cut-off Date. The scheduled maturity date of the 711 Fifth Avenue Whole Loan is the due date in March 2030. Voluntary prepayment of the 711 Fifth Avenue Whole Loan in whole is prohibited prior to September 6, 2029, provided that the 711 Fifth Avenue Borrower may prepay (with yield maintenance) the 711 Fifth Avenue Whole Loan in part in connection with a DY Cure Event (as defined below) after the 711 Fifth Avenue Lockout Period (as defined below). At any time after the date that is the earlier of (i) two years from the closing date of the securitization that includes the last note to be securitized and (ii) March 6, 2023, (the “711 Fifth Avenue Lockout Period”), the 711 Fifth Avenue Whole Loan permits (a) defeasance in whole with direct, non-callable obligations of the United States of America and (b) solely to cure a debt yield trigger as described below under “Escrows and Reserves”, partial defeasance or partial prepayment (which prepayment must be accompanied by any applicable yield maintenance).
| Whole Loan Summary | ||||
| Note | Original Balance | Cut-off Date Balance | Note Holder | Controlling Piece |
| A-1-1, A-1-10 | $62,500,000 | $62,500,000 | GSMS 2020-GC47 | Yes |
| A-1-2, A-1-3, A-1-4, A-1-5, A-1-11, A-1-12, A-1-14, A-1-15, A-1-16, A-1-17 | 234,000,000 | 234,000,000 | GSBI(1) | No |
| A-1-8, A-1-9, A-1-13 | 45,000,000 | 45,000,000 | Benchmark 2020-B18 | No |
| A-1-6, A-1-7 | 40,000,000 | 40,000,000 | JPMDB 2020-COR7 | No |
| A-2-1, A-2-3, A-2-4 | 120,500,000 | 120,500,000 | BANA(1) | No |
| A-2-2 | 43,000,000 | 43,000,000 | BANK 2020-BNK27 | No |
| Total | $545,000,000 | $545,000,000 | ||
| (1) | Expected to be contributed to one or more future securitizations. |
Sources and Uses | ||||||
| Sources | Proceeds | % of Total | Uses | Proceeds | % of Total | |
| Whole Loan | $545,000,000 | 90.0% | Loan Payoff | $598,153,683 | 98.8% | |
| Principal’s New Cash Contribution | 60,294,721 | 10.0 | Closing Costs | 4,093,014 | 0.7 | |
| Upfront Reserves | 3,048,024 | 0.5 | ||||
| Total Sources | $605,294,721 | 100.0% | Total Uses | $605,294,721 | 100.0% | |
The Borrower / Borrower Sponsors. The borrower is 711 Fifth Ave Principal Owner LLC, a Delaware limited liability company (the “711 Fifth Avenue Borrower”). Legal counsel to the 711 Fifth Avenue Borrower delivered a non-consolidation opinion in connection with the origination of the 711 Fifth Avenue Whole Loan. There is no nonrecourse carve-out guarantor or separate environmental indemnitor with respect to the 711 Fifth Avenue Whole Loan.
As of the 711 Fifth Avenue Whole Loan origination date, the borrower sponsors are one or more of (a) Bayerische Versorgungskammer (“BVK”), (b) Deutsche Finance America LLC and/or DF Deutsche Finance Holding AG (together, “DFA”) and/or (c) Hessen Lawyers Pension Fund. These entities collectively have acquired five other assets located in major cities. BVK, a public-law pension group in Germany, managed 12 independent professional and municipal pension funds with a total of 2.3 million policyholders and pension recipients, €4.8 billion in annual contributions and reimbursement income, and approximately €3.4 billion in annual pension payments as of December 31, 2018. BVK managed a total investment volume of €77 billion by book value as of December 31, 2018. DFA, the American private equity arm of Deutsche Finance Group, was established in 2018 and has acquired 11 properties with a total capitalization of over $3.1 billion as of April 21, 2020. Hessen Lawyers Pension Fund is the pension fund for the German state of Hessen, with approximately €4.12 billion assets under management as of February 29, 2020.
The Property. The 711 Fifth Avenue Property is an 18-story, 340,024 square foot Class A mixed use building with an office component (levels four – 18; 286,226 square feet) and a retail component (levels B – three; 53,798 square feet) located in Midtown Manhattan on the corner of Fifth Avenue and East 55th Street. The 711 Fifth Avenue Property was originally constructed in 1927 and has undergone various capital improvements from 2013 through mid-2019. Major capital improvements include a sixth floor corridor upgrade, 14th floor
THE INFORMATION IN THIS STRUCTURAL AND COLLATERAL TERM SHEET IS NOT COMPLETE AND MAY BE AMENDED PRIOR TO THE TIME OF SALE. THIS TERM SHEET IS NOT AN OFFER TO SELL THESE SECURITIES AND IT IS NOT A SOLICITATION OF AN OFFER TO BUY THESE SECURITIES IN ANY JURISDICTION WHERE THE OFFER OR SALE IS NOT PERMITTED.
104
711 5th Avenue New York, NY 10022 | Collateral Asset Summary – Loan No. 7 711 Fifth Avenue | Cut-off Date Balance: Cut-off Date LTV: U/W NCF DSCR: U/W NOI Debt Yield: | $45,000,000 54.5% 2.90x 9.4% |
roof replacement, main roof replacement, fourth and ninth floor renovations, and elevator modernization. Based on the underwritten rent roll dated January 31, 2020, the 711 Fifth Avenue Property is currently 76.5% leased (based on net rentable area (“NRA”)), to a diverse tenant roster including banking (SunTrust Banks), fashion (Ralph Lauren Retail Inc. (“Ralph Lauren”)) and The Swatch Group Ltd. (“The Swatch Group”)), and luxury goods (Loro Piana USA), as well as finance (Allen & Company LLC).
Major Office Tenants (84.2% of NRA; 21.5% of underwritten base rent)
The Class A office space at the 711 Fifth Avenue Property is currently 72.3% occupied by five tenants that collectively contribute 21.5% of underwritten base rent (inclusive of storage rent derived from office tenants). 84,516 square foot of the office space (29.5% of Class A office NRA) at the 711 Fifth Avenue Property is leased to SunTrust Banks, which is an investment grade-rated office tenant.
SunTrust Banks (84,516 sq. ft.; 24.9% of NRA; 8.9% of U/W Base Rent) is the largest office tenant at the 711 Fifth Avenue Property. The tenant has occupied space in the 711 Fifth Avenue Property since 2004 and has expanded several times. The bank's primary businesses include deposits, lending, credit cards, and trust and investment services. Through its various subsidiaries, the bank provides corporate and investment banking, capital market services, mortgage banking, and wealth management.
Allen & Company LLC (70,972 sq. ft.; 20.9% of NRA; 7.4% of U/W Base Rent) is the second largest office tenant at the 711 Fifth Avenue Property. The tenant has occupied space in the 711 Fifth Avenue Property since 1985 and has expanded several times. The 711 Fifth Avenue Property serves as Allen & Company LLC’s headquarters. Allen & Company LLC is a privately held boutique investment bank, which specializes in real estate, technology, media and entertainment.
Loro Piana USA (24,388 sq. ft.; 7.2% of NRA; 2.6% of U/W Base Rent) is the third largest office tenant at the 711 Fifth Avenue Property. The tenant has occupied space in the 711 Fifth Avenue Property since 2005. Loro Piana USA is an Italian fabrics and clothing company specializing in high-end, luxury cashmere and wool products.
Major Retail Tenants (15.8% of NRA; 78.5% of underwritten base rent)
The 53,798 square feet of multi-level retail space at the 711 Fifth Avenue Property is currently anchored by Ralph Lauren (which has been dark but paying rent since April 2017) and The Swatch Group that collectively contribute 78.5% of underwritten base rent (inclusive of storage/restaurant rent derived from retail tenants).
Ralph Lauren (38,638 sq. ft.; 11.4% of NRA; 41.1% of U/W Base Rent) is the largest retail tenant at the 711 Fifth Avenue Property and is a wholly owned subsidiary of Ralph Lauren Corporation. The 711 Fifth Avenue Property served as Ralph Lauren’s former flagship location; however, its space is now dark and available for sublease. Ralph Lauren continues to operate the Polo Bar (7,436 square feet of the total Ralph Lauren 38,638 square feet) at this location, but the Polo Bar is temporarily closed.
The Swatch Group (14,274 sq. ft.; 4.2% of NRA; 37.3% of U/W Base Rent) is the second largest retail tenant at the 711 Fifth Avenue Property. The Swatch Group has occupied space in the 711 Fifth Avenue Property since 2011, and brands that are currently represented at the 711 Fifth Avenue Property include Omega and Jaquet Droz. The Swatch Group engages in the design, manufacture, and sale of finished watches, jewelry as well as watch movements and components. It operates through two segments including, watches and jewelry, and electronic systems. The watches and jewelry segment designs, produces, and markets watches and jewelry. The electronic systems segment develops, manufactures, and sells electronic components and sports timing activities.
COVID-19 Update. As of July 8, 2020, the 711 Fifth Avenue Property is open; however, all retail tenants are closed and most, if not all, office tenants are working remotely. One retail tenant, representing approximately 37% of the underwritten base rent, executed a rent deferral agreement as of May 18, 2020 with the 711 Fifth Avenue Borrower that provides for a 50% rent abatement for April, May and June 2020, with abated rent being required to be repaid as follows: 50% of the abated total amount to be repaid by the end of 2020 and the remaining 50% to be repaid by the end of March 2021. On May 26, 2020, the 711 Fifth Avenue Borrower executed a modification of the 711 Fifth Avenue Whole Loan documents to (a) provide that the lender will release any funds that are deposited with the lender to cure a DY Cure Event once the debt yield test is satisfied for 2 consecutive quarters and (b) update the organizational chart of the 711 Fifth Avenue Borrower. The borrower sponsor is discussing rent relief with Ralph Lauren for the Polo Bar space (7,436 of 38,638 square feet attributable to Ralph Lauren and 1.4% of underwritten base rent attributable to Ralph Lauren) which is temporarily closed. The Ralph Lauren modification is expected to provide (but the final terms may not provide for), among other things, (a) a rent abatement for May 2020 rent in the amount of $250,000 and (b) a deferral of rent for May 2020 and June 2020 in the amount of $250,000 for each month, which must be repaid no later than December 31, 2020. All of the tenants have paid their June 2020 rent (which includes one tenant, representing 4.2% of the square footage and 37.3% of underwritten base rent of the 711 Fifth Avenue Property who paid their rent in accordance with an agreement to pay 50% abated rent for the month of June 2020 and one tenant, representing 11.4% of the square footage and 41.1% of the underwritten base rent of the 711 Fifth Avenue property who is in the process of executing an agreement with the borrower sponsor) which represents approximately 76.8% of the underwritten June base rent. The 711 Fifth Avenue Whole Loan is current through the July 6, 2020 payment date.
THE INFORMATION IN THIS STRUCTURAL AND COLLATERAL TERM SHEET IS NOT COMPLETE AND MAY BE AMENDED PRIOR TO THE TIME OF SALE. THIS TERM SHEET IS NOT AN OFFER TO SELL THESE SECURITIES AND IT IS NOT A SOLICITATION OF AN OFFER TO BUY THESE SECURITIES IN ANY JURISDICTION WHERE THE OFFER OR SALE IS NOT PERMITTED.
105
711 5th Avenue New York, NY 10022 | Collateral Asset Summary – Loan No. 7 711 Fifth Avenue | Cut-off Date Balance: Cut-off Date LTV: U/W NCF DSCR: U/W NOI Debt Yield: | $45,000,000 54.5% 2.90x 9.4% |
Tenant Summary(1) | |||||||
| Tenant | Ratings (Fitch/Moody’s/S&P)(2) | Net Rentable Area (Sq. Ft.) | % of Net Rentable Area | U/W Base Rent Per Sq. Ft.(3) | % of Total U/W Base Rent(3) | Lease Expiration | |
| SunTrust Banks | A+ / A3 / NR | 84,516 | 24.9% | $70.09 | 8.9% | 4/30/2024 | |
| Allen & Company | NR / NR / NR | 70,972 | 20.9 | $69.73 | 7.4% | 9/30/2033 | |
| Ralph Lauren (4) | NR / A2 / A- | 38,638 | 11.4 | $712.36 | 41.1% | 6/30/2029 | |
| Loro Piana USA | NR / NR / NR | 24,388 | 7.2 | $71.38 | 2.6% | 8/31/2025 | |
| Sandler Capital | NR / NR / NR | 17,200 | 5.1 | $80.17 | 2.1% | 6/30/2027 | |
| The Swatch Group | NR / NR / NR | 14,274 | 4.2 | $1,749.81 | 37.3% | 12/31/2029 | |
| Catalyst Investors | NR / NR / NR | 6,034 | 1.8 | $67.00 | 0.6% | 11/30/2023 | |
| Largest Owned Tenants | 256,022 | 75.3% | $261.29 | 100.0% | |||
| Remaining Occupied(5) | 3,935 | 1.2 | |||||
| Vacant | 80,067 | 23.5 | |||||
| Total | 340,024 | 100.0% | |||||
| (1) | Calculated based on the approximate square footage occupied by each tenant. |
| (2) | Certain ratings are those of the parent entity whether or not the parent entity guarantees the lease. |
| (3) | U/W Base Rent PSF and % of Total U/W Base Rent are based on the underwritten rent roll dated January 31, 2020 which includes contractual rent steps through January 2021. |
| (4) | Currently, the Ralph Lauren spaces totaling 38,638 sq. ft. are now dark and available for sublease. The tenant continues to operate the Polo Bar space of 7,436 sq. ft. at the 711 Fifth Avenue Property, but the Polo Bar is temporarily closed. |
| (5) | Includes non-revenue spaces of 2,330 square feet attributable to the property management office, 1,042 square feet attributable to the building security office and 563 square feet attributable to the porter locker room. |
| Lease Rollover Schedule(1)(2) | ||||||||
| Year | # of Leases Expiring | Total Expiring Sq. Ft. | % of Total Sq. Ft. Expiring | Cumulative Sq. Ft. Expiring | Cumulative % of Sq. Ft. Expiring | Annual U/W Per Sq. Ft.(3) | % U/W Rolling(3) | Cumulative % of U/W Base Rent(3) |
| MTM | 0 | 0 | 0.0% | 0 | 0.0% | $0.00 | 0.0% | 0.0% |
| 2020 | 0 | 0 | 0.0% | 0 | 0.0% | $0.00 | 0.0% | 0.0% |
| 2021 | 0 | 0 | 0.0% | 0 | 0.0% | $0.00 | 0.0% | 0.0% |
| 2022 | 0 | 0 | 0.0% | 0 | 0.0% | $0.00 | 0.0% | 0.0% |
| 2023 | 1 | 6,034 | 1.8% | 6,034 | 1.8% | $67.00 | 0.6% | 0.6% |
| 2024 | 6 | 84,516 | 24.9% | 90,550 | 26.6% | $70.09 | 8.9% | 9.5% |
| 2025 | 2 | 24,388 | 7.2% | 114,938 | 33.8% | $71.38 | 2.6% | 12.1% |
| 2026 | 0 | 0 | 0.0% | 114,938 | 33.8% | $0.00 | 0.0% | 12.1% |
| 2027 | 1 | 17,200 | 5.1% | 132,138 | 38.9% | $80.17 | 2.1% | 14.1% |
| 2028 | 0 | 0 | 0.0% | 132,138 | 38.9% | $0.00 | 0.0% | 14.1% |
| 2029 | 12 | 52,912 | 15.6% | 185,050 | 54.4% | $992.23 | 78.5% | 92.6% |
| 2030 | 0 | 0 | 0.0% | 185,050 | 54.4% | $0.00 | 0.0% | 92.6% |
| 2031 & Thereafter | 8 | 74,907 | 22.0% | 259,957 | 76.5% | $66.06 | 7.4% | 100.0% |
| Vacant | NAP | 80,067 | 23.5% | 340,024 | 100.0% | NAP | NAP | NAP |
| Total / Wtd. Avg.(4) | 30 | 340,024 | 100.0% | $261.29 | 100.0% | |||
| (1) | Calculated based on the approximate square footage occupied by each collateral tenant. |
| (2) | Certain tenants may have termination or contraction options (which may become exercisable prior to the originally stated expiration date of the tenant lease) that are not considered in the above Lease Rollover Schedule. |
| (3) | Annual U/W Base Rent PSF, % U/W Base Rent Rolling, and Cumulative % of U/W Base Rent includes contractual rent steps through January 2021. |
| (4) | Includes non-revenue spaces of 2,330 sq. ft. attributable to the property management office, 1,042 sq. ft. attributable to the building security office and 563 sq. ft. attributable to the porter locker room. |
Environmental Matters. According to a Phase I environmental report, dated February 3, 2020, there are no recognized environmental conditions or recommendations for further action at the 711 Fifth Avenue Property.
The Market. According to the appraisal, the 711 Fifth Avenue Property is located in the Midtown and the Upper Fifth Avenue retail submarket. The Plaza District office submarket is bounded by 65th Street to the north, the East River to the east, 47th Street to the south, and Avenue of the Americas to the west. The Plaza District is proximate to Central Park and has access to shopping along Fifth and Madison Avenues. The Plaza District office submarket is home to numerous national and multinational corporations and is dominated by financial (with hedge funds clustered along Madison Avenue) and legal tenants, with some media and fashion firms. According to the appraisal, as of the fourth quarter of 2019, the Plaza District office submarket has an inventory of 26.7 million SF with a vacancy rate of 8.7% and an average asking rent of $114.07 per sq. ft. The Upper Fifth Avenue retail submarket is located between 42nd and 57th Streets, and this portion of Fifth Avenue is the most expensive area for retail space rents in Manhattan. The Upper Fifth Avenue retail submarket has historically drawn international travelers and occupants of nearby luxury hotels and condos. According to the appraisal, as of the fourth quarter of 2019, the Upper Fifth Avenue retail submarket has an average asking rent of $1,775.00 per sq. ft., with an availability rate of 24.3%.
THE INFORMATION IN THIS STRUCTURAL AND COLLATERAL TERM SHEET IS NOT COMPLETE AND MAY BE AMENDED PRIOR TO THE TIME OF SALE. THIS TERM SHEET IS NOT AN OFFER TO SELL THESE SECURITIES AND IT IS NOT A SOLICITATION OF AN OFFER TO BUY THESE SECURITIES IN ANY JURISDICTION WHERE THE OFFER OR SALE IS NOT PERMITTED.
106
711 5th Avenue New York, NY 10022 | Collateral Asset Summary – Loan No. 7 711 Fifth Avenue | Cut-off Date Balance: Cut-off Date LTV: U/W NCF DSCR: U/W NOI Debt Yield: | $45,000,000 54.5% 2.90x 9.4% |
| Comparable Office Leases(1) | |||||||
| Property Name / Location | Year Built | Stories | Tenant Name | Tenant Leased Space | Lease Date | Lease Term (years) | Base Rent Per Sq. Ft. |
711 Fifth Avenue(2) New York, NY | 1927 | 18 | SunTrust Banks | 22,832 | Mar-16 | 8.2 | $75.50 |
623 Fifth Avenue New York, NY | 1989 | 36 | NWI Management | 8,400 | Nov-19 | 3.3 | $80.00 |
510 Madison Avenue New York, NY | 2009/2012 | 30 | Castlelake, L.P. | 6,903 | Nov-19 | 7.3 | $124.00 |
745 Fifth Avenue New York, NY | 1929/1989 | 35 | Fremont Macanta | 7,067 | Jun-19 | 6.8 | $103.00 |
640 Fifth Avenue New York, NY | 1940/2003 | 31 | Hamlin Capital Management | 23,616 | Mar-19 | 10.0 | $75.17 |
640 Fifth Avenue New York, NY | 1940/2003 | 31 | Avolon Aerospace | 10,295 | Jan-19 | 10.0 | $92.99 |
645 Madison Avenue New York, NY | 1971/2005 | 22 | Rothman Orthopaedic Institute | 21,461 | Jan-19 | 10.9 | $88.00 |
725 Fifth Avenue New York, NY | 1983 | 58 | S.S. Steiner, Inc. | 6,875 | Jan-19 | 7.5 | $82.00 |
510 Madison Avenue New York, NY | 2009/2012 | 30 | Christian Dior, Inc. and Christian Dior Perfumes, LLC | 70,055 | Jan-19 | 5.0 | $74.50 |
712 Fifth Avenue New York, NY | 1990 | 52 | Wargo & Co. | 2,074 | Oct-18 | 7.7 | $105.00 |
725 Fifth Avenue New York, NY | 1983 | 58 | Marc Fisher | 9,924 | Jul-18 | 10.0 | $89.00 |
640 Fifth Avenue New York, NY | 1940/2003 | 31 | Klein Group | 9,458 | Jul-18 | 10.0 | $92.00 |
535 Madison Avenue New York, NY | 1982 | 37 | Walker & Dunlop, LLC | 5,450 | Jul-18 | 3.0 | $80.00 |
535 Madison Avenue New York, NY | 1982 | 37 | Melvin Capital | 14,765 | May-18 | 10.6 | $104.00 |
| (1) | Source: Appraisal. |
| (2) | Based on underwritten rent roll as of January 31, 2020. |
| Comparable Retail Leases(1) | |||||
| Property Name / Location | Tenant Name | Tenant Leased Space | Lease Date | Lease Term (years) | Base Rent Per Sq. Ft. |
711 Fifth Avenue(2) New York, NY | The Swatch Group | 14,274 | May-11 | 18.7 | $1,749.81 |
767 Fifth Avenue New York, NY | Christian Dior | 11,847 | Apr-19 | 4.0 | $666.84 |
730 Fifth Avenue New York, NY | Mikimoto | 4,505 | Feb-19 | 10.0 | $1,109.88 |
760 Madison Avenue New York, NY | Giorgio Armani | 19,780 | Jan-19 | 15.0 | $1,066.23 |
706 Madison Avenue New York, NY | Hermès | 47,000 | Jan-19 | 10.0 | $329.79 |
609 Fifth Avenue New York, NY | Puma | 23,917 | Feb-18 | 16.0 | $372.12 |
650 Fifth Avenue New York, NY | Nike | 69,214 | Mar-17 | 15.5 | $479.53 |
640 Fifth Avenue New York, NY | Dyson | 3,097 | Mar-17 | 10.0 | $2,660.64 |
640 Fifth Avenue New York, NY | Victoria's Secret | 63,779 | Apr-16 | 16.0 | $516.90 |
645 Fifth Avenue New York, NY | Longchamp | 2,000 | Feb-16 | 10.0 | $2,850.00 |
767 Fifth Avenue New York, NY | Under Armour | 53,500 | Feb-16 | 15.0 | $560.75 |
685 Fifth Avenue New York, NY | Stuart Weitzman | 3,481 | Feb-16 | 15.0 | $1,436.37 |
685 Fifth Avenue New York, NY | Coach | 24,541 | Jan-16 | 15.0 | $814.96 |
| (1) | Source: Appraisal. |
| (2) | Based on underwritten rent roll as of January 31, 2020. |
THE INFORMATION IN THIS STRUCTURAL AND COLLATERAL TERM SHEET IS NOT COMPLETE AND MAY BE AMENDED PRIOR TO THE TIME OF SALE. THIS TERM SHEET IS NOT AN OFFER TO SELL THESE SECURITIES AND IT IS NOT A SOLICITATION OF AN OFFER TO BUY THESE SECURITIES IN ANY JURISDICTION WHERE THE OFFER OR SALE IS NOT PERMITTED.
107
711 5th Avenue New York, NY 10022 | Collateral Asset Summary – Loan No. 7 711 Fifth Avenue | Cut-off Date Balance: Cut-off Date LTV: U/W NCF DSCR: U/W NOI Debt Yield: | $45,000,000 54.5% 2.90x 9.4% |
Cash Flow Analysis.
| Cash Flow Analysis(1) | ||||||||
| 2016 | 2017 | 2018 | 2019 | T-12 3/31/2020 | U/W | U/W PSF | ||
| Base Rent | $50,709,002 | $59,133,963 | $58,947,171 | $64,979,130 | $64,530,557 | $66,896,764 | $196.74 | |
| Contractual Rent Steps(2) | 0 | 0 | 0 | 0 | 0 | 1,962,475 | 5.77 | |
| Vacant Income | 0 | 0 | 0 | 0 | 0 | 7,680,090 | 22.59 | |
| Reimbursements | 1,826,845 | 3,069,898 | 3,727,298 | 4,194,777 | 4,145,942 | 4,962,830 | 14.60 | |
| Vacancy & Credit Loss(3) | 0 | 0 | 0 | 0 | 0 | (7,680,090) | (22.59) | |
| Other Income | 307,215 | 519,693 | 364,227 | 389,683 | 383,754 | 371,484 | 1.09 | |
| Effective Gross Income | $52,843,062 | $62,723,555 | $63,038,695 | $69,563,590 | $69,060,254 | $74,193,553 | $218.20 | |
| Total Operating Expenses | 14,954,656 | 17,358,037 | 18,950,129 | 20,967,241 | 21,771,999 | 22,888,769 | 67.32 | |
| Net Operating Income | $37,888,406 | $45,365,518 | $44,088,566 | $48,596,349 | $47,288,255 | $51,304,783 | $150.89 | |
| TI/LC | 0 | 0 | 0 | 0 | 0 | 544,350 | 1.60 | |
| Capital Expenditures | 0 | 0 | 0 | 0 | 0 | 85,006 | 0.25 | |
| Net Cash Flow | $37,888,406 | $45,365,518 | $44,088,566 | $48,596,349 | $47,288,255 | $50,675,427 | $149.03 | |
| (1) | Certain items such as straight line rent, interest expense, interest income, lease cancellation income, depreciation, amortization, debt service payments and any other non-recurring or non-operating items were excluded from the historical presentation and are not considered for the underwritten cash flow. |
| (2) | Contractual Rent Steps include $1,962,475 underwritten for various tenants through January 31, 2021. |
| (3) | Underwritten Vacancy & Credit Loss represents an underwritten economic vacancy of 9.4%. |
Lockbox/Cash Management. The 711 Fifth Avenue Whole Loan is structured with a hard lockbox and springing cash management. The 711 Fifth Avenue Borrower is required to direct all existing and future tenants of the 711 Fifth Avenue Property to directly deposit all rents into a clearing account controlled by the lender. Provided no 711 Fifth Avenue Trigger Period (as defined below) exists, the funds in the clearing account are required to be swept on a daily basis into a borrower operating account. During the continuance of a 711 Fifth Avenue Trigger Period (or an event of default at the lender’s election), the funds in the clearing account are required to be swept on a daily basis into a cash management account controlled by the lender and all amounts on deposit in the cash management account after payment of the monthly debt service, required reserves and budgeted operating expenses are required to be held as additional security for the 711 Fifth Avenue Whole Loan during the continuance of such 711 Fifth Avenue Trigger Period, except that if there exists no event of default and the only 711 Fifth Avenue Trigger Period then in existence is a Tenant Rollover Sweep (as defined below) and the applicable Tenant Rollover Sweep Equity Amount (as defined below) was deposited with the lender as required under the 711 Fifth Avenue Whole Loan documents, then all excess cash flow that would have been reserved is required to be released to the 711 Fifth Avenue Borrower.
A “711 Fifth Avenue Trigger Period” means each period that commences upon the first to occur of: (a) debt yield, determined as of the first day of any fiscal quarter, is less than 7.0%, until the occurrence of a DY Cure Event (and if financial reports are not delivered to the lender as and when required under the 711 Fifth Avenue Whole Loan documents, a 711 Fifth Avenue Trigger Period will be deemed to have commenced and be ongoing, unless and until such reports are delivered and they indicate that, in fact, no 711 Fifth Avenue Trigger Period is ongoing); (b) there exists an event of default under any mezzanine loan until cured; (c) any major tenant leasing space that is rated investment grade is downgraded below investment grade (as determined by S&P or Moody’s), until the occurrence of a Downgraded Tenant Sweep Cure, and (d) any major tenant that (i) terminates its lease, (ii) “goes dark”, unless such applicable lease is and continues to be guaranteed by an entity rated investment grade (as determined by S&P or Moody’s), (iii) vacates or provides indication of its intent to vacate all of its leased space (or any portion thereof), or (iv) fails to provide written notice to the 711 Fifth Avenue Borrower of its intent to renew its applicable lease 36 months prior to its then current lease expiration date, until the occurrence of a Tenant Rollover Sweep Cure (as defined below).
A “DY Cure Event” means (a) no event of default is continuing and (b) the achievement of a debt yield, determined as of the first day of each of two consecutive fiscal quarters thereafter, equal to or greater than 7.0% (which (i) after the 711 Fifth Avenue Lockout Period, debt yield test may be satisfied, at the 711 Fifth Avenue Borrower’s sole discretion, by either (x) making voluntary prepayments or (y) effectuating a partial defeasance, in amounts necessary to achieve the required debt yield or (ii) the debt yield test may be satisfied, at the 711 Fifth Avenue Borrower’s sole discretion, by depositing in a reserve account, as additional collateral, cash or a letter of credit in an amount that when subtracted from the principal indebtedness for purposes of calculating debt yield would result in a debt yield that equals or exceeds 7.0% (provided that the aggregate notional amount of all outstanding letters of credit delivered may at no time exceed 10.0% of the principal indebtedness).
Additionally, provided no event of default under the 711 Fifth Avenue Whole Loan is continuing, the 711 Fifth Avenue Borrower has the right at any time from and after the expiration of the 711 Fifth Avenue Lockout Period (a) solely to effect a DY Cure Event to partially defease (with no corresponding release of collateral) and (b) to totally defease, the 711 Fifth Avenue Whole Loan in the amount necessary to either cause the achievement of a DY Cure Event as determined by the lender in its reasonable discretion or defease the 711 Fifth Avenue Whole Loan in whole, subject to the satisfaction of certain conditions, including, among others, delivery of defeasance collateral in an amount sufficient to make all payments of interest and principal due under the defeased note until the first due date in the prepayment period, a REMIC opinion and a rating agency confirmation.
THE INFORMATION IN THIS STRUCTURAL AND COLLATERAL TERM SHEET IS NOT COMPLETE AND MAY BE AMENDED PRIOR TO THE TIME OF SALE. THIS TERM SHEET IS NOT AN OFFER TO SELL THESE SECURITIES AND IT IS NOT A SOLICITATION OF AN OFFER TO BUY THESE SECURITIES IN ANY JURISDICTION WHERE THE OFFER OR SALE IS NOT PERMITTED.
108
711 5th Avenue New York, NY 10022 | Collateral Asset Summary – Loan No. 7 711 Fifth Avenue | Cut-off Date Balance: Cut-off Date LTV: U/W NCF DSCR: U/W NOI Debt Yield: | $45,000,000 54.5% 2.90x 9.4% |
Initial and Ongoing Reserves. At origination, the 711 Fifth Avenue Borrower funded (a) approximately $1,048,024 for outstanding free rent (including any rent credits) and (b) $2,000,000 for estimated costs in connection with obtaining a new temporary or permanent certificate of occupancy to replace the temporary certificate of occupancy that expired in November 2019. The 711 Fifth Avenue Borrower obtained a temporary certificate of occupancy that was effective as of March 24, 2020, and the $2,000,000 has been disbursed to the 711 Fifth Avenue Borrower. On each due date during the continuance of a 711 Fifth Avenue Trigger Period (as defined below), the 711 Fifth Avenue Borrower will be required to fund (i) a tax and insurance reserve in an amount equal to 1/12 of the property taxes and insurance premiums that the lender reasonably estimates will be payable during the next ensuing 12 months; provided that reserves for insurance premiums will be waived if the 711 Fifth Avenue Property is covered by an acceptable blanket insurance policy; (ii) a capital expenditure reserve in an amount equal to approximately $7,084 capped at an amount equal to the lender’s good faith estimate of capital expenses to be performed during the next two years; (iii) a tenant improvements and leasing commissions reserve in an amount equal to $42,503 capped at an amount equal to the greater of (x) the lender’s good faith estimate of all leasing commissions and tenant improvements to be performed during the next two years and (y) the aggregate amount of all outstanding leasing commissions and tenant improvements under leases then in effect.
Additionally, during the continuance of a Tenant Rollover Sweep (as defined below), all excess cash (and any other amounts sufficient to result in a reserve amount for such month of at least $2,500,000) after payment of applicable debt service, budgeted operating expenses and other required reserves are required to be reserved in a tenant rollover reserve, or to avoid such sweep, 711 Fifth Avenue Borrower may deposit with the lender an amount equal to the greater of (x) $7,500,000 and (y) all excess cash flow estimated by the lender in its good faith that would have been deposited in such reserve account for the three-month period following the deposit of such funds (the “Tenant Rollover Sweep Equity Amount”). Additionally, during the continuance of a Downgraded Tenant Sweep (as defined below) (if no deposits are required to be deposited into the tenant rollover reserve), all excess cash (capped at 18 months’ worth of rent payments by the downgraded tenant (as such amount may be reduced per the 711 Fifth Avenue Whole Loan documents) after payment of applicable debt service, budgeted operating expenses and other required reserves is required to be reserved in a tenant downgrade reserve.
A “Downgraded Tenant Sweep” will be continuing upon any tenant under a Major Lease (as defined below) (or with regard to Ralph Lauren, its highest rated parent entity, as applicable) that is rated investment grade is downgraded below investment grade (as determined by S&P or Moody’s), until (a) the downgraded tenant is once more rated investment grade (as determined by S&P or Moody’s), (b) such space is relet in accordance with the 711 Fifth Avenue Whole Loan documents, or (c) an amount sufficient to pay unabated rent for 18 consecutive months then due under the applicable downgraded tenant’s lease (subject to reduction in accordance with the 711 Fifth Avenue Whole Loan documents) has been deposited in the downgraded tenant reserve (the occurrence of (a), (b) or (c) above, a “Downgraded Tenant Sweep Cure”).
A “Major Lease” means any of the leases with Ralph Lauren, The Swatch Group and any lease that when aggregated with all other leases at the 711 Fifth Avenue Property with the same or an affiliated tenant (assuming the exercise of all expansion rights and all preferential rights to lease additional space), is expected to demise more than 30% of the rentable square footage or account for 20% or more of the total rental income. Additionally, any lease with any purchase option, with a 711 Fifth Avenue Borrower affiliate or entered into during an event of default will also be considered a Major Lease.
A “Tenant Rollover Sweep” will exist if any tenant under a Major Lease (i) terminates their lease, (ii) goes “dark” (other than (a) Ralph Lauren if it has an investment grade rating or (b) is guaranteed by an entity rated investment grade (as determined by S&P or Moody’s)), (iii) vacates or provides indication of their intent to vacate all or any portion of their leased space or (iv) fails to provide written notice of their intent to renew such lease on the date that is 36 months prior to its then current lease expiration date.
A “Tenant Rollover Sweep Cure” means, as applicable, (a) a tenant under a Major Lease renews its lease or enters into a new lease on substantially the same terms and conditions, is no longer “dark” or moves back into its space or revokes any prior notice of intent to vacate or (b) such space is relet in accordance with the terms of the 711 Fifth Avenue Whole Loan documents.
THE INFORMATION IN THIS STRUCTURAL AND COLLATERAL TERM SHEET IS NOT COMPLETE AND MAY BE AMENDED PRIOR TO THE TIME OF SALE. THIS TERM SHEET IS NOT AN OFFER TO SELL THESE SECURITIES AND IT IS NOT A SOLICITATION OF AN OFFER TO BUY THESE SECURITIES IN ANY JURISDICTION WHERE THE OFFER OR SALE IS NOT PERMITTED.
109
711 5th Avenue New York, NY 10022 | Collateral Asset Summary – Loan No. 7 711 Fifth Avenue | Cut-off Date Balance: Cut-off Date LTV: U/W NCF DSCR: U/W NOI Debt Yield: | $45,000,000 54.5% 2.90x 9.4% |
Property Management. The 711 Fifth Avenue Property is currently managed by SHVO Property Management LLC (an affiliate of the Sponsors) (“Shvo”), pursuant to a management agreement and sub-managed by Jones Lang Lasalle (“JLL”) pursuant to a sub-management agreement. Under the 711 Fifth Avenue Loan documents, the 711 Fifth Avenue Property is required to be managed by Shvo and sub-managed by JLL, respectively, or any other management or sub-management company, as applicable, approved by the lender and with respect to which a rating agency confirmation has been received. The lender has the right to replace, or require the 711 Fifth Avenue Borrower to replace, each of the property manager and the sub-property manager with a property manager or sub-property manager, as applicable, selected by the 711 Fifth Avenue Borrower (or selected by the lender in the event of an event of default under the 711 Fifth Avenue Loan) during the continuance of an event of default under the 711 Fifth Avenue Loan, (ii) following any foreclosure, conveyance in lieu of foreclosure or other similar transaction, (iii) during the continuance of a material default by the property manager under the management agreement or the sub-property manager under the sub-management agreement (after the expiration of any applicable notice and/or cure periods), (iv) if the property manager or sub-property manager, as applicable, files or is the subject of a petition in bankruptcy or (v) if a trustee or receiver is appointed for, respectively, the property manager’s or the sub-property manager’s assets or the property manager or sub-property manager, as applicable, makes an assignment for the benefit of its creditors or is adjudicated insolvent.
Current Mezzanine or Subordinate Indebtedness. None.
Future Permitted Mezzanine Indebtedness. A 100% direct or indirect owner of the 711 Fifth Avenue Borrower or any existing mezzanine borrower is permitted one time during the term of the 711 Fifth Avenue Whole Loan to obtain a mezzanine loan from a lender meeting certain requirements under the 711 Fifth Avenue Whole Loan documents secured by a pledge of the equity interests in the 711 Fifth Avenue Borrower, provided that, among other conditions: (a) the mezzanine loan is in an amount not to exceed the lesser of (i) $35,000,000 and (ii) an amount that, when added to the 711 Fifth Avenue Whole Loan will result in (A) a combined loan to “as-is” appraised value ratio of the 711 Fifth Avenue Property of no more than 54.5%, (B) a combined debt service coverage ratio (based on the 711 Fifth Avenue Whole Loan and the proposed mezzanine loan) of greater than 2.80x and (C) the combined debt yield being equal to or greater than 8.98%; (b) the mezzanine loan is secured by an equity pledge encumbering direct and indirect ownership interests in the 711 Fifth Avenue Borrower (and not any collateral securing the 711 Fifth Avenue Whole Loan); (c) the mezzanine loan will be coterminous with the 711 Fifth Avenue Whole Loan; and (d) the mezzanine lender (i) is not an affiliate of the 711 Fifth Avenue Borrower and (ii) enters into an intercreditor agreement with the lender satisfactory in all respects to the lender in its reasonable discretion and any applicable rating agency. Additionally, such financing will be subject to receipt by the lender of rating agency confirmations from the applicable rating agencies.
Partial Release. None.
THE INFORMATION IN THIS STRUCTURAL AND COLLATERAL TERM SHEET IS NOT COMPLETE AND MAY BE AMENDED PRIOR TO THE TIME OF SALE. THIS TERM SHEET IS NOT AN OFFER TO SELL THESE SECURITIES AND IT IS NOT A SOLICITATION OF AN OFFER TO BUY THESE SECURITIES IN ANY JURISDICTION WHERE THE OFFER OR SALE IS NOT PERMITTED.
110
(THIS PAGE INTENTIONALLY LEFT BLANK)
111
280 North Bernardo Avenue Mountain View, CA 94043 | Collateral Asset Summary – Loan No. 8 280 North Bernardo | Cut-off Date Balance: Cut-off Date LTV: U/W NCF DSCR: U/W NOI Debt Yield: | $40,000,000 59.2% 2.27x 9.3% |
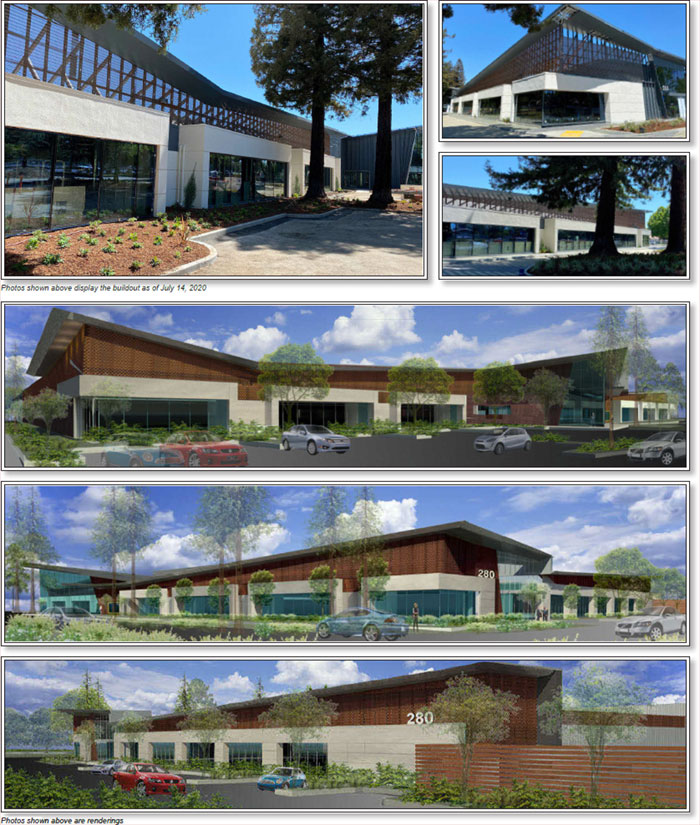
THE INFORMATION IN THIS STRUCTURAL AND COLLATERAL TERM SHEET IS NOT COMPLETE AND MAY BE AMENDED PRIOR TO THE TIME OF SALE. THIS TERM SHEET IS NOT AN OFFER TO SELL THESE SECURITIES AND IT IS NOT A SOLICITATION OF AN OFFER TO BUY THESE SECURITIES IN ANY JURISDICTION WHERE THE OFFER OR SALE IS NOT PERMITTED.
112
280 North Bernardo Avenue Mountain View, CA 94043 | Collateral Asset Summary – Loan No. 8 280 North Bernardo | Cut-off Date Balance: Cut-off Date LTV: U/W NCF DSCR: U/W NOI Debt Yield: | $40,000,000 59.2% 2.27x 9.3% |
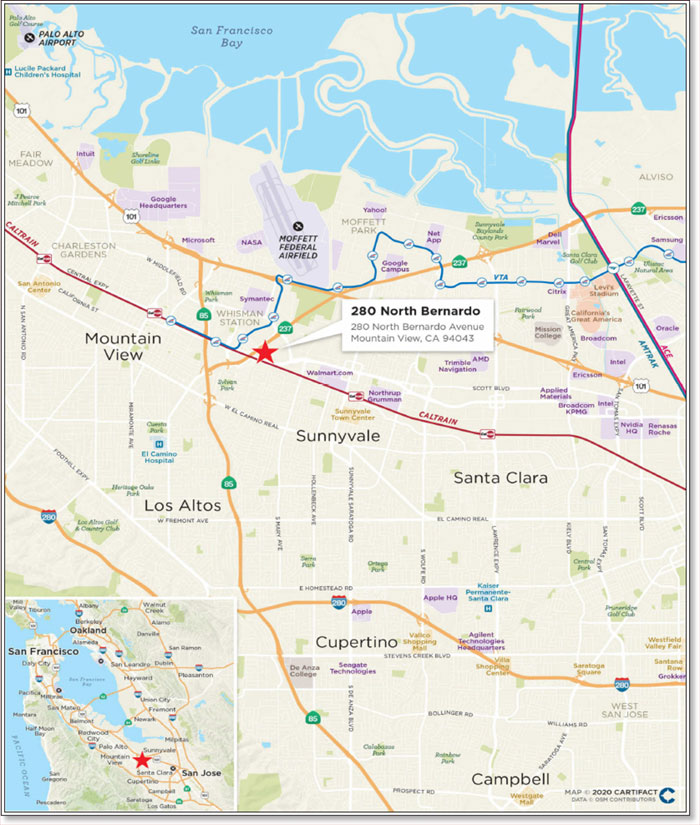
THE INFORMATION IN THIS STRUCTURAL AND COLLATERAL TERM SHEET IS NOT COMPLETE AND MAY BE AMENDED PRIOR TO THE TIME OF SALE. THIS TERM SHEET IS NOT AN OFFER TO SELL THESE SECURITIES AND IT IS NOT A SOLICITATION OF AN OFFER TO BUY THESE SECURITIES IN ANY JURISDICTION WHERE THE OFFER OR SALE IS NOT PERMITTED.
113
280 North Bernardo Avenue Mountain View, CA 94043 | Collateral Asset Summary – Loan No. 8 280 North Bernardo | Cut-off Date Balance: Cut-off Date LTV: U/W NCF DSCR: U/W NOI Debt Yield: | $40,000,000 59.2% 2.27x 9.3% |
| Mortgage Loan Information | |
| Loan Seller: | GACC |
| Loan Purpose: | Refinance |
| Borrower Sponsor: | Peter Pau |
| Borrower: | Mingfat, LLC |
| Original Balance(1): | $40,000,000 |
| Cut-off Date Balance(1): | $40,000,000 |
| % by Initial UPB: | 4.3% |
| Interest Rate: | 3.95000% |
| Payment Date: | 6th of each month |
| First Payment Date: | August 6, 2020 |
| Maturity Date: | July 6, 2030 |
| Amortization: | Interest Only |
| Additional Debt(1): | $31,000,000 Pari Passu Debt |
| Call Protection(2): | L(24), D(92), O(4) |
| Lockbox / Cash Management: | Hard / Springing |
| Reserves(3) | |||
| Initial | Monthly | Cap | |
| Taxes: | $217,595 | $53,740 | NAP |
| Insurance: | $0 | Springing | NAP |
| Replacement(4): | $0 | Springing | $50,019 |
| TI/LC: | $9,756,740 | $0 | NAP |
| Landlord’s Work: | $585,062 | $0 | NAP |
| Aurora Rent: | $600,825 | $0 | NAP |
| Debt Service: | $1,402,250 | Springing | NAP |
| Lease Sweep Funds: | $0 | Springing | NAP |
| Property Information | |
| Single Asset / Portfolio: | Single Asset |
| Property Type: | Suburban Office |
| Collateral: | Fee Simple |
| Location: | Mountain View, CA |
| Year Built / Renovated: | 1978-1980 / 2020 |
| Total Sq. Ft.: | 111,154 |
| Property Management: | Sand Hill Property Management, LLC |
| Underwritten NOI: | $6,577,971 |
| Underwritten NCF: | $6,450,144 |
| Appraised Value(5): | $120,000,000 |
| Appraisal Date(5): | April 1, 2020 |
| Historical NOI(6) | |
| Most Recent NOI: | NAV |
| 2019 NOI: | NAV |
| 2018 NOI: | NAV |
| 2017 NOI: | NAV |
| Historical Occupancy | |
| Most Recent Occupancy: | 100.0% (July 6, 2020) |
| 2019 Occupancy(6): | NAV |
| 2018 Occupancy(6): | NAV |
| 2017 Occupancy(6): | NAV |
| Financial Information(1)(2) | ||||||
| Tranche | Cut-off Date Balance | Balance per Sq. Ft. Cut-off / Balloon | LTV Cut-off / Balloon(5) | U/W DSCR NOI / NCF | U/W Debt Yield NOI / NCF | U/W Debt Yield at Balloon NOI / NCF |
| Mortgage Loan | $40,000,000 | |||||
| Pari Passu Notes | $31,000,000 | |||||
| Whole Loan | $71,000,000 | $639 / $639 | 59.2% / 59.2% | 2.31x / 2.27x | 9.3% / 9.1% | 9.3% / 9.1% |
| (1) | The 280 North Bernardo Loan (as defined below) consists of the controlling Note A-1 and is part of the 280 North Bernardo Whole Loan (as defined below) evidenced by two pari passu notes with an aggregate outstanding principal balance as of the Cut-off Date of $71.0 million. For additional information, see “The Loan” herein. |
| (2) | The defeasance lockout period will be at least 24 payments beginning with and including the first payment date of August 6, 2020. The borrower has the option to defease the 280 North Bernardo Whole Loan in whole (and not in part) after the earlier to occur of (i) two years after the closing date of the securitization that includes the last note to be securitized and (ii) June 29, 2023. The assumed defeasance lockout period of 24 months is based on the expected closing date of the Benchmark 2020-B18 securitization in July 2020. The actual lockout period may be longer. |
| (3) | For a full description of Escrows and Reserves, please refer to “Initial and Ongoing Reserves” below. |
| (4) | The borrower will be required to deposit on each monthly payment date an amount equal to approximately $1,389 beginning with the payment date in August 2021. |
| (5) | The appraised value represents the “As Stabilized” appraised value, which assumes completion of tenant improvements, free rent has burned off and rent commencement has begun. The tenant, Aurora Innovations, has begun the buildout of its space and approximately $10.9 million was reserved upfront for TI/LCs, free rent and a landlord completion reserve. Based on the “As-Is” appraised value as of October 29, 2019 equal to $98.7 million, the Cut-off Date LTV and Balloon LTV are 71.9%. In addition, the appraisal concluded to a “Hypothetical Go Dark” appraised value of $78.6 million as of October 29, 2019. Based on the “Hypothetical Go Dark” appraised value, the Cut-off Date LTV and Balloon LTV are 90.3%. |
| (6) | Historical NOI and Occupancy is not available because the 280 North Bernardo Property (as defined below) was recently renovated and delivered to the tenant. |
THE INFORMATION IN THIS STRUCTURAL AND COLLATERAL TERM SHEET IS NOT COMPLETE AND MAY BE AMENDED PRIOR TO THE TIME OF SALE. THIS TERM SHEET IS NOT AN OFFER TO SELL THESE SECURITIES AND IT IS NOT A SOLICITATION OF AN OFFER TO BUY THESE SECURITIES IN ANY JURISDICTION WHERE THE OFFER OR SALE IS NOT PERMITTED.
114
280 North Bernardo Avenue Mountain View, CA 94043 | Collateral Asset Summary – Loan No. 8 280 North Bernardo | Cut-off Date Balance: Cut-off Date LTV: U/W NCF DSCR: U/W NOI Debt Yield: | $40,000,000 59.2% 2.27x 9.3% |
The Loan. The 280 North Bernardo mortgage loan (the “280 North Bernardo Loan”) is part of a whole loan with an aggregate outstanding principal balance as of the Cut-off Date of $71.0 million (the “280 North Bernardo Whole Loan”), which is secured by the borrower’s fee simple interest in a Class A office building located in Mountain View, California (the “280 North Bernardo Property”). The controlling Note A-1 with an outstanding principal balance as of the Cut-off Date of $40.0 million will be included in the Benchmark 2020-B18 trust. The remaining note is expected to be contributed to one or more future securitization trusts.
The relationship between the holders of the 280 North Bernardo Whole Loan will be governed by a co-lender agreement as described under “Description of the Mortgage Pool—The Whole Loans—The Serviced Pari Passu Whole Loans” in the Preliminary Prospectus.
| Whole Loan Summary | ||||
| Note | Original Balance | Cut-off Date Balance | Note Holder | Controlling Piece |
| Note A-1 | $40,000,000 | $40,000,000 | Benchmark 2020-B18 | Yes |
| Note A-2 | 31,000,000 | 31,000,000 | DBRI(1) | No |
| Total | $71,000,000 | $71,000,000 | ||
| (1) | Expected to be contributed to one or more future securitizations. |
The 280 North Bernardo Whole Loan has a 10-year interest-only term and accrues interest at a rate of 3.95000% per annum. Proceeds of the 280 North Bernardo Whole Loan were primarily used to refinance the 280 North Bernardo Property, fund upfront reserves, pay closing costs and return equity to the borrower sponsor. Based on the “As Stabilized” appraised value of $120.0 million as of April 1, 2020, the Cut-off Date LTV Ratio is 59.2%. Based on the “As Is” appraised value of $98.7 million as of October 29, 2019, the Cut-off Date LTV Ratio is 71.9%. Based on the “Hypothetical Go Dark” appraised value of $78.6 million as of October 29, 2019, the Cut-off Date LTV is 90.3%.
Sources and Uses | ||||||
| Sources | Proceeds | % of Total | Uses | Proceeds | % of Total | |
| Whole Loan | $71,000,000 | 100.0% | Loan Payoff | $34,505,446 | 48.6% | |
| Return of Equity | 22,087,129 | 31.1 | ||||
| Upfront Reserves | 12,562,472 | 17.7 | ||||
| Closing Costs | 1,844,953 | 2.6 | ||||
| Total Sources | $71,000,000 | 100.0% | Total Uses | $71,000,000 | 100.0% | |
The Borrower / Borrower Sponsor. The borrower is Mingfat, LLC, a single purpose Delaware limited liability company structured to be bankruptcy remote with one independent director in the organizational structure. Legal counsel to the borrower delivered a non-consolidation opinion in connection with the origination of the 280 North Bernardo Whole Loan. The borrower sponsor and nonrecourse carve-out guarantor is Peter Pau.
The borrower sponsor is Peter Pau, co-founder of Sand Hill Property Company (“SHPC”), a real estate investment and development firm founded in 1988 by Peter and Susanna Pau. SHPC specializes in Silicon Valley real estate. The company’s current portfolio of stabilized assets includes shopping centers, mixed-use communities, office complexes, and hotels. SHPC has developed more than 40 projects encompassing 14.0 million sq. ft. of building area throughout the Silicon Valley area. According to SHPC’s website, they currently report 13 stabilized assets in their portfolio along with six active projects.
The Property.
| Tenant Summary(1) | ||||||
| Tenant | Credit Rating (Moody’s/Fitch/S&P) | Net Rentable Area (Sq. Ft.) | % of Net Rentable Area | U/W Base Rent per Sq. Ft. | % of Total U/W Base Rent | Lease Expiration |
| Aurora Innovations | NR / NR / NR | 111,154 | 100.0% | $63.00 | 100.0% | 3/31/2030 |
| Total Occupied | 111,154 | 100.0% | $63.00 | 100.0% | ||
| Vacant | 0 | 0.0% | ||||
| Total | 111,154 | 100.0% | ||||
| (1) | Based on the underwritten rent roll as of July 6, 2020. |
THE INFORMATION IN THIS STRUCTURAL AND COLLATERAL TERM SHEET IS NOT COMPLETE AND MAY BE AMENDED PRIOR TO THE TIME OF SALE. THIS TERM SHEET IS NOT AN OFFER TO SELL THESE SECURITIES AND IT IS NOT A SOLICITATION OF AN OFFER TO BUY THESE SECURITIES IN ANY JURISDICTION WHERE THE OFFER OR SALE IS NOT PERMITTED.
115
280 North Bernardo Avenue Mountain View, CA 94043 | Collateral Asset Summary – Loan No. 8 280 North Bernardo | Cut-off Date Balance: Cut-off Date LTV: U/W NCF DSCR: U/W NOI Debt Yield: | $40,000,000 59.2% 2.27x 9.3% |
| Lease Rollover Schedule(1) | ||||||||
| Year | # of Leases Expiring | Total Expiring Sq. Ft. | % of Total Sq. Ft. Expiring | Cumulative Sq. Ft. Expiring | Cumulative % of Sq. Ft. Expiring | Annual U/W Base Rent Per Sq. Ft. | % U/W Base Rent Rolling | Cumulative % of U/W Base Rent |
| MTM & 2020 | 0 | 0 | 0.0% | 0 | 0.0% | $0.00 | 0.0% | 0.0% |
| 2021 | 0 | 0 | 0.0% | 0 | 0.0% | $0.00 | 0.0% | 0.0% |
| 2022 | 0 | 0 | 0.0% | 0 | 0.0% | $0.00 | 0.0% | 0.0% |
| 2023 | 0 | 0 | 0.0% | 0 | 0.0% | $0.00 | 0.0% | 0.0% |
| 2024 | 0 | 0 | 0.0% | 0 | 0.0% | $0.00 | 0.0% | 0.0% |
| 2025 | 0 | 0 | 0.0% | 0 | 0.0% | $0.00 | 0.0% | 0.0% |
| 2026 | 0 | 0 | 0.0% | 0 | 0.0% | $0.00 | 0.0% | 0.0% |
| 2027 | 0 | 0 | 0.0% | 0 | 0.0% | $0.00 | 0.0% | 0.0% |
| 2028 | 0 | 0 | 0.0% | 0 | 0.0% | $0.00 | 0.0% | 0.0% |
| 2029 | 0 | 0 | 0.0% | 0 | 0.0% | $0.00 | 0.0% | 0.0% |
| 2030 | 1 | 111,154 | 100.0% | 111,154 | 100.0% | $63.00 | 100.0% | 100.0% |
| 2031 & Thereafter | 0 | 0 | 0.0% | 111,154 | 100.0% | $0.00 | 0.0% | 100.0% |
| Vacant | NAP | 0 | 0.0% | 111,154 | 100.0% | NAP | NAP | NAP |
| Total | 1 | 111,154 | 100.0% | $63.00 | 100.0% | |||
| (1) | Based on the underwritten rent roll dated July 6, 2020. |
The 280 North Bernardo Property is a newly re-developed Class A, 111,154 sq. ft. office building situated on a 7.7-acre site in Mountain View, California. The borrower sponsor purchased and redeveloped the 280 North Bernardo Property in 2017 which included all new facades, raising and pitching the roof, and a gut opening of the interior space to create a larger and more free flowing space. The 280 North Bernardo Property is composed of both research and development (“R&D”) and production spaces. The R&D component of the 280 North Bernardo Property is used for product development and testing and is anticipated by the borrower sponsor to be approximately 30% of the total net rentable area, with the majority of that space comprised of software R&D. The remaining sq. ft. of the R&D space will be comprised of true hardware R&D space. The production areas feature power drops and a warehouse with a 14-foot clear ceiling height served by two dock-high loading doors and one grade-level loading door at the rear elevation of the 280 North Bernardo Property. The 280 North Bernardo Property features 374 parking spaces, for a parking ratio of approximately 3.36 (parking spaces per 1,000 sq. ft. of NRA). As of July 6, 2020 the 280 North Bernardo Property was 100.0% leased to Aurora (as defined below) as their new headquarters location.
Sole Tenant. The sole tenant, Aurora Innovations (“Aurora”) (111,154 sq. ft.; 100.0% of NRA; 100.0% of U/W Base Rent), is an automobile technology company founded in Palo Alto, California. Aurora specializes in designing software and hardware in the self-driving vehicle industry. Aurora works with automakers to design and develop a package of sensors, software, and data services needed to deploy fully autonomous vehicles. Aurora is currently focused on “Level 4” autonomous systems as designated by SAE International, the Automotive Engineering Association, in which a car can handle the majority of driving situations independently with the option of driver intervention, but will eventually target “Level 5” autonomous systems, which are fully autonomous and perform all driving tasks. Aurora’s three co-founders are long-standing members of the self-driving community. Chris Urmson, the CEO, was an early leader of the driverless car project launched within Google that later became Waymo, now widely seen as the first robotaxi business. Sterling Anderson, Aurora’s CPO, previously led Tesla’s Autopilot team that developed driver-assistance technology. Drew Bagnell, the CTO, was a founding member of Uber’s Advanced Technologies Group. Aurora’s leadership team has allowed the company to attract top talent, with more than 250 employees operating in four locations throughout the country in Palo Alto, CA, San Francisco, CA, Pittsburgh, PA, and Bozeman, MT.
Aurora recently signed a 10 year, nine month lease that will expire on March 31, 2030. The initial annual base rent is $63 per sq. ft., NNN with annual 3% rent steps thereafter and one five- or 10-year renewal option at fair market rent. In addition, Aurora received nine months of free rent and approximately $88 per sq. ft. for tenant improvement allowance.
Aurora’s lease originally commenced on July 1, 2019 with nine months of free rent, however due to COVID-19 related stay-at-home orders preventing the landlord from accessing the 280 North Bernardo Property, Aurora’s rent commencement date was pushed to August 18, 2020. Once the stay-at-home orders delayed the landlord’s buildout, Aurora received a 3-month forbearance period from the landlord until August 18, 2020 ($1,985,673 in total rent). The forborne rent will be amortized over the remainder of the lease term. Aurora did not request any form of rent relief, and the forbearance was offered by the landlord given that Aurora could not complete their buildout by the original scheduled completion date. Aurora has commenced buildout and the landlord work (except for minor punch list items) has been completed. There are no outs, early termination options, or contraction rights in the lease. Aurora reported that they anticipate spending an additional approximately $8.81 million ($79 per sq. ft.) above and beyond the allotted TI/LC obligation of approximately $9.8 million, resulting in a total investment of approximately $18.7 million ($168 per sq. ft.). The guarantor is guarantying the completion of the work.
COVID-19 Update. As of the July 6, 2020 underwritten rent roll, the 280 North Bernardo Property is 100.0% occupied. The sole tenant is currently in a free rent period with rent commencing in August 2020. The first payment date of the 280 North Bernardo Whole Loan is August 6, 2020. As of July 6, 2020, the 280 North Bernardo Whole Loan is not subject to any modification or forbearance request.
THE INFORMATION IN THIS STRUCTURAL AND COLLATERAL TERM SHEET IS NOT COMPLETE AND MAY BE AMENDED PRIOR TO THE TIME OF SALE. THIS TERM SHEET IS NOT AN OFFER TO SELL THESE SECURITIES AND IT IS NOT A SOLICITATION OF AN OFFER TO BUY THESE SECURITIES IN ANY JURISDICTION WHERE THE OFFER OR SALE IS NOT PERMITTED.
116
280 North Bernardo Avenue Mountain View, CA 94043 | Collateral Asset Summary – Loan No. 8 280 North Bernardo | Cut-off Date Balance: Cut-off Date LTV: U/W NCF DSCR: U/W NOI Debt Yield: | $40,000,000 59.2% 2.27x 9.3% |
Environmental Matters. The Phase I environmental report dated January 15, 2020 recommended no further action at the 280 North Bernardo Property.
The Market. The 280 North Bernardo Property is located within the East Whisman area of the Mountain View submarket in Santa Clara County, California.
The City of Mountain View is a suburban city located at the base of the San Francisco Peninsula, 11.8 miles west of San Jose and 38 miles southeast of downtown San Francisco, and is home to a broad range of tech companies, from growth-stage startups to some of the largest companies in the world, including Google, Microsoft, Mozilla, LinkedIn, Symantec, and Intuit. The City of Mountain View recently approved the East Whisman area for redevelopment, identifying the area as a highly sustainable, transit-oriented employment center that is primed for further growth. The redevelopment plan aims to deliver 9,700 new apartments and at least 1.7 million sq. ft. of office space to the neighborhood in the coming years. The most recent iteration of the redevelopment plan would allow residential development along Middlefield and Whisman roads, to the northwest of the 280 North Bernardo Property, and concentrate office growth in the immediate area along Highways 101 and 237. The plan would also bring a light-rail station to the 280 North Bernardo Property’s neighborhood, a significant development seeing as the 280 North Bernardo Property is located almost directly in-between the Mountain View and Sunnyvale rail stations.
According to a market research report, the estimated 2019 population within a one-, three-, and five-mile radius was projected to be 25,242, 193,814, and 386,292, respectively. The population within the same radii is expected to grow 4.73%, 5.10%, and 5.10%, respectively, over the next five years. The 2019 average household income within a one-, three-, and five-mile radius was $182,702, $193,082, and $200,988, compared to $172,172 for Santa Clara County and $109,977 for the state of California.
According to the appraisal, as of the third quarter of 2019, the Mountain View office submarket consisted of approximately 5.2 million sq. ft. of office space with an overall market vacancy of 8.5% and average asking rents of approximately $7.53 per sq. ft.
The following chart displays six lease comparables for the 280 North Bernardo Property. Comparable buildings were built between 1977 and 2020 and range in size from 32,260 sq. ft. to 222,000 sq. ft. Initial asking rents at the comparable properties ranged between $56.16 and $96.00 per sq. ft. (net leases) with an average of approximately $70.66 per sq. ft. The appraisal concluded a market rent at the 280 North Bernardo Property of $63.00 per sq. ft. The 280 North Bernardo Property has an in-place rent of $63.00 per sq. ft.
| Comparable Retail Leases(1) | |||||
| Property Name | Tenant Name | Tenant Leased Space (Sq. Ft.) | Lease Date | Lease Term (years) | Base Rent Per Sq. Ft. |
| 280 North Bernardo, Mountain View, CA | Aurora Innovations | 111,154 | Jul 2019(2) | 10.8(2) | $63.00(2) |
| 805 E. Middlefield, Mountain View, CA | Nokia | 32,260 | Dec 2019 | 7.5 | $63.00 |
| 899 W. Evelyn Avenue, Mountain View, CA | Confluent | 75,475 | Apr 2019 | 10.2 | $96.00 |
| 600 Clyde, Mountain View, CA | Google LLC | 189,974 | May 2020 | 11.0 | $56.16 |
| Grove 221, Sunnyvale, CA | 23andMe | 154,987 | Mar 2019 | 12.8 | $61.80 |
| 351 E Evelyn, Mountain View, CA | Coursera | 45,240 | May 2017 | 7.0 | $69.00 |
| Ameswell Mountain View, Mountain View, CA | Available | 222,000 | Current | Neg. | $78.00 |
| (1) | Based on the appraisal. |
| (2) | Based on the underwritten rent roll as of July 6, 2020. |
THE INFORMATION IN THIS STRUCTURAL AND COLLATERAL TERM SHEET IS NOT COMPLETE AND MAY BE AMENDED PRIOR TO THE TIME OF SALE. THIS TERM SHEET IS NOT AN OFFER TO SELL THESE SECURITIES AND IT IS NOT A SOLICITATION OF AN OFFER TO BUY THESE SECURITIES IN ANY JURISDICTION WHERE THE OFFER OR SALE IS NOT PERMITTED.
117
280 North Bernardo Avenue Mountain View, CA 94043 | Collateral Asset Summary – Loan No. 8 280 North Bernardo | Cut-off Date Balance: Cut-off Date LTV: U/W NCF DSCR: U/W NOI Debt Yield: | $40,000,000 59.2% 2.27x 9.3% |
Cash Flow Analysis.
| Cash Flow Analysis(1) | ||
| U/W | U/W PSF | |
| Base Rent | $7,002,702 | $63.00 |
| Gross Potential Rent | $7,002,702 | $63.00 |
| Total Reimbursements | $135,628 | $1.22 |
| Net Rental Income | $7,138,330 | $64.22 |
| (Vacancy/Credit Loss) | ($356,917) | ($3.21) |
| Effective Gross Income | $6,781,414 | $61.01 |
| Total Expenses | $203,442 | $1.83 |
| Net Operating Income | $6,577,971 | $59.18 |
| TI/LC | $111,154 | $1.00 |
| Capital Expenditures | $16,673 | $0.15 |
| Net Cash Flow | $6,450,144 | $58.03 |
| (1) | Historical financials are not available because the 280 North Bernardo Property was recently renovated and delivered to the tenant. |
Property Management. The 280 North Bernardo Property is currently managed by Sand Hill Property Management, LLC, an affiliate of the borrower.
Lockbox / Cash Management. The 280 North Bernardo Whole Loan is structured with a hard lockbox and springing cash management. The borrower is required to cause tenants to deposit rents directly into a lender-controlled lockbox account (the “Clearing Account”). In addition, the borrower and the property manager are required to deposit all rents and gross revenue from the 280 North Bernardo Property into such lockbox account within one business day of receipt. Provided no 280 North Bernardo Trigger Period (as defined below) exists, funds deposited into the Clearing Account will be swept on a daily basis into the borrower’s operating account. Once a 280 North Bernardo Trigger Period occurs, such funds will be swept on a daily basis into the deposit account and applied and disbursed in accordance with the loan documents.
A “280 North Bernardo Trigger Period” will commence upon the occurrence of (i) an event of default under the 280 North Bernardo Whole Loan, (ii) the debt service coverage ratio is less than 1.15x on the last day of any calendar quarter, (iii) the commencement of a Lease Sweep Period (as defined below), (iv) the failure of the borrower to make a Landlord’s Work Rebalancing Payment (as defined below), or (v) the disbursement of funds from the debt service reserve account; and will end if, (A) with respect to clause (i), the event of default under the 280 North Bernardo Whole Loan has been cured and such cure has been accepted by the lender (and no other event of default under the 280 North Bernardo Whole Loan is then continuing) or (B) with respect to clause (ii), the debt service coverage ratio is at least 1.20x on the last day of two consecutive calendar quarters or (C) with respect to clause (iii), such Lease Sweep Period has ended (and no other Lease Sweep Period is then continuing), or (D) with respect to clause (iv), the lender has determined that the amount on deposit in the landlord’s work reserve account is sufficient to pay for the costs and expenses associated with completing all work required to be performed by the borrower pursuant to Aurora’s lease, or (E) with respect to clause (v), the earliest to occur of (x) if the debt service reserve account balance has not reached $0, the date on which the debt service reserve account has a balance equal to $1,402,250; (y) if the debt service reserve account balance reached $0 at any time, the date on which the debt service reserve account has a balance equal to $2,804,500; and (z) the satisfaction in full of the Debt Service Reserve Release Conditions (as defined below).
“Debt Service Reserve Release Conditions” means (i) at least 12 full calendar months have elapsed from the origination date; (ii) no 280 North Bernardo Trigger Period is then continuing; (iii) there are no restrictions resulting from the COVID-19 pandemic on the operations of any business in the county in which the 280 North Bernardo Property is located for at least 90 consecutive days, (iv) the borrower provided satisfactory evidence to the lender that each tenant under a major lease (as defined in the loan documents) has timely made all rental payments (including, without limitation, any payments of additional rent) due and payable under each such major lease for the immediately preceding six full calendar months, and (v) no portion of the Debt Service Reserve funds has been applied towards the monthly debt service payment during the immediately preceding 12 full calendar month period.
A “Lease Sweep Period” (i) will commence on the first monthly payment date following the occurrence of any of the following: (a) the earliest of (i) March 2028, (ii) the date that is 24 months prior to the earliest stated expiration (including the stated expiration of any renewal term) of the Aurora lease (or a replacement lease that covers all or any portion of the Aurora premises) (a “Lease Sweep Lease”), or (iii) the date required under a Lease Sweep Lease by which the tenant thereunder is required to give notice of its exercise of a renewal option thereunder (and such renewal has not been so exercised); (b) the receipt by the borrower or the manager of written notice from any tenant under a Lease Sweep Lease exercising its right to terminate its Lease Sweep Lease; (c) the date that a Lease Sweep Lease (or any material portion thereof) is surrendered, cancelled or terminated prior to its then current expiration date or the receipt by the borrower or the manager of written notice from any tenant under a Lease Sweep Lease of its intent to surrender, cancel or terminate the
THE INFORMATION IN THIS STRUCTURAL AND COLLATERAL TERM SHEET IS NOT COMPLETE AND MAY BE AMENDED PRIOR TO THE TIME OF SALE. THIS TERM SHEET IS NOT AN OFFER TO SELL THESE SECURITIES AND IT IS NOT A SOLICITATION OF AN OFFER TO BUY THESE SECURITIES IN ANY JURISDICTION WHERE THE OFFER OR SALE IS NOT PERMITTED.
118
280 North Bernardo Avenue Mountain View, CA 94043 | Collateral Asset Summary – Loan No. 8 280 North Bernardo | Cut-off Date Balance: Cut-off Date LTV: U/W NCF DSCR: U/W NOI Debt Yield: | $40,000,000 59.2% 2.27x 9.3% |
Lease Sweep Lease (or any material portion thereof prior to its then current expiration date); (d) the date that any tenant under a Lease Sweep Lease goes dark in or gives notice that it intends to discontinue its business in at least 25% of its space at the 280 North Bernardo Property; (e) upon a monetary or material non-monetary default under a Lease Sweep Lease by the tenant thereunder that continues beyond any applicable notice and cure period; or (f) the occurrence of a Lease Sweep Tenant Party Insolvency Proceeding (as defined below).
A Lease Sweep Period will end upon the first to occur of the following: (A) in the case of clauses (i)(a), (i)(b), (i)(c), and (i)(d) above, the entirety of the applicable premises, or applicable portion thereof, is leased pursuant to one or more qualified leases and, in the lender’s reasonable judgment, sufficient funds have been accumulated in the lease sweep reserve account (during the continuance of the subject Lease Sweep Period) to cover all anticipated leasing expenses, free rent periods, and/or rent abatement periods with respect to such premises set forth in all such qualified leases and any shortfalls in required payments under the loan documents or operating expenses as a result of any anticipated down time prior to the commencement of payments under such qualified leases; (B) in the case of clause (i)(a) above, the date on which the applicable tenant irrevocably exercises its renewal or extension option (or otherwise enters into an extension agreement with the borrower that is reasonably acceptable to the lender) with respect to all of its premises, and in the lender’s judgment, sufficient funds have been accumulated in the lease sweep account (during the continuance of the subject Lease Sweep Period) to cover all anticipated leasing expenses, free rent periods and/or rent abatement periods with respect to such premises in connection with such renewal or extension; (C) in the case of clause (i)(b) above, if such termination option is not validly exercised by the tenant under the applicable Lease Sweep Lease by the latest exercise date specified in such Lease Sweep Lease or is otherwise waived in writing by the related tenant; (D) in the case of clause (i)(e) above, the date on which the subject default has been cured, and no other default under such Lease Sweep Lease occurs for a period of three consecutive months following such cure; (E) in the case of clause (i)(f) above, either (a) the applicable Lease Sweep Tenant Party Insolvency Proceeding (as defined below) has terminated and the applicable Lease Sweep Lease has been affirmed, assumed or assigned in a manner reasonably satisfactory to the lender or (b) the applicable Lease Sweep Lease has been assumed and assigned to a third party in a manner reasonably satisfactory to the lender; and (F) in the case of clause (i)(a) above with respect to the Aurora tenant’s lease only, the date on which (x) the funds in the lease sweep account collected with respect to the Lease Sweep Lease in question (including any lease termination payments with respect to such Lease Sweep Lease deposited into the lease sweep account) is equal to the Lease Sweep Termination Deposit Amount (as defined below) applicable to such space, (y) the borrower delivers to the lender a letter of credit in the foregoing amount or (z) the borrower deposits an amount equal to the deficient amount for deposit into the lease sweep account, unless, in any such case, the applicable premises has been leased pursuant to one or more Leases which, in the aggregate, (x) require the borrower to incur expenses, including the payment of brokerage commissions, completion of tenant improvements or payment of tenant allowances, and/or (y) provide for free rent periods and/or rent abatement periods with respect to rent amounts, which, in the lender’s determination, exceed the lease sweep termination deposit amount applicable to such premises (in which case the Lease Sweep Period in question will continue until the borrower satisfies clause (A) above).
A “Lease Sweep Termination Deposit Amount” means an amount equal to the total rentable square feet of space demised under the Aurora Innovation Lease multiplied by $60.00 for so long as the Lease Sweep Period is not continuing as of the payment date occurring in April 2029 (i.e., the Lease Sweep Period ended by operation of the provisions of clause (ii)(B) of the definition thereof and no other Lease Sweep Period has occurred that is then continuing); provided that, in the event that a Lease Sweep Period is continuing as of the payment date occurring in April 2029, the “Lease Sweep Termination Deposit Amount” shall be increased by the amount of Rents that Lender reasonably determines would have otherwise been swept into the Lease Sweep Account had such Lease Sweep Period been in effect as of the payment date occurring in April 2029 through and including the payment date occurring in March 2030 (it being acknowledged and agreed that the Lease Sweep Period will resume on the payment date occurring in April 2029 if Borrower has not deposited (in cash and/or as a letter of credit) with Lender such increased amount, in the aggregate, on or prior to the payment date occurring in April 2029 (i.e., Lease Sweep Period will resume on the payment date occurring in April 2029 if the sum of (x) all cash deposited in the Lease Sweep Account during the continuance of the subject Lease Sweep Period in question and (y) the face amount of each letter of credit delivered to Lender, is less than the sum of (a) the total rentable square feet of the applicable Lease Sweep Lease multiplied by $60.00, and (b) the amount of Rents that Lender has reasonably determined would have otherwise been swept into the Lease Sweep Account had such Lease Sweep Period continued from and including the payment date occurring in April 2029 through and including the payment date occurring in March 2030).A “Lease Sweep Tenant Party Insolvency Proceeding” means (A) the admission in writing by any Lease Sweep Tenant Party (as defined below) of its inability to pay its debts generally, or the making of a general assignment for the benefit of creditors, or the instituting by any Lease Sweep Tenant Party of any proceeding seeking to adjudicate it insolvent or seeking a liquidation or dissolution, or the taking advantage by any Lease Sweep Tenant Party of any Insolvency Law (as hereinafter defined), or the commencement by any Lease Sweep Tenant Party of a case or other proceeding naming it as debtor under any Insolvency Law or the instituting of a case or other proceeding against or with respect to any Lease Sweep Tenant Party under any Insolvency Law or (B) the instituting of any proceeding against or with respect to any Lease Sweep Tenant Party seeking liquidation of its assets or the appointment of (or if any Lease Sweep Tenant Party will consent to or acquiesce in the appointment of) a receiver, liquidator, conservator, trustee or similar official in respect of it or the whole or any substantial part of its properties or assets or the taking of any corporate, partnership or limited liability company action in furtherance of any of the foregoing. As used herein, the term “Insolvency Law” means Title 11 of the United States Code (11 U.S.C. §§ 101 et seq.) as the same has been or may be amended or superseded from time to time, or any other applicable domestic or foreign liquidation, conservatorship, bankruptcy, receivership, insolvency, reorganization, or any similar debtor relief laws affecting the rights, remedies, powers, privileges and benefits of creditors generally.
THE INFORMATION IN THIS STRUCTURAL AND COLLATERAL TERM SHEET IS NOT COMPLETE AND MAY BE AMENDED PRIOR TO THE TIME OF SALE. THIS TERM SHEET IS NOT AN OFFER TO SELL THESE SECURITIES AND IT IS NOT A SOLICITATION OF AN OFFER TO BUY THESE SECURITIES IN ANY JURISDICTION WHERE THE OFFER OR SALE IS NOT PERMITTED.
119
280 North Bernardo Avenue Mountain View, CA 94043 | Collateral Asset Summary – Loan No. 8 280 North Bernardo | Cut-off Date Balance: Cut-off Date LTV: U/W NCF DSCR: U/W NOI Debt Yield: | $40,000,000 59.2% 2.27x 9.3% |
A “Lease Sweep Tenant Party” means a tenant under a Lease Sweep Lease or its direct or indirect parent company (if any) and/or any guarantor of such Tenant’s obligations under a Lease Sweep Lease.
Initial and Ongoing Reserves. At origination of the 280 North Bernardo Whole Loan, the borrower funded reserves of (i) approximately $9,756,740 for outstanding tenant improvements, (ii) approximately $1,402,250 for a debt service reserve (equivalent to approximately six months of debt service), (iii) approximately $600,825 for free rent (equivalent to approximately one month of rent for Aurora), (iv) approximately $585,062 for a landlord work completion reserve (approximately 125% of the landlord’s cost to complete), and (v) approximately $217,595 for real estate taxes (equivalent to four months of tax payments).
Real Estate Tax Reserve. On a monthly basis, the borrower is required to deposit 1/12 of an amount which would be sufficient to pay taxes for the next ensuing 12 months (currently equivalent to $53,740).
Insurance Reserve. On a monthly basis, the borrower is required to deposit 1/12 of the estimated annual insurance premiums into an insurance reserve, unless an acceptable blanket insurance policy is in place. An acceptable blanket policy is currently in place.
Debt Service Reserve. An amount of $1,402,250 was collected upfront, which amount represents approximately six months of debt service payments. In the event funds in the debt service reserve account are partially drawn down upon, the borrower is obligated to replenish such reserve up to such amount out of excess cash flow (i.e., $1,402,250). In the event funds in the debt service reserve account are fully drawn down upon, the borrower is obligated to replenish such reserve up to an amount equal to $2,804,500 out of excess cash flow. On each monthly payment date during a 280 North Bernardo Trigger Period due solely to a debt service reserve shortfall as defined in the 280 North Bernardo Whole Loan documents, the borrower will be required to deposit funds out of excess cash (i.e., at the end of the waterfall) to cure the aforementioned shortfall. After 12 months from the origination date, so long as, among other conditions, no Lease Sweep Period is continuing, no funds have been drawn down from the Debt Service Reserve in the past twelve months, and there are no restrictions resulting from the COVID-19 pandemic on the operations of any businesses in the county in which the property is located for at least 90 consecutive days, the funds in the Debt Service Reserve will be returned to the borrower.
Landlord Work Completion Reserve. An amount of $585,062 was collected initially to fund a reserve related to outstanding work on the 280 North Bernardo Property which the landlord is responsible for completing. In the event that the funds in the reserve are determined to be less than the sum of (a) the cost to complete the landlord’s work and (b) the amount the lender reasonably believes will become payable by the property manager under the manager reimbursement agreement, the borrower will be required to deposit funds to cure the deficiency (the “Landlord’s Work Rebalancing Payment”).
Lease Sweep Reserve. In the event of a Lease Sweep Period, on a monthly basis the borrower will be required to (i) deposit all excess funds into a lease sweep account until the Lease Sweep Period is cured or (ii) deliver to the lender a letter of credit in an amount equal to difference between the funds in the Lease Sweep Reserve and the funds required to cure the Lease Sweep Period.
Replacement Reserve. On a monthly basis beginning with the payment date in August 2021, the borrower will be required to deposit approximately $1,389 into a replacement reserve account, capped at approximately $50,019, for capital expenditures.
Current Mezzanine or Subordinate Indebtedness. None.
Future Mezzanine or Subordinate Indebtedness Permitted. None.
Partial Release. None.
THE INFORMATION IN THIS STRUCTURAL AND COLLATERAL TERM SHEET IS NOT COMPLETE AND MAY BE AMENDED PRIOR TO THE TIME OF SALE. THIS TERM SHEET IS NOT AN OFFER TO SELL THESE SECURITIES AND IT IS NOT A SOLICITATION OF AN OFFER TO BUY THESE SECURITIES IN ANY JURISDICTION WHERE THE OFFER OR SALE IS NOT PERMITTED.
120
(THIS PAGE INTENTIONALLY LEFT BLANK)
121
420 Taylor Street San Francisco, CA 94102 | Collateral Asset Summary – Loan No. 9 420 Taylor Street | Cut-off Date Balance: Cut-off Date LTV: U/W NCF DSCR: U/W NOI Debt Yield: | $38,000,000 61.3% 1.67x 9.4% |
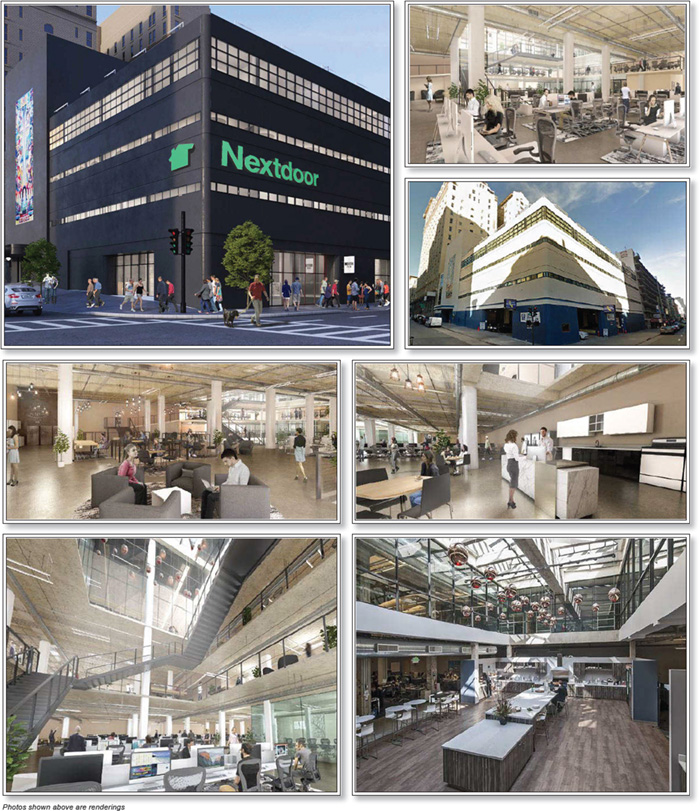
THE INFORMATION IN THIS STRUCTURAL AND COLLATERAL TERM SHEET IS NOT COMPLETE AND MAY BE AMENDED PRIOR TO THE TIME OF SALE. THIS TERM SHEET IS NOT AN OFFER TO SELL THESE SECURITIES AND IT IS NOT A SOLICITATION OF AN OFFER TO BUY THESE SECURITIES IN ANY JURISDICTION WHERE THE OFFER OR SALE IS NOT PERMITTED.
122
420 Taylor Street San Francisco, CA 94102 | Collateral Asset Summary – Loan No. 9 420 Taylor Street | Cut-off Date Balance: Cut-off Date LTV: U/W NCF DSCR: U/W NOI Debt Yield: | $38,000,000 61.3% 1.67x 9.4% |
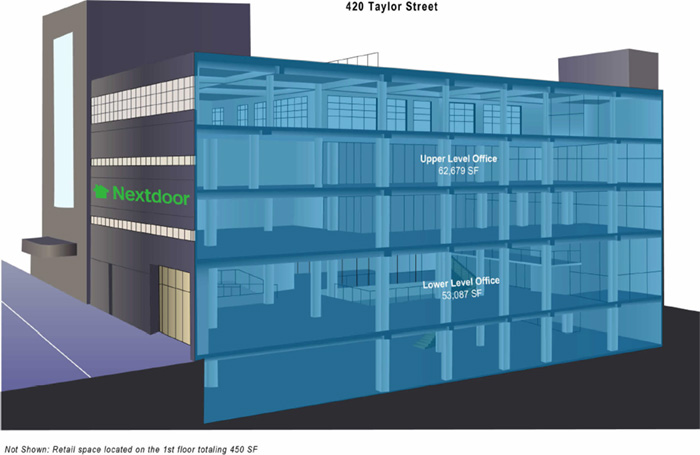
THE INFORMATION IN THIS STRUCTURAL AND COLLATERAL TERM SHEET IS NOT COMPLETE AND MAY BE AMENDED PRIOR TO THE TIME OF SALE. THIS TERM SHEET IS NOT AN OFFER TO SELL THESE SECURITIES AND IT IS NOT A SOLICITATION OF AN OFFER TO BUY THESE SECURITIES IN ANY JURISDICTION WHERE THE OFFER OR SALE IS NOT PERMITTED.
123
420 Taylor Street San Francisco, CA 94102 | Collateral Asset Summary – Loan No. 9 420 Taylor Street | Cut-off Date Balance: Cut-off Date LTV: U/W NCF DSCR: U/W NOI Debt Yield: | $38,000,000 61.3% 1.67x 9.4% |
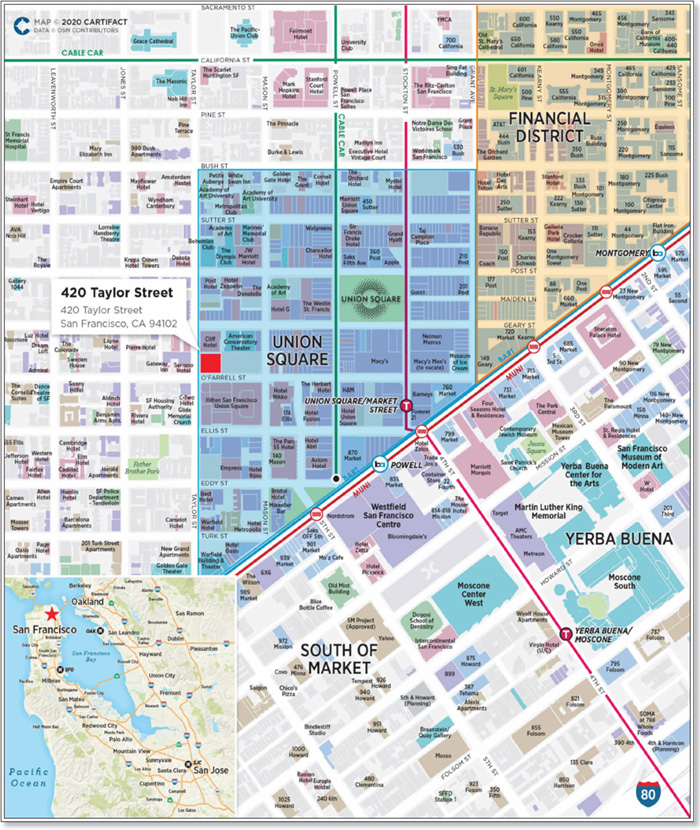
THE INFORMATION IN THIS STRUCTURAL AND COLLATERAL TERM SHEET IS NOT COMPLETE AND MAY BE AMENDED PRIOR TO THE TIME OF SALE. THIS TERM SHEET IS NOT AN OFFER TO SELL THESE SECURITIES AND IT IS NOT A SOLICITATION OF AN OFFER TO BUY THESE SECURITIES IN ANY JURISDICTION WHERE THE OFFER OR SALE IS NOT PERMITTED.
124
420 Taylor Street San Francisco, CA 94102 | Collateral Asset Summary – Loan No. 9 420 Taylor Street | Cut-off Date Balance: Cut-off Date LTV: U/W NCF DSCR: U/W NOI Debt Yield: | $38,000,000 61.3% 1.67x 9.4% |
| Mortgage Loan Information | |
| Loan Seller: | JPMCB/CREFI |
| Loan Purpose: | Refinance |
| Borrower Sponsors: | Seven Equity Group; Nakash Holdings |
| Borrowers(1): | 420 Taylor Ventures, LLC; NT 420 Taylor Owner LLC; 420 Taylor Holdings Owner LLC; NH 420 Taylor Owner LLC |
| Original Balance(2): | $38,000,000 |
| Cut-off Date Balance(2): | $38,000,000 |
| % by Initial UPB: | 4.1% |
| Interest Rate: | 3.75000% |
| Payment Date: | 6th of each month |
| First Payment Date(3): | August 6, 2020 |
| Maturity Date: | August 6, 2030 |
| Amortization(4): | Amortizing, then Interest Only |
| Additional Debt(2): | $50,000,000 Pari Passu Debt |
| Call Protection(3): | L(24), D(92), O(5) |
| Lockbox / Cash Management: | Hard / In Place |
| Reserves(5) | |||
| Initial | Monthly | Cap | |
| Taxes: | $98,219 | $49,110 | NAP |
| Insurance: | $2,615 | $2,615 | NAP |
| Replacement: | $1,937 | $1,937 | NAP |
| TI/LC: | $9,685 | $9,685 | $581,080 |
| Outstanding TI’s: | $8,447,054 | $0 | NAP |
| Capital Expenditures: | $4,834,237 | $0 | NAP |
| Free Rent: | $3,811,699 | $0 | NAP |
| Debt Service: | $1,222,625 | $0 | NAP |
| Property Information | |
| Single Asset / Portfolio: | Single Asset |
| Property Type: | CBD Office |
| Collateral: | Fee Simple |
| Location: | San Francisco, CA |
| Year Built / Renovated(6): | 1942 / 2020 |
| Total Sq. Ft.: | 116,216 |
| Property Management: | SEG Taylor LLC |
| Underwritten NOI(7): | $8,289,546 |
| Underwritten NCF(7) : | $8,150,087 |
| Appraised Value(8): | $143,500,000 |
| Appraisal Date(8): | May 1, 2021 |
| Historical NOI(9) | |
| Most Recent NOI: | NAV |
| 2019 NOI: | NAV |
| 2018 NOI: | NAV |
| 2017 NOI: | NAV |
| Historical Occupancy(9) | |
| Most Recent Occupancy(7): | 99.6% (July 6, 2020) |
| 2019 Occupancy: | NAV |
| 2018 Occupancy: | NAV |
| 2017 Occupancy: | NAV |
| Financial Information(2)(10) | ||||||
| Tranche | Cut-off Date Balance | Balance per Sq. Ft. Cut-off / Balloon | LTV Cut-off / Balloon(8) | U/W DSCR NOI / NCF | U/W Debt Yield NOI / NCF | U/W Debt Yield at Balloon NOI / NCF |
| Mortgage Loan | $38,000,000 | |||||
| Pari Passu Notes | 50,000,000 | |||||
| Whole Loan | $88,000,000 | $757 / $684 | 61.3% / 55.4% | 1.70x / 1.67x | 9.4% / 9.3% | 10.4% / 10.2% |
| (1) | The borrowers for the 420 Taylor Street Whole Loan (as defined below) are 420 Taylor Ventures, LLC, NT 420 Taylor Owner LLC, 420 Taylor Holdings Owner LLC and NH 420 Taylor Owner LLC which collectively own the 420 Taylor Street Property (as defined below) as tenants-in-common. See “The Borrowers / Borrower Sponsors” herein. |
| (2) | The 420 Taylor Street Loan (as defined below) consists of the controlling Note A-2 note and non-controlling Note A-4, and are part of the 420 Taylor Street Whole Loan, evidenced by four pari passu notes with an aggregate outstanding principal balance as of the Cut-off Date of $88.0 million. Please see “The Loan” below for additional information regarding control shift of the 420 Taylor Street Loan. |
| (3) | The lockout period will be 24 payments beginning with and including the first payment date of August 6, 2020. The Borrowers (as defined below) have the option to defease the full $88.0 million 420 Taylor Street Whole Loan after the earlier to occur of (i) two years after the closing date of the securitization that includes the last note to be securitized and (ii) the third anniversary of the first payment date. The actual lockout period may be longer. The Amortization period and Call Protection presented in the Mortgage Loan Information above are inclusive of the additional August 2020 interest payment to be deposited by JPMorgan Chase Bank, National Association. |
| (4) | Beginning on the payment date in September 2020, the 420 Taylor Street Whole Loan will be amortizing on a 30-year schedule for the first five years and will be interest only following the amortization period for the remainder of the loan term. |
| (5) | See “Initial and Ongoing Reserves” herein. |
| (6) | As of the Cut-off Date, conversion of the Lower Level Office (as defined below) and tenant buildout for the Upper Level Office (as defined below) at the 420 Taylor Street Property are currently underway. The conversion of the Lower Level Office is scheduled to be completed in September 2020. For more details on timing, see “The Property” herein. |
| (7) | Most Recent Occupancy, Underwritten NOI and Underwritten NCF are inclusive of the executed NextDoor (as defined below) lease. NextDoor took possession of the Upper Level Office in May 2020 and is expected to take possession of the Lower Level Office in September 2020. As of July 2020, NextDoor is currently paying rent for the Upper Level Office space and is expected to begin paying rent for the Lower Level Office space in January 2021 (with two months of free rent following the rent commencement date expected in January 2021) following the anticipated completion of the base building work in September 2020 (see “The Property” below for additional information). |
| (8) | Appraised Value is reflective of the “Prospective Value Upon Completion (TILC Funded) / Stabilization” Appraised Value, which assumes all remaining construction and tenant improvements as of May 1, 2021 have been paid for or funded. At origination, the Borrowers reserved approximately $8.4 million for all outstanding tenant improvements. The “As-Is” appraised value as of May 1, 2020 is $121.5 million, which results in a LTV Cut-off / Balloon ratio of approximately 72.4% and 65.4%, respectively. |
| (9) | Historical NOI and Historical Occupancy are unavailable as the collateral has expanded its premises and will be newly converted as of 2020. The 420 Taylor Street Property was originally constructed in 1942 but the recent conversion of the garage space to office has increased the size of the 420 Taylor Street Property office component by 53,087 sq. ft. Historical financials are not available as the Borrowers spent approximately two years negotiating entitlements for the lower levels from a parking garage to 53,087 sq. ft. of office space. |
| (10) | Financial information U/W DSCR NOI / NCF are based on the initial five year amortization period. Following the initial amortization period the U/W DSCR NOI / NCF are 2.74x and 2.70x, respectively on an interest only basis. |
THE INFORMATION IN THIS STRUCTURAL AND COLLATERAL TERM SHEET IS NOT COMPLETE AND MAY BE AMENDED PRIOR TO THE TIME OF SALE. THIS TERM SHEET IS NOT AN OFFER TO SELL THESE SECURITIES AND IT IS NOT A SOLICITATION OF AN OFFER TO BUY THESE SECURITIES IN ANY JURISDICTION WHERE THE OFFER OR SALE IS NOT PERMITTED.
125
420 Taylor Street San Francisco, CA 94102 | Collateral Asset Summary – Loan No. 9 420 Taylor Street | Cut-off Date Balance: Cut-off Date LTV: U/W NCF DSCR: U/W NOI Debt Yield: | $38,000,000 61.3% 1.67x 9.4% |
The Loan. The 420 Taylor Street mortgage loan (the “420 Taylor Street Loan”) is part of a whole loan that has an aggregate outstanding principal balance as of the Cut-off Date of $88.0 million (the “420 Taylor Street Whole Loan”), which is secured by a first mortgage lien on the borrowers’ fee simple interest in a 116,216 sq. ft. four-story, Class B, creative office building located in San Francisco, California (the “420 Taylor Street Property”). The 420 Taylor Street Whole Loan is comprised of four pari passu notes with an aggregate original principal balance as of the Cut-off Date of $88.0 million, of which the controlling Note A-2 and non-controlling Note A-4, with an outstanding principal balance as of the Cut-off Date of $38.0 million, are being contributed to the Benchmark 2020-B18 trust and constitute the 420 Taylor Street Loan. The remaining notes are expected to be contributed to one or more securitization trusts. At closing, Note A-2 will be the controlling note; provided however, that after the Benchmark 2020-B18 securitization closing date, if the aggregate principal balance of one or more notes included in the same securitization is greater than the aggregate principal balance of the 420 Taylor Street Loan, then on and after such securitization, the controlling note will be the note with the largest principal balance included in such other securitization.
The relationship between the holders of the 420 Taylor Street Whole Loan will be governed by co-lender agreements as described under “Description of the Mortgage Pool—The Whole Loans—The Serviced Pari Passu Whole Loans” in the Preliminary Prospectus.
| Whole Loan Summary | ||||
| Note | Original Balance | Cut-off Date Balance | Note Holder | Controlling Piece(2) |
| Note A-1 | $28,409,091 | $28,409,091 | JPMCB(1) | No |
| Note A-2 | $21,590,909 | $21,590,909 | Benchmark 2020-B18 | Yes |
| Note A-3 | $21,590,909 | $21,590,909 | CREFI(1) | No |
| Note A-4 | $16,409,091 | $16,409,091 | Benchmark 2020-B18 | No |
| Whole Loan | $88,000,000 | $88,000,000 | ||
| (1) | The related notes are currently held by the Note Holder identified in the table above and are expected to be contributed to one or more future securitization transactions. |
| (2) | In the event the aggregate principal balance of one or more notes included in the same securitization is greater than the aggregate principal balance of the 420 Taylor Street Loan, then on and after such securitization, the Controlling Piece will be the note with the largest principal balance included in such other securitization. |
The 420 Taylor Street Whole Loan has a 121-month term, and beginning on the payment date in September 2020, will amortize on a 30-year schedule for the first five years and will be followed by a five-year interest only period. The 420 Taylor Street Whole Loan will accrue interest at a fixed rate of 3.75000% per annum. The 420 Taylor Street Whole Loan proceeds were used to refinance existing debt, pay closing costs, fund upfront reserves, and returns equity to the Borrower Sponsors. Based on the “Prospective Value Upon Completion (TILC Funded) / Stabilization” appraised value of $143.5 million as of May 1, 2021, the Cut-off Date LTV Ratio for the 420 Taylor Street Whole Loan is 61.3%.
| Sources and Uses | ||||||
| Sources | Proceeds | % of Total | Uses | Proceeds | % of Total | |
| Whole Loan | $88,000,000 | 100.0% | Loan Payoff | $49,083,476 | 55.8% | |
| Upfront Reserves | 18,428,071 | 20.9% | ||||
| Closing Costs | 4,244,414 | 4.8% | ||||
| Return of Equity | 16,244,038 | 18.5% | ||||
| Total Sources | $88,000,000 | 100.0% | Total Uses | $88,000,000 | 100.0% | |
The Borrowers / Borrower Sponsors. The borrowers are 420 Taylor Ventures, LLC, NT 420 Taylor Owner LLC, 420 Taylor Holdings Owner LLC and NH 420 Taylor Owner LLC (collectively, the “Borrowers”), each a Delaware limited liability company and single purpose entity with two independent directors. The Borrowers have fee simple ownership of the 420 Taylor Street Property as tenants-in-common. The Borrowers are indirectly controlled by a joint venture between Seven Equity Group (“SEG”) and Nakash Holdings (“Nakash” and collectively with SEG, the “Borrower Sponsors”). The non-recourse guarantors are Raymond Falack and Ralph Nakash. SEG is a real estate owner, developer and operator focused on managing and redeveloping office, retail, mixed use and multifamily buildings in major U.S. markets. Raymond Falack is the managing principal of SEG. Prior to SEG, Mr. Falack spent seven years at Wells Fargo where he held various senior positions in Wells Fargo’s Corporate Investment Banking Group and Distressed Real Estate Groups. Mr. Falack originated over $3 billion of new credit for the bank and managed, repositioned, leased, worked out and sold over $500 million in distressed real estate and notes in both the San Francisco and New York offices. Nakash is the private investment office of the Nakash family of Jordache Enterprises, an American clothing manufacturing company. Nakash manages a multi-billion dollar portfolio of investments, which include aviation, retail, agriculture, transportation, manufacturing and real estate assets situated around the world. The real estate portfolio consists of institutional quality retail, office, multifamily and hospitality properties. Legal counsel to the Borrowers delivered a non-consolidation opinion in connection with the origination of the 420 Taylor Street Whole Loan.
THE INFORMATION IN THIS STRUCTURAL AND COLLATERAL TERM SHEET IS NOT COMPLETE AND MAY BE AMENDED PRIOR TO THE TIME OF SALE. THIS TERM SHEET IS NOT AN OFFER TO SELL THESE SECURITIES AND IT IS NOT A SOLICITATION OF AN OFFER TO BUY THESE SECURITIES IN ANY JURISDICTION WHERE THE OFFER OR SALE IS NOT PERMITTED.
126
420 Taylor Street San Francisco, CA 94102 | Collateral Asset Summary – Loan No. 9 420 Taylor Street | Cut-off Date Balance: Cut-off Date LTV: U/W NCF DSCR: U/W NOI Debt Yield: | $38,000,000 61.3% 1.67x 9.4% |
The Property.
| Tenant Summary(1) | |||||||
| Tenant | Floor | Credit Rating (Moody's/Fitch/S&P) | Net Rentable Area (Sq. Ft.) | % of Net Rentable Area | Annual U/W Base Rent Per Sq. Ft. | % of Total Annual U/W Base Rent | Lease Expiration(2) |
| NextDoor | Upper Level Office | NR / NR / NR | 62,679 | 53.9% | $83.00 | 54.1% | 2/1/2029 |
| NextDoor | Lower Level Office | NR / NR / NR | 53,087 | 45.7% | $83.00 | 45.9% | 2/1/2029 |
| Total / Wtd. Avg. Occupied | 115,766 | 99.6% | $83.00 | 100.0% | |||
| Vacant(3) | 450 | 0.4% | |||||
| Total / Wtd. Avg. | 116,216 | 100.0% | |||||
| (1) | Based on the underwritten rent roll as of July 6, 2020. |
| (2) | The NextDoor lease is structured with one, five-year extension option upon expiration of the NextDoor lease and pursuant to NextDoor providing 12 months’ notice to renew the lease. The NextDoor lease is structured with no contraction rights to either the Upper Level Office or Lower Level Office space. |
| (3) | Vacant space represents the ground floor retail component of the 420 Taylor Street Property. |
| Lease Rollover Schedule(1) | ||||||||
| Year | # of Leases Expiring | Total Expiring Sq. Ft. | % of Total Sq. Ft. Expiring | Cumulative Sq. Ft. Expiring | Cumulative % of Sq. Ft. Expiring | Annual U/W Base Rent per Sq. Ft. | % Annual U/W Base Rent Rolling | Cumulative % of U/W Base Rent |
| MTM | 0 | 0 | 0.0% | 0 | 0.0% | $0.00 | 0.0% | 0.0% |
| 2020 | 0 | 0 | 0.0% | 0 | 0.0% | $0.00 | 0.0% | 0.0% |
| 2021 | 0 | 0 | 0.0% | 0 | 0.0% | $0.00 | 0.0% | 0.0% |
| 2022 | 0 | 0 | 0.0% | 0 | 0.0% | $0.00 | 0.0% | 0.0% |
| 2023 | 0 | 0 | 0.0% | 0 | 0.0% | $0.00 | 0.0% | 0.0% |
| 2024 | 0 | 0 | 0.0% | 0 | 0.0% | $0.00 | 0.0% | 0.0% |
| 2025 | 0 | 0 | 0.0% | 0 | 0.0% | $0.00 | 0.0% | 0.0% |
| 2026 | 0 | 0 | 0.0% | 0 | 0.0% | $0.00 | 0.0% | 0.0% |
| 2027 | 0 | 0 | 0.0% | 0 | 0.0% | $0.00 | 0.0% | 0.0% |
| 2028 | 0 | 0 | 0.0% | 0 | 0.0% | $0.00 | 0.0% | 0.0% |
| 2029(2) | 1 | 115,766 | 99.6% | 115,766 | 99.6% | $83.00 | 100.0% | 100.0% |
| 2030 | 0 | 0 | 0.0% | 115,766 | 99.6% | $0.00 | 0.0% | 100.0% |
| 2031 & Thereafter | 0 | 0 | 0.0% | 115,766 | 99.6% | $0.00 | 0.0% | 100.0% |
| Vacant(3) | NAP | 450 | 0.4% | 116,216 | 100.0% | NAP | NAP | NAP |
| Total / Wtd. Avg. | 1 | 116,216 | 100.0% | $83.00 | 100.0% | |||
| (1) | Based on the underwritten rent roll as of July 6, 2020. |
| (2) | 2029 represents the executed lease for NextDoor. The NextDoor lease is structured with one, five-year extension option upon expiration initial terms and pursuant to NextDoor providing 12 months’ notice to renew the lease. |
| (3) | Vacant represents the ground floor retail component of the 420 Taylor Street Property. |
The 420 Taylor Street Property is a four-story, Class B, creative office building totaling 116,216 sq. ft. located in the Union Square submarket of San Francisco, California. The 420 Taylor Street Property is comprised of an 115,766 sq. ft. office component and an additional 450 sq. ft. ground floor retail component. The 420 Taylor Street Property’s improved creative office space features an efficient open layout, high ceilings, exposed ductwork, natural light through a central atrium and private roof deck. The office component consists of two spaces, an upper level office, which is comprised of the second, third and fourth floors totaling 62,679 sq. ft. (the “Upper Level Office”) and a lower level office which is comprised of the sub-level, first and mezzanine floors totaling 53,087 sq. ft. (the “Lower Level Office”).
The 420 Taylor Street Property’s space originally consisted of a parking garage located on the Lower Level Office floors. The Borrower Sponsors spent the approximately two years following their acquisition of the 420 Taylor Street Property obtaining entitlements to convert the existing parking garage into the Lower Level Office space. The conversion and base building work of the Lower Level Office is still underway and is scheduled to be completed and delivered to the tenant in September 2020. The conversion of the original parking garage into office space will also create an additional 450 sq. ft. ground floor retail component that will benefit from the 420 Taylor Street Property’s visibility along Taylor and O’Farrell streets.
When the Borrower Sponsors acquired the 420 Taylor Street Property in October 2016, it was occupied by Reddit. Reddit was paying approximately $64.00 per sq. ft. throughout its lease term. Despite the Borrower Sponsors plans to increase the office space at the property through the conversion of the lower level parking garage, Reddit ultimately vacated the 420 Taylor Street Property as the rapid growth of the company necessitated more space than the building could offer. Following Reddit’s departure in March 2020, the Borrower Sponsors executed a lease with NextDoor, Inc. (“NextDoor”) within two months for the entire office component at the 420 Taylor Street Property. The 420 Taylor Street Property will serve as the global headquarters for NextDoor. As of July 2020, the office component is 100.0% leased to NextDoor. NextDoor took possession of the Upper Level Office space in May 2020 and is currently undergoing the tenant buildout for the space. As of July 2020, the tenant is currently paying rent for the Upper Level Office.
THE INFORMATION IN THIS STRUCTURAL AND COLLATERAL TERM SHEET IS NOT COMPLETE AND MAY BE AMENDED PRIOR TO THE TIME OF SALE. THIS TERM SHEET IS NOT AN OFFER TO SELL THESE SECURITIES AND IT IS NOT A SOLICITATION OF AN OFFER TO BUY THESE SECURITIES IN ANY JURISDICTION WHERE THE OFFER OR SALE IS NOT PERMITTED.
127
420 Taylor Street San Francisco, CA 94102 | Collateral Asset Summary – Loan No. 9 420 Taylor Street | Cut-off Date Balance: Cut-off Date LTV: U/W NCF DSCR: U/W NOI Debt Yield: | $38,000,000 61.3% 1.67x 9.4% |
The buildout of the Lower Level Office is expected to cost approximately $13.8 million with approximately $5.0 million remaining to be completed as of June 2020. After delivery of the space to NextDoor in September 2020, NextDoor is anticipated to begin paying rent in January 2021 following a six-month tenant buildout. There will be a two month free rent period beginning on the expected rent commencement date in January 2021.
In addition to the conversion of the parking garage to the Lower Level Office space, the Borrower Sponsors undertook the base building work for the Upper Level Office component. The Borrower Sponsors completed the base building work on May 7, 2020 and has delivered the Upper Level Office to NextDoor.
COVID-19 Update. As of July 1, 2020, the 420 Taylor Street Loan is not subject to any modification or forbearance request. NextDoor has not requested any rent relief or lease modifications. NextDoor took possession of the Upper Level Office space in May 2020 and is currently undergoing the tenant buildout for the space. As of July 2020, the tenant is currently paying rent for the Upper Level Office.
Major Tenants.
NextDoor, Inc. (115,766 sq. ft., 99.6% of NRA; 100.0% of U/W Base Rent). NextDoor executed its lease for the office component at the 420 Taylor Street Property in November 2019. NextDoor began paying rent for the Upper Level Office in July 2020. Rent has not yet commenced on the Lower Level Office, the conversion of the Lower Level Office is still underway and is scheduled to be completed in September 2020 with an expected rent commencement date in January 2021 (with two months of free rent beginning on the rent commencement date in January 2021). NextDoor is a social networking platform for neighborhoods, which is available online and through its mobile application. The privately-held, San Francisco based company was founded in 2008 to create a platform whereby neighbors can work together to build stronger, safer, happier communities, all over the world. NextDoor allows neighbors to connect, stay informed, and find trusted local information to address their daily needs. The company operates in over 250,000 neighborhoods across 11 countries including the United States, United Kingdom, France, Germany, Netherlands, Italy, Spain, Denmark, Sweden, and Canada. Within the United States alone, NextDoor provides service to over 100,000 neighborhoods. NextDoor has created a new program in connection with a partnership with Walmart that will improve logistics for vulnerable community members seeking assistance for trips to Walmart. NextDoor executed a lease with a term of eight years and 10 months. The lease is structured with one, five year extension option. Pursuant to terms set forth in the lease, NextDoor has provided an approximately $5,872,366 initial security deposit in the form of an irrevocable letter of credit, which was taken as additional collateral for the Upper Level Office which increases by approximately $4,973,696 upon delivery of the Lower Level Office. The total security deposit will be approximately $10,846,063.
Upon delivery of the Lower Level Office, expected to occur in September 2020 (the “Lower Level Office Delivery Date”), NextDoor is required to deliver additional security deposit such that the total amount of security deposit would be approximately $10,846,063. Commencing on the fourth anniversary of the Lower Level Office Delivery Date and each year thereafter during the initial term of the lease, NextDoor is permitted to reduce the security deposit in accordance with the terms of the lease, resulting in approximately $5,337,076 remaining on deposit by the eighth anniversary of the Lower Level Office Delivery Date. The security deposit was collaterally assigned to JPMCB at loan origination.
Environmental Matters. According to a Phase I environmental report, dated March 26, 2020, there are no recognized environmental conditions or recommendations for further action at the 420 Taylor Street Property.
The Market. The 420 Taylor Street Property is located within the San Francisco-Oakland-Hayward, California Metropolitan Statistical Area (“MSA”). San Francisco and the greater Bay Area are known for the fields of technology, life science/biotech, hardware, software, social media, and alternative energy, due, in part, to the presence of Stanford University and the University of California Berkeley, which provide a base of intellectual capital. According to the appraisal, of all major cities, San Francisco has the second-highest percentage of residents with a college degree, behind only Seattle. More than two-thirds of Bay Area residents have training beyond high school and above 43% have attained a four-year college degree or higher. While San Francisco covers a relatively small land area of approximately 45 square miles, it is the geographic center of the nine counties that comprise the Bay Area and the fourth largest metropolitan area in the United States.
The MSA has historically benefited from the synergy of Silicon Valley. The Silicon Valley region is a worldwide technology center and regional employment center. Desirable physical features and well-diversified economy contribute to attracting both businesses and residents. The MSA is a leader in technology and a regional employment center.
San Francisco and the greater Bay Area are also home to the fifth largest corporate base of Fortune 500 companies in the United States. The region’s venture capital community and research and academic institutions have spawned global technology and biotechnology companies including Google, Apple, Facebook, Salesforce, Oracle, Cisco Systems, EBay, Genentech, and Gilead. In addition, the region continues to foster a host of next wave companies including Uber, Twitter, Dropbox, Airbnb, Square, and Okta.
According to the appraisal as of year-end 2019, the MSA had a total population of 4,781,196 and experienced an annual growth rate of 1.1%, which reflected a higher annual growth rate than the state of California at a rate of 0.8%. At year-end 2019, the MSA accounted for
THE INFORMATION IN THIS STRUCTURAL AND COLLATERAL TERM SHEET IS NOT COMPLETE AND MAY BE AMENDED PRIOR TO THE TIME OF SALE. THIS TERM SHEET IS NOT AN OFFER TO SELL THESE SECURITIES AND IT IS NOT A SOLICITATION OF AN OFFER TO BUY THESE SECURITIES IN ANY JURISDICTION WHERE THE OFFER OR SALE IS NOT PERMITTED.
128
420 Taylor Street San Francisco, CA 94102 | Collateral Asset Summary – Loan No. 9 420 Taylor Street | Cut-off Date Balance: Cut-off Date LTV: U/W NCF DSCR: U/W NOI Debt Yield: | $38,000,000 61.3% 1.67x 9.4% |
approximately 12.0% of the total California population of 39,848,262. According to a third party market report, San Francisco's economy grew rapidly in the expansion cycle and maintained strength heading into 2020 before the coronavirus pandemic hit. The trajectory of San Francisco's economy and its commercial real estate sector will depend on how widely the virus spreads, and how long containment policies like social distancing need to be maintained.
The 420 Taylor Street Property is located in the Union Square submarket of San Francisco, California. The Union Square submarket is known as one of the most prominent upscale retail markets in San Francisco but also contains a large office inventory. The submarket is surrounded by major office sub-markets including the Financial District, Rincon/South Beach and South of Market. High-rise office buildings are not as common in the Union Square submarket as they are in the Financial District. Commercial development in the area is typically a combination of small to mid-rise offices, street level stores below multi-family units, or consists of larger, mid-rise buildings dedicated to a single retailer. Larger commercial buildings are located throughout the immediate area and surrounding Union Square. Union Square is a 2.6 acre plaza bordered by Geary, Powell, Post and Stockton Street. The plaza refers to the central shopping, hotel, and theater district that surrounds the plaza for several blocks. This one-block plaza and nearby area is one of the largest collections of department stores, upscale boutiques, tourist shops, art galleries, and salons in the Western United States and has served as continuing major draw for tourists where approximately 17.3 million tourists visit San Francisco per year.
The Union Square submarket benefits from its proximity to downtown San Francisco located north of Market Street between Kearny and Taylor Streets in San Francisco's urban core, an area with abundant transportation options. The city of San Francisco is served by freeways, rail, air, and bus service. The major freeways that run through San Francisco are Route 101 and Interstate 80. Caltrain connects cities in San Francisco, Santa Clara and Contra Costa counties via high speed trains. The San Francisco International Airport is located approximately 12 miles south of the 420 Taylor Street Property.
According to the appraisal, the estimated 2019 population within a one-, three- and five-mile radius of the 420 Taylor Street Property was approximately 150,758, 468,759 and 754,941, respectively. The estimated 2019 average household income within a one-, three- and five-mile radius was approximately $107,979, $147,800 and $146,813. According to a third party market report as of June 2020, average asking rents for the Union Square submarket were at $87.15 per sq. ft. for four and five star properties representing an approximately 5.4% increase from year end 2018. According to the appraisal as of the first quarter of 2020 the vacancy rate in the San Francisco market is at 6.3% which is lower than the 10 year average in the market of 8.2%. There was approximately 187,598 sq. ft. under-construction in the Union Square submarket of which 115,766 sq. ft. is associated with the expansion of the 420 Taylor Street Property office space. The Lower Level Office buildout represents 28.3% of the total sq. ft. under construction while the completed Upper Level office represents 33.4% of the total sq. ft. under construction.
The appraiser identified four office rent comparables from other Class B in the Union Square office submarket and the surrounding submarkets. Base rent across approximately 238,861 sq. ft. of recently executed leases ranges from $77.00 (modified gross) to $88.00 (modified gross) per sq. ft. (highlighted in the chart below). The appraisal concluded a contractual base rent for office space on a modified gross basis of $85.00 per sq. ft. for the 420 Taylor Street Property.
| Office Building Comparables(1) | ||||||
| Property Address | Lessee | Lease Date | NRA | Lease Term | Lease Type | Rent per Sq. Ft. |
| 360 3rd Street | WPP | Sept-2020 | 113,480 | 5.0 Yrs. | Modified Gross | $88.00 |
| 135 Post Street | AppAnnie | Apr-2020 | 26,000 | 7.0 Yrs. | Modified Gross | $80.00 |
| 875 Howard Street | Glu Mobile | Oct-2019 | 61,381 | 8.0 Yrs. | Modified Gross | $84.00 |
| 747 Front Street | Minted | May-2019 | 38,000 | 7.0 Yrs. | Modified Gross | $77.00 |
| Total | 238,861 | |||||
| (1) | Based on the Appraisal. |
THE INFORMATION IN THIS STRUCTURAL AND COLLATERAL TERM SHEET IS NOT COMPLETE AND MAY BE AMENDED PRIOR TO THE TIME OF SALE. THIS TERM SHEET IS NOT AN OFFER TO SELL THESE SECURITIES AND IT IS NOT A SOLICITATION OF AN OFFER TO BUY THESE SECURITIES IN ANY JURISDICTION WHERE THE OFFER OR SALE IS NOT PERMITTED.
129
420 Taylor Street San Francisco, CA 94102 | Collateral Asset Summary – Loan No. 9 420 Taylor Street | Cut-off Date Balance: Cut-off Date LTV: U/W NCF DSCR: U/W NOI Debt Yield: | $38,000,000 61.3% 1.67x 9.4% |
Cash Flow Analysis.
| Cash Flow Analysis(1)(2) | ||
| U/W | U/W PSF(3) | |
| Base Rent(4) | $9,608,578 | $83.00 |
| Vacant Income(5) | 38,250 | $85.00 |
| Gross Potential Rent | $9,646,828 | $83.01 |
| CAM Reimbursements | 118,844 | $1.02 |
| Gross Potential Income | $9,765,672 | $84.03 |
| Less: Vacancy & Credit Loss | (488,284) | ($4.20) |
| Antenna Income | 48,000 | $0.41 |
| Effective Gross Income | $9,325,388 | $80.24 |
| Total Expenses | 1,035,842 | $8.91 |
| Net Operating Income | $8,289,546 | $71.33 |
| Capital Expenditures | 23,243 | $0.20 |
| TI/LC | 116,216 | $1.00 |
| Net Cash Flow | $8,150,087 | $70.13 |
| (1) | Based on the underwritten rent roll dated July 6, 2020. For avoidance of doubt, no COVID-19 specific adjustments have been incorporated in the lender U/W. |
| (2) | Historical financials are not available as the 420 Taylor Street Property recently expanded its space in September 2018 through negotiated entitlements of the previously existing parking component. |
| (3) | Base Rent U/W PSF is based on the total office component square footage and excludes 450 sq. ft. of ground floor retail space. Vacant Income U/W PSF is based on the retail component sq. ft. exclusively. |
| (4) | Base Rent is underwritten to $83.00 per sq. ft. for the Upper Level Office and Lower Level Office. NextDoor took occupancy of the Upper Level Office in May 2020 and is expected to take occupancy of the Lower Level Office in September 2020. |
| (5) | Vacant Income represents the ground floor retail suite representing 450 sq. ft. which is currently vacant and is being grossed up at the brokers concluded market rent of $85.00 per sq.ft. |
Property Management. The 420 Taylor Street Property is currently managed by SEG Taylor LLC, a Delaware limited liability company and affiliate of the Borrower Sponsors.
Lockbox / Cash Management. The 420 Taylor Street Whole Loan documents require a hard lockbox and in-place cash management. The Borrowers were required at loan origination to deliver within three days following the origination date tenant direction letters to the existing tenant at the 420 Taylor Street Property directing the tenant to remit its rent checks directly to the lender-controlled lockbox. All funds in the lockbox account are required to be swept to a lender-controlled cash management account every business day. Provided no Cash Sweep Period (as defined below) is continuing, all funds remaining in the cash management account will be transferred into the Borrowers’ operating account. During a Cash Sweep Period, all excess cash in the cash management account after payment of debt service, required reserves, operating expenses, and approved extraordinary expenses will be retained by the lender as additional collateral for the 420 Taylor Street Whole Loan.
A “Cash Sweep Period” will commence upon the occurrence of (i) an event of default, (ii) a bankruptcy action of any individual Borrower or an affiliated property manager, (iii) the debt service coverage ratio based on the trailing three-month period immediately preceding the date of determination being less than 1.20x (on an amortizing basis) (a “DSCR Trigger Event”), or (iv) a Specified Tenant Trigger Event (as defined below).
A Cash Sweep Period will cease to exist upon the following events (each, a “Cash Sweep Event Cure”): with respect to (a) clause (i) above, a cure of such event of default, (b) clause (ii) above solely with respect to the affiliated property manager, the replacement of the affiliated property manager with a qualified manager under a replacement management agreement in accordance with the 420 Taylor Street Whole Loan documents, (c) clause (ii) above solely with respect to the applicable Borrower, if the bankruptcy action is due to an involuntary petition against the applicable Borrower, (A) such Borrower has not (y) colluded or otherwise consented to or acquiesced in a legal proceeding to the filing of such involuntary petition against the Borrower, or (z) solicited creditors for such involuntary petition against the Borrower and (B) the bankruptcy action is dismissed, without, in the lender’s sole discretion, any adverse consequences to the 420 Taylor Street Whole Loan or the 420 Taylor Street Property within 60 days after the occurrence thereof, (d) clause (iii) above, the achievement of a debt service coverage ratio of 1.25x or greater for two consecutive calendar quarters based upon a 30-year amortization on the trailing three-month period immediately preceding the end of such calendar quarter (a “DSCR Cure Event”), and (e) clause (iv) above, the achievement of a Specified Tenant Trigger cure; provided (1) no other event of default is continuing under any 420 Taylor Street Whole Loan documents, (2) a Cash Sweep Event Cure may occur no more than a total of five times in the aggregate during the term of the 420 Taylor Street Whole Loan (except for a DSCR Cure Event or a Specified Tenant Trigger cure, which may occur an unlimited number of times during the term of the 420 Taylor Street Whole Loan), (3) the Borrowers will have paid all of the lender’s reasonable and actual out-of-pocket costs and expenses, and (4) in no event may the Borrowers have the right to cure a Cash Sweep Period caused by a bankruptcy action of the Borrowers if such bankruptcy action is filed by the Borrowers voluntarily or is filed involuntarily against the Borrowers and the Borrowers have (y) colluded or otherwise consented to or acquiesced in a legal proceeding to the filing of such involuntary petition against the Borrowers, or (z) solicited creditors for such involuntary petition against the Borrowers.
THE INFORMATION IN THIS STRUCTURAL AND COLLATERAL TERM SHEET IS NOT COMPLETE AND MAY BE AMENDED PRIOR TO THE TIME OF SALE. THIS TERM SHEET IS NOT AN OFFER TO SELL THESE SECURITIES AND IT IS NOT A SOLICITATION OF AN OFFER TO BUY THESE SECURITIES IN ANY JURISDICTION WHERE THE OFFER OR SALE IS NOT PERMITTED.
130
420 Taylor Street San Francisco, CA 94102 | Collateral Asset Summary – Loan No. 9 420 Taylor Street | Cut-off Date Balance: Cut-off Date LTV: U/W NCF DSCR: U/W NOI Debt Yield: | $38,000,000 61.3% 1.67x 9.4% |
A “Specified Tenant Trigger Event” means any of the following: (i) if NextDoor or any replacement tenant approved by the lender in accordance with the 420 Taylor Street Whole Loan documents (a “Specified Tenant”) or its guarantor is the subject of a bankruptcy action, (ii) a Specified Tenant terminates 20% or more of its lease (including, without limitation, rejection in any bankruptcy or similar insolvency proceeding) and/or its lease or guaranty failing to otherwise be in full force and effect and/or a Specified Tenant abandons 20% or more of its space (or providing written notice thereof), (iii) if a Specified Tenant or its guarantor is in material default under its lease or guaranty, as applicable, beyond applicable notice and cure periods, (iv) from and after original occupancy of the Specified Tenant space, any Specified Tenant failing to be in actual, physical possession of its space, if a Specified Tenant “goes dark” or vacates its space or gives notice that it intends to “go dark” or vacate its space, or (v) if a Specified Tenant gives notice that it is terminating its lease for 20% or more of its space, or relocating to another property, (vi) if any Specified Tenant enters into one or more subleases for more than 50% of its space in the aggregate (other than to an affiliate), (vii) the date that is 12 months prior to the then-current expiration date of a Specified Tenant’s lease, or (viii) the origination date of the 420 Taylor Street Whole Loan.
A Specified Tenant Trigger Event may be cured upon the following: (a) the replacement of the applicable Specified Tenant with one or more acceptable replacement tenants in accordance with the 420 Taylor Street Whole Loan documents; (b) with respect to clause (i) above, either the applicable Specified Tenant and its guarantor, as applicable, affirming its lease or guaranty thereof, as applicable, in the applicable bankruptcy or similar insolvency proceeding pursuant to a final, non-appealable order of a court of competent jurisdiction (and receipt by the lender of evidence thereof reasonably acceptable to lender) with no changes to such lease or guaranty thereof, as applicable, or the dismissal of such bankruptcy proceeding pursuant to a final, non-appealable order of the bankruptcy court (as evidenced by evidence reasonably acceptable to the lender); (c) with respect to clause (iii) above, the lender’s receipt of reasonably satisfactory evidence that the default under the lease (and guaranty thereof, as applicable) has been cured; (d) with respect to clause (v) above, the lender’s receipt of reasonably satisfactory evidence that the applicable Specified Tenant has revoked or rescinded all termination, cancellation or relocation notices with respect to its lease (and guaranty thereof, as applicable) and has reaffirmed its lease (and guaranty thereof, as applicable) as being in full force and effect; (e) with respect to clause (vi) above, either (A) the lender’s receipt of reasonably satisfactory evidence that such sublease(s) is/are terminated and the applicable Specified Tenant reoccupies the applicable space, or (B) if the lender approves such subtenant and sublease in accordance with the 420 Taylor Street Whole Loan documents; (f) with respect to clause (vii) above, either (x) the Borrowers provide evidence reasonably satisfactory to the lender that the applicable Specified Tenant has renewed its lease or (y) the applicable Specified Tenant is replaced with one or more acceptable replacement tenants in accordance with the 420 Taylor Street Whole Loan documents; and (g) with respect to clause (viii) above, (A) one or more Specified Tenants being in occupancy of the entire space and paying full contractual rent without right of offset or free rent credit with respect to the entire applicable space in accordance with the 420 Taylor Street Whole Loan documents, (B) delivery of a tenant estoppel from such Specified Tenant reasonably acceptable to the lender and (C) the Borrowers deliver to the lender reasonably satisfactory evidence that the Borrowers have performed and paid for all tenant improvements under the lease of such Specified Tenant and that there are no unpaid leasing commissions in accordance with the 420 Taylor Street Whole Loan documents.
Initial and Ongoing Reserves. At origination, the Borrowers deposited (i) approximately $8,447,054 for outstanding tenant improvements, (ii) $4,834,237 for lower level conversion work, (iii) $3,811,699 for bridge rent, (iv) approximately $1,222,625 (the “Minimum Balance”) for debt service (the amount representing the aggregate amount of the monthly debt service payment amount for three months), (v) $98,219 for taxes, (vi) $9,685 for tenant improvement and leasing commissions (vii) $2,615 for insurance and (viii) $1,937 for replacement reserves.
Tax Reserve. The Borrowers are required to deposit into a real estate tax reserve, on a monthly basis, 1/12 of the estimated annual real estate taxes, which currently equates to approximately $49,110 per month (approximately $0.42 per sq. ft.).
Insurance Reserve. The Borrowers are required to deposit into an insurance reserve, on a monthly basis, 1/12 of estimated insurance premiums, which currently equates to $2,615 per month (approximately $0.02 per sq. ft.). In the event the borrower obtains and maintains a blanket insurance policy acceptable to the lender and no event of default has occurred and is continuing, the requirement for monthly deposits into the insurance reserve will be waived.
Replacement Reserve. On each payment date, the Borrowers are required to deposit into the replacement reserve $1,937.
TI/LC Reserve. On each payment date, the Borrowers are required to deposit into the replacement reserve $9,685, subject to a cap of $581,080.
Static Debt Service Reserve. On each payment date following any disbursement of the amount then on deposit (the “Debt Service Reserve Funds”) in accordance with the 420 Taylor Street Whole Loan documents, the Borrowers are required to deposit into a static debt service reserve account all sums remaining in the cash management account after payment of debt service, required reserves, operating expenses, and approved extraordinary expenses until the balance therein equals the Minimum Balance or, on or after September 6, 2025, the amount equal to then-current monthly debt service payment amount multiplied by three.
THE INFORMATION IN THIS STRUCTURAL AND COLLATERAL TERM SHEET IS NOT COMPLETE AND MAY BE AMENDED PRIOR TO THE TIME OF SALE. THIS TERM SHEET IS NOT AN OFFER TO SELL THESE SECURITIES AND IT IS NOT A SOLICITATION OF AN OFFER TO BUY THESE SECURITIES IN ANY JURISDICTION WHERE THE OFFER OR SALE IS NOT PERMITTED.
131
420 Taylor Street San Francisco, CA 94102 | Collateral Asset Summary – Loan No. 9 420 Taylor Street | Cut-off Date Balance: Cut-off Date LTV: U/W NCF DSCR: U/W NOI Debt Yield: | $38,000,000 61.3% 1.67x 9.4% |
Letter of Credit Proceeds Reserve. During the term of the 420 Taylor Street Whole Loan, at any time that the Borrowers draw on the letter of credit given by NextDoor to Borrowers as security for the NextDoor lease, the Borrowers are required to cause such proceeds to be deposited into a letter of credit proceeds reserve account.
Current Mezzanine or Subordinate Indebtedness. None.
Future Mezzanine or Subordinate Indebtedness Permitted. None.
Partial Release. None.
THE INFORMATION IN THIS STRUCTURAL AND COLLATERAL TERM SHEET IS NOT COMPLETE AND MAY BE AMENDED PRIOR TO THE TIME OF SALE. THIS TERM SHEET IS NOT AN OFFER TO SELL THESE SECURITIES AND IT IS NOT A SOLICITATION OF AN OFFER TO BUY THESE SECURITIES IN ANY JURISDICTION WHERE THE OFFER OR SALE IS NOT PERMITTED.
132
(THIS PAGE INTENTIONALLY LEFT BLANK)
133
3000 Post Oak Boulevard Houston, TX 77056 | Collateral Asset Summary – Loan No. 10 3000 Post Oak | Cut-off Date Balance: Cut-off Date LTV: U/W NCF DSCR: U/W NOI Debt Yield: | $35,000,000 55.6% 2.19x 12.0% |
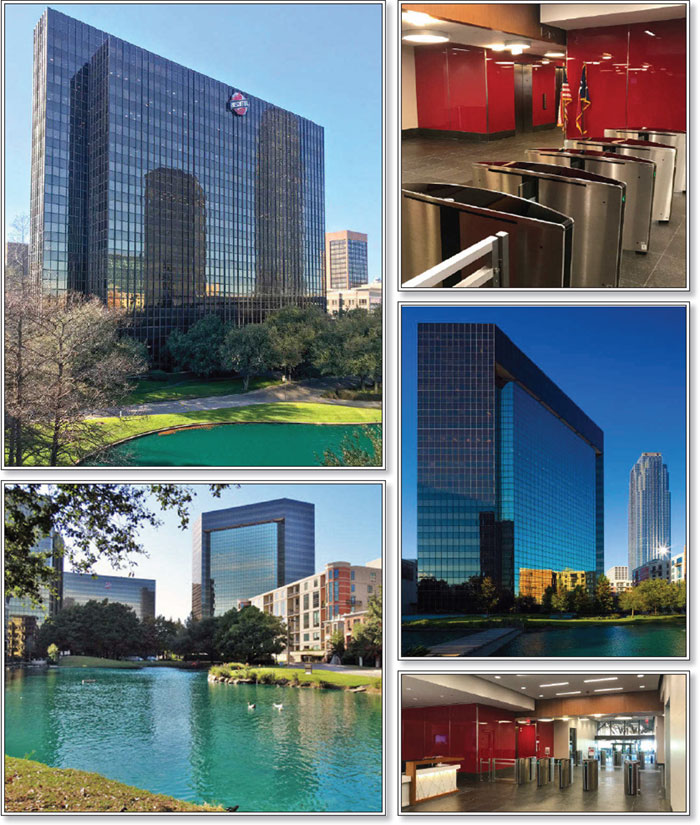
THE INFORMATION IN THIS STRUCTURAL AND COLLATERAL TERM SHEET IS NOT COMPLETE AND MAY BE AMENDED PRIOR TO THE TIME OF SALE. THIS TERM SHEET IS NOT AN OFFER TO SELL THESE SECURITIES AND IT IS NOT A SOLICITATION OF AN OFFER TO BUY THESE SECURITIES IN ANY JURISDICTION WHERE THE OFFER OR SALE IS NOT PERMITTED.
134
3000 Post Oak Boulevard Houston, TX 77056 | Collateral Asset Summary – Loan No. 10 3000 Post Oak | Cut-off Date Balance: Cut-off Date LTV: U/W NCF DSCR: U/W NOI Debt Yield: | $35,000,000 55.6% 2.19x 12.0% |
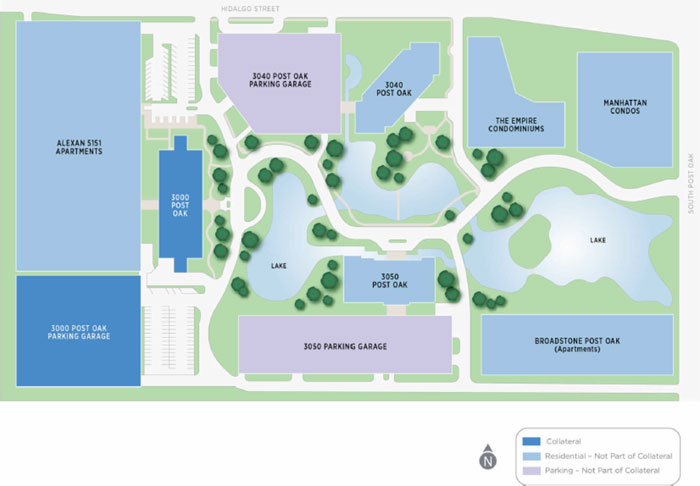
THE INFORMATION IN THIS STRUCTURAL AND COLLATERAL TERM SHEET IS NOT COMPLETE AND MAY BE AMENDED PRIOR TO THE TIME OF SALE. THIS TERM SHEET IS NOT AN OFFER TO SELL THESE SECURITIES AND IT IS NOT A SOLICITATION OF AN OFFER TO BUY THESE SECURITIES IN ANY JURISDICTION WHERE THE OFFER OR SALE IS NOT PERMITTED.
135
3000 Post Oak Boulevard Houston, TX 77056 | Collateral Asset Summary – Loan No. 10 3000 Post Oak | Cut-off Date Balance: Cut-off Date LTV: U/W NCF DSCR: U/W NOI Debt Yield: | $35,000,000 55.6% 2.19x 12.0% |
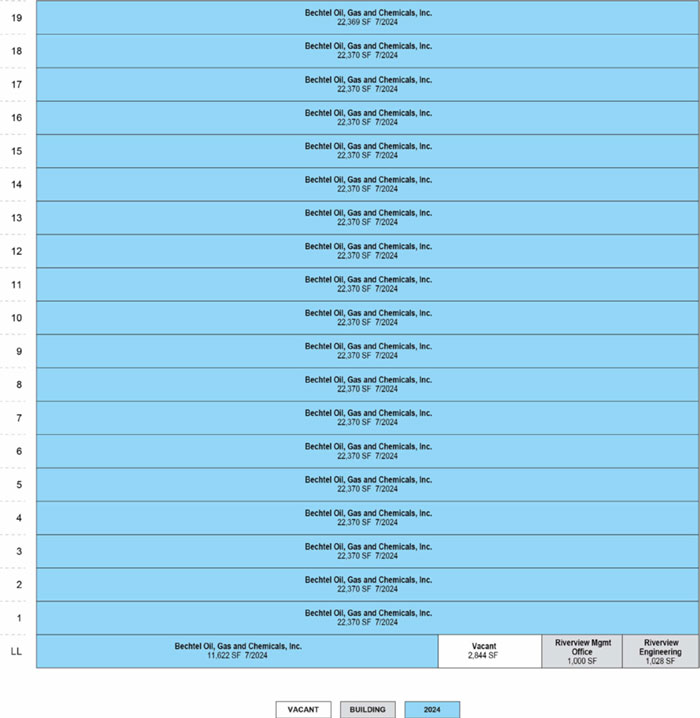
THE INFORMATION IN THIS STRUCTURAL AND COLLATERAL TERM SHEET IS NOT COMPLETE AND MAY BE AMENDED PRIOR TO THE TIME OF SALE. THIS TERM SHEET IS NOT AN OFFER TO SELL THESE SECURITIES AND IT IS NOT A SOLICITATION OF AN OFFER TO BUY THESE SECURITIES IN ANY JURISDICTION WHERE THE OFFER OR SALE IS NOT PERMITTED.
136
3000 Post Oak Boulevard Houston, TX 77056 | Collateral Asset Summary – Loan No. 10 3000 Post Oak | Cut-off Date Balance: Cut-off Date LTV: U/W NCF DSCR: U/W NOI Debt Yield: | $35,000,000 55.6% 2.19x 12.0% |
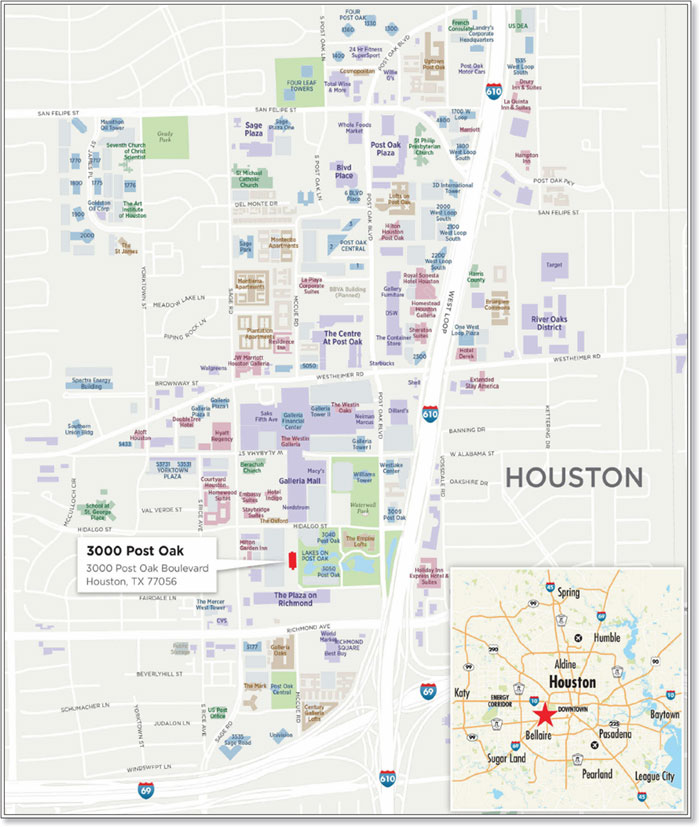
THE INFORMATION IN THIS STRUCTURAL AND COLLATERAL TERM SHEET IS NOT COMPLETE AND MAY BE AMENDED PRIOR TO THE TIME OF SALE. THIS TERM SHEET IS NOT AN OFFER TO SELL THESE SECURITIES AND IT IS NOT A SOLICITATION OF AN OFFER TO BUY THESE SECURITIES IN ANY JURISDICTION WHERE THE OFFER OR SALE IS NOT PERMITTED.
137
3000 Post Oak Boulevard Houston, TX 77056 | Collateral Asset Summary – Loan No. 10 3000 Post Oak | Cut-off Date Balance: Cut-off Date LTV: U/W NCF DSCR: U/W NOI Debt Yield: | $35,000,000 55.6% 2.19x 12.0% |
| Mortgage Loan Information | |
| Loan Seller: | JPMCB |
| Loan Purpose: | Refinance |
| Borrower Sponsor: | Norman Bobrow |
| Borrower: | LOPO 2 SPE LP |
| Original Balance(1): | $35,000,000 |
| Cut-off Date Balance(1): | $35,000,000 |
| % by Initial UPB: | 3.7% |
| Interest Rate: | 4.98750% |
| Payment Date: | 1st of each month |
| First Payment Date: | April 1, 2020 |
| Maturity Date: | March 1, 2025 |
| Amortization: | Interest Only |
| Additional Debt(1)(2) : | $45,000,000 Pari Passu Debt; |
| $20,000,000 Mezzanine Debt | |
| Call Protection(3): | L(28), D(26), O(6) |
| Lockbox / Cash Management: | Hard / In Place |
| Reserves(4) | |||
| Initial | Monthly | Cap | |
| Taxes: | $391,962 | $195,981 | NAP |
| Insurance: | $206,002 | $18,727 | NAP |
| Replacement: | $8,095 | $8,095 | NAP |
| TI/LC(5): | $55,190 | $55,190 | NAP |
| Property Information | |
| Single Asset / Portfolio: | Single Asset |
| Property Type: | CBD Office |
| Collateral: | Fee Simple |
| Location: | Houston, TX |
| Year Built / Renovated: | 1979 / 2014 |
| Total Sq. Ft.(6)(7): | 441,523 |
| Property Management: | Riverview Realty Management Texas LLC |
| Underwritten NOI: | $9,622,064 |
| Underwritten NCF: | $8,875,778 |
| Appraised Value(8): | $143,900,000 |
| Appraisal Date(8): | November 20, 2019 |
| Historical NOI(9) | |
| Most Recent NOI: | $9,984,787 (T-12 April 30, 2020) |
| 2019 NOI: | $9,943,455 (December 31, 2019) |
| 2018 NOI: | $9,775,556 (December 31, 2018) |
| 2017 NOI: | $9,611,788 (December 31, 2017) |
| Historical Occupancy | |
| Most Recent Occupancy(7): | 99.4% (July 1, 2020) |
| 2018 Occupancy: | 99.8% (December 31, 2018) |
| 2017 Occupancy: | 99.8% (December 31, 2017) |
| 2016 Occupancy: | 99.8% (December 31, 2016) |
| Financial Information(1) | ||||||
| Tranche | Cut-off Date Balance | Balance PSF Cut-off / Balloon(6)(7) | LTV Cut-off / Balloon(8) | U/W DSCR NOI / NCF | U/W Debt Yield NOI / NCF | U/W Debt Yield at Balloon NOI / NCF |
| Mortgage Loan | $35,000,000 | |||||
| Pari Passu Notes | 45,000,000 | |||||
| Whole Loan | $80,000,000 | $181 / $181 | 55.6% / 55.6% | 2.38x / 2.19x | 12.0% / 11.1% | 12.0% / 11.1% |
| Mezzanine Loan | 20,000,000 | |||||
| Total Debt | $100,000,000 | $226 / $226 | 69.5% / 69.5% | 1.58x / 1.46x | 9.6% / 8.9% | 9.6% / 8.9% |
| (1) | The 3000 Post Oak Loan (as defined below) consists of the controlling Note A-1 and is part of 3000 Post Oak Whole Loan (as defined below) evidenced by three pari passu notes with an aggregate outstanding principal balance as of the Cut-off Date of $80.0 million. For additional information, see “The Loan” herein. |
| (2) | See “Current Mezzanine or Subordinate Indebtedness” herein. |
| (3) | The lockout period will be at least 28 payments beginning with and including the first payment date of April 1, 2020. The borrower has the option to defease the full $80.0 million 3000 Post Oak Whole Loan after the earlier to occur of (i) two years after the closing date of the securitization that includes the last note to be securitized and (ii) February 6, 2024. The assumed lockout period of 28 months is based on the expected closing date of the Benchmark 2020-B18 securitization in July 2020. The actual lockout period may be longer. |
| (4) | See “Initial and Ongoing Reserves” herein. |
| (5) | On a monthly basis, the borrower is required to deposit $55,190 for tenant improvements and leasing commission (or approximately $1.50 per sq. ft. annually) as well as any lease termination fees or payments received in connection with the termination of any lease at the 3000 Post Oak Property. |
| (6) | Total Sq. Ft. does not include square footage associated with a 2,283-space parking garage utilized by Bechtel Oil, Gas and Chemicals, Inc.’s (“Bechtel”) pursuant to its lease. |
| (7) | Most Recent Occupancy and Total Sq. Ft. are inclusive of 2,028 sq. ft. associated with management and engineering space. |
| (8) | The appraisal provided a “Hypothetical Go Dark” value of $86.6 million, as of November 20, 2019, which assumes that Bechtel vacates the 3000 Post Oak Property (as defined below) and ceases rent payments under its lease. Based on the “Hypothetical Go Dark” value, the Whole Loan Cut-off Date LTV and the Total Debt Cut-off Date LTV are equal to 92.4% and 115.5%, respectively. |
| (9) | The increase from 2017 NOI through Most Recent NOI was attributable to contractual rent steps in connection with the Bechtel lease. |
THE INFORMATION IN THIS STRUCTURAL AND COLLATERAL TERM SHEET IS NOT COMPLETE AND MAY BE AMENDED PRIOR TO THE TIME OF SALE. THIS TERM SHEET IS NOT AN OFFER TO SELL THESE SECURITIES AND IT IS NOT A SOLICITATION OF AN OFFER TO BUY THESE SECURITIES IN ANY JURISDICTION WHERE THE OFFER OR SALE IS NOT PERMITTED.
138
3000 Post Oak Boulevard Houston, TX 77056 | Collateral Asset Summary – Loan No. 10 3000 Post Oak | Cut-off Date Balance: Cut-off Date LTV: U/W NCF DSCR: U/W NOI Debt Yield: | $35,000,000 55.6% 2.19x 12.0% |
The Loan. The 3000 Post Oak mortgage loan (the “3000 Post Oak Loan”) is part of a whole loan with an aggregate outstanding principal balance as of the Cut-off Date of $80.0 million (the “3000 Post Oak Whole Loan”) evidenced by three pari passu notes that are together secured by a first mortgage encumbering the borrower’s fee simple interest in a 441,523 sq. ft. Class A office building located in Houston, Texas (the “3000 Post Oak Property”). The 3000 Post Oak Loan, which is evidenced by the controlling Note A-1 and has an original principal balance as of the Cut-off Date of $35.0 million.
The relationship between the holders of the 3000 Post Oak Whole Loan will be governed by a co-lender agreement as described under “Description of the Mortgage Pool—The Whole Loans—The Serviced Pari Passu Whole Loans” in the Preliminary Prospectus.
| Whole Loan Summary | |||||
| Note | Original Balance | Cut-off Date Balance | Note Holder | Controlling Piece | |
| Note A-1 | $35,000,000 | $35,000,000 | Benchmark 2020-B18 | Yes | |
| Note A-2 | 30,000,000 | 30,000,000 | Benchmark 2020-B17 | No | |
| Note A-3 | 15,000,000 | 15,000,000 | JPMCB(1) | No | |
| Whole Loan | $80,000,000 | $80,000,000 | |||
| (1) | The related note is currently held by JPMCB and is expected to be contributed to one or more future securitizations. |
The 3000 Post Oak Whole Loan has a five-year interest-only term and accrues interest at a rate of 4.98750% per annum. The 3000 Post Oak Whole Loan proceeds were used to refinance existing debt, pay closing costs and fund upfront reserves. Based on the “As Is” appraised value of $143.9 million as of November 20, 2019, the Cut-off Date LTV Ratio is 55.6%.
| Sources and Uses | ||||||
| Sources | Proceeds | % of Total | Uses | Proceeds | % of Total | |
| Whole Loan | $80,000,000 | 79.9% | Payoff Existing Debt | $98,054,587 | 97.9% | |
| Mezzanine Loan | 20,000,000 | 20.0% | Return of Equity | 1,428,368 | 1.4% | |
| Sponsor Equity | 144,203 | 0.1% | Closing Costs | 661,249 | 0.7% | |
| Total Sources | $100,144,203 | 100.0% | Total Uses | $100,144,203 | 100.0% | |
The Borrower / Borrower Sponsor. The borrower is LOPO 2 SPE LP, a Delaware limited partnership and special purpose entity with two independent directors in its organizational structure. The borrower sponsor and non-recourse guarantor is Norman Bobrow, the key principal of Norman Bobrow & Company Inc. Founded in 1980 and headquartered in New York City, Norman Bobrow & Company Inc. is an independently-owned commercial real estate brokerage. The borrower is controlled by AIP Asset Management (“AIP”), a Korean financial services and asset management company focused on offshore investments. With offices in South Korea, Australia, Singapore and New York, AIP has approximately $2.3 billion assets under management and has executed over $3.8 billion of transactions.
Under the limited liability company agreement (the “LOPO 2 LLC Agreement”) of LOPO 2 LLC, which indirectly owns 100% of the borrower (“LOPO 2”), between Norman Bobrow and FG US Holdings 2, LLC, as consideration for executing and delivering the guaranty for the 3000 Post Oak Whole Loan (the “Guaranty”), Norman Bobrow is required to be paid by LOPO 2, as an operating expense of LOPO 2, a fee of $350,000 per annum, payable in monthly installments equal to $29,166.67, for so long as, among other conditions: (i) Norman Bobrow remains a member of LOPO 2, and/or (ii) unless Norman Bobrow has been removed as a member of LOPO 2 for cause under the LOPO 2 LLC Agreement, the Guaranty remains in effect.
The Property.
| Tenant Summary(1) | ||||||
| Tenant | Credit Rating (Moody’s/Fitch/S&P) | Net Rentable Area (Sq. Ft.) | % of Net Rentable Area | U/W Base Rent Per Sq. Ft.(2) | % of Total U/W Base Rent(2) | Lease Expiration |
| Bechtel Oil, Gas and Chemicals, Inc.(3) | NR / NR / NR | 436,651 | 98.9% | $19.40 | 99.9% | 7/31/2024 |
| Total Major Office | 436,651 | 98.9% | $19.40 | 99.9% | ||
| Other Occupied(4) | 2,028 | 0.5% | $5.92 | 0.1% | ||
| Total Occupied / Wtd Avg. | 438,679 | 99.4% | $19.34 | 100.0% | ||
| Vacant | 2,844 | 0.6% | ||||
| Total / Wtd. Avg. | 441,523 | 100.0% | ||||
| (1) | Based on the underwritten rent roll dated July 1, 2020. |
| (2) | U/W Base Rent Per Sq. Ft. and % of Total U/W Base Rent is inclusive of contractual rent steps through February 2021. |
| (3) | Bechtel subleases 1,447 sq. ft. to Chevron Federal Credit Union. |
| (4) | Other Occupied is inclusive of 2,028 sq. ft. associated with management and engineering space. |
THE INFORMATION IN THIS STRUCTURAL AND COLLATERAL TERM SHEET IS NOT COMPLETE AND MAY BE AMENDED PRIOR TO THE TIME OF SALE. THIS TERM SHEET IS NOT AN OFFER TO SELL THESE SECURITIES AND IT IS NOT A SOLICITATION OF AN OFFER TO BUY THESE SECURITIES IN ANY JURISDICTION WHERE THE OFFER OR SALE IS NOT PERMITTED.
139
3000 Post Oak Boulevard Houston, TX 77056 | Collateral Asset Summary – Loan No. 10 3000 Post Oak | Cut-off Date Balance: Cut-off Date LTV: U/W NCF DSCR: U/W NOI Debt Yield: | $35,000,000 55.6% 2.19x 12.0% |
| Lease Rollover Schedule(1)(2) | ||||||||
| Year | # of Leases Expiring | Total Expiring Sq. Ft. | % of Total Sq. Ft. Expiring | Cumulative Sq. Ft. Expiring | Cumulative % of Sq. Ft. Expiring | Annual U/W Base Rent Per Sq. Ft.(3) | % U/W Base Rent Rolling | Cumulative % of U/W Base Rent |
| 2020 & MTM | 0 | 0 | 0.0% | 0 | 0.0% | $0.00 | 0.0% | 0.0% |
| 2021 | 0 | 0 | 0.0% | 0 | 0.0% | $0.00 | 0.0% | 0.0% |
| 2022 | 0 | 0 | 0.0% | 0 | 0.0% | $0.00 | 0.0% | 0.0% |
| 2023 | 0 | 0 | 0.0% | 0 | 0.0% | $0.00 | 0.0% | 0.0% |
| 2024 | 1 | 436,651 | 98.9% | 436,651 | 98.9% | $19.40 | 99.9% | 99.9% |
| 2025 | 0 | 0 | 0.0% | 436,651 | 98.9% | $0.00 | 0.0% | 99.9% |
| 2026 | 0 | 0 | 0.0% | 436,651 | 98.9% | $0.00 | 0.0% | 99.9% |
| 2027 | 0 | 0 | 0.0% | 436,651 | 98.9% | $0.00 | 0.0% | 99.9% |
| 2028 | 0 | 0 | 0.0% | 436,651 | 98.9% | $0.00 | 0.0% | 99.9% |
| 2029 | 0 | 0 | 0.0% | 436,651 | 98.9% | $0.00 | 0.0% | 99.9% |
| 2030 | 0 | 0 | 0.0% | 436,651 | 98.9% | $0.00 | 0.0% | 99.9% |
| 2031 & Thereafter(4) | 1 | 2,028 | 0.5% | 438,679 | 99.4% | $5.92 | 0.1% | 100.0% |
| Vacant | NAP | 2,844 | 0.6% | 441,523 | 100.0% | NAP | NAP | |
| Total / Wtd. Avg. | 2 | 441,523 | 100.0% | $19.34 | 100.0% | |||
| (1) | Based on the underwritten rent roll dated July 1, 2020. |
| (2) | Certain tenants may have termination or contraction options (which may become exercisable prior to the originally stated expiration date of the tenant lease) that are not considered in the above Lease Rollover Schedule. |
| (3) | Annual U/W Base Rent Per Sq. Ft. is inclusive of contractual rent steps through February 2021. |
| (4) | 2031 & Thereafter is inclusive of 2,028 sq. ft. associated with management and engineering space. |
The 3000 Post Oak Property is a 19-story, 441,523 sq. ft. Class A office building located in Houston, Texas. The 3000 Post Oak Property also includes an adjacent 10-story parking garage containing 2,283 parking spaces, resulting in a parking ratio of approximately 5.2 spaces per 1,000 sq. ft., which is above the competitive set’s parking ratios of 2.8 to 3.4 spaces per 1,000 sq. ft. according to the appraisal. The office building was constructed in 1979 while the parking garage, with a direct canopy link to the office building, was constructed in September 2014 by prior ownership for approximately $22.9 million in connection with the renewal of Bechtel’s lease. The 3000 Post Oak Property is part of The Lakes on Post Oak office park, which consists of the 3000 Post Oak Property, a 22-story office building and a 17-story office building totaling approximately 1.2 million sq. ft. The Lakes on Post Oak office park has a weighted average occupancy of 91.9%.
AIP acquired the 3000 Post Oak Property in 2014 for approximately $170.0 million (approximately $385 per sq. ft.) and has since invested approximately $1.8 million in capital improvements including the replacement of main electrical breakers, chillers and the fire panel control system. The previous owner updated common area restrooms, corridors and lobbies in 2013 and constructed the 2,283 space parking garage in 2014.
Major Tenant.
Bechtel Oil, Gas and Chemicals, Inc. (436,615 sq. ft., 98.9% of NRA, 99.9% of U/W Base Rent) is an engineering, procurement, construction and project management company serving the infrastructure, power, water, nuclear, security, environmental, oil, gas and chemicals and mining and metals markets. Bechtel reported $25.5 billion in revenue as of year-end 2018 and was ranked the 14th largest American private company by Forbes as of 2019. Headquartered at the 3000 Post Oak Property, Bechtel has been a tenant since 1988 and has invested its own capital into its space including the upgrade of elevator cab finishes, dispatch programs and digital monitoring systems, restrooms, lobby finishes and common areas. Bechtel’s space at the 3000 Post Oak Property is designed with movable partition walls to provide flexibility in terms of space size, configuration and special access depending on project needs. Bechtel most recently executed a 10-year lease extension in July 2014 with a lease expiration date in July 2024 with two, five year extension options subject to an 18-month notice period and no termination options. Bechtel’s lease requires triple net (“NNN”) rent of $7.50 per sq. ft. for its lower level space and $19.25 per sq. ft. for floors one through 19. Bechtel also pays fixed monthly rent of $152,810 for exclusive use of the parking garage.
The 3000 Post Oak Whole Loan is structured with a cash flow sweep commencing on (a) April 1, 2021 if Bechtel fails to extend its lease for five years or the borrower fails to find an approved replacement tenant subject to certain leasing conditions or (b) the occurrence of tenant triggers including Bechtel terminating its lease, giving notice of termination or abandoning its premises, among other conditions as outlined in the 3000 Post Oak Whole Loan documents.
COVID-19 Update. As of July 1, 2020, the 3000 Post Oak Property remains 99.4% leased. Bechtel is current with respect to all contractual rent obligations for April, May and June of 2020 and has not expressed concerns regarding their ability to pay rent or stay in occupancy. The 3000 Post Oak Loan is current through the July 1, 2020 payment date. As of July 1, 2020, the 3000 Post Oak Loan is not subject to any modification or forbearance request.
THE INFORMATION IN THIS STRUCTURAL AND COLLATERAL TERM SHEET IS NOT COMPLETE AND MAY BE AMENDED PRIOR TO THE TIME OF SALE. THIS TERM SHEET IS NOT AN OFFER TO SELL THESE SECURITIES AND IT IS NOT A SOLICITATION OF AN OFFER TO BUY THESE SECURITIES IN ANY JURISDICTION WHERE THE OFFER OR SALE IS NOT PERMITTED.
140
3000 Post Oak Boulevard Houston, TX 77056 | Collateral Asset Summary – Loan No. 10 3000 Post Oak | Cut-off Date Balance: Cut-off Date LTV: U/W NCF DSCR: U/W NOI Debt Yield: | $35,000,000 55.6% 2.19x 12.0% |
Environmental Matters. The Phase I environmental report dated December 10, 2019 recommended no further action at the 3000 Post Oak Property.
The Market. The 3000 Post Oak Property is located in Houston, Texas, approximately 6.0 miles to the west of the Houston central business district and approximately 19.0 miles to the southwest of the George Bush Intercontinental Airport. The 3000 Post Oak Property provides convenient access to major thoroughfares in the area including Interstate 610 and Highway 59. Additionally, the 3000 Post Oak Property is located in an area known as the Galleria, which contains a mixture of office, retail, residential and hotel properties located along the West Loop section of Interstate 610. The Galleria, owned by Simon Property Group, is the fourth largest retail complex in the country, hosting more than 24 million visitors annually and offering more than 400 stores, 60 restaurants, two hotels and a full-sized ice rink. Houston benefits from significant trade and export links due to its location on the Gulf Coast of Texas, as evidenced by its leadership in the energy, oil and gas technology industries. According to the appraisal, Houston demonstrated a 3.9% unemployment rate as of 2019. Additionally, Houston experienced a 1.5% annual increase in gross metro product, 1.8% annual increase in population and 1.5% annual increase in total employment from 2014 to 2019. According to the appraisal, as of 2019, the population within a one-, three- and five-mile radius of the 3000 Post Oak Property was 27,186, 218,256 and 537,039, respectively. Additionally, over the same time period, the average household income within a one-, three- and five-mile radius was $120,943, $128,957 and $121,752, respectively.
The 3000 Post Oak Property is located within the Galleria/Uptown Class A submarket of the Houston office market. As of the second quarter of 2020, the Houston office market consisted of approximately 334.1 million sq. ft. of office space with an overall market vacancy of 17.5% and average gross asking rents of $28.27 per sq. ft. The Galleria/Uptown Class A submarket totaled approximately 16.9 million sq. ft. with an average vacancy of 17.0% and average gross asking rents of $31.22 per sq. ft. According to the appraisal, the Galleria/Uptown submarket is considered an upper tier submarket in Houston and has experienced stable gross asking rents ranging between $35.69 and $36.93 per sq. ft. within the past two years. There have been no completions within the Galleria/Uptown office submarket since the first quarter of 2018.
The appraisal identified seven office rent comparables for the 3000 Post Oak Property. Comparable buildings were built between 1972 and 2019 and range in size from 60,934 to 400,101 sq. ft. Effective asking rents for NNN leases at the comparable properties ranged between $19.50 and $28.00 per sq. ft. with a weighted average office rent of approximately $22.82 per sq. ft. The 3000 Post Oak Property’s in-place base rent (not inclusive of the lower level space) is $19.73 per sq. ft., below the appraisal’s concluded office market rent of $21.00 per sq. ft.
Cash Flow Analysis.
| Cash Flow Analysis | ||||||
| 2017 | 2018 | 2019 | TTM(1) | U/W | U/W PSF | |
| Base Rent(2) | $7,811,896 | $8,004,930 | $8,202,214 | $8,268,802 | $8,484,987 | $19.22 |
| Vacant Income | 0 | 0 | 0 | 0 | 49,770 | $0.11 |
| Gross Potential Rent | $7,811,896 | $8,004,930 | $8,202,214 | $8,268,802 | $8,534,757 | $19.33 |
| Total Reimbursements | 5,349,709 | 5,015,476 | 4,908,423 | 4,844,395 | 5,025,432 | $11.38 |
| Net Rental Income | $13,161,606 | $13,020,407 | $13,110,637 | $13,113,197 | $13,560,189 | $30.71 |
| (Vacancy/Credit Loss) | 0 | 0 | 0 | 0 | (678,009) | $(1.54) |
| Other Income(3) | 1,951,945 | 1,913,613 | 1,890,732 | 1,888,157 | 1,898,956 | $4.30 |
| Effective Gross Income | $15,113,551 | $14,934,019 | $15,001,369 | $15,001,353 | $14,781,135 | $33.48 |
| Total Expenses | $5,501,762 | $5,158,463 | $5,057,914 | $5,016,567 | $5,159,071 | $11.68 |
| Net Operating Income(4) | $9,611,788 | $9,775,556 | $9,943,455 | $9,984,787 | $9,622,064 | $21.79 |
| TI/LC | 0 | 0 | 0 | 0 | 657,981 | $1.49 |
| Capital Expenditures | 0 | 0 | 0 | 0 | 88,305 | $0.20 |
| Net Cash Flow | $9,611,788 | $9,775,556 | $9,943,455 | $9,984,787 | $8,875,778 | $20.10 |
| (1) | TTM column represents the trailing 12-month period ending April 30, 2020. |
| (2) | U/W Base Rent is inclusive of contractual rent steps through February 2021. For avoidance of doubt, no COVID-19 specific adjustments have been incorporated in the lender U/W. |
| (3) | Other Income includes contractual parking revenue of $152,810 per month pursuant to Bechtel’s lease and antenna income. |
| (4) | The increase from 2016 NOI through TTM NOI was attributable to contractual rent steps in connection with Bechtel’s lease. |
Property Management. The 3000 Post Oak Property is managed by Riverview Realty Management Texas LLC, an Illinois limited liability company.
Lockbox / Cash Management. The 3000 Post Oak Whole Loan is structured with a hard lockbox and in-place cash management. The borrower was required at origination to deliver tenant direction letters instructing all tenants to deposit rents into a lender controlled lockbox account. All funds in the lockbox account are required to be transferred on each business day to or at the direction of the borrower. All funds in the lockbox account are required to be swept on each business day to a cash management account under the control of the lender to be applied and disbursed for payment of taxes, insurance premiums, debt service, reserves, and other amounts payable in accordance with the loan documents, and, so long as no Cash Sweep Event (as defined below) is then continuing, disbursed to the
THE INFORMATION IN THIS STRUCTURAL AND COLLATERAL TERM SHEET IS NOT COMPLETE AND MAY BE AMENDED PRIOR TO THE TIME OF SALE. THIS TERM SHEET IS NOT AN OFFER TO SELL THESE SECURITIES AND IT IS NOT A SOLICITATION OF AN OFFER TO BUY THESE SECURITIES IN ANY JURISDICTION WHERE THE OFFER OR SALE IS NOT PERMITTED.
141
3000 Post Oak Boulevard Houston, TX 77056 | Collateral Asset Summary – Loan No. 10 3000 Post Oak | Cut-off Date Balance: Cut-off Date LTV: U/W NCF DSCR: U/W NOI Debt Yield: | $35,000,000 55.6% 2.19x 12.0% |
borrower. During the continuance of a Cash Sweep Event, funds shall also be applied and disbursed by lender for operating expenses, extraordinary expenses, and all excess cash flow funds remaining in the cash management account after the application of such funds in accordance with the loan documents are required to be held by the lender in an excess cash flow reserve account as additional collateral for the 3000 Post Oak Whole Loan. To the extent he Cash Sweep Event is caused by an event of default or bankruptcy action of the borrower, the lender may apply such funds in such order and priority as the lender determines. The lender has been granted a first priority security interest in the cash management account.
A “Cash Sweep Event” means the occurrence and continuation of (i) an event of default, (ii) mezzanine loan event of default, (iii) any bankruptcy action of the borrower or property manager, (iv) a DSCR Trigger Event (as defined below) or (v) a 3000 Post Oak Specified Tenant Trigger (as defined below).
A Cash Sweep Event may be cured no more than five times in the aggregate during the term of the 3000 Post Oak Whole Loan if, with respect to a Cash Sweep Event caused solely by (a) clause (i) and clause (ii) above, the lender has accepted a cure by the borrower of the related event of default or mezzanine loan event of default, (b) clause (iii) above, the borrower has replaced the property manager with a qualified manager under a replacement management agreement within 60 days in accordance with the 3000 Post Oak Whole Loan documents, (c) clause (iv) above, a DSCR Cure Event (as defined below), or (d) clause (v) above, a 3000 Post Oak Specified Tenant Trigger Cure (as defined below).
“DSCR Trigger Event” means the debt service coverage ratio of the 3000 Post Oak Whole Loan (as calculated in accordance with the loan documents) based on the trailing three-month period immediately preceding the date of determination is less than 1.30x.
“DSCR Cure Event” means the debt service coverage ratio of the 3000 Post Oak Whole Loan (as calculated in accordance with the 3000 Post Oak Whole loan documents), based on the trailing three-month period immediately preceding the date of determination, is at least 1.30x for two consecutive quarters.
“3000 Post Oak Specified Tenant Trigger” means (i) April 1, 2021, (ii) any bankruptcy action of Bechtel or any replacement tenant of Bechtel (a “Specified Tenant”) or its parent company, Bechtel Corporation (iii) any termination or cancellation of any Specified Tenant lease and/or such lease or any guaranty of such lease failing to be in full force and effect and/or any Specified Tenant abandoning its premises, (iv) any Specified Tenant being in monetary default or material non-monetary default under the applicable Specified Tenant lease beyond applicable notice and cure periods, (v) any Specified Tenant going dark, vacating or abandoning its premises at the 3000 Post Oak Property with respect to 50% or more of its space, (vi) any Specified Tenant giving notice that it is terminating its lease for any portion of its space, or (vii) if any Specified Tenant subleases 25% or more of its space.
“3000 Post Oak Specified Tenant Trigger Cure” means with respect to a 3000 Post Oak Specified Tenant Trigger Event caused by events described in (a) clauses (i) through (vii) above, the borrower provides satisfactory evidence that it has replaced the applicable Specified Tenant with one or more leases approved by the lender in accordance with the 3000 Post Oak Whole loan documents with one or more acceptable replacement Specified Tenants; (b) by the events described in clause (i) above (in addition to the conditions described in (a)), among other conditions, if the borrower provides satisfactory evidence that such Specified Tenant has extended its lease for an additional term of at least five years pursuant to an amendment or new lease approved by the lender in accordance with the 3000 Post Oak Whole Loan documents; (c) clause (ii) above, (A) the applicable Specified Tenant affirming its lease in the applicable bankruptcy action pursuant to a final order of a court or the dismissal of such bankruptcy proceeding, (B) the applicable Specified Tenant is in physical occupancy of the space covered by its lease and paying full rent, (C) the borrower delivers a satisfactory estoppel certificate, and (D) the borrower delivers a satisfactory evidence that the borrower has performed and paid for all tenant improvements relating to its lease and that there are no unpaid leasing commissions associated with its lease; (d) clause (iv) above, the lender’s receipt of satisfactory evidence that the default under the applicable Specified Tenant lease has been cured and an estoppel certificate; (e) clause (v) above, the lender’s receipt of satisfactory evidence that, among other things, the vacant or dark space referenced above is leased and the tenant is paying full rent, and an estoppel; (f) clause (vi) above, the applicable Specified Tenant’s revocation of all termination or cancellation notices; and (g) clause (vii) above, such sublease is terminated and the Specified Tenant re-occupies not less than 76% of its premises as evidenced by an estoppel.
Initial and Ongoing Reserves. At loan origination, the borrower deposited (i) $391,962 into a real estate tax reserve, (ii) $206,002 into an insurance reserve, (iii) $55,190 into a TI/LC reserve and (iv) $8,095 for capital expenditures.
Tax Reserve. The borrower is required to deposit into a real estate tax reserve, on a monthly basis, 1/12 of the estimated annual real estate taxes, which currently equates to approximately $195,981 per month.
Insurance Reserve. The borrower is required to deposit into an insurance reserve, on a monthly basis, 1/12 of the estimated insurance premiums, which currently equates to $18,727 per month. In the event the borrower obtains and maintains a blanket insurance policy acceptable to the lender and no event of default has occurred and is continuing, the requirement for monthly deposits into the insurance reserve will be waived.
Replacements Reserve. The borrower is required to deposit into the replacement reserve, on a monthly basis, $8,095 per month.
THE INFORMATION IN THIS STRUCTURAL AND COLLATERAL TERM SHEET IS NOT COMPLETE AND MAY BE AMENDED PRIOR TO THE TIME OF SALE. THIS TERM SHEET IS NOT AN OFFER TO SELL THESE SECURITIES AND IT IS NOT A SOLICITATION OF AN OFFER TO BUY THESE SECURITIES IN ANY JURISDICTION WHERE THE OFFER OR SALE IS NOT PERMITTED.
142
3000 Post Oak Boulevard Houston, TX 77056 | Collateral Asset Summary – Loan No. 10 3000 Post Oak | Cut-off Date Balance: Cut-off Date LTV: U/W NCF DSCR: U/W NOI Debt Yield: | $35,000,000 55.6% 2.19x 12.0% |
TI/LC Reserve. The borrower is required to deposit into the TI/LC reserve, on a monthly basis, $55,190 per month.
Current Mezzanine or Subordinate Indebtedness. The 3000 Post Oak mezzanine loan, with an aggregate outstanding principal balance as of the Cut-off Date of $20.0 million (the “3000 Post Oak Mezzanine Loan”), accrues interest at a fixed rate of 10.00000% per annum. The 3000 Post Oak Mezzanine Loan has a five-year term and is interest only for the full term. Based on the 3000 Post Oak Whole Loan and the 3000 Post Oak Mezzanine Loan, the cumulative Cut-off Date LTV is 69.5%, the cumulative U/W NCF DSCR is 1.46x and the cumulative U/W NOI Debt Yield is 9.6%. For additional information, see “Description of the Mortgage Pool—Additional Indebtedness—Mezzanine Indebtedness” in the Preliminary Prospectus.
Future Mezzanine or Subordinate Indebtedness Permitted. None.
Partial Release. None.
THE INFORMATION IN THIS STRUCTURAL AND COLLATERAL TERM SHEET IS NOT COMPLETE AND MAY BE AMENDED PRIOR TO THE TIME OF SALE. THIS TERM SHEET IS NOT AN OFFER TO SELL THESE SECURITIES AND IT IS NOT A SOLICITATION OF AN OFFER TO BUY THESE SECURITIES IN ANY JURISDICTION WHERE THE OFFER OR SALE IS NOT PERMITTED.
143
1655 3rd Street and 1725 3rd Street San Francisco, CA 94158 | Collateral Asset Summary – Loan No. 11 & 12 Chase Center Towers I & II | Cut-off Date Balance: Cut-off Date LTV: U/W NCF DSCR: U/W NOI Debt Yield: | $33,750,000 31.3% 3.87x 13.9% |
| Mortgage Loan Information | |
| Loan Seller: | JPMCB |
| Loan Purpose: | Refinance |
| Credit Assessment | |
| (Fitch/KBRA/S&P)(14): | BBB-sf / BBB-(sf) / N/A |
| Borrower Sponsors: | GSW Sports LLC; Uber Technologies, Inc.; Alexandria Real Estate Equities, Inc. |
| Borrowers(1): | ECOP Tower I Owner LLC; ECOP Tower II Owner LLC |
| Original Balance(2)(3): | $33,750,000 |
| Cut-off Date Balance(2)(3): | $33,750,000 |
| % by Initial UPB: | 3.6% |
| Interest Rate(4): | 3.52203810% |
| Payment Date: | 10th of each month |
| First Payment Date: | May 10, 2020 |
| Maturity Date: | March 10, 2025 |
| Amortization: | Interest Only |
| Additional Debt: | $236,250,000 Pari Passu Debt; $155,000,000 B Notes; $175,000,000 C Notes |
| Call Protection(5)(6): | L(27), D(28), O(4) |
| Lockbox / Cash Management: | Hard / Springing |
| Reserves(7) | |||
| Initial | Monthly | Cap | |
| Taxes: | $0 | Springing | NAP |
| Insurance: | $0 | Springing | NAP |
| Replacement: | $0 | Springing | NAP |
| TI/LC: | $0 | Springing | NAP |
| Outstanding TI’s: | $47,514,548 | $0 | NAP |
| Outstanding Repairs: | $15,163,800 | $0 | NAP |
| Common Charges: | $0 | Springing | NAP |
| Property Information | ||
| Single Asset / Portfolio(2): | Two Crossed Assets | |
| Property Type: | CBD Office | |
| Collateral: | Fee Simple | |
| Location: | San Francisco, CA | |
| Year Built / Renovated(8): | 2019 / NAP | |
| Total Sq. Ft.: | 586,208 | |
| Property Management: | ARE-San Francisco No. 68, LLC | |
| Underwritten NOI(9)(10)(13): | $37,458,664 | |
| Underwritten NCF(9)(10): | $37,341,422 | |
| Appraised Value(10)(11): | $863,500,000 | |
| Appraisal Date(11): | December 19, 2019 | |
| Historical NOI(12) | ||
| Most Recent NOI: | NAV | |
| 2019 NOI: | NAV | |
| 2018 NOI: | NAV | |
| 2017 NOI: | NAV | |
| Historical Occupancy(12) | ||
| Most Recent Occupancy(13): | 100.0% (July 10, 2020) | |
| 2019 Occupancy: | NAV | |
| 2018 Occupancy: | NAV | |
| 2017 Occupancy: | NAV | |
| Financial Information(2)(10) | ||||||
| Tranche | Cut-off Date Balance | Balance per Sq. Ft. Cut-off / Balloon | LTV Cut-off / Balloon | U/W DSCR NOI / NCF | U/W Debt Yield NOI / NCF | U/W Debt Yield at Balloon NOI / NCF |
| Mortgage Loan | $33,750,000 | |||||
| Pari Passu Notes | 236,250,000 | |||||
| Total Senior Notes | $270,000,000 | $461 / $461 | 31.3% / 31.3% | 3.89x / 3.87x | 13.9% / 13.8% | 13.9% / 13.8% |
| B Notes | $155,000,000 | $725 / $725 | 49.2% / 49.2% | 2.47x / 2.46x | 8.8% / 8.8% | 8.8% / 8.8% |
| C Notes | $175,000,000 | $1,024 / $1,024 | 69.5% / 69.5% | 1.37x / 1.36x | 6.2% / 6.2% | 6.2% / 6.2% |
| Whole Loan | $600,000,000 | $1,024 / $1,024 | 69.5% / 69.5% | 1.37x / 1.36x | 6.2% / 6.2% | 6.2% / 6.2% |
| (1) | There is no non-recourse carveout guarantor or separate environmental indemnitor for the Chase Center Towers whole loans (the “Chase Center Towers Whole Loans”). |
| (2) | The Chase Center Towers loans (the “Chase Center Tower Loans”) represent the cross-defaulted and cross-collateralized interests in the Chase Center Tower I loan (the “Chase Center Tower I Loan”) and the Chase Center Tower II loan (the “Chase Center Tower II Loan”). The financial information presented in the chart above reflects the aggregate Cut-off Date balance of the Chase Center Towers Loans. All information herein is represented on an aggregate basis, except as otherwise specified. |
| (3) | The Chase Center Towers Loans consist of the non-controlling Notes A-1-H and A-2-H and are part of the Chase Center Towers Whole Loans, evidenced by 16 senior pari passu notes and four subordinate notes, with an aggregate outstanding principal balance as of the Cut-off Date of $600.0 million. |
| (4) | Reflects the weighted average interest rate of the Chase Center Towers senior notes (the “Chase Center Senior Notes”) only. |
| (5) | The lockout period will be at least 27 payments beginning with and including the first payment date of May 10, 2020. At any time after the earlier of (i) second anniversary of the securitization closing date of the last note to be securitized and (ii) May 10, 2023 (such earlier date, the “Permitted Release Date”), the Chase Center Towers Whole Loans may be defeased as permitted under the loan documents. The assumed lockout period of 27 months is based on the expected closing date of the Benchmark 2020-B18 securitization in July 2020. The actual lockout period may be longer. After the Permitted Release Date in connection with the partial release of an individual building, repayment of an individual loan and uncrossing of the loans, a portion of, the Chase Center Towers Whole Loan may be prepaid with a prepayment fee in an amount equal to the greater of (i) the yield maintenance amount or (ii) 1.00% of the outstanding principal balance as of the prepayment date. |
| (6) | The Chase Center Towers Whole Loan documents provide that the Borrowers (as defined below) have the right to the release of an individual property from the lien of the mortgage, provided that the Borrowers satisfy certain terms and conditions to set forth in the cross agreement (the “Individual Loan Repayment Conditions”), including among other things (i) no event of default under the Chase Center Towers Whole Loan documents has occurred and is continuing, (ii) the individual Borrower making such request will (1) make a prepayment of the released loan in full in accordance with its respective loan agreement or defease the released loan in full, and (2) cause the Borrower under the remaining loan to either (x) pay to the remaining lender, an amount equal to 15% of the outstanding principal balance of the released loan including, interest for the full accrual period during which the prepayment occurs (or if such payment is made on a payment date, the full accrual period applicable to such payment date) and if such prepayment is made on or before the permitted prepayment date, the yield maintenance premium, which amount will be applied as a prepayment of the principal balance of the remaining loan or (y) defease the remaining loan in part by an amount equal to 15% of the outstanding principal balance of the released loan including interest that has or would have accrued on the portion of the remaining loan defeased for the full accrual period during which the partial defeasance occurs (or if such partial defeasance is made on a payment date, the full accrual period applicable to such payment date), (iii) delivery of evidence reasonably acceptable to the remaining lender that (A) the release property and the remaining property have been separately assessed for taxes and the release property constitutes or will constitute a separate tax lot, and (B) the lender receives evidence reasonably satisfactory to the lender that after giving effect to such release, the remaining property will continue to comply with all applicable laws (including all zoning, building, land use or parking or other similar legal requirements with respect to such property), (iv) subsequent to such release, the Borrower that owns the remaining property will continue to be a special purpose entity, (v) the debt service coverage ratio of the remaining loan, after giving effect to the release and to the partial prepayment of the remaining loan above, will be equal to or greater than the greater of (x) 1.45x for the release of the Chase Center Tower II and 1.43x for the release of the Chase Center Tower I and (y) the aggregate debt service coverage ratio immediately prior to such release, and (vi) the REMIC release requirements are satisfied. For more details regarding the release provisions of the Chase Center Towers Loan, see “Description of the Mortgage Pool—Certain Terms of the Mortgage Loans—Partial Releases” in the Preliminary Prospectus. |
THE INFORMATION IN THIS STRUCTURAL AND COLLATERAL TERM SHEET IS NOT COMPLETE AND MAY BE AMENDED PRIOR TO THE TIME OF SALE. THIS TERM SHEET IS NOT AN OFFER TO SELL THESE SECURITIES AND IT IS NOT A SOLICITATION OF AN OFFER TO BUY THESE SECURITIES IN ANY JURISDICTION WHERE THE OFFER OR SALE IS NOT PERMITTED.
144
1655 3rd Street and 1725 3rd Street San Francisco, CA 94158 | Collateral Asset Summary – Loan No. 11 & 12 Chase Center Towers I & II | Cut-off Date Balance: Cut-off Date LTV: U/W NCF DSCR: U/W NOI Debt Yield: | $33,750,000 31.3% 3.87x 13.9% |
| (7) | On each payment date, the Borrowers will be required to deposit with the lender one twelfth of the common charges and other regular assessments due under the condominium documents and master association documents that the lender reasonably estimates will be payable by the Borrowers under the condominium documents and master association documents during the next ensuing 12 months in order to accumulate with the lender sufficient funds to pay all such common charges at least 30 days prior to the respective due dates, provided that (i) the monthly deposits for common charges and any other amounts required to be deposited will be waived for each applicable month if (x) no event of default has occurred and is continuing, (y) the common charges are required to be paid by Uber or, if not paid directly by Uber, are paid by the Borrowers by the due date and reimbursed or required to be reimbursed to the Borrowers in accordance with the Uber lease, and (z) from and after the date that common charges or other regular assessments due under the condominium documents and master association documents commence being assessed and become due and payable thereunder, the Borrowers provide reasonable evidence of the payment of such common charges and/or other regular assessments that are then due and payable under the condominium documents and master association documents, as applicable for the applicable payment date |
| (8) | As of the Cut-off Date, construction of the Chase Center Tower Properties (as defined below) is substantially complete. The buildout of the interior space is currently underway and once completed Uber (as defined below) is expected to take occupancy. For more details on timing, see “The Property” herein. |
| (9) | Underwritten NOI and Underwritten NCF are inclusive of contractual rent steps through December 2020, consisting of annual increase of 3.0%. |
| (10) | All NOI, NCF and occupancy information, as well as the appraised value, were determined prior to the emergence of the novel coronavirus pandemic, and the economic disruption resulting from measures to combat the pandemic, and all DSCR, LTV and Debt Yield metrics were calculated, and the Chase Centers Towers Loans were underwritten, based on such prior information. See “Risk Factors—Coronavirus Pandemic Has Adversely Affected the Global Economy and Will Likely Adversely Affect the Performance of the Mortgage Loans” in the Preliminary Prospectus. |
| (11) | Appraised Value is reflective of the “Hypothetical As-If Funded” Appraised Value, which assumes all remaining construction and tenant improvements as of December 19, 2019 have been paid for or funded. At origination, the Borrowers reserved $62,678,348 for all outstanding tenant improvements and outstanding repairs. The “As-Is” appraised value as of December 19, 2019 is $789.1 million, which results in a Senior Notes and Whole Loan Cut-off LTV of approximately 34.2% and 76.0%, respectively. |
| (12) | Historical NOI and Historical Occupancy are unavailable as the collateral is newly constructed as of 2019. |
| (13) | Most Recent Occupancy and Underwritten NOI are inclusive of two executed leases with Uber (as defined below). Uber has begun paying rent, but is not yet in occupancy. Uber is expected to begin taking occupancy in August 2020 for the Northwest Tower and October 2020 for the Southwest Tower (see below for additional information). |
| (14) | Fitch and KBRA provided the listed assessments for the Chase Center Towers Loan in the context of its inclusion in the mortgage pool. |
The relationship between the holders of the Chase Center Towers Senior Notes, the Chase Center Tower senior-subordinate notes (the “Chase Center Tower Senior-Subordinate Notes”), and the Chase Center Towers junior-subordinate notes (the “Chase Center Towers Junior-Subordinate Notes”) will be governed by co-lender agreements as described under “Description of the Mortgage Pool—The Whole Loans—The Non-Serviced AB Whole Loans—The Chase Center Towers Whole Loan” in the Preliminary Prospectus.
| Whole Loan Summary(1)(2)(3) | |||||
| Note | Original Balance | Cut-off Date Balance | Note Holder | Controlling Piece | |
| Note A-1-A, A-2-A | $33,750,000 | $33,750,000 | Benchmark 2020-IG2 | No | |
| Note A-1-B, A-2-B | 33,750,000 | 33,750,000 | Benchmark 2020-IG2 | No | |
| Note A-1-C, A-2-C | 33,750,000 | 33,750,000 | Benchmark 2020-IG2 | No | |
| Note A-1-D, A-2-D | 33,750,000 | 33,750,000 | Benchmark 2020-IG3 | No | |
| Note A-1-E, A-2-E | 33,750,000 | 33,750,000 | Benchmark 2020-IG3 | No | |
| Note A-1-F, A-2-F | 33,750,000 | 33,750,000 | JPMDB 2020-COR7 | No | |
| Note A-1-G, A-2-G | 33,750,000 | 33,750,000 | JPMCB(5) | No | |
| Note A-1-H, A-2-H | 33,750,000 | 33,750,000 | Benchmark 2020-B18 | No | |
| Senior Notes | $270,000,000 | $270,000,000 | |||
| Note B-1, B-2(4) | 155,000,000 | 155,000,000 | Benchmark 2020-IG2 | No | |
| Note C-1, C-2(4) | 175,000,000 | 175,000,000 | Third Party(7) | Yes(6) | |
| Whole Loan | $600,000,000 | $600,000,000 | |||
| (1) | Representative of all promissory notes attributable to the cross-collateralized and cross-defaulted Chase Center Tower I Whole Loan and Chase Center Tower II Whole Loan. |
| (2) | All Notes designated with “A-1” and “A-2” are reflective of the Chase Center Tower I Senior Notes and Chase Center Tower II Senior Notes, respectively. Notes designated with “B-1” and “B-2” are reflective of the Chase Center Tower I Senior-Subordinate Notes and Chase Center Tower II Senior-Subordinate Notes, respectively. All Notes designated with “C-1” and “C-2” are reflective of the Chase Center Tower I Junior-Subordinate Notes and Chase Center Tower II Junior-Subordinate Notes, respectively. |
| (3) | The Notes above represent the combination of the Chase Center Tower I Loan and Chase Center Tower II Loan promissory notes which are allocated to their respective whole loans by an approximately 54.0% to 46.0% split, respectively. |
| (4) | The Chase Center Towers Senior-Subordinate Notes are subordinate in right of payment to the Chase Center Towers Senior Notes. The Chase Center Towers Junior-Subordinate Notes are subordinate in right of payment of the Chase Center Towers Senior Notes and the Chase Center Tower Senior-Subordinate Notes. |
| (5) | Expected to be contributed to one or more future securitizations. |
| (6) | The initial Control Notes are Note C-1 and Note C-2, so long as no Chase Center Towers control appraisal period has occurred and is continuing. See “Description of the Mortgage Pool—The Whole Loans—The Non-Serviced AB Whole Loans—The Chase Center Towers Whole Loans” in the Preliminary Prospectus. The Chase Center Towers Whole Loans will be serviced under the pooling and servicing agreement for the Benchmark 2020-IG2 transaction. |
| (7) | Note C-1 and C-2 are currently held by Security Benefit Life Insurance Company. |
The Chase Center Towers Whole Loans have a 59-month interest-only term. The Chase Center Towers Senior Notes, the Chase Center Towers Senior-Subordinate Notes and the Chase Center Towers Junior-Subordinate Notes accrue interest at weighted average fixed rates of approximately 3.52203810%, 3.52203812% and 6.875000% per annum, respectively. The proceeds of the Chase Center Towers Whole Loans were used to pay off existing construction debt encumbering the Chase Center Tower Properties of approximately $314.6 million, pay closing costs of approximately $20.4 million, fund escrows of approximately $62.7 million related to construction completion and tenant buildouts and return approximately $202.2 million of equity to the Borrower Sponsors (as defined below).
THE INFORMATION IN THIS STRUCTURAL AND COLLATERAL TERM SHEET IS NOT COMPLETE AND MAY BE AMENDED PRIOR TO THE TIME OF SALE. THIS TERM SHEET IS NOT AN OFFER TO SELL THESE SECURITIES AND IT IS NOT A SOLICITATION OF AN OFFER TO BUY THESE SECURITIES IN ANY JURISDICTION WHERE THE OFFER OR SALE IS NOT PERMITTED.
145
1655 3rd Street and 1725 3rd Street San Francisco, CA 94158 | Collateral Asset Summary – Loan No. 11 & 12 Chase Center Towers I & II | Cut-off Date Balance: Cut-off Date LTV: U/W NCF DSCR: U/W NOI Debt Yield: | $33,750,000 31.3% 3.87x 13.9% |
| Sources and Uses | |||||||||
| Sources | Proceeds | % of Total | Uses | Proceeds | % of Total | ||||
| Senior Notes | $270,000,000 | 45.0% | Loan Payoff(1) | $314,637,958 | 52.4% | ||||
| Senior-Subordinate Notes | 155,000,000 | 25.8 | Return of Equity | 202,236,155 | 33.7% | ||||
| Junior-Subordinate Notes | 175,000,000 | 29.2 | Upfront Reserves | 62,678,348 | 10.4% | ||||
| Closing Costs | 20,447,539 | 3.4% | |||||||
| Total Sources | $600,000,000 | 100.0% | Total Uses | $600,000,000 | 100.0% | ||||
| (1) | Loan Payoff is associated with the original construction loan for development of the Chase Center Towers Properties. |
The Borrowers / Borrower Sponsors. The borrowers are ECOP Tower I Owner LLC (“Tower I Borrower”) and ECOP Tower II Owner LLC (“Tower II Borrower” and together with the Tower I Borrower, collectively, the “Borrowers”), each, a Delaware limited liability company and single purpose entity with two independent directors. The Borrowers have entered into a cross-default and cross-collateralization agreement under which the Chase Center Towers I Loan and Chase Center Towers II Loan are cross-defaulted and cross-collateralized and are permitted to effectuate an uncross in accordance with the terms of such agreement. The Borrowers are indirectly owned or controlled by a joint venture between GSW Sports LLC (the ownership group of the Golden State Warriors NBA franchise), Uber Technologies, Inc. (“Uber”) and Alexandria Real Estate Equities, Inc. (“ARE”) (collectively the “Borrower Sponsors”). Uber owns 45.0% of the Borrowers and is also leasing 100.0% of the Chase Center Tower Properties. GSW Sports LLC owns 45.0% of the Borrowers and is comprised of the Golden State Warriors basketball franchise ownership group which is led Joe Lacob and Peter Guber. A business magazine ranks the Golden State Warriors as the NBA’s third most valuable franchise as of February 2020 at approximately $4.3 billion. ARE, which owns 10.0% of the Borrowers is also the manager of the joint venture that owns the Borrowers. ARE is a national development REIT focused on collaborative life science and technology campuses, with an asset base in North America of approximately 39.2 million sq. ft. as of December 31, 2019. Legal counsel to the Borrowers delivered a non-consolidation opinion in connection with the origination of the Chase Center Towers Whole Loans. There is no non-recourse carveout guarantor or separate environmental indemnitor for the Chase Center Towers Whole Loans.
In lieu of an environmental indemnity, the Borrower Sponsors provided a secured lender environmental policy.
The Property.
| Tenant Summary(1) | |||||||
| Building | Tenant | Credit Rating (Moody’s/Fitch/S&P)(2) | Net Rentable Area (Sq. Ft.) | % of Net Rentable Area | Annual U/W Base Rent per Sq. Ft.(3) | % of Total Annual U/W Base Rent(3) | Lease Expiration(4) |
| Chase Center Tower I | Uber Technologies, Inc. | B1 / NR / B- | 317,660 | 54.2% | $66.95 | 54.2% | 10/31/2039 |
| Chase Center Tower II | Uber Technologies, Inc. | B1 / NR / B- | 268,548 | 45.8% | 66.95 | 45.8% | 9/30/2039 |
| Total / Wtd. Avg. | 586,208 | 100.0% | $66.95 | 100.0% | |||
| (1) | Based on the underwritten rent roll. |
| (2) | In certain instances, ratings provided are those of the parent company of the entity shown, whether or not the parent company guarantees the lease. |
| (3) | Annual U/W Base Rent per sq. ft. and % of Total Annual U/W Base Rent are inclusive of contractual rent steps through December 2020. |
| (4) | Both leases are structured with one, 14-year extension option upon expiration of their respective initial terms. |
| Lease Rollover Schedule(1) | ||||||||
| Year | # of Leases Expiring | Total Expiring Sq. Ft. | % of Total Sq. Ft. Expiring | Cumulative Sq. Ft. Expiring | Cumulative % of Sq. Ft. Expiring | Annual U/W Base per sq. ft.(2) | % Annual U/W Rolling(2) | Cumulative % of U/W Base Rent(2) |
| MTM | 0 | 0 | 0.0% | 0 | 0.0% | $0.00 | 0.0% | 0.0% |
| 2020 | 0 | 0 | 0.0% | 0 | 0.0% | $0.00 | 0.0% | 0.0% |
| 2021 | 0 | 0 | 0.0% | 0 | 0.0% | $0.00 | 0.0% | 0.0% |
| 2022 | 0 | 0 | 0.0% | 0 | 0.0% | $0.00 | 0.0% | 0.0% |
| 2023 | 0 | 0 | 0.0% | 0 | 0.0% | $0.00 | 0.0% | 0.0% |
| 2024 | 0 | 0 | 0.0% | 0 | 0.0% | $0.00 | 0.0% | 0.0% |
| 2025 | 0 | 0 | 0.0% | 0 | 0.0% | $0.00 | 0.0% | 0.0% |
| 2026 | 0 | 0 | 0.0% | 0 | 0.0% | $0.00 | 0.0% | 0.0% |
| 2027 | 0 | 0 | 0.0% | 0 | 0.0% | $0.00 | 0.0% | 0.0% |
| 2028 | 0 | 0 | 0.0% | 0 | 0.0% | $0.00 | 0.0% | 0.0% |
| 2029 | 0 | 0 | 0.0% | 0 | 0.0% | $0.00 | 0.0% | 0.0% |
| 2030 & Thereafter | 2 | 586,208 | 100.0% | 586,208 | 100.0% | $66.95 | 100.0% | 100.0% |
| Vacant | 0 | 0 | 0.0% | 586,208 | 100.0% | NAP | NAP | NAP |
| Total / Wtd. Avg. | 2 | 586,208 | 100.0% | $66.95 | 100.0% | |||
| (1) | Based on the underwritten rent roll. |
| (2) | Annual U/W Base Rent per sq. ft., % Annual U/W Base Rent Rolling and Cumulative % of U/W Base Rent are inclusive of contractual rent steps through December 2020. |
THE INFORMATION IN THIS STRUCTURAL AND COLLATERAL TERM SHEET IS NOT COMPLETE AND MAY BE AMENDED PRIOR TO THE TIME OF SALE. THIS TERM SHEET IS NOT AN OFFER TO SELL THESE SECURITIES AND IT IS NOT A SOLICITATION OF AN OFFER TO BUY THESE SECURITIES IN ANY JURISDICTION WHERE THE OFFER OR SALE IS NOT PERMITTED.
146
1655 3rd Street and 1725 3rd Street San Francisco, CA 94158 | Collateral Asset Summary – Loan No. 11 & 12 Chase Center Towers I & II | Cut-off Date Balance: Cut-off Date LTV: U/W NCF DSCR: U/W NOI Debt Yield: | $33,750,000 31.3% 3.87x 13.9% |
The Chase Center Tower Properties are comprised of two 11-story, Class A, office condominium buildings totaling 586,208 sq. ft. located adjacent to the newly constructed Chase Arena in the Mission Bay submarket of San Francisco, California. The Chase Center Towers Properties, which are part of the broader Chase Center complex, are comprised of Chase Center Tower I (317,660 sq. ft.) and Chase Center Tower II (268,548 sq. ft.). As of July 2020, the Chase Center Tower Properties are 100.0% leased to Uber, which executed two leases for the premises in March 2018. Uber took possession of the completed Chase Center Tower Properties in September 2019 (Chase Center Tower II) and October 2019 (Chase Center Tower I). Uber began paying rent upon taking possession of its space, but is not yet in occupancy. Uber has been building out its interior space and is expected to start moving employees on-site in August 2020 for the Northwest Tower and October 2020 for the Southwest Tower. In March 2020, the remaining buildout was put on hold pursuant to the City of San Francisco stay-at-home directive due to the on-going COVID-19 pandemic. Effective May 4, 2020, the City of San Francisco permitted all construction activities to resume. The Borrowers have indicated that the pause in construction will delay Uber’s move in date, but the pause in construction does not impact the tenant’s contractual rent obligations.
Upon taking occupancy, over $212.0 million will have been invested in the build-out of the Uber space. In total, Uber will have contributed approximately $158.2 million to be utilized towards building a variety of unique office spaces, libraries and design labs. The invested capital will also be utilized in non-building system materials or equipment including Uber’s voice or data cabling, as well as furniture and other personal property items. Uber is also expected to occupy two adjacent buildings that are currently under construction (not a part of the collateral). Collectively, the four buildings are expected to represent Uber’s new headquarters campus. The campus will be home to approximately 7,000 employees and will represent Uber’s largest footprint in San Francisco with over 1.0 million sq. ft.
The Chase Center Tower Properties have been designed for and are expected to achieve LEED Gold certification (according to a third party report) and have been constructed to allow adaptability by both high-tech and biotech tenants. The Chase Center Tower Properties are situated on a portion of a 10.92 acre complex known as the Chase Center. Included in the Chase Center complex is the Chase Arena which serves as the home arena for the Golden State Warriors, as well as home to over 200 concerts and events throughout the year. Chase Arena is an 18,000 seat arena that is one of the nation’s most advanced sporting arenas. The Chase Center complex also includes a retail component and three levels of subterranean parking containing approximately 584 parking spaces.
As of June 1, 2020, Uber has paid all contractual rent obligations in-full. The Chase Center Towers Whole Loans are current through the June 1, 2020 payment date. As of June 1, 2020, the Chase Center Towers Whole Loans are not subject to any modification or forbearance requests.
The Chase Center Tower Properties are subject to a condominium declaration. Each office tower is a condominium comprised of the office unit (which is the collateral for the Chase Center Towers Whole Loans) and a retail unit (which is not collateral for the Chase Center Towers Whole Loan). The Borrowers act as a managing owner of each condominium association. The Borrowers have approximately 89.0% of the votes in the condominium association and approximately 11.0% of the votes are held by the owner of the retail unit, which is an affiliate of the GSW Sports LLC. The condominium association does not have a board and is managed by the managing owner. Each of the Chase Center Tower Properties are subject to a master association (“Master Association”) with respect to the Chase Center complex. The Master Association has a board of 11 directors and each Borrower acting as a managing owner has the right to appoint two directors. Please see “Description of the Mortgage Pool—Mortgage Pool Characteristics—Condominium and Other Shared Interests” in the Preliminary Prospectus for additional information.
| Collateral Summary | ||||||||
| Property Name | Year Built / Renovated | Net Rentable Area (Sq. Ft.) | Allocated Loan Cut-off Date Balance | % Allocated Loan Original Balance | Appraised Value(1) | % Appraised Value | U/W NCF | % of U/W NCF |
| Chase Center Tower I | 2019 / NAP | 317,660 | $18,213,750 | 54.0% | $466,000,000 | 54.0% | $20,235,832 | 54.2% |
| Chase Center Tower II | 2019 / NAP | 268,548 | 15,536,250 | 46.0 | 397,500,000 | 46.0 | 17,105,590 | 45.8 |
| Total / Wtd. Avg. | 586,208 | $33,750,000 | 100.0% | $863,500,000 | 100.0% | $37,341,422 | 100.0% | |
| (1) | Appraised Value is reflective of the “Hypothetical As-If Funded” Appraised Value, which assumes all remaining construction and tenant improvements as of December 19, 2019 has been paid for or funded. At origination, the Borrowers reserved $62,678,348 for all outstanding tenant improvements and outstanding repairs. The “As-Is” appraised value as of December 19, 2019 is $789.1 million, which results in a Senior Notes and Whole Loan Cut-off LTV of approximately 34.2% and 76.0%, respectively. |
Uber Technologies, Inc. (586,208 sq. ft., 100.0% of NRA; 100.0% of U/W Base Rent). Uber (rated B1 / NR / B- by Moody’s / Fitch / S&P), executed its leases for the Chase Center Tower II and Chase Center Tower I in March 2018 and has been paying rent since September 2019 and October 2019, respectively. According to the company’s most recent annual 10-K, Uber is a technology company and ride hailing service currently available in 69 countries and over 10,000 cities with approximately 111.0 million users, and possesses 69.7% of the US ride hailing market. In 2019, Uber had over $65.0 billion in gross bookings and over 26 billion miles driven. Uber has also grown its line of services to include UberEats, a food delivery service. Uber has also begun to develop autonomous car technology. Uber has five operating and reportable segments which include Rides, Eats, Freight, Other Bets and Advanced Technologies Group and Other Technology. Uber executed two individual leases in Chase Center Tower I and Chase Center Tower II. Each executed lease is subject to a 20-year term. Contractual rent under each lease is $65.00 per sq. ft. on a NNN basis subject to annual rent escalations of 3.0% which will occur on each anniversary of each respective rent commencement date. Each Uber lease includes one 14-year extension option at market rent. There are no early termination options (except in connection with a casualty or condemnation) or contraction options
THE INFORMATION IN THIS STRUCTURAL AND COLLATERAL TERM SHEET IS NOT COMPLETE AND MAY BE AMENDED PRIOR TO THE TIME OF SALE. THIS TERM SHEET IS NOT AN OFFER TO SELL THESE SECURITIES AND IT IS NOT A SOLICITATION OF AN OFFER TO BUY THESE SECURITIES IN ANY JURISDICTION WHERE THE OFFER OR SALE IS NOT PERMITTED.
147
1655 3rd Street and 1725 3rd Street San Francisco, CA 94158 | Collateral Asset Summary – Loan No. 11 & 12 Chase Center Towers I & II | Cut-off Date Balance: Cut-off Date LTV: U/W NCF DSCR: U/W NOI Debt Yield: | $33,750,000 31.3% 3.87x 13.9% |
structured into the leases. The terms and conditions of tenancy at the Chase Center Tower I and Chase Center Tower II are each governed and subject to terms set forth in the individual leases applicable to each individual property. Although similar, the leases remain uncrossed and are not impacted by conditions and terms applicable to the other lease.
The Phase I environmental report dated October 11, 2019 recommended no further action at the Chase Center Tower Properties. The Chase Center Tower Properties are within an area added to the San Francisco Bay in the early 20th Century where warehousing, railroad, oil storage and many other commercial operations were conducted for over 100 years. The part of the area in which the Chase Center Tower Properties are located is subject to a covenant and environmental restriction established in 2000 when redevelopment activities commenced. All required remedial work in the vicinity of the Chase Center Tower Properties had been completed prior to construction of the Chase Center Tower Properties. In lieu of an environmental indemnity, the Borrower Sponsors provided a secured lender environmental policy from Steadfast Insurance Company with the lender as the named insured, with per incident and aggregate limits of $20,000,000 and a $25,000 per incident self-insured retention, and with a term that extends approximately eight years beyond the Chase Center Tower Whole Loans term with the insurance premium paid at origination.
The Chase Center Tower Properties are located within the San Francisco-Oakland-Hayward, California Metropolitan Statistical Area (“MSA”). San Francisco and the greater Bay Area are known for the fields of technology, life science/biotech, hardware, software, social media, and alternative energy, due, in part, to the presence of Stanford University and the University of California Berkeley, which provide a base of intellectual capital. According to the appraisal, within the Bay Area, the City of San Francisco is attractive as a location for technology businesses due to the urban environment and the appeal that holds for recent college graduates.
San Francisco and the greater Bay Area are also home to the fifth largest corporate base of Fortune 500 companies in the United States. The region’s venture capital community and research and academic institutions have spawned global technology and biotechnology companies including Google, Apple, Facebook, Salesforce, Oracle, Cisco Systems, EBay, Genentech, and Gilead. In addition, the region continues to foster a host of next wave companies including Uber, Twitter, Dropbox, Airbnb, Square, and Okta.
According to the appraisal, as of the third quarter of 2019, the office building development cycle in San Francisco included 4.3 million sq. ft. currently under construction throughout the MSA. In total, approximately 60.0% of the inventory under construction has been preleased. Less than 2.0 million sq. ft. of office space currently under construction throughout the MSA is available for lease.
The Chase Center Tower Properties are located in the Mission Bay submarket of San Francisco, California. The submarket is anchored by the University of California, San Francisco’s Mission Bay Campus (“UCSF Mission Bay”) which focuses on the medical and biotech sectors. The Mission Bay submarket benefits from its proximity to downtown San Francisco and from significant infrastructure investment in the form of the San Francisco Light Rail which runs directly past the Chase Center Towers. The submarket offers almost entirely new office space, which according to the appraisal have asking rents among the highest in the San Francisco office market.
According to a third party market report as of April 2020, the total office inventory in the Mission Bay/China Basin submarket stood at approximately 4.15 million sq. ft. up from approximately 3.4 million sq. ft. at the end of 2018 with a positive net absorption of 746,101 sq. ft. at year end 2019 from year end 2018. Average asking rents were at $77.45 per sq. ft. on a NNN basis representing an approximately 6.7% and 0.2% increase from year end 2018 and year end 2019, respectively. The current vacancy rate in the submarket is at 1.2% with an availability rate of 4.7%. There was approximately 1.0 million sq. ft. under construction in the submarket, all of which was preleased to Uber, of which 586,208 sq. ft. represents the Chase Center Tower Properties and the remaining 422,980 sq. ft. represents two additional office towers located to the north of the Chase Center Tower Properties. Collectively, the four buildings represent Uber’s new HQ campus.
According to a third party market report, San Francisco’s economy grew rapidly in the expansion cycle and maintained strength heading into 2020 before the coronavirus pandemic hit. The trajectory of San Francisco’s economy and its commercial real estate sector will depend on how widely the virus spreads, and how long containment policies like social distancing need to be maintained.
The appraiser identified six office rent comparables from other class A/B office buildings in the Mission Bay/China Basin office submarket and the surrounding submarkets. Base rent across approximately 332,225 sq. ft. of recently executed leases ranges from $70.00 (NNN) to $100.00 (full service) per sq. ft. (highlighted in the chart below). The appraisal concluded a contractual base rent on a NNN basis of $65.00 per sq. ft. for the Chase Center Towers Properties. The appraisal concluded a full service market rental rate of $95.00 per sq. ft. On June 5, 2018, San Francisco passed a 3.5% gross receipts tax that applies to income generated by office buildings in addition to the in-place 0.3% gross tax receipt. The new tax (“Prop C”) took effect on January 1, 2019. The Prop C tax expense is recoverable from tenants on a NNN lease and is fully reimbursable with respect to the Chase Center Tower Properties based on the in-place lease with Uber. According to the appraisal, triple-net leases are less common in the San Francisco market than full-service and industrial gross leases. The concluded market rent of $95.00 is based on a full-service expense provision with the tenant paying a 3.5% Prop C tax on a net basis.
THE INFORMATION IN THIS STRUCTURAL AND COLLATERAL TERM SHEET IS NOT COMPLETE AND MAY BE AMENDED PRIOR TO THE TIME OF SALE. THIS TERM SHEET IS NOT AN OFFER TO SELL THESE SECURITIES AND IT IS NOT A SOLICITATION OF AN OFFER TO BUY THESE SECURITIES IN ANY JURISDICTION WHERE THE OFFER OR SALE IS NOT PERMITTED.
148
1655 3rd Street and 1725 3rd Street San Francisco, CA 94158 | Collateral Asset Summary – Loan No. 11 & 12 Chase Center Towers I & II | Cut-off Date Balance: Cut-off Date LTV: U/W NCF DSCR: U/W NOI Debt Yield: | $33,750,000 31.3% 3.87x 13.9% |
| Office Building Comparables(1) | ||||||
| Property Name | Lessee | Lease Date | NRA | Lease Term | Lease Type | Rent per Sq. Ft. |
| 55 Second Street | Rippling | Apr 2020 | 30,041 | 6.2 Yrs. | Full Service | $93.00 |
| 55 Hawthorne | KeepTruckin | Sep 2020 | 68,216 | 6.1 Yrs. | Full Service | $94.00 |
| 555 Mission Street | DLA Piper, LLC | Apr 2019 | 67,274 | 7.0 Yrs. | Full Service | $93.00 |
| One Tehama | SoFi | Apr 2019 | 98,566 | 10.5 Yrs. | NNN | $70.00 |
| 1 Market Plaza | RPX Corporation | Dec 2018 | 26,967 | 10.2 Yrs. | Full Service | $97.00 |
| 1 Ferry Building | Niantic Labs | Aug 2019 | 41,161 | 10.6 Yrs. | Full Service | $100.00 |
| Total | 332,225 | |||||
| (1) | Based on the Appraisal. |
Cash Flow Analysis.
| Cash Flow Analysis(1)(2) | ||
| U/W(3) | U/W PSF | |
| Base Rent(4) | $39,246,626 | $66.95 |
| Vacant Income | 0 | 0.00 |
| Gross Potential Rent | $39,246,626 | $66.95 |
| CAM Reimbursements | 24,793,767 | 42.30 |
| Parking Income | 2,109,600 | 3.60 |
| Gross Potential Income | $66,149,993 | $112.84 |
| Less: Vacancy & Credit Loss(5) | (3,307,500) | (5.64) |
| Effective Gross Income | $62,842,493 | $107.20 |
| Total Operating Expenses | 25,383,829 | 43.30 |
| Net Operating Income | $37,458,664 | $63.90 |
| Capital Expenditures | 117,242 | 0.20 |
| Net Cash Flow | $37,341,422 | $63.70 |
| (1) | The financials provided above are reflective of the consolidated underwritings for the Chase Center Tower I and the Chase Center Tower II. For avoidance of doubt, no COVID-19 specific adjustments have been incorporated in the lender U/W. |
| (2) | Historical financials are not available as the Chase Center Tower Properties are newly built as of 2019. |
| (3) | Based on the underwritten rent roll. |
| (4) | Base Rent is inclusive of contractual rent steps through December 2020, which reflect an annual increase of 3.0%. |
| (5) | Vacancy is underwritten to 5.0% of Gross Potential Income. |
Cross Default and Cross Collateralization. Pursuant to the term of the cross-default agreement, until the earlier to occur of (x) the satisfaction of the Individual Loan Repayment Conditions (as defined below) and (y) the consummation of a separation and uncross transaction, the Chase Center Tower I Loan and Chase Center Tower II Loan are cross-defaulted and cross-collateralized such that (i) an event of default under any of either individual loan for each office tower constitutes an event of default under each of the other mortgages; (ii) an event of default under any note, any loan agreement or the cross agreement constitutes an event of default under each mortgage; (iii) (x) the Chase Center Tower I mortgage and the Chase Center Tower II second mortgage each constitute security for the Chase Center Tower I Loan, and the Chase Center Tower I Loan lender holds a lien on both properties and (y) the Chase Center Tower II mortgage and the Chase Center Tower I second mortgage each constitute security for the Chase Center Tower II Loan, and the Chase Center Tower II lender holds a lien on both properties; (iv) the Chase Center Tower II second mortgage constitutes security for the repayment of the guaranteed obligations under the Chase Center Tower I note guaranty and (v) the Chase Center Tower I second mortgage constitutes security for repayment of the guaranteed obligations under the Chase Center Tower II note guaranty.
THE INFORMATION IN THIS STRUCTURAL AND COLLATERAL TERM SHEET IS NOT COMPLETE AND MAY BE AMENDED PRIOR TO THE TIME OF SALE. THIS TERM SHEET IS NOT AN OFFER TO SELL THESE SECURITIES AND IT IS NOT A SOLICITATION OF AN OFFER TO BUY THESE SECURITIES IN ANY JURISDICTION WHERE THE OFFER OR SALE IS NOT PERMITTED.
149
4400 Northwest Loop 410 San Antonio, TX 78229 | Collateral Asset Summary – Loan No. 13 Brass Professional Center | Cut-off Date Balance: Cut-off Date LTV: U/W NCF DSCR: U/W NOI Debt Yield: | $32,700,000 72.9% 1.31x 9.2% |
| Mortgage Loan Information | |
| Loan Seller: | GSMC |
| Loan Purpose: | Refinance |
| Borrower Sponsor: | Joe Richard Rodriguez |
| Borrower: | Brass Centerview 11, LLC |
| Original Balance(1): | $32,700,000 |
| Cut-off Date Balance(1): | $32,700,000 |
| % by Initial UPB: | 3.5% |
| Interest Rate: | 4.75000% |
| Payment Date: | 6th of each month |
| First Payment Date(2): | August 6, 2020 |
| Maturity Date: | August 6, 2030 |
| Amortization(2): | Interest Only for the first 13 months; 360 months thereafter |
| Additional Debt(1): | $25,000,000 Pari Passu Debt |
| Call Protection(3): | L(24), D(93), O(4) |
| Lockbox / Cash Management: | Hard / Springing |
| Reserves | |||
| Initial | Monthly | Cap | |
| Taxes(4): | $218,018 | $218,019 | NAP |
| Insurance(5): | $0 | Springing | NAP |
| Replacement: | $0 | $9,596 | NAP |
| TI/LC(6): | $0 | $143,309 | $2,000,000 |
| Debt Service: | $1,203,962 | $0 | NAP |
| Required Repairs: | $78,265 | $0 | NAP |
| Unfunded Obligations: | $648,214 | $0 | NAP |
| Property Information | |
| Single Asset / Portfolio: | Single Asset |
| Property Type: | Suburban Office |
| Collateral: | Fee Simple |
| Location: | San Antonio, TX |
| Year Built / Renovated: | 1968-1998 / NAP |
| Total Sq. Ft.: | 575,771 |
| Property Management: | Brass Property Management, LLC |
| Underwritten NOI: | $5,324,608 |
| Underwritten NCF: | $4,720,729 |
| Appraised Value: | $79,100,000 |
| Appraisal Date: | June 1, 2020 |
| Historical NOI | |
| Most Recent NOI: | $5,371,017 (T-12 May 31, 2020) |
| 2019 NOI: | $5,115,251 (December 31, 2019) |
| 2018 NOI: | $4,942,489 (December 31, 2018) |
| 2017 NOI: | $4,902,820 (December 31, 2017) |
| Historical Occupancy | |
| Most Recent Occupancy: | 84.8% (April 1, 2020) |
| 2019 Occupancy: | 86.6% (December 31, 2019) |
| 2018 Occupancy: | 84.0% (December 31, 2018) |
| 2017 Occupancy: | 84.8% (December 31, 2017) |
| Financial Information(1) | ||||||
| Tranche | Cut-off Date Balance | Balance per Sq. Ft. Cut-off / Balloon | LTV Cut-off / Balloon | U/W DSCR NOI / NCF | U/W Debt Yield NOI / NCF | U/W Debt Yield at Balloon NOI / NCF |
| Mortgage Loan | $32,700,000 | |||||
| Pari Passu Note | $25,000,000 | |||||
| Whole Loan | $57,700,000 | $100 / $84 | 72.9% / 61.1% | 1.47x / 1.31x | 9.2% / 8.2% | 11.0% / 9.8% |
| (1) | The Cut-off Date Balance of $32,700,000 represents the outstanding principal balance of the controlling Note A-1, which is part of the Brass Professional Center whole loan (the “Brass Professional Center Whole Loan”) consisting of two senior pari passu promissory notes with an aggregate original principal balance of $57,700,000. |
| (2) | Under the terms of the Brass Professional Center Whole Loan documents, the first payment date is September 6, 2020, the interest only period is 12 months, and the loan term is 120 months. However, due to the fact that GSMC will contribute an initial interest deposit amount to the Issuing Entity on the Closing Date to cover an amount that represents one-month’s interest that would have accrued with respect to the Brass Professional Center Whole Loan at the related net mortgage rate with respect to an August 2020 payment date, the Brass Professional Center Whole Loan is being treated as having a first payment date on August 6, 2020, an interest only period of 13 months, and a loan term of 121 months. |
| (3) | The defeasance lockout period, with respect to a defeasance of the Brass Professional Center Whole Loan, will be at least 24 payment dates beginning with and including the adjusted first payment date of August 6, 2020 (the actual first payment date is September 6, 2020; see footnote (2) above). Defeasance of the Brass Professional Center Whole Loan is permitted after the date that is the earlier of (i) two years from the closing date of the securitization that includes the last note to be securitized and (ii) July 10, 2023. Prepayment in whole, but not in part, of the Brass Professional Center Whole Loan is permitted on or after the payment date in May 2030 without the payment of a yield maintenance premium. |
| (4) | The Monthly Tax reserve payment prior to and including October 2020 is approximately $218,019 and approximately $109,010 thereafter. |
| (5) | The Insurance reserve has been conditionally waived so long as, the Brass Professional Center Borrower (as defined below) maintains satisfactory insurance under one or more blanket policies and the lender receives evidence of payment with respect to such policies and no event of default is continuing. In the event that these conditions are no longer met, a reserve for insurance in an amount equal to one-twelfth of the amount which would be sufficient to pay the insurance premiums due for the renewal of coverage. |
| (6) | The Monthly TI/LC reserve payment prior to and including August 2021 is $143,309 and approximately $59,977 thereafter. |
THE INFORMATION IN THIS STRUCTURAL AND COLLATERAL TERM SHEET IS NOT COMPLETE AND MAY BE AMENDED PRIOR TO THE TIME OF SALE. THIS TERM SHEET IS NOT AN OFFER TO SELL THESE SECURITIES AND IT IS NOT A SOLICITATION OF AN OFFER TO BUY THESE SECURITIES IN ANY JURISDICTION WHERE THE OFFER OR SALE IS NOT PERMITTED.
150
4400 Northwest Loop 410 San Antonio, TX 78229 | Collateral Asset Summary – Loan No. 13 Brass Professional Center | Cut-off Date Balance: Cut-off Date LTV: U/W NCF DSCR: U/W NOI Debt Yield: | $32,700,000 72.9% 1.31x 9.2% |
The relationship between the holders of the Brass Professional Center Whole Loan will be governed by a co-lender agreement as described under “Description of the Mortgage Pool–The Whole Loans–The Serviced Pari Passu Whole Loans” in the Preliminary Prospectus.
| Whole Loan Summary | ||||
| Note | Original Balance | Cut-off Date Balance | Note Holder | Controlling Piece |
| A-1 | $32,700,000 | $32,700,000 | Benchmark 2020-B18 | Yes |
| A-2 | $25,000,000 | $25,000,000 | GSBI(1) | No |
| Total | $57,700,000 | $57,700,000 | ||
| (1) | Expected to be contributed to one or more future securitizations. |
| Sources and Uses | ||||||
| Sources | Proceeds | % of Total | Uses | Proceeds | % of Total | |
| Whole Loan | $57,700,000 | 99.3% | Loan Payoff | $55,381,022 | 95.4% | |
| Principal’s New Cash Contribution | 381,070 | 0.7 | Upfront Reserves | 2,148,460 | 3.7 | |
| Closing Costs | 551,589 | 0.9 | ||||
| Total Sources | $58,081,070 | 100.0% | Total Uses | $58,081,070 | 100.0% | |
The Borrower / Borrower Sponsor. The borrower is Brass Centerview 11, LLC, a Texas limited liability company and single purpose entity with two independent directors (the “Brass Professional Center Borrower”). Legal counsel to the Brass Professional Center Borrower delivered a non-consolidation opinion in connection with the origination of the Brass Professional Center Whole Loan.
The borrower sponsor and non-recourse carveout guarantor is Joe Richard Rodriguez. Joe Richard Rodriguez is the principal of Brass (“Brass”), a commercial real estate investment firm based in San Antonio, Texas, and has been engaged in real estate development, construction, brokerage and property management for over 25 years. During his career, he has been responsible for the acquisition, financing, management and development of more than $500.0 million in real estate assets.
The Property. The Brass Professional Center property (the “Brass Professional Center Property”) consists of eleven suburban office buildings totaling 575,771 sq. ft. located in San Antonio, Texas. The Brass Professional Center Property was built between 1968 and 1998 on a 34.6-acre site. Based on the underwritten rent roll dated April 1, 2020, the Brass Professional Center Property is currently 84.8% leased. Since acquiring the Brass Professional Center Property in 2006, the borrower sponsor has spent approximately $26.8 million in capital improvements and leasing costs.
QTC Management (46,227 sq. ft.; 8.0% of NRA; 10.5% of U/W Base Rent) is the largest office tenant at the Brass Professional Center Property and has occupied space in the Brass Professional Center Property since December 2011. QTC Management (“QTC”) is the largest provider of disability and occupational health examination services. QTC delivers services to customers in the private sectors and federal, state, and local government agencies.
Aetna Health Management, LLC (41,255 sq. ft.; 7.2% of NRA; 9.5% of U/W Base Rent) is the second largest office tenant at the Brass Professional Center Property and has occupied space in the Brass Professional Center Property since February 1999. Aetna Health Management, LLC (“Aetna”) is a subsidiary of Aetna Inc. Aetna offers health insurance products and related services, including medical, pharmacy, dental, behavioral health, group life and disability plans and medical management capabilities and health care management services for Medicaid plans. Aetna is a subsidiary of CVS Health Corporation.
MCNA Insurance Company (32,686 sq. ft.; 5.7% of NRA; 7.8% of U/W Base Rent) is the third largest office tenant at the Brass Professional Center Property and has occupied space in the Brass Professional Center Property since November 2011. MCNA Insurance Company and Managed Care of North America, Inc. (“MCNA Insurance Company”) is a dental benefits administrator that provides services to state agencies and managed care organizations for Medicaid, Children's Health Insurance Program and Medicare members. MCNA Insurance Company also offers commercial dental plans for private employers, individuals and families.
COVID-19 Update. As of July 10, 2020, the Brass Professional Center Property is open; however, most tenants are working from home. 84.5% of the occupied SF made their June 2020 rent payments, represented approximately 87.1% of the UW Base Rent received for June 2020. The first payment date of the Brass Professional Center Whole Loan is in August 2020.
THE INFORMATION IN THIS STRUCTURAL AND COLLATERAL TERM SHEET IS NOT COMPLETE AND MAY BE AMENDED PRIOR TO THE TIME OF SALE. THIS TERM SHEET IS NOT AN OFFER TO SELL THESE SECURITIES AND IT IS NOT A SOLICITATION OF AN OFFER TO BUY THESE SECURITIES IN ANY JURISDICTION WHERE THE OFFER OR SALE IS NOT PERMITTED.
151
4400 Northwest Loop 410 San Antonio, TX 78229 | Collateral Asset Summary – Loan No. 13 Brass Professional Center | Cut-off Date Balance: Cut-off Date LTV: U/W NCF DSCR: U/W NOI Debt Yield: | $32,700,000 72.9% 1.31x 9.2% |
| Tenant Summary(1) | |||||||
| Tenant | Credit Rating (Moody’s/Fitch/S&P) | Net Rentable Area (Sq. Ft.) | % of Net Rentable Area | U/W Base Rent Per Sq. Ft. | % of Total U/W Base Rent | Lease Expiration | |
| QTC Management(2) | NR / NR / NR | 46,227 | 8.0% | $22.67 | 10.5% | 4/30/2025 | |
| Aetna Health Management, LLC | NR / NR / NR | 41,255 | 7.2 | $23.00 | 9.5% | 8/31/2021 | |
| MCNA Insurance Company(3) | NR / NR / NR | 32,686 | 5.7 | $23.88 | 7.8% | 4/30/2022 | |
| TNC (US) Holdings, Inc.(4) | NR / NR / NR | 30,154 | 5.2 | $18.21 | 5.5% | 10/31/2028 | |
| MacAulay Brown, Inc. | NR / NR / NR | 20,628 | 3.6 | $23.93 | 4.9% | 11/30/2023 | |
| United States of America(5) | NR / NR / NR | 19,546 | 3.4 | $16.81 | 3.3% | Various | |
| University Health System | NR / NR / NR | 17,221 | 3.0 | $23.50 | 4.1% | 8/31/2025 | |
| State of Texas (the Department of Assistive and Rehabilitation Services (DARS)) | NR / NR / NR | 13,043 | 2.3 | $17.70 | 2.3% | 10/31/2024 | |
| Northrop Grumman Systems Corporation | NR / NR / NR | 12,761 | 2.2 | $20.00 | 2.6% | 10/31/2020 | |
| BCFS Health and Human Services(6) | NR / NR / NR | 12,308 | 2.1 | $19.00 | 2.3% | 7/31/2022 | |
| Ten Largest Tenants | 245,829 | 42.7% | $21.45 | 52.9% | |||
| Remaining Occupied(7) | 242,396 | 42.1 | $19.39 | 47.1% | |||
| Total / Wtd. Avg. Occupied Collateral | 488,225 | 84.8% | $20.43 | 100.0% | |||
| Vacant | 87,546 | 15.2 | |||||
| Total | 575,771 | 100.0% | |||||
| (1) | Based on the underwritten rent roll dated as of April 1, 2020 with rent steps through July 31, 2021. |
| (2) | QTC Management, has the right to terminate its lease with respect to (i) Suite 350 (12,297 sq. ft.) effective annually beginning on April 30, 2024, with 120 days’ prior notice and payment of a termination fee and (ii) Suite 100 (5,256 sq. ft.) at any time effective as of May 1, 2023 with 365 days’ prior notice and payment of a termination fee. QTC Management has one, four-year, two, six-month and one, five-year extension options remaining. |
| (3) | MCNA Insurance Company has one, five-year extension option remaining. |
| (4) | TNC (US) Holdings, Inc. has a one-time right to terminate on October 31, 2025 with 180 days’ written notice and payment of a termination fee. |
| (5) | United States of America has the right to terminate in whole or in part at any time with 90 days’ written notice. United States of America has 6,688 sq. ft. expiring on January 3, 2021 and 12,858 sq. ft. expiring on April 30, 2022. |
| (6) | BCFS Health and Human Services has the right to terminate with 45 days’ written notice and payment of a termination fee in the event that funding from specific agencies is reduced, lost or terminated or if BCFS Health and Human Services is required to relocate by such agencies. BCFS Health and Human Services has one, three-year extension option remaining. |
| (7) | Remaining Occupied is inclusive of 4,697 sq. ft. used as conference space and 648 sq. ft. used by Brass, each of which has no attributable underwritten base rent. |
| Lease Rollover Schedule(1)(2) | ||||||||
| Year | # of Leases Expiring(3) | Total Expiring Sq. Ft. | % of Total Sq. Ft. Expiring | Cumulative Sq. Ft. Expiring | Cumulative % of Sq. Ft. Expiring | Annual U/W Base Rent Per Sq. Ft. | % U/W Base Rent Rolling | Cumulative % of U/W Base Rent |
| MTM | 0 | 0 | 0.0% | 0 | 0.0% | $0.00 | 0.0% | 0.0% |
| 2020 | 14 | 24,936 | 4.3% | 24,936 | 4.3% | $19.43 | 4.9% | 4.9% |
| 2021 | 57 | 151,411 | 26.3% | 176,347 | 30.6% | $20.32 | 30.9% | 35.7% |
| 2022 | 30 | 121,338 | 21.1% | 297,685 | 51.7% | $21.33 | 26.0% | 61.7% |
| 2023 | 10 | 36,862 | 6.4% | 334,547 | 58.1% | $21.67 | 8.0% | 69.7% |
| 2024 | 10 | 34,520 | 6.0% | 369,067 | 64.1% | $18.64 | 6.5% | 76.1% |
| 2025 | 8 | 83,659 | 14.5% | 452,726 | 78.6% | $21.90 | 18.4% | 94.5% |
| 2026 | 0 | 0 | 0.0% | 452,726 | 78.6% | $0.00 | 0.0% | 94.5% |
| 2027 | 0 | 0 | 0.0% | 452,726 | 78.6% | $0.00 | 0.0% | 94.5% |
| 2028 | 3 | 30,154 | 5.2% | 482,880 | 83.9% | $18.21 | 5.5% | 100.0% |
| 2029 | 0 | 0 | 0.0% | 482,880 | 83.9% | $0.00 | 0.0% | 100.0% |
| 2030 | 0 | 0 | 0.0% | 482,880 | 83.9% | $0.00 | 0.0% | 100.0% |
| 2031 & Thereafter(3) | 0 | 5,345 | 0.9% | 488,225 | 84.8% | $0.00 | 0.0% | 100.0% |
| Vacant | NAP | 87,546 | 15.2% | 575,771 | 100.0% | NAP | NAP | NAP |
| Total / Wtd. Avg. | 132 | 575,771 | 100.0% | $20.43 | 100.0% | |||
| (1) | Certain tenants may have termination or contraction options (which may become exercisable prior to the originally stated expiration date of the tenant lease) that are not considered in the above Lease Rollover Schedule. |
| (2) | Based on the underwritten rent roll dated as of April 1, 2020 with rent steps through July 31, 2021. |
| (3) | 2031 and Thereafter is inclusive of 4,697 sq. ft. used as conference space and 648 sq. ft. used by Brass, each of which has no attributable underwritten base rent. These spaces were excluded from the # of Leases Expiring. |
THE INFORMATION IN THIS STRUCTURAL AND COLLATERAL TERM SHEET IS NOT COMPLETE AND MAY BE AMENDED PRIOR TO THE TIME OF SALE. THIS TERM SHEET IS NOT AN OFFER TO SELL THESE SECURITIES AND IT IS NOT A SOLICITATION OF AN OFFER TO BUY THESE SECURITIES IN ANY JURISDICTION WHERE THE OFFER OR SALE IS NOT PERMITTED.
152
4400 Northwest Loop 410 San Antonio, TX 78229 | Collateral Asset Summary – Loan No. 13 Brass Professional Center | Cut-off Date Balance: Cut-off Date LTV: U/W NCF DSCR: U/W NOI Debt Yield: | $32,700,000 72.9% 1.31x 9.2% |
Cash Flow Analysis.
| Cash Flow Analysis(1) | ||||||
| 2017 | 2018 | 2019 | T-12 5/31/2020 | U/W | U/W PSF | |
| Base Rent(2) | $9,083,493 | $9,547,764 | $9,757,783 | $9,827,362 | $9,973,772 | $17.32 |
| Vacant Income | 0 | 0 | 0 | 0 | 1,823,132 | 3.17 |
| Reimbursements(3) | 229,799 | 295,115 | 237,786 | 257,240 | 226,991 | 0.39 |
| Vacancy & Credit Loss | 0 | 0 | 0 | 0 | (1,823,132) | (3.17) |
| Other Income(4) | 250,199 | 57,692 | 48,687 | 39,819 | 35,288 | 0.06 |
| Effective Gross Income | $9,563,491 | $9,900,571 | $10,044,256 | $10,124,420 | $10,236,052 | $17.78 |
| Total Operating Expenses | 4,660,672 | 4,958,082 | 4,929,005 | 4,753,403 | 4,911,444 | 8.53 |
| Net Operating Income | $4,902,820 | $4,942,489 | $5,115,251 | $5,371,017 | $5,324,608 | $9.25 |
| TI/LC | 0 | 0 | 0 | 0 | 488,725 | 0.85 |
| Capital Expenditures | 0 | 0 | 0 | 0 | 115,154 | 0.20 |
| Net Cash Flow | $4,902,820 | $4,942,489 | $5,115,251 | $5,371,017 | $4,720,729 | $8.20 |
| (1) | Certain items such as straight line rent, interest expense, interest income, lease cancellation income, depreciation, amortization, debt service payments and any other non-recurring or non-operating items were excluded from the historical presentation and are not considered for the underwritten cash flow. |
| (2) | U/W Base Rent is based on the underwritten rent roll dated as of April 1, 2020 inclusive of rent steps through July 31, 2021. |
| (3) | U/W Reimbursements include afterhours HVAC billing. |
| (4) | U/W Other Income includes parking revenue, other miscellaneous income and income from temporary, specialty and kiosk leasing. |
THE INFORMATION IN THIS STRUCTURAL AND COLLATERAL TERM SHEET IS NOT COMPLETE AND MAY BE AMENDED PRIOR TO THE TIME OF SALE. THIS TERM SHEET IS NOT AN OFFER TO SELL THESE SECURITIES AND IT IS NOT A SOLICITATION OF AN OFFER TO BUY THESE SECURITIES IN ANY JURISDICTION WHERE THE OFFER OR SALE IS NOT PERMITTED.
153
138-35 39th Avenue Flushing, NY 11354 | Collateral Asset Summary – Loan No. 14 Flushing Commons | Cut-off Date Balance: Cut-off Date LTV: U/W NCF DSCR: U/W NOI Debt Yield: | $28,000,000 59.6% 2.45x 8.9% |
| Mortgage Loan Information | |
| Loan Seller: | CREFI |
| Loan Purpose: | Acquisition |
| Borrower Sponsors: | A Laboz Control Party(1); Joseph J. Sitt |
| Borrowers(2): | Thor Flushing Commons LLC; Thor Flushing Commons 24W40 LLC; Thor Flushing Commons 45G LLC; Flushing Commons Laboz, LLC |
| Original Balance: | $28,000,000 |
| Cut-off Date Balance: | $28,000,000 |
| % by Initial UPB: | 3.0% |
| Interest Rate: | 3.45000% |
| Payment Date: | 6th of each month |
| First Payment Date: | April 6, 2020 |
| Maturity Date: | March 6, 2030 |
| Amortization: | Interest Only |
| Additional Debt(3): | $3,975,906 Intercompany Loan |
| Call Protection: | L(28), D(87), O(5) |
| Lockbox / Cash Management: | Hard / Springing |
| Reserves | |||
| Initial | Monthly | Cap | |
| Taxes: | $45,750 | $11,438 | NAP |
| Insurance: | $0 | Springing | NAP |
| Replacement: | $0 | $375 | NAP |
| TI/LC: | $0 | $2,500 | $150,000 |
| Empire TI/LC Reserve: | $199,700 | $0 | NAP |
| Empire Free Rent Reserve: | $195,221 | $0 | NAP |
| Condo Assessment Reserve: | $20,454 | Springing | NAP |
| Property Information | |
| Single Asset / Portfolio: | Single Asset |
| Property Type: | Unanchored Retail |
| Collateral: | Fee Simple |
| Location: | Flushing, NY |
| Year Built / Renovated: | 2017 / NAP |
| Total Sq. Ft.: | 30,000 |
| Property Management: | Flushing Commons Manager, LLC |
| Underwritten NOI: | $2,505,178 |
| Underwritten NCF: | $2,401,832 |
| Appraised Value: | $47,000,000 |
| Appraisal Date: | January 23, 2020 |
| Historical NOI(4) | |
| Most Recent NOI: | NAV |
| 2018 NOI: | NAV |
| 2017 NOI: | NAV |
| 2016 NOI: | NAP |
| Historical Occupancy(4) | |
| Most Recent Occupancy: | 83.0% (January 22, 2020) |
| 2018 Occupancy: | NAV |
| 2017 Occupancy: | NAV |
| 2016 Occupancy: | NAP |
| Financial Information | ||||||
| Tranche | Cut-off Date Balance | Balance per Sq. Ft. Cut-off / Balloon | LTV Cut-off / Balloon | U/W DSCR NOI / NCF | U/W Debt Yield NOI / NCF | U/W Debt Yield at Balloon NOI / NCF |
| Mortgage Loan | $28,000,000 | $933 / $933 | 59.6% / 59.6% | 2.56x / 2.45x | 8.9% / 8.6% | 8.9% / 8.6% |
| Intercompany Loan(3) | $3,975,906 | |||||
| Total Debt | $31,975,906 | $1,066 / $1,066 | 68.0% / 68.0% | 2.16x / 2.07x | 7.8% / 7.5% | 7.8% / 7.5% |
| (1) | The borrower sponsor, A Laboz Control Party, is an entity owned by the non-recourse carveout guarantors are Albert Laboz, Jason Laboz and Joseph Jody Laboz of United American Land, LLC. |
| (2) | The borrowers for the Flushing Commons loan are Thor Flushing Commons LLC; Thor Flushing Commons 24W40 LLC, Thor Flushing Commons 45G LLC, and Flushing Commons Laboz, LLC, which own the Flushing Commons property as tenants-in-common. See “The Borrowers / Borrower Sponsors” herein. |
| (3) | The additional debt on the Flushing Commons property consists of a $3,975,906.15 preferred equity intercompany loan that accrues interest at a rate of 4.50000%. The maturity date of the intercompany loan is the earlier to occur of (i) the sale of the Flushing Commons property, (ii) the dissolution of the borrowers and (iii) 10 years from the acquisition of the Flushing Commons property. |
| (4) | There is missing historical cash flow and occupancy due to the property having been built in 2017 and subsequently being in lease up since the second quarter of 2018. |
THE INFORMATION IN THIS STRUCTURAL AND COLLATERAL TERM SHEET IS NOT COMPLETE AND MAY BE AMENDED PRIOR TO THE TIME OF SALE. THIS TERM SHEET IS NOT AN OFFER TO SELL THESE SECURITIES AND IT IS NOT A SOLICITATION OF AN OFFER TO BUY THESE SECURITIES IN ANY JURISDICTION WHERE THE OFFER OR SALE IS NOT PERMITTED.
154
138-35 39th Avenue Flushing, NY 11354 | Collateral Asset Summary – Loan No. 14 Flushing Commons | Cut-off Date Balance: Cut-off Date LTV: U/W NCF DSCR: U/W NOI Debt Yield: | $28,000,000 59.6% 2.45x 8.9% |
| Sources and Uses | ||||||
| Sources | Proceeds | % of Total | Uses | Proceeds | % of Total | |
| Whole Loan | $28,000,000 | 62.2% | Purchase Price | $42,000,000 | 93.3% | |
| Borrower Sponsor Equity | 16,406,313 | 36.4 | Closing Costs | 2,558,647 | 5.7 | |
| Other Sources(1) | 613,460 | 1.4 | Initial Reserves | 461,125 | 1.0 | |
| Total Sources | $45,019,772 | 100.0% | Total Uses | $45,019,772 | 100.0% | |
| (1) | Other Sources consists of prorations and adjustments including free rent and other buyer credits. |
The Borrowers / Borrower Sponsors. The borrowers for the Flushing Commons mortgage loan are Thor Flushing Commons LLC, Thor Flushing Commons 24W40 LLC, Thor Flushing Commons 45G LLC, and Flushing Commons Laboz, LLC which own the Flushing Commons property as tenants-in-common. Each borrower is a Delaware limited liability companies and single purpose entities with one independent director. Legal counsel to the borrowers delivered a non-consolidation opinion in connection with the origination of the Flushing Commons mortgage loan.
The borrower sponsors are A Laboz Control Party and Joseph J. Sitt and the non-recourse carveout guarantors are Albert Laboz, Jason Laboz and Joseph Jody Laboz of United American Land, LLC (“UAL”) and Joseph J. Sitt. UAL is a family-owned real estate development, investment and management company based out of New York City. As of April 2020, UAL owned and managed over 50 properties located throughout Manhattan, Brooklyn and Queens. With a goal of restoring, improving and reinventing historic buildings in TriBeCa, SoHo, the Flatiron district and Brooklyn, UAL seeks to add value to its acquisitions via conversion from commercial use to luxury residences, or through upgraded retail use. Some of UAL’s notable owned buildings include 319 Broadway, The Constable Building and SoHo Mews in New York City. The other borrower sponsor is Joseph J. Sitt, who is the chairman of Thor Equities Group. Thor Equities Group owns property in urban markets throughout the United States, Europe, Canada and Latin America, with 160 properties worldwide worth in excess of $20.0 billion and totaling approximately 50.0 million sq. ft. Thor Equities Group is based in New York City with offices in London, Paris, Mexico City and Chicago.
Intercompany Loan. Flushing Commons Owner, LLC (“IC Lender”), f/k/a Flushing Commons Laboz, LLC, provided a $3,975,906.15 loan (the “Intercompany Loan”) to Thor Flushing Commons Investment BR LLC (“IC Borrower”), the sole owner of Thor Flushing Commons LLC (one of the borrowers under the Flushing Commons mortgage loan). The Intercompany Loan is secured by a pledge of the IC Borrower’s interest in Thor Flushing Commons LLC (the “IC Pledge”) as well as a guaranty provided by Joseph J. Sitt (the “IC Guaranty”). With respect to the Intercompany Loan, (i) the rights of IC Lender are subject and subordinate to the Flushing Commons mortgage loan, (ii) the IC Borrower does not have any obligation to make ongoing debt service payments pursuant to the Intercompany Loan other than: (x) payments of the cash distributions from the Flushing Commons property received by IC Borrower (the “Ongoing IC Debt Service Payments”) and (y) payment of the full outstanding balance of the Intercompany Loan on the maturity date thereof, (iii) in no event will any Ongoing IC Debt Service Payments be due and payable during the continuance of a Trigger Period and the Ongoing IC Debt Service Payments will only be due and payable to the extent of excess cash flow available to IC Borrower after payment of all amounts due under the Flushing Commons mortgage loan, (iv) to the extent an event of default has occurred and is continuing under the Flushing Commons mortgage loan, the sole remedy available to IC Lender in connection with any breach of the Intercompany Loan will be to enforce the IC Guaranty, upon various requirements set forth in the Intercompany Loan documents and (v) to the extent no event of default has occurred and is continuing under the Flushing Commons mortgage loan, the sole remedies that will be available to IC Lender in connection with a breach of the Intercompany Loan documents will be: (x) to foreclose on the IC Pledge in accordance with the Flushing Commons mortgage loan and (y) enforcement of the IC Guaranty in a manner that satisfies the requirements in the Flushing Commons mortgage loan documents. The maturity date of the Intercompany Loan is the earlier to occur of (i) the sale of the Flushing Commons property, (ii) dissolution of the Flushing Commons borrowers and (iii) 10 years from the acquisition of the Flushing Commons property.
A “Trigger Period” means a period commencing upon (i) the occurrence and continuance of an event of default, (ii) the Debt Yield falling below 7.00% or (iii) the occurrence of a specified tenant trigger period (as defined in the Flushing Commons loan documents).
The Property. The Flushing Commons property is part of the Flushing Commons condominium (the “Flushing Condominium”) and consists of 30,000 sq. ft. of unanchored retail space within a greater complex also known as Flushing Commons. The Flushing Condominium consists of 148 residential units, 90 office units, one retail unit, and one parking unit, and the Flushing Commons property comprises the retail unit of the Flushing Condominium. The retail unit owns 2.1444% of the general common elements. The Flushing Commons property is a LEED-silver certified retail property that was constructed in 2017 and is situated on a 1.34-acre site. The Flushing Commons property is located on the northeast corner of Union Street and 39th Avenue in the downtown Flushing neighborhood in Queens. Primary access to all New York City boroughs is provided through MTA subway and bus lines. The nearest subway station to the Flushing Commons property is at the intersection of Main Street and Roosevelt Avenue with access to the No. 7 line. As of January 22, 2020, the Flushing Commons property is 83.0% occupied by six tenants. The major tenants at the property are HaiDiLao Hotpot, which occupies 12,463 sq. ft. of space under a lease that expires on August 31, 2034, and Empire Healthchoice HMO Inc., which occupies 4,990 sq. ft. under a lease that expires on June 30, 2025.
THE INFORMATION IN THIS STRUCTURAL AND COLLATERAL TERM SHEET IS NOT COMPLETE AND MAY BE AMENDED PRIOR TO THE TIME OF SALE. THIS TERM SHEET IS NOT AN OFFER TO SELL THESE SECURITIES AND IT IS NOT A SOLICITATION OF AN OFFER TO BUY THESE SECURITIES IN ANY JURISDICTION WHERE THE OFFER OR SALE IS NOT PERMITTED.
155
138-35 39th Avenue Flushing, NY 11354 | Collateral Asset Summary – Loan No. 14 Flushing Commons | Cut-off Date Balance: Cut-off Date LTV: U/W NCF DSCR: U/W NOI Debt Yield: | $28,000,000 59.6% 2.45x 8.9% |
The Flushing Commons property also benefits from a 25 year tax abatement under the Industrial & Commercial Abatement Program (“ICAP”) with the amount of the abatement at 100% for the first 16 years, and phased out by 10% per annum for the remaining years. The Flushing Commons property is located in a special commercial area and qualifies for the inflation protection component of the ICAP. Once the ICAP is in place (FY 2019/2020), any year when the gross real estate taxes increase by more than 5%, the incremental increase over 5% is added to the ICAP abatement. The unabated taxes for the 2020 tax year are $579,152.
COVID-19 Update: As of July 13, 2020, New York City has entered Phase 3 of the state’s reopening plan and all tenants have been permitted to operate at the Flushing Commons property since Phase 2 commenced on June 22, 2020. The debt service payments have been made on the Flushing Commons mortgage loan from March through July. One tenant, representing approximately 41.5% of net rentable area and 25.2% of UW base rent (24.7% of UW base rent inclusive of rent steps), entered into a rent deferral arrangement with the borrowers for March through June. The tenant agreed to pay 100% of their base rent for March through June in exchange for 50% concessions on common charges for those months, which accounts for approximately 85% of their gross rent. All of the tenants by count, square footage and underwritten base rent have paid rent for July. As of the date hereof, the Flushing Commons mortgage loan is not subject to any modification or forbearance request.
| Tenant Summary(1) | ||||||
| Tenants | Ratings (Moody’s/Fitch/S&P) | Net Rentable Area (Sq. Ft.) | % of Net Rentable Area | U/W Base Rent Per Sq. Ft.(2) | % of Total U/W Base Rent(2) | Lease Expiration |
| HaiDiLao Hotpot(3) | NR / NR / NR | 12,463 | 41.5% | $50.70 | 24.7% | 8/31/2034 |
| Empire Healthchoice HMO Inc.(4) | Baa2 / BBB / NR | 4,990 | 16.6 | $136.00 | 26.5% | 6/30/2025 |
| Atelier Fashion, Inc. | NR / NR / NR | 2,236 | 7.5 | $148.53 | 13.0% | 11/30/2028 |
| Metro City Bank(5) | NR / NR / NR | 2,022 | 6.7 | $169.74 | 13.4% | 7/31/2028 |
| Elements Pharmacy, Inc. | NR / NR / NR | 1,756 | 5.9 | $201.57 | 13.8% | 9/30/2029 |
| Hanover Community Bank(6) | NR / NR / NR | 1,444 | 4.8 | $150.00 | 8.5% | 10/31/2028 |
| Total / Wtd. Avg. Occupied Space | 24,911 | 83.0% | $102.62 | 100.0% | ||
| Vacant | 5,089 | 17.0 | ||||
| Total | 30,000 | 100.0% | ||||
| (1) | Based on the underwritten rent roll dated January 22, 2020. |
| (2) | U/W Base Rent Per Sq. Ft. and % of Total U/W Base Rent include $49,939 of contractual rent steps underwritten through December 1, 2020. |
| (3) | Tenant has one, five year renewal option. |
| (4) | Tenant has one, five year renewal option; additionally the tenant has a one-time right to terminate its lease on the last day of the 36th month following the rent commencement date, so long as the tenant provides no less than 6 months’ notice and payment of a termination fee. |
| (5) | Tenant has one, five year renewal option. |
| (6) | Tenant has one, five year renewal option, additionally the tenant has the one-time right to terminate its lease on October 1, 2025, upon 180 days’ notice and payment of a termination fee. |
| Lease Rollover Schedule(1) | ||||||||
| Year | # of Leases Expiring | Total Expiring Sq. Ft. | % of Total Sq. Ft. Expiring | Cumulative Sq. Ft. Expiring | Cumulative % of Sq. Ft. Expiring | Annual U/W Base Per Sq. Ft.(2) | % U/W Base Rent Rolling(2) | Cumulative % of U/W Base Rent(2) |
| MTM | 0 | 0 | 0.0% | 0 | 0.0% | $0.00 | 0.0% | 0.0% |
| 2020 | 0 | 0 | 0.0% | 0 | 0.0% | $0.00 | 0.0% | 0.0% |
| 2021 | 0 | 0 | 0.0% | 0 | 0.0% | $0.00 | 0.0% | 0.0% |
| 2022 | 0 | 0 | 0.0% | 0 | 0.0% | $0.00 | 0.0% | 0.0% |
| 2023 | 0 | 0 | 0.0% | 0 | 0.0% | $0.00 | 0.0% | 0.0% |
| 2024 | 0 | 0 | 0.0% | 0 | 0.0% | $0.00 | 0.0% | 0.0% |
| 2025 | 1 | 4,990 | 16.6% | 4,990 | 16.6% | $136.00 | 26.5% | 26.5% |
| 2026 | 0 | 0 | 0.0% | 4,990 | 16.6% | $0.00 | 0.0% | 26.5% |
| 2027 | 0 | 0 | 0.0% | 4,990 | 16.6% | $0.00 | 0.0% | 26.5% |
| 2028 | 3 | 5,702 | 19.0% | 10,692 | 35.6% | $156.42 | 34.9% | 61.4% |
| 2029 | 1 | 1,756 | 5.9% | 12,448 | 41.5% | $201.57 | 13.8% | 75.3% |
| 2030 | 0 | 0 | 0.0% | 12,448 | 41.5% | $0.00 | 0.0% | 75.3% |
| 2031 & Thereafter | 1 | 12,463 | 41.5% | 24,911 | 83.0% | $50.70 | 24.7% | 100.0% |
| Vacant | NAP | 5,089 | 17.0% | 30,000 | 100.0% | NAP | NAP | NAP |
| Total / Wtd. Avg. | 6 | 30,000 | 100.0% | $102.62 | 100.0% | |||
| (1) | Based on the underwritten rent roll dated January 22, 2020. |
| (2) | Annual U/W Base Rent Per Sq. Ft., % U/W Base Rent Rolling and Cumulative % of U/W Base Rent includes $49,939 of contractual rent steps underwritten through December 1, 2020. |
THE INFORMATION IN THIS STRUCTURAL AND COLLATERAL TERM SHEET IS NOT COMPLETE AND MAY BE AMENDED PRIOR TO THE TIME OF SALE. THIS TERM SHEET IS NOT AN OFFER TO SELL THESE SECURITIES AND IT IS NOT A SOLICITATION OF AN OFFER TO BUY THESE SECURITIES IN ANY JURISDICTION WHERE THE OFFER OR SALE IS NOT PERMITTED.
156
138-35 39th Avenue Flushing, NY 11354 | Collateral Asset Summary – Loan No. 14 Flushing Commons | Cut-off Date Balance: Cut-off Date LTV: U/W NCF DSCR: U/W NOI Debt Yield: | $28,000,000 59.6% 2.45x 8.9% |
Cash Flow Analysis.
| Cash Flow Analysis(1) | ||
| U/W | U/W PSF | |
| Base Rent | $2,506,505 | $83.55 |
| Reimbursements | 291,550 | $9.72 |
| Rent Steps(2) | 49,939 | $1.66 |
| Potential Income From Vacant Space | 713,879 | $23.80 |
| Gross Potential Rent | $3,561,873 | $118.73 |
| Other Income | 0 | $0.00 |
| Vacancy & Credit Loss(3) | (713,879) | ($23.80) |
| Effective Gross Income | $2,847,994 | $94.93 |
| Real Estate Taxes | 130,715 | $4.36 |
| Insurance | 11,200 | $0.37 |
| Management Fee | 85,440 | $2.85 |
| Total Other Expenses | 115,461 | $3.85 |
| Net Operating Income | $2,505,178 | $83.51 |
| Replacement Reserves | 4,500 | $0.15 |
| TI/LC | 98,846 | $3.29 |
| Net Cash Flow | $2,401,832 | $80.06 |
| (1) | There is missing historical cash flow due to the property having been built in 2017 and subsequently being in lease up since the second quarter of 2018. |
| (2) | Rent Steps include $49,939 of contractual rent steps underwritten through December 1, 2020. |
| (3) | U/W Vacancy & Credit Loss represents the underwritten economic vacancy of 20.0%. |
THE INFORMATION IN THIS STRUCTURAL AND COLLATERAL TERM SHEET IS NOT COMPLETE AND MAY BE AMENDED PRIOR TO THE TIME OF SALE. THIS TERM SHEET IS NOT AN OFFER TO SELL THESE SECURITIES AND IT IS NOT A SOLICITATION OF AN OFFER TO BUY THESE SECURITIES IN ANY JURISDICTION WHERE THE OFFER OR SALE IS NOT PERMITTED.
157
4025, 4035, 4045, 4050, and 4055 South Riverpoint Parkway Phoenix, AZ 85040 | Collateral Asset Summary – Loan No. 15 Apollo Education Group HQ Campus | Cut-off Date Balance: Cut-off Date LTV: U/W NCF DSCR: U/W NOI Debt Yield: | $26,500,000 47.2% 4.15x 14.9% |
| Mortgage Loan Information | |
| Loan Seller: | JPMCB |
| Loan Purpose: | Refinance |
| Borrower Sponsor: | Steven Elghanayan |
| Borrower: | EPIC Apollo LLC |
| Original Balance(1): | $26,500,000 |
| Cut-off Date Balance(1): | $26,500,000 |
| % by Initial UPB: | 2.8% |
| Interest Rate: | 3.35000% |
| Payment Date: | 5th of each month |
| First Payment Date: | March 5, 2020 |
| Maturity Date: | February 5, 2025 |
| Amortization: | Interest Only |
| Additional Debt(1) : | $65,000,000 Pari Passu Debt |
| Call Protection: | L(29), D(28), O(3) |
| Lockbox / Cash Management: | Hard / Springing |
| Reserves | |||
| Initial | Monthly | Cap | |
| Taxes: | $0 | Springing | NAP |
| Insurance: | $0 | Springing | NAP |
| Replacement: | $9,994 | $9,994 | NAP |
| TI/LC: | $49,972 | $49,972 | NAP |
| Property Information | ||
| Single Asset / Portfolio: | Single Asset | |
| Property Type: | Suburban Office | |
| Collateral: | Fee Simple | |
| Location: | Phoenix, AZ | |
| Year Built / Renovated: | 2007, 2008 / 2019 | |
| Total Sq. Ft.(3): | 599,664 | |
| Property Management: | Self-Managed | |
| Underwritten NOI: | $13,609,674 | |
| Underwritten NCF: | $12,890,078 | |
| Appraised Value(4): | $194,000,000 | |
| Appraisal Date(4): | January 6, 2020 | |
| Historical NOI(2) | ||
| Most Recent NOI: | NAP | |
| 2019 NOI: | NAP | |
| 2018 NOI: | NAP | |
| 2017 NOI: | NAP | |
| Historical Occupancy | ||
| Most Recent Occupancy: | 100.0% (July 5, 2020) | |
| 2019 Occupancy: | 100.0% (December 31, 2019) | |
| 2018 Occupancy: | 100.0% (December 31, 2018) | |
| 2017 Occupancy: | 100.0% (December 31, 2017) | |
| Financial Information(1)(4) | ||||||
| Tranche | Cut-off Date Balance | Balance PSF Cut-off / Balloon | LTV Cut-off / Balloon | U/W DSCR NOI / NCF | U/W Debt Yield NOI / NCF | U/W Debt Yield at Balloon NOI / NCF |
| Mortgage Loan | $26,500,000 | |||||
| Pari Passu Notes | 65,000,000 | |||||
| Whole Loan | $91,500,000 | $153 / $153 | 47.2% / 47.2% | 4.38x / 4.15x | 14.9% / 14.1% | 14.9% / 14.1% |
| (1) | The Apollo Education Group HQ Campus mortgage loan (the “Apollo Education Group HQ Campus Loan”) consists of the non-controlling Note A-2 and is part of Apollo Education Group HQ Campus whole loan evidenced by three pari passu notes with an aggregate outstanding principal balance as of the Cut-off Date of $91.5 million (the “Apollo Education Group HQ Campus Whole Loan”). |
| (2) | Historical financial information was not provided by the borrower given the absolute NNN nature of the Apollo Education Group lease. |
| (3) | Apollo Education Group occupies all of the space at the Apollo Education Group HQ Campus Property (as defined below) pursuant to a NNN lease with a 2.0% contractual rent step per annum. |
| (4) | In addition to the “As Is” value of $194.0 million, the appraisal provided a “Hypothetical Go Dark” value of $97.0 million, as of January 6, 2020, which assumes that Apollo Education Group vacates the Apollo Education Group HQ Campus property and ceases rent payments under its lease. Based on the “Hypothetical Go Dark” value, the Whole Loan Cut-off Date LTV is equal to 94.3%. |
THE INFORMATION IN THIS STRUCTURAL AND COLLATERAL TERM SHEET IS NOT COMPLETE AND MAY BE AMENDED PRIOR TO THE TIME OF SALE. THIS TERM SHEET IS NOT AN OFFER TO SELL THESE SECURITIES AND IT IS NOT A SOLICITATION OF AN OFFER TO BUY THESE SECURITIES IN ANY JURISDICTION WHERE THE OFFER OR SALE IS NOT PERMITTED.
158
4025, 4035, 4045, 4050, and 4055 South Riverpoint Parkway Phoenix, AZ 85040 | Collateral Asset Summary – Loan No. 15 Apollo Education Group HQ Campus | Cut-off Date Balance: Cut-off Date LTV: U/W NCF DSCR: U/W NOI Debt Yield: | $26,500,000 47.2% 4.15x 14.9% |
The relationship between the holders of the Apollo Education Group HQ Campus Whole Loan will be governed by a co-lender agreement as described under “Description of the Mortgage Pool—The Whole Loans—The Non-Serviced Pari Passu Whole Loans” in the Preliminary Prospectus.
| Whole Loan Summary | |||||
| Note | Original Balance | Cut-off Date Balance | Note Holder | Controlling Piece | |
| Note A-1 | $50,000,000 | $50,000,000 | Benchmark 2020-B17 | Yes | |
| Note A-2 | 26,500,000 | 26,500,000 | Benchmark 2020-B18 | No | |
| Note A-3 | 15,000,000 | 15,000,000 | JPMDB 2020-COR7 | No | |
| Whole Loan | $91,500,000 | $91,500,000 | |||
The Apollo Education Group HQ Campus Whole Loan has a five-year interest-only term and accrues interest at a rate of 3.35000% per annum. The Apollo Education Group HQ Campus Whole Loan proceeds were used to refinance existing debt, pay closing costs and fund upfront reserves. Based on the “As Is” appraised value of $194.0 million as of January 6, 2020, the Cut-off Date LTV Ratio is 47.2%.
Sources and Uses | ||||||||
| Sources | Proceeds | % of Total | Uses | Proceeds | % of Total | |||
| Whole Loan | $91,500,000 | 100.0% | Payoff Existing Debt | $88,313,119 | 96.5% | |||
| Return of Equity | 2,248,647 | 2.5 | ||||||
| Closing Costs | 878,268 | 1.0 | ||||||
| Upfront Reserves | 59,966 | 0.1 | ||||||
| Total Sources | $91,500,000 | 100.0% | Total Uses | $91,500,000 | 100.0% | |||
The Borrower / Borrower Sponsor. The borrower is EPIC Apollo LLC, a Delaware limited liability company and single purpose entity with two independent directors. The borrower sponsor and non-recourse carveout guarantor is Steven Elghanayan. Steven Elghanayan is the CEO and Co-Founder of EPIC, LLC (“EPIC”), a global commercial real estate investment company operating from offices in London and New York. EPIC is a fully integrated owner, manager, operator and developer of commercial, residential, retail and industrial real estate. EPIC’s asset portfolio consists of logistics distribution properties across the United States and Europe encompassing over 6.7 million sq. ft. across 52 properties with a value of over $3 billion and net annual income of over $170 million.
The Property.
| Tenant Summary(1) | ||||||
| Tenant | Credit Rating (Moody’s/Fitch/S&P) | Net Rentable Area (Sq. Ft.) | % of Net Rentable Area | U/W Base Rent Per Sq. Ft.(2) | % of Total U/W Base Rent | Lease Expiration |
| Apollo Education Group | NR / NR / NR | 599,664 | 100.0% | $23.89 | 100.0% | 3/1/2031 |
| Total Occupied | 599,664 | 100.0% | $23.89 | 100.0% | ||
| Vacant | 0 | 0.0 | ||||
| Total | 599,664 | 100.0% | ||||
| (1) | Based on the underwritten rent roll dated July 5, 2020. |
| (2) | U/W Base Rent Per Sq. Ft. is inclusive of contractual rent steps through April 2020. Apollo Education Group occupies its space pursuant to a NNN lease with a 2.0% contractual rent step per annum. |
THE INFORMATION IN THIS STRUCTURAL AND COLLATERAL TERM SHEET IS NOT COMPLETE AND MAY BE AMENDED PRIOR TO THE TIME OF SALE. THIS TERM SHEET IS NOT AN OFFER TO SELL THESE SECURITIES AND IT IS NOT A SOLICITATION OF AN OFFER TO BUY THESE SECURITIES IN ANY JURISDICTION WHERE THE OFFER OR SALE IS NOT PERMITTED.
159
4025, 4035, 4045, 4050, and 4055 South Riverpoint Parkway Phoenix, AZ 85040 | Collateral Asset Summary – Loan No. 15 Apollo Education Group HQ Campus | Cut-off Date Balance: Cut-off Date LTV: U/W NCF DSCR: U/W NOI Debt Yield: | $26,500,000 47.2% 4.15x 14.9% |
| Lease Rollover Schedule(1)(2) | ||||||||
| Year | # of Leases Expiring | Total Expiring Sq. Ft. | % of Total Sq. Ft. Expiring | Cumulative Sq. Ft. Expiring | Cumulative % of Sq. Ft. Expiring | Annual U/W Base Rent Per Sq. Ft.(2) | % U/W Base Rent Rolling(2) | Cumulative % of U/W Base Rent |
| MTM | 0 | 0 | 0.0% | 0 | 0.0% | $0.00 | 0.0% | 0.0% |
| 2020 | 0 | 0 | 0.0% | 0 | 0.0% | $0.00 | 0.0% | 0.0% |
| 2021 | 0 | 0 | 0.0% | 0 | 0.0% | $0.00 | 0.0% | 0.0% |
| 2022 | 0 | 0 | 0.0% | 0 | 0.0% | $0.00 | 0.0% | 0.0% |
| 2023 | 0 | 0 | 0.0% | 0 | 0.0% | $0.00 | 0.0% | 0.0% |
| 2024 | 0 | 0 | 0.0% | 0 | 0.0% | $0.00 | 0.0% | 0.0% |
| 2025 | 0 | 0 | 0.0% | 0 | 0.0% | $0.00 | 0.0% | 0.0% |
| 2026 | 0 | 0 | 0.0% | 0 | 0.0% | $0.00 | 0.0% | 0.0% |
| 2027 | 0 | 0 | 0.0% | 0 | 0.0% | $0.00 | 0.0% | 0.0% |
| 2028 | 0 | 0 | 0.0% | 0 | 0.0% | $0.00 | 0.0% | 0.0% |
| 2029 | 0 | 0 | 0.0% | 0 | 0.0% | $0.00 | 0.0% | 0.0% |
| 2030 | 0 | 0 | 0.0% | 0 | 0.0% | $0.00 | 0.0% | 0.0% |
| 2031 and Thereafter | 1 | 599,664 | 100.0% | 599,664 | 100.0% | $23.89 | 100.0% | 100.0% |
| Vacant | NAP | 0 | 0.0% | 599,664 | 100.0% | NAP | NAP | |
| Total / Wtd. Avg. | 1 | 599,664 | 100.0% | $23.89 | 100.0% | |||
| (1) | Based on the underwritten rent roll dated July 5, 2020. |
| (2) | Annual U/W Base Rent Per Sq. Ft. and % U/W Base Rent Rolling is inclusive of contractual rent steps through April 2020. Apollo Education Group occupies its space pursuant to a NNN lease with a 2.0% contractual rent step per annum. |
The Apollo Education Group HQ Campus property (the “Apollo Education Group HQ Campus Property”) is comprised of three single tenant office buildings totaling 599,664 sq. ft. and is located in Phoenix, Arizona, approximately 3.5 miles southeast of the Phoenix Central Business District.
Apollo Education Group constructed the property in 2007 and 2008 to serve as the company’s global headquarters. Amenities at the Apollo Education Group HQ Campus Property include a two-story atrium at the front entrance of each building, a walking path around the full property, large landscaped and shaded outdoor areas, a Frisbee golf course, a fitness center, a student resource center and exterior basketball courts. The ten-story office building located at 4025 South Riverpoint Parkway also features a large full service cafeteria and two-story eating area. The Apollo Education Group HQ Campus Property features 4,623 surface and garage parking spaces, resulting in a parking ratio of 7.7 spaces per 1,000 sq. ft. of net rentable area. The Apollo Education Group HQ Campus Property is comprised primarily of office space with less than 10% of the space used as training facilities and classrooms. As of July 5, 2020, the Apollo Education Group HQ Campus Property was 100.0% occupied by Apollo Education Group.
The loan sponsor purchased the Apollo Education Group HQ Campus Property in February 2015 for a purchase price of $183 million ($305 per sq. ft.). Since 2016, the tenant, Apollo Education Group, has invested approximately $13.8 million ($23 per sq. ft.) in renovations and upgrades to the Apollo Education Group HQ Campus Property, re-affirming their commitment to the property. Renovations included upgrades to all restrooms, the installation of new sinks, counters and fixtures. Since 2018, approximately $13.0 million ($22 per sq. ft.) was used to upgrade training room configurations, provide updated amenities and a new student union.
Apollo Education Group (599,664 sq. ft.; 100.0% of NRA; 100.0% of U/W Base Rent), occupies the Apollo Education Group HQ Campus Property pursuant to a NNN lease expiring in March 2031 with four five-year extension options and no termination options. Founded in 1973, Apollo Education Group is a global private education service provider. Apollo Education Group was acquired by private equity firm Apollo Global Management in February 2017 for $1.14 billion. As of the fourth quarter of 2019, Apollo Global Management has assets under management of $331 billion and has experience in the education sector with investments in companies including McGraw Hill Education, Connections Academy and Sylvan Learning Centers. Apollo Education Group assigned its interest in the lease to the University of Phoenix in 2017, but still remains liable for all lease obligations. Through the University of Phoenix, a for-profit university, Apollo Education Group offers associate, bachelor’s, master’s and doctoral degree programs from campuses and learning centers across the United States as well as online throughout the world. The University of Phoenix has graduated more than one million students since its inception in 1976. The Apollo Education Group HQ Campus Property has served as Apollo Education Group’s global headquarters since the tenant constructed the Apollo Education Group HQ Campus Property in 2007-2008.
As of July 5, 2020, the Apollo Education Group HQ Campus Property remains 100.0% leased. The tenant has seen a significant increase in online enrollment as a result of the stay at home orders in the state of Arizona. Apollo Education Group is current with respect to all contractual rent obligations for April, May and June of 2020. The Apollo Education Group HQ Campus Loan is current through the July 5, 2020 payment date. As of July 1, 2020, the Apollo Education Group HQ Campus Loan is not subject to any modification or forbearance request.
The Apollo Education Group HQ Campus Property is situated along South Riverpoint Parkway with frontage along Interstate 10 and 32nd Street within the Phoenix Metropolitan Statistical Area. The Apollo Education Group HQ Campus Property is situated approximately 5.9 miles southwest of downtown Phoenix and 5.9 miles southwest of the Valley Metro rail station, a $1.4 billion light rail system connecting
THE INFORMATION IN THIS STRUCTURAL AND COLLATERAL TERM SHEET IS NOT COMPLETE AND MAY BE AMENDED PRIOR TO THE TIME OF SALE. THIS TERM SHEET IS NOT AN OFFER TO SELL THESE SECURITIES AND IT IS NOT A SOLICITATION OF AN OFFER TO BUY THESE SECURITIES IN ANY JURISDICTION WHERE THE OFFER OR SALE IS NOT PERMITTED.
160
4025, 4035, 4045, 4050, and 4055 South Riverpoint Parkway Phoenix, AZ 85040 | Collateral Asset Summary – Loan No. 15 Apollo Education Group HQ Campus | Cut-off Date Balance: Cut-off Date LTV: U/W NCF DSCR: U/W NOI Debt Yield: | $26,500,000 47.2% 4.15x 14.9% |
the cities of Phoenix, Tempe and Mesa. The light rail system was built in three phases beginning in late 2004 with completion in 2016. There is also access from the rail line to the Sky Harbor International Airport. Additionally, the Apollo Education Group HQ Campus Property is located adjacent to Interstate 10 providing centralized access to Highway 60, Interstate 17 and Loop 202 and 101 freeways, approximately 3.5 miles southeast of the Sky Harbor International Airport.
Apollo Education Group HQ Campus Property is located in the Phoenix office market, which has 91.6 million sq. ft. of office space as of the third quarter of 2019. The Phoenix office market has a 14.4% vacancy rate and average gross asking rents of $26.76 per sq. ft. Phoenix has a diverse list of large employers in both the public and private sector including Fortune 500 companies such as Honeywell, American Express, Amazon, JPMorgan, UnitedHealth, American Airlines and Bank of America. The Apollo Education Group HQ Campus Property is located in the South Airport office submarket, which, according to the appraisal, is the most active submarket within Phoenix. As of the third quarter of 2019, the South Airport submarket consisted of approximately 5.9 million sq. ft. of office space with a 21.0% vacancy rate and average gross rents of $23.19 per sq. ft. The Apollo Education Group HQ Campus Property has an average NNN rent of $23.89 per sq. ft. which is in line with the appraiser’s concluded market rent for the Apollo Education Group HQ Campus of $22.50 per sq. ft.
According to the appraisal, the estimated 2019 population within a one-, three- and five-mile radius of the Apollo Education Group HQ Campus Property was approximately 5,229, 63,646 and 301,595, respectively. The estimated 2019 average household income within the same radii was approximately $43,991, $63,371 and $60,717, respectively.
The appraisal identified eight comparable office leases ranging in size from 63,500 sq. ft. to 625,483 sq. ft. with terms ranging from 5.3 to 16.5 years. The comparable tenants reported annual rental rates ranging from $16.25 to $25.48 per sq. ft. with an average rent of approximately $22.01 per sq. ft., inclusive of NNN comparable leases. The weighted average in-place rent for the office space at the Apollo Education Group HQ Campus Property is $23.89 per sq. ft., in-line with the appraisal’s market rent conclusion.
Cash Flow Analysis.
| Cash Flow Analysis | ||
| U/W | U/W PSF | |
| Base Rent(1) | $14,325,973 | $23.89 |
| Gross Potential Rent | $14,325,973 | $23.89 |
| Total Reimbursements | 0 | $0.00 |
| Total Other Income | 0 | $0.00 |
| Vacancy | (716,299) | $(1.19) |
| Effective Gross Income | $13,609,674 | $22.70 |
| Total Expenses | 0 | $0.00 |
| Net Operating Income | $13,609,674 | $22.70 |
| TI/LC | 599,664 | $1.00 |
| Capital Expenditures | 119,933 | $0.20 |
| Net Cash Flow | $12,890,078 | $21.50 |
| (1) | U/W Base Rent is inclusive of contractual rent steps through April 2020. Apollo Education Group occupies its space pursuant to a NNN lease with a 2.0% contractual rent step per annum. For avoidance of doubt, no COVID-19 specific adjustments have been incorporated in the lender U/W. |
THE INFORMATION IN THIS STRUCTURAL AND COLLATERAL TERM SHEET IS NOT COMPLETE AND MAY BE AMENDED PRIOR TO THE TIME OF SALE. THIS TERM SHEET IS NOT AN OFFER TO SELL THESE SECURITIES AND IT IS NOT A SOLICITATION OF AN OFFER TO BUY THESE SECURITIES IN ANY JURISDICTION WHERE THE OFFER OR SALE IS NOT PERMITTED.
161
3600 South Las Vegas Boulevard Las Vegas, NV 89109 | Collateral Asset Summary – Loan No. 16 Bellagio Hotel and Casino | Cut-off Date Balance: Cut-off Date LTV: U/W NCF DSCR: U/W NOI Debt Yield: | $21,250,000 39.3% 8.42x 28.3% |
| Mortgage Loan Information | |
| Loan Sellers(1): | JPMCB |
| Loan Purpose: | Acquisition |
| Credit Assessment | |
| (Fitch/KBRA/S&P)(9): | BBB-sf / AA+(sf) / N/A |
| Borrower Sponsor(2): | BREIT Operating Partnership L.P. |
| Borrower: | BCORE Paradise LLC |
| Original Balance(3): | $21,250,000 |
| Cut-off Date Balance(3): | $21,250,000 |
| % by Initial UPB: | 2.3% |
| Interest Rate(4): | 3.170153% |
| Payment Date: | 5th of each month |
| First Payment Date: | January 5, 2020 |
| Maturity Date: | December 5, 2029 |
| Amortization: | Interest Only |
| Additional Debt(3): | $1,654,950,000 Pari Passu Debt; $650,500,000 B-Notes; $683,300,000 C-Notes; Future Mezzanine Debt Permitted |
| Call Protection(5): | YM0.5(31), DorYM0.5(82), O(7) |
| Lockbox / Cash Management: | Hard / Springing |
| Reserves | |||
| Initial | Monthly | Cap | |
| Taxes: | $0 | Springing | NAP |
| Insurance: | $0 | Springing | NAP |
| FF&E: | $0 | Springing | NAP |
| Property Information | |
| Single Asset / Portfolio: | Single Asset |
| Property Type: | Full Service Hospitality |
| Collateral: | Fee Simple / Leasehold |
| Location: | Las Vegas, NV |
| Year Built / Renovated: | 1997 / 2019 |
| Total Rooms(6): | 3,933 |
| Property Management: | Self-Managed |
| Underwritten NOI: | $474,065,315 |
| Underwritten NCF: | $453,829,378 |
| Appraised Value(7): | $4,260,000,000 |
| Appraisal Date(7): | October 16, 2019 |
| Historical NOI(8) | |
| Most Recent NOI: | $447,884,744 (T-12 March 31, 2020) |
| 2019 NOI: | $464,355,898 (December 31, 2019) |
| 2018 NOI: | $489,866,042 (December 31, 2018) |
| 2017 NOI: | $505,736,234 (December 31, 2017) |
| Historical Occupancy | |
| Most Recent Occupancy(6): | 93.4% (March 31, 2020) |
| 2019 Occupancy(6): | 94.4% (December 31, 2019) |
| 2018 Occupancy(6): | 94.9% (December 31, 2018) |
| 2017 Occupancy(6): | 92.9% (December 31, 2017) |
| Financial Information(3) | ||||||
| Tranche | Cut-off Date Balance | Balance per Room Cut-off / Balloon | LTV(7) Cut-off / Balloon | U/W DSCR(7) NOI / NCF | U/W Debt Yield(8) NOI / NCF | U/W Debt Yield at Balloon(8) NOI / NCF |
| Mortgage Loan | $21,250,000 | |||||
| Pari Passu Notes | $1,654,950,000 | |||||
| Total Senior Notes | $1,676,200,000 | $426,189 / $426,189 | 39.3% / 39.3% | 8.80x / 8.42x | 28.3% / 27.1% | 28.3% / 27.1% |
| B Notes | $650,500,000 | |||||
| C Notes | $683,300,000 | |||||
| Whole Loan | $3,010,000,000 | $765,319 / $765,319 | 70.7% / 70.7% | 4.24x / 4.06x | 15.7% / 15.1% | 15.7% / 15.1% |
| (1) | The Bellagio Hotel and Casino whole loan (the “Bellagio Hotel and Casino Whole Loan”) was co-originated by Morgan Stanley Bank, N.A. (“MSBNA”), JPMorgan Chase Bank, National Association (“JPMCB”) and Citi Real Estate Funding Inc. (“CREFI”). |
| (2) | The Borrower Sponsor is affiliated with the borrowers of the mortgage loans identified on Annex A-1 to the Preliminary Prospectus as BX Industrial Portfolio and MGM Grand and Mandalay Bay, which have a Cut-Off Date Balance of $70.00 million and $21.25 million, respectively. |
| (3) | The Bellagio Hotel and Casino loan (the “Bellagio Hotel and Casino Loan”) is part of the Bellagio Hotel and Casino Whole Loan, which is comprised of (i) 25 pari passu senior promissory notes with an aggregate Cut-off Date balance of $1,676,200,000 (the “Bellagio Hotel and Casino Senior Notes,” and collectively, the “Bellagio Hotel and Casino Senior Loan”), (ii) six promissory notes with an aggregate Cut-off Date balance of $650,500,000 which are pari passu with each other and subordinate to the Bellagio Hotel and Casino Senior Notes (the “Bellagio Hotel and Casino Junior A Notes”), and (iii) three promissory notes with an aggregate Cut-off Date balance of $683,300,000 which are pari passu with each other and subordinate to the Bellagio Hotel and Casino Senior Notes and the Bellagio Hotel and Casino Junior A Notes (the “Bellagio Hotel and Casino Junior B Notes” and collectively with the Bellagio Hotel and Casino Junior A Notes, the “Bellagio Hotel and Casino Subordinate Companion Loan”). |
| (4) | Reflects the Bellagio Hotel and Casino Senior Notes only. The Bellagio Hotel and Casino Junior A Notes also accrue interest at the rate of 3.170153% per annum. The Bellagio Hotel and Casino Junior B Notes accrue interest at the rate of 5.35000% per annum. |
| (5) | The defeasance lockout period will be 31 payments beginning with and including the first payment date of January 5, 2020. The Bellagio Hotel and Casino Borrower (as defined below) has the option to defease the full Bellagio Hotel and Casino Whole Loan after the earlier to occur of (i) two years after the closing date of the securitization that includes the last note to be securitized and (ii) November 15, 2022. The Bellagio Hotel and Casino Whole Loan may be prepaid in whole or in part at any time, subject to payment of the applicable yield maintenance premium if such prepayment occurs prior to June 5, 2029. |
| (6) | Size and Occupancy are based solely on the hotel at the Bellagio Hotel and Casino property (the “Bellagio Hotel and Casino Property”). As of the trailing 12 months ended March 31, 2020, approximately 29.9% of revenues were from gaming, 28.1% from hotel, 24.6% from food & beverage 9.0% from entertainment and 8.3% from other sources. |
| (7) | The Appraised Value of $4,260,000,000 set forth above is the appraised value solely with respect to real property at the Bellagio Hotel and Casino Property, excluding personal property and intangible property attributable to the Bellagio Hotel and Casino Property (the “Real Property Appraised Value”). The appraisal also includes an “As Leased-Sale-Leaseback Appraised Value,” which is equal to the Real Property Appraised Value. The Appraised Value of $6,500,000,000 (“As-Is Appraised Value”) includes personal property and intangible property attributable to the Bellagio Hotel and Casino Property. The personal property and intangible property relating to the Bellagio Hotel and Casino Property are owned by the Bellagio Tenant (as defined below), as more particularly provided in the Bellagio Lease (as defined below), which granted a security interest in certain property of Bellagio Tenant (with certain exclusions as more particularly described in the Bellagio Lease) in favor of the Bellagio Hotel and Casino Borrower (as defined below), and such security interest was collaterally assigned by the Bellagio Hotel and Casino Borrower to the lender. The Cut-off Date LTV Ratio and LTV Ratio at Maturity based on the As-Is Appraised Value are 25.8% and 25.8%, respectively, based on the Bellagio Hotel and Casino Senior Loan. |
| (8) | The Bellagio Hotel and Casino Property was acquired by the Bellagio Hotel and Casino Borrower in a sale-leaseback transaction from Bellagio, LLC, an indirectly wholly owned subsidiary of MGM Resorts International, which entered into a new 30-year lease, with two 10-year extension options to operate the Bellagio Hotel and Casino Property. The Bellagio Tenant owns a 5% equity interest in the Bellagio Hotel and Casino Borrower. Financial and other information presented in this term sheet is presented on a “look through” basis, before rent due under the Bellagio Lease. For so long as the Bellagio Lease is in effect, the Bellagio Hotel and Casino Borrower will be entitled only to the rent due under the Bellagio Lease and not to the underlying rent and other income from the Bellagio Hotel and Casino Property. The initial Bellagio Lease annual rent is $245,000,000, and U/W NCF DSCR, U/W NCF Debt Yield and U/W NCF Debt Yield at Maturity for the Bellagio Hotel and Casino Whole Loan based on such initial annual rent are 2.19x, 8.1% and 8.1% respectively. |
| (9) | Fitch and KBRA provided the listed assessments for the Bellagio Hotel and Casino Loan in the context of its inclusion in the mortgage pool. |
THE INFORMATION IN THIS STRUCTURAL AND COLLATERAL TERM SHEET IS NOT COMPLETE AND MAY BE AMENDED PRIOR TO THE TIME OF SALE. THIS TERM SHEET IS NOT AN OFFER TO SELL THESE SECURITIES AND IT IS NOT A SOLICITATION OF AN OFFER TO BUY THESE SECURITIES IN ANY JURISDICTION WHERE THE OFFER OR SALE IS NOT PERMITTED.
162
3600 South Las Vegas Boulevard Las Vegas, NV 89109 | Collateral Asset Summary – Loan No. 16 Bellagio Hotel and Casino | Cut-off Date Balance: Cut-off Date LTV: U/W NCF DSCR: U/W NOI Debt Yield: | $21,250,000 39.3% 8.42x 28.3% |
The relationship between the holders of the Bellagio Hotel and Casino Whole Loan will be governed by a co-lender agreement as described under “Description of the Mortgage Pool—The Whole Loans—The Non-Serviced AB Whole Loans—The Bellagio Hotel and Casino Whole Loan” in the Preliminary Prospectus.
| Whole Loan Summary | ||||||
| Note | Original Balance | Cut-off Date Balance | Note Holder | Controlling Piece | ||
| Note A-2-C2, A-3-C2 | $60,000,000 | $60,000,000 | Benchmark 2020-B16 | No | ||
| Note A-1-C1 | $100,000,000 | $100,000,000 | BANK 2020-BNK25 | No | ||
| Note A-2-C1 | $60,000,000 | $60,000,000 | GSMS 2020-GC45 | No | ||
| Note A-1-S1, A-1-S2, A-2-S1, A-2-S2, A-3-S1, A-3-S2 | $716,000,000 | $716,000,000 | BX 2019-OC11 | Yes(1) | ||
| Note A-1-RL, A-2-RL, A-3-RL | $360,200,000 | $360,200,000 | Third party investor | No | ||
| Note A-1-C2 | $61,000,000 | $61,000,000 | BANK 2020-BNK27 | No | ||
| Note A-1-C3 | $65,000,000 | $65,000,000 | MSC 2020-L4 | No | ||
| Note A-1-C5 | $35,000,000 | $35,000,000 | BANK 2020-BNK26 | No | ||
| Note A-1-C4, A-1-C6 | $39,000,000 | $39,000,000 | MSNBA(2) | No | ||
| Note A-2-C4 | $20,000,000 | $20,000,000 | CGCMT 2020-GC46 | No | ||
| Note A-3-C1 | $40,000,000 | $40,000,000 | Benchmark 2020-B17 | No | ||
| Note A-3-C3, A-3-C4 | $43,750,000 | $43,750,000 | BBCMS 2020-C6 | No | ||
| Note A-2-C-3, A-3-C5 | $55,000,000 | $55,000,000 | Benchmark 2020-IG1 | No | ||
| Note A-3-C6 | $21,250,000 | $21,250,000 | Benchmark 2020-B18 | No | ||
| Total Senior Notes(3) | $1,676,200,000 | $1,676,200,000 | ||||
| Note B-1-S, B-2-S, B-3-S | $510,700,000 | $510,700,000 | BX 2019-OC11 | No | ||
| Note B-1-RL, B-2-RL, B-3-RL | $139,800,000 | $139,800,000 | Third party investor | No | ||
| Total Junior A Notes(3) | $650,500,000 | $650,500,000 | ||||
| Note C-1-S, C-2-S, C-3-S | $683,300,000 | $683,300,000 | BX 2019-OC11 | No | ||
| Whole Loan | $3,010,000,000 | $3,010,000,000 | ||||
| (1) | The controlling note is Note A-1-S1. |
| (2) | Expected to be contributed to one or more future securitization transactions. |
| (3) | The Bellagio Hotel and Casino Junior A Notes are subordinate to the Bellagio Hotel and Casino Senior Notes, and the Bellagio Hotel and Casino Junior B Notes are subordinate to the Bellagio Hotel and Casino Senior Notes and the Bellagio Hotel and Casino Junior A Notes. |
The Bellagio Hotel and Casino Whole Loan has a 10-year interest-only term. The Bellagio Hotel and Casino Senior Notes and Bellagio Hotel and Casino Junior A Notes accrue at the rate of 3.170153% per annum. The Bellagio Hotel and Casino Junior B Notes accrue interest at the rate of 5.35000% per annum. The Bellagio Hotel and Casino Whole Loan proceeds along with borrower sponsor equity were used to purchase the Bellagio Hotel and Casino Property for approximately $4.25 billion. Based on the “As-Is” Appraised Value of $6.5 billion as of October 16, 2019, the Cut-off Date LTV and Maturity Date LTV for the Bellagio Hotel and Casino Senior Loan are 25.8% and 25.8%, respectively.
| Sources and Uses | ||||||
| Sources | Proceeds | % of Total | Uses | Proceeds | % of Total | |
| Senior Notes | $1,676,200,000 | 39.3% | Purchase Price | $4,250,000,000 | 99.8% | |
| Junior A Notes | 1,333,800,000 | 31.3 | Closing Costs | 10,591,035 | 0.2% | |
| Sponsor Equity(1) | 1,250,591,035 | 29.4 | ||||
| Total Sources | $4,260,591,035 | 100.0% | Total Uses | $4,260,591,035 | 100.0% | |
| (1) | Includes MGM’s approximately $62.4 million of retained equity interest in the Bellagio Hotel and Casino Property after the sale-leaseback. |
The Borrower / Borrower Sponsor. The borrower is BCORE Paradise LLC (the “Bellagio Hotel and Casino Borrower”), a Delaware limited liability company and single purpose entity with two independent directors. BREIT Operating Partnership L.P. (“BREIT OP”) is the borrower sponsor and the non-recourse carveout guarantor. BREIT OP is a subsidiary of Blackstone Real Estate Investment Trust, Inc. (“BREIT”). BREIT is a non-traded REIT focused on investing in commercial real estate properties diversified by sector with an emphasis on providing investors with access to Blackstone’s institutional real estate investment platform. BREIT seeks to directly own stabilized income-generating United States commercial real estate across the key property types, including multifamily, industrial, retail, hotel, healthcare and office. BREIT is managed by an external advisor, BX REIT Advisors L.L.C., which is an affiliate of The Blackstone Group Inc. (“Blackstone”). Blackstone’s real estate assets under management included approximately 114,000 owned hotel keys as of December 31, 2019, making Blackstone one of the largest hospitality investors in the United States. Blackstone’s experience of owning and managing hotels includes Cosmopolitan Las Vegas, Hotel Del Coronado, Grand Wailea, Arizona Biltmore, Ritz Carlton Kapalua, and Turtle Bay Resort. Legal counsel to the borrower delivered a non-consolidation opinion in connection with the origination of the Bellagio Hotel and Casino Whole Loan.
The non-recourse carveout guarantor’s liability for bankruptcy related recourse events is capped at an amount equal to 10% of the aggregate outstanding principal balance of the Bellagio Hotel and Casino Whole Loan as of the date of the event. In addition, only the related single purpose entity borrower, and not the non-recourse carveout guarantor, is liable for breaches of environmental covenants, and the single purpose entity borrower is the only party liable under the environmental indemnity; provided, however, that if the Bellagio
THE INFORMATION IN THIS STRUCTURAL AND COLLATERAL TERM SHEET IS NOT COMPLETE AND MAY BE AMENDED PRIOR TO THE TIME OF SALE. THIS TERM SHEET IS NOT AN OFFER TO SELL THESE SECURITIES AND IT IS NOT A SOLICITATION OF AN OFFER TO BUY THESE SECURITIES IN ANY JURISDICTION WHERE THE OFFER OR SALE IS NOT PERMITTED.
163
3600 South Las Vegas Boulevard Las Vegas, NV 89109 | Collateral Asset Summary – Loan No. 16 Bellagio Hotel and Casino | Cut-off Date Balance: Cut-off Date LTV: U/W NCF DSCR: U/W NOI Debt Yield: | $21,250,000 39.3% 8.42x 28.3% |
Hotel and Casino Borrower fails to maintain an environmental insurance policy required under the loan documents, the non-recourse carveout guarantor is liable for losses other than (x) for any amounts in excess of the applicable coverage amounts under the environmental policy had the same been renewed, replaced or extended as required under the loan agreement and (y) for any amounts recovered under the environmental policy. In addition, recourse for transfers of the Bellagio Hotel and Casino Property or controlling equity interests in the Bellagio Hotel and Casino Borrower is loss recourse, rather than full recourse.
The Property. The Bellagio Hotel and Casino Property is a full-service luxury resort and casino property located on the Las Vegas Strip, between The Cosmopolitan and Caesar’s Palace, and across from the Paris Las Vegas Hotel & Casino and Bally’s Las Vegas Hotel & Casino. The Bellagio covers approximately 77 acres and consists of 3,933 hotel rooms and suites in two hotel towers – the Main Tower and the Spa Tower. The Main Tower offers panoramic views of the Las Vegas Strip and the Fountains of Bellagio. The Bellagio Hotel and Casino Property contains approximately 154,000 sq. ft. of casino space, featuring approximately 1,700 slot machines and 144 gaming tables, approximately 200,000 sq. ft. of event space, 29 food and beverage outlets, an approximately 55,000 sq. ft. spa, five swimming pools, approximately 85,000 sq. ft. of retail space featuring approximately 30 retailers, and a botanical garden. The Bellagio is also the home to Cirque du Soleil’s “O”, an aquatic, acrobatic theater production that has been in residence at the Bellagio since October 1998. Guestrooms range from one to three bedrooms. Standard room amenities include a flat-panel television, high-speed internet and 24-hour in room dining. The guest bathrooms are finished with porcelain tile flooring and tub/shower surrounds, granite vanity countertops, and wall-mounted lighting fixtures. Additional amenities include access to five outdoor swimming pools with 51 private cabanas, four whirlpools, two wedding chapels, a fitness center, a spa, a salon and barber shop, concierge services, the Fountains of Bellagio, the Bellagio Gallery of Fine Art, the Conservatory and Botanical Gardens, on-site entertainment, retail outlets, a FedEx business center and transportation services.
Cirque du Soleil performances at the Bellagio Hotel and Casino Property scheduled through July 31, 2020 have been cancelled. On June 29, 2020, Cirque du Soleil Entertainment Group (“Cirque”) announced that it and certain of its affiliated companies have filed in Canada for protection from creditors under the Companies’ Creditors Arrangement Act in order to restructure its capital structure and that, if the court grants the initial order sought, Cirque will seek its immediate provisional recognition in the United States under Chapter 15 of the U.S. Bankruptcy Code in the United States Bankruptcy Court.
Approximately $371.9 million (approximately $94,600 per key) has been invested in the Bellagio Hotel and Casino Property since 2010, including approximately $165 million on room renovations (approximately $42,000 per key). In 2011 and 2012 the Bellagio Hotel and Casino Property underwent a $66.6 million renovation on the Main Tower and a $39.7 million renovation on the Spa Tower. Average daily rate (“ADR”) increased 2.9% from 2011 to 2012 and an additional 2.8% from 2012 to 2013. In 2014 and 2015 the Bellagio Hotel and Casino Property underwent a $59.1 million renovation on the suites in the Main Tower. Total hotel operating revenue increased to approximately $363.7 million in 2016, representing a 6.3% year over year increase compared to 2015. ADR increased 5.1% year over year and RevPAR increased 5.5% in the same time period. Approximately $12.8 million was spent on the renovation of Sadelle’s and Spago restaurants. Sadelle’s replaced Café Bellagio in December 2018 and Spago opened in June 2018, replacing Todd English Olives.
The Bellagio Hotel and Casino Property was acquired by the Bellagio Hotel and Casino Borrower in a sale-leaseback transaction from Bellagio, LLC (the “Bellagio Tenant”), an indirectly wholly owned subsidiary of MGM Resorts International (“MGM”), which entered into a new 30-year lease, with two 10-year extension options (the “Bellagio Lease”) to operate the Bellagio Hotel and Casino Property. Under the Bellagio Lease, the Bellagio Tenant is required to pay to the Bellagio Hotel and Casino Borrower an initial lease rent of $245.0 million per annum (the “Bellagio Lease Rent”), subject to annual increases of (i) 2.0% for the first 10 years of the lease term, and (ii) thereafter, the greater of 2.0% or the United States Department of Labor, Bureau of Labor Statistics Revised Consumer Price Index for All Urban Consumers (1982-84=100), U.S. City Average (“CPI”) (capped at 3.0% in years 11-20 and 4.0% thereafter) for the remainder of the initial lease term. MGM (NYSE: MGM, rated Ba3/BB/BB- by Moody’s, Fitch and S&P) guarantees the payment and performance of all monetary obligations and certain other obligations of the Bellagio Tenant under the Bellagio Lease. In connection with the sale-leaseback, the Bellagio Tenant is required under the Bellagio Lease to make capital improvements intended to ensure that the Bellagio Hotel and Casino Property remains competitive with other top tier Las Vegas Strip offerings going forward. For the four year period from 2020 through 2023, under the Bellagio Lease, the Bellagio Tenant is required to spend 5.0% of net revenues (subject to a minimum of $275.0 million total) on capital expenditures, in the aggregate. During each four year period (on a rolling basis) beginning in 2024 through the end of the Bellagio Hotel and Casino Whole Loan term, the Bellagio Tenant is required to spend 3.0% of net revenues on capital expenditures. Under the terms of the Bellagio Lease, the Bellagio Tenant is also required to reserve on a monthly basis 1.5% of net revenues each year to fund capital expenditures (which are made available to the Bellagio Tenant for capital expenditures and FF&E). As of the trailing twelve months ended March 31, 2020, approximately 29.9% of revenues were from gaming, 28.1% from hotel, 24.6% from food & beverage, 9.0% from entertainment and 8.3% from other sources.
The Bellagio Hotel and Casino Property includes a variety of retail tenants, including brands such as Chanel, Tiffany & Co., Gucci, Hermes, Christian Dior, Breguet and Harry Winston. The retail space totals approximately 85,000 sq. ft. and generated approximately $54.6 million in revenue as of December 31, 2018. The Bellagio Tenant is currently budgeting for the addition of a luxury retail store in the Bellagio Hotel and Casino Property lobby. We cannot assure you that this change will occur as expected or at all.
THE INFORMATION IN THIS STRUCTURAL AND COLLATERAL TERM SHEET IS NOT COMPLETE AND MAY BE AMENDED PRIOR TO THE TIME OF SALE. THIS TERM SHEET IS NOT AN OFFER TO SELL THESE SECURITIES AND IT IS NOT A SOLICITATION OF AN OFFER TO BUY THESE SECURITIES IN ANY JURISDICTION WHERE THE OFFER OR SALE IS NOT PERMITTED.
164
3600 South Las Vegas Boulevard Las Vegas, NV 89109 | Collateral Asset Summary – Loan No. 16 Bellagio Hotel and Casino | Cut-off Date Balance: Cut-off Date LTV: U/W NCF DSCR: U/W NOI Debt Yield: | $21,250,000 39.3% 8.42x 28.3% |
The hotel component of the Bellagio Hotel and Casino Property has maintained an occupancy at or above 92.3% since 2006 with an 11-year average occupancy of 93.4%. As of TTM March 2020, the Bellagio Hotel and Casino Property had an average of 3,933 rooms available with an occupancy of 93.4%, an ADR of $286.23 and a RevPAR of $267.40.
| Hotel Performance(1) | |||||||||||||
| 2009 | 2010 | 2011 | 2012 | 2013 | 2014 | 2015 | 2016 | 2017 | 2018 | 2019 | TTM March 2020 | 11-Year Avg.(2) | |
| Occupancy | 94.2% | 92.5% | 93.3% | 92.9% | 92.3% | 93.1% | 93.2% | 93.5% | 92.9% | 94.9% | 94.4% | 93.4% | 93.4% |
| ADR | $204 | $204 | $230 | $237 | $243 | $254 | $257 | $270 | $276 | $278 | $285 | $286 | $249 |
| RevPAR | $192 | $189 | $215 | $220 | $225 | $236 | $240 | $253 | $257 | $264 | $269 | $267 | $233 |
| Room Revenue ($mm) | $271.2 | $271.1 | $297.3 | $311.5 | $321.7 | $337.6 | $342.2 | $363.7 | $368.1 | $378.9 | $384.1 | $368.1 | $331.6 |
| (1) | The financial information presented in this table is consistent with the manner in which MGM management assesses these results and allocates resources. Accordingly, the results and information presented in this table may differ, in some respects, from how such results and information would be presented in standalone financial statements. |
| (2) | Average excludes TTM March 2020. |
The Bellagio Hotel and Casino Property contains approximately 154,000 sq. ft. of casino space, featuring approximately 1,700 slot machines and 144 gaming tables. The casino facilities include table games such as blackjack, craps, roulette, baccarat and poker.
| Casino Performance(1) | |||||||||||||
| 2008 | 2009 | 2010 | 2011 | 2012 | 2013 | 2014 | 2015 | 2016 | 2017 | 2018 | 5-Year Avg. | 11-Year Avg. | |
| Slot Units | 2,376 | 2,298 | 2,250 | 2,205 | 2,100 | 2,118 | 2,063 | 1,935 | 1,873 | 1,827 | 1,732 | 1,886 | 2,071 |
| Table Units | 151 | 153 | 154 | 152 | 147 | 146 | 144 | 146 | 145 | 145 | 144 | 145 | 148 |
| Gaming Revenue ($mm) | $352.75 | $306.87 | $289.51 | $319.11 | $298.61 | $335.58 | $381.50 | $369.71 | $439.66 | $435.93 | $422.86 | $409.93 | $359.28 |
| % Change in Gaming Revenue | - | -13.0% | -5.7% | 10.2% | -6.4% | 12.4% | 13.7% | -3.1% | 18.9% | -0.8% | -3.0% | N/A | N/A |
| (1) | The financial information presented in this table is consistent with the manner in which MGM management assesses these results and allocates resources. Accordingly, the results and information presented in this table may differ, in some respects, from how such results and information would be presented in standalone financial statements. 2019 figures for Casino Performance at the Bellagio Hotel and Casino Property are not available as they were not provided by the borrower. |
As of July 1, 2020, the Bellagio Hotel and Casino Property remains 100.0% leased to MGM. The Bellagio Hotel and Casino Loan is current through the July 1, 2020 payment date. As of July 5, 2020, the Bellagio Hotel and Casino Loan is not subject to any modification or forbearance request.
The Bellagio Hotel and Casino Property is located on the Las Vegas Strip in the heart of Las Vegas, Nevada. Visitor volume and airport passenger traffic into the Las Vegas region have more than doubled from 1990 to 2018. In connection with the financial downturn in 2008 and 2009, the Las Vegas Market generally experienced a contraction. During 2010, the market began to rebound and visitation has returned to or near peak levels. 2018 Year-over-Year, Airport Passenger Traffic is up 2.5% and Clark County Gaming Revenues are up 2.7%.
| Market Overview(1) | |||||||||||
| Category | 1990 | 2010 | 2011 | 2012 | 2013 | 2014 | 2015 | 2016 | 2017 | 2018 | 2019 |
| Visitor Volume (thousands) | 20,954 | 37,335 | 38,929 | 39,727 | 39,668 | 41,127 | 42,312 | 42,936 | 42,214 | 42,117 | 42,524 |
| YoY % Change | NAP | 2.7% | 4.3% | 2.1% | -0.1% | 3.7% | 2.9% | 1.5% | -1.7% | -0.2% | 1.0% |
| Clark County Gaming Revenues ($mm) | $4,104 | $8,909 | $9,223 | $9,400 | $9,674 | $9,554 | $9,618 | $9,714 | $9,979 | $10,250 | $10,355 |
| YoY % Change | NAP | 0.8% | 3.5% | 1.9% | 2.9% | -1.2% | 0.7% | 1.0% | 2.7% | 2.7% | 1.0% |
| Hotel / Motel Rooms Inventory | 73,730 | 148,935 | 150,161 | 150,481 | 150,593 | 150,544 | 149,213 | 149,339 | 148,896 | 149,158 | 150,259 |
| YoY % Change | NAP | 0.0% | 0.8% | 0.2% | 0.1% | 0.0% | -0.9% | 0.1% | -0.3% | 0.2% | 0.7% |
| Airport Passenger Traffic (thousands) | 19,090 | 39,757 | 41,481 | 41,668 | 41,857 | 42,885 | 45,319 | 47,368 | 48,430 | 49,646 | 51,538 |
| YoY % Change | NAP | -1.8% | 4.3% | 0.4% | 0.5% | 2.5% | 5.7% | 4.5% | 2.2% | 2.5% | 3.8% |
| Convention Attendance (thousands) | 1,742 | 4,473 | 4,865 | 4,944 | 5,107 | 5,195 | 5,891 | 6,311 | 6,646 | 6,502 | 6,649 |
| YoY % Change | NAP | -0.4% | 8.8% | 1.6% | 3.3% | 1.7% | 13.4% | 7.1% | 5.3% | -2.2% | 2.3% |
| (1) | Source: Las Vegas Convention and Visitors Authority. |
THE INFORMATION IN THIS STRUCTURAL AND COLLATERAL TERM SHEET IS NOT COMPLETE AND MAY BE AMENDED PRIOR TO THE TIME OF SALE. THIS TERM SHEET IS NOT AN OFFER TO SELL THESE SECURITIES AND IT IS NOT A SOLICITATION OF AN OFFER TO BUY THESE SECURITIES IN ANY JURISDICTION WHERE THE OFFER OR SALE IS NOT PERMITTED.
165
3600 South Las Vegas Boulevard Las Vegas, NV 89109 | Collateral Asset Summary – Loan No. 16 Bellagio Hotel and Casino | Cut-off Date Balance: Cut-off Date LTV: U/W NCF DSCR: U/W NOI Debt Yield: | $21,250,000 39.3% 8.42x 28.3% |
The Las Vegas Strip has traditionally enjoyed high occupancy rates compared to the national average. From 2014 to year to date May 2019, occupancy across the Las Vegas Strip increased from 88.8% to 90.3%. ADR for the Las Vegas Strip increased by approximately 18.3% from $126 in 2014 to $149 for year to date May 2019. Improving trends in ADR have been driven by more properties adding resort fees, improvement in the convention segment, as well as the addition of higher-quality room supply.
| Historical Occupancy, ADR, RevPAR(1) | |||||||||
| Competitive Set | Bellagio Hotel and Casino Property | Penetration Factor | |||||||
| Year | Occupancy | ADR | RevPAR | Occupancy | ADR | RevPAR | Occupancy | ADR | RevPAR |
| 2018 | 91.1% | $281.66 | $257.01 | 94.9% | $278.28 | $264.19 | 104.2% | 98.8% | 102.8% |
| (1) | Source: Appraisal. |
The primary competitive set for the Bellagio Hotel and Casino Property comprises five hotels located on the Las Vegas Strip. These properties total 22,840 rooms and include the 4,004 room Aria Resort & Casino, 4,748 room Wynn/Encore Resort and Casino, 7,117 room Venetian/Palazzo Resort and Casino, 2,995 room Cosmopolitan Resort and Casino and 3,976 room Caesar's Palace.
| Comparable Properties(1) | |||||||
| Property Name | No. of Rooms | Year Opened | Meeting Space (sq. ft.) | Gaming Space (sq. ft.) | Estimated 2018 Occ. | Estimated 2018 ADR | Estimated 2018 RevPAR |
| Bellagio Hotel and Casino Property | 3,933 | 1998 | 200,000 | 154,000 | 94.9% | $278.28 | $264.19 |
| Aria Resort & Casino | 4,004 | 2009 | 500,000 | 150,000 | 91.0% | $265.00 | $241.15 |
| Wynn/Encore Resort and Casino | 4,748 | 2006/2008 | 290,000 | 191,424 | 90.0% | $300.00 | $270.00 |
| Venetian/Palazzo Resort and Casino | 7,117 | 1999/2010 | 450,000 | 335,878 | 91.0% | $295.00 | $268.45 |
| Cosmopolitan Resort and Casino | 2,995 | 2010 | 152,000 | 68,981 | 95.0% | $325.00 | $308.75 |
| Caesar's Palace | 3,976 | 1966 | 300,000 | 124,200 | 90.0% | $220.00 | $198.00 |
| (1) | Source: Appraisal. |
Cash Flow Analysis.
| Cash Flow Analysis(1) | ||||||
| 2017 | 2018 | 2019 | T-12 3/31/2020 | U/W | U/W (Per Room) | |
| Occupancy | 92.9% | 94.9% | 94.4% | 93.4% | 94.8% | |
| ADR | $276.24 | $278.28 | $284.52 | $286.23 | $281.69 | |
| RevPAR | $256.53 | $264.19 | $268.51 | $267.40 | $267.18 | |
| Room Revenue | $368,058,522 | $378,860,233 | $384,145,763 | $368,069,271 | $382,839,838 | $97,340 |
| F&B Revenue | 341,830,126 | 334,447,851 | 334,770,265 | 322,552,992 | 333,149,122 | $84,706 |
| Gaming | 435,933,726 | 422,862,787 | 388,536,245 | 391,669,133 | 399,769,284 | $101,645 |
| Entertainment | 119,207,719 | 120,427,525 | 123,528,731 | 118,031,869 | 121,762,603 | $30,959 |
| Other Revenue(2) | 100,540,676 | 111,236,871 | 113,663,523 | 108,916,003 | 111,541,617 | $28,360 |
| Total Revenue | $1,365,570,769 | $1,367,835,267 | $1,344,644,527 | $1,309,239,268 | $1,349,062,464 | $343,011 |
| Room Expense | 107,330,702 | 111,385,859 | 112,393,890 | 110,133,638 | 111,344,926 | $28,310 |
| F&B Expense | 258,789,184 | 257,609,113 | 254,328,159 | 247,924,054 | 256,340,473 | $65,177 |
| Other Departmental Expenses(2) | 322,639,400 | 332,481,659 | 331,112,060 | 324,536,693 | 330,066,360 | $83,922 |
| Total Departmental Expenses | $688,759,286 | $701,476,631 | $697,834,109 | $682,594,385 | $697,751,759 | $177,410 |
| Gross Operating Income | $676,811,483 | $666,358,636 | $646,810,418 | $626,644,883 | $651,310,705 | $165,602 |
| Total Undistributed Expenses | 127,583,150 | 128,495,099 | 132,753,933 | 129,643,640 | 128,324,048 | $32,628 |
| Gross Operating Profit | $549,228,333 | $537,863,537 | $514,056,485 | $497,001,243 | $522,986,657 | $132,974 |
| Management Fee | 24,326,134 | 26,005,109 | 26,892,891 | 26,184,785 | 26,682,737 | $6,784 |
| Taxes | 16,070,971 | 18,230,324 | 17,853,945 | 17,951,785 | 17,763,857 | $4,517 |
| Insurance | 3,094,994 | 3,762,062 | 4,953,751 | 4,979,929 | 4,474,748 | $1,138 |
| Total Fixed Charges | 19,165,965 | 21,992,386 | 22,807,696 | 22,931,714 | 22,238,605 | $5,654 |
| Total Operating Expenses | $859,834,535 | $877,969,225 | $880,288,629 | $861,354,524 | $874,997,149 | $222,476 |
| Net Operating Income | $505,736,234 | $489,866,042 | $464,355,898 | $447,884,744 | $474,065,315 | $120,535 |
| Capital Expenditures | 0 | 0 | 0 | 0 | 20,235,937 | $5,145 |
| Net Cash Flow | $505,736,234 | $489,866,042 | $464,355,898 | $447,884,744 | $453,829,378 | $115,390 |
| (1) | The information above is presented on a “look through” basis, before rent due under the Bellagio Lease. For so long as the Bellagio Lease is in effect, the Bellagio Hotel and Casino Borrower will be entitled only to the rent due under the Bellagio Lease and not to the underlying rent and other income from the Bellagio Hotel and Casino Property. The initial Bellagio Lease annual rent is $245,000,000, and DSCR and Debt Yield for the Bellagio Hotel and Casino Whole Loan based on such initial annual rent are 2.19x and 8.1% respectively. . For avoidance of doubt, no COVID-19 specific adjustments have been incorporated in the lender U/W. |
| (2) | Other Revenue and Other Departmental Expenses include retail other operations. |
THE INFORMATION IN THIS STRUCTURAL AND COLLATERAL TERM SHEET IS NOT COMPLETE AND MAY BE AMENDED PRIOR TO THE TIME OF SALE. THIS TERM SHEET IS NOT AN OFFER TO SELL THESE SECURITIES AND IT IS NOT A SOLICITATION OF AN OFFER TO BUY THESE SECURITIES IN ANY JURISDICTION WHERE THE OFFER OR SALE IS NOT PERMITTED.
166
STATEMENT REGARDING ASSUMPTIONS AS TO SECURITIES, PRICING ESTIMATES AND
OTHER INFORMATION
This material is for your information, and none of Deutsche Bank Securities Inc., J.P. Morgan Securities LLC, Goldman Sachs & Co. LLC, Citigroup Global Markets Inc., Drexel Hamilton, LLC and AmeriVet Securities, Inc. or any other underwriter, (the “Underwriters”) are soliciting any action based upon it. This material is not to be construed as an offer to sell or the solicitation of any offer to buy any security in any jurisdiction where such an offer or solicitation would be illegal.
Neither this document nor anything contained herein shall form the basis for any contract or commitment whatsoever. The information contained herein is preliminary as of the date hereof. These materials are subject to change, completion or amendment from time to time. The information contained herein will be superseded by similar information delivered to you as part of the preliminary prospectus relating to the Benchmark 2020-B18 Mortgage Trust Commercial Mortgage Pass-Through Certificates, Series 2020-B18 (the "Offering Document"). The information contained herein supersedes any such information previously delivered and should be reviewed only in conjunction with the entire Offering Document. All of the information contained herein is subject to the same limitations and qualifications contained in the Offering Document. The information contained herein does not contain all relevant information relating to the underlying mortgage loans or mortgaged properties. Such information is described elsewhere in the Offering Document. The information contained herein will be more fully described elsewhere in the Offering Document. The information contained herein should not be viewed as projections, forecasts, predictions or opinions with respect to value. Prior to making any investment decision, prospective investors are strongly urged to read the Offering Document its entirety. Neither the Securities and Exchange Commission nor any state securities commission has approved or disapproved of these securities or determined if this free writing prospectus is truthful or complete. Any representation to the contrary is a criminal offense.
The attached information contains certain tables and other statistical analyses (the “Computational Materials”) which have been prepared in reliance upon information furnished by the Mortgage Loan Sellers. Numerous assumptions were used in preparing the Computational Materials, which may or may not be reflected herein. As such, no assurance can be given as to the Computational Materials’ accuracy, appropriateness or completeness in any particular context; or as to whether the Computational Materials and/or the assumptions upon which they are based reflect present market conditions or future market performance. The Computational Materials should not be construed as either projections or predictions or as legal, tax, financial or accounting advice. You should consult your own counsel, accountant and other advisors as to the legal, tax, business, financial and related aspects of a purchase of these securities. Any weighted average lives, yields and principal payment periods shown in the Computational Materials are based on prepayment and/or loss assumptions, and changes in such prepayment and/or loss assumptions may dramatically affect such weighted average lives, yields and principal payment periods. In addition, it is possible that prepayments or losses on the underlying assets will occur at rates higher or lower than the rates shown in the attached Computational Materials. The specific characteristics of the securities may differ from those shown in the Computational Materials due to differences between the final underlying assets and the preliminary underlying assets used in preparing the Computational Materials. The principal amount and designation of any security described in the Computational Materials are subject to change prior to issuance. None of Underwriters or any of their respective affiliates makes any representation or warranty as to the actual rate or timing of payments or losses on any of the underlying assets or the payments or yield on the securities.
This document contains forward-looking statements. Those statements are subject to certain risks and uncertainties that could cause the success of collections and the actual cash flow generated to differ materially from the information set forth herein. While such information reflects projections prepared in good faith based upon methods and data that are believed to be reasonable and accurate as of the dates thereof, the depositor undertakes no obligation to revise these forward-looking statements to reflect subsequent events or circumstances. Individuals should not place undue reliance on forward-looking statements and are advised to make their own independent analysis and determination with respect to the forecasted periods, which reflect the issuer’s view only as of the date hereof.
IMPORTANT NOTICE RELATING TO AUTOMATICALLY GENERATED EMAIL DISCLAIMERS
Any legends, disclaimers or other notices that may appear at the bottom of the email communication to which this free writing prospectus is attached relating to (1) these materials not constituting an offer (or a solicitation of an offer), (2) no representation being made that these materials are accurate or complete and may not be updated or (3) these materials possibly being confidential, are not applicable to these materials and should be disregarded. Such legends, disclaimers or other notices have been automatically generated as a result of these materials having been sent via Bloomberg or another system.
THE INFORMATION IN THIS STRUCTURAL AND COLLATERAL TERM SHEET IS NOT COMPLETE AND MAY BE AMENDED PRIOR TO THE TIME OF SALE. THIS TERM SHEET IS NOT AN OFFER TO SELL THESE SECURITIES AND IT IS NOT A SOLICITATION OF AN OFFER TO BUY THESE SECURITIES IN ANY JURISDICTION WHERE THE OFFER OR SALE IS NOT PERMITTED.
167