Precision is a leading provider of safe and environmentally responsible High Performance, High Value services to the energy industry, offering customers access to an extensive fleet of Super Series drilling rigs. Precision has commercialized an industry-leading digital technology portfolio known as AlphaTM technologies that utilizes advanced automation software and analytics to generate efficient, predictable, and repeatable results for energy customers. Additionally, Precision offers well service rigs, camps and rental equipment all backed by a comprehensive mix of technical support services and skilled, experienced personnel. Our drilling services are enhanced by our EverGreenTM suite of environmental solutions, which bolsters our commitment to reducing the environmental impact on our operations.
From our founding as a private drilling contractor in 1951, Precision has grown to become one of the most active drillers in North America. Our High Performance, High Value competitive advantage is underpinned by four distinguishing features:
▪a high-quality land drilling rig fleet, with AC Super Triple rigs enabled with our AlphaTM technologies and supported by our EverGreenTM suite of environmental solutions to deliver consistent, repeatable, high-quality wellbores while improving safety, performance, operational efficiency and reducing environmental impact
▪size and scale of our vertically integrated operations that provide higher margins and better service capabilities
▪a diverse culture focused on operational excellence, which includes corporate responsibility, safety and field performance, and
▪a capital structure that provides long-term stability, flexibility and liquidity, allowing us to take advantage of business cycle opportunities.
CORPORATE RESPONSIBILITY
Corporate Responsibility is a fundamental element of Precision’s High Performance, High Value strategy and critical to our long-term success. Our foundation was shaped by a commitment to operate with the highest ethical standards, prioritize the health, safety, and diversity of our workforce, and the protection of the environment and the communities where we operate. Our employees, investors and customers reward our commitment to Corporate Responsibility and recognize that it provides us the ability to attract talent, capital, and a premium for our services.
To learn more about Precision’s commitment to Corporate Responsibility, we invite you to review our interactive web page, which serves as the primary platform that highlights the Company’s progress in Environmental, Social and Governance (ESG) efforts, and provides recurring updates on our ESG efforts and performance. The information on our website represents not just a single snapshot of the year, but portrays a frequently updated view of our continuing ESG efforts.
OUR VISION AND DELIVERING ON OUR 2023 STRATEGIC PRIORITIES
Precision’s vision is to be globally recognized as the High Performance, High Value provider of land drilling services. We work toward this vision by defining and measuring our results against strategic priorities established at the beginning of each year.
In 2023, Precision focused on three strategic priorities:
▪Delivering High Performance, High Value service through operational excellence;
▪Maximizing free cash flow by increasing Adjusted EBITDA(1) margins, revenue efficiency and growing revenue from AlphaTM technologies and EverGreenTM suite of environmental solutions; and
▪Reducing debt by at least $150 million and allocating 10% to 20% of free cash flow before debt repayments for shareholder returns. We also increased our long-term debt reduction target to $500 million between 2022 and 2025 and sustained Net Debt to Adjusted EBITDA ratio(1) of below 1.0 times by the end of 2025.
(1) See Financial Measures and Ratios on page 40 of this report.
We successfully delivered on each of these priorities in 2023, reported one of our most profitable years in the past decade and exceeded our cash flow expectations. During the year, we not only met our debt reduction and shareholder capital return targets, but also funded two accretive acquisitions. Our High Performance, High Value strategy along with our Super Series rigs, AlphaTM technologies, and EverGreenTM suite of environmental solutions continue to differentiate our services.
In Canada, we increased our drilling utilization days and well servicing rig operating hours over 2022 levels, maintaining our position as the leading Canadian service provider of oilfield services. In the fourth quarter of 2023, we acquired CWC Energy Services Corp. (CWC), which increased our marketed service rig count by 36% year over year and enhanced our North America drilling operations. Internationally, we recertified and reactivated four rigs, exiting 2023 with eight active rigs under five-year term contracts that extend into 2027 and 2028. We also completed integrating our 2022 acquisition of High Arctic Energy Services Inc.'s (High Arctic) assets, which helped contribute to increase our year over year Completion and Productions Services' Adjusted EBITDA by 34%.
We generated cash provided by operations of $501 million, a 111% increase over 2022 due to the higher activity in Canada and improved North America day rates and daily operating margins. We continued to scale our AlphaTM technologies and EverGreenTM suite of environmental solutions across our Super Triple rig fleet, increasing revenue from these offerings year over year. Approximately 75% of our Super Triple fleet is equipped with AlphaTM and the majority of the fleet has at least one EverGreenTM product.
Precision Drilling Corporation 2023 Annual Report 1
With robust cash flow in 2023, we reduced debt by $152 million and increased direct returns to shareholders, allocating 15% of our free cash flow before debt repayments to share repurchases. In 2024, we plan to increase this allocation to 25% to 35% and reduce debt by another $150 million to $200 million. This positions us to achieve our sustained Net Debt to Adjusted EBITDA ratio of below 1.0 times by the end of 2025 and meet our long-term debt reduction target of $500 million between 2022 and 2025. In 2026, we plan to reduce debt by another $100 million and move our direct shareholder capital returns towards 50% of free cash flow.
| |
MANAGEMENT'S DISCUSSION AND ANALYSIS |
| |
This Management’s Discussion and Analysis (MD&A) contains information to help you understand our business and financial performance. Information is as at March 4, 2024, unless otherwise stated. This MD&A focuses on our Consolidated Financial Statements and Notes and includes a discussion of known risks and uncertainties relating to our business and the oilfield services sector.
You should read this MD&A with the accompanying audited Consolidated Financial Statements and Notes, which have been prepared in accordance with International Financial Reporting Standards (IFRS) and with information contained in the Cautionary Statement About Forward-Looking Information and Statements on page 39. In this MD&A, we reference certain Non-Generally Accepted Accounting Principles (Non-GAAP) financial measures and ratios that are not defined terms under IFRS to assess our performance as we believe they provide useful supplemental information to investors. Our Non-GAAP financial measures and ratios are defined on page 40.
The terms we, us, our, Corporation, Company, Precision and Precision Drilling mean Precision Drilling Corporation and our subsidiaries and include any partnerships of which we are a part.
All amounts are in Canadian dollars unless otherwise stated.
OUR STRATEGY
Our High Performance, High Value competitive advantage is underpinned by four distinguishing features:
▪a high-quality land drilling rig fleet, with AC Super Triple rigs enabled with our AlphaTM technologies and supported by our EverGreenTM suite of environmental solutions to deliver consistent, repeatable, high-quality wellbores while improving safety, performance, operational efficiency and reducing environmental impact;
▪size and scale of our vertically integrated operations that provide higher margins and better service capabilities;
▪a diverse culture focused on operational excellence, which includes corporate responsibility, safety and field performance; and
▪a capital structure that provides long-term stability, flexibility and liquidity, allowing us to take advantage of business cycle opportunities.
2 Management's Discussion and Analysis
BUSINESS SEGMENTS
We have two business segments, Contract Drilling Services and Completion and Production Services, which share business support systems and corporate and administrative services.
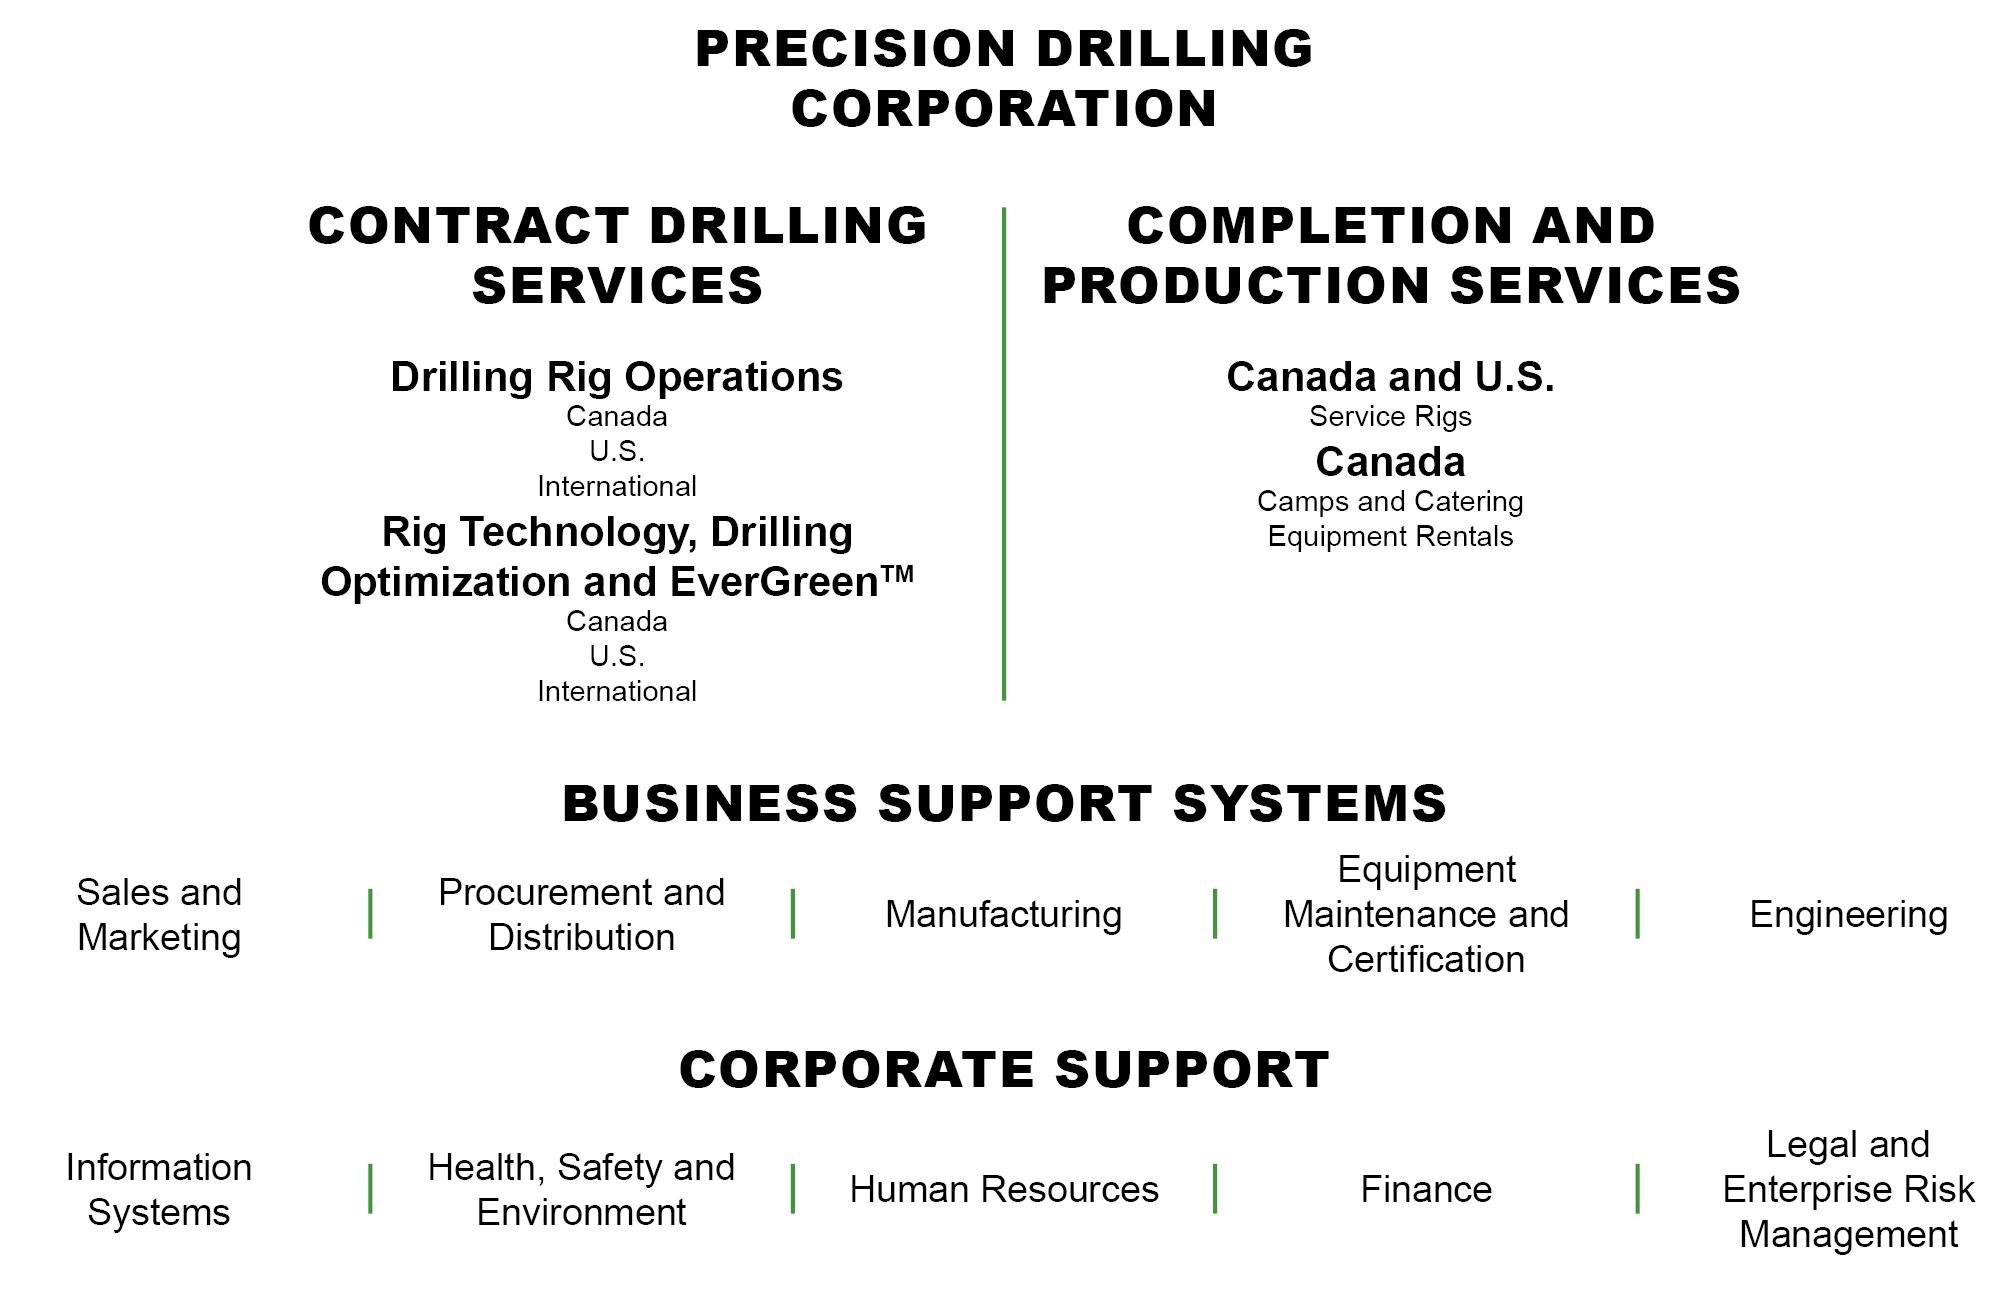
Precision Drilling Corporation Contract Drilling Services Drilling Rig Operations Canada U.S. International Directional Drilling Operations Canada Completion and Production Services Canada and U.S. Service Rigs Canada Camps and Catering Equipment Rentals Business Support Systems Sales and Marketing Procurement and Distribution Manufacturing Equipment Maintenance and Certification Engineering Corporate Support Information Systems Health, Safety and Environment Human Resources Finance Legal and Enterprise Risk Management
Precision Drilling Corporation 2023 Annual Report 3
Contract Drilling Services
We provide onshore drilling services to exploration and production companies in the oil and natural gas and geothermal industries, operating in Canada, the U.S., and internationally. In Canada, we are the largest onshore drilling company, marketing approximately 25% of the industry's land rig fleet. In the U.S., our fleet is the fifth largest and accounts for approximately 9% of the country's Super-Spec land drilling rigs. We also have an international presence with operations in the Middle East.
We offer customers access to an extensive fleet of high-efficiency Super Series drilling rigs ideally suited for development drilling. Our rigs are strategically deployed across the most active drilling regions in North America, including all major unconventional oil and natural gas basins.
At December 31, 2023, our Contract Drilling Services segment consisted of 214 land drilling rigs, including 97 in Canada, 104 in the U.S. and 13 in the Middle East.
During the year, our acquisition of CWC added seven Canadian and 11 U.S. drilling rigs to our fleet. In addition, we decommissioned 20 and seven legacy drilling rigs in Canada and the U.S., respectively.
Our Super Series drilling rigs are further enhanced by our AlphaTM technologies and EverGreenTM suite of environmental solutions. Our AlphaTM technologies drive performance by integrating data insights, human ingenuity, automation consistency and smart algorithms, increasing drilling performance and cost efficiencies for our customers. Our EverGreenTM suite of environmental solutions bolsters our commitment to reduce the environmental impact of oilfield operations and offers customers products and applications to measure and reduce their Greenhouse Gas (GHG) emissions during drilling operations. Precision exited the year with 75 AC Super Triple rigs equipped with AlphaTM and the majority equipped with at least one EverGreenTM product.
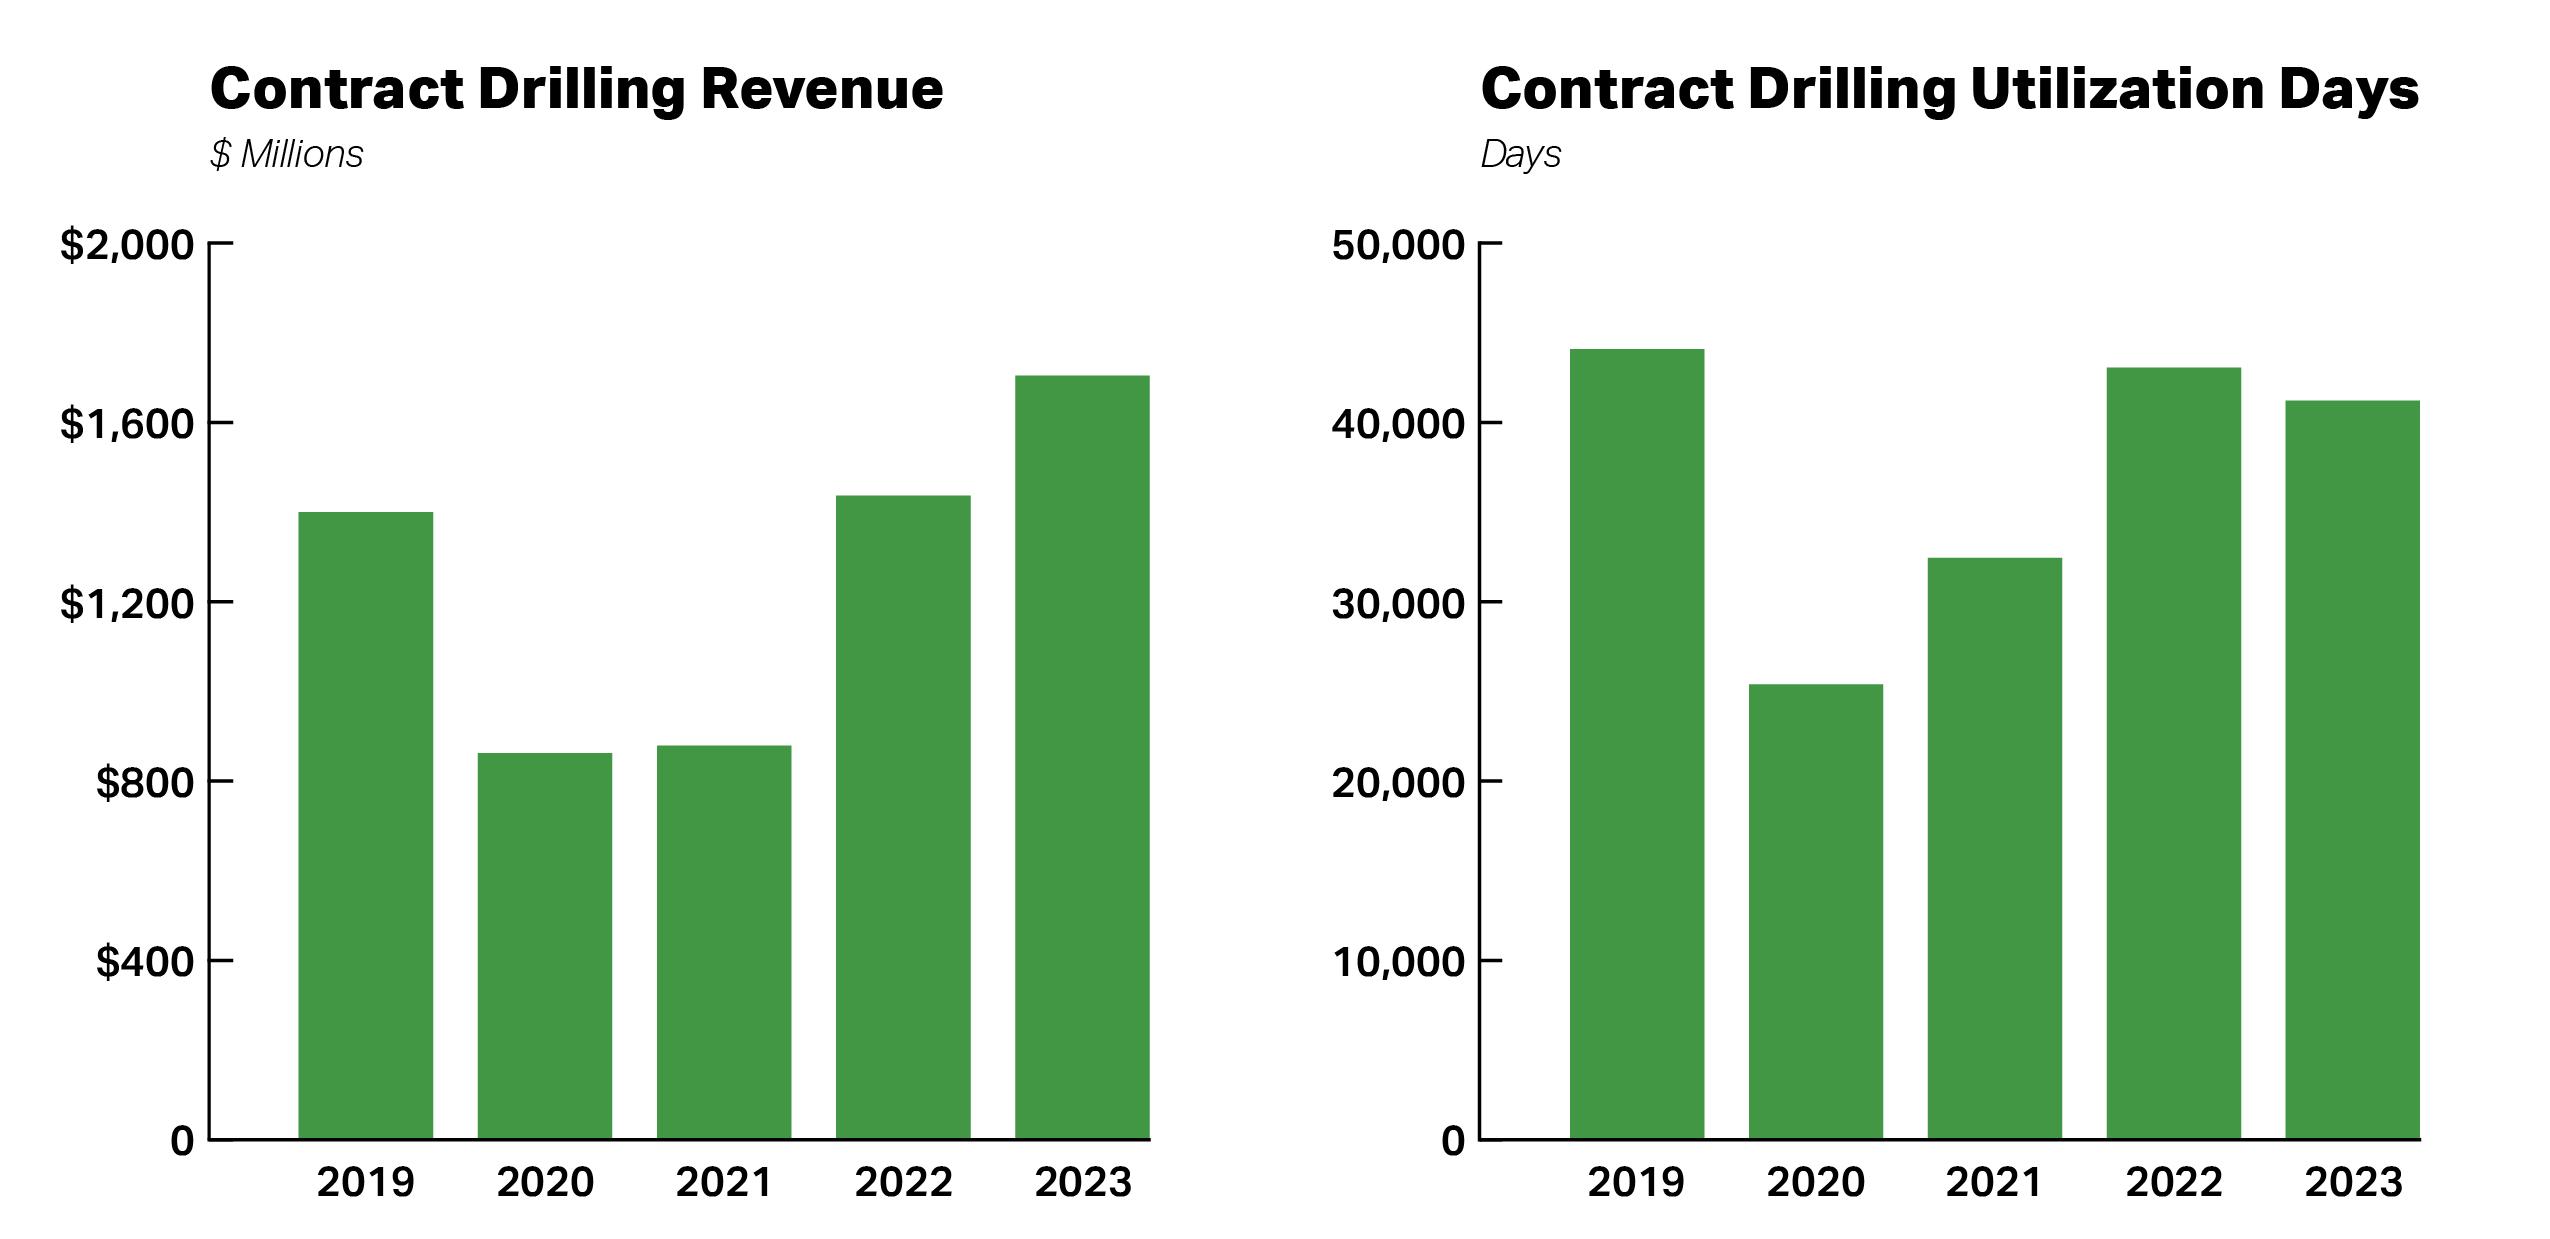
The below graphs summarize our revenue and utilization days for the last five financial years.
4 Management's Discussion and Analysis
Completion and Production Services
We provide well completion, workover, abandonment, and re-entry preparation services to oil and natural gas exploration and production companies in Canada and the U.S. In addition, we provide equipment rentals and camp and catering services in Canada.
In 2023, through the acquisition of CWC, we added 62 marketable Canadian service rigs to our fleet as well as ancillary equipment, inventories, spares and operating facilities in key basins in complementary geographic regions supported by skilled and experienced personnel and strong customer relationships.
At December 31, 2023, our Completion and Production Services segment consisted of 183 registered well completion and workover service rigs, including 173 in Canada and 10 in the U.S.
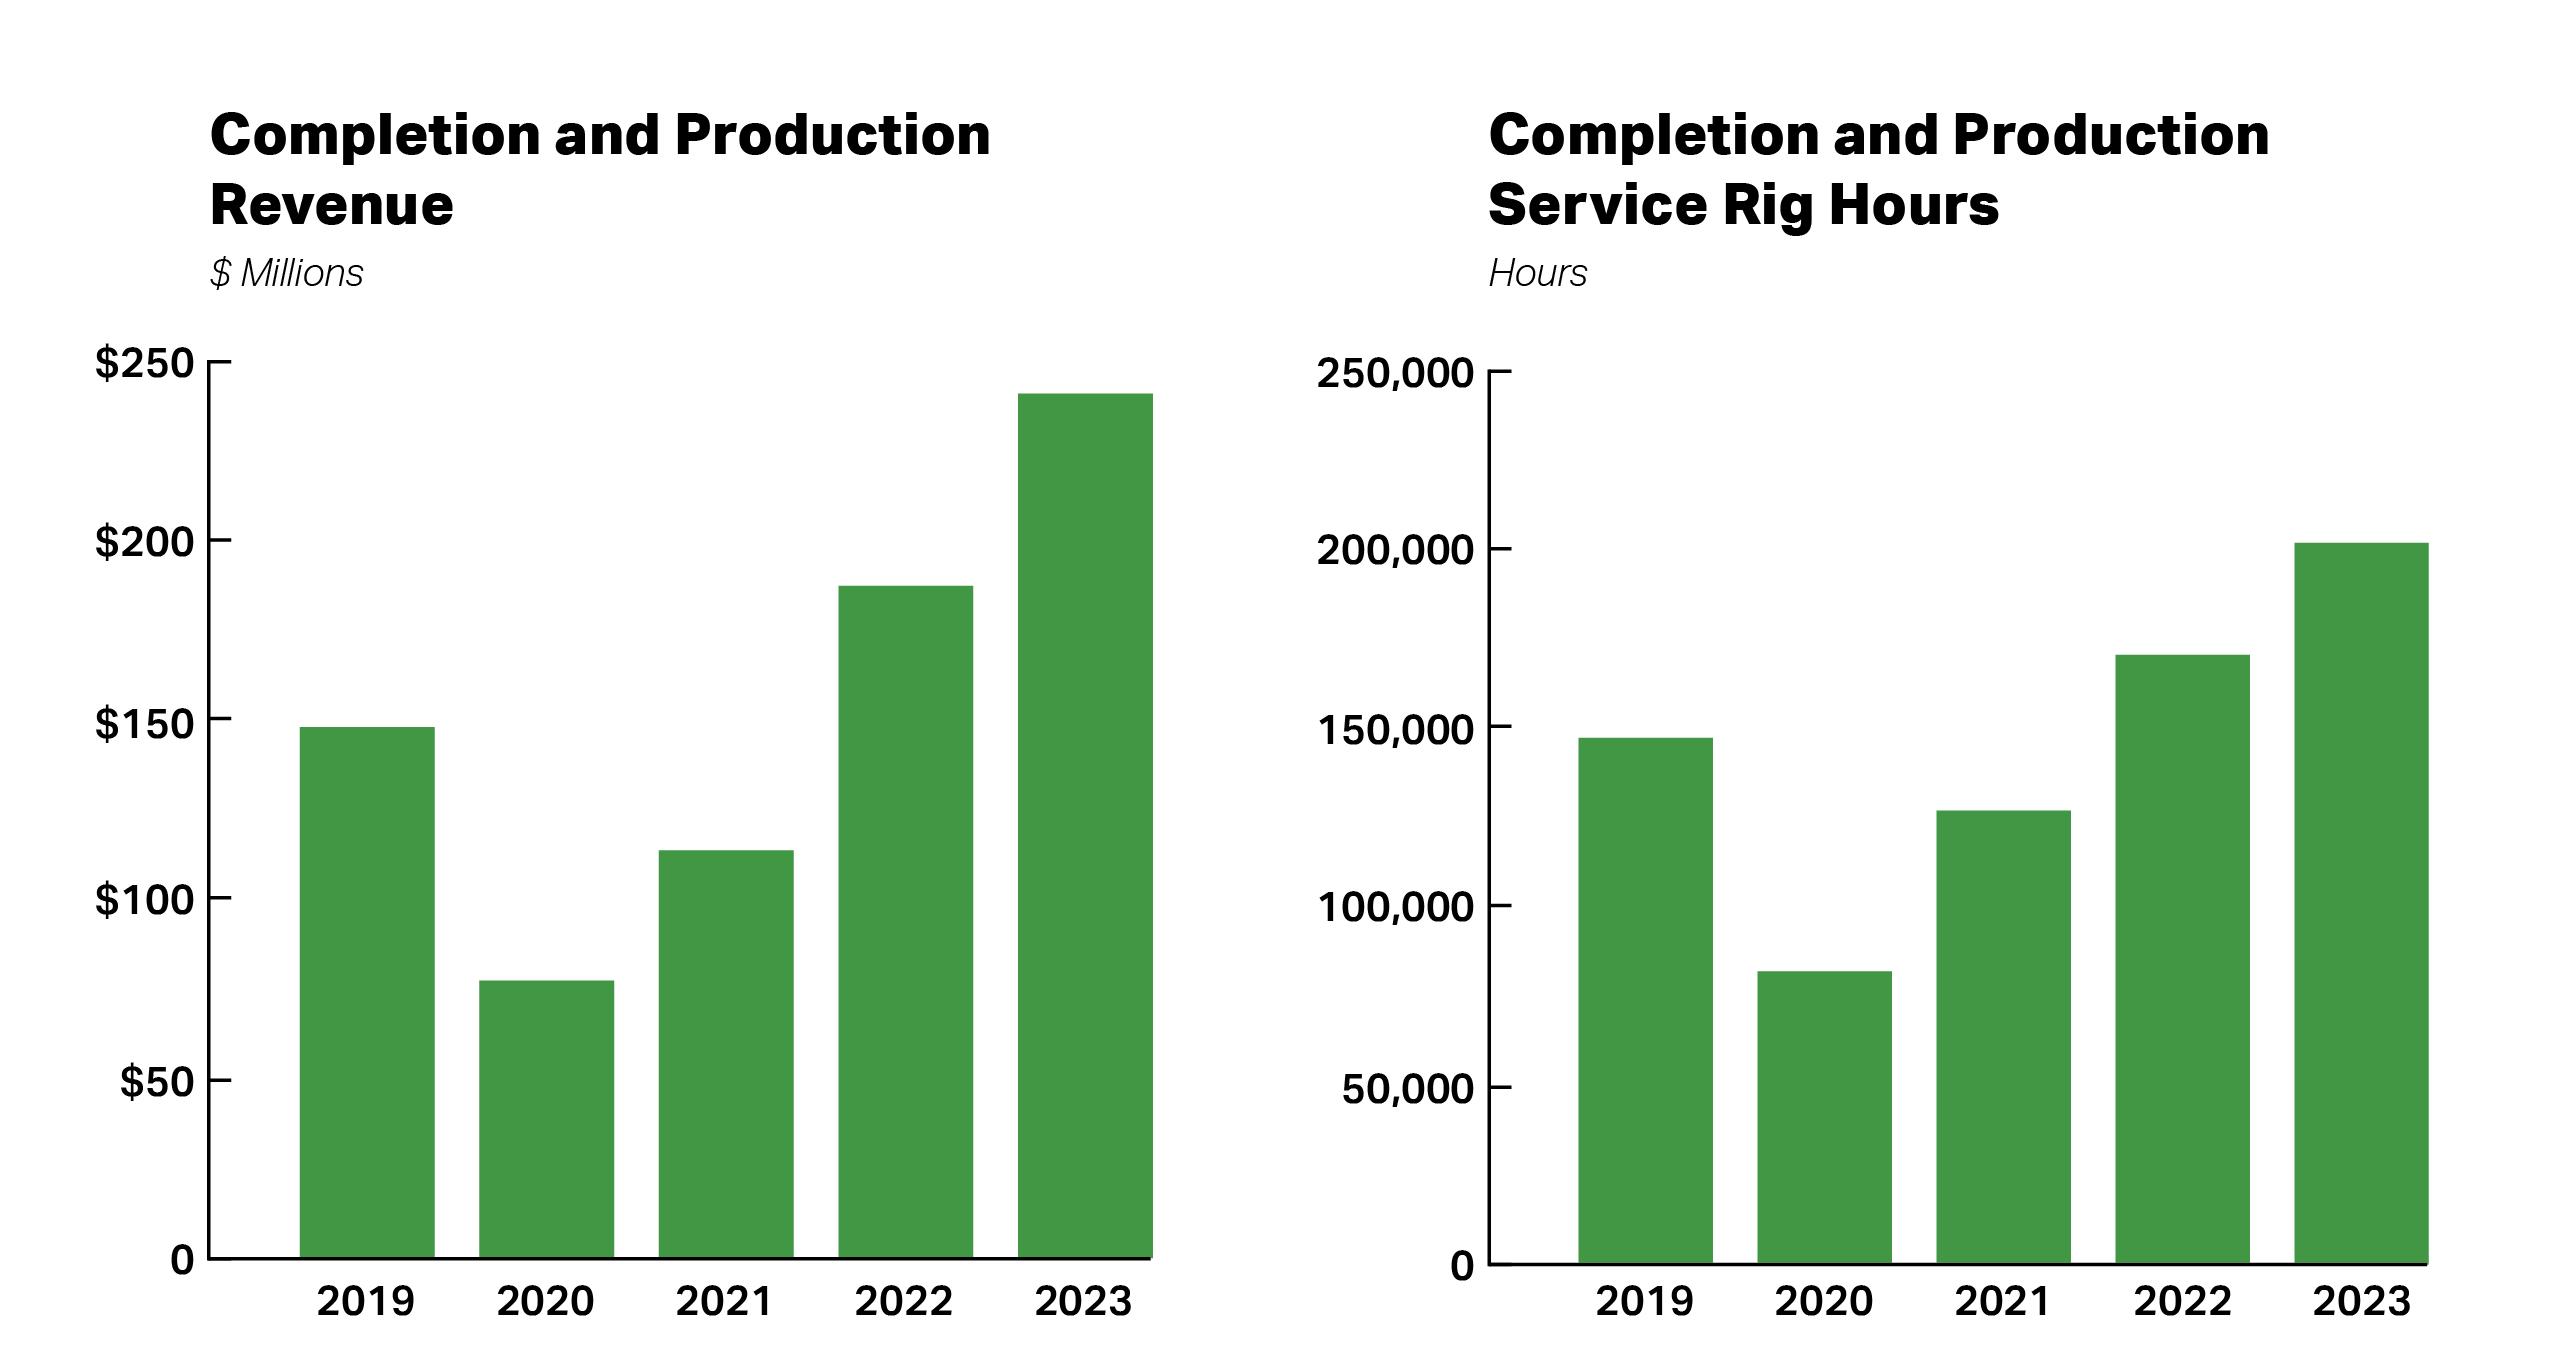
The below graphs summarize our revenue and utilization days for the last five financial years.
and Production Revenue $ Millions $200 $150 $100 $50 0 2016 2017 2018 2019 2020 Completion and Production Adjusted EBITDA $ Millions $25 $20 $15 $10 $5 0 -$5 2016 2017 2018 2019 2020 Completion and Production Service Rig Hours Hou0,000 0 2016 2017 2018 2019 2020
Precision Drilling Corporation 2023 Annual Report 5
strategic priorities
Our 2023 strategic priorities focused on delivering High Performance, High Value services, maximizing free cash flow, and continuing to strengthen our financial position with debt repayments. We successfully delivered on each of these priorities in 2023 and our results are summarized in the table below.
| |
2023 Strategic Priorities | 2023 Results |
Deliver High Performance, High Value service through operational excellence | ▪Increased our Canadian drilling rig utilization days and well servicing rig operating hours over 2022, maintaining our position as the leading provider of high-quality and reliable services in Canada. ▪Recertified and reactivated a total of four rigs in the Middle East, exiting 2023 with eight active rigs that represent approximately US$475 million in backlog revenue that stretches into 2028. ▪Acquired CWC, expanding our Canadian well servicing business and drilling fleets in both Canada and the U.S. ▪Upgraded and added the industry's most advanced AC Super Triple rig to our Canadian fleet, equipped with AlphaTM, EverGreenTM, and rig floor robotics. ▪Coached over 900 rig-based employees through our New Employee Orientation focused on industry-leading safety and performance training at our world-class facilities in Nisku, Alberta and Houston, Texas. |
Maximize free cash flow by increasing Adjusted EBITDA(1) margins, revenue efficiency, and growing revenue from AlphaTM technologies and EverGreenTM suite of environmental solutions | ▪Generated cash provided by operations of $501 million, a 111% increase over 2022. ▪Increased our daily operating margins(2) by approximately 39% in Canada and 69% in the U.S. year over year. ▪Grew combined Alpha™ and EverGreenTM revenue by over 10% compared to 2022. ▪Ended the year with 75 AC Super Triple Alpha™ rigs compared to 70 at the beginning of the year. ▪Scaled our EverGreenTM suite of environmental solutions, ending the year with approximately 65% of our AC Super Triple rigs equipped with at least one EverGreenTM product, including 13 EverGreenTM Battery Energy Storage Systems (BESS) versus seven a year ago. ▪Integrated the well servicing assets from our 2022 acquisition of High Arctic, which helped increase our Completion and Production Services’ Adjusted EBITDA(1) 34% in 2023. |
Reduce debt by at least $150 million and allocate 10% to 20% of free cash flow before debt repayments for share repurchases. Long-term debt reduction target of $500 million between 2022 and 2025 and sustained Net Debt to Adjusted EBITDA ratio(1) of below 1.0 times by the end of 2025 | ▪Reduced debt by $152 million and ended the year with more than $600 million of available liquidity(3). ▪Returned $30 million of capital to shareholders through share repurchases. ▪Renewed our Normal Course Issuer Bid (NCIB), allowing purchases of up to 10% of the public float. ▪Ended the year with a Net Debt to Adjusted EBITDA ratio(1) of approximately 1.4 times and remain committed to reaching a sustained Net Debt to Adjust EBITDA ratio of below 1.0 times by the end of 2025. |
Notes:
(1) See Financial Measures and Ratios on page 40 of this report.
(2) Revenue per utilization day less operating costs per utilization day.
(3) Available liquidity is defined as cash plus unused credit facility capacity.
We have established the following strategic priorities for 2024:
| | |
2024 Strategic Priorities | | |
▪Concentrate organizational efforts on leveraging our scale and generating free cash flow. ▪Reduce debt by $150 million to $200 million and allocate 25% to 35% of free cash flow before debt repayments for share repurchases, while remaining committed to achieving a sustained Net Debt to Adjusted EBITDA ratio of below 1.0 times by the end of 2025. Increase long-term debt reduction target to $600 million between 2022 and 2026 and continue to move direct shareholder capital returns towards 50% of free cash flow. ▪Continue to deliver operational excellence in drilling and service rig operations to strengthen our competitive position and extend market penetration of our AlphaTM and EverGreenTM products. |
6 Management's Discussion and Analysis
| |
UNDERSTANDING OUR BUSINESS DRIVERS |
| |
ENERGY INDUSTRY OVERVIEW
Precision operates in the energy services business. Our primary customers are oil and natural gas exploration and production companies, who contract our services as part of their exploration and development activities. The economics of their businesses are dictated by the current and expected future margin between their finding and development costs and the eventual market price for the commodities they produce: crude oil, natural gas, and Natural Gas Liquids (NGLs).
Commodity Prices
Our customers’ capital expenditures for exploration and development are largely dependent on current and expected future prices of crude oil and natural gas. Crude oil is generally priced in a global market which is influenced by an array of economic and political factors. Natural gas is priced more regionally and, in North America, largely depends on the weather. Colder winter temperatures, and to a lesser extent, warmer summer temperatures, result in greater natural gas demand. Both commodities have historically been, and we expect them to continue to be cyclical and highly volatile.
Historically, there has been a strong correlation between crude oil and natural gas prices and the demand for drilling rigs with the rig count increasing and decreasing with movements in commodity prices. However, beginning in 2021, rig activity has not moved in tandem with crude oil prices to the same extent it has historically, as a large portion of our customers instituted and adhered to a more disciplined approach to their operations and capital spending in order to enhance their own financial returns.
Average Oil and Natural Gas Prices
| | | | | | | | | | | | |
| | 2023 | | | 2022 | | | 2021 | |
Oil | | | | | | | | | |
West Texas Intermediate (per barrel) (US$) | | | 77.62 | | | | 94.23 | | | | 67.91 | |
Western Canadian Select (per barrel) (US$) | | | 58.96 | | | | 78.15 | | | | 54.84 | |
| | | | | | | | | |
Natural gas | | | | | | | | | |
U.S. | | | | | | | | | |
Henry Hub (per MMBtu) (US$) | | | 2.67 | | | | 6.51 | | | | 3.72 | |
Canada | | | | | | | | | |
AECO (per MMBtu) (Cdn$) | | | 2.64 | | | | 5.43 | | | | 3.64 | |
Source: WTI and Henry; Hub Energy Information Administration, AECO; Gas Alberta Inc. | | | | | | | | | |
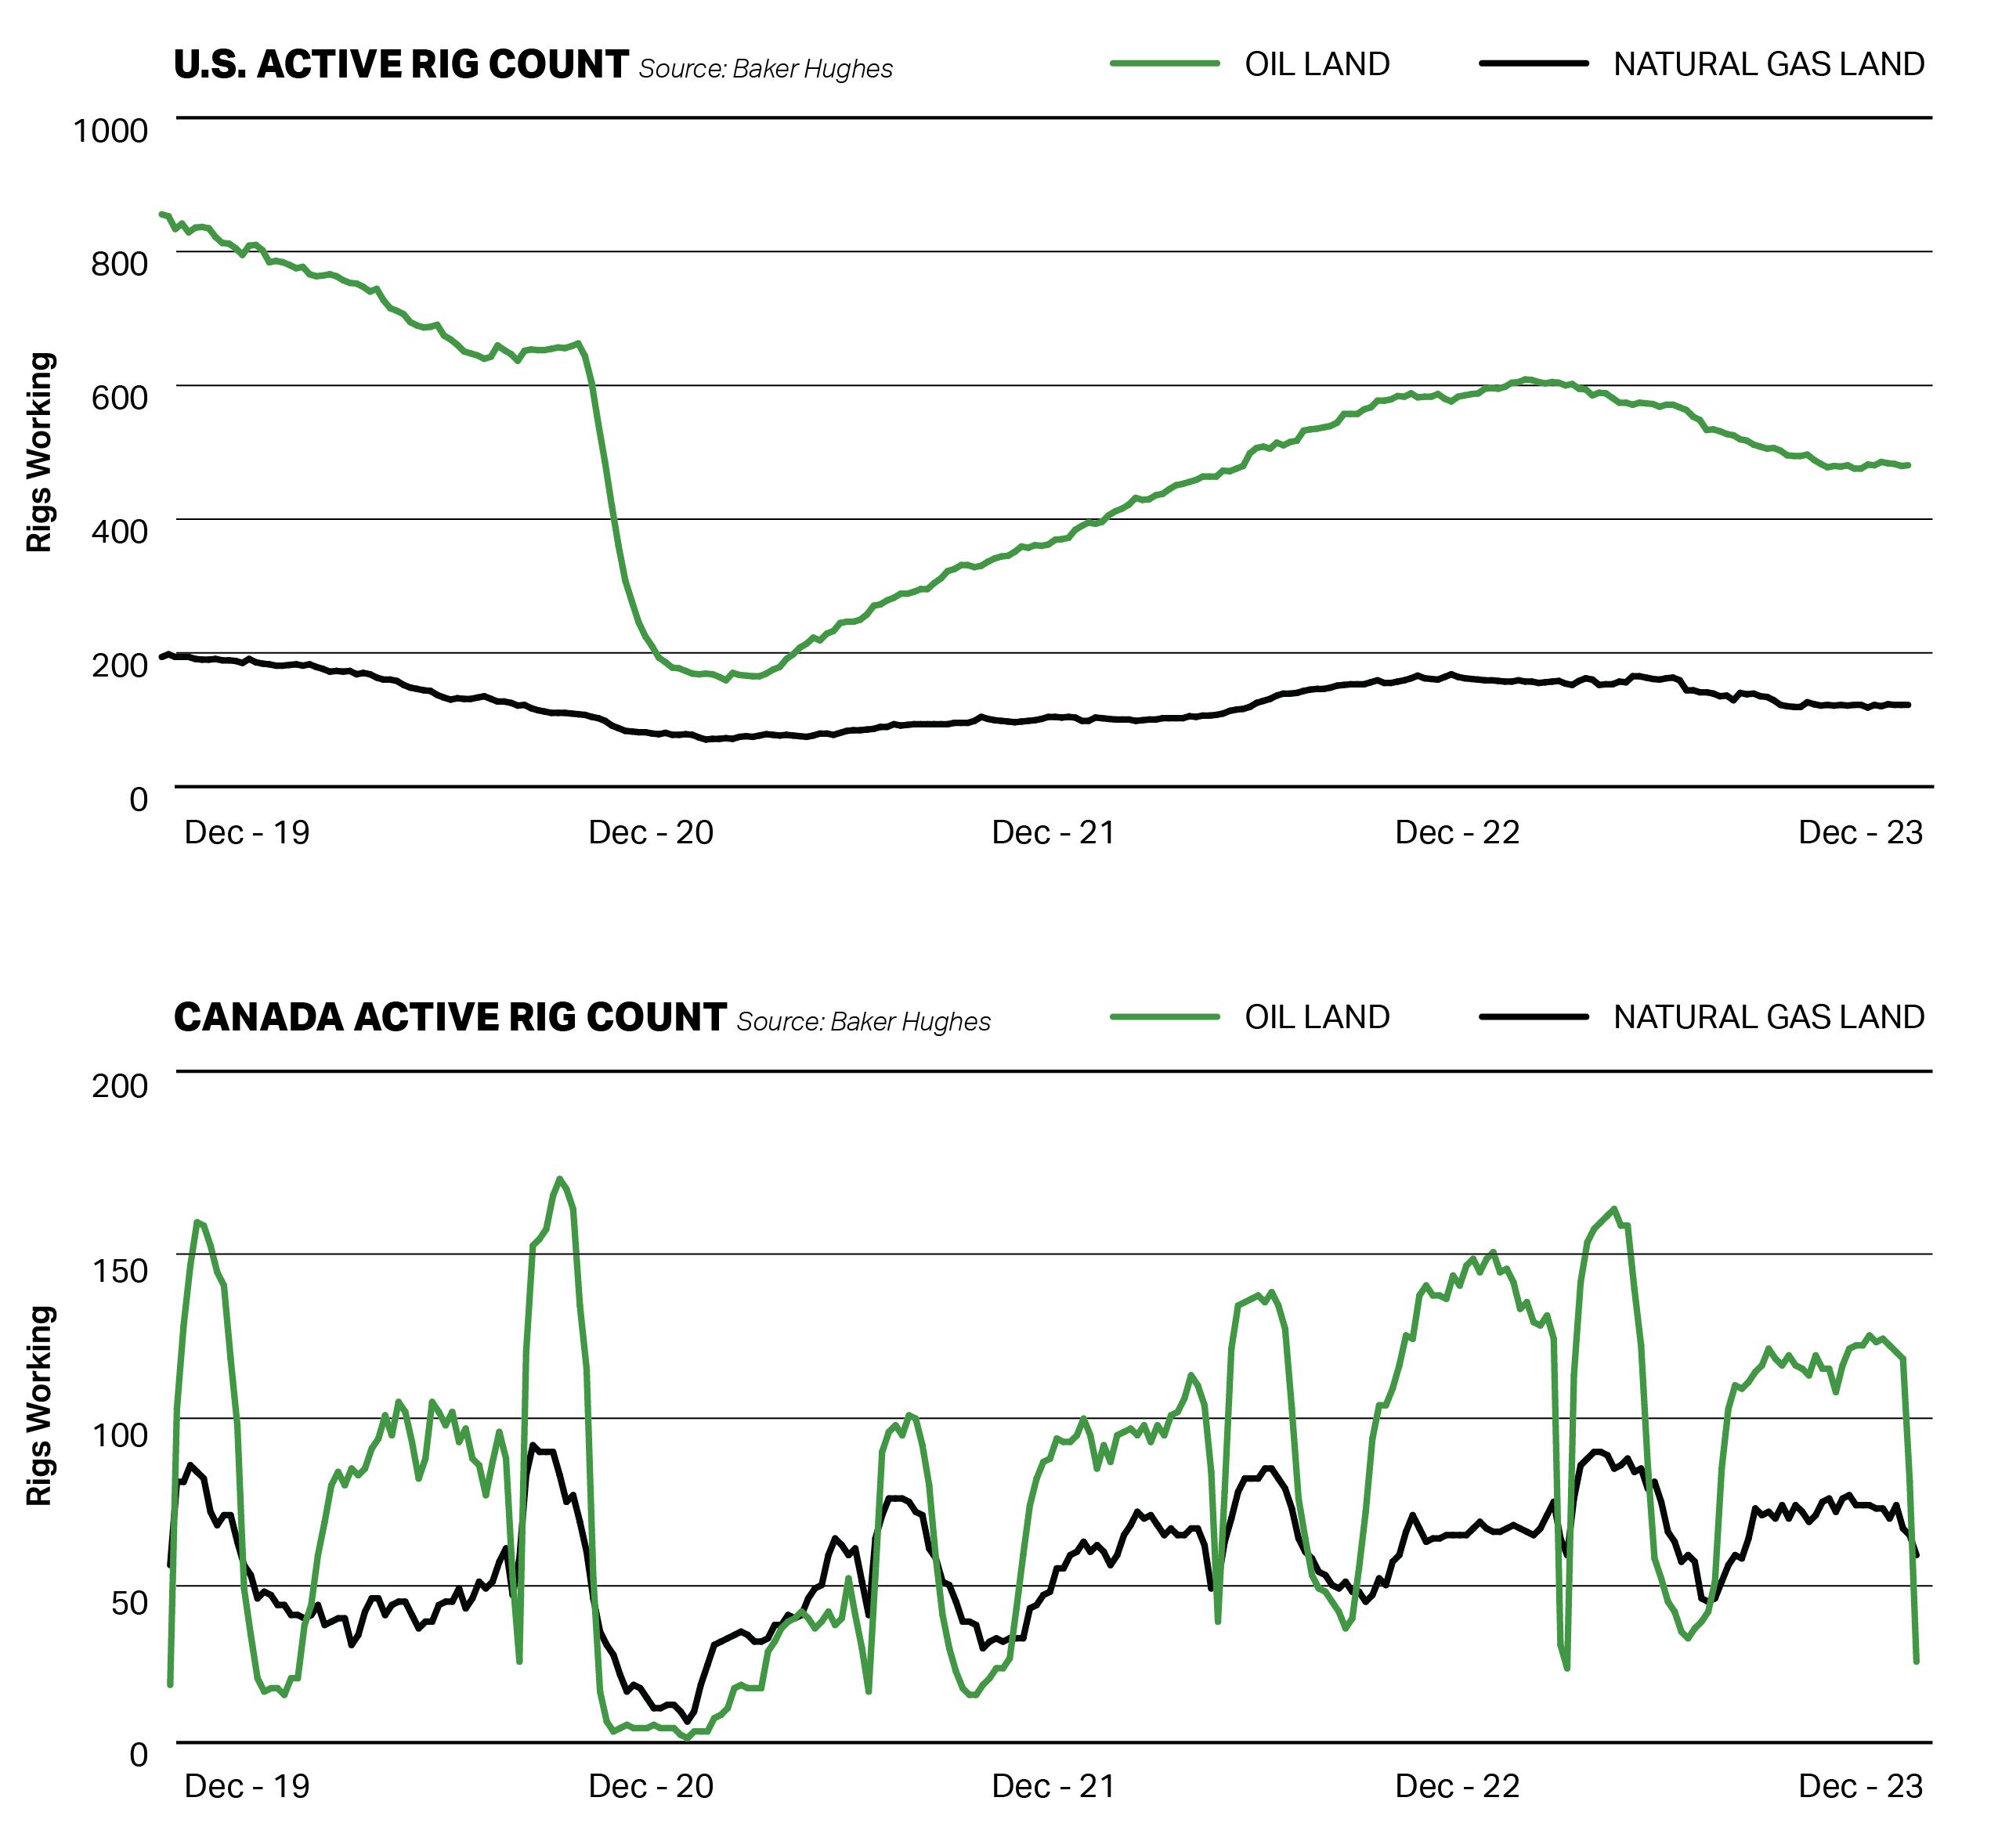
Drilling Activity
According to Baker Hughes, the Canadian average active rig count in 2023 was nearly flat year over year, while the U.S. average active land drilling rig count declined slightly. In Canada, the Canadian Association of Energy Contractors (CAOEC) reported approximately 5,700 wells were drilled in 2023, compared with 5,500 in 2022 and 4,600 in 2021. For the U.S., Enverus reported approximately 15,600 wells were started onshore in the U.S., compared with approximately 17,600 in 2022 and 14,400 in 2021. Drilling activity began to weaken in early 2023 due to lower natural gas prices and oil price volatility and was exacerbated by drilling and completion efficiencies, consolidation among producers, and continued capital discipline. The bias towards oil-directed drilling in the U.S. continues with approximately 80% of the active industry rig count drilling for oil targets during 2023.
In Canada, drilling activity was supported by strong fundamentals as additional takeaway capacity for oil and natural gas becomes available in 2024. Approximately 60% of the industry’s active rigs were drilling for oil targets in 2023 as producers remained active in the traditional heavy oil regions of Canada, such as the oil sands and the Clearwater. The start-up of the Trans Mountain oil pipeline expansion is expected in the first half of 2024, improving pricing for producers and encouraging additional drilling. Natural gas drilling occurs in the deeper basins of northwestern Alberta and northeastern British Columbia, supporting the production of NGLs required for oil sands development. Natural gas drilling in Canada continues to gain momentum as producers develop drilling programs to support LNG Canada, which is expected to begin start-up operations in 2024.
The following graphs shows oil and natural gas drilling activity since 2019, in both the U.S. and Canada. The Canadian drilling rig activity graph also shows the seasonality of the Canadian drilling activity which fluctuates with spring breakup, a market dynamic that generally is not present in the U.S.
Precision Drilling Corporation 2023 Annual Report 7
Competition and Competitive Strategy
The land drilling industry is highly competitive with technology increasingly differentiating the market, as customers have transitioned away from vertical wells to more complex directional and horizontal drilling programs. These wells require higher capacity rigs, which typically include AC power, digital control systems, integrated top drives, pad walking systems, highly mechanized pipe handling, and high capacity mud pumps. These rigs have recently been referred to as Super Specification (Super-Spec). Consequently, the rig market has been shedding older, low-technology rigs in favour of Super-Spec rigs as they are more powerful, efficient, and better suited for horizontal wells and resource development programs. Increasingly, digital technologies and rig-based software are becoming enablers of efficiency, and as a result, are in demand from our customers.
In the U.S., the top five land drillers own approximately 85% of the rigs referred to as Super-Spec, while in Canada, the top four land drillers own virtually all of these rigs.
In the early 1990s Precision designed and branded its Super Single rigs that are ideally suited for long-term conventional heavy oil development in the oil sands and other heavy oil plays. In 2010, Precision introduced and branded its Super Triple rigs, which are well suited for large pad horizontal drilling. Our Super Series fleet meets or exceeds the industry term Super-Spec that was recently adopted and as of December 31, 2023, our fleet of 214 rigs included 48 Super Single rigs and 101 AC Super Triple rigs.
8 Management's Discussion and Analysis
Drilling Contracts
We market our drilling rigs mainly on a regional basis through sales and marketing personnel. Our drilling contracts provide for payment on a daywork basis, pursuant to which we provide the drilling rig and crew to the customer. The customer provides the drilling program and is responsible for managing the downhole operation. Our compensation is based on a contracted rate per day (day rate) during the period the drilling rig is utilized. Generally, we do not bear any of the costs arising from downhole risks or loss of oil and natural gas reserves.
Products and services provided by our Alpha™ technologies and EverGreen™ suite of environmental solutions earn revenue that is incremental to the contracted day rate.
Seasonality
Drilling and well servicing activity is affected by seasonal weather patterns and ground conditions. In Canada and the northern U.S., wet weather and the spring thaw make the ground unstable resulting in road restrictions that may limit the movement of heavy oilfield equipment and reduce the level of drilling and well servicing activity primarily during the second quarter of the year. In Canada, some drilling sites can only be accessed in the winter once the terrain is frozen, which usually begins late in the fourth quarter. Our business activity depends, in part, on the severity and duration of the winter drilling season.
COMPETITIVE OPERATING MODEL
Providing High Performance, High Value services to our customers represents the core of our competitive strategy. Our competitive advantages include:
▪High Performance standardized rig fleet that is strategically deployed across the most active drilling regions in North America,
▪Alpha™ technologies that increase drilling performance and reduce costs,
▪EverGreen™ suite of environmental solutions which includes industry-leading alternative rig energy sources and fuel monitoring to reduce emissions and costs,
▪systems and scale to deliver highly disciplined, consistent, reliable, and safe operations,
▪experienced, High Performance crews as we focus on training, development and retaining key leaders, and
▪culture of teamwork, safety, integrity and desire to be the top tier service provider.
Employees
Our people strategies focus on initiatives that provide a safe and productive work environment, opportunity for advancement, and added wage security. In 2023, we had an average of approximately 5,000 employees, with a high of 5,560.
The market for experienced personnel in the oilfield services industry can be competitive due to the cyclical nature of the work, the uncertainty of continuing employment, and generally higher employment rates during periods of high oil and natural gas prices and drilling activities. We strive to position ourselves for increased activity while maintaining performance excellence through our safety performance and reputation. These factors help us attract and retain experienced, well-trained employees when the industry experiences crew shortages during peak operating periods.
Employee Safety and Training
Employee safety is embedded in all that we do at Precision, from job planning and change management to the critical task assessments and safety observations our employees perform every day. We deliver High Performance, High Value service to our customers without compromising the health and safety of our employees or those in the communities where we work.
Precision’s commitment to providing industry-leading comprehensive training and development to our employees can be seen through the extensive instructor-led and virtual courses, as well as face-to-face coaching. In 2023, over 63,600 employee training hours were focused on Precision’s culture, rig roles and responsibilities, well control, tools, and equipment, HSE standards, leadership and communication at one of our world-class training facilities, located in Nisku, Alberta and Houston, Texas. Additionally, in 2023, we continued our focus on rig-site training with over 18,000 employee training hours during more than 370 rig visits.
A specific focus on new employee development is driven through our Short-Service Employee (SSE) program, which is catered to rig-based employees with low levels of experience to ensure they are well-positioned for long-term success at Precision. During the first six months with Precision, these employees are paired with a mentor and put through various tasks under supervision to ensure they adapt to our culture, develop a safety-first mentality, and enable them to perform their duties to the best of their ability. In 2023, we dedicated over 15,000 SSE-specific training hours to approximately 990 employees who were new to the industry.
Technology and Innovation
In 2023, we upgraded and added the industry's most advanced AC Super Triple rig to our Canadian fleet, which is not only equipped with AlphaTM and EverGreenTM technologies but also includes rig floor robotics. The incorporation of a modular fully automated pipe handling system represents a pioneering achievement in the industry, positioning this land drilling rig at the forefront of technological advancement. By collaborating with AlphaAutomationTM, our rig floor robotics provides a comprehensive and seamless automation solution, optimizing operational efficiency and increasing safety standards.
Precision Drilling Corporation 2023 Annual Report 9
Diversity, Equity and Inclusion
Delivering strong operational and financial results in today’s environment requires the expertise and positive contributions of every Precision employee. We are committed to developing a diverse range of thoughts, experiences, and points of view to complement our strategy and decision-making processes. Precision is an inclusive workplace that strives to be free of discrimination, harassment, workplace violence, and retaliation. Our diversity, equity and inclusion policy prohibits discrimination of any kind and promotes diversity and inclusivity among our employees, management, and Board of Directors (Board).
Each year our employees are required to complete our Diversity, Equity, and Inclusion, and Discrimination and Harassment courses. In 2023, approximately 5,800 employees globally completed these courses.
Talent Management
As an industry leader, we are committed to recruiting and retaining high-performing, Passionate People at every level of our Company. Precision has developed a strong recruitment marketing strategy both in the field and for our corporate support roles. We ensure the value proposition we provide in the ways of pay and benefits remains competitive and engages our employees. We have implemented systems and processes that help us execute our talent management strategy to maintain a well-trained, highly competent and capable talent pool, both in the field and corporate positions with a broad range of business experience throughout market cycles. Our Talent Management and Field Training & Development departments have been successful implementing new and inventive technology platforms and internal learning systems to provide learning and development opportunities, leveraging our in-house technical expertise while maintaining the necessary in-person interactions to develop appropriate levels of understanding and strong professional networks.
10 Management's Discussion and Analysis
Contracts
Term customer contracts provide a base level of activity and revenue. In 2023, we had an average of 62 drilling rigs working under term contracts: 34 in the U.S., 22 in Canada and 6 internationally. Utilization days from these contracts was approximately 50% of our total contract drilling utilization days for the year. As at March 4, 2024, we had term contracts in place for an average of 44 rigs: 14 in the U.S., 22 in Canada and 8 internationally for 2024. In most regions in the U.S. and internationally, term contracts normally generate 365 utilization days per rig year. In Canada, term contracted rigs normally generate 250 utilization days per rig year because of the seasonal nature of wellsite access.
Pricing, Demand and Utilization
Energy industry fundamentals continue to support drilling activity for oil and natural gas despite economic uncertainty and the continued presence of global conflict. Today, oil prices are supported by increasing global demand and limited supply growth as OPEC+ continues to honor its lower production quotas and producers remain committed to returning capital to shareholders versus increasing production.
Natural gas has demonstrated price weaknesses since early 2023; however, this lower-carbon energy source is becoming increasingly favored as countries around the world stress the importance of sustainability, decarbonization and energy security. Even with the U.S. pausing approvals of new U.S. Liquefied Natural Gas (LNG) export terminals, we still expect North American LNG export capacity (including LNG Canada) to increase by more than 14 bcf/d over the next three years from projects currently under construction. We therefore anticipate a sustained period of elevated North America natural gas drilling activity.
In Canada, Precision’s drilling activity remained strong throughout 2023 and we expect high activity levels to continue into 2024 due to strong oil prices, tight supply of Super-Spec drilling rigs, and increases in hydrocarbon export capacity. The Trans Mountain oil pipeline expansion, which is expected to increase Canada’s tidewater takeaway capacity for crude oil by approximately 590,000 barrels per day, is expected to start-up in the first half of 2024. The Coastal GasLink pipeline achieved mechanical completion in late 2023 and will deliver gas to LNG Canada, which is expected to begin start-up activities in 2024. We expect near full utilization in the Canadian Super-Spec rig market in 2024, which should support high average day rates and demand for additional term contracts as customers secure rigs to ensure fulfillment of their development programs.
In the U.S., drilling activity began to weaken in early 2023 due to lower natural gas prices and oil price volatility and was exacerbated by drilling and completion efficiencies, consolidation among producers, and continued capital discipline. As a result, the U.S. active land rig count declined by approximately 21% throughout 2023, according to Baker Hughes. If oil prices remain stable and around today’s level, we expect drilling demand to begin to improve in the second quarter and gain momentum through the remainder of 2024 as customers embark on a new budget cycle, seek to maintain or possibly increase production levels, and replenish reserve inventories.
Internationally, as at March 4, 2024, we had eight rigs working on term contracts, five in Kuwait and three in the Kingdom of Saudi Arabia. During 2023, we recertified and reactivated four rigs, which is expected to increase our annual activity by approximately 40% in 2024. The majority of these rigs are under five-year term contracts that extend into 2027 and 2028, providing predictable cash flow for the next several years. We continue to bid our remaining idle rigs within the region and remain optimistic in our ability to secure rig reactivations.
High Performance Rig Fleet
The industry trend toward more complex drilling programs has accelerated the retirement of older generation, less capable drilling rigs. Over the past several years, we and some of our competitors have been upgrading our drilling rig fleets primarily through upgrading existing rigs and decommissioning lower capacity rigs. In more recent years, drilling rigs have been equipped with automation systems and emission reduction technologies to further drive time and cost efficiencies and environmental performance in the well construction process. We believe this retooling of the industry-wide fleet has made legacy rigs virtually obsolete in North America.
Capital Spending and Free Cash Flow Allocation
Capital spending in 2024 is expected to be $195 million and by spend category(1) includes $155 million for maintenance, infrastructure, and intangibles and $40 million for expansion and upgrades. We expect to spend $177 million in the Contract Drilling Services segment, $13 million in the Completion and Production Services segment and $5 million in the Corporate segment. At December 31, 2023, Precision had capital commitments of $175 million with payments expected through 2026.
We remain committed to our debt reduction plans and in 2024 expect to reduce debt by $150 million to $200 million and allocate 25% to 35% of free cash flow before debt repayments for share repurchases, while remaining committed to achieving a sustained Net Debt to Adjusted EBITDA ratio of below 1.0 times by the end of 2025. In 2026, we plan to reduce debt another $100 million and move our direct shareholder capital returns towards 50% of free cash flow.
(1) See Financial Measures and Ratios on page 40 of this report.
Precision Drilling Corporation 2023 Annual Report 11
Financial Highlights
| | | | | | | | | | | | | | | | | | | | | | | | | |
Year ended December 31
(in thousands of dollars, except where noted) | | 2023 | | | % increase/
(decrease) | | | 2022 | | | % increase/
(decrease) | | | 2021 | | | % increase/
(decrease) | | |
Revenue | | | 1,937,854 | | | | 19.8 | | | | 1,617,194 | | | | 63.9 | | | | 986,847 | | | | 5.5 | | |
Adjusted EBITDA(1) | | | 611,118 | | | | 96.1 | | | | 311,605 | | | | 61.6 | | | | 192,772 | | | | (26.8 | ) | |
Adjusted EBITDA % of revenue(1) | | | 31.5 | % | | | | | | 19.3 | % | | | | | | 19.5 | % | | | | |
Net earnings (loss) | | | 289,244 | | | | (943.4 | ) | | | (34,293 | ) | | | (80.7 | ) | | | (177,386 | ) | | | 47.7 | | |
Cash provided by operations | | | 500,571 | | | | 111.1 | | | | 237,104 | | | | 70.3 | | | | 139,225 | | | | (38.4 | ) | |
Funds provided by operations(1) | | | 533,409 | | | | 88.5 | | | | 282,994 | | | | 85.9 | | | | 152,243 | | | | (10.8 | ) | |
| | | | | | | | | | | | | | | | | | | |
Cash used in investing activities | | | 214,784 | | | | 48.7 | | | | 144,415 | | | | 155.1 | | | | 56,613 | | | | 39.7 | | |
Capital spending by spend category(1) | | | | | | | | | | | | | | | | | | | |
Expansion and upgrade | | | 63,898 | | | | 0.9 | | | | 63,305 | | | | 233.1 | | | | 19,006 | | | | (29.2 | ) | |
Maintenance, infrastructure and intangibles | | | 162,851 | | | | 34.6 | | | | 120,945 | | | | 112.4 | | | | 56,935 | | | | 64.2 | | |
Proceeds on sale of property, plant and
equipment | | | (23,841 | ) | | | (35.9 | ) | | | (37,198 | ) | | | 184.3 | | | | (13,086 | ) | | | (38.0 | ) | |
Net capital spending(1) | | | 202,908 | | | | 38.0 | | | | 147,052 | | | | 134.0 | | | | 62,855 | | | | 55.2 | | |
| | | | | | | | | | | | | | | | | | | |
Net earnings (loss) per share ($) | | | | | | | | | | | | | | | | | | | |
Basic | | | 21.03 | | | | (931.2 | ) | | | (2.53 | ) | | | (81.0 | ) | | | (13.32 | ) | | | 52.1 | | |
Diluted | | | 19.53 | | | | (871.9 | ) | | | (2.53 | ) | | | (81.0 | ) | | | (13.32 | ) | | | 52.1 | | |
(1) See Financial Measures and Ratios on page 40 of this report.
Operating Highlights
| | | | | | | | | | | | | | | | | | | | | | | | |
Year ended December 31 | | 2023 | | | % increase/
(decrease) | | | 2022 | | | % increase/
(decrease) | | | 2021 | | | % increase/
(decrease) | |
Contract drilling rig fleet | | | 214 | | | | (4.9 | ) | | | 225 | | | | (0.9 | ) | | | 227 | | | | — | |
Drilling rig utilization days | | | | | | | | | | | | | | | | | | |
U.S. | | | 17,961 | | | | (11.9 | ) | | | 20,396 | | | | 40.7 | | | | 14,494 | | | | 20.0 | |
Canada | | | 21,156 | | | | 3.1 | | | | 20,519 | | | | 30.0 | | | | 15,782 | | | | 46.2 | |
International | | | 2,132 | | | | (2.6 | ) | | | 2,190 | | | | — | | | | 2,190 | | | | (13.3 | ) |
Revenue per utilization day | | | | | | | | | | | | | | | | | | |
U.S. (US$) | | | 35,040 | | | | 28.3 | | | | 27,309 | | | | 28.7 | | | | 21,213 | | | | (19.0 | ) |
Canada (Cdn$) | | | 33,151 | | | | 22.6 | | | | 27,037 | | | | 28.1 | | | | 21,105 | | | | (2.3 | ) |
International (US$) | | | 50,840 | | | | (0.8 | ) | | | 51,242 | | | | (3.0 | ) | | | 52,837 | | | | (3.6 | ) |
Operating cost per utilization day | | | | | | | | | | | | | | | | | | |
U.S. (US$) | | | 20,401 | | | | 9.5 | | | | 18,635 | | | | 23.8 | | | | 15,048 | | | | 2.6 | |
Canada (Cdn$) | | | 19,225 | | | | 13.0 | | | | 17,007 | | | | 23.8 | | | | 13,734 | | | | 1.4 | |
| | | | | | | | | | | | | | | | | | |
Service rig fleet | | | 183 | | | | 35.6 | | | | 135 | | | | 9.8 | | | | 123 | | | | — | |
Service rig operating hours | | | 201,627 | | | | 18.4 | | | | 170,362 | | | | 34.3 | | | | 126,840 | | | | 54.8 | |
Financial Position and Ratios
| | | | | | | | | | | | |
(in thousands of dollars, except ratios) | | December 31,
2023 | | | December 31,
2022 | | | December 31,
2021 | |
Working capital(1) | | | 145,239 | | | | 60,641 | | | | 81,637 | |
Working capital ratio(1) | | | 1.4 | | | | 1.1 | | | | 1.3 | |
Long-term debt(2) | | | 914,830 | | | | 1,085,970 | | | | 1,106,794 | |
Total long-term financial liabilities(3) | | | 1,004,216 | | | | 1,206,619 | | | | 1,185,858 | |
Total assets | | | 3,019,035 | | | | 2,876,123 | | | | 2,661,752 | |
Enterprise Value(1)(4) | | | 1,892,305 | | | | 2,470,538 | | | | 1,660,781 | |
Long-term debt to long-term debt plus equity | | | 0.4 | | | | 0.5 | | | | 0.5 | |
Long-term debt to cash provided by operations(1) | | | 1.8 | | | | 4.6 | | | | 7.9 | |
Net Debt to Adjusted EBITDA(1) | | | 1.4 | | | | 3.4 | | | | 5.5 | |
(1) See Financial Measures and Ratios on page 40 of this report.
(2) Net of unamortized debt issue costs.
(3) Non-current liabilities less deferred tax liabilities.
(4) See page 23 for more information.
12 Management's Discussion and Analysis
Consolidated Statements of Net Earnings (Loss) Summary
| | | | | | | | | | | | |
Year ended December 31 (in thousands of dollars) | | | 2023 | | | | 2022 | | | | 2021 | |
Revenue | | | | | | | | | |
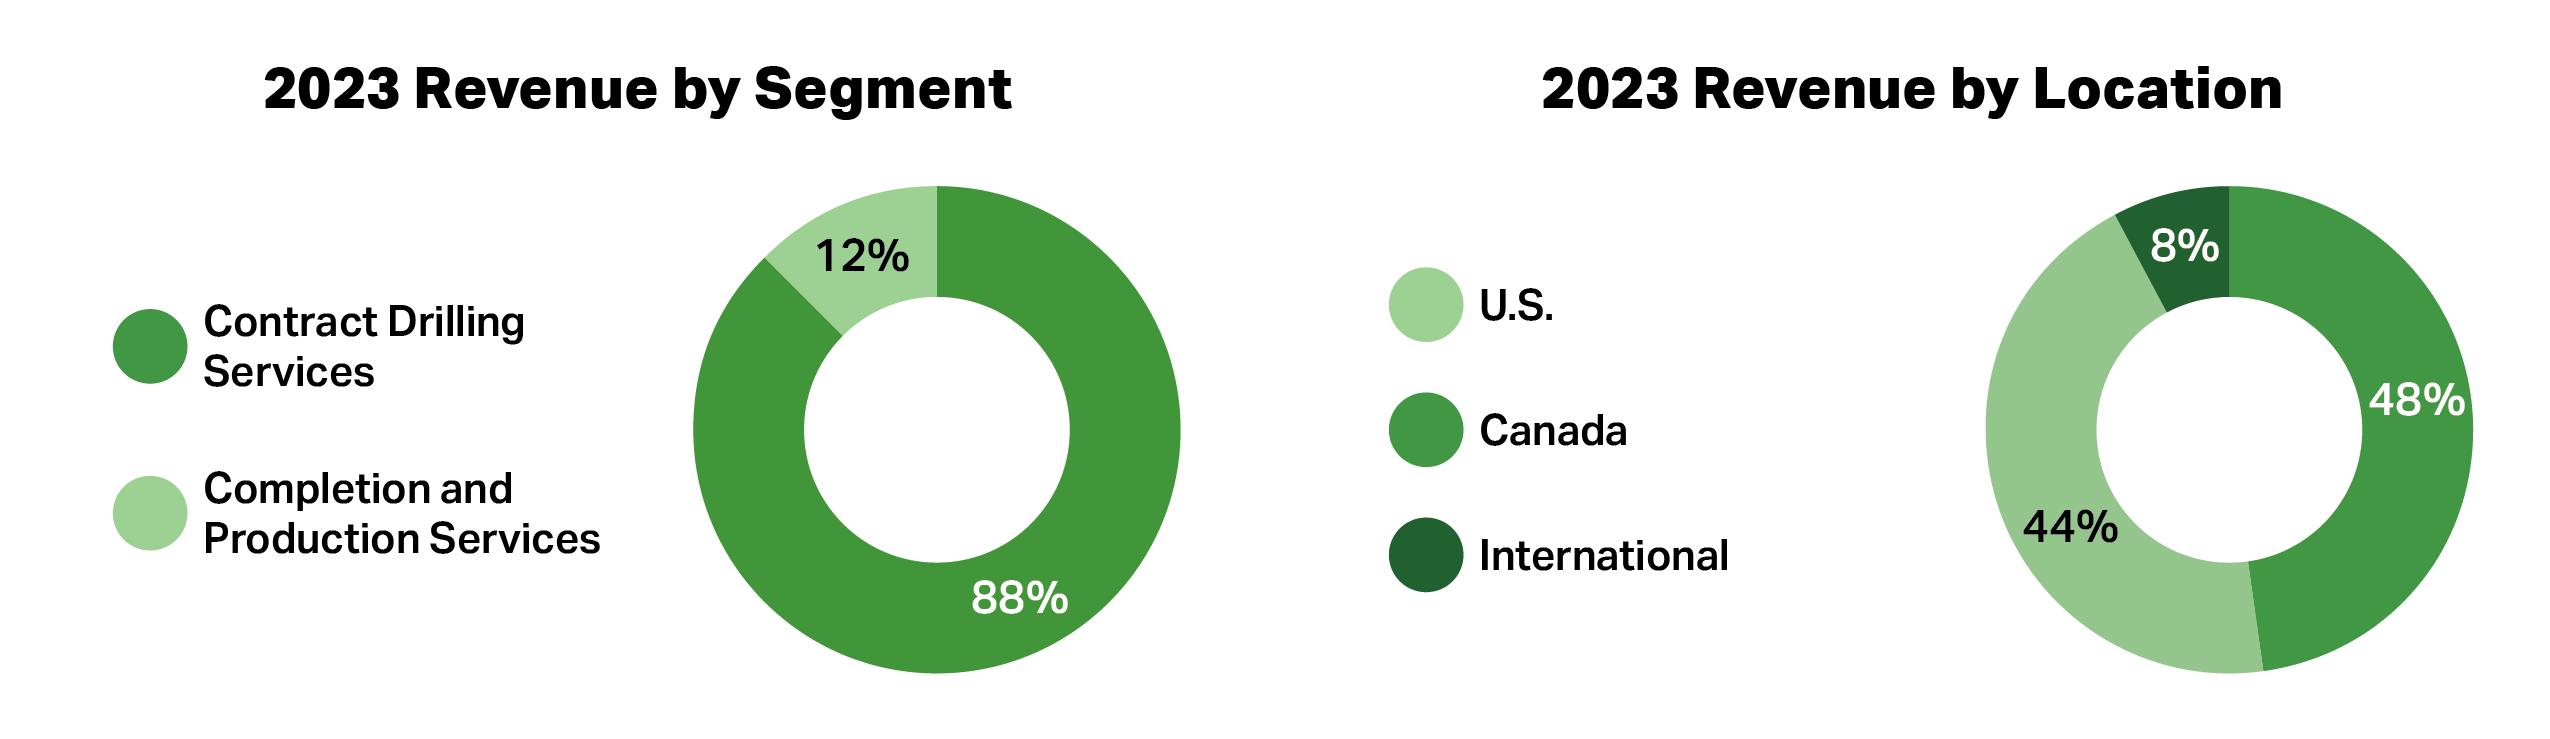
Contract Drilling Services | | | 1,704,265 | | | | 1,436,134 | | | | 877,943 | |
Completion and Production Services | | | 240,716 | | | | 187,171 | | | | 113,488 | |
Inter-segment elimination | | | (7,127 | ) | | | (6,111 | ) | | | (4,584 | ) |
| | | 1,937,854 | | | | 1,617,194 | | | | 986,847 | |
Adjusted EBITDA(1) | | | | | | | | | |
Contract Drilling Services | | | 630,761 | | | | 397,753 | | | | 231,532 | |
Completion and Production Services | | | 51,224 | | | | 38,147 | | | | 23,807 | |
Corporate and Other | | | (70,867 | ) | | | (124,295 | ) | | | (62,567 | ) |
| | | 611,118 | | | | 311,605 | | | | 192,772 | |
Depreciation and amortization | | | 297,557 | | | | 279,035 | | | | 282,326 | |
Gain on asset disposals | | | (24,469 | ) | | | (29,926 | ) | | | (8,516 | ) |
Loss on asset decommissioning | | | 9,592 | | | | — | | | | — | |
Foreign exchange | | | (1,667 | ) | | | 1,278 | | | | 393 | |
Finance charges | | | 83,414 | | | | 87,813 | | | | 91,431 | |
Loss (gain) on investments and other assets | | | 6,810 | | | | (12,452 | ) | | | 400 | |
Gain on acquisition | | | (25,761 | ) | | | — | | | | — | |
Loss (gain) on redemption and repurchase of unsecured senior notes | | | (137 | ) | | | — | | | | 9,520 | |
Earnings (loss) before income tax | | | 265,779 | | | | (14,143 | ) | | | (182,782 | ) |
Income taxes | | | (23,465 | ) | | | 20,150 | | | | (5,396 | ) |
Net earnings (loss) | | | 289,244 | | | | (34,293 | ) | | | (177,386 | ) |
(1) See Financial Measures and Ratios on page 40 of this report.
Results by Geographic Segment
| | | | | | | | | | | | |
Year ended December 31 (in thousands of dollars) | | | 2023 | | | | 2022 | | | | 2021 | |
Revenue | | | | | | | | | |
U.S. | | | 861,915 | | | | 745,630 | | | | 398,024 | |
Canada | | | 929,639 | | | | 725,560 | | | | 443,772 | |
International | | | 146,300 | | | | 146,004 | | | | 145,051 | |
| | | 1,937,854 | | | | 1,617,194 | | | | 986,847 | |
Total assets | | | | | | | | | |
U.S. | | | 1,226,256 | | | | 1,376,413 | | | | 1,247,173 | |
Canada | | | 1,246,069 | | | | 1,056,093 | | | | 959,163 | |
International | | | 546,710 | | | | 443,617 | | | | 455,416 | |
| | | 3,019,035 | | | | 2,876,123 | | | | 2,661,752 | |
2023 COMPARED WITH 2022
In the U.S., West Texas Intermediate (WTI) oil prices averaged US$77.62 per barrel and Henry Hub natural gas prices averaged US$2.67 per MMBtu, representing an decreases of 18% and 59% from 2022, respectively. In Canada, Western Canadian Select (WCS) and AECO natural gas prices averaged US$58.96 and $2.64 in 2023, respectively. Average WCS pricing was 25% lower than 2022 while AECO decreased by 51%.
As compared with 2022, our revenue increased by 20% to $1,938 million. Our higher revenue was primarily the result of increased North American drilling revenue per utilization day rates and increased service rig activity and revenue rates, partially offset by lower U.S. drilling activity. We recognized Adjusted EBITDA in 2023 of $611 million, 96% higher than 2022. Our higher Adjusted EBITDA in 2023 was primarily due to increased drilling and well service revenue rates, stronger Canadian drilling and well service activity and lower share-based compensation, partially offset by lower U.S. drilling activity. As compared with 2022, our U.S. drilling activity decreased 12%, Canadian activity increased 3% and international activity decreased 3%. Our service rig operating hours increased 18% compared with 2022. Net earnings in 2023 were $289 million, or $21.03 per share, compared with a net loss of $34 million, or $2.53 per share, in 2022.
Debt Repayments and Shareholder Returns
In 2023, we reduced debt by $152 million through the full repayment of our Senior Credit Facility of $60 million, $100 million of repurchases and redemptions of our 2026 unsecured senior notes and $2 million of repayments of our Real Estate Credit Facilities, partially offset by the assumption of the $10 million CWC Real Estate Credit Facility. Pursuant to our NCIB, we repurchased and cancelled 412,623 common shares for $30 million.
In addition, we assumed a $51 million syndicated loan in connection with our CWC acquisition that was fully repaid and cancelled upon closing.
CWC Acquisition
We acquired CWC for cash of $14 million and the issuance of 947,807 common shares for total consideration of $89 million plus the assumption of $61 million of CWC long-term debt. The acquisition further increased the size and scale of our Canadian well
Precision Drilling Corporation 2023 Annual Report 13
servicing operations, adding 62 marketable well service rigs to our service rig fleet along with ancillary and spare equipment and operating facilities in complimentary operating basins. The acquisition also added seven Canadian and 11 U.S. drilling rigs to our drilling fleet. We recognized a gain on acquisition of $26 million.
Finance Charges
Finance charges were $83 million as compared with $88 million in 2022. Our decreased finance charges in 2023 were the result of our lower debt balance, partially offset by the impact of higher variable interest rates and higher translated U.S. dollar-denominated interest charges due to the weakening of the Canadian dollar.
Capital Spending and Long-Lived Assets
Capital expenditures for the purchase of property, plant and equipment were $227 million, an increase of $42 million from 2022. Capital spending by spend category included $64 million for expansion and upgrades and $163 million for the maintenance of existing assets, infrastructure and intangibles. Capital expenditures were $12 million higher than guidance due to the timing of equipment deliveries.
We decommissioned 20 and seven legacy drilling rigs in Canada and the U.S., respectively, recognizing an asset decommissioning charge of $10 million.
Through the completion of normal course business operations, we sold non-core assets for proceeds of $24 million resulting in a gain on asset disposal of $24 million. Included in the gain on asset disposal was a $7 million gain from the non-cash swap of drill pipe.
In accordance with IFRS, we review the carrying value of our long-lived assets for indications of impairment at the end of each reporting period. At December 31, 2023, we reviewed each of our cash-generating units (CGUs) and did not identify indications of impairment and, therefore, did not test our CGUs for impairment.
Investments and Other Assets
During 2023, we exercised 2 million warrants for $1 million in exchange for 2 million common shares of Cathedral Energy Services Ltd. (Cathedral). We subsequently divested 11 million Cathedral common shares for net proceeds of $10 million. In addition, we completed a $5 million equity investment in CleanDesign Income Corp. (CleanDesign). CleanDesign is a key supplier of Precision’s EverGreenTM BESS and this investment provides access to key BESS and power management technologies.
Income Taxes
In 2023, we recognized an income tax recovery of $23 million as compared with an income tax expense of $20 million in 2022. During the fourth quarter of 2023, we recorded a deferred income tax asset of $73 million for the expected future use of certain Canadian operating losses. We continue to not recognize deferred income tax assets for certain international locations.
2022 COMPARED WITH 2021
2022 was highlighted by increasing industry activity, supported by strengthening commodity prices, as global oil and natural gas demand approached pre-pandemic levels and customers sought to replenish depleted well inventories. In the U.S., the WTI oil price averaged US$94.23 per barrel and Henry Hub natural gas prices averaged US$6.51 per MMBtu, representing an increase of 39% and 75% from 2021, respectively. In Canada, the WCS oil price and AECO natural gas prices averaged US$78.15 and $5.43 in 2022, respectively. Average WCS pricing was 43% higher than 2021 while AECO increased by 49%.
As compared with 2021, our revenue increased by 64% to $1,617 million. Our higher revenue in the year was primarily the result of higher North American activity and revenue per utilization day. We recognized Adjusted EBITDA in 2022 of $312 million, 62% higher than in 2021. Our higher Adjusted EBITDA in 2022 was primarily due to increased activity and day rates, partially offset by higher share-based compensation. As compared with 2021, U.S. drilling activity increased 41%, Canadian activity increased 30% and international activity remained consistent. In addition, service rig operating hours increased 34% compared with the prior year. Our net loss in 2022 was $34 million, or $2.53 per diluted share, compared with a net loss of $177 million, or $13.32 per diluted share, in 2021.
Debt Repayments and Shareholder Returns
During 2022, we reduced debt by $106 million through repayments on our Senior Credit and Real Estate Credit Facilities. Pursuant to our NCIB, we repurchased and cancelled 130,395 common shares for $10 million.
Finance Charges
Finance charges were $88 million, a decrease of $4 million from 2021 due to lower debt issue costs, partially offset by the impact of higher variable interest rates on our Senior Credit and Real Estate Credit Facilities. In 2021, we accelerated the amortization of issue costs associated with fully redeemed unsecured senior notes.
14 Management's Discussion and Analysis
Capital Spending and Long-Lived Assets
Capital expenditures for the purchase of property, plant and equipment were $184 million in 2022, an increase of $108 million from 2021. Capital spending by spend category included $63 million for expansion and upgrades and $121 million for the maintenance of existing assets and infrastructure.
During 2022, we acquired the well servicing business and associated rental assets of High Arctic for consideration of $38 million. On the date of acquisition, we made a $10 million cash payment with the remaining balance of $28 million paid in 2023. The acquisition increased the size and scale of our operations within the Canadian well servicing industry, adding well-service rigs to our fleet along with related rental assets, ancillary support equipment, inventories, spares and operating facilities in key operating basins.
Under IFRS, we review the carrying value of our long-lived assets for indications of impairment at the end of each reporting period. At December 31, 2022, we reviewed each of our cash-generating units and did not identify indications of impairment and, therefore, did not test our CGUs for impairment.
Through the completion of normal course business operations, we sold non-core assets for proceeds of $37 million resulting in a gain on asset disposal of $30 million.
Income Taxes
In 2022, we recognized an income tax expense of $20 million as compared with an income tax recovery of $5 million in 2021. In 2022, we continued to not recognize the benefit of Canadian and certain international deferred tax assets resulting in a higher income tax expense as compared with 2021.
SEGMENTED RESULTS
Contract Drilling Services
Financial Results
| | | | | | | | | | | | | | | | | | | | | | | | |
Year ended December 31
(in thousands of dollars, except where noted) | | 2023 | | | % of
revenue | | | 2022 | | | % of
revenue | | | 2021 | | | % of
revenue | |
Revenue | | | 1,704,265 | | | | | | | 1,436,134 | | | | | | | 877,943 | | | | |
Expenses | | | | | | | | | | | | | | | | | | |
Operating | | | 1,030,053 | | | | 60.4 | | | | 988,885 | | | | 68.9 | | | | 618,327 | | | | 70.4 | |
General and administrative | | | 43,451 | | | | 2.5 | | | | 49,496 | | | | 3.4 | | | | 28,084 | | | | 3.2 | |
Adjusted EBITDA(1) | | | 630,761 | | | | 37.0 | | | | 397,753 | | | | 27.7 | | | | 231,532 | | | | 26.4 | |
(1) See Financial Measures and Ratios on page 40 of this report.
Operating Statistics
| | | | | | | | | | | | | | | | | | | | | | | | |
Year ended December 31 | | 2023 | | | % increase/
(decrease) | | | 2022 | | | % increase/
(decrease) | | | 2021 | | | % increase/
(decrease) | |
Number of drilling rigs (year-end) | | | 214 | | | | (4.9 | ) | | | 225 | | | | (0.9 | ) | | | 227 | | | | — | |
Drilling utilization days (operating and moving) | | | | | | | | | | | | | | | | | | |
U.S. | | | 17,961 | | | | (11.9 | ) | | | 20,396 | | | | 40.7 | | | | 14,494 | | | | 20.0 | |
Canada | | | 21,156 | | | | 3.1 | | | | 20,519 | | | | 30.0 | | | | 15,782 | | | | 46.2 | |
International | | | 2,132 | | | | (2.6 | ) | | | 2,190 | | | | — | | | | 2,190 | | | | (13.3 | ) |
Drilling revenue per utilization day | | | | | | | | | | | | | | | | | | |
U.S. | | | 35,040 | | | | 28.3 | | | | 27,309 | | | | 28.7 | | | | 21,213 | | | | (19.0 | ) |
Canada | | | 33,151 | | | | 22.6 | | | | 27,037 | | | | 28.1 | | | | 21,105 | | | | (2.3 | ) |
International | | | 50,840 | | | | (0.8 | ) | | | 51,242 | | | | (3.0 | ) | | | 52,837 | | | | (3.6 | ) |
2023 Compared with 2022
Revenue from Contract Drilling Services was $1,704 million, 19% higher than 2022 due to higher North America revenue per utilization day rates, increased Canadian drilling activity, partially offset by lower U.S. and international activity. As compared to 2022, our drilling rig utilization days increased 3% in Canada while U.S. and international decreased by 12% and 3%, respectively.
Operating expenses in 2023 were 60% of revenue, 9% lower than the prior year, representing our revenue efficiency as our strengthening North American revenue per utilization day outpaced operating cost increases. On a per utilization day basis, in the U.S., operating costs were 10% higher than 2022 primarily due to higher rig operating expenses and repairs and maintenance and the impact of fixed operating overheads spread over fewer utilization days. Operating costs on a per day basis in our Canadian drilling rig division were 13% higher than in 2022, primarily due to higher rig operating expenses and repairs and maintenance. In both the U.S. and Canada, higher rig operating expenses primarily related to increased wages.
General and administrative expenses for 2023 decreased by 12% due to lower share-based compensation resulting from our lower share price. We recognized share-based compensation of $4 million as compared with $13 million in 2022.
Precision Drilling Corporation 2023 Annual Report 15
Our Adjusted EBITDA was $631 million as compared with $398 million in 2022. The increase was primarily due to the impact of stronger North America revenue per utilization day, higher Canadian drilling activity and lower share-based compensation, partially offset by decreased U.S. drilling activity.
U.S. Drilling
Revenue from U.S. drilling was US$629 million, 13% higher than 2022. Drilling rig activity, as measured by utilization days, was down 12% while average revenue per utilization day increased 28% compared with 2022. Adjusted EBITDA was US$242 million, 53% higher than 2022 and was the result of higher revenue per utilization day, partially offset by lower drilling and turnkey activity.
Our higher U.S. drilling revenue per utilization days was primarily due to higher average day rates spurred by the tightening of available Super-Spec rigs and revenue from idle but contracted rigs, partially offset by lower turnkey revenue. In 2023, we recognized turnkey revenue of US$7 million which accounted for 1% of our U.S. drilling revenue as compared with US$25 million and 4% in 2022, respectively. During the year, we recognized US$18 million of revenue from idle but contracted rigs as compared with $2 million in 2022.
Drilling Statistics – U.S.
We ended the year with a U.S. rig count of 104. We averaged 49 rigs working in 2023, 13% lower than 2022 due to lower industry activity. The average number of active land rigs for the industry was 670 as compared with 699 rigs in 2022.
| | | | | | | | | | | | | | | | | | | | | | | | |
| | 2023 | | | 2022 | | | 2021 | |
| | Precision | | | Industry (1) | | | Precision | | | Industry (1) | | | Precision | | | Industry (1) | |
Average number of active land rigs
for quarters ended: | | | | | | | | | | | | | | | | | | |
March 31 | | | 60 | | | | 744 | | | | 51 | | | | 603 | | | | 33 | | | | 378 | |
June 30 | | | 51 | | | | 700 | | | | 55 | | | | 687 | | | | 39 | | | | 437 | |
September 30 | | | 41 | | | | 631 | | | | 57 | | | | 746 | | | | 41 | | | | 485 | |
December 31 | | | 45 | | | | 603 | | | | 60 | | | | 761 | | | | 45 | | | | 545 | |
Annual average | | | 49 | | | | 670 | | | | 56 | | | | 699 | | | | 40 | | | | 461 | |
(1) Source: Baker Hughes.
Canadian Drilling
Revenue from Canadian drilling was $701 million, 26% higher than 2022. Drilling rig activity, as measured by utilization days, was up by 3% while average revenue per utilization day increased 23% as compared with 2022.
Adjusted EBITDA was $279 million, 45% higher than 2022 and was the result of higher drilling activity and day rates.
Drilling Statistics – Canada
We ended the year with a Canadian rig count of 97. Our average active rig count increased to 58 rigs in 2023, up from 56 rigs in 2022, and was consistent with increased industry activity as the average active land rigs increased from 176 to 177.
| | | | | | | | | | | | | | | | | | | | | | | | |
| | 2023 | | | 2022 | | | 2021 | |
| | Precision | | | Industry (1) | | | Precision | | | Industry (1) | | | Precision | | | Industry (1) | |
Average number of active land rigs
for quarters ended: | | | | | | | | | | | | | | | | | | |
March 31 | | | 69 | | | | 221 | | | | 63 | | | | 205 | | | | 42 | | | | 145 | |
June 30 | | | 42 | | | | 117 | | | | 37 | | | | 113 | | | | 27 | | | | 72 | |
September 30 | | | 57 | | | | 188 | | | | 59 | | | | 199 | | | | 51 | | | | 151 | |
December 31 | | | 64 | | | | 181 | | | | 66 | | | | 187 | | | | 52 | | | | 160 | |
Annual average | | | 58 | | | | 177 | | | | 56 | | | | 176 | | | | 43 | | | | 132 | |
(1) Source: Baker Hughes.
COMPLETION AND PRODUCTION SERVICES
Financial Results
| | | | | | | | | | | | | | | | | | | | | | | | |
Year ended December 31
(in thousands of dollars, except where noted) | | 2023 | | | % of
revenue | | | 2022 | | | % of
revenue | | | 2021 | | | % of
revenue | |
Revenue | | | 240,716 | | | | | | | 187,171 | | | | | | | 113,488 | | | | |
Expenses | | | | | | | | | | | | | | | | | | |
Operating | | | 181,622 | | | | 75.5 | | | | 141,827 | | | | 75.8 | | | | 84,401 | | | | 74.4 | |
General and administrative | | | 7,870 | | | | 3.3 | | | | 7,197 | | | | 3.8 | | | | 5,280 | | | | 4.7 | |
Adjusted EBITDA(1) | | | 51,224 | | | | 21.3 | | | | 38,147 | | | | 20.4 | | | | 23,807 | | | | 21.0 | |
(1) See Financial Measures and Ratios on page 40 of this report.
16 Management's Discussion and Analysis
Operating Statistics
| | | | | | | | | | | | | | | | | | | | | | | | |
Year ended December 31 | | 2023 | | | % increase/
(decrease) | | | 2022 | | | % increase/
(decrease) | | | 2021 | | | % increase/
(decrease) | |
Number of service rigs (end of year) | | | 183 | | | | 35.6 | | | | 135 | | | | 9.8 | | | | 123 | | | | — | |
Service rig operating hours | | | 201,627 | | | | 18.4 | | | | 170,362 | | | | 34.3 | | | | 126,840 | | | | 54.8 | |
2023 Compared with 2022
Revenue from Completion and Production Services was $241 million, 29% higher than 2022, resulting from increased well service activity and stronger hourly service rates. Our current year service rig operating hours rose by 18% versus 2022.
Operating expenses were 76% of segment revenue, largely consistent with 2022, as industry-wide wage increases were offset by increased hourly service rates. General and administrative expenses increased 9% due higher fixed overheads associated with our High Arctic and CWC acquisitions, partially offset by lower share-based compensation.
Adjusted EBITDA increased by 34% from 2022 as a result of increased activity and higher service rates.
CORPORATE AND OTHER
Financial Results
| | | | | | | | | | | | |
Year ended December 31
(in thousands of dollars, except where noted) | | | 2023 | | | | 2022 | | | | 2021 | |
Expenses | | | | | | | | | |
General and administrative | | | 70,867 | | | | 124,295 | | | | 62,567 | |
Adjusted EBITDA(1) | | | (70,867 | ) | | | (124,295 | ) | | | (62,567 | ) |
(1) See Financial Measures and Ratios on page 40 of this report.
2023 Compared with 2022
Our Corporate and Other segment contains support functions that provide assistance to our business segments. It includes costs incurred in corporate groups in both Canada and the U.S.
Corporate general and administrative expenses were $71 million, $53 million lower than 2022. The decrease was mainly related to lower share-based compensation resulting from our decreased share price in the current year. Corporate general and administrative costs were 4% of consolidated revenue as compared with 8% in 2022.
QUARTERLY FINANCIAL RESULTS
| | | | | | | | | | | | | | | | |
2023 – Quarters Ended
(in thousands of dollars, except per share amounts) | | March 31 | | | June 30 | | | September 30 | | | December 31 | |
Revenue | | | 558,607 | | | | 425,622 | | | | 446,754 | | | | 506,871 | |
Adjusted EBITDA(1) | | | 203,219 | | | | 142,093 | | | | 114,575 | | | | 151,231 | |
Net earnings (loss) | | | 95,830 | | | | 26,900 | | | | 19,792 | | | | 146,722 | |
per basic share | | | 7.02 | | | | 1.97 | | | | 1.45 | | | | 10.42 | |
per diluted share | | | 5.57 | | | | 1.63 | | | | 1.45 | | | | 9.81 | |
Funds provided by operations(1) | | | 159,653 | | | | 136,959 | | | | 91,608 | | | | 145,189 | |
Cash provided by (used in) operations | | | 28,356 | | | | 213,460 | | | | 88,500 | | | | 170,255 | |
(1) See Financial Measures and Ratios on page 40 of this report.
| | | | | | | | | | | | | | | | |
2022 – Quarters Ended
(in thousands of dollars, except per share amounts) | | March 31 | | | June 30 | | | September 30 | | | December 31 | |
Revenue | | | 351,339 | | | | 326,016 | | | | 429,335 | | | | 510,504 | |
Adjusted EBITDA(1) | | | 36,855 | | | | 64,099 | | | | 119,561 | | | | 91,090 | |
Net earnings (loss) | | | (43,844 | ) | | | (24,611 | ) | | | 30,679 | | | | 3,483 | |
per basic share | | | (3.25 | ) | | | (1.81 | ) | | | 2.26 | | | | 0.27 | |
per diluted share | | | (3.25 | ) | | | (1.81 | ) | | | 2.03 | | | | 0.27 | |
Funds provided by operations(1) | | | 29,955 | | | | 60,373 | | | | 81,327 | | | | 111,339 | |
Cash provided by operations | | | (65,294 | ) | | | 135,174 | | | | 8,142 | | | | 159,082 | |
(1) See Financial Measures and Ratios on page 40 of this report.
Fourth Quarter 2023 Compared with Fourth Quarter 2022
We recorded net earnings of $147 million or $10.42 per share as compared with net earnings of $3 million or $0.27 per share in the fourth quarter of 2022.
Fourth quarter revenue of $507 million was largely consistent with 2022 as increased drilling and service revenue rates were offset by lower North America activity. Drilling rig utilization days decreased 25% and 3% in the U.S. and Canada, respectively, while international activity increased 26% as we reactivated rigs in the Middle East. Fourth quarter revenue from our Contract Drilling Services was largely consistent with 2022, whereas revenue from our Completion and Production Services segment increased 5%.
Precision Drilling Corporation 2023 Annual Report 17
Adjusted EBITDA for the quarter was $151 million, $60 million higher than 2022. Our increased Adjusted EBITDA in 2023 was primarily due to lower share-based compensation. Share-based compensation for the quarter was $13 million, $62 million lower than 2022 as a result of our lower share price appreciation during the current year quarter.
Contract Drilling Services
Revenue from Contract Drilling Services was $447 million, largely consistent with 2022, while Adjusted EBITDA increased 18% to $162 million. The increased Adjusted EBITDA was primarily due to higher daily operating margins and international activity, partially offset by lower North America drilling activity.
Drilling rig utilization days in the U.S. were 4,138, 25% lower than 2022. Drilling rig utilization days in Canada were 5,909, 3% lower than 2022. The movement in utilization days in both the U.S. and Canada was largely consistent with changes in industry activity. Drilling rig utilization days in our international business increased 26% to 693, as we reactivated rigs in Kuwait.
As compared with 2022, our U.S. fourth quarter revenue per utilization day increased 10% to US$34,452. The increase was primarily the result of higher fleet average day rates and idle but contracted rig revenue, partially offset by lower turnkey revenue. We recognized revenue from idle but contracted rigs and turnkey activity of US$7 million and nil, respectively, as compared with nil and US$4 million in 2022. Compared with the same quarter in 2022, drilling rig revenue per utilization day in Canada increased 16% to $34,616 due to higher average day rates and customer cost recoveries. Our international revenue per utilization day for the quarter was consistent with 2022.
In the U.S., operating costs per utilization day were $21,039, 9% higher than in 2022. The increase was primarily due to higher rig operating costs and repairs and maintenance and the impact of fixed costs being spread over fewer activity days. Our Canadian operating costs on a per day basis increased 9% to $19,191 and was due to higher field wages and recoverable costs, partially offset by lower repairs and maintenance.
Our general and administrative expenses decreased $5 million as compared with 2022 and was primarily the result of lower share-based compensation, partially offset by the impact of higher translated U.S. dollar-denominated costs.
Completion and Production Services
Completion and Production Services revenue increased to $62 million as compared with $59 million in 2022. The higher revenue was primarily due to increased average service rates and activity. Our fourth quarter service rig operating hours were 56,683 an increase of 15% from 2022.
Operating costs as a percentage of revenue were 77%, consistent with 2022. As compared to 2022, our fourth quarter general and administrative expenses increased 9%, primarily due to overhead charges associated with the CWC acquisition.
Adjusted EBITDA was $12 million, consistent with 2022.
Corporate and Other
Our Corporate and Other segment provides support functions to our operating segments. The Corporate and Other segment had negative Adjusted EBITDA of $23 million as compared with negative $58 million in 2022. Our improved Adjusted EBITDA was due to lower share-based compensation, partially offset by $4 million in transaction costs and severance.
18 Management's Discussion and Analysis
The oilfield services business is inherently cyclical. To manage this variability, we focus on maintaining a strong financial position to have the financial flexibility we need to continue to manage our capital expenditures and cash flows, no matter where we are in the business cycle.
We apply a disciplined approach to managing and tracking the results of our operations to keep costs down. We maintain a variable cost structure so we can respond to changing market demand. We also invest in our fleet to make sure we remain competitive. Our maintenance capital expenditures are tightly governed and highly responsive to activity levels with additional cost savings generated through the operating leverage provided by our internal manufacturing and supply divisions. Term contracts on expansion capital for new-build rig programs help provide more certainty of future revenues and return on our growth capital investments.
LIQUIDITY
During 2023, we maintained our strong liquidity position, exiting the year with a cash balance of $54 million and more than $600 million of available liquidity. We expect cash provided by operations and our sources of financing, including our Senior Credit Facility, to be sufficient to meet our unsecured senior note obligations and to fund future capital expenditures.
At December 31, 2023, excluding letters of credit, we had approximately $929 million (2022 – $1,103 million) outstanding under our secured and unsecured credit facilities and $11 million (2022 – $15 million) in unamortized debt issue costs. Our Senior Credit Facility and Real Estate Credit Facility include financial ratio covenants that are tested quarterly.
The current blended cash interest cost of our debt is approximately 7.0%.
Key Financial Indicators and Ratios
We evaluate the relative strength of our financial position by monitoring our working capital, debt ratios and liquidity. We also monitor returns on capital and link our executives’ incentive compensation to certain long-term strategic targets as well as the returns of our shareholders relative to the shareholder returns of our peers. Please refer to page 12 for our summary of Financial Position and Ratios.
Credit Rating
Credit ratings affect our ability to obtain short and long-term financing, the cost of this financing, and our ability to engage in certain business activities cost-effectively.
| | | | | | |
At March 4, 2024 | | Moody’s | | S&P | | Fitch |
Corporate credit rating | | Ba3 | | B+ | | B+ |
Senior Credit Facility rating | | Not rated | | Not rated | | BB+ |
Unsecured senior notes credit rating | | B1 | | B+ | | B+ |
CAPITAL MANAGEMENT
To maintain and grow our business, we invest in growth, upgrade and sustaining capital. We base expansion and upgrade capital decisions on return of capital employed and payback. We mitigate the risk that we may not be able to fully recover our capital, by requiring term contracts for new-build rigs.
We base our maintenance capital decisions on actual activity levels, using key financial indicators that we express as per operating day or per operating hour. Sourcing internally (through our manufacturing and supply divisions) helps keep our maintenance capital costs as low as possible.
Foreign Exchange Risk
Our U.S. and international operations have revenue, expenses, assets, and liabilities denominated in currencies other than the Canadian dollar (mostly in U.S. dollars and currencies that are pegged to the U.S. dollar). This means that changes in currency exchange rates can materially affect our income statement, statement of financial position and statement of cash flow. We manage this risk by matching the currency of our debt obligations with the currency of cash flows generated by the operations that the debt supports.
Hedge of Investments in Foreign Operations
We utilize foreign currency long-term debt to hedge our exposure to changes in the carrying values of our net investment in certain foreign operations as a result of changes in foreign exchange rates. During 2023, we continued to designate our U.S. dollar Senior Credit Facility and unsecured senior notes as a net investment hedge in our U.S. dollar denominated foreign operations. To be accounted for as a hedge, the foreign currency denominated long-term debt must be designated and documented as such and must be effective at inception and on an ongoing basis. We recognize the effective amount of this hedge (net of tax) in other comprehensive income. We recognize ineffective amounts in earnings.
Precision Drilling Corporation 2023 Annual Report 19
SOURCES AND USES OF CASH
| | | | | | | | | | | | |
At December 31 (in thousands of dollars) | | | 2023 | | | | 2022 | | | | 2021 | |
Cash provided by operations | | | 500,571 | | | | 237,104 | | | | 139,225 | |
Cash used in investing activities | | | (214,784 | ) | | | (144,415 | ) | | | (56,613 | ) |
Surplus | | | 285,787 | | | | 92,689 | | | | 82,612 | |
Cash used in financing activities | | | (251,966 | ) | | | (113,171 | ) | | | (149,913 | ) |
Effect of exchange rate changes on cash | | | (1,226 | ) | | | 1,481 | | | | (883 | ) |
Net cash movement | | | 32,595 | | | | (19,001 | ) | | | (68,184 | ) |
Cash Provided by Operations
In 2023, cash provided by operations was $501 million compared with $237 million in 2022. The increase was driven by our revenue efficiency, as average drilling and service revenue rate increases outpaced operating cost increases, and lower share-based compensation, partially offset by lower U.S. and international drilling activity.
Cash Used in Investing Activities
Our 2023 capital spending of $227 million by spend category was comprised of:
▪$64 million on upgrade and expansion capital, and
▪$163 million on maintenance and infrastructure capital.
The $227 million in capital expenditures in 2023 was split between our segments as follows:
▪$214 million in Contract Drilling Services,
▪$10 million in Completion and Production Services, and
▪$3 million in Corporate and Other.
Expansion and upgrade capital includes the cost of long-lead items purchased for our capital inventory, such as integrated top drives, drill pipe, control systems, engines, and other items we can use to complete new-build projects or upgrade our rigs in North America and internationally.
We sold underutilized capital assets for proceeds of $24 million in 2023 compared with $37 million in 2022.
Our business combination activities included:
▪The acquisition of CWC in which we made a cash payment of $14 million on November 8, 2023 which was offset by the acquired CWC cash balance of $13 million, and
▪The payment of $28 million in connection with our 2022 acquisition of High Arctic that was deferred until 2023.
Our investments and other assets activities included:
▪The sale of Cathedral common shares for proceeds of $10 million, and
▪Our investment in CleanDesign for $5 million.
Cash Used in Financing Activities
In 2023, cash used in financing activities was $252 million as compared with $113 million in 2022. Our 2023 financing activities were comprised of:
▪$213 million of long-term debt repayments, which included the repayment of CWC's $51 million syndicated loan that was assumed upon acquisition,
▪$30 million of NCIB share repurchases, and
▪$9 million of lease payments.
20 Management's Discussion and Analysis
CAPITAL STRUCTURE
Material Debt
| | | | | | |
Amount | | Availability | | Used for | | Maturity |
Senior Credit Facility (secured) | | | | | | |
US$447 million (extendible, revolving
term credit facility with US$353 million
accordion feature) | | Nil drawn and US$56 million in
outstanding letters of credit | | General corporate purposes | | June 18, 2025 |
Real estate credit facilities (secured) | | | | | | |
US$8 million | | Fully drawn | | General corporate purposes | | November 19, 2025 |
$16 million | | Fully drawn | | General corporate purposes | | March 16, 2026 |
$10 million | | Fully drawn | | General corporate purposes | | June 30, 2028 |
Operating facilities (secured) | | | | | | |
$40 million | | Undrawn, except $20 million
in outstanding letters of credit | | Letters of credit and general
corporate purposes | | |
US$15 million | | Undrawn | | Short term working capital
requirements | | |
Demand letter of credit facility (secured) | | | | | | |
US$40 million | | Undrawn, except US$28 million
in outstanding letters of credit | | Letters of credit | | |
Unsecured senior notes (unsecured) | | | | | | |
US$273 million – 7.125% | | Fully drawn | | Debt redemption and repurchases | | January 15, 2026 |
US$400 million – 6.875% | | Fully drawn | | Debt redemption and repurchases | | January 15, 2029 |
| | | | | | |
Covenants
At December 31, 2023, we were in compliance with the covenants of our Senior Credit Facility, Real Estate Credit Facility and unsecured senior notes.
| | | | | | |
| | Covenant | | At December 31, 2023 | |
Senior Credit Facility | | | | | |
Consolidated senior debt to consolidated covenant EBITDA(1) | | ≤ 2.50 | | | 0.07 | |
Consolidated covenant EBITDA to consolidated interest expense | | ≥ 2.50 | | | 6.92 | |
| | | | | |
Real Estate Credit Facility | | | | | |
Consolidated covenant EBITDA to consolidated interest expense | | ≥ 2.50 | | | 6.92 | |
| | | | | |
Unsecured Senior Notes | | | | | |
Consolidated interest coverage ratio | | ≥ 2.00 | | | 7.50 | |
(1) For purposes of calculating the leverage ratio consolidated senior debt only includes secured indebtedness.
Senior Credit Facility
The senior secured revolving credit facility (Senior Credit Facility) provides Precision with senior secured financing for general corporate purposes, including for acquisitions, of up to US$447 million with a provision for an increase in the facility of up to an additional US$353 million. The Senior Credit Facility is secured by charges on substantially all of the present and future assets of Precision, its material U.S. and Canadian subsidiaries and, if necessary, to adhere to covenants under the Senior Credit Facility, certain subsidiaries organized in jurisdictions outside of Canada and the U.S.
The Senior Credit Facility requires Precision comply with certain restrictive and financial covenants including a leverage ratio of consolidated senior debt to consolidated Covenant EBITDA (as defined in the debt agreement) of less than 2.5:1. For purposes of calculating the leverage ratio consolidated senior debt only includes secured indebtedness. It also requires the Corporation maintain a ratio of consolidated Covenant EBITDA to consolidated interest expense for the most recent four consecutive quarters of greater than 2.5:1.
Distributions under the Senior Credit Facility are subject to a pro-forma senior net leverage covenant of less than or equal to 1.75:1. The Senior Credit Facility also limits the redemption and repurchase of junior debt subject to a pro-forma senior net leverage covenant test of less than or equal to 1.75:1.
Under the Senior Credit Facility, amounts can be drawn in U.S. dollars and/or Canadian dollars. At December 31, 2023, the facility was undrawn (2022 – US$44 million). Up to US$200 million of the Senior Credit Facility is available for letters of credit denominated in U.S. and/or Canadian dollars and other currencies acceptable to the fronting lender. As at December 31, 2023, outstanding letters of credit amounted to US$56 million (2022 – US$56 million).
The interest rate on loans that are denominated in U.S. dollars is, at the option of Precision, either a margin over a U.S. base rate or a margin over Term SOFR. The interest rate on loans denominated in Canadian dollars is, at the option of Precision, either a margin over the Canadian prime rate or a margin over the Canadian Dollar Offered Rate (CDOR); such margins will be based on the then applicable ratio of consolidated total debt to EBITDA.
Precision Drilling Corporation 2023 Annual Report 21
In 2023, we agreed with the lenders of our Senior Credit Facility to remove certain non-extending lenders from our facility, thereby reducing the total commitment from US$500 million to US$447 million.
Real Estate Credit Facilities
In 2023, we assumed a $10 million Canadian Real Estate Facility from our acquisition of CWC. The facility matures in June 2028 and is secured by real properties in Alberta, Canada. Principal plus interest payments are due monthly, based on a 22-year amortization period with any unpaid principal and accrued interest due at maturity. Interest is calculated using a CORRA rate plus margin.
Our $16 million Canadian Real Estate Credit Facility is secured by real properties in Alberta, Canada. Principal plus interest payments are due quarterly, based on 15-year straight-line amortization with any unpaid principal and accrued interest due at maturity. Interest is calculated using a CDOR rate plus margin.
Our U.S. Real Estate Credit Facility is secured by real property located in Houston, Texas. Principal plus interest payments are due monthly, based on 15-year straight-line amortization with any unpaid principal and accrued interest due at maturity. Interest is calculated using a LIBOR rate plus margin.
Our Real Estate Credit Facilities contain certain affirmative and negative covenants and events of default, customary for these types of transactions. Under the terms of these facilities, we must maintain financial covenants in accordance with the Senior Credit Facility, described above, as of the last day of each period of four consecutive fiscal quarters. For the Canadian Real Estate Credit Facilities, in the event the Senior Credit Facility expires, is cancelled, or is terminated, financial covenants in effect at that time shall remain in place for the remaining duration of the facility. For the U.S. Real Estate Credit Facility, in the event the consolidated Covenant EBITDA to consolidated interest expense coverage ratio is waived or removed from the Senior Credit Facility, a minimum threshold of 1.15:1 is required.
Unsecured Senior Notes
The unsecured senior notes require we comply with an incurrence based consolidated interest coverage ratio test of consolidated cash flow, as defined in the senior note agreements, to consolidated interest expense of greater than 2.0:1 for the most recent four consecutive fiscal quarters. In the event our consolidated interest coverage ratio is less than 2.0:1 for the most recent four consecutive fiscal quarters, the senior notes restrict our ability to incur additional indebtedness.
The unsecured senior notes contain a restricted payment covenant that limits our ability to pay dividends, make distributions or repurchase shares from shareholders. This restricted payment basket grows from a starting point of October 1, 2017 for the 2026 senior notes and July 1, 2021 for the 2029 senior notes by, among other things, 50% of consolidated cumulative net earnings and decreases by 100% of consolidated cumulative net losses, as defined in the senior note agreements, and payments made to shareholders. The governing net restricted payments basket is currently negative, limiting our ability to declare and make dividend payments and repurchase shares until such time as the restricted payments baskets become positive. During 2023, pursuant to the indentures governing the unsecured senior notes, Precision used the available general restricted payments basket to facilitate the repurchase and cancellation of its common shares.
In addition, the unsecured senior notes contain certain covenants that limit our ability, and the ability of certain subsidiaries, to incur additional indebtedness and issue preferred shares; create liens; create or permit to exist restrictions on our ability or certain subsidiaries to make certain payments and distributions; engage in amalgamations, mergers or consolidations; make certain dispositions and engage in transactions with affiliates.
For further information, please see the unsecured senior note indentures which are available on SEDAR+ and EDGAR.
Contractual Obligations
Our contractual obligations include both financial obligations (long-term debt and interest) and non-financial obligations (new-build rig commitments, leases, and equity-based compensation for key executives and officers). The table below shows the amounts of these obligations and when payments are due for each.
| | | | | | | | | | | | | | | | | | | | |
| | Payments due (by period) | |
At December 31, 2023
(in thousands of dollars) | | Less than
1 year | | | 1-3 years | | | 4-5 years | | | More than
5 years | | | Total | |
Long-term debt(1) | | | 2,848 | | | | 388,441 | | | | 7,854 | | | | 529,904 | | | | 929,047 | |
Interest on long-term debt(1) | | | 65,030 | | | | 103,255 | | | | 73,543 | | | | 1,518 | | | | 243,346 | |
Purchase of property, plant and equipment(1)(2) | | | 88,263 | | | | 86,374 | | | | — | | | | — | | | | 174,637 | |
Leases(1) | | | 17,540 | | | | 28,009 | | | | 14,451 | | | | 10,748 | | | | 70,748 | |
Contractual incentive plans(1)(3) | | | 67,117 | | | | 34,656 | | | | — | | | | — | | | | 101,773 | |
Total | | | 240,798 | | | | 640,735 | | | | 95,848 | | | | 542,170 | | | | 1,519,551 | |
(1) U.S. dollar denominated balances are translated at the period end exchange rate of Cdn$1.00 equals US$0.7549.
(2) Balance primarily relates to cost of rig equipment with flexible delivery schedule wherein we can take delivery between 2024 and 2026.
(3) Includes amounts not yet accrued but are likely to be paid at the end of the contract term. Our long-term incentive plans compensate officers and key employees through cash payments when their awards vest. Equity-based compensation amounts are shown based on the closing share price on the TSX of $71.96 at December 31, 2023.
22 Management's Discussion and Analysis
Shareholders Capital
| | | | | | | | | | | | | | | | |
| | March 4,
2024 | | | December 31,
2023 | | | December 31,
2022 | | | December 31,
2021 | |
Shares outstanding | | | 14,478,582 | | | | 14,336,539 | | | | 13,558,525 | | | | 13,304,425 | |
Deferred shares outstanding | | | 1,470 | | | | 1,470 | | | | 1,470 | | | | 1,470 | |
Share options outstanding | | | 87,983 | | | | 151,453 | | | | 164,803 | | | | 383,448 | |
During 2024, we settled certain vesting RSUs and PSUs through the issuance of 265,143 common shares and, pursuant to our NCIB, repurchased and cancelled 123,100 common shares for $10 million.
More information about our capital structure can be found in our Annual Information Form, available on our website and on SEDAR+.
Common Shares
Our articles of amalgamation allow us to issue an unlimited number of common shares.
Preferred Shares
We can issue preferred shares in one or more series. The Board must pass a resolution determining the number of shares in each series, and the designation, rights, privileges, restrictions and conditions for each series, before the shares can be issued. This includes the rate or amount of dividends, when and where dividends are paid, the dates dividends accrue from any rights or obligations for us to buy or redeem the shares, and the price, terms and conditions, and any conversion rights.
Enterprise Value
| | | | | | | | | | | | |
(in thousands of dollars, except shares outstanding and per share amounts) | | December 31,
2023 | | | December 31,
2022 | | | December 31,
2021 | |
Shares outstanding | | | 14,336,539 | | | | 13,558,525 | | | | 13,304,425 | |
Year-end share price on the TSX | | | 71.96 | | | | 103.71 | | | | 44.69 | |
Shares at market | | | 1,031,657 | | | | 1,406,155 | | | | 594,575 | |
Long-term debt | | | 914,830 | | | | 1,085,970 | | | | 1,106,794 | |
Less cash | | | (54,182 | ) | | | (21,587 | ) | | | (40,588 | ) |
Enterprise Value(1) | | | 1,892,305 | | | | 2,470,538 | | | | 1,660,781 | |
(1) See Financial Measures and Ratios on page 40 of this report.
Precision Drilling Corporation 2023 Annual Report 23
| |
ACCOUNTING POLICIES AND ESTIMATES |
| |
CRITICAL ACCOUNTING ESTIMATES AND JUDGEMENTS
Because of the nature of our business, we are required to make estimates about the future that affect the reported amounts of assets, liabilities, revenues and expenses, and the disclosure of contingent liabilities. Estimates are based on our past experience, our best judgement and assumptions we think are reasonable.
Our significant accounting policies are described in Note 3 to the Consolidated Financial Statements. We believe the following are the most difficult, subjective or complex judgements, and are the most critical to how we report our financial position and results of operations:
▪impairment of long-lived assets
Climate-related risks and opportunities may have a future impact on the Corporation and its estimates and judgements, including but not limited to the useful life and residual value of its property, plant and equipment and the measurement of projected cash flows when identifying impairment triggers, performing tests for impairment or impairment recoveries of non-financial assets.
The Corporation evaluated the remaining useful lives and residual values of its property, plant and equipment, concluding they remain reasonable given the current estimate of the demand period for oil and natural gas extractive services well exceeds their remaining useful lives. In addition, the Corporation’s property, plant and equipment, including drill rig equipment, adapts to numerous low-carbon projects, including but not limited to, geothermal drilling, carbon capture and storage and the extraction of helium and hydrogen gas.
In future periods, if indications of impairment of non-financial assets exist, the Corporation’s measurement of projected cash flows may be exposed to higher estimation uncertainty, including but not limited to the Corporation’s continued capital investment required to lower the carbon intensity of its property, plant and equipment, period and growth expectations used to calculate terminal values and the Corporation’s weighted average cost of capital.
Impairment of Long-Lived Assets
Long-lived assets, which include property, plant and equipment and intangibles, comprise the majority of our assets. The carrying value of these assets is reviewed for impairment periodically or whenever events or changes in circumstances indicate that their carrying amounts may not be recoverable. The Corporation’s analysis is based on relevant internal and external factors that indicate a CGU may be impaired such as the obsolescence or planned disposal of significant assets, the financial performance of the CGU compared to forecasts and consideration of the Corporation’s market capitalization.
The recoverability of long-lived assets requires a calculation of the recoverable amount of the cash generating unit or groups of CGUs to which assets have been allocated. A CGU is the smallest identifiable group of assets that generates cash inflows that are largely independent of the cash inflows from other assets or groups of assets. Judgement is required in the aggregation of assets into CGUs. The recoverability calculation requires an estimation of the future cash flows from the CGU or group of CGUs, and judgement is required in projecting cash flows and selecting the appropriate discount rate. We use observable market data inputs to develop a discount rate that we believe approximates the discount rate from market participants. For property, plant and equipment, this requires us to forecast future cash flows to be derived from the utilization of our assets based on assumptions about future business conditions and technological developments. Significant, unanticipated changes to these assumptions could require a provision for impairment in the future.
In deriving the underlying projected cash flows, assumptions must also be made about future drilling activity, margins and market conditions over the long-term life of the assets or CGUs. We cannot predict if an event that triggers impairment will occur, when it will occur or how it will occur, or how it will affect reported asset amounts. Although we believe the estimates are reasonable and consistent with current conditions, internal planning, and expected future operations, such estimations are subject to significant uncertainty and judgement.
Business Combinations
The determination of fair value is estimated based on information available at the date of acquisition and requires management to make assumptions and estimates about future events. The assumptions and estimates with respect to determining the fair value of property, plant and equipment generally requires significant judgment. The measurement of the estimated fair value of acquired property, plant, and equipment is based on a combination of approaches, including the market approach, which applies significant assumptions related to the price at which comparable assets would be sold. Minor changes to these assumptions could have resulted in a significant impact to the fair value of property, plant and equipment acquired.
Income Taxes
Uncertainties exist with respect to the interpretation of complex tax regulations, changes in tax laws, and the amount and timing of future taxable income. Differences arising between the actual results and the assumptions made, or future changes to such assumptions, could necessitate future adjustments to taxable income and expenses already recorded. We establish provisions, based on reasonable estimates, for possible consequences of audits by the tax authorities of the respective countries in which
24 Management's Discussion and Analysis
we operate. The amount of such provisions is based on various factors, such as our experience with previous tax audits and differing interpretations of tax regulations by the taxable entity and the responsible tax authority.
Investing in Precision securities presents risks. Take time to read about the risks described below and other important information in this MD&A and our other disclosure documents before making an investment decision, as these risks could have a material adverse effect on our business, financial condition, results of operations and cash flow. You may also want to seek advice from an expert.
Our enterprise risk management framework operates at the business and functional levels and is designed to identify, evaluate and mitigate risks within each of the risk categories below. It leverages the risk framework in each of our businesses, which includes Precision’s policies, guidelines and review mechanisms.
In the course of our operations, our businesses regularly confront and navigate various risks, some of which have the potential to result in future outcomes that may differ, and at times, be materially different from our current expectations. In this section, we provide a detailed account of certain important strategic, operational, financial, legal and compliance risks. Our response to developments in those risk areas and our reactions to material future developments will affect our future results.
Our operations depend on the prices of oil and natural gas, which are subject to volatility and on the exploration and development activities of oil and natural gas exploration and production companies
We primarily sell our services to oil and natural gas exploration and production companies. Macroeconomic and geopolitical factors associated with oil and natural gas supply and demand are the primary factors driving pricing and profitability in the oilfield services industry. Generally, we experience high demand for our services when commodity prices are relatively high, and the opposite is true when commodity prices are relatively low. The volatility of crude oil and natural gas prices accounts for much of the cyclical nature of the oilfield services business in recent years. Increased volatility and other factors beyond our control have led to greater uncertainty in the demand for our services.
The markets for oil and natural gas are separate and distinct. Oil is a global commodity with a vast distribution network, although the differential between benchmarks such as West Texas Intermediate, Western Canadian Select, and European Brent crude oil can fluctuate. As in all markets, when supply, demand, inability to access domestic or export markets and other factors change, so can the spreads between benchmarks. The use of natural gas is growing worldwide, with the three most developed demand centers residing in North America, Western Europe and North Asia. These regions have dense pipeline networks and a high demand for natural gas. The world’s largest producers of natural gas are currently the U.S., Russia, Iran, Qatar, Canada, China, Norway and Australia. The most economical way to transport natural gas is in its gaseous state by pipeline, and the natural gas market depends on pipeline infrastructure and regional supply and demand. However, developments in the transportation of LNG in ocean-going tanker ships introduced an element of globalization to the natural gas market. The development of LNG means all the major production centers for natural gas are linked to the world’s major demand centers.
Worldwide military, political, economic conditions and other events, such as the COVID-19 pandemic, the current conflicts in Ukraine and the Middle East, expectations for global economic growth, inflation, political sanctions, trade disputes, or initiatives by OPEC+, can all affect supply and demand for oil and natural gas. Weather conditions, governmental regulation (in Canada and U.S.), levels of consumer demand, the availability and pricing of alternate sources of energy (including renewable energy initiatives), the availability of pipeline capacity and other transportation for oil and natural gas, global oil and natural gas storage levels, and other factors beyond our control can also affect the supply of and demand for oil and natural gas and lead to future price volatility.
According to Baker Hughes, the Canadian average active rig count in 2023 was flat year over year, while the U.S. average active land drilling rig count declined approximately 6%. In Canada, the Canadian Association of Energy Contractors (CAOEC) reported approximately 5,700 wells were drilled in 2023, compared with 5,500 in 2022 and 4,600 in 2021. For the U.S., Enverus reported approximately 15,600 wells were started onshore in the U.S., compared with approximately 17,600 in 2022 and 14,400 in 2021. Drilling activity in the U.S. began to weaken in early 2023 due to lower natural gas prices and oil price volatility and was exacerbated by drilling and completion efficiencies, consolidation among producers, and continued capital discipline. In Canada, drilling activity is supported by strong fundamentals as additional take away capacity for oil and natural gas becomes available in 2024.
Recently, commodity prices have been negatively affected by a combination of factors, including increased production, the decisions of OPEC+, concerns in respect of a recession and a strengthening in the U.S. dollar relative to most other currencies. Although OPEC+ agreed in November 2023 to additional oil production cuts, there is no assurance that the most recent OPEC+ agreement will be observed by its parties and OPEC+ may change its agreement depending upon market conditions. Oil and natural gas prices are expected to continue to be volatile as a result of conflict in Ukraine, concerns around expansion of conflict in the Middle East, changes in oil and natural gas inventories, sanctions on Russian oil and natural gas exports and prices, global and national economic performance, the actions of OPEC+, and any coordinated releases of oil from strategic reserves by the U.S. (or any other country). Certain of these events and conditions may contribute to decreased exploration and drilling
Precision Drilling Corporation 2023 Annual Report 25
activities and a decrease in confidence in the oil and natural gas industry. These difficulties have been exacerbated in Canada and the U.S. by political and other actions resulting in uncertainty surrounding regulatory, tax, royalty and environmental regulation. Each of these factors have adversely affected, and could continue to adversely affect, the price of oil and natural gas and drilling activities by our customers, which would adversely affect the level of capital spending by our customers and in turn could have a material adverse effect on our business, financial condition, results of operations and cash flow.
As a result of the continued volatility in oil and natural gas prices, regulatory uncertainty, and strategies of certain of our customers to focus on debt reductions, returning cash to shareholders or other capital discipline rather than incurring expenditures on exploration and drilling activities, demand for our services may be lower compared to historic periods when commodity prices were at similar levels. Reductions in commodity prices or factors that impact the supply and demand for oil and natural gas and lead to price volatility may result in reductions in capital budgets by our customers in the future, which could result in cancelled, delayed or reduced drilling programs by our customers and a corresponding decline in demand for our services. Additionally, the availability and pricing of alternative sources of energy, a transition to lower carbon intensive energy sources or a shift to a lower carbon economy, and technological advances may also depress the overall level of oil and natural gas exploration and production activity, similarly impacting the demand for our services.
If a reduction in exploration and development activities, whether resulting from changes in oil and natural gas prices or reductions in capital expenditures and capital budgets as described above or otherwise, continues or worsens, it could materially and adversely affect us further by:
▪negatively impacting our revenue, cash flow, profitability and financial condition
▪restricting our ability to make capital expenditures compared to periods prior to the downturn and our ability to meet future contracted deliveries of new-build rigs
▪affecting the existing fair market value of our rig fleet, which in turn could trigger a write-down for accounting purposes
▪our customers negotiating, terminating, or failing to honour their drilling contracts with us
▪making our Senior Credit Facility financial covenants more difficult to maintain, and
▪negatively impacting our ability to maintain or increase our borrowing capacity, our ability to obtain additional capital to finance our business and our ability to achieve our debt reduction targets.
There is no assurance that demands for our services or conditions in the oil and natural gas and oilfield services sector will remain stable in the future. A significant decline in demand could have a material adverse effect on our business, financial condition, results of operations and cash flow.
Additionally, we have accounts receivable with customers in the oil and natural gas industry and their revenues may be affected by fluctuations in commodity prices. Our ability to collect receivables may be adversely affected by any prolonged weakness in oil and natural gas prices.
Intense price competition and the cyclical nature of the contract drilling industry could have an adverse effect on revenue and profitability
The contract drilling business is highly competitive with many industry participants. In an environment characterized by fierce competition, companies often face pressure to lower prices to secure contracts, potentially eroding profit margins. We compete for drilling contracts that are usually awarded based on competitive bids. We believe pricing, rig availability and technology are the primary factors potential customers consider when selecting a drilling contractor. We believe other factors are also important, such as the drilling capabilities and condition of drilling rigs, the quality of service and experience of rig crews, the safety record of the contractor, the offering of ancillary services, the ability to provide drilling equipment that is adaptable, having personnel familiar with new technologies and drilling techniques, and rig mobility and efficiency.
Historically, contract drilling has been cyclical with periods of low demand, excess rig supply and low day rates, followed by periods of high demand, short rig supply and increasing day rates. Periods of excess drilling rig supply intensify the competition and often result in rigs being idle. There are numerous drilling companies in the markets where we operate, and an oversupply of drilling rigs can cause greater price competition. Contract drilling companies compete primarily on a regional basis, and the intensity of competition can vary significantly from region to region at any particular time. However, if demand for contract drilling and drilling services is better in a region where we operate, our competitors might respond by moving suitable drilling rigs in from other regions with lower demand, reactivating previously stacked rigs or purchasing new drilling rigs. An influx of drilling rigs into a market from any source could rapidly intensify competition and make any improvement in the demand for our drilling rigs short-lived, which could in turn have a material adverse effect on our business, financial condition, results of operations and cash flow. In addition, the development of new drilling technology by competitors has increased in recent years, which could negatively affect our ability to differentiate our services.
Our business results and the strength of our financial position are affected by our ability to strategically manage our costs and capital expenditure program in a manner consistent with industry cycles and fluctuations in the demand for contract drilling services. If we do not effectively manage our costs and capital expenditures or respond to market signals relating to the supply or demand for contract drilling and oilfield services, it could have a material adverse effect on our business, financial condition, results of operations and cash flow.
26 Management's Discussion and Analysis
Lower activity in the contract drilling industry exposes us to the risk of oversupply of equipment
Periods of low demand often lead to low utilization. The number of drilling rigs competing for work in markets where we operate has remained the same as the industry has seen a decrease in drilling activity relative to periods prior to 2015. The industry supply of drilling rigs may exceed actual demand because of the relatively long-life span of oilfield services equipment as well as the typically long time from when a decision is made to upgrade or build new equipment to when the equipment is built and placed into service. Excess supply resulting from industry decline could lead to lower demand for term drilling contracts and for our equipment and services. The additional supply of drilling rigs allows competitors to potentially reallocate rigs to higher demand areas and has intensified price competition in the past and could continue to do so. This could lead to lower day rates in the oilfield services industry generally and lower utilization of existing rigs. If any of these factors materialize, it could have a material adverse effect on our business, financial condition, results of operations and cash flow.
Pipeline constraints and other regulatory uncertainty in western Canada could have an adverse effect on the demand for our services in Canada
In western Canada, delays and/or the inability to obtain necessary regulatory approvals for pipeline projects that would provide additional transportation capacity and access to refinery capacity for our customers has led to downward price pressure on oil and natural gas produced in western Canada, which has depressed, and may continue to depress, the overall exploration and production activity of our customers. Construction is progressing on the Trans Mountain pipeline in western Canada and may be in service in the first half of 2024. Canada generally has also lagged behind other natural gas producing countries in taking advantage of rising global demand and prices for natural gas primarily as a result of Canada’s lack of liquified natural gas facilities and, by extension, export capacity owing to regulatory delay and uncertainty. The Coastal Gas Link pipeline, which will transport natural gas to Kitimat, British Columbia, has been completed; however, the LNG Canada liquefaction facility and export terminal at Kitimat remains under construction, with first exports expected in 2025. Other proposed LNG facilities in Canada are at earlier stages of development, including Woodfibre LNG and Ksi Lisims LNG (completions currently anticipated between 2027 and 2028). There is no assurance that LNG projects in Canada will be completed on their expected timelines, or at all.
The regulatory uncertainty in Canada has impacted some of our customers’ ability to obtain financing as well as their ability to market their oil and natural gas, which has also depressed overall exploration and production activity. These factors could result in a corresponding decline in the demand for our services that could have a material adverse effect on our business, financial condition, results of operations and cash flow.
Any difficulty in retaining, replacing, or adding personnel could adversely affect our business
Our ability to provide reliable services depends on the availability of well-trained, experienced crews to operate our field equipment. We must also balance our need to maintain a skilled workforce with cost structures that fluctuate with activity levels. We retain the most experienced employees during periods of low utilization by having them fill lower-level positions on field crews. Many of our businesses experience manpower shortages in peak operating periods, and we may experience more severe shortages if the industry adds more rigs, oilfield services companies expand, and new companies enter the business.
We may not be able to find enough skilled labour to meet our needs, and this could limit growth. We may also have difficulty finding enough skilled and unskilled labour in the future if demand for our services increases. Shortages of qualified personnel have occurred in the past during periods of high demand. The demand for qualified rig personnel generally increases with stronger demand for land drilling services and as new and refurbished rigs are brought into service. Increased demand typically leads to higher wages that may or may not be reflected in any increases in service rates.
Other factors can also affect our ability to find enough workers to meet our needs. Our business requires skilled workers who can perform physically demanding work. Volatility in oil and natural gas activity and the demanding nature of the work, however, may prompt workers to pursue other kinds of jobs that offer a more desirable work environment and wages competitive to ours. Our success depends on our ability to continue to employ and retain skilled technical personnel and qualified rig personnel. If we are unable to, it could have a material adverse effect on our business, financial condition, results of operations and cash flow.
Internationally, our operations rely on expat crews working in the host country where we operate. Any restriction, delays or embargo on issuance or renewal of work visas by host governments, or regulatory changes, can have a material impact on our ability to conduct operations.
Risks and uncertainties associated with our international operations can negatively affect our business
We conduct some of our business in the Middle East. We may decide to establish operations in other international regions, including countries where the political and economic systems may be less stable than in Canada or the United States.
Our international operations are subject to risks normally associated with conducting business in foreign countries, including, but not limited to, the following:
▪an uncertain political and economic environment
▪the loss of revenue, property and equipment as a result of expropriation, confiscation, nationalization, contract deprivation and force majeure
▪war, terrorist acts or threats, civil insurrection and geopolitical and other political risks
Precision Drilling Corporation 2023 Annual Report 27
▪fluctuations in foreign currency and exchange controls
▪restrictions on the repatriation of income or capital
▪increases in duties, taxes and governmental royalties
▪renegotiation of contracts with governmental entities
▪changes in laws and policies governing operations of companies
▪compliance and regulatory challenges, including compliance with anti-corruption and anti-bribery legislation in Canada, the U.S. and other countries
▪trade restrictions or embargoes imposed by the U.S. or other countries
▪increasing global scrutiny on environmental practices and the evolving landscape of climate change regulations; and
▪differences in cultural norms and social expectations
If there is a dispute relating to our international operations, we may be subject to the exclusive jurisdiction of foreign courts. In addition, we may not be able to file suits against foreign persons or subject them to the jurisdiction of a court in Canada or the U.S. or be able to enforce judgement or arbitrated awards against state-owned customers.
Government-owned petroleum companies located in some of the countries where we operate now or in the future may have policies, or may be subject to governmental policies, that give preference to the purchase of goods and services from companies that are majority-owned by local nationals. As such, we may rely on joint ventures, license arrangements and other business combinations with local nationals in these countries, which may expose us to certain counterparty risks, including the failure of local nationals to meet contractual obligations or comply with local or international laws that apply to us.
In the international markets where we operate, we are subject to various laws and regulations that govern the operation and taxation of our businesses and the import and export of our equipment from country to country. There may be uncertainty about how these laws and regulations are imposed, applied or interpreted, and they could be subject to change. Since we derive a portion of our revenues from subsidiaries outside of Canada and the U.S., the subsidiaries paying dividends or making other cash payments or advances may be restricted from transferring funds in or out of the respective countries, or face exchange controls or taxes on any payments or advances. We have organized our foreign operations partly based on certain assumptions about various tax laws (including capital gains and withholding taxes), foreign currency exchange, and capital repatriation laws and other relevant laws of a variety of foreign jurisdictions. We believe these assumptions are reasonable; however, there is no assurance that foreign taxing or other authorities will reach the same conclusion. If these foreign jurisdictions change or modify the laws, we could suffer adverse tax and financial consequences.
Diverse regulatory frameworks across countries pose challenges in compliance, with variations in environmental standards, safety regulations, and permitting processes. Adapting to different regulatory environments may result in increased compliance costs, potential legal issues, and delays in project execution.
We are subject to compliance with the United States Foreign Corrupt Practices Act (FCPA) and the Corruption of Foreign Public Official Act (Canada) (CFPOA), which generally prohibit companies from making improper payments to foreign government officials for the purpose of obtaining business. While we have developed policies and procedures designed to achieve compliance with the FCPA, CFPOA and other applicable international laws, we could be exposed to potential civil and criminal claims, economic sanctions or other restrictions for alleged or actual violations of international laws related to our international operations, including anti-corruption and anti-bribery legislation, trade laws and trade sanctions. The Canadian government, the U.S. Department of Justice, the Securities and Exchange Commission (SEC), the U.S. Office of Foreign Assets Control and similar agencies have a broad range of civil and criminal penalties they may seek to impose against corporations and individuals for such violations, including injunctive relief, disgorgement, fines, penalties and modifications to business practices and compliance programs, among other things. We could also face fines, sanctions and other penalties from authorities in other the relevant foreign jurisdictions, including prohibition of our participating in or curtailment of business operations in those jurisdictions and the seizure of drilling rigs or other assets. While we cannot accurately predict the impact of any of these factors, if any of those risks materialize, it could have a material adverse effect on our reputation, business, financial condition, results of operations and cash flow.
Differences in cultural norms and social expectations can influence community relations, workforce dynamics, and stakeholder engagement. Failure to understand and navigate these aspects may lead to reputational damage, community opposition, or challenges in attracting and retaining skilled personnel.
We require sufficient cash flows to service and repay our debt
We will need sufficient cash flows in the future to service and repay our debt. Our ability to generate cash in the future is affected to some extent by general economic, geopolitical, financial, competitive and other factors that may be beyond our control. If we need to borrow funds in the future to service our debt, our ability will depend on covenants in our Senior Credit Facility and in our unsecured senior notes indentures and other debt agreements we may have in the future, and on our credit ratings. We may not be able to access sufficient amounts under the Senior Credit Facility or from the capital markets in the future to pay our obligations as they mature, or to fund other liquidity requirements. If we are not able to generate enough cash flow from operations or borrow a sufficient amount to service and repay our debt, we will need to refinance our debt or we will be in default, and we could be forced to reduce or delay investments and capital expenditures or dispose of material assets or issue equity. We may not be able to refinance or arrange alternative measures on favourable terms or at all. If we are unable to service, repay or refinance our debt, it could have a negative impact on our business, financial condition, results of operations and cash flow.
28 Management's Discussion and Analysis
Repaying our debt depends on our ability to generate cash flow and our guarantor subsidiaries generating cash flow and making it available to us by dividend, debt repayment or otherwise. Our guarantor subsidiaries may not be able to, or may not be permitted to, make distributions to allow us to make payments on our debt. Each guarantor subsidiary is a distinct legal entity, and, under certain circumstances, legal and contractual restrictions may limit our ability to obtain cash from the subsidiaries. While the agreements governing certain existing debt limits the ability of our subsidiaries to incur consensual restrictions on their ability to pay dividends or make other intercompany payments to us, these limitations are subject to qualifications and exceptions.
A substantial portion of our operations are carried out through subsidiaries, and some of them are not guarantors of our debt. The assets of the non-guarantor subsidiaries represent approximately 17% of Precision’s consolidated assets. These subsidiaries do not have any obligation to pay amounts due on the debt or to make funds available for that purpose.
If we do not receive funds from our guarantor subsidiaries, we may be unable to make the required principal and interest payments, which could have a material adverse effect on our business, financial condition, results of operations and cash flow.
Customers’ inability to obtain credit/financing could lead to lower demand for our services
Many of our customers require reasonable access to credit facilities and debt capital markets to finance their oil and natural gas drilling activity. If the availability of credit to our customers is reduced or the terms of such credit become less favourable to them, they may reduce their drilling and production expenditures, thereby decreasing demand for our products and services. Higher interest rates resulting from actions by central banks in response to inflation may reduce the amount of borrowing by our customers, which would decrease demand for our services. Additionally, certain investors and lenders may discourage investments or lending into the hydrocarbon industry. To the extent that certain institutions implement policies that discourage investments or lending into the hydrocarbon industry, it could have an adverse effect on the cost and terms of capital or availability of capital for our customers, which may result in reduced spending by our customers. A reduction in spending by our customers could have a material adverse effect on our business, financial condition, results of operations and cash flow as described further under – “Our operations depend on the price of oil and natural gas, which have been subject to increased volatility in recent years, and on the exploration and development activities of oil and natural gas exploration and production companies” on page 25.
Our debt facilities contain restrictive covenants
Our Senior Credit Facility, Real Estate Credit Facilities and the Senior Notes Indentures contain a number of covenants which, among other things, restrict us and some of our subsidiaries from conducting certain activities (see Capital Structure – Material Debt – Unsecured Senior Notes on page 22). In the event our Consolidated Interest Coverage Ratio (as defined in our two Senior Note Indentures) is less than 2.0:1 for the most recent four consecutive fiscal quarters, the Senior Note Indentures restrict our ability to incur additional indebtedness. As of December 31, 2023, our Consolidated Interest Coverage Ratio, as calculated per our Senior Note Indentures, was 7.5.
In addition, we must satisfy and maintain certain financial ratio tests under the Senior Credit Facility and Real Estate Credit Facilities (see Capital Structure – Material Debt on page 21). Events beyond our control could affect our ability to meet these tests in the future. If we breach any covenants, it could result in a default under the Senior Credit Facility and Real Estate Credit Facilities or any of the Senior Note Indentures. If there is a default under our Senior Credit Facility, the applicable lenders could decide to declare all amounts outstanding under the Senior Credit Facility, Real Estate Credit Facilities or any of the Senior Note Indentures to be due and payable immediately and terminate any commitments to extend further credit under the Senior Credit Facility. If there is an acceleration by the lenders and the accelerated amounts exceed a specific threshold, the applicable noteholders could decide to declare all amounts outstanding under any of the Senior Note Indentures to be due and payable immediately.
At December 31, 2023, we were in compliance with the covenants of our Senior Credit Facility and Real Estate Credit Facilities.
New technology could reduce demand for certain rigs or put us at a competitive disadvantage
Complex drilling programs for the exploration and development of conventional and unconventional oil and natural gas reserves demand high performance drilling rigs. The ability of drilling rig service providers to meet this demand depends on continuous improvement of existing rig technology, such as drive systems, control systems, automation, mud systems and top drives, to improve drilling efficiency. Our ability to deliver equipment and services that meet customer demand is essential to our continued success. We cannot guarantee that our rig technology will continue to meet the needs of our customers, especially as rigs age and technology advances, or that our competitors will not develop technological improvements that are more advantageous, timely, or cost effective. Failure to adopt or invest in emerging technologies could place the company at a competitive disadvantage, leading to a decline in market share and profitability. Additionally, new technologies, services or standards could render some of our services, drilling rigs or equipment obsolete, which could reduce our competitiveness and have a material adverse impact on our business, financial condition and results of operations.
Entering new lines of business or technical enhancements to our existing operating capabilities can be subject to risks, including a potential lack of acceptance by consumers and increased capital expenditures
Our AlphaTM technologies and EverGreenTM suite of environmental solutions use new technologies and are relatively new lines of business for us. Our ability to generate revenue from new business lines is uncertain and there can be no assurance that they
Precision Drilling Corporation 2023 Annual Report 29
will be able to generate significant revenue or be profitable. We may not realize benefits from investments into new business lines or technical enhancements for several years or may not realize benefits from such investments at all. Failure to realize the intended benefits from such investments could negatively affect our ability to attract new customers or expand our offerings to existing customers and may adversely affect our results from operations.
We are also introducing artificial intelligence and robotics into some of our offerings. The use of artificial intelligence and robotics on our rigs may not yield materially better results, higher outputs or increased productivity and there is no certainty that we will realize benefits from investments into these technologies. Failure to further adopt or invest in artificial intelligence and robotics could place us at a competitive disadvantage, leading to a decline in market share and profitability. Additionally, the use of artificial intelligence throughout our organization is subject to the risk that privacy and other concerns relating to such technology could deter current and potential customers.
The timing and amount of capital expenditures we incur, including those related to our AlphaTM technologies, EverGreenTM suite of environmental solutions and implementation of artificial intelligence and robotics technologies, will directly affect the amount of cash available to us. The cost of equipment generally escalates as a result of high input costs during periods of high demand for our drilling rigs and oilfield services equipment and other factors. There is no assurance that we will be able to recover higher capital costs through rate increases to our customers.
Public health crises, such as the COVID-19 pandemic, may impact our business
Local, regional, national or international public health crises, pandemics and epidemics, such as the COVID-19 pandemic, could have an adverse effect on local economies and potentially the global economy, which may adversely impact the price of and demand for oil and natural gas (and correspondingly, decrease the demand for our services, which could have a material adverse effect on our business, financial condition, results of operations and cash flows). Such public health crises, pandemics, epidemics and disease outbreaks are continuously evolving and the extent to which our business operations and financial results continue to be affected depends on various factors, such as the duration, severity and geographic resurgence of the virus; the impact and effectiveness of governmental action to reduce the spread and treat such outbreak, including government policies and restriction; vaccine hesitancy and voluntary or mandatory quarantines; and the global response surrounding any such uncertainty.
The economic climate resulting from the impact of public health crises, pandemics and epidemics and any corresponding emergency measures that may be implemented from time to time by various governments may have significant adverse impacts on Precision including, but not exclusively:
▪potential interruptions of our business or operations
▪material declines in revenue and cash flows, as our customers are concentrated in the oil and natural gas industry
▪future impairment charges to our property, plant and equipment and intangible assets
▪risk of non-payment of accounts receivable and customer defaults, and
▪additional restructuring charges as we align our structure and personnel to the dynamic environment.
Additionally, such public health crises, if uncontrolled, may result in temporary shortages of staff to the extent our workforce is impacted and may result in temporary interruptions to our business or operations, which may have an adverse effect on our financial condition, results of operations and cash flow.
Our and our customers’ operations are subject to numerous environmental laws, regulations and guidelines
In addition to expanded regulations and guidelines related specifically to climate change, we and our customers are subject to numerous environmental laws and regulations, including regulations relating to spills, releases and discharges of hazardous substances or other waste materials into the environment, requiring removal or remediation of pollutants or contaminants, and imposing civil and criminal penalties for violations. Some of these regulations apply directly to our operations and authorize the recovery of damages by the government, injunctive relief, and the imposition of stop, control, remediation and abandonment orders. For instance, our land drilling operations may be conducted in or near ecologically sensitive areas, such as wetlands that are subject to special protective measures, which may expose us to additional operating costs and liabilities for noncompliance with certain laws. Some environmental laws and regulations may impose strict and, in certain cases joint and several, liability. This means that in some situations we could be exposed to liability as a result of conduct that was lawful at the time it occurred, or conditions caused by prior operators or other third parties, including any liability related to offsite treatment or disposal facilities. The costs arising from compliance with these laws, regulations and guidelines may be material. The total costs of complying with environmental protection requirements is unknown, but we may experience increased insurance and compliance costs as further environmental laws and regulations are introduced.
We maintain liability insurance, including insurance for certain environmental claims, but coverage is limited and some of our policies exclude coverage for damages resulting from environmental contamination. We cannot assure that insurance will continue to be available to us on commercially reasonable terms, that the possible types of liabilities that we may incur will be covered by insurance, or that the dollar amount of the liabilities will not exceed our policy limits. Even a partially uninsured claim, if successful and of sufficient magnitude, could have a material adverse effect on our business, financial condition, results of operations and cash flow.
Governments in Canada and the U.S. may also consider more stringent regulations or restrictions of hydraulic fracturing, a technology used by most of our customers that involves the injection of water, sand and chemicals under pressure into rock
30 Management's Discussion and Analysis
formations to stimulate oil and natural gas production. Increasing regulatory restrictions could have a negative impact on the exploration of unconventional energy resources, which are only commercially viable with the use of hydraulic fracturing. Laws relating to hydraulic fracturing are in various stages of development at levels of governments in markets where we operate and the outcome of these developments and their effect on the regulatory landscape and the contract drilling industry is uncertain. Hydraulic fracturing laws or regulations that cause a decrease in the completion of new oil and natural gas wells and an associated decrease in demand for our services could have a material adverse effect on our business, financial condition, results of operations and cash flow.
Any regulatory changes that impose additional environmental restrictions or requirements on us, or our customers, could increase our operating costs and potentially lead to lower demand for our services and have an adverse effect. There can also be no guarantee that other laws and other government programs relating to the oil and natural gas industry and the transportation industry will not be changed in a manner that directly and adversely impacts the demand for oil and natural gas which could affect our business, nor can there be any assurances that the laws, regulations or rules governing our customers will not be changed in a manner that adversely affects our customers and, therefore, our business. The potential for increased regulation and oversight may make it more difficult or costly for us to operate.
Major projects that would benefit our customers, such as new pipelines and other facilities, including liquified natural gas export facilities in Canada, may be inhibited, delayed or stopped by a variety of factors, including inability to obtain regulatory or governmental approvals or public opposition.
Effects of climate change, including physical and regulatory impacts, could have a negative impact on our business
The views on climate change are evolving at a regional, national and international level. As a result, political and economic events may significantly affect the scope and timing of climate change measures and regulations that are ultimately put in place, which may challenge the oil and gas industry in a number of ways or result in changes to how companies in the industry operate or spend capital. Additionally, the risks of natural disasters that could impact our business may increase in the future as a result of climate change. Furthermore, consumer demand for alternative fuel sources may continue to rise and incentives to conserve energy may be developed. Our business may be adversely impacted as a result of climate change and its associated impacts, including, without limitation, our financial condition, results of operations, cash flow, reputation, access to capital, access to insurance, cost of borrowing, access to liquidity, and/or business plans.
Physical Impact
As discussed under “Business in our industry is seasonal and highly variable” on page 35, weather patterns in Canada and the northern U.S. affect activity in the oilfield services industry. Global climate change could impact the timing and length of the spring thaw and the period in which the muskeg freezes and thaws and could impact the severity of winter, which could have a material adverse effect on our business and operating results. Furthermore, extreme and evolving climate conditions could result in increased risks of, or more frequent, natural disasters such as flooding or forest fires and may result in delays or cancellation of some of our customer’s operations or could increase our operating costs (such as insurance costs), which could have a material adverse effect on our business and operating results. Extreme weather conditions could also impact the production and drilling of new wells. We cannot estimate the degree to which climate change and extreme climate conditions could impact our business and operating results; however, our insurance costs have increased, partially as a result of recent natural disasters.
Regulatory Impact
In response to climate change and increased focus on environmental protection, environmental laws, regulations and guidelines relating to the protection of the environment, including regulations and treaties concerning climate change or greenhouse gas and other emissions, continue to expand in scope. There has been an increasing focus on the reduction of greenhouse gas and other emissions and a potential shift to lower carbon intensive energy sources or a shift to a lower carbon economy. Laws, regulations or treaties concerning climate change or greenhouse gas and other emissions, including incentives to conserve energy or use alternate sources of energy, can have an adverse impact on the demand for oil and natural gas, which could have a material adverse effect on us. Such laws, regulations or treaties are evolving, and it is difficult to estimate with certainty the impact they will have on our business.
Canada and the U.S. are signatories to the Paris Agreement drafted at the United Nations Framework Convention on Climate Change (UNFCCC) in December 2015. The goals of the Paris Agreement are to prevent global temperature rise from exceeding 2 degrees Celsius above pre-industrial levels and to pursue efforts to limit the temperature increase to 1.5 degrees Celsius above pre-industrial levels. The Paris Agreement may provide for climate targets that could result in reduced demand for oil and natural gas in the United States. In Canada, in connection with its commitments under the Paris Agreement, the federal government developed the Pan-Canadian Framework on Clean Growth and Climate Change in 2016 (the PCF). The PCF requires all provinces and territories to have a carbon price of $30 per tonne in 2020 and rising by $10 per year to $50 per tonne in 2022. In December 2020, the Canadian Government announced proposed $15 per year increases to the carbon price commencing in 2023, to reach a total of $170 per tonne by 2050. Provinces and territories can implement either an explicit price-based system (such as the systems implemented in British Columbia and Alberta) or a cap-and-trade system. Saskatchewan remains the only Canadian jurisdiction that has not joined the national plan set out in the PCF. Saskatchewan released its own output-based performance standards approach, which is applied only to certain large industrial facilities. The proposed system in Saskatchewan only partially meets the PCF standards, therefore the federal carbon pollution pricing system will apply in
Precision Drilling Corporation 2023 Annual Report 31
Saskatchewan to sources not covered by Saskatchewan’s system. Certain Canadian provinces, including Alberta and Saskatchewan, had previously launched constitutional challenges related to the PCF; however, on March 25, 2021, the Supreme Court of Canada released its judgment confirming the constitutionality of Canada’s national carbon pricing regime. In November 2021, to conclude the 26th Conference of the Parties to the UNFCCC, nearly 200 countries including Canada signed the Glasgow Climate Pact, which reaffirms the commitments to limiting global temperature rise set out in the Paris Agreement. The Glasgow Climate Pact called for nations to submit new targets to the UNFCCC by the end of 2022 to align with the Paris Agreement’s goals, requests that nations take accelerated actions to reduce emissions by 2030 and asks nations to accelerate the development and adoption of policies to transition towards low-emission energy systems. It also includes the party nations’ agreement on rules under the Paris Agreement to create a global carbon credit market.
In August 2023 the Canadian Federal government published draft Clean Electricity Regulations, which are aimed at achieving net-zero emissions from Canada’s electricity grid by 2035. The regulations would implement measures to limit carbon emissions produced by electricity generated using fossil fuels, which may include natural gas. Certain provinces in Canada have indicated opposition to the Clean Electricity Regulations. If the regulations come into force in their current form, domestic demand for natural gas in Canada may decrease, which may have an adverse effect on the demand for our services.
As of the date hereof, it is not possible to predict the effect of the Paris Agreement, the Glasgow Climate Pact, Clean Electricity Regulations, and climate change-related legislation in Canada, the U.S. and globally on our business or whether additional climate-change legislation, regulations or other measures will be adopted at the federal, state, provincial or local levels in Canada, the U.S. or globally. While some of these regulations are in effect, others remain in various phases of review, discussion or implementation, leading to uncertainties regarding the timing and effects of these emerging regulations, making it difficult to accurately determine the cost impacts and effects on our operations. Further efforts by governments and non-governmental organizations to reduce greenhouse gas emissions appear likely, which, together with existing efforts, may reduce demand for oil and natural gas and potentially lead to lower demand for our services.
Transition Impact
In addition to the physical and regulatory effects of climate change on our business, an increasing focus on the reduction of greenhouse gas emissions and a potential shift to lower carbon intensive energy sources or a shift to a lower carbon economy may result in lower oil and natural gas prices and depress the overall level of oil and natural gas exploration and production activity, impacting the demand for our services from the oil and natural gas industry. Additionally, if our reputation is diminished as a result of the industry we operate in or services we provide, it could result in increased operating or regulatory costs, reduce access to capital, lower shareholder confidence or loss of public support for our business. It may also encourage exploration and production companies to diversify and limit drilling to find other more energy efficient/green generating energy alternatives.
Poor safety performance could lead to lower demand for our services
Standards for accident prevention in the oil and natural gas industry are governed by service company safety policies and procedures, accepted industry safety practices, customer-specific safety requirements, and health and safety legislation. Safety is a key factor that customers consider when selecting an oilfield services company. A decline in our safety performance could result in lower demand for services, which could have a material adverse effect on our business, financial condition, results of operations and cash flow. A public safety performance issue could also result in reputational damage to us or increased costs of operating and insuring assets.
We are subject to various health and safety laws, rules, legislation and guidelines which can impose material liability, increase our costs or lead to lower demand for our services.
Our business is subject to cybersecurity risks
We rely heavily on information technology systems and other digital systems for operating our business. Threats to information technology systems associated with cybersecurity risks and cyber incidents or attacks continue to grow and are increased by the growing complexity of our information technology systems. Cybersecurity attacks could include, but are not limited to, malicious software, attempts to gain unauthorized access to data and the unauthorized release, corruption or loss of data and personal information, account takeovers, and other electronic security breaches that could lead to disruptions in our critical systems. Other cyber incidents may occur as a result of natural disasters, telecommunication failure, utility outages, human error, design defects, and unexpected complications with technology upgrades. Risks associated with these attacks and other incidents include, among other things, loss of intellectual property, reputational harm, leaked information, improper use of our assets, disruption of our and our customers’ business operations and safety procedures, loss or damage to our data delivery systems, unauthorized disclosure of personal information which could result in administrative penalties and increased costs to prevent, respond to or mitigate cybersecurity events. Our increased use of technology, artificial intelligence and robotics in our service offerings could increase the potential impact that a cybersecurity incident or attack could have on our operations. Although we use various procedures and controls to mitigate our exposure to such risk, including cybersecurity risk assessments that are reviewed by our CGNRC, cybersecurity awareness programs for our employees, continuous monitoring of our information technology systems for threats, and insurance that may cover losses incurred as a result of certain cybersecurity attacks or incidents, cybersecurity attacks and other incidents are evolving and unpredictable. The occurrence of such an attack or incident could go unnoticed for a period of time. Any such attack or incident could have a material adverse effect on our business, financial condition, results of operations and cash flow.
32 Management's Discussion and Analysis
Relying on third-party suppliers has risks and shortages in supply of equipment could adversely impact our business
We source certain key rig components, raw materials, equipment and component parts from a variety of suppliers in Canada, the U.S. and internationally. We also outsource some or all construction services for drilling and service rigs, including new-build rigs, as part of our capital expenditure programs. We maintain relationships with several key suppliers and contractors and an inventory of key components, materials, equipment and parts. We also place advance orders for components that have long lead times. We may, however, experience cost increases, delays in delivery due to strong activity or financial hardship of suppliers or contractors, or other unforeseen circumstances relating to third parties. Increased inflation may also result in cost increases for the key components, materials, equipment and parts we use in our business. In times of increased demand for drilling services, there may be shortages of components, materials, equipment, parts and services required for our business. If our current or alternate suppliers are unable to deliver the necessary components, materials, equipment, parts and services we require for our businesses, including the construction of new-build drilling rigs, it can delay service to our customers and have a material adverse effect on our business, financial condition, results of operations and cash flow.
Additionally, new laws in respect of forced labour and other human rights issues throughout the supply chain may result in increased compliance costs for us or a potential need to make changes to our supply chain.
Our business could be negatively affected as a result of actions of activist shareholders and some institutional investors may be discouraged from investing in the industry in which we operate in
Activist shareholders could advocate for changes to our corporate governance, operational practices and strategic direction, which could have an adverse effect on our reputation, business and future operations. In recent years, publicly traded companies have been increasingly subject to demands from activist shareholders advocating for changes to corporate governance practices, such as executive compensation practices, social issues, or for certain corporate actions or reorganizations. There can be no assurances that activist shareholders will not publicly advocate for us to make certain corporate governance changes or engage in certain corporate actions. Responding to challenges from activist shareholders, such as proxy contests, media campaigns or other activities, could be costly and time consuming and could have an adverse effect on our reputation and divert the attention and resources of management and our Board, which could have an adverse effect on our business and operational results. Additionally, shareholder activism could create uncertainty about future strategic direction, resulting in loss of future business opportunities, which could adversely affect our business, future operations, profitability and our ability to attract and retain qualified personnel.
In addition to risks associated with activist shareholders, some institutional investors are placing an increased emphasis on ESG factors when allocating their capital. These investors may be seeking enhanced ESG disclosures or may implement policies that discourage investment in the hydrocarbon industry. To the extent that certain institutions implement policies that discourage investments in our industry, it could have an adverse effect on our financing costs and term and access to liquidity and capital. Additionally, if our reputation is diminished as a result of the industry we operate in or service, it could result in increased operation or regulatory costs, lower shareholder confidence or loss of public support for our business.
The loss of one or more of our larger customers or consolidation among our customers could have a material adverse effect on our business and our current backlog of contract drilling revenue may decline
In 2023, approximately 40% of our revenue was received from our ten largest drilling customers and approximately 16% of our revenue was received from our three largest drilling customers. The loss of one or more of our larger customers could have a material adverse effect on our business, financial condition, results of operations and cash flow. In addition, financial difficulties experienced by customers could adversely impact their demand for our services and cause them to request amendments to our contracts with them.
Our fixed-term drilling contracts generally provide our customers with the ability to terminate the contracts at their election, with an early termination payment to us if the contract is terminated before the expiration of the fixed term. During depressed market conditions or otherwise, customers may be unable to satisfy their contractual obligations or may seek to terminate or renegotiate or otherwise fail to honor their contractual obligations. In addition, we may not be able to perform under these contracts due to events beyond our control, and our customers may seek to terminate or renegotiate our contracts for various reasons, without paying an early termination payment. As a result, we may not realize all of our contract drilling backlog. In addition, the termination or renegotiation of fixed-term contracts without receiving early termination payments could have a material adverse effect on our business, financial condition, results of operations and cash flows. Our contract drilling backlog may decline, as fixed-term drilling contract coverage over time may not be offset by new or renegotiated contracts or may be reduced by price adjustments to existing contracts, including as a result of the decline in the price of oil and natural gas, capital spending reductions by our customers or other factors.
Further, consolidation among oil and natural gas exploration and production companies may reduce the number of available customers. As exploration and production entities merge, they often seek operational synergies and cost efficiencies. This can lead to a reduction in the number of drilling services required. Also, integrated entities may opt for in-house drilling capabilities or favor established contracts with other service providers. This may result in increased competition for available contracts or contractual termination, potentially impacting pricing dynamics and profitability.
Precision Drilling Corporation 2023 Annual Report 33
Our operations are subject to foreign exchange risk
Our U.S. and international operations have revenue, expenses, assets and liabilities denominated in currencies other than the Canadian dollar and are mostly in U.S. dollars and currencies that are pegged to the U.S. dollar. This means that currency exchange rates can affect our income statement, balance sheet and statement of cash flow.
Translation into Canadian Dollars
When preparing our consolidated financial statements, we translate the financial statements for foreign operations that do not have a Canadian dollar functional currency into Canadian dollars. We translate assets and liabilities at exchange rates in effect at the period end date. We translate revenues and expenses using average exchange rates for the month of the transaction. We initially recognize gains or losses from these translation adjustments in other comprehensive income and reclassify them from equity to net earnings on disposal or partial disposal of the foreign operation. Changes in currency exchange rates could materially increase or decrease our foreign currency-denominated net assets, which would increase or decrease shareholders’ equity. Changes in currency exchange rates will affect the amount of revenues and expenses we record for our U.S. and international operations, which will increase or decrease our net earnings. If the Canadian dollar strengthens against the U.S. dollar, the net earnings we record in Canadian dollars from our U.S. and international operations will be lower.
Transaction exposure
We have long-term debt denominated in U.S. dollars. We have designated our U.S. dollar denominated unsecured senior notes as a hedge against the net asset position of our U.S. and foreign operations. This debt is converted at the exchange rate in effect at the period end dates with the resulting gains or losses included in the statement of comprehensive income. If the Canadian dollar strengthens against the U.S. dollar, we will incur a foreign exchange gain from the translation of this debt. Similarly, if the Canadian dollar weakens against the U.S. dollar, we will incur a foreign exchange loss from the translation of this debt. The vast majority of our international operations are transacted in U.S. dollars or U.S. dollar-pegged currencies. Transactions for our Canadian operations are primarily transacted in Canadian dollars. We occasionally purchase goods and supplies in U.S. dollars for our Canadian operations, and we maintain U.S. dollar cash in our Canadian operations.
We may be unable to access additional financing
We may need to obtain additional debt or equity financing in the future to support ongoing operations, undertake capital expenditures, repay existing or future debt including the Senior Credit Facility and the Senior Note Indentures, or pursue acquisitions or other business combination transactions. Volatility or uncertainty in the credit markets and inflationary pressure may increase costs associated with issuing debt or equity, and there is no assurance that we will be able to access additional financing when we need it, or on terms we find acceptable or favourable. Such volatility and uncertainty may be adversely impacted by potential negative perception of investing in the hydrocarbon industry. If we are unable to obtain financing to support ongoing operations or to fund capital expenditures, acquisitions, debt repayments, or other business combination transactions, it could limit growth and may have a material adverse effect on our business, financial condition, results of operations, and cash flow. See also “Our business could be negatively affected as a result of actions of activist shareholders and some institutional investors may be discouraged from investing in the industry we operate in.”
Increasing interest rates may increase our cost of borrowing
Increases to the Canadian or United States benchmark interest rates may have an impact on our cost of borrowing under our Senior Credit Facility, Real Estate Credit Facilities and any debt financing we may negotiate. Actions by central banks to increase benchmark interest rates in reaction to inflation may increase our cost of borrowing and make the terms of borrowing less favourable to us.
Risks associated with turnkey drilling operations could adversely affect our business
We earn some of our revenue from turnkey drilling contracts. We expect that turnkey drilling will continue to be part of our service offering; however, turnkey contracts pose substantially more risk than wells drilled on a daywork basis. Under a typical turnkey drilling contract, we agree to drill a well for a customer to a specified depth and under specified conditions for a fixed price. We typically provide technical expertise and engineering services, as well as most of the equipment required for the drilling of turnkey wells and use subcontractors for related services. We typically do not receive progress payments and are entitled to payment by the customer only after we have met the full terms of the drilling contract. We sometimes encounter difficulties on wells and incur unanticipated costs, and not all the costs are covered by insurance. As a result, under turnkey contracts, we assume most of the risks associated with drilling operations that are generally assumed by customers under a daywork contract. Operating cost overruns or operational difficulties and higher contractual liabilities on turnkey jobs could have a material adverse effect on our business, financial condition, results of operations and cash flow.
Mergers and acquisitions entail numerous risks and may disrupt our business or distract management
We consider and evaluate mergers and acquisitions of, or significant investments in, complementary businesses and assets as part of our business strategy. Mergers and acquisitions involve numerous risks, including unanticipated costs and liabilities, difficulty in integrating the operations and assets of the merged or acquired business, the ability to properly access and maintain an effective internal control environment over a merged or acquired company to comply with public reporting requirements, potential loss of key employees and customers of the merged or acquired companies, and an increase in our expenses and
34 Management's Discussion and Analysis
working capital requirements. Any merger or acquisition could have a material adverse effect on our business, financial condition, results of operations and cash flow.
We may incur substantial debt to finance future mergers and acquisitions and also may issue equity securities or convertible securities for mergers and acquisitions. Debt service requirements could be a burden on our results of operations and financial condition. We would also be required to meet certain conditions to borrow money to fund future mergers and acquisitions. Mergers and acquisitions could also divert the attention of management and other employees from our day-to-day operations and the development of new business opportunities. Even if we are successful in integrating future mergers and acquisitions into our operations, we may not derive the benefits such as operational, financial, or administrative synergies we expect from mergers and acquisitions, which may result in us committing capital resources and not receiving the expected returns. Additionally, failing to pursue appropriate mergers when opportune may also pose a risk to our competitive positioning and growth potential. We may not be able to continue to identify attractive acquisition opportunities or successfully acquire identified targets.
Our operations face risks of interruption and casualty losses
Our operations face many hazards inherent in the drilling and well servicing industries, including blowouts, cratering, explosions, fires, loss of well control, loss of hole, reservoir damage, loss of directional control, damaged or lost equipment, and damage or loss from inclement weather or natural disasters. Any of these hazards could result in personal injury or death, damage to or destruction of equipment and facilities, suspension of operations, environmental damage, damage to the property of others, and damage to producing or potentially productive oil and natural gas formations that we drill through, which could have a material adverse effect on our business, financial condition, results of operations and cash flow. Additionally, unexpected events such as unplanned power outages, natural disasters, supply disruptions, pandemic illness or other unforeseeable circumstances could have a material adverse effect on our business, financial condition, results of operations and cash flow.
Our worldwide operations could be disrupted by terrorism, acts of war, political sanctions, earthquakes, telecommunications failures, power or water shortages, tsunamis, floods, hurricanes, typhoons, fires, extreme weather conditions (whether as a result of climate change or otherwise), medical epidemics or pandemics and other natural or manmade disasters or catastrophic events, for some of which may be self-insured. The occurrence of any of these business disruptions could result in difficulties in transporting our crews, hiring or managing personnel as well as other significant losses, that may adversely affect our business, financial conditions, results of operations and cash flow, and require substantial expenditures and recovery time in order to fully resume operations.
Generally, drilling and service rig contracts separate the responsibilities of a drilling or service rig company and the customer. We try to obtain indemnification from our customers by contract for some of these risks even though we also have insurance coverage to protect us. We cannot assure, however, that any insurance or indemnification agreements will adequately protect us against liability from all the consequences described above. If there is an event that is not fully insured or indemnified against, or a customer or insurer does not meet its indemnification or insurance obligations, it could result in substantial losses. In addition, we may not be able to get insurance to cover any or all these risks, or the coverage may not be adequate. Insurance premiums or other costs may rise significantly in the future, making the insurance prohibitively expensive or uneconomic. Significant events, including terrorist attacks in the U.S., wildfires, flooding, severe hurricane damage and well blowout damage in the U.S. Gulf Coast region, have resulted in significantly higher insurance costs, deductibles and coverage restrictions. When we renew our insurance, we may decide to self-insure at higher levels and assume increased risk to reduce costs associated with higher insurance premiums.
Business in our industry is seasonal and highly variable
Seasonal weather patterns in Canada and the northern U.S. affect activity in the oilfield services industry. During the spring months, wet weather and the spring thaw make the ground unstable, so municipalities and counties and provincial and state transportation departments enforce road bans that restrict the movement of rigs and other heavy equipment. This reduces activity and highlights the importance of the location of our equipment prior to the imposition of the road bans. The timing and length of road bans depend on weather conditions leading to the spring thaw and during the thawing period.
Additionally, certain oil and natural gas producing areas are located in parts of western Canada that are only accessible during the winter months because the ground surrounding or containing the drilling sites in these areas consists of terrain known as muskeg. Rigs and other necessary equipment cannot cross this terrain to reach the drilling site until the muskeg freezes. Moreover, once the rigs and other equipment have been moved to a drilling site, they may become stranded or be unable to move to another site if the muskeg thaws unexpectedly. Our business activity depends, at least in part, on the severity and duration of the winter season.
Litigation and legal claims could have an adverse impact on our business
We may be subject to legal proceedings and governmental investigations from time to time related to our business and operations. Lawsuits or claims against us could have a material adverse effect on our business, financial condition, results of operations and cash flow. While we maintain insurance that may cover the cost of certain litigation or have indemnity provisions in our favor, we cannot assure that any insurance or indemnification agreement will cover the cost of theses liabilities, thus litigation or claims could negatively impact our business, reputation, financial condition and cash flow.
Precision Drilling Corporation 2023 Annual Report 35
Certain of our offerings use proprietary technology and equipment which can involve potential infringement of a third party’s rights or a third party’s infringement of our rights, including rights to intellectual property. From time to time, we or our customers may become involved in disputes over infringement of intellectual property rights relating to equipment or technology owned or used by us. As a result, we may lose access to important equipment or technology, be required to cease use of some equipment or technology, be forced to modify our drilling rigs or technology, or be required to pay license fees or royalties for the use of equipment or technology. In addition, we may lose a competitive advantage in the event we are unsuccessful in enforcing our rights against third parties, or third parties are successful in enforcing their rights against us. As a result, any technology disputes involving us or our customers or supplying vendors could have a material adverse impact on our business, financial condition and results of operations.
Unionization efforts and labor regulations could materially increase our costs or limit our flexibility
Efforts may be made from time to time to unionize portions of our workforce. We may be subject to strikes or work stoppages and other labor disruptions in connection with unionization efforts or renegotiation of existing contracts with unions. Unionization efforts, if successful, new collective bargaining agreements or work stoppages could materially increase our labor costs, reduce our revenues and adversely impact our operations and cash flow.
There are risks associated with increased capital expenditures
The timing and amount of capital expenditures we incur, including those related to our AlphaTM technologies and EverGreenTM suite of environmental solutions, will directly affect the amount of cash available. The cost of equipment generally escalates as a result of high input costs during periods of high demand for our drilling rigs and oilfield services equipment and other factors. There is no assurance that we will be able to recover higher capital costs through rate increases to our customers.
A successful challenge by the tax authorities of expense deductions could negatively affect the value of our common shares
Taxation authorities may not agree with the classification of expenses we or our subsidiaries have claimed, or they may challenge the amount of interest expense deducted. If the taxation authorities successfully challenge our classifications or deductions, it could have a material adverse effect on our business financial condition, results of operations and cash flow.
Losing key management could reduce our competitiveness and prospects for future success
Our future success and growth depend partly on the expertise and experience of our key management. There is no assurance that we will be able to retain key management. Losing these individuals could have a material adverse effect on our business, financial condition, results of operations and cash flow.
Our assessment of capital assets for impairment may result in a non-cash charge against our consolidated net income
We are required to assess our capital asset balance for impairment when certain internal and external factors indicate the need for further analysis. When assessing impairment triggers and calculating impairment it is based on management’s estimates and assumptions. We may consider several factors, including any declines in our share price and market capitalization, lower future cash flow and earnings estimates, significantly reduced or depressed markets in our industry, and general economic conditions, among other things. Any impairment write-down to capital assets would result in a non-cash charge against net earnings, which could be material.
Our credit ratings may change
Credit ratings affect our financing costs, liquidity and operations over the long term and are intended as an independent measure of the credit quality of long-term debt. Credit ratings affect our ability to obtain short and long-term financing and the cost of this financing, and our ability to engage in certain business activities cost-effectively.
If a rating agency downgrades our current corporate credit rating or rating of debt, or changes our credit outlook to negative, it could have an adverse effect on our financing costs and access to liquidity and capital.
The price of our common shares can fluctuate
Several factors can cause volatility in our share price, including increases or decreases in revenue or earnings, changes in revenue or earnings estimates by the investment community, failure to meet analysts’ expectations, changes in credit ratings, and speculation in the media or investment community about our financial condition or results of operations. General market conditions, the perception of the industry we operate in and service and Canadian, U.S. or international economic and social factors and political events unrelated to our performance may also affect the price of our shares. Investors should therefore not rely on past performance of our shares to predict the future performance of our shares or financial results. At times when our share price is relatively low, we may be subject to takeover attempts by certain companies or institutions acting opportunistically.
While there is currently an active trading market for our shares in the United States and Canada, we cannot guarantee that an active trading market will be sustained in either country. There could cease to be an active trading market due to, among other factors, minimum listing requirements of stock exchanges. If an active trading market in our shares is not sustained, the trading liquidity of our shares will be limited and the market value of our shares may be reduced.
36 Management's Discussion and Analysis
Selling additional shares could affect share value
While we have a normal course issuer bid in place under which we may acquire our own shares, in the future, we may issue additional shares to fund our needs or those of other entities owned directly or indirectly by us, as authorized by the Board. We do not need shareholder approval to issue additional shares, except as may be required by applicable stock exchange rules, and shareholders do not have any pre-emptive rights related to share issues (see Capital Structure on page 21).
As a foreign private issuer in the U.S., we may file less information with the SEC than a company incorporated in the U.S.
As a foreign private issuer, we are exempt from certain rules under the United States Exchange Act of 1934 (the Exchange Act) that impose disclosure requirements, as well as procedural requirements, for proxy solicitations under Section 14 of the Exchange Act. Our directors, officers and principal shareholders are also exempt from the reporting and short-swing profit recovery provisions of Section 16 of the Exchange Act. We are not required to file periodic reports and financial statements with the SEC as frequently or as promptly as U.S. companies whose securities are registered under the Exchange Act, nor are we generally required to comply with Regulation FD, which restricts the selective disclosure of material non-public information. As a result, there may be less publicly available information about us than U.S. public companies and this information may not be provided as promptly. In addition, we are permitted, under a multi-jurisdictional disclosure system adopted by the U.S. and Canada, to prepare our disclosure documents in accordance with Canadian disclosure requirements, including preparing our financial statements in accordance with International Financial Reporting Standards (IFRS), which differs in some respects from U.S. GAAP. We are required to assess our foreign private issuer status under U.S. securities laws annually at the end of the second quarter. If we were to lose our status as a foreign private issuer under U.S. securities laws, we would be required to comply with U.S. securities and accounting requirements.
We have retained liabilities from prior reorganizations
We have retained all liabilities of our predecessor companies, including liabilities relating to corporate and income tax matters.
We may become a passive foreign investment company, which could result in adverse U.S. tax consequences to U.S. investors
Management does not believe we are or will be treated as a passive foreign investment company (PFIC) for U.S. tax purposes. However, because PFIC status is determined annually and will depend on the composition of our income and assets from time to time, it is possible that we could be considered a PFIC in the future. This could result in adverse U.S. tax consequences for a U.S. investor. In particular, a U.S. investor would be subject to U.S. federal income tax at ordinary income rates, plus a possible interest charge, for any gain derived from a disposition of common shares, as well as certain distributions by us. In addition, a step-up in the tax basis of our common shares would not be available if an individual holder dies.
An investor who acquires 10% or more of our common shares may be subject to taxation under the controlled foreign corporation (CFC) rules.
Under certain circumstances, a U.S. person who directly or indirectly owns 10% or more of the voting power of a foreign corporation that is a CFC (generally, a foreign corporation where 10% or more U.S. shareholders own more than 50% of the voting power or value of the stock of the foreign corporation) for 30 straight days or more during a taxable year and who holds any shares of the foreign corporation on the last day of the corporation’s tax year must include in gross income for U.S. federal income tax purposes its pro rata share of certain income of the CFC even if the income is not distributed to the person. We are not currently a CFC, but this could change in the future.
Precision Drilling Corporation 2023 Annual Report 37
| |
EVALUATION OF CONTROLS AND PROCEDURES |
| |
Internal Control over Financial Reporting
We maintain internal control over financial reporting that is designed to provide reasonable assurance regarding the reliability of financial reporting and the preparation of financial statements for external purposes in accordance with IFRS.
Management is responsible for establishing and maintaining adequate internal control over financial reporting, as defined in Rules 13a – 15(f) and 15d – 15(f) under the United States Securities Exchange Act of 1934, as amended (the Exchange Act) and under National Instrument 52-109 Certification of Disclosure in Issuer’s Annual and Interim Filings (NI 52-109).
Management, including the Chief Executive Officer (CEO) and the Chief Financial Officer (CFO), has conducted an evaluation of our internal control over financial reporting based on criteria established in Internal Control – Integrated Framework (2013) issued by the Committee of Sponsoring Organizations of the Treadway Commission (COSO 2013).
There were no changes in our internal control over financial reporting in 2023 that have materially affected or are reasonably likely to materially affect our internal control over financial reporting. Based on management’s assessment as at December 31, 2023, management has concluded that our internal control over financial reporting is effective.
The effectiveness of internal control over financial reporting as at December 31, 2023 was audited by KPMG LLP, an independent registered public accounting firm, as stated in their Report of Independent Registered Public Accounting Firm, which is included in this annual report.
Due to its inherent limitations, internal control over financial reporting is not intended to provide absolute assurance that a misstatement of our financial statements would be prevented or detected. Further, the evaluation of the effectiveness of internal control over financial reporting was made as of a specific date, and continued effectiveness in future periods is subject to the risk that controls may become inadequate.
Disclosure Controls and Procedures
We maintain disclosure controls and procedures designed to provide reasonable assurance that information required to be disclosed in our interim and annual filings is reviewed, recognized and disclosed accurately and in the appropriate time period.
Management, including the CEO and CFO, carried out an evaluation, as at December 31, 2023, of the effectiveness of the design and operation of Precision’s disclosure controls and procedures, as defined in Rule 13a – 15(e) and 15d – 15(e) under the Exchange Act and NI 52-109. Based on that evaluation, the CEO and CFO have concluded that the design and operation of Precision’s disclosure controls and procedures were effective to ensure that information required to be disclosed in the reports we file or submit under the Exchange Act or Canadian securities legislation is recorded, processed, summarized and reported within the time periods specified in the rules and forms therein.
It should be noted that while the CEO and CFO believe that our disclosure controls and procedures provide a reasonable level of assurance that they are effective, they do not expect that these disclosure controls and procedures will prevent all errors and fraud. A control system, no matter how well conceived or operated, can provide only reasonable, not absolute, assurance that the objectives of the control system are met.
38 Management's Discussion and Analysis
CAUTIONARY STATEMENT ABOUT FORWARD-LOOKING INFORMATION AND STATEMENTS
We disclose forward-looking information to help current and prospective investors understand our future prospects.
Certain statements contained in this MD&A, including statements that contain words such as could, should, can, anticipate, estimate, intend, plan, expect, believe, will, may, continue, project, potential and similar expressions and statements relating to matters that are not historical facts constitute forward-looking information within the meaning of applicable Canadian securities legislation and forward-looking statements within the meaning of the safe harbor provisions of the United States Private Securities Litigation Reform Act of 1995 (collectively, forward-looking information and statements).
Our forward-looking information and statements in this MD&A include, but are not limited to, the following:
▪our strategic priorities for 2024
▪our capital expenditures, free cash flow allocation and debt reduction plan for 2024
▪anticipated activity levels in 2024
▪anticipated demand for our drilling rigs
▪plans for returns of capital to shareholders
▪the average number of term contracts in place for 2024
▪customer adoption of Alpha™ technologies and EverGreen™ suite of environmental solutions
▪potential commercial opportunities and rig contract renewals
▪our future debt reduction plans
▪our outlook on oil and natural gas prices
▪target Net Debt to Adjusted EBITDA
▪the potential impact liquefied natural gas export development could have on North American drilling activity
▪our expectations that new or newer rigs will enter the markets we currently operate in, and
▪our ability to remain compliant with our Senior Credit Facility and Real Estate Credit Facility financial debt covenants.
The forward-looking information and statements are based on certain assumptions and analysis made by Precision in light of our experience and our perception of historical trends, current conditions and expected future developments as well as other factors we believe are appropriate in the circumstances. These include, among other things:
▪the fluctuation in oil prices may pressure customers into reducing or limiting their drilling budgets
▪the status of current negotiations with our customers and vendors
▪customer focus on safety performance
▪existing term contracts are neither renewed or terminated prematurely
▪continued market demand for our drilling rigs
▪our ability to deliver rigs to customers on a timely basis
▪the impact of climate change on our business
▪the general stability of the economic and political environment in the jurisdictions in which we operate, and
▪the impact of an increase/decrease in capital spending.
Undue reliance should not be placed on forward-looking information and statements. Whether actual results, performance or achievements will conform to our expectations and predictions is subject to a number of known and unknown risks and uncertainties which could cause actual results to differ materially from our expectations. Such risks and uncertainties include, but are not limited to:
▪volatility in the price and demand for oil and natural gas
▪fluctuations in the level of oil and natural gas exploration and development activities
▪fluctuations in the demand for contract drilling, well servicing and ancillary oilfield services
▪our customers’ inability to obtain adequate credit or financing to support their drilling and production activity
▪changes in drilling and well servicing technology, which could reduce demand for certain rigs or put us at a competitive advantage
▪shortages, delays and interruptions in the delivery of equipment supplies and other key inputs
▪liquidity of the capital markets to fund customer drilling programs
▪availability of cash flow, debt and equity sources to fund our capital and operating requirements, as needed
▪the physical, regulatory and transition impacts of climate change
▪the impact of weather and seasonal conditions on operations and facilities
▪competitive operating risks inherent in contract drilling, well servicing and ancillary oilfield services
▪ability to improve our rig technology to improve drilling efficiency
▪disease outbreaks which could impact demand for our services or impact our operations
▪public health crises that impact demand for our services and our business
▪general political, economic, market or business conditions
▪the availability of qualified personnel and management
▪a decline in our safety performance which could result in lower demand for our services
▪business interruptions related to cybersecurity risks
▪changes to, and new laws or regulations, including changes in environmental laws and regulations such as increased regulation of hydraulic fracturing or restrictions on the burning of fossil fuels and greenhouse gas emissions, which could
Precision Drilling Corporation 2023 Annual Report 39
have an adverse impact on the demand for oil and natural gas
▪terrorism, social, civil and political unrest globally or in the foreign jurisdictions where we operate
▪fluctuations in foreign exchange, interest rates and tax rates, and
▪other unforeseen conditions which could impact the use of services supplied by Precision and Precision’s ability to respond to such conditions.
Readers are cautioned that the foregoing list of risk factors is not exhaustive. You can find more information about these and other factors that could affect our business, operations or financial results in this MD&A under the section titled “Risks in our Business” and in reports on file with securities regulatory authorities from time to time, including but not limited to our Annual Information Form (AIF) for the year ended December 31, 2023, which you can find in our profile on SEDAR+ (www.sedarplus.ca) or in our profile on EDGAR ( www.sec.gov).
All of the forward-looking information and statements made in this MD&A are expressly qualified by these cautionary statements. There can be no assurance that actual results or developments that we anticipate will be realized. We caution you not to place undue reliance on forward-looking information and statements. The forward-looking information and statements made in this MD&A are made as of the date hereof. We will not necessarily update or revise this forward-looking information as a result of new information, future events or otherwise, unless we are required to by securities law.
Forward-looking information and statements in this MD&A may also address our sustainability plans and progress. The inclusion of these statements is not an indication that these contents are necessarily material to investors and certain standards for measuring progress for sustainability are still developing (including for emissions disclosures).
FINANCIAL MEASURES AND RATIOS
| |
NON-GAAP FINANCIAL MEASURES |
We reference certain additional Non-Generally Accepted Accounting Principles (Non-GAAP) measures that are not defined terms under IFRS to assess performance because we believe they provide useful supplemental information to investors. |
Adjusted EBITDA | We believe Adjusted EBITDA (earnings before income taxes, gain on repurchase of unsecured senior notes, gain on acquisition, loss (gain) on investments and other assets, finance charges, foreign exchange, loss on asset decommissioning, gain on asset disposals, and depreciation and amortization ), as reported in our Consolidated Statements of Net Earnings (Loss), is a useful measure, because it gives an indication of the results from our principal business activities prior to consideration of how our activities are financed and the impact of foreign exchange, taxation and depreciation and amortization charges. The most directly comparable financial measure is net earnings (loss). |
Funds provided by (used in) operations | We believe funds provided by (used in) operations, as reported in our Consolidated Statements of Cash Flows, is a useful measure because it provides an indication of the funds our principal business activities generate prior to consideration of working capital changes, which is primarily made up of highly liquid balances. The most directly comparable financial measure is cash provided by (used in) operations. |
Net capital spending | We believe net capital spending is a useful measure as it provides an indication of our primary investment activities. The most directly comparable financial measure is cash provided by (used in) investing activities. Net capital spending is calculated as follows: |
| | | | | | | | | | | | |
Year ended December 31 (in thousands of dollars) | | | 2023 | | | | 2022 | | | | 2021 | |
Capital spending by spend category | | | | | | | | | |
Expansion and upgrade | | | 63,898 | | | | 63,305 | | | | 19,006 | |
Maintenance and infrastructure | | | 162,851 | | | | 120,945 | | | | 56,935 | |
| | | 226,749 | | | | 184,250 | | | | 75,941 | |
Proceeds on sale of property, plant and equipment | | | (23,841 | ) | | | (37,198 | ) | | | (13,086 | ) |
Net capital spending | | | 202,908 | | | | 147,052 | | | | 62,855 | |
Business acquisitions | | | 28,646 | | | | 10,200 | | | | — | |
Proceeds from sale of investments and other assets | | | (10,013 | ) | | | — | | | | — | |
Purchase of investments and other assets | | | 5,343 | | | | 617 | | | | 3,500 | |
Receipt of finance lease payments | | | (255 | ) | | | — | | | | — | |
Changes in non-cash working capital balances | | | (11,845 | ) | | | (13,454 | ) | | | (9,742 | ) |
Cash used in investing activities | | | 214,784 | | | | 144,415 | | | | 56,613 | |
40 Management's Discussion and Analysis
| |
Working capital | We define working capital as current assets less current liabilities, as reported in our Consolidated Statements of Financial Position. Working capital is calculated as follows: |
| | | | | | | | | | | | |
Year ended December 31 (in thousands of dollars) | | | 2023 | | | | 2022 | | | | 2021 | |
Current assets | | | 510,881 | | | | 470,670 | | | | 319,757 | |
Current liabilities | | | (365,642 | ) | | | (410,029 | ) | | | (238,120 | ) |
Working capital | | | 145,239 | | | | 60,641 | | | | 81,637 | |
| |
NON-GAAP RATIOS |
We reference certain additional non-GAAP ratios that are not defined terms under IFRS to assess performance because we believe they provide useful supplemental information to investors. |
Adjusted EBITDA % of Revenue | We believe Adjusted EBITDA as a percentage of consolidated revenue, as reported in our Consolidated Statements of Net Earnings (Loss), provides an indication of our profitability from our principal business activities prior to consideration of how our activities are financed and the impact of foreign exchange, taxation and depreciation and amortization charges. |
Net Debt to Adjusted EBITDA | We believe the Net Debt (long-term debt less cash, as reported in our Consolidated Statements of Financial Position) to Adjusted EBITDA ratio provides an indication to the number of years it would take for us to repay our debt obligations. |
SUPPLEMENTARY FINANCIAL MEASURES |
We reference certain supplementary financial measures that are not defined terms under IFRS to assess performance because we believe they provide useful supplemental information to investors. |
Capital spending by spend category | We provide additional disclosure to better depict the nature of our capital spending. Our capital spending is categorized as expansion and upgrade, maintenance and infrastructure, or intangibles. |
Enterprise Value | We calculate our Enterprise Value as our market capitalization (outstanding common shares multiplied by our share price at the reporting date) plus our long-term debt less cash, as reported in our Consolidated Statements of Financial Position. |
Long-term debt to cash provided by (used in) operations | We calculate our long-term debt, as reported in our Consolidated Statements of Financial Position, to cash provided by (used in) operations, as reported in our Consolidated Statements of Cash Flows. |
Working capital ratio | We define our working capital ratio as current assets divided by current liabilities, as reported in our Consolidated Statements of Financial Position. |
Precision Drilling Corporation 2023 Annual Report 41