| FREE WRITING PROSPECTUS | ||
| FILED PURSUANT TO RULE 433 | ||
| REGISTRATION FILE NO.: 333-206361-09 | ||
| March [8], 2017 | JPMDB 2017-C5 |
Free Writing Prospectus Structural and Collateral Term Sheet
| ||
JPMDB 2017-C5 | ||
| ||
This material is for your information, and none of J.P. Morgan Securities LLC (“JPMS”), Drexel Hamilton, LLC and Academy Securities, Inc., (each individually, an “Underwriter”, and together, the ‘‘Underwriters’’) are soliciting any action based upon it. This material is not to be construed as an offer to sell or the solicitation of any offer to buy any security in any jurisdiction where such an offer or solicitation would be illegal.
The depositor has filed a registration statement (including a prospectus) with the SEC (SEC File No. 333-206361) for the offering to which this free writing prospectus relates. Before you invest, you should read the prospectus in the registration statement and other documents the depositor has filed with the SEC for more complete information about the depositor, the issuing entity and this offering. You may get these documents for free by visiting EDGAR on the SEC Web site at www.sec.gov. Alternatively, the depositor, any underwriter or any dealer participating in the offering will arrange to send you the prospectus if you request it by calling (866) 669-7629 or by emailing the ABS Syndicate Desk atabs_synd@jpmorgan.com.
Neither this document nor anything contained in this document shall form the basis for any contract or commitment whatsoever. The information contained in this document is preliminary as of the date of this document, supersedes any previous such information delivered to you and will be superseded by any such information subsequently delivered prior to the time of sale. These materials are subject to change, completion or amendment from time to time.
This information is based upon management forecasts and reflects prevailing conditions and management’s views as of this date, all of which are subject to change.
J.P. Morgan is the marketing name for the investment banking businesses of JPMorgan Chase & Co. and its subsidiaries worldwide. Securities, syndicated loan arranging, financial advisory and other investment banking activities are performed by JPMS and its securities affiliates, and lending, derivatives and other commercial banking activities are performed by JPMorgan Chase Bank, National Association and its banking affiliates. JPMS is a member of SIPC and the NYSE.
THE UNDERWRITERS MAY FROM TIME TO TIME PERFORM INVESTMENT BANKING SERVICES FOR, OR SOLICIT INVESTMENT BANKING BUSINESS FROM, ANY COMPANY NAMED IN THESE MATERIALS. THE UNDERWRITERS AND/OR THEIR AFFILIATES OR RESPECTIVE EMPLOYEES MAY FROM TIME TO TIME HAVE A LONG OR SHORT POSITION IN ANY CERTIFICATE OR CONTRACT DISCUSSED IN THESE MATERIALS.
| ||
THE INFORMATION IN THIS STRUCTURAL AND COLLATERAL TERM SHEET IS NOT COMPLETE AND MAY BE AMENDED PRIOR TO THE TIME OF SALE. THIS TERM SHEET IS NOT AN OFFER TO SELL THESE SECURITIES AND IT IS NOT A SOLICITATION OF AN OFFER TO BUY THESE SECURITIES IN ANY JURISDICTION WHERE THE OFFER OR SALE IS NOT PERMITTED.
| 1 of 139 |
| March [8], 2017 | JPMDB 2017-C5 |
THE REPUBLIC OF KOREA
THIS PROSPECTUS IS NOT, AND UNDER NO CIRCUMSTANCES IS THIS PROSPECTUS TO BE CONSTRUED AS, A PUBLIC OFFERING OF SECURITIES IN KOREA. NEITHER THE ISSUER NOR ANY OF ITS AGENTS MAKE ANY REPRESENTATION WITH RESPECT TO THE ELIGIBILITY OF ANY RECIPIENTS OF THIS PROSPECTUS TO ACQUIRE THE OFFERED CERTIFICATES UNDER THE LAWS OF KOREA, INCLUDING, BUT WITHOUT LIMITATION, THE FOREIGN EXCHANGE TRANSACTION LAW AND REGULATIONS THEREUNDER (THE “FETL”). THE OFFERED CERTIFICATES HAVE NOT BEEN REGISTERED WITH THE FINANCIAL SERVICES COMMISSION OF KOREA FOR PUBLIC OFFERING IN KOREA, AND NONE OF THE OFFERED CERTIFICATES MAY BE OFFERED, SOLD OR DELIVERED, DIRECTLY OR INDIRECTLY, OR OFFERED OR SOLD TO ANY PERSON FOR RE-OFFERING OR RESALE, DIRECTLY OR INDIRECTLY IN KOREA OR TO ANY RESIDENT OF KOREA EXCEPT PURSUANT TO THE FINANCIAL INVESTMENT SERVICES AND CAPITAL MARKETS ACT AND THE DECREES AND REGULATIONS THEREUNDER (THE “FSCMA”), THE FETL AND ANY OTHER APPLICABLE LAWS, REGULATIONS AND MINISTERIAL GUIDELINES IN KOREA. WITHOUT PREJUDICE TO THE FOREGOING, THE NUMBER OF OFFERED CERTIFICATES OFFERED IN KOREA OR TO A RESIDENT OF KOREA SHALL BE LESS THAN FIFTY AND FOR A PERIOD OF ONE YEAR FROM THE ISSUE DATE OF THE OFFERED CERTIFICATES, NONE OF THE OFFERED CERTIFICATES MAY BE DIVIDED RESULTING IN AN INCREASED NUMBER OF OFFERED CERTIFICATES. FURTHERMORE, THE OFFERED CERTIFICATES MAY NOT BE RESOLD TO KOREAN RESIDENTS UNLESS THE PURCHASER OF THE OFFERED CERTIFICATES COMPLIES WITH ALL APPLICABLE REGULATORY REQUIREMENTS (INCLUDING, BUT NOT LIMITED TO, GOVERNMENT REPORTING APPROVAL REQUIREMENTS UNDER THE FETL AND ITS SUBORDINATE DECREES AND REGULATIONS) IN CONNECTION WITH THE PURCHASE OF THE OFFERED CERTIFICATES.
JAPAN
THE OFFERED CERTIFICATES HAVE NOT BEEN AND WILL NOT BE REGISTERED UNDER THE FINANCIAL INSTRUMENTS AND EXCHANGE LAW OF JAPAN, AS AMENDED (THE “FIEL”), AND DISCLOSURE UNDER THE FIEL HAS NOT BEEN AND WILL NOT BE MADE WITH RESPECT TO THE OFFERED CERTIFICATES. ACCORDINGLY, EACH UNDERWRITER HAS REPRESENTED AND AGREED THAT IT HAS NOT, DIRECTLY OR INDIRECTLY, OFFERED OR SOLD AND WILL NOT, DIRECTLY OR INDIRECTLY, OFFER OR SELL ANY OFFERED CERTIFICATES IN JAPAN OR TO, OR FOR THE BENEFIT OF, ANY RESIDENT OF JAPAN (WHICH TERM AS USED IN THIS PROSPECTUS MEANS ANY PERSON RESIDENT IN JAPAN, INCLUDING ANY CORPORATION OR OTHER ENTITY ORGANIZED UNDER THE LAWS OF JAPAN) OR TO OTHERS FOR REOFFERING OR RE-SALE, DIRECTLY OR INDIRECTLY, IN JAPAN OR TO, OR FOR THE BENEFIT OF, ANY RESIDENT OF JAPAN EXCEPT PURSUANT TO AN EXEMPTION FROM THE REGISTRATION REQUIREMENTS OF, AND OTHERWISE IN COMPLIANCE WITH, THE FIEL AND OTHER RELEVANT LAWS, REGULATIONS AND MINISTERIAL GUIDELINES OF JAPAN. AS PART OF THIS OFFERING OF THE OFFERED CERTIFICATES, THE UNDERWRITERS MAY OFFER THE OFFERED CERTIFICATES IN JAPAN TO UP TO 49 OFFEREES IN ACCORDANCE WITH THE ABOVE PROVISIONS.
THE INFORMATION IN THIS STRUCTURAL AND COLLATERAL TERM SHEET IS NOT COMPLETE AND MAY BE AMENDED PRIOR TO THE TIME OF SALE. THIS TERM SHEET IS NOT AN OFFER TO SELL THESE SECURITIES AND IT IS NOT A SOLICITATION OF AN OFFER TO BUY THESE SECURITIES IN ANY JURISDICTION WHERE THE OFFER OR SALE IS NOT PERMITTED.
 | 2 of 139 |  |
| Structural and Collateral Term Sheet | JPMDB 2017-C5 | |
| Collateral Characteristics | ||
| Loan Pool | ||
| Initial Pool Balance (“IPB”): | $1,043,452,191 | |
| Number of Mortgage Loans: | 35 | |
| Number of Mortgaged Properties: | 50 | |
| Average Cut-off Date Balance per Mortgage Loan: | $29,812,920 | |
| Weighted Average Current Mortgage Rate: | 4.59769% | |
| 10 Largest Mortgage Loans as % of IPB: | 53.7% | |
| Weighted Average Remaining Term to Maturity(1): | 114 months | |
| Weighted Average Seasoning(1): | 3 months | |
| Credit Statistics | ||
| Weighted Average UW NCF DSCR(2)(3): | 2.03x | |
| Weighted Average UW NOI Debt Yield(2): | 11.4% | |
| Weighted Average Cut-off Date Loan-to-Value Ratio (“LTV”)(2)(4): | 58.8% | |
| Weighted Average Maturity Date LTV(2)(4): | 52.8% | |
| Other Statistics | ||
| % of Mortgage Loans with Additional Debt: | 29.6% | |
| % of Mortgaged Properties with Single Tenants: | 8.4% | |
| Amortization | ||
| Weighted Average Original Amortization Term(5): | 353 months | |
| Weighted Average Remaining Amortization Term(5): | 352 months | |
| % of Mortgage Loans with Partial Interest-Only followed by Amortizing Balloon: | 41.6% | |
| % of Mortgage Loans with Interest-Only: | 32.8% | |
| % of Mortgage Loans with Amortizing Balloon: | 25.6% | |
| Cash Management(6) | ||
| % of Mortgage Loans with In-Place, Hard Lockboxes: | 80.9% | |
| % of Mortgage Loans with Springing Lockboxes: | 17.8% | |
| % of Mortgage Loans with In-Place, Soft Lockboxes: | 1.2% | |
| % of Mortgage Loans with Springing Cash Management: | 71.4% | |
| % of Mortgage Loans with In-Place Cash Management: | 28.6% | |
| Reserves | ||
| % of Mortgage Loans Requiring Monthly Tax Reserves: | 81.0% | |
| % of Mortgage Loans Requiring Monthly Insurance Reserves: | 16.1% | |
| % of Mortgage Loans Requiring Monthly CapEx Reserves(7): | 67.3% | |
| % of Mortgage Loans Requiring Monthly TI/LC Reserves(8): | 45.8% | |
| (1) | In the case of the Loan No.18, the first payment date for the loan is May 1, 2017. On the Closing Date, JPMCB will deposit sufficient funds to pay the interest associated with the interest due for the April 2017 payment for the related loan. Information presented in this term sheet reflects the contractual loan terms. |
| (2) | In the case of Loan Nos. 1, 2, 3, 4, 5, 7, 8, 9, 10, 14, 16 and 25, the UW NCF DSCR, UW NOI Debt Yield, Cut-off Date LTV and Maturity Date LTV calculations include the related Pari Passu Companion Loan(s). In the case of Loan Nos. 2, 4 and 9, the UW NCF DSCR, UW NOI Debt Yield, Cut-off Date LTV and Maturity Date LTV calculations exclude the related Subordinate Companion Loan(s). |
| (3) | In the case of Loan No. 9, the UW NCF DSCR is calculated using the sum of principal and interest payments over the first 12 months following the expiration of the interest-only period based on the assumed principal payment schedule provided on Annex G to the Preliminary Prospectus. |
| (4) | In the case of Loan Nos. 1, 5, 9, 11 and 12, the Cut-off Date LTV and the Maturity Date LTV are calculated by using an appraised value based on certain hypothetical assumptions. Refer to “Description of the Mortgage Pool—Assessments of Property Value and Condition” and “—Appraised Value” in the Preliminary Prospectus for additional details. |
| (5) | Excludes seven mortgage loans that are interest-only for the entire term. |
| (6) | For a more detailed description of Cash Management, refer to “Description of the Mortgage Pool—Certain Terms of the Mortgage Loans—Mortgaged Property Accounts” in the Preliminary Prospectus. |
| (7) | CapEx Reserves include FF&E reserves for hotel properties. |
| (8) | Calculated only with respect to the Cut-off Date Balance of mortgage loans secured or partially secured by office, retail, mixed use and industrial properties. |
THE INFORMATION IN THIS STRUCTURAL AND COLLATERAL TERM SHEET IS NOT COMPLETE AND MAY BE AMENDED PRIOR TO THE TIME OF SALE. THIS TERM SHEET IS NOT AN OFFER TO SELL THESE SECURITIES AND IT IS NOT A SOLICITATION OF AN OFFER TO BUY THESE SECURITIES IN ANY JURISDICTION WHERE THE OFFER OR SALE IS NOT PERMITTED.
| 3 of 139 | |
| Structural and Collateral Term Sheet | JPMDB 2017-C5 | |
| Collateral Characteristics | ||
Mortgage Loan Seller | Number of | Number of | Aggregate | % of |
| GACC(1)(2) | 21 | 26 | $652,817,515 | 62.6% |
| JPMCB(2) | 14 | 24 | 390,634,677 | 37.4 |
| Total: | 35 | 50 | $1,043,452,191 | 100.0% |
| (1) | With the exception of Loan No. 3, all of the loans for which GACC is the Mortgage Loan Seller, were originated by Deutsche Bank, AG, New York Branch (“DBNY”) (an affiliate of GACC). |
| (2) | In the case of Loan No. 2, the whole loan was co-originated by DBNY and Goldman Sachs Mortgage Company. In the case of Loan No. 4, the whole loan was co-originated by JPMCB, DBNY, Goldman Sachs Mortgage Company, Barclays Bank PLC and Morgan Stanley Bank, N.A. In the case of Loan No. 5, the whole loan was co-originated by DBNY, Citi Real Estate Funding Inc. and Bank of America, N.A. |
| Ten Largest Mortgage Loans | ||||||||||||
| No. | Loan Name | Mortgage Loan Seller | No. of Prop. | Cut-off Date Balance | % of IPB | SF/Units/ Rooms | Property Type | UW NCF DSCR(1)(1) | UW NOI Debt Yield(1) | Cut-off Date LTV(1)(3) | Maturity Date LTV(1)(3) | |
| 1 | 229 West 43rd Street Retail Condo | GACC | 1 | $80,000,000 | 7.7% | 248,457 | Retail | 1.75x | 7.5% | 60.6% | 60.6% | |
| 2 | 350 Park Avenue | GACC | 1 | $66,667,200 | 6.4% | 570,784 | Office | 2.98x | 12.0% | 41.7% | 41.7% | |
| 3 | Prudential Plaza | GACC | 1 | $65,000,000 | 6.2% | 2,269,632 | Office | 1.33x | 9.1% | 59.3% | 53.2% | |
| 4 | Hilton Hawaiian Village | JPMCB | 1 | $62,250,000 | 6.0% | 2,860 | Hotel | 4.47x | 19.0% | 31.2% | 31.2% | |
| 5 | Key Center Cleveland | GACC | 1 | $60,000,000 | 5.8% | 1,369,980 | Mixed Use | 1.59x | 12.3% | 60.8% | 49.6% | |
| 6 | Gateway I & II | GACC | 1 | $55,000,000 | 5.3% | 95,782 | Mixed Use | 1.20x | 7.7% | 71.4% | 62.8% | |
| 7 | Landmark Square | JPMCB | 1 | $49,000,000 | 4.7% | 757,917 | Mixed Use | 2.19x | 12.0% | 56.9% | 56.9% | |
| 8 | Dallas Design District | JPMCB | 1 | $45,000,000 | 4.3% | 728,452 | Industrial | 1.28x | 9.4% | 62.1% | 55.3% | |
| 9 | Moffett Gateway | JPMCB | 1 | $40,000,000 | 3.8% | 612,691 | Office | 1.95x | 11.9% | 46.3% | 39.3% | |
| 10 | Uovo Art Storage | GACC | 1 | $36,943,588 | 3.5% | 275,000 | Self Storage | 1.55x | 9.8% | 52.6% | 43.0% | |
| Top 3 Total/Weighted Average | 3 | $211,667,200 | 20.3% | 2.01x | 9.4% | 54.2% | 52.4% | |||||
| Top 5 Total/Weighted Average | 5 | $333,917,200 | 32.0% | 2.39x | 11.7% | 51.1% | 47.9% | |||||
| Top 10 Total/Weighted Average | 10 | $559,860,788 | 53.7% | 2.08x | 11.0% | 54.3% | 49.8% | |||||
| (1) | In the case of Loan Nos. 1, 2, 3, 4, 5, 7, 8, 9 and 10, the UW NCF DSCR, UW NOI Debt Yield, Cut-off Date LTV and Maturity Date LTV calculations include the related Pari Passu Companion Loan(s). In the case of Loan Nos. 2, 4 and 9, the UW NCF DSCR, UW NOI Debt Yield, Cut-off Date LTV and Maturity Date LTV calculations exclude the related Subordinate Companion Loan(s). |
| (2) | In the case of Loan No. 9, the UW NCF DSCR is calculated using the sum of principal and interest payments over the first 12 payments following the expiration of the interest-only period based on the principal payment schedule provided in Annex G of the Preliminary Prospectus. |
| (3) | In the case of Loan Nos. 1, 5 and 9, the Cut-off Date LTV and the Maturity Date LTV are calculated by using an appraised value based on certain hypothetical assumptions. Refer to “Description of the Mortgage Pool—Assessments of Property Value and Condition” and “—Appraised Value” in the Preliminary Prospectus for additional details. |
THE INFORMATION IN THIS STRUCTURAL AND COLLATERAL TERM SHEET IS NOT COMPLETE AND MAY BE AMENDED PRIOR TO THE TIME OF SALE. THIS TERM SHEET IS NOT AN OFFER TO SELL THESE SECURITIES AND IT IS NOT A SOLICITATION OF AN OFFER TO BUY THESE SECURITIES IN ANY JURISDICTION WHERE THE OFFER OR SALE IS NOT PERMITTED.
| 4 of 139 | |
| Structural and Collateral Term Sheet | JPMDB 2017-C5 | |
| Collateral Characteristics | ||
| Pari Passu Companion Loan Summary | |||||||||
No. | Loan Name | Trust Cut- | Pari Passu | Total Mortgage | Controlling | Master | Special | Voting Rights | |
| 1 | 229 West 43rd Street Retail Condo | $80,000,000 | $205,000,000 | $285,000,000 | CD 2016-CD2 | Wells Fargo | KeyBank | CD 2016-CD2 | |
| 2 | 350 Park Avenue | $66,667,200 | $229,320,800 | $295,988,000 | VNDO 2016-350P | Midland | Aegon | VNDO 2016-350P | |
| 3 | Prudential Plaza | $65,000,000 | $350,000,000 | $415,000,000 | COMM 2015-CCRE26 | Wells Fargo | CWCapital | COMM 2015-CCRE26 | |
| 4 | Hilton Hawaiian Village | $62,250,000 | $634,350,000 | $696,600,000 | Hilton USA Trust 2016-HHV | Wells Fargo | Aegon | Hilton USA Trust 2016-HHV | |
| 5 | Key Center Cleveland | $60,000,000 | $160,000,000 | $220,000,000 | (2) | (2) | (2) | (2) | |
| 7 | Landmark Square | $49,000,000 | $51,000,000 | $100,000,000 | JPMCC 2017-JP5 | Midland | LNR | JPMCC 2017-JP5 | |
| 8 | Dallas Design District | $45,000,000 | $75,000,000 | $120,000,000 | JPMCC 2017-JP5 | Midland | LNR | JPMCC 2017-JP5 | |
| 9 | Moffett Gateway | $40,000,000 | $203,000,000 | $243,000,000 | JPMCC 2016-JP4 | Wells Fargo | LNR | JPMCC 2016-JP4 | |
| 10 | Uovo Art Storage | $36,943,588 | $49,923,767 | $86,867,355 | (2) | (2) | (2) | (2) | |
| 14 | Summit Mall | $35,000,000 | $50,000,000 | $85,000,000 | JPMCC 2016-JP4 | Wells Fargo | LNR | JPMCC 2016-JP4 | |
| 16 | Summit Place Wisconsin | $32,000,000 | $40,000,000 | $72,000,000 | CD 2017-CD3 | Midland | Midland | CD 2017-CD3 | |
| 25 | Dick’s Sporting Goods Portfolio | $12,930,513 | $17,903,787 | $30,834,300 | JPMCC 2016-JP4 | Wells Fargo | LNR | JPMCC 2016-JP4 | |
| (1) | In the case of Loan Nos. 2, 4 and 9, the Total Mortgage Loan Cut-off Date Balance excludes the related Subordinate Companion Loan(s). |
| (2) | In the case of Loan Nos. 5, and 10 the whole loans are serviced under the JPMDB 2017-C5 Pooling and Servicing Agreement until such time that the controlling pari passu companion loan has been securitized, at which point the whole loan will be serviced under the related pooling and servicing agreement. In the case of Loan No. 5, the initial controlling noteholder is CGMRC, or an affiliate, and in the case of Loan No. 10, the initial controlling noteholder is GACC, or an affiliate, in each case, as holder of the related controlling pari passu companion loan. |
| Additional Debt Summary(1) |
No. | Loan Name | Trust Cut- | Subordinate | Total Debt | Mortgage | Total | Mortgage | Total | Mortgage | Total |
| 1 | 229 West 43rd Street Retail Condo | $80,000,000 | $85,000,000 | $370,000,000 | 1.75x | 1.10x | 60.6% | 78.7% | 7.5% | 5.8% |
| 2 | 350 Park Avenue | $66,667,200 | 104,012,000 | $400,000,000 | 2.98x | 2.21x | 41.7% | 56.3% | 12.0% | 8.9% |
| 4 | Hilton Hawaiian Village | $62,250,000 | $578,400,000 | $1,275,000,000 | 4.47x | 2.44x | 31.2% | 57.2% | 19.0% | 10.4% |
| 5 | Key Center Cleveland | $60,000,000 | 42,500,000 | $262,500,000 | 1.59x | 1.17x | 60.8% | 72.5% | 12.3% | 10.3% |
| 9 | Moffett Gateway | $40,000,000 | $152,000,000 | $395,000,000 | 1.95x | 1.22x | 46.3% | 75.2% | 11.9% | 7.3% |
| (1) | In the case of Loan Nos. 1 and 5, subordinate debt represents a mezzanine loan. In the case of Loan Nos. 2 and 4, subordinate debt represents a Subordinate Companion Loan. In the case of Loan No. 9, subordinate debt represents a Subordinate Companion Loan and a mezzanine loan. |
| (2) | In the case of Loan Nos. 1, 2, 4, 5 and 9, Mortgage Loan UW NCF DSCR, Mortgage Loan Cut-off Date LTV and Mortgage Loan UW NOI Debt Yield calculations include any related Pari Passu Companion Loans, where applicable, but exclude the related Subordinate Companion Loan(s) or mezzanine loan(s), as applicable. |
| (3) | In the case of Loan No. 9, the Mortgage Loan UW NCF DSCR and Total Debt UW NCF DSCR are calculated using the sum of principal and interest payments over the first 12 payments following the expiration of the interest-only period based on the principal payment schedule provided in Annex G of the Preliminary Prospectus. |
| (4) | In the case of Loan Nos. 1, 5 and 9, the Mortgage Loan Cut-off Date LTV and the Total Debt Cut-off Date LTV are calculated by using an appraised value based on certain hypothetical assumptions. Refer to “Description of the Mortgage Pool—Assessments of Property Value and Condition” and “—Appraised Value” in the Preliminary Prospectus for additional details. |
THE INFORMATION IN THIS STRUCTURAL AND COLLATERAL TERM SHEET IS NOT COMPLETE AND MAY BE AMENDED PRIOR TO THE TIME OF SALE. THIS TERM SHEET IS NOT AN OFFER TO SELL THESE SECURITIES AND IT IS NOT A SOLICITATION OF AN OFFER TO BUY THESE SECURITIES IN ANY JURISDICTION WHERE THE OFFER OR SALE IS NOT PERMITTED.
| 5 of 139 | |
| Structural and Collateral Term Sheet | JPMDB 2017-C5 | |
| Collateral Characteristics | ||
| Mortgaged Properties by Type(1) |
| Weighted Average | |||||||||
| Property Type | Property Subtype | Number of Properties | Cut-off Date Principal Balance | % of IPB | Occupancy | UW NCF DSCR(2)(3) | UW NOI Debt Yield(2) | Cut-off Date LTV(2)(4) | Maturity Date LTV(2)(4) |
| Office | Suburban | 6 | $149,225,000 | 14.3% | 98.1% | 1.72x | 11.4% | 63.6% | 56.5% |
| CBD | 2 | 131,667,200 | 12.6 | 88.2% | 2.17x | 10.6% | 50.4% | 47.4% | |
| Medical | 1 | 11,500,000 | 1.1 | 91.6% | 1.83x | 11.9% | 65.6% | 57.4% | |
| Subtotal: | 9 | $292,392,200 | 28.0% | 93.4% | 1.92x | 11.0% | 57.7% | 52.4% | |
| Hotel | Full Service | 3 | $123,627,503 | 11.8% | 85.6% | 3.43x | 16.3% | 44.9% | 41.4% |
| Limited Service | 7 | 60,872,146 | 5.8 | 71.8% | 1.92x | 13.7% | 61.8% | 51.1% | |
| Extended Stay | 3 | 16,578,635 | 1.6 | 81.4% | 2.06x | 15.1% | 57.4% | 49.6% | |
| Subtotal: | 13 | $201,078,284 | 19.3% | 81.1% | 2.86x | 15.4% | 51.0% | 45.0% | |
| Retail | Anchored | 4 | $104,628,307 | 10.0% | 99.3% | 1.75x | 8.7% | 62.5% | 60.0% |
| Regional Mall | 1 | 35,000,000 | 3.4 | 92.3% | 4.50x | 15.8% | 41.5% | 41.5% | |
| Single Tenant | 3 | 27,046,845 | 2.6 | 100.0% | 1.41x | 10.1% | 68.1% | 54.9% | |
| Shadow Anchored | 3 | 20,472,205 | 2.0 | 94.0% | 1.27x | 8.4% | 61.8% | 56.4% | |
| Freestanding | 3 | 11,571,836 | 1.1 | 100.0% | 1.37x | 9.7% | 69.6% | 57.0% | |
| Unanchored | 1 | 1,505,907 | 0.1 | 100.0% | 1.40x | 9.5% | 70.5% | 57.2% | |
| Subtotal: | 15 | $200,225,101 | 19.2% | 97.7% | 2.11x | 10.1% | 60.0% | 55.5% | |
| Mixed Use | Office/Retail | 3 | $139,445,906 | 13.4% | 91.4% | 1.66x | 10.1% | 65.6% | 59.0% |
| Office/Hotel/Parking | 1 | 60,000,000 | 5.8 | 92.9% | 1.59x | 12.3% | 60.8% | 49.6% | |
| Subtotal: | 4 | $199,445,906 | 19.1% | 91.8% | 1.64x | 10.8% | 64.1% | 56.2% | |
| Multifamily | Garden | 7 | $68,367,113 | 6.6% | 95.4% | 1.68x | 9.5% | 68.3% | 63.5% |
| Subtotal: | 7 | $68,367,113 | 6.6% | 95.4% | 1.68x | 9.5% | 68.3% | 63.5% | |
| Industrial | Flex | 1 | $45,000,000 | 4.3% | 98.7% | 1.28x | 9.4% | 62.1% | 55.3% |
| Subtotal: | 1 | $45,000,000 | 4.3% | 98.7% | 1.28x | 9.4% | 62.1% | 55.3% | |
| Self Storage | Art Storage | 1 | $36,943,588 | 3.5% | 83.9% | 1.55x | 9.8% | 52.6% | 43.0% |
| Subtotal: | 1 | $36,943,588 | 3.5% | 83.9% | 1.55x | 9.8% | 52.6% | 43.0% | |
| Total / Weighted Average: | 50 | $1,043,452,191 | 100.0% | 91.6% | 2.03x | 11.4% | 58.8% | 52.8% | |
| (1) | Because this table presents information relating to the mortgaged properties and not mortgage loans, the information for mortgage loans secured by more than one mortgaged property is based on allocated loan amounts. |
| (2) | In the case of Loan Nos. 1, 2, 3, 4, 5, 7, 8, 9, 10, 14, 16 and 25, the UW NCF DSCR, UW NOI DY, Cut-off Date LTV and Maturity Date LTV calculations include the related Pari Passu Companion Loan(s). In the case of Loan Nos. 2, 4 and 9, the UW NCF DSCR, UW NOI DY, Cut-off Date LTV and Maturity Date LTV calculations exclude the related Subordinate Companion Loan(s). |
| (3) | In the case of Loan No. 9, the UW NCF DSCR is calculated using the sum of principal and interest payments over the first 12 months following the expiration of the interest-only period based on the assumed principal payment schedule provided on Annex G to the Preliminary Prospectus. |
| (4) | In the case of Loan Nos. 1, 5, 9, 11 and 12, the Cut-off Date LTV and the Maturity Date LTV are calculated by using an appraised value based on certain hypothetical assumptions. Refer to “Description of the Mortgage Pool—Assessments of Property Value and Condition” and “—Appraised Value” in the Preliminary Prospectus for additional details. |
THE INFORMATION IN THIS STRUCTURAL AND COLLATERAL TERM SHEET IS NOT COMPLETE AND MAY BE AMENDED PRIOR TO THE TIME OF SALE. THIS TERM SHEET IS NOT AN OFFER TO SELL THESE SECURITIES AND IT IS NOT A SOLICITATION OF AN OFFER TO BUY THESE SECURITIES IN ANY JURISDICTION WHERE THE OFFER OR SALE IS NOT PERMITTED.
| 6 of 139 | |
| Structural and Collateral Term Sheet | JPMDB 2017-C5 | |
| Collateral Characteristics | ||
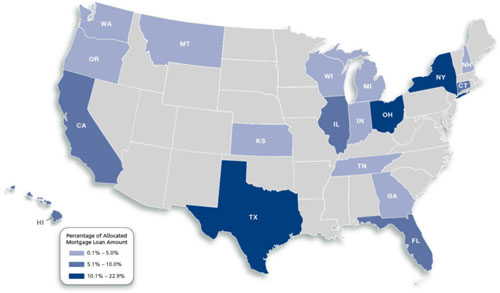
| Mortgaged Properties by Location(1) | ||||||||||||
Weighted Average | ||||||||||||
State | Number of Properties | Cut-off Date Principal Balance | % of | Occupancy | UW NCF DSCR(2)(3) | UW NOI Debt Yield(2) | Cut-off Date LTV(2)(4) | Maturity Date LTV(2)(4) | ||||
| New York | 4 | $238,610,788 | 22.9% | 96.2% | 1.94x | 9.2% | 56.6% | 53.1% | ||||
| Ohio | 4 | 164,945,906 | 15.8 | 93.1% | 2.34x | 13.2% | 59.9% | 51.9% | ||||
| Texas | 7 | 108,578,616 | 10.4 | 96.7% | 1.53x | 9.4% | 65.6% | 60.2% | ||||
| California | 5 | 103,150,000 | 9.9 | 97.8% | 1.61x | 10.4% | 58.4% | 52.2% | ||||
| Connecticut | 2 | 84,377,503 | 8.1 | 79.8% | 1.92x | 11.3% | 62.7% | 57.7% | ||||
| Florida | 9 | 78,925,009 | 7.6 | 78.7% | 2.48x | 15.5% | 53.8% | 47.3% | ||||
| Illinois | 2 | 66,922,668 | 6.4 | 77.8% | 1.33x | 9.1% | 59.6% | 53.3% | ||||
| Hawaii | 1 | 62,250,000 | 6.0 | 94.6% | 4.47x | 19.0% | 31.2% | 31.2% | ||||
| Oregon | 4 | 40,651,146 | 3.9 | 88.6% | 1.56x | 11.1% | 67.4% | 55.5% | ||||
| Wisconsin | 1 | 32,000,000 | 3.1 | 99.1% | 1.37x | 9.7% | 72.7% | 64.2% | ||||
| Tennessee | 1 | 12,285,000 | 1.2 | 96.3% | 2.07x | 14.1% | 67.9% | 62.7% | ||||
| Washington | 1 | 11,958,011 | 1.1 | 69.8% | 1.79x | 13.4% | 64.6% | 53.6% | ||||
| Michigan | 2 | 11,163,497 | 1.1 | 96.0% | 1.67x | 12.7% | 70.2% | 57.9% | ||||
| Georgia | 1 | 9,949,173 | 1.0 | 97.0% | 1.42x | 11.2% | 69.7% | 52.3% | ||||
| New Hampshire | 3 | 7,107,803 | 0.7 | 100.0% | 1.40x | 9.5% | 70.5% | 57.2% | ||||
| Montana | 1 | 6,677,030 | 0.6 | 100.0% | 1.55x | 11.1% | 64.8% | 48.9% | ||||
| Kansas | 1 | 2,394,134 | 0.2 | 100.0% | 1.40x | 9.5% | 70.5% | 57.2% | ||||
| Indiana | 1 | 1,505,907 | 0.1 | 100.0% | 1.40x | 9.5% | 70.5% | 57.2% | ||||
| Total / Weighted Average: | 50 | $1,043,452,191 | 100.0% | 91.6% | 2.03x | 11.4% | 58.8% | 52.8% | ||||
| (1) | Because this table presents information relating to the mortgaged properties and not mortgage loans, the information for mortgage loans secured by more than one mortgaged property is based on allocated loan amounts. |
| (2) | In the case of Loan Nos. 1, 2, 3, 4, 5, 7, 8, 9, 10, 14, 16 and 25, the UW NCF DSCR, UW NOI DY, Cut-off Date LTV and Maturity Date LTV calculations include the related Pari Passu Companion Loan(s). In the case of Loan Nos. 2, 4 and 9, the UW NCF DSCR, UW NOI DY, Cut-off Date LTV and Maturity Date LTV calculations exclude the related Subordinate Companion Loan(s). |
| (3) | In the case of Loan No. 9, the UW NCF DSCR is calculated using the sum of principal and interest payments over the first 12 months following the expiration of the interest-only period based on the assumed principal payment schedule provided on Annex G to the Preliminary Prospectus. |
| (4) | In the case of Loan Nos. 1, 5, 9, 11 and 12, the Cut-off Date LTV and the Maturity Date LTV are calculated by using an appraised value based on certain hypothetical assumptions. Refer to “Description of the Mortgage Pool—Assessments of Property Value and Condition” and “—Appraised Value” in the Preliminary Prospectus for additional details. |
THE INFORMATION IN THIS STRUCTURAL AND COLLATERAL TERM SHEET IS NOT COMPLETE AND MAY BE AMENDED PRIOR TO THE TIME OF SALE. THIS TERM SHEET IS NOT AN OFFER TO SELL THESE SECURITIES AND IT IS NOT A SOLICITATION OF AN OFFER TO BUY THESE SECURITIES IN ANY JURISDICTION WHERE THE OFFER OR SALE IS NOT PERMITTED.
| 7 of 139 | |
| Structural and Collateral Term Sheet | JPMDB 2017-C5 | |
| Collateral Characteristics | ||
| Cut-off Date Principal Balance |
Weighted Average | |||||||||||
| Range of Cut-off Date Principal Balances | Number of Loans | Cut-off Date Principal Balance | % of IPB | Mortgage Rate | Remaining Loan Term(1) | UW NCF DSCR(2)(3) | UW NOI DY(2) | Cut-off Date LTV(2)(4) | Maturity Date LTV(2)(4) | ||
| $4,788,497 | - | $9,999,999 | 6 | $43,848,804 | 4.2% | 5.10444% | 106 | 1.75x | 12.8% | 65.0% | 52.5% |
| $10,000,000 | - | $19,999,999 | 9 | 125,859,901 | 12.1 | 4.85807% | 114 | 1.55x | 10.7% | 67.1% | 58.9% |
| $20,000,000 | - | $24,999,999 | 1 | 23,610,000 | 2.3 | 3.82000% | 116 | 2.32x | 9.5% | 61.6% | 61.6% |
| $25,000,000 | - | $49,999,999 | 13 | 461,216,286 | 44.2 | 4.66797% | 115 | 2.01x | 11.9% | 59.8% | 53.1% |
| $50,000,000 | - | $80,000,000 | 6 | 388,917,200 | 37.3 | 4.42014% | 115 | 2.22x | 11.1% | 54.0% | 50.0% |
| Total / Weighted Average: | 35 | $1,043,452,191 | 100.0% | 4.59769% | 114 | 2.03x | 11.4% | 58.8% | 52.8% | ||
| Mortgage Interest Rates |
Weighted Average | |||||||||||
| Range of Mortgage Interest Rates | Number of Loans | Cut-off Date Principal Balance | % of IPB | Mortgage Rate | Remaining Loan Term(1) | UW NCF DSCR(2)(3) | UW NOI DY(2) | Cut-off Date LTV(2)(4) | Maturity Date LTV(2)(4) | ||
| 3.31400% | - | 3.99999% | 4 | $165,277,200 | 15.8% | 3.63007% | 118 | 2.96x | 12.4% | 45.6% | 43.9% |
| 4.00000% | - | 4.49999% | 5 | 192,680,513 | 18.5 | 4.18363% | 117 | 2.85x | 13.1% | 49.6% | 48.2% |
| 4.50000% | - | 4.99999% | 15 | 453,380,717 | 43.5 | 4.79237% | 116 | 1.59x | 10.6% | 64.2% | 56.4% |
| 5.00000% | - | 5.41000% | 11 | 232,113,761 | 22.2 | 5.25011% | 107 | 1.55x | 11.2% | 65.2% | 55.9% |
| Total / Weighted Average: | 35 | $1,043,452,191 | 100.0% | 4.59769% | 114 | 2.03x | 11.4% | 58.8% | 52.8% | ||
| Original Term to Maturity in Months(1) |
Weighted Average | |||||||||
| Original Term to Maturity in Months | Number of Loans | Cut-off Date Principal Balance | % of IPB | Mortgage Rate | Remaining Loan Term(1) | UW NCF DSCR(2)(3) | UW NOI DY(2) | Cut-off Date LTV(2)(4) | Maturity Date LTV(2)(4) |
| 60 | 2 | $35,559,103 | 3.4% | 5.24751% | 59 | 1.55x | 10.9% | 67.1% | 62.6% |
| 84 | 1 | 12,285,000 | 1.2 | 5.07000% | 82 | 2.07x | 14.1% | 67.9% | 62.7% |
| 120 | 30 | 888,940,888 | 85.2 | 4.67387% | 116 | 1.98x | 11.4% | 60.2% | 53.7% |
| 121 | 1 | 66,667,200 | 6.4 | 3.91513% | 118 | 2.98x | 12.0% | 41.7% | 41.7% |
| 126 | 1 | 40,000,000 | 3.8 | 3.31940% | 121 | 1.95x | 11.9% | 46.3% | 39.3% |
| Total / Weighted Average: | 35 | $1,043,452,191 | 100.0% | 4.59769% | 114 | 2.03x | 11.4% | 58.8% | 52.8% |
| Remaining Term to Maturity in Months(1) | |||||||||
| Weighted Average | |||||||||||
| Range of Remaining Term to Maturity in Months | Number of Loans | Cut-off Date Principal Balance | % of IPB | Mortgage Rate | Remaining Loan Term(1) | UW NCF DSCR(2)(3) | UW NOI DY(2) | Cut-off Date LTV(2)(4) | Maturity Date LTV(2)(4) | ||
| 57 | - | 84 | 3 | $47,844,103 | 4.6% | 5.20193% | 65 | 1.69x | 11.7% | 67.3% | 62.6% |
| 85 | - | 119 | 28 | 915,733,088 | 87.8 | 4.62189% | 116 | 2.01x | 11.2% | 59.3% | 53.2% |
| 120 | - | 121 | 4 | 79,875,000 | 7.7 | 3.95830% | 121 | 2.45x | 14.2% | 48.4% | 42.8% |
| Total / Weighted Average: | 35 | $1,043,452,191 | 100.0% | 4.59769% | 114 | 2.03x | 11.4% | 58.8% | 52.8% | ||
| (1) | In the case of the Loan No.18, the first payment date for the loan is May 1, 2017. On the Closing Date, JPMCB will deposit sufficient funds to pay the interest associated with the interest due for the April 2017 payment for the related loan. Information presented in this term sheet reflects the contractual loan terms. |
| (2) | In the case of Loan Nos. 1, 2, 3, 4, 5, 7, 8, 9, 10, 14, 16 and 25, the UW NCF DSCR, UW NOI DY, Cut-off Date LTV and Maturity Date LTV calculations include the related Pari Passu Companion Loan(s). In the case of Loan Nos. 2, 4 and 9, the UW NCF DSCR, UW NOI DY, Cut-off Date LTV and Maturity Date LTV calculations exclude the related Subordinate Companion Loan(s). |
| (3) | In the case of Loan No. 9, the UW NCF DSCR is calculated using the sum of principal and interest payments over the first 12 months following the expiration of the interest-only period based on the assumed principal payment schedule provided on Annex G to the Preliminary Prospectus. |
| (4) | In the case of Loan Nos. 1, 5, 9, 11 and 12, the Cut-off Date LTV and the Maturity Date LTV are calculated by using an appraised value based on certain hypothetical assumptions. Refer to “Description of the Mortgage Pool—Assessments of Property Value and Condition” and “—Appraised Value” in the Preliminary Prospectus for additional details. |
THE INFORMATION IN THIS STRUCTURAL AND COLLATERAL TERM SHEET IS NOT COMPLETE AND MAY BE AMENDED PRIOR TO THE TIME OF SALE. THIS TERM SHEET IS NOT AN OFFER TO SELL THESE SECURITIES AND IT IS NOT A SOLICITATION OF AN OFFER TO BUY THESE SECURITIES IN ANY JURISDICTION WHERE THE OFFER OR SALE IS NOT PERMITTED.
| 8 of 139 | |
| Structural and Collateral Term Sheet | JPMDB 2017-C5 | |
| Collateral Characteristics | ||
| Original Amortization Term in Months |
| Weighted Average | |||||||||
| Original Amortization Term in Months | Number of Loans | Cut-off Date Principal Balance | % of IPB | Mortgage Rate | Remaining Loan Term(1) | UW NCF DSCR(2)(3) | UW NOI DY(2) | Cut-off Date LTV(2)(4) | Maturity Date LTV(2)(4) |
| Interest Only | 7 | $342,527,200 | 32.8% | 4.11068% | 117 | 3.00x | 12.9% | 47.8% | 47.8% |
| 300 | 4 | 85,185,306 | 8.2 | 5.26800% | 112 | 1.63x | 12.5% | 61.6% | 49.9% |
| 360 | 24 | 615,739,685 | 59.0 | 4.77586% | 113 | 1.55x | 10.5% | 64.5% | 56.0% |
| Total / Weighted Average: | 35 | $1,043,452,191 | 100.0% | 4.59769% | 114 | 2.03x | 11.4% | 58.8% | 52.8% |
| Remaining Amortization Term in Months |
| Weighted Average | |||||||||||
| Range of Remaining Amortization Term in Months | Number of Loans | Cut-off Date Principal Balance | % of IPB | Mortgage Rate | Remaining Loan Term(1) | UW NCF DSCR(2)(3) | UW NOI DY(2) | Cut-off Date LTV(2)(4) | Maturity Date LTV(2)(4) | ||
| Interest Only | 7 | $342,527,200 | 32.8% | 4.11068% | 117 | 3.00x | 12.9% | 47.8% | 47.8% | ||
| 297 | - | 356 | 5 | 98,115,819 | 9.4 | 5.15993% | 113 | 1.60x | 12.1% | 62.8% | 50.8% |
| 357 | - | 360 | 23 | 602,809,172 | 57.8 | 4.78290% | 113 | 1.55x | 10.5% | 64.4% | 56.0% |
| Total / Weighted Average: | 35 | $1,043,452,191 | 100.0% | 4.59769% | 114 | 2.03x | 11.4% | 58.8% | 52.8% | ||
| Amortization Types |
Weighted Average | |||||||||
| Amortization Types | Number of Loans | Cut-off Date Principal Balance | % of IPB | Mortgage Rate | Remaining Loan Term(1) | UW NCF DSCR(2)(3) | UW NOI DY(2) | Cut-off Date LTV(2)(4) | Maturity Date LTV(2)(4) |
| IO-Balloon | 13 | $433,935,000 | 41.6% | 4.75065% | 111 | 1.50x | 10.3% | 63.8% | 56.5% |
| Interest Only | 7 | 342,527,200 | 32.8 | 4.11068% | 117 | 3.00x | 12.9% | 47.8% | 47.8% |
| Balloon | 15 | 266,989,991 | 25.6 | 4.97387% | 116 | 1.64x | 11.4% | 64.9% | 53.2% |
| Total / Weighted Average: | 35 | $1,043,452,191 | 100.0% | 4.59769% | 114 | 2.03x | 11.4% | 58.8% | 52.8% |
| Underwritten Net Cash Flow Debt Service Coverage Ratios(1)(2) |
| Weighted Average | |||||||||||
| Range of Underwritten Net Cash Flow Debt Service Coverage Ratios | Number of Loans | Cut-off Date Principal Balance | % of IPB | Mortgage Rate | Remaining Loan Term(1) | UW NCF DSCR(2)(3) | UW NOI DY(2) | Cut-off Date LTV(2)(4) | Maturity Date LTV(2)(4) | ||
| 1.20x | - | 1.24x | 2 | $70,300,000 | 6.7% | 4.70306% | 119 | 1.20x | 7.8% | 68.7% | 61.3% |
| 1.25x | - | 1.49x | 11 | 274,070,184 | 26.3 | 4.92298% | 108 | 1.34x | 9.5% | 66.6% | 58.5% |
| 1.50x | - | 1.74x | 5 | 174,444,027 | 16.7 | 5.05551% | 119 | 1.59x | 11.1% | 62.8% | 51.3% |
| 1.75x | - | 1.99x | 7 | 194,198,917 | 18.6 | 4.21404% | 118 | 1.84x | 10.7% | 58.4% | 53.0% |
| 2.00x | - | 4.50x | 10 | 330,439,064 | 31.7 | 4.28924% | 114 | 3.12x | 14.5% | 48.3% | 47.0% |
| Total / Weighted Average: | 35 | $1,043,452,191 | 100.0% | 4.59769% | 114 | 2.03x | 11.4% | 58.8% | 52.8% | ||
| (1) | In the case of the Loan No.18, the first payment date for the loan is May 1, 2017. On the Closing Date, JPMCB will deposit sufficient funds to pay the interest associated with the interest due for the April 2017 payment for the related loan. Information presented in this term sheet reflects the contractual loan terms. |
| (2) | In the case of Loan Nos. 1, 2, 3, 4, 5, 7, 8, 9, 10, 14, 16 and 25, the UW NCF DSCR, UW NOI DY, Cut-off Date LTV and Maturity Date LTV calculations include the related Pari Passu Companion Loan(s). In the case of Loan Nos. 2, 4 and 9, the UW NCF DSCR, UW NOI DY, Cut-off Date LTV and Maturity Date LTV calculations exclude the related Subordinate Companion Loan(s). |
| (3) | In the case of Loan No. 9, the UW NCF DSCR is calculated using the sum of principal and interest payments over the first 12 months following the expiration of the interest-only period based on the assumed principal payment schedule provided on Annex G to the Preliminary Prospectus. |
| (4) | In the case of Loan Nos. 1, 5, 9, 11 and 12, the Cut-off Date LTV and the Maturity Date LTV are calculated by using an appraised value based on certain hypothetical assumptions. Refer to “Description of the Mortgage Pool—Assessments of Property Value and Condition” and “—Appraised Value” in the Preliminary Prospectus for additional details. |
THE INFORMATION IN THIS STRUCTURAL AND COLLATERAL TERM SHEET IS NOT COMPLETE AND MAY BE AMENDED PRIOR TO THE TIME OF SALE. THIS TERM SHEET IS NOT AN OFFER TO SELL THESE SECURITIES AND IT IS NOT A SOLICITATION OF AN OFFER TO BUY THESE SECURITIES IN ANY JURISDICTION WHERE THE OFFER OR SALE IS NOT PERMITTED.
| 9 of 139 | |
| Structural and Collateral Term Sheet | JPMDB 2017-C5 | |
| Collateral Characteristics | ||
| LTV Ratios as of the Cut-off Date(2)(4) |
| Weighted Average | |||||||||||
| Range of Cut-off Date LTVs | Number of Loans | Cut-off Date Principal Balance | % of IPB | Mortgage Rate | Remaining Loan Term(1) | UW NCF DSCR(2)(3) | UW NOI DY(2) | Cut-off Date LTV(2)(4) | Maturity Date LTV(2)(4) | ||
| 31.2% | - | 49.9% | 5 | $229,917,200 | 22.0% | 3.85633% | 118 | 3.50x | 15.2% | 39.7% | 38.5% |
| 50.0% | - | 59.9% | 6 | 211,668,596 | 20.3 | 4.82381% | 110 | 1.70x | 11.0% | 57.5% | 51.7% |
| 60.0% | - | 64.9% | 8 | 247,312,803 | 23.7 | 4.69912% | 118 | 1.70x | 10.1% | 61.5% | 55.7% |
| 65.0% | - | 69.9% | 8 | 154,538,463 | 14.8 | 4.78553% | 116 | 1.71x | 11.8% | 68.4% | 58.6% |
| 70.0% | - | 73.9% | 8 | 200,015,129 | 19.2 | 4.94002% | 110 | 1.35x | 9.1% | 71.4% | 62.5% |
| Total / Weighted Average: | 35 | $1,043,452,191 | 100.0% | 4.59769% | 114 | 2.03x | 11.4% | 58.8% | 52.8% | ||
| LTV Ratios as of the Maturity Date(2)(4) |
Weighted Average | |||||||||||
| Range of Maturity Date LTVs | Number of Loans | Cut-off Date Principal Balance | % of IPB | Mortgage Rate | Remaining Loan Term(1) | UW NCF DSCR(2)(3) | UW NOI DY(2) | Cut-off Date LTV(2)(4) | Maturity Date LTV(2)(4) | ||
| 31.2% | - | 44.9% | 6 | $266,860,788 | 25.6% | 3.97797% | 118 | 3.23x | 14.4% | 41.5% | 39.1% |
| 45.0% | - | 49.9% | 4 | 112,102,039 | 10.7 | 5.20347% | 114 | 1.75x | 13.1% | 60.3% | 49.5% |
| 50.0% | - | 54.9% | 5 | 106,974,945 | 10.3 | 4.77637% | 108 | 1.51x | 10.6% | 61.6% | 52.9% |
| 55.0% | - | 59.9% | 10 | 243,800,803 | 23.4 | 4.97138% | 118 | 1.61x | 10.5% | 64.8% | 56.8% |
| 60.0% | - | 66.7% | 10 | 313,713,616 | 30.1 | 4.55704% | 111 | 1.61x | 9.3% | 67.4% | 62.6% |
| Total / Weighted Average: | 35 | $1,043,452,191 | 100.0% | 4.59769% | 114 | 2.03x | 11.4% | 58.8% | 52.8% | ||
| Prepayment Protection |
Weighted Average | |||||||||
| Prepayment Protection | Number of Loans | Cut-off Date Principal Balance | % of IPB | Mortgage Rate | Remaining Loan Term(1) | UW NCF DSCR(2)(3) | UW NOI DY(2) | Cut-off Date LTV(2)(4) | Maturity Date LTV(2)(4) |
| Defeasance | 25 | $794,908,703 | 76.2% | 4.53229% | 116 | 1.94x | 11.1% | 59.2% | 53.2% |
| Yield Maintenance | 9 | 186,293,488 | 17.9 | 5.00978% | 107 | 1.58x | 10.3% | 66.2% | 58.4% |
| Defeasance or Yield Maintenance | 1 | 62,250,000 | 6.0 | 4.19950% | 116 | 4.47x | 19.0% | 31.2% | 31.2% |
| Total / Weighted Average: | 35 | $1,043,452,191 | 100.0% | 4.59769% | 114 | 2.03x | 11.4% | 58.8% | 52.8% |
| Loan Purpose |
Weighted Average | |||||||||
| Loan Purpose | Number of Loans | Cut-off Date Principal Balance | % of IPB | Mortgage Rate | Remaining Loan Term(1) | UW NCF DSCR(2)(3) | UW NOI DY(2) | Cut-off Date LTV(2)(4) | Maturity Date LTV(2)(4) |
| Refinance | 26 | $826,789,256 | 79.2% | 4.52910% | 114 | 2.09x | 11.2% | 57.4% | 52.0% |
| Acquisition | 8 | 209,985,905 | 20.1 | 4.84984% | 116 | 1.81x | 12.2% | 64.0% | 56.3% |
| Recapitalization | 1 | 6,677,030 | 0.6 | 5.16000% | 118 | 1.55x | 11.1% | 64.8% | 48.9% |
| Total / Weighted Average: | 35 | $1,043,452,191 | 100.0% | 4.59769% | 114 | 2.03x | 11.4% | 58.8% | 52.8% |
| (1) | In the case of the Loan No.18, the first payment date for the loan is May 1, 2017. On the Closing Date, JPMCB will deposit sufficient funds to pay the interest associated with the interest due for the April 2017 payment for the related loan. Information presented in this term sheet reflects the contractual loan terms. |
| (2) | In the case of Loan Nos. 1, 2, 3, 4, 5, 7, 8, 9, 10, 14, 16 and 25, the UW NCF DSCR, UW NOI DY, Cut-off Date LTV and Maturity Date LTV calculations include the related Pari Passu Companion Loan(s). In the case of Loan Nos. 2, 4 and 9, the UW NCF DSCR, UW NOI DY, Cut-off Date LTV and Maturity Date LTV calculations exclude the related Subordinate Companion Loan(s). |
| (3) | In the case of Loan No. 9, the UW NCF DSCR is calculated using the sum of principal and interest payments over the first 12 months following the expiration of the interest-only period based on the assumed principal payment schedule provided on Annex G to the Preliminary Prospectus. |
| (4) | In the case of Loan Nos. 1, 5, 9, 11 and 12, the Cut-off Date LTV and the Maturity Date LTV are calculated by using an appraised value based on certain hypothetical assumptions. Refer to “Description of the Mortgage Pool—Assessments of Property Value and Condition” and “—Appraised Value” in the Preliminary Prospectus for additional details. |
THE INFORMATION IN THIS STRUCTURAL AND COLLATERAL TERM SHEET IS NOT COMPLETE AND MAY BE AMENDED PRIOR TO THE TIME OF SALE. THIS TERM SHEET IS NOT AN OFFER TO SELL THESE SECURITIES AND IT IS NOT A SOLICITATION OF AN OFFER TO BUY THESE SECURITIES IN ANY JURISDICTION WHERE THE OFFER OR SALE IS NOT PERMITTED.
| 10 of 139 | |
| Structural and Collateral Term Sheet | JPMDB 2017-C5 | |
| Collateral Characteristics | ||
| Previous Securitization History(1) |
| No. | Loan Name | Location | Property Type | Previous Securitization |
| 2 | 350 Park Avenue | New York, NY | Office | WBCMT 2007-C30 |
| 3 | Prudential Plaza | Chicago, IL | Office | JPMCC 2006-LDP7; JPMCC 2006-CB16 |
| 4 | Hilton Hawaiian Village | Honolulu, HI | Hotel | HILT 2013-HLT |
| 8 | Dallas Design District | Dallas, TX | Industrial | JPMCC 2015-FL7 |
| 13 | Delamar Greenwich Harbor | Greenwich, CT | Hotel | LBUBS 2007-C2 |
| 14 | Summit Mall | Fairlawn, OH | Retail | JPMCC 2007-LD12 |
| 16 | Summit Place Wisconsin | West Allis, WI | Office | BSCMS 2007-PW15 |
| 17.01 | Shopko Salem | Salem, OR | Retail | MSC 2007-IQ14 |
| 17.02 | Shopko Bend | Bend, OR | Retail | MSC 2007-IQ14 |
| 17.03 | Shopko Eugene | Eugene, OR | Retail | MSC 2007-IQ14 |
| 19 | Holiday Inn Miami Beach | Miami Beach, FL | Hotel | CGCMT 2007-C6 |
| 21 | Cupertino Civic Center | Cupertino, CA | Office | WBCMT 2007-C32 |
| 23 | Trabuco Hills | Mission Viejo, CA | Retail | MLCFC 2007-6 |
| 24.01 | Creekview Apartments | Sherman, TX | Multifamily | MLCFC 2007-6 |
| 24.02 | Country Village Apartments | Sherman, TX | Multifamily | MLCFC 2007-5 |
| 25.01 | Dick’s Keene | Keene, NH | Retail | BACM 2006-1 |
| 25.02 | Dick’s & PetSmart Concord | Concord, NH | Retail | CGCMT 2006-C5 |
| 25.03 | Dick’s Wichita | Wichita, KS | Retail | CGCMT 2006-C5 |
| 25.04 | Dick’s Bloomingdale | Bloomingdale, IL | Retail | CGCMT 2006-C5 |
| 26 | Plaza Ashland | Ashland, OR | Hotel | MSC 2007-T25 |
| 27 | Cleveland Towne Center | Cleveland, TN | Retail | WFCG 2015-BXRP |
| 28 | Courtyard Marriott Richland | Richland, WA | Hotel | BACM 2006-6 |
| 29 | Grossmont Medical Center | La Mesa, CA | Office | MSC 2004-T13; MLCFC 2007-5 |
| 33 | Shopko Billings | Billings, MT | Retail | CGCMT 2006-C4 |
| 35 | Crossroads Village Apartments | Portage, MI | Multifamily | FNA 2014-M9 |
| (1) | The table above represents the properties for which the previously existing debt was most recently securitized, based on information provided by the related borrower or obtained through searches of a third-party database. |
THE INFORMATION IN THIS STRUCTURAL AND COLLATERAL TERM SHEET IS NOT COMPLETE AND MAY BE AMENDED PRIOR TO THE TIME OF SALE. THIS TERM SHEET IS NOT AN OFFER TO SELL THESE SECURITIES AND IT IS NOT A SOLICITATION OF AN OFFER TO BUY THESE SECURITIES IN ANY JURISDICTION WHERE THE OFFER OR SALE IS NOT PERMITTED.
| 11 of 139 | |
| Structural and Collateral Term Sheet | JPMDB 2017-C5 |
| 229 West 43rd Street Retail Condo | |

THE INFORMATION IN THIS STRUCTURAL AND COLLATERAL TERM SHEET IS NOT COMPLETE AND MAY BE AMENDED PRIOR TO THE TIME OF SALE. THIS TERM SHEET IS NOT AN OFFER TO SELL THESE SECURITIES AND IT IS NOT A SOLICITATION OF AN OFFER TO BUY THESE SECURITIES IN ANY JURISDICTION WHERE THE OFFER OR SALE IS NOT PERMITTED.
| 12 of 139 | |
| Structural and Collateral Term Sheet | JPMDB 2017-C5 |
| 229 West 43rd Street Retail Condo | |
THE INFORMATION IN THIS STRUCTURAL AND COLLATERAL TERM SHEET IS NOT COMPLETE AND MAY BE AMENDED PRIOR TO THE TIME OF SALE. THIS TERM SHEET IS NOT AN OFFER TO SELL THESE SECURITIES AND IT IS NOT A SOLICITATION OF AN OFFER TO BUY THESE SECURITIES IN ANY JURISDICTION WHERE THE OFFER OR SALE IS NOT PERMITTED.
| 13 of 139 | |
| Structural and Collateral Term Sheet | JPMDB 2017-C5 |
| 229 West 43rd Street Retail Condo | |
THE INFORMATION IN THIS STRUCTURAL AND COLLATERAL TERM SHEET IS NOT COMPLETE AND MAY BE AMENDED PRIOR TO THE TIME OF SALE. THIS TERM SHEET IS NOT AN OFFER TO SELL THESE SECURITIES AND IT IS NOT A SOLICITATION OF AN OFFER TO BUY THESE SECURITIES IN ANY JURISDICTION WHERE THE OFFER OR SALE IS NOT PERMITTED.
| 14 of 139 | |
| Structural and Collateral Term Sheet | JPMDB 2017-C5 |
| 229 West 43rd Street Retail Condo | |
| Mortgage Loan Information | Property Information | |||
| Mortgage Loan Seller: | GACC | Single Asset / Portfolio: | Single Asset | |
| Original Principal Balance(1): | $80,000,000 | Title: | Fee | |
| Cut-off Date Principal Balance(1): | $80,000,000 | Property Type - Subtype: | Retail – Anchored | |
| % of Pool by IPB: | 7.7% | Net Rentable Area (SF): | 248,457 | |
| Loan Purpose: | Refinance | Location: | New York, NY | |
| Borrowers: | Elmwood NYT Owner, LLC; | Year Built / Renovated: | 1913-1947 / 2009 | |
| Oakwood NYT Owner, LLC; Wallkill | Occupancy: | 100.0% | ||
| NYT Owner, LLC and Landings | Occupancy Date: | 10/1/2016 | ||
| NYT Owner, LLC | Number of Tenants: | 8 | ||
| Sponsor(2): | Jared Kushner | 2013 NOI: | $9,621,123 | |
| Interest Rate: | 4.00550% | 2014 NOI: | $11,949,215 | |
| Note Date: | 10/13/2016 | 2015 NOI(4): | N/A | |
| Maturity Date: | 11/6/2026 | T-10 Ann. NOI (as of 8/2016)(5): | $13,775,701 | |
| Interest-only Period: | 120 months | UW Economic Occupancy(6): | 100.0% | |
| Original Term: | 120 months | UW Revenues: | $25,397,158 | |
| Original Amortization: | None | UW Expenses: | $3,895,157 | |
| Amortization Type: | Interest Only | UW NOI(5): | $21,502,001 | |
| Call Protection(3): | L(28),Def(85),O(7) | UW NCF: | $20,207,655 | |
| Lockbox / Cash Management: | Hard / In-Place | Appraised Value / Per SF(7): | $470,000,000 / $1,892 | |
| Additional Debt: | Yes | Appraisal Date: | 10/1/2016 | |
| Additional Debt Balance: | $205,000,000 / $85,000,000 | |||
| Additional Debt Type: | Pari Passu / Mezzanine | |||
| Escrows and Reserves(8) | Financial Information(1) | ||||||
| Initial | Monthly | Initial Cap | Whole Loan | Total Debt | |||
| Taxes: | $651,564 | $126,690 | N/A | Cut-off Date Loan / SF: | $1,147 | $1,489 | |
| Insurance: | $18,983 | Springing | N/A | Maturity Date Loan / SF: | $1,147 | $1,489 | |
| Replacement Reserves: | $0 | $6,211 | N/A | Cut-off Date LTV(7): | 60.6% | 78.7% | |
| TI/LC: | $14,492,159 | $0 | N/A | Maturity Date LTV(7): | 60.6% | 78.7% | |
| Other: | $11,133,080 | Springing | N/A | UW NCF DSCR: | 1.75x | 1.10x | |
| UW NOI Debt Yield: | 7.5% | 5.8% | |||||
| Sources and Uses | |||||||
| Sources | Proceeds | % of Total | Uses | Proceeds | % of Total | |
| Mortgage Loan(1) | $285,000,000 | 77.0% | Payoff Existing Debt | $276,954,279 | 74.9% | |
| Mezzanine Loan | 85,000,000 | 23.0 | Return of Equity | 59,327,520 | 16.0 | |
| Upfront Reserves | 26,295,786 | 7.1 | ||||
| Closing Costs | 7,422,416 | 2.0 | ||||
| Total Sources | $370,000,000 | 100.0% | Total Uses | $370,000,000 | 100.0% |
| (1) | The 229 West 43rd Street Retail Condo loan is part of a whole loan evidenced by ninepari passu notes with an aggregate original principal balance of $285.0 million. The Whole Loan Financial Information presented in the chart above reflects the 229 West 43rd Street Retail Condo Whole Loan Cut-off Date balance of $285.0 million. The Total Debt Financial Information presented in the chart above reflects the aggregate Cut-off Date balance of the 229 West 43rd Street Retail Condo Whole Loan and the related mezzanine loan of $370.0 million. |
| (2) | See “The Loan Sponsor” herein. |
| (3) | The lockout period will be at least 28 payments beginning with and including the first payment on December 6, 2016. Defeasance of the full $285.0 million 229 West 43rd Street Retail Condo Whole Loan is permitted after the earlier to occur of (i) October 13, 2019 and (ii) the date that is two years from the closing date of the securitization that includes the note to be last securitized. The assumed lockout period is based on the expected JPMDB 2017-C5 securitization closing date in March 2017. The actual lockout period may be longer. |
| (4) | 2015 NOI is not available due to the borrower’s acquisition of the 229 West 43rd Street Retail Condo property in October 2015. |
| (5) | The increase in UW NOI from T-10 Ann. NOI is due to 121,832 square feet of recent leasing at the 229 West 43rd Street Retail Condo property (49.0% of NRA and 59.7% of U/W Base Rent). |
| (6) | UW Economic Occupancy includes four tenants (49.0% of NRA) that have signed leases but have not yet taken occupancy at the 229 West 43rd Street Retail Condo property, each of which is in a free rent period for which $11,061,751 was reserved with lender at loan origination. |
| (7) | The Appraised Value / Per SF, Cut-off Date LTV and Maturity Date LTV are calculated based on the “Hypothetical As-Is” appraised value, which applies a credit for the approximately $24.2 million of contractual free rent and TI/LC obligations for which approximately $25.6 million was ultimately reserved at loan origination. Based on the as-is appraised value of $445.0 million, the Cut-off Date LTV for the Mortgage Loan and Total Debt are 64.0% and 83.1%, respectively. |
| (8) | For a full description of Escrows and Reserves, please refer to “Escrows and Reserves” below. |
THE INFORMATION IN THIS STRUCTURAL AND COLLATERAL TERM SHEET IS NOT COMPLETE AND MAY BE AMENDED PRIOR TO THE TIME OF SALE. THIS TERM SHEET IS NOT AN OFFER TO SELL THESE SECURITIES AND IT IS NOT A SOLICITATION OF AN OFFER TO BUY THESE SECURITIES IN ANY JURISDICTION WHERE THE OFFER OR SALE IS NOT PERMITTED.
| 15 of 139 | |
| Structural and Collateral Term Sheet | JPMDB 2017-C5 |
| 229 West 43rd Street Retail Condo | |
The Loan. The 229 West 43rd Street Retail Condo loan is secured by a first mortgage lien on the borrowers’ fee interest in a 248,457 square foot retail condominium located in New York, New York. The whole loan has an outstanding principal balance as of the Cut-off Date of $285.0 million (the “229 West 43rd Street Retail Condo Whole Loan”) and is comprised of ninepari passu notes, each as described below. Note A-2 and Note A-3 with an aggregate balance of $80.0 million are being contributed to the JPMDB 2017-C5 Trust. Note A-1 was securitized in the CD 2016-CD2 trust and is the controlling note under the related co-lender agreement, the rights of which will be exercised by the related trustee (or, prior to the occurrence and continuance of a control termination event under the related pooling and servicing agreement, by the related directing certificateholder). However, the JPMDB 2017-C5 Trust will be entitled, under certain circumstances, to be consulted with respect to certain major decisions. The 229 West 43rd Street Retail Condo Whole Loan has a 10-year term and is interest-only for the entire term of the loan.
| Whole Loan Summary | ||||
| Note | Original Balance | Cut-off Date Balance | Note Holder | Controlling Piece |
| A-1, A-6 | 75,000,000 | 75,000,000 | CD 2016-CD2 | Yes |
| A-2, A-3 | $80,000,000 | $80,000,000 | JPMDB 2017-C5 | No |
| A-4-A | 30,000,000 | 30,000,000 | CGMRC | No |
| A-4-B, A-5, A-7, A-8 | 100,000,000 | 100,000,000 | CD 2017-CD3 | No |
| Total | $285,000,000 | $285,000,000 | ||
The Borrower. The borrowing entities for the 229 West 43rd Street Retail Condo Whole Loan are Elmwood NYT Owner, LLC, Oakwood NYT Owner, LLC, Wallkill NYT Owner, LLC and Landings NYT Owner, LLC, as tenants-in-common. Each is a Delaware limited liability company and special purpose entity structured to be bankruptcy remote, with two independent directors in its organizational structure.
The Loan Sponsor. The loan sponsor and nonrecourse carve-out guarantor is Jared Kushner. On January 3, 2017, the borrowers sent a notice to the lender stating that subject to the terms of the related 229 West 43rd Street Retail Condo Loan documents, and to the extent required, the consent of the lender, Jared Kushner intends to tender his resignation as manager of the borrowers and will be replaced in such capacity by Joshua Kushner, effective as of January 19, 2017. Following such notice, the borrower proposed that Jared Kushner be replaced by Joshua Kushner as the nonrecourse carve-out guarantor. Such notice and proposal are currently under review by the servicer and special servicer in the CD 2016-CD2 securitization under which the 229 West 43rd Street Retail Condo Whole Loan is being serviced. It is anticipated that Jared Kushner will be replaced by Joshua Kushner as the manager of the indirect owner of the borrower, and the 229 West 43rd Street Retail Condo Loan documents may be amended to provide that, among other things, both Jared Kushner and Joshua Kushner are guarantors under nonrecourse carve-out guaranties and will individually and collectively constitute key principals for purposes of such documents. However, such proposal is not final and may be subject to further change. Jared Kushner has been appointed as a senior White House advisor in the Trump administration.
According to management at Kushner Companies, Jared Kushner has tendered his resignation as CEO of Kushner Companies, a real estate organization headquartered in New York City and founded in 1964 by Charles Kushner, Jared’s father. The company’s national reach consists of more than 20,000 multifamily apartments and approximately 13.0 million square feet of office, hotel, industrial and retail space throughout the Northeast and Mid-Atlantic regions. In 2015 alone, Kushner Companies completed more than $1.5 billion of transactions. See “Description of the Mortgage Pool—Loan Purpose; Default History, Bankruptcy Issues and Other Proceedings” in the Preliminary Prospectus.
In addition to his former role at Kushner Companies, Jared, alongside his brother, Joshua, co-founded Cadre, a company that utilizes technology to connect institutional investors with potential real estate investments. Jared Kushner has been an active investor in technology companies and has been a member on the boards of several start-ups including Urban Compass, Honest Buildings and 42 Floors.
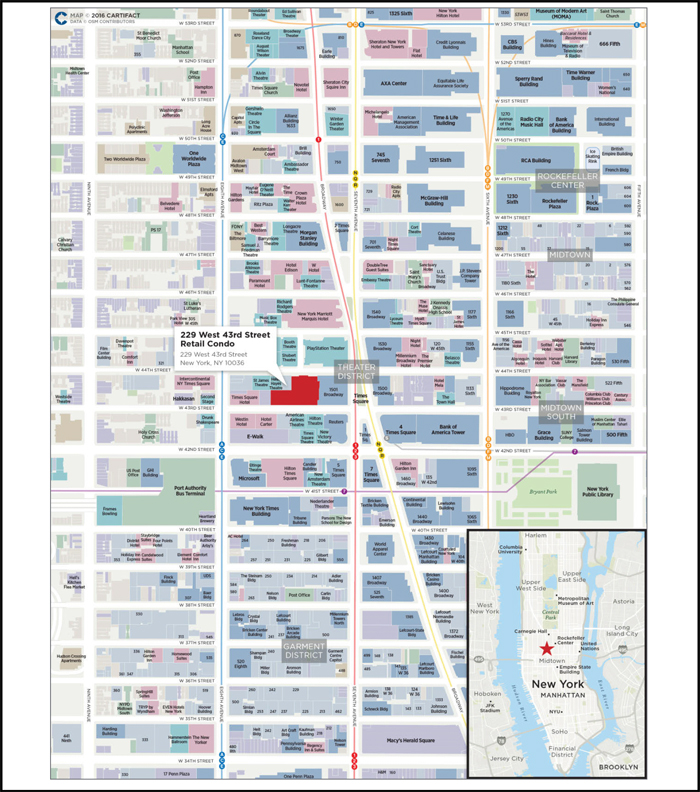
The Property. The 229 West 43rd Street Retail Condo property is a 248,457 square foot retail condominium located at 229 West 43rd Street, formerly known as The New York Times Building. The 229 West 43rd Street Retail Condo property is a landmarked building located mid-block with frontage on both 43rd and 44th streets, across from the famous Shubert Alley, a 300-foot long pedestrian alley at the heart of the New York City theater district.
THE INFORMATION IN THIS STRUCTURAL AND COLLATERAL TERM SHEET IS NOT COMPLETE AND MAY BE AMENDED PRIOR TO THE TIME OF SALE. THIS TERM SHEET IS NOT AN OFFER TO SELL THESE SECURITIES AND IT IS NOT A SOLICITATION OF AN OFFER TO BUY THESE SECURITIES IN ANY JURISDICTION WHERE THE OFFER OR SALE IS NOT PERMITTED.
| 16 of 139 | |
| Structural and Collateral Term Sheet | JPMDB 2017-C5 |
| 229 West 43rd Street Retail Condo | |
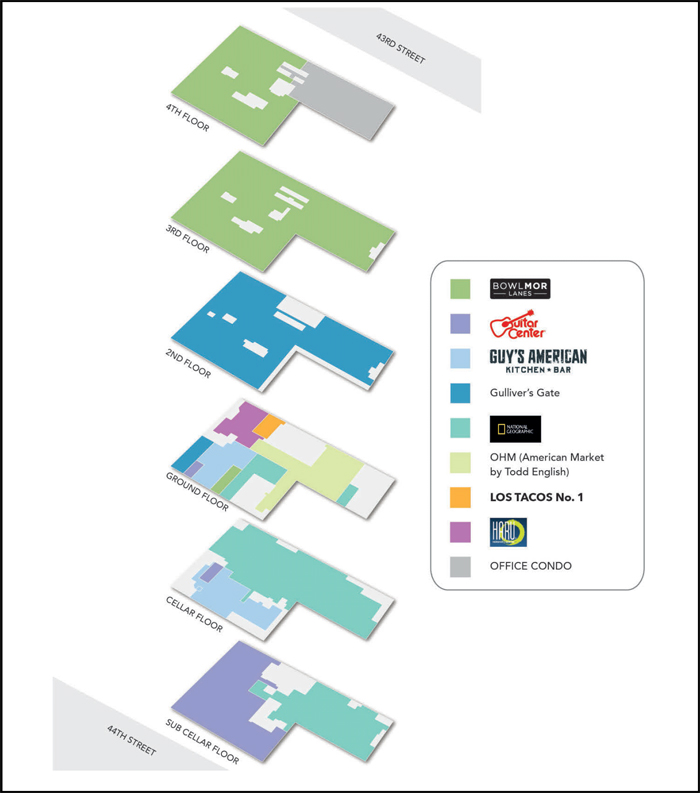
The 229 West 43rd Street Retail Condo property consists of six floors, two below-grade and four above-grade (the “Retail Condominium Unit”) that is the base of an 18-story, 729,566 square foot building that also includes an office condominium (the “Office Condominium Unit,” and together with the Retail Condominium Unit, the “229 West 43rd Street Condominium”) on floors 5 – 16. The Office Condominium Unit is not collateral for the 229 West 43rd Street Retail Condo Whole Loan. The related condominium board of directors has five board members, two of which are appointed by the borrowers. For additional information regarding the 229 West 43rd Street Condominium see “The Condominium” herein. The borrowers acquired the 229 West 43rd Street Retail Condo property in October 2015 for approximately $295.0 million ($1,187 per square foot) from Africa-Israel USA and Five Mile Capital in an off market transaction.
The 229 West 43rd Street Retail Condo property is 100.0% leased as of October 1, 2016 to 8 tenants in the retail, entertainment and restaurant sectors, all of which have lease terms that extend beyond the term of the 229 West 43rd Street Retail Condo Whole Loan. Top tenants include Bowlmor Times Square, LLC, National Geographic, Gulliver’s Gate, Guitar Center Stores, Inc. and Guy’s American Kitchen. The 229 West 43rd Street Retail Condo property’s combined weighted average lease term and remaining lease term are 18.4 and 15.7 years, respectively, and the current weighted average in-place gross rent for the 229 West 43rd Street Retail Condo property is $102.14 per square foot.
Prior to the borrowers’ acquisition in 2015, the 229 West 43rd Street Retail Condo property was 75.1% occupied. Since the acquisition, the loan sponsor fully leased up the 229 West 43rd Street Retail Condo property, signing leases for 121,832 square feet of space. New leases include National Geographic, Gulliver’s Gate, Los Tacos No.1 and OHM (American Market by Todd English). As part of its lease up efforts, the loan sponsor was able to buyout Discovery TSX’s lease and subsequently release the space to National Geographic at $101.46 per square foot. In connection with the new leases, there is approximately $16.2 million in tenant improvements, leasing commissions and landlord work, the outstanding balance of which was reserved for at loan origination. The subsequent chart details the recent leasing at the 229 West 43rd Street Retail Condo property and the borrowers’ budgeted tenant improvements, leasing commissions and landlord work associated with each lease.
| Recent Leasing | |||||||||
| Tenant | Lease Commencement | Free Rent | Rent Commencement | Tenant Possession Date | Projected | Tenant Improvements | Leasing Commissions | LL Work / Budgeted CapEx | |
| National Geographic | 10/4/2016 | 12 | 10/8/2017 | Oct-16 | Aug-17 | $4,000,000 | $2,400,000 | $0 | |
| Gulliver’s Gate | 1/4/2016 | 12 | 1/4/2017 | Jan-16 | Mar-17 | $2,500,000 | $2,571,226 | $0 | |
| OHM (American Market by Todd English) | 8/1/2016 | 15 | (1) | 11/1/2017 | Mar-17 | Apr-17 | $1,100,000 | $1,000,000 | $2,100,000 |
| Los Tacos No.1 | 12/1/2016 | 9 | 9/1/2017 | Dec-16 | Jul-17 | $0 | $164,000 | $400,000 | |
| Total | $7,600,000 | $6,135,226 | $2,500,000 | ||||||
| (1) | Includes partial free rent starting in December 2017. The free rent schedule is as follows: 100% abatement until November 2017; 50% abatement from December 2017 through July 2018; 25% abatement from August 2018 through March 2019; full rent thereafter. |
The 229 West 43rd Street Retail Condo property benefits from an existing Industrial Commercial Incentive Program (“ICIP”) tax exemption, granted to the prior owner in connection with certain capital improvements made to the 229 West 43rd Street Retail Condo property which qualified for such ICIP benefits. The ICIP program provided exemptions from real estate tax increases resulting from capital improvements installed in qualifying industrial and commercial properties. To be eligible, industrial and commercial buildings must be modernized, expanded or otherwise physically improved as required by the ICIP rules, and the benefits could last for up to 25 tax years. The 229 West 43rd Street Retail Condo property qualified for a 12 tax year exemption (total and partial exemption) period. The annual exemption totals $55,838,279; that exemption amount is multiplied by the current tax rate, to yield the annual reduction of real estate taxes. During the 2016 tax year, the dollar value of the exemption applied to taxes due totaled $5,950,127 (based on the tax rate of 10.656%) and that exemption was deducted from the $7,390,842 annual taxes before ICIP exemption (resulting in an annual $1,440,715 tax bill for the 229 West 43rd Street Retail Condo property). For the first eight tax years beginning July 1, 2009 through June 30, 2017, 100% of the $55,838,279 ICIP exemption will be applied to the tax bills. In the 2017/2018 tax year, 80% of the exemption will be applied, and the exemption will continue to decrease at a rate of 20% per year, until it is entirely phased out after the 12th exemption year, in 2020/2021. Full taxes without any exemption will be owed effective the tax year beginning July 1, 2021. Real estate taxes were underwritten to half of the payable taxes for the 2016/2017 fiscal year and half of the payable taxes for the 2017/2018 fiscal year.
THE INFORMATION IN THIS STRUCTURAL AND COLLATERAL TERM SHEET IS NOT COMPLETE AND MAY BE AMENDED PRIOR TO THE TIME OF SALE. THIS TERM SHEET IS NOT AN OFFER TO SELL THESE SECURITIES AND IT IS NOT A SOLICITATION OF AN OFFER TO BUY THESE SECURITIES IN ANY JURISDICTION WHERE THE OFFER OR SALE IS NOT PERMITTED.
| 17 of 139 | |
| Structural and Collateral Term Sheet | JPMDB 2017-C5 |
| 229 West 43rd Street Retail Condo | |
The 229 West 43rd Street Retail Condo property is located in the Times Square retail submarket of New York City, which is defined as Broadway between West 42nd and West 47th Streets. The 229 West 43rd Street Retail Condo property is located across from the famous Shubert Alley and adjacent to the Times Square “bowtie”. Times Square is a highly visited tourist attraction, with an average of 350,000 people passing through the “bowtie” every day, according to the appraisal. The neighborhood is home to numerous retail and entertainment companies such as ABC/Disney, Forever21, Clear Channel Entertainment, MTV and Oakley Sunglasses as well as a number of high profile office tenants including Morgan Stanley, Thomson Reuters, the New York Times, NASDAQ, Microsoft and Ernst & Young.
The submarket also benefits from numerous transportation options. These include the Times Square subway station (the largest in New York City), MTA Buses, the Port Authority Bus Terminal and quick access to Grand Central Terminal and Penn Station. The Times Square/42nd Street/Eighth Avenue interlinked subway stations offer access to 11 different subway lines (A, C, E, N, Q, R, 1, 2, 3, 7 and Shuttle to Grand Central Terminal).
According to the appraisal, the Times Square submarket contains 169 buildings and 2,482,831 square feet of total rentable area. As of mid-year 2016, there was 258,718 square feet of directly vacant space available, which equates to a direct vacancy rate of 10.4%. Retail asking rents for grade level space in the submarket were $2,109 per square foot as of second quarter of 2016, a decrease of 8.1% over the quarter and a decrease of 15.9% year-over-year. Despite this recent decline, the Times Square submarket continued to experience the greatest long term increase in asking rents tracked by the appraisal. Five years ago, asking rents in the submarket were $691 per square foot, which equates to a 238.0% increase.
The appraisal identified the following six properties as sales comparables for the 229 West 43rd Street Retail Condo property. The adjusted comparables range from $1,574 per square foot to $2,045 per square foot with an average of approximately $1,982 per square foot.
| Summary of Comparable Sales(1) | ||||||||
| Property | NRA | Year Built | No. Stories | Sales Date | Sales Price | Price per SF | Appraisal’s Adjusted Price per SF | Occupancy |
| 229 West 43rd Street Retail Condo | 248,457(2) | 1913-1947 | 6 | NAP | $470,000,000(3) | $1,892 | NAP | 100%(2)(4) |
| 432-440 Park Avenue | 133,600 | 2016 | 6 | Jun-16 | $411,125,625 | $3,077 | $1,877 | 0% |
| The Shops at Columbus Circle | 461,080 | 2004 | 6 | Jun-15 | $1,040,000,000 | $2,256 | $2,045 | 99% |
| 150 West 34th Street | 77,760 | 1998 | 4 | Jun-15 | $355,500,000 | $4,572 | $1,951 | 100% |
| 530 Fifth Avenue | 56,039 | 1957 | 3 | Sep-14 | $295,000,000 | $5,264 | $2,034 | 47% |
| 697-699 Fifth Avenue | 24,737 | 1903 / 2000 | 3 | Jul-14 | $700,000,000 | $28,298 | $1,574 | 100% |
| 1107 Broadway | 20,609 | 1915 / 2013 | 2 | Feb-14 | $56,500,000 | $2,742 | $1,709 | 21% |
| (1) | Source: Appraisal. |
| (2) | Based on the underwritten rent roll dated October 1, 2016. |
| (3) | Represents the “Hypothetical As-Is” appraised value for the 229 West 43rd Street Retail Condo property. |
| (4) | Includes four tenants (49.0% of net rentable area) that have signed leases but have not yet taken occupancy at the 229 West 43rd Street Retail Condo property. |
The appraisal identified lease comparables ranging from $239.48 per square foot to $350.28 per square foot, on an adjusted basis, for grade space and $130.59 per square foot to $392.08 per square foot, on an adjusted basis, for multi-level space. The appraisal’s market rent conclusions for the 229 West 43rd Street Retail Condo property, broken out by floor and frontage, are summarized in the subsequent chart.
| Retail Market Rent(1) | |
| Space Type | Rent PSF |
| Grade 44th Street | $350.00 |
| Grade 43rd Street | $250.00 |
| 2nd Floor / Mezzanine | $100.00 |
| 3rd Floor | $80.00 |
| 4th Floor | $70.00 |
| Lower Level | $75.00 |
| Sub-Lower Level | $75.00 |
| (1) | Source: Appraisal. |
THE INFORMATION IN THIS STRUCTURAL AND COLLATERAL TERM SHEET IS NOT COMPLETE AND MAY BE AMENDED PRIOR TO THE TIME OF SALE. THIS TERM SHEET IS NOT AN OFFER TO SELL THESE SECURITIES AND IT IS NOT A SOLICITATION OF AN OFFER TO BUY THESE SECURITIES IN ANY JURISDICTION WHERE THE OFFER OR SALE IS NOT PERMITTED.
| 18 of 139 | |
| Structural and Collateral Term Sheet | JPMDB 2017-C5 |
| 229 West 43rd Street Retail Condo | |
| Historical and Current Occupancy(1) | ||
| 2014 | 2015 | Current(2) |
| 75.1% | 75.1% | 100.0% |
| (1) | Historical occupancies are as of December 31 of each respective year. |
| (2) | Current occupancy is as of October 1, 2016 and includes four tenants (49.0% of net rentable area) that signed leases but have not yet taken occupancy and opened for business at the 229 West 43rd Street Retail Condo property, each of which is in a free rent period for which $11,061,751 was reserved with lender at loan origination. |
| Tenant Summary(1) | |||||||||||
| Tenant | Ratings(2) Fitch/Moody’s/S&P | Net Rentable Area (SF) | % of Total NRA | Base Rent PSF | % of Total Base Rent | Lease Expiration Date | |||||
| Bowlmor Times Square, LLC | NA / NA / NA | 77,536 | 31.2% | $63.84 | 20.5% | 7/31/2034 | |||||
| National Geographic(2) | NA / NA / NA | 59,137 | 23.8% | $101.46 | 24.9% | 10/31/2032 | |||||
| Gulliver’s Gate(3) | NA / NA / NA | 49,000 | 19.7% | $117.35 | 23.8% | 1/31/2031 | |||||
| Guitar Center Stores, Inc. | NA / NA / NA | 28,119 | 11.3% | $61.52 | 7.2% | 1/31/2029 | |||||
| Guy’s American Kitchen | NA / NA / NA | 15,670 | 6.3% | $118.25 | 7.7% | 11/30/2032 | |||||
| OHM (American Market by Todd English)(4) | NA / NA / NA | 11,970 | 4.8% | $192.15 | 9.5% | 7/31/2031 | |||||
| Haru Broadway Corp. | NA / NA / NA | 5,300 | 2.1% | $225.00 | 4.9% | 12/31/2028 | |||||
| Los Tacos No.1(5) | NA / NA / NA | 1,725 | 0.7% | $208.70 | 1.5% | 11/30/2031 | |||||
| (1) | Based on the underwritten rent roll dated October 1, 2016. |
| (2) | National Geographic signed a 16-year lease for its space on June 14, 2016. The tenant took possession of its space in October 2016 and is expected to open for business in August 2017. The tenant is in a free rent period until October 8, 2017, and the related rent was reserved with lender at loan origination. |
| (3) | Gulliver’s Gate signed a 15-year lease for its space on November 9, 2015. The tenant took possession of its space in January 2016 and is expected to open for business in the spring of 2017. The tenant was in a free rent period until January 4, 2017, and the related rent was reserved with lender at loan origination. |
| (4) | OHM (American Market by Todd English) signed a 15-year lease for its space on August 1, 2016. The tenant is took possession of its space in March 2017 and is expected to open for business in April 2017. The tenant is in a free rent period until November 1, 2017, and the related rent was reserved with lender at loan origination. |
| (5) | Los Tacos No.1 signed a 15-year lease for its space on June 8, 2016. The tenant took possession of its space in December 2016 and is expected to open for business in July 2017. The tenant is in a free rent period until September 1, 2017, and the related rent was reserved with lender at loan origination. |
| Lease Rollover Schedule(1)(2) | ||||||||||||||
Year | Number of | Net Rentable | % of NRA | Base Rent | % of Base | Cumulative | Cumulative | Cumulative | Cumulative | |||||
| Vacant | NAP | 0 | 0.0 | % | NAP | NAP | 0 | 0.0% | NAP | NAP | ||||
| 2017 & MTM | 0 | 0 | 0.0 | $0 | 0.0 | % | 0 | 0.0% | $0 | 0.0% | ||||
| 2018 | 0 | 0 | 0.0 | 0 | 0.0 | 0 | 0.0% | $0 | 0.0% | |||||
| 2019 | 0 | 0 | 0.0 | 0 | 0.0 | 0 | 0.0% | $0 | 0.0% | |||||
| 2020 | 0 | 0 | 0.0 | 0 | 0.0 | 0 | 0.0% | $0 | 0.0% | |||||
| 2021 | 0 | 0 | 0.0 | 0 | 0.0 | 0 | 0.0% | $0 | 0.0% | |||||
| 2022 | 0 | 0 | 0.0 | 0 | 0.0 | 0 | 0.0% | $0 | 0.0% | |||||
| 2023 | 0 | 0 | 0.0 | 0 | 0.0 | 0 | 0.0% | $0 | 0.0% | |||||
| 2024 | 0 | 0 | 0.0 | 0 | 0.0 | 0 | 0.0% | $0 | 0.0% | |||||
| 2025 | 0 | 0 | 0.0 | 0 | 0.0 | 0 | 0.0% | $0 | 0.0% | |||||
| 2026 | 0 | 0 | 0.0 | 0 | 0.0 | 0 | 0.0% | $0 | 0.0% | |||||
| 2027 | 0 | 0 | 0.0 | 0 | 0.0 | 0 | 0.0% | $0 | 0.0% | |||||
| 2028 & Beyond | 8 | 248,457 | 100.0 | 24,135,419 | 100.0 | 248,457 | 100.0% | $24,135,419 | 100.0% | |||||
| Total | 8 | 248,457 | 100.0 | % | $24,135,419 | 100.0 | % | |||||||
| (1) | Based on the underwritten rent roll. |
| (2) | Certain tenants may have contraction options that may be exercisable prior to the originally stated expiration date of the tenant lease that are not considered above. |
THE INFORMATION IN THIS STRUCTURAL AND COLLATERAL TERM SHEET IS NOT COMPLETE AND MAY BE AMENDED PRIOR TO THE TIME OF SALE. THIS TERM SHEET IS NOT AN OFFER TO SELL THESE SECURITIES AND IT IS NOT A SOLICITATION OF AN OFFER TO BUY THESE SECURITIES IN ANY JURISDICTION WHERE THE OFFER OR SALE IS NOT PERMITTED.
| 19 of 139 | |
| Structural and Collateral Term Sheet | JPMDB 2017-C5 |
| 229 West 43rd Street Retail Condo | |
| Operating History and Underwritten Net Cash Flow(1) | ||||||||||||
2013 | 2014 | T-10 Ann.(2) | Underwritten(3) | Per Square Foot | %(4) | |||||||
| Rents In Place | $14,741,197 | $16,019,885 | $16,863,101 | 24,135,419 | $97.14 | 95.0 | % | |||||
| Vacant Income | 0 | 0 | 0 | 0 | 0.00 | 0.0 | ||||||
| Gross Potential Rent | $14,741,197 | $16,019,885 | $16,863,101 | $24,135,419 | $97.14 | 95.0 | % | |||||
| Total Reimbursements | 2,670,754 | 2,443,708 | 782,785 | 1,261,739 | 5.08 | 5.0 | ||||||
| Net Rental Income | $17,411,951 | $18,463,593 | $17,645,886 | $25,397,158 | $102.22 | 100.0 | % | |||||
| (Vacancy & Credit Loss) | (739,044) | (1,070,219) | 0 | 0 | 0.00 | (0.0) | ||||||
| Effective Gross Income | $16,672,907 | $17,393,374 | $17,645,886 | $25,397,158 | $102.22 | 100.0 | % | |||||
| Total Expenses | $7,051,784 | $5,444,159 | $3,870,185 | $3,895,157 | $15.68 | 15.3 | % | |||||
| Net Operating Income | $9,621,123 | $11,949,215 | $13,775,701 | $21,502,001 | $86.54 | 84.7 | % | |||||
| Total TI/LC, Capex/RR | 0 | 0 | 0 | 1,294,346 | 5.21 | 5.1 | ||||||
| Net Cash Flow | $9,621,123 | $11,949,215 | $13,775,701 | $20,207,655 | $81.33 | 79.6 | % | |||||
| (1) | 2015 figures are not available due to the borrowers’ acquisition of the 229 West 43rd Street Retail Condo property in October 2015. |
| (2) | T-10 Ann. column represents the trailing 10-month period ending on August 31, 2016 annualized. |
| (3) | The increase in Underwritten Net Cash Flow is due to 121,832 square feet of recent leasing at the 229 West 43rd Street Retail Condo property (49.0% of net rentable area and 59.7% of underwritten base rent). |
| (4) | % column represents percentage of Net Rental Income for all revenue line items and represents percentage of Effective Gross Income for the remainder of the fields. |
Property Management. The 229 West 43rd Street Retail Condo property is managed by Westminster Management, LLC, an affiliate of the borrowers.
Escrows and Reserves. At loan origination, the borrowers deposited $14,492,159 into a tenant improvement and leasing commissions reserve account for tenant improvements, leasing commissions and landlord work in connection with the National Geographic, Gulliver’s Gate, OHM and Los Tacos No. 1 leases, $11,061,751 into a free rent reserve account in connection with free rent periods under the National Geographic, Gulliver’s Gate, OHM and Los Tacos No. 1 leases, $651,564 into a tax reserve account and $18,983 into an insurance reserve account, $48,329 into a bridge rent reserve account in connection with the Los Tacos No. 1 lease and $23,000 into a required repairs account, which represents 115% of the estimated costs.
Tax Escrows- On a monthly basis, the borrowers are required to deposit reserves of 1/12 of the estimated annual real estate taxes, which currently equates to $126,690.
Insurance Escrows - Provided that an acceptable blanket policy is no longer in place, on a monthly basis, the borrowers are required to escrow 1/12 of annual insurance premiums.
Replacement Reserves– On a monthly basis, the borrowers are required to escrow $6,211 (approximately $0.20 per square foot annually) into a replacement reserve. The replacement reserve is not subject to a cap.
Lockbox / Cash Management.The 229 West 43rd Street Retail Condo Whole Loan is structured with a hard lockbox and in-place cash management. The borrowers were required to send tenant direction letters to all tenants instructing them to deposit all rents and other payments into the clearing account controlled by the lender. All funds in the clearing account are required to be transferred on a daily basis into a deposit account established and maintained by the lender, and applied to all required payments and reserves as set forth in the 229 West 43rd Street Retail Condo Whole Loan documents. Provided no Trigger Period (as defined below) is continuing, excess cash in the deposit account will be disbursed to the borrowers in accordance with the 229 West 43rd Street Retail Condo Whole Loan documents.
A “Trigger Period” will commence upon the occurrence of (i) an event of default, (ii) the debt service coverage ratio, as of any calculation date, falling below 1.75x based on the 229 West 43rd Street Retail Condo Whole Loan balance or 1.10x based on the total debt (including the mezzanine loan balance), (iii) a mezzanine loan default, (iv) a Lease Sweep Period (as defined herein) or (v) receipt by the lender of a mezzanine loan trigger period commencement notice and will end upon (a) with respect to clause (i), the date on which such event of default is cured, (b) with respect to clause (ii), the debt service coverage ratio is at least 1.75x based on the whole loan balance or 1.10x based on the total debt (including the mezzanine loan balance), in each case, for two consecutive calendar quarters, (c) with respect to clause (iii), the receipt by lender of a mezzanine loan default revocation notice, (d) with respect to clause (iv), such Lease Sweep Period has ended or (e) with respect to clause (v), provided no other Trigger Period is continuing, receipt by lender of a mezzanine loan trigger period termination notice.
THE INFORMATION IN THIS STRUCTURAL AND COLLATERAL TERM SHEET IS NOT COMPLETE AND MAY BE AMENDED PRIOR TO THE TIME OF SALE. THIS TERM SHEET IS NOT AN OFFER TO SELL THESE SECURITIES AND IT IS NOT A SOLICITATION OF AN OFFER TO BUY THESE SECURITIES IN ANY JURISDICTION WHERE THE OFFER OR SALE IS NOT PERMITTED.
| 20 of 139 | |
| Structural and Collateral Term Sheet | JPMDB 2017-C5 |
| 229 West 43rd Street Retail Condo | |
A “Lease Sweep Period” will commence, with respect to any lease for space at the 229 West 43rd Street Retail Condo property, upon the first monthly payment following (i) the day following the latest date under the lease by which the related tenant is required to give notice of its exercise of a renewal option (and such option has not been exercised), (ii) the date that the lease is surrendered, cancelled or terminated (or borrowers receive notice of such) prior to its then current expiration date, (iii) the date on which a tenant discontinues its business for 30 continuous days (other than for repair, maintenance or renovations or a sublease or assignment of the lease permitted by the 229 West 43rd Street Retail Condo Whole Loan Documents), (iv) a tenant being in default, in the payment of base rent under its lease, for two consecutive calendar months beyond any applicable notice and cure period (other than as a result of approved lease modifications or good faith disputes regarding expense reimbursements) or the occurrence of any other material default under the lease that remains uncured for 60 days after notice and (v) a bankruptcy or insolvency proceeding of the tenant, its parent or lease guarantor.
A Lease Sweep Period will end upon the earlier to occur of the date that: (a) with respect to clauses (i) through (v) above, (1) the entire space demised under the subject lease has been re-tenanted pursuant to one or more leases entered into in accordance with the 229 West 43rd Street Retail Condo Whole Loan documents and, in lender’s reasonable judgment, sufficient funds have been accumulated in the lease sweep reserve to cover all anticipated tenant improvement and leasing commissions and other landlord obligations, including free and/or abated rent, (2) the funds in the lease sweep reserve with respect to the subject lease are equal to the sum of (x) $100 per square foot of the leased space, plus (y) an amount equal to lender’s reasonable estimate of the amount likely to be incurred in connection with leasing the related space (including free rent related to the new lease or leases), if any (such amounts, “Re-Leasing Expenses”), (3) in the case of a tenant space that has been partially re-tenanted, all of conditions of clause (1) above have been met with respect to the leased portion and all of the conditions of clause (2) above have been met with respect to the remaining space, or (4) lender has waived the Lease Sweep Period; (b) in the case of clause (i) above, the date on which the subject tenant either (x) irrevocably extends or renews its lease after a waiver by the borrowers or (y) enters into a lease extension or renewal with borrowers that is acceptable to lender in lender’s reasonable discretion with respect to all or substantially all of its space, and in lender’s judgment, sufficient funds have been accumulated in the lease sweep reserve to cover all Re-Leasing Expenses in connection with such renewal or extension; (c) in the case of clause (ii) above based on a tenant’s delivery of notice of its intention to terminate, cancel or surrender its lease, if such option is not exercised by the related tenant by the latest exercise date specified in the related lease or is otherwise validly waived or revoked in writing by the applicable tenant; (d) in the case of clause (iii) above, the date on which the subject tenant re-opens for business in all of its leased space and continually operates for three months; (e) in the case of clause (iv) above, the date on which the subject default has been cured, and no other monetary or material non-monetary default under such lease occurs for a period of three consecutive months following such cure; and (f) in the case of clause (v) above, the applicable bankruptcy or insolvency proceeding has terminated in accordance with the terms of the 229 West 43rd Street Retail Condo Whole Loan documents.
The Condominium.The 229 West 43rd Street Condominium board of directors has five board members, two of which are appointed by the borrowers. Pursuant to the related 229 West 43rd Street Condominium documents, (i) the borrowers have the right to make decisions that relate solely to the Retail Condominium Unit, (ii) the borrowers have the right to vote on major decisions, including amendments to quorum requirements for voting, decisions that affect insurance or decisions that adversely affect the use, operation or leasing of the Retail Condominium Unit, (iii) if 75% or more of the building is damaged by a casualty, a 75% vote of the board is required for a decision not to proceed with restoration, and (iv) any amendment to the declaration or by-laws require unanimous written consent and consent of lender (as a registered mortgagee).
Additional Debt. Two mezzanine loans, with an aggregate original principal balance of $85,000,000 were funded concurrently with the funding of the 229 West 43rd Street Retail Condo Whole Loan. The Mezzanine A loan has an original principal balance of $55,000,000, accrues interest at a rate of 7.00000% and is senior to the Mezzanine B Loan. The Mezzanine B loan has an original principal balance of $30,000,000 and accrues interest at a rate of 9.60670%. Both the Mezzanine A and Mezzanine B loans are coterminous with the 229 West 43rd Street Retail Condo Whole Loan and are interest only for their terms. The Mezzanine A loan and a 50% participation interest in the Mezzanine B loan is currently held by Paramount Group, Inc. and the remainder of the Mezzanine B loan is currently held by SL Green Realty Corp.
THE INFORMATION IN THIS STRUCTURAL AND COLLATERAL TERM SHEET IS NOT COMPLETE AND MAY BE AMENDED PRIOR TO THE TIME OF SALE. THIS TERM SHEET IS NOT AN OFFER TO SELL THESE SECURITIES AND IT IS NOT A SOLICITATION OF AN OFFER TO BUY THESE SECURITIES IN ANY JURISDICTION WHERE THE OFFER OR SALE IS NOT PERMITTED.
| 21 of 139 | |
| Structural and Collateral Term Sheet | JPMDB 2017-C5 |
| 350 Park Avenue |

THE INFORMATION IN THIS STRUCTURAL AND COLLATERAL TERM SHEET IS NOT COMPLETE AND MAY BE AMENDED PRIOR TO THE TIME OF SALE. THIS TERM SHEET IS NOT AN OFFER TO SELL THESE SECURITIES AND IT IS NOT A SOLICITATION OF AN OFFER TO BUY THESE SECURITIES IN ANY JURISDICTION WHERE THE OFFER OR SALE IS NOT PERMITTED.
| 22 of 139 | |
| Structural and Collateral Term Sheet | JPMDB 2017-C5 |
| 350 Park Avenue |
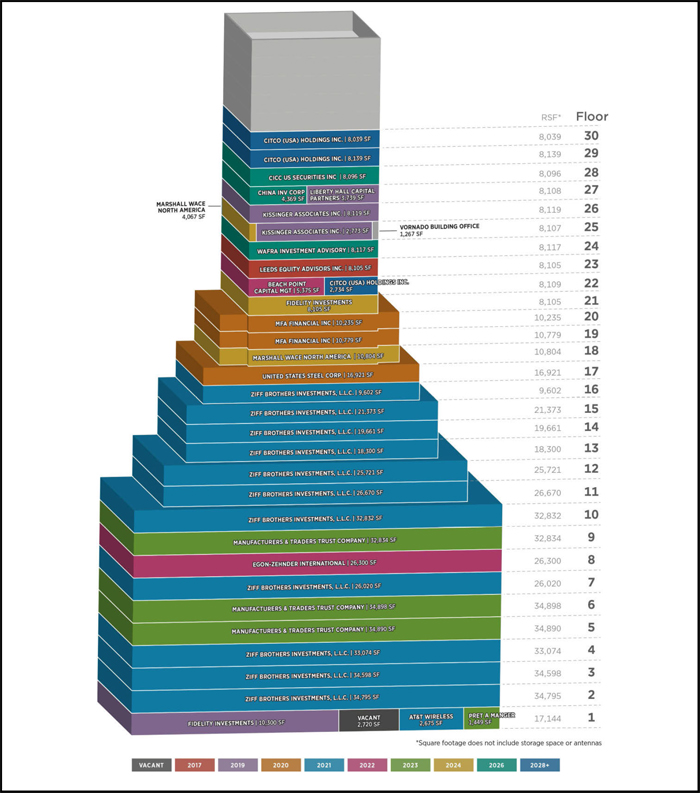
THE INFORMATION IN THIS STRUCTURAL AND COLLATERAL TERM SHEET IS NOT COMPLETE AND MAY BE AMENDED PRIOR TO THE TIME OF SALE. THIS TERM SHEET IS NOT AN OFFER TO SELL THESE SECURITIES AND IT IS NOT A SOLICITATION OF AN OFFER TO BUY THESE SECURITIES IN ANY JURISDICTION WHERE THE OFFER OR SALE IS NOT PERMITTED.
| 23 of 139 | |
| Structural and Collateral Term Sheet | JPMDB 2017-C5 |
| 350 Park Avenue |
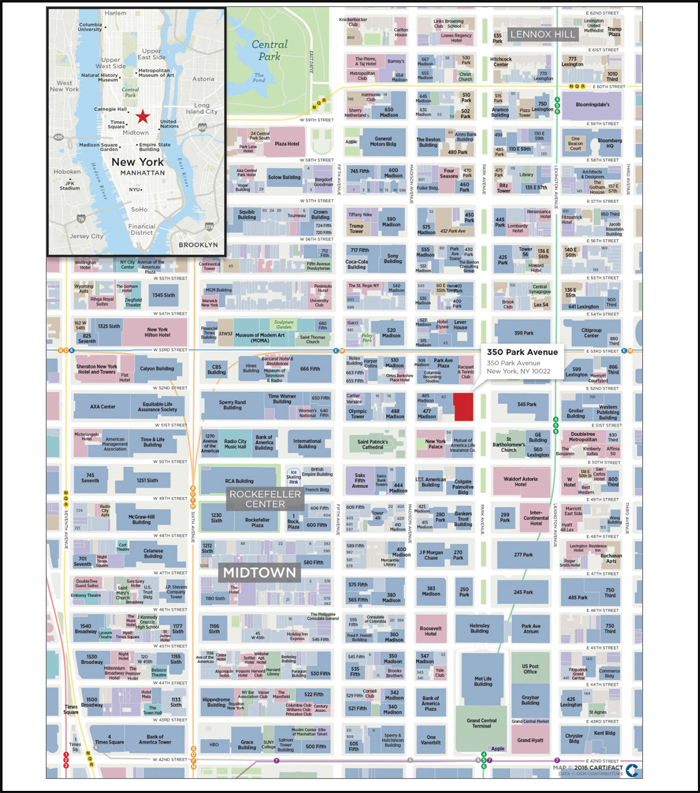
THE INFORMATION IN THIS STRUCTURAL AND COLLATERAL TERM SHEET IS NOT COMPLETE AND MAY BE AMENDED PRIOR TO THE TIME OF SALE. THIS TERM SHEET IS NOT AN OFFER TO SELL THESE SECURITIES AND IT IS NOT A SOLICITATION OF AN OFFER TO BUY THESE SECURITIES IN ANY JURISDICTION WHERE THE OFFER OR SALE IS NOT PERMITTED.
| 24 of 139 | |
| Structural and Collateral Term Sheet | JPMDB 2017-C5 |
| 350 Park Avenue |
| Mortgage Loan Information | Property Information | |||
| Mortgage Loan Seller(1): | GACC | Single Asset / Portfolio: | Single Asset | |
| Original Principal Balance(2): | $66,667,200 | Title: | Fee | |
| Cut-off Date Principal Balance(2): | $66,667,200 | Property Type - Subtype: | Office - CBD | |
| % of Pool by IPB: | 6.4% | Net Rentable Area (SF): | 570,784 | |
| Loan Purpose: | Refinance | Location: | New York, NY | |
| Borrower: | 350 Park EAT LLC | Year Built / Renovated: | 1961 / 2012 | |
| Sponsor: | Vornado Realty Trust | Occupancy(3): | 99.1% | |
| Interest Rate: | 3.91513% | Occupancy Date: | 11/1/2016 | |
| Note Date: | 12/2/2016 | Number of Tenants: | 54 | |
| Maturity Date: | 1/6/2027 | 2013 NOI: | $29,661,558 | |
| Interest-only Period: | 121 months | 2014 NOI: | $32,906,446 | |
| Original Term: | 121 months | 2015 NOI: | $34,526,344 | |
| Original Amortization: | None | TTM NOI (as of 10/2016): | $35,462,223 | |
| Amortization Type: | Interest Only | UW Economic Occupancy: | 95.0% | |
| Call Protection: | L(27),Def(87),O(7) | UW Revenues: | $58,443,166 | |
| Lockbox / Cash Management: | Hard / Springing | UW Expenses: | $22,786,342 | |
| Additional Debt: | Yes | UW NOI: | $35,656,824 | |
| Additional Debt Balance: | $229,320,800 / $104,012,000 | UW NCF(3): | $35,023,512 | |
| Additional Debt Type: | Pari Passu / Subordinate Debt | Appraised Value / Per SF: | $710,000,000 / $1,244 | |
| Appraisal Date: | 11/1/2016 | |||
| Escrows and Reserves(4) | Financial Information(2) | ||||||
| Initial | Monthly | Initial Cap | Pari Passu Debt | Whole Loan | |||
| Taxes: | $0 | Springing | N/A | Cut-off Date Loan / SF: | $519 | $701 | |
| Insurance: | $0 | Springing | N/A | Maturity Date Loan / SF: | $519 | $701 | |
| Replacement Reserves: | $0 | Springing | $228,314 | Cut-off Date LTV: | 41.7% | 56.3% | |
| TI/LC: | $1,829,270 | Springing | $2,283,136 | Maturity Date LTV: | 41.7% | 56.3% | |
| Other: | $1,413,328 | Springing | $25,000,000 | UW NCF DSCR: | 2.98x | 2.21x | |
| UW NOI Debt Yield: | 12.0% | 8.9% | |||||
| Sources and Uses | |||||||
| Sources | Proceeds | % of Total | Uses | Proceeds | % of Total | |
| Whole Loan(1) | $400,000,000 | 100.0% | Payoff Existing Debt | $283,818,010 | 71.0% | |
| Return of Equity | 106,910,068 | 26.7 | ||||
| Closing Costs | 6,029,324 | 1.5 | ||||
| Upfront Reserves | 3,242,598 | 0.8 | ||||
| Total Sources | $400,000,000 | 100.0% | Total Uses | $400,000,000 | 100.0% |
| (1) | The 350 Park Avenue Whole Loan was co-originated by Deutsche Bank AG, New York Branch and Goldman Sachs Mortgage Company (“GSMC”). |
| (2) | The 350 Park Avenue loan is part of a whole loan evidenced by four seniorpari passu notes with an outstanding aggregate principal balance of $295,988,000 (the “350 Park Avenue Senior Loans”) and two subordinate notes with an outstanding principal balance of $104,012,000 (the “350 Park Avenue Junior Loans”). The Pari Passu Debt Financial Information presented in the chart above reflects the Cut-off Date balance of the 350 Park Avenue Senior Loans. The Whole Loan Financial Information presented in the chart above reflects the Cut-off Date balance of the $400 million 350 Park Avenue Whole Loan, as defined in “The Loan” below. |
| (3) | Occupancy includes 8,039 square feet of space for which CITCO (USA) Holdings Inc. (“CITCO Holdings”) has executed a lease but not yet taken occupancy or begun paying rent. The 8,039 square feet is occupied by Peconic Partners LLC, which is expected to vacate in August 2017, and CITCO Holdings is expected to take occupancy and begin paying rent in November 2017. In addition, CITCO Holdings directly leases 14,825 square feet and subleases 20,038 square feet. We cannot assure you that this tenant will take occupancy or begin paying rent as anticipated or at all. Occupancy and UW NOI exclude Valley National Bank (2,720 square feet) which is dark but paying rent. |
| (4) | For a full description of Escrows and Reserves, please refer to “Escrows and Reserves” below. |
THE INFORMATION IN THIS STRUCTURAL AND COLLATERAL TERM SHEET IS NOT COMPLETE AND MAY BE AMENDED PRIOR TO THE TIME OF SALE. THIS TERM SHEET IS NOT AN OFFER TO SELL THESE SECURITIES AND IT IS NOT A SOLICITATION OF AN OFFER TO BUY THESE SECURITIES IN ANY JURISDICTION WHERE THE OFFER OR SALE IS NOT PERMITTED.
| 25 of 139 | |
| Structural and Collateral Term Sheet | JPMDB 2017-C5 |
| 350 Park Avenue |
The Loan. The 350 Park Avenue loan is secured by a first mortgage lien on the borrower���s fee interest in a 30-story, 570,784 square foot office building located in New York, New York. The whole loan was co-originated by Deutsche Bank AG, New York Branch and Goldman Sachs Mortgage Company, and has an outstanding principal balance as of the Cut-off Date of $400.0 million (the “350 Park Avenue Whole Loan”) and is comprised of (i) the 350 Park Avenue Senior Loans with an aggregate outstanding principal balance as of the Cut-off Date of $295,988,000 and (ii) the 350 Park Avenue Junior Loans, with an aggregate outstanding principal balance as of the Cut-off Date of $104,012,000. The senior Note A-1 was contributed to the VNDO Trust 2016-350P securitization that governs the servicing and administration of the 350 Park Avenue Whole Loan and is the controlling note under the related intercreditor agreement, the rights of which will be exercised by the related trustee (or, prior to the occurrence and continuance of a control termination event under the related trust and servicing agreement (the “VNDO Trust 2016-350P Trust and Servicing Agreement”), the directing certificateholder under the VNDO Trust 2016-350P Trust and Servicing Agreement). However, the JPMDB 2017-C5 Trust will be entitled, under certain circumstances, to be consulted with respect to certain major decisions. The 350 Park Avenue Whole Loan has a 121-month term and is interest-only for the entire term of the loan. The most recent prior financing of the 350 Park Avenue property was included in the WBCMT 2007-C30 securitization.
| Whole Loan Summary | |||||
| Notes | Original Balance | Cut-off Date Balance | Note Holder(1) | Controlling Piece | |
| A-1, A-3, B-1, B-2 | 233,332,000 | 233,332,000 | VNDO Trust 2016-350P | Yes | |
| A-2 | 100,000,800 | 100,000,800 | GSMC | No | |
| A-4 | $66,667,200 | $66,667,200 | JPMDB 2017-C5 | No | |
| Total | $400,000,000 | $400,000,000 | |||
| (1) | The non-controlling Note A-2 is currently held by GSMC and is expected to be contributed to the GSMS 2017-GS5 trust. |
The Borrower. The borrowing entity for the 350 Park Avenue Whole Loan is 350 Park EAT LLC, a Delaware limited liability company and special purpose entity.
The Loan Sponsor. The loan sponsor is Vornado Realty Trust. The borrower is 94.0% indirectly owned and controlled by Vornado Realty Trust. Other than the borrower, no person or entity guarantees the nonrecourse carve-outs with respect to the 350 Park Avenue Whole Loan. Vornado Realty Trust is a fully integrated, publicly traded REIT (NYSE: VNO; member of the S&P 500 Index). As of September 30, 2016, Vornado Realty Trust owned (wholly, or partially through joint ventures) more than 20.2 million square feet across 36 office properties in Manhattan and had a total enterprise value of approximately $32 billion. Vornado Realty Trust’s Manhattan office portfolio has been over 95.0% occupied over the last 10 years.
The Property. The 350 Park Avenue property is a 30-story, 570,784 square foot, Class A office tower located in Manhattan’s Plaza District, or more specifically the Park Avenue submarket. 350 Park Avenue encompasses the entire westerly block-front on Park Avenue between East 51st Street and East 52nd Street. The 350 Park Avenue property is located approximately a half mile from Grand Central Terminal. The 350 Park Avenue property was built in 1961 and was acquired by the loan sponsor in 2006 for approximately $540.0 million. Since acquiring the 350 Park Avenue property, the loan sponsor has invested more than $20.0 million in structural and non-structural capital improvements, including lobby and common area renovations, new windows and the installment of landscaped terraces on the setbacks of the 16th and 18th floors. The office component (excluding 12,283 square feet of storage space) represents 541,352 square feet, and is 100.0% occupied. The 350 Park Avenue property also includes 17,144 square feet of ground floor retail space, which is currently 84.1% occupied by three tenants. The remaining 2,720 square feet of ground floor retail space is currently leased by Valley National Bank, which is dark but paying rent and excluded from occupancy and the underwriting analysis. As of November 1, 2016, total occupancy at the 350 Park Avenue property was 99.1%.
Approximately 21.8% of the net rentable area at the 350 Park Avenue property is occupied by investment grade tenants such as Manufacturer & Traders Trust Company, Fidelity Investments and AT&T Wireless, that contribute a combined 22.0% of underwritten total rent.
Four of the top tenants have executed multiple renewal and expansion options. Manufacturers & Traders Trust Company, the second largest tenant by underwritten base rent, occupies 102,622 square feet and renewed its lease for an additional 10 years in 2013 and has occupied space in the building since 1993. CITCO Holdings, the third largest tenant by underwritten base rent, leases 14,825 square feet, sub-leases an additional 20,038 square feet of space from Ziff Brothers Investments, L.L.C. (“ZBI”) on the 13th floor and has executed a lease for the penthouse suite (8,039 square feet) for $160 per square foot starting in November 2017. Fidelity Investments has occupied both its retail and office space since 1986 and AT&T Wireless (“AT&T”) has occupied its retail space in the building since 2000.
THE INFORMATION IN THIS STRUCTURAL AND COLLATERAL TERM SHEET IS NOT COMPLETE AND MAY BE AMENDED PRIOR TO THE TIME OF SALE. THIS TERM SHEET IS NOT AN OFFER TO SELL THESE SECURITIES AND IT IS NOT A SOLICITATION OF AN OFFER TO BUY THESE SECURITIES IN ANY JURISDICTION WHERE THE OFFER OR SALE IS NOT PERMITTED.
| 26 of 139 | |
| Structural and Collateral Term Sheet | JPMDB 2017-C5 |
| 350 Park Avenue |
ZBI, the largest tenant at the 350 Park Avenue Property, currently leases 287,030 square feet, representing approximately 50.3% of rentable square feet at the 350 Park Avenue property, and subleases approximately 55.3% of its space to seven tenants (See “—Subleasing” table below). ZBI occupies floors 2-4 and parts of floor 7 and 12 along with lower level storage. ZBI subleases part of floors 7 and 12 and all of floors 10, 11 and 13-16. The ZBI subleases are scheduled to expire on March 31, 2021, with no renewal options.
| Subleasing(1) | |||||||
| Sublease | ZBI | ||||||
Subtenant | Floor | Lease | Square | UW Base | UW Base | UW Base | UW Base |
| Egon-Zehnder International | 7 | 2021 | 14,028 | $1,052,100 | $75.00 | $1,402,800 | $100.00 |
| Citadel | 10 | 2021 | 32,893 | 2,466,975 | 75.00 | 2,368,296 | 72.00 |
| Raymond James | 11 & 12 | 2021 | 38,660 | 2,899,500 | 75.00 | 2,493,570 | 64.50 |
| CITCO (USA) Holdings Inc. | 13 | 2021 | 20,038 | 1,502,850 | 75.00 | 1,292,451 | 64.50 |
| Security Benefit Corporation | 14 | 2021 | 21,485 | 1,611,375 | 75.00 | 1,385,783 | 64.50 |
| Square Mile Capital | 15 | 2021 | 21,485 | 1,568,405 | 73.00 | 2,664,140 | 124.00 |
| Wafra Investment | 16 | 2021 | 10,258 | 810,382 | 79.00 | 1,271,992 | 124.00 |
| Total / Wtd. Avg. | 158,847 | $11,911,587 | $74.99 | $12,879,032 | $81.08 | ||
| (1) | Square Feet in the chart above represent re-measured square feet at the time of the respective sublease. |
| (2) | ZBI’s base rent is calculated by multiplying UW Base Rent per square foot by the subleased square feet. |
As of November 1, 2016, the 350 Park Avenue property is 99.1% leased by 54 tenants. The largest tenant, ZBI, occupies 50.3% of net rentable area through April 30, 2021. ZBI is a hedge fund that was founded in 1992 and is the investment vehicle of the Ziff family. The parent company of ZBI is Ziff Brothers Investments Inc. The firm seeks to invest in various securities including equities, debt, real estate, commodities, private equity and hedge funds. ZBI leases 287,030 square feet (including 4,384 square feet of storage) under its lease that is scheduled to expire in April 2021. ZBI first took occupancy at the property in 2005 (107,630 square feet) and since then expanded several times. ZBI subleases approximately 55.3% of its space (158,847 square feet) to seven tenants as described above.
The second largest tenant, Manufacturers & Traders Trust Company, rated A2/A/A by Moody’s, S&P and Fitch, respectively, occupies 18.0% of net rentable area through March 31, 2023. Manufacturers & Traders Trust Company is the parent company of M&T Bank, a regional bank founded more than 150 years ago. M&T Bank is headquartered in Buffalo, New York but has operations in New York City. Manufacturers & Traders Trust Company is the second largest tenant at the property (by square feet and base rent) and recently renewed its lease for a 10-year term in 2013. The bank originally moved into the building in 1993.
The third largest tenant, Egon-Zehnder International, occupies 4.6% of net rentable area through May 31, 2022. Egon-Zehnder International provides board advisory, CEO and leadership succession planning, executive search and assessment, and leadership development services. The company was founded in 1964 and is based in New York, New York with offices and consultants in Africa, the Americas, the Asia Pacific, Europe, and the Middle East. Egon-Zehnder International has been a tenant at the property since 1997.
The 350 Park Avenue property is located on the westerly block front of Park Avenue between 51st and 52nd Streets. The 350 Park Avenue Property is located in the Plaza District, or more specifically the Park Avenue office submarket. The Plaza District is generally bounded by 47th Street to the south and 65th Street to the north and from Avenue of the Americas to Park Avenue.
According to the appraisal, the average direct primary, Class A, asking rental rate in the four Plaza District statistical areas averaged $100.35 per square foot in the third quarter of 2016, higher than the direct primary Midtown average of $88.27 per square foot. The direct vacancy rate for Class A space in the Plaza District statistical areas was 8.7% in the third quarter of 2016, compared to the direct Midtown Class A vacancy rate of 8.5%.
THE INFORMATION IN THIS STRUCTURAL AND COLLATERAL TERM SHEET IS NOT COMPLETE AND MAY BE AMENDED PRIOR TO THE TIME OF SALE. THIS TERM SHEET IS NOT AN OFFER TO SELL THESE SECURITIES AND IT IS NOT A SOLICITATION OF AN OFFER TO BUY THESE SECURITIES IN ANY JURISDICTION WHERE THE OFFER OR SALE IS NOT PERMITTED.
| 27 of 139 | |
| Structural and Collateral Term Sheet | JPMDB 2017-C5 |
| 350 Park Avenue |
The appraisal identified six directly comparable office properties, which are summarized below.
| Competitive Set(1) | |||||
Property | Office Area | Direct | Sublease | % Occupied | % Occupied |
| 200 Park Avenue | 2,254,274 | 12,352 | 13,535 | 99.5% | 98.9% |
| 277 Park Avenue | 1,529,945 | 35,420 | 0 | 97.7% | 97.7% |
| 300 Park Avenue | 690,800 | 0 | 0 | 100.0% | 100.0% |
| 320 Park Avenue | 716,683 | 58,710 | 4,516 | 91.8% | 91.2% |
| 345 Park Avenue | 1,600,519 | 0 | 0 | 100.0% | 100.0% |
| 399 Park Avenue | 1,250,000 | 48,859 | 97,308 | 96.1% | 88.3% |
| Total/Wtd. Avg. | 8,042,221 | 155,341 | 155,359 | 98.1% | 96.7% |
| (1) | Source: Appraisal. |
The following table presents certain information relating to comparable office leasing for the 350 Park Avenue property:
| Office Lease Comparables(1) | ||||||||||
| Address | Tenant | Lease Date | SF | Floor | Term (yrs) | Actual Base Rent PSF | Free Rent (mos) | TI PSF | Effective Rent PSF | Adjusted Rent PSF(1) |
| 500 Park Avenue | The Georgetown Company | Sep-2016 | 18,795 | 10 | 12 | $86.50 | 12 | $100.00 | $83.17 | $87.33 |
| 399 Park Avenue | Epoch Investments | Sep-2016 | 5,843 | 32 (Partial) | 6 | $95.00 | 6 | $20.00 | $109.58 | $98.63 |
| 280 Park Avenue | Ruton Capital Management | Jul-2016 | 8,941 | 20 | 10 | $115.00 | 6 | $100.00 | $116.75 | $110.91 |
| 300 Park Avenue | EnTrustPermal | Jul-2016 | 18,909 | 16 (Partial) | 8 | $72.50 | 8 | $30.00 | $79.27 | $83.23 |
| 399 Park Avenue | Morgan Stanley | Jul-2016 | 110,025 | 12, 23, 24 | 10 | $108.50 | 10 | $90.00 | $107.31 | $112.67 |
| 505 Park Avenue | Spurrier Capital | Jun-2016 | 9,404 | 16 | 10 | $74.00 | 6 | $75.00 | $76.20 | $83.82 |
| 499 Park Avenue | M. Safria & Co. | Jun-2016 | 22,606 | 10, 11 | 5 | $92.00 | 3 | $55.00 | $106.80 | $101.46 |
| 277 Park Avenue | Visa | Apr-2016 | 24,618 | 50 | 10 | $116.00 | 11 | $75.00 | $115.47 | $109.69 |
| 299 Park Avenue | UBS | Mar-2016 | 117,996 | 8, 9, 24, 25 | 13.50 | $87.50 | 12 | $70.00 | $86.76 | $91.10 |
| 430 Park Avenue | Withers Bergman | Mar-2016 | 4,110 | 8 (Partial) | 11 | $75.00 | 8 | $62.50 | $77.05 | $80.90 |
| (1) | Source: Appraisal. Reflects appraisal’s adjustments to rent for various economic factors. |
The following table presents certain information relating to comparable retail leasing for the 350 Park Avenue property:
| Retail Lease Comparables(1) | ||||||||||
Address | Tenant | Lease | SF | Floor | Term (yrs) | Actual | Free Rent (mos) | TI PSF | Effective | Adjusted Rent PSF(1) |
| 374 Park Avenue | Union Bank | Sep-2016 | 3,330 | Grade | 10 | $365.00 | 6 | $0.00 | $365.00 | $365.00 |
| 475 Park Avenue | Macklowe Gallery | Sep-2016 | 2,500 | Grade | 10 | $235.00 | 6 | $0.00 | $235.00 | $270.25 |
| 475 Park Avenue | Forum Gallery | Sep-2016 | 3,240 | Grade | 10 | $235.00 | 6 | $0.00 | $235.00 | $258.50 |
| 7 E. 53rd Street | Le Pain Quotidien | Jun-2016 | 3,100 | Grade | 12 | $185.00 | 6 | $0.00 | $185.00 | $185.00 |
| 142 East 49th Street | Blo Dry Bar | Mar-2016 | 542 | Grade | 10 | $140.00 | 6 | $0.00 | $140.00 | $161.00 |
| 505 Park Avenue | Workshop | Sep-2015 | 600 | Grade | 10 | $300.00 | 6 | $0.00 | $300.00 | $270.00 |
| 320 Park Avenue | Little Beet | Sep-2015 | 3,400 | Grade | 10 | $150.00 | 6 | $0.00 | $150.00 | $157.50 |
| 485 Park Avenue | Seaman Schepps Jewelry | Apr-2015 | 1,000 | Grade | 5 | $275.00 | 0 | $0.00 | $302.50 | $347.88 |
| (1) | Source: Appraisal. Reflects the appraisal’s adjustments to rent for various economic factors. |
| Historical and Current Occupancy(1) | |||||||||
2007 | 2008 | 2009 | 2010 | 2011 | 2012 | 2013 | 2014 | 2015 | Current(2) |
| 99.3% | 96.9% | 95.3% | 92.5% | 95.4% | 96.1% | 99.0% | 99.4% | 100.0% | 99.1% |
| (1) | Historical occupancies are as of December 31 of each respective year. |
| (2) | Current Occupancy is as of November 1, 2016. Current occupancy includes 8,039 square feet of space for which CITCO Holdings has executed a lease but has not yet taken occupancy or begun paying rent. The 8,039 square feet is occupied by Peconic Partners LLC, which is expected to vacate in August 2017, and CITCO Holdings is expected to take occupancy and begin paying rent in November 2017. In addition to this 8,039 square feet, CITCO Holdings directly leases 14,825 square feet and subleases 20,038 square feet. We cannot assure you that this tenant will take occupancy or begin paying rent as anticipated or at all. Current Occupancy also excludes Valley National Bank (2,720 square feet) which is dark but paying rent. |
THE INFORMATION IN THIS STRUCTURAL AND COLLATERAL TERM SHEET IS NOT COMPLETE AND MAY BE AMENDED PRIOR TO THE TIME OF SALE. THIS TERM SHEET IS NOT AN OFFER TO SELL THESE SECURITIES AND IT IS NOT A SOLICITATION OF AN OFFER TO BUY THESE SECURITIES IN ANY JURISDICTION WHERE THE OFFER OR SALE IS NOT PERMITTED.
| 28 of 139 | |
| Structural and Collateral Term Sheet | JPMDB 2017-C5 |
| 350 Park Avenue |
| Tenant Summary(1) | |||||||
| Tenant | Ratings(2) Moody’s/S&P/ Fitch | Net Rentable Area (SF) | % of Total NRA | Base Rent PSF | % of Total Base Rent | Lease Expiration Date | |
| Ziff Brothers Investments, L.L.C.(3) | NA / NA / NA | 287,030 | 50.3% | $86.39 | 46.6% | 4/30/2021 | |
| Manufacturers & Traders Trust Company(4) | A2 / A / A | 102,622 | 18.0% | $86.31 | 16.6% | 3/31/2023 | |
| Egon-Zehnder International(5) | NA / NA / NA | 26,300 | 4.6% | $66.00 | 3.3% | 5/31/2022 | |
| CITCO (USA) Holdings Inc.(6) | NA / NA / NA | 22,864 | 4.0% | $122.94 | 5.3% | 6/30/2028 | |
| MFA Financial Inc | NA / NA / NA | 21,014 | 3.7% | $120.00 | 4.7% | 6/30/2020 | |
| Fidelity Investments(7) | A2 / A+ / A+ | 19,305 | 3.4% | $122.31 | 4.4% | Various | |
| United States Steel Corp. | Caa1 / B / B- | 16,921 | 3.0% | $80.00 | 2.5% | 4/30/2020 | |
| Marshall Wace North America(8) | NA / NA / NA | 14,871 | 2.6% | $113.63 | 3.2% | 8/31/2024 | |
| Kissinger Associates Inc.(9) | NA / NA / NA | 11,610 | 2.0% | $95.47 | 2.1% | 12/31/2019 | |
| AT&T Wireless | Baa1 / BBB+ / A- | 2,675 | 0.5% | $571.16 | 2.9% | 3/31/2021 | |
| (1) | Based on the underwritten rent roll. |
| (2) | Ratings provided are for the parent company of the entity listed in the “Tenant” field whether or not the parent company guarantees the lease. |
| (3) | ZBI subleases 158,847 square feet of space to seven tenants. See “—Subleasing” above. ZBI has two, five-year renewal options upon satisfaction of certain minimum occupancy requirements, including ZBI (not subtenants) occupying at least 65% of its leased premises. |
| (4) | Manufacturers & Traders Trust Company has one, five-year or one, 10-year renewal option upon satisfaction of certain minimum occupancy requirements, including Manufacturers & Traders Trust Company occupying two full floors of its leased premises, comprising at least 69,788 square feet of its leased premises. |
| (5) | Egon-Zehnder International subleases an additional 14,028 square feet from ZBI. |
| (6) | CITCO Holdings has executed a lease for 8,039 square feet (included in the Net Rentable Area noted in the chart above) that is scheduled to commence November 1, 2017 and is expected to take occupancy and begin paying rent on November 1, 2017. Peconic Partners LLC currently occupies this space and is expected to vacate in August 2017. We cannot assure you that this tenant will take occupancy or begin paying rent at all. CITCO Holdings has also executed a renewal for 3,952 square feet of storage space (included in the Net Rentable Area in the chart above) at $30 per square foot scheduled to commence in March 2018. CITCO Holdings has one, five-year renewal option upon satisfaction of certain minimum occupancy requirements, including CITCO Holdings occupying at least 75% of its leased premises. |
| (7) | Fidelity Investments leases 10,300 square feet of in-line space ($133.10 per square foot) scheduled to expire on July 31, 2019, 8,105 square feet of office space ($112.00 per square foot) scheduled to expire on July 31, 2024 and 900 square feet of storage space ($24.20 per square foot) scheduled to expire on July 31, 2019. With regards to the 8,105 square feet of office space, scheduled to expire on July 31, 2024, Fidelity Investments has a one-time right to terminate its lease on July 31, 2019, with notice given before July 31, 2018 and payment of a termination fee. Fidelity Investments has one, five-year renewal option applicable to 10,300 square feet of retail space and 900 square feet of storage space expiring July 31, 2019. |
| (8) | Marshall Wace North America has one, five-year renewal option upon satisfaction of certain minimum occupancy requirements, including Marshall Wace North America occupying 100% of its leased premises. |
| (9) | If Dr. Henry Kissinger dies or becomes incapacitated, Kissinger Associates Inc. has the option to terminate its lease. |
Lease Rollover Schedule(1)(2) | |||||||||
| Year | Number of Leases Expiring | Net Rentable Area Expiring | % of NRA Expiring | Base Rent Expiring | % of Base Rent Expiring | Cumulative Net Rentable Area Expiring | Cumulative % of NRA Expiring | Cumulative Base Rent Expiring | Cumulative % of Base |
| Vacant | NAP | 5,050 | 0.9% | NAP | NAP | 5,050 | 0.9% | NAP | NAP |
| 2017 & MTM | 1 | 8,105 | 1.4 | $851,025 | 1.6% | 13,155 | 2.3% | $851,025 | 1.6% |
| 2018 | 1 | 1 | 0.0 | 0 | 0.0 | 13,156 | 2.3% | $851,025 | 1.6% |
| 2019 | 8 | 26,550 | 4.7 | 2,912,367 | 5.5 | 39,706 | 7.0% | $3,763,392 | 7.1% |
| 2020 | 2 | 37,935 | 6.6 | 3,875,360 | 7.3 | 77,641 | 13.6% | $7,638,752 | 14.3% |
| 2021 | 19 | 289,705 | 50.8 | 26,325,681 | 49.5 | 367,346 | 64.4% | $33,964,433 | 63.8% |
| 2022 | 2 | 31,675 | 5.5 | 2,353,925 | 4.4 | 399,021 | 69.9% | $36,318,358 | 68.2% |
| 2023 | 3 | 104,071 | 18.2 | 9,102,292 | 17.1 | 503,092 | 88.1% | $45,420,651 | 85.3% |
| 2024 | 5 | 22,978 | 4.0 | 2,658,223 | 5.0 | 526,070 | 92.2% | $48,078,874 | 90.3% |
| 2025 | 0 | 0 | 0.0 | 0 | 0.0 | 526,070 | 92.2% | $48,078,874 | 90.3% |
| 2026 | 5 | 20,582 | 3.6 | 2,346,927 | 4.4 | 546,652 | 95.8% | $50,425,801 | 94.7% |
| 2027 | 0 | 0 | 0.0 | 0 | 0.0 | 546,652 | 95.8% | $50,425,801 | 94.7% |
| 2028 & Beyond | 8 | 24,132 | 4.2 | 2,810,787 | 5.3 | 570,784 | 100.0% | $53,236,588 | 100.0% |
| Total | 54 | 570,784 | 100.0% | $53,236,588 | 100.0% | ||||
| (1) | Based on the underwritten rent roll. |
| (2) | Certain tenants may have termination or contraction options that may become exercisable prior to the originally stated expiration date of the tenant lease that are not considered in this lease rollover schedule. |
THE INFORMATION IN THIS STRUCTURAL AND COLLATERAL TERM SHEET IS NOT COMPLETE AND MAY BE AMENDED PRIOR TO THE TIME OF SALE. THIS TERM SHEET IS NOT AN OFFER TO SELL THESE SECURITIES AND IT IS NOT A SOLICITATION OF AN OFFER TO BUY THESE SECURITIES IN ANY JURISDICTION WHERE THE OFFER OR SALE IS NOT PERMITTED.
| 29 of 139 | |
| Structural and Collateral Term Sheet | JPMDB 2017-C5 |
| 350 Park Avenue |
| Operating History and Underwritten Net Cash Flow | |||||||
2013 | 2014 | 2015 | TTM(1) | Underwritten | Per Square | %(2) | |
| Rents In Place(3) | $44,227,791 | $47,984,569 | $49,274,645 | $50,829,469 | $53,236,588 | $93.27 | 87.2% |
| Vacant Income | 0 | 0 | 0 | 0 | 816,466 | 1.43 | 1.3 |
| Gross Potential Rent | $44,227,791 | $47,984,569 | $49,274,645 | $50,829,469 | $54,053,054 | $94.70 | 88.6% |
| Total Reimbursements | 4,532,222 | 5,178,933 | 5,887,822 | 6,306,496 | 6,975,239 | 12.22 | 11.4 |
| Net Rental Income | $48,760,013 | $53,163,502 | $55,162,467 | $57,135,965 | $61,028,293 | $106.92 | 100.0% |
| (Vacancy/Credit Loss) | 0 | 0 | 0 | 0 | (3,075,956) | (5.39) | (5.0) |
| Other Income(4) | 299,864 | 700,304 | 924,299 | 490,830 | 490,830 | 0.86 | 0.8 |
| Effective Gross Income | $49,059,877 | $53,863,805 | $56,086,766 | $57,626,795 | $58,443,166 | $102.39 | 95.8% |
| Total Expenses | $19,398,319 | $20,957,359 | $21,560,422 | $22,164,572 | $22,786,342 | $39.92 | 39.0% |
| Net Operating Income | $29,661,558 | $32,906,446 | $34,526,344 | $35,462,223 | $35,656,824 | $62.47 | 61.0% |
| Total TI/LC, Capex/RR | 0 | 0 | 0 | 0 | 633,312 | 1.11 | 1.1 |
| Net Cash Flow | $29,661,558 | $32,906,446 | $34,526,344 | $35,462,223 | $35,023,512 | $61.36 | 59.9% |
| (1) | TTM column represents the trailing 12-month period ending on October 31, 2016. |
| (2) | % column represents percentage of Net Rental Income for all revenue lines and represents percentage of Effective Gross Income for the remainder of the fields. |
| (3) | Rents in Place include contractual rents as of November 2016, contractual rent steps through January 2018, rents from CITCO Holdings for 8,039 square feet of space for which they are expected to take occupancy and begin paying rent beginning November 2017 and the net present value of future contractual rent steps for investment grade tenants through the end of their lease terms. |
| (4) | Other Income includes tenant service recoveries and miscellaneous revenue. |
Property Management. The 350 Park Avenue property is managed by Vornado Office Management, LLC a borrower affiliate.
Escrows and Reserves. At loan origination, the borrower deposited $1,413,328 into a free rent reserve account and $1,829,270 into a rollover reserve account.
Tax Escrows- During the continuance of a Trigger Period (as defined below) or Ziff Reserve Period (as defined below) (unless in the case of a Ziff Reserve Period, funds in the Ziff reserve account equal or exceed the Ziff Reserve Cap (as defined below)), on a monthly basis the borrower is required to deposit reserves of 1/12 of the estimated annual real estate taxes.
Insurance Escrows - During the continuance of a Trigger Period or Ziff Reserve Period (unless in the case of a Ziff Reserve Period, funds in the Ziff reserve account equal or exceed the Ziff Reserve Cap) and provided that an acceptable blanket policy is no longer in place, on a monthly basis the borrower is required to escrow 1/12 of annual insurance premiums.
Replacement Reserves– During the continuance of a Trigger Period or Ziff Reserve Period (unless in the case of a Ziff Reserve Period, funds in the Ziff reserve account equal or exceed the Ziff Reserve Cap), on a monthly basis, the borrower is required to escrow $9,513 ($0.20 per square foot annually) into a replacement reserve subject to a cap of $228,314.
TI/LC Reserves – During the continuance of a Trigger Period or Ziff Reserve Period (unless in the case of a Ziff Reserve Period, funds in the Ziff reserve account equal or exceed the Ziff Reserve Cap), on a monthly basis the borrower is required to escrow $95,131 ($2.00 per square foot annually) into the tenant improvements and leasing commissions reserve subject to a cap of $2,283,136 (excluding the initial deposit amount of $1,829,270).
In addition, on each due date during the continuance of a Ziff Reserve Period (unless in the case of a Ziff Reserve Period, funds in the Ziff reserve account equal or exceed the Ziff Reserve Cap), the related loan documents require the borrower to deposit into the Ziff reserve account all excess cash flow after payment of debt service, required reserves and operating expenses capped (the “Ziff Reserve Cap”) at an amount equal to the sum of (x) the product of (a) $85.46, multiplied by (b) the aggregate amount of leasable square feet in the space that has not been demised under a lease renewal or replacement leases in accordance with the loan documents, plus (y) the lesser of (a) the remaining unpaid actual out-of-pocket tenant allowance and tenant improvement costs, leasing commissions and other expenses in respect of such lease renewal or replacement leases and (b) $85.46 multiplied by the aggregate amount of leasable square feet in the space demised under a lease renewal or replacement leases in accordance with the loan documents minus all actual out-of-pocket tenant allowance and tenant improvement costs, leasing commissions and other expenses previously disbursed in respect of such lease renewals or replacement leases, provided, that in no event may the Ziff Reserve Cap exceed $25,000,000.
THE INFORMATION IN THIS STRUCTURAL AND COLLATERAL TERM SHEET IS NOT COMPLETE AND MAY BE AMENDED PRIOR TO THE TIME OF SALE. THIS TERM SHEET IS NOT AN OFFER TO SELL THESE SECURITIES AND IT IS NOT A SOLICITATION OF AN OFFER TO BUY THESE SECURITIES IN ANY JURISDICTION WHERE THE OFFER OR SALE IS NOT PERMITTED.
| 30 of 139 | |
| Structural and Collateral Term Sheet | JPMDB 2017-C5 |
| 350 Park Avenue |
A “Trigger Period” means any period (i) after an event of default under the related loan documents until cured, (ii) after the borrower’s failure to deliver any quarterly or annual report and such failure remains uncured for 10 business days after the borrower receives written notice of such failure until such reports are delivered or (iii) upon the 12-month debt yield as calculated under the related loan documents being less than 7.25% for two consecutive fiscal quarters until the 350 Park Avenue property achieves a 12-month debt yield of at least 7.25% for two consecutive fiscal quarters as reasonably determined by the lender or upon the borrower’s delivery to the lender of cash collateral, a letter of credit or a guaranty from a qualified guarantor to achieve a debt yield equal to 7.25%.
A “Ziff Reserve Period” is a period commencing on the due date in October 2019 if the lease with Ziff Brothers Investments, L.L.C. has not been renewed and generally terminating upon (a) the borrower’s entering into a lease renewal or replacement leases meeting certain conditions contained in the loan documents or the trailing 12-month debt yield as of the end of the most recent fiscal quarter is at least 7.25% and (b) the amount in the applicable reserve account being at least equal to the lesser of (x) the remaining unpaid actual out-of-pocket tenant allowance and tenant improvement costs, leasing commissions and other expenses in respect of such lease renewal or replacement leases and (y) $85.46 multiplied by the aggregate amount of leasable square feet in the space demised under a lease renewal or replacement leases in accordance with the loan documents minus all actual out-of-pocket tenant allowance and tenant improvement costs, leasing commissions and other expenses previously disbursed in respect of such lease renewal or replacement leases.
Lockbox / Cash Management.The 350 Park Avenue loan is structured with a hard lockbox and springing cash management. The related loan documents require the borrower to direct tenants to pay rent directly to a lender-controlled lockbox account and require that all other money received by the borrower or the property manager with respect to the 350 Park Avenue property be deposited into such lockbox account by the end of the first business day following receipt. For so long as no Trigger Period or Ziff Reserve Period is continuing, funds deposited into the lockbox account are required to be swept into the borrower’s operating account on a daily basis. During the continuance of a Trigger Period or Ziff Reserve Period, all funds in the lockbox account are required to be swept into a lender-controlled cash management account on a daily basis; provided that if there is a Ziff Reserve Period but no Trigger Period, and the amount in the Ziff reserve account equals or exceeds the Ziff Reserve Cap, then all funds deposited into the lockbox account are required to be swept into the borrower’s operating account on a daily basis. On each due date during the continuance of a Trigger Period or Ziff Reserve Period (unless in the case of a Ziff Reserve period, the amount in the Ziff reserve account equals or exceeds the Ziff Reserve Cap) or, at the lender’s discretion, during an event of default under the 350 Park Avenue loan, the related loan documents require that all amounts on deposit in the cash management account be used to pay debt service, required reserves and operating expenses, and that all remaining amounts be reserved in an excess cash flow reserve account (unless there is a Ziff Reserve Period then in effect and funds in the Ziff reserve account equal or exceed the Ziff Reserve Cap, in which case the excess amounts will be distributed to the borrower).
THE INFORMATION IN THIS STRUCTURAL AND COLLATERAL TERM SHEET IS NOT COMPLETE AND MAY BE AMENDED PRIOR TO THE TIME OF SALE. THIS TERM SHEET IS NOT AN OFFER TO SELL THESE SECURITIES AND IT IS NOT A SOLICITATION OF AN OFFER TO BUY THESE SECURITIES IN ANY JURISDICTION WHERE THE OFFER OR SALE IS NOT PERMITTED.
| 31 of 139 | |
| Structural and Collateral Term Sheet | JPMDB 2017-C5 |
| Prudential Plaza |
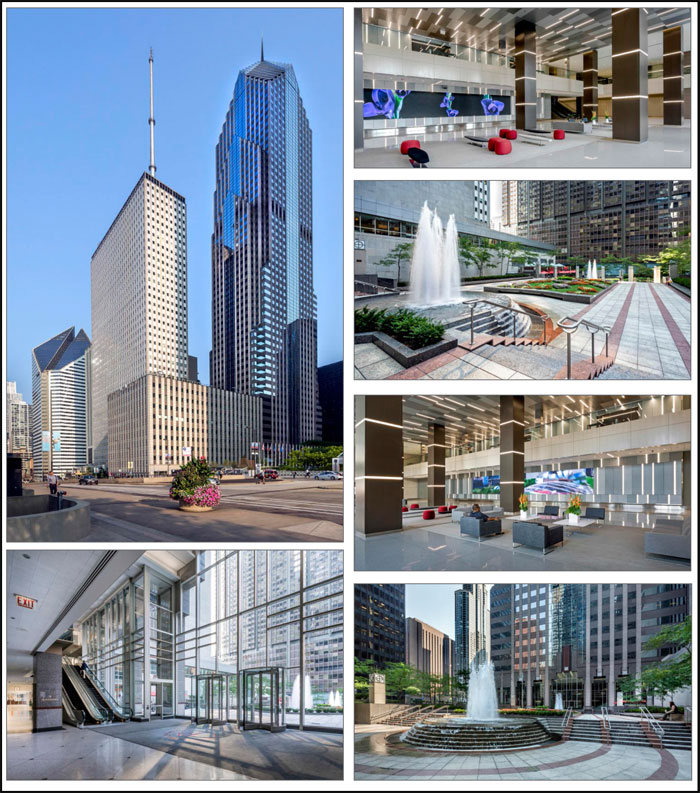
THE INFORMATION IN THIS STRUCTURAL AND COLLATERAL TERM SHEET IS NOT COMPLETE AND MAY BE AMENDED PRIOR TO THE TIME OF SALE. THIS TERM SHEET IS NOT AN OFFER TO SELL THESE SECURITIES AND IT IS NOT A SOLICITATION OF AN OFFER TO BUY THESE SECURITIES IN ANY JURISDICTION WHERE THE OFFER OR SALE IS NOT PERMITTED.
| 32 of 139 | |
| Structural and Collateral Term Sheet | JPMDB 2017-C5 |
| Prudential Plaza |
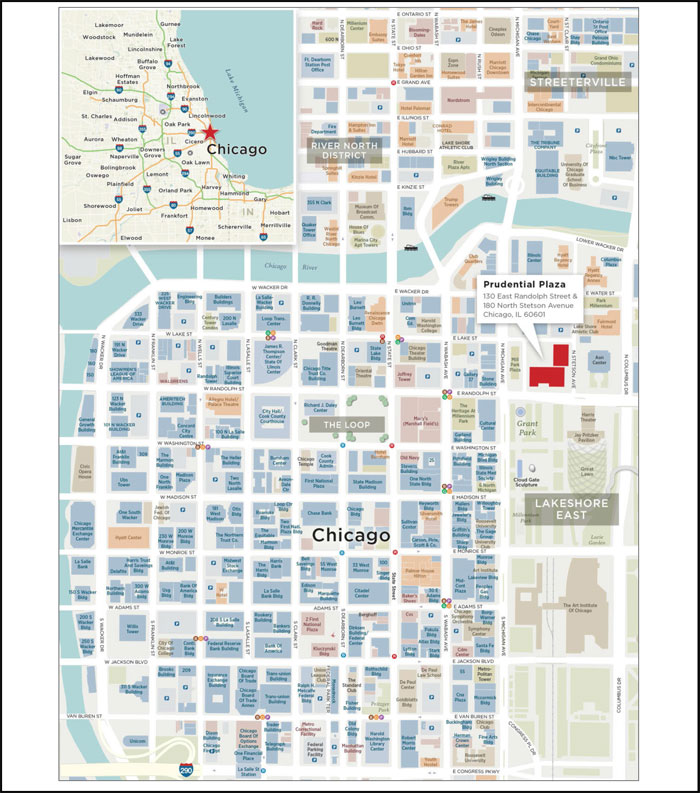
THE INFORMATION IN THIS STRUCTURAL AND COLLATERAL TERM SHEET IS NOT COMPLETE AND MAY BE AMENDED PRIOR TO THE TIME OF SALE. THIS TERM SHEET IS NOT AN OFFER TO SELL THESE SECURITIES AND IT IS NOT A SOLICITATION OF AN OFFER TO BUY THESE SECURITIES IN ANY JURISDICTION WHERE THE OFFER OR SALE IS NOT PERMITTED.
| 33 of 139 | |
| Structural and Collateral Term Sheet | JPMDB 2017-C5 |
| Prudential Plaza |
| Mortgage Loan Information | Property Information | |||
| Mortgage Loan Seller: | GACC | Single Asset / Portfolio: | Single Asset | |
| Original Principal Balance(1): | $65,000,000 | Title: | Fee | |
| Cut-off Date Principal Balance(1): | $65,000,000 | Property Type - Subtype: | Office - CBD | |
| % of Pool by IPB: | 6.2% | Net Rentable Area (SF): | 2,269,632 | |
| Loan Purpose: | Refinance | Location: | Chicago, IL | |
| Borrower: | SL PRU LLC | Year Built / Renovated: | 1955, 1990 / 1990, 2014-2015 | |
| Sponsors: | Michael Silberberg and Mark | Occupancy(3): | 77.1% | |
| Karasick | Occupancy Date: | 11/30/2016 | ||
| Interest Rate: | 4.61000% | Number of Tenants: | 273 | |
| Note Date: | 7/30/2015 | 2013 NOI: | $22,042,511 | |
| Maturity Date: | 8/6/2025 | 2014 NOI: | $21,430,754 | |
| Interest-only Period: | 48 months | 2015 NOI(4): | $21,153,848 | |
| Original Term: | 120 months | TTM NOI (11/2016)(4): | $26,562,892 | |
| Original Amortization: | 360 months | UW Economic Occupancy: | 79.6% | |
| Amortization Type: | IO-Balloon | UW Revenues: | $70,131,390 | |
| Call Protection(2): | L(35),Def(79),O(6) | UW Expenses: | $32,570,196 | |
| Lockbox / Cash Management: | Hard / In-Place | UW NOI(3)(4): | $37,561,194 | |
| Additional Debt: | Yes | UW NCF: | $33,902,628 | |
| Additional Debt Balance: | $350,000,000 | Appraised Value / Per SF: | $700,000,000 / $308 | |
| Additional Debt Type: | Pari Passu | Appraisal Date: | 7/20/2016 | |
| Escrows and Reserves(5) | Financial Information(1) | ||||||
| Initial | Monthly | Initial Cap | Cut-off Date Loan / SF: | $183 | |||
| Taxes: | $7,572,461 | $1,134,682 | N/A | Maturity Date Loan / SF: | $164 | ||
| Insurance: | $697,045 | $82,759 | N/A | Cut-off Date LTV: | 59.3% | ||
| Replacement Reserves: | $1,338,519 | $47,671 | N/A | Maturity Date LTV: | 53.2% | ||
| TI/LC: | $554,171 | $0 | N/A | UW NCF DSCR: | 1.33x | ||
| Other: | $19,935,546 | $236,236 | N/A | UW NOI Debt Yield: | 9.1% | ||
| Sources and Uses | |||||||
| Sources | Proceeds | % of Total | Uses | Proceeds | % of Total | |
| Mortgage Loan(1) | $415,000,000 | 100.0% | Payoff Existing Debt | $327,845,504 | 79.0% | |
| Upfront Reserves | 73,309,474 | 17.7 | ||||
| Working Capital | 10,819,980 | 2.6 | ||||
| Closing Costs | 3,025,042 | 0.7 | ||||
| Total Sources | $415,000,000 | 100.0% | Total Uses | $415,000,000 | 100.0% |
| (1) | The Prudential Plaza loan is part of a whole loan evidenced by eightpari passu notes with an aggregate original principal balance of $415.0 million. The Financial Information presented in the chart above reflects the Prudential Plaza Whole Loan Cut-off Date balance of $415.0 million. |
| (2) | On July 26, 2016, the holder of the non-controlling Note A-3-1, together with the other non-controlling pari passu companion notes (the “REMIC Election Notes”) made a REMIC election with respect to the REMIC Election Notes. As such, the defeasance lockout period for the Prudential Plaza Whole Loan will continue through the first business day after July 26, 2018. For additional information regarding the REMIC Election Notes, see “Material Federal Income Tax Considerations” in the Preliminary Prospectus. |
| (3) | Occupancy and UW NOI include approximately 6.9% of net rentable area leased to tenants that have signed leases but have yet to take occupancy at the Prudential Plaza property. |
| (4) | The approximate $11.0 million increase in UW NOI from TTM NOI is due to (i) approximately $11.1 million attributable to leases that are signed but have not yet commenced, (ii) approximately $1.0 million in step rents taken through January 2018, (iii) approximately $0.2 million in rent credit relating to investment grade tenants on long term leases, (iv) approximately $0.5 million representing the differential between the underwritten management fee cap of $1.0 million against the most recent management fee of approximately $1.5 million, (v) $5.9 million in rent abatements that were effective in the trailing 12 months ending November 2016 and (vi) a reduction of $7.4 million in rents attributable to expiring leases. |
| (5) | Initial Escrows and Reserves represent reserve balances as of January 9, 2017. For a description of Escrows and Reserves, please refer to “Escrows and Reserves” below. |
THE INFORMATION IN THIS STRUCTURAL AND COLLATERAL TERM SHEET IS NOT COMPLETE AND MAY BE AMENDED PRIOR TO THE TIME OF SALE. THIS TERM SHEET IS NOT AN OFFER TO SELL THESE SECURITIES AND IT IS NOT A SOLICITATION OF AN OFFER TO BUY THESE SECURITIES IN ANY JURISDICTION WHERE THE OFFER OR SALE IS NOT PERMITTED.
| 34 of 139 | |
| Structural and Collateral Term Sheet | JPMDB 2017-C5 |
| Prudential Plaza |
The Loan. The Prudential Plaza loan is secured by a first mortgage lien on the borrower’s fee interest in two Class A office towers totaling 2,269,632 square feet, located in Chicago, Illinois. The whole loan has an outstanding principal balance as of the Cut-off Date of $415.0 million (the “Prudential Plaza Whole Loan”) and is comprised of eightpari passu notes, each as described below. Note A-4-2 with a balance of $65.0 million is being contributed to the JPMDB 2017-C5 Trust. Note A-1 was contributed to the COMM 2015-CCRE26 trust and is the controlling note under the related co-lender agreement, the rights of which will be exercised by the related trustee (or, prior to the occurrence and continuance of a control termination event under the related pooling and servicing agreement, by the related directing certificateholder). However, the JPMDB 2017-C5 Trust will be entitled, under certain circumstances, to be consulted with respect to certain major decisions. The Prudential Plaza Whole Loan has a 10-year term and subsequent to a 48 month interest only period, will amortize on a 30-year schedule. The most recent prior financing of the Prudential Plaza property was included in the JPMCC 2006-LDP7 and JPMCC 2006-CB16 securitizations.
| Whole Loan Summary | |||||
| Original Balance | Cut-off Date Balance | Note Holder | Controlling Piece | ||
| A-1 | 115,000,000 | 115,000,000 | COMM 2015-CCRE26 | Yes | |
| A-2-1 | 50,000,000 | 50,000,000 | CD 2016-CD1 | No | |
| A-2-2 and A-3-3 | 75,000,000 | 75,000,000 | CD 2016-CD2 | No | |
| A-3-1 | 40,000,000 | 40,000,000 | COMM 2016-COR1 | No | |
| A-3-2 and A-4-1 | 70,000,000 | 70,000,000 | CD 2017-CD3 | No | |
| A-4-2 | $65,000,000 | $65,000,000 | JPMDB 2017-C5 | No | |
| Total | $415,000,000 | $415,000,000 | |||
The Borrower. The borrowing entity for the Prudential Plaza Whole Loan is SL PRU LLC, a Delaware limited liability company and special purpose entity.
The Loan Sponsor. The loan sponsor and nonrecourse carve-out guarantors are Michael Silberberg and Mark Karasick (the “Guarantors”), on a joint and several basis.
Michael Silberberg is a principal of Berkley Properties, LLC, a privately owned real estate holding company that acquires, renovates and manages hotels, offices, retail and multifamily properties in the Northeast. Additionally, directly or through affiliated companies, Berkley Properties, LLC has holdings in New York, New Jersey, Illinois, Alabama, Tennessee and Texas. Berkley Properties, LLC is headquartered in New York City.
Mark Karasick is a principal of the 601W Companies (“601W”). 601W manages private real estate acquisition, ownership, development and management portfolios. Since its founding more than 15 years ago, 601W has acquired a number of commercial properties throughout the country, totaling 24 million square feet with a collective value in excess of $5.0 billion. At 601W, Mark Karasick leads the acquisition, development and management of the 601W real estate portfolio.
Michael Silberberg and Mark Karasick have worked on numerous transactions in the Chicago central business district. In 2010, Berkley Properties, LLC purchased, and later sold, 180 North La Salle Street in the East Loop submarket and 601W is currently holding 550 West Jackson Avenue, an approximately 400,000 square feet office property in the West Loop submarket. The Guarantors also purchased the Aon Center, a 2.7 million square feet office building located adjacent to the Prudential Plaza property in October 2015 for $712 million ($260 per square foot).
The Prudential Plaza property was acquired by the prior owner (the “Prior Owner”) in 2006 for $525 million ($231 per square foot), which Prior Owner was owned and controlled by sponsorship unaffiliated with the Guarantors (the “Prior Sponsorship”). The Prudential Plaza property was previously collateral for a $410.0 million first mortgage (the “Prior Loan”), which was deposited in equal portions in the JPMCC 2006-LDP7 and JPMCC 2006-CB16 securitization trusts (together, the “Prior Securitization”) and an affiliate of the borrower under the Prior Loan also obtained a $60.0 million original principal balance mezzanine loan from an affiliate of Northstar. In 2012, the Prior Loan was transferred into special servicing as a result of impending lease expirations with two major tenants totaling approximately 19.0% of the total net rentable area, which tenants ultimately vacated the Prudential Plaza property.
THE INFORMATION IN THIS STRUCTURAL AND COLLATERAL TERM SHEET IS NOT COMPLETE AND MAY BE AMENDED PRIOR TO THE TIME OF SALE. THIS TERM SHEET IS NOT AN OFFER TO SELL THESE SECURITIES AND IT IS NOT A SOLICITATION OF AN OFFER TO BUY THESE SECURITIES IN ANY JURISDICTION WHERE THE OFFER OR SALE IS NOT PERMITTED.
| 35 of 139 | |
| Structural and Collateral Term Sheet | JPMDB 2017-C5 |
| Prudential Plaza |
The Guarantors reached an agreement with the Prior Sponsorship for an equity recapitalization. In June 2013, the Guarantors and the Prior Securitization special servicer agreed to bifurcate the $410.0 million Prior Loan into a $336 million A-note and a $74 million B-note (hope note). As part of the loan modification, the Guarantors took control of the Prudential Plaza property and the Prior Owner and contributed $76.5 million of new equity into the property (while the Prior Sponsorship retained a minority non-controlling interest). In addition, as part of such agreement, the N-Star CDO VIII securitization, as the holder of the $60 million original principal balance mezzanine loan, agreed to modify its mezzanine loan to require payments to be made only from excess cash flow remaining following the payment of amounts then due under the Prior Loan, and a Northstar affiliate agreed to contribute $8.5 million of new equity into the Prudential Plaza property. The Guarantors and the mezzanine lender then allocated amounts payable under the modified mezzanine loan to the contributors of the new equity.
In connection with the origination of the Prudential Plaza Whole Loan, (i) the lender under the Prior Securitization accepted $336 million (a portion of the proceeds of the Prudential Plaza Whole Loan) in satisfaction of the Prior Loan, (ii) the hope note was cancelled without repayment and (iii) the mezzanine lender entered into a standstill agreement with GACC pursuant to which it agreed to terminate the existing mezzanine loan pledge. Additionally, the standstill agreement provides that no exercise of remedies may be undertaken under the unsecured mezzanine loan until the Prudential Plaza Whole Loan is fully satisfied, and the mezzanine lender agreed that during any event of default or Trigger Period (as defined below) no payments may be made on the unsecured mezzanine loan.
On February 24, 2016, the trustees of the Prior Securitization filed suit in the United States District Court for the Southern District of New York against the Guarantors and the Prior Owner alleging, among other things, that the defendants engaged in fraud, willful misconduct and intentional misrepresentation by failing to provide complete and accurate information regarding prospective leasing activity relating to the Prudential Plaza property in connection with the preparation of an appraisal used in connection with the calculation of the discounted payoff amount. The current borrower under the Prudential Plaza Whole Loan is not named as a defendant in the suit. For more information regarding the litigation, see “Description of the Mortgage Pool–Litigation and Other Considerations” in the Preliminary Prospectus.
The Property. The Prudential Plaza property consists of two Class A office towers, One Prudential Plaza and Two Prudential Plaza, totaling 2,269,632 square feet located in Chicago, Illinois. One Prudential Plaza is a 41-story, 1,273,204 square foot building that was built in 1955 and renovated in 1990 and again in 2014-2015. Two Prudential Plaza is a 64-story, 996,428 square foot building that was completed in 1990. The two towers are connected by a public mezzanine level that contains approximately 60,000 square feet of restaurant and retail space. The Prudential Plaza property has a tenant base of over 120 tenants including law firms, financial services, technology, media and marketing companies. No tenant accounts for greater than 3.9% of net rentable area. The Prudential Plaza property also features a five-level, 608-space underground parking facility that is run by AMPCO Parking, a third party operator, an underground connection to the Randolph Street commuter rail station, a landscaped one acre plaza and a tenant amenity space on the 11th floor. The tenant amenity space features a 10,000 square foot gym, a tenant lounge and an outdoor rooftop space that includes a bar and an outdoor fireplace and offers unobstructed views of Millennium Park.
In 2014, the Guarantors invested over $30.0 million in capital expenditures and an additional approximately $26.6 million in tenant improvements for building renovations and upgrades to tenant spaces. Major projects included an elevator modernization and cab renovation, window replacements in vacant spaces, a convector replacement, the creation of the tenant amenity space on the 11th floor, exterior lighting renovations and a complete renovation of the lobby. The investments to upgrade the Prudential Plaza property have resulted in positive leasing velocity with 654,767 square feet of leases signed between January 2015 and May 2016. The table below summarizes recent leasing activity at the Prudential Plaza property since October 2014.
THE INFORMATION IN THIS STRUCTURAL AND COLLATERAL TERM SHEET IS NOT COMPLETE AND MAY BE AMENDED PRIOR TO THE TIME OF SALE. THIS TERM SHEET IS NOT AN OFFER TO SELL THESE SECURITIES AND IT IS NOT A SOLICITATION OF AN OFFER TO BUY THESE SECURITIES IN ANY JURISDICTION WHERE THE OFFER OR SALE IS NOT PERMITTED.
| 36 of 139 | |
| Structural and Collateral Term Sheet | JPMDB 2017-C5 |
| Prudential Plaza |
| Recent Leasing(1)(2) | |||
| Date of Lease Execution | Lease Count | SF | Gross Rent |
| Oct 2014 | 2 | 24,267 | $819,054 |
| Nov 2014 | 1 | 2,489 | $80,011 |
| Dec 2014 | 3 | 28,471 | $946,092 |
| Jan 2015 | 4 | 44,249 | $1,241,990 |
| Feb 2015 | 1 | 239 | $6,271 |
| Mar 2015 | 4 | 54,103 | $1,953,948 |
| Apr 2015 | 4 | 6,892 | $134,245 |
| May 2015 | 3 | 16,704 | $621,447 |
| Jun 2015 | 6 | 48,139 | $1,902,909 |
| Jul 2015 | 11 | 127,537 | $4,487,880 |
| Aug 2015 | 8 | 63,228 | $2,359,173 |
| Sep 2015 | 1 | 2,319 | $92,377 |
| Oct 2015 | 1 | 577 | $23,435 |
| Nov 2015 | 4 | 35,486 | $1,325,724 |
| Dec 2015 | 8 | 173,316 | $6,676,301 |
| Jan 2016 | 0 | 0 | $0 |
| Feb 2016 | 3 | 28,699 | $1,514,381 |
| Mar 2016 | 6 | 25,758 | $1,392,647 |
| Apr 2016 | 1 | 24,226 | $955,958 |
| May 2016 | 2 | 3,295 | $162,736 |
| Jun 2016 | 3 | 37,541 | $1,271,534 |
| Jul 2016 | 1 | 5,385 | $212,511 |
| Aug 2016 | 7 | 102,560 | $3,700,809 |
| Sept 2016 | 0 | 0 | $0 |
| Oct 2016 | 0 | 0 | $0 |
| Nov 2016 | 0 | 0 | $0 |
| Dec 2016 | 0 | 0 | $0 |
| Total | 84 | 855,480 | $31,881,435 |
| (1) | As provided by the borrower. |
| (2) | Includes expansions and lease renewals. |
Total leasing at the Prudential Plaza property between October 2014 and August 2016 included 855,480 square feet (37.7% of net rentable area) which accounts for approximately $31.9 million in gross rent. This includes 502,390 square feet (22.1% of net rentable area) leased since loan origination in July 2015. Major new leases include Wilson (87,386 square feet, 3.9% of net rentable area), Clark Hill (71,813 square feet, 3.2% of net rentable area), Cision US, Inc. (49,703 square feet, 2.2% of net rentable area), Pandora (32,331 square feet, 1.4% of net rentable area), Chicago Council on Global Affairs (29,035 square feet, 1.3% of net rentable area), University of Chicago (23,710 square feet, 1.0% of net rentable area), Prescient Edge, LLC (23,616 square feet, 1.0% of net rentable area), Textura Corporation (23,374 square feet, 1.0% of net rentable area) and CA Ventures (23,672 square feet, 1.0% of net rentable area).
The Prudential Plaza property is situated immediately north of Millennium Park and one block east of Michigan Avenue, a major north-south roadway in Chicago. The Prudential Plaza property is accessible via Interstate 90/94 from the west, Lake Shore Drive from the east and Wacker Drive. The Prudential Plaza property also has pedestrian access via underground pedestrian corridors that provide direct access to neighboring hotels, department stores, office buildings and cultural attractions throughout the city of Chicago.
As of November 30, 2016, the Prudential Plaza property is 77.1% occupied by 273 tenants. The largest tenant, Wilson Sporting Goods Co. (“Wilson”), occupies 3.9% of net rentable area through December 2029. Wilson manufactures sporting goods for nearly every major sport through its Wilson, Louisville, Demarini and Atec brands. The company offers its products through dealers in the United States and internationally. Founded in 1913 and based in Chicago, Illinois, Wilson has locations in the United States, Mexico/Latin America, Brazil, Germany, Spain, France, Italy, the United Kingdom, Australia, Japan and Korea. As of March 1989, Wilson operates as a subsidiary of Amer Sports Corp., which guaranties the lease. Upon taking occupancy of its space, the Prudential Plaza property will serve as the headquarters of the company. Wilson has one five-year renewal option and one termination option effective December 31, 2026 with 15 months’ notice, subject to payment of a termination fee equal to the unamortized leasing costs amortized at a rate of 8% per year. Wilson will be entitled to rent abatement on the first month of each year during the lease term. Neither the gap period prior to commencement of such lease nor such rent abatement periods have been reserved for.
THE INFORMATION IN THIS STRUCTURAL AND COLLATERAL TERM SHEET IS NOT COMPLETE AND MAY BE AMENDED PRIOR TO THE TIME OF SALE. THIS TERM SHEET IS NOT AN OFFER TO SELL THESE SECURITIES AND IT IS NOT A SOLICITATION OF AN OFFER TO BUY THESE SECURITIES IN ANY JURISDICTION WHERE THE OFFER OR SALE IS NOT PERMITTED.
| 37 of 139 | |
| Structural and Collateral Term Sheet | JPMDB 2017-C5 |
| Prudential Plaza |
The second largest tenant, Optiver US LLC (“Optiver”), occupies 3.3% of net rentable area through April 2023. Optiver engages in the trading of stocks, futures, and options. Optiver was founded in 1999, and has its US headquarters in Chicago, IL. Optiver is a subsidiary of Optiver Holding B.V., a global electronic market maker. Optiver Holdings B.V. was founded in 1986, and has over 750 employees in over 40 different nations. The company focuses on on-screen liquidity, covering listed derivatives, cash equities, ETF’s, bonds, and foreign exchange. Optiver has been at the property since 2008 and recently signed a new lease to take additional space on the 14th floor (approximately 25,000 square feet with base rent of $20.25 per square foot triple net) previously occupied by McGraw Hill Financial, Inc. Additionally, Optiver has one five-year renewal option remaining and no termination options. Optiver US LLC is entitled to rent abatement from May 2017 to October 2017 and from May 2018 to September 2018, as to which only two months have been reserved for.
The third largest tenant, Clark Hill, occupies 3.2% of net rentable area through December 2032. Clark Hill is an entrepreneurial, full service law firm serving clients in all areas of business legal services, government and public affairs and personal legal services. Clark Hill was founded in 1890 and has over 350 attorneys and legal professionals. The firm’s practice areas include administrative and behavioral healthcare law, corporate restructuring and bankruptcy, estate planning and probate, government and public affairs, insurance and reinsurance, municipal finance, litigation, real estate, white collar criminal defense and economic development services, among others. Clark Hill signed a 15-year lease for 71,813 square feet at the Prudential Plaza property in December of 2015. The Clark Hill lease commenced on January 1, 2017 and the tenant took occupancy of its space at that time. Clark Hill has one five-year renewal option and the option to terminate its lease beginning on the last day of the 10th year of the lease term upon at least 15 months prior written notice, subject to termination fees as set forth in the lease documents. Clark Hill signed a 15-year lease for its space which commenced on January 1, 2017 and has a rent abatement period from January 2017 to July 2017, which has not been reserved for.
The Prudential Plaza property is located in the city of Chicago, Illinois, one block east of North Michigan Avenue in the East Loop office submarket. Located adjacent to Millennium Park, the Prudential Plaza property is within walking distance of numerous dining, shopping and cultural attractions. Notable nearby attractions include The Harold Washington Library, the world’s largest public library, popular downtown theatres, Lyric Opera Goodman Theatre and Adler & Sullivan’s Auditorium Theatre and the Magnificent Mile, one of the world’s premier shopping districts. Several hotels are also in walking distance, including the Palmer House, which is a block from the Prudential Plaza property, a Hilton, Hyatt Regency, Sheraton, the Renaissance, Hotel Blake and the W Hotel, among others.
The East Loop office submarket contains 83 buildings totaling approximately 28.0 million square feet, including 16 Class A buildings totaling approximately 16.6 million square feet. The average quoted rent in the East Loop Class A submarket was $28.06 per square foot as of the third quarter of 2016 and the vacancy was 12.9% in the same period. The East Loop Class A submarket also experienced positive net absorption of 467,653 square feet as of the third quarter of 2016. Additionally, there is no reported new office construction underway or planned in the East Loop submarket. Current activity in the East Loop office sector is continued repositioning of the existing inventory. In July 2015, Kraft Heinz announced that it is moving its corporate headquarters from Northfield, Illinois to the East Loop submarket of Chicago. Kraft Heinz took over approximately 170,000 square feet across five floors in the AON Center, located next door to the Prudential Plaza property, in early 2016.
The appraisal identified a set of six comparable properties in the downtown Chicago area that it considered directly competitive with the Prudential Plaza property. The buildings range from 737,308 to 2,744,552 sq. ft. with an occupancy range of 67% to 96%. Leases signed at the competitive properties range from $17.00 to $31.00 per square foot. The table below summarizes the appraisal’s competitive set.
| Competitive Set(1) | ||||
| Property Name | Year Built | Net Rentable Area (SF) | Occupancy | Recent Leasing (PSF) |
| Prudential Plaza Property | 1955, 1990 | 2,269,632(2) | 77.1%(2) | $23.20(3) |
| AON Center | 1974 | 2,744,552 | 90% | $19.50 - $22.50 |
| Illinois Center | 1972 | 2,132,048 | 75% | $17.50 - $18.50 |
| AMA Plaza | 1971 | 1,141,760 | 92% | $24.28 - $31.00 |
| Chicago Title and Trust Center I | 1992 | 1,068,877 | 96% | $18.08 - $30.00 |
| 303 East Wacker | 1979 | 859,187 | 67% | $17.00 - $18.50 |
| Equitable Office Building | 1966 | 737,308 | 95% | $23.00 - $25.50 |
| Total/Wtd. Avg.(4) | 8,683,732 | 85.5% | ||
| (1) | Source: Appraisal dated July 29, 2016. |
| (2) | Based on the November 30, 2016 underwritten rent roll and includes approximately 6.9% of tenants by net rentable area who may not yet be in occupancy. |
| (3) | Represents Avg. U/W Base Rent PSF on a triple net basis for the Prudential Plaza property. |
| (4) | Total/Wtd. Avg. excludes the Prudential Plaza property. |
THE INFORMATION IN THIS STRUCTURAL AND COLLATERAL TERM SHEET IS NOT COMPLETE AND MAY BE AMENDED PRIOR TO THE TIME OF SALE. THIS TERM SHEET IS NOT AN OFFER TO SELL THESE SECURITIES AND IT IS NOT A SOLICITATION OF AN OFFER TO BUY THESE SECURITIES IN ANY JURISDICTION WHERE THE OFFER OR SALE IS NOT PERMITTED.
| 38 of 139 | |
| Structural and Collateral Term Sheet | JPMDB 2017-C5 |
| Prudential Plaza |
| Historical and Current Occupancy(1) | |||
| 2013(2) | 2014(2) | 2015(2) | Current(2) |
| 69.6% | 64.0% | 68.3% | 77.1% |
| (1) | Historical occupancies are as of December 31 of each respective year. |
| (2) | Based on the underwritten rent roll dated November 30, 2016. |
| Tenant Summary(1) | |||||||
| Tenant | Ratings(2)Fitch/Moody’s/S&P | Net Rentable Area (SF) | % of Total NRA | Base Rent PSF | % of Total Base Rent | Lease Expiration Date | |
| Wilson(3) | NA / NA / NA | 87,386 | 3.9% | $22.00 | 4.6% | 12/31/2029 | |
| Optiver US LLC(4) | NA / NA / NA | 73,779 | 3.3% | $20.90 | 3.7% | 4/30/2023 | |
| Clark Hill(5) | NA / NA / NA | 71,813 | 3.2% | $26.30 | 4.5% | 12/31/2032 | |
| Leydig, Voit & Mayer, Ltd. | NA / NA / NA | 66,783 | 2.9% | $25.88 | 4.2% | 9/30/2025 | |
| CBS Radio Holdings Corp.(6) | BBB / Baa2 / BBB | 63,453 | 2.8% | $20.65 | 3.3% | 4/30/2028 | |
| The Prudential Insurance Company | A- / Baa1 / A | 51,646 | 2.3% | $26.31 | 3.3% | 7/31/2025 | |
| McDermott, Will & Emery, LLP | NA / NA / NA | 50,178 | 2.2% | $21.00 | 2.5% | 10/31/2028 | |
| Cision US, Inc. | NA / NA / NA | 49,703 | 2.2% | $19.28 | 2.3% | 1/31/2023 | |
| Textura Corporation | A+ / A1 / AA- | 46,748 | 2.1% | $23.64 | 2.7% | 8/1/2027 | |
| Crossmark Consumer Engagements, LLC | NA / NA / NA | 44,463 | 2.0% | $22.00 | 2.4% | 6/30/2023 | |
| (1) | Based on the underwritten rent roll. |
| (2) | Ratings provided are for the parent company of the entity listed in the “Tenant” field whether or not the parent company guarantees the lease. |
| (3) | Wilson signed a 12-year lease for its space which commences on January 1, 2018. Wilson has the right to terminate its lease on December 31, 2026 with 15 months’ prior written notice, subject to payment of a termination fee equal to the unamortized leasing costs amortized at a rate of 8% per year. In addition, Wilson will be entitled to a rent abatement on the first month of each year during the lease term. Neither the gap period prior to commencement of such lease nor such rent abatement periods have been reserved for. |
| (4) | Optiver US LLC is entitled to a rent abatement from May 2017 to October 2017 and from May 2018 to September 2018, for which only two months have been reserved for. |
| (5) | Clark Hill signed a 15-year lease for its space which commenced on January 1, 2017 and has a rent abatement period from January 2017 to July 2017, which has not been reserved for. The tenant has the right to terminate its lease on December 31, 2026, upon at least 15 months’ prior written notice, subject to a termination fee equal to the then unamortized leasing costs associated with the Clark Hill lease amortized at a rate of 8% per year. |
| (6) | CBS Radio Holdings Corp. executed an early renewal option for its space on floors 9-11, totaling approximately 63,228 SF at a higher rent of $22.50 per SF for an additional 10 years. CBS Radio Holdings Corp. relinquished a portion of its space on the 12th floor (8,068 SF). Additionally, the tenant has 225 SF of space that expires on April 30, 2018. CBS has a 50% rent abatement period from May 2018 to December 2019, which has not been reserved for. |
| Lease Rollover Schedule(1)(2) | |||||||||||
Year | Number of | Net Rentable Area Expiring | % of NRA Expiring | Base Rent Expiring | % of Base | Cumulative Net Rentable Area Expiring | Cumulative | Cumulative Base Rent Expiring | Cumulative % of Base Rent Expiring | ||
| Vacant | NAP | 520,216 | 22.9% | NAP | NAP | 520,216 | 22.9% | NAP | NAP | ||
| 2017 | 18 | 39,695 | 1.7 | $916,289 | 2.2% | 559,911 | 24.7% | $916,289 | 2.2% | ||
| 2018 | 43 | 157,475 | 6.9 | 3,522,284 | 8.5 | 717,386 | 31.6% | 4,438,572 | 10.7% | ||
| 2019 | 13 | 57,943 | 2.6 | 1,252,766 | 3.0 | 775,329 | 34.2% | 5,691,338 | 13.7% | ||
| 2020 | 20 | 56,447 | 2.5 | 1,461,324 | 3.5 | 831,776 | 36.6% | 7,152,662 | 17.2% | ||
| 2021 | 27 | 103,449 | 4.6 | 2,565,226 | 6.2 | 935,225 | 41.2% | 9,717,888 | 23.4% | ||
| 2022 | 21 | 97,607 | 4.3 | 2,583,478 | 6.2 | 1,032,832 | 45.5% | 12,301,366 | 29.6% | ||
| 2023 | 29 | 234,546 | 10.3 | 5,006,956 | 12.1 | 1,267,378 | 55.8% | 17,308,322 | 41.7% | ||
| 2024 | 12 | 54,588 | 2.4 | 1,351,648 | 3.3 | 1,321,966 | 58.2% | 18,659,970 | 44.9% | ||
| 2025 | 26 | 202,902 | 8.9 | 5,144,441 | 12.4 | 1,524,868 | 67.2% | 23,804,410 | 57.3% | ||
| 2026 | 17 | 99,793 | 4.4 | 3,416,341 | 8.2 | 1,624,661 | 71.6% | 27,220,751 | 65.5% | ||
| 2027 | 18 | 200,088 | 8.8 | 3,948,700 | 9.5 | 1,824,749 | 80.4% | 31,169,451 | 75.0% | ||
| 2028 & Beyond | 29 | 444,883 | 19.6 | 10,371,197 | 25.0 | 2,269,632 | 100.0% | $41,540,648 | 100.0% | ||
| Total / Wtd. Avg. | 273 | 2,269,632 | 100.0% | $41,540,648 | 100.0% | ||||||
| (1) | Based on the underwritten rent roll. |
| (2) | Certain tenants may have termination or contraction options that may become exercisable prior to the originally stated expiration date of the tenant lease that are not considered in this lease rollover schedule. |
THE INFORMATION IN THIS STRUCTURAL AND COLLATERAL TERM SHEET IS NOT COMPLETE AND MAY BE AMENDED PRIOR TO THE TIME OF SALE. THIS TERM SHEET IS NOT AN OFFER TO SELL THESE SECURITIES AND IT IS NOT A SOLICITATION OF AN OFFER TO BUY THESE SECURITIES IN ANY JURISDICTION WHERE THE OFFER OR SALE IS NOT PERMITTED.
| 39 of 139 | |
| Structural and Collateral Term Sheet | JPMDB 2017-C5 |
| Prudential Plaza |
| Operating History and Underwritten Net Cash Flow | |||||||
2013 | 2014 | 2015 | TTM(1) | Underwritten | Per Square | %(2) | |
| Rents In Place(3) | $28,764,554 | $28,473,086 | $30,025,537 | $34,261,798 | $41,540,648 | $18.30 | 48.9% |
| IG Rent Credit | 0 | 0 | 0 | 0 | 232,359 | 0.10 | 0.3 |
| Vacant Income | 0 | 0 | 0 | 0 | 17,967,138 | 7.92 | 21.2% |
| Gross Potential Rent | $28,764,554 | $28,473,086 | $30,025,537 | $34,261,798 | $59,740,145 | $26.32 | 70.3% |
| Total Reimbursements | 20,442,385 | 18,888,044 | 20,087,785 | 21,436,527 | 25,198,144 | 11.10 | 29.7% |
| Net Rental Income | 49,206,939 | 47,361,130 | 50,113,322 | 55,698,325 | 84,938,289 | $37.42 | 100.0% |
| (Vacancy/Credit Loss)(4) | 0 | 0 | 0 | 0 | (17,967,138) | (7.92) | (21.2) |
| Other Income | 3,318,520 | 2,915,164 | 3,208,355 | 3,160,239 | 3,160,239 | 1.39 | 3.7% |
| Effective Gross Income | $52,525,460 | $50,276,294 | $53,321,676 | $58,858,563 | $70,131,390 | $30.90 | 82.6% |
| Total Expenses | $30,482,948 | $28,845,540 | $32,167,828 | $32,295,671 | $32,570,196 | $14.35 | 46.4% |
| Net Operating Income(5) | $22,042,511 | $21,430,754 | $21,153,848 | $26,562,892 | $37,561,194 | $16.55 | 53.6% |
| Total TI/LC, Capex/RR | 0 | 0 | 0 | 0 | 3,658,566 | 1.61 | 5.2% |
| Net Cash Flow | $22,042,511 | $21,430,754 | $21,153,848 | $26,562,892 | $33,902,628 | $14.94 | 48.3% |
| (1) | TTM column represents the trailing 12-month period ending on November 30, 2016. |
| (2) | % column represents percentage of Net Rental Income for all revenue lines and represents percentage of Effective Gross Income for the remainder of the fields. |
| (3) | Rent in Place includes contractual rent steps taken through January 2018. |
| (4) | Vacancy was underwritten at the in-place vacancy of 20.4% compared to the East Loop submarket vacancy rate of 12.9%. |
| (5) | The approximate $11.0 million increase in Underwritten Net Operating Income from TTM to Net Operating Income figure is due to (i) approximately $11.1 million attributable to leases that are signed but have not yet commenced, (ii) approximately $1.0 million in step rents taken through January 2018, (iii) approximately $0.2 million in rent credit relating to investment grade tenants on long term leases, (iv) approximately $0.5 million representing the differential between the underwritten management fee cap of $1.0 million against the most recent management fee of approximately $1.5 million, (v) $5.9 million in rent abatements that were effective in the trailing 12 months ending November 2016 and (vi) a reduction of $7.4 million in rents attributable to expiring leases. |
Property Management.The Prudential Plaza property is managed by SL PRU Property Manager LLC, a borrower affiliate. The Prudential Plaza property is sub-managed by Jones Lang LaSalle Americas (Illinois), LP (“Jones Lang LaSalle”). Jones Lang LaSalle is a financial and professional services firm that specializes in commercial real estate services and investment management.
Escrows and Reserves. At loan origination, the borrower deposited (i) $1,134,682 into a tax reserve account, (ii) $248,278 into an insurance reserve account, (iii) $2,525,657 into a replacement reserve account, (iv) $21,489,422 into a TI/LC reserve account for existing TI/LC obligations due to certain tenants, (v) $35,000,000 into a future leasing reserve account and (vi) $12,911,435 into a rent abatement reserve account.
As of January 2017, the current amounts on deposit are (i) $7,572,461 in the tax reserve account, (ii) $697,045 in the insurance reserve account, (iii) $1,338,519 in the replacement reserve account, (iv) $554,171 in the existing TI/LC reserve account (the “Existing TI/LC Account”), (v) $11,219,368 (the “Future TI/LC Amount”) in the future leasing reserve account (the “Future TI/LC Account”), all of which is earmarked for future TI/LCs based on recent leases signed and (vi) $2,416,178 in the rent abatement reserve account. The Future TI/LC Amount includes $3,058,133 that was initially included in the Existing TI/LC Account but was determined to be in excess of the amount necessary to pay approved leasing expenses under the then-current leases and was reallocated into the Future TI/LC Account to be available to pay approved leasing expenses for future leases entered into by the borrower.
In connection with the Wilson lease, a Wilson TI reserve of $6,300,000 was established, of which $3,100,000 was funded through loan sponsor equity and $3,200,000 was transferred from the Future TI/LC Account. The $11,219,368 remaining in the Future TI/LC Account is net of the $3,200,000 transferred to the Wilson TI reserve. Amounts in the Wilson TI reserve are required to be used to cover certain tenant improvements associated with the Wilson lease, and an amount not to exceed $873,860 thereof may, at the tenant’s election, be applied towards monthly base rent during the term of the lease.
Tax Escrows- On a monthly basis, the borrower is required to deposit reserves of 1/12 of the estimated annual real estate taxes, which currently equates to $1,134,682.
Insurance Escrows - On a monthly basis, the borrower is required to escrow 1/12 of annual insurance premiums, which currently equates to $82,759.
Replacement Reserves– On a monthly basis, the borrower is required to escrow $47,671 ($0.25 per square foot annually) into a replacement reserve. The replacement reserve is not subject to a cap.
THE INFORMATION IN THIS STRUCTURAL AND COLLATERAL TERM SHEET IS NOT COMPLETE AND MAY BE AMENDED PRIOR TO THE TIME OF SALE. THIS TERM SHEET IS NOT AN OFFER TO SELL THESE SECURITIES AND IT IS NOT A SOLICITATION OF AN OFFER TO BUY THESE SECURITIES IN ANY JURISDICTION WHERE THE OFFER OR SALE IS NOT PERMITTED.
| 40 of 139 | |
| Structural and Collateral Term Sheet | JPMDB 2017-C5 |
| Prudential Plaza |
Future Leasing Reserves– On a monthly basis, the borrower is required to escrow $236,236 into a future leasing reserve account until August 2018, on which date the amount will increase to $377,978. Such monthly deposits into the future leasing reserve will no longer be required if (i) 85% of the net rentable area of the Prudential Plaza property is leased in the lender’s reasonable determination or (ii) a transfer and assumption of the Prudential Plaza Whole Loan is consummated with a third party in an arm’s length transaction; provided that in either case monthly deposits in an amount equal to $238,344 into the future leasing reserve will be required if the reserve balance drops below $5,000,000, for so long as the future leasing reserve is less than $10,000,000. For so long as the debt service coverage ratio is less than 1.25x as of any calculation date and the amount on deposit in the Wilson TI reserve is less than $3,800,000, any deposit required to the future leasing reserve is required to be deposited into the Wilson TI reserve up to an amount equal to such shortfall, or if such deposit is no longer required or the borrower otherwise elects, the borrower is required to deposit, on a monthly basis, an amount equal to such shortfall into the Wilson TI reserve.
Lockbox / Cash Management.The Prudential Plaza Whole Loan is structured with a hard lockbox and in-place cash management. All rents and other payments are required to be deposited directly into a clearing account controlled by the lender. All funds in the clearing account are required to be transferred on a daily basis into a deposit account controlled by the lender and disbursed in accordance with the Prudential Plaza Loan documents. Provided no Trigger Period (as defined below) is continuing, excess cash in the deposit account is required to be disbursed to borrower, or if a new mezzanine lender exists, to mezzanine lender, in accordance with the Prudential Plaza Loan documents.
A “Trigger Period” will commence upon (i) the occurrence of an event of default under the Prudential Plaza Loan documents, (ii) the debt service coverage ratio being less than 1.15x as of any calendar quarter or (iii) the occurrence of a new mezzanine loan default, and will end if (a) with respect to clause (i) the event of default has been cured, (b) with respect to clause (ii) the debt service coverage ratio is at least 1.20x for two consecutive calendar quarters and (c) with respect to clause (iii) the receipt by lender of a new mezzanine loan default revocation notice.
Current Mezzanine or Subordinate Indebtedness. As discussed in“The Loan Sponsor” herein, there is an existing $60.0 million loan between Wells Fargo Bank, National Association, as Trustee for the Beneficial Owners of N-Star CDO VIII Grantor Trust and BFPRU II, LLC, which was initially structured as a mezzanine loan. This loan was converted to an unsecured loan which has been fully subordinated pursuant to a standstill, intercreditor and subordination agreement, and is not secured by a pledge.
Permitted Mezzanine Debt. The Prudential Plaza Whole Loan permits an approved mezzanine loan in a maximum amount of $20,000,000 provided, among other things, (i) no event of default or Trigger Period is then continuing, (ii) the future leasing reserve is drawn down to $12.5 million or less, (iii) the mezzanine loan results in a combined debt yield of no less than 9.0%, (iv) the proceeds from the mezzanine loan will be deposited into the mortgage lender’s future leasing reserve, (v) the combined debt service coverage ratio is not less than 1.40x on an amortizing basis and (vi) the loan to value ratio of the combined loans is not more than 64.6%.
THE INFORMATION IN THIS STRUCTURAL AND COLLATERAL TERM SHEET IS NOT COMPLETE AND MAY BE AMENDED PRIOR TO THE TIME OF SALE. THIS TERM SHEET IS NOT AN OFFER TO SELL THESE SECURITIES AND IT IS NOT A SOLICITATION OF AN OFFER TO BUY THESE SECURITIES IN ANY JURISDICTION WHERE THE OFFER OR SALE IS NOT PERMITTED.
| 41 of 139 | |
| Structural and Collateral Term Sheet | JPMDB 2017-C5 | |
| Hilton Hawaiian Village | ||

THE INFORMATION IN THIS STRUCTURAL AND COLLATERAL TERM SHEET IS NOT COMPLETE AND MAY BE AMENDED PRIOR TO THE TIME OF SALE. THIS TERM SHEET IS NOT AN OFFER TO SELL THESE SECURITIES AND IT IS NOT A SOLICITATION OF AN OFFER TO BUY THESE SECURITIES IN ANY JURISDICTION WHERE THE OFFER OR SALE IS NOT PERMITTED.
| 42 of 139 | |
| Structural and Collateral Term Sheet | JPMDB 2017-C5 | |
| Hilton Hawaiian Village | ||
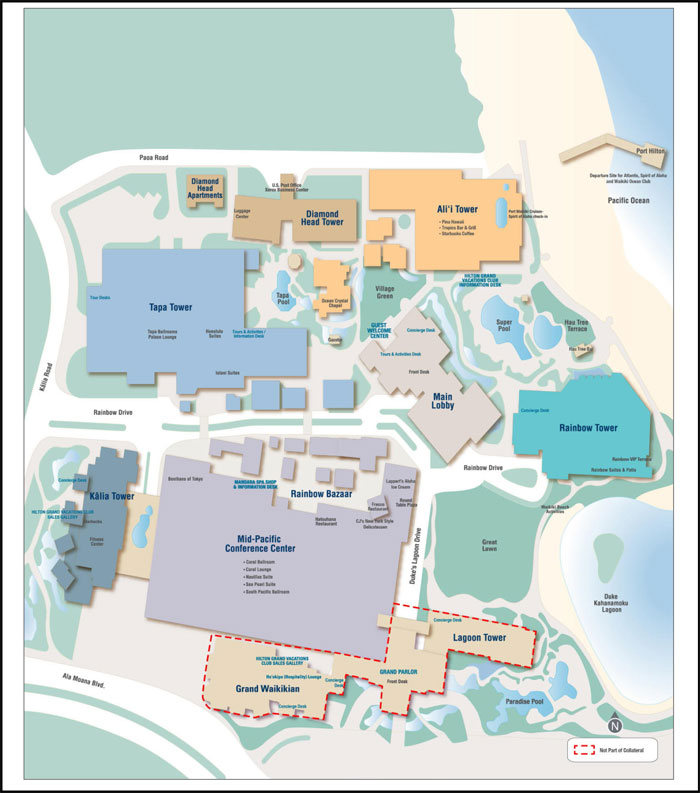
THE INFORMATION IN THIS STRUCTURAL AND COLLATERAL TERM SHEET IS NOT COMPLETE AND MAY BE AMENDED PRIOR TO THE TIME OF SALE. THIS TERM SHEET IS NOT AN OFFER TO SELL THESE SECURITIES AND IT IS NOT A SOLICITATION OF AN OFFER TO BUY THESE SECURITIES IN ANY JURISDICTION WHERE THE OFFER OR SALE IS NOT PERMITTED.
| 43 of 139 | |
| Structural and Collateral Term Sheet | JPMDB 2017-C5 | |
| Hilton Hawaiian Village | ||
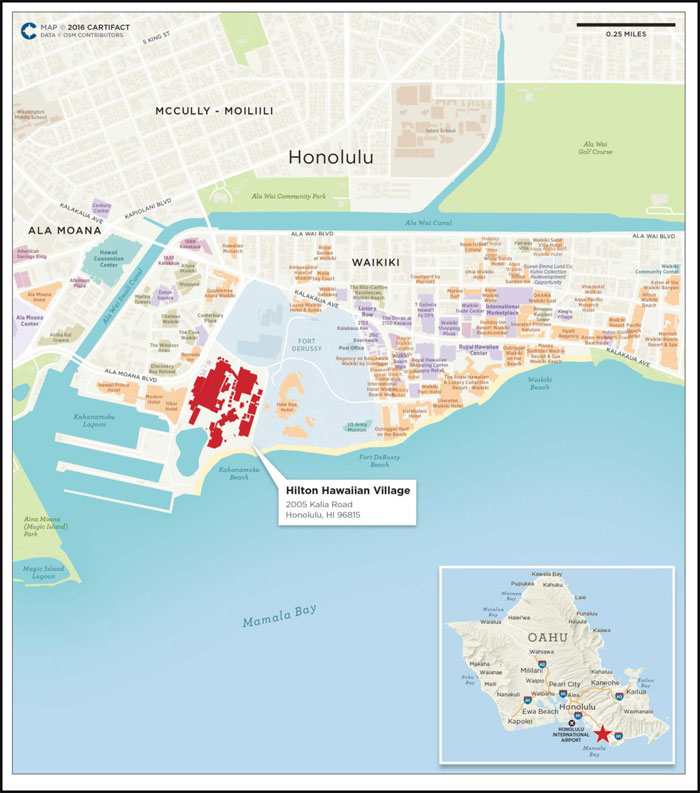
THE INFORMATION IN THIS STRUCTURAL AND COLLATERAL TERM SHEET IS NOT COMPLETE AND MAY BE AMENDED PRIOR TO THE TIME OF SALE. THIS TERM SHEET IS NOT AN OFFER TO SELL THESE SECURITIES AND IT IS NOT A SOLICITATION OF AN OFFER TO BUY THESE SECURITIES IN ANY JURISDICTION WHERE THE OFFER OR SALE IS NOT PERMITTED.
| 44 of 139 | |
| Structural and Collateral Term Sheet | JPMDB 2017-C5 | |
| Hilton Hawaiian Village | ||
| Mortgage Loan Information | Property Information | |||
| Mortgage Loan Seller(1): | JPMCB | Single Asset / Portfolio: | Single Asset | |
| Credit Assessment | Title: | Fee / Leasehold | ||
| (Moody’s/Fitch/KBRA)(2): | Aa3 / BBB- / BBB+ | Property Type - Subtype: | Hotel – Full Service | |
| Original Principal Balance(3): | $62,250,000 | Net Rentable Area (Rooms)(6): | 2,860 | |
| Cut-off Date Principal Balance(3): | $62,250,000 | Location: | Honolulu, HI | |
| % of Pool by IPB: | 6.0% | Year Built / Renovated: | 1961 / 2016 | |
| Loan Purpose(4): | Refinance | Occupancy / ADR / RevPAR: | 94.6% / $250.09 / $236.65 | |
| Borrower: | Hilton Hawaiian Village LLC | Occupancy / ADR / RevPAR Date: | 9/30/2016 | |
| Sponsor: | Park Intermediate Holdings LLC | Number of Tenants: | N/A | |
| Interest Rate: | 4.19950% | 2013 NOI: | $110,964,835 | |
| Note Date: | 10/24/2016 | 2014 NOI: | $119,860,819 | |
| Maturity Date: | 11/1/2026 | 2015 NOI: | $128,737,723 | |
| Interest-only Period: | 120 months | TTM NOI (as of 9/2016): | $131,893,120 | |
| Original Term: | 120 months | UW Occupancy / ADR / RevPAR: | 94.6% / $250.09 / $236.65 | |
| Original Amortization: | None | UW Revenues: | $374,437,742 | |
| Amortization Type: | Interest Only | UW Expenses: | $241,850,768 | |
| Call Protection(5): | L(28),DeforGrtr1%orYM(85),O(7) | UW NOI: | $132,586,975 | |
| Lockbox / Cash Management: | Hard / Springing | UW NCF: | $132,586,975 | |
| Additional Debt: | Yes | Appraised Value / Per Room: | $2,230,000,000 / $779,720 | |
| Additional Debt Balance(3): | $634,350,000 / $578,400,000 | Appraisal Date: | 8/30/2016 | |
| Additional Debt Type: | Pari Passu / Subordinate Debt | |||
| Escrows and Reserves(7) | Financial Information(3) | ||||||||
| Initial | Monthly | Initial Cap | Pari Passu Debt | Whole Loan | |||||
| Taxes: | $0 | Springing | N/A | Cut-off Date Loan / Room: | $243,566 | $445,804 | |||
| Insurance: | $0 | Springing | N/A | Maturity Date Loan / Room: | $243,566 | $445,804 | |||
| FF&E: | $0 | Springing | N/A | Cut-off Date LTV: | 31.2% | 57.2% | |||
| TI/LC: | $0 | $0 | N/A | Maturity Date LTV: | 31.2% | 57.2% | |||
| Other: | $0 | $0 | N/A | UW NCF DSCR: | 4.47x | 2.44x | |||
| UW NOI Debt Yield: | 19.0% | 10.4% | |||||||
| Sources and Uses | ||||||
| Sources | Proceeds | % of Total | Uses | Proceeds | % of Total | |
| Mortgage Loan(3) | $1,275,000,000 | 100.0% | Payoff Existing Debt | $1,255,912,700 | 98.5% | |
| Excess Loan Proceeds(4) | 10,621,760 | 0.8 | ||||
| Closing Costs | 8,465,540 | 0.7 | ||||
| Total Sources | $1,275,000,000 | 100.0% | Total Uses | $1,275,000,000 | 100.0% | |
| (1) | The Hilton Hawaiian Village Whole Loan was co-originated by JPMCB, Deutsche Bank AG, New York Branch, Goldman Sachs Mortgage Company, Barclays Bank PLC and Morgan Stanley Bank, N.A. |
| (2) | Moody’s, Fitch and KBRA have confirmed that the Hilton Hawaiian Village Mortgage Loan has, in the context of its inclusion in the mortgage pool, credit characteristics consistent with an investment grade obligation. |
| (3) | The Hilton Hawaiian Village Mortgage Loan is part of a whole loan comprised of (i) the mortgage loan (comprised of two senior notes with an aggregate outstanding principal balance as of the Cut-off Date of $62.25 million), (ii) two companion loans, each of which ispari passu with respect to the Hilton Hawaiian Village Mortgage Loan (such companion loans being comprised of 14pari passu notes) with an aggregate outstanding principal balance as of the Cut-off Date of $634.35 million and (iii) a subordinate companion loan (comprised of fivepari passu notes) with an aggregate outstanding principal balance as of the Cut-off Date of $578.4 million. The Pari Passu Debt Financial Information presented in the chart above reflects the $696.6 million aggregate Cut-off Date balance of the Hilton Hawaiian Village Mortgage Loan and the Hilton Hawaiian Village Pari Passu Companion Loan, excluding the Hilton Hawaiian Village Subordinate Companion Loan. The Whole Loan Financial Information presented in the chart above reflects the Cut-off Date balance of the $1.275 billion Hilton Hawaiian Village Whole Loan, as defined in“The Loan” below. |
| (4) | Excess Loan Proceeds were distributed by the borrower to its member and utilized by affiliates of Park Hotels & Resorts to prepay other outstanding CMBS loans. |
| (5) | The lockout period will be at least 28 payment dates beginning with and including the first payment date of December 1, 2016. Defeasance of the full $1.275 billion Hilton Hawaiian Village Whole Loan is permitted after the date that is the earlier of (i) May 1, 2019 and (ii) two years from the closing date of the securitization that includes the last note to be securitized (the “REMIC Prohibition Period”). If the borrower has not previously elected to defease the Hilton Hawaiian Village Whole Loan, the borrower is also permitted to prepay the Hilton Hawaiian Village Whole Loan in whole, but not in part, after the expiration of the REMIC Prohibition Period with the payment of a yield maintenance premium. |
| (6) | The Hilton Hawaiian Village property also includes approximately 130,489 square feet of commercial/retail space leased to more than 100 tenants. Additionally, the property includes the 25-story Kalia Tower which is subject to a condominium regime. Kalia Tower contains six floors totaling 72 timeshare units that are not part of the collateral for the loan. |
| (7) | For a full description of Escrows and Reserves, please refer to“Escrows and Reserves”below. |
THE INFORMATION IN THIS STRUCTURAL AND COLLATERAL TERM SHEET IS NOT COMPLETE AND MAY BE AMENDED PRIOR TO THE TIME OF SALE. THIS TERM SHEET IS NOT AN OFFER TO SELL THESE SECURITIES AND IT IS NOT A SOLICITATION OF AN OFFER TO BUY THESE SECURITIES IN ANY JURISDICTION WHERE THE OFFER OR SALE IS NOT PERMITTED.
| 45 of 139 | |
| Structural and Collateral Term Sheet | JPMDB 2017-C5 | |
| Hilton Hawaiian Village | ||
The Loan.The Hilton Hawaiian Village loan is secured by a first mortgage lien on the borrower’s fee and leasehold interests in a 2,860-room luxury full-service destination resort located in Honolulu, Hawaii. The whole loan was co-originated by JPMCB, Deutsche Bank AG, New York Branch, Goldman Sachs Mortgage Company, Barclays Bank PLC and Morgan Stanley Bank, N.A. and has an outstanding principal balance as of the Cut-off Date of $1.275 billion (the “Hilton Hawaiian Village Whole Loan”). The Hilton Hawaiian Village Whole Loan is comprised of (i) a senior loan, comprised of 16pari passu notes, with an aggregate outstanding principal balance of $696.6 million (two of which, Note A-2-A-3 and Note A-2-A-4, will be contributed to the JPMDB 2017-C5 Trust, the “Hilton Hawaiian Village Mortgage Loan” and the remaining notes, collectively, the “Hilton Hawaiian Village Pari Passu Companion Loan”) and (ii) a subordinate companion loan, comprised of fivepari passunotes, with an aggregate outstanding principal balance of $578.4 million (collectively, the “Hilton Hawaiian Village Subordinate Companion Loan”), each as described below. The Hilton Hawaiian Village Mortgage Loan and the Hilton Hawaiian Village Pari Passu Companion Loan arepari passu in right of payment with each other and are generally senior in right of payment to the Hilton Hawaiian Village Subordinate Companion Loan as and to the extent described in “Description of the Mortgage Pool—The Whole Loans—The Non-Serviced Whole Loans—The Hilton Hawaiian Village Whole Loan” in the Preliminary Prospectus. The senior Note A-1-A was contributed to the Hilton USA Trust 2016-HHV securitization that governs the servicing and administration of the Hilton Hawaiian Village Whole Loan and is the controlling note under the related intercreditor agreement, the rights of which will be exercised by the related trustee (or, prior to the occurrence and continuance of a control termination event under the related trust and servicing agreement (the “Hilton USA Trust 2016-HHV Trust and Servicing Agreement”), the directing certificateholder under the Hilton USA Trust 2016-HHV Trust and Servicing Agreement). However, the JPMDB 2017-C5 Trust will be entitled, under certain circumstances, to be consulted with respect to certain major decisions (which rights will be exercised by the Directing Certificateholder prior to a Control Termination Event). The Hilton Hawaiian Village Whole Loan has a 10-year term and will be interest-only for the term of the loan. The prior debt secured by the Hilton Hawaiian Village property was previously securitized in the Hilton USA Trust 2013-HLT trust.
| Whole Loan Summary |
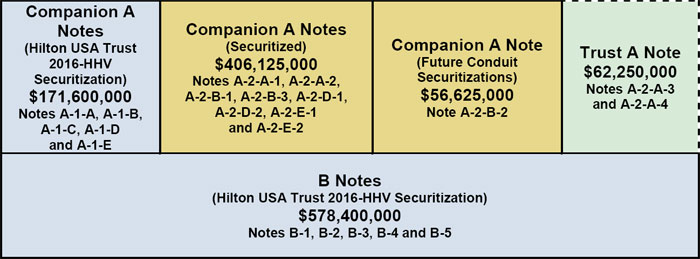
The Borrower.The borrowing entity for the Hilton Hawaiian Village Whole Loan is Hilton Hawaiian Village LLC, a Hawaii limited liability company and special purpose entity.
The Loan Sponsor.The loan sponsor and nonrecourse carve-out guarantor is Park Intermediate Holdings LLC. Park Intermediate Holdings LLC is a wholly owned subsidiary of Park Hotels & Resorts Inc. (“Park Hotels & Resorts”), one of two spin-offs announced by Hilton Worldwide Holdings Inc. (“Hilton”). On February 26, 2016, Hilton announced plans to separate into three independent, publicly traded companies: Park Hotels & Resorts (NYSE: PK), Hilton Grand Vacations Inc. (NYSE: HGV) and Hilton (NYSE: HLT). The spin-offs were completed in January 2017 and Park Hotels & Resorts now owns most of Hilton’s formerly owned and leased real estate properties and, with over 35,000 rooms and 67 hotels, is the second-largest publicly traded real estate investment trust in the lodging industry. Hilton Grand Vacations Inc. owns and operates Hilton’s timeshare business, while Hilton retains its core management and franchise business and continues to trade on the NYSE as a leading global hospitality company. The aggregate liability of the guarantor with respect to all full recourse carve-outs in the Hilton Hawaiian Village Whole Loan documents may not exceed an amount equal to 10.0% of the principal balance of the Hilton Hawaiian Village Whole Loan outstanding at the time of the occurrence of such event, plus any and all reasonable third-party collection costs actually incurred by the lender. In addition, the guarantor is not a party to the environmental indemnity. In lieu of the guarantor signing the indemnity, the Hilton Hawaiian Village Whole Loan documents require the borrower to obtain environmental insurance. At origination, the borrower obtained an environmental insurance policy with (i) a term of 10 years, (ii) limits of $10,000,000 per occurrence and $25,000,000 in the aggregate and (iii) a $25,000 deductible.
THE INFORMATION IN THIS STRUCTURAL AND COLLATERAL TERM SHEET IS NOT COMPLETE AND MAY BE AMENDED PRIOR TO THE TIME OF SALE. THIS TERM SHEET IS NOT AN OFFER TO SELL THESE SECURITIES AND IT IS NOT A SOLICITATION OF AN OFFER TO BUY THESE SECURITIES IN ANY JURISDICTION WHERE THE OFFER OR SALE IS NOT PERMITTED.
| 46 of 139 | |
| Structural and Collateral Term Sheet | JPMDB 2017-C5 | |
| Hilton Hawaiian Village | ||
The Property. The Hilton Hawaiian Village property is a 2,860-room, full-service luxury resort located on the island of Oahu in Honolulu, Hawaii. The Hilton Hawaiian Village is one of Hawaii’s premier urban resort destinations, situated on an entire city block overlooking Waikiki Beach. The property is situated on an approximately 22-acre site, the majority of which is fee-owned. The property is comprised of 2,860 guest rooms spread across five towers: the Ali’i Tower (348 rooms), Diamond Head Tower (380 rooms), Rainbow Tower (796 rooms), Kalia Tower (315 rooms) and Tapa Tower (1,021 rooms). The towers each offer unique guest room accommodations and are situated on ocean-front property, offering views of Waikiki Beach, Diamond Head and downtown Honolulu. The property is the only self-contained destination resort in Waikiki and offers the largest guest room inventory in the state of Hawaii, as well as the most meeting space within its competitive set. The property offers a host of resort-style amenities and services, including 20 food and beverage outlets, over 150,000 square feet of flexible indoor and outdoor function space, three conference centers, five swimming pools, a saltwater lagoon, spa grottos, the Mandara Spa and Fitness Center, a chapel and a retail component comprised of over 100 retail tenants.
The property was initially constructed by Hilton in 1961 and has undergone several extensive renovations throughout its existence. According to the sponsor, since 2008, the loan sponsor has invested approximately $232.2 million (approximately $81,188 per room) in capital expenditures spread across all segments of the property. Most recently, the loan sponsor completed a full-scale renovation of its premier luxury guest room tower, the Ali’i Tower, in 2012, updating the guest rooms and suites, main lobby and library at an estimated cost of approximately $20.6 million. Additionally, the loan sponsor completed a comprehensive renovation of the Diamond Head Tower in 2014 at an estimated cost of approximately $17.9 million.
| Historical Capital Expenditures(1) | ||||||||||
| 2008 | 2009 | 2010 | 2011 | 2012 | 2013 | 2014 | 2015 | YTD 2016(2) | Total | |
| Capital Expenditures(3) | $22,216 | $16,509 | $8,834 | $56,117 | $42,568 | $28,138 | $32,965 | $15,559 | $9,293 | $232,198 |
| Per Room | $7,768 | $5,772 | $3,089 | $19,621 | $14,884 | $9,838 | $11,526 | $5,440 | $3,249 | $81,188 |
| (1) | Based on actual capital expenditures as provided by the loan sponsor. |
| (2) | YTD 2016 Capital Expenditures are as of September 30, 2016. |
| (3) | Capital Expenditures are presented in (000)’s. |
The property offers approximately 150,000 square feet of indoor and outdoor meeting and function space, which is split between three primary locations: the second floor of the Tapa Tower, the base of the Kalia Tower and the Mid-Pacific Conference Center. The property features over 65,000 square feet of indoor meeting space spread throughout four buildings, as well as two outdoor lawns: the Lagoon Green and the Village Green. The Mid-Pacific Conference Center, a stand-alone building, underwent a full-scale refurbishment in 2013 and features 35,000 square feet of meeting/event space, including the 24,840 square foot Coral Ballroom, which is divisible into five separate breakout rooms. It is among the largest conference centers in the Hawaiian Islands and offers the largest capacity ballroom, accommodating up to 2,600 guests.
The property features approximately 130,489 square feet of leased retail and restaurant space, which was 78.5% occupied by over 100 tenants as of September 2016. The retail component of the property generated TTM September 2016 sales of approximately $136.1 million for reporting tenants. For the trailing 12-month period ending September 30, 2016, the retail component of the property generated approximately $20.8 million in retail revenue (retail revenue is inclusive of reimbursements for common area maintenance, taxes and marketing expenses, as provided by the loan sponsor) which, net of undistributed expenses attributable to the retail component (as estimated by the loan sponsor), accounts for approximately 13.1% of net cash flow, providing diversity to traditional hotel revenue streams. While the majority of the property’s leased space is made up of traditional retail and restaurant tenants, the hotel also leases some office space to Hilton Grand Vacations and third-party travel wholesalers, such as Kintetsu and JTB. The hotel’s Ocean Crystal Chapel and Lagoon Chapel are also leased to a third-party operator.
| Historical Retail Component Sales(1) | ||||
| 2013 | 2014 | 2015 | TTM(2) | |
| Total Sales | $130,613,993 | $141,808,186 | $137,316,925 | $136,055,744 |
| Sales PSF | $1,552 | $1,651 | $1,590 | $1,496 |
| (1) | Historical Sales for reporting tenants were provided by the loan sponsor. |
| (2) | TTM is as of September 30, 2016. |
THE INFORMATION IN THIS STRUCTURAL AND COLLATERAL TERM SHEET IS NOT COMPLETE AND MAY BE AMENDED PRIOR TO THE TIME OF SALE. THIS TERM SHEET IS NOT AN OFFER TO SELL THESE SECURITIES AND IT IS NOT A SOLICITATION OF AN OFFER TO BUY THESE SECURITIES IN ANY JURISDICTION WHERE THE OFFER OR SALE IS NOT PERMITTED.
| 47 of 139 | |
| Structural and Collateral Term Sheet | JPMDB 2017-C5 | |
| Hilton Hawaiian Village | ||
| Collateral Tenant Summary(1) | ||||||||
| Tenant | Ratings(2) Moody’s/S&P/Fitch | Net Rentable Area (SF) | % of Total NRA | Lease Expiration Date | Base Rent PSF | % of Total Base Rent | Most Recent Sales(3) | Most Recent Sales PSF(3) |
| Mandara Spa | NA / NA / NA | 12,583 | 9.6% | 8/31/2017 | $53.61 | 3.9% | $2,903,709 | $231 |
| Hatsuhana Hawaii | NA / NA / NA | 6,026 | 4.6% | 11/30/2018 | $52.38 | 1.8% | $2,969,958 | $493 |
| Fresco | NA / NA / NA | 5,983 | 4.6% | 12/31/2018 | $58.38 | 2.0% | $3,331,316 | $557 |
| Benihana of Tokyo | NA / NA / NA | 5,300 | 4.1% | 5/31/2021 | $127.6 | 3.9% | $6,561,789 | $1,238 |
| Best Bridal - Lagoon Chapel | NA / NA / NA | 4,755 | 3.6% | 10/31/2022 | $57.45 | 1.6% | $520,020 | $109 |
| Watabe Wedding(4) | NA / NA / NA | 4,158 | 3.2% | 1/14/2019 | $63.93 | 1.5% | $167,697 | $40 |
| ABC Stores - Tapa Tower | NA / NA / NA | 3,500 | 2.7% | 8/31/2022 | $384.2 | 7.7% | $12,225,380 | $3,493 |
| Louis Vuitton | NA / A+ / NA | 3,500 | 2.7% | 8/18/2023 | $146.7 | 2.9% | $7,978,397 | $2,280 |
| Lamonts & Whalers General Store | NA / NA / NA | 2,800 | 2.1% | MTM | $163.1 | 2.6% | $1,856,972 | $663 |
| ABC Discount Store | NA / NA / NA | 2,145 | 1.6% | 12/31/2018 | $812.2 | 10.0% | $14,519,183 | $6,769 |
| (1) | Based on the underwritten rent roll. |
| (2) | Ratings provided are for the parent company of the entity listed in the “tenant” field whether or not the parent company guarantees the lease. |
| (3) | Most Recent Sales and Most Recent Sales PSF for reporting tenants were provided by the loan sponsor as of September 30, 2016. |
| (4) | Most Recent Sales and Most Recent Sales PSF for Watabe Wedding represent only partial year performance as the venue opened in 2016. |
The Hilton Hawaiian Village property is located in Honolulu, Hawaii, in the greater Oahu lodging market and the Waikiki submarket. The island of Oahu serves as an economic center of the Hawaiian Islands. Oahu maintains its status as one of the world’s foremost tourist destinations, with cultural venues, golf courses, restaurants, retail and recreational attractions. In 2015, approximately 5.3 million tourists, or 62.4% of Hawaii’s total air tourists, visited the island of Oahu, making it the most popular destination in the Hawaiian Islands. The total number of air visitors has increased by 435,867 from 2012 to 2015, which represents a 2.9% year-over-year increase. International travel to Oahu represented 46.3% of Oahu’s 5.3 million air visitors in 2015 and was marginally unchanged from 2014. Additionally, visitor expenditures in Oahu totaled $7.4 billion in 2015, which represents 49.3% of total expenditures by air visitors in 2015. Honolulu is the strongest lodging market in Oahu and all of the eight Hawaiian Islands, a status attributable to a temperate year-round climate, popularity as one of the leading group and leisure destinations of Hawaii, superior visitor infrastructure and high barriers to new supply. Honolulu encompasses more than 24,000 guest rooms in 74 properties and consistently achieved occupancy rates in the mid 70% to 80% range, never dropping below 74%, between 2009 and 2015. During this same period, RevPAR in Honolulu increased at an average annual rate of 9.5%, ending 2015 at $190, while the average daily rate achieved a premium of $69 over 2009. The market’s RevPAR in 2009, which represented the trough during the downturn, reflects a 14.6% decline relative to 2007, less than other leading markets.
The appraisal identified two hotels either recently opened or currently under construction in the Waikiki submarket that are expected to have some degree of competitive interaction with the Hilton Hawaiian Village property. The 623-room Hilton Garden Inn (Ohana Waikiki West Redevelopment) opened in June 2016, while the 230-room boutique Hyatt Centric (Waikiki Trade Center Redevelopment) is expected to open in March 2017. Though offered at a competitive price-point with national brand affiliations, the appraisal notes that both options are non-beachfront locations with select-service product offerings. Additionally, the appraisal notes significant barriers to entry, including nearly no developable ocean-front land and prohibitively high costs.
| Historical Occupancy, ADR, RevPAR(1) | ||||||||||
| Competitive Set(2) | Hilton Hawaiian Village(3) | Penetration Factor(4) | ||||||||
| Year | Occupancy | ADR | RevPAR | Occupancy | ADR | RevPAR | Occupancy | ADR | RevPAR | |
| 2013 | 89.0% | $248.36 | $221.07 | 89.9% | $237.77 | $213.84 | 101.0% | 95.7% | 96.7% | |
| 2014 | 87.8% | $250.07 | $219.50 | 90.7% | $238.34 | $216.26 | 103.4% | 95.3% | 98.5% | |
| 2015 | 89.0% | $256.75 | $228.38 | 94.4% | $240.62 | $227.20 | 106.2% | 93.7% | 99.5% | |
| TTM(5) | 89.9% | $259.08 | $232.92 | 94.6% | $250.09 | $236.65 | 105.3% | 96.5% | 101.6% | |
| (1) | Variances between the underwriting, the appraisal and the above table with respect to Occupancy, ADR and RevPAR at the Hilton Hawaiian Village property are attributable to variances in reporting methodologies and/or timing differences. |
| (2) | Data provided by STR. The competitive set contains the following properties: Sheraton Waikiki, Marriott Waikiki Beach Resort & Spa, Hyatt Regency Waikiki Beach Resort & Spa, Westin Moana Surfrider, Sheraton Hotel Princess Kaiulani, Outrigger Reef Waikiki Beach Resort and Outrigger Waikiki Beach Resort. |
| (3) | Based on operating statements provided by the borrower, with the exception of 2013 and 2014 which have been adjusted by STR for both ADR and RevPAR in order to normalize for a change in accounting methodology in 2015. Prior to 2015, borrower operating statements presented ADR and RevPAR inclusive of resort fees. For all years presented above, ADR and RevPAR are calculated exclusive of resort fees. |
| (4) | Penetration Factor is calculated based on data provided by STR for the competitive set and borrower-provided operating statements for the property. |
| (5) | TTM represents the trailing 12-month period ending on September 30, 2016. |
THE INFORMATION IN THIS STRUCTURAL AND COLLATERAL TERM SHEET IS NOT COMPLETE AND MAY BE AMENDED PRIOR TO THE TIME OF SALE. THIS TERM SHEET IS NOT AN OFFER TO SELL THESE SECURITIES AND IT IS NOT A SOLICITATION OF AN OFFER TO BUY THESE SECURITIES IN ANY JURISDICTION WHERE THE OFFER OR SALE IS NOT PERMITTED.
| 48 of 139 | |
| Structural and Collateral Term Sheet | JPMDB 2017-C5 | |
| Hilton Hawaiian Village | ||
| Competitive Hotels Profile(1) | |||||||||
| 2015 Estimated Market Mix | 2015 Estimated Operating Statistics | ||||||||
| Property | Rooms | Year Opened | Meeting Space (SF) | Wholesale | Transient | Meeting & Group | Occupancy | ADR | RevPAR |
| Hilton Hawaiian Village(2) | 2,860 | 1961 | 150,000 | 37% | 44% | 19% | 94.4% | $240.62 | $227.20 |
| Primary Competitors | |||||||||
| Sheraton Waikiki | 1,636 | 1971 | 48,210 | 65% | 15% | 20% | 90-95% | $300-325 | $280-290 |
| Marriott Waikiki Beach Resort & Spa | 1,310 | 1971 | 55,000 | 20% | 60% | 20% | 85-90% | $210-220 | $180-190 |
| Hyatt Regency Waikiki Beach Resort & Spa | 1,230 | 1976 | 23,130 | 60% | 25% | 15% | 85-90% | $250-260 | $220-230 |
| Westin Moana Surfrider | 791 | 1901-1969 | 23,612 | 60% | 30% | 10% | 85-90% | $350-375 | $300-325 |
| Secondary Competitors | |||||||||
| Sheraton Hotel Princess Kaiulani | 1,000 | 1955 | 14,000 | 65% | 25% | 10% | 85-90% | $150-160 | $130-140 |
| Outrigger Reef Waikiki Beach Resort | 635 | 1956 | 9,600 | 55% | 40% | 5% | 85-90% | $250-260 | $220-230 |
| Outrigger Waikiki Beach Resort | 524 | 1967 | 5,000 | 50% | 40% | 10% | 80-85% | $260-270 | $220-230 |
| Total(3) | 7,126 | ||||||||
| (1) | Based on the appraisal. |
| (2) | Occupancy, ADR and RevPAR are based on operating statements provided by the borrower. |
| (3) | Excludes the Hilton Hawaiian Village property. |
| Operating History and Underwritten Net Cash Flow | |||||||
| 2013 | 2014 | 2015 | TTM(1) | Underwritten | Per Room(2) | % of Total Revenue(3) | |
| Occupancy | 89.9% | 90.7% | 94.4% | 94.6% | 94.6% | ||
| ADR(4) | $247.48 | $259.85 | $240.62 | $250.09 | $250.09 | ||
| RevPAR(4) | $222.57 | $235.77 | $227.20 | $236.65 | $236.65 | ||
| Room Revenue | $232,345,007 | $246,124,088 | $237,172,233 | $247,711,744 | $247,034,700 | $86,376 | 66.0% |
| Resort Fee(4) | 0 | 0 | 22,462,635 | 22,641,808 | 22,752,381 | 7,955 | 6.1% |
| Food and Beverage Revenue | 56,844,007 | 62,740,100 | 70,771,369 | 69,023,623 | 68,996,667 | 24,125 | 18.4% |
| Retail Revenue(5) | 19,071,361 | 20,048,658 | 20,582,018 | 20,786,062 | 19,162,812 | 6,700 | 5.1% |
| Other Departmental Revenue | 16,714,514 | 17,176,781 | 15,802,967 | 16,824,201 | 16,491,183 | 5,766 | 4.4% |
| Total Revenue | $324,974,888 | $346,089,627 | $366,791,222 | $376,987,438 | $374,437,742 | $130,922 | 100.0% |
| Room Expense | $55,976,889 | $59,766,137 | $62,515,991 | $64,556,543 | $64,380,098 | $22,511 | 26.1% |
| Food and Beverage Expense | 45,055,100 | 48,831,676 | 56,658,889 | 56,716,914 | 56,028,348 | 19,590 | 81.2% |
| Other Departmental Expense | 7,418,538 | 7,148,334 | 7,483,496 | 6,425,274 | 6,371,608 | 2,228 | 38.6% |
| Departmental Expenses | $108,450,526 | $115,746,148 | $126,658,376 | $127,698,731 | $126,780,054 | $44,329 | 33.9% |
| Departmental Profit | $216,524,362 | $230,343,479 | $240,132,846 | $249,288,707 | $247,657,688 | $86,594 | 66.1% |
| Operating Expenses | $61,997,168 | $64,229,329 | $62,250,540 | $64,897,454 | $62,099,714 | $21,713 | 16.6% |
| Gross Operating Profit | $154,527,194 | $166,114,150 | $177,882,306 | $184,391,253 | $185,557,974 | $64,880 | 49.6% |
| Management Fee | $9,159,509 | $9,759,316 | $10,366,617 | $11,551,940 | $10,658,248 | $3,727 | 2.8% |
| Incentive Management Fee | 7,542,587 | 8,134,544 | 8,776,701 | 9,141,675 | 9,344,215 | 3,267 | 2.5% |
| Retail Management Fee | 1,081,185 | 1,142,850 | 1,168,053 | 1,174,867 | 1,053,955 | 369 | 0.3% |
| Property Taxes | 8,335,725 | 9,129,497 | 10,512,964 | 11,773,676 | 12,249,130 | 4,283 | 3.3% |
| Property Insurance | 3,138,410 | 3,058,106 | 2,452,071 | 2,579,098 | 3,343,630 | 1,169 | 0.9% |
| Ground Rent & Other Expense | 1,305,948 | 1,185,432 | 1,196,527 | 1,197,379 | 1,344,312 | 470 | 0.4% |
| FF&E | 12,998,996 | 13,843,585 | 14,671,649 | 15,079,498 | 14,977,510 | 5,237 | 4.0% |
| Total Other Expenses | $43,562,359 | $46,253,331 | $49,144,583 | $52,498,133 | $52,971,000 | $18,521 | 14.1% |
| Net Operating Income | $110,964,835 | $119,860,819 | $128,737,723 | $131,893,120 | $132,586,975 | $46,359 | 35.4% |
| Net Cash Flow | $110,964,835 | $119,860,819 | $128,737,723 | $131,893,120 | $132,586,975 | $46,359 | 35.4% |
| (1) | TTM represents the trailing 12-month period ending on September 30, 2016. |
| (2) | Per Room values based on 2,860 guest rooms. |
| (3) | % of Total Revenue for Room Expense, Food and Beverage Expense and Other Departmental Expenses is based on their corresponding revenue line items. |
| (4) | Prior to a change in industry accounting methodology in 2015, resort fees were accounted for as a component of Room Revenue and included in ADR and RevPAR calculations. Since 2014, resort fees have been netted out of Room Revenue and shown separately in the Resort Fee category. ADR and RevPAR are shown net of resort fees for 2015 and all future years. |
| (5) | Retail tenant spaces are occupied pursuant to partial net leases. Retail Revenue is inclusive of reimbursements associated with shared common area maintenance, tax and marketing expenses. Related expenses attributable to the retail component are included in undistributed Operating Expenses for the overall property. |
THE INFORMATION IN THIS STRUCTURAL AND COLLATERAL TERM SHEET IS NOT COMPLETE AND MAY BE AMENDED PRIOR TO THE TIME OF SALE. THIS TERM SHEET IS NOT AN OFFER TO SELL THESE SECURITIES AND IT IS NOT A SOLICITATION OF AN OFFER TO BUY THESE SECURITIES IN ANY JURISDICTION WHERE THE OFFER OR SALE IS NOT PERMITTED.
| 49 of 139 | |
| Structural and Collateral Term Sheet | JPMDB 2017-C5 | |
| Hilton Hawaiian Village | ||
Property Management. The property is currently managed by Hilton Management LLC, a Delaware limited liability company and subsidiary of Hilton. The current management agreement expires on December 31, 2047, with two 20-year extension options, and provides for (i) a base management fee equal to 3.0% of gross revenue (less revenue from the retail component of the property), (ii) an incentive management fee equal to 6.0% of adjusted gross profit (exclusive of the retail component of the property), (iii) a management fee equal to 5.5% of net retail income with respect to the retail component of the property and (iv) monthly FF&E deposits equal to 4.0% of gross revenue for the prior month.
Escrows and Reserves. No upfront reserves were taken at origination.
Tax Escrows - The requirement for the borrower to make monthly deposits to the tax escrow is waived so long as the borrower has reserved such amounts with the property manager or the manager pays such taxes, in each case pursuant to the management agreement. In the event that the borrower is no longer required to reserve such amounts with the property manager, on each payment date, the borrower will be required to deposit 1/12 of annual estimated taxes upon the occurrence of a Trigger Period (as defined below).
Insurance Escrows - The requirement for the borrower to make monthly deposits to the insurance escrow is waived so long as the borrower has reserved such amounts with the property manager or the manager pays such premiums, in each case pursuant to the management agreement. In the event that the borrower is no longer required to reserve such amounts with the property manager, on each payment date, the borrower will be required to deposit 1/12 of annual estimated insurance premiums upon the occurrence of a Trigger Period. In addition, provided that no event of default has occurred and is continuing, the requirement to deposit such amounts is waived so long as the property is insured under a blanket policy reasonably acceptable to the lender insuring substantially all of the real property owned, directly or indirectly, by the guarantor.
Replacement Reserves -The requirement for the borrower to make monthly deposits for replacements reserves is waived so long as the borrower has reserved such amounts with the property manager pursuant to the management agreement. In the event that the borrower is no longer required to reserve such amounts with the property manager, on each payment date, the borrower will be required to deposit 4.0% of gross income for the calendar month that is two months prior to the applicable payment date (as calculated in the loan documents).
Lockbox / Cash Management.The loan is structured with a hard lockbox and springing cash management. All revenues will be deposited into segregated property accounts maintained by the property manager on behalf of the borrower and the operating lessee, as applicable, and controlled by the lender (the “Property Accounts”). All revenues in the Property Accounts (less any account charges payable to the bank at which the Property Accounts are maintained and less any required minimum peg balance) will be transferred on each business day to accounts maintained by the property manager on behalf of the borrower and the operating lessee, as applicable (each, an “Operating Account”). Funds on deposit in the Operating Accounts will be disbursed in an amount equal to the monthly replacement reserve deposit into the manager replacement reserve account (the “Manager FF&E Reserve Account”) (each of the Manager FF&E Reserve Account, the Operating Account and the Property Account are referred to as “Manager Accounts”). The property manager will be required to apply such funds to the payment of real property taxes and insurance, ground rent, debt service (but only prior to the restructuring), management fees, capital expenditures and reserves for the same, operating expenses, emergency repairs, tenant improvement costs and leasing commissions, working capital reserves, sales and use taxes owed to governmental authorities, custodial funds and required monthly reserves, in each case in accordance with the management agreement (the “Required Payments”). The lender will not require any reserves with respect to any Required Payments which are to be paid directly by or reserved by the property manager pursuant to the management agreement. On a monthly basis, the property manager will deposit all funds remaining in the Operating Accounts after the payment of the Required Payments (“Excess Cash”) into a lender-controlled account as additional collateral for the mortgage loan (the “Cash Management Account”). So long as no Trigger Period is continuing, all funds in the Cash Management Account after payment of debt service, required reserves and operating expenses will be released to the operating lessee and/or the borrower, as applicable, not later than the business day immediately following the date such funds are deposited by the property manager. During a Trigger Period, all funds in the Cash Management Account will be deposited into the excess cash accounts and held as additional collateral for the Hilton Hawaiian Village Whole Loan. The operating lessee and/or the borrower, as applicable, is required to grant a security interest in all Manager Accounts (and the property manager will consent to the same); provided, that such amounts on deposit in the Manager Accounts will be available for use by the property manager in accordance with the management agreement following an event of default and the lender will not apply such amounts on deposit in the Manager Accounts to Hilton Hawaiian Village Whole Loan.
A “Trigger Period” will commence upon the occurrence of: (i) an event of default or (ii) the date that the debt yield (as calculated in the loan documents) is less than 7.0%.
A Trigger Period will end when, if caused by (a) clause (i) above, the respective event of default has been cured or waived or (b) clause (ii) above, the debt yield (as calculated in the loan documents) exceeds 7.0% for two consecutive quarters.
THE INFORMATION IN THIS STRUCTURAL AND COLLATERAL TERM SHEET IS NOT COMPLETE AND MAY BE AMENDED PRIOR TO THE TIME OF SALE. THIS TERM SHEET IS NOT AN OFFER TO SELL THESE SECURITIES AND IT IS NOT A SOLICITATION OF AN OFFER TO BUY THESE SECURITIES IN ANY JURISDICTION WHERE THE OFFER OR SALE IS NOT PERMITTED.
| 50 of 139 | |
| Structural and Collateral Term Sheet | JPMDB 2017-C5 | |
| Hilton Hawaiian Village | ||
Partial Releases.The borrower is permitted to release (i) the ground leased parcel, (ii) the retail component and/or (iii) certain other parcels of property that do not materially and adversely affect the ongoing operations of the remaining property, other than the lost income associated with the released parcels, in each case through a partial prepayment of the Hilton Hawaiian Village Whole Loan at any time after the expiration of the lockout period upon certain terms and conditions contained in the loan documents (including, without limitation, payment of the yield maintenance premium, if applicable). Please see “Description of the Mortgage Pool—Certain Terms of the Mortgage Loans—Partial Releases” in the Preliminary Prospectus for additional details.
THE INFORMATION IN THIS STRUCTURAL AND COLLATERAL TERM SHEET IS NOT COMPLETE AND MAY BE AMENDED PRIOR TO THE TIME OF SALE. THIS TERM SHEET IS NOT AN OFFER TO SELL THESE SECURITIES AND IT IS NOT A SOLICITATION OF AN OFFER TO BUY THESE SECURITIES IN ANY JURISDICTION WHERE THE OFFER OR SALE IS NOT PERMITTED.
| 51 of 139 | |
| Structural and Collateral Term Sheet | JPMDB 2017-C5 | |
| Key Center Cleveland | ||

THE INFORMATION IN THIS STRUCTURAL AND COLLATERAL TERM SHEET IS NOT COMPLETE AND MAY BE AMENDED PRIOR TO THE TIME OF SALE. THIS TERM SHEET IS NOT AN OFFER TO SELL THESE SECURITIES AND IT IS NOT A SOLICITATION OF AN OFFER TO BUY THESE SECURITIES IN ANY JURISDICTION WHERE THE OFFER OR SALE IS NOT PERMITTED.
| 52 of 139 | |
| Structural and Collateral Term Sheet | JPMDB 2017-C5 | |
| Key Center Cleveland | ||
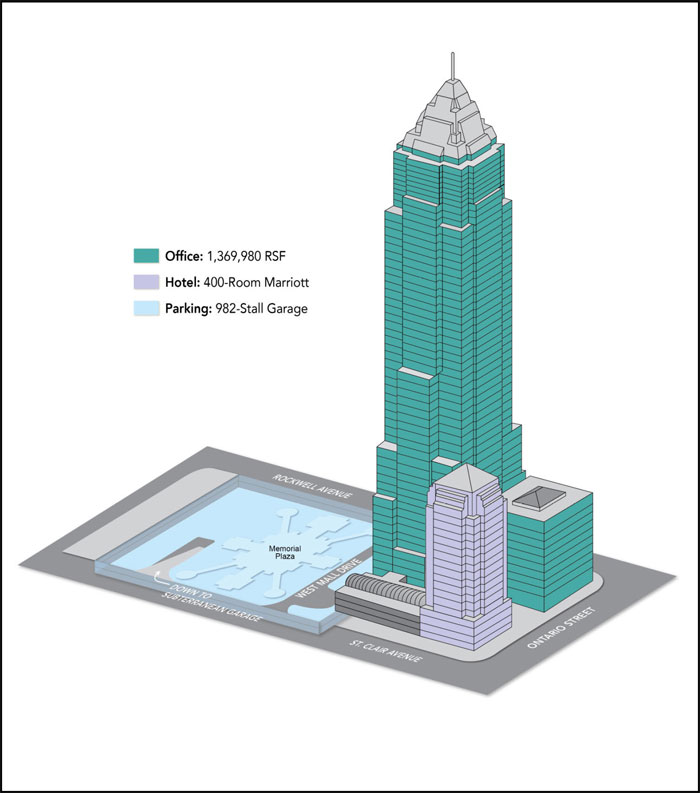
THE INFORMATION IN THIS STRUCTURAL AND COLLATERAL TERM SHEET IS NOT COMPLETE AND MAY BE AMENDED PRIOR TO THE TIME OF SALE. THIS TERM SHEET IS NOT AN OFFER TO SELL THESE SECURITIES AND IT IS NOT A SOLICITATION OF AN OFFER TO BUY THESE SECURITIES IN ANY JURISDICTION WHERE THE OFFER OR SALE IS NOT PERMITTED.
| 53 of 139 | |
| Structural and Collateral Term Sheet | JPMDB 2017-C5 | |
| Key Center Cleveland | ||
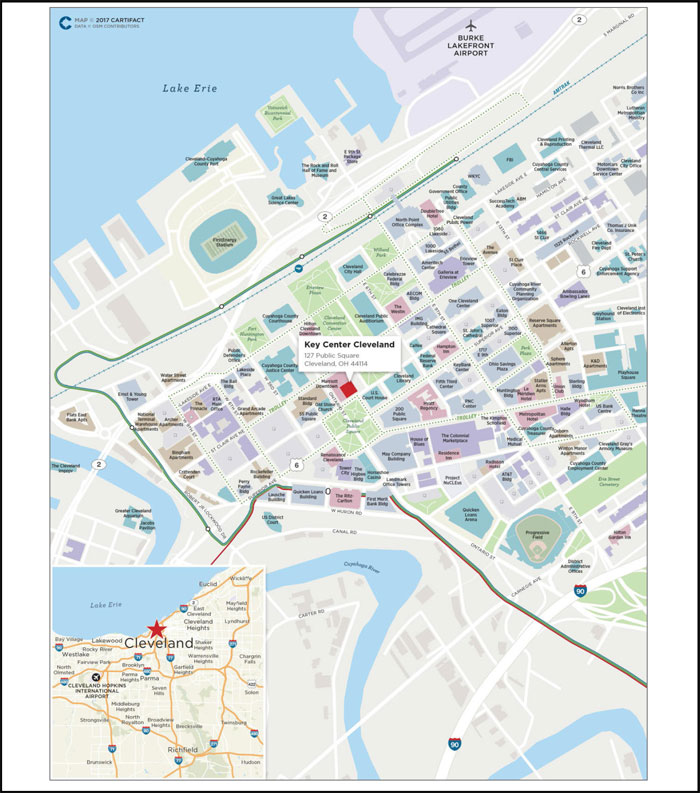
THE INFORMATION IN THIS STRUCTURAL AND COLLATERAL TERM SHEET IS NOT COMPLETE AND MAY BE AMENDED PRIOR TO THE TIME OF SALE. THIS TERM SHEET IS NOT AN OFFER TO SELL THESE SECURITIES AND IT IS NOT A SOLICITATION OF AN OFFER TO BUY THESE SECURITIES IN ANY JURISDICTION WHERE THE OFFER OR SALE IS NOT PERMITTED.
| 54 of 139 | |
| Structural and Collateral Term Sheet | JPMDB 2017-C5 | |
| Key Center Cleveland | ||
| Mortgage Loan Information | Property Information | |||
| Mortgage Loan Seller: | GACC | Single Asset / Portfolio: | Single Asset | |
| Original Principal Balance(1): | $60,000,000 | Title: | Fee / Leasehold | |
| Cut-off Date Principal Balance(1): | $60,000,000 | Property Type – Subtype(3): | Mixed Use – Office/Hotel/Parking | |
| % of Pool by IPB: | 5.8% | Net Rentable Area (SF)(3): | 1,369,980 | |
| Loan Purpose: | Acquisition | Location: | Cleveland, OH | |
| Borrower: | 127 PS Fee Owner LLC | Year Built / Renovated: | 1890,1991 / N/A | |
| Sponsor: | Frank T. Sinito and Malisse J. Sinito | Occupancy(4): | 92.9% | |
| Interest Rate: | 5.31000% | Occupancy Date: | 10/19/2016 | |
| Note Date: | 1/31/2017 | Number of Tenants: | 36 | |
| Maturity Date: | 2/6/2027 | 2013 NOI(5): | $26,874,225 | |
| Interest-only Period: | 24 months | 2014 NOI(5): | $24,855,822 | |
| Original Term: | 120 months | 2015 NOI(5): | $22,253,611 | |
| Original Amortization: | 300 months | 2016 NOI(5): | $19,057,726 | |
| Amortization Type: | IO-Balloon | UW Economic Occupancy: | 92.9% | |
| Call Protection(2): | L(25),Def(91),O(4) | UW Revenues: | $67,329,103 | |
| Lockbox / Cash Management: | Hard / In Place | UW Expenses: | $40,324,409 | |
| Additional Debt: | Yes | UW NOI(5): | $27,004,694 | |
| Additional Debt Balance: | $160,000,000 / $42,500,000 | UW NCF: | $25,327,136 | |
| Additional Debt Type: | Pari Passu / Mezzanine Loan | Appraised Value / Per SF(6): | $362,000,000 / $264 | |
| Appraisal Date: | 12/1/2017 | |||
| Escrows and Reserves(7) | Financial Information(1) | ||||||
| Initial | Monthly | Initial Cap | Whole Loan | Total Debt | |||
| Taxes: | $1,540,363 | $770,181 | N/A | Cut-off Date Loan / SF: | $161 | $192 | |
| Insurance: | $55,406 | Springing | N/A | Maturity Date Loan / SF: | $131 | $160 | |
| Replacement Reserves: | $18,271,556 | $29,284 | 1,757,065 | Cut-off Date LTV: | 60.8% | 72.5% | |
| TI/LC: | $24,069,759 | $110,513 | N/A | Maturity Date LTV: | 49.6% | 60.7% | |
| Other(8): | $11,883,765 | $5,000 | N/A | UW NCF DSCR: | 1.59x | 1.17x | |
| UW NOI Debt Yield: | 12.3% | 10.3% | |||||
| Sources and Uses | ||||||
| Sources | Proceeds | % of Total | Uses | Proceeds | % of Total | |
| Mortgage Loan | $220,000,000 | 66.7% | Gross Purchase Price | $267,500,000 | 81.1% | |
| Sponsor Equity | 60,845,008 | 18.5 | Upfront Reserves | 50,645,552 | 15.4 | |
| Mezzanine Loan | 42,500,000 | 12.9 | Closing Costs | 11,588,828 | 3.5 | |
| Other Sources(9) | 6,389,372 | 1.9 | ||||
| Total Sources | $329,734,380 | 100.0% | Total Uses | $329,734,380 | 100.0% | |
| (1) | The Key Center Cleveland loan is part of a whole loan evidenced by sixpari passu notes with an aggregate original principal balance of $220.0 million. The Whole Loan Financial Information presented in the chart above reflects the Key Center Whole Loan Cut-off Date balance of $220.0 million. The Total Debt Financial Information presented in the chart above reflects the aggregate Cut-off Date balance of the Key Center Whole Loan and the related mezzanine loan of $262.5 million. |
| (2) | Defeasance of the full $220.0 million Key Center Cleveland Whole Loan is permitted after the earlier to occur of (i) July 31, 2020 and (ii) the date that is two years from the closing date of the securitization that includes the note to be last securitized. The assumed lockout period of 25 payments is based on the expected JPMDB 2017-C5 securitization closing date in March 2017. The actual lockout period may be longer. |
| (3) | The Key Center Cleveland property consists of a 1,369,980 square foot office building (“Key Tower”), 400-room, 699,871 square foot, full service hotel (“Marriott Cleveland Downtown”), and 985-space, 319,590 square foot, parking garage (“Key Center Parking Garage Component”). |
| (4) | Occupancy represents the occupancy for Key Tower of 92.9% as of October 19, 2016, which includes the tenants Forest City and Millennia, which have not yet taken occupancy at the Key Center Cleveland property. The Marriott Cleveland Downtown is 66.2% occupied for the trailing twelve month period ending December 31, 2016. |
| (5) | The decline in historical NOI is due primarily to KeyBank downsizing its space at the property. The increase in UW NOI from 2016 NOI was primarily due to newly executed leases with tenants Forest City and Millennia (a borrower affiliate). Forest City executed a lease commencing in April 2018 for 147,795 square feet resulting in an increase to the Underwritten Base Rent of $3,990,465 and Millennia executed a lease commencing in July 2017 for 45,360 square feet resulting in an increase to the Underwritten Base Rent of $1,247,400. |
| (6) | The Appraised Value / Per SF, Cut-off Date LTV and Maturity Date LTV are calculated based on the Key Center Cleveland property’s combined “Prospective Value Upon Completion” of $362,000,000 as of December 1, 2017, which is the date upon which all capital improvements are expected to be completed at the property. The budgeted costs of such planned capital improvements were reserved for at loan origination. The Appraised Value of $362,000,000 consists of (i) $253,800,000 ($185 per square foot) for Key Tower, (ii) $77,000,000 (192,5000 per room) for Marriott Cleveland Downtown and (iii) $31,200,000 ($97 per square foot) for the Key Center Parking Garage Component. The combined “As-is” appraised value of $304,100,000 as of December 1, 2016 results in a Cut-off Date LTV and Maturity Date LTV for the whole loan of 72.3% and 59.0%, respectively and 86.3% and 72.3% for the total debt, respectively. |
| (7) | For a description of Escrows and Reserves, please refer to “Escrows and Reserves” below. In addition to the reserves above, the borrower provided two letters of credit in the aggregate amount of $5,175,296 to cover free rent associated with the Forest City and Millennia tenants. Such tenants are not yet in occupancy or paying rent. Forest City and Millennia are expected to commence paying rent no later than April 1, 2018 and July 1, 2017, respectively. |
| (8) | Initial Other reserves includes $1,991,429 that is held in an FF&E reserve account by Marriott as the hotel manager for planned capital expenditures at the Marriott Cleveland Downtown. |
| (9) | Other Sources include $5,608,359 of seller credits transferred to the loan sponsor at loan closing which was related to outstanding tenant improvements for the Thompson Hine LLP tenant. |
THE INFORMATION IN THIS STRUCTURAL AND COLLATERAL TERM SHEET IS NOT COMPLETE AND MAY BE AMENDED PRIOR TO THE TIME OF SALE. THIS TERM SHEET IS NOT AN OFFER TO SELL THESE SECURITIES AND IT IS NOT A SOLICITATION OF AN OFFER TO BUY THESE SECURITIES IN ANY JURISDICTION WHERE THE OFFER OR SALE IS NOT PERMITTED.
| 55 of 139 | |
| Structural and Collateral Term Sheet | JPMDB 2017-C5 | |
| Key Center Cleveland | ||
The Loan.The Key Center Cleveland loan is secured by a first mortgage lien on the borrower’s fee interest in a 1,369,980 square foot office building and a 400-room full service hotel and the leasehold interest in an adjacent, 985-space subterranean parking garage, located in Cleveland, Ohio. The whole loan has an outstanding principal balance as of the Cut-off Date of $220.0 million (the “Key Center Cleveland Whole Loan”) and is comprised of sixpari passu notes, each as described below. Note A-3 and A-6, with an aggregate outstanding principal balance as of the Cut-off Date of $60.0 million is being contributed to the JPMDB 2015-C5 Trust. Note A-1 is held by Citigroup Global Markets Realty Corp., is expected to be contributed to a future securitization, and is the controlling note under the related co-lender agreement, the rights of which will be exercised by CGMRC, or, upon such contribution, by the related trustee (or, prior to the occurrence and continuance of a control termination event under the related pooling and servicing agreement, by the related directing certificateholder). However, the holder of Note A-2 (including the Trustee or, prior to the occurrence and continuance of a Control Termination Event, the Directing Certificateholder) will be entitled, under certain circumstances, to be consulted with respect to certain major decisions. The Key Center Cleveland Whole Loan has a 10-year term and subsequent to a 24-month interest only period, amortizes on a 25 year schedule.
| Whole Loan Summary | |||||
| Note | Original Balance | Cut-off Date Balance | Note Holder | Controlling Piece | |
| A-1, A-4 | $80,000,000 | $80,000,000 | CGMRC | Yes | |
| A-2, A-5 | $80,000,000 | $80,000,000 | Bank of America, N.A. | No | |
| A-3, A-6 | $60,000,000 | $60,000,000 | JPMDB 2017-C5 | No | |
| Total | $220,000,000 | $220,000,000 | |||
The Borrower.The borrowing entity for the loan is 127 PS Fee Owner LLC, a Delaware limited liability company and special purpose entity.
The Loan Sponsor. The loan sponsor and nonrecourse carve-out guarantors are Frank T. Sinito and his wife, Malisse J. Sinito, jointly and severally. Frank T. Sinito is the CEO and President of Millennia Companies which he founded in 1995. Millennia Companies own and manages over 200 multifamily communities totaling over 20,000 residential units across 21 states. The sponsorship includes a joint venture between Frank T. Sinito and Lubert Adler, an institutional real estate fund. Frank T. Sinito and Lubert Adler own 39.0% controlling interest and 24% non-controlling, limited interest in the borrowing entity, respectively.
The Property. The Key Center Cleveland property is located in downtown Cleveland Ohio, within Cuyahoga County and consists of a 1,369,980 square foot office building, a 400-room full service hotel, and a leasehold interest in a 985-space subterranean parking garage located on three separate parcels over a 2.14-acre site at 127 Public Square in Cleveland, Ohio. The Key Center Cleveland property takes up a full city block and is located between two arteries and two commercial corridors. The immediate area is urban in nature and has a mix of commercial uses, including retail, office and multifamily developments. Local transportation is provided by the Greater Cleveland Regional Transit Authority (“RTA”). RTA services 59 municipalities including 38 cities, 19 villages and two townships. There are several stops in the immediate vicinity located along East 9th Street and St. Clair Avenue. The Key Center Cleveland property is located approximately 13.5 miles northeast of the Cleveland Hopkins International Airport.
Key Tower. The original structure was built in 1890, with the construction of Key Tower in 1991, which contains 1,369,980 square feet over 57 stories. Key Tower was designed by architect Cesar Pelli and is currently the tallest building in Ohio. The building provides views of Lake Erie, FirstEnergy Stadium, City Hall, and the Cleveland Skyline. Key Tower features a spacious and ornate lobby with four separate street entrances and access to the underground parking facilities between Key Tower and the Marriott Cleveland Downtown lobbies.
Key Tower is currently 92.9% leased to approximately 36 tenants as of October 19, 2016 and historical occupancy has averaged 90% since 2006. The largest tenant at the Key Tower is KeyBank National Association (Moody’s/S&P/Fitch: A3/A-/A-) (“KeyBank”) which has been operating its headquarters there since 1992 and currently occupies 34.9% of the net rentable area. KeyBank is one of the largest bank-based financial services companies in the United States, with a reported $95.1 billion in total assets as of year-end 2015.
KeyBank has reportedly invested approximately $24.0 million in its space since 2013. KeyBank’s lease expires in June 2030 and provides for three, five-year renewal options remaining. KeyBank has an ongoing option, beginning in July 2020, to contract its space by up to 103,000 square feet; provided that each exercise of a contraction option may not exceed 44,000 square feet, and following each exercise of a contraction option, KeyBank may not exercise another contraction option for a period of three years following such exercise. KeyBank must give 12 months’ notice for each contraction option as well as a pay a termination fee consisting of unamortized tenant improvement and leasing commissions costs as well as a rent penalty.
THE INFORMATION IN THIS STRUCTURAL AND COLLATERAL TERM SHEET IS NOT COMPLETE AND MAY BE AMENDED PRIOR TO THE TIME OF SALE. THIS TERM SHEET IS NOT AN OFFER TO SELL THESE SECURITIES AND IT IS NOT A SOLICITATION OF AN OFFER TO BUY THESE SECURITIES IN ANY JURISDICTION WHERE THE OFFER OR SALE IS NOT PERMITTED.
| 56 of 139 | |
| Structural and Collateral Term Sheet | JPMDB 2017-C5 | |
| Key Center Cleveland | ||
Other large tenants in the building include law firms such as Squire Patton & Boggs, Thompson Hine LLP and Baker Hostetler LLP as well as accounting and consulting firms such as Deloitte LLP and PricewaterhouseCoopers. The top five tenants by net rentable area have been at the Key Center Cleveland property on average approximately 18.0 years and have a weighted average remaining lease term of 12.6 years.
Key Center Parking Garage Component.The Key Center Parking Garage Component contains 985 spaces and is connected to the Key Tower lobby through a separate double elevator bank. The garage features security lighting, video surveillance, and security patrols throughout the day. Valet service is offered at the Marriott Cleveland Downtown entrance. The City of Cleveland, Ohio owns the land beneath the parking lot and leases it to the loan sponsor through 2059 with one 34-year extension through 2093 (“Parking Ground Lease”). The ground lease requires that at least 45% of the parking spaces be reserved for transient parking and hotel guests and the remainder of the parking spaces may be leased on a monthly basis. Minimum base rent paid to the city under the Parking Ground Lease is $60,000 per year provided that if the revenue exceeds certain breakpoints (based on the percentage of parking space leased on a monthly basis), percentage rent will also be payable. SL Plus Corporation (formerly known as Standard Parking Corporation) manages the Key Center Parking Garage Component for a 3.0% fee of net revenue. The term of the parking management agreement is month-to-month with automatic renewals.
Marriott Cleveland Downtown.Marriott Cleveland Downtown is a 24-story, 400-room, full service hotel built in 1991. Amenities at the Marriott Cleveland Downtown include a sports bar (“Jake’s Lounge”) and a modern American restaurant (“David’s Restaurant”) and an approximately 23,000 square foot private health club which is for use by hotel guests as well as tenants at the Key Tower (“Key Club”). The private health club features an indoor pool, sauna, and fitness room. The Marriott Cleveland Downtown also contains approximately 17,000 square feet of meeting space, a ballroom, and a contemporary lobby lounge with TVs.
Since 2010 the prior ownership has invested $6.3 million (15,782 per room) in capital expenditures, including over $4.6 million in guestroom upgrades in 2013-2014. The Marriott Cleveland Downtown is slated to undergo approximately $13.5 million in capital improvements which includes $3.3 million to update Key Club, $2.6 million to modernize the ballrooms and meeting space, approximately $2.0 million to renovate David’s Restaurant and $1.4 million to upgrade the hotel lobby.
The Key Center Cleveland property is within proximity to the Gateway District and local sports venue Progressive Field (home to the Major League Baseball’s Cleveland Indians) and Quicken Loans Arena (home to the National Basketball Association’s Cleveland Cavaliers), both of which are less than one mile from the Marriott Cleveland Downtown. Playhouse Square, a not-for-profit performing arts center is located approximately 0.7 miles away and is the largest performing arts center outside of New York and features over 1,000 annual events including Broadway shows, dance, concerts, and speakers. Cleveland State University (over 17,000 students) is located approximately 1.0 mile from the Marriott Cleveland Downtown.
The approximate distribution of demand of the Marriott Cleveland Downtown is 41% group, 28% leisure, 27% commercial, and 4% extended-stay, which generally mirror that of the market. Year-to-date July 2016, top accounts at the Marriott Cleveland Downtown which includes tenants at Key Tower were KeyBank (4.2% of room nights), Greater Cleveland Sports Commissions (2.4%), Association of Healthcare Journal (1.3%), Ernst & Young (1.2%), and Deloitte LLP (1.1%).
The Marriott Cleveland Downtown Hotel is brand-managed by Marriott Hotel Services, Inc. (“Marriott”) under a long term agreement which commenced in 1988 and will be expiring in 2021, with three, 10-year renewal periods. Marriott is entitled to a base management fee equal to 3.0% of total revenue. The management agreement may be terminated by the owner if the average operating profit does not equal or exceed $3.3 million for any three consecutive fiscal years.
| Historical Occupancy, ADR, RevPAR(1) | |||||||||
| Marriott Cleveland Downtown | Competitive Set | Penetration Factor | |||||||
| Year | Occupancy | ADR | RevPAR | Occupancy | ADR | RevPAR | Occupancy | ADR | RevPAR |
| 2014 | 65.8% | $159.58 | $104.99 | 67.9% | $161.07 | $109.31 | 96.9% | 99.1% | 96.0% |
| 2015 | 70.2% | $159.52 | $111.95 | 70.4% | $162.80 | $114.68 | 99.6% | 98.0% | 97.6% |
| 2016 | 66.2% | $162.44 | $107.51 | 69.8% | $161.00 | $112.33 | 94.9% | 100.9% | 95.7% |
| (1) | Source: Industry research report. |
THE INFORMATION IN THIS STRUCTURAL AND COLLATERAL TERM SHEET IS NOT COMPLETE AND MAY BE AMENDED PRIOR TO THE TIME OF SALE. THIS TERM SHEET IS NOT AN OFFER TO SELL THESE SECURITIES AND IT IS NOT A SOLICITATION OF AN OFFER TO BUY THESE SECURITIES IN ANY JURISDICTION WHERE THE OFFER OR SALE IS NOT PERMITTED.
| 57 of 139 | |
| Structural and Collateral Term Sheet | JPMDB 2017-C5 | |
| Key Center Cleveland | ||
| Marriott Cleveland Downtown – Competitive Set(1) | ||
| Property | Number of Rooms | Year Built |
| Marriott Cleveland Downtown | 400 | 1991 |
| Wyndham Cleveland at Playhouse Square | 205 | 1995 |
| Hyatt Regency Cleveland at The Arcade | 293 | 2001 |
| InterContinental Hotel Cleveland | 295 | 2003 |
| Total(2) | 793 | |
| (1) | Source: Appraisal. |
| (2) | Total excludes the Marriott Cleveland Downtown. |
Key Tower is located within the Cleveland central business district office submarket which has a total Class A office inventory of 10.9 million square feet and a vacancy rate of 14.9% as of the third quarter 2016. Over the past four quarters, the central business district Class A office market has experienced no growth of supply. There was also positive net absorption, decrease in vacancy rates and increase of asking rent in the marketplace. The appraisal identified five Class A properties located within the submarket that are the primary competitors of Key Tower. The properties range from 321,311 square feet to 1,270,204 with occupancies ranging from 89.0% to 93.6% with a weighted average of 90.8%. Average asking rents range from $17.00 per square foot to $35.00 per square foot with a weighted average of $24.57 per square foot on a modified gross basis. The appraisal concluded to a general vacancy rate of 7.0% for Key Tower.
Cleveland has a diversified economy with a large presence in education, technology, finance, biotechnology, and healthcare. The top five employers in the Cleveland area are Cleveland Clinic (34,000 employees), US Office of Personnel Management (15,095 employees), University Hospitals (13,726 employees), Giant Eagle (10,311 employees), and Progressive Corporation (8,612 employees). According to a third party report, the 2016 population within the one-, three-, and five-mile radius was 11,685, 75,091 and 239,627, respectively and the 2016 average household income was $65,299, $41,254 and $39,712, respectively.
| Key Tower Historical and Current Occupancy(1) | |||
| 2013 | 2014 | 2015 | Current(2) |
| 89.7% | 86.4% | 80.3% | 92.9% |
| (1) | Historical occupancies are as of December, 31 of each respective year. |
| (2) | Current occupancy is as of October 19, 2016. |
| Key Tower - Competitive Set(1) | ||||||
| Property | Location | Distance from Subject | Year Built | SF | Occupancy % | Average Asking Rent $/SF |
| Key Tower | Cleveland, OH | — | 1890, 1991 | 1,369,980(2) | 92.9%(2) | $28.25(2) |
| Ernst & Young Tower | Cleveland, OH | 0.5 miles | 2013 | 550,000 | 93.6% | $35.00 |
| 200 Public Square | Cleveland, OH | 0.1 miles | 1985 | 1,270,204 | 91.0% | $20.00 – $27.00 |
| Fifth Third Center | Cleveland, OH | 0.2 miles | 1991 | 508,400 | 89.7% | $19.00 - $23.00 |
| One Cleveland Center | Cleveland, OH | 0.4 miles | 1983 | 545,028 | 89.0% | $22.00 |
| Skylight Office Center | Cleveland, OH | 0.2 miles | 1990 | 321,311 | 90.0% | $17.00 - $25.00 |
| (1) | Source: Appraisal. |
| (2) | Based on the underwritten rent roll. |
THE INFORMATION IN THIS STRUCTURAL AND COLLATERAL TERM SHEET IS NOT COMPLETE AND MAY BE AMENDED PRIOR TO THE TIME OF SALE. THIS TERM SHEET IS NOT AN OFFER TO SELL THESE SECURITIES AND IT IS NOT A SOLICITATION OF AN OFFER TO BUY THESE SECURITIES IN ANY JURISDICTION WHERE THE OFFER OR SALE IS NOT PERMITTED.
| 58 of 139 | |
| Structural and Collateral Term Sheet | JPMDB 2017-C5 | |
| Key Center Cleveland | ||
| Key Tower Collateral Tenant Summary(1) | ||||||
| Tenant | Ratings(2) Moody’s/S&P/Fitch | Net Rentable Area (SF) | % of Total NRA | UW Base Rent PSF | % of Total Base Rent | Lease Expiration Date |
| Keybank National Association(3) | A3 / A- / A- | 477,781 | 34.9% | $31.30 | 39.7% | 6/30/2030 |
| Squire Patton Boggs | NA / NA / NA | 150,890 | 11.0% | $33.05 | 13.2% | 4/30/2022 |
| Forest City(4) | NA / NA / BB- | 147,795 | 10.8% | $27.00 | 10.6% | 3/31/2033 |
| Thompson Hine LLP(5) | NA / NA / NA | 125,120 | 9.1% | $27.55 | 9.2% | 9/30/2029 |
| Baker Hostetler LLP | NA / NA / NA | 115,615 | 8.4% | $28.62 | 8.8% | 10/31/2031 |
| Millenia(6) | NA / NA / NA | 45,360 | 3.3% | $27.50 | 3.3% | 6/30/2032 |
| Deloitte LLP(7) | NA / NA / NA | 41,718 | 3.0% | $29.25 | 3.2% | 7/31/2024 |
| PricewaterhouseCoopers | NA / NA / NA | 16,385 | 1.2% | $33.70 | 1.5% | 3/31/2019 |
| Ogletree | NA / NA / NA | 14,589 | 1.1% | $28.64 | 1.1% | 6/30/2025 |
| Amin, Turocy & Watson | NA / NA / NA | 13,887 | 1.0% | $34.27 | 1.3% | 11/30/2018 |
| (1) | Based on the underwritten rent roll. |
| (2) | Ratings provided are for the parent company of the entity listed in the “Tenant” field whether or not the parent company guarantees the lease. |
| (3) | KeyBank has an ongoing option, beginning in July 2020, to contract its space by up to 103,000 square feet in three installments; provided that each exercise of a contraction option may not exceed 44,000 square feet, and following each exercise of a contraction option, KeyBank may not exercise another contraction option for a period of three years following such exercise. KeyBank must give 12 months notice for each contraction option as well as pay a termination fee consisting of unamortized tenant improvement and leasing commissions costs as well as a rent penalty. |
| (4) | Forest City is not yet in occupancy or paying rent. Forest City is expected to commence paying rent no later than April 1, 2018. At the origination date, the borrower provided the lender a letter of credit in the amount of $4,655,546, in respect of gap rent for Forest City. |
| (5) | Thompson Hine LLP, has the one time option to terminate its space by not more than a full floor of either (i) any single, non-contiguous floor leased by it or (ii) the highest or lowest full floor of any contiguous block of floors leased by it, which termination may be effective, at the tenant’s option, either on October 1, 2023 or October 1, 2025. Such option is exercisable upon written notice no later than 12 months prior to the applicable termination date, and payment of a fee equal to unamortized tenant improvement allowances and leasing commissions that were paid with respect to the terminated space. |
| (6) | Millennia is an affiliate of the borrower. Millennia is not yet in occupancy or paying rent. Millennia is expected to commence paying rent no later than July 1, 2017. At the origination date, the borrower provided the lender a letter of credit in the amount of $519,750, in respect of gap rent for Millennia. |
| (7) | Deloitte LLP has a one-time right no later than April 30, 2018 to reduce a portion of its premises consisting of such portion thereof located on the lowest or highest of the contiguous portion of its premises including the 33rd and 34th floors of the building, effective upon April 30, 2019. |
| Lease Rollover Schedule(1)(2) | |||||||||||
| Year | Number of Leases Expiring | Net Rentable Area Expiring | % of NRA Expiring | Base Rent Expiring | % of Base Rent Expiring | Cumulative Net Rentable Area Expiring | Cumulative % of NRA Expiring | Cumulative Base Rent Expiring | Cumulative % of Base Rent Expiring | ||
| Vacant | NAP | 97,245 | 7.1% | NAP | NAP | 97,245 | 7.1% | NAP | NAP | ||
| 2017 & MTM | 12 | 17,593 | 1.3 | 671,709 | 1.8% | 114,838 | 8.4% | $671,709 | 1.8% | ||
| 2018 | 9 | 35,869 | 2.6 | 1,152,639 | 3.1 | 150,707 | 11.0% | $1,824,348 | 4.8% | ||
| 2019 | 2 | 24,251 | 1.8 | 784,222 | 2.1 | 174,958 | 12.8% | $2,608,569 | 6.9% | ||
| 2020 | 3 | 356 | 0.0 | 79,602 | 0.2 | 175,314 | 12.8% | $2,688,171 | 7.1% | ||
| 2021 | 3 | 10,705 | 0.8 | 292,071 | 0.8 | 186,019 | 13.6% | $2,980,242 | 7.9% | ||
| 2022 | 8 | 167,787 | 12.2 | 5,454,978 | 14.5 | 353,806 | 25.8% | $8,435,221 | 22.4% | ||
| 2023 | 0 | 0 | 0.0 | 0 | 0.0 | 353,806 | 25.8% | $8,435,221 | 22.4% | ||
| 2024 | 3 | 46,451 | 3.4 | 1,359,875 | 3.6 | 400,257 | 29.2% | $9,795,096 | 26.0% | ||
| 2025 | 3 | 14,589 | 1.1 | 417,778 | 1.1 | 414,846 | 30.3% | $10,212,873 | 27.1% | ||
| 2026 | 0 | 0 | 0.0 | 0 | 0.0 | 414,846 | 30.3% | $10,212,873 | 27.1% | ||
| 2027 | 2 | 37,044 | 2.7 | 349,785 | 0.9 | 451,890 | 33.0% | $10,562,658 | 28.1% | ||
| 2028 & Beyond | 26 | 918,090 | 67.0 | 27,093,506 | 71.9 | 1,369,980 | 100.0% | $37,656,164 | 100.0% | ||
| Total | 71 | 1,369,980 | 100.0% | $37,656,164 | 100.0% | ||||||
| (1) | Based on the underwritten rent roll. |
| (2) | Certain tenants may have termination or contraction options that may be exercisable prior to the originally stated expiration date of the tenant lease that are not considered above. |
THE INFORMATION IN THIS STRUCTURAL AND COLLATERAL TERM SHEET IS NOT COMPLETE AND MAY BE AMENDED PRIOR TO THE TIME OF SALE. THIS TERM SHEET IS NOT AN OFFER TO SELL THESE SECURITIES AND IT IS NOT A SOLICITATION OF AN OFFER TO BUY THESE SECURITIES IN ANY JURISDICTION WHERE THE OFFER OR SALE IS NOT PERMITTED.
| 59 of 139 | |
| Structural and Collateral Term Sheet | JPMDB 2017-C5 | |
| Key Center Cleveland | ||
| Marriott Cleveland Downtown - Operating History and Underwritten Net Cash Flow | |||||||
| 2013 | 2014 | 2015 | 2016 | Underwritten | Per Room(1) | % of Total Revenue(2) | |
| Occupancy | 71.6% | 66.5% | 70.9% | 66.2% | 65.0% | ||
| ADR | $155.32 | $157.83 | $157.93 | $162.44 | $163.45 | ||
| RevPAR(3) | $111.24 | $104.99 | $111.95 | $107.51 | $106.24 | ||
| Room Revenue | $16,240,749 | $15,328,051 | $16,344,286 | $15,738,880 | $15,511,405 | $38,779 | 70.2% |
| Food & Beverage Revenue | 6,570,035 | 6,684,994 | 6,900,689 | 6,359,302 | 5,996,176 | 14,990 | 27.1 |
| Other Departmental Revenue(4) | 944,523 | 880,565 | 807,358 | 825,681 | 584,993 | 1,462 | 2.6 |
| Total Revenue | $23,755,307 | $22,893,610 | $24,052,333 | $22,923,863 | $22,092,574 | $55,231 | 100.0% |
| Room Expense | $4,304,027 | $4,127,235 | $4,491,676 | $4,060,110 | $4,032,965 | $10,082 | 26.0 |
| Food & Beverage Expense | 4,861,458 | 4,876,676 | 5,101,971 | 4,744,258 | 4,437,170 | 11,093 | 74.0 |
| Other Departmental Expenses | 955,052 | 809,103 | 818,316 | 736,237 | 584,993 | 1,462 | 100.0 |
| Departmental Expenses | $10,120,537 | $9,813,014 | $10,411,963 | $9,540,605 | $9,055,128 | $22,638 | 41.0% |
| Total General/Unallocated | 6,890,609 | 6,965,054 | 7,394,903 | 7,407,458 | 7,437,569 | 18,594 | 33.7 |
| Total Fixed Charges | 1,205,091 | 1,487,694 | 1,264,250 | 1,312,263 | 1,433,240 | 3,583 | 6.5 |
| Net Operating Income | $5,539,070 | $4,627,848 | $4,981,217 | $4,663,537 | $4,166,637 | $10,417 | 18.9% |
| FF&E | 1,181,285 | 1,138,580 | 1,197,413 | 1,141,811 | 1,104,629 | 2,762 | 5.0 |
| Net Cash Flow | $4,357,785 | $3,489,268 | $3,783,804 | $3,521,726 | $3,062,008 | $7,655 | 13.9% |
| (1) | Per Room values are based on 400 guest rooms. |
| (2) | % of Total Revenue for Room Expense, Food & Beverage Expense and Other Departmental Expenses are based on their corresponding revenue line items. |
| (3) | Historical RevPAR for 2008, 2009, 2010, 2011 and 2012 was $102.07, $91.24, $90.59, $92.57, and $106.13, respectively. |
| (4) | Other Departmental Revenue consists primarily of vending commissions, guest services, miscellaneous commissions, sales tax discounts, cancellation fees, and attrition fees. |
THE INFORMATION IN THIS STRUCTURAL AND COLLATERAL TERM SHEET IS NOT COMPLETE AND MAY BE AMENDED PRIOR TO THE TIME OF SALE. THIS TERM SHEET IS NOT AN OFFER TO SELL THESE SECURITIES AND IT IS NOT A SOLICITATION OF AN OFFER TO BUY THESE SECURITIES IN ANY JURISDICTION WHERE THE OFFER OR SALE IS NOT PERMITTED.
| 60 of 139 | |
| Structural and Collateral Term Sheet | JPMDB 2017-C5 | |
| Key Center Cleveland | ||
| Key Center Cleveland - Operating History and Underwritten Net Cash Flow | |||||||
| 2013 | 2014 | 2015 | 2016 | Underwritten | Per Square Foot | %(1) | |
| Rents in Place(2) | $32,510,214 | $31,608,409 | $29,936,738 | $28,060,735 | $37,656,164 | $27.49(3) | 56.2% |
| Vacancy Income | 0 | 0 | 0 | 0 | 2,745,589 | 2.00(3) | 4.1 |
| Gross Potential Rent | $32,510,214 | $31,608,409 | $29,936,738 | $28,060,735 | $40,401,753 | $29.49(3) | 60.3% |
| Reimbursements | 2,348,968 | 2,690,336 | 1,319,674 | 691,479 | 597,315 | 0.44(3) | 0.9 |
| Hotel Revenue | 23,755,307 | 22,893,610 | 24,052,333 | 22,923,863 | 22,092,574 | 55,231.44(4) | 33.0 |
| Parking Revenue | 4,208,945 | 3,784,318 | 3,804,773 | 4,014,186 | 3,953,056 | 12.36(5) | 5.9 |
| Net Rental Income | $62,823,434 | $60,976,673 | $59,113,518 | $55,690,263 | $67,044,698 | $28.05(6) | 100.0% |
| (Vacancy/Credit Loss) | 0 | 0 | 0 | 0 | (3,090,816) | (2.26)(3) | (4.6) |
| Other Income | 3,122,262 | 3,226,533 | 4,133,442 | 3,550,145 | 3,375,221 | 2.46(3) | 5.0 |
| Effective Gross Income | $65,945,696 | $64,203,206 | $63,246,960 | $59,240,408 | $67,329,103 | $28.17(6) | 100.4% |
| Real Estate Taxes | 7,328,456 | 7,479,510 | 7,521,235 | 7,917,113 | 7,557,705 | 5.52(3) | 11.2 |
| Insurance | 222,847 | 213,688 | 203,536 | 178,137 | 205,793 | 0.15(3) | 0.3 |
| Management Fee | 1,175,941 | 1,116,060 | 1,066,322 | 967,260 | 1,357,096 | 0.99(3) | 2.0 |
| Hotel Expenses | 18,216,237 | 18,265,762 | 19,071,116 | 18,260,326 | 17,925,937 | 44,814.84(4) | 26.6 |
| Hotel FF&E | 1,181,285 | 1,138,580 | 1,197,413 | 1,141,811 | 1,104,629 | 2,761.57(4) | 1.6 |
| Parking Expenses | 1,790,147 | 1,750,452 | 1,660,359 | 1,634,547 | 1,634,547 | 5.11(5) | 2.4 |
| Parking Ground Rent | 60,000 | 60,000 | 60,000 | 60,000 | 60,000 | 0.19(5) | 0.1 |
| Other Operating Expenses | 9,096,558 | 9,323,332 | 10,213,368 | 10,023,488 | 10,478,703 | 7.65(3) | 15.6 |
| Total Expenses | $39,071,471 | $39,347,384 | $40,993,349 | $40,182,682 | $40,324,409 | 16.87(6) | 59.9% |
| Net Operating Income | $26,874,225 | $24,855,822 | $22,253,611 | $19,057,726 | $27,004,694 | $11.30(6) | 40.1% |
| Total TI/LC, Capex/RR | 0 | 0 | 0 | 0 | 1,677,558 | 1.22(3) | 2.5 |
| Net Cash Flow | $26,874,225 | $24,855,822 | $22,253,611 | $19,057,726 | $25,327,136 | $10.60(6) | 37.6% |
| (1) | Percentage column represents percent of Net Rental Income for all revenue line items and represents percentage of Effective Gross Income for the remainder of fields. |
| (2) | Rents in Place include contractual rent steps through May 2017 and the present value of rent steps for Jones Lang LaSalle GR and KeyBank National Association. The increase in Rents in Place between Underwritten and 2016 was primarily due to newly executed leases with tenants Forest City and Millennia. Forest City executed a lease commencing in April 2018 for 147,795 square feet resulting in an increase to the Underwritten Base Rent of $3,990,465 and Millennia executed a lease commencing in July 2017 for 45,360 square feet resulting in an increase to the Underwritten Base Rent of $1,247,400. |
| (3) | Calculated based upon the total square footage of Key Tower. |
| (4) | Calculated based upon total rooms at the Marriott Downtown Cleveland. |
| (5) | Calculated based upon the total square footage of the Key Center Parking Garage Component. |
| (6) | Calculated based upon total square footage of the Key Center Cleveland property. |
Property Management.The Key Tower is currently managed by Millennia Housing Management, Ltd., an affiliate of the borrower.
Escrows and Reserves.At origination, the borrower was required to deposit into escrow $1,540,363 for real estate taxes, $55,406 for insurance premiums, $18,271,556 for planned capital improvements for Key Tower and the Marriott Cleveland Downtown, $18,461,400 for outstanding tenant improvements related to Forest City and Millennia, $5,608,359 for outstanding tenant improvements related to Thompson Hine LLP (which amount was funded by the seller of the Key Center Cleveland property and is being held by a third party escrow agent, and not by the lender), $4,652,415 for a property improvement plan expected to be incurred at the Marriott Cleveland Downtown in connection with the renewal of the management agreement with Marriott in 2021, and $64,625 for deferred maintenance. Additionally, at origination, the borrower provided two letters of credit in the aggregate amount of $5,175,296 to cover free rent associated with the Forest City and Millennia tenants.
In addition to the reserves escrowed with the lender at closing, $1,991,429 is held in an FF&E reserve account held by Marriott as the hotel manager for planned capital improvements for the Marriott Cleveland Downtown.
Tax Escrows -On a monthly basis, the borrower is required to escrow 1/12 of the annual estimated tax payments, which currently equates to $770,181.
Insurance Escrows -On a monthly basis, unless an acceptable blanket policy is maintained in accordance with the loan documents, the borrower is required to escrow 1/12 of the annual insurance premiums, which currently equates to $27,703.
Replacement Reserves -On a monthly basis, the borrower is required to escrow $29,284 (approximately $0.26 per square foot annually) for replacement reserves subject to a cap of $1,757,065.
TI/LC Reserves -On a monthly basis, the borrower is required to deposit $110,513 (approximately $0.97 per square foot annually) for future tenant improvements and leasing commissions.
THE INFORMATION IN THIS STRUCTURAL AND COLLATERAL TERM SHEET IS NOT COMPLETE AND MAY BE AMENDED PRIOR TO THE TIME OF SALE. THIS TERM SHEET IS NOT AN OFFER TO SELL THESE SECURITIES AND IT IS NOT A SOLICITATION OF AN OFFER TO BUY THESE SECURITIES IN ANY JURISDICTION WHERE THE OFFER OR SALE IS NOT PERMITTED.
| 61 of 139 | |
| Structural and Collateral Term Sheet | JPMDB 2017-C5 | |
| Key Center Cleveland | ||
Ground Rent Reserve -On a monthly basis, the borrower is required to deposit 1/12 of the annual estimated ground rent payments at the Key Center Cleveland property, which currently equates to $5,000.
PIP Reserve – On a monthly basis the borrower is required to deposit an amount equal to 1/12 of 5.00% (or if Marriott Corporation or an affiliate is the hotel manager, 4.00%) of gross hotel revenues unless (a) Marriott Corporation or an affiliate thereof is the hotel manager, (b) the borrower is required to reserve with the hotel manager an amount not less than the FF&E payment required under the Key Center Loan documents, and (c) no event of default is continuing.
Lockbox / Cash Management.The loan is structured with a hard lockbox and in place cash management. The borrowers were required at origination to deliver tenant direction letters instructing all tenants to pay their rents and all credit card companies under merchant agreements to pay receipts directly into such lockbox account. All checks and cash received from the hotel manager by the borrower or the property manager are required to be deposited into the lockbox account immediately upon receipt; provided that, so long as Marriott or its affiliate is the hotel manager, Marriott is only required to deposit net proceeds payable to the borrower into the lockbox. The funds on deposit in the lockbox account are required to be transferred daily to the cash management account under the control of the lender. On each due date, the Key Center Cleveland loan documents require that all amounts on deposit in the cash management account will be applied to fund reserves and pay debt service (and mezzanine debt service), and (i) to the extent that a Key Center Trigger Period (as defined below) has occurred and is continuing, remaining funds are transferred into an excess cash flow account to be held by the lender as additional collateral and (ii) to the extent that no Key Center Trigger Period exists, be disbursed to the borrower. Upon an event of default under the Key Center Cleveland loan documents, the lender may apply the funds in the cash management account in such priority as it may determine.
A “Key Center Trigger Period” means a period (A) commencing upon the earliest of: (i) the occurrence and continuance of an event of default, (ii) the debt service coverage ratio being less than (a) 1.05x through January 31, 2019 or (b) 1.10x at any time thereafter, (iii) the occurrence of a Key Center Specified Tenant Trigger Period (as defined below) or (iv) the occurrence of a Hotel Management Trigger Period (as defined below), and (B) expiring upon: (i) with regard to any Key Center Trigger Period commenced in connection with clause (A)(i) above, the cure (if applicable) of such event of default, (ii) with regard to any Key Center Trigger Period commenced in connection with clause (A)(ii) above, the date that the debt service coverage ratio is equal to or greater (a) 1.10x for one calendar quarter through January 31, 2019 and (b) 1.15x for one calendar quarter thereafter, (iii) with regard to any Key Center Trigger Period commenced in connection with clause (A)(iii) above, a Key Center Specified Tenant Trigger Period ceasing to exist and (iv) with regard to any Key Center Trigger Period commenced in connection with clause (A)(iv) above, a Hotel Management Trigger Period ceasing to exist.
A “Key Center Specified Tenant” means, as applicable, (i) KeyBank National Association, (ii) any other lessee(s) of more than 20,000 square feet of the space occupied by KeyBank National Association at origination (or any portion thereof), and (iii) any guarantor(s) of such lease.
A “Key Center Specified Tenant Trigger Period” means a period: (A) commencing upon the first to occur of: (i) any Key Center Specified Tenant being in default under its lease beyond applicable grace and cure periods set forth therein, (ii) any Key Center Specified Tenant failing to be in actual, physical possession of any portion of the applicable space in excess of 20,000 square feet (except as a result of a qualified casualty event), (iii) any Key Center Specified Tenant giving notice that it is terminating its lease for all or any portion of the space (or applicable portion thereof) (other than as a result on an exercise of a contraction option set forth in the lease at origination), (iv) any termination or cancellation of any Key Center Specified Tenant lease (including, without limitation, rejection in any bankruptcy or similar insolvency proceeding) and/or any Key Center Specified Tenant lease failing to otherwise be in full force and effect, (v) any bankruptcy or similar insolvency of any Key Center Specified Tenant, (vi) any Key Center Specified Tenant failing to extend or renew its lease on or prior to the earlier to occur of (i) the date occurring one (1) year prior to the expiration of the then applicable term of the applicable Key Center Specified Tenant Lease or (ii) the renewal notice date (if any) set forth in the applicable Key Center Specified Tenant Lease for a term of at least 5 years, (vii) any Key Center Specified Tenant ceasing to maintain for at least one calendar quarter a long-term unsecured debt rating of at least “BBB-” from S&P and an equivalent rating from each of the other Rating Agencies which rate such entity, and (viii) any termination or cancellation of the Key Center Specified Tenant lease to any portion (but less than all) of the Key Center Specified Tenant space; and (B) expiring upon the first to occur of the lender’s receipt of evidence reasonably acceptable to the lender (which such evidence includes a duly executed estoppel certificate from the applicable Key Center Specified Tenant in form and substance acceptable to the lender) of: (i) the satisfaction of the Key Center Specified Tenant Cure Conditions (defined below) or (ii) the borrower leasing the entire Key Center Specified Tenant space (or applicable portion thereof that was partially terminated) in accordance with the applicable terms and conditions of the Key Center Cleveland loan documents, the applicable tenant under such lease being in actual, physical occupancy of the space demised under its lease and paying the full amount of the rent due under its lease and the borrower depositing into the leasing reserve account funds (which, to the extent that the excess cash flow account contains sufficient funds therefor, shall be transferred from the excess cash flow account to the leasing reserve account) sufficient to pay any leasing costs as reasonably expected to be incurred by the borrower in connection with re-leasing the applicable Key Center Specified Tenant space applicable to the Key Center Specified Tenant space.
THE INFORMATION IN THIS STRUCTURAL AND COLLATERAL TERM SHEET IS NOT COMPLETE AND MAY BE AMENDED PRIOR TO THE TIME OF SALE. THIS TERM SHEET IS NOT AN OFFER TO SELL THESE SECURITIES AND IT IS NOT A SOLICITATION OF AN OFFER TO BUY THESE SECURITIES IN ANY JURISDICTION WHERE THE OFFER OR SALE IS NOT PERMITTED.
| 62 of 139 | |
| Structural and Collateral Term Sheet | JPMDB 2017-C5 | |
| Key Center Cleveland | ||
“Key Center Specified Tenant Cure Conditions” means the receipt by the lender of evidence reasonably satisfactory to the lender of the following, as applicable: (i) the applicable Key Center Specified Tenant has cured all defaults under the applicable Key Center Specified Tenant lease, (ii) the applicable Key Center Specified Tenant is in actual, physical possession of the Key Center Specified Tenant space (or applicable portion thereof) and the applicable Key Center Specified Tenant is paying full, unabated rent under the applicable Key Center Specified Tenant lease, (iii) the applicable Key Center Specified Tenant has revoked or rescinded all termination or cancellation notices with respect to the applicable Key Center Specified Tenant lease and has re-affirmed the applicable Key Center Specified Tenant lease as being in full force and effect, (iv) in the event the Key Center Specified Tenant Trigger Period is due to the applicable Key Center Specified Tenant’s failure to extend or renew the applicable Key Center Specified Tenant lease in accordance with clause (A)(vi) of the definition of “Key Center Specified Tenant Trigger Period”, the applicable Key Center Specified Tenant has renewed or extended the applicable Key Center Specified Tenant lease in accordance with the terms of the Key Center Cleveland loan documents for a term of at least 5 years, (v) with respect to any applicable bankruptcy or insolvency proceedings involving the applicable Key Center Specified Tenant and/or the applicable Key Center Specified Tenant lease, the applicable Key Center Specified Tenant is no longer insolvent or subject to any bankruptcy or insolvency proceedings and has affirmed the applicable Key Center Specified Tenant lease pursuant to final, non-appealable order of a court of competent jurisdiction, (vi) in the event the Key Center Specified Tenant Trigger Period is due to a clause (vii) of “Key Center Specified Tenant Trigger Period”, the applicable Key Center Specified Tenant with respect to which such trigger occurred satisfies the credit requirements, and (vii) in the event the Key Center Specified Tenant Trigger Period is due to the borrower having deposited or cause to be deposited into the reserve account, an amount equal to $50 per square foot terminated.
“Hotel Management Trigger Period” means a period: (A) commencing upon the first to occur of: (i) the occurrence of a default by the borrower or hotel manager under the hotel management agreement, which default continues beyond any applicable grace or cure period, (ii) the borrower or hotel manager giving notice that it is terminating the hotel management agreement or hotel manager failing to renew the hotel management agreement not later than December 31, 2020, (iii) a PIP is required in connection with any hotel management agreement (including, but not limited to, as a result of the exercise of hotel manager’s rights pursuant to the hotel management agreement to require, from time to time, a PIP), (iv) any notice of termination, non-renewal or cancellation of the hotel management agreement (including, without limitation, rejection in any bankruptcy or similar insolvency proceeding) and/or the hotel management agreement failing to otherwise be in full force and effect, (v) any bankruptcy or similar insolvency of hotel manager, (vi) the hotel failing to be operated, “flagged” and/or branded pursuant to the hotel management agreement, and (vii) any Permit required pursuant to the hotel management agreement ceasing to be in full force in effect; and (B) expiring upon the first to occur of the lender’s receipt of evidence reasonably acceptable to the lender (which such evidence includes, without limitation, a duly executed estoppel certificate from the hotel manager in form and substance reasonably acceptable to the lender) of: (1) the satisfaction of the Hotel Management Cure Conditions (defined below), and (2) the branding, “flagging” and operation of the hotel pursuant to a hotel management agreement entered into in accordance with the terms of the Key Center Cleveland loan documents and the (which agreement is in full force and effect with no defaults thereunder) and the deposit into a PIP reserve account of an amount equal to any required PIP deposit (if any).
“Hotel Management Cure Conditions” means each of the following, as applicable: (i) all defaults have been cured under the hotel management agreement to the satisfaction of the non-defaulting party, (ii) the borrower and the applicable hotel manager have re-affirmed in writing the hotel management agreement as being in full force and effect, (iii) with respect to any applicable bankruptcy or insolvency proceedings involving the applicable hotel manager and/or hotel management agreement, such hotel manager is no longer insolvent or subject to any bankruptcy or insolvency proceedings and has affirmed such hotel management agreement pursuant to a final, non-appealable order of a court of competent jurisdiction, (iv) the hotel continues to be operated, “flagged” and branded pursuant to the hotel management agreement, (v) all permits applicable to the related hotel management agreement are in full force and effect, and (vi) any required PIP reserve has been deposited.
Additional Debt.Concurrently with the funding of the Key Center Cleveland Whole Loan, ACREFI MORTGAGE LENDING, LLC funded a mezzanine loan in the amount of $42,500,000 (the “Key Center Mezzanine Loan”) to 127 PS MEZZ BORROWER LLC, as mezzanine borrower, which is the direct owner of 100.0% of the limited liability company interests in the borrower. The Key Center Cleveland Mezzanine Loan is secured by a pledge of the mezzanine borrower’s 100% limited liability company interests in the borrower. The Key Center Cleveland Mezzanine Loan carries an interest rate of 12.75000% per annum and is coterminous with the Key Center Cleveland Whole Loan. The Key Center Cleveland Mezzanine Loan is subject to an intercreditor agreement.
THE INFORMATION IN THIS STRUCTURAL AND COLLATERAL TERM SHEET IS NOT COMPLETE AND MAY BE AMENDED PRIOR TO THE TIME OF SALE. THIS TERM SHEET IS NOT AN OFFER TO SELL THESE SECURITIES AND IT IS NOT A SOLICITATION OF AN OFFER TO BUY THESE SECURITIES IN ANY JURISDICTION WHERE THE OFFER OR SALE IS NOT PERMITTED.
| 63 of 139 | |
| Structural and Collateral Term Sheet | JPMDB 2017-C5 | |
| Gateway I & II | ||
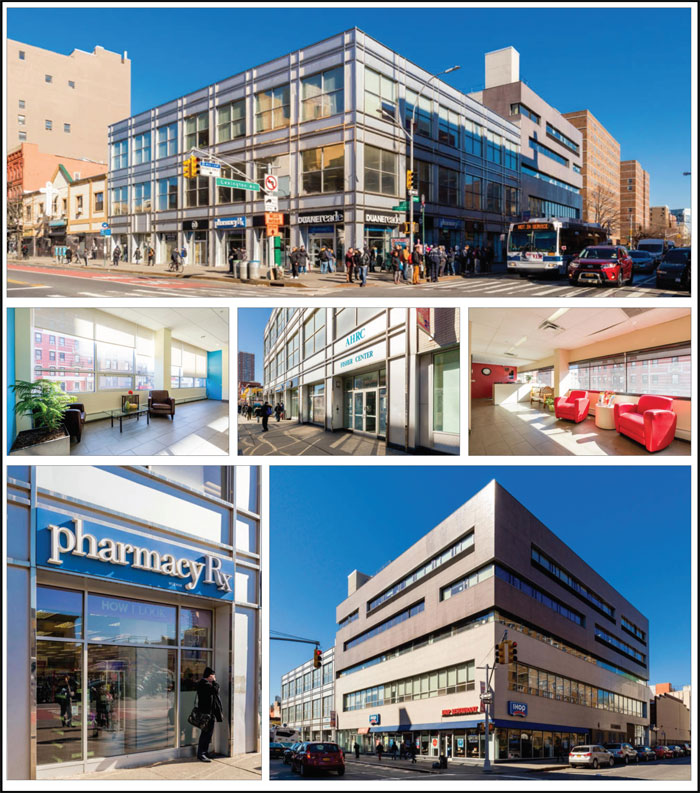
THE INFORMATION IN THIS STRUCTURAL AND COLLATERAL TERM SHEET IS NOT COMPLETE AND MAY BE AMENDED PRIOR TO THE TIME OF SALE. THIS TERM SHEET IS NOT AN OFFER TO SELL THESE SECURITIES AND IT IS NOT A SOLICITATION OF AN OFFER TO BUY THESE SECURITIES IN ANY JURISDICTION WHERE THE OFFER OR SALE IS NOT PERMITTED.
| 64 of 139 | |
| Structural and Collateral Term Sheet | JPMDB 2017-C5 | |
| Gateway I & II | ||
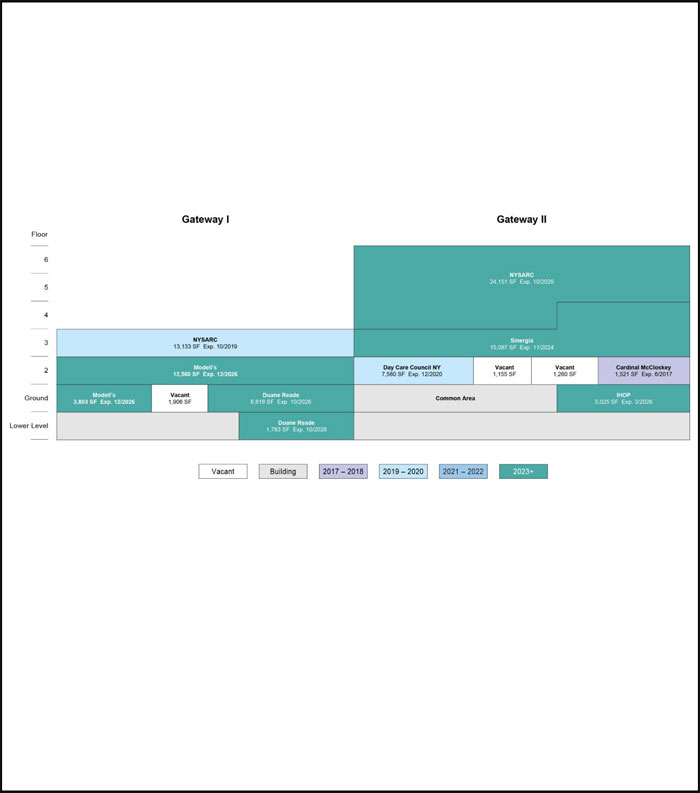
THE INFORMATION IN THIS STRUCTURAL AND COLLATERAL TERM SHEET IS NOT COMPLETE AND MAY BE AMENDED PRIOR TO THE TIME OF SALE. THIS TERM SHEET IS NOT AN OFFER TO SELL THESE SECURITIES AND IT IS NOT A SOLICITATION OF AN OFFER TO BUY THESE SECURITIES IN ANY JURISDICTION WHERE THE OFFER OR SALE IS NOT PERMITTED.
| 65 of 139 | |
| Structural and Collateral Term Sheet | JPMDB 2017-C5 | |
| Gateway I & II | ||
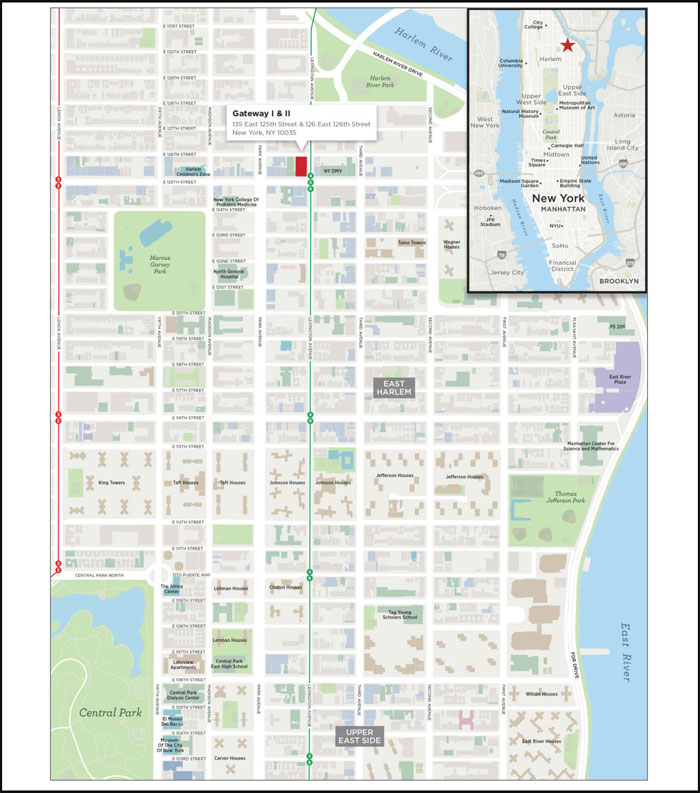
THE INFORMATION IN THIS STRUCTURAL AND COLLATERAL TERM SHEET IS NOT COMPLETE AND MAY BE AMENDED PRIOR TO THE TIME OF SALE. THIS TERM SHEET IS NOT AN OFFER TO SELL THESE SECURITIES AND IT IS NOT A SOLICITATION OF AN OFFER TO BUY THESE SECURITIES IN ANY JURISDICTION WHERE THE OFFER OR SALE IS NOT PERMITTED.
| 66 of 139 | |
| Structural and Collateral Term Sheet | JPMDB 2017-C5 | |
| Gateway I & II | ||
| Mortgage Loan Information | Property Information | |||
| Mortgage Loan Seller: | GACC | Single Asset / Portfolio: | Single Asset | |
| Original Principal Balance: | $55,000,000 | Title: | Fee | |
| Cut-off Date Principal Balance: | $55,000,000 | Property Type - Subtype: | Mixed Use – Office/Retail | |
| % of Pool by IPB: | 5.3% | Net Rentable Area (SF): | 95,782 | |
| Loan Purpose: | Refinance | Location: | New York, NY | |
| Borrower: | Thor Gateway I & II Owner, LLC | Year Built / Renovated: | 2001, 2008 / N/A | |
| Sponsor: | Joseph J. Sitt | Occupancy(1): | 95.5% | |
| Interest Rate: | 4.69000% | Occupancy Date: | 10/31/2016 | |
| Note Date: | 2/3/2017 | Number of Tenants: | 7 | |
| Maturity Date: | 2/6/2027 | 2013 NOI: | $3,563,426 | |
| Interest-only Period: | 36 months | 2014 NOI: | $3,620,865 | |
| Original Term: | 120 months | 2015 NOI: | $3,269,810 | |
| Original Amortization: | 360 months | T-5 NOI (as of 10/2016)(2): | $3,648,491 | |
| Amortization Type: | IO-Balloon | UW Economic Occupancy: | 93.5% | |
| Call Protection: | L(25),Def(90),O(5) | UW Revenues: | $5,116,508 | |
| Lockbox / Cash Management: | Hard / Springing | UW Expenses: | $854,992 | |
| Additional Debt: | N/A | UW NOI(2): | $4,261,516 | |
| Additional Debt Balance: | N/A | UW NCF: | $4,098,687 | |
| Additional Debt Type: | N/A | Appraised Value / Per SF: | $77,000,000 / $804 | |
| Appraisal Date: | 11/16/2016 | |||
| Escrows and Reserves(3) | Financial Information | |||||||||||
| Initial | Monthly | Initial Cap | Cut-off Date Loan / SF: | $574 | ||||||||
| Taxes: | $13,361 | $6,680 | N/A | Maturity Date Loan / SF: | $505 | |||||||
| Insurance: | $0 | Springing | N/A | Cut-off Date LTV: | 71.4% | |||||||
| Replacement Reserves: | $0 | $1,596 | N/A | Maturity Date LTV: | 62.8% | |||||||
| TI/LC: | $601,000 | $11,973 | N/A | UW NCF DSCR: | 1.20x | |||||||
| Other: | $4,483,333 | Springing | N/A | UW NOI Debt Yield: | 7.7% | |||||||
| Sources and Uses | ||||||||||||
| Sources | Proceeds | % of Total | Uses | Proceeds | % of Total | |||||||
| Mortgage Loan | $55,000,000 | 100.0% | Payoff Existing Debt | $43,916,784 | 79.8% | |||||||
| Return of Equity | 5,333,315 | 9.7 | ||||||||||
| Upfront Reserves | 5,097,694 | 9.3 | ||||||||||
| Closing Costs | 652,207 | 1.2 | ||||||||||
| Total Sources | $55,000,000 | 100.0% | Total Uses | $55,000,000 | 100.0% | |||||||
| (1) | Occupancy includes Modells, which has taken possession of its space and is anticipated to open in the summer of 2017. The Modells lease began in January 2017 with rental payments beginning in September 2017. At loan origination, $733,333 was escrowed to a free rent reserve to cover the free rent period through August 2017. |
| (2) | The difference between the UW NOI and the T-5 NOI is attributed to the Modells lease which began in January 2017, as well as rent steps consisting of $100,965 in rental steps that will take place through December 2017 and $45,000 related to the straight line average of Duane Reade rent steps through 2025. |
| (3) | For a full description of Escrows and Reserves, please refer to “Escrows and Reserves” below. |
THE INFORMATION IN THIS STRUCTURAL AND COLLATERAL TERM SHEET IS NOT COMPLETE AND MAY BE AMENDED PRIOR TO THE TIME OF SALE. THIS TERM SHEET IS NOT AN OFFER TO SELL THESE SECURITIES AND IT IS NOT A SOLICITATION OF AN OFFER TO BUY THESE SECURITIES IN ANY JURISDICTION WHERE THE OFFER OR SALE IS NOT PERMITTED.
| 67 of 139 | |
| Structural and Collateral Term Sheet | JPMDB 2017-C5 | |
| Gateway I & II | ||
The Loan.The Gateway I & II loan has an outstanding principal balance as of the Cut-off Date of $55.0 million and is secured by a first mortgage lien on the borrower’s fee interest in a 95,782 square foot mixed use office and retail center located in New York, New York. The loan has a 10-year term and, subsequent to a three-year interest-only period, will amortize on a 30-year schedule. The previously existing debt was not included in a securitization.
The Borrower.The borrowing entity for the loan is Thor Gateway I & II Owner, LLC, a Delaware limited liability company and special purpose entity.
The Loan Sponsor. The loan sponsor and nonrecourse carve-out guarantor is Joseph J. Sitt, the founder and CEO of Thor Equities. Thor Equities participates in urban real estate projects and public/private partnerships, owning more than 160 properties throughout the United States, Canada, Latin America, and Europe. In addition to his responsibilities as the company’s CEO, Mr. Sitt also serves as the Chairman and Managing Principal of the Thor Urban Property Funds, an investment vehicle serving pension funds, investment banks, top-tier college endowments and foundations. The borrower is also indirectly owned approximately 49% by Israeli pension funds managed by Amitim, an operating body that manages eight defined benefit plans that are part of a pension reform program, and 41% by funds managed by Quilvest SA, a Luxembourg public financial holding company engaged in private equity and wealth management, or by its affiliates.
The loan sponsor purchased the property in June 2016 for approximately $75.5 million (approximately $788 per square foot). At the time of the acquisition, leases for approximately 40.0% of the net rentable area at the property were due to expire in 2016 and the rent roll had a weighted average remaining lease term of approximately six years. Since acquisition, the borrower signed a 10-year lease with Modells for a 3,803 square foot ground floor space and the entire 12,560 square foot 2nd floor space at a blended rental rate of $67.22 per square foot. In addition, the Duane Reade lease was modified and extended from November 2016 through October 2026 at a blended rental rate of $104.64 per square foot. Lastly, the borrower signed a lease amendment with NYSARC for their 3rd floor office space and a portion of the ground floor in Gateway I at $46.02 per square foot from November 2016 through October 2019. The weighted average remaining lease term at the property is 8.6 years as of March 2017.
The Property. Gateway I & II is a two building, Class B 95,782 square foot office, retail and community space located at 135 East 125th Street and 126 East 126th Street within the Upper Manhattan submarket of New York City. The buildings were originally built in 2001 and 2008. The property is comprised of Gateway I, a three-story building with 40,003 square feet of net rentable area and Gateway II, a six-story building with 55,779 square feet of net rentable area. Gateway I is 95.2% leased to three tenants and Gateway II is 95.7% leased to five tenants (NYSARC has leases in both buildings). The ground floor features two lobbies and the retail suites, while office space is located on the second through fourth floors. The community facility space that is occupied by NYSARC has its own dedicated lobby and is located on floors five and six. This space features classrooms, recreational areas, kitchen facilities and dormitory style housing for individuals with developmental disabilities. The basement features storage for the building’s tenants.
As of October 31, 2016, the property was 95.5% occupied by seven tenants throughout ten leases. Tenant rollover at the property is granular with the largest single-year rollover at the property in 2026. Lease expirations in 2026 include Modells, Duane Reade, and IHOP, which tenants lease an aggregate 31.3% of net rentable area and account for an aggregate 46.6% of base rent. The Duane Reade lease expires in October 2026 and the Modells lease expires in December 2026. The expirations of such leases are among the triggers of a Lease Sweep Period as defined in “Escrows and Reserves” below.
The largest tenant at the property, NYSARC, leases 37,284 square feet (38.9% of net rentable area) with space in both Gateway I and Gateway II. NYSARC has leased space in both buildings since they were built and currently leases 13,133 square feet (13.7% of net rentable area) in Gateway I through October 2019 and 24,151 square feet in Gateway II (38.9% of net rentable area) through October 2029. NYSARC recently extended its lease in Gateway I through October 2019 at a gross rent of $48.05 per square foot, a 7.0% increase from the previous gross rent of $44.89 per square foot. NYSARC is one of New York State’s largest nonprofit organizations serving people with developmental disabilities. NYSARC has 48 chapters across New York State, supporting more than 60,000 individuals, employing approximately 30,000 people and has a membership of more than 100,000 people. NYSARC also occupies the community facility space on the fifth and sixth floors, which serves as residential quarters for approximately 26 individuals with developmental disabilities. The NYSARC lease does not have any termination, appropriation or kickout clauses. The second largest tenant, Modells, leases 16,363 square feet (17.1% of net rentable area) through December 2026. Modells is a family-owned and operated retailer of sporting goods, athletic footwear, active apparel and fan gear. Modells was founded in 1889 and operates over 150 stores throughout the Northeast. Modells signed a 10 year lease at Gateway I for 16,363 square feet through December 31, 2026, taking over the space previously occupied by Raymour & Flanigan. The Modells lease began in January 2017 with rental payments beginning in September 2017. At loan origination, $733,333 was escrowed in a free rent reserve to cover Modells free rent period through August 2017. In addition, Modells received $601,000 ($36.73 per square foot) in approved tenant improvement expenses in conjunction with their lease, which amount was also escrowed at loan origination. Modells is currently building out its space and is anticipated to take occupancy in the summer of 2017. A holdback reserve was established at origination in the amount of $3,750,000 as further described in “Escrows and Reserves” herein. Modells does not have any termination options. The third largest tenant, Sinergia,
THE INFORMATION IN THIS STRUCTURAL AND COLLATERAL TERM SHEET IS NOT COMPLETE AND MAY BE AMENDED PRIOR TO THE TIME OF SALE. THIS TERM SHEET IS NOT AN OFFER TO SELL THESE SECURITIES AND IT IS NOT A SOLICITATION OF AN OFFER TO BUY THESE SECURITIES IN ANY JURISDICTION WHERE THE OFFER OR SALE IS NOT PERMITTED.
| 68 of 139 | |
| Structural and Collateral Term Sheet | JPMDB 2017-C5 | |
| Gateway I & II | ||
leases 15,087 square feet (15.8% of net rentable area) through November 2024 and has been at the Gateway II property since December 2009. Sinergia is a non-profit organization that works with people with disabilities and their families. Founded in 1977, Sinergia works with underserved families, many with limited English proficiency, who may be homeless or impoverished, or who may be struggling with insecure housing and income, lack of services and discrimination based on ethnicity, language status, immigration status, gender or poverty. Sinergia does not have any termination options. Duane Reade is the fourth largest tenant, occupying 8,601 square feet (9.0% net rentable area) through October 2026. Founded in 1960, Duane Reade owns and operates a chain of drugstores in commercial and residential neighborhoods in New York. Its stores offer products in various categories, including beauty, diet and fitness, grocery, household medicines and treatments, nutritional products, cosmetics, greeting cards, and photo processing solutions, among many others. In 2010, Duane Reade was acquired by Walgreens Boots Alliance, Inc. The Duane Reade lease at the property is guaranteed by Walgreens Co. (rated Baa2/BBB/BBB by Moody’s, Fitch and S&P, respectively). Duane Reade previously leased 9,792 square feet at Gateway I through October 2016, when the Duane Reade space was reconfigured to allow the borrower to recapture a 1,191 square foot space along 125th street. Duane Reade then renewed its lease for 8,601 square feet through October 2026. Duane Reade does not have any termination options.
Gateway I & II is located on the entire western blockfront of Lexington Avenue between 125th Street and 126th Street in the Harlem neighborhood of Upper Manhattan. Harlem is located within the northern section of Manhattan and has traditionally been defined as the area bound by 110th Street to the south, 155th Street to the north, the Hudson River to the west and Harlem River to the East. In 2008 the City of New York rezoned the neighborhood and introduced new incentives to encourage commercial development in the area. The area’s shifting demographics have led to the emergence of a new retail and office landscape, including the addition of Whole Foods at 100 West 125th Street.
The Upper Manhattan office market is generally considered the area from 110th Street to the south, the tip of Manhattan to the north, the Harlem River to the west and the East River to the east. According to the appraisal, as of the first quarter 2016, the Upper Manhattan Office market maintains a total of 205 office buildings in its competitive inventory, containing approximately 6.5 million square feet of office space with a vacancy rate of 8.5% as of November 2016. Between the fourth quarter of 2012 and the third quarter of 2016, vacancy rates have fluctuated between 8.3% and 9.5%, with the highest vacancy observed at year end 2015 and the lowest vacancy rate observed during the final quarter of 2013. Vacancy rates are currently the third lowest of any point over the past four years. Over the same period, asking rents have ranged from $35.47 per square foot, gross (fourth quarter 2013) to $40.93 per square foot, gross (third quarter 2016). As of the third quarter 2016, average asking rent is $40.93 per square foot, gross and asking rent for Class B office space within the Harlem neighborhood of Manhattan is $37.00 per square foot. The appraisal identified nine comparable office space leases ranging from $33.00 to $55.00 per square foot. Based upon recent leases at Gateway I & II, recent activity in the market, and the comparable leases, the appraisal concluded to a market rent of $40.00 per square foot for the Gateway I & II office space, and $45.00 per square foot for the community facility space.
The majority of the Harlem retail market is comprised of ground floor retail within the base of residential and office buildings. The Harlem retail market is situated within self-contained areas serving the immediate surroundings. According to a third party market research report, the Upper Manhattan/Harlem retail market contains approximately 2.2 million square feet of retail space. The 125th Street corridor is considered Harlem’s prime retail/commercial corridor with much of the higher density retail development located along this strip. Asking rents vary significantly throughout the Harlem market. A real estate trade association conducts semiannual retail market reports which contain an analysis of the 125th Street corridor. According to such report for spring 2016 (the “Spring 2016 Retail Report”), the average 125th Street asking rent was $132.00 per square foot, up 2% from the fall of 2014 and down 6% from the spring of 2016. Furthermore, Gateway I & II’s 125th Street retail corridor exhibits a range of asking rents from $75.00 to $225.00 per square foot depending on size, frontage, utility and location. The Spring 2016 Retail Report indicates that the Harlem corridor has ground floor average asking rents ranging between $70.00 and $390.00 per square foot, with an average asking rent of $138.00 per square foot. The appraisal identified 13 comparable retail leases ranging from $88.00 to $200.00 per square foot. Based upon recent leases at Gateway Center I & II, recent activity in the market, and the comparable leases, the appraisal concluded to a market rent of $190.00 per square foot for small ground floor space (less than 2,000 square feet) along East 125th Street, $125.00 per square foot for the large ground floor space (greater than 2,000 square feet) along East 125th Street, $110.00 per square foot for the small retail suite along Lexington Avenue and $100.00 per square foot for the corner retail suite along Lexington Avenue and East 126th Street.
| Historical and Current Occupancy(1) | |||
| 2013 | 2014 | 2015 | Current(2)(3) |
| 100.0% | 100.0% | 100.0% | 95.5% |
| (1) | Historical Occupancies are as of December 31 of each respective year. |
| (2) | Current Occupancy is as of October 31, 2016. |
| (3) | Current Occupancy dipped from 100.0% when the previous owner vacated their small office space. |
THE INFORMATION IN THIS STRUCTURAL AND COLLATERAL TERM SHEET IS NOT COMPLETE AND MAY BE AMENDED PRIOR TO THE TIME OF SALE. THIS TERM SHEET IS NOT AN OFFER TO SELL THESE SECURITIES AND IT IS NOT A SOLICITATION OF AN OFFER TO BUY THESE SECURITIES IN ANY JURISDICTION WHERE THE OFFER OR SALE IS NOT PERMITTED.
| 69 of 139 | |
| Structural and Collateral Term Sheet | JPMDB 2017-C5 | |
| Gateway I & II | ||
| Collateral Tenant Summary(1) | ||||||
| Tenant | Ratings(2) Moody’s/S&P/Fitch | Net Rentable Area (SF) | % of Total NRA | Base Rent PSF | % of Total Base Rent | Lease Expiration Date |
| NYSARC(3) | NA / NA / NA | 37,284 | 38.9% | $46.35 | 34.7% | 10/31/2029 |
| Modells(4) | NA / NA / NA | 16,363 | 17.1% | $67.22 | 22.1% | 12/31/2026 |
| Sinergia | NA / NA / NA | 15,087 | 15.8% | $45.24 | 13.7% | 11/30/2024 |
| Duane Reade | Baa2 / BBB / BBB | 8,601 | 9.0% | $104.64 | 18.1% | 10/31/2026 |
| Day Care Council NY(5) | NA / NA / NA | 7,580 | 7.9% | $31.25 | 4.8% | 12/31/2020 |
| IHOP | NA / NA / NA | 5,025 | 5.2% | $56.54 | 5.7% | 3/31/2026 |
| Cardinal McCloskey | NA / NA / NA | 1,521 | 1.6% | $34.83 | 1.1% | 6/30/2017 |
| (1) | Based on the underwritten rent roll. |
| (2) | Ratings provided are for the parent company of the entity listed in the “Tenant” field whether or not the parent company guarantees the lease. |
| (3) | NYSARC has 13,133 square feet (Gateway I) expiring October 31, 2019 and 24,151 square feet (Gateway II) expiring October 31, 2029. |
| (4) | Modells is anticipated to take occupancy in the summer of 2017. The Modells lease began in January 2017 with rental payments beginning in September 2017. At loan origination, $733,333 was escrowed to a free rent reserve to cover Modells free rent period through August 2017. |
| (5) | Day Care Council NY has the right to terminate its lease after October 2017 if the tenant suffers from a defunding event. |
| Lease Rollover Schedule(1) | |||||||||||
| Year | Number of Leases Expiring | Net Rentable Area Expiring | % of NRA Expiring | Base Rent Expiring | % of Base Rent Expiring | Cumulative Net Rentable Area Expiring | Cumulative % of NRA Expiring | Cumulative Base Rent Expiring | Cumulative % of Base Rent Expiring | ||
| Vacant | NAP | 4,321 | 4.5% | NAP | NAP | 4,321 | 4.5% | NAP | NAP | ||
| 2017 & MTM | 1 | 1,521 | 1.6 | $52,983 | 1.1% | 5,842 | 6.1% | $52,983 | 1.1% | ||
| 2018 | 0 | 0 | 0.0 | 0 | 0.0 | 5,842 | 6.1% | $52,983 | 1.1% | ||
| 2019 | 1 | 13,133 | 13.7 | 621,848 | 12.5 | 18,975 | 19.8% | $674,831 | 13.5% | ||
| 2020 | 1 | 7,580 | 7.9 | 236,875 | 4.8 | 26,555 | 27.7% | $911,706 | 18.3% | ||
| 2021 | 0 | 0 | 0.0 | 0 | 0.0 | 26,555 | 27.7% | $911,706 | 18.3% | ||
| 2022 | 0 | 0 | 0.0 | 0 | 0.0 | 26,555 | 27.7% | $911,706 | 18.3% | ||
| 2023 | 0 | 0 | 0.0 | 0 | 0.0 | 26,555 | 27.7% | $911,706 | 18.3% | ||
| 2024 | 1 | 15,087 | 15.8 | 682,536 | 13.7 | 41,642 | 43.5% | $1,594,241 | 32.0% | ||
| 2025 | 0 | 0 | 0.0 | 0 | 0.0 | 41,642 | 43.5% | $1,594,241 | 32.0% | ||
| 2026 | 5 | 29,989 | 31.3 | 2,284,114 | 45.8 | 71,631 | 74.8% | $3,878,355 | 77.8% | ||
| 2027 | 0 | 0 | 0 | 0 | 0.0 | 71,631 | 74.8% | $3,878,355 | 77.8% | ||
| 2028 & Beyond | 1 | 24,151 | 25.2 | 1,106,116 | 22.2 | 95,782 | 100.0% | $4,984,471 | 100.0% | ||
| Total | 10 | 95,782 | 100.0% | $4,984,471 | 100.0% | ||||||
| (1) | Based on the underwritten rent roll. Certain tenants may have termination or contraction options that may become exercisable prior to the originally stated expiration date of the tenant lease that are not considered in this lease rollover schedule. |
THE INFORMATION IN THIS STRUCTURAL AND COLLATERAL TERM SHEET IS NOT COMPLETE AND MAY BE AMENDED PRIOR TO THE TIME OF SALE. THIS TERM SHEET IS NOT AN OFFER TO SELL THESE SECURITIES AND IT IS NOT A SOLICITATION OF AN OFFER TO BUY THESE SECURITIES IN ANY JURISDICTION WHERE THE OFFER OR SALE IS NOT PERMITTED.
| 70 of 139 | |
| Structural and Collateral Term Sheet | JPMDB 2017-C5 | |
| Gateway I & II | ||
Operating History and Underwritten Net Cash Flow | |||||||
| 2013 | 2014 | 2015 | T-5 Ann.(1) | Underwritten(2) | Per Square Foot | %(3) | |
| Rents in Place(4) | $4,186,208 | $4,286,319 | $4,140,882 | $4,159,003 | $4,984,471 | $52.04 | 91.0% |
| IG Rent Credit | 0 | 0 | 0 | 0 | 45,000 | 0.47 | 0.8% |
| Vacant Income | 0 | 0 | 0 | 0 | 358,350 | 3.74 | 6.5% |
| Gross Potential Rent | $4,186,208 | $4,286,319 | $4,140,882 | $4,159,003 | $5,387,821 | $56.25 | 98.4% |
| Reimbursements | 0 | 59 | 0 | 37,681 | 69,829 | 0.73 | 1.3% |
| Overage Rent | 0 | 0 | 0 | 0 | 17,208 | 0.18 | 0.3% |
| Net Rental Income | $4,186,208 | $4,286,378 | $4,140,882 | $4,196,684 | $5,474,858 | $57.16 | 100.0% |
| (Vacancy/Credit Loss) | 0 | 0 | 0 | 0 | (358,350) | (3.74) | (7.0)% |
| Other Income | 0 | 0 | 0 | 0 | 0 | 0 | 0.0% |
| Effective Gross Income | $4,186,208 | $4,286,378 | $4,140,882 | $4,196,684 | $5,116,508 | $53.42 | 100.0% |
| Total Expenses(5) | $622,781 | $665,514 | $871,072 | $548,193 | $854,992 | $8.93 | 16.7% |
| Net Operating Income | $3,563,426 | $3,620,865 | $3,269,810 | $3,648,491 | $4,261,516 | $44.49 | 83.3% |
| Total TI/LC, Capex/RR | 0 | 0 | 0 | 0 | 162,829 | 1.70 | 3.2% |
| Net Cash Flow | $3,563,426 | $3,620,865 | $3,269,810 | $3,648,491 | $4,098,687 | $42.79 | 80.1% |
| (1) | T-5 historical financials are based on financials from June 15, 2016 through October 31, 2016 annualized. Full year 2016 financials were not available as the sponsor acquired the property in June 2016. |
| (2) | The difference between the underwritten rents in place and the T-5 rents in place is attributed to the Modells lease which began in January 2017. |
| (3) | % column represents percent of Net Rental Income for all revenue lines and represents percent of Effective Gross Income for the remainder of fields. |
| (4) | Rents in Place include $100,965 in contractual rent steps through December 2017. |
| (5) | Gateway I & II benefit from extended real estate tax exemptions under New York City’s Industrial and Commercial Incentive Program (“ICIP”) for 25 years following each building’s original construction year. Under the ICIP, 100% of taxable improvements on Gateway I are exempt through the 2016/2017 tax year and, thereafter, the exemption is reduced by 10% per year over the next 10 years through the 2025/2026 tax year. Gateway II is 100% tax exempt through the 2025/2026 tax year, with a 10% per year phase out through the 2034/2035 tax year. Taxes have been underwritten based on the unabated amount less the average tax savings for the life of the loan. |
Property Management.The Gateway I & II property is managed by Sierra Real Estate, LLC.
Escrows and Reserves.At origination, the borrower was required to deposit into escrow $13,361 for real estate taxes, $601,000 for outstanding approved tenant improvements and leasing commissions related to Modells, $733,333 for free rent related to the Modells lease and a $3,750,000 holdback to be held by lender until such time as, among other conditions, (i) the property achieves a debt yield of at least 7.3%, (ii) Modells is in occupancy, open for business and paying full unabated rent (or, alternatively sufficient funds have been retained in the holdback reserve to account for all remaining scheduled free rent periods or rent abatements under the Modells lease) with all tenant improvements or other landlord obligations required to be performed or paid by lender under such lease having been completed, at which point the holdback reserve is required to be released to the borrower.
Tax Escrows -On a monthly basis, the borrower is required to escrow 1/12 of the annual estimated tax payments, which currently equates to $6,680.
Insurance Escrows -The requirement for the borrower to make monthly deposits to the insurance escrow is waived so long as the property is insured under an acceptable blanket policy in accordance with the loan documents.
Replacement Reserves -On a monthly basis, the borrower is required to escrow $1,596 (approximately $0.20 per square foot annually) for replacement reserves.
TI/LC Reserves -On a monthly basis, the borrower is required to deposit $11,973 (approximately $1.50 per square foot annually) for future tenant improvements and leasing commissions.
Seller IHOP Escrow - At loan origination, the prior owner escrowed $560,000 with the title company to cover any rental payments from June 2016 through June 2018 due from IHOP if not paid by the IHOP tenant. This amount is equal to two years of IHOP’s rental payments. IHOP had previously been delinquent in payment prior to the acquisition by the sponsor in June 2016, but the tenant has been current on payments since acquisition. All payments required to be made to the borrower must be paid to the lender in the clearing account and the lender is a third party beneficiary of all of borrower’s rights under the escrow agreement. The lender does not have the right to hold such escrow or to apply it to pay obligations under the loan.
THE INFORMATION IN THIS STRUCTURAL AND COLLATERAL TERM SHEET IS NOT COMPLETE AND MAY BE AMENDED PRIOR TO THE TIME OF SALE. THIS TERM SHEET IS NOT AN OFFER TO SELL THESE SECURITIES AND IT IS NOT A SOLICITATION OF AN OFFER TO BUY THESE SECURITIES IN ANY JURISDICTION WHERE THE OFFER OR SALE IS NOT PERMITTED.
| 71 of 139 | |
| Structural and Collateral Term Sheet | JPMDB 2017-C5 | |
| Gateway I & II | ||
Lockbox / Cash Management.The loan is structured with a hard lockbox and springing cash management. The borrower was required at origination to deliver tenant direction letters instructing all tenants to deposit rents into a lockbox account controlled by the lender. All funds in the lockbox account are required to be swept daily into the borrowers’ operating account, unless a Trigger Period (as defined below) is continuing, in which event such funds are required to be swept on a daily basis into a cash management account controlled by the lender and disbursed on each payment date in accordance with the loan documents.
A “Trigger Period” commences upon the occurrence of (i) an event of default, (ii) a Lease Sweep Period (as defined below), (iii) from and after December 31, 2017, the debt service coverage ratio based on underwritten net cash flow (as calculated in the loan documents) falling below 1.15x and ends upon, (a) with respect to clause (i) above, a cure of such default, (b) with respect to clause (ii) above, a Lease Sweep Cure (as defined below) and (c) with respect to clause (iii) above, the property achieving a debt service coverage ratio of at least 1.20x for two consecutive quarters. In addition, the borrower may deliver funds or a letter of credit equal to the amount which, if applied to repay the outstanding principal balance of the loan, would cause the property to achieve a 1.20x debt service coverage ratio.
A “Lease Sweep Period” will occur upon (i) 12 months prior to the earliest stated expiration of (a) the Duane Reade lease, (b) the Modell’s lease, and/or (c) any replacement lease that, either individually, or when taken together with any other lease with the same tenant or its affiliates, and assuming the exercise of all expansion rights and all preferential rights to lease additional space contained in such lease, covers the majority of the applicable space (each a “Lease Sweep Lease”), (ii) upon the date required under the Lease Sweep Lease by which the subject tenant is required to give notice of its exercise of a renewal option thereunder (and such renewal has not been so exercised), (iii) upon the early termination, early cancellation or early surrender of a Lease Sweep Lease or upon the borrower’s receipt of notice by a subject tenant of its intent to effect an early termination, early cancellation or early surrender of its Lease Sweep Lease, (iv) if a subject tenant has ceased operating its business at the property orgoes dark at substantially all of its space at the property, (v) upon a default under a Lease Sweep Lease by a subject tenant beyond any applicable notice and cure period or (vi) upon a bankruptcy or insolvency proceeding of the applicable tenant or its direct or indirect parent company.
A “Lease Sweep Cure” means (a) with respect to clauses (i), (ii), (iii) and (iv) above, the space demised under the Lease Sweep Lease has been re-tenanted pursuant to one or more Qualified Leases (as defined below) (or such lesser amount of applicable space is tenanted under one or more Qualified Leases, the leasing of which results in a debt service coverage ratio of at least 1:20x and the replacement tenant thereunder has taken occupancy and commenced paying full un-abated rent and all landlord obligations (including the payment of any leasing commissions) have been satisfied in full (or sufficient funds have been collected in the lease sweep reserve for such purposes and to cover any shortfalls with respect to required payments or operating expenses relating to the delay in the commencement of full rent payments, (b) with respect to clause (iv) above, the tenant re-opens for business and continuously operates for at least 90 days, (c) with respect to clauses (i) and (ii) above, the date on which the tenant under the Lease Sweep Lease irrevocably exercises its renewal or extension option (or otherwise enters into an extension agreement with the borrower and reasonably acceptable to the lender), and sufficient funds have accumulated in the lease sweep account to cover all anticipated leasing expenses, free rent periods and/or rent abatement periods in connection with such renewal or extension, (d) with respect to clause (v) above, such default has been cured for a period of six consecutive months and (e) with respect to clause (vi) above, the applicable insolvency proceeding has terminated and/or the applicable Lease Sweep Lease has been affirmed, assumed or assigned in a manner reasonably satisfactory to the lender.
A “Qualified Lease” means either (a) the original Lease Sweep Lease, as extended in accordance with (i) the express renewal option set forth in such Lease Sweep Lease and, with respect to which, the terms of such renewal are on market terms with respect to, among other things, base rent, additional rent and recoveries and tenant improvement allowances or (ii) a modification of the Lease Sweep Lease approved by the lender, or (b) a replacement lease (i) with a term that extends at least three years beyond the end of the loan term, (ii) entered into in accordance with the loan documents and (iii) on market terms with respect to, among other things, base rent, additional rent (which base rent and additional rent shall be at least equivalent to the rent amounts being paid under the subject Lease Sweep Lease) and recoveries and tenant improvement allowances.
THE INFORMATION IN THIS STRUCTURAL AND COLLATERAL TERM SHEET IS NOT COMPLETE AND MAY BE AMENDED PRIOR TO THE TIME OF SALE. THIS TERM SHEET IS NOT AN OFFER TO SELL THESE SECURITIES AND IT IS NOT A SOLICITATION OF AN OFFER TO BUY THESE SECURITIES IN ANY JURISDICTION WHERE THE OFFER OR SALE IS NOT PERMITTED.
| 72 of 139 | |
| Structural and Collateral Term Sheet | JPMDB 2017-C5 |
[THIS PAGE INTENTIONALLY LEFT BLANK]
THE INFORMATION IN THIS STRUCTURAL AND COLLATERAL TERM SHEET IS NOT COMPLETE AND MAY BE AMENDED PRIOR TO THE TIME OF SALE. THIS TERM SHEET IS NOT AN OFFER TO SELL THESE SECURITIES AND IT IS NOT A SOLICITATION OF AN OFFER TO BUY THESE SECURITIES IN ANY JURISDICTION WHERE THE OFFER OR SALE IS NOT PERMITTED.
| 73 of 139 | |
| Structural and Collateral Term Sheet | JPMDB 2017-C5 | |
| Landmark Square | ||

THE INFORMATION IN THIS STRUCTURAL AND COLLATERAL TERM SHEET IS NOT COMPLETE AND MAY BE AMENDED PRIOR TO THE TIME OF SALE. THIS TERM SHEET IS NOT AN OFFER TO SELL THESE SECURITIES AND IT IS NOT A SOLICITATION OF AN OFFER TO BUY THESE SECURITIES IN ANY JURISDICTION WHERE THE OFFER OR SALE IS NOT PERMITTED.
| 74 of 139 | |
| Structural and Collateral Term Sheet | JPMDB 2017-C5 | |
| Landmark Square | ||
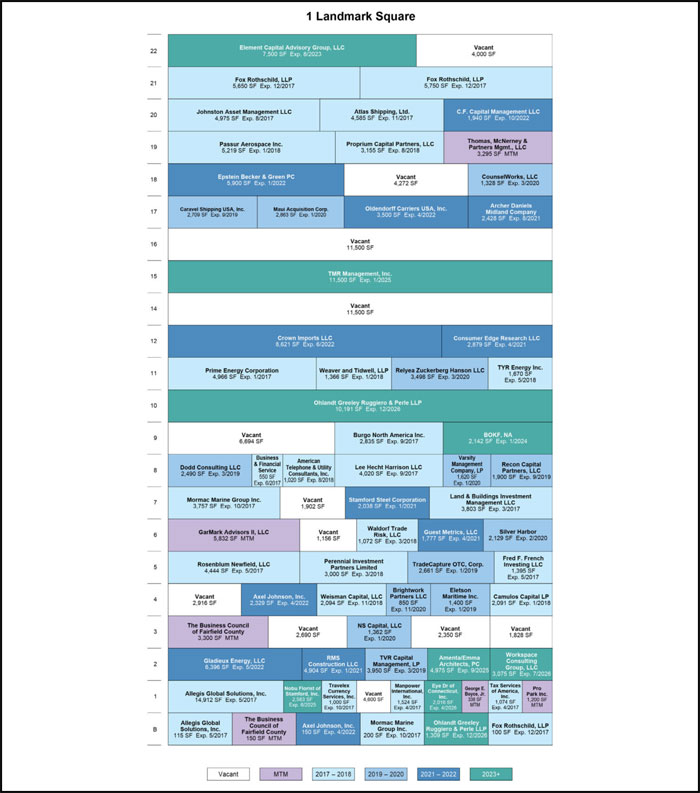
THE INFORMATION IN THIS STRUCTURAL AND COLLATERAL TERM SHEET IS NOT COMPLETE AND MAY BE AMENDED PRIOR TO THE TIME OF SALE. THIS TERM SHEET IS NOT AN OFFER TO SELL THESE SECURITIES AND IT IS NOT A SOLICITATION OF AN OFFER TO BUY THESE SECURITIES IN ANY JURISDICTION WHERE THE OFFER OR SALE IS NOT PERMITTED.
| 75 of 139 | |
| Structural and Collateral Term Sheet | JPMDB 2017-C5 | |
| Landmark Square | ||

THE INFORMATION IN THIS STRUCTURAL AND COLLATERAL TERM SHEET IS NOT COMPLETE AND MAY BE AMENDED PRIOR TO THE TIME OF SALE. THIS TERM SHEET IS NOT AN OFFER TO SELL THESE SECURITIES AND IT IS NOT A SOLICITATION OF AN OFFER TO BUY THESE SECURITIES IN ANY JURISDICTION WHERE THE OFFER OR SALE IS NOT PERMITTED.
| 76 of 139 | |
| Structural and Collateral Term Sheet | JPMDB 2017-C5 | |
| Landmark Square | ||

THE INFORMATION IN THIS STRUCTURAL AND COLLATERAL TERM SHEET IS NOT COMPLETE AND MAY BE AMENDED PRIOR TO THE TIME OF SALE. THIS TERM SHEET IS NOT AN OFFER TO SELL THESE SECURITIES AND IT IS NOT A SOLICITATION OF AN OFFER TO BUY THESE SECURITIES IN ANY JURISDICTION WHERE THE OFFER OR SALE IS NOT PERMITTED.
| 77 of 139 | |
| Structural and Collateral Term Sheet | JPMDB 2017-C5 | |
| Landmark Square | ||
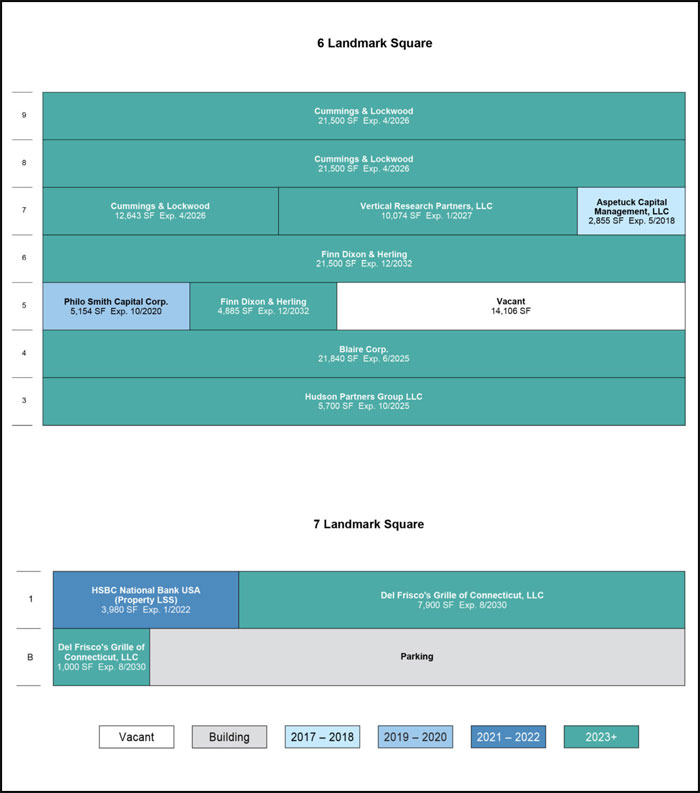
THE INFORMATION IN THIS STRUCTURAL AND COLLATERAL TERM SHEET IS NOT COMPLETE AND MAY BE AMENDED PRIOR TO THE TIME OF SALE. THIS TERM SHEET IS NOT AN OFFER TO SELL THESE SECURITIES AND IT IS NOT A SOLICITATION OF AN OFFER TO BUY THESE SECURITIES IN ANY JURISDICTION WHERE THE OFFER OR SALE IS NOT PERMITTED.
| 78 of 139 | |
| Structural and Collateral Term Sheet | JPMDB 2017-C5 | |
| Landmark Square | ||
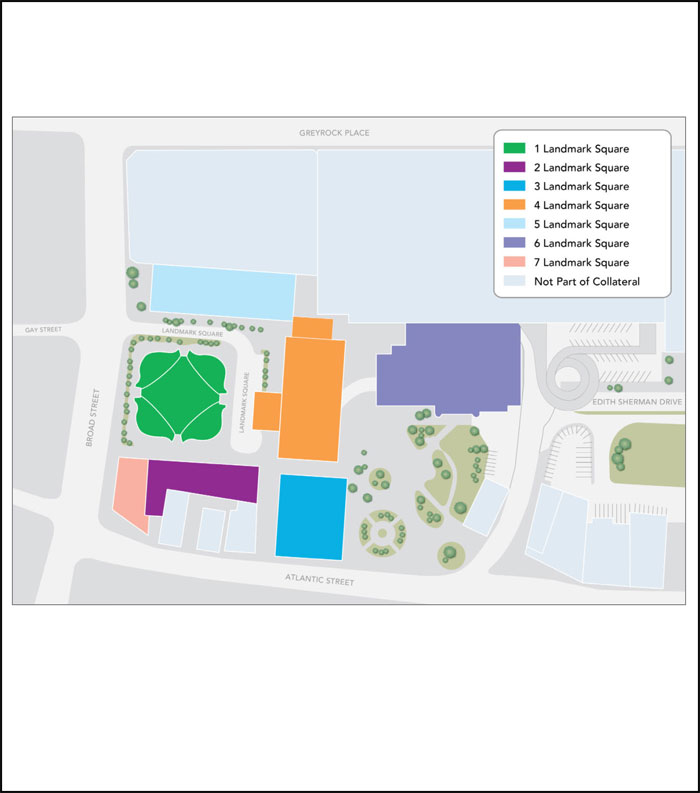
THE INFORMATION IN THIS STRUCTURAL AND COLLATERAL TERM SHEET IS NOT COMPLETE AND MAY BE AMENDED PRIOR TO THE TIME OF SALE. THIS TERM SHEET IS NOT AN OFFER TO SELL THESE SECURITIES AND IT IS NOT A SOLICITATION OF AN OFFER TO BUY THESE SECURITIES IN ANY JURISDICTION WHERE THE OFFER OR SALE IS NOT PERMITTED.
| 79 of 139 | |
| Structural and Collateral Term Sheet | JPMDB 2017-C5 | |
| Landmark Square | ||
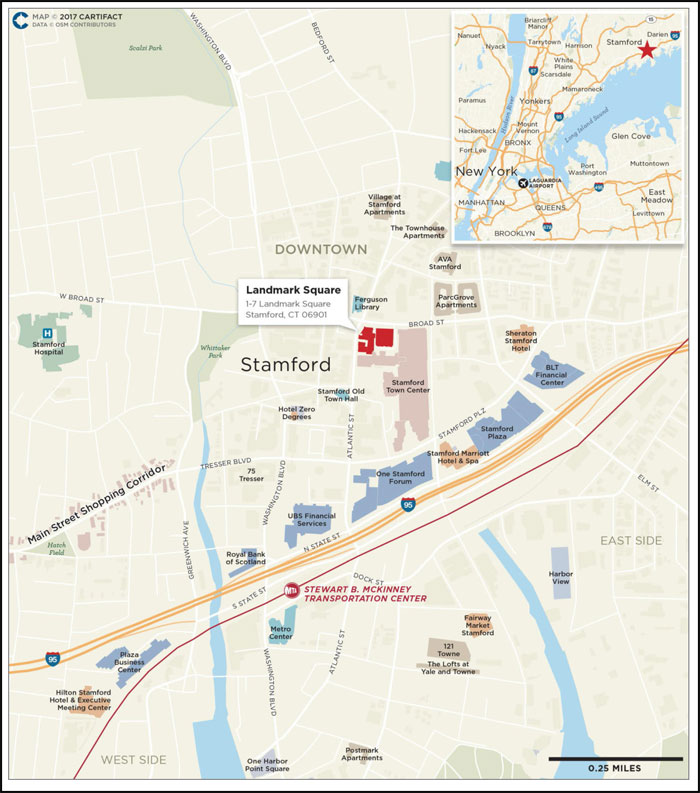
THE INFORMATION IN THIS STRUCTURAL AND COLLATERAL TERM SHEET IS NOT COMPLETE AND MAY BE AMENDED PRIOR TO THE TIME OF SALE. THIS TERM SHEET IS NOT AN OFFER TO SELL THESE SECURITIES AND IT IS NOT A SOLICITATION OF AN OFFER TO BUY THESE SECURITIES IN ANY JURISDICTION WHERE THE OFFER OR SALE IS NOT PERMITTED.
| 80 of 139 | |
| Structural and Collateral Term Sheet | JPMDB 2017-C5 | |
| Landmark Square | ||
| Mortgage Loan Information | Property Information | |||
| Mortgage Loan Seller: | JPMCB | Single Asset / Portfolio: | Single Asset | |
| Original Principal Balance(1): | $49,000,000 | Title: | Fee / Leasehold | |
| Cut-off Date Principal Balance(1): | $49,000,000 | Property Type - Subtype: | Mixed Use – Office/Retail | |
| % of Pool by IPB: | 4.7% | Net Rentable Area (SF): | 757,917 | |
| Loan Purpose: | Refinance | Location: | Stamford, CT | |
| Borrower: | Landmark Square 1-6 LLC | Year Built / Renovated: | 1974, 1976, 1977, 1981, 1983, | |
| Sponsor: | SL Green Operating Partnership, | 2006 / N/A | ||
| L.P. | Occupancy: | 84.9% | ||
| Interest Rate: | 4.97000% | Occupancy Date: | 12/31/2016 | |
| Note Date: | 12/2/2016 | Number of Tenants: | 113 | |
| Maturity Date: | 1/1/2027 | 2013 NOI: | $9,916,119 | |
| Interest-only Period: | 120 months | 2014 NOI(2): | $10,446,258 | |
| Original Term: | 120 months | 2015 NOI(2): | $7,467,129 | |
| Original Amortization: | None | TTM NOI (as of 12/2016)(2)(3): | $9,724,228 | |
| Amortization Type: | Interest Only | UW Economic Occupancy(3): | 85.4% | |
| Call Protection: | L(26),Def(90),O(4) | UW Revenues: | $24,368,179 | |
| Lockbox / Cash Management: | Hard / Springing | UW Expenses: | $12,347,514 | |
| Additional Debt: | Yes | UW NOI(3): | $12,020,665 | |
| Additional Debt Balance: | $51,000,000 | UW NCF: | $11,058,110 | |
| Additional Debt Type: | Pari Passu | Appraised Value / Per SF: | $175,700,000 / $232 | |
| Appraisal Date: | 11/9/2016 | |||
| Escrows and Reserves(4) | Financial Information(1) | ||||||||
| Initial | Monthly | Initial Cap | Cut-off Date Loan / SF: | $132 | |||||
| Taxes: | $1,325,844 | $220,974 | N/A | Maturity Date Loan / SF: | $132 | ||||
| Insurance: | $0 | Springing | N/A | Cut-off Date LTV: | 56.9% | ||||
| Replacement Reserves: | $0 | Springing | $500,000 | Maturity Date LTV: | 56.9% | ||||
| TI/LC: | $0 | Springing | N/A | UW NCF DSCR: | 2.19x | ||||
| Other: | $0 | $0 | N/A | UW NOI Debt Yield: | 12.0% | ||||
| Sources and Uses | |||||||||
| Sources | Proceeds | % of Total | Uses | Proceeds | % of Total | ||||
| Mortgage Loan(1) | $100,000,000 | 100.0% | Payoff Existing Debt | $78,204,098 | 78.2% | ||||
| Return of Equity | 19,056,999 | 19.1 | |||||||
| Closing Costs | 1,413,059 | 1.4 | |||||||
| Upfront Reserves | 1,325,844 | 1.3 | |||||||
| Total Sources | $100,000,000 | 100.0% | Total Uses | $100,000,000 | 100.0% | ||||
| (1) | The Landmark Square loan is part of a whole loan evidenced by twopari passu notes with an aggregate outstanding principal balance as of the Cut-off Date of $100.0 million. The Financial Information presented in the chart above reflects the Cut-off Date balance of the $100.0 million Landmark Square Whole Loan, as defined in “The Loan” below. |
| (2) | The decrease from 2014 NOI to 2015 NOI is primarily due to rent abatements for tenants which signed leases in 2015. The increase from 2015 NOI to TTM NOI is primarily due to rent abatements burning off from the leases executed in 2015 and an increase in other income related to licensee rent, lease buy out income and miscellaneous income in the amount of $699,848. |
| (3) | The increase in UW NOI from TTM NOI is primarily due to rent abatements burning off, additional leasing and contractual rent steps though January 1, 2018 totaling approximately $340,507. |
| (4) | For a full description of Escrows and Reserves, please refer to“Escrows and Reserves”below. |
THE INFORMATION IN THIS STRUCTURAL AND COLLATERAL TERM SHEET IS NOT COMPLETE AND MAY BE AMENDED PRIOR TO THE TIME OF SALE. THIS TERM SHEET IS NOT AN OFFER TO SELL THESE SECURITIES AND IT IS NOT A SOLICITATION OF AN OFFER TO BUY THESE SECURITIES IN ANY JURISDICTION WHERE THE OFFER OR SALE IS NOT PERMITTED.
| 81 of 139 | |
| Structural and Collateral Term Sheet | JPMDB 2017-C5 | |
| Landmark Square | ||
The Loan.The Landmark Square loan is secured by a first mortgage lien on the borrower’s fee and leasehold interests in a mixed use office and retail complex located in downtown Stamford, Connecticut, consisting of 757,917 square feet. The whole loan has an outstanding principal balance as of the Cut-off Date of $100.0 million (the “Landmark Square Whole Loan”) and is comprised of twopari passu notes, each as described below. Note A-2 with a balance of $49.0 million is being contributed to the JPMDB 2017-C5 Trust. Note A-1 is expected to be contributed to the JPMCC 2017-JP5 trust and is the controlling note under the related intercreditor agreement, the rights of which will be exercised by the related trustee under that securitization (or, prior to the occurrence and continuance of a control termination event under the related pooling and servicing agreement, by the related directing certificateholder). However, the holder of Note A-2 (including the Trustee or, prior to the occurrence and continuance of a Control Termination Event, the Directing Certificateholder) will be entitled, under certain circumstances, to be consulted with respect to certain major decisions. The Landmark Square Whole Loan has a 10-year term and is interest-only for the entire term.
| Whole Loan Summary | |||||
| Note | Original Balance | Cut-off Date Balance | Note Holder(1) | Controlling Piece | |
| A-1 | $51,000,000 | $51,000,000 | JPMCB | Yes | |
| A-2 | 49,000,000 | 49,000,000 | JPMDB 2017-C5 | No | |
| Total | $100,000,000 | $100,000,000 | |||
(1) The controlling Note A-1 is currently held by JPMCB and is expected to be contributed to the JPMCC 2017-JP5 trust
The Borrower. The borrowing entity for the Landmark Square Whole Loan is Landmark Square 1-6 LLC, a Delaware limited liability company and special purpose entity.
The Loan Sponsor.The loan sponsor of the borrower and nonrecourse carve-out guarantor is SL Green Operating Partnership, L.P. (“SL Green”) (NYSE: “SLG”; rated Baa3/BBB-/BBB- by Moody’s, S&P and Fitch, respectively) which is an S&P 500 company and New York City’s largest office landlord. As of December 31, 2016, SL Green held interests in 127 Manhattan properties totaling 47.8 million square feet. In addition to the Landmark Square property, the loan sponsor owns four other office buildings (680, 750, 1055 and 1010 Washington Boulevard) totaling over 650,000 square feet in Stamford, Connecticut.
The property was acquired by the loan sponsor through its acquisition of Reckson Operating Partnership LP in January 2007 for an allocated purchase price of approximately $256.0 million ($338 per square foot). According to the loan sponsor, it invested approximately $36.5 million ($48 per square foot) in capital improvements including new building and garage entrances, fully renovated lobbies, elevator modernization, universal key card access, main arcade renovations, exterior plaza upgrades and a sustainability program that encompassed a complete exterior LED lighting retrofit along with various mechanical improvements and upgrades.
The Property.The Landmark Square property consists of 757,917 square feet of office and retail space and is situated on a 6.30 acre site in downtown Stamford, Connecticut. Landmark Square is comprised of seven buildings ranging in size from 12,880 square feet to 272,578 square feet that were built in various phases between 1974 and 2006. The largest building, 1 Landmark Square, is the tallest office building in Stamford at 22 stories and offers expansive views of the Long Island Sound and the New York City skyline. The remaining buildings are two to nine stories each. Due to its varying floorplates, the Landmark Square property is able to accommodate tenants ranging in size from approximately 55,000 square feet to less than 1,000 square feet at a wide range of price points. Property amenities include on-site parking consisting of 1,100 spaces (resulting in a parking ratio of 1.45 spaces per 1,000 square feet) with optional valet parking, a private shuttle to and from the Metro North/Amtrak transportation hub which is 0.5 miles from the property, numerous on-site restaurants including Del Frisco’s Grill and a full-time concierge for tenants. Of the total square footage, approximately 81,879 square feet is retail (10.8% of total square footage). Of the retail square footage, 50,247 square feet is leased to Bow Tie Cinemas movie theater, which is located at 5 Landmark Square, while the remainder of the retail space is located within 1, 3, 4 and 7 Landmark Square. The property also features a 21,500 square foot health club, complete with squash courts, cardio rooms, weight rooms and full locker room facilities, which is available exclusively to tenants for a monthly fee of $30.00. Tenants also have access to a state-of-the-art 50-seat conference facility, barbershop and on-site tailor and dry cleaners.
THE INFORMATION IN THIS STRUCTURAL AND COLLATERAL TERM SHEET IS NOT COMPLETE AND MAY BE AMENDED PRIOR TO THE TIME OF SALE. THIS TERM SHEET IS NOT AN OFFER TO SELL THESE SECURITIES AND IT IS NOT A SOLICITATION OF AN OFFER TO BUY THESE SECURITIES IN ANY JURISDICTION WHERE THE OFFER OR SALE IS NOT PERMITTED.
| 82 of 139 | |
| Structural and Collateral Term Sheet | JPMDB 2017-C5 | |
| Landmark Square | ||
| Property Summary | ||||||||
Building Name | Location | Net Rentable Area (SF)(1) | Year Built | Number of Stories | Number of Tenants(2) | Occupancy | Major Tenants | |
| 1 Landmark Square | Stamford, CT | 272,578 | 1981 | 22 | 61 | 79.7% | Allegis Global Solutions | |
| 2 Landmark Square | Stamford, CT | 37,715 | 1974 | 3 | 6 | 62.4% | SAC Acquisition, Katon Partners | |
| 3 Landmark Square | Stamford, CT | 131,556 | 1977 | 6 | 20 | 81.8% | NBC Universal Media, Boardroom, Inc. | |
| 4 Landmark Square | Stamford, CT | 103,431 | 1976 | 5 | 15 | 93.7% | Silgan Holdings, Inc | |
| 5 Landmark Square | Stamford, CT | 58,000 | 1974 | 3 | 3 | 100.0% | Bow Tie Cinemas | |
| 6 Landmark Square | Stamford, CT | 141,757 | 1983 | 9 | 7 | 90.0% | Cummings & Lockwood, Finn Dixon & Herling | |
| 7 Landmark Square | Stamford, CT | 12,880 | 2006 | 2 | 2 | 100.0% | Del Frisco’s Grille, HSBC | |
| Total/Wtd. Avg. | 757,917 | 114 | 84.9% | |||||
| (1) | Net rentable area excludes all storage space, the conference center and fitness center. |
| (2) | The total number of tenants does not equal 113 because Sacred Heart University leases space at 3 and 4 Landmark Square. |
As of December 31, 2016, the property was 84.9% leased to 113 tenants, across a wide-range of industries including legal, accounting, financial services, publishing, software, advertising, food packaging, liquor import, recruiting, human resources and mail order retail, among others. The largest tenant at the property, Cummings & Lockwood, leases 55,643 square feet (7.3% of the net rentable area) through April 2026 and has been in occupancy since 2005. Cummings & Lockwood has two five-year renewal options which would extend its lease out to 2036. Cummings & Lockwood is a law firm founded in 1909 that provides legal counsel to both private clients and commercial enterprises with one of the largest trust and estate practices in the United States. Cummings & Lockwood employs nearly 100 attorneys across six offices located in Connecticut and Florida. The second largest tenant, B and E Theaters LLC (“Bow Tie Cinemas”), leases 50,247 square feet (6.6% of the net rentable area) of the ground floor of 5 Landmark Square and has been a tenant at the property since 1996 and most recently renewed its lease in June 2016. The theater features nine screens and has an entrance from Stamford Town Center Mall. Bow Tie Cinemas’ lease expires in May 2021 and it has one five-year renewal option which would extend its lease out to 2026. Founded in 1900, Bow Tie Cinemas is a privately-held theater company with more than 400 screens across 50 theaters in Colorado, Connecticut, Maryland, New Jersey, New York and Virginia. The third largest tenant, Finn Dixon & Herling, leases 26,385 square feet (3.5% of the net rentable area). Finn Dixon & Herling is a corporate law firm headquartered at the property, which was founded in 1987 and employs more than 50 attorneys. The firm specializes in bankruptcy and corporate reorganizations, commercial litigation, banking, mergers and acquisitions, securities, private equity, public finance, executive compensation and tax law. Finn Dixon & Herling has been at the property since April 2016 and its lease expires in December 2032. The Landmark Square property has had 26 renewal or new leases signed since January 2016 totaling 207,147 square feet (27.3% of total net rentable area).
| Historical and Current Occupancy(1) | |||
| 2013 | 2014 | 2015 | Current(2) |
| 82.4% | 84.9% | 87.6% | 84.9% |
| (1) | Historical Occupancies are as of December 31 of each respective year. |
| (2) | Current Occupancy is as of December 31, 2016. |
The Landmark Square property is located within the Stamford central business district adjacent to Veterans Memorial Park and connected via an enclosed arcade to the adjacent Stamford Town Center Mall, an 853,000 square foot retail complex featuring more than 100 retailers and anchored by Macy’s and Saks Fifth Avenue OFF Fifth. Within one block of the property are Palace Theater, Ferguson Library and Old Town Hall, a public exhibition and event space, Courtyard by Marriott Stamford Downtown, Target and the University of Connecticut – Stamford. The property is located within three blocks of the Stamford Innovation Center which serves as an incubator and co-working space for technology start-ups. The Landmark Square property is also located within 0.75 miles of the Stamford train station, which allows for access to Manhattan in approximately 50 minutes. The property is located just north of Interstate 95 which provides access to State Routes 7 and 8 and connects to the Merritt Parkway and other points in the northern sector of the state.
THE INFORMATION IN THIS STRUCTURAL AND COLLATERAL TERM SHEET IS NOT COMPLETE AND MAY BE AMENDED PRIOR TO THE TIME OF SALE. THIS TERM SHEET IS NOT AN OFFER TO SELL THESE SECURITIES AND IT IS NOT A SOLICITATION OF AN OFFER TO BUY THESE SECURITIES IN ANY JURISDICTION WHERE THE OFFER OR SALE IS NOT PERMITTED.
| 83 of 139 | |
| Structural and Collateral Term Sheet | JPMDB 2017-C5 | |
| Landmark Square | ||
Stamford is home to numerous national and multinational corporations such as Sikorsky Aircraft, General Electric Corporation, Gen Re, Pitney Bowes, UBS, Reuters, Bridgewater Associates, Vineyard Vines and Royal Bank of Scotland, among others. According to the appraisal, Stamford is a global financial center with a strong high tech manufacturing and defense industry presence which benefits from a highly educated labor force. Stamford has a growing number of residential projects including Harbor Point, Parcel 38 and Bedford House. Harbor Point, the largest development within Stamford is a mixed-use redevelopment encompassing 82 acres, currently consisting of more than 2,360 apartments and is anticipated to expand to more than 4,000 units. Harbor Point also features a significant retail component including 30 retailers with more than a dozen restaurants, 20 acres of public parks, four marinas and a water taxi. Parcel 38 and Bedford House are two additional developments projected to add approximately 754 residential units.
The property is located within the Stamford central business district office submarket which, according to the appraisal, as of the third quarter of 2016 had an overall vacancy rate of 21.3% and an overall availability rate of 31.7%. However, a significant amount of office vacancy in the Stamford central business district is situated in three buildings (677 Washington Boulevard, 695 East Main Street and 1 Elmcroft Road) that comprise 16.1% of the total submarket office inventory. According to the appraisal, 677 Washington Boulevard, 695 East Main Street and 1 Elmcroft Road are not directly competitive with the property since they were designed as corporate headquarters with very large floor plans, long corridors, and are inefficiently designed for a multi-tenant building while the property caters to small and medium sized tenants. Excluding these three buildings from the Stamford central business district inventory, the availability rate decreases from 31.7% to 19.1%.
According to the appraisal, as of third quarter 2016, the Stamford central business district office and retail submarket rental rates were $43.41 per square foot gross and $34.31 triple net, respectively. The appraisal identified seven competitive properties built between 1980 and 1989 and ranging in size from 133,000 square feet to 501,448 square feet. The comparable properties reported occupancies ranging from 72.0% to 99.0% with a weighted average occupancy of approximately 86.2%. The appraisal concluded a stabilized occupancy rate of 90.0% for the property and an office market rental range of $33.00 to $44.00 per square foot gross for the property. Additionally, the appraisal concluded a retail market rental range of $15.00 to $35.00 per square foot triple net.
| Tenant Summary(1) | |||||||
| Tenant | Retail / Office Component | Ratings(2) Moody’s/S&P/Fitch | Net Rentable Area (SF) | % of Total NRA | Base Rent PSF | % of Total Base Rent | Lease Expiration Date |
| Cummings & Lockwood(3) | Office | NA / NA / NA | 55,643 | 7.3% | $35.00 | 9.5% | 4/30/2026 |
| Bow Tie Cinemas | Retail | NA / NA / NA | 50,247 | 6.6% | $7.46 | 1.8% | 5/31/2021 |
| Finn Dixon & Herling(4) | Office | NA / NA / NA | 26,385 | 3.5% | $35.00 | 4.5% | 12/31/2032 |
| Morgan Stanley Smith Barney(5) | Office | A3 / BBB+ / A | 23,062 | 3.0% | $36.50 | 4.1% | 11/30/2020 |
| Blaire Corp. | Office | NA / NA / NA | 21,840 | 2.9% | $21.02 | 2.3% | 6/30/2025 |
| NBC Universal Media | Office | A3 / NA / A- | 16,774 | 2.2% | $32.25 | 2.7% | 7/31/2017 |
| Silgan Holdings, Inc(6) | Office | NA / NA / NA | 16,223 | 2.1% | $32.00 | 2.5% | 4/30/2023 |
| Allegis Global Solutions(7) | Office | NA / NA / NA | 15,027 | 2.0% | $31.38 | 2.3% | 5/31/2017 |
Sacred Heart University | Office | NA / NA / NA | 14,987 | 2.0% | $31.00 | 2.3% | 8/31/2018 |
| Luxury Mortgage Corporation(8) | Office | NA / NA / NA | 14,643 | 1.9% | $17.21 | 1.2% | MTM |
| (1) | Based on the underwritten rent roll dated December 31, 2016. |
| (2) | Ratings provided are for the parent company of the entity listed in the “Tenant” field whether or not the parent company guarantees the lease. |
| (3) | Cummings & Lockwood has the right to contract 5,000-10,000 square feet of its leased space as of April 30, 2021, with 12 months’ notice and the payment of a contraction fee. |
| (4) | Finn Dixon & Herling has the right to terminate 3,240 square feet of its 26,385 total square feet as of January 1, 2023 with 18 months’ written notice and the payment of a contraction fee. |
| (5) | Morgan Stanley Smith Barney has the right to terminate its lease beginning August 23, 2019 with 12 months’ written notice and the payment of a termination fee. |
| (6) | Silgan Holdings, Inc has the right to terminate its lease as of July 1, 2019 with 12 months’ written notice and the payment of a termination fee. |
| (7) | Allegis Global Solutions may terminate its lease at any time with 30 days’ written notice. |
| (8) | Luxury Mortgage Corporation may terminate its lease at any time with 30 days’ written notice. |
THE INFORMATION IN THIS STRUCTURAL AND COLLATERAL TERM SHEET IS NOT COMPLETE AND MAY BE AMENDED PRIOR TO THE TIME OF SALE. THIS TERM SHEET IS NOT AN OFFER TO SELL THESE SECURITIES AND IT IS NOT A SOLICITATION OF AN OFFER TO BUY THESE SECURITIES IN ANY JURISDICTION WHERE THE OFFER OR SALE IS NOT PERMITTED.
| 84 of 139 | |
| Structural and Collateral Term Sheet | JPMDB 2017-C5 | |
| Landmark Square | ||
| Lease Rollover Schedule(1) | |||||||||
| Year | Number of Leases Expiring | Net Rentable Area Expiring | % of NRA Expiring | Base Rent Expiring | % of Base Rent Expiring | Cumulative Net Rentable Area Expiring | Cumulative % of NRA Expiring | Cumulative Base Rent Expiring | Cumulative % of Base Rent Expiring |
| Vacant | NAP | 114,084 | 15.1% | NAP | NAP | 114,084 | 15.1% | NAP | NAP |
| 2017 & MTM | 26 | 126,528 | 16.7 | $4,086,661 | 20.0% | 240,612 | 31.7% | $4,086,661 | 20.0% |
| 2018 | 19 | 63,116 | 8.3 | 2,119,068 | 10.4 | 303,728 | 40.1% | $6,205,728 | 30.4% |
| 2019 | 11 | 28,411 | 3.7 | 985,672 | 4.8 | 332,139 | 43.8% | $7,191,400 | 35.3% |
| 2020 | 14 | 60,584 | 8.0 | 2,133,342 | 10.5 | 392,723 | 51.8% | $9,324,743 | 45.7% |
| 2021 | 10 | 85,718 | 11.3 | 1,652,180 | 8.1 | 478,441 | 63.1% | $10,976,923 | 53.8% |
| 2022 | 13 | 66,352 | 8.8 | 2,412,938 | 11.8 | 544,793 | 71.9% | $13,389,861 | 65.7% |
| 2023 | 4 | 32,556 | 4.3 | 1,206,024 | 5.9 | 577,349 | 76.2% | $14,595,885 | 71.6% |
| 2024 | 2 | 12,683 | 1.7 | 410,545 | 2.0 | 590,032 | 77.8% | $15,006,430 | 73.6% |
| 2025 | 5 | 46,598 | 6.1 | 1,309,327 | 6.4 | 636,630 | 84.0% | $16,315,757 | 80.0% |
| 2026 | 4 | 72,234 | 9.5 | 2,525,892 | 12.4 | 708,864 | 93.5% | $18,841,649 | 92.4% |
| 2027 | 1 | 10,074 | 1.3 | 272,000 | 1.3 | 718,938 | 94.9% | $19,113,649 | 93.7% |
| 2028 & Beyond | 4 | 38,979 | 5.1 | 1,279,563 | 6.3 | 757,917 | 100.0% | $20,393,211 | 100.0% |
| Total | 113 | 757,917 | 100.0% | $20,393,211 | 100.0% | ||||
| (1) | Based on the underwritten rent roll dated December 31, 2016 and includes rent steps through January 1, 2018. |
| Operating History and Underwritten Net Cash Flow | |||||||
| 2013 | 2014 | 2015 | 2016 | Underwritten | Per Square Foot | %(1) | |
| Rents in Place | $17,688,150 | $17,808,307 | $18,668,997 | $19,376,081 | $20,393,211 | $26.91 | 74.1% |
| Vacant Income | 0 | 0 | 0 | 0 | 4,030,490 | 5.32 | 14.6% |
| Gross Potential Rent | $17,688,150 | $17,808,307 | $18,668,997 | $19,376,081 | $24,423,701 | $32.22 | 88.7% |
| Total Reimbursements | 2,769,707 | 3,591,215 | 3,078,349 | 3,353,847 | 3,105,660 | 4.10 | 11.3% |
| Net Rental Income | $20,457,856 | $21,399,521 | $21,747,346 | $22,729,928 | $27,529,361 | $36.32 | 100.0% |
| (Vacancy/Credit Loss)(2) | (431,586) | (705,825) | (2,869,221) | (2,162,927) | (4,030,490) | (5.32) | (14.6) |
| Other Income(3) | 1,063,762 | 1,513,068 | 973,897 | 1,673,745 | 869,308 | 1.15 | 3.2% |
| Effective Gross Income | $21,090,032 | $22,206,765 | $19,852,023 | $22,240,746 | $24,368,179 | $32.15 | 88.5% |
| Total Expenses | $11,173,914 | $11,760,507 | $12,384,894 | $12,516,518 | $12,347,514 | $16.29 | 50.7% |
| Net Operating Income(4) | $9,916,119 | $10,446,258 | $7,467,129 | $9,724,228 | $12,020,665 | $15.86 | 49.3% |
| Total TI/LC, Capex/RR | 0 | 0 | 0 | 0 | 962,555 | 1.27 | 4.0% |
| Net Cash Flow | $9,916,119 | $10,446,258 | $7,467,129 | $9,724,228 | $11,058,110 | $14.59 | 45.4% |
| (1) | % column represents percent of Net Rental Income for all revenue lines and represents percent of Effective Gross Income for the remainder of the fields. |
| (2) | Historical Vacancy/Credit Loss consists primarily of free rent. |
| (3) | Other Income consists of licensee rent, lease buy out income and miscellaneous income. Lease buy out income has not been underwritten. |
| (4) | The decrease in Net Operating Income from 2014 to 2015 is primarily due to rent abatements for tenants which signed leases in 2015. The increase in Net Operating Income from 2015 to 2016 is primarily due to rent abatements burning off from the leases executed in 2015 and an increase in other income related to licensee rent, lease buy out income and miscellaneous income in the amount of $699,848. The increase in Net Operating Income from 2016 to Underwritten is primarily due to rent abatements burning off, additional leasing and contractual rent steps through January 1, 2018 totaling approximately $340,507. |
Property Management. The property is managed by SL Green Management LLC, an affiliate of the borrower.
Escrows and Reserves. At origination, the borrower deposited $1,325,844 for real estate taxes. The guarantor also delivered the guaranty referenced below in“Reserve Waiver Guaranty”.
THE INFORMATION IN THIS STRUCTURAL AND COLLATERAL TERM SHEET IS NOT COMPLETE AND MAY BE AMENDED PRIOR TO THE TIME OF SALE. THIS TERM SHEET IS NOT AN OFFER TO SELL THESE SECURITIES AND IT IS NOT A SOLICITATION OF AN OFFER TO BUY THESE SECURITIES IN ANY JURISDICTION WHERE THE OFFER OR SALE IS NOT PERMITTED.
| 85 of 139 | |
| Structural and Collateral Term Sheet | JPMDB 2017-C5 | |
| Landmark Square | ||
Tax Escrows -On a monthly basis, the borrower is required to escrow 1/12 of annual estimated tax payments, which currently equates to $220,974.
Insurance Escrows- The requirement for the borrower to make deposits to the insurance escrow is waived so long as no event of default has occurred and is continuing and the borrower provides satisfactory evidence that the property is insured as part of a blanket policy in accordance with the loan documents.
Replacement Reserves -In the event the borrower is required to make deposits into the replacement reserve, on a monthly basis, the borrower is required to deposit approximately $17,053 (approximately $0.27 per square foot annually) for replacement reserves. The reserve is subject to a cap of $500,000 (approximately $0.66 per square foot).
TI/LC Reserves - In the event the borrower is required to make monthly deposits into the tenant improvement and leasing commission reserve, on a monthly basis, the borrower is required to deposit approximately $63,160 (approximately $1.00 per square foot annually) for tenant improvements and leasing commission reserves.
Reserve Waiver Guaranty. So long as an affiliate of the borrower maintains a long term unsecured debt rating of “BBB-” (or its equivalent) from each of Moody’s and Fitch or has total assets in excess of $500.0 million and maintains a net worth of at least $250.0 million (in each case, exclusive of any interest in the property), the borrower may deliver a partial payment guaranty from such entity in lieu of the borrower’s requirement to make (i) the initial deposit in the amount of $2,500,000 required at origination and monthly deposits into the tenant improvement and leasing commission reserve, (ii) the initial deposit into the free rent reserve in the amount of $2,309,168, (iii) the initial deposit into the outstanding tenant improvement and leasing commission reserve in the amount of $1,437,315 and (iv) the initial and monthly deposits into the replacement reserve. The borrower is also permitted to deliver a letter of credit in an amount required by the loan documents in lieu of such deposits or any combination of cash, a letter of credit or a partial payment guaranty. The amount of this partial payment guaranty is equal to the lesser of (A) the amount that would be contained in each reserve if not for the delivery of the partial payment guaranty and (B) the then outstanding principal balance of the Landmark Square Whole Loan.
Lockbox / Cash Management.The Landmark Square Whole Loan is structured with a hard lockbox and springing cash management. The borrower was required at origination to deliver tenant direction letters instructing all tenants to deposit rents into a lockbox account controlled by the lender. All funds in the lockbox account are required to be swept each business day into the borrower’s operating account, unless a Cash Sweep Event (as defined below) is continuing, in which event such funds are required to be swept each business day into a cash management account controlled by the lender and disbursed on each payment date in accordance with the loan documents.
A “Cash Sweep Event” means the occurrence of (i) an event of default, (ii) any bankruptcy or insolvency action of the borrower or the property manager, unless the property manager that files bankruptcy is not an affiliate of the borrower and is replaced with a qualified manager in accordance with the loan agreement within 30 days or (iii) a DSCR Trigger Event (as defined below). A Cash Sweep Event arising from a DSCR Trigger Event may be prevented if (a) the borrower provides cash or a letter of credit that, if used to reduce the outstanding principal balance of the loan, would otherwise prevent or cure the applicable DSCR Trigger Event or (b) provided no event of default has occurred or is continuing, SL Green Operating Partnership, L.P. or an affiliate of the borrower that maintains a long term unsecured debt rating of “BBB-” (or its equivalent) from each of Moody’s and Fitch delivers a partial payment guaranty in an amount required by the loan documents (a “DSCR Trigger Cure Deposit”).
A “DSCR Trigger Event” means the debt service coverage ratio as calculated in accordance with the loan documents is less than 1.65x (which may not be tested more than once quarterly under the loan documents).
A Cash Sweep Event may be cured by the following: if the Cash Sweep Event is caused solely by (a) clause (i) above, the acceptance by the lender of a cure of such event of default, (b) clause (ii) above only with respect to the property manager, the lender replacing such property manager with a qualified manager under a replacement management agreement within 60 days, (c) clause (ii) above only with respect to the borrower, if such bankruptcy is caused by a party filing an involuntary petition against the borrower and the borrower has not colluded with or otherwise assisted such party or solicited creditors for any involuntary petition against the borrower, and such bankruptcy action is dismissed within 90 days after the filing date without any adverse modifications to the terms of the loan documents or (d) clause (iii) above, either (1) the applicable debt service coverage ratio (as calculated in the loan documents) for two consecutive quarters is not less than 1.65x or (2) the borrower delivers a DSCR Trigger Cure Deposit (each of the foregoing, a “Cash Sweep Event Cure”). Each Cash Sweep Event Cure is also subject to the following limitations: (1) there is no other event of default continuing under the loan documents; (2) a Cash Sweep Event Cure may occur no more than four times during the term of the loan (except that there is no limit on the number of times the borrower may cure a DSCR Trigger Event); (3) the borrower pays all of the lender’s reasonable expenses incurred in connection with such Cash Sweep Event Cure; and (4) the borrower may not cure a voluntary bankruptcy or insolvency action of the borrower or for any involuntary bankruptcy or insolvency action in which the borrower has colluded with or otherwise assisted such party or has solicited creditors for any action.
THE INFORMATION IN THIS STRUCTURAL AND COLLATERAL TERM SHEET IS NOT COMPLETE AND MAY BE AMENDED PRIOR TO THE TIME OF SALE. THIS TERM SHEET IS NOT AN OFFER TO SELL THESE SECURITIES AND IT IS NOT A SOLICITATION OF AN OFFER TO BUY THESE SECURITIES IN ANY JURISDICTION WHERE THE OFFER OR SALE IS NOT PERMITTED.
| 86 of 139 | |
| Structural and Collateral Term Sheet | JPMDB 2017-C5 | |
| Landmark Square | ||
Permitted Releases.None.
Permitted Mezzanine Debt. In connection with a bona fide sale of the property to an unaffiliated third party and assumption of the loan in accordance with the loan documents, the owners of the transferee are permitted to obtain a mezzanine loan secured by the ownership interests in the related transferee upon satisfaction of certain terms and conditions in the loan documents which include, without limitation, (i) the mezzanine lender is not an affiliate of the borrower (except that the guarantor and any of its affiliates may be the mezzanine lender in connection with a permitted assumption of the mortgage loan) and meets a qualified transferee definition in the loan documents, (ii) immediately after giving effect to the mezzanine loan, the combined loan-to-value ratio does not exceed 56.9%, (iii) immediately after giving effect to the mezzanine loan, the combined debt service coverage ratio (as calculated in the loan documents and based on the 12 months immediately following the date of determination) is not less than 2.25x and (iv) the lenders enter into an intercreditor agreement satisfactory to the mortgage lender in its sole discretion.
Ground Lease.1 Landmark Square is encumbered by a ground lease which expires February 2082 and has a rental rate of $1.00 for the entire 99-year lease term. The portion of the collateral constituting the borrower’s leasehold interest in the air rights parcel is taxed as part of the larger fee estate. The borrower pays 50% of the real estate taxes assessed against the entire parcel, with the remaining 50% of the taxes paid by the occupant of the remainder of such fee parcel, pursuant to a reciprocal easement agreement between the parties.
THE INFORMATION IN THIS STRUCTURAL AND COLLATERAL TERM SHEET IS NOT COMPLETE AND MAY BE AMENDED PRIOR TO THE TIME OF SALE. THIS TERM SHEET IS NOT AN OFFER TO SELL THESE SECURITIES AND IT IS NOT A SOLICITATION OF AN OFFER TO BUY THESE SECURITIES IN ANY JURISDICTION WHERE THE OFFER OR SALE IS NOT PERMITTED.
| 87 of 139 | |
| Structural and Collateral Term Sheet | JPMDB 2017-C5 |
| Dallas Design District | |
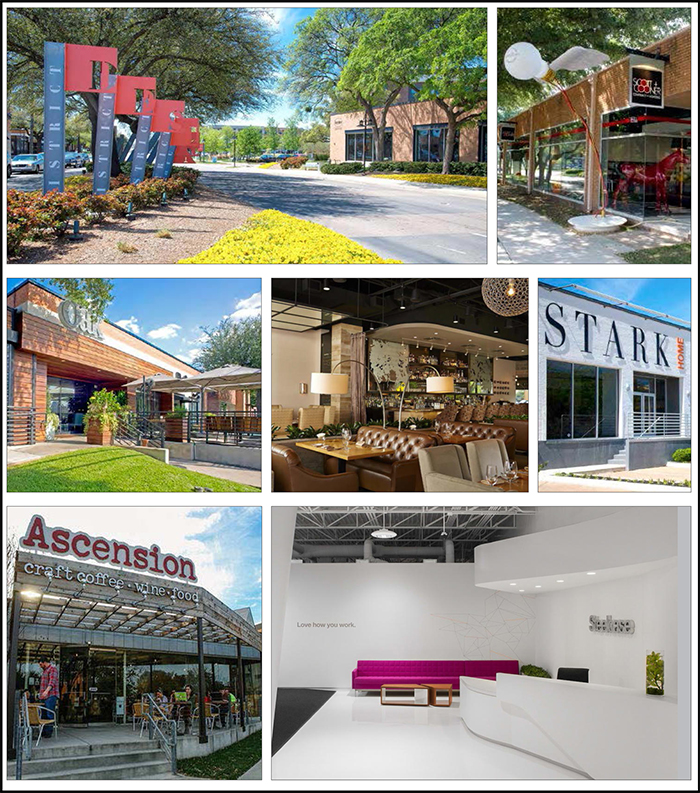
THE INFORMATION IN THIS STRUCTURAL AND COLLATERAL TERM SHEET IS NOT COMPLETE AND MAY BE AMENDED PRIOR TO THE TIME OF SALE. THIS TERM SHEET IS NOT AN OFFER TO SELL THESE SECURITIES AND IT IS NOT A SOLICITATION OF AN OFFER TO BUY THESE SECURITIES IN ANY JURISDICTION WHERE THE OFFER OR SALE IS NOT PERMITTED.
| 88 of 139 | |
| Structural and Collateral Term Sheet | JPMDB 2017-C5 |
| Dallas Design District | |
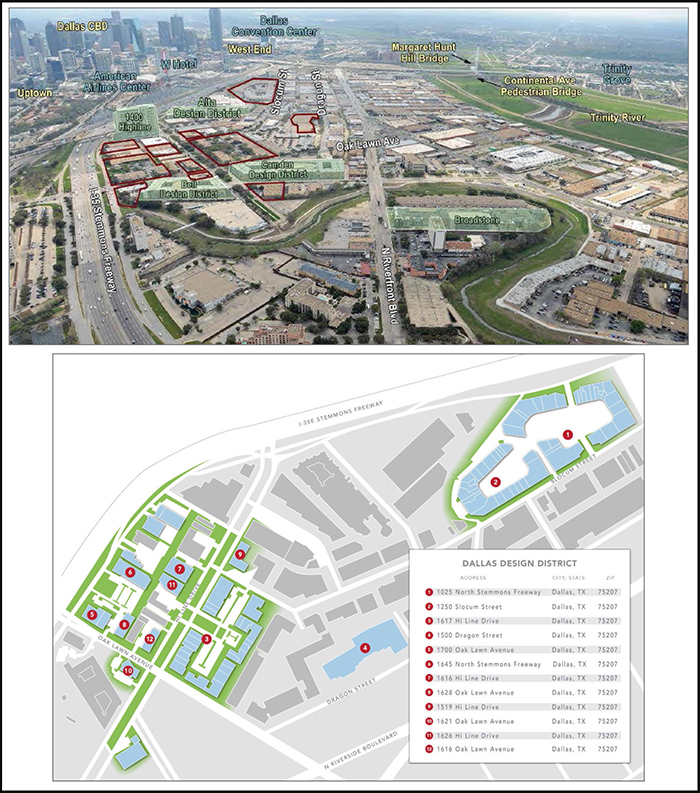
THE INFORMATION IN THIS STRUCTURAL AND COLLATERAL TERM SHEET IS NOT COMPLETE AND MAY BE AMENDED PRIOR TO THE TIME OF SALE. THIS TERM SHEET IS NOT AN OFFER TO SELL THESE SECURITIES AND IT IS NOT A SOLICITATION OF AN OFFER TO BUY THESE SECURITIES IN ANY JURISDICTION WHERE THE OFFER OR SALE IS NOT PERMITTED.
| 89 of 139 | |
| Structural and Collateral Term Sheet | JPMDB 2017-C5 |
| Dallas Design District | |
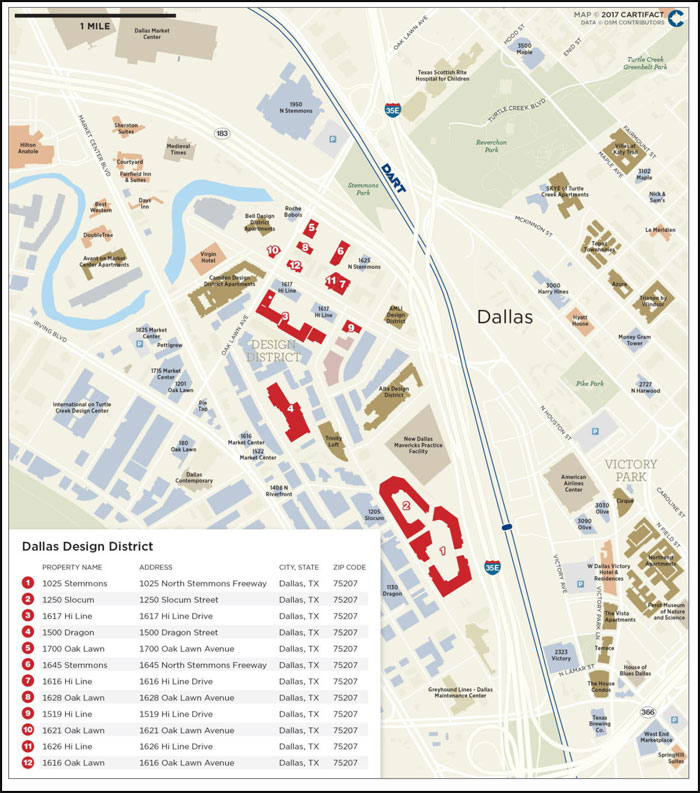
THE INFORMATION IN THIS STRUCTURAL AND COLLATERAL TERM SHEET IS NOT COMPLETE AND MAY BE AMENDED PRIOR TO THE TIME OF SALE. THIS TERM SHEET IS NOT AN OFFER TO SELL THESE SECURITIES AND IT IS NOT A SOLICITATION OF AN OFFER TO BUY THESE SECURITIES IN ANY JURISDICTION WHERE THE OFFER OR SALE IS NOT PERMITTED.
| 90 of 139 | |
| Structural and Collateral Term Sheet | JPMDB 2017-C5 |
| Dallas Design District | |
| Mortgage Loan Information | Property Information | |||
| Mortgage Loan Seller: | JPMCB | Single Asset / Portfolio: | Single Asset | |
| Original Principal Balance(1): | $45,000,000 | Title: | Fee / Leasehold | |
| Cut-off Date Principal Balance(1): | $45,000,000 | Property Type - Subtype: | Industrial – Flex | |
| % of Pool by IPB: | 4.3% | Net Rentable Area (SF): | 728,452 | |
| Loan Purpose: | Refinance | Location: | Dallas, TX | |
| Borrowers(2): | Various | Year Built / Renovated(3) | Various / Various | |
| Sponsors: | Donald Engle and | Occupancy: | 98.7% | |
| William L. Hutchinson | Occupancy Date: | 12/28/2016 | ||
| Interest Rate: | 5.25700% | Number of Tenants: | 100 | |
| Note Date: | 1/5/2017 | 2013 NOI(4): | $7,626,320 | |
| Maturity Date: | 2/1/2027 | 2014 NOI(4): | $9,005,119 | |
| Interest-only Period: | 36 months | 2015 NOI: | $8,498,455 | |
| Original Term: | 120 months | TTM NOI (as of 9/2016)(5): | $9,637,865 | |
| Original Amortization: | 360 months | UW Economic Occupancy: | 95.0% | |
| Amortization Type: | IO-Balloon | UW Revenues: | $15,304,762 | |
| Call Protection: | L(25),Grtr1%orYM(91),O(4) | UW Expenses: | $4,048,471 | |
| Lockbox / Cash Management: | Hard / In-Place | UW NOI(5): | $11,256,291 | |
| Additional Debt: | Yes | UW NCF: | $10,204,999 | |
| Additional Debt Balance: | $75,000,000 | Appraised Value / Per SF: | $193,085,000 / $265 | |
| Additional Debt Type: | Pari Passu | Appraisal Date(6): | Various | |
| Escrows and Reserves(7) | Financial Information(1) | |||||||
| Initial | Monthly | Initial Cap | Cut-off Date Loan / SF: | $165 | ||||
| Taxes: | $316,270 | $316,270 | N/A | Maturity Date Loan / SF: | $147 | |||
| Insurance: | $200,000 | Springing | N/A | Cut-off Date LTV: | 62.1% | |||
| Replacement Reserves: | $374,106 | Springing | $372,816 | Maturity Date LTV: | 55.3% | |||
| TI/LC: | $3,278,052 | Springing | $3,278,052 | UW NCF DSCR: | 1.28x | |||
| Other: | $2,155,636 | $6,025 | N/A | UW NOI Debt Yield: | 9.4% | |||
| Sources and Uses | ||||||
| Sources | Proceeds | % of Total | Uses | Proceeds | % of Total | |
| Mortgage Loan(1) | $120,000,000 | 100.0% | Payoff Existing Debt | $109,451,756 | 91.2% | |
| Upfront Reserves | 6,324,064 | 5.3 | ||||
| Closing Costs | 3,812,371 | 3.2 | ||||
| Return of Equity | 411,809 | 0.3 | ||||
| Total Sources | $120,000,000 | 100.0% | Total Uses | $120,000,000 | 100.0% | |
| (1) | The Dallas Design District loan is part of a whole loan evidenced by twopari passu notes, with an aggregate outstanding principal balance as of the Cut-off Date of $120.0 million. The Financial Information presented in the chart above reflects the Cut-off Date balance of the $120.0 million Dallas Design District Whole Loan, as defined in “The Loan” below. |
| (2) | For a full description of the borrowers, please refer to “The Borrowers” below. |
| (3) | The Dallas Design District properties were built between 1953 and 1999 and renovated between 2010 and 2016. |
| (4) | The increase in 2014 NOI from 2013 NOI is primarily due to rents in place increasing from approximately $9.0 million in 2013 to approximately $9.9 million in 2014 as a result of new/renewal leases signed at higher rents at 1025 Stemmons, 1250 Slocum, 1617 Hi Line, 1645 Stemmons and 1500 Dragon. |
| (5) | The increase in TTM NOI to UW NOI is primarily due to recent leasing across the properties along with contractual rent steps taken through January 2018 totaling $425,877. |
| (6) | All properties except 1621 Oak Lawn have an appraisal date of November 15, 2016. 1621 Oak Lawn has an appraisal date of November 21, 2016. |
| (7) | For a full description of Escrows and Reserves, please refer to“Escrows and Reserves”below. |
THE INFORMATION IN THIS STRUCTURAL AND COLLATERAL TERM SHEET IS NOT COMPLETE AND MAY BE AMENDED PRIOR TO THE TIME OF SALE. THIS TERM SHEET IS NOT AN OFFER TO SELL THESE SECURITIES AND IT IS NOT A SOLICITATION OF AN OFFER TO BUY THESE SECURITIES IN ANY JURISDICTION WHERE THE OFFER OR SALE IS NOT PERMITTED.
| 91 of 139 | |
| Structural and Collateral Term Sheet | JPMDB 2017-C5 |
| Dallas Design District | |
The Loan.The Dallas Design District loan is secured by a first mortgage lien on the borrowers’ fee and leasehold interests in 12 industrial-flex properties located in Dallas, Texas. The whole loan has an outstanding principal balance as of the Cut-off Date of $120.0 million (the “Dallas Design District Whole Loan”) and is comprised of twopari passu notes, each as described below. Note A-2 with a balance of $45.0 million, is being contributed to the JPMDB 2017-C5 Trust. Note A-1 is expected to be contributed to the JPMCC 2017-JP5 trust and is the controlling note under the related intercreditor agreement, the rights of which will be exercised by the related trustee under that securitization (or, prior to the occurrence and continuance of a control termination event under the related pooling and servicing agreement, by the related directing certificateholder). However, the holder of Note A-2 (including the Trustee or, prior to the occurrence and continuance of a Control Termination Event, the Directing Certificateholder) will be entitled, under certain circumstances, to be consulted with respect to certain major decisions. The Dallas Design District Whole Loan has a 10-year term and, subsequent to a three-year interest-only period, will amortize on a 30-year schedule. The previous debt secured by the property was securitized in JPMCC 2015-FL7.
| Whole Loan Summary | ||||
| Notes | Original Balance | Cut-off Date Balance | Note Holder(1) | Controlling Piece |
| A-1 | $75,000,000 | $75,000,000 | JPMCB | Yes |
| A-2 | 45,000,000 | 45,000,000 | JPMDB 2017-C5 | No |
| Total | $120,000,000 | $120,000,000 | ||
| (1) | The controlling Note A-1 is currently held by JPMCB and is expected to be contributed to the JPMCC 2017-JP5 trust |
The Borrowers. The borrowing entities for the Dallas Design District Whole Loan are DE Design Borrower 2017 LLC, DD Dunhill 2017 LLC and 1500 Dragon Dunhill LLC, each a Delaware limited liability company and special purpose entity. DD Dunhill 2017 LLC and DE Design Borrower 2017 LLC own the majority of the property as tenants-in-common and the remaining borrower owns the fee interest in its parcel located at 1500 Dragon Street, Dallas, Texas.
The Loan Sponsors.The Dallas Design District Whole Loan’s sponsors and nonrecourse carve-out guarantors are William L. Hutchinson, President of Dunhill Partners (“Dunhill”), and Donald Engle. Dunhill specializes in the sale, acquisition, leasing and management of retail shopping centers. Over the last 10 years, Dunhill has bought and sold approximately $3.0 billion of shopping centers throughout the Southwestern United States. Dunhill currently manages more than 5.8 million square feet of retail commercial property in Texas. Donald Engle, who owns one of the borrowers, is not a party to the environmental indemnity and is obligated under his guaranty only for certain breaches or violations of the nonrecourse carve-out provisions attributed to that borrower. The other guarantor, William L. Hutchinson, is a party to the environmental indemnity and is obligated under his guaranty for any breach or violation of the nonrecourse carve-out provisions in the loan documents.
The loan sponsors purchased 11 of the 12 properties in 2014 for $131.5 million and, according to the loan sponsors, have invested approximately $3.2 million toward tenant improvements and leasing commissions as well as approximately $1.4 million in other building improvements. The loan sponsors purchased the 12th property (1500 Dragon) in 2016 for approximately $17.6 million. The loan sponsors’ total cost basis in the portfolio is approximately $156.4 million.
The Property.The Dallas Design District properties consist of 728,452 square feet of industrial-flex space across 12 Class A properties located in Dallas, Texas. The 12 properties were developed between 1953 and 1999, renovated between 2010 and 2016, and are situated on approximately 32.5 acres. Among the 12 properties are three larger design and showroom centers, which comprise the majority of the property collateral.
As of December 28, 2016, the complex was 98.7% occupied by 100 tenants. The rent roll at the properties is diverse with no tenant representing more than 6.1% of net rentable area. Tenants at the properties include seven restaurants, several retail shops, and showroom/gallery space for tenants such as furniture retailers, wholesale textile retailers, interior design and architecture firms, and other professional firms including a modeling agency and photography studio. Among the properties, the largest tenant is Regulus Group LLC (“Regulus Group”), which first took occupancy in November 2006 and leases 6.1% of the net rentable area through March 2017. Regulus Group was founded in 2002 and provides processing solutions to a wide range of firms and has operations in three states. The second largest tenant is Walter Lee Culp Associates, Inc. (“Culp Associates”), which first took occupancy in September 1993 and recently exercised a lease extension option through October 2028, and leases 4.2% of the net rentable area. Culp Associates has two, five-year extension options. Culp Associates has been involved in the interior design community for over 42 years. The Culp Associates showroom has a large collection of traditional, transitional and fashion-forward textiles. The third largest tenant is David Sutherland, Inc. (“David Sutherland”), which first took occupancy in October 1997, and leases 4.1% of the net rentable area through May 2023. The David Sutherland showroom has a multi-line collection of furniture, fabric and accessories from manufacturers from around the world. David Sutherland has one, five-year extension option.
THE INFORMATION IN THIS STRUCTURAL AND COLLATERAL TERM SHEET IS NOT COMPLETE AND MAY BE AMENDED PRIOR TO THE TIME OF SALE. THIS TERM SHEET IS NOT AN OFFER TO SELL THESE SECURITIES AND IT IS NOT A SOLICITATION OF AN OFFER TO BUY THESE SECURITIES IN ANY JURISDICTION WHERE THE OFFER OR SALE IS NOT PERMITTED.
| 92 of 139 | |
| Structural and Collateral Term Sheet | JPMDB 2017-C5 |
| Dallas Design District | |
The loan sponsors have recently executed several new and renewal leases with tenants at the properties, with 305,121 square feet of new, renewal and expansion leases executed since May 2015. Headington Realty signed a new lease for 10,161 square feet at $35.00 per square foot and William E. McGannon, Inc. renewed its 15,823 square foot lease starting January 2018 at 1617 Hi Line at $18.00 per square foot. Additionally, new leases were executed by Janus et Cie at 1700 Oak Lawn for 8,250 square feet at $30.00 per square foot and by Made Goods at 1025 Stemmons for 4,670 square feet at $28.00 per square foot.
| Property Summary(1) | |||||||
| Property Name | Net Rentable Area (SF) | Property Description | Class | Year Built | Occupancy(2) | Appraised Value | % of Appraised Value |
| 1025 Stemmons | 212,329 | Retail / Lifestyle Center | A | 1982 | 97.6% | $51,300,000 | 26.6% |
| 1250 Slocum | 156,659 | Retail / Lifestyle Center | A | 1999 | 98.3% | 41,500,000 | 21.5 |
| 1617 Hi Line | 136,539 | Designer / Showroom | A | 1955-1967 | 100.0% | 40,500,000 | 21.0 |
| 1500 Dragon | 104,641 | Office / Showroom | A | 1979, 1981 | 100.0% | 18,500,000 | 9.6 |
| 1700 Oak Lawn | 17,425 | Designer / Showroom | A | 1957 | 100.0% | 8,350,000 | 4.3 |
| 1645 Stemmons | 22,726 | Designer / Showroom | A | 1963 | 100.0% | 7,100,000 | 3.7 |
| 1616 Hi Line | 19,074 | Designer / Showroom | A | 1954 | 100.0% | 5,450,000 | 2.8 |
| 1628-1630 Oak Lawn | 11,655 | Restaurant / Showroom | A | 1954 | 92.6% | 4,950,000 | 2.6 |
| 1519-1525 Hi Line | 13,816 | Designer / Showroom | A | 1955 | 99.2% | 4,250,000 | 2.2 |
| 1621 Oak Lawn | 9,038 | Restaurant / Retail | A | 1953 | 96.6% | 4,000,000 | 2.1 |
| 1626 Hi Line | 14,150 | Designer / Showroom | A | 1955 | 99.4% | 3,725,000 | 1.9 |
| 1616 Oak Lawn | 10,400 | Designer / Showroom | A | 1953 | 100.0% | 3,460,000 | 1.8 |
| Total/Wtd. Avg. | 728,452 | 98.7% | $193,085,000 | 100.0% | |||
| (1) | Based on the appraisals. |
| (2) | Based on the underwritten rent roll dated December 28, 2016. |
The Dallas Design District property is located approximately 2.7 miles northwest of downtown Dallas in an area locally known as the “The Design District”. Originally developed as showrooms for home furnishings, fabrics and decorative accessories, The Design District is comprised of approximately 160.0 acres just west of downtown Dallas and on the north side of the Trinity River corridor. The area consists of residential, retail, restaurants, showrooms and trade buildings and, according to the borrowers, is known to have the fourth largest concentration of designer showroom space in the country. Approximately 186.0 acres within The Design District are part of a Tax Increment Financing (“TIF”) zone that began in June 2005 and will terminate on December 31, 2027. The mission of the TIF zone is to provide a source of funding for public infrastructure improvements that will assist in redeveloping an industrial and warehouse district to take full advantage of the expanding DART light rail system, to promote transit oriented development, and to improve access to the Trinity River and the quality of development adjacent to the Trinity River Corridor.
According to the appraisal, the Dallas Design District is also home to the Dallas Market Center (“DMC”), one of the world’s largest wholesale marts (more than five million square feet), which is located along Stemmons Freeway near Market Center Boulevard, approximately one mile north of the property. The DMC offers more than 2,000 permanent showrooms with thousands of lines from leading manufacturers of gift products, decorative accessories, home furnishing, lighting, garden accessories, gourmet products, holiday and floral items and apparel. The DMC holds approximately 50 trade and special events each year with the largest event attracting more than 50,000 attendees. According to the appraisal, approximately 400,000 people visit the DMC campus each year including more than 200,000 buyers and sellers from all 50 states and 84 countries.
The Dallas Design District property is located adjacent to Stemmons Freeway, a main north-south thoroughfare that bisects Dallas. The property is also located off Interstate 35 to the north and east, with access on the south to Riverfront Boulevard and the Trinity River. The area benefited from a 2011 Interstate 35 expansion that added additional freeway access points to the surrounding area. The Dallas Design District property is situated on the other side of Interstate 35 and is approximately one mile from the American Airlines Center, the home court of the Dallas Mavericks National Basketball Association team, Dallas Stars National Hockey League team and a venue used for concerts and events throughout the year. Mark Cuban, owner of the Dallas Mavericks National Basketball Association team, recently announced in October 2016 plans to build a $70.0 million practice facility for the Dallas Mavericks located within the Dallas Design District neighborhood. The new practice facility will be adjacent to the 1025 Stemmons and 1250 Slocum properties. Additionally, Dunhill and Gatehouse Capital Corporation are building an approximately $80.0 million Virgin Hotel Dallas, a 14-story, 240-room boutique hotel located on Hi Line Drive near Stemmons Freeway. The hotel is scheduled to open in early 2018 and will include luxury suites, restaurants, bars, meeting space and a rooftop terrace with a pool, spa and gym.
According to the 1025 Stemmons appraisal, the population within a three- and five-mile radius contained 155,036 and 355,808 people, respectively, with a median household income of $54,153 and $51,771, respectively, as of 2016.
THE INFORMATION IN THIS STRUCTURAL AND COLLATERAL TERM SHEET IS NOT COMPLETE AND MAY BE AMENDED PRIOR TO THE TIME OF SALE. THIS TERM SHEET IS NOT AN OFFER TO SELL THESE SECURITIES AND IT IS NOT A SOLICITATION OF AN OFFER TO BUY THESE SECURITIES IN ANY JURISDICTION WHERE THE OFFER OR SALE IS NOT PERMITTED.
| 93 of 139 | |
| Structural and Collateral Term Sheet | JPMDB 2017-C5 |
| Dallas Design District | |
| Market Rent Summary | ||
| Category | Underwritten Rent(1) | Appraisal Rent(2) |
| Showroom <20k Square Feet | $17 | $23 |
| Showroom >20k Square Feet | $15 | $18 |
| Collection Space | $24 | $19 |
| Showroom/Retail | $34 | $35 |
| Mezz/Rear | $6 | $9 |
| Restaurant | $30 | $34 |
| (1) | Based on the underwritten rent roll dated December 28, 2016 and includes rent steps through January 2018. |
| (2) | Weighted average of the appraisal concluded rent per square foot for each of the categories. |
| Historical and Current Occupancy(1) | |||
| 2013 | 2014 | 2015 | Current(2) |
| 89.6% | 86.7% | 89.6% | 98.7% |
| (1) | Historical Occupancies are as of December 31 of each respective year. |
| (2) | Current Occupancy is as of December 28, 2016. |
| Tenant Summary(1) | ||||||
| Tenant | Ratings Moody’s/S&P/Fitch | Net Rentable Area (SF) | % of Total NRA | Base Rent PSF | % of Total Base Rent | Lease Expiration Date |
| Regulus Group LLC(2) | NA / NA / NA | 44,345 | 6.1% | $11.50 | 4.1% | 3/31/2017 |
| Walter Lee Culp Associates, Inc. | NA / NA / NA | 30,650 | 4.2% | $13.41 | 3.3% | 10/31/2028 |
| David Sutherland, Inc.(3) | NA / NA / NA | 29,937 | 4.1% | $12.50 | 3.0% | 5/31/2023 |
| Interior Design Collections, Ltd. | NA / NA / NA | 24,651 | 3.4% | $16.99 | 3.4% | 6/30/2026 |
| E.C. Dicken, Inc. | NA / NA / NA | 23,083 | 3.2% | $13.75 | 2.6% | 5/31/2020 |
| George Cameron Nash, Inc. | NA / NA / NA | 21,305 | 2.9% | $20.09 | 3.5% | 12/31/2025 |
| Baker, Knapp & Tubbs, Inc./Kohler Interior | NA / NA / NA | 20,800 | 2.9% | $13.04 | 2.2% | 1/31/2018 |
| Scott + Cooner, Inc. | NA / NA / NA | 20,079 | 2.8% | $17.50 | 2.9% | 8/31/2019 |
| The Robert Allen Group, Inc. | NA / NA / NA | 16,940 | 2.3% | $15.45 | 2.1% | 10/31/2017 |
| Morrison Supply Co. | NA / NA / NA | 16,433 | 2.3% | $10.71 | 1.4% | 6/10/2024 |
| (1) | Based on the underwritten rent roll dated December 28, 2016 and includes rent steps through January 2018. |
| (2) | According to the loan sponsors, Regulus Group LLC has a lease out for signature that will extend the term of its lease until September 30, 2017. The loan sponsors are in discussions with four potential tenants to backfill the space at rents approximately 25% higher than the rent currently paid by Regulus Group LLC. |
| (3) | David Sutherland, Inc. has the right to terminate its lease on June 1, 2018, with 12 months’ notice and the payment of a termination fee. |
| Lease Rollover Schedule(1) | |||||||||
| Year | Number of Leases Expiring | Net Rentable Area Expiring | % of NRA Expiring | Base Rent Expiring | % of Base Rent Expiring | Cumulative Net Rentable Area Expiring | Cumulative % of NRA Expiring | Cumulative Base Rent Expiring | Cumulative % of Base Rent Expiring |
| Vacant | NAP | 9,165 | 1.3% | NAP | NAP | 9,165 | 1.3% | NAP | NAP |
| 2017 & MTM | 9 | 92,618 | 12.7 | $1,431,094 | 11.6% | 101,783 | 14.0% | $1,431,094 | 11.6% |
| 2018 | 16 | 94,455 | 13.0 | $1,466,513 | 11.9 | 196,238 | 26.9% | $2,897,607 | 23.5% |
| 2019 | 20 | 107,321 | 14.7 | $1,853,564 | 15.0 | 303,559 | 41.7% | $4,751,171 | 38.5% |
| 2020 | 8 | 64,001 | 8.8 | $1,091,760 | 8.9 | 367,560 | 50.5% | $5,842,931 | 47.4% |
| 2021 | 11 | 53,826 | 7.4 | $1,145,051 | 9.3 | 421,386 | 57.8% | $6,987,982 | 56.7% |
| 2022 | 6 | 15,114 | 2.1 | $345,933 | 2.8 | 436,500 | 59.9% | $7,333,915 | 59.5% |
| 2023 | 9 | 80,915 | 11.1 | $1,268,392 | 10.3 | 517,415 | 71.0% | $8,602,307 | 69.8% |
| 2024 | 4 | 39,179 | 5.4 | $566,300 | 4.6 | 556,594 | 76.4% | $9,168,607 | 74.4% |
| 2025 | 5 | 60,726 | 8.3 | $1,007,427 | 8.2 | 617,320 | 84.7% | $10,176,034 | 82.6% |
| 2026 | 9 | 62,121 | 8.5 | $1,411,699 | 11.5 | 679,441 | 93.3% | $11,587,733 | 94.0% |
| 2027 | 2 | 18,361 | 2.5 | $327,039 | 2.7 | 697,802 | 95.8% | $11,914,772 | 96.7% |
| 2028 & Beyond | 1 | 30,650 | 4.2 | $410,866 | 3.3 | 728,452 | 100.0% | $12,325,638 | 100.0% |
| Total | 100 | 728,452 | 100.0% | $12,325,638 | 100.0% | ||||
| (1) | Based on the underwritten rent roll dated December 28, 2016 and includes rent steps through January 2018. |
THE INFORMATION IN THIS STRUCTURAL AND COLLATERAL TERM SHEET IS NOT COMPLETE AND MAY BE AMENDED PRIOR TO THE TIME OF SALE. THIS TERM SHEET IS NOT AN OFFER TO SELL THESE SECURITIES AND IT IS NOT A SOLICITATION OF AN OFFER TO BUY THESE SECURITIES IN ANY JURISDICTION WHERE THE OFFER OR SALE IS NOT PERMITTED.
| 94 of 139 | |
| Structural and Collateral Term Sheet | JPMDB 2017-C5 |
| Dallas Design District | |
| Operating History and Underwritten Net Cash Flow | |||||||
| 2013 | 2014 | 2015 | TTM(1) | Underwritten | Per Square Foot | %(2) | |
| Rents in Place(3)(4) | $8,960,054 | $9,866,210 | $9,805,348 | $10,552,323 | $12,325,638 | $16.92 | 76.8% |
| Vacant Income | 0 | 0 | 0 | 0 | 147,998 | 0.20 | 0.9 |
| Gross Potential Rent | $8,960,054 | $9,866,210 | $9,805,348 | $10,552,323 | $12,473,636 | $17.12 | 77.7% |
| CAM Reimbursements | 2,635,957 | 2,937,497 | 2,547,667 | 2,773,769 | 3,279,365 | 4.50 | 20.4 |
| Percentage Rent | 127,620 | 208,806 | 200,877 | 266,763 | 293,987 | 0.40 | 1.8 |
| Net Rental Income | $11,723,632 | $13,012,514 | $12,553,892 | $13,592,854 | $16,046,988 | $22.03 | 100.0% |
| (Vacancy/Credit Loss) | 599 | (39,490) | 0 | 0 | (802,349) | (1.10) | (5.0) |
| Other Income | 38,610 | 83,344 | 52,728 | 80,918 | 60,123 | 0.08 | 0.4 |
| Effective Gross Income | $11,762,840 | $13,056,367 | $12,606,620 | $13,673,772 | $15,304,762 | $21.01 | 95.4% |
| Total Expenses | $4,136,520 | $4,051,248 | $4,108,165 | $4,035,907 | $4,048,471 | $5.56 | 26.5% |
| Net Operating Income | $7,626,320 | $9,005,119 | $8,498,455 | $9,637,865 | $11,256,291 | $15.45 | 73.5% |
| Total TI/LC, Capex/RR | 0 | 0 | 0 | 0 | 1,051,292 | 1.44 | 6.9 |
| Net Cash Flow | $7,626,320 | $9,005,119 | $8,498,455 | $9,637,865 | $10,204,999 | $14.01 | 66.7% |
| (1) | TTM column represents the trailing 12-month period ending September 30, 2016. |
| (2) | % column represents percent of Net Rental Income for all revenue lines and represents percent of Effective Gross Income for the remainder of the fields. |
| (3) | The increase in 2014 Rents in Place from 2013 Rents in Place is primarily a result of new/renewal leases signed at higher rents at 1025 Stemmons, 1250 Slocum, 1617 Hi Line, 1645 Stemmons and 1500 Dragon. |
| (4) | The increase in Underwritten Rents in Place from TTM Rents in Place is primarily due to recent leasing across the properties, along with contractual rent steps taken through January 2018 totaling $425,877. |
Property Management. The property is managed by Dunhill Property Management Services, Inc., an affiliate of the borrowers.
Escrows and Reserves. At origination, the borrowers deposited into escrow $3,278,052 for future tenant improvements and leasing commissions, $1,693,764 for outstanding tenant improvements and leasing commissions related to 11 tenants, $374,106 for a replacement reserve, $320,671 for a free rent reserve related to four tenants $316,270 for a real estate tax reserve, $200,000 for an insurance reserve, $123,125 for a deferred maintenance reserve and $18,076 for a ground rent reserve.
Tax Escrows- On a monthly basis, the borrowers are required to escrow 1/12 of the annual estimated tax payments, which currently equates to $316,270.
Insurance Escrows - The requirement for the borrowers to make monthly deposits to the insurance escrow is waived so long as (i) no event of default exists and (ii) the borrowers provide satisfactory evidence that the properties are insured under an acceptable blanket policy in accordance with the loan documents.
Replacement Reserves - At origination, the borrowers reserved $374,106 for replacement reserves. If the total amount of replacement reserves on deposit decreases below $372,816 during the term of the loan, on a monthly basis, the borrowers are required to escrow $9,106 (approximately $0.13 per square foot annually) for future ongoing replacement reserves. The reserve is subject to a cap of $372,816 (approximately $0.51 per square foot).
TI/LC Reserves - At origination, the borrowers reserved $3,278,052 for tenant improvements and leasing commissions. If the total amount on deposit decreases below $3,278,052 during the term of the loan, on a monthly basis, the borrowers are required to escrow $91,057 for future tenant improvements and leasing commissions. The reserve is subject to a cap of $3,278,052 (approximately $4.50 per square foot).
Lockbox / Cash Management.The Dallas Design District Whole Loan is structured with a hard lockbox and in-place cash management. The borrowers were required within three business days after the establishment of the lockbox account to send tenant direction letters to the tenants at the property instructing them to deposit all rents and payments directly into the lockbox account controlled by the lender. All funds in the lockbox account are swept each business day to a segregated cash management account under the control of the lender and disbursed in accordance with the loan documents. During a Cash Sweep Event (as defined below) all excess cash flow after payment of the debt service, required reserves and operating expenses will be held as additional collateral for the loan. The lender has a first priority security interest in the cash management account.
A “Cash Sweep Event” means (i) the occurrence of an event of default, (ii) the bankruptcy or insolvency action of the borrowers or the property manager, or (iii) a DSCR Trigger Event (as defined below) has occurred and is ongoing.
THE INFORMATION IN THIS STRUCTURAL AND COLLATERAL TERM SHEET IS NOT COMPLETE AND MAY BE AMENDED PRIOR TO THE TIME OF SALE. THIS TERM SHEET IS NOT AN OFFER TO SELL THESE SECURITIES AND IT IS NOT A SOLICITATION OF AN OFFER TO BUY THESE SECURITIES IN ANY JURISDICTION WHERE THE OFFER OR SALE IS NOT PERMITTED.
| 95 of 139 | |
| Structural and Collateral Term Sheet | JPMDB 2017-C5 |
| Dallas Design District | |
A “DSCR Trigger Event” means the trailing three-month debt service coverage ratio as calculated in accordance with the loan documents is less than 1.15x.
A Cash Sweep Event may be cured by the following: if the Cash Sweep Event is caused solely by (a) clause (i) above, the acceptance by the lender of a cure of such event of default, (b) clause (ii) above, only with respect to the property manager, the borrowers replacing such property manager with a qualified manager under a replacement management agreement within 60 days, and (c) clause (iii) above, the debt service coverage ratio for two consecutive quarters based on the trailing three-month period is 1.20x or greater. A Cash Sweep Event cure may occur no more than four times during the term of the loan.
Ground Lease. The property located at 1621 Oak Lawn Avenue is subject to a ground lease, which commenced on December 21, 1952 for a term of 99 years and expires on December 20, 2051 with no renewal options. The annual rent under the ground lease is currently $72,305 and is payable in advance on December 21 of each year during the term of the lease. Annual rent is subject to adjustment on December 21 of every 10th year. The annual rent is adjusted pursuant to the agreement of the parties or pursuant to an appraisal every 10 years. The annual rent is required to be 6.0% of the appraised value of the land (exclusive of improvements and buildings constructed by the borrowers, but including paving, storm sewers, utilities and other improvements constructed by the ground lessor). The appraised value will be determined by three appraisers: one chosen by the borrowers under the ground lease (DD Dunhill 2017 LLC and DE Design Borrower 2017 LLC), one chosen by the ground lessor and one chosen by the other two appraisers (this third appraiser must be a realtor and a qualified member of the Dallas Real Estate Board). The next rent adjustment is expected to occur on December 21, 2017.
THE INFORMATION IN THIS STRUCTURAL AND COLLATERAL TERM SHEET IS NOT COMPLETE AND MAY BE AMENDED PRIOR TO THE TIME OF SALE. THIS TERM SHEET IS NOT AN OFFER TO SELL THESE SECURITIES AND IT IS NOT A SOLICITATION OF AN OFFER TO BUY THESE SECURITIES IN ANY JURISDICTION WHERE THE OFFER OR SALE IS NOT PERMITTED.
| 96 of 139 | |
| Structural and Collateral Term Sheet | JPMDB 2017-C5 |
[THIS PAGE INTENTIONALLY LEFT BLANK]
THE INFORMATION IN THIS STRUCTURAL AND COLLATERAL TERM SHEET IS NOT COMPLETE AND MAY BE AMENDED PRIOR TO THE TIME OF SALE. THIS TERM SHEET IS NOT AN OFFER TO SELL THESE SECURITIES AND IT IS NOT A SOLICITATION OF AN OFFER TO BUY THESE SECURITIES IN ANY JURISDICTION WHERE THE OFFER OR SALE IS NOT PERMITTED.
| 97 of 139 | |
| Structural and Collateral Term Sheet | JPMDB 2017-C5 |
| Moffett Gateway |

THE INFORMATION IN THIS STRUCTURAL AND COLLATERAL TERM SHEET IS NOT COMPLETE AND MAY BE AMENDED PRIOR TO THE TIME OF SALE. THIS TERM SHEET IS NOT AN OFFER TO SELL THESE SECURITIES AND IT IS NOT A SOLICITATION OF AN OFFER TO BUY THESE SECURITIES IN ANY JURISDICTION WHERE THE OFFER OR SALE IS NOT PERMITTED.
| 98 of 139 | |
| Structural and Collateral Term Sheet | JPMDB 2017-C5 |
| Moffett Gateway |
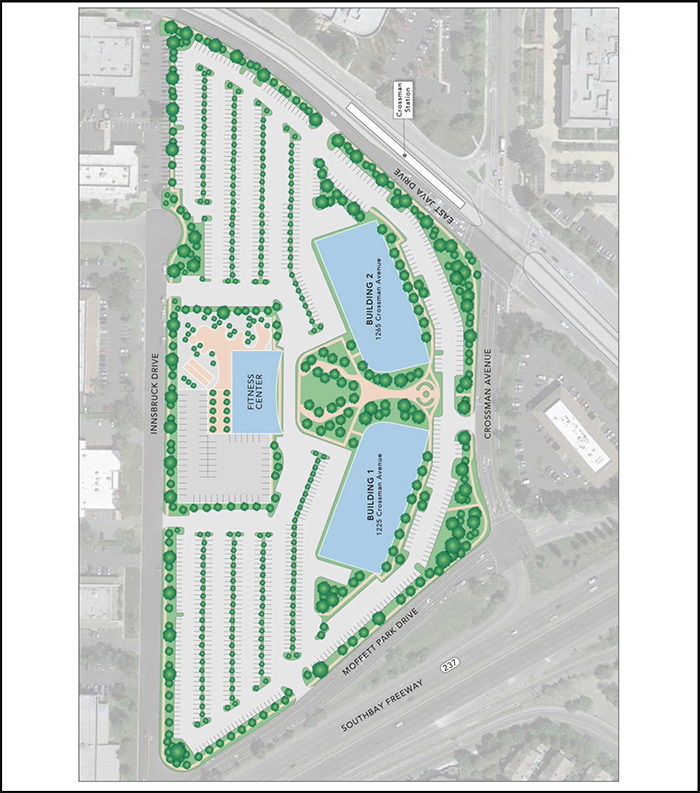
THE INFORMATION IN THIS STRUCTURAL AND COLLATERAL TERM SHEET IS NOT COMPLETE AND MAY BE AMENDED PRIOR TO THE TIME OF SALE. THIS TERM SHEET IS NOT AN OFFER TO SELL THESE SECURITIES AND IT IS NOT A SOLICITATION OF AN OFFER TO BUY THESE SECURITIES IN ANY JURISDICTION WHERE THE OFFER OR SALE IS NOT PERMITTED.
| 99 of 139 | |
| Structural and Collateral Term Sheet | JPMDB 2017-C5 |
| Moffett Gateway |

THE INFORMATION IN THIS STRUCTURAL AND COLLATERAL TERM SHEET IS NOT COMPLETE AND MAY BE AMENDED PRIOR TO THE TIME OF SALE. THIS TERM SHEET IS NOT AN OFFER TO SELL THESE SECURITIES AND IT IS NOT A SOLICITATION OF AN OFFER TO BUY THESE SECURITIES IN ANY JURISDICTION WHERE THE OFFER OR SALE IS NOT PERMITTED.
| 100 of 139 | |
| Structural and Collateral Term Sheet | JPMDB 2017-C5 |
| Moffett Gateway |
| Mortgage Loan Information | Property Information | |||
| Mortgage Loan Seller: | JPMCB | Single Asset / Portfolio: | Single Asset | |
| Credit Assessment (Fitch)(1): | BBB- | Title: | Fee | |
| Original Principal Balance(2): | $40,000,000 | Property Type - Subtype: | Office – Suburban | |
| Cut-off Date Principal Balance(2): | $40,000,000 | Net Rentable Area (SF): | 612,691 | |
| % of Pool by IPB: | 3.8% | Location: | Sunnyvale, CA | |
| Loan Purpose: | Refinance | Year Built / Renovated: | 2016 / N/A | |
| Borrower: | 441 Real Estate LLC | Occupancy(6): | 100.0% | |
| Sponsor(3): | Joseph K. Paul | Occupancy Date: | 3/1/2017 | |
| Interest Rate: | 3.319403% | Number of Tenants: | 1 | |
| Note Date: | 9/22/2016 | 2013 NOI(7): | N/A | |
| Maturity Date: | 4/1/2027 | 2014 NOI(7): | N/A | |
| Interest-only Period: | 60 months | 2015 NOI(7): | N/A | |
| Original Term: | 126 months | TTM NOI(7): | N/A | |
| Original Amortization(4): | 360 months | UW Economic Occupancy: | 95.0% | |
| Amortization Type: | IO-Balloon | UW Revenues: | $35,097,235 | |
| Call Protection(5): | L(29),Def(90),O(7) | UW Expenses: | $6,170,971 | |
| Lockbox / Cash Management: | Hard / In-Place | UW NOI: | $28,926,265 | |
| Additional Debt: | Yes | UW NCF: | $27,631,280 | |
| Additional Debt Balance(2): | $203,000,000 / $102,000,000 / | Appraised Value / Per SF(8): | $525,000,000 / $857 | |
| $50,000,000 | Appraisal Date: | 7/20/2016 | ||
| Additional Debt Type: | Pari Passu / B-Note / | |||
| Mezzanine Loan | ||||
| Escrows and Reserves(9) | Financial Information(2) | |||||||
| Initial | Monthly | Initial Cap | A-Notes | Whole Loan | ||||
| Taxes: | $180,864 | $180,864 | N/A | Cut-off Date Loan / SF: | $397 | $563 | ||
| Insurance: | $0 | Springing | N/A | Maturity Date Loan / SF: | $337 | $503 | ||
| Replacement Reserves: | $0 | $0 | N/A | Cut-off Date LTV(8): | 46.3% | 65.7% | ||
| TI/LC: | $0 | $0 | N/A | Maturity Date LTV(8): | 39.3% | 58.7% | ||
| Other: | $86,961,915 | $0 | N/A | UW NCF DSCR(10): | 1.95x | 1.43x | ||
| UW NOI Debt Yield: | 11.9% | 8.4% | ||||||
| Sources and Uses | ||||||
| Sources | Proceeds | % of Total | Uses | Proceeds | % of Total | |
| A-Notes(2) | $243,000,000 | 61.5% | Payoff Existing Debt | $216,321,083 | 54.8% | |
| B-Note(2) | 102,000,000 | 25.8% | Upfront Reserves | 87,142,779 | 22.1% | |
| Mezzanine Loan | 50,000,000 | 12.7% | Return of Equity | 84,003,847 | 21.3% | |
| Closing Costs | 7,532,290 | 1.9% | ||||
| Total Sources | $395,000,000 | 100.0% | Total Uses | $395,000,000 | 100.0% | |
| (1) | Fitch has confirmed that the Moffett Gateway Mortgage Loan has, in the context of its inclusion in the mortgage pool, credit characteristics consistent with an investment grade obligation. |
| (2) | The Moffett Gateway loan is part of a whole loan evidenced by fivepari passu notes with an aggregate principal balance as of the Cut-off Date of $243.0 million (the “A-Notes”) and a subordinate companion loan (the “B-Note”). The A-Notes Financial Information presented in the chart above reflects the Cut-off Date balance of the A-Notes but excludes the related B-Note and mezzanine loan. The Whole Loan Financial Information presented in the chart above reflects the Cut-off Date balance of the A-Notes and B-Note evidencing the Moffett Gateway Whole Loan, but excludes the related mezzanine loan. |
| (3) | For a full description of Sponsor, please refer to “The Loan Sponsor” below. |
| (4) | The Moffett Gateway A-Notes will amortize in accordance with the amortization schedule set forth in Annex G to the Preliminary Prospectus subsequent to a five-year interest-only period. The principal payments that would otherwise have been paid to the B-Note will be used to pay down the aggregate principal balance of the A-Notes. |
| (5) | The lockout period will be at least 29 payment dates beginning with and including the first payment date of November 1, 2016. Defeasance of the full $345.0 million Moffett Gateway Whole Loan is permitted after the date that is two years from the closing date of the securitization that includes the note to be last securitized (the “REMIC Prohibition Period”). If the REMIC Prohibition Period has not expired by November 1, 2020, the borrower is permitted to prepay the Moffett Gateway Whole Loan in whole, but not in part, with the payment of a yield maintenance premium. |
| (6) | The property is 100.0% leased to Google Inc. (“Google”) through March 2027. Google has executed two leases for the property but is not yet in occupancy of either space. Google leases the property under two separate leases, one for 1225 Crossman Avenue (“Building One”) and the second for 1265 Crossman Avenue (“Building Two”). Google is expected to take occupancy for both spaces by September 2017 and, subsequent to any applicable free rent periods, is required to begin paying full rent as applicable under each lease as follows: Building One in July 2018 and Building Two in July 2017. |
| (7) | Historical cash flows are not available as the property was constructed in 2016. |
THE INFORMATION IN THIS STRUCTURAL AND COLLATERAL TERM SHEET IS NOT COMPLETE AND MAY BE AMENDED PRIOR TO THE TIME OF SALE. THIS TERM SHEET IS NOT AN OFFER TO SELL THESE SECURITIES AND IT IS NOT A SOLICITATION OF AN OFFER TO BUY THESE SECURITIES IN ANY JURISDICTION WHERE THE OFFER OR SALE IS NOT PERMITTED.
| 101 of 139 | |
| Structural and Collateral Term Sheet | JPMDB 2017-C5 |
| Moffett Gateway |
(8)
| The Appraised Value / Per SF, Cut-off Date LTV and Maturity Date LTV are calculated based on the “hypothetical market value as stabilized”, which assumes that all tenant improvement construction is complete and that all contractual free rent has “burned off” at the “stabilized” value date. At origination, the borrower reserved approximately $87.0 million for unfunded obligations (approximately $49.4 million for outstanding tenant improvements and leasing commissions and approximately $37.6 million for free rent). The “as-is” value as of July 20, 2016 is $430.0 million, which results in a Cut-off Date LTV and Maturity Date LTV of 56.5% and 48.0%, respectively, and a Whole Loan Cut-off Date LTV and Maturity Date LTV of 80.2% and 71.7%, respectively. |
| (9) | For a full description of Escrows and Reserves, please refer to “Escrows and Reserves” below. |
| (10) | The UW NCF DSCR is calculated using the sum of principal and interest payments over the first 12 months following the expiration of the interest-only period based on the assumed principal payment schedule provided on Annex G to the Preliminary Prospectus. |
The Loan.The Moffett Gateway loan is secured by a first mortgage lien on the borrower’s fee interest in a newly constructed corporate office campus consisting of two seven-story towers, an amenities building and a parking garage, located in Sunnyvale, California. The whole loan has an outstanding principal balance as of the Cut-off Date of $345.0 million (the “Moffett Gateway Whole Loan”) and is comprised of fivepari passusenior notes, each as described below, with an aggregate outstanding principal balance as of the Cut-off Date of $243.0 million (collectively, the “Moffett Gateway A-Notes”) and a subordinate B-Note with an outstanding principal balance as of the Cut-off Date of $102.0 million (the “Moffett Gateway Subordinate Companion Loan”), each as described below. Note A-3, with an outstanding principal balance as of the Cut-off Date of $40.0 million, is being contributed to the JPMDB 2017-C5 Trust (the “Moffett Gateway Mortgage Loan”). Note A-4, with an outstanding principal balance as of the Cut-off Date of $20.0 million, is expected to be contributed to one or more future securitization trust(s). Note A-1 with an outstanding principal balances as of the Cut-off Date of $80.0 million is expected to be contributed to the JPMCC 2017-JP5 trust, Note A-2, with an outstanding principal balance as of the Cut-off Date of $60.0 million, was contributed to the JPMCC 2016-JP4 trust and Note A-5, with an outstanding principal balance as of the Cut-off Date of $43.0, million was contributed to the JPMDB 2016-C4 trust (together, with Note A-4, the “Moffett Gateway Pari Passu Companion Loans”). The Moffett Gateway Subordinate Companion Loan has been sold to a third party investor. Under the related intercreditor agreement, prior to a control appraisal period with respect to the Moffett Gateway Subordinate Companion Loan, under certain circumstances, the holder of the Moffett Gateway Subordinate Companion Loan will have the right to approve certain major decisions with respect to the Moffett Gateway Whole Loan, to exercise certain cure rights and to replace the related special servicer with or without cause. The holder of the Moffett Gateway Subordinate Companion Loan will also have the right to purchase the Moffett Gateway A-Notes under certain circumstances. After the occurrence and during the continuance of a control appraisal period with respect to the Moffett Gateway Subordinate Companion Loan, the holder of Note A-2 will be entitled to exercise the rights of the controlling noteholder for the Moffett Gateway Whole Loan, which rights will be exercised by the related trustee (or, prior to the occurrence and continuance of a control termination event under the related pooling and servicing agreement, by the related directing certificateholder); however, the holders of the Moffett Gateway Pari Passu Companion Loans will be entitled, under certain circumstances, to be consulted with respect to certain major decisions. The Moffett Gateway Whole Loan has a 10-year, six-month term and, subsequent to a five-year interest-only period, the Moffett Gateway A-Notes will amortize in accordance with the amortization schedule set forth on Annex G to the Preliminary Prospectus. The principal payments that would otherwise have been paid to the Moffett Gateway Subordinate Companion Loan are included as part of the scheduled amortization of the Moffett Gateway A-Notes.
| Whole Loan Summary | ||||||
| Note | Original Balance | Cut-off Date Balance | Note Holder(1) | Controlling Piece | ||
| A-1 | $80,000,000 | $80,000,000 | JPMCB | No | ||
| A-2 | 60,000,000 | 60,000,000 | JPMCC 2016-JP4 | No | ||
| A-3 | 40,000,000 | 40,000,000 | JPMDB 2017-C5 | No | ||
| A-4 | 20,000,000 | 20,000,000 | JPMCB | No | ||
| A-5 | 43,000,000 | 43,000,000 | JPMDB 2016-C4 | No | ||
| B-1 | 102,000,000 | 102,000,000 | Third Party Investor | Yes | ||
| Total | $345,000,000 | $345,000,000 | ||||
| (1) | The non-controlling Note A-1 is currently held by JPMCB and is expected to be contributed to the JPMCC 2017-JP5 trust |
The Borrower. The borrowing entity for the Moffett Gateway Whole Loan is 441 Real Estate LLC, a Delaware limited liability company and special purpose entity.
The Loan Sponsor. The loan sponsor is Joseph K. Paul (“Jay Paul”) and the nonrecourse carve-out guarantors are Jay Paul, Jay Paul Revocable Living Trust Dated November 9, 1999, as Amended and Restated on March 19, 2010, and Paul Guarantor LLC, a Delaware limited liability company. Jay Paul is the founder of the Jay Paul Company. The Jay Paul Company is an owner and developer of commercial office properties throughout California. Founded in 1975, the Jay Paul Company has developed or acquired over 8.5 million square feet of office space, including 21 buildings in Moffett Park totaling 5.0 million square feet. Jay Paul Company has built projects for many notable companies including Apple, Google, Amazon, Motorola, Microsoft, Boeing, Philips Electronics, HP and DreamWorks, among others. The loan sponsor focuses on sustainable design and has closed in excess of $12.0 billion in equity and debt financings since inception. The borrower is permitted to obtain the release of Jay Paul and the trust from the guaranty and environmental indemnity upon satisfaction of certain conditions in the loan documents, which include, without limitation, Paul Guarantor LLC maintaining a net worth of not less than $300.0 million and liquidity of not less than $20.0 million.
THE INFORMATION IN THIS STRUCTURAL AND COLLATERAL TERM SHEET IS NOT COMPLETE AND MAY BE AMENDED PRIOR TO THE TIME OF SALE. THIS TERM SHEET IS NOT AN OFFER TO SELL THESE SECURITIES AND IT IS NOT A SOLICITATION OF AN OFFER TO BUY THESE SECURITIES IN ANY JURISDICTION WHERE THE OFFER OR SALE IS NOT PERMITTED.
| 102 of 139 | |
| Structural and Collateral Term Sheet | JPMDB 2017-C5 |
| Moffett Gateway |
The loan sponsor purchased the land and previous buildings in 2012 for approximately $50.4 million and, according to the loan sponsor, has spent approximately $182.5 million ($298 per square foot) on the development of the Moffett Gateway office complex. Additionally, the loan sponsor has indicated it spent approximately $55.1 million ($90 per square foot) in tenant improvement and leasing commission costs. The loan sponsor’s total cost basis is approximately $336.1 million ($549 per square foot).
The Property. The Moffett Gateway property is comprised of two newly-constructed seven-story Class A LEED Platinum-Certified towers totaling 597,848 square feet and is located in Sunnyvale, California. The property is situated on approximately 15.5 acres and features a 14,843 square foot amenities building, which contains a fitness center with locker rooms, showers, steam rooms and a yoga studio, a rooftop dining area, bocce court area and common and recreation areas. Additionally, the property contains 2,022 parking spaces resulting in a parking ratio of approximately 3.3 spaces per 1,000 square feet of space. The property benefits from its location at the intersection of Highways 237 and 101, two regional highway systems that provide direct access to the surrounding areas as well as the San Francisco central business district, located approximately 38.4 miles north of the property. The property is part of the larger Moffett Park development, a 519-acre area comprised of recently developed office spaces and research and development buildings. Additionally, a Santa Clara Light Rail System is located adjacent to the property, which provides service to the surrounding residential communities. The Santa Clara County Transit System provides bus service county-wide and has four stops nearby the property.
As of March 1, 2017, the property is 100.0% leased to Google pursuant to two separate 298,924 square foot triple net leases through March 31, 2027 for Building One and Building Two, each with two seven-year extension options and no early termination options. Google does not directly lease the amenities building from the landlord. Instead, Google’s right to use the amenities building is contained within each individual lease. Google’s right to use the amenities building is exclusive during any period when Google leases both office buildings and is non-exclusive for any period of time that an additional tenant leases space at the property in the future. Additionally, the amenities building, which includes the parking structure, is part of the common areas which are owned in fee simple by an owners association, which is wholly owned by the borrower. The borrower has pledged the ownership interests in the owner’s association as collateral for the Moffett Gateway Whole Loan.
Google’s main headquarters in Mountain View, California is located approximately 6.4 miles west of the property. On October 2, 2015, Google implemented a holding company reorganization in which Alphabet became the successor issuer to Google. At that time, Alphabet recognized the assets and liabilities of Google at carryover basis. Alphabet, through its subsidiaries, provides online advertising services in the United States, the United Kingdom and rest of the world. Alphabet is the second largest publicly traded company (NASDAQ: GOOG) in the world as measured by market capitalization and is rated Aa2 and AA by Moody’s and S&P, respectively. Google represents approximately 99.4% of Alphabet’s total revenues, based on Alphabet’s 2015 annual report.
The property is located in the Sunnyvale office submarket. The submarket features one of the highest concentrations of technology, software and creative tenants within Silicon Valley. Moffett Gateway is located along Moffett Park Avenue, a part of the larger Moffett Park development, which is a 519-acre area comprised of recently developed office spaces and research and development buildings. Moffett Park is home to several notable technology firms including Amazon.com, Google, Hewlett-Packard, Juniper Networks, Lockheed Martin, Microsoft, and Yahoo!. Google owns or leases approximately 3.5 million square feet of office space in Sunnyvale, making it the largest corporate occupier in the submarket. Additionally, Google collectively owns or leases approximately 15.1 million square feet in Silicon Valley and the greater San Francisco area. As of the second quarter of 2016, the Sunnyvale market had a Class A office inventory of approximately 8.9 million square feet with an overall vacancy rate of 8.8% and annual asking rents between $43.80 and $45.60 per square foot on a triple-net basis.
| Historical and Current Occupancy(1) | |||
| 2013 | 2014 | 2015 | Current(2) |
| N/A | N/A | N/A | 100.0% |
| (1) | Historical Occupancy is not available as the property was constructed in 2016. |
| (2) | Current Occupancy is as of March 1, 2017. The property is 100.0% leased to Google through March 2027. Google has executed two leases for the property but is not yet in occupancy of either space. Google leases the property under two separate leases, one for Building One and the second for Building Two. Google is expected to take occupancy by September 2017 and, subsequent to any applicable free rent periods, is required to begin paying full rent at Building One in July 2018 and full rent at Building Two in July 2017. At origination, the borrower reserved approximately $87.0 million for unfunded obligations (approximately $49.4 million for outstanding tenant improvements and leasing commissions and approximately $37.6 million for free rent). |
THE INFORMATION IN THIS STRUCTURAL AND COLLATERAL TERM SHEET IS NOT COMPLETE AND MAY BE AMENDED PRIOR TO THE TIME OF SALE. THIS TERM SHEET IS NOT AN OFFER TO SELL THESE SECURITIES AND IT IS NOT A SOLICITATION OF AN OFFER TO BUY THESE SECURITIES IN ANY JURISDICTION WHERE THE OFFER OR SALE IS NOT PERMITTED.
| 103 of 139 | |
| Structural and Collateral Term Sheet | JPMDB 2017-C5 |
| Moffett Gateway |
| Tenant Summary(1) | ||||||
| Tenant | Ratings(2) Moody’s/S&P/Fitch | Net Rentable Area (SF) | % of Total NRA | Base Rent PSF(3) | % of Total Base Rent | Lease Expiration Date |
| Google(4) | Aa2 / AA / NA | 612,691 | 100.0% | $50.87 | 100.0% | 3/31/2027 |
| (1) | Based on the underwritten rent roll. |
| (2) | Ratings provided are for the parent company of the entity listed in the “Tenant” field whether or not the parent company guarantees the lease. |
| (3) | Base Rent PSF includes the 14,843 square foot amenities building, for which approximately $785,298 of base rent has been underwritten. Google’s right to use the amenities building is exclusive during any period when Google leases both office buildings and is non-exclusive for any additional tenant that may sign a lease at the property in the future. |
| (4) | Google has two seven-year renewal options remaining for each lease. Google must provide notice of its intention to renew no earlier than January 2026 or later than June 2026. |
| Lease Rollover Schedule(1) | |||||||||
| Year | Number of Leases Expiring | Net Rentable Area Expiring | % of NRA Expiring | Base Rent Expiring | % of Base Rent Expiring | Cumulative Net Rentable Area Expiring | Cumulative % of NRA Expiring | Cumulative Base Rent Expiring | Cumulative % of Base Rent Expiring |
| Vacant | NAP | 0 | 0.0% | NAP | NAP | 0 | 0.0% | NAP | NAP |
| 2017 & MTM | 0 | 0 | 0.0% | $0 | 0.0% | 0 | 0.0% | $0 | 0.0% |
| 2018 | 0 | 0 | 0.0% | 0 | 0.0% | 0 | 0.0% | $0 | 0.0% |
| 2019 | 0 | 0 | 0.0% | 0 | 0.0% | 0 | 0.0% | $0 | 0.0% |
| 2020 | 0 | 0 | 0.0% | 0 | 0.0% | 0 | 0.0% | $0 | 0.0% |
| 2021 | 0 | 0 | 0.0% | 0 | 0.0% | 0 | 0.0% | $0 | 0.0% |
| 2022 | 0 | 0 | 0.0% | 0 | 0.0% | 0 | 0.0% | $0 | 0.0% |
| 2023 | 0 | 0 | 0.0% | 0 | 0.0% | 0 | 0.0% | $0 | 0.0% |
| 2024 | 0 | 0 | 0.0% | 0 | 0.0% | 0 | 0.0% | $0 | 0.0% |
| 2025 | 0 | 0 | 0.0% | 0 | 0.0% | 0 | 0.0% | $0 | 0.0% |
| 2026 | 0 | 0 | 0.0% | 0 | 0.0% | 0 | 0.0% | $0 | 0.0% |
| 2027 | 2 | 612,691 | 100.0% | 31,169,318 | 100.0% | 612,691 | 100.0% | $31,169,318 | 100.0% |
| 2028 & Beyond | 0 | 0 | 0.0% | 0 | 0.0% | 612,691 | 100.0% | $31,169,318 | 100.0% |
| Total | 2 | 612,691 | 100.0% | $31,169,318 | 100.0% | ||||
| (1) | Based on the underwritten rent roll. |
| Google Rent Schedule | ||||||
| Period | Building One Base Rent per Year | Building One Base Rent per Year PSF | Building Two Base Rent per Year | Building Two Base Rent per Year PSF | Cumulative Base Rent per Year | Cumulative Base Rent per Year PSF |
| Months 1 – 10(1) | $0 | $0.00 | $0 | $0.00 | $0 | $0.00 |
| Months 11 – 22(1) | 0 | 0.00 | 12,232,568 | 20.46 | 12,232,568 | 20.46 |
| Months 23 – 34 | 12,599,545 | 21.07 | 13,738,744 | 22.98 | 26,338,289 | 44.06 |
| Months 35 – 46 | 14,150,907 | 23.67 | 14,150,907 | 23.67 | 28,301,813 | 47.34 |
| Months 47 – 58 | 14,575,434 | 24.38 | 14,575,434 | 24.38 | 29,150,868 | 48.76 |
| Months 59 – 70 | 15,012,697 | 25.11 | 15,012,697 | 25.11 | 30,025,394 | 50.22 |
| Months 71 – 82 | 15,463,078 | 25.86 | 15,463,078 | 25.86 | 30,926,156 | 51.73 |
| Months 83 – 94 | 15,926,970 | 26.64 | 15,926,970 | 26.64 | 31,853,940 | 53.28 |
| Months 95 – 106 | 16,404,779 | 27.44 | 16,404,779 | 27.44 | 32,809,559 | 54.88 |
| Months 107 – 118 | 16,896,923 | 28.26 | 16,896,923 | 28.26 | 33,793,845 | 56.53 |
| Months 119 – 128 | 14,431,037 | 24.14 | 14,431,037 | 24.14 | 28,862,073 | 48.28 |
| Total/Wtd. Avg.(2) | $135,461,369 | $25.34 | $148,833,136 | $25.09 | $284,294,505 | $49.53 |
| (1) | The property is 100.0% leased to Google through March 2027. Google has executed two leases for the property but is not yet in occupancy of either space. Google leases the property under two separate leases, one for Building One and the second for Building Two. Google is expected to take occupancy by September 2017 and, after any applicable free rent periods, is required to begin paying full rent as applicable under each lease as follows: Building One in July 2018 and Building Two in July 2017. At origination, the borrower reserved approximately $87.0 million for unfunded obligations (approximately $49.4 million for outstanding tenant improvements and leasing commissions and approximately $37.6 million for free rent). |
| (2) | The Total/Wtd. Avg. Base Rent and PSF numbers exclude the 14,843 square foot amenities building, for which approximately $785,298 of base rent has been underwritten. Google’s right to use the amenities building is exclusive during any period when Google leases both office buildings and is non-exclusive for any period of time an additional tenant leases space at the property in the future. |
THE INFORMATION IN THIS STRUCTURAL AND COLLATERAL TERM SHEET IS NOT COMPLETE AND MAY BE AMENDED PRIOR TO THE TIME OF SALE. THIS TERM SHEET IS NOT AN OFFER TO SELL THESE SECURITIES AND IT IS NOT A SOLICITATION OF AN OFFER TO BUY THESE SECURITIES IN ANY JURISDICTION WHERE THE OFFER OR SALE IS NOT PERMITTED.
| 104 of 139 | |
| Structural and Collateral Term Sheet | JPMDB 2017-C5 |
| Moffett Gateway |
Proforma and Underwritten Net Cash Flow
| ||||||
Proforma | Proforma | Proforma | Underwritten | Per Square | %(1) | |
| Rents in Place(2) | $3,318,057 | $17,393,064 | $28,439,878 | $31,169,318 | $50.87 | 84.4% |
| Vacant Income | 0 | 0 | 0 | 0 | 0.00 | 0.0% |
| Gross Potential Rent | $3,318,057 | $17,393,064 | $28,439,878 | $31,169,318 | $50.87 | 84.4% |
| Total Reimbursements | 4,112,410 | 6,072,471 | 6,503,937 | 5,775,140 | 9.43 | 15.6% |
| Net Rental Income | $7,430,467 | $23,465,535 | $34,943,815 | $36,944,458 | $60.30 | 100.0% |
| (Vacancy/Credit Loss) | 0 | 0 | 0 | (1,847,223) | (3.01) | (5.0)- |
| Other Income | 0 | 0 | 0 | 0 | 0.00 | 0.0% |
| Effective Gross Income | $7,430,467 | $23,465,535 | $34,943,815 | $35,097,235 | $57.28 | 95.0% |
| Total Expenses | $5,583,716 | $6,204,727 | $6,692,827 | $6,170,971 | $10.07 | 17.6% |
| Net Operating Income | $1,846,751 | $17,260,808 | $28,250,988 | $28,926,265 | $47.21 | 82.4% |
| Total TI/LC, Capex/RR | 0 | 0 | 0 | 1,294,985 | 2.11 | 3.7% |
| Net Cash Flow | $1,846,751 | $17,260,808 | $28,250,988 | $27,631,280 | $45.10 | 78.7% |
| (1) | % column represents percent of Net Rental Income for all revenue lines and represents percent of Effective Gross Income for the remainder of fields. |
| (2) | The property is 100.0% leased to Google through March 2027. Google has executed two leases for the property but is not yet in occupancy of either space. Google leases the property under two separate leases, one for Building One and the second for Building Two. Google is expected to take occupancy by September 2017 and, after any applicable free rent periods, is required to begin paying full rent as applicable under each lease as follows: Building One in July 2018 and Building Two in July 2017. At origination, the borrower reserved approximately $87.0 million for unfunded obligations (approximately $49.4 million for outstanding tenant improvements and leasing commissions and approximately $37.6 million for free rent). |
Property Management. The property is subject to a management agreement with Paul Holdings, Inc., an affiliate of the loan sponsor.
Escrows and Reserves. At origination, the borrower deposited into escrow approximately $87.0 million for unfunded obligations (which included approximately $49.4 million for outstanding tenant improvements and leasing commissions and approximately $37.6 million for free rent reserves) and $180,864 for tax reserves.
Tax Escrows- On a monthly basis, the borrower is required to escrow 1/12 of the annual estimated tax payments, which currently equates to $180,864.
Insurance Escrows- The requirement for the borrower to make monthly deposits to the insurance escrow is waived so long as (i) no event of default exists and (ii) the borrower provides satisfactory evidence that the property is insured under an acceptable blanket policy in accordance with the loan documents.
Lockbox / Cash Management.The loan is structured with a hard lockbox and in-place cash management. The borrower was required to send tenant direction letters to all tenants upon the origination of the loan instructing them to deposit all rents and payments directly into the lockbox account controlled by the lender. All funds in the lockbox account are swept each business day to a segregated cash management account under the control of the lender and disbursed on each payment date during the term of the loan in accordance with the loan documents. During a Cash Sweep Period (as defined below), all excess cash flow after payment of the mortgage debt service, required reserves, operating expenses and mezzanine debt service will be held as additional collateral for the loan. The lender has a first priority security interest in the cash management account.
A “Cash Sweep Period” means the period after the occurrence of (i) an event of default, (ii) any bankruptcy action of the borrower or manager (if, with respect to the manager only, such bankruptcy action is not discharged, stayed or dismissed within 30 days), (iii) the date on which the debt service coverage ratio (as calculated in the loan documents), based on trailing three-months is less than 1.10x (including aggregate debt service for the Moffett Gateway A-Notes, Moffett Gateway Subordinate Companion Loan and mezzanine loan) or (iv) any of the following: (a) the earlier of (1) the payment date in August 2024, (2) a notification by Google of its intention to not renew its leases or (3) any failure to renew the Google leases in accordance with their terms (a “Maturity Trigger”), (b) the date on which the long term unsecured debt rating of Google or its parent company is not rated by two rating agencies, is withdrawn by two rating agencies or is downgraded to or below BBB- (or its equivalent) by two rating agencies (a “Downgrade Trigger”), (c) any default by Google under its leases (a “Default Trigger”), (d) any bankruptcy or insolvency action by Google or any party providing a guaranty or credit support for the leases (a “Tenant Bankruptcy Trigger”), or (e) Google gives notice that it intends to terminate its leases or any termination or cancellation of the leases (a “Termination Trigger”) (any of the foregoing in subpart (iv), a “Specified Tenant Trigger”).
THE INFORMATION IN THIS STRUCTURAL AND COLLATERAL TERM SHEET IS NOT COMPLETE AND MAY BE AMENDED PRIOR TO THE TIME OF SALE. THIS TERM SHEET IS NOT AN OFFER TO SELL THESE SECURITIES AND IT IS NOT A SOLICITATION OF AN OFFER TO BUY THESE SECURITIES IN ANY JURISDICTION WHERE THE OFFER OR SALE IS NOT PERMITTED.
| 105 of 139 | |
| Structural and Collateral Term Sheet | JPMDB 2017-C5 |
| Moffett Gateway |
The borrower has the right to cure a Cash Sweep Period by, if caused by (a) clause (i) above, the acceptance of a cure by the lender of the applicable event of default (in its sole and absolute discretion), (b) clause (ii) above solely with respect to the manager, the replacement of such manager with a qualified manager under a management agreement acceptable to the lender within 60 days (or, if such bankruptcy action was involuntary and the manager or borrower did not consent to or solicit or collude with the party filing such action, upon the same being discharged, stayed or dismissed within 60 days), (c) clause (ii) above solely with respect to the borrower if the bankruptcy action was involuntary and the borrower, guarantor or any affiliate did not consent to or solicit or collude with the party filing such action, upon the same not being discharged, stayed or dismissed within 60 days, (d) clause (iii) above, the achievement of a debt service coverage ratio for two consecutive quarters of at least 1.10x on a trailing three-month basis, (e) a Maturity Trigger, Google renewing both of its leases in accordance with the loan documents and paying full unabated rent without any right of offset or free rent credit or outstanding tenant improvement obligations in accordance with the loan documents, (f) a Downgrade Trigger, the initiation or reinstatement by Fitch, Moody’s and S&P, of the applicable rating required under the loan documents, (g) a Default Trigger, Google has cured all defaults and is paying full unabated rent without any right of offset or free rent credit or outstanding tenant improvement obligations (unless the tenant is rated at least BBB- (or its equivalent) by Fitch, Moody’s and S&P and the borrower reserves for such amounts in accordance with the loan documents), (h) a Tenant Bankruptcy Trigger, the bankruptcy action is dismissed pursuant to a final, non-appealable order and Google is paying full unabated rent without any right of offset or free rent credit or outstanding tenant improvement obligations (unless the tenant is rated at least BBB- (or its equivalent) by Fitch, Moody’s and S&P and the borrower reserves for such amounts in accordance with the loan documents), or (i) a Termination Trigger, Google has revoked or rescinded all termination or cancellation notices with respect to the lease(s) and has re-affirmed each lease as being in full force and effect and is paying full unabated rent without any right of offset or free rent credit or outstanding tenant improvement obligations (unless the tenant is rated at least BBB- (or its equivalent) by Fitch, Moody’s and S&P and the borrower reserves for such amounts in accordance with the loan documents). The borrower may also cure a Default Trigger, a Tenant Bankruptcy Trigger or a Termination Trigger by re-leasing the space leased by Google to a replacement tenant in accordance with the loan documents. In no event will the borrower have the right to cure a Cash Sweep Period caused by the borrower’s voluntary bankruptcy or insolvency, and the borrower is limited to curing a Cash Sweep Period caused by an event of default, a Default Trigger, a Downgrade Trigger, a Tenant Bankruptcy Trigger or a Termination Trigger to no more than three times during the term of the loan.
Additional Debt. There is a $102.0 million Moffett Gateway Subordinate Companion Loan and a $50.0 million mezzanine loan, both coterminous with the Moffett Gateway A-Notes. The Moffett Gateway Subordinate Companion Loan and the mezzanine loan have each been sold to separate third party investors. The Moffett Gateway Subordinate Companion Loan has a 5.00000% coupon and is interest only for the entire term. All principal payments on the Moffett Gateway Whole Loan once amortization begins after the expiration of the interest-only period will be applied to the Moffett Gateway A-Notes, which will cause hyper-amortization of the Moffett Gateway A-Notes. The mezzanine loan has a 6.35000% coupon and is interest only for the full term of the loan. Including the Moffett Gateway Subordinate Companion Loan and mezzanine loan, the cumulative Cut-off Date LTV, cumulative UW NCF DSCR and cumulative UW NOI Debt Yield are 75.2%, 1.22x and 7.3%, respectively. The mortgage and mezzanine lenders have entered into an intercreditor agreement.
Partial Release. The borrower is permitted to release Building One or Building Two from the lien of the security instrument through a partial defeasance of the Moffett Gateway Whole Loan at any time after the expiration of the lockout period if, among other conditions, (i) no event of default has occurred and is continuing, (ii) the borrower defeases a portion of the Moffett Gateway Whole Loan in an amount equal to (a) the allocated loan amount for the applicable building (which is $170.0 million for each building with respect to the Moffett Gateway Whole Loan and $27.5 million for each building with respect to the mezzanine loan) plus (b) if the Google Tenancy Condition (as defined below) is not satisfied, 25% of the allocated loan amount, (iii) after giving effect to the release, the debt service coverage ratio of the remaining portion of the property based on the trailing 12-month period equals or is greater than the greater of (a) 1.23x and (b) the debt service coverage ratio for the property (including the building being released) immediately preceding the release based on the trailing-three month period.
“Google Tenancy Condition” means (a) there is no Cash Sweep Period caused by a Specified Tenant Trigger and (b) either the Google lease or a lease for the Google leased premises with a tenant that has a long term unsecured debt rating of BBB or its equivalent is in full force and effect for the remaining property.
Right of First Offer. Google has a right of first offer, so long as the borrower or an affiliate owns the property, to purchase all or any portion of the property that the borrower is willing to sell. The right of first offer expressly does not apply to any third party (including any owner by reason of foreclosure or any successor-in-interest) who subsequently owns all or any portion of the property.
THE INFORMATION IN THIS STRUCTURAL AND COLLATERAL TERM SHEET IS NOT COMPLETE AND MAY BE AMENDED PRIOR TO THE TIME OF SALE. THIS TERM SHEET IS NOT AN OFFER TO SELL THESE SECURITIES AND IT IS NOT A SOLICITATION OF AN OFFER TO BUY THESE SECURITIES IN ANY JURISDICTION WHERE THE OFFER OR SALE IS NOT PERMITTED.
| 106 of 139 | |
| Structural and Collateral Term Sheet | JPMDB 2017-C5 |
[THISPAGEINTENTIONALLYLEFTBLANK]
THE INFORMATION IN THIS STRUCTURAL AND COLLATERAL TERM SHEET IS NOT COMPLETE AND MAY BE AMENDED PRIOR TO THE TIME OF SALE. THIS TERM SHEET IS NOT AN OFFER TO SELL THESE SECURITIES AND IT IS NOT A SOLICITATION OF AN OFFER TO BUY THESE SECURITIES IN ANY JURISDICTION WHERE THE OFFER OR SALE IS NOT PERMITTED.
| 107 of 139 | |
| Structural and Collateral Term Sheet | JPMDB 2017-C5 | |
| Uovo Art Storage | ||
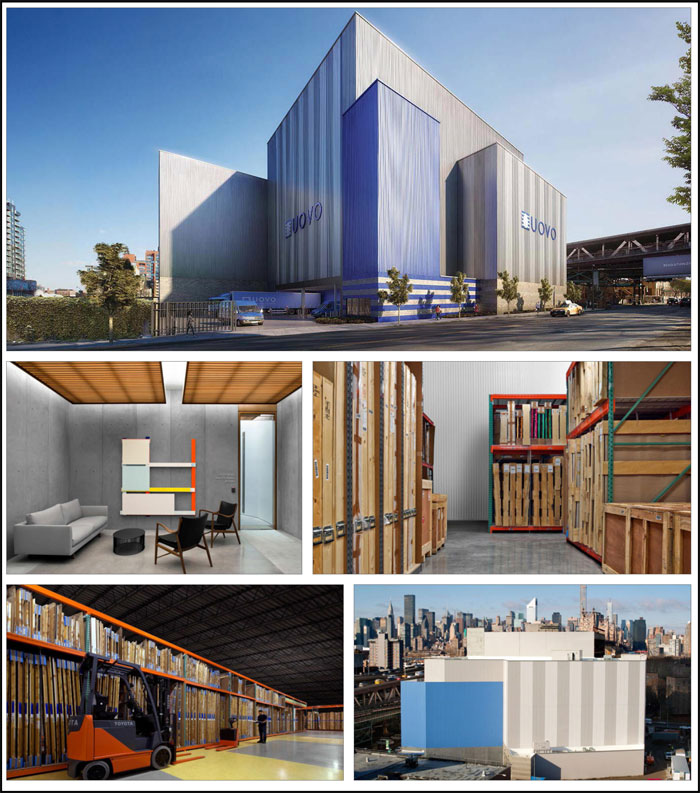
THE INFORMATION IN THIS STRUCTURAL AND COLLATERAL TERM SHEET IS NOT COMPLETE AND MAY BE AMENDED PRIOR TO THE TIME OF SALE. THIS TERM SHEET IS NOT AN OFFER TO SELL THESE SECURITIES AND IT IS NOT A SOLICITATION OF AN OFFER TO BUY THESE SECURITIES IN ANY JURISDICTION WHERE THE OFFER OR SALE IS NOT PERMITTED.
| 108 of 139 | |
| Structural and Collateral Term Sheet | JPMDB 2017-C5 | |
| Uovo Art Storage | ||
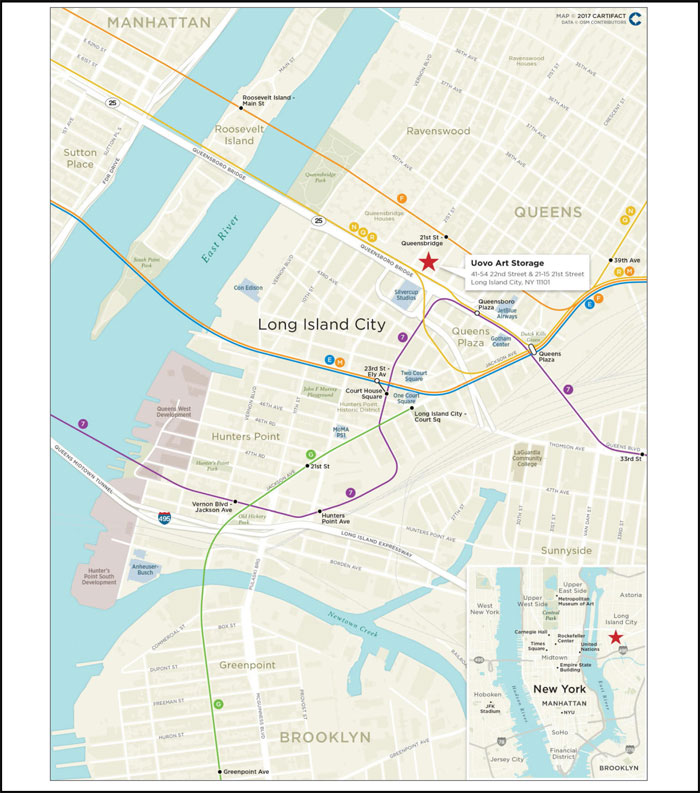
THE INFORMATION IN THIS STRUCTURAL AND COLLATERAL TERM SHEET IS NOT COMPLETE AND MAY BE AMENDED PRIOR TO THE TIME OF SALE. THIS TERM SHEET IS NOT AN OFFER TO SELL THESE SECURITIES AND IT IS NOT A SOLICITATION OF AN OFFER TO BUY THESE SECURITIES IN ANY JURISDICTION WHERE THE OFFER OR SALE IS NOT PERMITTED.
| 109 of 139 | |
| Structural and Collateral Term Sheet | JPMDB 2017-C5 | |
| Uovo Art Storage | ||
| Mortgage Loan Information | Property Information | |||
| Mortgage Loan Seller: | GACC | Single Asset / Portfolio: | Single Asset | |
| Original Principal Balance(1): | $37,000,000 | Title: | Fee | |
| Cut-off Date Principal Balance(1): | $36,943,588 | Property Type - Subtype: | Self Storage – Art Storage | |
| % of Pool by IPB: | 3.5% | Net Rentable Area (SF)(3): | 275,000 | |
| Loan Purpose: | Refinance | Location: | Long Island City, NY | |
| Borrower: | QPN 1 DE LLC and QPN 10 DE LLC | Year Built / Renovated: | 2014-2015 / N/A | |
| Sponsor: | Steven J. Guttman | Occupancy(4): | 83.9% | |
| Interest Rate: | 4.73500% | Occupancy Date: | 1/10/2017 | |
| Note Date: | 2/2/2017 | Number of Tenants: | N/A | |
| Maturity Date: | 2/6/2027 | 2013 NOI(5): | N/A | |
| Interest-only Period: | None | 2014 NOI(5): | N/A | |
| Original Term: | 120 months | 2015 NOI(5): | $892,213 | |
| Original Amortization: | 360 months | 2016 NOI: | $5,959,509 | |
| Amortization Type: | Balloon | UW Economic Occupancy: | 71.6% | |
| Call Protection(2): | L(25),Def(91),O(4) | UW Revenues: | $11,241,398 | |
| Lockbox / Cash Management: | Springing / Springing | UW Expenses: | $2,760,281 | |
| Additional Debt: | Yes | UW NOI(6): | $8,481,117 | |
| Additional Debt Balance: | $49,923,767 | UW NCF: | $8,451,641 | |
| Additional Debt Type: | Pari Passu | Appraised Value / Per SF(7)(8): | $165,000,000 / $600 | |
| Appraisal Date: | 1/9/2017 | |||
| Escrows and Reserves(9) | Financial Information(1) | ||||||
| Initial | Monthly | Initial Cap | Cut-off Date Loan / SF(7): | $316 | |||
| Taxes: | $29,711 | $14,855 | N/A | Maturity Date Loan / SF(7): | $258 | ||
| Insurance: | $0 | Springing | N/A | Cut-off Date LTV: | 52.6% | ||
| Replacement Reserves: | $0 | $2,456 | N/A | Maturity Date LTV: | 43.0% | ||
| TI/LC: | $0 | $0 | N/A | UW NCF DSCR: | 1.55x | ||
| Other: | $71,500 | $0 | N/A | UW NOI Debt Yield: | 9.8% | ||
| Sources and Uses | |||||||
| Sources | Proceeds | % of Total | Uses | Proceeds | % of Total | |
| Mortgage Loan(1) | $87,000,000 | 100.0% | Payoff Existing Debt | $75,149,150 | 86.4% | |
| Return of Equity | 11,016,416 | 12.7 | ||||
| Closing Costs | 733,223 | 0.8 | ||||
| Upfront Reserves | 101,211 | 0.1 | ||||
| Total Sources | $87,000,000 | 100.0% | Total Uses | $87,000,000 | 100.0% |
| (1) | The Uovo Art Storage loan is part of a whole loan evidenced by fourpari passu notes with an aggregate original principal balance of $87.0 million. The Financial Information presented in the chart above reflects the aggregate Cut-off Date balance of the $86,867,355 Uovo Art Storage Whole Loan (as defined herein). |
| (2) | The lockout period will be at least 25 payments beginning with and including the first payment date in March 2017. Defeasance of the full $87.0 million Uovo Art Storage Whole Loan is permitted after the date that is the earlier to occur of (i) two years from the closing date of the securitization that includes the lastpari passunote to be securitized and (ii) February 2, 2020. |
| (3) | Net Rentable Area (SF) is based on the gross building area of 275,000 square feet between the two buildings. The private storage units total 164,812 square feet and the managed storage units total 162,793 cubic feet. |
| (4) | Occupancy represents the occupancy percentage for the private storage space (measured in square feet). The managed storage space is measured in cubic feet and as of the January 10, 2017 rent roll is 48.2% leased. |
| (5) | Historical cash flows are not available as the property was constructed in 2014 and was not fully opened until June 2015. |
| (6) | UW NOI is higher than the 2016 NOI due to additional lease up of the property. Since the beginning of 2016, new leases have commenced for approximately 111 private storage units, totaling approximately $4.9 million (54.2% of private unit underwritten rents in place). In addition, UW NOI includes $270,525 in rent steps through January 2018. |
| (7) | The Appraised Value / Per SF, Cut-off Date Loan / SF and Maturity Date Loan / SF calculations are based on 275,000 gross square feet. |
| (8) | In addition to the as-is appraised value, the appraisal determined an as-stabilized appraised value of $180,000,000 which assumes 87.5% occupancy for the private storage units and 70.0% occupancy for the managed storage units. Based on the January 10, 2017 rent roll, the private storage space is 83.9% leased and the managed storage is 48.2% leased. Based on the as stabilized appraised value, the Cut-off Date LTV and the Maturity Date LTV would be 48.3% and 39.4%, respectively. |
| (9) | For a full description of Escrows and Reserves, please refer to “Escrows and Reserves” below. |
THE INFORMATION IN THIS STRUCTURAL AND COLLATERAL TERM SHEET IS NOT COMPLETE AND MAY BE AMENDED PRIOR TO THE TIME OF SALE. THIS TERM SHEET IS NOT AN OFFER TO SELL THESE SECURITIES AND IT IS NOT A SOLICITATION OF AN OFFER TO BUY THESE SECURITIES IN ANY JURISDICTION WHERE THE OFFER OR SALE IS NOT PERMITTED.
| 110 of 139 | |
| Structural and Collateral Term Sheet | JPMDB 2017-C5 | |
| Uovo Art Storage | ||
The Loan. The Uovo Art Storage loan is secured by a first mortgage lien on the borrowers’ fee interest in Uovo Art Storage, which consists of two interconnecting art storage buildings totaling 275,000 gross square feet located in Long Island City, New York. The whole loan has an outstanding principal balance as of the Cut-off Date of approximately $86.9 million (the “Uovo Art Storage Whole Loan”) and is comprised of fourpari passu notes, each as described below. The non-controlling Note A-2, with an outstanding principal balance as of the Cut-off Date of approximately $22.0 million and non-controlling Note A-3, with an outstanding principal balance as of the Cut-off Date of approximately $15.0 million, are being contributed to the JPMDB 2017-C5 Trust. The controlling Note A-1, and non-controlling Note A-4, with an aggregate outstanding principal balance as of the Cut-off Date of $49,923,767, are each expected to be contributed to one or more future securitization trusts. The holder of the Note A-2 and Note A-3 (including the Trustee or, prior to the occurrence and continuance of a Control Termination Event under the PSA, the Directing Certificateholder) will be entitled, under certain circumstances, to be consulted with respect to certain major decisions. The Uovo Art Storage Whole Loan has a 10-year term and will amortize on a 30-year schedule. The most recent prior financing of the Uovo Art Storage property was not included in a securitization.
| Whole Loan Summary | |||||
| Original Balance | Cut-off Date Balance | Note Holder | Controlling Piece | ||
| A-1 | $40,000,000 | $39,939,014 | DBNY | Yes | |
| A-2, A-3 | $37,000,000 | $36,943,588 | JPMDB 2017-C5 | No | |
| A-4 | $10,000,000 | $9,984,753 | DBNY | No | |
| Total | $87,000,000 | $86,867,355 | |||
The Borrower.The borrowing entities for the Uovo Art Storage loan are QPN 1 DE LLC and QPN 10 DE LLC, each a Delaware limited liability company and recycled special purpose entity, and are jointly and severally liable under the loan documents.
The Loan Sponsor.The loan sponsor and nonrecourse carve-out guarantor is Steven J. Guttman, founder of Storage Deluxe Management Company (“Storage Deluxe”). Founded in 1998, Storage Deluxe has developed and constructed approximately 34 self storage facilities, three fine art storage facilities, and one luxury car storage facility. Altogether, these assets comprise approximately 2.4 million net rentable square feet across approximately 40,000 units. The loan sponsor has since sold 27 of its properties, with the majority being acquired by Cube Smart. Currently, Storage Deluxe manages approximately 10 facilities in New York within Brooklyn, Manhattan, Flushing, Long Island City, Queens, New Hyde Park and The Bronx, with an additional seven properties under construction.
The Property. The Uovo Art Storage property includes two interconnected fine art storage facilities consisting of a six-story building (“Building 10”) containing 110,000 gross square feet of space and an eight-story building (“Building 1”) containing 165,000 gross square feet of space, for a total 275,000 gross square feet. The property was developed by Storage Deluxe in 2015 for a total cost of $73.3 million and is located in Long Island City, Queens, at the foot of the 59th Street Bridge. The fine art storage facilities consist of both private storage and managed storage. Private storage totals 164,812 square feet throughout 290 units and is 83.9% leased as of January 2017, while managed storage totals 162,793 cubic feet and is 48.2% leased as of January 2017. First floor amenities include a lobby and reception common areas, nine covered loading docks that can accommodate a tractor-trailer up to 53-feet, seven private viewing rooms, a café for clients, three passenger elevators and two freight elevators capable of moving large artwork. The viewing rooms, ranging in size from 400 square feet to 1,600 square feet, are designed to display artwork and can be rented on a half day or a full day basis for an additional fee. The buildings have dock-high and drive-in loading capabilities, with nine loading bays on site, as well as clear ceiling heights, ranging from 10’ to 16’5’’ to accommodate larger items. The property features 24/7 security with integrated key card access controls, individual unit door alarms, two-way intercoms and CCTV cameras. The property also contains an integrated building management system and security systems with motion detectors, glass break sensors, sonic sensors, water sensors and heat detectors that report directly to a central station, the New York Police Department and the Fire Department of New York. Additionally, all artwork is stored a minimum of six inches off the floor.
Private Storage. The private storage facilities operate similarly to traditional self-storage units and are tailor made for each tenant and include lighting, flooring, racking systems, conservation equipment, and security systems, and allow for tenants to work out of their space. The customer is responsible for loading and unloading the unit and assumes responsibility for the handling of all items stored. Tenants can access their private storage unit at any time during the property’s hours of operation. Each tenant is only allowed access to the floor and unit in which their private storage is located and requires a new security key each time they enter the property. Private storage tenants sign a standard form lease (similar to a traditional self storage lease) that can go month to month once it expires. As of the January 2017 rent roll, 83.9% of the private storage units were leased with a weighted average lease term of five years. The private storage units are leased by a variety of tenants, with the two largest tenants being Metropolitan Museum of Art (“Met”) and Phillip Van Heusen (“PVH Corp.”) (rated Ba2 and BB+ by Moody’s and S&P, respectively), each of which lease 22,000 square feet (each 13.3% of total private storage square feet). The Met signed a 10-year lease through March 2026 and accounts for 12.1% of private storage base rent. PVH Corp signed a five-year lease through May 2020 and accounts for 8.9% of private storage base rent. No other tenant leases more than 4,000 square feet of private storage space or accounts for more than 4.3% of private storage base rent.
THE INFORMATION IN THIS STRUCTURAL AND COLLATERAL TERM SHEET IS NOT COMPLETE AND MAY BE AMENDED PRIOR TO THE TIME OF SALE. THIS TERM SHEET IS NOT AN OFFER TO SELL THESE SECURITIES AND IT IS NOT A SOLICITATION OF AN OFFER TO BUY THESE SECURITIES IN ANY JURISDICTION WHERE THE OFFER OR SALE IS NOT PERMITTED.
| 111 of 139 | |
| Structural and Collateral Term Sheet | JPMDB 2017-C5 | |
| Uovo Art Storage | ||
Managed Storage. The managed storage facilities are for customers who do not need full units but want certain items to be stored and managed by the facility. The managed storage units are located on the first and second floors of each building, and consist of open storage areas that are optimized for large and small pieces of artwork. These items are typically catalogued and individually bar-coded, then stored in the managed storage area, which is fitted out with racks. In order to view artwork stored in these spaces, users must request their art to be removed from managed storage and set up in a viewing room for an additional fee. The managed storage tenants lease space based on cubic feet and are structured with month-to-month leases. Each tenant can opt to increase or reduce their space at any given time. As of the January 2017 rent roll, 48.2% of the managed storage space is leased. Both facilities are climate controlled to maintain constant temperatures and humidity.
The subsequent charts provide a breakdown of each building as well as a breakout of the public and private storage units:
| Unit Breakdown(1) | |||||||
| Private Storage Units | Managed Storage Units(2) | ||||||
| Building | Address | Gross Building Area (Square Feet) | Rentable Area (Square Feet) | Number of Units | Rentable Area (Cubic Feet) | ||
| Building 1 | 41-45 21st Street | 165,000 | 111,015 | 181 | 46,519 | ||
| Building 10 | 41-54 22nd Street | 110,000 | 53,797 | 109 | 116,274 | ||
| Total | 275,000 | 164,812 | 290 | 162,793 | |||
| (1) | Source: Appraisal |
| (2) | Managed storage units are measured and rented upon a per cubic foot basis. |
| Private and Managed Storage Breakdown | |||||||
| Private Storage | Total Square Feet | Units | U/W Base Rent | % of Total U/W Base Rent | Leased Square Feet | Leased Percentage(1) | Avg. Rent Per Square Foot(1) |
| Building 10 | 53,797 | 109 | $3,282,845 | 30.8% | 50,147 | 93.2% | $65.46 |
| Building 1 | 111,015 | 181 | $5,726,857 | 53.8% | 88,180 | 79.4% | $64.95 |
| Total | 164,812 | 290 | $9,009,702 | 84.6% | 138,327 | 83.9% | $65.13 |
| Managed Storage | Total Cubic Feet | Units | U/W Base Rent | % of Total U/W Base Rent | Leased Cubic Feet | Leased Percentage(1) | Avg. Rent Per Cubic Foot(1) |
| Building 1 & Building 10 | 162,793 | NAP | $1,634,154 | 15.4% | 78,544 | 48.2% | $20.81 |
| Total | 162,793 | NAP | $1,634,154 | 15.4% | 78,544 | 48.2% | $20.81 |
| (1) | Leased percentage based on the January 10, 2017 rent roll. |
| Historical and Current Occupancy | |||
| 2014(1) | 2015(2) | 2016(2) | Current(2)(3) |
| N/A | 57.7% | 83.1% | 83.9% |
| (1) | 2014 occupancy is not available as the property was constructed in 2014 and was not fully opened until June 2015. |
| (2) | 2015 and 2016 Occupancies are based on the borrower operating statements and represent private storage occupancy as of December 31 of each year. |
| (3) | Current Occupancy is based on the January 10, 2017 rent roll, and represents the occupancy percentage for the private storage space (measured in square feet). The managed storage space is measured in cubic feet and as of the January 10, 2017 rent roll is 48.2% leased. |
The Uovo Art Storage property was designed to permit use by individual owners, artists, galleries and museums that can both store and showcase artwork. Museum clients use the facility to store and ship pieces back and forth. Galleries can set up private viewings and conduct business in New York, while artists can manage and show their own artwork to individual collectors and galleries. The property’s tenant composition is diversified and, in addition to galleries and museums, includes financial firms, fashion galleries and individuals. Individuals compose the majority of the storage demand in Building 1 and galleries make up the majority of the storage demand in Building 10.
THE INFORMATION IN THIS STRUCTURAL AND COLLATERAL TERM SHEET IS NOT COMPLETE AND MAY BE AMENDED PRIOR TO THE TIME OF SALE. THIS TERM SHEET IS NOT AN OFFER TO SELL THESE SECURITIES AND IT IS NOT A SOLICITATION OF AN OFFER TO BUY THESE SECURITIES IN ANY JURISDICTION WHERE THE OFFER OR SALE IS NOT PERMITTED.
| 112 of 139 | |
| Structural and Collateral Term Sheet | JPMDB 2017-C5 | |
| Uovo Art Storage | ||
The Uovo Art Storage property is located in Long Island City, New York, a neighborhood located in the western area of Queens and situated opposite Midtown Manhattan. Long Island City consists of an approximately 2.5 square mile area bound by 34th Avenue to the north, Northern Boulevard and 39th Street to the east, Newtown Creek to the south, the Long Island Expressway to the southeast, and the East River to the west. Long Island City is part of Queens Community District 1 and 2. Long Island City is served by highways, surface streets and public transportation. The Long Island Expressway is located at the southern end of Long Island City, while the Brooklyn Queens Expressway is located along the eastern end of Long Island City. Queens Boulevard, Northern Boulevard and Hunters Point Avenue provide good access through Long Island City and its surrounding neighborhoods. Long Island City is also served by two of the busiest New York City subways and by a public bus service. The 21st Street Queensbridge F train stop is located one block north of the property, the Queensboro Plaza 7 train stop is located three blocks east of the property, and the Queens Plaza E/M/R train stop is located approximately seven blocks to the east of the property. These trains provide access to Manhattan and other areas of New York. While the Uovo Art Storage property draws clientele from the entire New York Metro Area, the majority of the property’s prospective customers are located in Manhattan (museums, galleries, and private art collectors). The site is located close to Manhattan and the majority of its potential customer base, and it enjoys access via the Long Island Expressway and Brooklyn-Queens Expressway.
According to the appraisal, Long Island City is transforming from a community that is comprised primarily of industrial and commercial districts, with a limited amount of residential uses, to one with a strong residential component with expanding hotel and retail services. The residential communities are comprised primarily of multi-family apartment buildings, with a mix of one-, two-, and three-family dwellings. Retail and commercial districts are located on Queens Boulevard, Northern Boulevard and Jackson Avenue. According to the appraisal, since 2006, at least 9,000 residential units have been completed in the Long Island City neighborhood. There are currently more than 14,000 units under construction in the area, and at least 3,500 more units planned for the future. The 14,000 units under construction will generally be delivered between 2015 and 2018. Over 4,700 rental units are in the process of being converted or have been converted recently.
The Uovo Art Storage property is a newly built art storage facility. The appraisal identified a set of storage properties that cater to the storage of fine art and collectibles in the New York Metro area, and act as the property’s most direct competition within the art customer demographic. In total, the competitive art storage properties contain approximately 600,600 square feet. The comparable projects were older buildings originally built for purposes other than art storage, and then repurposed over time. Excluding the Uovo Art Storage property, the comparable art storage projects had occupancy levels ranging from 90.0% to 98.0%, with an average of 93.8%. The subsequent chart is a summary of the comparable properties.
| Competitive Set Summary(1) | |||||||
| Property Name | Location | Year Built | Year Renovated | Total Units | NRA | Average Unit Size (Square Feet) | Occupancy Rate |
| Uovo Art Storage(2) | Long Island City, NY | 2014-2015 | NAP | 290 | 164,812 | 568 | 83.9% |
| Atelier 4 | Long Island City, NY | 1955 | 2005 | NAP | 65,000 | NAP | 90.0% |
| Fortress | Long Island City, NY | 1931 | NAP | NAP | 85,000 | NAP | 95.0% |
| Artex Fine Art Services | Long Island City, NY | 1926 | 2003 | 320 | 80,000 | 250 | 95.0% |
| Day & Meyer | Manhattan, NY | 1927 | NAP | 700 | 70,000 | 100 | 95.0% |
| Crozier | Manhattan, NY | 1913 | NAP | 856 | 80,600 | 94 | 98.0% |
| Christies | Brooklyn, NY | 1913 | 2009 | NAP | 220,000 | NAP | 92.0% |
| Total/Wtd. Avg.(3) | 600,600 | 123 | 93.8% | ||||
| (1) | Source: Appraisal. |
| (2) | The information in the above chart represents the private storage units at the Uovo Art Storage property. |
| (3) | Total/Wtd. Avg. excludes the Uovo Art Storage property. |
THE INFORMATION IN THIS STRUCTURAL AND COLLATERAL TERM SHEET IS NOT COMPLETE AND MAY BE AMENDED PRIOR TO THE TIME OF SALE. THIS TERM SHEET IS NOT AN OFFER TO SELL THESE SECURITIES AND IT IS NOT A SOLICITATION OF AN OFFER TO BUY THESE SECURITIES IN ANY JURISDICTION WHERE THE OFFER OR SALE IS NOT PERMITTED.
| 113 of 139 | |
| Structural and Collateral Term Sheet | JPMDB 2017-C5 | |
| Uovo Art Storage | ||
| Operating History and Underwritten Net Cash Flow | |||||||||
2015(1) | 2016 | T-6 12/2016 | T-3 12/2016 | Underwritten | Per Square Foot(2) | %(3) | |||
| Rents in Place – Private Units(4) | $2,995,208 | $7,265,414 | $8,743,345 | $8,975,923 | $9,280,227 | $33.75 | 58.6% | ||
| Rents in Place – Managed Units(4) | 423,049 | 1,369,086 | 1,607,509 | 1,595,629 | 1,634,154 | 5.94 | 10.3 | ||
| Vacant Income | 0 | 0 | 0 | 4,036,126 | 4,521,448 | 16.44 | 28.5 | ||
| Gross Potential Rent | $3,418,257 | $8,634,500 | $10,350,854 | $10,571,552 | $15,435,829 | $56.13 | 97.4% | ||
| Viewing Room Income | 96,670 | 227,350 | 269,050 | 289,100 | 289,100 | 1.05 | 1.8 | ||
| Miscellaneous Revenue | (7,470) | 77,866 | 185,770 | 120,088 | 120,088 | 0.44 | 0.8 | ||
| Net Rental Income | $3,507,457 | $8,939,716 | $10,805,674 | $10,980,740 | $15,845,017 | $57.62 | 100.0% | ||
| (Vacancy/Credit Loss) | 0 | 0 | 0 | 0 | (4,521,448) | (16.44) | (40.2) | ||
| (Concessions/Discounts) | (167,566) | (97,361) | (45,363) | (77,876) | (82,171) | (0.30) | (0.7) | ||
| Effective Gross Income | $3,339,891 | $8,842,355 | $10,760,311 | $10,902,864 | $11,241,398 | $40.88 | 100.0% | ||
| Total Expenses(5) | 2,447,678 | 2,882,846 | 3,448,103 | 3,360,555 | 2,760,281 | 10.04 | 24.6% | ||
| Net Operating Income(6) | $892,213 | $5,959,509 | $7,312,208 | $7,542,309 | $8,481,117 | $30.84 | 75.4% | ||
| Total Capex | 0 | 0 | 0 | 0 | 29,476 | 0.11 | 0.3 | ||
| Net Cash Flow | $892,213 | $5,959,509 | $7,312,208 | $7,542,309 | $8,451,641 | $30.73 | 75.2% | ||
| (1) | Full 2015 financials are not available as the property was constructed in 2014 and was not fully opened until June 2015. |
| (2) | Per Square Foot calculations are based on 275,000 gross square feet. |
| (3) | % column represents percentage of Net Rental Income for all revenue lines and represents percent of Effective Gross Income for the remainder of the fields. |
| (4) | Rents in Place are based on in-place rents as of January 10, 2017 and include $270,525 of rent steps through January 2018. |
| (5) | The property is enrolled in the Industrial & Commercial Abatement Program (“ICAP”), a tax exemption on new construction in designated areas. Properties that qualify for ICAP benefits in a designated special area receive a property tax exemption of the added physical value resulting from the construction for 25 years. The Uovo Art Storage property will receive 100% of the exemption benefit for the first 15 years, which then decreases each year thereafter by 10%. The physical improvements will be fully taxable in Year 26. Building 1 will begin the tax abatement in the 2017/2018 tax year and Building 10 began its abatement in the 2016/2017 tax year. Taxes have been underwritten based on the 10-year average abated tax amount. |
| (6) | Underwritten Net Operating Income is higher than the 2016 Net Operating Income due to additional lease up of the property, and includes underwritten steps of $270,525 through January 2018. Since the beginning of 2016, new leases have commenced for approximately 111 private storage units, totaling approximately $4.9 million (54.2% of private unit underwritten rents in place). |
Property Management.The Uovo Art Storage property is managed by Uovo Management LLC, a borrower affiliate.
Escrows and Reserves.At origination, the borrowers were required to deposit into escrow $29,711 for real estate taxes, and $71,500 into the new PCO reserve, which represents 110% of the estimated cost of required work in order to obtain new permanent certificates of occupancy (“PCO”). The property is currently operating under a temporary certificate of occupancy (“TCO”) and the borrower is required to renew and maintain the TCO at all times until a new PCO has been obtained.
Tax Escrows -On a monthly basis, the borrowers are required to escrow 1/12 of the annual estimated tax payments, which currently equates to $14,855.
Insurance Escrows -The requirement for the borrowers to make monthly deposits to the insurance escrow is waived so long as the property is insured under an acceptable blanket policy in accordance with the loan documents.
Replacement Reserves -On a monthly basis, the borrowers are required to escrow $2,456 (approximately $0.15 per square foot annually based on 196,505 square feet) for replacement reserves. The private storage area is measured on a square foot basis and totals 164,812 square feet. The managed storage area is measured on a cubic foot basis. On a square foot basis the managed storage area totals 31,693 square feet.
Lockbox / Cash Management.The loan is structured with a springing lockbox and springing cash management. Upon a “Trigger Period” (as defined herein), a lender controlled clearing account is required to be established by the borrowers and the borrowers will be required to cause all rents to be transmitted directly into the clearing account and, during the continuance of a Trigger Period, funds in such clearing account will be transferred on a daily basis to a cash management account controlled by the lender to be applied and disbursed according to the loan documents.
A “Trigger Period” commences upon the occurrence of (i) an event of default or (ii) the debt service coverage ratio, based on underwritten net cash flow, falling below 1.20x at the end of any calendar quarter and ends upon, (a) with respect to clause (i) above, a cure of such default or (b) with respect to clause (ii) above, the property achieving a debt service coverage ratio of at least 1.25x for two consecutive calendar quarters.
THE INFORMATION IN THIS STRUCTURAL AND COLLATERAL TERM SHEET IS NOT COMPLETE AND MAY BE AMENDED PRIOR TO THE TIME OF SALE. THIS TERM SHEET IS NOT AN OFFER TO SELL THESE SECURITIES AND IT IS NOT A SOLICITATION OF AN OFFER TO BUY THESE SECURITIES IN ANY JURISDICTION WHERE THE OFFER OR SALE IS NOT PERMITTED.
| 114 of 139 | |
| Structural and Collateral Term Sheet | JPMDB 2017-C5 |
[THIS PAGE INTENTIONALLY LEFT BLANK]
THE INFORMATION IN THIS STRUCTURAL AND COLLATERAL TERM SHEET IS NOT COMPLETE AND MAY BE AMENDED PRIOR TO THE TIME OF SALE. THIS TERM SHEET IS NOT AN OFFER TO SELL THESE SECURITIES AND IT IS NOT A SOLICITATION OF AN OFFER TO BUY THESE SECURITIES IN ANY JURISDICTION WHERE THE OFFER OR SALE IS NOT PERMITTED.
| 115 of 139 | |
| Structural and Collateral Term Sheet | JPMDB 2017-C5 | |
| AHIP FL 5 Portfolio | ||
| Mortgage Loan Information | Property Information | |||
| Mortgage Loan Seller: | GACC | Single Asset / Portfolio: | Portfolio | |
| Original Principal Balance: | $37,000,000 | Title: | Fee | |
| Cut-off Date Principal Balance: | $36,865,905 | Property Type - Subtype: | Hotel – Various | |
| % of Pool by IPB: | 3.5% | Net Rentable Area (Rooms): | 473 | |
| Loan Purpose: | Acquisition | Location: | Various, FL | |
| Borrowers(1): | Various | Year Built / Renovated: | Various / Various | |
| Sponsor: | American Hotel Income Properties | Occupancy / ADR / RevPAR: | 74.1% / $114.72 / $84.79 | |
| REIT Inc. | Occupancy / ADR / RevPAR Date: | 9/30/2016 | ||
| Interest Rate: | 4.99000% | Number of Tenants: | N/A | |
| Note Date: | 11/29/2016 | 2013 NOI: | N/A | |
| Maturity Date: | 12/6/2026 | 2014 NOI: | $4,707,160 | |
| Interest-only Period: | None | 2015 NOI: | $6,118,858 | |
| Original Term: | 120 months | TTM NOI (as of 9/2016): | $5,973,405 | |
| Original Amortization: | 360 months | UW Occupancy / ADR / RevPAR: | 72.5% / $109.68 / $79.40 | |
| Amortization Type: | Balloon | UW Revenues: | $14,154,095 | |
| Call Protection: | L(27),Def(89),O(4) | UW Expenses: | $8,995,281 | |
| Lockbox / Cash Management: | Hard / Springing | UW NOI: | $5,158,816 | |
| Additional Debt: | N/A | UW NCF: | $4,592,650 | |
| Additional Debt Balance: | N/A | Appraised Value / Per Room(4): | $61,600,000 / $130,233 | |
| Additional Debt Type: | N/A | Appraisal Date: | 11/1/2017 | |
| Escrows and Reserves | Financial Information | ||||||
| Initial | Monthly | Initial Cap | Cut-off Date Loan / Room: | $77,941 | |||
| Taxes: | $48,027 | $48,027 | N/A | Maturity Date Loan / Room: | $64,283 | ||
| Insurance: | $0 | Springing | N/A | Cut-off Date LTV(4): | 59.8% | ||
| FF&E Reserves(2): | $0 | Springing | N/A | Maturity Date LTV(4): | 49.4% | ||
| TI/LC: | $0 | $0 | N/A | UW NCF DSCR: | 1.93x | ||
| Other(3): | $7,874,700 | Springing | N/A | UW NOI Debt Yield: | 14.0% | ||
| Sources and Uses | |||||||
| Sources | Proceeds | % of Total | Uses | Proceeds | % of Total | |
| Mortgage Loan | $37,000,000 | 59.4% | Purchase Price | $53,219,000 | 85.4% | |
| Sponsor Equity | 25,284,719 | 40.6 | Upfront Reserves | 7,922,727 | 12.7 | |
| Closing Costs | 1,142,992 | 1.8 | ||||
| Total Sources | $62,284,719 | 100.0% | Total Uses | $62,284,719 | 100.0% |
| (1) | The borrowers for the AHIP FL 5 Portfolio loan are: AHIP FL Fort Myers Properties LLC, AHIP FL Fort Myers Enterprises LLC, AHIP FL Tampa 3624 Properties LLC, AHIP FL Tampa 3624 Enterprises LLC, AHIP FL Sarasota Properties LLC, AHIP FL Sarasota Enterprises LLC, AHIP FL Tampa 13575 Properties LLC, AHIP FL Tampa 13575 Enterprises LLC, AHIP FL Ocoee Properties LLC and AHIP FL Ocoee Enterprises LLC. Each individual property has two related borrowers comprised of a fee owner and an operating lessee. |
| (2) | Beginning with the monthly payment date in December 2018, the borrowers are required to deposit the greater of (i) 1/12 of an amount equal to 4.0% of annual gross revenues for each hotel estimated in the borrowers’ approved annual budget for the year in which such payment date occurs and (ii) the then-current amount required by the franchise agreement for FF&E work. In lieu of depositing FF&E Reserve Funds into the FF&E Reserve Account, the borrowers may elect to deliver to the lender a letter of credit on a monthly payment date with a term of not less than 12 months and for a stated amount of not less than the total amount of 4.0% of the gross revenues from the hotel for the 12 calendar months preceding the date such letter of credit is provided to lender. |
| (3) | Initial Other Reserve represents a PIP reserve. Monthly Other Reserve represents a springing reserve for condominium assessments. Upon the occurrence and during the continuance of a Trigger Period (as defined below), the borrowers are required to deposit with the lender, on each monthly payment date, an amount equal to 1/12 of the condominium assessments that the lender estimates will be payable during the next ensuing 12 months. A “Trigger Period” will commence upon the occurrence of (i) an event of default or (ii) the debt service coverage ratio, based on underwritten net cash flow, falling below 1.25x at the end of any calendar quarter and will end upon, (a) with respect to clause (i) above, a cure of such event of default has been accepted by the lender or (b) with respect to clause (ii) above, the portfolio achieving a debt service coverage ratio of at least 1.30x for two consecutive calendar quarters. |
| (4) | The Appraised Value / Per Room, Cut-off Date LTV and Maturity Date LTV are calculated based on the “As Complete” value for the AHIP FL 5 Portfolio properties, which assumes the completion of the required PIP at each property. The estimated cost of each respective PIP was reserved in full at loan origination. Based on the “As Is” appraised value as of November 1, 2016 of $53,400,000, the loan has a Cut-off Date LTV and Maturity Date LTV of 69.0% and 56.9%, respectively. |
THE INFORMATION IN THIS STRUCTURAL AND COLLATERAL TERM SHEET IS NOT COMPLETE AND MAY BE AMENDED PRIOR TO THE TIME OF SALE. THIS TERM SHEET IS NOT AN OFFER TO SELL THESE SECURITIES AND IT IS NOT A SOLICITATION OF AN OFFER TO BUY THESE SECURITIES IN ANY JURISDICTION WHERE THE OFFER OR SALE IS NOT PERMITTED.
| 116 of 139 | |
| Structural and Collateral Term Sheet | JPMDB 2017-C5 | |
| AHIP FL 5 Portfolio | ||
The Loan.The AHIP FL 5 Portfolio loan has an outstanding principal balance as of the Cut-off Date of approximately $36.9 million and is secured by a first mortgage lien on the fee interests in four limited service hotels and one extended stay hotel totaling 473 rooms located in Florida. The AHIP FL 5 Portfolio loan has a 10-year term and amortizes on a 30-year schedule. The borrowers are each Delaware limited liability companies and special purpose entities. The loan sponsor and nonrecourse carve-out guarantor is American Hotel Income Properties REIT Inc., which is the United States holding company for all of American Hotel Income Properties REIT LP’s (“AHIP”) United States assets. AHIP is traded on the Toronto Exchange under the symbol HOT.UN and has holdings of 84 hotel properties within 28 states.
The Portfolio. The AHIP FL 5 Portfolio consists of five hotel properties totaling 473 rooms located in Fort Myers, Tampa, Sarasota and Ocoee, Florida. The five properties are cross-collateralized and cross-defaulted. The properties were acquired by AHIP as part of a six-property portfolio. The sixth property in the portfolio, the Wingate Tampa/USF, is not collateral for the AHIP FL 5 Portfolio loan. The allocated purchase price for the five collateral properties is $53,219,000. Following loan origination, the borrowers are required to complete a $7,874,000 franchise-required PIP, which amount was reserved for at loan origination. The franchise agreement for Holiday Inn Express Ft Myers East, Staybridge Suites Tampa East Brandon and Holiday Inn Express Sarasota I-75 expires in November 2031. The franchise agreement for Fairfield Inn & Suites Orlando Ocoee expires in January 2034. The franchise agreement for Courtyard Tampa North I-75 Fletcher expires in January 2028.
| Portfolio Summary | |||||||||
| Property | Location | Rooms | Year Built / Renovated | Cut-off Date Allocated Loan Amount | % of Allocated Loan Amount | Appraised Value(1) | UW NCF | % of UW NCF | PIP Amount |
| Holiday Inn Express Ft Myers East | Fort Myers, FL | 111 | 2009 / NAP | $8,677,851 | 23.5% | $14,500,000 | $1,098,446 | 23.9% | $2,497,500 |
| Staybridge Suites Tampa East Brandon | Tampa, FL | 100 | 2007 / 2014 | 8,019,531 | 21.8% | 13,400,000 | 871,524 | 19.0% | 1,835,300 |
| Holiday Inn Express Sarasota I-75(2) | Sarasota, FL | 101 | 2003 / 2012 | 7,480,906 | 20.3% | 12,500,000 | 966,889 | 21.1% | 2,272,500 |
| Fairfield Inn & Suites Orlando Ocoee | Ocoee, FL | 80 | 2004 / 2014 | 6,583,197 | 17.9% | 11,000,000 | 904,113 | 19.7% | 600,000 |
| Courtyard Tampa North I-75 Fletcher | Tampa, FL | 81 | 1995 / 2013 | 6,104,419 | 16.6% | 10,200,000 | 751,678 | 16.4% | 669,400 |
| Total | 473 | $36,865,905 | 100.0% | $61,600,000 | $4,592,650 | 100.0% | $7,874,700 | ||
| (1) | Represents the appraisal’s “As Complete” value for the AHIP FL 5 Portfolio properties, which assumes the completion of the required PIP at each property. |
| (2) | The Holiday Inn Express Sarasota I-75 is one of four units in a land development condominium and comprises the full parcel of land on which the hotel, parking, and landscaping are located. The related borrower does not control the condominium. The condominium’s common areas are limited to the easement interests for ingress/egress access and utility easements and borrower otherwise maintains its own unit and carries insurance covering the Holiday Inn Express Sarasota I-75 property. |
| Historical Occupancy, ADR and RevPAR(1) | ||||||||||
| Occupancy | ADR | RevPAR | ||||||||
| Property | 2014 | 2015 | TTM(2) | 2014 | 2015 | TTM(2) | 2014 | 2015 | TTM(2) | |
| Holiday Inn Express Ft Myers East | 66.3% | 73.3% | 75.0% | $100.69 | $112.45 | $114.70 | $66.76 | $82.43 | $85.97 | |
| Staybridge Suites Tampa East Brandon | 69.7% | 74.6% | 74.7% | $96.64 | $105.20 | $107.31 | $67.36 | $78.48 | $80.16 | |
| Holiday Inn Express Sarasota I-75 | 67.4% | 68.2% | 65.4% | $109.59 | $125.18 | $122.96 | $73.86 | $85.37 | $80.40 | |
| Fairfield Inn & Suites Orlando Ocoee | 78.1% | 82.5% | 80.6% | $97.85 | $108.59 | $114.76 | $76.42 | $89.58 | $92.54 | |
| Courtyard Tampa North I-75 Fletcher | 66.5% | 74.6% | 76.3% | $104.29 | $109.30 | $113.61 | $69.35 | $81.54 | $86.68 | |
| Weighted Average(3) | 69.3% | 74.3% | 74.1% | $101.87 | $112.44 | $114.72 | $70.48 | $83.28 | $84.79 | |
| (1) | Based on operating statements provided by the borrowers. |
| (2) | Represents the trailing 12-month period ending on September 30, 2016. |
| (3) | Weighted by room count. |
THE INFORMATION IN THIS STRUCTURAL AND COLLATERAL TERM SHEET IS NOT COMPLETE AND MAY BE AMENDED PRIOR TO THE TIME OF SALE. THIS TERM SHEET IS NOT AN OFFER TO SELL THESE SECURITIES AND IT IS NOT A SOLICITATION OF AN OFFER TO BUY THESE SECURITIES IN ANY JURISDICTION WHERE THE OFFER OR SALE IS NOT PERMITTED.
| 117 of 139 | |
| Structural and Collateral Term Sheet | JPMDB 2017-C5 | |
| AHIP FL 5 Portfolio | ||
| Historical Occupancy, ADR and RevPAR Penetration Rates(1) | |||||||||||
| Occupancy | ADR | RevPAR | |||||||||
| Property | 2014 | 2015 | TTM(2) | 2014 | 2015 | TTM(2) | 2014 | 2015 | TTM(2) | ||
| Holiday Inn Express Ft Myers East | 97.6% | 102.2% | 101.9% | 104.9% | 107.0% | 102.7% | 102.4% | 109.4% | 104.7% | ||
| Staybridge Suites Tampa East Brandon | 85.5% | 87.7% | 88.3% | 115.4% | 116.1% | 109.3% | 98.6% | 101.9% | 96.5% | ||
| Holiday Inn Express Sarasota I-75 | 93.9% | 92.4% | 88.9% | 109.5% | 113.4% | 108.3% | 102.8% | 104.7% | 96.2% | ||
| Fairfield Inn & Suites Orlando Ocoee | 98.6% | 106.1% | 104.5% | 103.0% | 105.6% | 109.6% | 101.6% | 112.0% | 114.5% | ||
| Courtyard Tampa North I-75 Fletcher | 100.7% | 99.1% | 106.3% | 111.2% | 110.6% | 110.5% | 111.9% | 109.6% | 117.6% | ||
| Weighted Average(3) | 94.9% | 97.2% | 97.4% | 108.8% | 110.7% | 107.8% | 103.2% | 107.3% | 105.0% | ||
| (1) | Penetration Rates are from reports provided by a third party data provider. |
| (2) | Represents the trailing 12-month period ending on September 30, 2016. |
| (3) | Weighted by room count. |
The Market.
Holiday Inn Express Ft Myers East.The Holiday Inn Express Ft Myers is located on the east side of Fort Myers near I-75, within the Cape Coral-Fort Myers metropolitan statistical area (“MSA”). The property is located approximately 11 miles from downtown Fort Myers, 6.5 miles from Southwest Florida International Airport, and 14.0 miles from Florida Gulf Coast University. According to the appraisal, the Cape Coral-Fort Myers MSA had an estimated 2015 population of 701,200 people, which represents a compound annual growth rate of approximately 2.5% since 2010. As of August 2016, unemployment in the Cape Coral-Fort Myers MSA was 4.7%, compared to 4.9% for the state of Florida and 5.0% for the United States over the same time period.
Tourism is a major economic driver for Fort Myers and the surrounding MSA. According to the appraisal, tourism employs two of every three people in Lee County and generates an annual economic impact of approximately $2.87 billion and attracts roughly 5 million visitors per year. Visitors are drawn to Fort Myers’ various beaches and golf courses as well as the area’s restaurants, nightlife, and shopping. The biggest demand generator in the area is sports tourism. Each year, the Boston Red Sox and the Minnesota Twins hold their spring training in Fort Myers. Additionally, Perfect Game USA, which is a nationally recognized youth baseball league, has partnered with Lee County to host various tournaments and sporting events in the area. Other annual sporting events include The City of Palms Classic Basketball Tournament and the Gene Cusic Collegiate Classic, an NCAA softball tournament. Additional demand generators include Lee Memorial (a 355-bed hospital which is the primary hospital for the Lee Health system) and HealthPark Medical Center (a medical campus featuring a 368-bed acute care facility, a rehabilitation center and the Golisano Children’s Hospital of Southwest Florida). The appraisal identified one nearby hotel under construction, the 180-room Drury Inn & Suites, which is approximately 10.5 miles south of the property and is scheduled to open in 2017. The appraisal concluded that this hotel has a different target market and is not expected to compete with the Holiday Inn Express Ft Myers East.
Staybridge Suites Tampa East Brandon & Courtyard Tampa North I-75 Fletcher.The Staybridge Suites Tampa East Brandon and Courtyard Tampa North I-75 Fletcher are located within the Tampa-St. Petersburg-Clearwater MSA. The Staybridge Suites Tampa East Brandon is located off I-75, approximately 15 minutes east of downtown Tampa. The Courtyard Tampa North I-75 Fletcher is located off of I-75 in northeast Tampa, approximately three miles from the University of South Florida. According to the appraisal, the Tampa-St. Petersburg-Clearwater MSA had a 2015 population of 2,961,800 people, which represents a compound annual growth rate of approximately 1.21% since 2010. As of September 2016, unemployment in the Tampa-St. Petersburg-Clearwater MSA was 4.7%.
According to the appraisal, demand drivers for the Staybridge Suites Tampa East Brandon include the Highland Oaks Office Park, a 575,000 square foot development comprised of five buildings. Major tenants include McDonald’s Corporation, Opis Management Resources, Quality Distribution, Greystone Healthcare, Nortrax, Inc. and Virginia College. In 2016, United Services Automobile Association (“USAA”) unveiled its recently constructed Crosstown Campus approximately 4 miles from the property. The campus is USAA’s second facility in Tampa and will house a mix of financial services positions covering insurance, banking, and mortgage lending. The facility is expected to seat 1,200 employees. Located immediately adjacent to the Staybridge Suites Tampa East Brandon is Ford Motor Credit Co. and across the street is Citigroup Technology’s office campus.
The Courtyard Tampa North I-75 Fletcher is located within the Hidden River Corporate Center, a 420,000 square foot office park. Major tenants of the park include Lowe’s Home Improvement, Genesis Health Corporation, CareSync and most recently Johnson & Johnson signed a large lease to house approximately 500 finance, human resources and information technology employees. Additional demand generators include the H. Lee MOFFITT Cancer Center & Research Institute and Veterans Associate Hospital, located approximately 10 minutes from the property. The H. Lee MOFFITT Cancer Center is the only National Cancer Institute-designated Comprehensive Cancer Center based in Florida. The center is located within the University of South Florida campus. Additional demand in the area is from Busch Gardens, an African animal theme park owned by SeaWorld Entertainment. The park had 4.2 million visitors in 2015.
THE INFORMATION IN THIS STRUCTURAL AND COLLATERAL TERM SHEET IS NOT COMPLETE AND MAY BE AMENDED PRIOR TO THE TIME OF SALE. THIS TERM SHEET IS NOT AN OFFER TO SELL THESE SECURITIES AND IT IS NOT A SOLICITATION OF AN OFFER TO BUY THESE SECURITIES IN ANY JURISDICTION WHERE THE OFFER OR SALE IS NOT PERMITTED.
| 118 of 139 | |
| Structural and Collateral Term Sheet | JPMDB 2017-C5 | |
| AHIP FL 5 Portfolio | ||
According to the appraisal, there are several hotels proposed or recently opened in the Greater Tampa Bay area inclusive of an 84-room Hampton Inn near Busch Gardens which opened in September 2016. However, in consideration of the locations, branding, amenities and/or estimated performance of the proposed hotels, none were considered by the appraisal to be directly competitive with the Staybridge Suites Tampa East Brandon or Courtyard Tampa North I-75 Fletcher.
Holiday Inn Express Sarasota I-75.The Holiday Inn Express Sarasota I-75 is located on the east side of Sarasota off I-75, within the North Port-Sarasota-Bradenton MSA. According to the appraisal, the North Port-Sarasota-Bradenton MSA had an estimated 2015 population of 768,900, which represents a compound annual growth rate of approximately 1.6% since 2009. As of September 2016, unemployment in the North Port-Sarasota-Bradenton MSA was 4.7%. Sarasota is a tourist destination for winter and spring travelers. The area is known for its high quality beaches at Lido Key and Siesta Key. Additional demand drivers include Nathan Benderson Park, IMG Academy and Ed Smith Stadium (the spring training facility for the Baltimore Orioles). Nathan Benderson Park, located approximately 15 minutes from the Holiday Inn Express Sarasota I-75, is a rowing facility, sprint course, and regatta center. Nathan Benderson Park is also home to several paddle sport competitions as well as triathlon and cross country events. In 2017, the Nathan Benderson Park will host the World Rowing Championships and anticipates more than 40,000 athletes and spectators will visit the market. IMG Academy is a private athletic training institute for youth, high school, collegiate, and professional athletes located approximately 40 minutes from the Holiday Inn Express Sarasota I-75 in Bradenton. IMG Academy attracts more than 12,000 athletes from approximately 80 countries every year and offers a co-educational college preparatory school for the athletes. Finally, Twin Lakes Park is located approximately one mile from the Holiday Inn Express Sarasota I-75. Twin Lakes Park serves as a training base for minor and major league baseball teams. Twin Lakes Park features 11 baseball fields, a football field, picnic shelter, playground, two soccer fields, two tennis courts, and a walking trail.
According to the appraisal, there are no proposed hotels in the immediate area. Approximately eight miles north a 122-room Hyatt Place and a 133-room Homewood Suites are under construction and expected to open in 2017. These properties are under construction in Lakewood Ranch, which is not considered to be part of the market for the Holiday Inn Express Sarasota I-75. The appraisal notes that there are additional hotels planned for downtown Sarasota and Siesta Key, but given their locations and level of service, they were not considered by the appraisal to be competitive with the Holiday Inn Express Sarasota I-75.
Fairfield Inn & Suites Orlando Ocoee.The Fairfield Inn & Suites Orlando Ocoee is located in the Orlando, Florida suburb of Ocoee within the Orlando-Kissimmee-Sanford MSA. Ocoee is located approximately 12 miles west of the city of Orlando near the intersection of Florida’s Turnpike and Florida State Road 429. The property is located off Colonia Drive (HWY-50) which is the main east-west commercial corridor through Orlando. According to the appraisal, the Orlando-Kissimmee-Sanford MSA had an estimated 2015 population of 2,387,138, which represents a growth rate of approximately 11.6% from 2010.
Orlando’s economy is largely based around tourism centered around the theme parks in the area. According to the appraisal, in 2015, approximately 66 million travelers visited Orlando. Ocoee benefits from its location approximately 12 miles from Orlando. The city has a presence of diverse businesses that include Adventist Health System, Darden Restaurants, Lockheed Martin Corporation, CenturyLink, Florida Hospital, and Sysco. The appraisal identified one new hotel, a 122-room Hilton Garden Inn, which is anticipated to enter the market. The Hilton Garden Inn will be part of the City Center West Orange development. This hotel is expected to open in 2018 and will be directly competitive with the Fairfield Inn & Suites Orlando Ocoee property.
THE INFORMATION IN THIS STRUCTURAL AND COLLATERAL TERM SHEET IS NOT COMPLETE AND MAY BE AMENDED PRIOR TO THE TIME OF SALE. THIS TERM SHEET IS NOT AN OFFER TO SELL THESE SECURITIES AND IT IS NOT A SOLICITATION OF AN OFFER TO BUY THESE SECURITIES IN ANY JURISDICTION WHERE THE OFFER OR SALE IS NOT PERMITTED.
| 119 of 139 | |
| Structural and Collateral Term Sheet | JPMDB 2017-C5 | |
| AHIP FL 5 Portfolio | ||
| Operating History and Underwritten Net Cash Flow | ||||||
| 2014 | 2015 | TTM(1) | Underwritten | Per Room(2) | % of Total Revenue(3) | |
| Occupancy | 69.3% | 74.3% | 74.1% | 72.5% | ||
| ADR | $101.87 | $112.44 | $114.72 | $109.68 | ||
| RevPAR | $70.48 | $83.28 | $84.79 | $79.40 | ||
| Room Revenue | $12,168,079 | $14,377,926 | $14,677,908 | $13,707,937 | $28,981 | 96.8% |
| Food & Beverage Revenue | 137,352 | 150,955 | 156,849 | 165,000 | 349 | 1.2 |
| Other Departmental Revenue | 347,703 | 366,034 | 278,840 | 281,158 | 594 | 2.0 |
| Total Revenue | $12,653,134 | $14,894,915 | $15,113,597 | $14,154,095 | $29,924 | 100.0% |
| Room Expense | $2,817,981 | $2,921,400 | $3,079,578 | $2,941,567 | $6,219 | 21.5 |
| Food & Beverage Expense | 149,738 | 161,943 | 163,395 | 165,939 | 351 | 100.6 |
| Other Departmental Expenses | 236,638 | 174,241 | 122,580 | 111,199 | 235 | 39.6 |
| Departmental Expenses | $3,204,357 | $3,257,584 | $3,365,553 | $3,218,705 | $6,805 | 22.7% |
| Departmental Profit | $9,448,777 | $11,637,331 | $11,748,044 | $10,935,391 | $23,119 | 77.3% |
| Management Fees | 379,593 | 446,848 | 453,407 | 490,766 | 1,038 | 3.5 |
| Franchise Fees | 760,631 | 1,043,108 | 1,024,927 | 1,150,988 | 2,433 | 8.1 |
| Property Taxes | 407,269 | 484,567 | 542,057 | 572,563 | 1,210 | 4.0 |
| Property Insurance | 151,758 | 206,245 | 251,626 | 259,392 | 548 | 1.8 |
| Other Expenses | 3,042,366 | 3,337,705 | 3,502,622 | 3,302,867 | 6,983 | 23.3 |
| Total General/Unallocated Expenses | $4,741,617 | $5,518,473 | $5,774,639 | $5,776,576 | $12,213 | 40.8% |
| Net Operating Income | $4,707,160 | $6,118,858 | $5,973,405 | $5,158,816 | $10,907 | 36.4% |
| FF&E | 478,397 | 595,796 | 604,544 | 566,164 | 1,197 | 4.0 |
| Net Cash Flow | $4,228,763 | $5,523,062 | $5,368,861 | $4,592,650 | $9,710 | 32.4% |
| (1) | TTM column represents the trailing 12-month period ending on September 30, 2016. |
| (2) | Per Room values are based on 473 guest rooms |
| (3) | % of Total Revenue for Room Expense, Food & Beverage Expense and Other Departmental Expenses are based on their corresponding revenue line items. |
Property Release.After the lockout period, the borrower may obtain the release of an individual property upon a bona fide third-party sale provided, among other things, (i) borrowers defease an amount of principal equal to 110% of the allocated loan amount for the property being released and (ii) after giving effect to the sale and the defeasance, (a) the debt service coverage ratio for the remaining properties shall be no less than the greater of the debt service coverage ratio immediately preceding the sale and 1.67x and (b) the loan to value ratio for the remaining properties is no more than the lesser of the loan to value ratio immediately preceding the sale and 60.1%; provided, that if the debt yield for the remaining properties is 15% or higher, the release is not subject to such loan to value ratio condition; (iii) compliance with REMIC-related requirements; and (iv) at the lender’s request, receipt of rating agency confirmation.
THE INFORMATION IN THIS STRUCTURAL AND COLLATERAL TERM SHEET IS NOT COMPLETE AND MAY BE AMENDED PRIOR TO THE TIME OF SALE. THIS TERM SHEET IS NOT AN OFFER TO SELL THESE SECURITIES AND IT IS NOT A SOLICITATION OF AN OFFER TO BUY THESE SECURITIES IN ANY JURISDICTION WHERE THE OFFER OR SALE IS NOT PERMITTED.
| 120 of 139 | |
| Structural and Collateral Term Sheet | JPMDB 2017-C5 |
[THIS PAGE INTENTIONALLY LEFT BLANK]
THE INFORMATION IN THIS STRUCTURAL AND COLLATERAL TERM SHEET IS NOT COMPLETE AND MAY BE AMENDED PRIOR TO THE TIME OF SALE. THIS TERM SHEET IS NOT AN OFFER TO SELL THESE SECURITIES AND IT IS NOT A SOLICITATION OF AN OFFER TO BUY THESE SECURITIES IN ANY JURISDICTION WHERE THE OFFER OR SALE IS NOT PERMITTED.
| 121 of 139 | |
| Structural and Collateral Term Sheet | JPMDB 2017-C5 | |
| 580 Walnut Street | ||
| Mortgage Loan Information | Property Information | |||
| Mortgage Loan Seller: | GACC | Single Asset / Portfolio: | Single Asset | |
| Original Principal Balance: | $35,500,000 | Title: | Fee | |
| Cut-off Date Principal Balance: | $35,445,906 | Property Type - Subtype: | Mixed Use – Office/Retail | |
| % of Pool by IPB: | 3.4% | Net Rentable Area (SF): | 245,520 | |
| Loan Purpose: | Refinance | Location: | Cincinnati, OH | |
| Borrower: | Cincinnati 580 Commercial | Year Built / Renovated: | 1973 / 2016 | |
| Development, LLC | Occupancy(1): | 93.9% | ||
| Sponsors: | Anthony W. Birkla and David B. | Occupancy Date: | 1/1/2017 | |
| Anderson | Number of Tenants: | 10 | ||
| Interest Rate: | 4.74000% | 2013 NOI(1): | N/A | |
| Note Date: | 1/23/2017 | 2014 NOI(1): | $2,607,838 | |
| Maturity Date: | 2/6/2027 | 2015 NOI(1): | $3,075,622 | |
| Interest-only Period: | None | TTM NOI (as of 11/2016)(1)(2): | $2,822,308 | |
| Original Term: | 120 months | UW Economic Occupancy: | 92.5% | |
| Original Amortization: | 360 months | UW Revenues: | $5,814,172 | |
| Amortization Type: | Balloon | UW Expenses: | $1,830,831 | |
| Call Protection: | L(25),Def(91),O(4) | UW NOI(2): | $3,983,341 | |
| Lockbox / Cash Management: | Hard / Springing | UW NCF: | $3,676,441 | |
| Additional Debt: | N/A | Appraised Value / Per SF(3): | $51,750,000 / $211 | |
| Additional Debt Balance: | N/A | Appraisal Date: | 4/1/2017 | |
| Additional Debt Type: | N/A | |||
| Escrows and Reserves | Financial Information | |||||
| Initial | Monthly | Initial Cap | Cut-off Date Loan / SF(3): | $144 | ||
| Taxes: | $85,098 | $30,121 | N/A | Maturity Date Loan / SF(3): | $118 | |
| Insurance: | $41,113 | Springing | N/A | Cut-off Date LTV(3): | 68.5% | |
| Replacement Reserves: | $0 | $5,115 | N/A | Maturity Date LTV(3): | 55.9% | |
| TI/LC(4): | $2,330,975 | $20,460 | N/A | UW NCF DSCR: | 1.66x | |
| Other(5): | $0 | Springing | N/A | UW NOI Debt Yield: | 11.2% | |
| Sources and Uses | ||||||
| Sources | Proceeds | % of Total | Uses | Proceeds | % of Total | |
| Mortgage Loan | $35,500,000 | 100.0% | Payoff Existing Debt | $27,920,156 | 78.6% | |
| Return of Equity | 4,074,727 | 11.5 | ||||
| Upfront Reserves | 2,457,186 | 6.9 | ||||
| Closing Costs | 1,047,931 | 3.0 | ||||
| Total Sources | $35,500,000 | 100.0% | Total Uses | $35,500,000 | 100.0% | |
| (1) | Since acquisition, the loan sponsors indicated they have invested approximately $21.55 million, approximately ($87.77 per square foot), towards the development and renovation of the property, including approximately $3.6 million in tenant improvements and $1.6 million in building improvements. Occupancy increased from 66.3% in 2014 to 93.9% in January 2017. The loan sponsors acquired the property in 2013, as such, 2013 NOI is not available. The increase in NOI from 2015 to TTM (as of 11/2016) is due to new lease signings, including the expansion of Fifth Third Bank in March and October 2016 from 132,856 square feet to 198,116 square feet. |
| (2) | The increase in UW NOI from TTM NOI is due to the commencement of Fifth Third Bank’s rental payments on 32,630 square feet of its expansion space, as well as the commencement of full unabated rental payments on new leases. |
| (3) | Appraised Value / Per SF, Cut-off Date LTV and Maturity Date LTV are calculated based on the “As Complete / Stabilized” appraised value. The “As Complete / Stabilized” appraised value represents the value of $51,750,000 which assumes (i) completion of the landlord obligations reserved at closing, (ii) a commercial and retail occupancy of 95.0% and 90.0%, respectively, (iii) vacancy loss of 5.0% and (iv) credit loss of 0.5%. Based on the “as-is” appraised value of $50,000,000 as of November 10, 2016, the Cut-off Date LTV is 70.9% and the Maturity Date LTV would be 57.9%. |
| (4) | Initial TI/LC Escrows and Reserves include outstanding landlord obligations with respect to the Fifth Third Bank and Taco Bell leases. |
| (5) | Monthly Other Escrows and Reserves represent a common charges reserve and a lease sweep reserve. The common charges reserve will spring into effect from and after the date the condominium board imposes assessments, and such monthly amount will be equal to the monthly amount as set forth in the approved budget for such assessments. A lease sweep reserve will spring into place upon (a) (i) the date that is 18 months prior to the lease expiration date of Fifth Third Bank, (ii) the date Fifth Third Bank is required to give notice of renewal (if not given), (iii) with respect to any Fifth Third Bank lease that is set to expire on or prior to July 1, 2028, the monthly payment date occurring in January 2026, (b) the date Fifth Third Bank surrenders, cancels or terminates its lease, (c) the date Fifth Third Bank goes dark, unless Fifth Third Bank at the time has a credit rating greater than or equal to “BBB-” or an equivalent by each rating agency rating such tenant, (d) upon any default under the Fifth Third Bank lease beyond any applicable cure period, (e) the occurrence of a Fifth Third Bank insolvency proceeding or (f) upon Fifth Third Bank’s credit rating falling below “BBB-” or the equivalent by any rating agency rating such tenant. |
THE INFORMATION IN THIS STRUCTURAL AND COLLATERAL TERM SHEET IS NOT COMPLETE AND MAY BE AMENDED PRIOR TO THE TIME OF SALE. THIS TERM SHEET IS NOT AN OFFER TO SELL THESE SECURITIES AND IT IS NOT A SOLICITATION OF AN OFFER TO BUY THESE SECURITIES IN ANY JURISDICTION WHERE THE OFFER OR SALE IS NOT PERMITTED.
| 122 of 139 | |
| Structural and Collateral Term Sheet | JPMDB 2017-C5 | |
| 580 Walnut Street | ||
The Loan. The 580 Walnut Street loan is secured by a first mortgage lien on the borrower’s fee interest in a 245,520 square foot commercial component of a larger 849,507 square foot mixed use commercial and residential building located in Cincinnati, Ohio. The loan has a 10-year term and will amortize on a 30-year schedule. The borrowing entity for the 580 Walnut Street loan is Cincinnati 580 Commercial Development, LLC, a newly formed Delaware limited liability company and special purpose entity. The loan sponsors and nonrecourse carve-out guarantors are Anthony W. Birkla and David B. Anderson, both principals at Anderson Birkla Investment Partners, LLC. Formed in 2007, Anderson Birkla Investment Partners is an Indianapolis based real estate owner and operator engaged in the construction and management of lifestyle residential projects. The company’s portfolio spans approximately 1.25 million square feet of developments that are mixed use in nature, including office, retail, hospitality and residential.
The Property. The 580 Walnut Street property consists of the 245,520 square foot office and retail portions of the larger 849,507 square foot AT580 building, as well as a 430-space parking garage. The building is split into six separate condominium structures, including four commercial components (collateral for the 580 Walnut Street loan) and two residential components (non-collateral) currently owned by the loan sponsor. The commercial component is configured with retail space on the ground and plaza levels, office space on the upper six floors and a five level underground parking garage. The office and retail spaces comprise 201,579 square feet (82.1% of the net rentable area) and 43,941 square feet (17.9% of the net rentable area), respectively. The parking garage consists of 430 parking spaces on five below-grade levels, for a parking ratio of 1.75 spaces per 1,000 square feet. The non-collateral residential portion of the AT580 building consists of 180 luxury multifamily units occupying the top 10 floors. The mortgage loan seller has made a loan in the amount of $34,680,000 secured by the residential portion of the AT580 building, which will not be included in the JPMDB 2017-C5 trust.
The AT580 building was originally constructed in 1973 and underwent an approximately $15 million renovation in 2005 by previous ownership. In 2011, Great American Insurance, which occupied a majority of the building relocated to Queen City Square, which now serves as their headquarters. As a result, the AT580 building’s occupancy fell to 27.0%. In 2013, the loan sponsors acquired the fee simple interest of the building along with a 0.433 acre parking lot from a foreclosing lender for $13.7 million. Following the purchase, the loan sponsors immediately sold the parking lot and began to convert the former office and retail property into its current mixed use development. The loan sponsors’ basis in the commercial portion of the property is approximately $33.3 million ($136 per square foot), of which approximately $11.5 million was spent towards acquisition costs. The sponsors spent an additional $21.55 million towards the renovation and conversion of the property.
The office space at the 580 Walnut Street property includes six levels plus the Fifth Third Bank conference center. The office portion of the collateral is 100.0% leased, with 98.3% of office space leased to Fifth Third Bank (rated Baa1/A/BBB+ by Moody’s, Fitch and S&P, respectively), whose original lease commenced in 1996. In March 2016, and subsequently in October 2016, Fifth Third Bank expanded its footprint from 132,856 square feet to a total of 198,116 square feet. The Fifth Third Bank headquarters building, which is owned by Fifth Third Bank, are located adjacent to the 580 Walnut Street building. The retail component consists of 43,255 square feet spanning the first and second levels. The tenants on the first level include restaurants Sushi Cafe World of Cincinnati, Prime 47 Cincinnati LLC, Mungo Inc and Starbucks, which all feature frontage along Sixth Street. Sixth Street leads to Fountain Square, which features retail and restaurants in Cincinnati’s central business district. The garage component includes 430 spaces and is leased to and operated by ABM Parking Services, Inc. through August 31, 2021 at an annual base rent of $750,000 with no annual escalations. ABM Parking Services, Inc. is also required to pay a percentage rent equivalent to 85% of gross parking receipts in excess of $1.0 million. Of the 430 spaces, 111 are reserved for the exclusive use of the residential tenants at a cost of $100 per month per space. The residential and commercial components of the condominium each have 50% control over the entire condominium, both with respect to the Board of Directors as well as any voting. The loan sponsors currently own and control the residential condominium units and the borrower owns and controls the commercial condominium units. Accordingly, the borrower does not have control over the entire condominium. According to an anticipated timeline provided by the loan sponsor, residential condominium is expected to be completed by June 2017. As of December 16, 2016, 45 units had signed leases and tenants in occupancy.
The largest tenant, Fifth Third Bank, is a subsidiary of Fifth Third Bancorp (NASDAQ: FITB, rated Baa1/A/BBB+ by Moody’s, Fitch and S&P, respectively) leases 80.7% of the net rentable area and 98.3% of the net rentable office area and has been a tenant at the property since 1996. Fifth Third Bank is a U.S. regional banking corporation, headquartered in Cincinnati, Ohio at the Fifth Third Center. The company’s main business areas include branch banking, consumer banking, commercial banking, consumer lending, payment processing, investment advising, and title insurance. Founded in 1858, the company now employs over 20,000 people. In recent years Fifth Third Bank has been consolidating its office space from outlying branches into downtown Cincinnati. In March 2016, and subsequently in October 2016, Fifth Third Bank expanded from 132,856 square feet to a total of 198,116 square feet with a lease expiration in December 2025. The 10,352 square foot conference center space expires in December 2020 and has one five-year renewal option to extend the lease expiration to December 2025. Fifth Third Bank has reportedly invested $800,000 of its own capital in a major renovation of their 6th floor space at the property. The estimated headcount at the property is approximately 700 employees, with job functions spanning compliance, credit/risk management, enterprise performance, IT, human resources and wealth management.
THE INFORMATION IN THIS STRUCTURAL AND COLLATERAL TERM SHEET IS NOT COMPLETE AND MAY BE AMENDED PRIOR TO THE TIME OF SALE. THIS TERM SHEET IS NOT AN OFFER TO SELL THESE SECURITIES AND IT IS NOT A SOLICITATION OF AN OFFER TO BUY THESE SECURITIES IN ANY JURISDICTION WHERE THE OFFER OR SALE IS NOT PERMITTED.
| 123 of 139 | |
| Structural and Collateral Term Sheet | JPMDB 2017-C5 | |
| 580 Walnut Street | ||
The Market.According to the appraisal, the 580 Walnut Street is located in the central business district of Downtown Cincinnati, northeast of Fountain Square. The location offers proximity to a variety of office, retail, and institutional properties. The Cincinnati central business district has a large array of office, retail and institutional properties that surround the property. The central business district consists of nearly 13 million square feet of office space and is home to seven Fortune 500 companies including American Financial Group, Fifth Third Bank, Kroger, Macy’s, Omnicare, Western and Southern Financial Group and Procter & Gamble. The area is in proximity to the Aronoff Center for the Arts, a performance venue consisting of three individual spaces with seating for 2,700, 437 or 150 people, respectively. Additional artistic draw includes the Cincinnati Contemporary Arts Center, located adjacent to the property at the northwest corner of Walnut Street and Sixth Street. The Class A Cincinnati Office Market contains a total inventory of approximately 12.0 million square feet throughout 741 buildings. The Cincinnati central business district contains 9.5 million square feet throughout 20 buildings, representing approximately 78% of total office space in the Cincinnati City market. According to a third party market report, Cincinnati currently has a 4.5% unemployment rate, which is forecasted to decrease to 3.2%. In July 2014, a business magazine named Cincinnati as one of its five cities with up-and-coming downtowns.
Per the appraisal, the Greater Cincinnati asking office lease rates increased from $18.80 per square foot in second quarter 2016 to $18.91 per square foot in third quarter 2016, while central business district asking office lease rates increased from $20.87 per square foot in second quarter 2016 to $20.92 per square foot in third quarter 2016. In addition, theGreater Cincinnati office vacancy rate decreased to 19.0% in third quarter 2016 from 19.4% in second quarter 2016. In the same time period, office vacancy rate in the central business district fell from 15.9% to 15.4% and suburban office vacancy rate decreased from 21.1% to 20.9%. The appraisal identified 20 comparable office lease signings in the submarket. The weighted average in place office rent at the property is $10.47 per square foot, approximately 14.1% below the weighted average office rent (NNN) of $12.18 per square foot of the comparable set. The appraisal also identified 15 comparable retail lease signings in the submarket. The weighted average in place retail rent at the property is $25.43 per square foot, approximately 14.3% below the weighted average in place retail rent of $29.68 per square foot of the comparable set.
| Tenant Summary(1) | ||||||||
| Tenant | Retail/Office Component | Ratings(2) | Net Rentable Area (SF) | % of | Base Rent PSF | % of Total Base Rent | Lease Expiration Date | |
| Fifth Third Bank(3) | Office | Baa1 / BBB+ / A | 198,116 | 80.7% | $10.73 | 73.1% | Various | |
| Prime 47 Cincinnati LLC | Ground Floor Retail | NA / NA / NA | 8,724 | 3.6% | $28.96 | 8.7% | 7/31/2026 | |
| Starbucks(4) | Office/Ground Floor Retail | A2 / A / A | 5,607 | 2.3% | $17.11 | 3.3% | Various | |
| Pi Cincinnati LLC | Ground Floor Retail | NA / NA / NA | 3,843 | 1.6% | $26.01 | 3.4% | 1/31/2025 | |
| Sushi Cafe World of Cincinnati | Ground Floor Retail | NA / NA / NA | 3,621 | 1.5% | $28.64 | 3.6% | 1/31/2020 | |
| Gourmet Management LLC | Arcade Level Commercial | NA / NA / NA | 3,168 | 1.3% | $15.23 | 1.7% | 3/31/2020 | |
| Mungo Inc | Ground Floor Retail | NA / NA / NA | 2,923 | 1.2% | $20.76 | 2.1% | 8/31/2026 | |
| The Silver Ladle LLC | Ground Floor Retail | NA / NA / NA | 2,405 | 1.0% | $28.00 | 2.3% | 3/31/2020 | |
| Taco Bell(5) | Ground Floor Retail | B2 / BB / NA | 1,875 | 0.8% | $26.50 | 1.7% | 3/31/2027 | |
| Off the Vine | Arcade Level Commercial | NA / NA / NA | 188 | 0.1% | $25.53 | 0.2% | 12/31/2018 | |
| (1) | Based on the underwritten rent roll. |
| (2) | Ratings provided are for the parent company of the entity listed in the “Tenant” field whether or not the parent company guarantees the lease. |
| (3) | Fifth Third Bank leases 10,352 square feet of conference center space at $10.61 per square foot expiring in December 2020. In addition to the conference center space, Fifth Third Bank leases 187,764 square feet of office space at $10.44 per square foot expiring in December 2025. |
| (4) | Starbucks leases 3,463 square feet of office space at $11.60 per square foot expiring in December 2021. In addition, Starbucks leases 2,144 square feet of retail space at $26.00 per square foot expiring in April 2025. Starbucks has the right to terminate the retail portion of its lease in April 2020 with at least 180 days’ notice and pay a termination fee equal to unamortized leasing commissions and tenant improvement allowance. Starbucks has two five-year renewal options remaining for the retail portion of its net rentable area and two three-year renewal options remaining for the office portion of its net rentable area. |
| (5) | Taco Bell has the right to terminate its lease after December 2019 with at least 180 days’ written notice and a termination fee equal to 12 months’ rent and unamortized leasing commissions and tenant improvement allowance. Taco Bell has two five-year renewal options remaining. |
THE INFORMATION IN THIS STRUCTURAL AND COLLATERAL TERM SHEET IS NOT COMPLETE AND MAY BE AMENDED PRIOR TO THE TIME OF SALE. THIS TERM SHEET IS NOT AN OFFER TO SELL THESE SECURITIES AND IT IS NOT A SOLICITATION OF AN OFFER TO BUY THESE SECURITIES IN ANY JURISDICTION WHERE THE OFFER OR SALE IS NOT PERMITTED.
| 124 of 139 | |
| Structural and Collateral Term Sheet | JPMDB 2017-C5 | |
| 580 Walnut Street | ||
| Lease Rollover Schedule(1)(2) | |||||||||||||||
| Year | Number of Leases Expiring | Net Rentable Area Expiring | % of NRA Expiring | Base Rent Expiring(2) | % of Base Rent Expiring(2) | Cumulative Net Rentable Area Expiring | Cumulative % of NRA Expiring | Cumulative Base Rent Expiring(2) | Cumulative % of Base Rent Expiring(2) | ||||||
| Vacant | NAP | 15,050 | 6.1 | % | NAP | NAP | 15,050 | 6.1% | NAP | NAP | |||||
| 2017 & MTM | 0 | 0 | 0.0 | $0 | 0.0 | % | 15,050 | 6.1% | $0 | 0.0% | |||||
| 2018 | 1 | 188 | 0.1 | 4,800 | 0.2 | 15,238 | 6.2% | $4,800 | 0.2% | ||||||
| 2019 | 0 | 0 | 0.0 | 0 | 0.0 | 15,238 | 6.2% | $4,800 | 0.2% | ||||||
| 2020 | 5 | 19,546 | 8.0 | 332,435 | 11.4 | 34,784 | 14.2% | $337,235 | 11.6% | ||||||
| 2021 | 1 | 3,463 | 1.4 | 40,171 | 1.4 | 38,247 | 15.6% | $377,406 | 13.0% | ||||||
| 2022 | 0 | 0 | 0.0 | 0 | 0.0 | 38,247 | 15.6% | $377,406 | 13.0% | ||||||
| 2023 | 0 | 0 | 0.0 | 0 | 0.0 | 38,247 | 15.6% | $377,406 | 13.0% | ||||||
| 2024 | 0 | 0 | 0.0 | 0 | 0.0 | 38,247 | 15.6% | $377,406 | 13.0% | ||||||
| 2025 | 5 | 193,751 | 78.9 | 2,168,107 | 74.5 | 231,998 | 94.5% | $2,545,513 | 87.5% | ||||||
| 2026 | 2 | 11,647 | 4.7 | 313,351 | 10.8 | 243,645 | 99.2% | $2,858,865 | 98.3% | ||||||
| 2027 | 1 | 1,875 | 0.8 | 49,688 | 1.7 | 245,520 | 100.0% | $2,908,552 | 100.0% | ||||||
| 2028 & Beyond | 0 | 0 | 0.0 | 0 | 0.0 | 245,520 | 100.0% | $2,908,552 | 100.0% | ||||||
| Total | 15 | 245,520 | 100.0 | % | $2,908,552 | 100.0 | % | ||||||||
| (1) | Based on the underwritten rent roll. |
| (2) | Certain tenants may have termination or contraction options that may become exercisable prior to the originally stated expiration date of the tenant lease that are not considered in this lease rollover schedule. |
| Operating History and Underwritten Net Cash Flow(1) | ||||||||
| 2014 | 2015 | TTM(2) | Underwritten | Per Square Foot | %(3) | |||
| Rents in Place(4)(5) | $2,077,172 | $2,376,919 | $2,062,817 | $2,908,552 | $11.85 | 47.1 | % | |
| IG Rent Credit | 0 | 0 | 0 | 230,182 | 0.94 | 3.7 | ||
| Vacant Income | 0 | 0 | 0 | 232,445 | 0.95 | 3.8 | ||
| Gross Potential Rent | $2,077,172 | $2,376,919 | $2,062,817 | $3,371,179 | $13.73 | 54.6 | % | |
| Total Reimbursements | 751,739 | 921,668 | 819,666 | 1,482,706 | 6.04 | 24.0 | ||
| Parking Income | 1,116,689 | 1,216,150 | 1,318,597 | 1,324,328 | 5.39 | 21.4 | ||
| Net Rental Income | $3,945,600 | $4,514,737 | $4,201,080 | $6,178,214 | $25.16 | 100.0 | % | |
| (Vacancy/Credit Loss)(6) | 0 | (40,521) | (43,750) | (364,041) | (1.48) | (7.5) | ||
| Effective Gross Income | $3,945,600 | $4,474,216 | $4,157,331 | $5,814,172 | $23.68 | 94.1 | % | |
| Total Expenses | $1,337,762 | $1,398,593 | $1,335,023 | $1,830,831 | $7.46 | 31.5 | % | |
| Net Operating Income | $2,607,838 | $3,075,622 | $2,822,308 | $3,983,341 | $16.22 | 68.5 | % | |
| Total TI/LC, Capex/RR | 0 | 0 | 0 | 306,900 | 1.25 | 5.3 | ||
| Net Cash Flow | $2,607,838 | $3,075,622 | $2,822,308 | $3,676,441 | $14.97 | 63.2 | % | |
| Occupancy(7) | 66.3% | 69.0% | 93.9% | 92.5% | ||||
| (1) | The loan sponsors acquired the property in 2013, as such, 2013 information is not available. |
| (2) | The TTM column represents the trailing 12-month period ending on November 30, 2016. |
| (3) | % column represents percent of Net Rental Income for all revenue lines and represents percent of Effective Gross Income for the remainder of fields. |
| (4) | Underwritten Rents in Place contractual steps rent through January 2018. |
| (5) | The increase in Underwritten Rents in Place from TTM Rents in Place is due to the commencement of Fifth Third Bank’s rental payments on 32,630 square feet of its expansion space, as well as the commencement of full unabated rental payments on new leases. |
| (6) | The Underwritten Vacancy/Credit Loss % is 7.5% of Net Rental Income excluding parking income of $1,324,328. |
| (7) | Historical Occupancies are as of December 31 of each year. TTM Occupancy represents occupancy as of January 1, 2017. Underwritten Occupancy represents economic occupancy. |
THE INFORMATION IN THIS STRUCTURAL AND COLLATERAL TERM SHEET IS NOT COMPLETE AND MAY BE AMENDED PRIOR TO THE TIME OF SALE. THIS TERM SHEET IS NOT AN OFFER TO SELL THESE SECURITIES AND IT IS NOT A SOLICITATION OF AN OFFER TO BUY THESE SECURITIES IN ANY JURISDICTION WHERE THE OFFER OR SALE IS NOT PERMITTED.
| 125 of 139 | |
| Structural and Collateral Term Sheet | JPMDB 2017-C5 | |
| Delamar Greenwich Harbor | ||
| Mortgage Loan Information | Property Information | |||
| Mortgage Loan Seller: | JPMCB | Single Asset / Portfolio: | Single Asset | |
| Original Principal Balance: | $35,500,000 | Title: | Fee | |
| Cut-off Date Principal Balance: | $35,377,503 | Property Type - Subtype: | Hotel – Full Service | |
| % of Pool by IPB: | 3.4% | Net Rentable Area (Rooms): | 82 | |
| Loan Purpose: | Refinance | Location: | Greenwich, CT | |
| Borrowers: | Greenwich Harbor (DEL) LLC | Year Built / Renovated: | 1961 / 2012 | |
| and Delamar Hotel Corp. | Occupancy / ADR / RevPAR: | 72.7% / $323.02 / $234.70 | ||
| Sponsors: | Charles Mallory and | Occupancy / ADR / RevPAR Date: | 10/31/2016 | |
| James Cabrera | Number of Tenants: | N/A | ||
| Interest Rate: | 5.25500% | 2013 NOI: | $2,957,429 | |
| Note Date: | 11/14/2016 | 2014 NOI: | $3,192,658 | |
| Maturity Date: | 12/1/2026 | 2015 NOI: | $3,513,537 | |
| Interest-only Period: | None | TTM NOI (as of 10/2016): | $3,717,072 | |
| Original Term: | 120 months | UW Occupancy / ADR / RevPAR: | 72.7% / $323.02 / $234.70 | |
| Original Amortization: | 360 months | UW Revenues: | $9,676,636 | |
| Amortization Type: | Balloon | UW Expenses: | $6,023,582 | |
| Call Protection: | L(25),Grtr1%orYM(91),O(4) | UW NOI: | $3,653,055 | |
| Lockbox / Cash Management: | Hard / Springing | UW NCF: | $3,653,055 | |
| Additional Debt: | N/A | Appraised Value / Per Room: | $50,000,000 / $609,756 | |
| Additional Debt Balance: | N/A | Appraisal Date: | 10/1/2016 | |
| Additional Debt Type: | N/A | |||
| Escrows and Reserves | Financial Information | ||||||
| Initial | Monthly | Initial Cap | Cut-off Date Loan / Room: | $431,433 | |||
| Taxes: | $120,303 | $20,640 | N/A | Maturity Date Loan / Room: | $358,822 | ||
| Insurance: | $0 | Springing | N/A | Cut-off Date LTV: | 70.8% | ||
| FF&E(1): | $31,450 | 4% of Gross Revenues | N/A | Maturity Date LTV: | 58.8% | ||
| TI/LC: | $0 | $0 | N/A | UW NCF DSCR: | 1.55x | ||
| Other: | $0 | $0 | N/A | UW NOI Debt Yield: | 10.3% | ||
| Sources and Uses | |||||||
| Sources | Proceeds | % of Total | Uses | Proceeds | % of Total | ||
| Mortgage Loan | $35,500,000 | 98.6% | Payoff Existing Mortgage | $35,232,582 | 97.8% | ||
| Sponsor Equity | 515,476 | 1.4 | Closing Costs | 631,141 | 1.8% | ||
| Upfront Reserves | 151,753 | 0.4% | |||||
| Total Sources | $36,015,476 | 100.0% | Total Uses | $36,015,476 | 100.0% | ||
(1) The deposit for the Monthly FF&E Escrows and Reserves is 4.0% of gross income from operations for the calendar month that was two months prior to the applicable payment date.
The Loan.The Delamar Greenwich Harbor loan is secured by a first mortgage lien on the fee interest in an 82-room full service hotel located in Greenwich, Connecticut. The loan has an outstanding principal balance as of the Cut-off Date of approximately $35.4 million, has a 10-year term and will amortize on a 30-year schedule. The previous debt secured by the property was securitized as part of the LBUBS 2007-C2 transaction. The borrowing entities for the loan are Greenwich Harbor (DEL) LLC, a Delaware limited liability company and Delamar Hotel Corp., a Connecticut corporation, each a special purpose entity. There is an operating lease between the two borrowers, and the borrowers have pledged the fee interest as collateral for the loan. The loan sponsors and nonrecourse carve-out guarantors are Charles Mallory and James Cabrera. Charles Mallory is the founder and Chief Executive Officer of Greenwich Hospitality Group, LLC (“Greenwich Hospitality Group”), a developer, owner and operator of lifestyle hospitality assets. Founded in 1999, the company’s portfolio currently consists of seven hospitality assets representing 380 rooms throughout the northeastern United States and Texas. Greenwich Hospitality Group has an additional 226 rooms under construction and 124 rooms under renovation which the loan sponsors anticipate to be placed into service in 2017.
THE INFORMATION IN THIS STRUCTURAL AND COLLATERAL TERM SHEET IS NOT COMPLETE AND MAY BE AMENDED PRIOR TO THE TIME OF SALE. THIS TERM SHEET IS NOT AN OFFER TO SELL THESE SECURITIES AND IT IS NOT A SOLICITATION OF AN OFFER TO BUY THESE SECURITIES IN ANY JURISDICTION WHERE THE OFFER OR SALE IS NOT PERMITTED.
| 126 of 139 | |
| Structural and Collateral Term Sheet | JPMDB 2017-C5 | |
| Delamar Greenwich Harbor | ||
The Property. The Delamar Greenwich Harbor property is a four-story, 82-room, full service hotel located within Fairfield County in Greenwich, Connecticut. The property is the only waterfront hotel in Greenwich, Connecticut, which, according to the appraisal, is one of the most affluent cities in the United States. The property was originally built as the Showboat Hotel in 1961, and in 1997 the loan sponsors purchased the property for $13.0 million. According to the loan sponsors, they subsequently completed a $17.0 million ($207,317 per room) renovation in 2002 in order to reposition it as a luxury hotel. The property features 82 guest rooms, comprised of 58 king guest rooms, six queen guest rooms, 10 double/double guest rooms and eight suites (including two presidential suites). Standard guest room amenities include a flat-screen television, a desk, Bvlgari bath amenities, an iPod docking station, a minibar, an in-room safe, Roomlinx in-room entertainment system and individually controlled heat and air conditioning. Complimentary amenities at the property include champagne upon check-in, a fitness center, bike rentals, high speed-internet access, weekend wine and cheese receptions, harbor cruises and a daily continental breakfast as well as tea and coffee service. Additional amenities include room service, a hotel shuttle via Tesla, an electric vehicle charging station and valet parking. The property also has 88 surface parking spaces (which results in a parking ratio of 1.07 spaces per room).
The Delamar Greenwich Harbor property offers 2,350 square feet of meeting space, a business center, L’escale Restaurant and bar, a spa and a 500-foot private dock that can accommodate vessels up to 180 feet in length. L’escale Restaurant offers outdoor seating overlooking the Greenwich Harbor waterfront and serves as a meeting place for companies located in Greenwich. L’escale Restaurant has leased its space at the property since 2002 and reported sales of over $2,100 per square foot in 2015. Additionally, the spa at the property experienced revenue growth of 99.0% from 2013 to October 2016 after undergoing a renovation and was voted “Best Day Spa in Connecticut” for the past two years by Connecticut Magazine. Hotel guests may choose from a wide array of treatments including nail services, waxing, facials and body treatments by Biologique Recherche and Valmont.
The Market.The property is located approximately 33.0 miles north of New York City and within 0.3 miles of the Metro-North Greenwich train station, which offers express train service to Grand Central Station in less than 40 minutes. Greenwich is home to many large financial institutions and investment management funds such as AMG Funds, General Atlantic Corporation, Blue Harbor Group, Sarissa Capital Management, WR Berkley Corporation, SPCP Group, Lone Pine Capital, AQR Capital Management, Mastercard, Partnerre US, Aristela Capital, Forester Capital and Tudor Investment Group, among others. In addition to Metro-North Railroad, the property is also accessible via Interstate 95. The property is proximate to the Greenwich Avenue corridor, which includes retailers such as Tiffany & Co., Brooks Brothers, Saks Fifth Avenue and Ralph Lauren. The Delamar Greenwich Harbor property is also located in close proximity to several country clubs including Greenwich Country Club, the Milbrook Club and several Yacht Clubs including the Greenwich Boat and Yacht Club and Indian Harbor Yacht Club.
| Historical Occupancy, ADR, RevPAR | |||||||||
| Competitive Set(1) | Delamar Greenwich Harbor(2) | Penetration Factor(3) | |||||||
| Year | Occupancy | ADR | RevPAR | Occupancy | ADR | RevPAR | Occupancy | ADR | RevPAR |
| 2013 | 72.3% | $160.16 | $115.82 | 67.1% | $308.83 | $207.26 | 92.8% | 192.8% | 179.0% |
| 2014 | 74.5% | $164.86 | $122.81 | 70.6% | $310.16 | $218.84 | 94.8% | 188.1% | 178.2% |
| 2015 | 71.6% | $177.56 | $127.07 | 71.1% | $313.20 | $222.57 | 99.3% | 176.4% | 175.2% |
| TTM(4) | 71.8% | $175.21 | $125.87 | 72.7% | $323.02 | $234.70 | 101.3% | 184.4% | 186.5% |
| (1) | Data provided by Smith Travel Research (“STR”). The competitive set contains the following properties: Sheraton Hotel Stamford, Hyatt Regency Greenwich, Courtyard Stamford Downtown, Ritz-Carlton New York Westchester and J House Greenwich. |
| (2) | Based on operating statements provided by the borrowers. |
| (3) | Penetration Factor is calculated based on data provided by STR for the competitive set and operating statements provided by the borrowers for the property. |
| (4) | TTM represents the trailing 12-month period ending on October 31, 2016. |
THE INFORMATION IN THIS STRUCTURAL AND COLLATERAL TERM SHEET IS NOT COMPLETE AND MAY BE AMENDED PRIOR TO THE TIME OF SALE. THIS TERM SHEET IS NOT AN OFFER TO SELL THESE SECURITIES AND IT IS NOT A SOLICITATION OF AN OFFER TO BUY THESE SECURITIES IN ANY JURISDICTION WHERE THE OFFER OR SALE IS NOT PERMITTED.
| 127 of 139 | |
| Structural and Collateral Term Sheet | JPMDB 2017-C5 | |
| Delamar Greenwich Harbor | ||
| Competitive Hotels Profile(1) | |||||||||
| 2015 Estimated Market Mix | 2015 Estimated Operating Statistics | ||||||||
| Property | Rooms | Year Opened | Meeting Space (SF) | Commercial | Meeting and Group | Leisure | Occupancy | ADR | RevPAR |
| Delamar Greenwich Harbor(2) | 82 | 2002 | 2,350 | 50% | 20% | 30% | 71.1% | $313.20 | $222.57 |
| Sheraton Hotel Stamford | 379 | 1983 | 20,000 | 65% | 25% | 10% | 68.0% | $160.00 | $108.80 |
| Hyatt Regency Greenwich | 373 | 1986 | 35,000 | 60% | 30% | 10% | 77.0% | $140.00 | $107.80 |
| Courtyard Stamford Downtown | 115 | 2005 | 877 | 70% | 20% | 10% | 77.0% | $190.00 | $146.30 |
| Ritz-Carlton New York, Westchester | 146 | 2007 | 10,000 | 60% | 30% | 10% | 65.0% | $305.00 | $198.25 |
| J House Greenwich | 86 | 2012 | 3,000 | 50% | 20% | 30% | 71.0% | $210.00 | $149.10 |
| Total(3) | 1,099 | ||||||||
| (1) | Based on the appraisal. |
(2) The property was built in 1961 as the Showboat Hotel and reopened in 2002 under its current name. Occupancy, ADR and RevPAR are based on operating statements provided by the borrowers.
(3) Excludes the Delamar Greenwich Harbor property.
| Operating History and Underwritten Net Cash Flow | ||||||||
| 2013 | 2014 | 2015 | TTM(1) | Underwritten | Per Room(2) | % of Total Revenue(3) | ||
| Occupancy | 67.1% | 70.6% | 71.1% | 72.7% | 72.7% | |||
| ADR | $308.83 | $310.16 | $313.20 | $323.02 | $323.02 | |||
| RevPAR(4) | $207.26 | $218.84 | $222.57 | $234.70 | $234.70 | |||
| Room Revenue | $6,203,165 | $6,549,909 | $6,661,406 | $7,043,822 | $7,043,774 | $85,900 | 72.8% | |
| Food and Beverage Revenue | 73,874 | 72,399 | 74,938 | 78,888 | 78,887 | 962 | 0.8% | |
| Other Departmental Revenue(5) | 1,905,091 | 2,393,104 | 2,422,834 | 2,553,991 | 2,553,975 | 31,146 | 26.4% | |
| Total Revenue | $8,182,130 | $9,015,412 | $9,159,178 | $9,676,701 | $9,676,636 | $118,008 | 100.0% | |
| Room Expense | $1,715,692 | $1,814,635 | $1,858,110 | $1,868,908 | $1,868,895 | $22,791 | 26.5% | |
| Food and Beverage Expense | 29,648 | 29,349 | 29,370 | 36,808 | 36,808 | 449 | 46.7% | |
| Other Departmental Expense | 519,570 | 847,134 | 790,501 | 858,435 | 858,429 | 10,469 | 33.6% | |
| Departmental Expenses | $2,264,910 | $2,691,118 | $2,677,981 | $2,764,151 | $2,764,132 | $33,709 | 28.6% | |
| Departmental Profit | $5,917,220 | $6,324,294 | $6,481,197 | $6,912,550 | $6,912,504 | $84,299 | 71.4% | |
| Operating Expenses | $2,145,642 | $2,220,270 | $2,044,315 | $2,216,477 | $2,256,196 | $27,515 | 23.3% | |
| Gross Operating Profit | $3,771,578 | $4,104,024 | $4,436,882 | $4,696,073 | $4,656,308 | $56,784 | 48.1% | |
| Management Fees | $187,617 | $206,485 | $205,805 | $226,751 | $290,299 | $3,540 | 3.0% | |
| Property Taxes | 187,561 | 186,405 | 190,781 | 209,252 | 236,062 | 2,879 | 2.4% | |
| Property Insurance | 78,753 | 135,125 | 137,715 | 147,604 | 85,077 | 1,038 | 0.9% | |
| Other Expenses | 32,933 | 22,735 | 22,677 | 15,142 | 4,750 | 58 | 0.0% | |
| FF&E | 327,285 | 360,616 | 366,367 | 380,252 | 387,065 | 4,720 | 4.0% | |
| Total Other Expenses | $814,149 | $911,366 | $923,345 | $979,001 | $1,003,254 | $12,235 | 10.4% | |
| Net Operating Income | $2,957,429 | $3,192,658 | $3,513,537 | $3,717,072 | $3,653,055 | $44,549 | 37.8% | |
| Net Cash Flow(4) | $2,957,429 | $3,192,658 | $3,513,537 | $3,717,072 | $3,653,055 | $44,549 | 37.8% | |
| (1) | TTM represents the trailing 12-month period ending on October 31, 2016. |
| (2) | Per Room values are based on 82 guest rooms. |
| (3) | % of Total Revenue for Room Expense, Food and Beverage Expense and Other Departmental Expense is based on their corresponding revenue line items. |
| (4) | RevPAR for 2011 and 2012 was $195.85 and $200.62, respectively, and Net Cash Flow for 2011 and 2012 was approximately $2.6 million and $2.4 million, respectively. |
| (5) | Other Departmental Revenue consists of rental income for L’escale Restaurant (which includes base rent, overage rent and 22.0% of L’escale Restaurant’s profit for each respective year as a result of the common ownership between L’escale Restaurant and the Delamar Greenwich Harbor property), spa revenue, marina revenue and other revenue. |
THE INFORMATION IN THIS STRUCTURAL AND COLLATERAL TERM SHEET IS NOT COMPLETE AND MAY BE AMENDED PRIOR TO THE TIME OF SALE. THIS TERM SHEET IS NOT AN OFFER TO SELL THESE SECURITIES AND IT IS NOT A SOLICITATION OF AN OFFER TO BUY THESE SECURITIES IN ANY JURISDICTION WHERE THE OFFER OR SALE IS NOT PERMITTED.
| 128 of 139 | |
| Structural and Collateral Term Sheet | JPMDB 2017-C5 |
[THIS PAGE INTENTIONALLY LEFT BLANK]
THE INFORMATION IN THIS STRUCTURAL AND COLLATERAL TERM SHEET IS NOT COMPLETE AND MAY BE AMENDED PRIOR TO THE TIME OF SALE. THIS TERM SHEET IS NOT AN OFFER TO SELL THESE SECURITIES AND IT IS NOT A SOLICITATION OF AN OFFER TO BUY THESE SECURITIES IN ANY JURISDICTION WHERE THE OFFER OR SALE IS NOT PERMITTED.
| 129 of 139 | |
| Structural and Collateral Term Sheet | JPMDB 2017-C5 | |
| Summit Mall | ||
| Mortgage Loan Information | Property Information | |||
| Mortgage Loan Seller: | JPMCB | Single Asset / Portfolio: | Single Asset | |
| Credit Assessment (Moody’s)(1) | Baa3 | Title: | Fee | |
| Original Principal Balance(2): | $35,000,000 | Property Type - Subtype: | Retail – Regional Mall | |
| Cut-off Date Principal Balance(2): | $35,000,000 | Net Rentable Area (SF)(3): | 528,234 | |
| % of Pool by IPB: | 3.4% | Location: | Fairlawn, OH | |
| Loan Purpose: | Refinance | Year Built / Renovated: | 1965 / 2007 | |
| Borrower: | Mall at Summit, LLC | Occupancy(4): | 92.3% | |
| Sponsor: | Simon Property Group, L.P. | Occupancy Date: | 7/5/2016 | |
| Interest Rate: | 3.31400% | Number of Tenants: | 98 | |
| Note Date: | 9/7/2016 | 2013 NOI(5): | $11,304,120 | |
| Maturity Date: | 10/1/2026 | 2014 NOI(5): | $12,280,008 | |
| Interest-only Period: | 120 months | 2015 NOI: | $12,234,473 | |
| Original Term: | 120 months | TTM NOI (as of 7/2016)(6): | $12,759,882 | |
| Original Amortization: | None | UW Economic Occupancy: | 92.7% | |
| Amortization Type: | Interest Only | UW Revenues: | $17,294,164 | |
| Call Protection: | L(29),Def(84),O(7) | UW Expenses: | $3,863,136 | |
| Lockbox / Cash Management: | Hard / Springing | UW NOI(6): | $13,431,028 | |
| Additional Debt: | Yes | UW NCF: | $12,844,933 | |
| Additional Debt Balance: | $50,000,000 | Appraised Value / Per SF: | $205,000,000 / $388 | |
| Additional Debt Type: | Pari Passu | Appraisal Date: | 8/8/2016 | |
| Escrows and Reserves | Financial Information(2) | |||||||||
| Initial | Monthly | Initial Cap | Cut-off Date Loan / SF: | $161 | ||||||
| Taxes: | $0 | Springing | N/A | Maturity Date Loan / SF: | $161 | |||||
| Insurance: | $0 | Springing | N/A | Cut-off Date LTV: | 41.5% | |||||
| Replacement Reserves: | $0 | Springing | N/A | Maturity Date LTV: | 41.5% | |||||
| TI/LC: | $0 | Springing | N/A | UW NCF DSCR: | 4.50x | |||||
| Other: | $0 | $0 | N/A | UW NOI Debt Yield: | 15.8% | |||||
| Sources and Uses | ||||||
| Sources | Proceeds | % of Total | Uses | Proceeds | % of Total | |
| Mortgage Loan(2) | $85,000,000 | 100.0% | Payoff Existing Debt | $65,000,000 | 76.5% | |
| Return of Equity | 19,005,820 | 22.4 | ||||
| Closing Costs | 994,180 | 1.2 | ||||
| Total Sources | $85,000,000 | 100.0% | Total Uses | $85,000,000 | 100.0% | |
| (1) | Moody’s has confirmed that the Summit Mall Mortgage Loan has, in the context of its inclusion in the mortgage pool, credit characteristics consistent with an investment grade obligation. |
| (2) | The Summit Mall loan is part of a whole loan evidenced by twopari passu senior notes, with an aggregate principal balance as of the Cut-off Date of $85.0 million. The Financial Information presented in the chart above reflects the Cut-off Date balance of the $85.0 million Summit Mall Whole Loan, as defined in “The Loan” below. |
| (3) | Net Rentable Area (SF) is exclusive of square footage associated with the two Dillard’s boxes. The Dillard’s land and improvements are tenant-owned with no attributable base rent. |
| (4) | Current Occupancy is as of July 5, 2016 and includes space leased by Dewey’s Pizza (3,490 square feet) and Auntie Anne’s (250 square feet), accounting for a combined underwritten base rent of $149,360, for which the tenants have signed leases but are not yet in occupancy. The tenants are expected to take possession of the leased spaces and commence paying rent in November 2016. |
| (5) | The increase in 2014 NOI from 2013 NOI is primarily associated with tenants renewing their leases at higher rents. |
| (6) | The increase in UW NOI from TTM NOI is primarily associated with $546,578 in contractual rent steps underwritten through October 2017 and underwriting two tenants that have signed leases, but were not yet in occupancy. These tenants are now in occupancy. |
THE INFORMATION IN THIS STRUCTURAL AND COLLATERAL TERM SHEET IS NOT COMPLETE AND MAY BE AMENDED PRIOR TO THE TIME OF SALE. THIS TERM SHEET IS NOT AN OFFER TO SELL THESE SECURITIES AND IT IS NOT A SOLICITATION OF AN OFFER TO BUY THESE SECURITIES IN ANY JURISDICTION WHERE THE OFFER OR SALE IS NOT PERMITTED.
| 130 of 139 | |
| Structural and Collateral Term Sheet | JPMDB 2017-C5 | |
| Summit Mall | ||
The Loan. The Summit Mall loan is secured by a first mortgage lien on the borrower’s fee interest in 528,234 square feet of an approximately 777,185 square foot mall located in Fairlawn, Ohio. The whole loan has an outstanding principal balance as of the Cut-off Date of $85.0 million (the “Summit Mall Whole Loan”) and is comprised of twopari passunotes, each as described below. Note A-2 with a balance of $35.0 million is being contributed to the JPMDB 2017-C5 Trust. Note A-1 was contributed to the JPMCC 2016-JP4 Trust and is the controlling note under the related intercreditor agreement, the rights of which will be exercised by the related trustee under that securitization (or, prior to the occurrence and continuance of a control termination event under the related pooling and servicing agreement, by the related directing certificateholder). However, the holder of Note A-2 (including the Trustee or, prior to the occurrence and continuance of a Control Termination Event, the Directing Certificateholder) will be entitled, under certain circumstances, to be consulted with respect to certain major decisions. The Summit Mall Whole Loan has a 10-year term and is interest-only for the entire term. The previously existing debt securing the property was securitized in JPMCC 2007-LD12.
| Whole Loan Summary | |||||
| Note | Original Balance | Cut-off Date Balance | Note Holder | Controlling Piece | |
| A-1 | $50,000,000 | $50,000,000 | JPMCC 2016-JP4 | Yes | |
| A-2 | 35,000,000 | 35,000,000 | JPMDB 2017-C5 | No | |
| Total | $85,000,000 | $85,000,000 | |||
The borrowing entity for the Summit Mall Whole Loan is Mall at Summit, LLC, a Delaware limited liability company and special purpose entity.
The loan sponsor and nonrecourse carve-out guarantor is Simon Property Group, L.P., an affiliate of Simon Property Group, Inc. (“SPG”). SPG was founded in 1960 and is headquartered in Indianapolis, Indiana. SPG (NYSE: SPG, rated A3/A by Moody’s and S&P) is an S&P 100 company and the largest public real estate company in the world. As of September 30, 2016, SPG owned or had an interest in 227 retail real estate properties in North America, Europe and Asia comprising approximately 189 million square feet. SPG’s liability under the nonrecourse carve-out provisions in the Summit Mall Whole Loan documents is capped at $17.0 million plus reasonable collection costs.
The Property. Summit Mall is an approximately 777,185 square foot regional mall located in Fairlawn, Ohio. Approximately 528,234 square feet of the Summit Mall property will serve as collateral for the Summit Mall Whole Loan. The property is anchored by Macy’s and two Dillard’s boxes and features national retailers such as Apple, Gap, Express, Coach, Swarovski, American Eagle, Sephora, Versona and Pandora. Summit Mall was originally built in 1965 and was renovated in 2007. In 2009, the loan sponsor completed an approximately $19.5 million renovation to add approximately 47,000 square feet of exterior facing stores along the south side of the mall to create a lifestyle component by the main entrance. This includes P.F. Chang’s, David’s Bridal, LOFT and Christopher & Banks, among others. Summit Mall has approximately 3,581 surface parking spaces, resulting in a parking ratio of approximately 6.8 spaces per 1,000 square feet of the collateral’s net rentable area.
In 2007, the property reported a net operating income of approximately $8.0 million, which has grown by approximately 59.5% to approximately $12.8 million for the trailing 12-month period ending July 2016. The property has experienced recent leasing momentum, signing 20 new and renewal leases since 2014, accounting for 56,855 square feet, or 10.8% of collateral net rentable area, with a weighted average underwritten base rent of $38.77 per square foot. The property’s total comparable collateral in-line sales for all tenants have grown from approximately $461 per square foot in 2013 to $491 per square foot as of the trailing 12-month period ending May 2016. The most recent comparable sales are above both regional and national averages and near the upper end of the property’s competitive set. Total mall sales have grown consistently, from approximately $156.6 million in 2013 to approximately $163.2 million for the trailing 12-month period ending May 2016.
| Historical In-line Sales and Occupancy Costs(1) | ||||
| 2013 | 2014 | 2015 | TTM(2) | |
| In-line Sales PSF(3) | $461 | $428 | $473 | $491 |
| Occupancy Costs(4) | 10.0% | 11.0% | 10.9% | 10.7% |
| (1) | In-line Sales PSF and Occupancy Costs are for comparable tenants less than 10,000 square feet that reported full year sales. |
| (2) | TTM In-line Sales PSF and Occupancy Costs are as of May 31, 2016. |
| (3) | In-line Sales PSF excluding Apple are $352, $335, $374 and $379 for 2013, 2014, 2015 and the trailing 12-month period ending May 2016, respectively. |
| (4) | Occupancy Costs excluding Apple are 13.0%, 14.0%, 13.7% and 13.8% for 2013, 2014, 2015 and the trailing 12-month period ending May 2016, respectively. |
THE INFORMATION IN THIS STRUCTURAL AND COLLATERAL TERM SHEET IS NOT COMPLETE AND MAY BE AMENDED PRIOR TO THE TIME OF SALE. THIS TERM SHEET IS NOT AN OFFER TO SELL THESE SECURITIES AND IT IS NOT A SOLICITATION OF AN OFFER TO BUY THESE SECURITIES IN ANY JURISDICTION WHERE THE OFFER OR SALE IS NOT PERMITTED.
| 131 of 139 | |
| Structural and Collateral Term Sheet | JPMDB 2017-C5 | |
| Summit Mall | ||
Macy’s leases 195,776 square feet (37.1% of collateral net rentable area) through October 2020 and is the only collateral anchor tenant. For the trailing 12-month period ending May 2016, Macy’s totaled approximately $28.6 million in annual sales ($146 per square foot). Macy’s recently closed its store at Chapel Hill Mall, which is the only competitor within 16.0 miles of Summit Mall. Dillard’s owns its own improvements and underlying land and is not collateral for the Summit Mall Whole Loan. Dillard’s North offers the women’s department and Dillard’s South offers the children’s, men’s and home departments. Both anchors are original tenants at the property.
| Anchors | ||||||
| Tenant | Collateral | Ratings(1) Moody’s/S&P/Fitch | Net Rentable Area (SF) | Most Recent Sales(2) | Most Recent Sales PSF(2) | |
| Dillard’s | No | Baa3 / BBB- / BBB- | 237,160 | $16,400,000 | $69 | |
| Macy’s | Yes | Baa2 / BBB / NA | 195,776 | $28,608,747 | $146 | |
| (1) | Ratings provided are for the parent company of the entity listed in the “Tenant” field whether or not the parent company guarantees the lease. |
| (2) | Dillard’s is not required to report sales. Most Recent Sales are based on the loan sponsor’s estimate and are as of December 31, 2015. Macy’s Most Recent Sales is based on actual reported sales as of May 31, 2016. |
As of July 5, 2016, the collateral was 92.3% leased by 98 tenants under 99 individual leases (95.4% including temporary tenants as of June 30, 2016). The overall mall, inclusive of the non-owned anchor tenants, is 95.9% occupied with a diverse tenant offering. The largest non-anchor collateral tenant, Goodyear, leases 11,732 square feet (2.2% of the collateral net rentable area) through June 2031. Goodyear contributes 3.3% of the total underwritten base rent and reported sales of approximately $91 per square foot for the trailing 12-month period ending May 31, 2016. The second largest non-anchor collateral tenant, Gap, leases 9,532 square feet (1.8% of the collateral net rentable area) through January 2018. Gap contributes 3.1% of the total underwritten base rent and reported sales of approximately $199 per square foot for the trailing 12-month period ending May 31, 2016. The third largest non-anchor collateral tenant, Express, leases 8,500 square feet (1.6% of the collateral net rentable area) through January 2021. Express contributes 2.4% of the total underwritten base rent and reported sales of approximately $379 per square foot for the trailing 12-month period ending May 31, 2016.
The Market. Summit Mall is located approximately 7.3 miles northwest of downtown Akron, Ohio. The property is located along West Market Street (Route 18) and 1.5 miles east of Interstate 77. West Market Street is the main commercial thoroughfare in Fairlawn and connects to I-77, the major regional highway that runs through the Akron central business district to Cleveland. Fairlawn is surrounded by several affluent neighborhoods. The average household income within a five-mile radius of the property is $88,584 as compared to $70,881 for the Akron CBSA in 2015. Per the appraisal, the daily traffic count for West Market Street is 20,310 vehicles. West Market Street is highly developed with professional and medical offices, strip and freestanding retail, hotels and restaurants. Additionally, the property is located opposite a series of office buildings ranging from 10,000 to 100,000 square feet. As of year-end 2015, Summit County is home to approximately 542,000 people. According to the appraisal, as of the end of 2015, the estimated population within a five-, 10- and 15-mile radius of the property was 88,353, 381,361 and 755,569 people, respectively, and the average household income was $88,584, $66,276 and $75,825, respectively, with projected annual compound growth of approximately 3.3% through 2020.
Summit Mall benefits from its location along West Market Street in Summit County. According to the appraisal, Summit Mall is the dominant enclosed mall in the Akron area. Competitive properties in the area maintained an average vacancy rate of approximately 12.0% and sales ranging from $245 to $440 per square foot. The appraisal does not identify any new or proposed directly competitive properties in the area. The current primary and secondary competition consists of five properties detailed in the table below.
THE INFORMATION IN THIS STRUCTURAL AND COLLATERAL TERM SHEET IS NOT COMPLETE AND MAY BE AMENDED PRIOR TO THE TIME OF SALE. THIS TERM SHEET IS NOT AN OFFER TO SELL THESE SECURITIES AND IT IS NOT A SOLICITATION OF AN OFFER TO BUY THESE SECURITIES IN ANY JURISDICTION WHERE THE OFFER OR SALE IS NOT PERMITTED.
| 132 of 139 | |
| Structural and Collateral Term Sheet | JPMDB 2017-C5 | |
| Summit Mall | ||
| Competitive Set Summary(1) | ||||||
| Property | Year Built / Renovated | Total GLA | Proximity (Miles) | Estimated Occupancy | Sales PSF | Anchor Tenants |
| Summit Mall(2) | 1965 / 2007 | 777,185 | NAP | 95.4% | $473 | Macy’s, Dillard’s North, Dillard’s South |
| Primary Competition | ||||||
| Chapel Hill Mall(3) | 1966 / 2006 | 1,096,797 | 7.8 | 75.0% | $250 | JCPenney, Sears |
| Belden Village Mall | 1970 / 1987 | 822,924 | 21.2 | 97.0% | $440 | Dillard’s, Macy’s, Sears |
| SouthPark Center | 1996 / 2007 | 1,238,740 | 16.0 | 85.0% | $390 | Cinemark, Dick’s Sporting Goods, Dillard’s, JCPenney, Kohl’s, Macy’s, Sears |
| Secondary Competition | ||||||
| Great Northern Mall | 1976 / 1992 | 1,148,527 | 24.4 | 97.0% | $350 | Dillard’s, JCPenney, Macy’s, Sears |
| Carnation City Mall | 1983 / NA | 354,274 | 28.5 | 86.0% | $245 | Cinemark, Dunham Sports, Elder-Beerman, JCPenney |
| (1) | Based on the appraisal. |
| (2) | Total GLA for Summit Mall includes non-collateral space and Estimated Occupancy represents actual occupancy as of July 5, 2016. |
| (3) | Chapel Hill Mall has a vacant anchor tenant space. |
| Collateral Tenant Summary(1) | ||||||||
| Tenant | Ratings(2) Moody’s/S&P/Fitch | Net Rentable Area (SF) | % of Total NRA | Lease Expiration Date | Base Rent PSF | % of Total Base Rent | Most Recent Sales PSF (3) | Occupancy Cost(3) |
| Macy’s | Baa2 / BBB / NA | 195,776 | 37.1% | 10/24/2020 | $0.75 | 1.4% | $146 | 1.8% |
| Goodyear | B1 / BB / BB | 11,732 | 2.2% | 6/30/2031 | $28.86 | 3.3% | $91 | N/A |
| Gap | Baa2 / BB+ / BB+ | 9,532 | 1.8% | 1/31/2018 | $33.00 | 3.1% | $199 | 25.9% |
| Express | NA / NA / NA | 8,500 | 1.6% | 1/31/2021 | $29.12 | 2.4% | $379 | 15.0% |
| Versona Accessories(4) | NA / NA / NA | 8,000 | 1.5% | 1/31/2024 | $13.07 | 1.0% | $109 | 29.7% |
| Banana Republic | Baa2 / BB+ / BB+ | 7,806 | 1.5% | 4/30/2018 | $30.41 | 2.3% | $281 | 17.1% |
| Bravo | NA / NA / NA | 7,337 | 1.4% | 1/31/2019 | $25.56 | 1.8% | $388 | 8.7% |
| P.F. Chang’s | NA / NA / NA | 7,226 | 1.4% | 8/31/2019 | $30.25 | 2.1% | $520 | 7.4% |
| Victoria’s Secret | Ba1 / BB+ / BB+ | 6,650 | 1.3% | 1/31/2024 | $32.00 | 2.1% | $457 | 10.8% |
| Hollister Co. | NA / BB- / NA | 6,500 | 1.2% | 1/31/2019 | $19.01 | 1.2% | $197 | 20.2% |
| (1) | Based on the underwritten rent roll. |
| (2) | Ratings provided are for the parent company of the entity listed in the “Tenant” field whether or not the parent company guarantees the lease. |
| (3) | Most Recent Sales PSF and Occupancy Cost are based on actual reported sales or estimates, in each case provided by the sponsor, is as of May 31, 2016. |
| (4) | Versona Accessories has the right to terminate its lease if its adjusted gross sales (as defined in the lease) do not exceed $2,000,000 during the sixth lease year (November 15, 2017 through October 31, 2018), with 90 days’ notice and the payment of a termination fee of $400,000. |
THE INFORMATION IN THIS STRUCTURAL AND COLLATERAL TERM SHEET IS NOT COMPLETE AND MAY BE AMENDED PRIOR TO THE TIME OF SALE. THIS TERM SHEET IS NOT AN OFFER TO SELL THESE SECURITIES AND IT IS NOT A SOLICITATION OF AN OFFER TO BUY THESE SECURITIES IN ANY JURISDICTION WHERE THE OFFER OR SALE IS NOT PERMITTED.
| 133 of 139 | |
| Structural and Collateral Term Sheet | JPMDB 2017-C5 | |
| Summit Mall | ||
| Lease Rollover Schedule(1)(2) | |||||||||
| Year | Number of Leases Expiring | Net Rentable Area Expiring | % of NRA Expiring | Base Rent Expiring | % of Base Rent Expiring | Cumulative Net Rentable Area Expiring | Cumulative % of NRA Expiring | Cumulative Base Rent Expiring | Cumulative % of Base Rent Expiring |
| Vacant | NAP | 40,586 | 7.7% | NAP | NAP | 40,586 | 7.7% | NAP | NAP |
| 2017 & MTM | 16 | 39,341 | 7.4 | 1,351,489 | 13.2 | 79,927 | 15.1% | $1,351,489 | 13.2% |
| 2018 | 20 | 53,338 | 10.1 | 2,005,413 | 19.6 | 133,265 | 25.2% | $3,356,902 | 32.7% |
| 2019 | 9 | 43,194 | 8.2 | 1,129,771 | 11.0 | 176,459 | 33.4% | $4,486,673 | 43.8% |
| 2020 | 7 | 209,357 | 39.6 | 597,990 | 5.8 | 385,816 | 73.0% | $5,084,662 | 49.6% |
| 2021 | 11 | 37,029 | 7.0 | 1,262,400 | 12.3 | 422,845 | 80.0% | $6,347,062 | 61.9% |
| 2022 | 7 | 15,094 | 2.9 | 596,969 | 5.8 | 437,939 | 82.9% | $6,944,031 | 67.7% |
| 2023 | 12 | 30,227 | 5.7 | 1,302,947 | 12.7 | 468,166 | 88.6% | $8,246,978 | 80.4% |
| 2024 | 6 | 25,573 | 4.8 | 693,134 | 6.8 | 493,739 | 93.5% | $8,940,113 | 87.2% |
| 2025 | 4 | 9,859 | 1.9 | 385,640 | 3.8 | 503,598 | 95.3% | $9,325,753 | 91.0% |
| 2026 | 4 | 12,903 | 2.4 | 366,835 | 3.6 | 516,501 | 97.8% | $9,692,587 | 94.6% |
| 2027 & Beyond(3) | 3 | 11,733 | 2.2 | 558,586 | 5.4 | 528,234 | 100.0% | $10,251,173 | 100.0% |
| Total | 99 | 528,234 | 100.0% | $10,251,173 | 100.0% | ||||
| (1) | Based on the underwritten rent roll. |
| (2) | Lease Rollover Schedule is not inclusive of the square footage associated with Dillard’s, which is tenant-owned with no attributable base rent. |
| (3) | 2027 & Beyond includes an antenna tenant with one square foot of space, but no underwritten rent. The rent is captured in Underwritten Other Rental Storage. |
| Operating History and Underwritten Net Cash Flow | |||||||
| 2013 | 2014 | 2015 | TTM(1) | Underwritten | Per Square Foot | %(2) | |
| Rents in Place(3)(4) | $9,014,699 | $9,526,994 | $9,509,298 | $9,872,123 | $10,251,173 | $19.41 | 54.9% |
| Vacant Income | 0 | 0 | 0 | 0 | 1,369,226 | 2.59 | 7.3 |
| Gross Potential Rent | $9,014,699 | $9,526,994 | $9,509,298 | $9,872,123 | $11,620,399 | $22.00 | 62.3% |
| Total Reimbursements | 4,478,719 | 5,024,877 | 4,992,364 | 5,111,040 | 5,307,583 | 10.05 | 28.4 |
| Percentage Rent | 181,249 | 216,045 | 316,332 | 254,994 | 338,196 | 0.64 | 1.8 |
| Other Rental Storage(5) | 1,390,989 | 1,414,645 | 1,194,939 | 1,291,469 | 1,397,213 | 2.65 | 7.5 |
| Net Rental Income | $15,065,656 | $16,182,561 | $16,012,933 | $16,529,626 | $18,663,390 | $35.33 | 100.0% |
| (Vacancy/Credit Loss) | 0 | 0 | 0 | 0 | (1,369,226) | (2.59) | (7.3) |
| Effective Gross Income | $15,065,656 | $16,182,561 | $16,012,933 | $16,529,626 | $17,294,164 | $32.74 | 92.7% |
| Total Expenses | $3,761,536 | $3,902,553 | $3,778,460 | $3,769,744 | $3,863,136 | $7.31 | 22.3% |
| Net Operating Income | $11,304,120 | $12,280,008 | $12,234,473 | $12,759,882 | $13,431,028 | $25.43 | 77.7% |
| Total TI/LC, Capex/RR | 0 | 0 | 0 | 0 | 586,095 | 1.11 | 3.4 |
| Net Cash Flow | $11,304,120 | $12,280,008 | $12,234,473 | $12,759,882 | $12,844,933 | $24.32 | 74.3% |
| Occupancy(6) | 94.3% | 94.7% | 89.2% | 92.3% | |||
| (1) | TTM represents the trailing 12-month period ending on July 31, 2016. |
| (2) | % column represents percent of Net Rental Income for all revenue lines and percent of Effective Gross Income for the remainder of fields. |
| (3) | Underwritten Rents in Place is inclusive of $546,578 in contractual rent steps underwritten though October 2017. |
| (4) | Non-collateral anchor tenants, Dillard’s North and Dillard’s South, have not been included in Rents in Place. |
| (5) | Other Rental Storage includes media income and other rents, including $870,029 in underwritten base rent associated with in-line temporary tenants. |
| (6) | TTM Occupancy is as of July 5, 2016 and includes space leased by Dewey’s Pizza (3,490 square feet) and Auntie Anne’s (250 square feet), accounting for a combined underwritten base rent of $149,360, for which the tenants had signed leases but were not yet in occupancy. These tenants are now in occupancy. |
THE INFORMATION IN THIS STRUCTURAL AND COLLATERAL TERM SHEET IS NOT COMPLETE AND MAY BE AMENDED PRIOR TO THE TIME OF SALE. THIS TERM SHEET IS NOT AN OFFER TO SELL THESE SECURITIES AND IT IS NOT A SOLICITATION OF AN OFFER TO BUY THESE SECURITIES IN ANY JURISDICTION WHERE THE OFFER OR SALE IS NOT PERMITTED.
| 134 of 139 | |
| Structural and Collateral Term Sheet | JPMDB 2017-C5 |
[THIS PAGE INTENTIONALLY LEFT BLANK]
THE INFORMATION IN THIS STRUCTURAL AND COLLATERAL TERM SHEET IS NOT COMPLETE AND MAY BE AMENDED PRIOR TO THE TIME OF SALE. THIS TERM SHEET IS NOT AN OFFER TO SELL THESE SECURITIES AND IT IS NOT A SOLICITATION OF AN OFFER TO BUY THESE SECURITIES IN ANY JURISDICTION WHERE THE OFFER OR SALE IS NOT PERMITTED.
| 135 of 139 | |
| Structural and Collateral Term Sheet | JPMDB 2017-C5 | |
| Park Center Plaza I, II & III | ||
| Mortgage Loan Information | Property Information | |||
| Mortgage Loan Seller: | GACC | Single Asset / Portfolio: | Single Asset | |
| Original Principal Balance: | $34,500,000 | Title: | Fee | |
| Cut-off Date Principal Balance: | $34,500,000 | Property Type - Subtype: | Office – Suburban | |
| % of Pool by IPB: | 3.3% | Net Rentable Area (SF): | 418,999 | |
| Loan Purpose: | Acquisition | Location: | Independence, OH | |
| Borrower: | Park Center Plaza LP | Year Built / Renovated: | 1998-2000 / N/A | |
| Sponsors: | Brad Coven and Joseph Greenberg | Occupancy: | 93.6% | |
| Interest Rate: | 4.60000% | Occupancy Date: | 12/28/2016 | |
| Note Date: | 1/5/2017 | Number of Tenants: | 25 | |
| Maturity Date: | 1/6/2027 | 2013 NOI: | $5,301,561 | |
| Interest-only Period: | 60 months | 2014 NOI: | $4,191,687 | |
| Original Term: | 120 months | 2015 NOI: | $4,599,633 | |
| Original Amortization: | 360 months | YTD Ann. NOI (as of 8/2016): | $5,293,604 | |
| Amortization Type: | IO-Balloon | UW Economic Occupancy: | 90.8% | |
| Call Protection: | L(26),Def(90),O(4) | UW Revenues: | $8,987,319 | |
| Lockbox / Cash Management: | Hard / Springing | UW Expenses: | $4,126,117 | |
| Additional Debt: | N/A | UW NOI: | $4,861,202 | |
| Additional Debt Balance: | N/A | UW NCF: | $4,549,614 | |
| Additional Debt Type: | N/A | Appraised Value / Per SF: | $50,650,000 / $121 | |
| Appraisal Date: | 11/15/2016 | |||
| Escrows and Reserves | Financial Information | |||||||||
| Initial | Monthly | Initial Cap | Cut-off Date Loan / SF: | $82 | ||||||
| Taxes: | $88,877 | $88,877 | N/A | Maturity Date Loan / SF: | $75 | |||||
| Insurance: | $4,493 | $4,493 | N/A | Cut-off Date LTV: | 68.1% | |||||
| Replacement Reserves: | $0 | $7,024 | $337,151 | Maturity Date LTV: | 62.4% | |||||
| TI/LC(1): | $3,100,000 | $47,412 | $4,250,000 | UW NCF DSCR: | 2.14x | |||||
| Other(2): | $6,250 | Springing | N/A | UW NOI Debt Yield: | 14.1% | |||||
| Sources and Uses | ||||||||||
| Sources | Proceeds | % of Total | Uses | Proceeds | % of Total | |||||
| Mortgage Loan | $34,500,000 | 63.5% | Purchase Price | $50,100,000 | 92.3% | |||||
| Sponsor Equity | 19,808,784 | 36.5% | Upfront Reserves | 3,199,621 | 5.9 | |||||
| Closing Costs | 1,009,163 | 1.9 | ||||||||
| Total Sources | $54,308,784 | 100.0% | Total Uses | $54,308,784 | 100.0% | |||||
| (1) | If each of the General Services Administration (Department of Veteran’s Affairs) (“GSA”), Traveler’s Indemnity Company (“Travelers”) and CBIZ, Inc. has irrevocably exercised its renewal or extension option (or otherwise enters into an extension agreement acceptable to the lender that provides for at least a five year extension term) with respect to all of its leased space in accordance with the loan documents, and the base rent due under such lease is no less than 90% of the base rent due immediately prior to expiration and (ii) the debt service coverage ratio is no less than 1.50x, any funds then on deposit in the TI/LC reserve in excess of $2,500,000 (including the initial deposit) are required to be released to the borrower. The borrower’s obligation to make monthly deposits into the TI/LC reserve continues after such release. Both the initial $3,100,000 deposit and funds swept into the lease sweep reserve described in footnote (2) below are counted towards the $4,250,000 cap on the TI/LC reserve. |
| (2) | At origination, the borrower deposited $6,250 into escrow for deferred maintenance. A lease sweep reserve (up to the $4,250,000 cap amount) will spring into place upon (a) the earlier to occur (i) the date that is 12 months prior to the lease expiration date of the GSA or Travelers or (ii) the date GSA or Travelers is required to give notice of renewal (if not given), (b) the date GSA or Travelers surrenders, cancels or terminates its lease, (c) the date GSA or Travelers goes dark, (d) upon any default under the GSA or Travelers lease beyond any applicable cure period or (e) the occurrence of a GSA or Travelers insolvency proceeding. |
THE INFORMATION IN THIS STRUCTURAL AND COLLATERAL TERM SHEET IS NOT COMPLETE AND MAY BE AMENDED PRIOR TO THE TIME OF SALE. THIS TERM SHEET IS NOT AN OFFER TO SELL THESE SECURITIES AND IT IS NOT A SOLICITATION OF AN OFFER TO BUY THESE SECURITIES IN ANY JURISDICTION WHERE THE OFFER OR SALE IS NOT PERMITTED.
| 136 of 139 | |
| Structural and Collateral Term Sheet | JPMDB 2017-C5 | |
| Park Center Plaza I, II & III | ||
The Loan.The Park Center Plaza I, II & III loan has an outstanding principal balance as of the Cut-off Date of $34.5 million and is secured by a first mortgage lien on the fee interest in Park Center Plaza I, II & III, which is a 418,999 square foot office complex located in Independence, Ohio. The loan has a 10-year term and, subsequent to a 60 month interest-only period, will amortize on a 30-year schedule. The borrowing entity for the Park Center Plaza I, II & III loan is Park Center Plaza LP, a Delaware limited partnership and special purpose entity. The loan sponsors of the borrower and nonrecourse carve-out guarantors are Brad Coven and Joseph Greenberg. Joseph Greenberg is a licensed Ohio real estate broker. Mr. Greenberg specializes in the representation of landlords and tenants as well as the sale of office and industrial buildings in the Greater Cleveland Real Estate Market. In 2007, he founded Greenberg Real Estate Advisors which currently handles the leasing on nearly 6 million square feet in Greater Cleveland. Brad Coven is a licensed Ohio real estate broker. Mr. Coven has over 16 years of experience specializing in the representation of landlords and tenants in the leasing and management of commercial real estate in the greater Cleveland market.
The Property. Park Center Plaza I, II & III is a 418,999 square foot Class A office complex located on a 20 acre site in Independence, Ohio, approximately 10 miles south of Cleveland. The property consists of three, five-story buildings that form a campus. The buildings were constructed from 1998 to 2000 and feature large two-story atriums, an on-site fitness center with men’s and women’s locker rooms, a 60-seat restaurant offering sit-down, carry-out or catering services and multiple conference rooms with classroom style seating for 40, 48 or 75 people equipped with WiFi and audio visual capabilities. The property has a total of 1,718 surface and heated underground parking spaces which equates to a parking ratio of 4.1 parking spaces per 1,000 square feet.
The loan sponsors acquired the property for approximately $50.1 million (approximately $120 per square foot). Since acquisition, the sponsors have invested over $2.4 million to upgrade most of the common areas including the lobbies, corridors and restrooms, parking lots, exterior/landscaping and amenities including the fitness center, cafe and meeting rooms. Furthermore, building systems such as elevators were improved as well as the addition of WiFi to the property’s park at the front of the buildings.
The Park Center Plaza I, II & III property is 93.6% occupied as of December 28, 2016 by 25 tenants under 32 leases. The largest tenant at the property, the General Services Administration of the United States (“GSA”) leases 14.0% of the net rentable area through November 2019. The three GSA entities located at the property are the Internal Revenue Service, the United States Secret Service, and the Department of Veteran Affairs. GSA has been at the property since 2010 and has expanded several times from an initial 14,856 square feet to the current 58,821 square feet. The second largest tenant at the property, CBIZ, Inc. (NYSE: CBZ) leases 12.1% of the net rentable area through February 2022. CBIZ, Inc. is a professional services company offering accounting services, casualty brokerage and risk consulting, valuation, retirement services, and employee benefits with over 100 offices nationwide. Park Center Plaza III serves as the corporate headquarters for CBIZ. The third largest tenant, Travelers Indemnity Company (NYSE: TRV) (“Travelers”) leases 12.0% of the net rentable area through December 2019. Travelers is a provider of property casualty insurance for auto, home and business and is the third largest underwriter of United States personal insurance through independent agents with total assets of approximately $100 billion reported as of 2015. Park Center Plaza II serves as Travelers’ primary Cleveland location operating their claims and legal departments. No other tenant at the property accounts for more than 6.8% of the net rentable area. Overall, 47.0% of the net rentable area consists of investment grade rated tenants. Six of the top 10 tenants at the property are investment grade rated, accounting for 44.7% of the net rentable area.
The Market.The property is located in Independence, Ohio, a suburb of the Cleveland-Elyria-Mentor metropolitan statistical area (“MSA”). As of 2010, the greater Cleveland area consists of five counties and a population over 2 million resulting in the 28th most populous MSA in the United States and the largest in Ohio. Independence is approximately 10 miles south of downtown Cleveland and approximately 12 miles east of the Cleveland Hopkins International Airport. The property is accessible via Rockside Road near the intersection of two major highways in the region, Interstate 77 and Interstate 480. Rockside Road is a major commercial corridor which connects the property to Interstate 77 and large residential neighborhoods to the west and commercial developments to the east. Healthcare has become a large driving force in the economy with the Cleveland Clinic and University Hospitals as the #1 and #3 employers in the region.
According to the appraisal, the property is located within the Rockside Corridor office submarket. As of the third quarter of 2016, the Rockside Corridor submarket totaled approximately 4.1 million square feet of net rentable area with an overall vacancy rate of 9.2% compared to 10.8% as of 2015 and average rents of $19.14 per square foot. Over the past four quarters, the submarket has experienced zero supply with no new inventory scheduled for the property’s submarket. Absorption during the third quarter of 2016 was 0.1% and net absorption was 2.1% as of 2015. The Rockside Corridor office submarket has established an overall trend of absorption of 1.1% over the past 10 years.
The appraisal identified six comparable leases for the Park Center Plaza I, II & III property. The comparable leases range in size from 1,794 to 15,804 square feet and exhibit a range in adjusted rents from $21.63 to $24.29 per square foot, with a weighted average of $22.63 per square foot. The appraisal concluded a market rent of $22.50 per square foot.
THE INFORMATION IN THIS STRUCTURAL AND COLLATERAL TERM SHEET IS NOT COMPLETE AND MAY BE AMENDED PRIOR TO THE TIME OF SALE. THIS TERM SHEET IS NOT AN OFFER TO SELL THESE SECURITIES AND IT IS NOT A SOLICITATION OF AN OFFER TO BUY THESE SECURITIES IN ANY JURISDICTION WHERE THE OFFER OR SALE IS NOT PERMITTED.
| 137 of 139 | |
| Structural and Collateral Term Sheet | JPMDB 2017-C5 | |
| Park Center Plaza I, II & III | ||
| Tenant Summary(1) | ||||||
| Tenant | Ratings(2) Moody’s/S&P/ Fitch | Net Rentable Area (SF) | % of Total NRA | Base Rent PSF | % of Total Base Rent | Lease Expiration Date |
| GSA(3) | Aaa / AA+ / AAA | 58,821 | 14.0% | $23.64 | 15.4% | 11/30/2019(4) |
| CBIZ, Inc. | NA / NA / NA | 50,531 | 12.1% | $22.50 | 12.6% | 2/28/2022 |
| Travelers Indemnity Company(5) | A2 / A / A | 50,407 | 12.0% | $23.00 | 12.9% | 12/31/2019 |
| Life Line Screening of America , LTD. | NA / NA / NA | 28,297 | 6.8% | $23.50 | 7.4% | 2/28/2019 |
| Regus | NA / NA / NA | 26,690 | 6.4% | $25.00 | 7.4% | 12/31/2022 |
| Graftech International Holdings, Inc. | Baa2 / A- / NA | 23,790 | 5.7% | $24.87 | 6.6% | 9/30/2020 |
| Nexus Gas Transmission, LLC. | Baa2 / BBB+ / NA | 22,369 | 5.3% | $23.75 | 5.9% | 5/31/2019 |
| University Hospitals Health Systems, Inc. | A2 / NA / NA | 18,238 | 4.4% | $22.84 | 4.6% | 6/30/2027 |
| Jackson Lewis, LLP. | NA / NA / NA | 14,037 | 3.4% | $22.50 | 3.5% | 5/9/2022 |
| Microsoft Corporation | Aaa / AAA / AA+ | 13,771 | 3.3% | $20.25 | 3.2% | 3/31/2021 |
| (1) | Based on the underwritten rent roll. |
| (2) | Ratings provided are for the parent company of the entity listed in the Tenant field whether or not the parent company guarantees the lease. |
| (3) | GSA may exercise the right to terminate its lease at any time after November 30, 2019 with 90 days’ notice. |
| (4) | GSA is underwritten to the date of its termination option. The actual lease expiration date is August 22, 2020. |
| (5) | Travelers has the right as of December 31, 2017 to surrender a portion of its space, consisting of no more than 10,081 square feet. Travelers is required to notify the landlord at least nine months in advance of any surrender and pay a fee of $8.44 per square foot of the surrendered space. Travelers has one five-year renewal option remaining with no termination options. |
| Lease Rollover Schedule(1) | |||||||||
| Year | Number of Leases Expiring | Net Rentable Area Expiring | % of NRA Expiring | Base Rent Expiring | % of Base Rent Expiring | Cumulative Net Rentable Area Expiring | Cumulative % of NRA Expiring | Cumulative Base Rent Expiring | Cumulative % of Base Rent Expiring |
| Vacant | NAP | 27,000 | 6.4% | NAP | NAP | 27,000 | 6.4% | NAP | NAP |
| 2017 & MTM | 3 | 12,953 | 3.1 | $303,551 | 3.4% | 39,953 | 9.5% | $303,551 | 3.4% |
| 2018 | 0 | 0 | 0.0 | 0 | 0.0 | 39,953 | 9.5% | $303,551 | 3.4% |
| 2019(3) | 11 | 182,654 | 43.6 | 4,273,062 | 47.4 | 222,607 | 53.1% | $4,576,613 | 50.8% |
| 2020 | 6 | 37,720 | 9.0 | 918,889 | 10.2 | 260,327 | 62.1% | $5,495,502 | 61.0% |
| 2021 | 3 | 27,616 | 6.6 | 603,446 | 6.7 | 287,943 | 68.7% | $6,098,948 | 67.7% |
| 2022 | 5 | 107,636 | 25.7 | 2,491,863 | 27.7 | 395,579 | 94.4% | $8,590,811 | 95.4% |
| 2023 | 0 | 0 | 0.0 | 0 | 0.0 | 395,579 | 94.4% | $8,590,811 | 95.4% |
| 2024 | 0 | 0 | 0.0 | 0 | 0.0 | 395,579 | 94.4% | $8,590,811 | 95.4% |
| 2025 | 0 | 0 | 0.0 | 0 | 0.0 | 395,579 | 94.4% | $8,590,811 | 95.4% |
| 2026 | 2 | 3,783 | 0.9 | 0 | 0.0 | 399,362 | 95.3% | $8,590,811 | 95.4% |
| 2027 | 1 | 18,238 | 4.4 | 416,499 | 4.6 | 417,600 | 99.7% | $9,007,310 | 100.0% |
| 2028 & Beyond | 1 | 1,399 | 0.3 | 0 | 0.0 | 418,999 | 100.0% | $9,007,310 | 100.0% |
| Total | 32 | 418,999 | 100.0% | $9,007,310 | 100.0% | ||||
| (1) | Based on the underwritten rent roll. |
| (2) | Certain tenants may have termination or contraction options that may become exercisable prior to the originally stated expiration date of the tenant lease that are not considered in this lease rollover schedule. |
| (3) | GSA is underwritten to the date of its termination option. The actual lease expiration date is August 22, 2020. |
THE INFORMATION IN THIS STRUCTURAL AND COLLATERAL TERM SHEET IS NOT COMPLETE AND MAY BE AMENDED PRIOR TO THE TIME OF SALE. THIS TERM SHEET IS NOT AN OFFER TO SELL THESE SECURITIES AND IT IS NOT A SOLICITATION OF AN OFFER TO BUY THESE SECURITIES IN ANY JURISDICTION WHERE THE OFFER OR SALE IS NOT PERMITTED.
| 138 of 139 | |
| Structural and Collateral Term Sheet | JPMDB 2017-C5 | |
| Park Center Plaza I, II & III | ||
| Operating History and Underwritten Net Cash Flow | |||||||
| 2013 | 2014 | 2015 | YTD Ann.(1) | Underwritten | Per Square Foot | %(2) | |
| Rents in Place(3) | $8,329,593 | $7,489,013 | $8,273,942 | $8,973,115 | $9,007,310 | $21.50 | 91.5% |
| Vacant Income | 0 | 0 | 0 | 0 | 615,619 | 1.47 | 6.3 |
| Gross Potential Rent | $8,329,593 | $7,489,013 | $8,273,942 | $8,973,115 | $9,622,929 | $22.97 | 97.7% |
| Total Reimbursements | 301,854 | 343,899 | 219,515 | 121,207 | 225,000 | 0.54 | 2.3 |
| Net Rental Income | $8,631,447 | $7,832,912 | $8,493,457 | $9,094,322 | $9,847,929 | $23.50 | 100.0% |
| (Vacancy/Credit Loss) | 0 | 0 | 0 | 0 | (910,609) | (2.17) | (10.1) |
| Other Income | 312,323 | 55,404 | 47,115 | 59,181 | 50,000 | 0.12 | 0.6 |
| Effective Gross Income | $8,943,770 | $7,888,316 | $8,540,572 | $9,153,503 | $8,987,319 | $21.45 | 100.0% |
| Total Expenses | $3,642,209 | $3,696,629 | $3,940,939 | $3,859,898 | $4,126,117 | $9.85 | 45.9% |
| Net Operating Income | $5,301,561 | $4,191,687 | $4,599,633 | $5,293,604 | $4,861,202 | $11.60 | 54.1% |
| Total TI/LC, Capex/RR | 0 | 0 | 0 | 0 | 311,588 | 0.74 | 3.5 |
| Net Cash Flow | $5,301,561 | $4,191,687 | $4,599,633 | $5,293,604 | $4,549,614 | $10.86 | 50.6% |
| Occupancy(4) | 84.3% | 87.0% | 95.7% | 93.6% | 90.8% | ||
| (1) | The YTD Ann. column represents the annualized year-to-date period ending on August 31, 2016. |
| (2) | % column represents percent of Net Rental Income for all revenue lines and represents percent of Effective Gross Income for the remainder of fields. |
| (3) | Underwritten Rents in Place includes contractual step rent of $88,806 through November 2017. |
| (4) | YTD Ann. Occupancy is as of December 28, 2016. Underwritten occupancy represents economic occupancy. |
THE INFORMATION IN THIS STRUCTURAL AND COLLATERAL TERM SHEET IS NOT COMPLETE AND MAY BE AMENDED PRIOR TO THE TIME OF SALE. THIS TERM SHEET IS NOT AN OFFER TO SELL THESE SECURITIES AND IT IS NOT A SOLICITATION OF AN OFFER TO BUY THESE SECURITIES IN ANY JURISDICTION WHERE THE OFFER OR SALE IS NOT PERMITTED.
| 139 of 139 | |