JP Morgan Chase Commercial Mortgage Securities
Filed: 18 May 18, 4:08pm
| FREE WRITING PROSPECTUS | ||
| FILED PURSUANT TO RULE 433 | ||
| REGISTRATION FILE NO.: 333-206361-14 | ||
| May 18, 2018 | JPMDB 2018-C8 |
Free Writing Prospectus Structural and Collateral Term Sheet | ||
JPMDB 2018-C8
| ||
$713,137,655 (Approximate Mortgage Pool Balance) | ||
$628,452,367 (Approximate Offered Certificates) | ||
J.P. Morgan Chase Commercial Mortgage Securities Corp. Depositor | ||
| | ||
Commercial Mortgage Pass-Through Certificates Series 2018-C8 | ||
| | ||
JPMorgan Chase Bank, National Association German American Capital Corporation Starwood Mortgage Funding VI LLC BSPRT Finance, LLC Mortgage Loan Sellers
| ||
J.P. Morgan Co-Lead Manager and Joint | Deutsche Bank Co-Lead Manager and Joint | |
Co-Lead Managers and Joint Bookrunners
| ||
Drexel Hamilton
| Co-Managers | Academy Securities
|
THE INFORMATION IN THIS STRUCTURAL AND COLLATERAL TERM SHEET IS NOT COMPLETE AND MAY BE AMENDED PRIOR TO THE TIME OF SALE. THIS TERM SHEET IS NOT AN OFFER TO SELL THESE SECURITIES AND IT IS NOT A SOLICITATION OF AN OFFER TO BUY THESE SECURITIES IN ANY JURISDICTION WHERE THE OFFER OR SALE IS NOT PERMITTED.
| May 18, 2018 | JPMDB 2018-C8 |
This material is for your information, and none of J.P. Morgan Securities LLC (“JPMS”), Deutsche Bank Securities Inc., Drexel Hamilton, LLC, or Academy Securities, Inc. (each individually, an “Underwriter”, and together, the ‘‘Underwriters’’) are soliciting any action based upon it. This material is not to be construed as an offer to sell or the solicitation of any offer to buy any security in any jurisdiction where such an offer or solicitation would be illegal.
The Depositor has filed a registration statement (including a prospectus) with the SEC (SEC File no. 333-206361) for the offering to which this free writing prospectus relates. Before you invest, you should read the prospectus in the registration statement and other documents the Depositor has filed with the SEC for more complete information about the Depositor, the issuing entity and this offering. You may get these documents for free by visiting EDGAR on the SEC Website at www.sec.gov. Alternatively, the Depositor or any Underwriter or any dealer participating in the offering will arrange to send you the prospectus if you request it by calling (866) 669-7629 or by emailing the ABS Syndicate Desk at abs_synd@jpmorgan.com.
Neither this document nor anything contained in this document shall form the basis for any contract or commitment whatsoever. The information contained in this document is preliminary as of the date of this document, supersedes any previous such information delivered to you and will be superseded by any such information subsequently delivered prior to the time of sale. These materials are subject to change, completion or amendment from time to time.
This document has been prepared by the Underwriters for information purposes only and does not constitute, in whole or in part, a prospectus for the purposes of Directive 2003/71/EC (as amended) and/or Part VI of the Financial Services and Markets Act 2000 (as amended) or other offering document.
The attached information contains certain tables and other statistical analyses (the “Computational Materials”) that have been prepared in reliance upon information furnished by the Mortgage Loan Sellers. Numerous assumptions were used in preparing the Computational Materials, which may or may not be reflected in this document. The Computational Materials should not be construed as either projections or predictions or as legal, tax, financial or accounting advice. You should consult your own counsel, accountant and other advisors as to the legal, tax, business, financial and related aspects of a purchase of these certificates. Any weighted average lives, yields and principal payment periods shown in the Computational Materials are based on prepayment and/or loss assumptions, and changes in such prepayment and/or loss assumptions may dramatically affect such weighted average lives, yields and principal payment periods. In addition, it is possible that prepayments or losses on the underlying assets will occur at rates higher or lower than the rates shown in the Computational Materials. The specific characteristics of the certificates may differ from those shown in the Computational Materials due to differences between the final underlying assets and the preliminary underlying assets used in preparing the Computational Materials. The principal amount and designation of any certificate described in the Computational Materials are subject to change prior to issuance. None of the Underwriters nor any of their respective affiliates make any representation or warranty as to the actual rate or timing of payments or losses on any of the underlying assets or the payments or yield on the certificates.
This information is based upon management forecasts and reflects prevailing conditions and management’s views as of this date, all of which are subject to change.
This document contains forward-looking statements. Those statements are subject to certain risks and uncertainties that could cause the success of collections and the actual cash flow generated to differ materially from the information set forth in this document. While such information reflects projections prepared in good faith based upon methods and data that are believed to be reasonable and accurate as of their dates, the Depositor undertakes no obligation to revise these forward-looking statements to reflect subsequent events or circumstances. Investors should not place undue reliance on forward-looking statements and are advised to make their own independent analysis and determination with respect to the forecasted periods, which reflect the Depositor’s view only as of the date of this document.
J.P. Morgan is the marketing name for the investment banking businesses of JPMorgan Chase & Co. and its subsidiaries worldwide. Securities, syndicated loan arranging, financial advisory and other investment banking activities are performed by JPMS and its securities affiliates, and lending, derivatives and other commercial banking activities are performed by JPMorgan Chase Bank, National Association and its banking affiliates. JPMS is a member of SIPC and the NYSE.
Capitalized terms used in this material but not defined herein shall have the meanings ascribed to them in the Preliminary Prospectus (as defined below).
THE CERTIFICATES REFERRED TO IN THESE MATERIALS ARE SUBJECT TO MODIFICATION OR REVISION (INCLUDING THE POSSIBILITY THAT ONE OR MORE CLASSES OF CERTIFICATES MAY BE SPLIT, COMBINED OR ELIMINATED AT ANY TIME PRIOR TO ISSUANCE OR AVAILABILITY OF A FINAL PROSPECTUS) AND ARE OFFERED ON A “WHEN, AS AND IF ISSUED” BASIS.
THE UNDERWRITERS MAY FROM TIME TO TIME PERFORM INVESTMENT BANKING SERVICES FOR, OR SOLICIT INVESTMENT BANKING BUSINESS FROM, ANY COMPANY NAMED IN THESE MATERIALS. THE UNDERWRITERS AND/OR THEIR AFFILIATES OR RESPECTIVE EMPLOYEES MAY FROM TIME TO TIME HAVE A LONG OR SHORT POSITION IN ANY CERTIFICATE OR CONTRACT DISCUSSED IN THESE MATERIALS.
THE INFORMATION IN THIS STRUCTURAL AND COLLATERAL TERM SHEET IS NOT COMPLETE AND MAY BE AMENDED PRIOR TO THE TIME OF SALE. THIS TERM SHEET IS NOT AN OFFER TO SELL THESE SECURITIES AND IT IS NOT A SOLICITATION OF AN OFFER TO BUY THESE SECURITIES IN ANY JURISDICTION WHERE THE OFFER OR SALE IS NOT PERMITTED.
 | 2 of 136 |  |
| Structural and Collateral Term Sheet | JPMDB 2018-C8 | |
| Indicative Capital Structure | ||
Publicly Offered Certificates
| Class | Expected Ratings (S&P / Fitch / KBRA) | Approximate Initial Certificate Balance or Notional Amount(1) | Approximate Initial Available Certificate Balance or Notional Amount(1) | Approximate Initial Retained Certificate Balance or Notional Amount(1)(2) | Approximate Initial Credit Support(3) | Expected Weighted Avg. Life (years)(4) | Expected Principal Window(4) | Certificate Principal to Value Ratio(5) | Underwritten NOI Debt Yield(6) |
| A-1 | AAA(sf) / AAAsf / AAA(sf) | $20,521,343 | $19,730,000 | $791,343 | 30.000% | 2.63 | 7/18 – 12/22 | 41.8% | 15.9% |
| A-2 | AAA(sf) / AAAsf / AAA(sf) | $131,981,467 | $126,892,000 | $5,089,467 | 30.000% | 4.76 | 12/22 – 6/23 | 41.8% | 15.9% |
| A-3 | AAA(sf) / AAAsf / AAA(sf) | (7) | (7) | (7) | 30.000% | (7) | (7) | 41.8% | 15.9% |
| A-4 | AAA(sf) / AAAsf / AAA(sf) | (7) | (7) | (7) | 30.000% | (7) | (7) | 41.8% | 15.9% |
| A-SB | AAA(sf) / AAAsf / AAA(sf) | $33,165,944 | $31,887,000 | $1,278,944 | 30.000% | 7.33 | 6/23 – 11/27 | 41.8% | 15.9% |
| X-A | AA+(sf) / AAAsf / AAA(sf) | $563,379,010(8) | $541,654,000(8) | $21,725,010(8) | N/A | N/A | N/A | N/A | N/A |
| X-B | A-(sf) / A-sf / AAA(sf) | $65,073,358(8) | $62,564,000(8) | $2,509,358(8) | N/A | N/A | N/A | N/A | N/A |
| A-S | AA+(sf) / AAAsf / AAA(sf) | $64,183,025 | $61,708,000 | $2,475,025 | 21.000% | 9.92 | 5/28 – 5/28 | 47.2% | 14.1% |
| B | AA-(sf) / AA-sf / AA(sf) | $32,981,845 | $31,710,000 | $1,271,845 | 16.375% | 9.92 | 5/28 – 5/28 | 49.9% | 13.3% |
| C | A-(sf) / A-sf / A(sf) | $32,091,512 | $30,854,000 | $1,237,512 | 11.875% | 9.92 | 5/28 – 5/28 | 52.6% | 12.6% |
Privately Offered Certificates(9)
| Class | Expected Ratings (S&P / Fitch / KBRA) | Approximate Initial Certificate Balance or Notional Amount(1) | Approximate Initial Available Certificate Balance or Notional Amount(1) | Approximate Initial Retained Certificate Balance or Notional Amount(1)(2) | Approximate Initial Credit Support(3) | Expected Weighted Avg. Life (years)(4) | Expected Principal Window(4) | Certificate Principal to Value Ratio(5) | Underwritten NOI Debt Yield(6) |
| X-D | NR / BBB-sf / BBB-(sf) | $35,657,005(8) | $34,282,000(8) | $1,375,005(8) | N/A | N/A | N/A | N/A | N/A |
| X-EF | NR / BB-sf / BB-(sf) | $16,044,716(8) | $15,426,000(8) | $618,716(8) | N/A | N/A | N/A | N/A | N/A |
| X-G | NR / B-sf / B(sf) | $7,132,025(8) | $6,857,000(8) | $275,025(8) | N/A | N/A | N/A | N/A | N/A |
| D | NR / BBB-sf / BBB-(sf) | $35,657,005 | $34,282,000 | $1,375,005 | 6.875% | 9.92 | 5/28 – 5/28 | 55.6% | 11.9% |
| E | NR / BB+sf / BB+(sf) | $8,912,691 | $8,569,000 | $343,691 | 5.625% | 9.92 | 5/28 – 5/28 | 56.3% | 11.8% |
| F | NR / BB-sf / BB-(sf) | $7,132,025 | $6,857,000 | $275,025 | 4.625% | 9.92 | 5/28 – 5/28 | 56.9% | 11.6% |
| G | NR / B-sf / B(sf) | $7,132,025 | $6,857,000 | $275,025 | 3.625% | 9.98 | 5/28 – 6/28 | 57.5% | 11.5% |
| NR-RR | NR / NR / NR | $25,851,542 | $24,854,655 | $996,887 | 0.000% | 10.00 | 6/28 – 6/28 | 59.7% | 11.1% |
| (1) | In the case of each such Class, subject to a permitted variance of plus or minus 5%, including in connection with any variation in the certificate balances and notional amounts of the classes comprising the VRR Interest following the calculation of the actual fair value of the ABS interests (as such term is defined in Regulation RR) issued by the issuing entity. |
| (2) | On the Closing Date, SMF VI will cause a majority-owned affiliate to purchase from the underwriters the certificates (other than the Class S and Class R certificates) with the initial certificate balances or notional amounts, as applicable, as set forth in the table above under “Approx. Initial Retained Certificate Balance or Notional Amount”, as well as an approximately 3.856% interest in the Class S certificates, as further described in “Credit Risk Retention” in the Preliminary Prospectus. |
| (3) | The credit support percentages set forth for Class A-1, Class A-2, Class A-3, Class A-4 and Class A-SB Certificates represent the approximate initial credit support for the Class A-1, Class A-2, Class A-3, Class A-4 and Class A-SB Certificates in the aggregate. |
| (4) | Assumes 0% CPR / 0% CDR and a June 15, 2018 closing date. Based on modeling assumptions as described in the Preliminary Prospectus dated May 18, 2018 (the “Preliminary Prospectus”). |
| (5) | The “Certificate Principal to Value Ratio” for any Class of Principal Balance Certificates (other than the Class A-1, Class A-2, Class A-3, Class A-4 and Class A-SB Certificates) is calculated as the product of (a) the weighted average Cut-off Date LTV Ratio for the mortgage loans, multiplied by (b) a fraction, the numerator of which is the total initial Certificate Balance of such Class of Certificates and all Classes of Principal Balance Certificates senior to such Class of Certificates and the denominator of which is the total initial Certificate Balance of all of the Principal Balance Certificates. The Class A-1, Class A-2, Class A-3, Class A-4 and Class A-SB Certificate Principal to Value Ratios are calculated in the aggregate for those Classes as if they were a single Class. Investors should note, however, that excess mortgaged property value associated with a mortgage loan will not be available to offset losses on any other mortgage loan. |
| (6) | The “Underwritten NOI Debt Yield” for any Class of Principal Balance Certificates (other than the Class A-1, Class A-2, Class A-3, Class A-4 and Class A-SB Certificates) is calculated as the product of (a) the weighted average UW NOI Debt Yield for the mortgage loans and (b) the total initial Certificate Balance of all of the Classes of Principal Balance Certificates divided by the total initial Certificate Balance for such Class and all Classes of Principal Balance Certificates senior to such Class of Certificates. The Underwritten NOI Debt Yield for each of the Class A-1, Class A-2, Class A-3, Class A-4 and Class A-SB Certificates is calculated in the aggregate for those Classes as if they were a single Class. Investors should note, however, that net operating income from any mortgaged property supports only the related mortgage loan and will not be available to support any other mortgage loan. |
| (7) | The exact initial certificate balances of the Class A-3 and Class A-4 certificates are unknown and will be determined based on the final pricing of those classes of certificates. However, the respective initial certificate balances and weighted average lives of the Class A-3 and Class A-4 certificates are expected to be within the applicable ranges reflected in the following chart. The aggregate initial offered certificate balance of the Class A-3 and Class A-4 certificates is expected to be approximately $301,437,000, subject to a variance of plus or minus 5%. |
| Class of Certificates | Expected Range of Initial Certificate Balance | Expected Range of Initial Available Certificate Balance | Expected Range of Initial Retained Certificate Balance | Expected Range of Weighted Avg. Life (Yrs) | Expected Principal Window | |||||
| Class A-3 | $78,008,149 – $130,013,581 | $75,000,000 – $125,000,000 | $3,008,149 – $5,013,581 | 9.58 – 9.67 | 11/27 – 3/28 / 11/27– 4/28 | |||||
| Class A-4 | $183,513,650 – $235,519,082 | $176,437,000 – $226,437,000 | $7,076,650 – $9,082,082 | 9.84 – 9.85 | 3/28 – 5/28 / 4/28 – 5/28 |
| (8) | The Class X-A, Class X-B, Class X-D, Class X-EF and Class X-G Notional Amounts are defined in the Preliminary Prospectus. |
| (9) | The Class X-D, Class-X-EF, Class X-G, Class D, Class E, Class F, Class G and Class NR-RR Certificates are not being offered by the Preliminary Prospectus or this Term Sheet. The Class S and Class R Certificates are not shown above. |
THE INFORMATION IN THIS STRUCTURAL AND COLLATERAL TERM SHEET IS NOT COMPLETE AND MAY BE AMENDED PRIOR TO THE TIME OF SALE. THIS TERM SHEET IS NOT AN OFFER TO SELL THESE SECURITIES AND IT IS NOT A SOLICITATION OF AN OFFER TO BUY THESE SECURITIES IN ANY JURISDICTION WHERE THE OFFER OR SALE IS NOT PERMITTED.
| 3 of 136 | |
| Structural and Collateral Term Sheet | JPMDB 2018-C8 | |
| Summary of Transaction Terms | ||
| Securities Offered: | $628,452,367 monthly pay, multi-class, commercial mortgage REMIC Pass-Through Certificates. |
| Co-Lead Managers and Joint Bookrunners: | J.P. Morgan Securities LLC and Deutsche Bank Securities Inc. |
| Co-Managers: | Drexel Hamilton, LLC and Academy Securities, Inc. |
| Mortgage Loan Sellers: | JPMorgan Chase Bank, National Association (“JPMCB”) (27.2%), German American Capital Corporation (“GACC”) (29.7%), Starwood Mortgage Funding VI LLC (“SMF VI”) (29.2%) and BSPRT Finance, LLC (“BSP”) (13.9%). |
| Master Servicer: | Wells Fargo Bank, National Association. |
| Special Servicer: | LNR Partners, LLC (“LNR”). |
| Directing Certificateholder: | LNR Securities Holdings, LLC (or its affiliate). |
| Trustee: | Wilmington Trust, National Association. |
| Certificate Administrator: | Wells Fargo Bank, National Association. |
| Operating Advisor: | Pentalpha Surveillance LLC. |
| Asset Representations Reviewer: | Pentalpha Surveillance LLC. |
| Rating Agencies: | S&P Global Ratings, acting through Standard & Poor’s Financial Services LLC (“S&P”), Fitch Ratings, Inc. (“Fitch”) and Kroll Bond Rating Agency, Inc. (“KBRA”). |
| U.S. Credit Risk Retention: | SMF VI, an indirect wholly-owned subsidiary of Starwood Property Trust, Inc., is expected to act as the “retaining sponsor” for this securitization and intends to satisfy the U.S. credit risk retention requirements (i) through the purchase by Starwood Conduit CMBS Vertical Retention I LLC, a “majority-owned affiliate,” of an “eligible vertical interest” (each as defined in Regulation RR), which will consist of approximately 3.856% of the certificate balance, notional amount or percentage interest of each class of certificates (other than the Class R Certificates) (the “VRR Interest”) issued by the issuing entity and (ii) through the purchase by Starwood Conduit CMBS Horizontal Retention I LLC, a “majority-owned affiliate,” to acquire an “eligible horizontal residual interest” (each as defined in Regulation RR), which will consist of the portion of the Class NR-RR Certificates not included in the VRR Interest (the “HRR Interest”).
SMF VI, in its capacity as the “retaining sponsor” for this transaction, will be required to comply with the hedging, transfer and financing restrictions applicable to a “retaining sponsor” under the credit risk retention rules, which generally prohibit the transfer of the applicable certificates except to a “majority-owned affiliate” of the “retaining sponsor”. The restrictions on hedging and transfer under the credit risk retention rules as in effect on the closing date of this transaction will expire on and after the date that is the latest of (i) the date on which the aggregate principal balance of the mortgage loans has been reduced to 33% of the aggregate principal balance of the mortgage loans as of the Cut-off Date; (ii) the date on which the total unpaid principal obligations under the certificates has been reduced to 33% of the aggregate total unpaid principal obligations under the certificates as of the Closing Date; or (iii) two years after the Closing Date.
For additional information, see “Credit Risk Retention” in the Preliminary Prospectus. |
| EU Credit Risk Retention: | The transaction is not structured to satisfy the EU risk retention and due diligence requirements. |
| Pricing Date: | On or about May [23], 2018. |
| Closing Date: | On or about June 15, 2018. |
| Cut-off Date: | With respect to each mortgage loan, the related due date in June 2018, or with respect to any mortgage loan that has its first due date in July 2018, the date that would otherwise have been the related due date in June 2018. |
| Distribution Date: | The 4th business day after the Determination Date in each month, commencing in July 2018. |
| Determination Date: | 11thday of each month, or if the 11th day is not a business day, the next succeeding business day, commencing in July 2018. |
| Assumed Final Distribution Date: | The Distribution Date in June 2028 which is the latest anticipated repayment date of the Certificates. |
| Rated Final Distribution Date: | The Distribution Date in June 2051. |
| Tax Treatment: | The Publicly Offered Certificates are expected to be treated as REMIC “regular interests” for U.S. federal income tax purposes. |
| Form of Offering: | The Class A-1, Class A-2, Class A-3, Class A-4, Class A-SB, Class X-A, Class X-B, Class A-S, Class B and Class C Certificates (the “Publicly Offered Certificates”) will be offered publicly. The Class X-D, Class X-EF, Class X-G, Class D, Class E, Class F, Class G, Class NR-RR, Class S and Class R Certificates (the “Privately Offered Certificates”) will be offered domestically to Qualified Institutional Buyers and to Institutional Accredited Investors and to institutions that are not U.S. Persons pursuant to Regulation S. |
| SMMEA Status: | The Certificates will not constitute “mortgage related securities” for purposes of SMMEA. |
| ERISA: | The Publicly Offered Certificates are expected to be ERISA eligible. |
THE INFORMATION IN THIS STRUCTURAL AND COLLATERAL TERM SHEET IS NOT COMPLETE AND MAY BE AMENDED PRIOR TO THE TIME OF SALE. THIS TERM SHEET IS NOT AN OFFER TO SELL THESE SECURITIES AND IT IS NOT A SOLICITATION OF AN OFFER TO BUY THESE SECURITIES IN ANY JURISDICTION WHERE THE OFFER OR SALE IS NOT PERMITTED.
| 4 of 136 | |
| Structural and Collateral Term Sheet | JPMDB 2018-C8 | |
| Summary of Transaction Terms | ||
Optional Termination:
| On any Distribution Date on which the aggregate principal balance of the pool of mortgage loans is less than (or, in the case of clause (ii) below, less than or equal to) the greater of (i) 1% of the aggregate principal balance of the mortgage loans as of the Cut-off Date, or (ii) if either the mortgage loan identified on Annex A-1 to the Preliminary Prospectus as “Marina Heights State Farm” or “U-Haul AREC 27 Portfolio” is an asset of the trust fund, the product of (x) a percentage that is calculated by dividing (A) the sum of the outstanding principal balance of the mortgage loan identified on Annex A-1 to the Preliminary Prospectus as “Marina Heights State Farm” and/or “U-Haul AREC 27 Portfolio” on any date of determination and 1% of the aggregate principal balance of the mortgage loans as of the Cut-off Date by (B) the aggregate principal balance of the mortgage loans as of the Cut-off Date and (y) the aggregate principal balance of the mortgage loans as of the Cut-off Date, certain entities specified in the Preliminary Prospectus will have the option to purchase all of the remaining mortgage loans (and all property acquired through exercise of remedies in respect of any mortgage loan) at the price specified in the Preliminary Prospectus (provided, however, that the termination right will not be exercisable in connection with the percentage threshold in (ii) above prior to the Distribution Date in June 2028). Refer to “Pooling and Servicing Agreement—Termination; Retirement of Certificates” in the Preliminary Prospectus. |
| Minimum Denominations: | The Publicly Offered Certificates (other than the Class X-A and Class X-B Certificates) will be issued in minimum denominations of $10,000 and integral multiples of $1 in excess of $10,000. The Class X-A and Class X-B Certificates will be issued in minimum denominations of $1,000,000 and in integral multiples of $1 in excess of $1,000,000. |
| Settlement Terms: | DTC, Euroclear and Clearstream Banking. |
| Analytics: | The transaction is expected to be modeled by Intex Solutions, Inc. and Trepp, LLC and is expected to be available on Bloomberg L.P., Blackrock Financial Management, Inc., Interactive Data Corporation, CMBS.com, Inc., Markit Group Limited, Moody’s Analytics, MBS Data, LLC and Thomson Reuters Corporation. |
| Risk Factors: | THE CERTIFICATES INVOLVE CERTAIN RISKS AND MAY NOT BE SUITABLE FOR ALL INVESTORS. REFER TO “RISK FACTORS” IN THE PRELIMINARY PROSPECTUS. |
THE INFORMATION IN THIS STRUCTURAL AND COLLATERAL TERM SHEET IS NOT COMPLETE AND MAY BE AMENDED PRIOR TO THE TIME OF SALE. THIS TERM SHEET IS NOT AN OFFER TO SELL THESE SECURITIES AND IT IS NOT A SOLICITATION OF AN OFFER TO BUY THESE SECURITIES IN ANY JURISDICTION WHERE THE OFFER OR SALE IS NOT PERMITTED.
| 5 of 136 | |
| Structural and Collateral Term Sheet | JPMDB 2018-C8 | |
| Collateral Characteristics | ||
| Loan Pool | ||
| Initial Pool Balance (“IPB”): | $713,137,655 | |
| Number of Mortgage Loans: | 41 | |
| Number of Mortgaged Properties: | 69 | |
| Average Cut-off Date Balance per Mortgage Loan: | $17,393,601 | |
| Weighted Average Current Mortgage Rate: | 4.77046% | |
| 10 Largest Mortgage Loans as % of IPB: | 50.9% | |
| Weighted Average Remaining Term to Maturity(1): | 107 months | |
| Weighted Average Seasoning: | 2 months | |
| Credit Statistics | ||
| Weighted Average UW NCF DSCR(2)(3): | 1.99x | |
| Weighted Average UW NOI Debt Yield(2): | 11.1% | |
| Weighted Average Cut-off Date Loan-to-Value Ratio (“LTV”)(2)(4): | 59.7% | |
| Weighted Average Maturity Date LTV(1)(2)(4): | 54.5% | |
| Other Statistics | ||
| % of Mortgage Loans with Additional Debt: | 10.7% | |
| % of Mortgaged Properties with Single Tenants: | 5.3% | |
| Amortization | ||
| Weighted Average Original Amortization Term(5): | 350 months | |
| Weighted Average Remaining Amortization Term(5): | 349 months | |
| % of Mortgage Loans with Partial Interest-Only followed by Amortizing Balloon: | 35.8% | |
| % of Mortgage Loans with Interest-Only: | 26.1% | |
| % of Mortgage Loans with Amortizing Balloon: | 22.9% | |
| % of Mortgage Loans with Interest-Only followed by ARD structure: | 11.2% | |
| % of Mortgage Loans with Amortization followed by ARD structure: | 4.0% | |
| Lockbox / Cash Management(6) | ||
| % of Mortgage Loans with Springing Lockboxes: | 50.3% | |
| % of Mortgage Loans with In-Place, Hard Lockboxes: | 37.1% | |
| % of Mortgage Loans with No Lockboxes: | 7.0% | |
| % of Mortgage Loans with In-Place, Soft Lockboxes: | 5.6% | |
| % of Mortgage Loans with Springing Cash Management: | 83.4% | |
| % of Mortgage Loans with In-Place Cash Management: | 9.5% | |
| % of Mortgage Loans with No Cash Management: | 7.0% | |
| Reserves | ||
| % of Mortgage Loans Requiring Monthly Tax Reserves: | 79.6% | |
| % of Mortgage Loans Requiring Monthly Insurance Reserves: | 48.7% | |
| % of Mortgage Loans Requiring Monthly CapEx Reserves(7): | 73.1% | |
| % of Mortgage Loans Requiring Monthly TI/LC Reserves(8): | 61.1% | |
| (1) | In the case of Loan Nos. 1, 8 and 12, each with an anticipated repayment date, Remaining Term to Maturity and Maturity Date LTV are calculated as of the related anticipated repayment date. |
| (2) | In the case of Loan Nos. 1, 3, 4, 8, 9, 10, 11, 16, 19 and 27, the UW NCF DSCR, UW NOI Debt Yield, Cut-off Date LTV and Maturity Date LTV calculations include the related Pari Passu Companion Loan(s). In the case of Loan Nos. 8 and 16, the UW NCF DSCR, UW NOI Debt Yield, Cut-off Date LTV and Maturity Date LTV calculations exclude the related Subordinate Companion Loan(s). |
| (3) | In the case of Loan Nos. 11 and 16, the UW NCF DSCR is calculated using the sum of principal and interest payments over the first 12 payments allocable to the Mortgage Loan following the Cut-off Date based on the assumed principal payment schedule provided on Annex F and Annex G, respectively, to the Preliminary Prospectus. |
| (4) | In the case of Loan Nos. 5, 9, 13, 21 and 27, the Cut-off Date LTV and the Maturity Date LTV are calculated by using an appraised value based on certain hypothetical assumptions. Refer to “Description of the Mortgage Pool—Assessments of Property Value and Condition” and “—Appraised Value” in the Preliminary Prospectus for additional details. |
| (5) | Excludes 10 mortgage loans that are interest-only for the entire term or until the anticipated repayment date. |
| (6) | For a more detailed description of Cash Management, refer to “Description of the Mortgage Pool—Certain Terms of the Mortgage Loans—Mortgaged Property Accounts” in the Preliminary Prospectus. |
| (7) | CapEx Reserves include FF&E reserves for hotel properties. |
| (8) | Calculated only with respect to the Cut-off Date Balance of mortgage loans secured or partially secured by office, retail, mixed use and industrial properties. |
THE INFORMATION IN THIS STRUCTURAL AND COLLATERAL TERM SHEET IS NOT COMPLETE AND MAY BE AMENDED PRIOR TO THE TIME OF SALE. THIS TERM SHEET IS NOT AN OFFER TO SELL THESE SECURITIES AND IT IS NOT A SOLICITATION OF AN OFFER TO BUY THESE SECURITIES IN ANY JURISDICTION WHERE THE OFFER OR SALE IS NOT PERMITTED.
| 6 of 136 | |
| Structural and Collateral Term Sheet | JPMDB 2018-C8 | |
| Collateral Characteristics | ||
Mortgage Loan Seller | Number of | Number of | Aggregate | % of IPB |
| GACC(1) | 11 | 11 | $211,770,968 | 29.7% |
| SMF VI | 16 | 20 | 208,141,380 | 29.2% |
| JPMCB(2) | 8 | 25 | 194,191,782 | 27.2% |
| BSP | 6 | 13 | 99,033,525 | 13.9 |
| Total: | 41 | 69 | $713,137,655 | 100.0% |
| (1) | With the exception of Loan Nos. 1, 8, 19, all of the loans for which GACC is the Mortgage Loan Seller were originated by Deutsche Bank, AG, New York Branch (“DBNY”) (an affiliate of GACC). In the case of Loan No. 1, the whole loan was originated by Goldman Sachs Mortgage Company (“GSMC”), which sold the Marina Heights State Farm mortgage loan to DBNY. In the case of Loan No. 8, the whole loan was originated by Cantor Commercial Real Estate Lending, L.P. (“CCRE”) and Prima Mortgage Investment Trust, LLC. CCRE sold the DreamWorks Campus mortgage loan to DBNY. In the case of Loan No. 19, the whole loan was originated by Column Financial, Inc., JPMCB and CCRE. CCRE sold the Lehigh Valley Mall mortgage loan to DBNY. |
| (2) | In the case of Loan No. 16, the whole loan was co-originated by JPMCB, GSMC and Wells Fargo Bank, National Association. |
| Ten Largest Mortgage Loans | |||||||||||||
| No. | Loan Name | Mortgage Loan Seller | No. of Prop. | Cut-off Date Balance | % of IPB | SF/Units/ Rooms | Property Type | UW NCF DSCR(1) | UW NOI Debt Yield(1) | Cut-off Date LTV(1)(2) | Maturity Date LTV(1)(2)(3) | ||
| 1 | Marina Heights State Farm | GACC | 1 | $50,000,000 | 7.0% | 2,031,293 | Office | 3.12x | 11.3% | 58.3% | 58.3% | ||
| 2 | 1875 Atlantic Avenue | SMF VI | 1 | $42,000,000 | 5.9% | 118 | Multifamily | 1.43x | 7.1% | 60.7% | 60.7% | ||
| 3 | Atlantic Times Square | JPMCB | 1 | $40,000,000 | 5.6% | 379,376 | Mixed Use | 1.86x | 9.5% | 59.8% | 59.8% | ||
| 4 | Embassy Suites Glendale | JPMCB | 1 | $37,000,000 | 5.2% | 272 | Hotel | 2.04x | 11.3% | 59.6% | 59.6% | ||
| 5 | Sheraton Hotel Arlington | GACC | 1 | $36,193,886 | 5.1% | 311 | Hotel | 1.82x | 14.1% | 60.8% | 56.6% | ||
| 6 | Southland Shopping Center | SMF VI | 1 | $34,000,000 | 4.8% | 260,862 | Retail | 1.47x | 10.3% | 58.4% | 52.8% | ||
| 7 | The Metropolitan at Wilton Manors | BSP | 1 | $33,500,000 | 4.7% | 179 | Multifamily | 1.48x | 7.8% | 62.0% | 62.0% | ||
| 8 | DreamWorks Campus | GACC | 1 | $30,000,000 | 4.2% | 497,404 | Office | 6.31x | 14.8% | 31.0% | 31.0% | ||
| 9 | Meridian Corporate Center | JPMCB | 10 | $30,000,000 | 4.2% | 691,705 | Office | 1.63x | 11.0% | 69.9% | 64.1% | ||
| 10 | Steelyard Commons | GACC | 1 | $30,000,000 | 4.2% | 265,386 | Retail | 1.39x | 9.4% | 74.5% | 64.2% | ||
| Top 3 Total/Weighted Average | 3 | $132,000,000 | 18.5% | 2.20x | 9.4% | 59.5% | 59.5% | ||||||
| Top 5 Total/Weighted Average | 5 | $205,193,886 | 28.8% | 2.10x | 10.6% | 59.8% | 59.0% | ||||||
| Top 10 Total/Weighted Average | 19 | $362,693,886 | 50.9% | 2.24x | 10.6% | 59.5% | 57.2% | ||||||
| (1) | In the case of Loan Nos. 1, 3, 4, 8, 9 and 10, the UW NCF DSCR, UW NOI Debt Yield, Cut-off Date LTV and Maturity Date LTV calculations include the related Pari Passu Companion Loan(s). In the case of Loan No. 8, the UW NCF DSCR, UW NOI Debt Yield, Cut-off Date LTV and Maturity Date LTV calculations exclude the related Subordinate Companion Loan(s). |
| (2) | In the case of Loan Nos. 5 and 9, the Cut-off Date LTV and the Maturity Date LTV are calculated by using an appraised value based on certain hypothetical assumptions. Refer to “Description of the Mortgage Pool—Assessments of Property Value and Condition” and “—Appraised Value” in the Preliminary Prospectus for additional details. |
| (3) | In the case of Loan Nos. 1 and 8, each with an anticipated repayment date, Maturity Date LTV are calculated as of the related anticipated repayment date. |
THE INFORMATION IN THIS STRUCTURAL AND COLLATERAL TERM SHEET IS NOT COMPLETE AND MAY BE AMENDED PRIOR TO THE TIME OF SALE. THIS TERM SHEET IS NOT AN OFFER TO SELL THESE SECURITIES AND IT IS NOT A SOLICITATION OF AN OFFER TO BUY THESE SECURITIES IN ANY JURISDICTION WHERE THE OFFER OR SALE IS NOT PERMITTED.
| 7 of 136 | |
| Structural and Collateral Term Sheet | JPMDB 2018-C8 | |
| Collateral Characteristics | ||
| Pari Passu Companion Loan Summary | |||||||||
No. | Loan Name | Trust Cut-off Date Balance | Pari Passu Loan(s) Cut-off Date Balance | Total Mortgage Loan Cut-off Date Balance(1) | Controlling Pooling & Servicing Agreement | Master Servicer | Special Servicer | Voting Rights | |
| 1 | Marina Heights State Farm | $50,000,000 | $510,000,000 | $560,000,000 | GSMS 2017-FARM | KeyBank | AEGON | GSMS 2017-FARM | |
| 3 | Atlantic Times Square | $40,000,000 | $58,000,000 | $98,000,000 | JPMDB 2018-C8 | Wells Fargo | LNR | JPMDB 2018-C8 | |
| 4 | Embassy Suites Glendale | $37,000,000 | $31,000,000 | $68,000,000 | JPMDB 2018-C8 | Wells Fargo | LNR | JPMDB 2018-C8 | |
| 8 | DreamWorks Campus | $30,000,000 | $62,000,000 | $92,000,000 | UBS 2018-C9 | Midland | Rialto | (2) | |
| 9 | Meridian Corporate Center | $30,000,000 | $45,705,000 | $75,705,000 | (3) | (3) | (3) | (3) | |
| 10 | Steelyard Commons | $30,000,000 | $14,250,000 | $44,250,000 | JPMDB 2018-C8 | Wells Fargo | LNR | JPMDB 2018-C8 | |
| 11 | Constitution Plaza | $29,975,491 | $24,979,576 | $54,955,068 | JPMDB 2018-C8 | Wells Fargo | LNR | JPMDB 2018-C8 | |
| 16 | Twelve Oaks Mall | $16,609,145 | $182,700,601 | $199,309,746 | GSMS 2018-GS9 | Wells Fargo | Rialto | (2) | |
| 19 | Lehigh Valley Mall | $14,852,082 | $183,175,679 | $198,027,762 | Benchmark 2018-B1 | Wells Fargo | Midland | Benchmark 2018-B1 | |
| 27 | Fort Knox Executive Park | $7,962,419 | $26,873,166 | $34,835,585 | CGCMT 2018-B2 | Midland | LNR | CGCMT 2018-B2 | |
| (1) | In the case of Loan Nos. 8 and 16, the Total Mortgage Loan Cut-off Date Balance excludes the related Subordinate Companion Loan(s). |
| (2) | The initial controlling noteholder is a third party investor, as holder of the related controlling subordinate companion loan. Upon the occurrence and during the continuance of a control appraisal period, the trust governed by the related lead servicing agreement will be the controlling noteholder. |
| (3) | In the case of Loan No. 9, the whole loan will be serviced under the JPMDB 2018-C8 Pooling and Servicing Agreement until such time that the controllingpari passu companion loan has been securitized, at which point the whole loan will be serviced under the related pooling and servicing agreement. |
| Additional Debt Summary |
No. | Loan Name | Trust | Subordinate Debt Cut-off Date Balance(1) | Total Debt Cut-off Date Balance | Mortgage Loan UW NCF DSCR(2)(3) | Total Debt UW NCF DSCR(3) | Mortgage Loan | Total Debt Cut-off Date LTV | Mortgage Loan UW NOI Debt Yield(2) | Total Debt UW NOI Debt Yield |
| 8 | DreamWorks Campus | $30,000,000 | $108,000,000 | $200,000,000 | 6.31x | 2.07x | 31.0% | 67.3% | 14.8% | 6.8% |
| 11 | Constitution Plaza | $29,975,491 | $10,000,000 | $64,955,068 | 1.43x | 1.13x | 58.2% | 68.8% | 11.9% | 10.1% |
| 16 | Twelve Oaks Mall | $16,609,145 | $99,654,873 | $298,964,619 | 2.55x | 1.58x | 36.0% | 54.1% | 15.4% | 10.2% |
| (1) | In the case of Loan Nos. 8 and 16, Subordinate Debt Cut-off Date Balance represents one or more Subordinate Companion Loans. In the case of Loan No. 11, Subordinate Debt Cut-off Date Balance represents a mezzanine loan. |
| (2) | In the case of Loan Nos. 8, 11 and 16, Mortgage Loan UW NCF DSCR, Mortgage Loan Cut-off Date LTV and Mortgage Loan UW NOI Debt Yield calculations include any related Pari Passu Companion Loans, where applicable, but exclude the related Subordinate Companion Loan(s) or mezzanine loan(s), as applicable. |
| (3) | In the case of Loan Nos. 11 and 16, the Mortgage Loan UW NCF DSCR and Total Debt UW NCF DSCR are calculated using the sum of principal and interest payments over the first 12 payments allocable to the Mortgage Loan following the Cut-off Date based on the assumed principal payment schedule provided in Annex F and Annex G, respectively, to the Preliminary Prospectus. |
THE INFORMATION IN THIS STRUCTURAL AND COLLATERAL TERM SHEET IS NOT COMPLETE AND MAY BE AMENDED PRIOR TO THE TIME OF SALE. THIS TERM SHEET IS NOT AN OFFER TO SELL THESE SECURITIES AND IT IS NOT A SOLICITATION OF AN OFFER TO BUY THESE SECURITIES IN ANY JURISDICTION WHERE THE OFFER OR SALE IS NOT PERMITTED.
| 8 of 136 | |
| Structural and Collateral Term Sheet | JPMDB 2018-C8 | |
| Collateral Characteristics | ||
| Mortgaged Properties by Type(1) |
| Weighted Average | |||||||||
| Property Type | Property Subtype | Number of Properties | Cut-off Date Principal Balance | % of IPB | Occupancy | UW NCF DSCR(2)(3) | UW NOI Debt Yield(2) | Cut-off Date LTV(2)(4) | Maturity Date LTV(2)(4)(5) |
| Office | Suburban | 16 | $153,862,419 | 21.6% | 96.9% | 3.01x | 11.8% | 56.3% | 52.5% |
| CBD | 1 | 29,975,491 | 4.2 | 82.8% | 1.43x | 11.9% | 58.2% | 54.4% | |
| Medical | 1 | 8,350,000 | 1.2 | 85.3% | 1.74x | 9.3% | 63.5% | 63.5% | |
| Subtotal: | 18 | $192,187,911 | 26.9% | 94.2% | 2.71x | 11.7% | 56.9% | 53.3% | |
| Retail | Anchored | 5 | $101,657,882 | 14.3% | 93.2% | 1.45x | 10.1% | 65.6% | 57.3% |
| Super Regional Mall | 2 | 31,461,227 | 4.4 | 88.1% | 2.32x | 14.1% | 40.0% | 32.5% | |
| Shadow Anchored | 1 | 13,310,000 | 1.9 | 87.3% | 1.40x | 9.2% | 65.6% | 60.3% | |
| Freestanding | 7 | 5,830,000 | 0.8 | 100.0% | 2.50x | 12.7% | 50.0% | 50.0% | |
| Unanchored | 2 | 3,905,508 | 0.5 | 100.0% | 1.57x | 10.1% | 67.5% | 58.1% | |
| Single Tenant | 1 | 2,294,492 | 0.3 | 100.0% | 1.57x | 10.1% | 67.5% | 58.1% | |
| Subtotal: | 18 | $158,459,109 | 22.2% | 92.2% | 1.67x | 10.9% | 60.0% | 52.4% | |
| Hotel | Full Service | 3 | $87,896,552 | 12.3% | 79.8% | 1.96x | 13.0% | 59.0% | 55.1% |
| Limited Service | 3 | 21,602,204 | 3.0 | 73.9% | 2.00x | 14.7% | 58.3% | 45.7% | |
| Extended Stay | 1 | 8,574,092 | 1.2 | 76.9% | 2.22x | 17.4% | 57.0% | 43.0% | |
| Subtotal: | 7 | $118,072,847 | 16.6% | 78.5% | 1.99x | 13.7% | 58.7% | 52.5% | |
| Multifamily | Mid-Rise | 2 | $75,500,000 | 10.6% | 95.9% | 1.45x | 7.4% | 61.3% | 61.3% |
| Garden | 3 | 23,375,000 | 3.3% | 97.7% | 1.58x | 10.6% | 66.6% | 59.5% | |
| Subtotal: | 5 | $98,875,000 | 13.9% | 96.3% | 1.48x | 8.2% | 62.5% | 60.9% | |
| Mixed Use | Retail/Multifamily | 1 | $40,000,000 | 5.6% | 96.9% | 1.86x | 9.5% | 59.8% | 59.8% |
| Retail/Office | 2 | 12,900,000 | 1.8% | 96.7% | 1.77x | 10.5% | 60.2% | 56.9% | |
| Multifamily/Office | 1 | 6,300,000 | 0.9% | 95.6% | 1.24x | 8.4% | 66.3% | 59.0% | |
| Subtotal: | 4 | $59,200,000 | 8.3% | 96.7% | 1.77x | 9.6% | 60.6% | 59.1% | |
| Self Storage | Self Storage | 13 | $48,897,637 | 6.9% | 89.4% | 1.79x | 10.8% | 61.7% | 51.0% |
| Subtotal: | 13 | $48,897,637 | 6.9% | 89.4% | 1.79x | 10.8% | 61.7% | 51.0% | |
| Industrial | Flex | 2 | $28,000,000 | 3.9% | 92.4% | 1.62x | 12.1% | 65.3% | 59.5% |
| Warehouse | 1 | 4,745,152 | 0.7% | 100.0% | 1.68x | 12.1% | 62.4% | 51.7% | |
| Subtotal: | 3 | $32,745,152 | 4.6% | 93.5% | 1.63x | 12.1% | 64.9% | 58.4% | |
| Manufactured Housing | Manufactured Housing | 1 | $4,700,000 | 0.7% | 96.3% | 1.52x | 9.9% | 58.0% | 50.2% |
| Subtotal: | 1 | $4,700,000 | 0.7% | 96.3% | 1.52x | 9.9% | 58.0% | 50.2% | |
| Total / Weighted Average: | 69 | $713,137,655 | 100.0% | 91.3% | 1.99x | 11.1% | 59.7% | 54.5% | |
| (1) | Because this table presents information relating to the mortgaged properties and not mortgage loans, the information for mortgage loans secured by more than one mortgaged property is based on allocated loan amounts. |
| (2) | In the case of Loan Nos. 1, 3, 4, 8, 9, 10, 11, 16, 19 and 27, the UW NCF DSCR, UW NOI Debt Yield, Cut-off Date LTV and Maturity Date LTV calculations include the related Pari Passu Companion Loan(s). In the case of Loan Nos. 8 and 16, the UW NCF DSCR, UW NOI Debt Yield, Cut-off Date LTV and Maturity Date LTV calculations exclude the related Subordinate Companion Loan(s). |
| (3) | In the case of Loan Nos. 11 and 16, the UW NCF DSCR is calculated using the sum of principal and interest payments over the first 12 payments allocable to the Mortgage Loan following the Cut-off Date based on the assumed principal payment schedule provided on Annex F and Annex G, respectively, to the Preliminary Prospectus. |
| (4) | In the case of Loan Nos. 5, 9, 13, 21 and 27, the Cut-off Date LTV and the Maturity Date LTV are calculated by using an appraised value based on certain hypothetical assumptions. Refer to “Description of the Mortgage Pool—Assessments of Property Value and Condition” and “—Appraised Value” in the Preliminary Prospectus for additional details. |
| (5) | In the case of Loan Nos. 1, 8 and 12, each with an anticipated repayment date, Maturity Date LTV is calculated as of the related anticipated repayment date. |
THE INFORMATION IN THIS STRUCTURAL AND COLLATERAL TERM SHEET IS NOT COMPLETE AND MAY BE AMENDED PRIOR TO THE TIME OF SALE. THIS TERM SHEET IS NOT AN OFFER TO SELL THESE SECURITIES AND IT IS NOT A SOLICITATION OF AN OFFER TO BUY THESE SECURITIES IN ANY JURISDICTION WHERE THE OFFER OR SALE IS NOT PERMITTED.
| 9 of 136 | |
| Structural and Collateral Term Sheet | JPMDB 2018-C8 | |
| Collateral Characteristics | ||
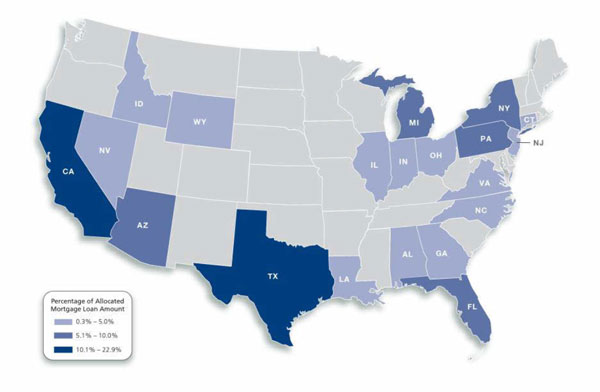
| Mortgaged Properties by Location(1) | ||||||||
| ||||||||
Weighted Average | ||||||||
State | Number of Properties | Cut-off Date Principal Balance | % of IPB | Occupancy | UW | UW | Cut-off Date LTV(2)(4) | Maturity Date LTV(2)(4)(5) |
| California | 9 | $163,250,000 | 22.9% | 95.4% | 2.64x | 11.1% | 54.8% | 52.8% |
| Texas | 10 | 113,655,401 | 15.9 | 83.3% | 1.76x | 12.5% | 61.8% | 54.4% |
| Pennsylvania | 7 | 69,529,733 | 9.7 | 90.1% | 1.76x | 10.9% | 56.4% | 50.8% |
| Arizona | 2 | 59,416,059 | 8.3 | 98.3% | 2.89x | 11.3% | 59.0% | 56.4% |
| New York | 2 | 49,185,396 | 6.9 | 92.1% | 1.47x | 7.7% | 61.2% | 59.7% |
| Michigan | 5 | 44,462,280 | 6.2 | 87.5% | 2.21x | 15.2% | 50.5% | 39.3% |
| Florida | 2 | 41,462,419 | 5.8 | 93.7% | 1.50x | 8.6% | 61.9% | 59.0% |
| Ohio | 4 | 35,484,133 | 5.0 | 94.8% | 1.45x | 9.7% | 72.4% | 62.1% |
| North Carolina | 11 | 30,971,390 | 4.3 | 91.0% | 1.66x | 11.1% | 69.3% | 63.7% |
| Connecticut | 1 | 29,975,491 | 4.2 | 82.8% | 1.43x | 11.9% | 58.2% | 54.4% |
| Georgia | 1 | 22,750,000 | 3.2 | 90.6% | 1.65x | 12.5% | 66.5% | 60.4% |
| Virginia | 2 | 13,232,882 | 1.9 | 91.3% | 1.40x | 10.2% | 58.8% | 51.1% |
| Indiana | 2 | 12,300,000 | 1.7 | 96.6% | 1.30x | 8.8% | 66.5% | 58.4% |
| Nevada | 3 | 6,200,000 | 0.9 | 100.0% | 1.57x | 10.1% | 67.5% | 58.1% |
| Wyoming | 1 | 6,000,000 | 0.8 | 100.0% | 1.34x | 8.7% | 68.2% | 62.9% |
| Illinois | 2 | 5,850,000 | 0.8 | 84.1% | 1.62x | 10.5% | 62.1% | 57.2% |
| New Jersey | 1 | 3,218,399 | 0.5 | 90.7% | 1.65x | 11.2% | 62.8% | 46.0% |
| Alabama | 2 | 2,497,397 | 0.4 | 95.4% | 1.88x | 11.6% | 59.3% | 47.1% |
| Louisiana | 1 | 1,873,248 | 0.3 | 78.6% | 1.65x | 11.2% | 62.8% | 46.0% |
| Idaho | 1 | 1,823,427 | 0.3 | 89.9% | 1.65x | 11.2% | 62.8% | 46.0% |
| Total / Weighted Average: | 69 | $713,137,655 | 100.0% | 91.3% | 1.99x | 11.1% | 59.7% | 54.5% |
| (1) | Because this table presents information relating to the mortgaged properties and not mortgage loans, the information for mortgage loans secured by more than one mortgaged property is based on allocated loan amounts. |
| (2) | In the case of Loan Nos. 1, 3, 4, 8, 9, 10, 11, 16, 19 and 27, the UW NCF DSCR, UW NOI Debt Yield, Cut-off Date LTV and Maturity Date LTV calculations include the related Pari Passu Companion Loan(s). In the case of Loan Nos. 8 and 16, the UW NCF DSCR, UW NOI Debt Yield, Cut-off Date LTV and Maturity Date LTV calculations exclude the related Subordinate Companion Loan(s). |
| (3) | In the case of Loan Nos. 11 and 16, the UW NCF DSCR is calculated using the sum of principal and interest payments over the first 12 payments allocable to the Mortgage Loan following the Cut-off Date based on the assumed principal payment schedule provided on Annex F and Annex G, respectively, to the Preliminary Prospectus. |
| (4) | In the case of Loan Nos. 5, 9, 13, 21 and 27, the Cut-off Date LTV and the Maturity Date LTV are calculated by using an appraised value based on certain hypothetical assumptions. Refer to “Description of the Mortgage Pool—Assessments of Property Value and Condition” and “—Appraised Value” in the Preliminary Prospectus for additional details. |
| (5) | In the case of Loan Nos. 1, 8 and 12, each with an anticipated repayment date, Maturity Date LTV is calculated as of the related anticipated repayment date. |
THE INFORMATION IN THIS STRUCTURAL AND COLLATERAL TERM SHEET IS NOT COMPLETE AND MAY BE AMENDED PRIOR TO THE TIME OF SALE. THIS TERM SHEET IS NOT AN OFFER TO SELL THESE SECURITIES AND IT IS NOT A SOLICITATION OF AN OFFER TO BUY THESE SECURITIES IN ANY JURISDICTION WHERE THE OFFER OR SALE IS NOT PERMITTED.
| 10 of 136 | |
| Structural and Collateral Term Sheet | JPMDB 2018-C8 | |
| Collateral Characteristics | ||
| Cut-off Date Principal Balance |
Weighted Average | |||||||||||
| Range of Cut-off Date Principal Balances | Number of Loans | Cut-off Date Principal Balance | % of IPB | Mortgage Rate | Remaining Loan Term(1) | UW NCF DSCR(2)(3) | UW NOI Debt Yield(2) | Cut-off Date LTV(2)(4) | Maturity Date LTV(1)(2)(4) | ||
| $2,350,000 | - | $9,999,999 | 17 | $103,205,849 | 14.5% | 5.04756% | 118 | 1.62x | 10.4% | 62.4% | 55.6% |
| $10,000,000 | - | $19,999,999 | 10 | 145,421,227 | 20.4 | 4.78844% | 118 | 1.85x | 12.1% | 57.7% | 49.9% |
| $20,000,000 | - | $24,999,999 | 2 | 43,443,565 | 6.1 | 5.16093% | 119 | 1.86x | 13.6% | 60.1% | 50.6% |
| $25,000,000 | - | $49,999,999 | 11 | 371,067,015 | 52.0 | 4.80381% | 96 | 2.01x | 10.6% | 59.8% | 56.0% |
| $50,000,000 | - | $50,000,000 | 1 | 50,000,000 | 7.0 | 3.55950% | 115 | 3.12x | 11.3% | 58.3% | 58.3% |
| Total / Weighted Average: | 41 | $713,137,655 | 100.0% | 4.77046% | 107 | 1.99x | 11.1% | 59.7% | 54.5% | ||
| Mortgage Interest Rates |
Weighted Average | |||||||||||
| Range of Mortgage Interest Rates | Number of Loans | Cut-off Date Principal Balance | % of IPB | Mortgage Rate | Remaining Loan Term(1) | UW NCF DSCR(2)(3) | UW NOI Debt Yield(2) | Cut-off Date LTV(2)(4) | Maturity Date LTV(1)(2)(4) | ||
| 2.29783% | - | 3.99999% | 2 | $80,000,000 | 11.2% | 3.08637% | 92 | 4.32x | 12.6% | 48.1% | 48.1% |
| 4.00000% | - | 4.49999% | 4 | 72,158,864 | 10.1 | 4.31350% | 117 | 2.04x | 12.3% | 52.2% | 42.3% |
| 4.50000% | - | 4.99999% | 17 | 282,365,000 | 39.6 | 4.81866% | 118 | 1.59x | 9.7% | 63.2% | 58.6% |
| 5.00000% | - | 5.99000% | 18 | 278,613,791 | 39.1 | 5.32353% | 96 | 1.71x | 11.9% | 61.4% | 55.5% |
| Total / Weighted Average: | 41 | $713,137,655 | 100.0% | 4.77046% | 107 | 1.99x
| 11.1% | 59.7% | 54.5% | ||
| Original Term to Maturity/ARD in Months(1) |
Weighted Average | |||||||||
| Original Term to Maturity in Months | Number of Loans | Cut-off Date Principal Balance | % of IPB | Mortgage Rate | Remaining Loan Term(1) | UW NCF DSCR(2)(3) | UW NOI Debt Yield(2)) | Cut-off Date LTV(2)(4) | Maturity Date LTV(1)(2)(4) |
| 60 | 4 | $133,169,378 | 18.7% | 4.80109% | 57 | 2.80x | 13.0% | 53.2% | 51.2% |
| 120 | 37 | 579,968,278 | 81.3 | 4.76343% | 118 | 1.80x | 10.7% | 61.2% | 55.3% |
| Total / Weighted Average: | 41 | $713,137,655 | 100.0% | 4.77046% | 107 | 1.99x | 11.1% | 59.7% | 54.5% |
| Remaining Term to Maturity/ARD in Months(1) | |||||||||
| Weighted Average | |||||||||||
| Range of Remaining Term to Maturity in Months | Number of Loans | Cut-off Date Principal Balance | % of IPB | Mortgage Rate | Remaining Loan Term(1) | UW NCF DSCR(2)(3) | UW NOI Debt Yield(2) | Cut-off Date LTV(2)(4) | Maturity Date LTV(1)(2)(4) | ||
| 54 | - | 84 | 4 | $133,169,378 | 18.7% | 4.80109% | 57 | 2.80x | 13.0% | 53.2% | 51.2% |
| 85 | - | 119 | 33 | 543,368,278 | 76.2 | 4.73904% | 118 | 1.80x | 10.6% | 61.3% | 55.6% |
| 120 | - | 120 | 4 | 36,600,000 | 5.1 | 5.12546% | 120 | 1.83x | 12.8% | 59.6% | 51.0% |
| Total / Weighted Average: | 41 | $713,137,655 | 100.0% | 4.77046% | 107 | 1.99x | 11.1% | 59.7% | 54.5% | ||
| (1) | In the case of Loan Nos. 1, 8 and 12, each with an anticipated repayment date, Remaining Loan Term and Maturity Date LTV are calculated as of the related anticipated repayment date. |
| (2) | In the case of Loan Nos. 1, 3, 4, 8, 9, 10, 11, 16, 19 and 27, the UW NCF DSCR, UW NOI Debt Yield, Cut-off Date LTV and Maturity Date LTV calculations include the related Pari Passu Companion Loan(s). In the case of Loan Nos. 8 and 16, the UW NCF DSCR, UW NOI Debt Yield, Cut-off Date LTV and Maturity Date LTV calculations exclude the related Subordinate Companion Loan(s). |
| (3) | In the case of Loan Nos. 11 and 16, the UW NCF DSCR is calculated using the sum of principal and interest payments over the first 12 payments allocable to the Mortgage Loan following the Cut-off Date based on the assumed principal payment schedule provided on Annex F and Annex G, respectively, to the Preliminary Prospectus. |
| (4) | In the case of Loan Nos. 5, 9, 13, 21 and 27, the Cut-off Date LTV and the Maturity Date LTV are calculated by using an appraised value based on certain hypothetical assumptions. Refer to “Description of the Mortgage Pool—Assessments of Property Value and Condition” and “—Appraised Value” in the Preliminary Prospectus for additional details. |
THE INFORMATION IN THIS STRUCTURAL AND COLLATERAL TERM SHEET IS NOT COMPLETE AND MAY BE AMENDED PRIOR TO THE TIME OF SALE. THIS TERM SHEET IS NOT AN OFFER TO SELL THESE SECURITIES AND IT IS NOT A SOLICITATION OF AN OFFER TO BUY THESE SECURITIES IN ANY JURISDICTION WHERE THE OFFER OR SALE IS NOT PERMITTED.
| 11 of 136 | |
| Structural and Collateral Term Sheet | JPMDB 2018-C8 | |
| Collateral Characteristics | ||
| Original Amortization Term in Months |
| Weighted Average | |||||||||
| Original Amortization Term in Months | Number of Loans | Cut-off Date Principal Balance | % of IPB | Mortgage Rate | Remaining Loan Term(1) | UW NCF DSCR(2)(3) | UW NOI Debt Yield(2) | Cut-off Date LTV(2)(4) | Maturity Date LTV(1)(2)(4) |
| Interest Only | 10 | $266,280,000 | 37.3% | 4.42703% | 103 | 2.53x | 10.2% | 56.3% | 56.3% |
| 300 | 4 | 74,053,622 | 10.4 | 4.83032% | 119 | 1.90x | 13.7% | 58.6% | 43.6% |
| 357 | 1 | 29,975,491 | 4.2 | 5.99000% | 59 | 1.43x | 11.9% | 58.2% | 54.4% |
| 360 | 26 | 342,828,543 | 48.1 | 4.91765% | 112 | 1.63x | 11.2% | 62.7% | 55.5% |
| Total / Weighted Average: | 41 | $713,137,655 | 100.0% | 4.77046% | 107 | 1.99x | 11.1% | 59.7% | 54.5% |
| Remaining Amortization Term in Months |
| Weighted Average | |||||||||||
| Range of Remaining Amortization Term in Months | Number of Loans | Cut-off Date Principal Balance | % of IPB | Mortgage Rate | Remaining Loan Term(1) | UW NCF DSCR(2)(3) | UW NOI Debt Yield(2) | Cut-off Date LTV(2)(4) | Maturity Date LTV(1)(2)(4) | ||
| Interest Only | 10 | $266,280,000 | 37.3% | 4.42703% | 103 | 2.53x | 10.2% | 56.3% | 56.3% | ||
| 297 | - | 356 | 7 | 155,075,081 | 21.7 | 5.07361% | 92 | 1.80x | 13.3% | 57.7% | 48.0% |
| 357 | - | 360 | 24 | 291,782,574 | 40.9 | 4.92276% | 118 | 1.59x | 10.8% | 63.8% | 56.4% |
| Total / Weighted Average: | 41 | $713,137,655 | 100.0% | 4.77046% | 107 | 1.99x | 11.1% | 59.7% | 54.5% | ||
| Amortization Types |
Weighted Average | |||||||||
| Amortization Types | Number of Loans | Cut-off Date Principal Balance | % of IPB | Mortgage Rate | Remaining Loan Term(1) | UW NCF DSCR(2)(3) | UW NOI Debt Yield(2) | Cut-off Date LTV(2)(4) | Maturity Date LTV(1)(2)(4) |
| IO-Balloon | 20 | $255,260,000 | 35.8% | 4.92401% | 119 | 1.53x | 10.5% | 65.8% | 58.6% |
| Interest Only | 8 | 186,280,000 | 26.1 | 5.00280% | 107 | 1.77x | 9.1% | 59.9% | 59.9% |
| Balloon | 10 | 163,200,018 | 22.9 | 5.16641% | 93 | 1.88x | 13.6% | 55.0% | 46.8% |
| ARD-Interest Only | 2 | 80,000,000 | 11.2 | 3.08637% | 92 | 4.32x | 12.6% | 48.1% | 48.1% |
| ARD-Balloon | 1 | 28,397,637 | 4.0 | 4.33500% | 118 | 1.65x | 11.2% | 62.8% | 46.0% |
| Total / Weighted Average: | 41 | $713,137,655 | 100.0% | 4.77046% | 107 | 1.99x | 11.1% | 59.7% | 54.5% |
| Underwritten Net Cash Flow Debt Service Coverage Ratios(2)(3) |
| Weighted Average | |||||||||||
| Range of Underwritten Net Cash Flow Debt Service Coverage Ratios | Number of Loans | Cut-off Date Principal Balance | % of IPB | Mortgage Rate | Remaining Loan Term(1) | UW NCF DSCR(2)(3) | UW NOI Debt Yield(2) | Cut-off Date LTV(2)(4) | Maturity Date LTV(1)(2)(4) | ||
| 1.24x | - | 1.49x | 12 | $227,418,373 | 31.9% | 5.13013% | 111 | 1.43x | 9.2% | 63.2% | 58.6% |
| 1.50x | - | 1.74x | 16 | 186,565,605 | 26.2 | 4.80967% | 118 | 1.62x | 11.1% | 64.7% | 55.9% |
| 1.75x | - | 1.99x | 4 | 94,868,886 | 13.3 | 5.04715% | 94 | 1.84x | 11.6% | 60.4% | 57.9% |
| 2.00x | - | 2.24x | 5 | 101,845,647 | 14.3 | 5.01387% | 97 | 2.10x | 13.1% | 55.5% | 49.2% |
| 2.25x | - | 6.31x | 4 | 102,439,145 | 14.4 | 3.40233% | 98 | 3.93x | 13.1% | 46.2% | 45.2% |
| Total / Weighted Average: | 41 | $713,137,655 | 100.0% | 4.77046% | 107 | 1.99x | 11.1% | 59.7% | 54.5% | ||
| (1) | In the case of Loan Nos. 1, 8 and 12, each with an anticipated repayment date, Remaining Loan Term and Maturity Date LTV are calculated as of the related anticipated repayment date. |
| (2) | In the case of Loan Nos. 1, 3, 4, 8, 9, 10, 11, 16, 19 and 27, the UW NCF DSCR, UW NOI Debt Yield, Cut-off Date LTV and Maturity Date LTV calculations include the related Pari Passu Companion Loan(s). In the case of Loan Nos. 8 and 16, the UW NCF DSCR, UW NOI Debt Yield, Cut-off Date LTV and Maturity Date LTV calculations exclude the related Subordinate Companion Loan(s). |
| (3) | In the case of Loan Nos. 11 and 16, the UW NCF DSCR is calculated using the sum of principal and interest payments over the first 12 payments allocable to the Mortgage Loan following the Cut-off Date based on the assumed principal payment schedule provided on Annex F and Annex G, respectively, to the Preliminary Prospectus. |
| (4) | In the case of Loan Nos. 5, 9, 13, 21 and 27, the Cut-off Date LTV and the Maturity Date LTV are calculated by using an appraised value based on certain hypothetical assumptions. Refer to “Description of the Mortgage Pool—Assessments of Property Value and Condition” and “—Appraised Value” in the Preliminary Prospectus for additional details. |
THE INFORMATION IN THIS STRUCTURAL AND COLLATERAL TERM SHEET IS NOT COMPLETE AND MAY BE AMENDED PRIOR TO THE TIME OF SALE. THIS TERM SHEET IS NOT AN OFFER TO SELL THESE SECURITIES AND IT IS NOT A SOLICITATION OF AN OFFER TO BUY THESE SECURITIES IN ANY JURISDICTION WHERE THE OFFER OR SALE IS NOT PERMITTED.
| 12 of 136 | |
| Structural and Collateral Term Sheet | JPMDB 2018-C8 | |
| Collateral Characteristics | ||
| LTV Ratios as of the Cut-off Date(2)(4) |
| Weighted Average | |||||||||||
| Range of Cut-off Date LTVs | Number of Loans | Cut-off Date Principal Balance | % of IPB | Mortgage Rate | Remaining Loan Term(1) | UW NCF DSCR(2)(3) | UW NOI Debt Yield(2) | Cut-off Date LTV(2)(4) | Maturity Date LTV(1)(2)(4) | ||
| 31.0% | - | 49.9% | 3 | $61,461,227 | 8.6% | 3.29037% | 85 | 4.27x | 14.4% | 35.6% | 31.8% |
| 50.0% | - | 59.9% | 12 | 266,781,938 | 37.4 | 4.87068% | 103 | 2.07x | 11.5% | 57.9% | 54.4% |
| 60.0% | - | 64.9% | 13 | 212,084,491 | 29.7 | 4.93920% | 108 | 1.59x | 10.2% | 61.6% | 55.9% |
| 65.0% | - | 69.9% | 11 | 137,210,000 | 19.2 | 4.94011% | 119 | 1.56x | 10.8% | 67.4% | 60.4% |
| 70.0% | - | 74.5% | 2 | 35,600,000 | 5.0 | 4.91556% | 118 | 1.43x | 9.8% | 73.8% | 63.9% |
| Total / Weighted Average: | 41 | $713,137,655 | 100.0% | 4.77046% | 107 | 1.99x | 11.1% | 59.7% | 54.5% | ||
| LTV Ratios as of the Maturity/ARD Date(1)(2)(4) |
Weighted Average | |||||||||||
| Range of Maturity Date LTVs | Number of Loans | Cut-off Date Principal Balance | % of IPB | Mortgage Rate | Remaining Loan Term(1) | UW NCF DSCR(2)(3) | UW NOI Debt Yield(2) | Cut-off Date LTV(2)(4) | Maturity Date LTV(1)(2)(4) | ||
| 29.6% | - | 44.9% | 5 | $99,154,792 | 13.9% | 3.99574% | 98 | 3.46x | 15.0% | 42.9% | 35.4% |
| 45.0% | - | 49.9% | 3 | 44,342,939 | 6.2 | 4.64303% | 118 | 1.58x | 11.1% | 61.6% | 46.4% |
| 50.0% | - | 54.9% | 9 | 124,036,039 | 17.4 | 5.20763% | 104 | 1.57x | 10.9% | 58.7% | 52.9% |
| 55.0% | - | 59.9% | 14 | 248,493,886 | 34.8 | 4.77368% | 100 | 2.06x | 11.1% | 61.3% | 58.4% |
| 60.0% | - | 64.2% | 10 | 197,110,000 | 27.6 | 4.90970% | 119 | 1.51x | 9.3% | 66.3% | 62.2% |
| Total / Weighted Average: | 41 | $713,137,655 | 100.0% | 4.77046% | 107 | 1.99x | 11.1% | 59.7% | 54.5% | ||
| Prepayment Protection |
Weighted Average | |||||||||
| Prepayment Protection | Number of Loans | Cut-off Date Principal Balance | % of IPB | Mortgage Rate | Remaining Loan Term(1) | UW NCF DSCR(2)(3) | UW NOI Debt Yield(2) | Cut-off Date LTV(2)(4) | Maturity Date LTV(1)(2)(4) |
| Defeasance(5) | 30 | $534,802,655 | 75.0% | 4.87626% | 103 | 1.96x | 11.2% | 58.5% | 52.8% |
| Yield Maintenance | 9 | 165,185,000 | 23.2 | 4.41601% | 117 | 2.10x | 10.9% | 63.8% | 60.1% |
| Defeasance or Yield Maintenance | 2 | 13,150,000 | 1.8 | 4.91998% | 119 | 1.75x | 9.9% | 56.9% | 54.7% |
| Total / Weighted Average: | 41 | $713,137,655 | 100.0% | 4.77046% | 107 | 1.99x | 11.1% | 59.7% | 54.5% |
| Loan Purpose |
Weighted Average | |||||||||
| Loan Purpose | Number of Loans | Cut-off Date Principal Balance | % of IPB | Mortgage Rate | Remaining Loan Term(1) | UW NCF DSCR(2)(3) | UW NOI Debt Yield(2) | Cut-off Date LTV(2)(4) | Maturity Date LTV(1)(2)(4) |
| Refinance | 29 | $499,810,721 | 70.1% | 5.04569% | 106 | 1.68x | 10.7% | 60.9% | 55.8% |
| Acquisition | 10 | 168,320,152 | 23.6 | 4.06337% | 106 | 2.91x | 12.0% | 57.8% | 54.6% |
| Recapitalization | 2 | 45,006,782 | 6.3 | 4.35843% | 118 | 1.98x | 12.7% | 52.9% | 39.9% |
| Total / Weighted Average: | 41 | $713,137,655 | 100.0% | 4.77046% | 107 | 1.99x | 11.1% | 59.7% | 54.5% |
| (1) | In the case of Loan Nos. 1, 8 and 12, each with an anticipated repayment date, Remaining Loan Term and Maturity Date LTV are calculated as of the related anticipated repayment date. |
| (2) | In the case of Loan Nos. 1, 3, 4, 8, 9, 10, 11, 16, 19 and 27, the UW NCF DSCR, UW NOI Debt Yield, Cut-off Date LTV and Maturity Date LTV calculations include the related Pari Passu Companion Loan(s). In the case of Loan Nos. 8 and 16, the UW NCF DSCR, UW NOI Debt Yield, Cut-off Date LTV and Maturity Date LTV calculations exclude the related Subordinate Companion Loan(s). |
| (3) | In the case of Loan Nos. 11 and 16, the UW NCF DSCR is calculated using the sum of principal and interest payments over the first 12 payments allocable to the Mortgage Loan following the Cut-off Date based on the assumed principal payment schedule provided on Annex F and Annex G, respectively, to the Preliminary Prospectus. |
| (4) | In the case of Loan Nos. 5, 9, 13, 21 and 27, the Cut-off Date LTV and the Maturity Date LTV are calculated by using an appraised value based on certain hypothetical assumptions. Refer to “Description of the Mortgage Pool—Assessments of Property Value and Condition” and “—Appraised Value” in the Preliminary Prospectus for additional details. |
| (5) | In the case of Loan Nos. 3 and 4, the loan documents permit the borrowers to prepay the related loan with yield maintenance premium in the event the defeasance lockout period has not expired after certain dates. See the “Description of the Mortgage Pool—Certain Terms of the Mortgage Loans—Defeasance; Collateral Substitution” in the Preliminary Prospectus. |
THE INFORMATION IN THIS STRUCTURAL AND COLLATERAL TERM SHEET IS NOT COMPLETE AND MAY BE AMENDED PRIOR TO THE TIME OF SALE. THIS TERM SHEET IS NOT AN OFFER TO SELL THESE SECURITIES AND IT IS NOT A SOLICITATION OF AN OFFER TO BUY THESE SECURITIES IN ANY JURISDICTION WHERE THE OFFER OR SALE IS NOT PERMITTED.
| 13 of 136 | |
| Structural and Collateral Term Sheet | JPMDB 2018-C8 | |
| Collateral Characteristics | ||
| Previous Securitization History(1) |
| No. | Loan Name | Cut-off Date Principal Balance | % of IPB | Location | Property Type | Previous Securitization |
| 3 | Atlantic Times Square | $40,000,000 | 5.6% | Monterey Park, CA | Mixed Use | JPMCC 2013-C13 |
| 4 | Embassy Suites Glendale | 37,000,000 | 5.2% | Glendale, CA | Hotel | JPMBB 2013-C14 |
| 5 | Sheraton Hotel Arlington | 36,193,886 | 5.1% | Arlington, TX | Hotel | RSO 2015-CRE3 |
| 9 | Meridian Corporate Center | 30,000,000 | 4.2% | Durham, NC | Office | JPMBB 2014-C24 |
| 10 | Steelyard Commons | 30,000,000 | 4.2% | Cleveland, OH | Retail | JPMBB 2013-C12 |
| 11 | Constitution Plaza | 29,975,491 | 4.2% | Hartford, CT | Office | FORT CRE 2016-1 |
| 17 | Lakewood Forest Plaza | 16,575,000 | 2.3% | Houston, TX | Retail | GSMS 2010-C1 |
| 25 | Northridge Medical Tower | 8,350,000 | 1.2% | Northridge, CA | Office | DBUBS 2011-LC3 |
| 37 | Shoppes at Schoolhouse Crossing | 5,600,000 | 0.8% | Kennett Square, PA | Mixed Use | MSC 2008-T29 |
| 40 | Sunrise Pass Estates MHC | 4,700,000 | 0.7 | Barstow, CA | Manufactured Housing | WFRBS 2013-C14 |
| Total: | $238,394,378 | 33.4% | ||||
| (1) | The table above represents the properties for which the previously existing debt was most recently securitized, based on information provided by the related borrower or obtained through searches of a third-party database. |
THE INFORMATION IN THIS STRUCTURAL AND COLLATERAL TERM SHEET IS NOT COMPLETE AND MAY BE AMENDED PRIOR TO THE TIME OF SALE. THIS TERM SHEET IS NOT AN OFFER TO SELL THESE SECURITIES AND IT IS NOT A SOLICITATION OF AN OFFER TO BUY THESE SECURITIES IN ANY JURISDICTION WHERE THE OFFER OR SALE IS NOT PERMITTED.
| 14 of 136 | |
| Structural and Collateral Term Sheet | JPMDB 2018-C8 | |
| Class A-2(1) | ||
No. | Loan Name | Location | Cut-off Date Balance | % of IPB | Maturity Date Balance | % of Certificate Class(2) | Original Loan Term | Remaining Loan Term(3) | UW NCF DSCR(4)(5) | UW NOI Debt Yield(4) | Cut-off Date LTV(4)(6) | Maturity Date LTV(3)(4)(6) |
| 4 | Embassy Suites Glendale | Glendale, CA | $37,000,000 | 5.2% | $37,000,000 | 28.0% | 60 | 60 | 2.04x | 11.3% | 59.6% | 59.6% |
| 5 | Sheraton Hotel Arlington | Arlington, TX | 36,193,886 | 5.1% | 33,683,249 | 25.5% | 60 | 55 | 1.82x | 14.1% | 60.8% | 56.6% |
| 8 | DreamWorks Campus | Glendale, CA | 30,000,000 | 4.2% | 30,000,000 | 22.7% | 60 | 54 | 6.31x | 14.8% | 31.0% | 31.0% |
| 11 | Constitution Plaza | Hartford, CT | 29,975,491 | 4.2% | 28,029,464 | 21.2% | 60 | 59 | 1.43x | 11.9% | 58.2% | 54.4% |
| Total / Weighted Average: | $133,169,378 | 18.7% | $128,712,712 | 97.5% | 60 | 57 | 2.80x | 13.0% | 53.2% | 51.2% | ||
| (1) | The table above presents the mortgage loans whose balloon payments would be applied to pay down the certificate balance of the Class A-2 Certificates, assuming a 0% CPR and applying the “Modeling Assumptions” described in the Preliminary Prospectus, including the assumptions that (i) none of the mortgage loans in the pool experience prepayments, defaults or losses; (ii) there are no extensions of maturity dates of any mortgage loans in the pool; and (iii) each mortgage loan in the pool is paid in full on its stated maturity or anticipated repayment date, as applicable. Each Class of Certificates, including the Class A-2 Certificates, evidences undivided ownership interests in the entire pool of mortgage loans. Debt service coverage ratio, debt yield and loan-to-value ratio information does not take into account subordinate debt (whether or not secured by the mortgaged property), if any, that is allowed under the terms of any mortgage loan. See Annex A-1 to the Preliminary Prospectus. |
| (2) | Reflects the percentage equal to the Maturity Date Balance divided by the initial Class A-2 Certificate Balance. |
| (3) | In the case of Loan No. 8 with an anticipated repayment date, Remaining Loan Term and Maturity Date LTV are calculated as of the related anticipated repayment date. |
| (4) | In the case of Loan Nos. 4, 8 and 11, the UW NCF DSCR, UW NOI Debt Yield, Cut-off Date LTV and Maturity Date LTV calculations include the related Pari Passu Companion Loan(s). In the case of Loan No. 8, the UW NCF DSCR, UW NOI Debt Yield, Cut-off Date LTV and Maturity Date LTV calculations exclude the related Subordinate Companion Loan(s). |
| (5) | In the case of Loan No. 11, the UW NCF DSCR is calculated using the sum of principal and interest payments over the first 12 payments allocable to the Mortgage Loan following the Cut-off Date based on the assumed principal payment schedule provided on Annex F to the Preliminary Prospectus. |
| (6) | In the case of Loan No. 5, the Cut-off Date LTV and the Maturity Date LTV are calculated by using an appraised value based on certain hypothetical assumptions. Refer to “Description of the Mortgage Pool—Assessments of Property Value and Condition” and “—Appraised Value” in the Preliminary Prospectus for additional details. |
THE INFORMATION IN THIS STRUCTURAL AND COLLATERAL TERM SHEET IS NOT COMPLETE AND MAY BE AMENDED PRIOR TO THE TIME OF SALE. THIS TERM SHEET IS NOT AN OFFER TO SELL THESE SECURITIES AND IT IS NOT A SOLICITATION OF AN OFFER TO BUY THESE SECURITIES IN ANY JURISDICTION WHERE THE OFFER OR SALE IS NOT PERMITTED.
| 15 of 136 | |
| Structural and Collateral Term Sheet | JPMDB 2018-C8 | |
| Structural Overview | ||
| ■ Accrual: | Each Class of Certificates (other than the Class S and Class R Certificates) will accrue interest on a 30/360 basis. The Class S and Class R Certificates will not accrue interest. On each Distribution Date, any excess interest collected in respect of any mortgage loan in the trust with an anticipated repayment date, solely to the extent received from the related borrower during the related collection period, will be distributed to the holders of the Class S Certificates. | |
| ■ Distribution of Interest: | On each Distribution Date, accrued interest for each Class of Certificates (other than the Class S and Class R Certificates) at the applicable pass-through rate will be distributed in the following order of priority to the extent of available funds: first, to the Class A-1, Class A-2, Class A-3, Class A-4, Class A-SB, Class X-A, Class X-B, Class X-D, Class X-EF and Class X-G Certificates (the “Senior Certificates”), on apro rata basis, based on the interest entitlement for each such Class on such date, and then to the Class A-S, Class B, Class C, Class D, Class E, Class F, Class G and Class NR-RR Certificates, in that order, in each case until the interest entitlement for such date payable to each such Class is paid in full.
The pass-through rate applicable to the Class A-1, Class A-2, Class A-3, Class A-4, Class A-SB, Class A-S, Class B, Class C, Class D, Class E, Class F, Class G and Class NR-RR Certificates on each Distribution Date, will be aper annum rate equal to one of (i) a fixed rate, (ii) the weighted average of the net mortgage rates on the mortgage loans (in each case adjusted, if necessary, to accrue on the basis of a 360-day year consisting of twelve 30-day months), (iii) the lesser of a specified fixed pass-through rate and the rate described in clause (ii) above or (iv) the rate described in clause (ii) above less a specified percentage.
The pass-through rate for the Class X-A Certificates for any Distribution Date will be aper annum rate equal to the excess, if any, of (a) the weighted average of the net mortgage rates on the mortgage loans (in each case adjusted, if necessary, to accrue on the basis of a 360-day year consisting of twelve 30-day months), over (b) the weighted average of the pass-through rates on the Class A-1, Class A-2, Class A-3, Class A-4, Class A-SB and Class A-S Certificates for the related Distribution Date, weighted on the basis of their respective Certificate Balances outstanding immediately prior to that Distribution Date.
The pass-through rate for the Class X-B Certificates for any Distribution Date will be aper annum rate equal to the excess, if any, of (a) the weighted average of the net mortgage rates on the mortgage loans (in each case adjusted, if necessary, to accrue on the basis of a 360-day year consisting of twelve 30-day months), over (b) the weighted average of the pass-through rates on the Class B and Class C Certificates for the related Distribution Date, weighted on the basis of their respective Certificate Balances outstanding immediately prior to the Distribution Date.
The pass-through rate for the Class X-D Certificates for any Distribution Date will be aper annum rate equal to the excess, if any, of (a) the weighted average of the net mortgage rates on the mortgage loans (in each case adjusted, if necessary, to accrue on the basis of a 360-day year consisting of twelve 30-day months), over (b) the pass-through rates on the Class D Certificates for the related Distribution Date.
The pass-through rate for the Class X-EF Certificates for any Distribution Date will be aper annum rate equal to the excess, if any, of (a) the weighted average of the net mortgage rates on the mortgage loans (in each case adjusted, if necessary, to accrue on the basis of a 360-day year consisting of twelve 30-day months), over (b) the weighted average of the pass-through rates on the Class E and Class F Certificates for the related Distribution Date, weighted on the basis of their respective Certificate Balances outstanding immediately prior to the Distribution Date.
The pass-through rate for the Class X-G Certificates for any Distribution Date will be aper annum rate equal to the excess, if any, of (a) the weighted average of the net mortgage rates on the mortgage loans (in each case adjusted, if necessary, to accrue on the basis of a 360-day year consisting of twelve 30-day months), over (b) the pass-through rates on the Class G Certificates for the related Distribution Date.
The Class S Certificates will not have a pass-through rate. On each Distribution Date, a specified portion of any excess interest collected in respect of any mortgage loan in the trust with an anticipated repayment date, solely to the extent received from the related borrower during the related collection period, will be distributed to the holders of the Class S Certificates.
See “Description of the Certificates—Distributions” in the Preliminary Prospectus.
|
THE INFORMATION IN THIS STRUCTURAL AND COLLATERAL TERM SHEET IS NOT COMPLETE AND MAY BE AMENDED PRIOR TO THE TIME OF SALE. THIS TERM SHEET IS NOT AN OFFER TO SELL THESE SECURITIES AND IT IS NOT A SOLICITATION OF AN OFFER TO BUY THESE SECURITIES IN ANY JURISDICTION WHERE THE OFFER OR SALE IS NOT PERMITTED.
| 16 of 136 | |
| Structural and Collateral Term Sheet | JPMDB 2018-C8 | |
| Structural Overview | ||
| ■ Distribution of Principal: | On any Distribution Date prior to the Cross-Over Date, payments in respect of principal of the Certificates will be distributed:
first, to the Class A-SB Certificates until the Certificate Balance of the Class A-SB Certificates is reduced to the Class A-SB planned principal balance for the related Distribution Date set forth in Annex E to the Preliminary Prospectus, second, to the Class A-1 Certificates, until the Certificate Balance of such Class is reduced to zero, third, to the Class A-2 Certificates, until the Certificate Balance of such Class is reduced to zero, fourth, to the Class A-3 Certificates, until the Certificate Balance of such Class is reduced to zero, fifth, to the Class A-4 Certificates, until the Certificate Balance of such Class is reduced to zero and sixth to the Class A-SB Certificates, until the Certificate Balance of such Class is reduced to zero and then to the Class A-S, Class B, Class C, Class D, Class E, Class F, Class G and Class NR-RR Certificates, in that order, until the Certificate Balance of each such Class is reduced to zero.
On any Distribution Date on or after the Cross-Over Date, payments in respect of principal of the Certificates will be distributed to the Class A-1, Class A-2, Class A-3, Class A-4 and Class A-SB Certificates,pro rata based on the Certificate Balance of each such Class until the Certificate Balance of each such Class is reduced to zero.
The “Cross-Over Date” means the Distribution Date on which the aggregate Certificate Balances of the Class A-S, Class B, Class C, Class D, Class E, Class F, Class G and Class NR-RR Certificates have been reduced to zero as a result of the allocation of realized losses to such Classes.
The Class X-A, Class X-B, Class X-D, Class X-EF and Class X-G Certificates (the “Class X Certificates”) will not be entitled to receive distributions of principal; however, the notional amount of the Class X-A Certificates will be reduced by the aggregate amount of principal distributions, realized losses and trust fund expenses, if any, allocated to the Class A-1, Class A-2, Class A-3, Class A-4, Class A-SB and Class A-S Certificates, the notional amount of the Class X-B Certificates will be reduced by the aggregate amount of principal distributions, realized losses and trust fund expenses, if any, allocated to the Class B and Class C Certificates, the notional amount of the Class X-D Certificates will be reduced by the amount of principal distributions, realized losses and trust fund expenses, if any, allocated to the Class D Certificates, the notional amount of the Class X-EF Certificates will be reduced by the aggregate amount of principal distributions, realized losses and trust fund expenses, if any, allocated to Class E and Class F Certificates and the notional amount of the Class X-G Certificates will be reduced by the amount of principal distributions, realized losses and trust fund expenses, if any, allocated to the Class G Certificates.
The Class S Certificates have no certificate balance, notional amount, credit support, pass-through rate, rated final distribution date or rating, and will not be entitled to distributions of principal. The Class S Certificates are entitled to distributions of excess interest collected on the mortgage loan with an anticipated repayment date solely to the extent received from the related borrower and will represent beneficial ownership of the grantor trust, as further described in “Description of the Certificates—Distributions” in the Preliminary Prospectus.
| |
| ■ Yield Maintenance / Fixed Penalty Allocation: | For purposes of the distribution of Yield Maintenance Charges on any Distribution Date, Yield Maintenance Charges collected in respect of the mortgage loans will first be allocated pro rata among four groups (based on the aggregate amount of principal distributed to the Principal Balance Certificates in each group), consisting of (a) the Class A-1, Class A-2, Class A-3, Class A-4, Class A-SB, Class A-S and Class X-A Certificates (“YM Group A”), (b) the Class B, Class C and Class X-B Certificates (“YM Group BC”), (c) the Class X-D and Class D Certificates (“YM Group D”), (d) the Class X-EF, Class E and Class F Certificates (“YM Group EF”), (e) the Class X-G and Class G Certificates (“YM Group G”) and (f) the Class NR-RR Certificates (“YM Group NR-RR”). As among the Classes of Certificates in each YM Group, other than the YM Group RR, each Class of Certificates entitled to distributions of principal will receive an amount calculated generally in accordance with the following formula and as more specifically described in the Preliminary Prospectus, with any remaining Yield Maintenance Charges on such Distribution Date being distributed to the class of Class X Certificates in such YM Group. |
YM | X | Principal Paid to Class | X | (Pass-Through Rate on Class – Discount Rate) |
Total Principal Paid to the related YM Group | (Mortgage Rate on Loan – Discount Rate) |
THE INFORMATION IN THIS STRUCTURAL AND COLLATERAL TERM SHEET IS NOT COMPLETE AND MAY BE AMENDED PRIOR TO THE TIME OF SALE. THIS TERM SHEET IS NOT AN OFFER TO SELL THESE SECURITIES AND IT IS NOT A SOLICITATION OF AN OFFER TO BUY THESE SECURITIES IN ANY JURISDICTION WHERE THE OFFER OR SALE IS NOT PERMITTED.
| 17 of 136 | |
| Structural and Collateral Term Sheet | JPMDB 2018-C8 | |
| Structural Overview | ||
| With respect to the YM Group NR-RR, the Certificates in such YM Group entitled to distributions of principal will receive an amount calculated generally in accordance with the following formula and as more specifically described in the Preliminary Prospectus. No Yield Maintenance Charges will be distributed to the Class S or Class R Certificates. | ||
| ■ Realized Losses: | Losses on the mortgage loans will be allocated first to the Class NR-RR, Class G, Class F, Class E, Class D, Class C, Class B and Class A-S Certificates, in that order, in each case until the Certificate Balance of all such Classes have been reduced to zero, and then, to the Class A-1, Class A-2, Class A-3, Class A-4 and Class A-SB Certificates,pro rata, based on the Certificate Balance of each such Class, until the Certificate Balance of each such Class has been reduced to zero. The notional amounts of the Class X-A, Class X-B, Class X-D, Class X-EF and Class X-G Certificates will be reduced by the aggregate amount of realized losses allocated to Certificates that are components of the notional amounts of the Class X-A, Class X-B, Class X-D, Class X-EF and Class X-G Certificates, respectively.
Losses on eachpari passu Whole Loan will be allocated,pro rata, between the related mortgage loan and the relatedpari passu companion loan(s), based upon their respective principal balances, and with respect to any Whole Loan with one or more subordinate companion loans, first to the related subordinate companion loan(s) and then to the mortgage loan andpari passucompanion loans (if any).
| |
| ■ Interest Shortfalls: | A shortfall with respect to the amount of available funds distributable in respect of interest can result from, among other sources: (a) delinquencies and defaults by borrowers; (b) shortfalls resulting from the application of appraisal reductions to reduce P&I Advances; (c) shortfalls resulting from interest on Advances made by the Master Servicer, the Special Servicer or the Trustee; (d) shortfalls resulting from the payment of Special Servicing Fees and other additional compensation that the Special Servicer is entitled to receive; (e) shortfalls resulting from extraordinary expenses of the trust, including indemnification payments payable to the Depositor, the Master Servicer, the Special Servicer, the Certificate Administrator, the Trustee, the Operating Advisor and the Asset Representations Reviewer; (f) shortfalls resulting from a modification of a mortgage loan’s interest rate or principal balance; and (g) shortfalls resulting from other unanticipated or default-related expenses of the trust. Any such shortfalls that decrease the amount of available funds distributable in respect of interest to the Certificateholders will reduce distributions to the classes of Certificates (other than the Class S and Class R Certificates) beginning with those with the lowest payment priorities, in reverse sequential order. See “Description of the Certificates—Distributions—Priority of Distributions” in the Preliminary Prospectus. | |
| ■ Appraisal Reduction Amounts: | With respect to mortgage loans serviced under the Pooling and Servicing Agreement, upon the occurrence of certain trigger events with respect to a mortgage loan, which are generally tied to certain events of default under the related mortgage loan documents, the Special Servicer will be obligated to obtain an appraisal of the related mortgaged property and the Master Servicer will calculate the Appraisal Reduction Amount. The “Appraisal Reduction Amount” is generally the amount by which the current principal balance of the related mortgage loan or serviced whole loan, plus outstanding advances, real estate taxes, unpaid servicing fees and certain similar amounts exceeds the sum of (a) 90% of the appraised value of the related mortgaged property, (b) the amount of any escrows and letters of credit and reserves and (c) all insurance and casualty proceeds and condemnation awards that are collateral for the related mortgage loan.
With respect to the Non-Serviced Whole Loans, any Appraisal Reduction Amount will be similarly determined pursuant to the related trust and servicing agreement or pooling and servicing agreement, as applicable, under which it is serviced.
In general, the Appraisal Reduction Amounts that are allocated to the mortgage loans are notionally allocated to reduce, in reverse sequential order, the Certificate Balance of each Class of Certificates (other than the Class A-1, Class A-2, Class A-3, Class A-4 and Class A-SB Certificates) beginning with the Class NR-RR Certificates for certain purposes, including certain voting rights and the determination of the controlling class. As a result of calculating one or more Appraisal Reduction Amounts (and, in the case of any Whole Loan, to the extent allocated to the related mortgage loan), the amount of any required P&I Advance will be reduced, which will have the effect of reducing the amount of interest available to the most subordinate class of certificates then-outstanding (i.e.,first, to Class NR-RR Certificates;second, to the Class G Certificates;third, to the Class F Certificates;fourth, to the Class E |
THE INFORMATION IN THIS STRUCTURAL AND COLLATERAL TERM SHEET IS NOT COMPLETE AND MAY BE AMENDED PRIOR TO THE TIME OF SALE. THIS TERM SHEET IS NOT AN OFFER TO SELL THESE SECURITIES AND IT IS NOT A SOLICITATION OF AN OFFER TO BUY THESE SECURITIES IN ANY JURISDICTION WHERE THE OFFER OR SALE IS NOT PERMITTED.
| 18 of 136 | |
| Structural and Collateral Term Sheet | JPMDB 2018-C8 | |
| Structural Overview | ||
| Certificates;fifth, to the Class D Certificates,sixth, to the Class C Certificates,seventh, to the Class B Certificates,eighth, to the Class A-S Certificates and finally,pro rata based on their respective interest entitlements, to the Senior Certificates). | ||
| With respect to each servicedpari passu Whole Loan, the Appraisal Reduction Amount is notionally allocated,pro rata, between the related mortgage loan and the related servicedpari passu companion loan(s), based upon their respective principal balances. | ||
| ■ Appraisal Reduced Interest: | Accrued and unpaid interest at the related Mortgage Rate for a mortgage loan that is not advanced by the Master Servicer or the Trustee as backup master servicer due to the application of Appraisal Reduction Amounts to such mortgage loan. | |
| ■ Master Servicer Advances: | The Master Servicer will be required to advance certain delinquent scheduled mortgage loan payments of principal and interest and certain property protection advances, in each case, to the extent the Master Servicer deems such advances to be recoverable. At any time that an Appraisal Reduction Amount exists, the amount that would otherwise be required to be advanced by the Master Servicer in respect of delinquent payments of interest on any mortgage loan will be reduced to equal the product of (x) the interest portion of the amount that would be advanced without regard to any Appraisal Reduction Amount and (y) a fraction, the numerator of which is the then-outstanding principal balance of the mortgage loan minus the Appraisal Reduction Amount and the denominator of which is the then-outstanding principal balance of the mortgage loan immediately prior to the related Distribution Date. The Master Servicer will not make any principal or interest advances with respect to any companion loan. | |
| ■ Whole Loans: | Ten mortgage loans are each evidenced by one mortgage loan and one or more companion loans (each a “Companion Loan” and collectively with the related mortgage loan, a “Whole Loan”), secured by the same mortgage(s) on the related mortgaged property(ies). Each such mortgage loan and its related Companion Loan(s) are subject to an intercreditor agreement or co-lender. None of these Companion Loans will be part of the trust.
With respect to the Whole Loans referred to as the “Marina Heights State Farm Whole Loan”, the “Atlantic Times Square Whole Loan”, the “Embassy Suites Glendale Whole Loan”, the “DreamWorks Campus Whole Loan”, the “Meridian Corporate Center Whole Loan”, the “Steelyard Commons Whole Loan”, the “Constitution Plaza Whole Loan”, the “Twelve Oaks Mall Whole Loan”, the “Lehigh Valley Mall Whole Loan” and the “Fort Knox Executive Park Whole Loan”, one or more related Companion Loans arepari passu with the related mortgage loan (these Companion Loans are also referred to as the “Pari Passu Companion Loans”). In the case of each of the DreamWorks Campus Whole Loan and Twelve Oaks Mall Whole Loan, in addition to any related Pari Passu Companion Loans, one or more related Companion Loans are subordinate in right of payment to the related mortgage loan and the related Pari Passu Companion Loans (if any) (these Companion Loans are also referred to as the “Subordinate Companion Loans”).
The Atlantic Times Square Whole Loan, the Embassy Suites Glendale Whole Loan, the Steelyard Commons Whole Loan and the Constitution Plaza Whole Loan (each, a “Serviced Whole Loan”) will be serviced under the pooling and servicing agreement for the JPMDB 2018-C8 transaction (the “Pooling and Servicing Agreement”).
The Meridian Corporate Center Whole Loan (a “Servicing Shift Whole Loan”, and the related mortgage loan, a “Servicing Shift Mortgage Loan”) will be initially serviced pursuant to the Pooling and Servicing Agreement. After the securitization of the related controlling pari passu companion loan, the related Servicing Shift Whole Loan is expected to be serviced pursuant to the pooling and servicing agreement relating to the securitization of such controlling pari passu companion loan as described under “Description of the Mortgage Pool—The Whole Loans” in the Preliminary Prospectus.
The Marina Heights State Farm Whole Loan, the DreamWorks Campus Whole Loan, the Twelve Oaks Mall Whole Loan and the Lehigh Valley Mall Whole Loan are being serviced and administered pursuant to the applicable trust and servicing agreement or pooling and servicing agreement as described under “Description of the Mortgage Pool—The Whole Loans—The Non-Serviced Pari Passu Whole Loans” in the Preliminary Prospectus.
The Marina Heights State Farm Whole Loan, the DreamWorks Campus Whole Loan, the Twelve Oaks Mall Whole Loan, the Lehigh Valley Mall Whole Loan and the Fort Knox Executive Park Whole Loan are each a “Non-Serviced Whole Loan” and collectively the “Non-Serviced Whole Loans”. |
THE INFORMATION IN THIS STRUCTURAL AND COLLATERAL TERM SHEET IS NOT COMPLETE AND MAY BE AMENDED PRIOR TO THE TIME OF SALE. THIS TERM SHEET IS NOT AN OFFER TO SELL THESE SECURITIES AND IT IS NOT A SOLICITATION OF AN OFFER TO BUY THESE SECURITIES IN ANY JURISDICTION WHERE THE OFFER OR SALE IS NOT PERMITTED.
| 19 of 136 | |
| Structural and Collateral Term Sheet | JPMDB 2018-C8 | |
| Structural Overview | ||
| ■ Highlighted Servicing Provisions: | The following are certain servicing provisions of note:
The Special Servicer will not be entitled to any fees from the securitization trust or the related borrower during a fee restricted period, other than a portion of default interest collected on the related mortgage loan, if the Special Servicer elects to cause a mortgage loan to be transferred to special servicing under either of the following circumstances:
1. A transfer to special servicing as a result of an imminent or reasonably foreseeable default when the master servicer has not independently transferred the mortgage loan to special servicing for that reason; or
2. A transfer to special servicing after a maturity date default under circumstances where the master servicer has determined that the borrower has, prior to such maturity date, provided from an acceptable lender an executed term sheet or refinancing commitment or an executed purchase and sale agreement, in each case, that is consistent with CMBS market practices and is reasonably satisfactory in form and substance acceptable to the Master Servicer evidencing an expected refinancing of the mortgage loan or sale of the related Mortgaged Property.
A fee restricted period will end and the Special Servicer will generally be entitled to the special servicing fees payable with respect to any specially serviced loan after such mortgage loan would become a specially serviced loan for any other reason.
Certain revisions to the rights of the Directing Certificateholder to approve “major decisions” have been incorporated in the Preliminary Prospectus, including limiting the involvement of the Directing Certificateholder in (1) the replacement of the related property management company and (2) the consent to modifications of any mezzanine intercreditor agreement in circumstances when the Directing Certificateholder is affiliated with the mezzanine lender.
The Certificate Administrator will be required to identify the then-current Directing Certificateholder as part of its monthly distribution date statement.
See“Description of the Certificates” and“Pooling and Servicing Agreement” in the Preliminary Prospectus.
| |
| ■ Liquidated Loan Waterfall: | On liquidation of any mortgage loan, all net liquidation proceeds related to the mortgage loan (but not any related Companion Loan) will be applied so that amounts allocated as a recovery of accrued and unpaid interest will not, in the first instance, include any delinquent interest that was not advanced as a result of Appraisal Reduction Amounts or interest that accrued on any junior note(s) if such mortgage loan is an AB Modified Loan. After the adjusted interest amount is so allocated, any remaining liquidation proceeds will be allocated to offset certain advances and to pay principal on the mortgage loan until the unpaid principal amount of the mortgage loan has been reduced to zero. Any remaining liquidation proceeds will then be allocated to pay delinquent interest that was not advanced as a result of Appraisal Reduction Amounts and any interest that accrued on any junior note(s) if such mortgage loan is an AB Modified Loan. Any liquidation proceeds in respect of each such mortgage loan in excess of the related outstanding balance will first be applied to offset any interest shortfalls allocated to the Certificates (other than the Class S and Class R Certificates), in sequential order, and then to offset any realized losses allocated to the Certificates (other than the Class S and Class R Certificates), in sequential order. Any liquidation proceeds remaining after such applications will be distributed to the Class S and Class R Certificates. | |
| ■ Sale of Defaulted Loans and REO Properties: | The Special Servicer is required to solicit offers for any defaulted loan or REO property (other than a non-serviced mortgage loan), if the Special Servicer determines that no satisfactory arrangements can be made for collection of delinquent payments and the sale would be in the best economic interests of the certificateholders (or, in the case of any Serviced Whole Loan, the certificateholders and any holders of the related Serviced Pari Passu Companion Loans, as a collective whole, taking into account thepari passu or subordinate nature of such Serviced Companion Loans), on a net present value basis. | |
| In the case of each non-serviced mortgage loan, under certain circumstances permitted under the related intercreditor agreement, to the extent that such non-serviced mortgage loan is not |
THE INFORMATION IN THIS STRUCTURAL AND COLLATERAL TERM SHEET IS NOT COMPLETE AND MAY BE AMENDED PRIOR TO THE TIME OF SALE. THIS TERM SHEET IS NOT AN OFFER TO SELL THESE SECURITIES AND IT IS NOT A SOLICITATION OF AN OFFER TO BUY THESE SECURITIES IN ANY JURISDICTION WHERE THE OFFER OR SALE IS NOT PERMITTED.
| 20 of 136 | |
| Structural and Collateral Term Sheet | JPMDB 2018-C8 | |
| Structural Overview | ||
sold together with the related non-serviced companion loan by the special servicer for the related Non-Serviced Whole Loans, the Special Servicer will be entitled to sell (with respect to any mortgage loan other than an Excluded Loan, with the consent of the Directing Certificateholder if no Control Termination Event has occurred and is continuing) such non-serviced mortgage loan if it determines in accordance with the servicing standard that such action would be in the best interests of the certificateholders.
The Special Servicer is generally required to accept the highest cash offer received from any person for any defaulted loan or REO property in an amount at least equal to par plus accrued interest plus all other outstanding amounts due under such mortgage loan and any outstanding expenses of the trust relating to such mortgage loan (the “Purchase Price”) except as described in the Preliminary Prospectus.
With respect to the Serviced Whole Loans, any such sale of the related defaulted loan is required to also include the related Pari Passu Companion Loans, if any, and the prices will be adjusted accordingly.
With respect to the mortgage loans that have mezzanine debt or permit mezzanine debt in the future, the mezzanine lenders may have the option to purchase the related mortgage loan after certain events of default under such mortgage loan.
The Directing Certificateholder will not have a right of first refusal to purchase a defaulted loan.
If the Special Servicer does not receive a cash offer at least equal to the Purchase Price, the Special Servicer is required to accept the first cash offer received from any person that is determined to be a fair price and will be required to take into account (in addition to the results of any appraisal, updated appraisal or narrative appraisal that it may have obtained pursuant to the PSA within the prior 9 months), among other factors, the period and amount of the occupancy level and physical condition of the related Mortgaged Property and the state of the local economy) for such defaulted loan or REO property, if the highest offeror is a person other than a party to the Pooling and Servicing Agreement, the Directing Certificateholder, any sponsor, any borrower, any manager of a mortgaged property, any independent contractor engaged by the Special Servicer, with respect to a defaulted whole loan, the depositor, Master Servicer, Special Servicer (or independent contractor engaged by such Special Servicer) or the trustee for the securitization of a Companion Loan and each holder of any related Companion Loan or mezzanine loan (but only with respect to the related mortgage loan), or any known affiliate of any such person (each, an “Interested Person”). If the highest offer is made by an Interested Person, the Trustee will determine (based upon the most recent appraisal or updated appraisal conducted in accordance with the terms of the Pooling and Servicing Agreement) whether the offer constitutes a fair price for the defaulted loan or REO property provided that no offer from an Interested Person will constitute a fair price unless (A) it is the highest offer received and (B) if the offer is less than the applicable Purchase Price, at least two other offers are received from independent third parties and the Trustee may conclusively rely on the opinion of an independent appraiser or other independent expert retained by the Trustee in connection with making such determination. Neither the Trustee nor any of its affiliates may make an offer for or purchase any specially serviced mortgage loan or REO property.
If the Special Servicer does not receive any offers that are at least equal to the Purchase Price, the Special Servicer is not required to accept the highest offer and may accept a lower offer for a defaulted loan or REO property if the Special Servicer determines, in accordance with the servicing standard (and subject to the requirements of any related intercreditor agreement), that a rejection of such offer would be in the best interests of the Certificateholders and, with respect to any Serviced Whole Loan, the holder of the related Companion Loans, as a collective whole, as if such Certificateholders and, if applicable, the related Companion Loan Holder(s) constituted a single lender), so long as such lower offer was not made by the Special Servicer or any of its affiliates. If title to any mortgaged property is acquired by the trust fund, the Special Servicer will be required to sell such mortgaged property prior to the close of the third calendar year beginning after the year of acquisition, unless (a) the IRS grants or has not denied an extension of time to sell such mortgaged property or (b) the Special Servicer, Trustee and the Certificate Administrator receive an opinion of independent counsel to the effect that the holding of the property by the trust longer than the above-referenced three-year period will not result in the imposition of a tax on any REMIC of the trust fund or Grantor Trust or cause any REMIC of the trust fund to fail to qualify as a REMIC or the Grantor Trust to fail to qualify as a grantor trust. |
THE INFORMATION IN THIS STRUCTURAL AND COLLATERAL TERM SHEET IS NOT COMPLETE AND MAY BE AMENDED PRIOR TO THE TIME OF SALE. THIS TERM SHEET IS NOT AN OFFER TO SELL THESE SECURITIES AND IT IS NOT A SOLICITATION OF AN OFFER TO BUY THESE SECURITIES IN ANY JURISDICTION WHERE THE OFFER OR SALE IS NOT PERMITTED.
| 21 of 136 | |
| Structural and Collateral Term Sheet | JPMDB 2018-C8 | |
| Structural Overview | ||
| The foregoing applies to mortgage loans serviced under the Pooling and Servicing Agreement. With respect to each Non-Serviced Whole Loan, if the special servicer under the applicable trust and servicing agreement or pooling and servicing agreement, as applicable, determines to sell the related Companion Loan(s) as described above, then the applicable special servicer will be required to sell the related non-serviced mortgage loan, included in the JPMDB 2018-C8 Trust, and the related Companion Loan(s), as a single loan. In connection with any such sale, the then-applicable special servicer will be required to follow procedures substantially similar to those set forth above. | ||
| ■ Control Eligible Certificates: | Classes E, F, G and NR-RR. | |
| ■ Control Rights: | The Control Eligible Certificates will have certain control rights attached to them. The “Directing Certificateholder” will be (i) with respect to the Servicing Shift Mortgage Loan, the “controlling holder” or any analogous concept under the related intercreditor agreement, which prior to the securitization of the related controllingpari passucompanion loan will be the holder of such companion loan, and (ii) with respect to each mortgage loan (other than the Servicing Shift Mortgage Loan) the Controlling Class Certificateholder (or its representative) selected by more than 50% of the Controlling Class Certificateholders;provided,however, that (1) absent that selection, (2) until a Directing Certificateholder is so selected or (3) upon receipt of a notice from a majority of the Controlling Class Certificateholders that a Directing Certificateholder is no longer designated, the Controlling Class Certificateholder that owns the largest aggregate Certificate Balance of the Controlling Class (or its representative) will be the Directing Certificateholder;provided,however, that in the case of this clause (3), in the event no one holder owns the largest aggregate Certificate Balance of the Controlling Class, then there will be no Directing Certificateholder until appointed in accordance with the terms of the Pooling and Servicing Agreement. With respect to any mortgage loan (other than any non-serviced mortgage loan or any Excluded Loan), unless a Control Termination Event has occurred and is continuing, the Directing Certificateholder will be entitled to direct the Special Servicer to take, or refrain from taking, certain actions with respect to such mortgage loan. Furthermore, the Directing Certificateholder will also have the right to receive notice and provide consent with respect to certain material actions that the Master Servicer and the Special Servicer plan on taking with respect to a mortgage loan (other than any non-serviced mortgage loan or any Excluded Loan). With respect to any mortgage loan that has or may in the future have mezzanine debt, pursuant to the related intercreditor agreement, the related mezzanine lender may have certain consent rights with respect to certain modifications related to such mortgage loan.
A “Borrower Party” means a borrower, a mortgagor, a manager of a mortgaged property, an Accelerated Mezzanine Loan Lender, any other person controlling or controlled by or under common control with such borrower, mortgagor, manager or Accelerated Mezzanine Loan Lender, as applicable, or any other person owning, directly or indirectly, 25% or more of the beneficial interests in such borrower, mortgagor, manager or Accelerated Mezzanine Loan Lender, as applicable. For purposes of this definition, “control” when used with respect to any specified person means the power to direct the management and policies of such person, directly or indirectly, whether through the ownership of voting securities, by contract or otherwise and the terms “controlling” and “controlled” have meanings correlative to the foregoing.
An “Accelerated Mezzanine Loan Lender” means a mezzanine lender under a mezzanine loan that has been accelerated or as to which foreclosure or enforcement proceedings have been commenced against the equity collateral pledged to secure such mezzanine loan.
An “Excluded Loan” is a mortgage loan or Whole Loan with respect to which the Directing Certificateholder or the holder of the majority of the controlling class is a Borrower Party. As of the Closing Date, it is expected that there will be no Excluded Loans in this securitization.
With respect to the Serviced Whole Loans, direction, consent and consultation rights with respect to the related Whole Loan are subject to certain consultation rights of the holder of the related Pari Passu Companion Loans pursuant to the related intercreditor agreement.
With respect to any Non-Serviced Whole Loan, direction, consent and consultation rights with respect to the related Whole Loan will be exercised by the directing certificateholder or controlling class representative under the applicable trust and servicing agreement or pooling and servicing agreement, as applicable. |
THE INFORMATION IN THIS STRUCTURAL AND COLLATERAL TERM SHEET IS NOT COMPLETE AND MAY BE AMENDED PRIOR TO THE TIME OF SALE. THIS TERM SHEET IS NOT AN OFFER TO SELL THESE SECURITIES AND IT IS NOT A SOLICITATION OF AN OFFER TO BUY THESE SECURITIES IN ANY JURISDICTION WHERE THE OFFER OR SALE IS NOT PERMITTED.
| 22 of 136 | |
| Structural and Collateral Term Sheet | JPMDB 2018-C8 | |
| Structural Overview | ||
| With respect to any Servicing Shift Whole Loan, direction, consent and consultation rights with respect to the related Whole Loan will be exercised by the applicable directing holder pursuant to the applicable pooling and servicing agreement and related intercreditor agreement. | ||
| ■ Directing Certificateholder: | LNR Securities Holdings, LLC (or its affiliate), is expected to be appointed as the initial directing certificateholder with respect to all serviced mortgage loans (other than the Excluded Loans and the Servicing Shift Mortgage Loan). | |
| ■ Controlling Class: | The “Controlling Class” will at any date of determination be the most subordinate Class of Control Eligible Certificates then outstanding that has an aggregate Certificate Balance, as notionally reduced by any Cumulative Appraisal Reduction Amounts allocable to such Class, equal to no less than 25% of the initial Certificate Balance for such Class. Each holder of a certificate of the Controlling Class is referred to herein as a “Controlling Class Certificateholder”.
The Controlling Class as of the Closing Date will be the Class NR-RR Certificates;provided that if at any time the principal balances of the certificates other than the Control Eligible Certificates have been reduced to zero as a result of the allocation of principal payments on the mortgage loans, then the Controlling Class will be the most subordinate Class among the Control Eligible Certificates that has an aggregate principal balance greater than zero without regard to any Appraisal Reduction Amounts.
| |
| ■ Control Termination Event: | A “Control Termination Event” will occur when the Class E certificates have a Certificate Balance (taking into account the application of any Cumulative Appraisal Reduction Amounts to notionally reduce the Certificate Balance of such class) of less than 25% of the initial Certificate Balance of that class;provided that prior to the applicable securitization of the controllingpari passuCompanion Loan with respect to any Servicing Shift Whole Loan, no Control Termination Event may occur with respect to the Directing Certificateholder related to such Servicing Shift Whole Loan, and the term “Control Termination Event” will not be applicable to the Directing Certificateholder related to such Servicing Shift Whole Loan;provided, further,that a Control Termination Event will not be deemed to be continuing in the event the Certificate Balances of all Classes of Principal Balance Certificates other than the Control Eligible Certificates have been reduced to zero.
The “Cumulative Appraisal Reduction Amount” as of any date of determination, is equal to the sum of (i) with respect to any mortgage loan, all Appraisal Reduction Amounts then in effect, and (ii) with respect to any AB Modified Loan, any Collateral Deficiency Amount then in effect.
An “AB Modified Loan” means any corrected loan (1) that became a corrected loan (which includes for purposes of this definition any non-serviced mortgage loan that became a “corrected loan” (or any term substantially similar thereto) pursuant to the trust and servicing agreement or pooling and servicing agreement, as applicable, governing such non-serviced mortgage loan) due to a modification thereto that resulted in the creation of an A/B note structure (or similar structure) and as to which the new junior note(s) did not previously exist or the principal amount of the new junior note(s) was previously part of either an A note held by the issuing entity or the original unmodified mortgage loan and (2) as to which an Appraisal Reduction Amount is not in effect.
The “Collateral Deficiency Amount” means, with respect to any AB Modified Loan as of any date of determination, the excess of (i) the principal balance of such AB Modified Loan (taking into account the related junior note(s) and any pari passu notes included therein), over (ii) the sum of (in the case of a Whole Loan, solely to the extent allocable to the subject mortgage loan) (x) the most recent Appraised Value for the related mortgaged property or mortgaged properties, plus (y) solely to the extent not reflected or taken into account in such Appraised Value and to the extent on deposit with, or otherwise under the control of, the lender as of the date of such determination, any capital or additional collateral contributed by the related borrower at the time the mortgage loan became (and as part of the modification related to) such AB Modified Loan for the benefit of the related mortgaged property or mortgaged properties (provided, that in the case of a non-serviced mortgage loan, the amounts set forth in this clause (y) will be taken into account solely to the extent relevant information is received by the Master Servicer), plus (z) any other escrows or reserves (in addition to any amounts set forth in the immediately preceding clause (y)) held by the lender in respect of such AB Modified Loan as of the date of such determination.
Upon the occurrence and during the continuance of a Control Termination Event, the Controlling Class will no longer have any control rights. After the occurrence and during the |
THE INFORMATION IN THIS STRUCTURAL AND COLLATERAL TERM SHEET IS NOT COMPLETE AND MAY BE AMENDED PRIOR TO THE TIME OF SALE. THIS TERM SHEET IS NOT AN OFFER TO SELL THESE SECURITIES AND IT IS NOT A SOLICITATION OF AN OFFER TO BUY THESE SECURITIES IN ANY JURISDICTION WHERE THE OFFER OR SALE IS NOT PERMITTED.
| 23 of 136 | |
| Structural and Collateral Term Sheet | JPMDB 2018-C8 | |
| Structural Overview | ||
| continuance of a Control Termination Event, the Directing Certificateholder will relinquish its right to direct certain actions of the Special Servicer and will no longer have consent rights with respect to certain actions that the Master Servicer or the Special Servicer plan on taking with respect to a mortgage loan. Following the occurrence and during the continuance of a Control Termination Event, the Directing Certificateholder will retain consultation rights with the Special Servicer with respect to certain material actions that the Special Servicer plans on taking with respect to any mortgage loan other than an Excluded Loan. Such consultation rights will continue until the occurrence of a Consultation Termination Event. | ||
| ■ Consultation Termination Event: | A “Consultation Termination Event” will occur when there is no class of Control Eligible Certificates that has a then-outstanding Certificate Balance at least equal to 25% of the initial Certificate Balance of that class, in each case, without regard to the application of any Cumulative Appraisal Reduction Amounts;providedthat prior to the applicable securitization of the related controllingpari passuCompanion Loan with respect to a Servicing Shift Whole Loan, no Consultation Termination Event may occur with respect to the directing certificateholder related to the related Servicing Shift Whole Loan, and the term “Consultation Termination Event” will not be applicable to the Directing Certificateholder related to such Servicing Shift Whole Loan;provided, further, that a Consultation Termination Event will not be deemed to be continuing in the event the Certificate Balances of all Classes of Principal Balance Certificates other than the Control Eligible Certificates have been reduced to zero.
Upon the occurrence of a Consultation Termination Event, there will be no Class of Certificates that will act as the Controlling Class and the Directing Certificateholder will have no rights under the Pooling and Servicing Agreement, other than those rights generally available to all Certificateholders.
| |
| ■ Appraised-Out Class: | A Class of Control Eligible Certificates that has been determined, as a result of Appraisal Reduction Amounts or Collateral Deficiency Amounts allocable to such Class, to no longer be the Controlling Class. | |
| ■ Remedies Available to Holders of an Appraised-Out Class: | Holders of the majority of any Class of Control Eligible Certificates that are determined at any date of determination to no longer be the Controlling Class as a result of Appraisal Reduction Amounts or Collateral Deficiency Amounts allocable to such class will have the right, at their sole expense, to require the Special Servicer to order a supplemental appraisal report from an MAI appraiser (selected by the Special Servicer) for any mortgage loan (or Serviced Whole Loan) that results in the Class becoming an Appraised-Out Class.
Upon receipt of that supplemental appraisal, the Special Servicer will be required to determine, in accordance with the Servicing Standard, whether, based on its assessment of the supplemental appraisal, any recalculation of the Appraisal Reduction Amount or Collateral Deficiency Amount is warranted, and if so warranted, the Master Servicer will be required to recalculate the Appraisal Reduction Amount or Collateral Deficiency Amount, as applicable, based on the supplemental appraisal and if required by such recalculation, the Appraised-Out Class will be reinstated as the Controlling Class. The holders of an Appraised-Out Class requesting a supplemental appraisal are not permitted to exercise any control or consent rights of the Controlling Class until such time, if any, as the Class is reinstated as the Controlling Class.
| |
| ■ Operating Advisor: | The Operating Advisor will initially be Pentalpha Surveillance LLC. The Operating Advisor will have certain review and consultation rights relating to the performance of the Special Servicer and with respect to its actions taken in connection with the resolution and/or liquidation of specially serviced loans. The Operating Advisor will generally be responsible for reviewing the Special Servicer’s operational practices with respect to the resolution and liquidation of specially serviced loans. In addition, after the occurrence and during the continuance of a Control Termination Event, the Operating Advisor will have certain consultation rights with respect to the specially serviced loans. The Operating Advisor will generally have no obligations or consultation rights under the Pooling and Servicing Agreement with respect to the Non-Serviced Whole Loans or any related REO Property. | |
| However, Pentalpha Surveillance LLC is currently the operating advisor under the GSMS 2018-GS9 pooling and servicing agreement, the UBS 2018-C9 pooling and servicing agreement and the GSMS 2017-FARM trust and servicing agreement, and, in each such capacity, has certain obligations and consultation rights with respect to the GSMS 2018-GS9 pooling and servicing agreement, the UBS 2018-C9 pooling and servicing agreement and the GSMS 2017-FARM trust and servicing agreement, respectively, that are substantially similar to those of the |
THE INFORMATION IN THIS STRUCTURAL AND COLLATERAL TERM SHEET IS NOT COMPLETE AND MAY BE AMENDED PRIOR TO THE TIME OF SALE. THIS TERM SHEET IS NOT AN OFFER TO SELL THESE SECURITIES AND IT IS NOT A SOLICITATION OF AN OFFER TO BUY THESE SECURITIES IN ANY JURISDICTION WHERE THE OFFER OR SALE IS NOT PERMITTED.
| 24 of 136 | |
| Structural and Collateral Term Sheet | JPMDB 2018-C8 | |
| Structural Overview | ||
Operating Advisor under the Pooling and Servicing Agreement.
With respect to each mortgage loan or Serviced Whole Loan (in each case, other than a non-serviced mortgage loan, the Operating Advisor will be responsible for:
■ after the occurrence and during the continuance of a Control Termination Event, consulting (on a non-binding basis) with the Special Servicer with respect to each asset status report prepared by the Special Servicer and recommending proposed alternative courses of action.
■ after the occurrence and during the continuance of a Control Termination Event, preparing an annual report addressing the Operating Advisor’s overall findings and determinations and setting forth its assessment of the Special Servicer’s performance of its duties under the Pooling and Servicing Agreement on a platform-level basis with respect to the resolution and/or liquidation of specially serviced loans that the Special Servicer is responsible for servicing under the Pooling and Servicing Agreement. As used above, “platform-level basis” refers to the Special Servicer’s performance of its duties as they relate to the resolution and liquidation of specially serviced loans, taking into account the Special Servicer’s specific duties under the Pooling and Servicing Agreement as well as the extent to which those duties were performed in accordance with the servicing standard, with reasonable consideration to (and as limited by) the Operating Advisor’s review of any assessment of compliance report, attestation report, asset status report and other information delivered to the Operating Advisor by the Special Servicer with respect to the specially serviced loans (other than any communications between the Directing Certificateholder and the Special Servicer that would be privileged information). The annual report will be based on the Operating Advisor’s knowledge of the Special Servicer’s actions taken during the applicable calendar year with respect to the resolution or liquidation of specially serviced loans that the Special Servicer is responsible for servicing under the Pooling and Servicing Agreement, including knowledge obtained in connection with the Operating Advisor’s review of each asset status report prepared by the Special Servicer.
■ prior to the occurrence and continuance of a Control Termination Event, the Special Servicer will forward any Appraisal Reduction Amount and net present value calculations used in the Special Servicer’s determination of what course of action to take in connection with the workout or liquidation of a specially serviced loan to the Operating Advisor after such calculations have been finalized. The Operating Advisor will be required to review such calculations (with respect to Appraisal Reduction Amounts, if the Special Servicer has calculated such amounts) but will not opine on or take any affirmative action with respect to such Appraisal Reduction Amount calculations and/or net present value calculations.
■ after the occurrence and during the continuance of a Control Termination Event, recalculating and verifying, on a limited basis, the accuracy of mathematical calculations and the corresponding application of the non-discretionary portion of the applicable formulas utilized in connection with any Appraisal Reduction Amount (with respect to Appraisal Reduction Amounts, if the Special Servicer has calculated such amounts) or net present value calculations performed by the Special Servicer. In the event the Operating Advisor does not agree with the mathematical calculations or the application of the non-discretionary portion of the applicable formulas required to be utilized for such calculation, the Operating Advisor and the Special Servicer will consult with each other in order to resolve any disagreement. If there is any disagreement with respect to such calculations that the Operating Advisor and the Special Servicer are unable to resolve, the Certificate Administrator will determine which calculation is to apply.
In addition, the Operating Advisor is required to promptly review all information available to Privileged Persons on the Certificate Administrator’s website related to specially serviced loans and certain information available to Privileged Persons on the Certificate Administrator’s website related to mortgage loans included on the monthly CREFC®servicer watch list report, each final asset status report delivered to the Operating Advisor by the Special Servicer and each assessment of compliance report and attestation report prepared by the Special Servicer in order to maintain its familiarity with the mortgage loans and the performance of the Special Servicer under the Pooling and Servicing Agreement. |
THE INFORMATION IN THIS STRUCTURAL AND COLLATERAL TERM SHEET IS NOT COMPLETE AND MAY BE AMENDED PRIOR TO THE TIME OF SALE. THIS TERM SHEET IS NOT AN OFFER TO SELL THESE SECURITIES AND IT IS NOT A SOLICITATION OF AN OFFER TO BUY THESE SECURITIES IN ANY JURISDICTION WHERE THE OFFER OR SALE IS NOT PERMITTED.
| 25 of 136 | |
| Structural and Collateral Term Sheet | JPMDB 2018-C8 | |
| Structural Overview | ||
After the occurrence and during the continuance of a Control Termination Event, the Operating Advisor will also consult with the Special Servicer in connection with certain major decisions and propose possible alternative courses of action.
In addition, after the occurrence of a Consultation Termination Event, if the Operating Advisor determines that the Special Servicer is not performing its duties as required under the Pooling and Servicing Agreement or is otherwise not acting in accordance with the Servicing Standard, the Operating Advisor will have the right to recommend the replacement of the Special Servicer and will submit its formal recommendation to the Trustee and the Certificate Administrator (along with its rationale, its proposed replacement special servicer and other relevant information justifying its recommendation).
The Operating Advisor’s recommendation to replace the Special Servicer must be confirmed by an affirmative vote of holders of Certificates evidencing at least a majority of the aggregate voting rights (taking into account the application of any Appraisal Reduction Amounts to notionally reduce the Certificate Balances of the Classes to which such Appraisal Reduction Amounts are allocable). In the event the holders of such Certificates elect to remove and replace the Special Servicer, the Certificate Administrator will be required to obtain a rating agency confirmation from each of the rating agencies at that time. |
| ■ Replacement of Operating Advisor: | The Operating Advisor may be terminated or removed under certain circumstances and a replacement operating advisor appointed as described in the Preliminary Prospectus.
Any replacement operating advisor (or the personnel responsible for supervising the obligations of the replacement operating advisor) must be an institution (A) that is a special servicer or operating advisor on a commercial mortgage-backed securities transaction rated by S&P, Fitch and KBRA (including, in the case of the Operating Advisor, this transaction) but has not been special servicer or operating advisor on a transaction for which any of S&P, Fitch and KBRA has qualified, downgraded or withdrawn its rating or ratings of, one or more classes of certificates for such transaction publicly citing servicing concerns with the operating advisor in its capacity as special servicer or operating advisor on such commercial mortgage-backed securities transaction as the sole or a material factor in such rating action; (B) that can and will make the representations and warranties of the operating advisor set forth in the Pooling and Servicing Agreement; (C) that is not (and is not affiliated with) the Depositor, the Trustee, the Certificate Administrator, the Master Servicer, the Special Servicer, a Mortgage Loan Seller, the Directing Certificateholder, a depositor, a trustee, a certificate administrator, a master servicer or special servicer with respect to the securitization of a Companion Loan, or any of their respective affiliates; (D) that has not been paid by any Special Servicer or successor special servicer any fees, compensation or other remuneration (x) in respect of its obligations hereunder or (y) for the appointment or recommendation for replacement of a successor special servicer to become the Special Servicer; and (E) that (x) has been regularly engaged in the business of analyzing and advising clients in commercial mortgage-backed securities matters and that has at least 5 years of experience in collateral analysis and loss projections and (y) has at least 5 years of experience in commercial real estate asset management and experience in the workout and management of distressed commercial real estate assets. Any Operating Advisor is prohibited from making an investment in any Class of Certificates in the Trust as described in the Preliminary Prospectus.
| |
| ■ Asset Representations Reviewer: | The Asset Representations Reviewer will be required to review certain delinquent mortgage loans after a specified delinquency threshold has been exceeded and notification from the Certificate Administrator that the required percentage of Certificateholders have voted to direct a review of such delinquent mortgage loans. An “Asset Review Trigger” will occur when either (1) mortgage loans with an aggregate outstanding principal balance of 25.0% or more of the aggregate outstanding principal balance of all of the mortgage loans (including any REO Loans (or a portion of any REO Loan in the case of a Whole Loan)) held by the issuing entity as of the end of the applicable Collection Period are Delinquent Loans, (2)(A) prior to and including the second anniversary of the Closing Date, at least 10 mortgage loans are Delinquent Loans and the outstanding principal balance of such Delinquent Loans in the aggregate constitutes at least 15.0% of the aggregate outstanding principal balance of all of the mortgage loans (including any REO Loans (or a portion of any REO Loan in the case of a Whole Loan)) held by the issuing entity as of the end of the applicable Collection Period or (B) after the second anniversary of the Closing Date, at least 15 mortgage loans are Delinquent Loans and the outstanding principal balance of such Delinquent Loans in the aggregate constitutes at least 20.0% of the aggregate outstanding principal balance of all of the mortgage loans (including |
THE INFORMATION IN THIS STRUCTURAL AND COLLATERAL TERM SHEET IS NOT COMPLETE AND MAY BE AMENDED PRIOR TO THE TIME OF SALE. THIS TERM SHEET IS NOT AN OFFER TO SELL THESE SECURITIES AND IT IS NOT A SOLICITATION OF AN OFFER TO BUY THESE SECURITIES IN ANY JURISDICTION WHERE THE OFFER OR SALE IS NOT PERMITTED.
| 26 of 136 | |
| Structural and Collateral Term Sheet | JPMDB 2018-C8 | |
| Structural Overview | ||
| any REO Loans (or a portion of any REO Loan in the case of a Whole Loan)) held by the issuing entity as of the end of the applicable Collection Period. | ||
| Following the determination that an Asset Review Trigger has occurred, the Certificate Administrator will include in the Form 10-D relating to the distribution period in which the Asset Review Trigger occurred a description of the events that caused the Asset Review Trigger to occur. Once an Asset Review Trigger has occurred, Certificateholders evidencing not less than 5% of the voting rights may deliver to the Certificate Administrator a written direction requesting a vote on whether to commence an Asset Review within 90 days after the filing of the Form 10-D reporting the occurrence of the Asset Review Trigger (an “Asset Review Vote Election”). If directed by such Certificateholders, a vote of all Certificateholders will commence and an Asset Review will occur if more than a majority of Certificateholders voting (assuming Certificateholders representing a minimum of 5% of the voting rights respond) vote affirmatively within 150 days of the Asset Review Vote Election. If the vote does not pass, then no further votes will occur until an additional mortgage loan becomes a Delinquent Loan, an additional Asset Review Trigger occurs, and Certificateholders representing 5% of the voting rights again elect to cause a vote of all the Certificateholders. | ||
| ■ Replacement of the Asset Representations Reviewer: | The Asset Representations Reviewer may be terminated and replaced without cause. Upon (i) the written direction of Certificateholders evidencing not less than 25% of the voting rights (without regard to the application of any Appraisal Reduction Amounts) requesting a vote to terminate and replace the Asset Representations Reviewer with a proposed successor asset representations reviewer that is an Eligible Asset Representations Reviewer, and (ii) payment by such holders to the Certificate Administrator of the reasonable fees and expenses to be incurred by the Certificate Administrator in connection with administering such vote, the Certificate Administrator will promptly provide notice to all Certificateholders and the Asset Representations Reviewer of such request by posting such notice on its internet website, and by mailing to all Certificateholders and the Asset Representations Reviewer. Upon the written direction of Certificateholders evidencing at least 75% of a Certificateholder Quorum (without regard to the application of any Appraisal Reduction Amounts), the Trustee will terminate all of the rights and obligations of the Asset Representations Reviewer under the Pooling and Servicing Agreement by written notice to the Asset Representations Reviewer, and the proposed successor asset representations reviewer will be appointed. | |
| ■ Appointment and Replacement of Special Servicer: | The Directing Certificateholder will appoint the initial Special Servicer as of the Closing Date. Prior to the occurrence and continuance of a Control Termination Event, the Special Servicer may generally be replaced for cause at any time and without cause if either (i) LNR Partners, LLC or its affiliate is no longer the Special Servicer or (ii) LNR Securities Holdings, LLC or its affiliate owns less than 25% of the certificate balance of the controlling class, by the Directing Certificateholder.
If the Special Servicer obtains knowledge that it has become a Borrower Party with respect to any mortgage loan or Serviced Whole Loan (any such mortgage loan or Serviced Whole Loan, an “Excluded Special Servicer Loan”), the Special Servicer will be required to resign as Special Servicer of that Excluded Special Servicer Loan. Prior to the occurrence and continuance of a Control Termination Event, if the applicable Excluded Special Servicer Loan is not also an Excluded Loan, the Directing Certificateholder or the controlling class certificateholder on its behalf will be required to appoint (and may remove and replace with or without cause) a successor special servicer that is not a Borrower Party in accordance with the terms of the Pooling and Servicing Agreement (an “Excluded Special Servicer”) for the related Excluded Special Servicer Loan. After the occurrence and during the continuance of a Control Termination Event or if at any time the applicable Excluded Special Servicer Loan is also an Excluded Loan, the resigning Special Servicer will be required to use reasonable efforts to select the related Excluded Special Servicer.
Upon the occurrence and during the continuance of a Control Termination Event, the Directing Certificateholder will no longer have the right to replace the Special Servicer and such replacement will occur based on a vote of holders of all voting eligible Classes of Certificates as described below.
After the occurrence of a Consultation Termination Event, the Operating Advisor may also recommend the replacement of the Special Servicer as described above. | |
| ■ Replacement of Special Servicer by Vote of Certificateholders: | After the occurrence and during the continuance of a Control Termination Event and upon (a) the written direction of holders of Certificates evidencing not less than 25% of the Voting Rights |
THE INFORMATION IN THIS STRUCTURAL AND COLLATERAL TERM SHEET IS NOT COMPLETE AND MAY BE AMENDED PRIOR TO THE TIME OF SALE. THIS TERM SHEET IS NOT AN OFFER TO SELL THESE SECURITIES AND IT IS NOT A SOLICITATION OF AN OFFER TO BUY THESE SECURITIES IN ANY JURISDICTION WHERE THE OFFER OR SALE IS NOT PERMITTED.
| 27 of 136 | |
| Structural and Collateral Term Sheet | JPMDB 2018-C8 | |
| Structural Overview | ||
of all Classes of Certificates entitled to principal (taking into account the application of Appraisal Reduction Amounts to notionally reduce the Certificate Balances of Classes to which such Appraisal Reduction Amounts are allocable) requesting a vote to replace the Special Servicer with a replacement special servicer, (b) payment by such requesting holders to the Certificate Administrator of all reasonable fees and expenses to be incurred by the Certificate Administrator in connection with administering such vote and (c) delivery by such holders to the Certificate Administrator and the Trustee of written confirmations from each Rating Agency that the appointment of such replacement special servicer will not result in a downgrade, withdrawal or qualification of the Certificates (which confirmations will be obtained at the expense of such holders), the Certificate Administrator will be required to post such notice on its Internet website, and by mail conduct the solicitation of votes of all Certificates in such regard, which such vote must occur within 180 days of the posting of such notice. Upon the written direction of holders of at least 66-2/3% of a Certificateholder Quorum, the Trustee will immediately replace the Special Servicer with a qualified replacement special servicer designated by such holders of Certificates.
A “Certificateholder Quorum” means, in connection with any solicitation of votes in connection with the replacement of the Special Servicer or the Asset Representations Reviewer described above, the holders of Certificates evidencing at least 50% of the aggregate Voting Rights (taking into account the application of realized losses and, other than with respect to the termination of the Asset Representations Reviewer, the application of any Appraisal Reduction Amounts to notionally reduce the Certificate Balance of the Certificates) of all Classes of Certificates entitled to principal on an aggregate basis.
With respect to each of the Serviced Whole Loan, the holders of the related Pari Passu Companion Loans, under certain circumstances following a servicer termination event with respect to the Special Servicer, will be entitled to direct the Trustee (and the Trustee will be required) to terminate the Special Servicer solely with respect to such Serviced Whole Loan. A replacement special servicer will be selected by the Trustee or, prior to a Control Termination Event, by the Directing Certificateholder;provided,however, that any successor special servicer appointed to replace the Special Servicer with respect to such Whole Loan can generally not be the person (or its affiliate) that was terminated at the direction of the holder of the related Pari Passu Companion Loan.
With respect to any Non-Serviced Whole Loan, the JPMDB 2018-C8 trust as holder of the related mortgage loan has similar termination rights in the event of a servicer termination event with respect to the special servicer under the applicable trust and servicing agreement or pooling and servicing agreement, as applicable, as described above, which may be exercised by the Directing Certificateholder prior to the Control Termination Event. However, the successor special servicer will be selected pursuant to the applicable trust and servicing agreement or pooling and servicing agreement, as applicable, by the related directing holder prior to a control event under such trust and servicing agreement or pooling and servicing agreement, as applicable. The Master Servicer and Special Servicer are entitled to certain fees in connection with the servicing and administration of the mortgage loans as more fully described in “Pooling and Servicing Agreement—Servicing and Other Compensation and Payment of Expenses” in the Preliminary Prospectus.
| ||
| ■ Dispute Resolution Provisions: | Each Mortgage Loan Seller will be subject to the dispute resolution provisions set forth in the Pooling and Servicing Agreement to the extent those provisions are triggered with respect to any mortgage loan sold to the Depositor by a Mortgage Loan Seller and such Mortgage Loan Seller will be obligated under the related mortgage loan purchase agreement to comply with all applicable provisions and to take part in any mediation or arbitration proceedings that may result. | |
| Generally, in the event that a request to repurchase a mortgage loan (a “Repurchase Request”) is not “Resolved” (as defined below) within 180 days after the related Mortgage Loan Seller receives such Repurchase Request (a “Resolution Failure”), then the Enforcing Servicer (as defined below) will be required to send a notice to the “Initial Requesting Certificateholder” (if any) indicating the Enforcing Servicer’s intended course of action with respect to the Repurchase Request. If (a) the Enforcing Servicer’s intended course of action with respect to the Repurchase Request does not involve pursuing further action to exercise rights against the related Mortgage Loan Seller with respect to the Repurchase Request and the Initial Requesting Certificateholder, if any, or any other Certificateholder or Certificate Owner wishes to exercise its right to refer the matter to mediation (including nonbinding arbitration) or |
THE INFORMATION IN THIS STRUCTURAL AND COLLATERAL TERM SHEET IS NOT COMPLETE AND MAY BE AMENDED PRIOR TO THE TIME OF SALE. THIS TERM SHEET IS NOT AN OFFER TO SELL THESE SECURITIES AND IT IS NOT A SOLICITATION OF AN OFFER TO BUY THESE SECURITIES IN ANY JURISDICTION WHERE THE OFFER OR SALE IS NOT PERMITTED.
| 28 of 136 | |
| Structural and Collateral Term Sheet | JPMDB 2018-C8 | |
| Structural Overview | ||
arbitration, or (b) the Enforcing Servicer’s intended course of action is to pursue further action to exercise rights against the related Mortgage Loan Seller with respect to the Repurchase Request but the Initial Requesting Certificateholder, if any, or any other Certificateholder or Certificate Owner does not agree with the dispute resolution method selected by the Enforcing Servicer, then the Initial Requesting Certificateholder, if any, or such other Certificateholder or Certificate Owner may deliver a written notice to the Enforcing Servicer indicating its intent to exercise its right to refer the matter to either mediation or arbitration.
The Enforcing Servicer will be required to consult with any Certificateholder or Certificate Owner that delivers a notice of its intent to exercise its dispute resolution rights (a “Requesting Certificateholder”) so that a Requesting Certificateholder may consider the views of the Enforcing Servicer as to the claims underlying the Repurchase Request and possible dispute resolution methods. If a Requesting Certificateholder elects to exercise its right to refer the matter to either mediation or arbitration, then it will become the party responsible for enforcing the Repurchase Request and must promptly submit the matter to mediation (including nonbinding arbitration) or arbitration. Failure to make an election to exercise that right or failure to begin the elected form of proceedings within the certain timeframe set forth in the Pooling and Servicing Agreement will generally waive the Certificateholders’ or Certificate Owners’ rights with respect to the related Repurchase Request.
The “Enforcing Servicer” will be (a) with respect to a specially serviced loan, the Special Servicer, and (b) with respect to a non-specially serviced loan, (i) in the case of a Repurchase Request made by the Special Servicer, the Directing Certificateholder or a Controlling Class Certificateholder, the Master Servicer, and (ii) in the case of a Repurchase Request made by any person other than the Special Servicer, the Directing Certificateholder or a Controlling Class Certificateholder, (A) prior to a Resolution Failure relating to such non-specially serviced loan, the Master Servicer, and (B) from and after a Resolution Failure relating to such non-specially serviced Loan, the Special Servicer.
“Resolved” means, with respect to a Repurchase Request, (i) that the related Material Defect has been cured, (ii) the related mortgage loan has been repurchased in accordance with the related mortgage loan purchase agreement, (iii) a mortgage loan has been substituted for the related mortgage loan in accordance with the related mortgage loan purchase agreement, (iv) the applicable Mortgage Loan Seller has made a Loss of Value Payment, (v) a contractually binding agreement is entered into between the Enforcing Servicer, on behalf of the issuing entity, and the related Mortgage Loan Seller that settles the related Mortgage Loan Seller’s obligations under the related mortgage loan purchase agreement, or (vi) the related mortgage loan is no longer property of the issuing entity as a result of a sale or other disposition in accordance with the Pooling and Servicing Agreement.
| ||
| ■ Investor Communications: | The Certificate Administrator is required to include on any Form 10–D any request received from a Certificateholder to communicate with other Certificateholders related to Certificateholders exercising their rights under the terms of the Pooling and Servicing Agreement. Any Certificateholder wishing to communicate with other Certificateholders regarding the exercise of its rights under the terms of the Pooling and Servicing Agreement should deliver a written request signed by an authorized representative of the requesting investor to the Certificate Administrator at the address below:
9062 Old Annapolis Road
Columbia, Maryland 21045
Attention: Corporate Trust Administration Group – JPMDB 2018-C8
With a copy to: trustadministrationgroup@wellsfargo.com | |
| ■ Master Servicer and Special Servicer Compensation: | The Master Servicer is entitled to a fee (the “Servicing Fee”) payable monthly from interest received in respect of each mortgage loan, any related REO loan and any related Serviced Companion Loan that will accrue at the related servicing fee rate described in the Preliminary Prospectus. The Special Servicer is also entitled to a fee (the “Special Servicing Fee”) with respect to each specially serviced loan (except with respect to any Fee Restricted Specially Serviced Loan (as defined below)) and REO loan (other than a non-serviced mortgage loan) at the special servicing fee rate described in the Preliminary Prospectus. |
THE INFORMATION IN THIS STRUCTURAL AND COLLATERAL TERM SHEET IS NOT COMPLETE AND MAY BE AMENDED PRIOR TO THE TIME OF SALE. THIS TERM SHEET IS NOT AN OFFER TO SELL THESE SECURITIES AND IT IS NOT A SOLICITATION OF AN OFFER TO BUY THESE SECURITIES IN ANY JURISDICTION WHERE THE OFFER OR SALE IS NOT PERMITTED.
| 29 of 136 | |
| Structural and Collateral Term Sheet | JPMDB 2018-C8 | |
| Structural Overview | ||
In addition to the Servicing Fee, Special Servicing Fee and certain other fees described below, the Master Servicer and Special Servicer are entitled to retain and share certain additional servicing compensation, including assumption application fees, assumption fees, defeasance fees and certain Excess Modification Fees and consent fees with respect to the mortgage loans. The Special Servicer may also be entitled to either a Workout Fee or Liquidation Fee, but not both, from recoveries in respect of any particular mortgage loan.
An “Excess Modification Fee” with respect to any mortgage loan (other than the non-serviced mortgage loans) or Serviced Whole Loan is the sum of (A) the excess, if any, of (i) any and all Modification Fees with respect to a mortgage loan or Serviced Whole Loan, as applicable, over (ii) all unpaid or unreimbursed additional expenses described in the Preliminary Prospectus (excluding Special Servicing Fees, Workout Fees and Liquidation Fees) outstanding with respect to the related mortgage loan or Serviced Whole Loan, as applicable, and reimbursed from such Modification Fees and (B) expenses previously paid or reimbursed from Modification Fees as described in clause (A), which expenses have subsequently been recovered from the related borrower or otherwise.
With respect to the Master Servicer and Special Servicer, the Excess Modification Fees collected and earned by such servicer from the related borrower (taken in the aggregate with any other Excess Modification Fees collected and earned by such servicer from the related borrower within the prior 18 months of the collection of the current Excess Modification Fees) will be subject to a cap of 1.00% of the outstanding principal balance of the related mortgage loan or Serviced Whole Loan, as applicable, on the closing date of the related modification, extension, waiver or amendment. A “Modification Fee” with respect to any mortgage loan (other than the non-serviced mortgage loans) or Serviced Companion Loan is generally any fee with respect to a modification, extension, waiver or amendment of any mortgage loan and/or related Serviced Companion Loan.
A specially serviced loan is a “Fee Restricted Specially Serviced Loan” if (i) such specially serviced loan is a specially serviced loan solely because of an event described in clause (1)(y), (5) or (7) of the definition of “Specially Serviced Loan” in the Preliminary Prospectus and (ii) the Special Servicer made the determination that the related mortgage loan (and any related Serviced Companion Loan) should be transferred to special servicing and the Master Servicer does not agree with the Special Servicer’s determination, as evidenced by, in the case of an event described in clause (5) or (7) of the definition of “Specially Serviced Loan” in the Preliminary Prospectus, an officer’s certificate delivered to the Special Servicer setting forth the reason for such disagreement;provided,however that no specially serviced loan will be a Fee Restricted Specially Serviced Loan if such specially serviced loan is transferred to special servicing by the determination of the Master Servicer or if the Master Servicer and the Special Servicer mutually agree to such transfer. In addition, a specially serviced loan will be a Fee Restricted Specially Serviced Loan only during (i) with respect to a specially serviced loan that is a specially serviced loan solely because of an event described in clause (1)(y) of the definition of “Specially Serviced Loan” in the Preliminary Prospectus, the Fee Restricted Period, and (ii) with respect to a specially serviced loan that is a specially serviced loan solely because of an event described in clause (5) or (7) of the definition of “Specially Serviced Loan” in the Preliminary Prospectus, the Imminent Default Fee Restricted Period.
A “Fee Restricted Period” will exist from the occurrence of a Fee Restricted Trigger until the earlier of (i) the time set forth in the applicable Refinancing/P&S Document (as defined below), as extended pursuant to the original terms of such documentation, (ii) 120 days after the balloon payment default or maturity default and (iii) the date that the related borrower fails to make the assumed scheduled payment or the date that the related mortgage loan (or serviced companion loan) would have become a specially serviced loan due to an event other than an event described in clause (1)(y) of the definition of “Specially Serviced Loan” in the Preliminary Prospectus.
A “Fee Restricted Trigger” will occur in connection with a balloon payment default or a maturity default if (A) the borrower provides on or prior to the related maturity date or, if the maturity date of such mortgage loan or serviced companion loan has been extended in accordance with the Pooling and Servicing Agreement, the extended maturity date, (i) a fully executed term sheet or refinancing commitment with respect to a refinancing of the related Mortgage Loan or (ii) a signed purchase and sale agreement with respect to a sale of the related mortgaged property (each of the documents in clauses (i) and (ii), a “Refinancing/P&S Document”) for a refinancing of the related mortgage loan or sale of the mortgaged property (in each case subject only to |
THE INFORMATION IN THIS STRUCTURAL AND COLLATERAL TERM SHEET IS NOT COMPLETE AND MAY BE AMENDED PRIOR TO THE TIME OF SALE. THIS TERM SHEET IS NOT AN OFFER TO SELL THESE SECURITIES AND IT IS NOT A SOLICITATION OF AN OFFER TO BUY THESE SECURITIES IN ANY JURISDICTION WHERE THE OFFER OR SALE IS NOT PERMITTED.
| 30 of 136 | |
| Structural and Collateral Term Sheet | JPMDB 2018-C8 | |
| Structural Overview | ||
typical due diligence and closing conditions and, in the case of a purchase and sale agreement, if such agreement includes delivery of an acceptable deposit by the purchaser) in a manner consistent with CMBS market practices and that is satisfactory in form and substance to the Master Servicer but that is not satisfactory to the Special Servicer, from an acceptable lender or purchaser reasonably satisfactory to the Master Servicer but that is not satisfactory to the Special Servicer, and (B) the borrower thereafter continues to make the assumed scheduled payment, and (C) the mortgage loan is not a specially serviced loan due to the occurrence of any other event.
An “Imminent Default Fee Restricted Period” will exist, with respect to any specially serviced loan that is a specially serviced loan solely because of an event described in clause (5) or (7) of the definition of “Specially Serviced Loan” in the Preliminary Prospectus, during the period commencing upon the Special Servicer determining that such specially serviced loan will be transferred into special servicing (without the agreement of the Master Servicer) and ending on the date on which a payment default has occurred and remained uncured for 60 days. In the event that the Master Servicer disagrees with the Special Servicer’s determination to transfer such specially serviced loan into special servicing, the Master Servicer will be required to deliver an officer’s certificate to the Special Servicer setting forth the reasons for such disagreement.
A “Workout Fee” will generally be payable with respect to each corrected loan (except with respect to a corrected loan that was a Fee Restricted Specially Serviced Loan) (as more specifically described in the Preliminary Prospectus) and will be calculated at a rate of 1.00% of payments of principal and interest on the respective mortgage loan for so long as it remains a corrected loan, subject to a maximum of $1,000,000 in the aggregate with respect to any particular corrected mortgage loan. After receipt by the Special Servicer of Workout Fees with respect to a corrected loan in an amount equal to $25,000, any Workout Fees in excess of such amount will be reduced by the Excess Modification Fee Amount;provided that in the event the Workout Fee, collected over the course of such workout calculated at the Workout Fee Rate is less than $25,000, then the Special Servicer will be entitled to an amount from the final payment on the related corrected loan (including any related Serviced Companion Loan) that would result in the total Workout Fees payable to the Special Servicer in respect of that corrected loan (including any related Serviced Companion Loan) to be $25,000.
The “Excess Modification Fee Amount” for any corrected loan is an amount equal to any Excess Modification Fees paid by or on behalf of the related borrower with respect to the related mortgage loan (including the related Serviced Companion Loan) and received and retained by the Master Servicer or the Special Servicer, as applicable, as additional servicing compensation within the prior 18 months of the related modification, waiver, extension or amendment resulting in the mortgage loan or REO loan being a corrected loan, but only to the extent those fees have not previously been deducted from a Workout Fee or Liquidation Fee.
A “Liquidation Fee” will generally be payable with respect to each specially serviced loan (except with respect to any Fee Restricted Specially Serviced Loan) or REO property (except with respect to any non-serviced mortgage loan) as to which the Special Servicer obtains a full or partial recovery of the related asset. The Liquidation Fee for each specially serviced mortgage loan will be payable at a rate of 1.00% of the liquidation proceeds (exclusive of default interest) subject to a maximum of $1,000,000;provided,however, that no Liquidation Fee will be less than $25,000.
The Liquidation Fees will be reduced by the amount of any Excess Modification Fees received by the Special Servicer with respect to the related mortgage loan (including a Serviced Companion Loan) or REO property as additional compensation within the prior 18 months, but only to the extent those fees have not previously been deducted from a Workout Fee or Liquidation Fee.
Similar fees to those described above will be payable to the applicable special servicer for the Non-Serviced Whole Loans under the related trust and servicing agreement or pooling and servicing agreement, as applicable.
Subject to certain limited exceptions, in connection with its duties under the Pooling and Servicing Agreement, the Special Servicer and its affiliates are prohibited from receiving or retaining any compensation (other than compensation specifically provided for under the Pooling and Servicing Agreement) from anyone in connection with the disposition, workout or foreclosure of any mortgage loan, the management or disposition of any REO property, or the |
THE INFORMATION IN THIS STRUCTURAL AND COLLATERAL TERM SHEET IS NOT COMPLETE AND MAY BE AMENDED PRIOR TO THE TIME OF SALE. THIS TERM SHEET IS NOT AN OFFER TO SELL THESE SECURITIES AND IT IS NOT A SOLICITATION OF AN OFFER TO BUY THESE SECURITIES IN ANY JURISDICTION WHERE THE OFFER OR SALE IS NOT PERMITTED.
| 31 of 136 | |
| Structural and Collateral Term Sheet | JPMDB 2018-C8 | |
| Structural Overview | ||
| performance of any other special servicing duties under the Pooling and Servicing Agreement. In the event the Special Servicer does receive any such compensation, it will be required to disclose those fees to the Certificate Administrator who will include it as part of the statement to Certificateholders. | ||
| In addition, no liquidation fee will be payable to the Special Servicer if a mortgage loan or Serviced Whole Loan becomes a specially serviced loan only because of a maturity default and the related liquidation proceeds are received within 90 days following the related maturity date as a result of the related mortgage loan or Serviced Whole Loan being refinanced or otherwise repaid in full. | ||
| ■ Deal Website: | The Certificate Administrator will maintain a deal website to which certain persons will have access to certain information including, but not limited to the following, which will be posted: ■ special notices; ■ summaries of any final asset status reports; ■ appraisals in connection with Appraisal Reductions plus any second appraisals ordered; ■ an “Investor Q&A Forum”; ■ a voluntary investor registry; and ■ SEC EDGAR filings. |
THE INFORMATION IN THIS STRUCTURAL AND COLLATERAL TERM SHEET IS NOT COMPLETE AND MAY BE AMENDED PRIOR TO THE TIME OF SALE. THIS TERM SHEET IS NOT AN OFFER TO SELL THESE SECURITIES AND IT IS NOT A SOLICITATION OF AN OFFER TO BUY THESE SECURITIES IN ANY JURISDICTION WHERE THE OFFER OR SALE IS NOT PERMITTED.
| 32 of 136 | |
| Structural and Collateral Term Sheet | JPMDB 2018-C8 |
[THIS PAGE INTENTIONALLY LEFT BLANK]
THE INFORMATION IN THIS STRUCTURAL AND COLLATERAL TERM SHEET IS NOT COMPLETE AND MAY BE AMENDED PRIOR TO THE TIME OF SALE. THIS TERM SHEET IS NOT AN OFFER TO SELL THESE SECURITIES AND IT IS NOT A SOLICITATION OF AN OFFER TO BUY THESE SECURITIES IN ANY JURISDICTION WHERE THE OFFER OR SALE IS NOT PERMITTED.
| 33 of 136 | |
| Structural and Collateral Term Sheet | JPMDB 2018-C8 | |
| Marina Heights State Farm | ||

THE INFORMATION IN THIS STRUCTURAL AND COLLATERAL TERM SHEET IS NOT COMPLETE AND MAY BE AMENDED PRIOR TO THE TIME OF SALE. THIS TERM SHEET IS NOT AN OFFER TO SELL THESE SECURITIES AND IT IS NOT A SOLICITATION OF AN OFFER TO BUY THESE SECURITIES IN ANY JURISDICTION WHERE THE OFFER OR SALE IS NOT PERMITTED.
| 34 of 136 | |
| Structural and Collateral Term Sheet | JPMDB 2018-C8 | |
| Marina Heights State Farm | ||
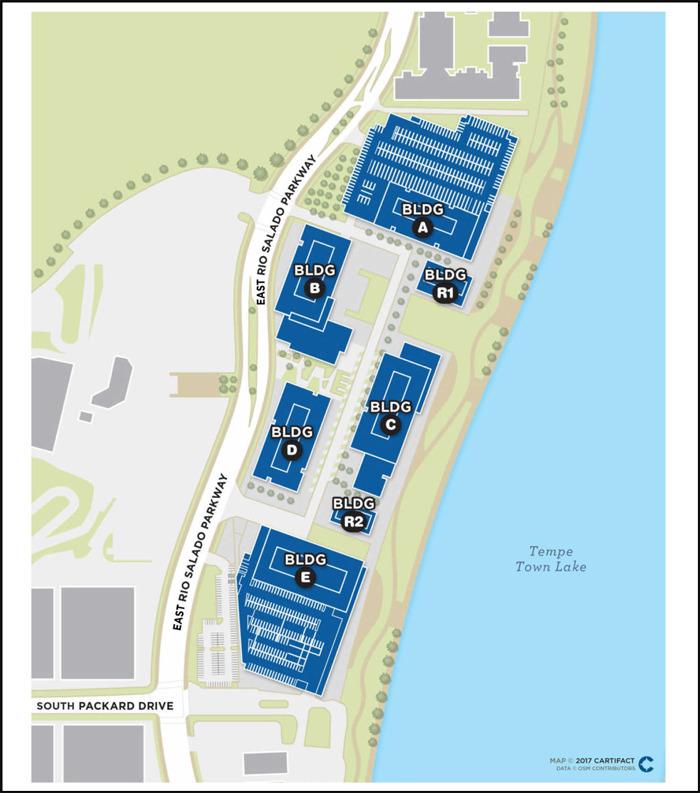
THE INFORMATION IN THIS STRUCTURAL AND COLLATERAL TERM SHEET IS NOT COMPLETE AND MAY BE AMENDED PRIOR TO THE TIME OF SALE. THIS TERM SHEET IS NOT AN OFFER TO SELL THESE SECURITIES AND IT IS NOT A SOLICITATION OF AN OFFER TO BUY THESE SECURITIES IN ANY JURISDICTION WHERE THE OFFER OR SALE IS NOT PERMITTED.
| 35 of 136 | |
| Structural and Collateral Term Sheet | JPMDB 2018-C8 | |
| Marina Heights State Farm | ||
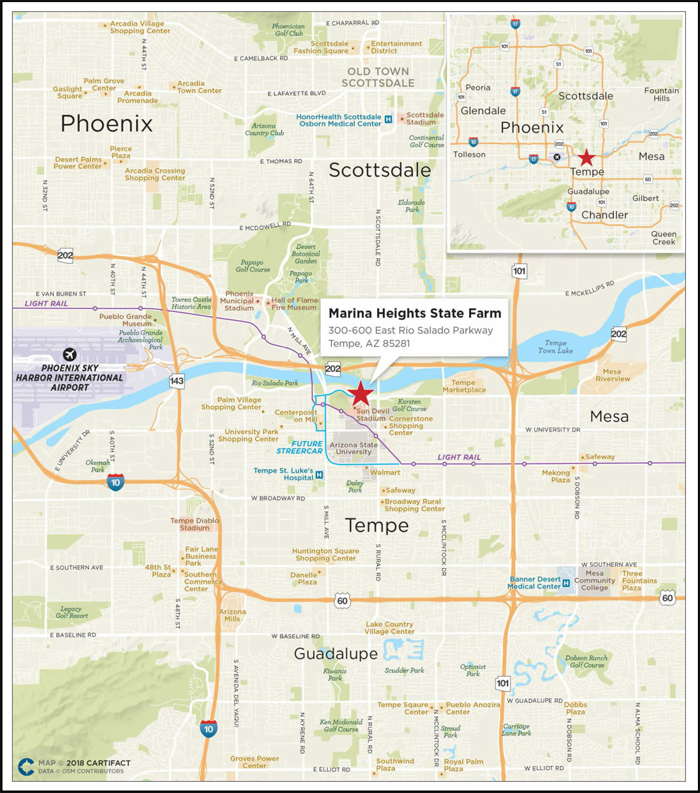
THE INFORMATION IN THIS STRUCTURAL AND COLLATERAL TERM SHEET IS NOT COMPLETE AND MAY BE AMENDED PRIOR TO THE TIME OF SALE. THIS TERM SHEET IS NOT AN OFFER TO SELL THESE SECURITIES AND IT IS NOT A SOLICITATION OF AN OFFER TO BUY THESE SECURITIES IN ANY JURISDICTION WHERE THE OFFER OR SALE IS NOT PERMITTED.
| 36 of 136 | |
| Structural and Collateral Term Sheet | JPMDB 2018-C8 | |
| Marina Heights State Farm | ||
| Mortgage Loan Information | Property Information | |||
| Mortgage Loan Seller(1): | GACC | Single Asset / Portfolio: | Single Asset | |
| Credit Assessment (KBRA)(2): | BBB- | Title: | Leasehold | |
| Original Principal Balance(3): | $50,000,000 | Property Type - Subtype: | Office – Suburban | |
| Cut-off Date Principal Balance(3): | $50,000,000 | Net Rentable Area (SF): | 2,031,293 | |
| % of Pool by IPB: | 7.0% | Location: | Tempe, AZ | |
| Loan Purpose: | Acquisition | Year Built / Renovated: | 2015-2017 / N/A | |
| Borrower: | Corporate Properties Tempe SPE, | Occupancy: | 99.5% | |
| L.L.C. | Occupancy Date: | 12/7/2017 | ||
| Sponsors(4): | Transwestern Investment Group, | Number of Tenants: | 4 | |
| Corporate Properties Trust III, L.P. | 2015 NOI(6): | N/A | ||
| Interest Rate(5): | 3.55950% | 2016 NOI(6): | N/A | |
| Note Date: | 12/7/2017 | 2017 NOI(6): | N/A | |
| Anticipated Repayment Date(5): | 1/6/2028 | TTM NOI(6): | N/A | |
| Final Maturity Date(5): | 1/6/2033 | UW Economic Occupancy: | 98.7% | |
| Interest-only Period: | 120 months | UW Revenues: | $83,160,015 | |
| Original Term(5): | 120 months | UW Expenses: | $19,826,859 | |
| Original Amortization: | None | UW NOI(7): | $63,333,156 | |
| Amortization Type: | ARD-Interest Only | UW NCF(7): | $63,137,233 | |
| Call Protection: | L(11),Gtr1%orYM(102),O(7) | Appraised Value / Per SF: | $960,000,000 / $473 | |
| Lockbox / Cash Management: | Hard / Springing | Appraisal Date: | 11/20/2017 | |
| Additional Debt(3): | Yes | |||
| Additional Debt Balance(3): | $510,000,000 | |||
| Additional Debt Type: | Pari Passu | |||
| Escrows and Reserves(8) | Financial Information(3) | ||||||
| Initial | Monthly | Initial Cap | Cut-off Date Loan / SF: | $276 | |||
| Taxes: | $0 | Springing | N/A | Maturity Date Loan / SF(5): | $276 | ||
| Insurance: | $0 | Springing | N/A | Cut-off Date LTV: | 58.3% | ||
| Replacement Reserves: | $0 | Springing | N/A | Maturity Date LTV(5): | 58.3% | ||
| TI/LC: | $0 | Springing | N/A | UW NCF DSCR(7): | 3.12x | ||
| Other: | $0 | Springing | N/A | UW NOI Debt Yield(7): | 11.3% | ||
| Sources and Uses(9) | |||||||
| Sources | Proceeds | % of Total | Uses | Proceeds | % of Total | ||
| Mortgage Loan | $560,000,000 | 58.4% | Purchase Price(11) | $930,000,000 | 97.1% | ||
| Principal Cash Equity Contribution | 375,736,548 | 39.2% | Imputed Equity Purchase(10) | 22,500,000 | 2.3% | ||
| Imputed Equity Contribution(10) | 22,500,000 | 2.3% | Closing Costs(12) | 5,736,548 | 0.6% | ||
| Total Sources | $958,236,548 | 100.0% | Total Uses | $958,236,548 | 100.0% | ||
| (1) | The Marina Heights State Farm Whole Loan (as defined in “The Loan” below) was originated by Goldman Sachs Mortgage Company (“GSMC”) on December 7, 2017. Subsequent to the origination date, notes representing 35% of the Marina Heights State Farm Whole Loan were transferred to Deutsche Bank AG, acting through its New York Branch (“DBNY”), an affiliate of GACC, which has re-underwritten such mortgage loan in accordance with the procedures described under “Transaction Parties—The Sponsors and Mortgage Loan Sellers—German American Capital Corporation—DBNY’s Underwriting Guidelines and Processes”in the Preliminary Prospectus. |
| (2) | KBRA confirmed that the Marina Heights State Farm loan has, in the context of its inclusion in the mortgage pool, credit characteristics consistent with an investment grade obligation. |
| (3) | The Marina Heights State Farm loan is part of a whole loan evidenced by eightpari passunotes with an aggregate outstanding principal balance of $560.0 million. The Financial Information presented in the chart above reflects the $560.0 million aggregate Cut-off Date balance of the Marina Heights State Farm Whole Loan. |
| (4) | There is no nonrecourse carve-out guarantor or environmental indemnitor, other than the borrower, for the Marina Heights State Farm Whole Loan. |
| (5) | The Marina Heights State Farm Whole Loan has an anticipated repayment date of January 6, 2028 (the “Anticipated Repayment Date” or “ARD”) and a final maturity date of January 6, 2033. From and after the Anticipated Repayment Date, the Marina Heights State Farm Whole Loan (a) accrues interest at a fixed rate that is equal to the greater of (i) 3.55950% plus 3.00000% and (ii) the then 10-year swap rate plus 3.00000% and (b) on each payment date after the ARD, requires principal payments based on a 30-year amortization schedule assuming the initial interest rate. The Maturity Date Loan / SF and Maturity Date LTV are based on the maturity balance as of the ARD. |
| (6) | Historical net operating income is not available because the property was constructed between 2015 and 2017. |
| (7) | The UW NCF DSCR and UW NOI Debt Yield are based on the adjusted UW NOI and UW NCF (as set forth under the “Underwritten Net Cash Flow” chart below), and include the net present value of future contractual rent increases in the amount of $11,242,393, as well as other adjustments. The UW NCF DSCR and UW NOI Debt Yield absent such adjustments are 2.62x and 9.4%, respectively. |
| (8) | For a full description of Escrows and Reserves, please refer to “Escrows and Reserves” below. |
THE INFORMATION IN THIS STRUCTURAL AND COLLATERAL TERM SHEET IS NOT COMPLETE AND MAY BE AMENDED PRIOR TO THE TIME OF SALE. THIS TERM SHEET IS NOT AN OFFER TO SELL THESE SECURITIES AND IT IS NOT A SOLICITATION OF AN OFFER TO BUY THESE SECURITIES IN ANY JURISDICTION WHERE THE OFFER OR SALE IS NOT PERMITTED.
| 37 of 136 | |
| Structural and Collateral Term Sheet | JPMDB 2018-C8 | |
| Marina Heights State Farm | ||
| (9) | The Marina Heights State Farm Whole Loan was used to finance the purchase of the Marina Heights State Farm property by a wholly-owned subsidiary of a joint venture between JDM Partners, LLC (“JDM”) and Transwestern Investment Group, LLC (“Transwestern”) in a sale lease-back transaction from State Farm Mutual Automobile Insurance Company and its affiliates (collectively, “State Farm”). |
| (10) | Represents the value of Transwestern’s equity interest in partnership based on borrower’s purchase price. |
| (11) | Represents the contractual purchase price. |
| (12) | Closing Costs includes costs associated with the purchase and sale transaction. |
The Loan.The Marina Heights State Farm loan is secured by a first mortgage lien on the borrower’s leasehold interest in a five building office complex with retail space. The whole loan has an outstanding principal balance as of the Cut-off Date of $560.0 million (the “Marina Heights State Farm Whole Loan”), and is comprised of eightpari passu notes, each as described below. The non-controlling Note A-2-C3 with an outstanding principal balance as of the Cut-off Date of $50.0 million, will be contributed to the JPMDB 2018-C8 Trust. The remaining notes are currently held by the parties described in the “Whole Loan Summary” chart below and have been or are expected to be contributed to one or more securitization trusts. The relationship between the holders of the Marina Heights State Farm Whole Loan will be governed by a co-lender agreement as described under “Description of the Mortgage Pool—The Whole Loans—The Non-Serviced Pari Passu Whole Loans” in the Preliminary Prospectus. The Marina Heights State Farm Whole Loan is structured with an ARD of January 6, 2028, a final maturity date of January 6, 2033 and will be interest-only for the entire term until the ARD. From the first payment date after the ARD until the final maturity date, the Marina Heights State Farm Whole Loan will amortize on a 30-year schedule. At any time on or after the due date in January 2019, the borrower will have the right to prepay the Marina Heights State Farm Whole Loan in whole or in part. Any voluntary prepayments prior to the payment date in July 2027 require a yield maintenance premium, which may be no less than 1% of the amount prepaid.
| Whole Loan Summary | |||||
| Note | Original Balance | Cut-off Date Balance | Note Holder | Controlling Piece | |
| A-2-C3 | $50,000,000 | $50,000,000 | JPMDB 2018-C8 | No | |
| A-1-S | 264,000,000 | 264,000,000 | GSMS 2017-FARM | Yes | |
| A-2-C4, A-2-C5 | 41,000,000 | 41,000,000 | Benchmark 2018-B2 | No | |
| A-1-C1 | 72,500,000 | 72,500,000 | GSMS 2018-GS9 | No | |
| A-2-C1 | 45,000,000 | 45,000,000 | Benchmark 2018-B3 | No | |
| A-1-C2 | 27,500,000 | 27,500,000 | GSMC | No | |
| A-2-C2 | 60,000,000 | 60,000,000 | DBNY | No | |
| Total | $560,000,000 | $560,000,000 | |||
The Borrower.The borrowing entity for the Marina Heights State Farm Whole Loan is Corporate Properties Tempe SPE, L.L.C., a Delaware limited liability company. There is no nonrecourse carve-out guarantor or environmental indemnitor, other than the borrower, for the Marina Heights State Farm Whole Loan.
The Loan Sponsors.The loan sponsors are Transwestern Investment Group and Corporate Properties Trust III, L.P. (a joint venture between JDM and Transwestern). JDM is a Phoenix-based real estate development and equity fund management firm. JDM sponsors multiple real estate funds with approximately $1.2 billion in assets under management as of December 31, 2016. As of December 31, 2016, JDM’s fund assets consist of office, commercial, and resort assets, including 23 commercial and office buildings in 16 states, totaling over six million square feet (not including the Marina Heights State Farm property). JDM has an existing relationship with State Farm as State Farm is the tenant in 20 of the 23 commercial and office buildings referenced above and accounts for over 4.8 million of the over six million square feet. Transwestern, an investment advisor, is the general partner and a minority equity holder of the joint venture. Transwestern has an existing relationship with State Farm, including acting as general partner, minority equity holder and property manager of State Farm’s two other super-regional headquarters in Richardson, Texas and Dunwoody, Georgia. There is no nonrecourse carve-out guarantor or environmental indemnitor, other than the borrower, for the Marina Heights State Farm Whole Loan.
THE INFORMATION IN THIS STRUCTURAL AND COLLATERAL TERM SHEET IS NOT COMPLETE AND MAY BE AMENDED PRIOR TO THE TIME OF SALE. THIS TERM SHEET IS NOT AN OFFER TO SELL THESE SECURITIES AND IT IS NOT A SOLICITATION OF AN OFFER TO BUY THESE SECURITIES IN ANY JURISDICTION WHERE THE OFFER OR SALE IS NOT PERMITTED.
| 38 of 136 | |
| Structural and Collateral Term Sheet | JPMDB 2018-C8 | |
| Marina Heights State Farm | ||
The Property.The Marina Heights State Farm property is an approximately 2.03 million square foot office campus consisting of (i) approximately 1.97 million square feet of office space, (ii) approximately 58,000 square feet of dining, retail, and wellness space and (iii) approximately 8,000 square feet of management office space, located on an approximately 20-acre site. The Marina Heights State Farm property consists of five regional headquarters office buildings and was delivered to State Farm in 2015 through 2017 to meet the company’s need for a campus to accommodate the consolidation of approximately 10,000 employees from across the southwest region. As part of this strategy, the Marina Heights State Farm property was developed as a Class A, office campus offering modern finishes and flexible office configurations for office, conference and training needs. The Marina Heights State Farm property also offers 7,991 parking spaces (approximately 3.9 spaces per 1,000 square feet). The Marina Heights State Farm property has large, raised floor plates, raised ceilings, modern building systems, along with marble and natural hardwood lobby accents and ground floor café and restaurant tenants. Furthermore, the campus offers access to Loop 202 and is approximately four miles from the Phoenix Sky Harbor International Airport. The Marina Heights State Farm property is also expected to be a future stop for the Tempe Streetcar (which is in an initial construction phase and is not expected to be completed prior to 2020), which is anticipated to provide access to the airport, downtown and central Phoenix, and west Mesa via the Valley Metro Light Rail.
State Farm is the largest tenant at the Marina Heights State Farm property, occupying 97.1% of the total square feet, 100.0% of the office space and accounts for 98.8% of UW total rent. In addition to State Farm, the Marina Heights State Farm property is leased to Mountainside Fitness, Compass, Honor Health, and Transwestern’s management office (in the aggregate representing 2.3% of the total square feet and 1.2% of UW total rent). Founded in 1922 and based in Bloomington, Illinois, State Farm has approximately $148 billion in total assets as of December 2016. State Farm generated a net loss of $2.6 billion in 2016, with net written premiums of $39.6 billion and net investment income of $3.4 billion. A.M. Best Co. gives an A++ rating to State Farm Mutual Automobile Insurance Company. State Farm operates in every state and Washington, D.C. through its independent field agents that operate through localized offices. In January 2015, State Farm sold all of its Canadian businesses to the Desjardins Group.
The Marina Heights State Farm property represents an operations center that houses approximately 10,000 employees in various roles including regional managers, claims processing and field agents serving State Farm’s Southwestern markets. The five office buildings are leased to State Farm pursuant to five separate long-term leases averaging more than 20 years across the five buildings, with the option to renew each lease for up to 20 additional years. The State Farm leases are triple net, allowing the pass through of Marina Heights State Farm property operating expenses, and provide for annual rent escalations of 2.0%. There are two additional buildings on the campus for retail and wellness facilities.
The Marina Heights State Farm property is located in Tempe, Arizona. The Tempe office submarket had a vacancy rate of 6.7% for Class A office properties as of third quarter 2017, which has remained near or below the historical average since 2013. The gross market rents for Class A office leases were $34.46 per square foot as of the third quarter of 2017. Seven office lease comparables have asking rents ranging from $21.06 per square foot to $27.56 per square foot on a triple-net basis and $31.50 per square foot to $44.00 per square foot on a gross rent basis.
| Historical and Current Occupancy(1) | |||
| 2014 | 2015 | 2016 | Current(2) |
| N/A | N/A | N/A | 99.5% |
| (1) | Historical occupancy is not available because the Marina Heights State Farm property was constructed between 2015 and 2017. |
| (2) | Current occupancy is as of December 7, 2017. |
| Tenant Summary(1) | ||||||
| Tenant | Ratings(2) Moody’s/S&P/Fitch | Net Rentable Area (SF) | % of Total NRA | Base Rent PSF | % of Base Rent | Lease Expiration Date |
| State Farm Building B | NA / AA / NA | 575,639 | 28.3% | $26.52 | 28.9% | 12/31/2042 |
| State Farm Building E | NA / AA / NA | 426,902 | 21.0% | $26.52 | 21.4% | 12/31/2032 |
| State Farm Building D | NA / AA / NA | 370,332 | 18.2% | $26.52 | 18.6% | 12/31/2035 |
| State Farm Building A | NA / AA / NA | 347,851 | 17.1% | $26.52 | 17.5% | 12/31/2037 |
| State Farm Building C | NA / AA / NA | 245,370 | 12.1% | $26.52 | 12.3% | 12/31/2039 |
| Mountainside Fitness | NA / NA / NA | 17,485 | 0.9% | $10.00 | 0.3% | 3/31/2027 |
| MarinaLink (State Farm) | NA / AA / NA | 7,154 | 0.4% | $25.50 | 0.3% | 3/31/2027 |
| Compass - Cafe 450 | NA / NA / NA | 6,610 | 0.3% | $10.51 | 0.1% | 12/31/2031 |
| Honor Health | NA / NA / NA | 5,736 | 0.3% | $21.53 | 0.2% | 7/31/2027 |
| Compass - Matt’s Big Breakfast | NA / NA / NA | 5,007 | 0.2% | $10.51 | 0.1% | 12/31/2031 |
| (1) | Based on the underwritten rent roll dated December 7, 2017. |
| (2) | Ratings for State Farm leases are those for State Farm Mutual Automobile Insurance Company, the tenant on each State Farm lease. |
THE INFORMATION IN THIS STRUCTURAL AND COLLATERAL TERM SHEET IS NOT COMPLETE AND MAY BE AMENDED PRIOR TO THE TIME OF SALE. THIS TERM SHEET IS NOT AN OFFER TO SELL THESE SECURITIES AND IT IS NOT A SOLICITATION OF AN OFFER TO BUY THESE SECURITIES IN ANY JURISDICTION WHERE THE OFFER OR SALE IS NOT PERMITTED.
| 39 of 136 | |
| Structural and Collateral Term Sheet | JPMDB 2018-C8 | |
| Marina Heights State Farm | ||
| Lease Rollover Schedule(1) | |||||||||
| Year | Number of Leases Expiring(2) | Net Rentable Area Expiring | % of NRA Expiring | Base Rent Expiring | % of Base Rent Expiring | Cumulative Net Rentable Area Expiring | Cumulative % of NRA Expiring | Cumulative Base Rent Expiring | Cumulative % of Base Rent Expiring |
| Vacant | NAP | 10,488 | 0.5% | NAP | NAP | 10,488 | 0.5% | NAP | NAP |
| 2018 & MTM | 0 | 0 | 0.0 | $0 | 0.0% | 10,488 | 0.5% | 0 | 0.0% |
| 2019 | 0 | 0 | 0.0 | 0 | 0.0 | 10,488 | 0.5% | 0 | 0.0% |
| 2020 | 0 | 0 | 0.0 | 0 | 0.0 | 10,488 | 0.5% | 0 | 0.0% |
| 2021 | 0 | 0 | 0.0 | 0 | 0.0 | 10,488 | 0.5% | 0 | 0.0% |
| 2022 | 0 | 0 | 0.0 | 0 | 0.0 | 10,488 | 0.5% | 0 | 0.0% |
| 2023 | 0 | 0 | 0.0 | 0 | 0.0 | 10,488 | 0.5% | 0 | 0.0% |
| 2024 | 0 | 0 | 0.0 | 0 | 0.0 | 10,488 | 0.5% | 0 | 0.0% |
| 2025(2) | 1 | 915 | 0.0 | 0 | 0.0 | 11,403 | 0.6% | 0 | 0.0% |
| 2026(2) | 3 | 6,621 | 0.3 | 0 | 0.0 | 18,024 | 0.9% | 0 | 0.0% |
| 2027(3)(4) | 3 | 30,375 | 1.5 | 480,773 | 0.9 | 48,399 | 2.4% | 480,773 | 0.9% |
| 2028 | 0 | 0 | 0.0 | 0 | 0.0 | 48,399 | 2.4% | 480,773 | 0.9% |
| 2029 & Beyond | 11 | 1,982,894 | 97.6 | 52,317,710 | 99.1 | 2,031,293 | 100.0% | 52,798,483 | 100.0% |
| Total(2) | 18 | 2,031,293 | 100.0% | $52,798,483 | 100.0% | ||||
| (1) | Based on the underwritten rent roll dated December 7, 2017. |
| (2) | The Marina Heights State Farm property is occupied by four tenants under eighteen leases. |
| (3) | Includes a total of 7,536 square feet which pertains to the management office, which does not pay rent or reimbursements at the Marina Heights State Farm property. |
| (4) | Includes State Farm as the MarinaLink (State Farm) lease that expires in 2027. The other leases with State Farm expire in 2032, 2035, 2037, 2039 and 2042. |
| Underwritten Net Cash Flow(1) | ||||
| Underwritten In-Place | Adjusted Underwritten | Per Square Foot | %(2) | |
| Rents in Place(3) | $52,798,483 | $52,798,483 | $25.99 | 62.7% |
| Credit Tenant Rent Steps(4) | 0 | 11,242,393 | 5.53 | 13.3% |
| Vacant Income | 0 | 300,493 | 0.15 | 0.4% |
| Gross Potential Rent | $52,798,483 | $64,341,369 | $31.68 | 76.4% |
| Total Reimbursements(5) | 17,819,370 | 19,919,069 | 9.81 | 23.6% |
| Net Rental Income | $70,617,853 | $84,260,438 | $41.48 | 100.0% |
| (Vacancy/Credit Loss)(6) | 0 | (1,100,423) | (0.54) | (1.3) |
| Effective Gross Income | $70,617,853 | $83,160,015 | $40.94 | 98.7% |
| Total Expenses(7) | $17,716,262 | $19,826,859 | $9.76 | 23.8% |
| Net Operating Income | $52,901,590 | $63,333,156 | $31.18 | 76.2% |
| Total TI/LC, Capex/RR | 0 | 195,923 | 0.10 | 0.2% |
| Net Cash Flow | $52,901,590 | $63,137,233 | $31.08 | 75.9% |
| (1) | Historical financial information is not available as the Marina Heights State Farm property was constructed between 2015 and 2017. |
| (2) | % column represents percent of Net Rental Income for all revenue lines and represents percent of Effective Gross Income for the remainder of the fields. |
| (3) | Rents in Place include rent steps through January 31, 2019. |
| (4) | Credit Tenant Rent Steps reflect the net present value of future contractual rent steps for State Farm leases (office and MarinaLink (State Farm) space) through the lease term (excluding any rent steps already captured in Rents in Place), using a discount rate of 7.0%. |
| (5) | Underwritten In-Place Total Reimbursements reflect contractual expense reimbursements for all tenants at the property, based on a pro-rata share of budgeted expenses and management office rent and reimbursements. Adjusted Underwritten Total Reimbursements are calculated the same as Underwritten In-Place, however the additional management fee and ground rent expense is passed through to occupied tenants. |
| (6) | Vacancy/Credit Loss reflects 1.0% vacancy for State Farm space, in-place economic vacancy for retail space of 21.2% and 0% vacancy on management office space. |
| (7) | Adjusted Underwritten Total Expenses includes the average of ground rent expense over the Marina Heights State Farm Whole Loan term, which is required to be reimbursed by the tenants (other than the tenant under the space used for management). |
Property Management.The property is managed by Transwestern Commercial Services Arizona, L.L.C., an affiliate of the borrower.
Escrows and Reserves.
Tax Escrows – On a monthly basis, during the continuance of a Trigger Period (as defined below) or after the ARD (or following any failure of State Farm to pay all required taxes, insurance, and ground rent payments when due), the borrower is required to escrow an amount equal to 1/12 of projected annual property tax payments.
THE INFORMATION IN THIS STRUCTURAL AND COLLATERAL TERM SHEET IS NOT COMPLETE AND MAY BE AMENDED PRIOR TO THE TIME OF SALE. THIS TERM SHEET IS NOT AN OFFER TO SELL THESE SECURITIES AND IT IS NOT A SOLICITATION OF AN OFFER TO BUY THESE SECURITIES IN ANY JURISDICTION WHERE THE OFFER OR SALE IS NOT PERMITTED.
| 40 of 136 | |
| Structural and Collateral Term Sheet | JPMDB 2018-C8 | |
| Marina Heights State Farm | ||
Insurance Escrows –On a monthly basis, during the continuance of a Trigger Period or after the ARD (or following any failure of State Farm to pay all required taxes, insurance, and ground rent payments when due), the borrower is required to escrow an amount equal to 1/12 of projected annual estimated insurance premiums.
Replacement Reserves – On a monthly basis, during the continuance of a Trigger Period or after the ARD, the borrower is required to escrow an amount equal to approximately $50,782 (approximately $0.30 per square foot per annum) into a capital expenditure reserve.
TI/LC Reserves– On a monthly basis, during the continuance of a Trigger Period or after the ARD the borrower is required to escrow (i) an amount equal to approximately $338,549 (approximately $2.00 per square foot per annum) into a tenant improvements and leasing commissions reserve.
Ground Rent Escrows– On a monthly basis, during the continuance of a Trigger Period or after the ARD (or following any failure of State Farm to pay all required taxes, insurance, and ground rent payments when due), the borrower is required to escrow an amount equal to 1/12 of projected annual ground rent.
Lockbox / Cash Management.The Marina Heights State Farm Whole Loan is structured with a hard lockbox and springing cash management. The tenants are required to pay rent directly to a lender-controlled lockbox account, and all other money received by the borrower with respect to the Marina Heights State Farm property (other than tenant security deposits required to be held in escrow accounts) is required to be promptly deposited into such lockbox account during the term of the Marina Heights State Farm Whole Loan. Prior to the ARD, for so long as no Trigger Period or event of default under the Marina Heights State Farm Whole Loan is continuing, funds in the lockbox account will be transferred daily at the direction of the borrower. After the occurrence of and during the continuance of a Trigger Period, after the ARD or during the continuance of an event of default under the Marina Heights State Farm Whole Loan, all amounts in the lockbox account are required to be swept to a lender-controlled cash management account on a daily basis and applied to payment of debt service and operating expenses and funding of required reserves, with the remainder deposited into an excess cash flow reserve and held by the lender as additional collateral for the Marina Heights State Farm Whole Loan; provided, however, that to the extent no event of default is then ongoing, funds in the excess cash flow account will be made available to the borrower for: (x) certain tenant improvement and/or leasing commission costs (to the extent there are, as of said date of disbursement, insufficient funds in the leasing reserve for payment of the same and, (y) certain operating expenses that are due and payable; provided that cash flow from the Marina Heights State Farm property is insufficient to make such payments.
A “Trigger Period” means any period during which (i) State Farm is in default under any lease beyond any applicable notice and cure period, (ii) State Farm is rated below Baa3 by Moody’s (to the extent that Moody’s is then rating State Farm) or BBB- by S&P, (iii) State Farm has surrendered, cancelled or terminated any of the State Farm leases or given written notice of its intent to surrender, cancel or terminate any of State Farm leases, (iv) State Farm fails to continuously occupy at least 50.0% of the aggregate space demised by all of the State Farm leases or (v) State Farm is the subject of a voluntary or involuntary bankruptcy proceeding or the subject of any other proceeding under any reorganization, arrangement, adjustment of debt, relief of creditors, dissolution, insolvency or similar law of any jurisdiction or State Farm has otherwise dissolved, been adjudicated insolvent or bankrupt or made a general assignment for the benefit of creditors. A Trigger Period will no longer be continuing if a replacement tenant or replacement tenants that are each rated Baa3 or better by Moody’s and BBB- or better by S&P and have assumed the obligations of State Farm under its leases or have entered into a replacement lease(s) for the State Farm space.
Condominium.The Marina Heights State Farm property has been divided into multiple condominium units, each of which is owned by the borrower and is part of the collateral by way of the condominium units being part of the ground leasehold interest in the Marina Heights State Farm property. The borrower also owns 100% of the undivided interests in the common elements of the condominium, and controls 100% of the condominium association. See “Description of the Mortgage Pool—Mortgage Pool Characteristics—Condominium Interests” in the Preliminary Prospectus.
THE INFORMATION IN THIS STRUCTURAL AND COLLATERAL TERM SHEET IS NOT COMPLETE AND MAY BE AMENDED PRIOR TO THE TIME OF SALE. THIS TERM SHEET IS NOT AN OFFER TO SELL THESE SECURITIES AND IT IS NOT A SOLICITATION OF AN OFFER TO BUY THESE SECURITIES IN ANY JURISDICTION WHERE THE OFFER OR SALE IS NOT PERMITTED.
| 41 of 136 | |
| Structural and Collateral Term Sheet | JPMDB 2018-C8 | |
| Marina Heights State Farm | ||
Ground Lease.The borrower’s interest with respect to the property is through a ground lease with the Arizona Board of Regents, a body corporate, for and on behalf of Arizona State University (the “Ground Lessor”) that commenced on August 16, 2013 and expires on August 16, 2112 (the “Ground Lease”). The borrower has one option to renew for a period of no fewer than 25 and no more than 99 years. The ground lease is structured with seven separate phases corresponding to the seven buildings. No rent payments are due with respect to any phase under the ground lease until October 13, 2023 (the 8th anniversary of the day the first certificate of occupancy was issued for the first phase). The rent commencement dates for the phases begin on October 13, 2023 and the final phase rent commences March 3, 2025. The maximum ground rent expense once rent commences for all phases is $4,375,033per annum. There are no contractual ground lease increases. $30,905,569 of rent was prepaid to the Ground Lessor. In addition to ground rent, the Ground Lease requires the tenant to cover certain additional costs and expenses, including but not limited to (i) annual payments to the city of Tempe, which includes a set of annual payments calculated on gross building space and number of office floors (a portion of these payments fund K-12 city schools) and a $309,315 annual municipal services fee, (ii) annual payments to the Rio Salado Community Facilities District equal to the Ground Lessor’s proportionate share of maintaining the adjacent public lake and park and (iii) all taxes, assessments, utility fees or other charges imposed upon or that are a lien on the property or the improvements. For example, pending the execution of the Streetcar Development Agreement in order to develop the Streetcar project, the borrower will be required to pay annual payments of $210,125.30 for 20 years, totaling an aggregate payment of $4,202,506. The property is exempt from property taxes because the Ground Lessor is a tax exempt government agency. The Ground Lease prohibits the Ground Lessor from transferring the fee to any entity that is not the State of Arizona or a political subdivision thereof that is exempt from property taxes. The Marina Heights State Farm loan was underwritten assuming no property taxes are paid. The ground lease requires the consent of the Ground Lessor, to any transfer by the ground lessee of its ground leasehold interest, which consent may not be unreasonably withheld, delayed or conditioned. Such consent is not required in connection with a lender’s enforcement of its lien.
THE INFORMATION IN THIS STRUCTURAL AND COLLATERAL TERM SHEET IS NOT COMPLETE AND MAY BE AMENDED PRIOR TO THE TIME OF SALE. THIS TERM SHEET IS NOT AN OFFER TO SELL THESE SECURITIES AND IT IS NOT A SOLICITATION OF AN OFFER TO BUY THESE SECURITIES IN ANY JURISDICTION WHERE THE OFFER OR SALE IS NOT PERMITTED.
| 42 of 136 | |
| Structural and Collateral Term Sheet | JPMDB 2018-C8 |
[THIS PAGE INTENTIONALLY LEFT BLANK]
THE INFORMATION IN THIS STRUCTURAL AND COLLATERAL TERM SHEET IS NOT COMPLETE AND MAY BE AMENDED PRIOR TO THE TIME OF SALE. THIS TERM SHEET IS NOT AN OFFER TO SELL THESE SECURITIES AND IT IS NOT A SOLICITATION OF AN OFFER TO BUY THESE SECURITIES IN ANY JURISDICTION WHERE THE OFFER OR SALE IS NOT PERMITTED.
| 43 of 136 | |
| Structural and Collateral Term Sheet | JPMDB 2018-C8 | |
| 1875 Atlantic Avenue | ||
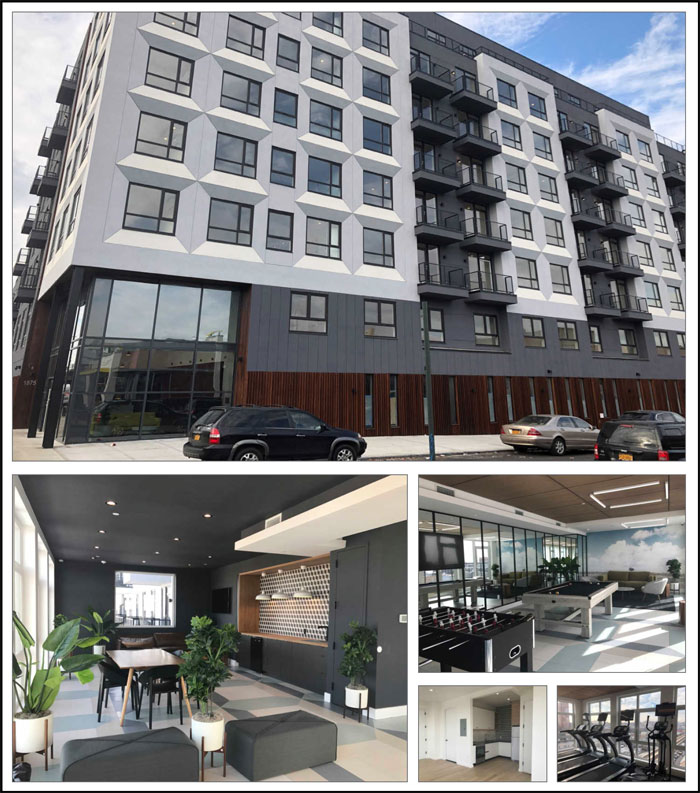
THE INFORMATION IN THIS STRUCTURAL AND COLLATERAL TERM SHEET IS NOT COMPLETE AND MAY BE AMENDED PRIOR TO THE TIME OF SALE. THIS TERM SHEET IS NOT AN OFFER TO SELL THESE SECURITIES AND IT IS NOT A SOLICITATION OF AN OFFER TO BUY THESE SECURITIES IN ANY JURISDICTION WHERE THE OFFER OR SALE IS NOT PERMITTED.
| 44 of 136 | |
| Structural and Collateral Term Sheet | JPMDB 2018-C8 | |
| 1875 Atlantic Avenue | ||
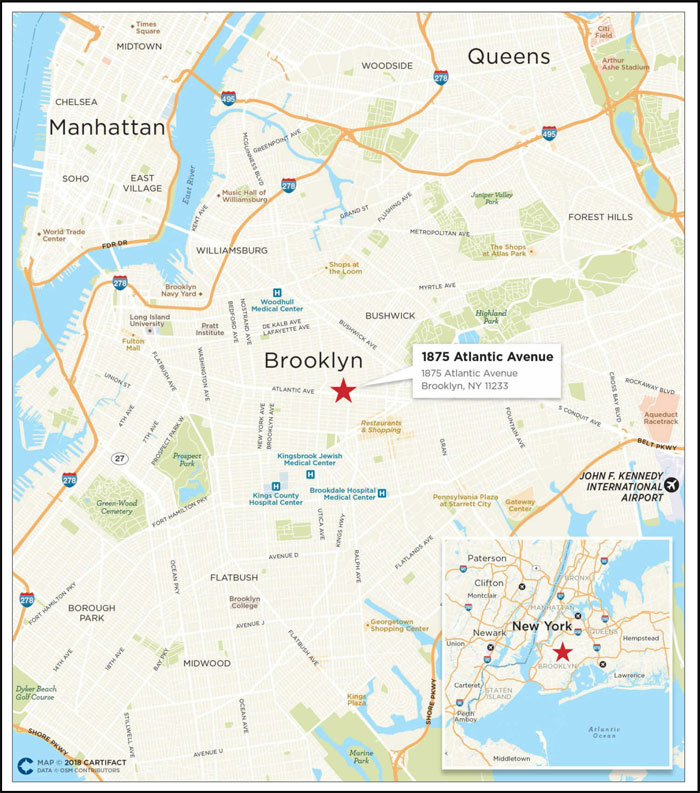
THE INFORMATION IN THIS STRUCTURAL AND COLLATERAL TERM SHEET IS NOT COMPLETE AND MAY BE AMENDED PRIOR TO THE TIME OF SALE. THIS TERM SHEET IS NOT AN OFFER TO SELL THESE SECURITIES AND IT IS NOT A SOLICITATION OF AN OFFER TO BUY THESE SECURITIES IN ANY JURISDICTION WHERE THE OFFER OR SALE IS NOT PERMITTED.
| 45 of 136 | |
| Structural and Collateral Term Sheet | JPMDB 2018-C8 | |
| 1875 Atlantic Avenue | ||
| Mortgage Loan Information | Property Information | |||
| Mortgage Loan Seller: | SMF VI | Single Asset / Portfolio: | Single Asset | |
| Original Principal Balance: | $42,000,000 | Title: | Fee | |
| Cut-off Date Principal Balance: | $42,000,000 | Property Type - Subtype: | Multifamily – Mid-Rise | |
| % of Pool by IPB: | 5.9% | Net Rentable Area (Units): | 118 | |
| Loan Purpose: | Refinance | Location: | Brooklyn, NY | |
| Borrower: | 1875 Atlantic Ave Development | Year Built / Renovated: | 2018 / N/A | |
| LLC | Occupancy: | 95.8% | ||
| Sponsors: | Joseph Brunner, Abraham Mandel | Occupancy Date: | 4/26/2018 | |
| and Solomon Feder | Number of Tenants: | N/A | ||
| Interest Rate: | 4.86700% | 2015 NOI(1): | N/A | |
| Note Date: | 4/27/2018 | 2016 NOI(1): | N/A | |
| Maturity Date: | 5/6/2028 | 2017 NOI(1): | N/A | |
| Interest-only Period: | 120 months | TTM NOI(1): | N/A | |
| Original Term: | 120 months | UW Economic Occupancy: | 95.8% | |
| Original Amortization: | None | UW Revenues: | $3,454,388 | |
| Amortization Type: | Interest Only | UW Expenses: | $460,421 | |
| Call Protection: | L(25),Def(89),O(6) | UW NOI: | $2,993,967 | |
| Lockbox / Cash Management: | None / None | UW NCF: | $2,970,367 | |
| Additional Debt: | N/A | Appraised Value / Per Unit: | $69,200,000 / $586,441 | |
| Additional Debt Balance: | N/A | Appraisal Date: | 3/5/2018 | |
| Additional Debt Type: | N/A | |||
| Escrows and Reserves(2) | Financial Information | |||||||||
| Initial | Monthly | Initial Cap | Cut-off Date Loan / Unit: | $355,932 | ||||||
| Taxes: | $19,197 | $3,839 | N/A | Maturity Date Loan / Unit: | $355,932 | |||||
| Insurance: | $18,888 | $3,778 | N/A | Cut-off Date LTV: | 60.7% | |||||
| Replacement Reserves: | $0 | $1,967 | $118,000 | Maturity Date LTV: | 60.7% | |||||
| TI/LC: | $0 | $0 | N/A | UW NCF DSCR: | 1.43x | |||||
| Other: | $0 | $0 | N/A | UW NOI Debt Yield: | 7.1% | |||||
| Sources and Uses | ||||||||||
| Sources | Proceeds | % of Total | Uses | Proceeds | % of Total | |||||
| Mortgage Loan | $42,000,000 | 100.0% | Payoff Existing Debt | $30,134,171 | 71.7% | |||||
| Closing Costs | 846,064 | 2.0 | ||||||||
| Upfront Reserves | 38,084 | 0.1 | ||||||||
| Return of Equity | 10,981,681 | 26.1 | ||||||||
| Total Sources | $42,000,000 | 100.0% | Total Uses | $42,000,000 | 100.0% | |||||
| (1) | The property was constructed in early 2018. As a result, historical financial information is not available. |
| (2) | For a full description of Escrows and Reserves, please refer to “Escrows and Reserves” below. |
The Loan.The 1875 Atlantic Avenue loan is secured by a first lien on the borrower’s fee interest in a recently constructed mid-rise multifamily property located in Brooklyn, New York. The 1875 Atlantic Avenue loan has a 10-year term and will be interest-only for the term of the loan.
The Borrower. The borrowing entity for the 1875 Atlantic Avenue loan is 1875 Atlantic Ave Development LLC, a New York limited liability company and special purpose entity.
THE INFORMATION IN THIS STRUCTURAL AND COLLATERAL TERM SHEET IS NOT COMPLETE AND MAY BE AMENDED PRIOR TO THE TIME OF SALE. THIS TERM SHEET IS NOT AN OFFER TO SELL THESE SECURITIES AND IT IS NOT A SOLICITATION OF AN OFFER TO BUY THESE SECURITIES IN ANY JURISDICTION WHERE THE OFFER OR SALE IS NOT PERMITTED.
| 46 of 136 | |
| Structural and Collateral Term Sheet | JPMDB 2018-C8 | |
| 1875 Atlantic Avenue | ||
The Loan Sponsors. The loan sponsors and nonrecourse carve-out guarantors are Joseph Brunner, Abraham Mandel and Solomon Feder. Joseph Brunner and Abraham Mandel serve as principals at Bruman Realty, which was founded by Mr. Mandel and Mr. Brunner. Bruman Realty’s portfolio includes residential apartments, Class A office properties and retail centers. In the aggregate, the three loan sponsors have ownership interests in over 1,000 apartment units throughout the tristate area and approximately six million square feet of office and retail space throughout the United States. Bruman Realty has also developed in excess of one million square feet of residential apartments and luxury condominiums.
The Property. The 1875 Atlantic Avenue property is a 118-unit, 79,445 square foot, nine-story multifamily property located in the Bedford-Stuyvesant neighborhood of Brooklyn, New York. The property was completed in 2018 and occupancy as of April 26, 2018 was 95.8%. The property offers studio, one-, two-, three- and four-bedroom units. Some units contain balconies or terraces, and all of the units feature custom Italian-style kitchens, quartz countertops, custom Italian bath cabinetry, oversized closets, white oak hardwood floors and nine-foot ceilings. Property amenities include an elevator, lounge, laundry room, fitness center, furnished roof deck, game room, study lounge, parking and bike room. The property features 59 parking spaces, resulting in a parking ratio of approximately 0.50 spaces per unit. The property is located along Atlantic Avenue, within two blocks of the A and C subway lines as well as a bus station. Atlantic Avenue is a main commercial thoroughfare, and the Barclays Center, home to Brooklyn Nets and New York Islanders, along with the Atlantic Terminal Mall, are located approximately 2.8 miles west of the property along Atlantic Avenue.
The majority of housing units in the property’s submarket were delivered before 1970 (approximately 76.7%), while only approximately 7.8% were delivered after 2009. Additionally, the property’s zip code, 11233, has seen approximately 135% growth in home values since 2004, per an interactive map compiled by the Washington Post utilizing Census Bureau data. Between 2000 and 2017, Brooklyn exhibited approximately 66.8% household income growth, which is the highest among New York City boroughs.
According to the appraisal, Brooklyn is becoming popular with high-tech and creative firms, as well as online retailers such as Etsy. Many of these firms are located in Downtown Brooklyn, Dumbo and the Brooklyn Navy Yard, an area known as the Brooklyn Tech Triangle. The Brooklyn Navy Yard is a 300-acre industrial park with four million square feet of leasable space. The Navy Yard has more than 330 businesses (including manufacturers, artists, distributors, a distillery, food processors, filmmakers and a medical lab) that employ nearly 7,000 people. The Navy Yard has been undergoing an expansion, with new or renovated buildings to include a sustainable design center, a green manufacturing center, new film and television studio facilities, and a new 240,000-square foot medical lab.
The property is located within the Kings County multifamily submarket. The submarket had a 7.4% vacancy rate as of the third quarter of 2017. According to the appraisal, the 2018 estimated population within the zip code of the property is 72,857. The 2018 estimated average household income within the zip code of the property is $59,263. The property’s comparable monthly market rent for studio, one-, two-, three- and four-bedroom units ranges is $1,850, $2,350, $2,650, $3,100 and $3,400, respectively.
| Historical and Current Occupancy(1) | |||
| 2015 | 2016 | 2017 | Current(2) |
| N/A | N/A | N/A | 95.8% |
| (1) | The property was constructed in early 2018. As a result, historical occupancy is not available. |
| (2) | Current Occupancy is as of April 26, 2018. |
| Multifamily Unit Mix(1) | |||||||
| Unit Type | # of Units | % of Total | Occupied Units | Occupancy | Average Unit Size | Monthly Market Rent Per Unit(2) | Monthly In-Place Rents Per Unit |
| Studio | 1 | 0.8% | 1 | 100.0% | 463 | $1,850 | $1,875 |
| 1 BR | 17 | 14.4 | 15 | 88.2% | 507 | $2,350 | $2,138 |
| 2 BR | 82 | 69.5 | 79 | 96.3% | 608 | $2,650 | $2,369 |
| 3 BR | 17 | 14.4 | 17 | 100.0% | 846 | $3,100 | $2,824 |
| 4 BR | 1 | 0.8 | 1 | 100.0% | 1,163 | $3,400 | $3,500 |
| Total / Wtd. Avg. | 118 | 100.0% | 113 | 95.8% | 631 | $2,671 | $2,407 |
| (1) | Based on the rent roll dated April 26, 2018 provided by the borrower. |
| (2) | Based on the appraisal. |
THE INFORMATION IN THIS STRUCTURAL AND COLLATERAL TERM SHEET IS NOT COMPLETE AND MAY BE AMENDED PRIOR TO THE TIME OF SALE. THIS TERM SHEET IS NOT AN OFFER TO SELL THESE SECURITIES AND IT IS NOT A SOLICITATION OF AN OFFER TO BUY THESE SECURITIES IN ANY JURISDICTION WHERE THE OFFER OR SALE IS NOT PERMITTED.
| 47 of 136 | |
| Structural and Collateral Term Sheet | JPMDB 2018-C8 | |
| 1875 Atlantic Avenue | ||
| Operating History and Underwritten Net Cash Flow(1) | |||
| Underwritten | Per Unit | %(2) | |
| Rents in Place(3) | $3,264,408 | $27,664 | 95.8% |
| Vacant Income | 143,976 | 1,220 | 4.2 |
| Gross Potential Rent | $3,408,384 | $28,885 | 100.0% |
| Total Reimbursements | 0 | 0 | 0.0 |
| Net Rental Income | $3,408,384 | $28,885 | 100.0% |
| (Vacancy/Credit Loss) | (143,976) | (1,220) | (4.2) |
| Other Income(4) | 189,980 | 1,610 | 5.6 |
| Effective Gross Income | $3,454,388 | $29,274 | 101.3% |
| Total Expenses | $460,421 | $3,902 | 13.3% |
| Net Operating Income | $2,993,967 | $25,373 | 86.7% |
| Replacement Reserves | 23,600 | 200 | 0.7 |
| Net Cash Flow | $2,970,367 | $25,173 | 86.0% |
| (1) | The property was constructed in early 2018. As a result, historical financial information is not available. |
| (2) | % column represents percent of Net Rental Income for all revenue lines and represents percent of Effective Gross Income for the remainder of fields. |
| (3) | Based on the rent roll dated April 26, 2018. |
| (4) | Other Income represents parking contract rent and laundry income. |
Property Management. The property is managed by Bruman Realty LLC, a New York limited liability company and an affiliate of the loan sponsor.
Escrows and Reserves. At origination, the borrower deposited $19,197 for real estate taxes and $18,888 for insurance premiums.
Tax Escrows - On a monthly basis, the borrower is required to escrow 1/12 of the annual estimated tax payments, which currently equates to $3,839.
Insurance Escrows - On a monthly basis, the borrower is required to escrow 1/12 of the annual estimated insurance payments, which currently equates to $3,778.
Replacement Reserves- On a monthly basis, the borrower is required to escrow $1,967 (approximately $200 per unit annually) for replacement reserves. The replacement reserve is capped at $118,000.
Lockbox / Cash Management. None.
Permitted Mezzanine Debt. The loan documents permit the owners of the borrower to obtain a mezzanine loan secured by the ownership interests in the borrower from an acceptable mezzanine lender, subject to the lender’s approval, under the following conditions, among others: (a) a minimum combined debt service coverage ratio (as calculated in the loan documents) of 1.50x, (b) an aggregate maximum loan-to-value ratio of 65.0%, (c) a minimum combined debt yield of 7.0%, (d) a hard cash management system is in place and the related account is controlled by the lender, (e) delivery of a satisfactory intercreditor agreement, (f) the mortgage loan and the mezzanine loan are coterminous and (g) rating agency confirmation.
THE INFORMATION IN THIS STRUCTURAL AND COLLATERAL TERM SHEET IS NOT COMPLETE AND MAY BE AMENDED PRIOR TO THE TIME OF SALE. THIS TERM SHEET IS NOT AN OFFER TO SELL THESE SECURITIES AND IT IS NOT A SOLICITATION OF AN OFFER TO BUY THESE SECURITIES IN ANY JURISDICTION WHERE THE OFFER OR SALE IS NOT PERMITTED.
| 48 of 136 | |
| Structural and Collateral Term Sheet | JPMDB 2018-C8 |
[THIS PAGE INTENTIONALLY LEFT BLANK]
THE INFORMATION IN THIS STRUCTURAL AND COLLATERAL TERM SHEET IS NOT COMPLETE AND MAY BE AMENDED PRIOR TO THE TIME OF SALE. THIS TERM SHEET IS NOT AN OFFER TO SELL THESE SECURITIES AND IT IS NOT A SOLICITATION OF AN OFFER TO BUY THESE SECURITIES IN ANY JURISDICTION WHERE THE OFFER OR SALE IS NOT PERMITTED.
| 49 of 136 | |
| Structural and Collateral Term Sheet | JPMDB 2018-C8 | |
| Atlantic Times Square | ||
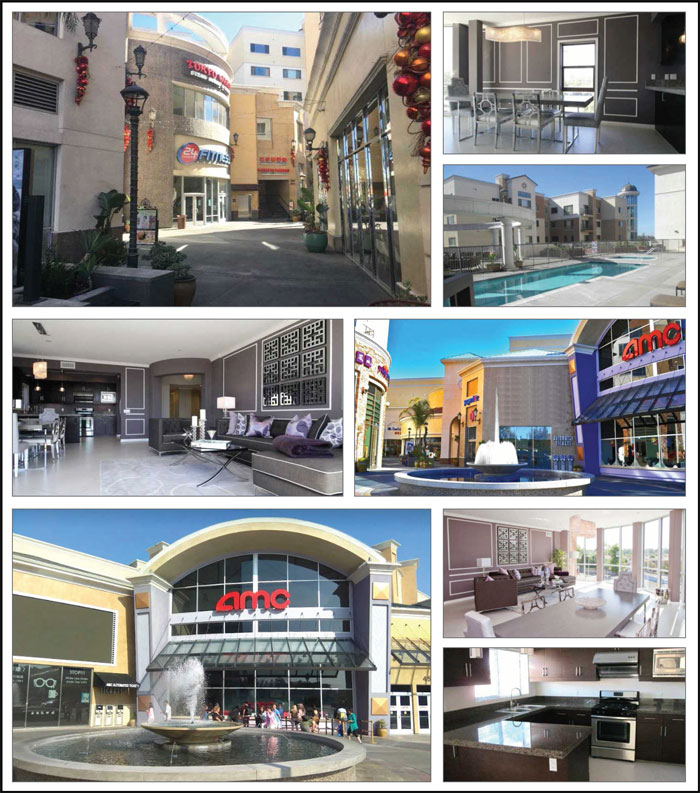
THE INFORMATION IN THIS STRUCTURAL AND COLLATERAL TERM SHEET IS NOT COMPLETE AND MAY BE AMENDED PRIOR TO THE TIME OF SALE. THIS TERM SHEET IS NOT AN OFFER TO SELL THESE SECURITIES AND IT IS NOT A SOLICITATION OF AN OFFER TO BUY THESE SECURITIES IN ANY JURISDICTION WHERE THE OFFER OR SALE IS NOT PERMITTED.
| 50 of 136 | |
| Structural and Collateral Term Sheet | JPMDB 2018-C8 | |
| Atlantic Times Square | ||
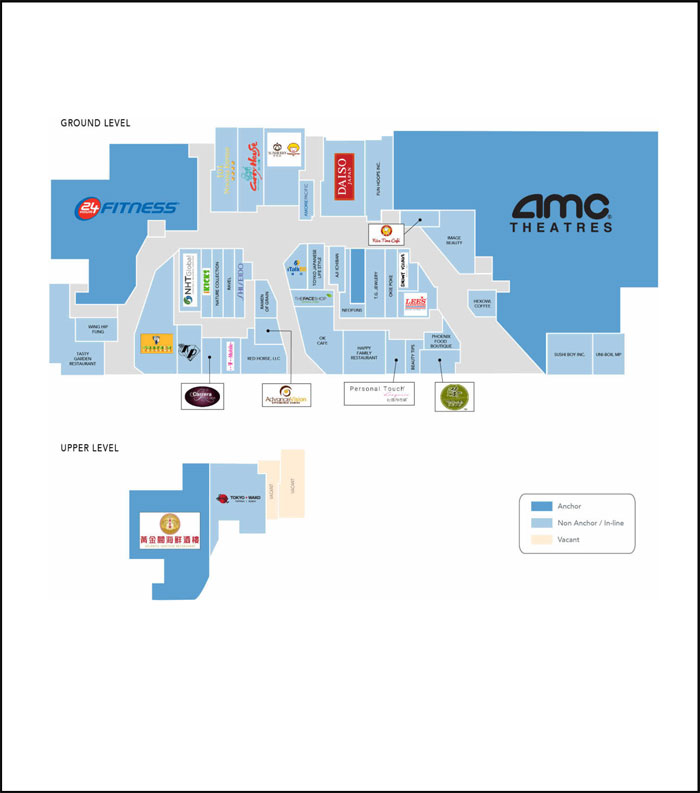
THE INFORMATION IN THIS STRUCTURAL AND COLLATERAL TERM SHEET IS NOT COMPLETE AND MAY BE AMENDED PRIOR TO THE TIME OF SALE. THIS TERM SHEET IS NOT AN OFFER TO SELL THESE SECURITIES AND IT IS NOT A SOLICITATION OF AN OFFER TO BUY THESE SECURITIES IN ANY JURISDICTION WHERE THE OFFER OR SALE IS NOT PERMITTED.
| 51 of 136 | |
| Structural and Collateral Term Sheet | JPMDB 2018-C8 | |
| Atlantic Times Square | ||
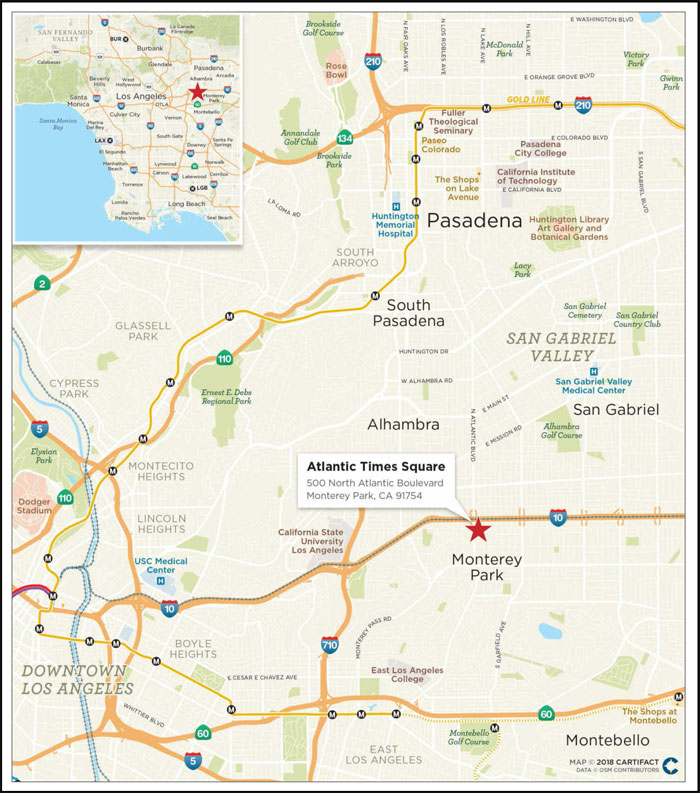
THE INFORMATION IN THIS STRUCTURAL AND COLLATERAL TERM SHEET IS NOT COMPLETE AND MAY BE AMENDED PRIOR TO THE TIME OF SALE. THIS TERM SHEET IS NOT AN OFFER TO SELL THESE SECURITIES AND IT IS NOT A SOLICITATION OF AN OFFER TO BUY THESE SECURITIES IN ANY JURISDICTION WHERE THE OFFER OR SALE IS NOT PERMITTED.
| 52 of 136 | |
| Structural and Collateral Term Sheet | JPMDB 2018-C8 | |
| Atlantic Times Square | ||
| Mortgage Loan Information | Property Information | |||
| Mortgage Loan Seller: | JPMCB | Single Asset / Portfolio: | Single Asset | |
| Original Principal Balance(1): | $40,000,000 | Title: | Fee | |
| Cut-off Date Principal Balance(1): | $40,000,000 | Property Type – Subtype: | Mixed Use – Retail / Multifamily | |
| % of Pool by IPB: | 5.6% | Net Rentable Area (SF / Units)(3): | 379,376 SF / 100 Units | |
| Loan Purpose: | Refinance | Location: | Monterey Park, CA | |
| Borrower: | Atlantic Times Square X, LLC | Year Built/Renovated: | 2010 / N/A | |
| Sponsor: | Ronnie Lam | Occupancy(4): | 96.9% | |
| Interest Rate: | 4.84500% | Occupancy Date: | 3/1/2018 | |
| Note Date: | 3/20/2018 | Number of Tenants(5): | 45 | |
| Maturity Date: | 4/1/2028 | 2015 NOI(6): | $8,042,730 | |
| Interest-only Period: | 120 months | 2016 NOI: | $9,280,553 | |
| Original Term: | 120 months | 2017 NOI: | $9,919,162 | |
| Original Amortization: | None | TTM NOI(as of 2/2018)(6): | $9,977,969 | |
| Amortization Type: | Interest Only | UW Economic Occupancy: | 95.0% | |
| Call Protection(2): | L(26),Def(90),O(4) | UW Revenues(7): | $14,250,504 | |
| Lockbox / Cash Management: | Springing / Springing | UW Expenses: | $4,913,493 | |
| Additional Debt: | Yes | UW NOI(7): | $9,337,011 | |
| Additional Debt Balance: | $58,000,000 | UW NCF: | $8,967,236 | |
| Additional Debt Type: | Pari Passu | Appraised Value / Per SF(8): | $163,800,000 / $432 | |
| Appraisal Date: | 2/1/2018 | |||
| Escrows and Reserves(9) | Financial Information(1) | ||||||
| Initial | Monthly | Initial Cap | Cut-off Date Loan / SF(8): | $258 | |||
| Taxes: | $483,974 | $161,325 | N/A | Maturity Date Loan / SF(8): | $258 | ||
| Insurance: | $140,595 | $15,622 | N/A | Cut-off Date LTV: | 59.8% | ||
| Replacement Reserves: | $4,744 | $4,744 | N/A | Maturity Date LTV: | 59.8% | ||
| TI/LC: | $11,487 | $11,487 | $344,595 | UW NCF DSCR: | 1.86x | ||
| Other: | $0 | Springing | $2,000,000 | UW NOI Debt Yield: | 9.5% | ||
| Sources and Uses | ||||||
| Sources | Proceeds | % of Total | Uses | Proceeds | % of Total | |
| Mortgage Loan(1) | $98,000,000 | 100.0% | Payoff Existing Debt | $66,380,388 | 67.7% | |
| Closing Costs | 1,333,259 | 1.4% | ||||
| Upfront Reserves | 640,799 | 0.7% | ||||
| Return of Equity | 29,645,554 | 30.3% | ||||
| Total Sources | $98,000,000 | 100.0% | Total Uses | $98,000,000 | 100.0% | |
| (1) | The Atlantic Times Square loan is part of a whole loan evidenced by threepari passunotes with an aggregate outstanding principal balance as of the Cut-off Date of $98.0 million. The Financial Information presented in the chart above reflects the aggregate Cut-off Date balance of the $98.0 million Atlantic Times Square Whole Loan, as defined in “The Loan” below. |
| (2) | The lockout period will be at least 26 payments beginning with and including the first payment date of May 1, 2018. Defeasance of the full $98.0 million Atlantic Times Square Whole Loan is permitted at any time after the date that is two years from the closing date of the securitization that includes the note to be last securitized (the “REMIC Prohibition Period”). If the REMIC Prohibition Period has not expired prior to May 1, 2021, the borrower is permitted to prepay the Atlantic Times Square Whole Loan with a yield maintenance premium. The assumed lockout period of 26 payments is based on the expected JPMDB 2018-C8 securitization closing date in June 2018. The actual lockout period may be longer. |
| (3) | Net Rentable Area (SF / Units) of 379,376 square feet represents 212,838 square feet of retail space and 166,538 square feet attributable to 100 multifamily units. |
| (4) | Occupancy is weighted based on total occupied square footage of the retail and multifamily components of the property. Individually, the retail and multifamily components are approximately 97.6% and 96.0% occupied, as of the Occupancy Date, respectively. |
| (5) | Number of Tenants reflects retail tenants only. |
| (6) | The increase in TTM NOI from 2015 NOI is driven predominantly by a general lease up of the retail component of the property totaling 33,919 square feet across 16 new and renewal leases since June 2015. |
| (7) | Approximately 26.5% and 28.4% of the UW Revenues and UW NOI, respectively, are attributable to the multifamily component of the property. |
| (8) | Appraised Value / Per SF, Cut-off Date Loan / SF and Maturity Date Loan / SF are each calculated based on the combined net rentable area of 379,376 square feet of retail and multifamily space. |
| (9) | For a full description of Escrows and Reserves, please refer to the “Escrows and Reserves” section below. |
THE INFORMATION IN THIS STRUCTURAL AND COLLATERAL TERM SHEET IS NOT COMPLETE AND MAY BE AMENDED PRIOR TO THE TIME OF SALE. THIS TERM SHEET IS NOT AN OFFER TO SELL THESE SECURITIES AND IT IS NOT A SOLICITATION OF AN OFFER TO BUY THESE SECURITIES IN ANY JURISDICTION WHERE THE OFFER OR SALE IS NOT PERMITTED.
| 53 of 136 | |
| Structural and Collateral Term Sheet | JPMDB 2018-C8 | |
| Atlantic Times Square | ||
The Loan. The Atlantic Times Square loan is secured by a first mortgage lien on the borrower’s fee interest in a 379,376 square foot mixed-use development comprised of a 212,838 square foot retail component and a 100 unit multifamily component (166,538 square feet) located in Monterey Park, California. The whole loan has an aggregate outstanding principal balance as of the Cut-off Date of $98.0 million (the “Atlantic Times Square Whole Loan”) and is comprised of threepari passusenior notes, each as described below. The controlling Note A-1, with an outstanding principal balance as of the Cut-off Date of $40.0 million, is being contributed to the JPMDB 2018-C8 Trust (the “Atlantic Times Square Mortgage Loan”). The relationship between the holders of the Atlantic Times Square Whole Loan will be governed by a co-lender agreement as described under “Description of the Mortgage Pool—The Whole Loans—The Serviced Pari Passu Whole Loans” in the preliminary prospectus. The Atlantic Times Square Whole Loan has a 10-year term and will be interest only for the entire term. The previous debt secured by the mortgage property was securitized in the JPMCC 2013-C13 transaction.
| Whole Loan Summary | |||||
| Note | Original Balance | Cut-off Date Balance | Note Holder | Controlling Piece | |
| A-1 | $40,000,000 | $40,000,000 | JPMDB 2018-C8 | Yes | |
| A-2 | 40,000,000 | 40,000,000 | COMM 2018-COR3 | No | |
| A-3 | 18,000,000 | 18,000,000 | JPMCB | No | |
| Total | $98,000,000 | $98,000,000 | |||
The Borrower. The borrowing entity for the Atlantic Times Square Whole Loan is Atlantic Times Square X, LLC, a Delaware limited liability company and special purpose entity.
The Loan Sponsor. The loan sponsor and nonrecourse carve-out guarantor is Ronnie Lam.Mr. Lam is the founder and current CEO of Kam Sang Company, Inc. (“Kam Sang”). Kam Sang, established in 1979, is a privately held real estate development and management firm with a portfolio consisting of hospitality, retail, residential, restaurants and mixed use properties. The company currently owns and manages a portfolio of 17 properties, 16 of which are located in the greater Los Angeles, California area with the remaining property located in Henderson, Nevada.
The Property. Atlantic Times Square is a 379,376 square foot mixed use development comprised of a 212,838 square foot retail component and a 100 unit multifamily component. The property was constructed in 2010 for approximately $182.9 million by Kam Sang. The property was built on an approximately 6.6 acre site and contains a 1,649 space subterranean parking garage. The multifamily component of the Atlantic Times Square complex includes two buildings containing 100 units that are part of the collateral and a third building containing 110 condominium units which are not part of the collateral for the loan. The property is located in the Monterey Park/Alhambra sections of East Los Angeles, approximately 7.0 miles from downtown Los Angeles. The local area around the property consists of a mix of residential and commercial use properties and is in close proximity to attractions such as the Pacific Ocean, Disneyland, Dodger Stadium, the Coliseum, the Rose Bowl, L.A. Live and several universities. The property is located on Atlantic Boulevard less than one mile off of Interstate 10. Interstate 10 connects the property to downtown Los Angeles and Santa Monica to the west and West Covina to the east. Atlantic Boulevard, which runs north/south, provides access to Pasadena approximately six miles to the north of the property. Additionally, as of 2017, the population within a one-, three- and five-mile radius was approximately 40,509, 290,496 and 781,501, respectively. The average household income within a one-, three- and five-mile radius was $71,503, $74,572 and $76,299, respectively.
The multifamily component of the collateral consists of 100 units totaling 166,538 square feet and is comprised of 40 two-bedroom and 60 three-bedroom layouts. The multifamily component was 96.0% occupied as of March 1, 2018. Amenities at the property include an outdoor swimming pool and sundecks, health spa, clubhouse lounge and outdoor garden and lounge area. According to the appraisal, the property falls within the East Los Angeles/Alhambra/Montebello/Pico Rivera apartment submarket, which reported a total inventory of 24,722 units as of year-end 2017. The submarket reported a vacancy rate of 2.9% with asking rents of $1,428 per unit, which is up from $1,163 in 2013. Additionally, the Class A average asking rents in the submarket were $1,878 per unit, up from $1,512 in 2013. The appraiser identified seven competitive multifamily properties built between 1962 and 2016, ranging in size from 109 units to 391 units. The competitive properties reported occupancies ranging from 94.3% to 97.3% with a weighted average occupancy of approximately 96.1% as of year-end 2017. There are currently 122 apartment units under construction in the submarket across two projects.
THE INFORMATION IN THIS STRUCTURAL AND COLLATERAL TERM SHEET IS NOT COMPLETE AND MAY BE AMENDED PRIOR TO THE TIME OF SALE. THIS TERM SHEET IS NOT AN OFFER TO SELL THESE SECURITIES AND IT IS NOT A SOLICITATION OF AN OFFER TO BUY THESE SECURITIES IN ANY JURISDICTION WHERE THE OFFER OR SALE IS NOT PERMITTED.
| 54 of 136 | |
| Structural and Collateral Term Sheet | JPMDB 2018-C8 | |
| Atlantic Times Square | ||
The ground floor retail component of the property is comprised of 212,838 square feet and is currently 97.6% leased by 45 tenants, as of March 1, 2018. The retail component is anchored by a 14-screen AMC Theater cinema and 30,842 square foot 24 Hour Fitness. The remaining tenancy is comprised of a variety of in-line and restaurant tenants. According to the appraisal, the property falls within the San Gabriel Valley-West retail submarket. As of year-end 2017, the submarket was comprised of approximately 5.7 million square feet of space with a vacancy rate of 2.8% and average asking rents of $33.79 per square foot. Additionally, the appraisal identified 10 comparable retail leases ranging in size from 627 square feet to 2,366 square feet. Base rents for the comparable leases ranged from $32.40 per square foot to $54.00 per square foot, with a weighted average of $44.76 per square foot. The appraisal concluded retail market rents of between $24.00 per square foot for anchor space to $57.00 per square foot for small shop inline space. Additionally, the appraisal identified approximately 81,500 square feet of new construction in the submarket.
| Historical and Current Occupancy(1) | |||||
| Property Component | Units/SF | 2015 | 2016 | 2017 | Current(2) |
| Residential | 100 Units | 87.0% | 98.0% | 90.0% | 96.0% |
| Retail | 212,838 SF | 96.8% | 98.8% | 97.6% | 97.6% |
| Wtd. Avg.(3) | 92.5% | 98.4% | 94.3% | 96.9% | |
| (1) | Historical Occupancies are as of December 31 of each respective year. |
| (2) | Current Occupancy is as of March 1, 2018. |
| (3) | Based on total square feet. The 100 multifamily units account for 166,538 square feet of the property’s 379,376 square feet of net rentable area. |
| Multifamily Unit Mix(1) | |||||||
| Unit Type | # of Units | % of Total | Occupied Units | Occupancy | Average Unit Size (SF) | Average Monthly Rental Rate Per Unit(2) | Monthly Market Rent Per Unit(3) |
| 2 BR – 2 BA | 40 | 40.0% | 39 | 97.5% | 1,437 | $2,911 | $3,240 |
| 3 BR – 2 BA | 60 | 60.0 | 57 | 95.0% | 1,818 | $3,359 | $3,360 |
| Total / Wtd. Avg. | 100 | 100.0% | 96 | 96.0% | 1,665 | $3,177 | $3,310 |
| (1) | Based on the underwritten multifamily rent roll dated March 1, 2018. |
| (2) | Average Monthly Rental Rates based on occupied units only. |
| (3) | Based on the appraisal. |
| Retail Tenant Summary(1)(2) | ||||||||
| Tenant | Ratings(3) Moody’s/S&P/Fitch | Net Rentable Area (SF) | % of Total NRA | Base Rent PSF | % of Total Base Rent | Most Recent Sales PSF | Lease Expiration Date | |
| AMC Theater(4)(5) | NA / B+ / NA | 75,000 | 35.2% | $22.82 | 25.0% | $533,390 | 4/30/2030 | |
| 24 Hour Fitness | Ba3 / B / NA | 30,842 | 14.5% | $26.88 | 12.1% | NAP | 8/31/2025 | |
| Atlantic Seafood and Dim Sum Restaurant | NA / NA / NA | 12,000 | 5.6% | $33.00 | 5.8% | NAP | 3/20/2022 | |
| Teletron | NA / NA / NA | 6,205 | 2.9% | $33.00 | 3.0% | NAP | 1/31/2026 | |
| Tokyo Wako(6)(7) | NA / NA / NA | 5,977 | 2.8% | $26.40 | 2.3% | $143 | 6/30/2020 | |
| Daiso Japan(8) | NA / NA / NA | 5,525 | 2.6% | $21.00 | 1.7% | $413 | 2/28/2019 | |
| Tasty Garden Restaurant | NA / NA / NA | 4,925 | 2.3% | $46.26 | 3.3% | NAP | 3/31/2028 | |
| OK Café | NA / NA / NA | 4,504 | 2.1% | $45.87 | 3.0% | NAP | 3/21/2020 | |
| Image Beauty(9) | NA / NA / NA | 4,250 | 2.0% | $39.17 | 2.4% | $533 | 7/31/2021 | |
| 101 Noodles Express + Grill | NA / NA / NA | 4,135 | 1.9% | $44.57 | 2.7% | NAP | 6/30/2022 | |
| (1) | Based on the underwritten retail rent roll dated March 1, 2018. |
| (2) | Based on 212,838 square feet, which excludes 166,538 square feet and $3,660,084 of underwritten base rent from the multifamily units. |
| (3) | Ratings provided are for the parent company of the entity listed in the “Tenant” field whether or not the parent company guarantees the lease. |
| (4) | The AMC Theater is leased by an affiliate of the borrower and managed by AMC Theater. |
| (5) | Most Recent Sales PSF for AMC Theater represent the trailing 12-months of sales ended December 2017 and is based on a total of 14 screens. |
| (6) | Tokyo Wako is leased by an affiliate of the borrower. |
| (7) | Most Recent Sales PSF for Tokyo Wako represent the trailing 12-months of sales ended November 2017. |
| (8) | Most Recent Sales PSF for Daiso Japan represent the trailing 12-months of sales ended December 2017. |
| (9) | Most Recent Sales PSF for Image Beauty represent the trailing 12-months of sales ended October 2017. |
THE INFORMATION IN THIS STRUCTURAL AND COLLATERAL TERM SHEET IS NOT COMPLETE AND MAY BE AMENDED PRIOR TO THE TIME OF SALE. THIS TERM SHEET IS NOT AN OFFER TO SELL THESE SECURITIES AND IT IS NOT A SOLICITATION OF AN OFFER TO BUY THESE SECURITIES IN ANY JURISDICTION WHERE THE OFFER OR SALE IS NOT PERMITTED.
| 55 of 136 | |
| Structural and Collateral Term Sheet | JPMDB 2018-C8 | |
| Atlantic Times Square | ||
| Retail Lease Rollover Schedule(1)(2)(3) | |||||||||
| Year | Number of Leases Expiring | Net Rentable Area Expiring | % of NRA Expiring | Base Rent Expiring | % of Base Rent Expiring | Cumulative Net Rentable Area Expiring | Cumulative % of NRA Expiring | Cumulative Base Rent Expiring | Cumulative % of Base Rent |
| Vacant | NAP | 5,142 | 2.4% | NAP | NAP | 5,142 | 2.4% | NAP | NAP |
| 2018 & MTM | 4 | 2,327 | 1.1% | $245,158 | 3.6% | 7,469 | 3.5% | $245,158 | 3.6% |
| 2019 | 6 | 15,060 | 7.1% | 596,947 | 8.7% | 22,529 | 10.6% | $842,105 | 12.3% |
| 2020 | 13 | 29,831 | 14.0% | 1,269,659 | 18.6% | 52,360 | 24.6% | $2,111,765 | 30.9% |
| 2021 | 10 | 18,570 | 8.7% | 801,893 | 11.7% | 70,930 | 33.3% | $2,913,658 | 42.6% |
| 2022 | 7 | 22,662 | 10.6% | 842,415 | 12.3% | 93,592 | 44.0% | $3,756,073 | 54.9% |
| 2023 | 0 | 0 | 0.0% | 0 | 0.0% | 93,592 | 44.0% | $3,756,073 | 54.9% |
| 2024 | 1 | 2,274 | 1.1% | 110,765 | 1.6% | 95,866 | 45.0% | $3,866,838 | 56.5% |
| 2025 | 1 | 30,842 | 14.5% | 829,033 | 12.1% | 126,708 | 59.5% | $4,695,871 | 68.7% |
| 2026 | 1 | 6,205 | 2.9% | 204,765 | 3.0% | 132,913 | 62.4% | $4,900,636 | 71.6% |
| 2027 | 0 | 0 | 0.0% | 0 | 0.0% | 132,913 | 62.4% | $4,900,636 | 71.6% |
| 2028 | 1 | 4,925 | 2.3% | 227,806 | 3.3% | 137,838 | 64.8% | $5,128,442 | 75.0% |
| 2029 & Beyond | 1 | 75,000 | 35.2% | 1,711,815 | 25.0% | 212,838 | 100.0% | $6,840,257 | 100.0% |
| Total | 45 | 212,838 | 100.0% | $6,840,257 | 100.0% | ||||
| (1) | Based on the underwritten retail rent roll dated March 1, 2018. |
| (2) | Certain retail tenants may have termination or contraction options (which may become exercisable prior to the originally stated expiration date of the tenant lease) that are not considered in the above Retail Lease Rollover Schedule. |
| (3) | Based on 212,838 square feet, which excludes 166,538 square feet and $3,660,084 of underwritten base rent attributable to the multifamily component of the property. |
| Operating History and Underwritten Net Cash Flow | |||||||
| 2015 | 2016 | 2017 | TTM(1) | Underwritten | Per Square Foot(2) | %(3) | |
| Rents in Place(4)(5) | $9,021,233 | $10,202,637 | $10,483,266 | $10,759,602 | $10,500,341 | $27.68 | 75.0% |
| Vacant Income | 0 | 0 | 0 | 0 | 373,532 | 0.98 | 2.7% |
| Gross Potential Rent | $9,021,233 | $10,202,637 | $10,483,266 | $10,759,602 | $10,873,873 | $28.66 | 77.7% |
| Total Reimbursements | 2,333,796 | 2,505,209 | 2,471,754 | 2,475,782 | 3,124,391 | 8.24 | 22.3% |
| Net Rental Income | $11,355,029 | $12,707,846 | $12,955,020 | $13,235,384 | $13,998,264 | $36.90 | 100.0% |
| (Vacancy/Credit Loss) | 0 | 0 | 0 | 0 | (699,913) | (1.84) | (5.0)-- |
| Other Income | 710,377 | 807,714 | 1,462,316 | 1,269,244 | 952,154 | 2.51 | 6.8% |
| Effective Gross Income | $12,065,407 | $13,515,561 | $14,417,336 | $14,504,628 | $14,250,504 | $37.56 | 101.8% |
| Total Expenses | $4,022,677 | $4,235,008 | $4,498,174 | $4,526,659 | $4,913,493 | $12.95 | 34.5% |
| Net Operating Income(6) | $8,042,730 | $9,280,553 | $9,919,162 | $9,977,969 | $9,337,011 | $24.61 | 65.5% |
| Total TI/LC, Capex/RR | 0 | 0 | 0 | 0 | 369,775 | 0.97 | 2.6% |
| Net Cash Flow | $8,042,730 | $9,280,553 | $9,919,162 | $9,977,969 | $8,967,236 | $23.64 | 62.9% |
| (1) | TTM column represents the trailing 12-month period ending February 28, 2018. |
| (2) | Per Square Foot is based on 379,376 square feet, which represents 212,838 square feet of retail space and 166,538 square feet of multifamily space. |
| (3) | % column represents percent of Net Rental Income for all revenue lines and represents percent of Effective Gross Income for the remainder of the fields. |
| (4) | Underwritten Rents in Place includes $6,840,257 of retail income (approximately 65.1%) and $3,660,084 of multifamily income (approximately 34.9%). |
| (5) | Underwritten Rents in Place for the multifamily component is based on the multifamily rent roll as of March 1, 2018 annualized. Underwritten Rents in Place for the retail component is based on the in-place retail rent roll as of March 1, 2018. |
| (6) | The increase in TTM Net Operating Income from 2015 Net Operating Income is driven predominantly by a general lease up of the retail component of the property totaling 33,919 square feet across 16 new and renewal leases since June 2015. |
Property Management.Both the multifamily and retail portions of the property are managed by Kam Sang.
Escrows and Reserves. At origination, the borrower deposited into escrow $483,974 for real estate taxes, $140,595 for insurance premiums, $11,487 for tenant improvements and leasing commissions and $4,744 for replacement reserves.
Tax Escrows- On a monthly basis,the borrower is required to escrow 1/12 of the annual estimated tax payments, which currently equates to $161,325.
THE INFORMATION IN THIS STRUCTURAL AND COLLATERAL TERM SHEET IS NOT COMPLETE AND MAY BE AMENDED PRIOR TO THE TIME OF SALE. THIS TERM SHEET IS NOT AN OFFER TO SELL THESE SECURITIES AND IT IS NOT A SOLICITATION OF AN OFFER TO BUY THESE SECURITIES IN ANY JURISDICTION WHERE THE OFFER OR SALE IS NOT PERMITTED.
| 56 of 136 | |
| Structural and Collateral Term Sheet | JPMDB 2018-C8 | |
| Atlantic Times Square | ||
Insurance Escrows – On a monthly basis, the borrower is required to escrow 1/12 of the annual estimated insurance premiums, which currently equates to $15,622. To the extent there is no event of default and the borrower obtains a blanket insurance policy in accordance with the loan documents, the loan documents provide that the requirement to escrow for insurance premiums will be waived.
Replacement Reserves– On a monthly basis, the borrower is required to escrow $4,744 for replacement reserves, comprised of $2,660 for the retail component (approximately $0.15 per square foot of retail space annually) and $2,083 for the multifamily component (approximately $250 per unit of multifamily space annually). The reserve is not subject to a cap.
TI/LC Reserves– On a monthly basis, the borrower is required to escrow $11,487 (approximately $0.65 per square foot of retail space annually) for tenant improvements and leasing commissions. The reserve is subject to a cap of $344,595 (approximately $1.62 per square foot of retail space).
AMC Reserve– Upon the occurrence of an AMC Trigger Event (as defined below) and until the occurrence of an AMC Trigger Event Cure (as defined below), all excess cash flow after payment of debt service, required reserves and operating expenses is required to be held for the purpose of payment of tenant improvements and leasing commissions and other obligations incurred by the borrower in connection with an AMC Trigger Event (the “AMC Reserve”). The AMC Reserve is subject to a cap of $2,000,000 (approximately $9.40 per square foot of retail space).
Lockbox / Cash Management.The Atlantic Times Square Whole Loan is structured with a springing lockbox and springing cash management. Upon the occurrence of a Lockbox Event (as defined below), the borrower will be required to establish and maintain the lockbox account. Further, the borrower will be required to send or cause the property manager to send tenant direction letters instructing all commercial tenants to deposit all rents and payments directly into the lender-controlled lockbox account. Following the Lockbox Event and until the occurrence of a Cash Sweep Event (as defined below), all funds in the lockbox account will be transferred each business day to an account controlled by the borrower. Upon the occurrence of a Cash Sweep Event, all funds in the lockbox account will be required to be swept each business day into a lender-controlled cash management account and disbursed in accordance with the loan documents. During the continuation of a Cash Sweep Event, all excess cash flow after payment of debt service, required reserves and operating expenses and the AMC Reserve deposit (if applicable) is required to be held as additional collateral for the loan. The lender has been granted a first priority security interest in the cash management account.
A “Lockbox Event” means the occurrence of either: (i) a Cash Sweep Event or (ii) the debt service coverage ratio (as calculated in the loan documents) based on the trailing 12-month period falling below 1.15x.
A “Cash Sweep Event” means the occurrence of one or more of the following: (i) an event of default, (ii) any bankruptcy or insolvency action of the borrower or the property manager, (iii) the debt service coverage ratio (as calculated in the loan documents) based on the trailing 12-month period falling below 1.10x or (iv) an AMC Trigger Event (as defined below).
A “Cash Sweep Event Cure” means the occurrence of one or more of the following: (a) with respect to clause (i) above, the acceptance of a cure by the lender of the related event of default, (b) with respect to clause (ii) above, solely with respect to a bankruptcy or insolvency of the property manager, if the borrower replaces such property manager within 60 days of such action in accordance with the loan documents, (c) with respect to clause (iii) above, the achievement of a debt service coverage ratio (as calculated in the loan documents and based on the trailing three month period) of at least 1.15x for two consecutive calendar quarters and (d) with respect to (iv) above, an AMC Trigger Event Cure (as defined below).
An “AMC Trigger Event” means AMC Theater’s failure to renew its management agreement with respect to the theater space on or before the date that is one year prior to the then-current expiration of the AMC Theater management agreement. The expiration date of the current AMC Theater management agreement is August 31, 2020.
An “AMC Trigger Event Cure” means the execution of a replacement management agreement with AMC Theater or other theater manager acceptable to the lender for a term of no less than five years and AMC Theater or such other theater manager is operating the theater pursuant to such replacement management agreement or the theater has been re-let to one or more replacement tenant(s) pursuant to a replacement lease(s) and the borrower has delivered to the lender a tenant estoppel certificate(s) from each such replacement tenant(s) in form and substance reasonably acceptable to the lender stating that such replacement tenant(s) is/are in occupancy and paying full contractual rent.
THE INFORMATION IN THIS STRUCTURAL AND COLLATERAL TERM SHEET IS NOT COMPLETE AND MAY BE AMENDED PRIOR TO THE TIME OF SALE. THIS TERM SHEET IS NOT AN OFFER TO SELL THESE SECURITIES AND IT IS NOT A SOLICITATION OF AN OFFER TO BUY THESE SECURITIES IN ANY JURISDICTION WHERE THE OFFER OR SALE IS NOT PERMITTED.
| 57 of 136 | |
| Structural and Collateral Term Sheet | JPMDB 2018-C8 | |
| Embassy Suites Glendale | ||
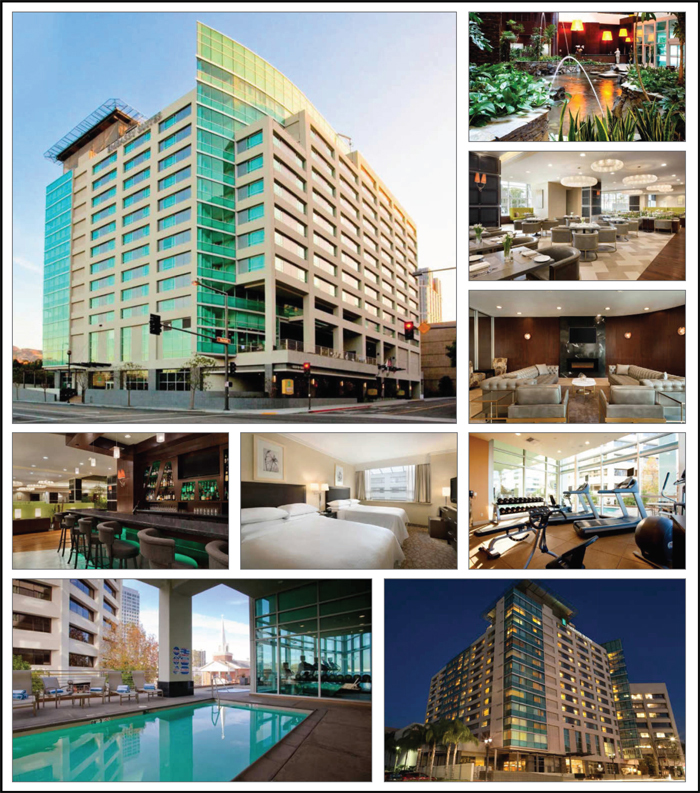
THE INFORMATION IN THIS STRUCTURAL AND COLLATERAL TERM SHEET IS NOT COMPLETE AND MAY BE AMENDED PRIOR TO THE TIME OF SALE. THIS TERM SHEET IS NOT AN OFFER TO SELL THESE SECURITIES AND IT IS NOT A SOLICITATION OF AN OFFER TO BUY THESE SECURITIES IN ANY JURISDICTION WHERE THE OFFER OR SALE IS NOT PERMITTED.
| 58 of 136 | |
| Structural and Collateral Term Sheet | JPMDB 2018-C8 | |
| Embassy Suites Glendale | ||
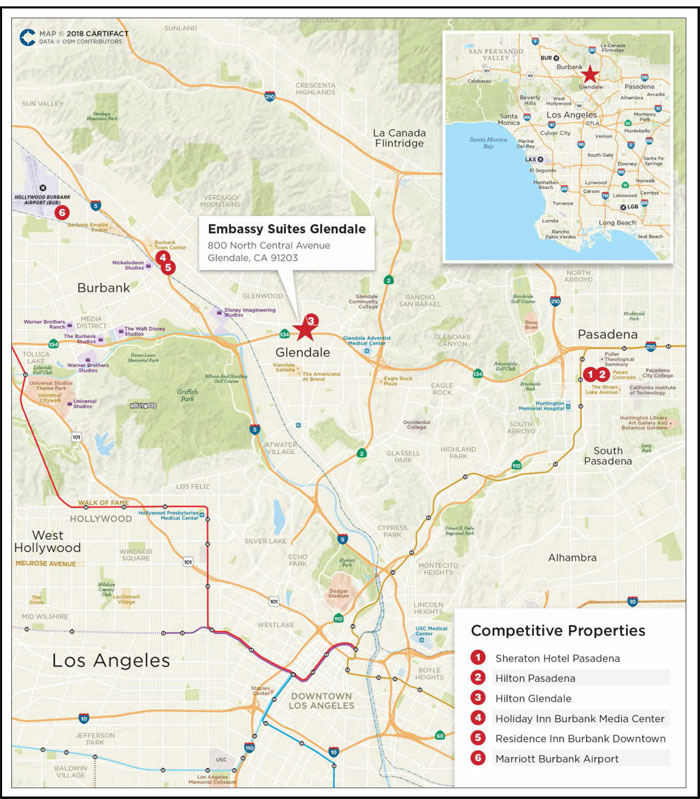
THE INFORMATION IN THIS STRUCTURAL AND COLLATERAL TERM SHEET IS NOT COMPLETE AND MAY BE AMENDED PRIOR TO THE TIME OF SALE. THIS TERM SHEET IS NOT AN OFFER TO SELL THESE SECURITIES AND IT IS NOT A SOLICITATION OF AN OFFER TO BUY THESE SECURITIES IN ANY JURISDICTION WHERE THE OFFER OR SALE IS NOT PERMITTED.
| 59 of 136 | |
| Structural and Collateral Term Sheet | JPMDB 2018-C8 | |
| Embassy Suites Glendale | ||
| Mortgage Loan Information | Property Information | |||
| Mortgage Loan Seller: | JPMCB | Single Asset / Portfolio: | Single Asset | |
| Original Principal Balance(1): | $37,000,000 | Title: | Fee | |
| Cut-off Date Principal Balance(1): | $37,000,000 | Property Type - Subtype: | Hotel – Full Service | |
| % of Pool by IPB: | 5.2% | Net Rentable Area (Rooms): | 272 | |
| Loan Purpose: | Refinance | Location: | Glendale, CA | |
| Borrower: | Newage Glendale LLC | Year Built / Renovated: | 2008 / 2017 | |
| Sponsor: | Ronnie Lam | Occupancy / ADR / RevPAR: | 88.1% / $193.86 / $170.73 | |
| Interest Rate: | 5.44800% | Occupancy / ADR / RevPAR Date: | 2/28/2018 | |
| Note Date: | 5/8/2018 | Number of Tenants: | N/A | |
| Maturity Date: | 6/1/2023 | 2015 NOI: | $7,719,740 | |
| Interest-only Period: | 60 months | 2016 NOI(3): | $8,445,149 | |
| Original Term: | 60 months | 2017 NOI: | $7,472,939 | |
| Original Amortization: | None | TTM NOI (as of 2/2018): | $7,383,675 | |
| Amortization Type: | Interest Only | UW Occupancy / ADR / RevPAR: | 88.1% / $193.86 / $170.73 | |
| Call Protection(2): | L(24),Def(32),O(4) | UW Revenues: | $19,903,033 | |
| Lockbox / Cash Management: | Springing / Springing | UW Expenses: | $12,222,381 | |
| Additional Debt: | Yes | UW NOI: | $7,680,652 | |
| Additional Debt Balance: | $31,000,000 | UW NCF: | $7,680,652 | |
| Additional Debt Type: | Pari Passu | Appraised Value / Per Room: | $114,000,000 / $419,118 | |
| Appraisal Date: | 3/29/2018 | |||
| Escrows and Reserves(4) | Financial Information(1) | ||||||
| Initial | Monthly | Initial Cap | Cut-off Date Loan / Room: | $250,000 | |||
| Taxes: | $347,034 | $69,407 | N/A | Maturity Date Loan / Room: | $250,000 | ||
| Insurance: | $0 | Springing | N/A | Cut-off Date LTV: | 59.6% | ||
| FF&E Reserves: | $69,500 | 4% of Gross Revenues | N/A | Maturity Date LTV: | 59.6% | ||
| Other: | $0 | $0 | N/A | UW NCF DSCR: | 2.04x | ||
| UW NOI Debt Yield: | 11.3% | ||||||
| Sources and Uses | ||||||
| Sources | Proceeds | % of Total | Uses | Proceeds | % of Total | |
| Mortgage Loan(1) | $68,000,000 | 100.0% | Payoff Existing Debt | $43,893,657 | 64.5% | |
| Upfront Reserves | 416,534 | 0.6 | ||||
| Closing Costs | 363,643 | 0.5 | ||||
| Return of Equity | 23,326,165 | 34.3 | ||||
| Total Sources | $68,000,000 | 100.0% | Total Uses | $68,000,000 | 100.0% | |
| (1) | The Embassy Suites Glendale loan is part of a whole loan evidenced by twopari passu notes, with an aggregate outstanding principal balance as of the Cut-off Date of $68.0 million. The information presented in the chart titled “Financial Information” above reflects the aggregate Cut-off Date balance of the $68.0 million Embassy Suites Glendale Whole Loan, as defined in “The Loan” below. |
| (2) | The lockout period for defeasance will be at least 24 payments beginning with and including the first payment date of July 1, 2018. Defeasance of the full $68.0 million Embassy Suites Glendale Whole Loan (as defined below) is permitted at any time after the date that is two years from the closing date of the securitization that includes the note to be last securitized (the “REMIC Prohibition Period”). If the REMIC Prohibition Period has not expired prior to July 1, 2021, the borrower is permitted to prepay the Embassy Suites Glendale Whole Loan with a yield maintenance premium. The assumed lockout period of 24 payments is based on the expected JPMDB 2018-C8 securitization closing date in June 2018. The actual lockout period may be longer. |
| (3) | 2016 NOI reflects increased room revenue driven primarily by the displacement of residents following the Porter Ranch gas leak in the first half of 2016. |
| (4) | For a full description of Escrows and Reserves, please refer to “Escrows and Reserves” below. |
THE INFORMATION IN THIS STRUCTURAL AND COLLATERAL TERM SHEET IS NOT COMPLETE AND MAY BE AMENDED PRIOR TO THE TIME OF SALE. THIS TERM SHEET IS NOT AN OFFER TO SELL THESE SECURITIES AND IT IS NOT A SOLICITATION OF AN OFFER TO BUY THESE SECURITIES IN ANY JURISDICTION WHERE THE OFFER OR SALE IS NOT PERMITTED.
| 60 of 136 | |
| Structural and Collateral Term Sheet | JPMDB 2018-C8 | |
| Embassy Suites Glendale | ||
The Loan.The Embassy Suites Glendale loan is secured by a first mortgage lien on the borrower’s fee interest in a 272-room hotel building located in Glendale, California. The whole loan has an aggregate outstanding principal balance as of the Cut-off Date of $68.0 million (the “Embassy Suites Glendale Whole Loan”) and is comprised of twopari passu notes, each as described below. Note A-1, with an outstanding principal balance as of the Cut-off Date of $37.0 million (the “Embassy Suites Glendale Mortgage Loan”), is being contributed to the JPMDB 2018-C8 Trust and is the controlling note under the related co-lender agreement. Note A-2, with an outstanding principal balance as of the Cut-off Date of $31.0 million is expected to be contributed to one or more future securitization trusts. The Embassy Suites Glendale Whole Loan has a five-year term and will be interest-only for the entire loan term. The previous debt secured by the property was securitized in JPMBB 2013-C14. The relationship between the holders of the Embassy Suites Glendale Whole Loan will be governed by a co-lender agreement as described under the “Description of the Mortgage Pool—The Whole Loans—The Pari Passu Whole Loans” in the Preliminary Prospectus.
| Whole Loan Summary | |||||
| Note | Original Balance | Cut-off Date Balance | Note Holder | Controlling Piece | |
| A-1 | $37,000,000 | $37,000,000 | JPMDB 2018-C8 | Yes | |
| A-2 | 31,000,000 | 31,000,000 | JPMCB | No | |
| Total | $68,000,000 | $68,000,000 | |||
The Borrower. The borrowing entity for the Embassy Suites Glendale Whole Loan is Newage Glendale LLC, a California limited liability company and special purpose entity with two independent directors in its organizational structure.
The Loan Sponsor.The loan sponsor and nonrecourse carve-out guarantor is Ronnie Lam. Ronnie Lam is the Chief Executive Officer and President at Kam Sang Company, Inc. (“Kam Sang”). Kam Sang is a privately held real estate development and investment firm based in Arcadia, California. Established in 1979 by founder Ronnie Lam, Kam Sang manages a portfolio of 17 properties, 16 of which are located in the greater Los Angeles, California area. The portfolio includes hotel, retail, residential, restaurant and mixed-use properties. Kam Sang currently has an additional eight projects in the construction pipeline.
The Property. The Embassy Suites Glendale property is a 272-room, 12-story, full service hotel located in Glendale, California. The property was built in 2008 by Kam Sang for approximately $72.5 million and is the newest property in the hotel’s competitive set. Kam Sang also invested approximately $1.2 million in 2016 and 2017 for various improvements, including replacement and refurbishment of common carpet and finishes and upgrades to the lobby and restaurant furniture and lighting. The property’s amenities include a fitness center, outdoor swimming pool, business center, breakfast buffet, restaurant and lounge, approximately 10,131 square feet of meeting and banquet space, a gift shop and a three-level subterranean parking garage with 348 parking spaces. The property offers a complimentary hot breakfast buffet and a complimentary evening cocktail reception to guests. The guestrooms are situated on floors three through 12 of the property and feature flat-screen televisions, telephones, desks with chairs, dressers, nightstands and sofa sleepers.
The property is located one block north of the Central Avenue-Ventura Freeway interchange, which provides access to downtown Los Angeles, approximately 7.3 miles south of the property, as well as Pasadena to the east and Burbank to the west. The property is approximately 6.2 miles southwest from the Hollywood Burbank Airport, which serves the local area with commercial, charter and private air service. The property is also approximately 17.3 miles northeast of the Los Angeles International Airport, which is undergoing a $14.0 billion modernization project, which includes an overhaul and expansion of various terminals to accommodate growing air traffic volumes at the nation’s third busiest airport, according to the appraisal. Leisure demand drivers include Universal Studios and Universal City, the Warner Bros. Studio, the Los Angeles Zoo, Hollywood Hills, Hollywood Bowl, Griffith Observatory and the Rose Bowl Stadium, which has hosted UCLA’s Bruins football games, nearly 100 Rose Bowl games, five Super Bowls and numerous soccer matches and concerts. Regional access to the property is provided by the Metro Orange Line, one of two lines on the Metro Transitway network in Los Angeles, that provide public transportation access to downtown Los Angeles.
The property serves the greater Los Angeles County and commercial and group demand is generated primarily by a wide variety of corporate tenants in the surrounding area. According to the appraisal, Los Angeles’ leading employment sectors include trade, transportation and utilities; education and health services; and professional and business services, with employment shares of 18.7%, 17.8% and 13.9%, respectively. Major employers include the University of California Los Angeles, Kaiser Permanente, University of Southern California, Target Brands Inc., The Kroger Company, The Boeing Company, Bank of America Corporation and The Walt Disney Company, which is the largest Fortune 500 company in Los Angeles County.
THE INFORMATION IN THIS STRUCTURAL AND COLLATERAL TERM SHEET IS NOT COMPLETE AND MAY BE AMENDED PRIOR TO THE TIME OF SALE. THIS TERM SHEET IS NOT AN OFFER TO SELL THESE SECURITIES AND IT IS NOT A SOLICITATION OF AN OFFER TO BUY THESE SECURITIES IN ANY JURISDICTION WHERE THE OFFER OR SALE IS NOT PERMITTED.
| 61 of 136 | |
| Structural and Collateral Term Sheet | JPMDB 2018-C8 | |
| Embassy Suites Glendale | ||
The appraisal noted that there are two hotels, the 179-room Hyatt Place Glendale and the 85-room Aloft Glendale, under construction, slated for delivery in the summer of 2018 and summer of 2019, respectively. The Hyatt Place Glendale is expected to be located less than one mile south of the Embassy Suites Glendale property. The Aloft Glendale is expected to be located approximately half a mile north of the Embassy Suites Glendale property and is not anticipated to be competitive with the property. The property’s competitive set and performance relative to its competitive set are detailed below:
| Historical Occupancy, ADR, RevPAR(1) | ||||||||||
| Competitive Set(2) | Embassy Suites Glendale(3) | Penetration Factor(2) | ||||||||
| Year | Occupancy | ADR | RevPAR | Occupancy | ADR | RevPAR | Occupancy | ADR | RevPAR | |
| 2015 | 83.1% | $154.87 | $128.74 | 85.9% | $187.47 | $161.07 | 103.4% | 121.0% | 125.1% | |
| 2016 | 83.5% | $178.53 | $149.03 | 88.4% | $202.51 | $178.99 | 105.9% | 113.4% | 120.1% | |
| 2017 | 74.9% | $172.37 | $129.06 | 88.7% | $193.12 | $171.30 | 118.4% | 112.0% | 132.7% | |
| TTM(4) | 74.9% | $173.32 | $129.81 | 88.1% | $193.86 | $170.73 | 117.6% | 111.9% | 131.5% | |
| (1) | The variances between the underwriting, the hotel research report and above table with respect to Occupancy, ADR and RevPAR at the Embassy Suites Glendale property are attributable to variances in reporting methodologies and/or timing differences. |
| (2) | Competitive Set data for each individual property provided from a third party hotel research report. The competitive set contains the following properties: Holiday Inn Burbank Media Center, Sheraton Hotel Pasadena, Marriott Los Angeles Burbank Airport, Hilton Pasadena, Hilton Los Angeles North Glendale & Executive Meeting Center and Residence Inn Burbank Downtown. |
| (3) | Based on operating statements provided by the borrower and weighted based on available rooms and occupied rooms, as applicable. |
| (4) | TTM represents the trailing 12-month period ending on February 28, 2018. |
| Competitive Hotels Profile(1) | ||||||||
| 2017 Estimated Market Mix | 2017 Estimated Operating Statistics | |||||||
| Property | Rooms | Year Opened | Meeting Space (SF) | Transient | Meeting and Group | Occupancy | ADR | RevPAR |
| Embassy Suites Glendale(2) | 272 | 2008 | 10,131 | 90% | 10% | 88.7% | $193.12 | $171.30 |
| Sheraton Hotel Pasadena | 311 | 1975 | 11,523 | 80% | 20% | 51.0% | $176.00 | $89.76 |
| Hilton Pasadena | 296 | 1970 | 32,410 | 81% | 19% | 57.0% | $192.00 | $109.44 |
| Hilton Glendale | 351 | 1992 | 15,036 | 79% | 21% | 87.0% | $169.00 | $147.03 |
| Holiday Inn Burbank Media Center | 484 | 1981 | 16,518 | 77% | 23% | 77.0% | $146.00 | $112.42 |
| Residence Inn Burbank Downtown | 166 | 2007 | 1,352 | 96% | 4% | 91.0% | $204.00 | $185.64 |
| Marriott Burbank Airport | 488 | 1982 | 46,750 | 77% | 23% | 85.0% | $178.00 | $151.30 |
| Total(3) | 2,096 | |||||||
| (1) | Based on the appraisal. |
| (2) | The Embassy Suites Glendale 2017 Occupancy, ADR and RevPAR are based on operating statements provided by the borrower. |
| (3) | Excludes the Embassy Suites Glendale property. |
THE INFORMATION IN THIS STRUCTURAL AND COLLATERAL TERM SHEET IS NOT COMPLETE AND MAY BE AMENDED PRIOR TO THE TIME OF SALE. THIS TERM SHEET IS NOT AN OFFER TO SELL THESE SECURITIES AND IT IS NOT A SOLICITATION OF AN OFFER TO BUY THESE SECURITIES IN ANY JURISDICTION WHERE THE OFFER OR SALE IS NOT PERMITTED.
| 62 of 136 | |
| Structural and Collateral Term Sheet | JPMDB 2018-C8 | |
| Embassy Suites Glendale | ||
| Operating History and Underwritten Net Cash Flow | |||||||
| 2015 | 2016 | 2017 | TTM(1) | Underwritten | Per Room(2) | % of Total Revenue(3) | |
| Occupancy | 85.9% | 88.4% | 88.7% | 88.1% | 88.1% | ||
| ADR | $187.47 | $202.51 | $193.12 | $193.86 | $193.86 | ||
| RevPAR | $161.07 | $178.99 | $171.30 | $170.73 | $170.73 | ||
| Room Revenue(4) | $15,990,798 | $17,819,172 | $17,006,303 | $16,950,463 | $16,950,463 | $62,318 | 85.2% |
| Food & Beverage Revenue | 2,126,104 | 2,128,171 | 1,945,495 | 1,919,015 | 1,919,015 | 7,055 | 9.6% |
| Telephone Revenue | 7,855 | 6,296 | 4,516 | 4,019 | 4,019 | 15 | 0.0% |
| Other Departmental Revenue | 971,597 | 1,047,366 | 1,020,066 | 1,029,536 | 1,029,536 | 3,785 | 5.2% |
| Total Revenue | $19,096,354 | $21,001,005 | $19,976,380 | $19,903,033 | $19,903,033 | $73,173 | 100.0% |
| Room Expense | $2,989,449 | $3,245,384 | $3,352,376 | $3,369,948 | $3,199,131 | $11,762 | 18.9% |
| Food & Beverage Expense | 1,666,053 | 1,857,410 | 1,774,312 | 1,752,802 | 1,647,243 | 6,056 | 85.8% |
| Telephone Expense | 25,154 | 28,392 | 33,074 | 34,176 | 34,176 | 126 | 850.4% |
| Other Departmental Expenses | 81,971 | 81,466 | 74,034 | 74,384 | 74,384 | 273 | 7.2% |
| Departmental Expenses | $4,762,627 | $5,212,652 | $5,233,796 | $5,231,310 | $4,954,933 | $18,217 | 24.9% |
| Departmental Profit | $14,333,727 | $15,788,353 | $14,742,584 | $14,671,723 | $14,948,100 | $54,956 | 75.1% |
| Operating Expenses | $4,563,795 | $4,959,785 | $4,885,928 | $4,884,774 | $4,884,831 | $17,959 | 24.5% |
| Gross Operating Profit | $9,769,932 | $10,828,568 | $9,856,656 | $9,786,949 | $10,063,269 | $36,997 | 50.6% |
| Management Fees | $399,770 | $576,621 | $553,344 | $551,670 | $597,091 | $2,195 | 3.0% |
| Property Taxes | 775,037 | 840,544 | 830,008 | 834,603 | 834,603 | 3,068 | 4.2% |
| Property Insurance | 111,531 | 121,430 | 194,362 | 213,928 | 147,850 | 544 | 0.7% |
| Other Expenses | 0 | 4,784 | 6,948 | 6,952 | 6,952 | 26 | 0.0% |
| FF&E | 763,854 | 840,040 | 799,055 | 796,121 | 796,121 | 2,927 | 4.0% |
| Total General/Unallocated Expenses | $2,050,192 | $2,383,419 | $2,383,717 | $2,403,274 | $2,382,617 | $8,760 | 12.0% |
| Net Operating Income(4) | $7,719,740 | $8,445,149 | $7,472,939 | $7,383,675 | $7,680,652 | $28,238 | 38.6% |
| Net Cash Flow | $7,719,740 | $8,445,149 | $7,472,939 | $7,383,675 | $7,680,652 | $28,238 | 38.6% |
| (1) | TTM column represents the trailing 12-month period ending on February 28, 2018. |
| (2) | Per Room values are based on 272 guest rooms. |
| (3) | % of Total Revenue for Room Expense, Food & Beverage Expense, Telephone Expense and Other Departmental Expenses are based on their corresponding revenue line items. |
| (4) | 2016 NOI reflects increased room revenue driven primarily by the displacement of residents following the Porter Ranch gas leak in the first half of 2016. |
Property Management. The property is managed by Kam Sang Company, Inc., an affiliate of the loan sponsor.
Franchise Agreement. The property has a franchise agreement with Hilton Hotels Corporation. The current franchise agreement is effective as of May 4, 2018 for a term of approximately 10 years, expiring on June 30, 2028. The franchise agreement provides for a monthly program fee of 4.0% of gross room revenues for the preceding month.
Escrows and Reserves. At origination, the borrower deposited into escrow $347,034 for real estate taxes and approximately $69,500 for FF&E reserves.
Tax Escrows – On a monthly basis, the borrower is required to escrow 1/12 of annual estimated tax payments, which currently equates to $69,407.
Insurance Escrows – The requirement for the borrower to make monthly deposits to the insurance escrow is waived provided that (i) no event of default is then continuing and (ii) the borrower provides the lender with certificates of insurance reasonably satisfactory to the lender evidencing that the property is insured pursuant to a blanket insurance policy meeting the requirements specified in the loan agreement.
FF&E Reserves– On a monthly basis, the borrower is required to escrow the greater of (a) the sum of 1/12 of 4% of annual gross income from operations plus any amounts then required for any PIP pursuant to the franchise agreement and (b) the amount required by the franchisor pursuant to the franchise agreement.
THE INFORMATION IN THIS STRUCTURAL AND COLLATERAL TERM SHEET IS NOT COMPLETE AND MAY BE AMENDED PRIOR TO THE TIME OF SALE. THIS TERM SHEET IS NOT AN OFFER TO SELL THESE SECURITIES AND IT IS NOT A SOLICITATION OF AN OFFER TO BUY THESE SECURITIES IN ANY JURISDICTION WHERE THE OFFER OR SALE IS NOT PERMITTED.
| 63 of 136 | |
| Structural and Collateral Term Sheet | JPMDB 2018-C8 | |
| Embassy Suites Glendale | ||
Lockbox / Cash Management.The Embassy Suites Glendale Whole Loan is structured with a springing lockbox and springing cash management. Upon the occurrence of a Lockbox Event (as defined below), the borrower is required to establish a lockbox account and direct all credit card companies, credit card clearing banks and all tenants under commercial leases to send all revenues directly to the lockbox account. During a Cash Sweep Event (as defined below), all funds in the lockbox account are swept on each business day to a segregated cash management account under the control of the lender and all excess cash flow after payment of the mortgage debt service, required reserves and operating expenses is required to be held as additional collateral for the loan. The lender has a first priority security interest in the cash management account.
“Lockbox Event” means the occurrence of either (i) a Cash Sweep Event or (ii) the debt service coverage ratio (as calculated in the loan documents) based on the trailing twelve month period immediately preceding the date of determination is less than 1.20x.
“Cash Sweep Event” means the occurrence of (i) an event of default, (ii) any bankruptcy or insolvency action of the borrower or property manager or a non-collusive involuntary bankruptcy action of the borrower or property manager that is not dismissed within 60 days of filing or (c) the debt service coverage ratio (as calculated in the loan documents) based on the trailing twelve-month period immediately preceding the date of determination is less than 1.15x.
THE INFORMATION IN THIS STRUCTURAL AND COLLATERAL TERM SHEET IS NOT COMPLETE AND MAY BE AMENDED PRIOR TO THE TIME OF SALE. THIS TERM SHEET IS NOT AN OFFER TO SELL THESE SECURITIES AND IT IS NOT A SOLICITATION OF AN OFFER TO BUY THESE SECURITIES IN ANY JURISDICTION WHERE THE OFFER OR SALE IS NOT PERMITTED.
| 64 of 136 | |
| Structural and Collateral Term Sheet | JPMDB 2018-C8 |
[THIS PAGE INTENTIONALLY LEFT BLANK]
THE INFORMATION IN THIS STRUCTURAL AND COLLATERAL TERM SHEET IS NOT COMPLETE AND MAY BE AMENDED PRIOR TO THE TIME OF SALE. THIS TERM SHEET IS NOT AN OFFER TO SELL THESE SECURITIES AND IT IS NOT A SOLICITATION OF AN OFFER TO BUY THESE SECURITIES IN ANY JURISDICTION WHERE THE OFFER OR SALE IS NOT PERMITTED.
| 65 of 136 | |
| Structural and Collateral Term Sheet | JPMDB 2018-C8 | |
| Sheraton Hotel Arlington | ||

THE INFORMATION IN THIS STRUCTURAL AND COLLATERAL TERM SHEET IS NOT COMPLETE AND MAY BE AMENDED PRIOR TO THE TIME OF SALE. THIS TERM SHEET IS NOT AN OFFER TO SELL THESE SECURITIES AND IT IS NOT A SOLICITATION OF AN OFFER TO BUY THESE SECURITIES IN ANY JURISDICTION WHERE THE OFFER OR SALE IS NOT PERMITTED.
| 66 of 136 | |
| Structural and Collateral Term Sheet | JPMDB 2018-C8 | |
| Sheraton Hotel Arlington | ||
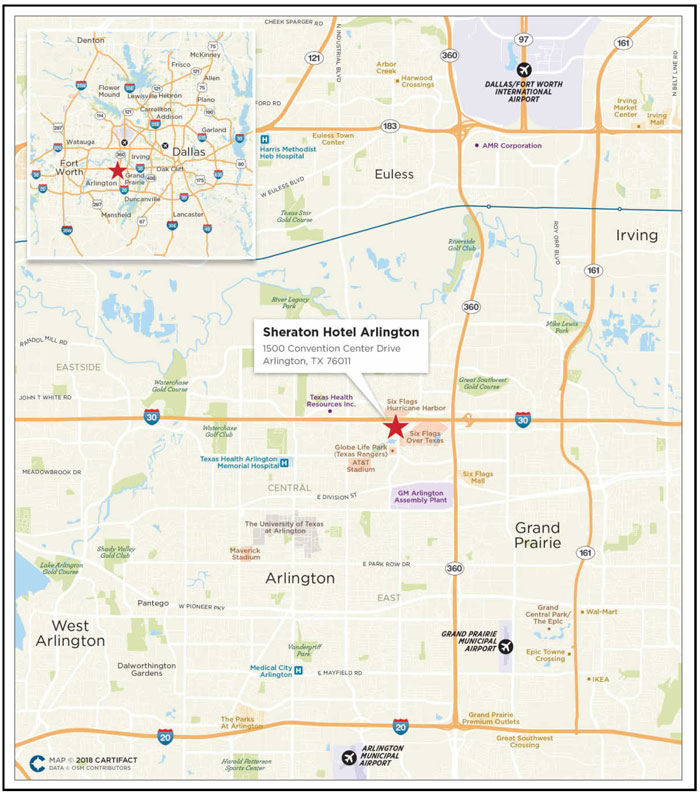
THE INFORMATION IN THIS STRUCTURAL AND COLLATERAL TERM SHEET IS NOT COMPLETE AND MAY BE AMENDED PRIOR TO THE TIME OF SALE. THIS TERM SHEET IS NOT AN OFFER TO SELL THESE SECURITIES AND IT IS NOT A SOLICITATION OF AN OFFER TO BUY THESE SECURITIES IN ANY JURISDICTION WHERE THE OFFER OR SALE IS NOT PERMITTED.
| 67 of 136 | |
| Structural and Collateral Term Sheet | JPMDB 2018-C8 | |
| Sheraton Hotel Arlington | ||
| Mortgage Loan Information | Property Information | |||
| Mortgage Loan Seller: | GACC | Single Asset / Portfolio: | Single Asset | |
| Original Principal Balance: | $36,400,000 | Title: | Leasehold | |
| Cut-off Date Principal Balance: | $36,193,886 | Property Type - Subtype: | Hotel – Full Service | |
| % of Pool by IPB: | 5.1% | Net Rentable Area (Rooms): | 311 | |
| Loan Purpose: | Refinance | Location: | Arlington, TX | |
| Borrower: | UVH Arlington, LLC | Year Built / Renovated: | 1985 / 2016 | |
| Sponsor: | Allan Gutierrez | Occupancy / ADR / RevPAR: | 72.6% / $144.18 / $104.69 | |
| Interest Rate: | 5.23000% | Occupancy / ADR / RevPAR Date: | 12/31/2017 | |
| Note Date: | 12/20/2017 | Number of Tenants: | N/A | |
| Maturity Date: | 1/6/2023 | 2015 NOI: | $4,958,476 | |
| Interest-only Period: | None | 2016 NOI: | $4,637,653 | |
| Original Term: | 60 months | 2017 NOI: | $5,201,393 | |
| Original Amortization: | 360 months | TTM NOI: | N/A | |
| Amortization Type: | Balloon | UW Occupancy / ADR / RevPAR: | 72.6% / $144.18 / $104.69 | |
| Call Protection: | L(29),Def(27),O(4) | UW Revenues: | $17,359,843 | |
| Lockbox / Cash Management: | Hard / Springing | UW Expenses: | $12,273,814 | |
| Additional Debt: | N/A | UW NOI: | $5,086,029 | |
| Additional Debt Balance: | N/A | UW NCF: | $4,391,636 | |
| Additional Debt Type: | N/A | Appraised Value / Per Room(1): | $59,500,000 / $191,318 | |
| Appraisal Date: | 10/1/2018 | |||
| Escrows and Reserves(2) | Financial Information | ||||||
| Initial | Monthly | Initial Cap | Cut-off Date Loan / Room: | $116,379 | |||
| Taxes: | $0 | $48,723 | N/A | Maturity Date Loan / Room: | $108,306 | ||
| Insurance: | $0 | Springing | N/A | Cut-off Date LTV(1): | 60.8% | ||
| FF&E Reserves: | $0 | 4% of Gross Revenues | N/A | Maturity Date LTV(1): | 56.6% | ||
| TI/LC: | $0 | $0 | N/A | UW NCF DSCR: | 1.82x | ||
| Other: | $2,253,991 | Springing | N/A | UW NOI Debt Yield: | 14.1% | ||
| Sources and Uses | |||||||
| Sources | Proceeds | % of Total | Uses | Proceeds | % of Total | |
| Mortgage Loan | $36,400,000 | 100.0% | Payoff Existing Debt | $31,230,356 | 85.8% | |
| Upfront Reserves | 2,253,991 | 6.2 | ||||
| Closing Costs | 1,178,794 | 3.2 | ||||
| Return of Equity | 1,736,859 | 4.8 | ||||
| Total Sources | $36,400,000 | 100.0% | Total Uses | $36,400,000 | 100.0% |
| (1) | Appraised Value / Per Room, Cut-off Date LTV and Maturity Date LTV are calculated based on the “Prospective Market Value Upon Completion of the Renovation and Stabilization” appraised value, which assumes the completion of the approximately $2.2 million property improvement plan and sponsor-elected capital improvements. At loan origination, the borrower reserved (i) $1.31 million in a capital improvement reserve and (ii) $892,160 in a PIP reserve. Based on the “as is” appraised value of $53,000,000, as of October 1, 2017, the Cut-off Date LTV and Maturity Date LTV are equal to 68.3% and 63.6%, respectively. |
| (2) | For a full description of Escrows and Reserves, please refer to “Escrows and Reserves” below. |
The Loan.The Sheraton Hotel Arlington loan has an outstanding principal balance as of the Cut-off Date of approximately $36.2 million and is secured by a first mortgage lien on the borrower’s leasehold interest in a 311-room full service hotel located in Arlington, Texas. The loan has a five-year term and will amortize on a 30-year schedule. The previously existing debt was securitized in the RSO 2015-CRE3 transaction.
The Borrower. The borrowing entity for the Sheraton Hotel Arlington loan is UVH Arlington, LLC, a Delaware limited liability company and special purpose entity.
THE INFORMATION IN THIS STRUCTURAL AND COLLATERAL TERM SHEET IS NOT COMPLETE AND MAY BE AMENDED PRIOR TO THE TIME OF SALE. THIS TERM SHEET IS NOT AN OFFER TO SELL THESE SECURITIES AND IT IS NOT A SOLICITATION OF AN OFFER TO BUY THESE SECURITIES IN ANY JURISDICTION WHERE THE OFFER OR SALE IS NOT PERMITTED.
| 68 of 136 | |
| Structural and Collateral Term Sheet | JPMDB 2018-C8 | |
| Sheraton Hotel Arlington | ||
The Loan Sponsor.The loan sponsor and nonrecourse carve-out guarantor is Allan Gutierrez. Allan Gutierrez is the founder and CEO of Urbana Holdings, LLC, a developer and owner of hotel, office, residential and retail properties in the Midwest, Southeast, West and Southwest regions of the U.S. Urbana Holdings, LLC is an approved franchisee for the Starwood, Marriott and Hilton Brands and its current hotel portfolio includes more than 1,000 rooms across properties in Georgia, South Carolina, Texas and California. In addition to his role as CEO of Urbana Holdings, Allan Gutierrez serves as CEO of Urbana Varro, LLC, a real-estate capital raising vehicle, and Urbana Realty Advisors, LLC, a real estate property services company.
The Sheraton Hotel Arlington property was purchased by the sponsor for $36.0 million (approximately $115,756 per room) in October 2014. Since purchasing the Sheraton Hotel Arlington property, Allan Gutierrez has spent approximately $4.3 million ($13,840 per room) on capital improvements at the property.
The Property. The Sheraton Hotel Arlington property is a full service hotel located in the Entertainment District submarket of Arlington, Texas and is connected, via covered walkway, to the Arlington Convention Center. The Sheraton Hotel Arlington property is approximately 18 miles west of the Dallas central business district and approximately 16 miles east of Fort Worth’s central business district. The Sheraton Hotel Arlington property was built in 1985 as a Marriott branded hotel and was subsequently re-branded as a Wyndham hotel prior to 2009. In 2009, the property underwent a major renovation and re-branded again as a Sheraton. The hotel features three food and beverage outlets, a lounge, an outdoor pool, a fitness center, a business center, a sundry shop, a helipad and approximately 21,390 square feet of dedicated meeting space. The property features 311 guestrooms, comprised of 152 king rooms, 140 double/double rooms, 15 king suites and four double/double suites. All standard guestrooms and suites feature work desks and chairs, flat screen televisions, sofa chairs and mini refrigerators. The Sheraton Hotel Arlington property has 521 surface parking spaces, which results in a parking ratio of approximately 1.7 spaces per room.
The Sheraton Hotel Arlington property food and beverage outlets are the Parkside Grille, Parkside Lounge and Market Place. The Parkside Grille is an upscale lounge featuring tapas-style appetizers, signature cocktails and an array of tequilas and serves breakfast, lunch and dinner daily. The Parkside Lounge is located adjacent to the Parkside Grille on the first floor and is open from 4:00 PM to 12:00 AM daily and features the same menu as the Parkside Grille. The Market Place is a grab-and-go shop located adjacent to the lobby serving Starbucks coffee and an assortment of beverages and snacks. The Sheraton Hotel Arlington property’s meeting space is spread across 13 meeting rooms, the largest of which is 6,000 square feet. The meeting space is primarily located on the first and second floors of the property with 5,140 square feet of space located in two adjacent buildings. The Sheraton Hotel Arlington property is also connected to Arlington Convention Center. The Arlington Convention Center features approximately 48,600 square feet of column-free exhibit space, a 30,000 square foot ballroom and over 8,500 square feet of separate meeting rooms.
The Sheraton Hotel Arlington property guestrooms underwent a renovation in early 2016 and the meeting space underwent renovation in 2017. The guestroom renovation included the replacement of all soft goods, refinishing of all case goods, installation of new wall vinyl and mirrors in the bathrooms and new wall vinyl, carpeting and lighting in the corridors. The meeting space renovation consisted of installing new wall vinyl, lighting, carpeting and furniture. The total renovation cost totaled approximately $4.3 million ($13,840 per room). In addition, the borrower reserved approximately $2.2 million ($7,248 per room) at loan origination, of which (i) 892,610 was reserved for the remaining completion costs of an approximately $5.2 million Sheraton-required property improvement plan that began in 2016 and (ii) $1.31 million was reserved for a sponsor-elected capital improvement plan, which includes the renovation of the lobby, restaurants and lounge. The capital improvement plans are expected to be completed by February 2019.
The Sheraton Hotel Arlington property is located at the intersection between Interstate 30 and Highway 360. Interstate 30 is a major east-west interstate providing access to Dallas to the east and Fort Worth to the west, and Highway 360 provides access to Interstate 20 to the north. The Sheraton Hotel Arlington property is located in close proximity to a number of area demand drivers including AT&T Stadium (home to the Dallas Cowboys), Golden Life Park in Arlington (home to the Texas Rangers), Six Flags Over Texas and Six Flags Hurricane Harbor. Golden Life Park’s replacement, Globe Life Field, broke ground in September 2017 and will be home to the Texas Rangers starting in 2020. The planned $1.1 billion development is located less than one-half mile from the Sheraton Hotel Arlington property. Texas Live!, a planned $250.0 million entertainment district, is being developed adjacent to Globe Life Field. Texas Live! is expected to include 200,000 square feet of restaurants, retail and entertainment venues, including Rangers Republic, a 30,000 square foot dining and entertainment venue, Live! Arena, a multi-level, 35,000 square foot gathering area and a new Guy Fieri flagship restaurant. Included in the development is a $150.0 million flagship Live! by Loews hotel, which will feature 302 rooms and a 35,000 square foot event center. The hotel is slated to open in 2019 and according to the appraisal is expected to be 75% competitive with the Sheraton Hotel Arlington property. The appraisal estimates that the developments are expected to attract 3.0 million new visitors upon opening in 2018 and create 1,025 permanent jobs in the area.
THE INFORMATION IN THIS STRUCTURAL AND COLLATERAL TERM SHEET IS NOT COMPLETE AND MAY BE AMENDED PRIOR TO THE TIME OF SALE. THIS TERM SHEET IS NOT AN OFFER TO SELL THESE SECURITIES AND IT IS NOT A SOLICITATION OF AN OFFER TO BUY THESE SECURITIES IN ANY JURISDICTION WHERE THE OFFER OR SALE IS NOT PERMITTED.
| 69 of 136 | |
| Structural and Collateral Term Sheet | JPMDB 2018-C8 | |
| Sheraton Hotel Arlington | ||
The demand segmentation at the Sheraton Hotel Arlington property consists of 45.0% meeting and group, 30.0% commercial and 25.0% leisure. The primary competitive set for the Sheraton Hotel Arlington property consists of four hotels located in Arlington, ranging in size from 132 to 308 rooms and containing an aggregate of 787 rooms. In addition, the appraisal identified three hotels, which have recently opened, are currently under construction or are planned in the area, a 136-room Aloft, the 268-room Drury Plaza and the aforementioned Live! by Loews. The 136-room Aloft opened in 2018 and is expected to be 25% competitive with the Sheraton Hotel Arlington property. The 268-room Drury Plaza hotel is currently planned approximately two miles from the property and is expected to be 25% competitive with the property, according to the appraisal. The property’s competitive set and historical performance relative to its competitive set are detailed below:
Historical Occupancy, ADR, RevPAR(1)(2) | ||||||||||
| Competitive Set | Sheraton Hotel Arlington(3) | Penetration Factor | ||||||||
| Year | Occupancy | ADR | RevPAR | Occupancy | ADR | RevPAR | Occupancy | ADR | RevPAR | |
| 2015 | 69.0% | $133.05 | $91.85 | 75.2% | $133.80 | $100.63 | 109.0% | 100.6% | 109.6% | |
| 2016 | 73.8% | $131.20 | $96.82 | 73.4% | $137.57 | $100.92 | 99.5% | 104.9% | 104.2% | |
| 2017 | 66.9% | $133.29 | $89.19 | 72.6% | $144.18 | $104.69 | 108.5% | 108.2% | 117.4% | |
| TTM(4) | 66.1% | $132.71 | $87.77 | 71.7% | $143.26 | $102.66 | 108.5% | 107.9% | 117.0% | |
| (1) | The minor variances between the underwriting, appraisal and above table with respect to Occupancy, ADR and RevPAR at the Sheraton Hotel Arlington property are attributable to variances in reporting methodologies and/or timing differences. |
| (2) | Data provided by a third party travel research report. The competitive set contains the following properties: Courtyard Dallas Arlington Entertainment District, Hilton Arlington, Crowne Plaza Suites Arlington Ballpark Stadium and Hilton Garden Inn Dallas/Arlington. |
(3) Based on operating statements provided by the borrower, excluding the TTM. TTM data is provided by a third party travel research report.
| (4) | TTM represents the trailing 12-month period ending on February 28, 2018. |
Competitive Hotels Profile(1)(2)
| |||||||||
| 2016 Estimated Market Mix | 2016 Estimated Operating Statistics | ||||||||
| Property | Rooms | Year Opened | Meeting Space (SF) | Commercial | Meeting and Group | Leisure | Occupancy | ADR | RevPAR |
| Sheraton Hotel Arlington(3) | 311 | 1985 | 21,390 | 30% | 45% | 25% | 73.4% | $137.57 | $100.92 |
| Hilton Arlington | 308 | 1983 | 11,000 | 35% | 30% | 35% | 70% - 75% | $140 - 145 | $100 - $105 |
| Crowne Plaza Suites Arlington Ballpark Stadium | 200 | 1986 | 8,300 | 30% | 40% | 30% | 70% - 75% | $120 - $125 | $85 - $90 |
| Hilton Garden Inn Dallas/Arlington | 132 | 2009 | 4,630 | 45% | 25% | 30% | 75% - 80% | $130 - $135 | $100 - $105 |
| Courtyard Dallas Arlington Entertainment District | 147 | 1987 | 1,300 | 45% | 20% | 35% | 70% - 75% | $125 - $130 | $90 - $95 |
| Total(4) | 787 | ||||||||
| (1) | Based on the appraisal. |
| (2) | The appraisal only provided 2016 estimated market mix and 2016 estimated operating statistics for the competitive set. |
| (3) | The Sheraton Hotel Arlington 2016 Occupancy, ADR and RevPAR are based on operating statements provided by the borrower. |
| (4) | Excludes the Sheraton Hotel Arlington property. |
THE INFORMATION IN THIS STRUCTURAL AND COLLATERAL TERM SHEET IS NOT COMPLETE AND MAY BE AMENDED PRIOR TO THE TIME OF SALE. THIS TERM SHEET IS NOT AN OFFER TO SELL THESE SECURITIES AND IT IS NOT A SOLICITATION OF AN OFFER TO BUY THESE SECURITIES IN ANY JURISDICTION WHERE THE OFFER OR SALE IS NOT PERMITTED.
| 70 of 136 | |
| Structural and Collateral Term Sheet | JPMDB 2018-C8 | |
| Sheraton Hotel Arlington | ||
| Operating History and Underwritten Net Cash Flow | |||||||
| 2015 | 2016 | 2017 | Underwritten | Per Room(1) | % of Total Revenue(2) | ||
| Occupancy | 75.2% | 73.4% | 72.6% | 72.6% | |||
| ADR | $133.80 | $137.57 | $144.18 | $144.18 | |||
| RevPAR | $100.63 | $100.92 | $104.69 | $104.69 | |||
| Room Revenue | $ 11,423,579 | $11,456,095 | $11,883,696 | $11,883,696 | $38,211.24 | 68.5 | % |
| Food & Beverage Revenue | 5,052,816 | 4,675,060 | 5,042,572 | 5,042,572 | 16,214 | 29.0 | |
| Other Departmental Revenue | 430,808 | 401,142 | 433,575 | 433,575 | 1,394 | 2.5 | |
| Total Revenue | $ 16,907,203 | $16,532,297 | $17,359,843 | $17,359,843 | $55,819 | 100.0 | % |
| Room Expense | $2,509,717 | $2,520,710 | $2,471,583 | $2,471,583 | $7,947 | 20.8 | % |
| Food & Beverage Expense | 2,933,211 | 2,882,324 | 2,988,130 | 2,988,130 | 9,608 | 59.3 | |
| Other Departamental Expenses | 37,459 | 22,707 | 22,769 | 22,769 | 73 | 5.3 | |
| Departmental Expenses | $5,480,387 | $5,425,741 | $5,482,482 | $5,482,482 | $17,629 | 31.6 | % |
| Departmental Profit | $11,426,816 | $11,106,556 | $11,877,361 | $11,877,361 | $38,191 | 68.4 | % |
| Management Fees | $507,215 | $495,968 | $520,795 | $520,795 | $1,675 | 3.0 | % |
| Property Taxes | 564,768 | 650,879 | 657,195 | 640,471 | 2,059 | 3.7 | |
| Property Insurance | 123,644 | 135,039 | 139,611 | 137,165 | 441 | 0.8 | |
| Other Expenses | 4,966,941 | 4,883,562 | 5,053,141 | 5,181,912 | 16,662 | 29.8 | |
| Ground Rent | 305,772 | 303,455 | 305,226 | 310,989 | 1,000 | 1.8 | % |
| Total Other Expenses | $6,468,340 | $6,468,903 | $6,675,968 | $6,791,332 | $21,837 | 39.1 | % |
| Net Operating Income | $4,958,476 | $4,637,653 | $5,201,393 | $5,086,029 | $16,354 | 29.3 | % |
| FF&E | 676,288 | 661,292 | 694,394 | 694,394 | 2,233 | 4.0 | |
| Net Cash Flow | $4,282,188 | $3,976,361 | $4,506,999 | $4,391,636 | $14,121 | 25.3 | % |
| (1) | Per Room values are based on 311 guest rooms. |
| (2) | % of Total Revenue for Room Expense, Food & Beverage Expense and Other Departmental Expenses are based on their corresponding revenue line items. |
Property Management. The Sheraton Hotel Arlington property is managed by Urbana Varro Hospitality Management Company, LLC, a borrower affiliate.
Franchise Agreement.The Sheraton Hotel Arlington property is subject to 20 year franchise agreement with The Sheraton LLC, which commenced in October 2014 and expires in October 2034.
Escrows and Reserves. At origination, the borrower deposited $1,310,000 for a capital improvement reserve, $892,160 for a PIP reserve and $51,831 for a ground lease reserve.
Tax Escrows– On a monthly basis, the borrower is required to deposit 1/12 of the estimated annual real estate taxes, which currently equates to $48,723.
Insurance Escrows– If an acceptable blanket insurance policy is no longer in place, the borrower is required on a monthly basis to deposit 1/12 of the annual insurance premiums.
FF&E Reserves– The borrower is required to deposit monthly into an FF&E reserve the greatest of (i) 4.0% of the gross revenues for the property for the prior month, (ii) the then-current amount required by the property management agreement and (iii) the then-current amount required by any franchise agreement for approved capital expenditures and FF&E.
THE INFORMATION IN THIS STRUCTURAL AND COLLATERAL TERM SHEET IS NOT COMPLETE AND MAY BE AMENDED PRIOR TO THE TIME OF SALE. THIS TERM SHEET IS NOT AN OFFER TO SELL THESE SECURITIES AND IT IS NOT A SOLICITATION OF AN OFFER TO BUY THESE SECURITIES IN ANY JURISDICTION WHERE THE OFFER OR SALE IS NOT PERMITTED.
| 71 of 136 | |
| Structural and Collateral Term Sheet | JPMDB 2018-C8 | |
| Sheraton Hotel Arlington | ||
Lockbox / Cash Management.The Sheraton Hotel Arlington loan is structured with a hard lockbox and springing cash management. All credit card receipts are required to be deposited directly into a clearing account controlled by the lender. The borrower and property manager are required to deposit all other rent and payments into the clearing account within one business day of receipt. Unless a Trigger Period (as defined below) is ongoing, all amounts on deposit in the clearing account are required to be swept daily into the borrower’s operating account. During a Trigger Period, all amounts on deposit in the clearing account are required to be swept daily into a cash management account controlled by the lender and, provided no event of default exists, applied in accordance with the loan documents, with any excess funds to be held as additional security for the Sheraton Hotel Arlington loan during such Trigger Period.
A “Trigger Period” means a period that commences (i) upon an event of default and continues until a cure of such event of default has been accepted by the lender, (ii) upon the debt service coverage ratio (as calculated in the loan documents) falling below 1.25x as of the end of any calendar quarter and continues until the debt service coverage ratio (as calculated in the loan documents) has been at least 1.30x for two consecutive calendar quarters or (iii) upon a Rating Sweep Period (as defined below) and continues until a cure of such Rating Sweep Period.
A “Rating Sweep Period” means a period that commences upon the date that the borrower receives a Smith Travel Research Report for the hotel with a rating below “Upper Upscale” (the “Rating Sweep Start Date”) and will end upon (i) the borrower’s delivery to the lender Smith Travel Research Reports for three consecutive months after the Rating Sweep Start Date, with a rating of at least “Upper Upscale” and (ii) the borrower’s delivery of evidence satisfactory to the lender that after the Rating Sweep Start Date, (x) the ground lessor has acknowledged the borrower’s compliance with certain sections in the ground lease and (y) the borrower has resumed paying rent pursuant to certain sections of the ground lease.
Ground Lease.The Sheraton Hotel Arlington property is subject to a ground lease agreement with The City of Arlington, Texas. Inclusive of extension options, the term of the ground lease is 95 years which, if all extension options are exercised, will expire in 2078. The initial term of the lease commenced on October 1, 1983 with a term of 50 years, which is set to expire on September 30, 2033. The lessee has the option to renew the lease under the same terms and conditions, for three additional terms of 15 years each by giving the lessor at least one year’s advance written notice. The ground lease is structured so that in 2006, annual rent was equal to $250,000. Each year after 2006, rent is escalated by an amount that does not exceed the effective percentage in the consumer price index. The ground rent obligation, according to the sponsor’s 2018 budget, is equal to $310,989.
THE INFORMATION IN THIS STRUCTURAL AND COLLATERAL TERM SHEET IS NOT COMPLETE AND MAY BE AMENDED PRIOR TO THE TIME OF SALE. THIS TERM SHEET IS NOT AN OFFER TO SELL THESE SECURITIES AND IT IS NOT A SOLICITATION OF AN OFFER TO BUY THESE SECURITIES IN ANY JURISDICTION WHERE THE OFFER OR SALE IS NOT PERMITTED.
| 72 of 136 | |
| Structural and Collateral Term Sheet | JPMDB 2018-C8 |
[THIS PAGE INTENTIONALLY LEFT BLANK]
THE INFORMATION IN THIS STRUCTURAL AND COLLATERAL TERM SHEET IS NOT COMPLETE AND MAY BE AMENDED PRIOR TO THE TIME OF SALE. THIS TERM SHEET IS NOT AN OFFER TO SELL THESE SECURITIES AND IT IS NOT A SOLICITATION OF AN OFFER TO BUY THESE SECURITIES IN ANY JURISDICTION WHERE THE OFFER OR SALE IS NOT PERMITTED.
| 73 of 136 | |
| Structural and Collateral Term Sheet | JPMDB 2018-C8 | |
| Southland Shopping Center | ||

THE INFORMATION IN THIS STRUCTURAL AND COLLATERAL TERM SHEET IS NOT COMPLETE AND MAY BE AMENDED PRIOR TO THE TIME OF SALE. THIS TERM SHEET IS NOT AN OFFER TO SELL THESE SECURITIES AND IT IS NOT A SOLICITATION OF AN OFFER TO BUY THESE SECURITIES IN ANY JURISDICTION WHERE THE OFFER OR SALE IS NOT PERMITTED.
| 74 of 136 | |
| Structural and Collateral Term Sheet | JPMDB 2018-C8 | |
| Southland Shopping Center | ||
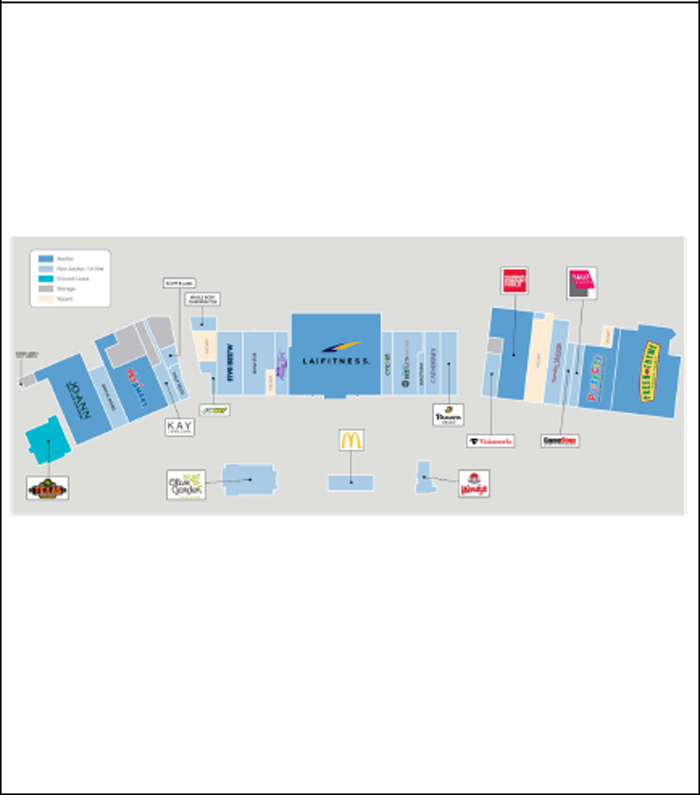
THE INFORMATION IN THIS STRUCTURAL AND COLLATERAL TERM SHEET IS NOT COMPLETE AND MAY BE AMENDED PRIOR TO THE TIME OF SALE. THIS TERM SHEET IS NOT AN OFFER TO SELL THESE SECURITIES AND IT IS NOT A SOLICITATION OF AN OFFER TO BUY THESE SECURITIES IN ANY JURISDICTION WHERE THE OFFER OR SALE IS NOT PERMITTED.
| 75 of 136 | |
| Structural and Collateral Term Sheet | JPMDB 2018-C8 | |
| Southland Shopping Center | ||

THE INFORMATION IN THIS STRUCTURAL AND COLLATERAL TERM SHEET IS NOT COMPLETE AND MAY BE AMENDED PRIOR TO THE TIME OF SALE. THIS TERM SHEET IS NOT AN OFFER TO SELL THESE SECURITIES AND IT IS NOT A SOLICITATION OF AN OFFER TO BUY THESE SECURITIES IN ANY JURISDICTION WHERE THE OFFER OR SALE IS NOT PERMITTED.
| 76 of 136 | |
| Structural and Collateral Term Sheet | JPMDB 2018-C8 | |
| Southland Shopping Center | ||
| Mortgage Loan Information | Property Information | |||
| Mortgage Loan Seller: | SMF VI | Single Asset / Portfolio: | Single Asset | |
| Original Principal Balance: | $34,000,000 | Title: | Fee | |
| Cut-off Date Principal Balance: | $34,000,000 | Property Type - Subtype: | Retail – Anchored | |
| % of Pool by IPB: | 4.8% | Net Rentable Area (SF): | 260,862 | |
| Loan Purpose: | Refinance | Location: | Pittsburgh, PA | |
| Borrower: | PZ Southland Limited Partnership | Year Built / Renovated: | 1955 / 2018 | |
| Sponsors: | David Pearson and Paul Pearson | Occupancy(1): | 94.0% | |
| Interest Rate: | 4.92500% | Occupancy Date: | 4/1/2018 | |
| Note Date: | 4/20/2018 | Number of Tenants: | 28 | |
| Maturity Date: | 5/6/2028 | 2015 NOI: | $2,699,545 | |
| Interest-only Period: | 48 months | 2016 NOI: | $2,901,894 | |
| Original Term: | 120 months | 2017 NOI(1): | $2,819,962 | |
| Original Amortization: | 360 months | TTM NOI: | N/A | |
| Amortization Type: | IO-Balloon | UW Economic Occupancy: | 95.9% | |
| Call Protection: | L(25),Def(89),O(6) | UW Revenues: | $5,148,868 | |
| Lockbox / Cash Management: | Springing / Springing | UW Expenses: | $1,652,585 | |
| Additional Debt: | N/A | UW NOI(1): | $3,496,283 | |
| Additional Debt Balance: | N/A | UW NCF: | $3,196,292 | |
| Additional Debt Type: | N/A | Appraised Value / Per SF: | $58,200,000 / $223 | |
| Appraisal Date: | 1/26/2018 | |||
| Escrows and Reserves(2) | Financial Information | |||||||||
| Initial | Monthly | Initial Cap | Cut-off Date Loan / SF: | $130 | ||||||
| Taxes: | $693,791 | $78,656 | N/A | Maturity Date Loan / SF: | $118 | |||||
| Insurance: | $56,824 | $4,735 | N/A | Cut-off Date LTV: | 58.4% | |||||
| Replacement Reserves: | $0 | $3,261 | N/A | Maturity Date LTV: | 52.8% | |||||
| TI/LC: | $0 | $16,304 | $587,000 | UW NCF DSCR: | 1.47x | |||||
| Other: | $1,267,434 | $0 | N/A | UW NOI Debt Yield: | 10.3% | |||||
| Sources and Uses | ||||||||||
| Sources | Proceeds | % of Total | Uses | Proceeds | % of Total | |||||
| Mortgage Loan | $34,000,000 | 99.2% | Payoff Existing Debt | $31,903,106 | 93.1% | |||||
| Sponsor Equity | 265,175 | 0.8 | Upfront Reserves | 2,018,049 | 5.9 | |||||
| Closing Costs | 344,019 | 1.0 | ||||||||
| Total Sources | $34,265,175 | 100.0% | Total Uses | $34,265,175 | 100.0% | |||||
| (1) | Occupancy and UW NOI include Fresh Thyme (11.0% of NRA; 11.1% of underwritten base rent) and Texas Roadhouse (2.7% of NRA; 2.7% of underwritten base rent) which have not yet opened for business. Both tenants have taken possession of their respective spaces and rental amounts through the tenants’ respective rent commencement dates have been escrowed at closing, along with unpaid tenant improvements. Fresh Thyme is expected to open for business in July 2018 and to begin paying rent in September 2018. Texas Roadhouse is expected to begin paying rent in July 2018 and to open for business in August 2018. Additionally, both spaces have been delivered by the borrower to the respective tenants and neither tenant has the right to terminate its lease in connection with the delivery of its space. |
| (2) | For a full description of Escrows and Reserves, please refer to “Escrows and Reserves” below. |
The Loan.The Southland Shopping Center loan is secured by a first lien on the borrower’s fee interest in an anchored retail property located in Pittsburgh, Pennsylvania. The loan has a 10-year term and, subsequent to a four-year interest-only period, will amortize on a 30-year schedule.
The Borrower. The borrowing entity for the Southland Shopping Center loan is PZ Southland Limited Partnership, a Delaware limited partnership and special purpose entity.
The Loan Sponsors. The loan sponsors and nonrecourse carve-out guarantors are David Pearson and Paul Pearson. David and Paul Pearson are the founders of Pearson Partners and Pearson Realty Services. Together, David Pearson and Paul Pearson have previously owned and sold over 3.65 million square feet of retail, office and redevelopment space and over 616 multifamily units.
THE INFORMATION IN THIS STRUCTURAL AND COLLATERAL TERM SHEET IS NOT COMPLETE AND MAY BE AMENDED PRIOR TO THE TIME OF SALE. THIS TERM SHEET IS NOT AN OFFER TO SELL THESE SECURITIES AND IT IS NOT A SOLICITATION OF AN OFFER TO BUY THESE SECURITIES IN ANY JURISDICTION WHERE THE OFFER OR SALE IS NOT PERMITTED.
| 77 of 136 | |
| Structural and Collateral Term Sheet | JPMDB 2018-C8 | |
| Southland Shopping Center | ||
The Property. The property is a 260,862 square foot anchored retail center located in Pittsburgh, Pennsylvania. The property was constructed in 1955 and renovated in 2018. Since 2016, the loan sponsorshave made improvements to tenancy of the property. For example, Quaker Steak vacated its premises at the property, which totaled 13,040 square feet. The loan sponsors subsequently demolished the former tenant’s premises to prepare for Texas Roadhouse’s new pad at the property, which is expected to total 7,163 square feet. Quaker Steak’s rent was $12.00 per square foot, while Texas Roadhouse is obligated to pay $14.66 per square foot under the new lease upon the commencement date. Additionally, the loan sponsors paid OfficeMax, a former tenant, approximately $1.5 million to vacate its premises, which were leased through January 2018, while simultaneously procuring Fresh Thyme via a 10-year lease. In connection with Fresh Thyme lease, the loan sponsors redeveloped the former Office Max building and added 4,709 square feet of additional leasable space to the property to accommodate Fresh Thyme’s specifications. Since 2005, the loan sponsors have spent approximately $12.9 million on capital improvements at the property, including approximately $6.7 million used for the construction of the LA Fitness building, $1.5 million for the buyout of the OfficeMax lease as referenced above and approximately $2.2 million invested in upgrades to the facades, parking area lighting, landscaping, roofs and paving. The property currently includes 1,451 parking spaces, resulting in a parking ratio of approximately 5.56 spaces per 1,000 square feet of net rentable area. Following the release of the theater parcel, the property will include 1,257 parking spaces, resulting in a parking ratio of approximately 4.82 spaces per 1,000 square feet of net rentable area.
As of April 1, 2018, the property was 94.0% occupied by 28 tenants and has had an average occupancy level of 81.3% over the past three years. The largest tenant, LA Fitness, leases 17.3% of the property’s net rentable area under a lease that expires in December 2023 and has occupied the space since 2008. LA Fitness is a gym chain with over 600 clubs across the United States and Canada. The company was formed in 1984 and is based in Irvine, California. LA Fitness has three, five-year renewal options and accounts for approximately 23.9% of the underwritten base rent at the property. The second largest tenant, Fresh Thyme, leases 11.0% of the property’s net rentable area under a lease which expires in July 2028 and is currently completing build out of its space. Fresh Thyme is expected to open for business in July 2018 and begin paying rent in September 2018. All rent through Fresh Thyme’s rent commencement date were escrowed at closing, along with unpaid tenant improvements. Additionally, the space has been delivered by the borrower to Fresh Thyme and Fresh Thyme does not have the right to terminate its lease related to the delivery of its space. Fresh Thyme is a super market chain that specializes in healthy and organic products. Fresh Thyme has four, five-year renewal options and accounts for approximately 11.1% of the underwritten base rent at the property. The third largest tenant, Jo-Ann Fabrics, leases 7.3% of the property’s net rentable area under a lease which expires in January 2023 and has occupied its space since 1993. Jo-Ann Fabrics is an American specialty retailer of crafts and fabrics based in Hudson, Ohio. Jo-Ann Fabrics has one, five-year renewal option and accounts for approximately 5.0% of the underwritten base rent at the property.
The property is located along US Route 51 (Clairton Boulevard), a state thoroughfare that connects to the Pittsburgh central business district. On average, approximately 26,229 vehicles per day drive past the property, according a market research report. Theproperty is located within the Greater Pittsburgh retail market and the South Pittsburgh-Route 51 submarket. The appraisal indicates that the Greater Pittsburgh retail market features approximately 153.2 million square feet of inventory with a vacancy rate of approximately 3.3% as of the fourth quarter of 2017. Additionally, the appraisal indicates that the South Pittsburgh-Route 51 retail submarket features approximately 13.0 million square feet of inventory with a vacancy rate of approximately 3.7% as of the fourth quarter of 2017. As of year-end 2017, the population within a one-, three- and five-mile radius was 6,602, 49,332 and 158,208, respectively, with estimated average household income of approximately $80,527, $77,355 and $69,830, respectively.
According to the appraisal, the market rent is $15.00, $18.00, $20.00 and $22.50 per square foot for junior anchor space, retail greater than 5,000 square foot space, retail less than 5,000 square foot space and fitness center space, respectively. Additionally, the appraisal for the property indicated annual market rent of $105,000 for the ground leased pad.
THE INFORMATION IN THIS STRUCTURAL AND COLLATERAL TERM SHEET IS NOT COMPLETE AND MAY BE AMENDED PRIOR TO THE TIME OF SALE. THIS TERM SHEET IS NOT AN OFFER TO SELL THESE SECURITIES AND IT IS NOT A SOLICITATION OF AN OFFER TO BUY THESE SECURITIES IN ANY JURISDICTION WHERE THE OFFER OR SALE IS NOT PERMITTED.
| 78 of 136 | |
| Structural and Collateral Term Sheet | JPMDB 2018-C8 | |
| Southland Shopping Center | ||
| Historical and Current Occupancy(1) | |||
| 2015 | 2016 | 2017 | Current(2) |
| 82.6% | 77.0% | 84.4% | 94.0% |
| (1) | Historical Occupancies are as of December 31 of each respective year. |
| (2) | Current Occupancy is as of April 1, 2018 and includes Fresh Thyme (28,709 square feet; 11.0% of NRA) and Texas Roadhouse (7,163 square feet; 2.7% of NRA) which have not yet opened for business. Both tenants have taken possession of their respective spaces, and rental amounts through the tenants’ respective rent commencement dates have been escrowed at closing, along with unpaid tenant improvements. Fresh Thyme is expected to open for business in July 2018 and to begin paying rent in September 2018. Texas Roadhouse is expected to begin paying rent in July 2018 and to open for business in August 2018. Additionally, both spaces have been delivered by the borrower to the respective tenants and neither tenant has the right to terminate its lease in connection with the delivery of its space. |
| Tenant Summary(1) | |||||||
| Tenant | Ratings(2) Moody’s/S&P/Fitch | Net Rentable Area (SF) | % of Total NRA | Base Rent PSF | % of Total Base Rent | Most Recent Sales PSF(3) | Lease Expiration Date |
| LA Fitness | NA / NA / NA | 45,000 | 17.3% | $20.49 | 23.9% | NAV | 12/31/2023 |
| Fresh Thyme(4) | NA / NA / NA | 28,709 | 11.0% | $15.00 | 11.1% | NAV | 7/31/2028 |
| Jo-Ann Fabrics | NA / B / NA | 18,960 | 7.3% | $10.18 | 5.0% | $106 | 1/31/2023 |
| Harbor Freight | NA / BB- / NA | 15,975 | 6.1% | $10.64 | 4.4% | NAV | 8/31/2019 |
| PetSmart | Caa1 / CCC+ / NA | 15,471 | 5.9% | $17.59 | 7.0% | NAV | 9/30/2022 |
| Party City | NA / NA / NA | 14,000 | 5.4% | $14.00 | 5.1% | $126 | 1/31/2024 |
| China Star | NA / NA / NA | 10,050 | 3.9% | $12.00 | 3.1% | NAV | 5/31/2027 |
| Altmeyer’s | NA / NA / NA | 9,925 | 3.8% | $11.00 | 2.8% | $95 | 7/31/2019 |
| Five Below | NA / NA / NA | 9,375 | 3.6% | $13.25 | 3.2% | NAV | 1/31/2022 |
| Olive Garden | Baa2 / BBB / BBB | 8,986 | 3.4% | $10.57 | 2.5% | $589 | 4/8/2025 |
| (1) | Based on the underwritten rent roll dated April 1, 2018. |
| (2) | Ratings provided are for the parent company of the entity listed in the “Tenant” field whether or not the parent company guarantees the lease. |
| (3) | Most Recent Sales PSF are as of September 30, 2017. |
| (4) | Fresh Thyme is currently building out its space. Fresh Thyme is expected to open for business in July 2018 and begin paying rent in September 2018. All rental amounts through Fresh Thyme’s rent commencement date were escrowed at closing, along with unpaid tenant improvements. Additionally, the space has been delivered by the borrower to Fresh Thyme and Fresh Thyme does not have the right to terminate its lease in connection with the delivery of its space. |
| Lease Rollover Schedule(1) | |||||||||
| ��Year | Number of Leases Expiring | Net Rentable Area Expiring | % of NRA Expiring | Base Rent Expiring | % of Base Rent Expiring | Cumulative Net Rentable Area Expiring | Cumulative % of NRA Expiring | Cumulative Base Rent Expiring | Cumulative % of Base Rent Expiring |
| Vacant | NAP | 15,652 | 6.0% | NAP | NAP | 15,652 | 6.0% | NAP | NAP |
| 2018 & MTM | 1 | 1,650 | 0.6 | $16,500 | 0.4% | 17,302 | 6.6% | $16,500 | 0.4% |
| 2019 | 3 | 33,900 | 13.0 | 375,149 | 9.7 | 51,202 | 19.6% | $391,649 | 10.1% |
| 2020 | 4 | 13,471 | 5.2 | 261,530 | 6.8 | 64,673 | 24.8% | $653,179 | 16.9% |
| 2021 | 4 | 15,263 | 5.9 | 303,046 | 7.8 | 79,936 | 30.6% | $956,225 | 24.7% |
| 2022 | 3 | 26,436 | 10.1 | 425,778 | 11.0 | 106,372 | 40.8% | $1,382,003 | 35.8% |
| 2023 | 4 | 72,960 | 28.0 | 1,250,020 | 32.4 | 179,332 | 68.7% | $2,632,023 | 68.1% |
| 2024 | 2 | 16,122 | 6.2 | 244,806 | 6.3 | 195,454 | 74.9% | $2,876,829 | 74.5% |
| 2025 | 3 | 14,986 | 5.7 | 254,000 | 6.6 | 210,440 | 80.7% | $3,130,829 | 81.0% |
| 2026 | 1 | 4,500 | 1.7 | 76,500 | 2.0 | 214,940 | 82.4% | $3,207,329 | 83.0% |
| 2027 | 1 | 10,050 | 3.9 | 120,600 | 3.1 | 224,990 | 86.2% | $3,327,929 | 86.1% |
| 2028 | 1 | 28,709 | 11.0 | 430,635 | 11.1 | 253,699 | 97.3% | $3,758,564 | 97.3% |
| 2029 & Beyond | 1 | 7,163 | 2.7 | 105,000 | 2.7 | 260,862 | 100.0% | $3,863,564 | 100.0% |
| Total | 28 | 260,862 | 100.0% | $3,863,564 | 100.0% | ||||
| (1) | Based on the underwritten rent roll dated April 1, 2018. |
THE INFORMATION IN THIS STRUCTURAL AND COLLATERAL TERM SHEET IS NOT COMPLETE AND MAY BE AMENDED PRIOR TO THE TIME OF SALE. THIS TERM SHEET IS NOT AN OFFER TO SELL THESE SECURITIES AND IT IS NOT A SOLICITATION OF AN OFFER TO BUY THESE SECURITIES IN ANY JURISDICTION WHERE THE OFFER OR SALE IS NOT PERMITTED.
| 79 of 136 | |
| Structural and Collateral Term Sheet | JPMDB 2018-C8 | |
| Southland Shopping Center | ||
| Operating History and Underwritten Net Cash Flow | ||||||
| 2015 | 2016 | 2017 | Underwritten | Per Square Foot | %(1) | |
| Rents in Place(2) | $3,021,798 | $3,214,612 | $3,129,034 | $3,863,564 | $14.81 | 72.0% |
| Vacant Income | 0 | 0 | 0 | 218,970 | 0.84 | 4.1 |
| Gross Potential Rent | $3,021,798 | $3,214,612 | $3,129,034 | $4,082,534 | $15.65 | 76.1% |
| Total Reimbursements | 1,331,806 | 1,147,124 | 1,104,054 | 1,194,771 | 4.58 | 22.3 |
| Percentage Rent | 127,759 | 122,386 | 28,757 | 0 | 0.00 | 0.0 |
| Other Income | 104,654 | 76,836 | 168,735 | 90,534 | 0.35 | 1.7 |
| Net Rental Income | $4,586,017 | $4,560,958 | $4,430,581 | $5,367,838 | $20.58 | 100.0% |
| (Vacancy/Credit Loss) | 0 | 0 | 0 | (218,970) | (0.84) | (4.1) |
| Effective Gross Income | $4,586,017 | $4,560,958 | $4,430,581 | $5,148,868 | $19.74 | 95.9% |
| Total Expenses | $1,886,472 | $1,659,064 | $1,610,619 | $1,652,585 | $6.34 | 32.1% |
| Net Operating Income | $2,699,545 | $2,901,894 | $2,819,962 | $3,496,283 | $13.40 | 67.9% |
| Total TI/LC, Capex/RR | 0 | 0 | 0 | 299,991 | 1.15 | 5.8 |
| Net Cash Flow | $2,699,545 | $2,901,894 | $2,819,962 | $3,196,292 | $12.25 | 62.1% |
| (1) | % column represents the percent of Net Rental Income for all revenue lines and represents the percent of Effective Gross Income for the remainder of fields. |
| (2) | Underwritten Rents in Place includes Fresh Thyme (11.0% of NRA; 11.1% of underwritten base rent) and Texas Roadhouse (2.7% of NRA; 2.7% of underwritten base rent) which have not yet opened for business. Both tenants have taken possession of their respective spaces and rental amounts through the tenants’ respective rent commencement dates have been escrowed at closing, along with unpaid tenant improvements. Fresh Thyme is expected to open for business in July 2018 and to begin paying rent in September 2018. Texas Roadhouse is expected to begin paying rent in July 2018 and to open for business in August 2018. Additionally, both spaces have been delivered by the borrower to the respective tenants and neither tenant has the right to terminate its lease in connection with the delivery of its space. |
Property Management. The property is managed by Pearson Realty Services, Inc., a New York corporation and an affiliate of the loan sponsor.
Escrows and Reserves. At origination, the borrower deposited approximately $1,046,899 for outstanding tenant improvements and leasing commissions, $693,791 for real estate taxes, approximately $196,160 for rent concessions, $56,824 for insurance and $24,375 for deferred maintenance.
Tax Escrows - On a monthly basis, the borrower is required to escrow 1/12 of the annual estimated tax payments, which currently equates to $78,656.
Insurance Escrows - On a monthly basis, the borrower is required to escrow 1/12 of the annual estimated insurance payments, which currently equates to $4,735.
Replacement Reserves- On a monthly basis, the borrower is required to escrow $3,261 (approximately $0.15 per square foot annually) for replacement reserves.
TI/LC Reserves- On a monthly basis, the borrower is required to escrow $16,304 (approximately $0.75 per square foot annually) for future tenant improvements and leasing commissions. The TI/LC Reserve is capped at $587,000. Notwithstanding the foregoing, if a Major Tenant Event (as defined below) commences, (A) (i) so long as the balance in the TI/LC Reserve is less than the $1,350,000, all excess cash flow will be transferred to the TI/LC Reserve until the balance in the TI/LC Reserve is equal to or greater than $1,350,000 or (ii) so long as the balance in the TI/LC Reserve is equal to or greater than the cap of $1,350,000, all excess cash flow will be transferred to an account designated by the borrower if no other Sweep Event is continuing and (B) upon the occurrence of a Major Tenant Event Cure (as defined below), (1) the TI/LC Reserve cap will be reduced to $587,000, (2) if any Sweep Event (as defined below) then exists, all amounts remaining in the TI/LC Reserve in excess of $587,000 will be transferred to an excess cash flow reserve as additional collateral for the Southland Shopping Center loan and (3) if no other Sweep Event then exists, all amounts remaining in the TI/LC Reserve in excess of $587,000 will be released to the Borrower.
THE INFORMATION IN THIS STRUCTURAL AND COLLATERAL TERM SHEET IS NOT COMPLETE AND MAY BE AMENDED PRIOR TO THE TIME OF SALE. THIS TERM SHEET IS NOT AN OFFER TO SELL THESE SECURITIES AND IT IS NOT A SOLICITATION OF AN OFFER TO BUY THESE SECURITIES IN ANY JURISDICTION WHERE THE OFFER OR SALE IS NOT PERMITTED.
| 80 of 136 | |
| Structural and Collateral Term Sheet | JPMDB 2018-C8 | |
| Southland Shopping Center | ||
Lockbox / Cash Management. The loan is structured with a springing lockbox and springing cash management. Following the commencement of a Sweep Event, the borrower and property manager are required to send tenant direction letters to tenants instructing them to deposit all rents and payments directly into a lockbox account controlled by the lender. During a Sweep Event, all funds in the lockbox account are required to be swept daily to a cash management account under the control of the lender and disbursed during the term of the loan in accordance with the loan documents and all excess cash flow after payment of debt service, required reserves and operating expenses is required to be held as additional collateral for the loan subject to the TI/LC Reserve cap above if such Sweep Event is not caused by a Major Tenant Event.
A “Sweep Event” means: (i) the occurrence of an event of default under the loan documents, (ii) the debt service coverage ratio as calculated in the loan documents based on a trailing 12-month period falling below 1.15x or (iii) the occurrence of a Major Tenant Event.
A “Major Tenant Event” means that LA Fitness or any other tenant occupying the space at the Southland Shopping Center property currently occupied by LA Fitness (the “Major Tenant”) (i) fails to extend the term of its lease for its space at the Southland Shopping Center property for at least three years and otherwise on terms and conditions satisfactory to the lender, on or before the date that is 12 months prior to its lease expiration date, (ii) defaults under its lease, (iii) “goes dark”, gives notice to vacate or vacates its leased space at the Southland Shopping Center property or (iv) becomes a debtor in any bankruptcy or other insolvency proceeding.
A “Major Tenant Event Cure” means either (a) a Major Tenant Re-Tenanting Event (as defined below) or (b) (1) with respect to clause (i) of the definition of Major Tenant Event, the lender receives satisfactory evidence that the Major Tenant has extended the terms of its lease on terms and conditions satisfactory to the lender, (2) with respect to clause (ii) of the definition of Major Tenant Event, the default of the Major Tenant has been cured and no other default of the Major Tenant exists under the lease for a period of two consecutive calendar quarters, (3) with respect to clause (iii) of the definition of Major Tenant Event, the Major Tenant has resumed its normal business operations for two consecutive calendar quarters or the Major Tenant has revoked, in writing, its intent to vacate the related space or (4) with respect to clause (iv) of the definition of Major Tenant Event, the Major Tenant bankruptcy or insolvency proceeding has been terminated and the related lease has been affirmed.
A “Major Tenant Re-Tenanting Event” means that the lender has received satisfactory evidence that at least 80.0% of the space previously occupied by the Major Tenant has been leased to one or more replacement tenants, each pursuant to a satisfactory replacement lease on terms and conditions acceptable to the lender, including but not limited to, having a term of at least five years, that each such tenant is in occupancy of its premises, open for business and is then paying full unabated rent, and that all tenant improvements and leasing commissions provided in each such replacement lease having been paid in full.
THE INFORMATION IN THIS STRUCTURAL AND COLLATERAL TERM SHEET IS NOT COMPLETE AND MAY BE AMENDED PRIOR TO THE TIME OF SALE. THIS TERM SHEET IS NOT AN OFFER TO SELL THESE SECURITIES AND IT IS NOT A SOLICITATION OF AN OFFER TO BUY THESE SECURITIES IN ANY JURISDICTION WHERE THE OFFER OR SALE IS NOT PERMITTED.
| 81 of 136 | |
| Structural and Collateral Term Sheet | JPMDB 2018-C8 | |
| The Metropolitan at Wilton Manors | ||
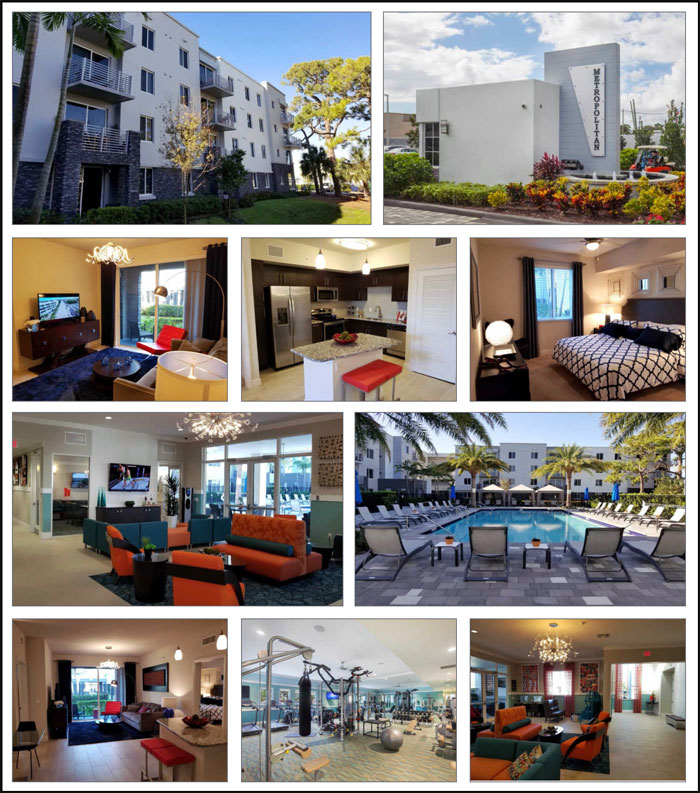
THE INFORMATION IN THIS STRUCTURAL AND COLLATERAL TERM SHEET IS NOT COMPLETE AND MAY BE AMENDED PRIOR TO THE TIME OF SALE. THIS TERM SHEET IS NOT AN OFFER TO SELL THESE SECURITIES AND IT IS NOT A SOLICITATION OF AN OFFER TO BUY THESE SECURITIES IN ANY JURISDICTION WHERE THE OFFER OR SALE IS NOT PERMITTED.
| 82 of 136 | |
| Structural and Collateral Term Sheet | JPMDB 2018-C8 | |
| The Metropolitan at Wilton Manors | ||
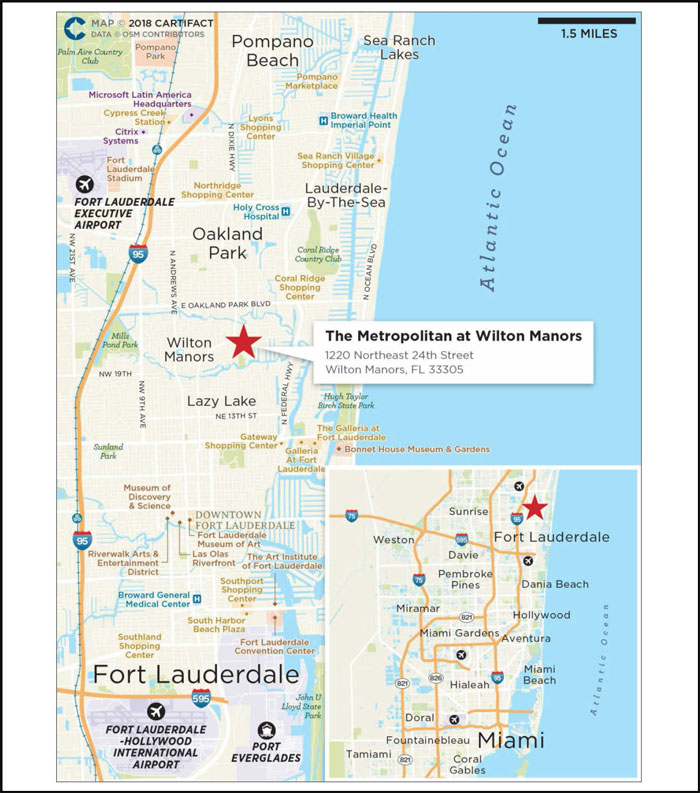
THE INFORMATION IN THIS STRUCTURAL AND COLLATERAL TERM SHEET IS NOT COMPLETE AND MAY BE AMENDED PRIOR TO THE TIME OF SALE. THIS TERM SHEET IS NOT AN OFFER TO SELL THESE SECURITIES AND IT IS NOT A SOLICITATION OF AN OFFER TO BUY THESE SECURITIES IN ANY JURISDICTION WHERE THE OFFER OR SALE IS NOT PERMITTED.
| 83 of 136 | |
| Structural and Collateral Term Sheet | JPMDB 2018-C8 | |
| The Metropolitan at Wilton Manors | ||
| Mortgage Loan Information | Property Information | |||
| Mortgage Loan Seller: | BSP | Single Asset / Portfolio: | Single Asset | |
| Original Principal Balance: | $33,500,000 | Title: | Fee | |
| Cut-off Date Principal Balance: | $33,500,000 | Property Type - Subtype: | Multifamily – Mid-Rise | |
| % of Pool by IPB: | 4.7% | Net Rentable Area (Units): | 179 | |
| Loan Purpose: | Refinance | Location: | Wilton Manors, FL | |
| Borrower: | Ascend Wilton Twenty Fourth | Year Built / Renovated: | 2016 / N/A | |
| Street LLC | Occupancy: | 96.1% | ||
| Sponsors(1): | Various | Occupancy Date: | 4/18/2018 | |
| Interest Rate: | 5.12000% | Number of Tenants: | N/A | |
| Note Date: | 5/1/2018 | 2015 NOI(3): | N/A | |
| Maturity Date: | 5/6/2028 | 2016 NOI(3): | N/A | |
| Interest-only Period: | 120 months | 2017 NOI: | $1,895,707 | |
| Original Term: | 120 months | TTM NOI (as of 3/2018): | $2,368,403 | |
| Original Amortization: | None | UW Economic Occupancy: | 95.0% | |
| Amortization Type: | Interest Only | UW Revenues: | $4,475,265 | |
| Call Protection(2): | L(25),Def(91),O(4) | UW Expenses: | $1,869,810 | |
| Lockbox / Cash Management: | Springing / Springing | UW NOI: | $2,605,455 | |
| Additional Debt: | N/A | UW NCF: | $2,569,655 | |
| Additional Debt Balance: | N/A | Appraised Value / Per Unit: | $54,000,000 / $301,676 | |
| Additional Debt Type: | N/A | Appraisal Date: | 3/15/2018 | |
| Escrows and Reserves(4) | Financial Information | |||||
| Initial | Monthly | Initial Cap | Cut-off Date Loan / Unit: | $187,151 | ||
| Taxes: | $477,167 | $68,167 | N/A | Maturity Date Loan / Unit: | $187,151 | |
| Insurance: | $18,000 | $9,000 | N/A | Cut-off Date LTV: | 62.0% | |
| Replacement Reserves: | $107,400 | Springing | N/A | Maturity Date LTV: | 62.0% | |
| TI/LC: | $0 | $0 | N/A | UW NCF DSCR: | 1.48x | |
| Other: | $1,563 | $0 | N/A | UW NOI Debt Yield: | 7.8% | |
| Sources and Uses | ||||||
| Sources | Proceeds | % of Total | Uses | Proceeds | % of Total | |
| Mortgage Loan | $33,500,000 | 100.0% | Payoff Existing Debt | $24,798,567 | 74.0% | |
| Upfront Reserves | 604,129 | 1.8 | ||||
| Closing Costs | 327,872 | 1.0 | ||||
| Return of Equity | 7,769,432 | 23.2 | ||||
| Total Sources | $33,500,000 | 100.0% | Total Uses | $33,500,000 | 100.0% | |
| (1) | The sponsors under The Metropolitan at Wilton Manors loan are Richard Marti Finkelstein, Dean Jeremy Borg and Michael David Wohl. |
| (2) | Beginning on the payment date in June 2023, and on every monthly payment date occurring in June and December thereafter, the borrower is permitted to voluntarily prepay the loan in an amount of $333,333 without payment of any prepayment premium or penalty. |
| (3) | The Metropolitan at Wilton Manors property was built in 2016. As such, historical occupancy and historical NOI prior to 2017 are not available. |
| (4) | For a full description of Escrows and Reserves please refer to “Escrows and Reserves” below. |
The Loan.The Metropolitan at Wilton Manors loan has an outstanding principal balance as of the Cut-off Date of $33.5 million, and is secured by a first mortgage lien on the borrower’s fee interest in a 179-unit, Class A mid-rise multifamily community located in Wilton Manors, Florida. The loan is interest-only for the entire 10-year term.
The Borrower. The borrowing entity for The Metropolitan at Wilton Manors loan is Ascend Wilton Twenty Fourth Street LLC, a bankruptcy-remote Delaware limited liability company and recycled special purpose entity.
THE INFORMATION IN THIS STRUCTURAL AND COLLATERAL TERM SHEET IS NOT COMPLETE AND MAY BE AMENDED PRIOR TO THE TIME OF SALE. THIS TERM SHEET IS NOT AN OFFER TO SELL THESE SECURITIES AND IT IS NOT A SOLICITATION OF AN OFFER TO BUY THESE SECURITIES IN ANY JURISDICTION WHERE THE OFFER OR SALE IS NOT PERMITTED.
| 84 of 136 | |
| Structural and Collateral Term Sheet | JPMDB 2018-C8 | |
| The Metropolitan at Wilton Manors | ||
The Loan Sponsors.The loan sponsors and nonrecourse carve-out guarantors are Richard Marti Finkelstein, Dean Jeremy Borg and Michael David Wohl. The loan sponsors are the founders and principals of Ascend Properties, a Boca Raton based real estate development firm. Including The Metropolitan at Wilton Manors property, Ascend Properties has completed five projects comprising over 1,000 units in central and south Florida. Prior to forming Ascend Properties, Richard Marti Finkelstein and Dean Jeremy Borg oversaw Kenco Communities, a developer of single-family residential properties. Since its inception in 1992, Kenco Communities has delivered over 3,000 homes with an aggregate value in excess of $2.5 billion. Michael David Wohl, co-founded Pinnacle Housing in 1997, prior to his time at Ascend Properties. Pinnacle Housing is a leading developer in affordable housing in the Southeastern United States having delivered over 6,000 units in over 40 complexes.
The Property. The Metropolitan at Wilton Manors property is a 179-unit, Class A, mid-rise multifamily community recently constructed in 2016 that is situated on approximately 6.8 acres in Wilton Manors, Florida. The property was developed in October 2016 at a total cost of $36.75 million (approximately $205,307 per unit). Lease up velocity at the property has remained strong. Prior to opening, approximately 62.6% of the property’s units were pre-leased with an average of approximately seven units per month leased through July 2017. As of April 18, 2018, the property was 96.1% occupied.
The Metropolitan at Wilton Manors property is comprised of three, four-story residential buildings, a single-story clubhouse and a security guardhouse at the perimeter of the property. Available floor plans at the property include studio, one bedroom-one bath, two bedroom-two bath and three bedroom-two bath units, with an average unit size of approximately 1,012 square feet and an average in-place rent of approximately $1,980. All units feature walk-in closets, terraces or balconies, granite countertops, designer dark wood cabinetry and porcelain tile flooring. Each unit is outfitted with stainless steel, energy efficient appliances, including a range/stove, dishwasher, refrigerator, microwave and a washer and dryer set. Additionally, fiber optic wiring is provided in each unit for faster internet and television services.
The Metropolitan at Wilton Manors property offers many amenities and a wide range of community activities. All residents have access to a resort-style pool and hot tub with private cabanas, a fitness studio with complimentary classes and training, a yoga studio and massage room, a business center with a conference room, climate controlled residential storage units, an outdoor kitchen and BBQ area, a car wash area, a dog park and an electric car charging station. Additionally, an on-site management and security team are available on the premises. The property consists of 286 parking spaces, resulting in a parking ratio of approximately 1.6 spaces per unit. Parking is available for residents via five, single-story private parking garages.
| Historical and Current Occupancy(1) | |||
| 2015 | 2016(2) | 2017(2) | Current(3) |
| N/A | 63.1% | 96.1% | 96.1% |
| (1) | 2015 Historical occupancy is unavailable as the property was constructed in October 2016. |
| (2) | 2016 and 2017 historical occupancies are as of December 31 of each respective year. |
| (3) | Current Occupancy is as of April 18, 2018. |
| Unit Mix(1) | |||||||
| Unit Type | # of Units | % of Total | Occupied Units | Occupancy(2) | Average Unit Size (SF)(2) | Average Monthly In-Place Rents(2) | Average Market Rent Per Unit(2)(3) |
| Studio | 23 | 12.8% | 23 | 100.0% | 627 | $1,524 | $1,710 |
| 1 BR / 1 BA | 44 | 24.6 | 43 | 97.7% | 804 | $1,738 | $1,975 |
| 2 BR / 2 BA | 96 | 53.6 | 90 | 93.8% | 1,141 | $2,115 | $2,261 |
| 3 BR / 2 BA | 16 | 8.9 | 16 | 100.0% | 1,357 | $2,520 | $2,639 |
| Total / Wtd. Avg. | 179 | 100.0% | 172 | 96.1% | 1,012 | $1,980 | $2,120 |
| (1) | Based on the underwritten rent roll dated April 18, 2018. |
| (2) | Occupancy, Average Unit Size (SF), Average Monthly In-Place Rents and Average Market Rent per Unit represent a weighted average of the various unit type layouts. |
| (3) | Based on the appraisal. Average Market Rent Per Unit represents the median comparable market rents indicated by the appraisal. |
THE INFORMATION IN THIS STRUCTURAL AND COLLATERAL TERM SHEET IS NOT COMPLETE AND MAY BE AMENDED PRIOR TO THE TIME OF SALE. THIS TERM SHEET IS NOT AN OFFER TO SELL THESE SECURITIES AND IT IS NOT A SOLICITATION OF AN OFFER TO BUY THESE SECURITIES IN ANY JURISDICTION WHERE THE OFFER OR SALE IS NOT PERMITTED.
| 85 of 136 | |
| Structural and Collateral Term Sheet | JPMDB 2018-C8 | |
| The Metropolitan at Wilton Manors | ||
The Metropolitan at Wilton Manors property is located in Wilton Manors, Florida, approximately four miles north of the Fort Lauderdale central business district and two miles west of the Atlantic Ocean. Wilton Manors is known as the “Island City” and is bordered by the North Fork of the Middle River in South Florida and the City of Oakland to the south. The property benefits from high accessibility to the greater Miami-Fort Lauderdale metro area, with US Highway 1 located approximately one mile to the east and Interstate 95 located approximately three miles to the west. An art gallery, gym, local theater, salon and antiques shop are all located in close proximity to the property. Adjacent to the property is Colahatchee Park, an 8.5 acre community park with walking trails, basketball and volleyball courts, a picnic pavilion, boat ramp infrastructure for docking and kayak access to the Fort Lauderdale Intracoastal. Additionally, two blocks southeast of the property is Wilton Drive, known locally as “The Drive”. The Drive serves as Wilton Manors’ primary dining and entertainment area with over 50 restaurants, clubs, galleries and specialty shops.
Located within the Miami-Fort Lauderdale-Pompano Beach metropolitan statistical area (“Miami MSA”), the property is approximately 32 miles from the Miami central business district. The Miami MSA is comprised of the three most populous counties in Florida: Broward, Palm Beach and Miami-Dade. Florida’s economy is expected to continue to outpace the rest of the country for the next three years, pushing the state toward an approximate $1 trillion economy by 2018, with employment in the Miami MSA rising by 5.5% from 2007 to 2016. Major employers within Broward County include AutoNation, Nova Southeastern University, American Express, The Answer Group and BrandMart USA. Due to Miami and South Florida’s proximity to Latin America, more than 1,100 multinational corporations including American Airlines, Exxon, Microsoft, Oracle, Sony and Wal-Mart have headquarters in the area. These corporations collectively generate approximately $221 billion in revenue per year from their operations.
Tourism represents one of the top industries within the Miami MSA, with the economic impact of tourism in the area estimated to be $25 billion when considering direct and indirect tourist expenditures. The Port of Miami, known as the “Cruise Capital of the World” broke a world record by welcoming approximately 5.1 million passengers to the port and is currently the busiest port based on both passenger traffic and number of cruise lines. Additional demand drivers within the Miami MSA include the Broward Health Medical Center, a 648-bed medical and surgical hospital that has over 3,000 employees and is a leader in cancer, cardiac and orthopedic services, the Fort Lauderdale-Hollywood International Airport (“FLL”), one of the fastest-growing airports in the US, the Galleria Mall, a 1.3 million square foot enclosed shopping mall and the Seminole Hard Rock Hotel & Casino, a full-service hotel with 140,000 square feet of casino space.
According to a third party market research report, the Metropolitan at Wilton Manors property is located within the Fort Lauderdale submarket of the Fort Lauderdale-Pompano Beach-Deerfield Beach Metro Apartment market. As of the fourth quarter of 2017, the Fort Lauderdale submarket had an inventory of 37,830 units, with an average vacancy of 5.7% and effective rent of $1,862. Occupancy levels in the submarket have averaged approximately 94.9% since 2012, with an average rental rate from 2012 to 2017 of approximately $1,577. According to the appraisal, the 2017 population within a half-, one-, and three-mile radius of the property was 5,477, 19,359 and 148,980, respectively. The 2017 average household income within a half-, one-, and three-mile radius was $84,645, $77,219 and $84,002, respectively.
| Operating History and Underwritten Net Cash Flow(1) | |||||
| 2017 | TTM(2) | Underwritten | Per Unit | %(3) | |
| Rents in Place(4) | $4,421,721 | $4,394,303 | $4,262,856 | $23,815 | 100.0% |
| Vacant Income | 0 | 0 | 0 | 0 | 0.0 |
| Gross Potential Rent | $4,421,721 | $4,394,303 | $4,262,856 | $23,815 | 100.0% |
| Vacancy | (682,162) | (371,295) | (213,143) | (1,191) | (5.0) |
| Concessions/Bad Debt | (305,437) | (255,501) | (47,148) | (263) | (1.1) |
| Other Income(5) | 472,853 | 520,776 | 472,700 | 2,641 | 11.1 |
| Effective Gross Income | $3,906,974 | $4,288,283 | $4,475,265 | $25,001 | 105.0% |
| Total Expenses | $2,011,267 | $1,919,880 | $1,869,810 | $10,446 | 41.8% |
| Net Operating Income | $1,895,707 | $2,368,403 | $2,605,455 | $14,556 | 58.2% |
| Total TI/LC, CapEx/RR | 35,800 | 35,800 | 35,800 | 200 | 0.8 |
| Net Cash Flow | $1,859,907 | $2,332,603 | $2,569,655 | $14,356 | 57.4% |
| (1) | Historical financials prior to 2017 are unavailable as The Metropolitan at Wilton Manors Property was constructed in October 2016. |
| (2) | TTM column represents the trailing 12-month period ending on March 30, 2018. |
| (3) | % column represents percent of Gross Potential Rent for all revenue lines and represents percent of Effective Gross Income for the remainder of fields. |
| (4) | Underwritten Rents in Place as of the rent roll dated April 18, 2018. |
| (5) | The majority of Other Income consists of administrative fees, late fee income, parking income, utilities income and termination fees. |
THE INFORMATION IN THIS STRUCTURAL AND COLLATERAL TERM SHEET IS NOT COMPLETE AND MAY BE AMENDED PRIOR TO THE TIME OF SALE. THIS TERM SHEET IS NOT AN OFFER TO SELL THESE SECURITIES AND IT IS NOT A SOLICITATION OF AN OFFER TO BUY THESE SECURITIES IN ANY JURISDICTION WHERE THE OFFER OR SALE IS NOT PERMITTED.
| 86 of 136 | |
| Structural and Collateral Term Sheet | JPMDB 2018-C8 | |
| The Metropolitan at Wilton Manors | ||
Property Management. The property is managed by Ascend Property Management, LLC, a Florida limited liability company, and an affiliate of the sponsors.
Escrows and Reserves.At loan origination, the borrower deposited $477,167 for taxes, $107,400 for replacement reserves (representing approximately three years of ongoing deposits), $18,000 for insurance reserves and $1,563 into the required repairs reserve.
Tax Escrows– On a monthly basis, the borrower is required to deposit 1/12 of the annual estimated real estate taxes into the tax reserve account, which currently equates to $68,167.
Insurance Escrows– On a monthly basis, the borrower is required to deposit 1/12 of the annual estimated insurance premiums, into the insurance reserve account, which currently equates to $9,000.
Replacement Reserves –On a monthly basis, beginning on the payment date in June 2021, the borrower is required to deposit $2,983 (approximately $200 per unit annually) into the replacement reserve account in connection with anticipated routine capital improvements at The Metropolitan at Wilton Manors property.
Credit Support Reserve –Upon the debt service coverage ratio (as calculated in the loan documents) at the property falling below 1.25x, the borrower is permitted to deposit the Credit Support (as defined below) amount into the reserve in order to prevent a Cash Sweep Period (as defined below).
Lockbox / Cash Management. The loan is structured with a springing lockbox and springing cash management. During the continuance of a Cash Sweep Period, the borrower will, or cause the manager to, immediately deposit all revenue derived into the lockbox account. Such funds will be swept each business day into a cash management account controlled by the lender and disbursed in accordance with the loan documents. To the extent there is a Cash Sweep Period continuing, all excess cash flow after payment of debt service, required reserves and operating expenses is required to be held as additional collateral for the loan. The lender has been granted a security interest in the cash management account. Upon occurrence of a Cash Sweep Period Cure (as defined below), the lockbox and cash management accounts (as well as any related accounts) are required to be closed at the request of the borrower and amounts held in such accounts are required to be disbursed to the borrower.
A “Cash Sweep Period” means a period commencing upon the earliest of (i) an event of default, and (ii)debt service coverage ratio (as calculated in the loan documents) being less than 1.25x, provided, however that such Cash Sweep Period will not commence until the date that is three business days after the Credit Support Notice Date (as defined below) and will not occur if the borrower provides Credit Support within such time frame.
“Credit Support” means, upon the occurrence of a Cash Sweep Period commencing solely due to thedebt service coverage ratio (as calculated in the loan documents) being less than 1.25x, a deposit into the Credit Support reserve account in the amount of $103,750 or a letter of credit in the same amount pledged to the Credit Support reserve account.
A “Credit Support Notice Date” is the notice date that the borrower intends to make a Credit Support deposit; the notice will be delivered no later than the day that financial statements are required to be delivered for the applicable testing period.
A “Cash Sweep Period Cure” means, with regard to any Cash Sweep Period commenced in connection with clause (i) above, the cure (if applicable) of such event of default, and with regard to any Cash Sweep Period commenced in connection with clause (ii) above, the earlier to occur of (x) the date upon which the borrower provides Credit Support or (y) the date the DSCR is equal to or greater than 1.30x for four consecutive calendar months. Notwithstanding the foregoing, a Cash Sweep Period will not be deemed to expire in the event that a Cash Sweep Period then exists for any other reason.
THE INFORMATION IN THIS STRUCTURAL AND COLLATERAL TERM SHEET IS NOT COMPLETE AND MAY BE AMENDED PRIOR TO THE TIME OF SALE. THIS TERM SHEET IS NOT AN OFFER TO SELL THESE SECURITIES AND IT IS NOT A SOLICITATION OF AN OFFER TO BUY THESE SECURITIES IN ANY JURISDICTION WHERE THE OFFER OR SALE IS NOT PERMITTED.
| 87 of 136 | |
| Structural and Collateral Term Sheet | JPMDB 2018-C8 | |
| DreamWorks Campus | ||

THE INFORMATION IN THIS STRUCTURAL AND COLLATERAL TERM SHEET IS NOT COMPLETE AND MAY BE AMENDED PRIOR TO THE TIME OF SALE. THIS TERM SHEET IS NOT AN OFFER TO SELL THESE SECURITIES AND IT IS NOT A SOLICITATION OF AN OFFER TO BUY THESE SECURITIES IN ANY JURISDICTION WHERE THE OFFER OR SALE IS NOT PERMITTED.
| 88 of 136 | |
| Structural and Collateral Term Sheet | JPMDB 2018-C8 | |
| DreamWorks Campus | ||
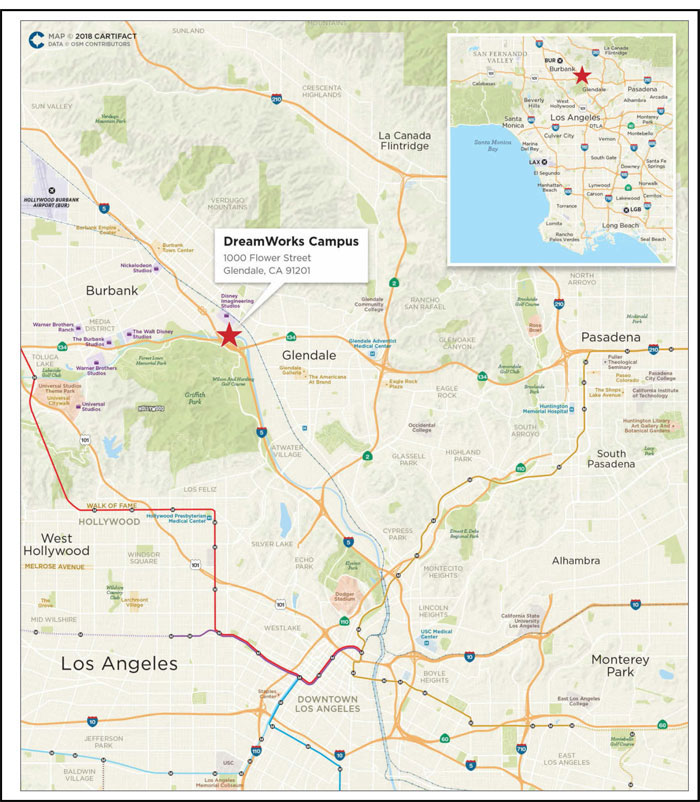
THE INFORMATION IN THIS STRUCTURAL AND COLLATERAL TERM SHEET IS NOT COMPLETE AND MAY BE AMENDED PRIOR TO THE TIME OF SALE. THIS TERM SHEET IS NOT AN OFFER TO SELL THESE SECURITIES AND IT IS NOT A SOLICITATION OF AN OFFER TO BUY THESE SECURITIES IN ANY JURISDICTION WHERE THE OFFER OR SALE IS NOT PERMITTED.
| 89 of 136 | |
| Structural and Collateral Term Sheet | JPMDB 2018-C8 | |
| DreamWorks Campus | ||
| Mortgage Loan Information | Property Information | |||
| Mortgage Loan Seller(1): | GACC | Single Asset / Portfolio: | Single Asset | |
| Credit Assessment | Title: | Fee | ||
| (S&P/Fitch/KBRA)(2): | AA/BBB-/BBB- | Property Type - Subtype: | Office – Suburban | |
| Original Principal Balance(3): | $30,000,000 | Net Rentable Area (SF): | 497,404 | |
| Cut-off Date Principal Balance(3): | $30,000,000 | Location: | Glendale, CA | |
| % of Pool by IPB: | 4.2% | Year Built / Renovated: | 1997 / 2010 | |
| Loan Purpose: | Acquisition | Occupancy: | 100.0% | |
| Borrower: | La Hana OW, LLC | Occupancy Date: | 6/6/2018 | |
| Sponsor(4): | Hana Asset Management Co., LTD | Number of Tenants: | 1 | |
| Interest Rate(5): | 2.297826% | 2015 NOI(7): | N/A | |
| Note Date: | 11/20/2017 | 2016 NOI: | $13,177,512 | |
| Anticipated Repayment Date(5): | 12/6/2022 | 2017 NOI: | N/A | |
| Final Maturity Date(5): | 12/6/2024 | TTM NOI (as of 9/2017): | $13,333,362 | |
| Interest-only Period: | 60 months | UW Economic Occupancy: | 98.0% | |
| Original Term(5): | 60 months | UW Revenues: | $13,855,836 | |
| Original Amortization: | None | UW Expenses: | $239,684 | |
| Amortization Type: | ARD-Interest Only | UW NOI: | $13,616,152 | |
| Call Protection(6): | L(30),Def(25),O(5) | UW NCF: | $13,516,671 | |
| Lockbox / Cash Management: | Hard / In Place | Appraised Value / Per SF(8): | $297,000,000 / $597 | |
| Additional Debt: | Yes | Appraisal Date: | 8/3/2017 | |
| Additional Debt Balance: | $62,000,000 / $108,000,000 | |||
| Additional Debt Type: | Pari Passu / Subordinate Debt | |||
| Escrows and Reserves(9) | Financial Information(3) | ||||||
| Initial | Monthly | Initial Cap | A-Notes | Whole Loan | |||
| Taxes: | $0 | Springing | N/A | Cut-off Date Loan / SF: | $185 | $402 | |
| Insurance: | $53,091 | $8,849 | N/A | Maturity Date Loan / SF(5): | $185 | $402 | |
| Replacement Reserves: | $0 | Springing | N/A | Cut-off Date LTV: | 31.0% | 67.3% | |
| TI/LC: | $0 | Springing | N/A | Maturity Date LTV(5): | 31.0% | 67.3% | |
| Other: | $562,887 | $0 | N/A | UW NCF DSCR: | 6.31x | 2.07x | |
| UW NOI Debt Yield: | 14.8% | 6.8% | |||||
| Sources and Uses | ||||||
| Sources | Proceeds | % of Total | Uses | Proceeds | % of Total | |
| Mortgage Loan(3) | $92,000,000 | 31.0% | Purchase Price(10) | $289,585,418 | 97.7% | |
| B-Note(3) | 108,000,000 | 36.4% | Closing Costs | 6,339,240 | 2.1% | |
| Sponsor Equity | 96,540,637 | 32.6% | Upfront Reserves | 615,979 | 0.2% | |
| Total Sources | $296,540,637 | 100.0% | Total Uses | $296,540,637 | 100.0% | |
| (1) | The DreamWorks Campus Whole Loan (as defined in “The Loan” below) was originated by Cantor Commercial Real Estate Lending, L.P (“CCRE”) on November 20, 2017. Subsequent to the origination date, notes representing $30.0 million of the DreamWorks Campus Whole Loan were transferred to Deutsche Bank AG, acting through its New York Branch (“DBNY”), an affiliate of GACC, which has re-underwritten such mortgage loan in accordance with the procedures described under “Transaction Parties—The Sponsors and Mortgage Loan Sellers—German American Capital Corporation—DBNY’s Underwriting Guidelines and Processes”in the Preliminary Prospectus. |
| (2) | S&P, Fitch and KBRA have confirmed that the DreamWorks Campus loan has, in the context of its inclusion in the mortgage pool, credit characteristics consistent with an investment grade obligation. |
| (3) | The DreamWorks Campus loan is part of a whole loan evidenced by five seniorpari passu promissory notes with an aggregate original principal balance of $92.0 million (“DreamWorks Campus A-Notes”) and one subordinate companion note with an original principal balance of $108.0 million (“DreamWorks Campus B-Note”). The information presented under the column titled “A-Notes” in the chart titled “Financial Information” above reflects the Cut-off Date balance of the DreamWorks Campus A-Notes, but excludes the DreamWorks Campus B-Note. The information presented under the column titled “Whole Loan” in the chart titled “Financial Information” above reflects the Cut-off Date balance of the DreamWorks Campus A-Notes and DreamWorks Campus B-Note evidencing the DreamWorks Campus Whole Loan. |
| (4) | There is no nonrecourse carve-out guarantor or environmental indemnitor for the DreamWorks Campus Whole Loan. |
| (5) | The DreamWorks Campus Whole Loan has an anticipated repayment date of December 6, 2022 (the “Anticipated Repayment Date” or “ARD”) and a final maturity date of December 6, 2024. From and after the Anticipated Repayment Date, (a) the DreamWorks Campus Whole Loan accrues interest at a fixed rate that is equal to the greater of (i) 2.297826% plus 3.00000% or 4.00000% plus 3.00000% as applicable, for the A-Notes and B-Note, respectively, and (ii) the then current five-year swap yield plus 3.00000% and (b) on each payment date after the ARD, the borrower is required to make principal payments in an amount equal to excess cash flow. The Maturity Date Loan / SF and Maturity Date LTV are based on the maturity balance as of the ARD. |
| (6) | The lockout period for defeasance will be at least 30 payment dates beginning with and including the first payment date of January 6, 2018. Defeasance of the full DreamWorks Campus Whole Loan is permitted at any time after the earlier to occur of (i) January 6, 2021 and (ii) two years after the closing date of the final securitization that holds a promissory note evidencing all or a portion of the DreamWorks Campus Whole Loan (the “REMIC Prohibition Period”) based on the expected JPMDB 2018-C8 securitization closing in June 2018. The actual lockout period may be longer. |
THE INFORMATION IN THIS STRUCTURAL AND COLLATERAL TERM SHEET IS NOT COMPLETE AND MAY BE AMENDED PRIOR TO THE TIME OF SALE. THIS TERM SHEET IS NOT AN OFFER TO SELL THESE SECURITIES AND IT IS NOT A SOLICITATION OF AN OFFER TO BUY THESE SECURITIES IN ANY JURISDICTION WHERE THE OFFER OR SALE IS NOT PERMITTED.
| 90 of 136 | |
| Structural and Collateral Term Sheet | JPMDB 2018-C8 | |
| DreamWorks Campus | ||
| (7) | Historical financial information prior to 2016 is not available as the DreamWorks Campus Property (as defined below) was owned by DreamWorks Animation SKG, Inc. prior to executing a sale-leaseback transaction in 2015. |
| (8) | The “Hypothetical Go-Dark” appraised value is $239,200,000. Based on the “Hypothetical Go-Dark” appraised value, the Cut-off Date LTV and Maturity Date LTV for the DreamWorks Campus A-Notes are 38.5%, and the Cut-off Date LTV and Maturity Date LTV for the DreamWorks Campus Whole Loan are 83.6%. |
| (9) | For a full description of Escrows and Reserves, please refer to “Escrows and Reserves” below. |
| (10) | The DreamWorks Campus Property purchase price of $297,000,000 includes seller credit of $7,414,582 given to the DreamWorks Campus Borrower at loan origination. |
The Loan.The DreamWorks Campus loan is secured by a first mortgage lien on the borrower’s fee interest in a 497,404 square foot, creative office campus in Glendale, California (the “DreamWorks Campus Property”), which is 100.0% occupied and globally headquartered by DreamWorks Animation SKG, Inc. (“DreamWorks”) through February 2035. The loan is part of a whole loan that has an outstanding principal balance as of the Cut-off Date of $200.0 million (the “DreamWorks Campus Whole Loan”) and is comprised of five seniorpari passu notes with an aggregate original principal balance of $92.0 million and one subordinate companion note with an original principal balance of $108.0 million. The non-controlling Note A-3 and Note A-5 with an aggregate outstanding principal balance as of the Cut-off Date of $30.0 million, will be contributed to the JPMDB 2018-C8 Trust. The remaining notes are currently held by the parties described in the “Whole Loan Summary” chart below and have been or are expected to be contributed to one or more securitization trusts. The DreamWorks Campus Whole Loan is structured with an ARD of December 6, 2022, a final maturity date of December 6, 2024 and will be interest-only through the ARD. On each payment date after the ARD, the borrower is required to make principal payments equal to the excess cash flow. The relationship between the holders of the DreamWorks Campus A-Notes and the DreamWorks Campus B-Note evidencing the DreamWorks Campus Whole Loan is governed by a co-lender agreement as described under “Description of the Mortgage Pool—The Whole Loans—The Non-Serviced AB Whole Loans – The DreamWorks Campus Whole Loan” in the Preliminary Prospectus.
| Whole Loan Summary(1) | |||||
| Note | Original Balance | Cut-off Date Balance | Note Holder | Controlling Piece | |
| A-3, A-5 | $30,000,000 | $30,000,000 | JPMDB 2018-C8 | No | |
| A-1 | 25,000,000 | 25,000,000 | UBS 2018-C9 | No(2) | |
| A-2, A-4 | 37,000,000 | 37,000,000 | CCRE | No | |
| B-Note | 108,000,000 | 108,000,000 | Prima Mortgage Investment Trust, LLC | Yes | |
| Total | $200,000,000 | $200,000,000 | |||
| (1) | The DreamWorks Campus Whole Loan will be serviced pursuant to the UBS 2018-C9 pooling and servicing agreement. However, so long as no “control appraisal period” (or similar term) has occurred and is continuing, the holder of the related B-Note will be the controlling noteholder and will have the right to approve certain modifications and consent to certain actions taken with respect to the related whole loan. If a control appraisal period has occurred and is continuing, the holder of the note indicated as the “controlling” note will be the controlling noteholder. |
| (2) | The DreamWorks Campus Whole Loan will be serviced pursuant to the UBS 2018-C9 PSA. |
The Borrower.The borrowing entity for the DreamWorks Campus Whole Loan is La Hana OW, LLC, a Delaware limited liability company. There is no nonrecourse carve-out guarantor or environmental indemnitor, other than the borrower, for the DreamWorks Campus Whole Loan.
The Loan Sponsor.The loan sponsor is Hana Asset Management Co., LTD, a Korean joint stock corporation, which is a private subsidiary of Hana Financial Group, Inc. (“Hana”). Hana has approximately $5.1 billion of assets under management primarily invested in two classes: real estate assets and special assets. Hana’s real estate assets account for nearly 75.8% ($3.8 billion) of their total assets under management and include office, mixed-use, industrial, retail, hotel and data center properties. Hana’s investors include a network of Korean pension funds, financial services companies, government agencies and others.
Originally founded as Korea Investment & Finance in 1971, Hana converted to a financial holding group in 2005 and is now one of the largest bank holding companies in Korea. Hana is publicly traded on the Korean stock exchanges (KRXL:086790). As of December 31, 2016, Hana employs over 19,000 employees and has over 100 offices in 24 countries (Americas, Europe, Middle East, Asia & Pacific). Hana was ranked number 492 in the Forbes Global 2000 for 2017.
The Property.The DreamWorks Campus Property, the global headquarters for DreamWorks, is a 497,404 square foot single-tenant, creative office property located in Glendale, California. Designed by Gensler and Steven Ehrlich Architects and constructed as a build-to-suit for DreamWorks in 1997, the DreamWorks Campus Property has been 100% occupied since completion. The DreamWorks Campus Property is situated on approximately 13.8 acres and features seven buildings that consist of five multi-level creative office buildings, one parking structure that features 1,006 parking spaces in addition to 417 street level parking spaces (approximately 2.86 spaces per 1,000 square feet) and one central plant, which provides power, water and HVAC to the DreamWorks Campus Property. The DreamWorks Campus Property features numerous amenities, including: full-service commissary, library, screening room, motion capture studio, recording studio, helipad, medical clinic, coffee shop, outdoor plazas and common areas featuring workspaces and activities and extensive landscaping including a manmade river that runs throughout the DreamWorks Campus Property, a lagoon, waterfall and large fountain.
THE INFORMATION IN THIS STRUCTURAL AND COLLATERAL TERM SHEET IS NOT COMPLETE AND MAY BE AMENDED PRIOR TO THE TIME OF SALE. THIS TERM SHEET IS NOT AN OFFER TO SELL THESE SECURITIES AND IT IS NOT A SOLICITATION OF AN OFFER TO BUY THESE SECURITIES IN ANY JURISDICTION WHERE THE OFFER OR SALE IS NOT PERMITTED.
| 91 of 136 | |
| Structural and Collateral Term Sheet | JPMDB 2018-C8 | |
| DreamWorks Campus | ||
As of June 6, 2018, the DreamWorks Campus Property is 100.0% occupied by DreamWorks. The DreamWorks Campus Property is subject to a 20-year, absolute triple net lease to the tenant, DWA Holdings, LLC, an affiliate of DreamWorks, pursuant to a lease with annual rent escalations of 1.5%, a lease end date of February 2035 and four, five-year renewal options.
DreamWorks was founded in 1994 as a collaboration between Stephen Spielberg, Jeffery Katzenberg and David Geffen, DreamWorks has released 36 feature films grossing over $14.6 billion in revenues (average of $406 million). DreamWorks also creates television series, short films and television specials. Some of DreamWorks’ most popular and commercially successful franchises include: Shrek, Kung Fu Panda, Madagascar and How to Train Your Dragon.
DreamWorks is a wholly owned subsidiary of NBC Universal, itself a wholly owned subsidiary of Comcast Corporation (rated A3/ A-/ A- by Moody’s/Fitch/S&P). Comcast Corporation acquired DreamWorks in August 2016 for approximately $3.8 billion. Comcast is an American global telecommunications conglomerate and is one of the nation’s largest broadcasting and cable television company. Comcast Corporation is a publicly traded company listed on NASDAQ under the ticker symbol CMCSA. As of May 8, 2018, Comcast Corporation has a market capitalization of approximately $139.8 billion and according to the Comcast 10-Q report as of the second quarter 2017, reported revenues of approximately $41.6 billion and net income of approximately $5.2 billion for the first six months of 2017.
DreamWorks is a part of the “Filmed Entertainment” division of NBC Universal, which consists primarily of the operations of Universal Pictures and films produced under the Illumination, Focus Features and DreamWorks names. According to the Comcast 10-Q as of the second quarter 2017, the Filmed Entertainment business segment generated revenue of approximately $4.14 billion for the first six months of 2017, out of a total of approximately $16.2 billion generated by all NBC Universal Divisions (approximately 25.5%). After the addition of the DreamWorks brand, revenue for the Filmed Entertainment segment increased from $2.73 billion in the first six months of 2016 to $4.14 billion in the first six months of 2017.
The DreamWorks Campus Property is located in Glendale, California, a media-focused submarket of Los Angeles. Glendale, California, which along with adjacent Burbank and Pasadena, comprises Los Angeles’ Tri-Cities, which contains major studio production headquarters and entertainment and media focused companies including Warner Brothers, Disney, ABC, NBC Universal and Nickelodeon, among others.
The DreamWorks Campus Property is located in the East Valley/Tri-Cities submarket, which posted a direct vacancy rate of 11.9% and an average asking rate of $36.00 per square foot, full service gross (“FSG”) as of the second quarter of 2017.
After reviewing comparable lease information for 19 Class A buildings, the appraisal’s concluded rental rate was $46.50 per square foot, which reflects the weighted average of $42.00 per square foot for office and $4.50 per square foot for parking, FSG for the DreamWorks Campus Property. The appraiser also determined that a deduction of $12.50 per square foot for expenses would be appropriate to convert FSG rental rates to triple net. This translates to a market rental rate of $34.00 per square foot for the DreamWorks Campus Property on a triple net basis. Based on this market rent conclusion, the underwritten base rent for DreamWorks is approximately 19.6% below market.
| Historical and Current Occupancy | |||
| 2015 | 2016 | 2017 | Current(1) |
| 100.0% | 100.0% | 100.0% | 100.0% |
| (1) | Current occupancy is as of June 6, 2018. |
| Tenant Summary(1) | ||||||
| Tenant | Ratings Moody’s/S&P/Fitch(2) | Net Rentable Area (SF) | % of Total NRA | Base Rent PSF | % of Base Rent(3) | Lease Expiration Date(4) |
| DreamWorks | A3 / A- / A- | 497,404 | 100.0% | $28.42 | 100.0% | 2/28/2035 |
| (1) | Based on the underwritten rent roll. |
| (2) | Ratings provided are for the parent company of the entity listed in the Tenant Name field, whether or not the parent company guarantees the lease. |
| (3) | Base Rent and Base Rent PSF represents the average rent over the DreamWorks Campus Whole Loan term. |
| (4) | DreamWorks has four, five-year renewal options and no termination options. |
THE INFORMATION IN THIS STRUCTURAL AND COLLATERAL TERM SHEET IS NOT COMPLETE AND MAY BE AMENDED PRIOR TO THE TIME OF SALE. THIS TERM SHEET IS NOT AN OFFER TO SELL THESE SECURITIES AND IT IS NOT A SOLICITATION OF AN OFFER TO BUY THESE SECURITIES IN ANY JURISDICTION WHERE THE OFFER OR SALE IS NOT PERMITTED.
| 92 of 136 | |
| Structural and Collateral Term Sheet | JPMDB 2018-C8 | |
| DreamWorks Campus | ||
| Lease Rollover Schedule(1) | |||||||||
| Year | Number of Leases Expiring | Net Rentable Area Expiring | % of NRA Expiring | Base Rent Expiring(2) | % of Base Rent Expiring | Cumulative Net Rentable Area Expiring | Cumulative % of NRA Expiring | Cumulative Base Rent Expiring(2) | Cumulative % of Base Rent Expiring |
| Vacant | NAP | 0 | 0.0% | NAP | NAP | 0 | 0.0% | NAP | NAP |
| 2018 & MTM | 0 | 0 | 0.0 | $0 | 0.0% | 0 | 0.0% | $0 | 0.0% |
| 2019 | 0 | 0 | 0.0 | 0 | 0.0 | 0 | 0.0% | $0 | 0.0% |
| 2020 | 0 | 0 | 0.0 | 0 | 0.0 | 0 | 0.0% | $0 | 0.0% |
| 2021 | 0 | 0 | 0.0 | 0 | 0.0 | 0 | 0.0% | $0 | 0.0% |
| 2022 | 0 | 0 | 0.0 | 0 | 0.0 | 0 | 0.0% | $0 | 0.0% |
| 2023 | 0 | 0 | 0.0 | 0 | 0.0 | 0 | 0.0% | $0 | 0.0% |
| 2024 | 0 | 0 | 0.0 | 0 | 0.0 | 0 | 0.0% | $0 | 0.0% |
| 2025 | 0 | 0 | 0.0 | 0 | 0.0 | 0 | 0.0% | $0 | 0.0% |
| 2026 | 0 | 0 | 0.0 | 0 | 0.0 | 0 | 0.0% | $0 | 0.0% |
| 2027 | 0 | 0 | 0.0 | 0 | 0.0 | 0 | 0.0% | $0 | 0.0% |
| 2028 | 0 | 0 | 0.0 | 0 | 0.0 | 0 | 0.0% | $0 | 0.0% |
| 2029 & Beyond | 1 | 497,404 | 100.0 | 14,138,608 | 100.0 | 497,404 | 100.0% | $14,138,608 | 100.0% |
| Total | 1 | 497,404 | 100.0% | $14,138,608 | 100.0% | ||||
| (1) | Based on the underwritten rent roll. |
| (2) | Total Base Rent Expiring and Cumulative Base Rent Expiring represent the average contractual rent over the DreamWorks Campus Whole Loan term. |
| Operating History and Underwritten Net Cash Flow(1) | |||||
| 2016 | TTM(2) | Underwritten | Per Square Foot | %(3) | |
| Rents in Place(4) | $13,334,684 | $13,484,575 | $14,138,608 | $28.42 | 100.0% |
| Vacant Income | 0 | 0 | 0 | 0.00 | 0.0% |
| Gross Potential Rent | $13,334,684 | $13,484,575 | $14,138,608 | $28.42 | 100.0% |
| Total Reimbursements | 0 | 0 | 0 | 0.00 | 0.00% |
| Net Rental Income | $13,334,684 | $13,484,575 | $14,138,608 | $28.42 | 100.0% |
| (Vacancy/Credit Loss)(5) | 0 | 0 | (282,772) | (0.57) | (2.0) |
| Effective Gross Income | $13,334,684 | $13,484,575 | $13,855,836 | $27.86 | 98.0% |
| Total Expenses(6) | $157,172 | $151,213 | $239,684 | $0.48 | 1.7% |
| Net Operating Income | $13,177,512 | $13,333,362 | $13,616,152 | $27.37 | 98.3% |
| Total TI/LC, Capex/RR | 0 | 0 | 99,481 | 0.20 | 0.7% |
| Net Cash Flow | $13,177,512 | $13,333,362 | $13,516,671 | $27.17 | 97.6% |
| (1) | Historical financial information prior to 2016 is not available as the DreamWorks Campus Property was owned by DreamWorks prior to executing a sale-leaseback transaction in 2015. As such, historical cash flow information prior to 2016 is unavailable. |
| (2) | TTM is as of September 30, 2017. |
| (3) | % column represents percent of Net Rental Income for all revenue lines and represents percent of Effective Gross Income for the remainder of the fields. |
| (4) | Underwritten Rents in Place represents the average contractual rent over the DreamWorks Campus Whole Loan term. |
| (5) | The DreamWorks Campus Property is 100.0% occupied as of June 6, 2018. However, vacancy was underwritten to 2.0%. |
| (6) | The DreamWorks lease is absolute net and all expenses are paid directly by the tenant other than the management fee and the insurance payment reflected herein. |
Property Management.The DreamWorks Campus Property is managed by OW Management Services, Inc.
Escrows and Reserves. At origination, the borrower deposited into escrow $562,887 for a payment reserve, which payment reserve was applied to satisfy the borrower’s obligations with respect to the first monthly debt service and reserve account payments on January 6, 2018 and approximately $53,091 for insurance.
Tax Escrows – The borrower’s obligations to escrow an amount equal to 1/12 of projected annual property tax payments is waived so long as (i) no event of default has occurred and is continuing, (ii) the borrower provides satisfactory evidence that DreamWorks is obligated to pay all taxes to be paid by the borrower and (iii) the borrower makes, or causes DreamWorks to make, all payments of taxes within the time frames set forth in the loan documentation.
THE INFORMATION IN THIS STRUCTURAL AND COLLATERAL TERM SHEET IS NOT COMPLETE AND MAY BE AMENDED PRIOR TO THE TIME OF SALE. THIS TERM SHEET IS NOT AN OFFER TO SELL THESE SECURITIES AND IT IS NOT A SOLICITATION OF AN OFFER TO BUY THESE SECURITIES IN ANY JURISDICTION WHERE THE OFFER OR SALE IS NOT PERMITTED.
| 93 of 136 | |
| Structural and Collateral Term Sheet | JPMDB 2018-C8 | |
| DreamWorks Campus | ||
Insurance Escrows –The borrower’s obligations to escrow an amount equal to 1/12 of projected annual estimated insurance premiums is waived so long as (i) no event of default has occurred and is continuing, (ii) the insurance coverage for the DreamWorks Campus Property is included in a policy held by the borrower or an entity that controls the borrower, or which the borrower causes DreamWorks to hold, (iii) the borrower binds, or causes DreamWorks to bind, all applicable insurance prior to the then-current expiration date of the foregoing policy and (iv) the borrower provides evidence of renewal policies prior to the then-current expiration date of the applicable policy.
Replacement Reserves– On a monthly basis, during the continuance of a Major Tenant Trigger Event (as defined below) the borrower is required to escrow an amount equal to approximately $8,290 (approximately $0.20 per square foot annually) into a capital expenditure reserve account.
TI/LC Reserves– On a monthly basis, during the continuance of a Major Tenant Trigger Event (as defined below) the borrower is required to escrow (i) an amount equal to approximately $33,160 (approximately $0.80 per square foot annually) plus (ii) sums received by the borrower in connection with a modification, termination, cancellation of any lease, any settlement of claims of the borrower against third parties in connection with any lease, any sums received from any tenant in connection with a consent to an assignment or sublease, any holdover rents and any other payment or income derived from an extraordinary event related to the use, ownership or operation of the DreamWorks Campus Property into a tenant improvements and leasing commissions reserve account.
Lockbox / Cash Management.The DreamWorks Campus Whole Loan is structured with a hard lockbox and in-place cash management. The DreamWorks Campus Whole Loan documents required the borrower or the property manager to deliver tenant direction letters at origination, which directed tenants to pay rent directly to a lender-controlled lockbox account and required that all other money received by the borrower or manager with respect to the DreamWorks Campus property (other than tenant security deposits required to be held in escrow accounts) be promptly deposited within two business days into such lockbox account during the term of the DreamWorks Campus Whole Loan. All amounts in the lockbox account are required to be swept to a lender-controlled cash management account on a daily basis and applied to payment of enumerated items, including debt service and operating expenses and funding of required reserves, with the remainder deposited into an excess cash flow reserve and held by the lender as additional collateral for the DreamWorks Campus Whole Loan provided, however, that to the extent no Major Tenant Trigger Event and no Cash Trap Event (defined below) is then ongoing, funds in the excess cash flow account will be made available to the borrower.
A “Major Tenant Trigger Event” will commence if DreamWorks, or any successor tenant representing 20.0% or more of the DreamWorks Campus property’s net rentable area or in-place rents (each a “Major Tenant”), (i) goes “dark” in 50.0% or more of its space, (ii) gives notice of its intent to vacate or notice of termination of its lease, in each case with respect to 50.0% or more of its space, (iii) files for bankruptcy protection or goes out of business, (iv) upon a default under such Major Tenant lease beyond any applicable notice and cure period or (v) a Major Tenant Non-Renewal Event occurs (defined below) (each, a “Major Tenant Trigger Event”), upon which time all cash flow after the payment of debt service, applicable operating expenses and applicable reserves shall be collected by Lender and deposited into a reserve (the “Major Tenant Reserve Account”) until such time as a replacement tenant or tenants reasonably acceptable to Lender takes the vacated space.
A “Major Tenant Non-Renewal Event” will commence if a major tenant fails to execute a new lease for its currently occupied space or fails to renew or extend its lease pursuant to the terms thereof, in each case with respect to 50.0% or more of its space, then a Major Tenant Non-Renewal Event occurs on the earlier of (i) of the date of notice of non-renewal or non-extension or (ii) nine months prior to the current lease expiration date.
A “Cash Trap Event” will occur on the date that any of the following has occurred: (i) any event of default, (ii) any bankruptcy action of the Borrower, (iii) any Major Tenant Trigger Event, (iv) the failure of the Borrower to achieve a debt yield of at least 6.0% for two (2) consecutive calendar quarters, or (v) the occurrence of the ARD.
Additional Debt.The DreamWorks Campus B-Note, which has an original principal balance of $108,000,000, is held by Prima Mortgage Investment Trust, LLC. Prior to the ARD, the DreamWorks Campus B-Note accrues interest at an interest rate equal to 4.00000%.In the event the DreamWorks Campus Whole Loan is not paid in full on or before the ARD, the DreamWorks Campus B-Note interest rate will increase to the greater of (x) 3.00000% plus the B-Note initial term interest rate of 4.00000% and (y) 3.00000% plus the then current five-year swap yield. The DreamWorks Campus B-Note iscoterminous with the DreamWorks Campus A-Notes. The DreamWorks B-Note is subject to an intercreditor agreement. Based on the DreamWorks Campus Whole Loan, the UW NOI Debt Yield, UW NCF DSCR, Cut-off Date LTV Ratio and Maturity Date LTV based on the DreamWorks Campus Whole Loan is 6.8%, 2.07x, 67.3% and 67.3%, respectively.
THE INFORMATION IN THIS STRUCTURAL AND COLLATERAL TERM SHEET IS NOT COMPLETE AND MAY BE AMENDED PRIOR TO THE TIME OF SALE. THIS TERM SHEET IS NOT AN OFFER TO SELL THESE SECURITIES AND IT IS NOT A SOLICITATION OF AN OFFER TO BUY THESE SECURITIES IN ANY JURISDICTION WHERE THE OFFER OR SALE IS NOT PERMITTED.
| 94 of 136 | |
| Structural and Collateral Term Sheet | JPMDB 2018-C8 |
[THIS PAGE INTENTIONALLY LEFT BLANK]
THE INFORMATION IN THIS STRUCTURAL AND COLLATERAL TERM SHEET IS NOT COMPLETE AND MAY BE AMENDED PRIOR TO THE TIME OF SALE. THIS TERM SHEET IS NOT AN OFFER TO SELL THESE SECURITIES AND IT IS NOT A SOLICITATION OF AN OFFER TO BUY THESE SECURITIES IN ANY JURISDICTION WHERE THE OFFER OR SALE IS NOT PERMITTED.
| 95 of 136 | |
| Structural and Collateral Term Sheet | JPMDB 2018-C8 | |
| Meridian Corporate Center | ||

THE INFORMATION IN THIS STRUCTURAL AND COLLATERAL TERM SHEET IS NOT COMPLETE AND MAY BE AMENDED PRIOR TO THE TIME OF SALE. THIS TERM SHEET IS NOT AN OFFER TO SELL THESE SECURITIES AND IT IS NOT A SOLICITATION OF AN OFFER TO BUY THESE SECURITIES IN ANY JURISDICTION WHERE THE OFFER OR SALE IS NOT PERMITTED.
| 96 of 136 | |
| Structural and Collateral Term Sheet | JPMDB 2018-C8 | |
| Meridian Corporate Center | ||
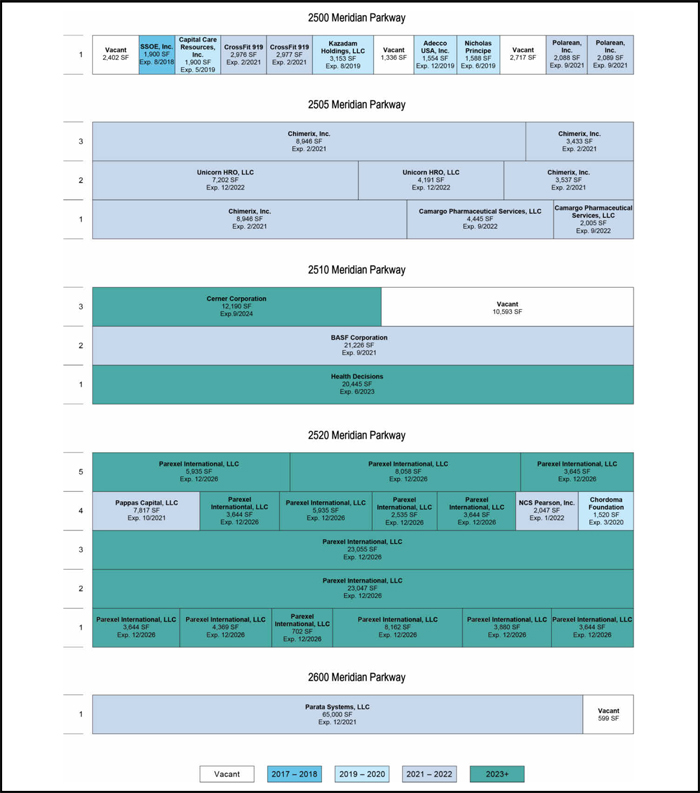
THE INFORMATION IN THIS STRUCTURAL AND COLLATERAL TERM SHEET IS NOT COMPLETE AND MAY BE AMENDED PRIOR TO THE TIME OF SALE. THIS TERM SHEET IS NOT AN OFFER TO SELL THESE SECURITIES AND IT IS NOT A SOLICITATION OF AN OFFER TO BUY THESE SECURITIES IN ANY JURISDICTION WHERE THE OFFER OR SALE IS NOT PERMITTED.
| 97 of 136 | |
| Structural and Collateral Term Sheet | JPMDB 2018-C8 | |
| Meridian Corporate Center | ||
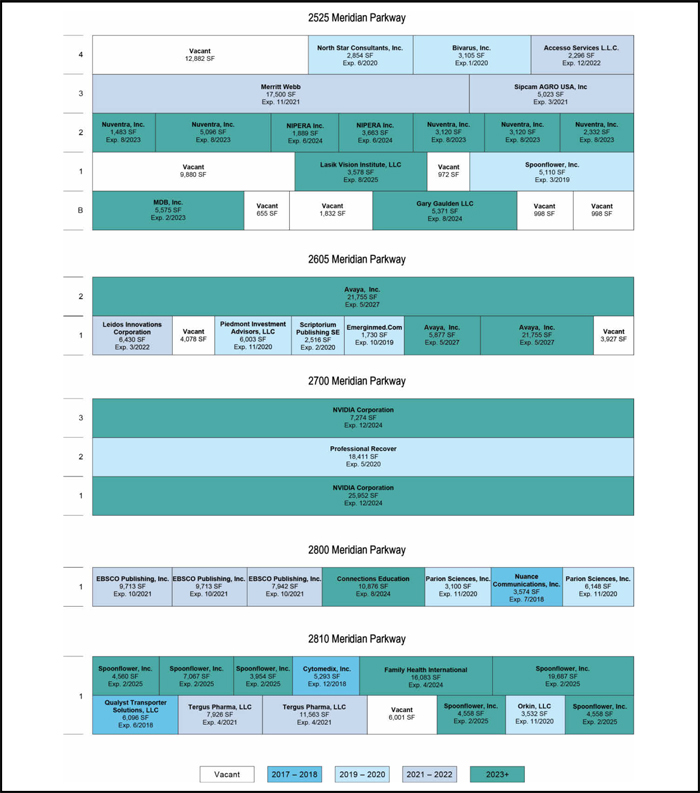
THE INFORMATION IN THIS STRUCTURAL AND COLLATERAL TERM SHEET IS NOT COMPLETE AND MAY BE AMENDED PRIOR TO THE TIME OF SALE. THIS TERM SHEET IS NOT AN OFFER TO SELL THESE SECURITIES AND IT IS NOT A SOLICITATION OF AN OFFER TO BUY THESE SECURITIES IN ANY JURISDICTION WHERE THE OFFER OR SALE IS NOT PERMITTED.
| 98 of 136 | |
| Structural and Collateral Term Sheet | JPMDB 2018-C8 | |
| Meridian Corporate Center | ||
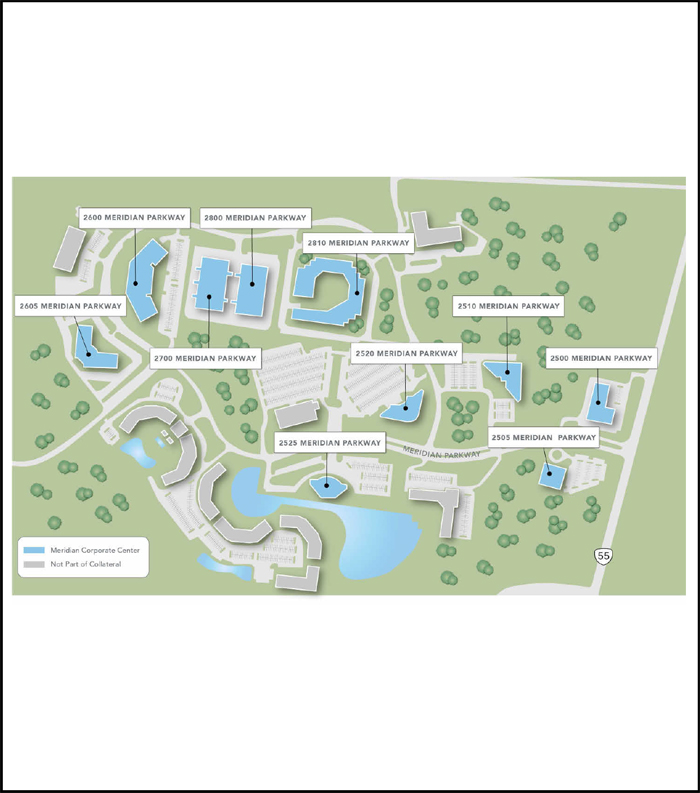
THE INFORMATION IN THIS STRUCTURAL AND COLLATERAL TERM SHEET IS NOT COMPLETE AND MAY BE AMENDED PRIOR TO THE TIME OF SALE. THIS TERM SHEET IS NOT AN OFFER TO SELL THESE SECURITIES AND IT IS NOT A SOLICITATION OF AN OFFER TO BUY THESE SECURITIES IN ANY JURISDICTION WHERE THE OFFER OR SALE IS NOT PERMITTED.
| 99 of 136 | |
| Structural and Collateral Term Sheet | JPMDB 2018-C8 | |
| Meridian Corporate Center | ||
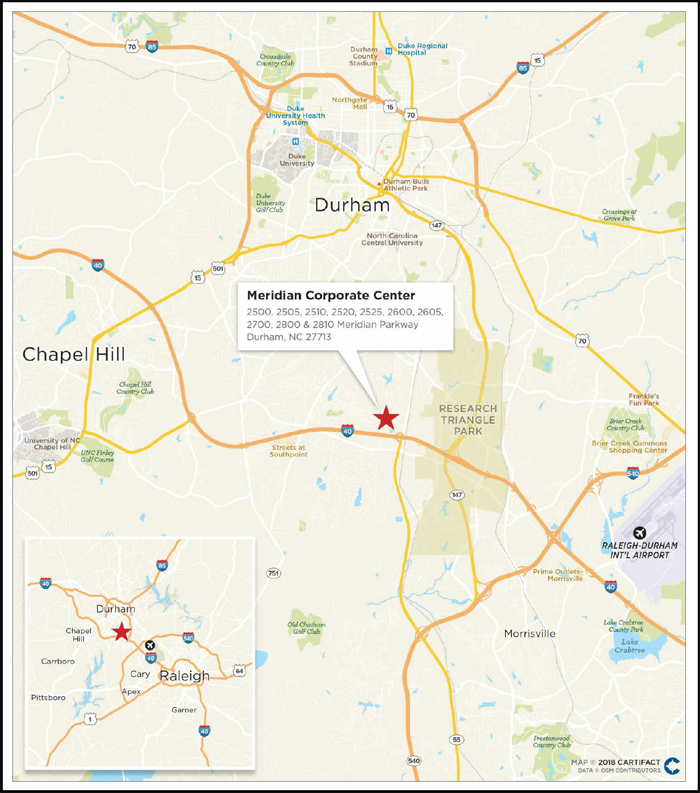
THE INFORMATION IN THIS STRUCTURAL AND COLLATERAL TERM SHEET IS NOT COMPLETE AND MAY BE AMENDED PRIOR TO THE TIME OF SALE. THIS TERM SHEET IS NOT AN OFFER TO SELL THESE SECURITIES AND IT IS NOT A SOLICITATION OF AN OFFER TO BUY THESE SECURITIES IN ANY JURISDICTION WHERE THE OFFER OR SALE IS NOT PERMITTED.
| 100 of 136 | |
| Structural and Collateral Term Sheet | JPMDB 2018-C8 | |
| Meridian Corporate Center | ||
| Mortgage Loan Information | Property Information | |||
| Mortgage Loan Seller: | JPMCB | Single Asset / Portfolio: | Portfolio | |
| Original Principal Balance(1): | $30,000,000 | Title: | Fee | |
| Cut-off Date Principal Balance(1): | $30,000,000 | Property Type - Subtype: | Office – Suburban | |
| % of Pool by IPB: | 4.2% | Net Rentable Area (SF): | 691,705 | |
| Loan Purpose: | Acquisition | Location: | Durham, NC | |
| Borrower: | BRI 1875 Meridian, LLC | Year Built / Renovated(2): | Various / N/A | |
| Sponsors: | Accesso Investment | Occupancy: | 90.6% | |
| Properties VI (US), LLLP and | Occupancy Date: | 2/20/2018 | ||
| Accesso Investment | Number of Tenants: | 46 | ||
| Properties VI, LLLP | 2015 NOI: | $7,106,354 | ||
| Interest Rate: | 4.57460% | 2016 NOI: | $7,228,314 | |
| Note Date: | 3/20/2018 | 2017 NOI(3): | $7,453,899 | |
| Maturity Date: | 4/1/2028 | TTM NOI: | N/A | |
| Interest-only Period: | 60 months | UW Economic Occupancy: | 91.0% | |
| Original Term: | 120 months | UW Revenues: | $13,496,059 | |
| Original Amortization: | 360 months | UW Expenses: | $5,134,415 | |
| Amortization Type: | IO-Balloon | UW NOI(3): | $8,361,644 | |
| Call Protection: | L(25),Grtr1%orYM(91),O(4) | UW NCF: | $7,565,588 | |
| Lockbox / Cash Management: | Hard / In Place | Appraised Value / Per SF(4): | $108,250,000 / $156 | |
| Additional Debt: | Yes | Appraisal Date: | 2/13/2018 | |
| Additional Debt Balance: | $45,705,000 | |||
| Additional Debt Type: | Pari Passu | |||
| Escrows and Reserves(5) | Financial Information(1) | |||||||
| Initial | Monthly | Initial Cap | Cut-off Date Loan / SF: | $109 | ||||
| Taxes: | $435,013 | $108,753 | N/A | Maturity Date Loan / SF: | $100 | |||
| Insurance: | $0 | Springing | N/A | Cut-off Date LTV(4): | 69.9% | |||
| Replacement Reserves: | $12,681 | $12,681 | $304,350 | Maturity Date LTV(4): | 64.1% | |||
| TI/LC: | $2,350,000 | Springing | $2,075,115 | UW NCF DSCR: | 1.63x | |||
| Other: | $3,903,855 | $5,492 | $800,000 | UW NOI Debt Yield: | 11.0% | |||
| Sources and Uses | ||||||
| Sources | Proceeds | % of Total | Uses | Proceeds | % of Total | |
| Mortgage Loan(1) | $75,705,000 | 65.0% | Purchase Price | $108,146,000 | 92.8% | |
| Sponsor Equity | 40,788,234 | 35.0% | Upfront Reserves | 6,701,549 | 5.8% | |
| Closing Costs | 1,645,685 | 1.4% | ||||
| Total Sources | $116,493,234 | 100.0% | Total Uses | $116,493,234 | 100.0% | |
| (1) | The Meridian Corporate Center loan is part of a whole loan evidenced by twopari passu notes, with an aggregate outstanding principal balance as of the Cut-off Date of $75.705 million. The information presented in the chart titled “Financial Information” above reflects the aggregate Cut-off Date balance of the $75.705 million Meridian Corporate Center Whole Loan, as defined in “The Loan” below. |
| (2) | Year Built / Renovated for each individual property is detailed in “The Portfolio” below. |
| (3) | The increase in 2017 NOI to UW NOI is primarily due to the inclusion of contractual rent steps totaling $493,011 through April 2019. |
| (4) | Appraised Value / Per SF, Cut-off Date LTV and Maturity Date LTV represents the sum of the “as-is” appraised values for 2505, 2520 and 2600 Meridian Parkway and the “As Is - Hypothetical” appraised values for 2500, 2510, 2525, 2605, 2700, 2800 and 2810 Meridian Parkway, which assume that contractual tenant improvement and leasing commission obligations have been fulfilled and there is no outstanding free rent. At origination, the borrower deposited upfront reserves totaling $3,903,855 for such contractual tenant improvement and leasing commission obligations and free rent. The sum of the “as-is” appraised values as of February 13, 2018 for the Meridian Corporate Center properties is $106,100,000, which results in a Cut-off Date LTV and Maturity Date LTV of 71.4% and 65.4%, respectively. |
| (5) | For a full description of Escrows and Reserves, please refer to “Escrows and Reserves” below. |
THE INFORMATION IN THIS STRUCTURAL AND COLLATERAL TERM SHEET IS NOT COMPLETE AND MAY BE AMENDED PRIOR TO THE TIME OF SALE. THIS TERM SHEET IS NOT AN OFFER TO SELL THESE SECURITIES AND IT IS NOT A SOLICITATION OF AN OFFER TO BUY THESE SECURITIES IN ANY JURISDICTION WHERE THE OFFER OR SALE IS NOT PERMITTED.
| 101 of 136 | |
| Structural and Collateral Term Sheet | JPMDB 2018-C8 | |
| Meridian Corporate Center | ||
The Loan.The Meridian Corporate Center loan is secured by a first mortgage lien on the borrower’s fee interests in 10 office properties totaling 691,705 square feet located in Durham, North Carolina. The whole loan has an aggregate outstanding principal balance as of the Cut-off Date of $75.705 million (the “Meridian Corporate Center Whole Loan”), and is comprised of twopari passu notes, each as described below. Note A-2, with an outstanding principal balance as of the Cut-off Date of $30.0 million (the “Meridian Corporate Center Mortgage Loan”), is being contributed to the JPMDB 2018-C8 Trust. Note A-1, with an outstanding principal balance as of the Cut-off Date of $45.705 million, is expected to be contributed to one or more future securitization trusts and is the controlling note under the related co-lender agreement. The Meridian Corporate Center Whole Loan has a 10-year term and, subsequent to a five-year interest-only period, will amortize on a 30-year schedule. The previous debt secured by the property was securitized in JPMBB 2014-C24. The relationship between the holders of the Meridian Corporate Center Whole Loan will be governed by a co-lender agreement as described under the “Description of the Mortgage Pool—The Whole Loans—The Serviced Pari Passu Whole Loans” and “—The Non-Serviced Pari Passu Whole Loans” in the Preliminary Prospectus.
| Whole Loan Summary | |||||
| Note | Original Balance | Cut-off Date Balance | Note Holder | Controlling Piece | |
| A-1 | $45,705,000 | $45,705,000 | JPMCB | Yes | |
| A-2 | 30,000,000 | 30,000,000 | JPMDB 2018-C8 | No | |
| Total | $75,705,000 | $75,705,000 | |||
The Borrower. The borrowing entity for the Meridian Corporate Center Whole Loan is BRI 1875 Meridian, LLC, a Delaware limited liability company and special purpose entity with two independent directors in its organizational structure.
The Loan Sponsors.The loan sponsors and nonrecourse carve-out guarantors are Accesso Investment Properties VI (US), LLLP and Accesso Investment Properties VI, LLLP, each a Florida limited liability limited partnership. The indirect owner of 100% of the equity interests in the borrower is JV BRI 1875 Meridian, LLC, a joint venture between Accesso Partners Meridian, LLC, the managing member of the joint venture and an affiliate of Accesso Partners LLC (“Accesso”), and DOF V Meridian, LLC, an affiliate of Torchlight Investors (“Torchlight”). Accesso is a commercial real estate investment manager, owner and operator that focuses on acquiring Class A commercial office properties in major cities and suburban markets across the United States. Accesso is headquartered in Hallandale Beach, Florida and has offices in Houston, Dallas, Minneapolis and Atlanta. Founded in 1995, Torchlight has since acquired over $20 billion in commercial real estate debt investments, with approximately $3.9 billion of assets currently under management. Headquartered in New York City, Torchlight provides investment management and disposition strategies for its investors.
| Portfolio Summary | ||||||||
| Property | Year Built | Number of Stories | Net Rentable Area (SF) | Allocated Loan Amount | % of Allocated Loan Amount | Appraised Value | Underwritten Rent(1) | Largest Tenant |
| 2520 Meridian Parkway | 1997 | 5 | 115,283 | $15,737,526 | 20.8% | $22,400,000 | $2,886,924 | Parexel International, LLC |
| 2525 Meridian Parkway | 1985 | 4 | 99,332 | 11,451,861 | 15.1% | 16,300,000 | 1,641,454 | Merritt, Webb, Wilson & Caruso PLLC |
| 2605 Meridian Parkway | 1995 | 2 | 74,071 | 8,680,000 | 11.5% | 12,850,000 | 1,513,939 | Avaya, Inc. |
| 2810 Meridian Parkway | 1986 | 1 | 100,878 | 8,641,588 | 11.4% | 12,300,000 | 1,372,074 | Spoonflower, Inc. |
| 2510 Meridian Parkway | 1990 | 3 | 64,454 | 8,079,533 | 10.7% | 11,500,000 | 1,267,957 | BASF Corporation |
| 2600 Meridian Parkway | 1998 | 1 | 65,599 | 7,025,681 | 9.3% | 10,000,000 | 1,188,200 | Parata Systems, LLC |
| 2700 Meridian Parkway | 1997 | 1 | 51,637 | 5,058,491 | 6.7% | 7,200,000 | 1,022,275 | NVIDIA Corporation |
| 2800 Meridian Parkway | 1997 | 1 | 51,066 | 4,566,693 | 6.0% | 6,500,000 | 961,912 | EBSCO Publishing, Inc. |
| 2505 Meridian Parkway | 1989 | 3 | 42,705 | 4,496,436 | 5.9% | 6,400,000 | 970,237 | Chimerix, Inc. |
| 2500 Meridian Parkway | 1991 | 1 | 26,680 | 1,967,191 | 2.6% | 2,800,000 | 331,739 | CrossFit 919 |
| Total | 691,705 | $75,705,000 | 100.0% | $108,250,000 | $13,156,711 | |||
| (1) | Property level underwritten net cash flow is unavailable as property level expense reporting was not provided by the sponsor. |
THE INFORMATION IN THIS STRUCTURAL AND COLLATERAL TERM SHEET IS NOT COMPLETE AND MAY BE AMENDED PRIOR TO THE TIME OF SALE. THIS TERM SHEET IS NOT AN OFFER TO SELL THESE SECURITIES AND IT IS NOT A SOLICITATION OF AN OFFER TO BUY THESE SECURITIES IN ANY JURISDICTION WHERE THE OFFER OR SALE IS NOT PERMITTED.
| 102 of 136 | |
| Structural and Collateral Term Sheet | JPMDB 2018-C8 | |
| Meridian Corporate Center | ||
The Portfolio. The Meridian Corporate Center portfolio consists of 10 Class A office properties totaling 691,705 square feet, constructed in phases between 1985 and 1998. The properties are located in Durham, North Carolina, adjacent to Research Triangle Park, the largest technology research and science park in the United States, spanning 7,000 acres and including over 250 companies and approximately 50,000 employees. The properties’ amenities include pedestrian trails, a seven-acre lake and outdoor picnic areas. The properties are adjacent to a full-service Doubletree Suites hotel. The properties feature 2,640 parking spaces, resulting in a parking ratio of approximately 3.8 spaces per 1,000 square feet of aggregate net rentable area.
As of February 20, 2018, the Meridian Corporate Center portfolio was 90.6% leased to 46 tenants, under 47 leases. The largest tenant, Parexel International, LLC, leases 103,899 square feet (15.0% of the net rentable area) through December 2026 and accounts for 19.9% of underwritten base rent. Parexel International, LLC has been in occupancy since January 2003 and has expanded its space and/or renewed its lease eight times, most recently in August 2015. Parexel International, LLC is a global biopharmaceutical services firm that provides a broad range of knowledge-based contract research, consulting, medical communications and technology solutions and services to the pharmaceutical, biotechnology and medical device industries. Parexel International, LLC is headquartered near Boston and has approximately 18,900 employees in 84 offices across 51 countries. The second largest tenant, Parata Systems, LLC (“Parata”), leases 65,000 square feet (9.4% of the net rentable area) through December 2021 and accounts for 9.0% of underwritten base rent. Parata has been in occupancy since July 2005 and has expanded its space and/or extended its lease four times, most recently in December 2010. Parata currently subleases its entire leased space to Frontier Communications of America, Inc (“Frontier”) (rated B/B3/B- by Fitch/Moody’s/S&P). Incorporated in 1935, Frontier is currently a Fortune 500 company and a member of the S&P MidCap400. With 28,000 employees across 29 states, Frontier provides internet, television and phone services to business and residential customers. The third largest tenant, Spoonflower, Inc. (“Spoonflower”), leases 49,494 square feet (7.2% of the net rentable area) and accounts for 5.5% of underwritten base rent. Spoonflower leases 5,110 square feet at the 2525 Meridian Parkway property with a lease expiration of March 31, 2019 and 44,384 square feet at the 2810 Meridian Parkway property with a lease expiration of February 28, 2025. Spoonflower has been in occupancy since October 2012 and has expanded its space and/or extended its lease four times, most recently in January 2018. Founded in May 2008, Spoonflower is a web-based service that allows its users to design, print and sell custom textiles for home décor. Spoonflower has grown to host over 3.5 million users and over 500,000 designs printed on various products, including curtains, clothes, quilts, bags, furniture, dolls, pillows and more. Spoonflower is headquartered at the 2810 Meridian Parkway property.
The Meridian Corporate Center properties are located at the intersection of Interstate 40, which provides access to Raleigh to the east and Chapel Hill to the west, and Highway 55, which provides access to Durham, approximately 5.2 miles north of the portfolio. The portfolio is approximately seven miles northwest from the Raleigh-Durham International Airport and adjacent to the Research Triangle Park. Research Triangle Park is one of several major demand drivers in the area. Prominent employers at Research Triangle Park include IBM Corporation, Cisco Systems, Inc. and GlaxoSmithKline, as well as others in fields spanning micro-electronics, telecommunications, biotechnology, pharmaceuticals, environmental sciences and more. Other demand drivers include several major universities, including Duke University, NC State University and the University of North Carolina Chapel Hill, and various retail destinations, including Streets at Southpoint, a Nordstrom and Belk anchored GGP mall, located one exit west of the portfolio on Interstate 40. Regional access to the properties is provided by Interstate 85, Interstate 540, State Highway 147 and State Highway 55. According to the appraisal, the estimated population as of year-end 2017 within a one-, three- and five-mile radius of the properties was 9,317, 52,542 and 121,259, respectively, with estimated average household income of $65,096, $85,692 and $83,875, respectively.
According to the appraisal, as of the fourth quarter of 2017, the Raleigh/Durham metropolitan statistical area office market consisted of approximately 100.4 million square feet of office space with an overall vacancy rate of 7.0% and an average asking rent of $22.48 per square foot. As of the same period, the South Durham office submarket consisted of approximately 6.2 million square feet of office space with an overall vacancy rate of 6.1% and an average asking rent of $21.53 per square foot. The appraisal identified five directly comparable office properties built between 1998 and 2017 ranging in size from 77,409 to 152,563 square feet. Occupancies at the comparable properties ranged from 73.0% to 100.0%, with a weighted average vacancy of approximately 7.6%. Recently quoted rental rate for the comparable office properties ranged from $16.52 per square foot to $25.50 per square foot, with a weighted average of approximately $21.33 per square foot. The appraisal concluded a vacancy rate for the Meridian Corporate Center portfolio of approximately 5.7%, which is less than the current vacancy rate of 9.4%. The weighted average of the appraisal’s concluded market rents for the buildings is $21.42 per square foot, which is in-line with the underwritten rent at the Meridian Corporate Center portfolio of $21.00 per square foot.
| Historical and Current Occupancy(1) | |||
| 2015 | 2016 | 2017 | Current(2) |
| 93.2% | 96.4% | 91.7% | 90.6% |
| (1) | Historical Occupancies are as of December 31 of each respective year. |
| (2) | Current Occupancy is as of February 20, 2018. |
THE INFORMATION IN THIS STRUCTURAL AND COLLATERAL TERM SHEET IS NOT COMPLETE AND MAY BE AMENDED PRIOR TO THE TIME OF SALE. THIS TERM SHEET IS NOT AN OFFER TO SELL THESE SECURITIES AND IT IS NOT A SOLICITATION OF AN OFFER TO BUY THESE SECURITIES IN ANY JURISDICTION WHERE THE OFFER OR SALE IS NOT PERMITTED.
| 103 of 136 | |
| Structural and Collateral Term Sheet | JPMDB 2018-C8 | |
| Meridian Corporate Center | ||
| Tenant Summary(1) | ||||||
| Tenant | Ratings(2) Moody’s/S&P/Fitch | Net Rentable Area (SF) | % of Total NRA | Base Rent PSF | % of Total Base Rent | Lease Expiration Date |
| Parexel International, LLC(3) | NA / NA / NA | 103,899 | 15.0% | $25.18 | 19.9% | 12/31/2026 |
| Parata(4) | NA / NA / NA | 65,000 | 9.4% | $18.28 | 9.0% | 12/31/2021 |
| Spoonflower(5) | NA / NA / NA | 49,494 | 7.2% | $14.62 | 5.5% | Various |
| Avaya, Inc.(6) | NA / NA / NA | 49,387 | 7.1% | $22.70 | 8.5% | 5/31/2027 |
| NVIDIA Corporation | A3 / BBB+ / A- | 33,226 | 4.8% | $19.48 | 4.9% | 12/31/2024 |
| EBSCO Publishing, Inc. | NA / NA / NA | 27,368 | 4.0% | $18.39 | 3.8% | 10/31/2021 |
| Chimerix, Inc. | NA / NA / NA | 24,862 | 3.6% | $22.63 | 4.3% | 2/28/2021 |
| BASF Corporation | A1 / A / A+ | 21,226 | 3.1% | $23.64 | 3.8% | 9/30/2021 |
| Health Decisions | NA / NA / NA | 20,445 | 3.0% | $23.69 | 3.7% | 6/30/2023 |
| Tergus Pharma, LLC(7) | NA / NA / NA | 19,489 | 2.8% | $15.64 | 2.3% | 4/30/2021 |
| (1) | Based on the underwritten rent roll dated February 20, 2018. |
| (2) | Ratings provided are for the parent company of the entity listed in the “Tenant” field whether or not the parent company guarantees the lease. |
| (3) | Parexel International, LLC subleases 8,951 square feet of its space to AroundCampus, LLC. The tenant also has the right to contract its leased space by the entire third floor on August 31, 2020, with six-months’ notice and the payment of a contraction fee. |
| (4) | Parata subleases its entire leased space to Frontier, which currently pays an annual base rent per square foot of $17.83. |
| (5) | Spoonflower leases 5,110 square feet at the 2525 Meridian Parkway property with a lease expiration date of March 31, 2019 and 44,384 square feet at the 2810 Meridian Parkway property with a lease expiration date of February 28, 2025. |
| (6) | Avaya, Inc. has a one-time option to terminate its lease as of July 31, 2024, with one year’s notice and the payment of a termination fee. |
| (7) | Tergus Pharma, LLC has a one-time option to terminate its lease as of April 30, 2019, with at least nine months’ prior notice and the payment of a termination fee. |
| Lease Rollover Schedule(1)(2) | |||||||||||||
| Year | Number of Leases Expiring | Net Rentable Area Expiring | % of NRA Expiring | Base Rent Expiring(1) | % of Base Rent Expiring | Cumulative Net Rentable Area Expiring | Cumulative % Expiring | Cumulative Base Rent Expiring | Cumulative % of Base Rent Expiring | ||||
| Vacant | NAP | 65,163 | 9.4% | NAP | NAP | 65,163 | 9.4% | NAP | NAP | ||||
| 2018 & MTM | 3 | 11,570 | 1.7% | $196,216 | 1.5% | 76,733 | 11.1% | $196,216 | 1.5% | ||||
| 2019 | 6 | 15,035 | 2.2% | 230,322 | 1.8% | 91,768 | 13.3% | $426,538 | 3.2% | ||||
| 2020 | 8 | 47,189 | 6.8% | 992,956 | 7.5% | 138,957 | 20.1% | $1,419,494 | 10.8% | ||||
| 2021 | 11 | 198,415 | 28.7% | 3,926,088 | 29.8% | 337,372 | 48.8% | $5,345,582 | 40.6% | ||||
| 2022 | 5 | 28,616 | 4.1% | 668,939 | 5.1% | 365,988 | 52.9% | $6,014,520 | 45.7% | ||||
| 2023 | 3 | 41,171 | 6.0% | 980,422 | 7.5% | 407,159 | 58.9% | $6,994,942 | 53.2% | ||||
| 2024 | 7 | 83,298 | 12.0% | 1,656,333 | 12.6% | 490,457 | 70.9% | $8,651,275 | 65.8% | ||||
| 2025 | 2 | 47,962 | 6.9% | 768,173 | 5.8% | 538,419 | 77.8% | $9,419,449 | 71.6% | ||||
| 2026 | 1 | 103,899 | 15.0% | 2,616,261 | 19.9% | 642,318 | 92.9% | $12,035,710 | 91.5% | ||||
| 2027 | 1 | 49,387 | 7.1% | 1,121,000 | 8.5% | 691,705 | 100.0% | $13,156,711 | 100.0% | ||||
| 2028 | 0 | 0 | 0.0% | 0 | 0.0% | 691,705 | 100.0% | $13,156,711 | 100.0% | ||||
| 2029 & Beyond | 0 | 0 | 0.0% | 0 | 0.0% | 691,705 | 100.0% | $13,156,711 | 100.0% | ||||
| Total | 47 | 691,705 | 100.0% | $13,156,711 | 100.0% | ||||||||
| (1) | Based on the underwritten rent roll dated February 20, 2018. |
| (2) | Certain tenants may have termination or contraction options (which may become exercisable prior to the originally stated expiration date of the tenant lease) that are not considered in the above Lease Rollover Schedule. |
THE INFORMATION IN THIS STRUCTURAL AND COLLATERAL TERM SHEET IS NOT COMPLETE AND MAY BE AMENDED PRIOR TO THE TIME OF SALE. THIS TERM SHEET IS NOT AN OFFER TO SELL THESE SECURITIES AND IT IS NOT A SOLICITATION OF AN OFFER TO BUY THESE SECURITIES IN ANY JURISDICTION WHERE THE OFFER OR SALE IS NOT PERMITTED.
| 104 of 136 | |
| Structural and Collateral Term Sheet | JPMDB 2018-C8 | |
| Meridian Corporate Center | ||
| Operating History and Underwritten Net Cash Flow | |||||||
| 2015 | 2016 | 2017 | Underwritten | Per Square Foot | %(1) | ||
| Rents in Place(2) | $12,002,589 | $12,439,438 | $12,630,164 | $13,156,711 | $19.02 | 88.7% | |
| Vacant Income | 0 | 0 | 0 | 1,297,015 | 1.88 | 8.7% | |
| Gross Potential Rent | $12,002,589 | $12,439,438 | $12,630,164 | $14,453,725 | $20.90 | 97.5% | |
| Total Reimbursements | 314,246 | 157,360 | 406,580 | 372,802 | 0.54 | 2.5% | |
| Net Rental Income | $12,316,834 | $12,596,797 | $13,036,744 | $14,826,527 | $21.43 | 100.0% | |
| (Vacancy/Credit Loss) | 0 | 0 | 0 | (1,330,468) | (1.92) | (9.0) | |
| Other Income | 0 | 0 | 0 | 0 | 0.00 | 0.0% | |
| Effective Gross Income | $12,316,834 | $12,596,797 | $13,036,744 | $13,496,059 | $19.51 | 91.0% | |
| Total Expenses | $5,210,481 | $5,368,484 | $5,582,846 | $5,134,415 | $7.42 | 38.0% | |
| Net Operating Income(3) | $7,106,354 | $7,228,314 | $7,453,899 | $8,361,644 | $12.09 | 62.0% | |
| Total TI/LC, Capex/RR | 0 | 0 | 0 | 796,056 | 1.15 | 5.9% | |
| Net Cash Flow | $7,106,354 | $7,228,314 | $7,453,899 | $7,565,588 | $10.94 | 56.1% | |
| (1) | % column represents percent of Net Rental Income for all revenue lines and represents percent of Effective Gross Income for the remainder of the fields. |
| (2) | Underwritten Rents in Place includes contractual rent steps through April 2019. |
| (3) | The increase in 2017 NOI to UW NOI is primarily due to the inclusion of contractual rent steps totaling $493,011 through April 2019. |
Property Management. The properties are managed by Accesso Services, LLC, a Florida limited liability company and an affiliate of the loan sponsor.
Escrows and Reserves. At origination, the borrower deposited into escrow $3,125,744 for outstanding tenant improvements and leasing commissions, $778,111 for outstanding free rent, $2,350,000 for future tenant improvement and leasing commission obligations, $435,013 for real estate taxes and approximately $12,681 for replacement reserves.
Tax Escrows – On a monthly basis, the borrower is required to escrow 1/12 of annual estimated tax payments, which currently equates to $108,753.
Insurance Escrows – The requirement for the borrower to make monthly deposits to the insurance escrow is waived provided that (i) no event of default has occurred and is continuing and (ii) the borrower provides the lender with reasonably satisfactory evidence that the property is insured pursuant to a blanket insurance policy meeting the requirements specified in the loan agreement.
Replacement Reserves– On a monthly basis, the borrower is required to escrow $12,681 (approximately $0.22 per square foot annually) for replacement reserves. This reserve is subject to a cap of $304,350 (approximately $0.44 per square foot).
TI/LC Reserves – On a monthly basis, the borrower is required to escrow $57,642 (approximately $1.00 per square foot annually) (the “TI/LC Reserve Monthly Deposit”) for TI/LC reserves. However, the requirement to make the TI/LC Reserve Monthly Deposit will be waived on each payment date prior to the payment date occurring on May 1, 2020 so long as the TI/LC reserve balance is greater than or equal to $1,300,000 on such payment date. The reserve is subject to a cap of $2,075,115 ($3.00 per square foot). The borrower is also required to escrow any lease termination fees (other than any termination fees related to Parata) in the reserve.
Avaya Reserve –On each payment date through and including the payment date occurring on August 1, 2022, the borrower is required to escrow $5,492 on a monthly basis (approximately $0.10 per square foot annually) for free rent related to Avaya, the fourth largest tenant at the property. Such monthly escrows cover the rent abatement period beginning in August 2022 through January 2024. Rent abatements occurring in the periods beginning in April 2018 through February 2019 have been reserved for at closing.
Parata Reserve –If Parata or a replacement tenant chooses to exercise an early termination option, the borrower will be required to deposit any termination fee or other consideration payable upon exercise of such early termination option. Further, in connection with curing a Parata Trigger Event (as defined below), the borrower has the option to reserve the amount of any free rent, rent abatements, tenant improvement or leasing commissions associated with Parata or a Parata replacement tenant in accordance with the loan documents. To the extent there is a Cash Sweep Period (as defined below) continuing caused solely by a Parata Trigger Event, all excess cash flow is required to be deposited into the Parata reserve until the funds in the reserve equal the Parata Reserve Cap (as defined below). Notwithstanding the aforementioned, upon the occurrence of Parata Trigger Event, the borrower is permitted to deposit additional funds in the form of cash or a letter of credit in accordance with the loan documents in connection with curing a Parata Trigger Event.
THE INFORMATION IN THIS STRUCTURAL AND COLLATERAL TERM SHEET IS NOT COMPLETE AND MAY BE AMENDED PRIOR TO THE TIME OF SALE. THIS TERM SHEET IS NOT AN OFFER TO SELL THESE SECURITIES AND IT IS NOT A SOLICITATION OF AN OFFER TO BUY THESE SECURITIES IN ANY JURISDICTION WHERE THE OFFER OR SALE IS NOT PERMITTED.
| 105 of 136 | |
| Structural and Collateral Term Sheet | JPMDB 2018-C8 | |
| Meridian Corporate Center | ||
A “Parata Trigger Event” means the failure to satisfy the Parata Renewal Criteria or Parata Replacement Lease Criteria (each as described below) on or before 12 months prior to any expiration of the Parata lease or any Parata replacement lease, as described in the loan agreement.
A “Parata Trigger Event Cure” means either (i) the satisfaction of the Parata Replacement Lease Criteria, (ii) the satisfaction of the Parata Renewal Criteria, (iii) the achievement of a debt service coverage ratio, as calculated based on the specifications described in the loan agreement, based on the trailing six-month period immediately preceding the date of determination, that is at least 1.40x or (iv) the funds on deposit in the Parata Reserve are equal to or exceed $800,000 (the “Parata Reserve Cap”).
“Parata Renewal Criteria” means (i) Parata or a Parata replacement tenant has renewed or extended its lease for a term that extends at least three years beyond the term of the previous lease and (ii) the lender has received an updated tenant estoppel from Parata or the Parata replacement tenant confirming, among other items, (a) renewal and terms of such renewal, (b) the lease is in full force and effect and (c) that Parata, a sub-tenant or the Parata replacement tenant is in physical occupancy and paying full contractual rent as described in the loan agreement.
“Parata Replacement Lease Criteria” means that, with respect to at least 40,000 square feet of Parata space, (i) the borrower has entered into one or more Parata replacement leases, each with a term extending at least three years beyond the date of termination of the previous lease, (ii) each Parata replacement tenant is in physical occupancy of the space and paying full contractual rent and (iii) the borrower provides the lender with (a) a copy of the executed Parata replacement lease, (b) a tenant estoppel, (c) evidence that the borrower has performed and paid for all tenant improvements related to such lease and that there are no unpaid leasing commissions associated with the Parata replacement tenants and (d) an updated rent roll, all as described further in the loan agreement.
Lockbox / Cash Management.The loan is structured with a hard lockbox and in-place cash management. The borrower was required to send tenant direction letters to all tenants upon the origination of the loan instructing them to deposit all rents and payments directly into the lockbox account controlled by the lender. All funds in the lockbox account are required to be swept each business day to a segregated cash management account under the control of the lender and disbursed on each payment date during the term of the loan in accordance with the loan documents. Except as described in the Parata Reserve section above, during a Cash Sweep Period, all excess cash flow after payment of debt service, required reserves and operating expenses is required to be held as additional collateral for the loan. The lender has been granted a first priority security interest in the cash management account.
A “Cash Sweep Period” means each period commencing on the occurrence of a Cash Sweep Event (as defined below) and continuing until the earlier of (a) the payment date next occurring following the related Cash Sweep Event Cure (as defined below) or (b) payment in full of all principal and interest on the loan and all other amounts payable under the loan documents in accordance with the terms and provisions of the loan documents.
A “Cash Sweep Event” means the occurrence of (i) an event of default, (ii) any bankruptcy or insolvency action of the borrower or property manager, (iii) the date that the debt service coverage ratio (as calculated in the loan documents) based on the trailing six-month period immediately preceding the date of determination falling below 1.15x (a “DSCR Trigger Event”) or (iv) a Parata Trigger Event.
A “Cash Sweep Event Cure” means (a) with respect to clause (iii) above, the achievement of a debt service coverage ratio, based on the trailing six month period immediately preceding the date of determination, of at least 1.20x for two consecutive quarters, (b) with respect to clause (i) above, the acceptance by the lender of a cure of such event of default (which the lender is not obligated to accept and may reject or accept in its sole and absolute discretion), (c) with respect to clause (ii) above solely with respect to the property manager, the borrower replacing the manager with a qualified manager under a replacement management agreement within 60 days or the dismissal of such bankruptcy or insolvency action without any material adverse consequences to the loan or the property (as determined by the lender in its sole discretion), (d) with respect to clause (iv) above, the occurrence of a Parata Trigger Event Cure or (e) with respect to clause (ii) above solely with respect to the bankruptcy action of the borrower that is involuntary and not consented to or colluded in by borrower, guarantor or any of their affiliates, if such bankruptcy action is discharged, stayed or dismissed within 60 days of such filing without any adverse consequences to the loan or the property, which shall be determined in lender’s sole discretion, provided, however, that such Cash Sweep Event Cure shall be subject to certain conditions described in the loan documents.
THE INFORMATION IN THIS STRUCTURAL AND COLLATERAL TERM SHEET IS NOT COMPLETE AND MAY BE AMENDED PRIOR TO THE TIME OF SALE. THIS TERM SHEET IS NOT AN OFFER TO SELL THESE SECURITIES AND IT IS NOT A SOLICITATION OF AN OFFER TO BUY THESE SECURITIES IN ANY JURISDICTION WHERE THE OFFER OR SALE IS NOT PERMITTED.
| 106 of 136 | |
| Structural and Collateral Term Sheet | JPMDB 2018-C8 | |
| Meridian Corporate Center | ||
Partial Release. On or after the expiration of the lockout period, the borrower may release one or more individual buildings from the lien of the mortgage solely in connection with an arm’s length sale to a third party that is not an affiliate of the borrower, upon satisfaction of certain conditions set forth in the loan documents, including without limitation, the following: (i) no event of default exists, (ii) the borrower pays to the lender 110% of the allocated loan amount for the individual building, plus the applicable yield maintenance premium, (iii) after giving effect to the release for the applicable individual building, the loan to value ratio, as calculated in the loan documents, will not be greater than 69.9%, (iv) after giving effect to the release, the debt service coverage ratio (as calculated in the loan documents) for the remaining buildings based on the trailing 12-month period is equal to or greater than the greater of (a) 1.50x and (b) the debt service coverage ratio for all the properties (including the individual buildings requested to be released) immediately preceding the release based on the trailing 12-month period, (v) the receipt of a rating agency confirmation and (vi) satisfaction of customary REMIC requirements.
Permitted Mezzanine Debt. In connection with a bona fide sale of the property to a third party, the loan agreement permits the owners of the transferee to obtain a mezzanine loan secured by 100% of such ownership interest upon satisfaction of certain terms and conditions including, without limitation, the following: (i) no event of default exists, (ii) the combined loan-to-value ratio does not exceed 69.9%, (iii) the combined debt service coverage ratio (as defined in the loan documents) is not less than 1.50x, (iv) the maturity date of the new mezzanine loan is not earlier than the maturity date of the Meridian Corporate Center Whole Loan, (v) the lender executes an intercreditor agreement acceptable to the lender in its sole discretion and (vi) the lender’s receipt of a rating agency confirmation.
THE INFORMATION IN THIS STRUCTURAL AND COLLATERAL TERM SHEET IS NOT COMPLETE AND MAY BE AMENDED PRIOR TO THE TIME OF SALE. THIS TERM SHEET IS NOT AN OFFER TO SELL THESE SECURITIES AND IT IS NOT A SOLICITATION OF AN OFFER TO BUY THESE SECURITIES IN ANY JURISDICTION WHERE THE OFFER OR SALE IS NOT PERMITTED.
| 107 of 136 | |
| Structural and Collateral Term Sheet | JPMDB 2018-C8 |
| Steelyard Commons | |
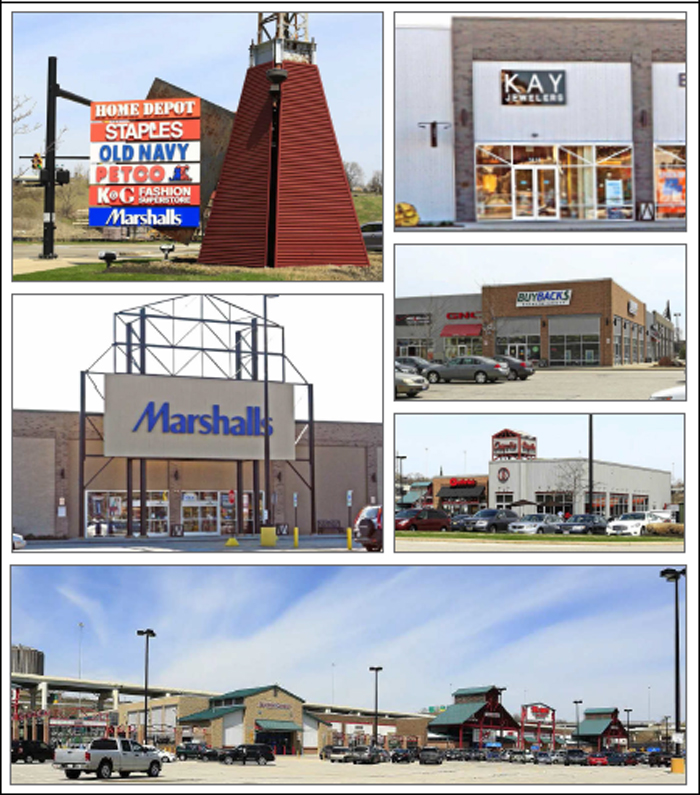
THE INFORMATION IN THIS STRUCTURAL AND COLLATERAL TERM SHEET IS NOT COMPLETE AND MAY BE AMENDED PRIOR TO THE TIME OF SALE. THIS TERM SHEET IS NOT AN OFFER TO SELL THESE SECURITIES AND IT IS NOT A SOLICITATION OF AN OFFER TO BUY THESE SECURITIES IN ANY JURISDICTION WHERE THE OFFER OR SALE IS NOT PERMITTED.
| 108 of 136 | |
| Structural and Collateral Term Sheet | JPMDB 2018-C8 |
| Steelyard Commons | |

THE INFORMATION IN THIS STRUCTURAL AND COLLATERAL TERM SHEET IS NOT COMPLETE AND MAY BE AMENDED PRIOR TO THE TIME OF SALE. THIS TERM SHEET IS NOT AN OFFER TO SELL THESE SECURITIES AND IT IS NOT A SOLICITATION OF AN OFFER TO BUY THESE SECURITIES IN ANY JURISDICTION WHERE THE OFFER OR SALE IS NOT PERMITTED.
| 109 of 136 | |
| Structural and Collateral Term Sheet | JPMDB 2018-C8 |
| Steelyard Commons | |
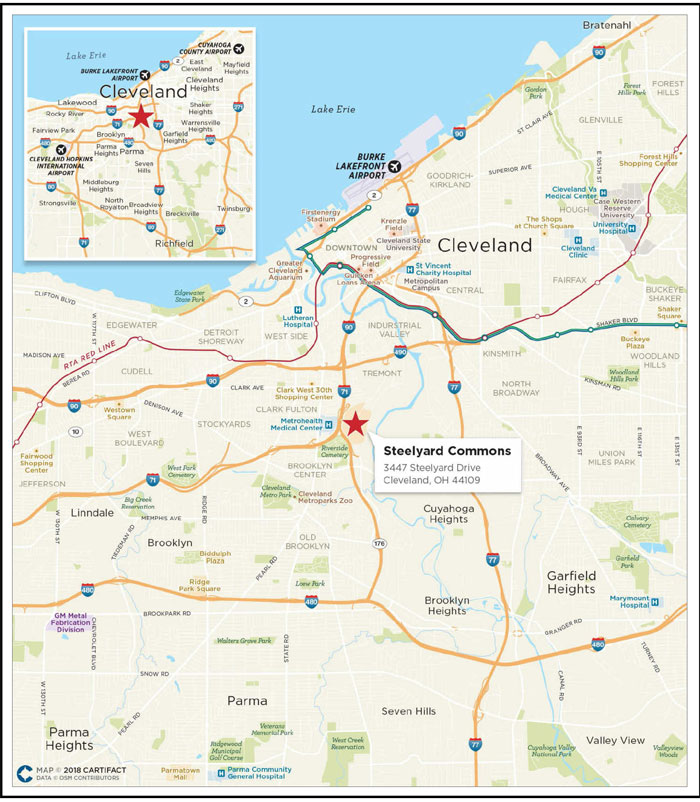
THE INFORMATION IN THIS STRUCTURAL AND COLLATERAL TERM SHEET IS NOT COMPLETE AND MAY BE AMENDED PRIOR TO THE TIME OF SALE. THIS TERM SHEET IS NOT AN OFFER TO SELL THESE SECURITIES AND IT IS NOT A SOLICITATION OF AN OFFER TO BUY THESE SECURITIES IN ANY JURISDICTION WHERE THE OFFER OR SALE IS NOT PERMITTED.
| 110 of 136 | |
| Structural and Collateral Term Sheet | JPMDB 2018-C8 |
| Steelyard Commons | ||||
| Mortgage Loan Information | Property Information | |||
| Mortgage Loan Seller: | GACC | Single Asset / Portfolio: | Single Asset | |
| Original Principal Balance(1): | $30,000,000 | Title: | Fee | |
| Cut-off Date Principal Balance(1): | $30,000,000 | Property Type - Subtype: | Retail – Anchored | |
| % of Pool by IPB: | 4.2% | Net Rentable Area (SF)(3): | 265,386 | |
| Loan Purpose: | Refinance | Location: | Cleveland, OH | |
| Borrower: | F.I. Steelyard Commons LLC | Year Built / Renovated: | 2007-2014 / N/A | |
| Sponsor: | Mitchell C. Schneider | Occupancy(4): | 94.0% | |
| Interest Rate: | 4.85500% | Occupancy Date: | 5/9/2018 | |
| Note Date: | 4/3/2018 | Number of Tenants: | 35 | |
| Maturity Date: | 4/6/2028 | 2015 NOI: | $3,917,389 | |
| Interest-only Period: | 24 months | 2016 NOI(5): | $3,812,189 | |
| Original Term: | 120 months | 2017 NOI(5)(6): | $3,425,944 | |
| Original Amortization: | 360 months | TTM NOI: | N/A | |
| Amortization Type: | IO-Balloon | UW Economic Occupancy(4): | 94.5% | |
| Call Protection(2): | L(26),Def(90),O(4) | UW Revenues: | $9,313,853 | |
| Lockbox / Cash Management: | Hard / Springing | UW Expenses: | $5,157,557 | |
| Additional Debt: | Yes | UW NOI(6): | $4,156,296 | |
| Additional Debt Balance: | $14,250,000 | UW NCF: | $3,903,219 | |
| Additional Debt Type: | Pari Passu | Appraised Value / Per SF: | $59,400,000 / $224 | |
| Appraisal Date: | 2/9/2018 | |||
| Escrows and Reserves(7) | Financial Information(1) | |||||||||||
| Initial | Monthly | Initial Cap | Cut-off Date Loan / SF: | $167 | ||||||||
| Taxes: | $427,774 | $106,943 | N/A | Maturity Date Loan / SF: | $144 | |||||||
| Insurance: | $0 | Springing | N/A | Cut-off Date LTV: | 74.5% | |||||||
| Replacement Reserves: | $0 | $4,423 | N/A | Maturity Date LTV: | 64.2% | |||||||
| TI/LC: | $0 | $16,667 | $1,000,000 | UW NCF DSCR: | 1.39x | |||||||
| Other: | $1,062,594 | $0 | N/A | UW NOI Debt Yield: | 9.4% | |||||||
| Sources and Uses | ||||||||||||
| Sources | Proceeds | % of Total | Uses | Proceeds | % of Total | |||||||
| Mortgage Loan | $44,250,000 | 100.0% | Payoff Existing Debt | $42,074,682 | 95.1% | |||||||
| Upfront Reserves | 1,490,368 | 3.4 | ||||||||||
| Closing Costs | 648,484 | 1.5 | ||||||||||
| Return of Equity | 36,466 | 0.1 | ||||||||||
| Total Sources | $44,250,000 | 100.0% | Total Uses | $44,250,000 | 100.0% | |||||||
| (1) | The Steelyard Commons loan is part of a whole loan evidenced by twopari passu notes with an aggregate outstanding principal balance of $44.25 million. The Financial Information presented in the chart above reflects the $44.25 million aggregate Cut-off Date balance of the Steelyard Commons Whole Loan. |
| (2) | The lockout period for defeasance will be at least 26 payment dates beginning with and including the first payment date of May 6, 2018. Defeasance of the full Steelyard Commons Whole Loan is permitted at any time after the earlier to occur of (i) April 3, 2021 and (ii) two years after the closing date of the final securitization that holds a promissory note evidencing all or a portion of the Steelyard Commons Whole Loan based on the expected JPMDB 2018-C8 securitization closing. The actual lockout period may be longer. |
| (3) | The Steelyard Commons Property represents a 265,386 square foot portion of a 718,821 square foot power center, which is anchored by three non-collateral tenants, Walmart, Target and Home Depot. |
| (4) | Occupancy and UW Economic Occupancy includes 11.3% of the net rentable area leased to Aspire Fitness, which executed a lease in April 2017 with a lease commencement in October 2017. After a six-month free rent period, Aspire Fitness began paying rent in April 2018 and is expected to open for business towards the end of May 2018. |
| (5) | The decrease in NOI from 2016 to 2017 reflects the downtime between Best Buy terminating its lease in March 2017 and the execution of the new lease with Aspire Fitness in April 2017 with rent commencement in April 2018. |
| (6) | The increase in NOI from 2017 to UW is primarily due to the inclusion of rents from newly signed leases in 2017 and 2018 accounting for $438,816 in annual rent and $253,763 in recoveries, which include the new lease for the largest tenant, Aspire Fitness, accounting for 8.0% of in place base rent. |
| (7) | For a full description of Escrows and Reserves, please refer to “Escrows and Reserves” below. |
THE INFORMATION IN THIS STRUCTURAL AND COLLATERAL TERM SHEET IS NOT COMPLETE AND MAY BE AMENDED PRIOR TO THE TIME OF SALE. THIS TERM SHEET IS NOT AN OFFER TO SELL THESE SECURITIES AND IT IS NOT A SOLICITATION OF AN OFFER TO BUY THESE SECURITIES IN ANY JURISDICTION WHERE THE OFFER OR SALE IS NOT PERMITTED.
| 111 of 136 | |
| Structural and Collateral Term Sheet | JPMDB 2018-C8 |
| Steelyard Commons | |
The Loan.The Steelyard Commons loan is secured by a first mortgage lien on the borrower’s fee interest in 265,386 square feet (the “Steelyard Commons Property”) of a 718,821 square foot power center located in Cleveland, Ohio.The whole loan has an outstanding principal balance as of the Cut-off Date of $44.25 million (the “Steelyard CommonsWhole Loan”), and is comprised of twopari passu notes, each as described below. The controlling Note A-1 with an outstanding principal balance as of the Cut-off Date of $30.0 million, will be contributed to the JPMDB 2018-C8 Trust. The remaining note is currently held by DBNY, as described in the “Whole Loan Summary” chart below and have been or are expected to be contributed to one or more securitization trusts.The Steelyard Commons loan has a 10-year term and following a two-year interest only period, will amortize on a 30-year schedule. The previously existing debt was securitized in JPMBB 2013-C12.
| Whole Loan Summary | |||||
| Note | Original Balance | Cut-off Date Balance | Note Holder | Controlling Piece | |
| A-1 | $30,000,000 | $30,000,000 | JPMDB 2018-C8 | Yes | |
| A-2 | 14,250,000 | 14,250,000 | DBNY | No | |
| Total | $44,250,000 | $44,250,000 | |||
The Borrower.The borrowing entity for the Steelyard Commons Whole Loan is F.I. Steelyard Commons LLC, a Delaware limited liability company and special purpose entity.
The Loan Sponsor. The loan sponsor and nonrecourse carve-out guarantor is Mitchell C. Schneider, the founding principal and the current president and chairman of First Interstate Properties, Ltd. (“First Interstate”). First Interstate is a northeast Ohio based full-service real estate development and management company founded in 1989 following Mr. Schneider’s career in real estate development law. First Interstate’s portfolio of 10 properties, inclusive of Steelyard Commons, is located across the state of Ohio and includes eight retail properties currently encompassing approximately 3.6 million square feet, a 450,000 square foot commerce park and a residential development under construction.
The Property. The Steelyard Commons Property represents a265,386 square foot portion of a 718,821 square foot power center, which is anchored by three non-collateral tenants Walmart, Target and Home Depot. A majority of theSteelyard Commonscenter was developed by the sponsor in 2007 on an approximately 47.8-acre former finishing mill site and at a total cost of approximately $54 million (approximately $204 per square foot). In 2014, approximately 82,000 square feet of additional retail space was developed and a 1.5-acre site is under contract to Panda Express which is scheduled to be completed in the second quarter of 2018.
As of May 9, 2018, the Steelyard Commons Property was 94.0% leased to 35 tenants. National tenants at the Steelyard Commons Property include Aldi, Bath & Body Works, Dollar Tree, Marshall’s, Old Navy, Party City, Rue21 and Verizon, among others. There are several restaurant options including Applebee’s, Burger King, Chipotle, Five Guys, IHOP, Jimmy John’s, Steak ’n Shake, and Taco Bell. The largest tenant, Aspire Fitness, executed a 15-year lease that commenced on April 12, 2017, with a free rent period that expired on April 7, 2018. Aspire Fitness, which is a national fitness franchise with 12 existing and 12 planned locations nationwide, executed its lease shortly after Best Buy terminated its lease in March 2017. Best Buy originally closed the store in 2012 as part of its nationwide initiative; however, per the executed lease termination agreement, Best Buy fulfilled all rent obligations under the original lease through January 2018. During the time that they were dark, Best Buy controlled the store and handled the sub leasing of the space. Aspire Fitness is expected to open for business towards the end of May 2018. The Steelyard Commons Whole Loan is structured with an upfront reserve for the remaining tenant improvement allowance obligations with respect to construction of the Aspire Fitness space and for payment of a leasing commission relating to the Aspire Fitness lease (see “Escrows and Reserves” below).
According to the sponsor, the entire power center experienced over $250 million ($330 per square foot) in sales and over seven million annual customers. In 2017, sales per square foot and occupancy cost for tenants reporting sales (which accounts for 45.4% of the Steelyard Commons Property’s net rentable area) was approximately $222.60 and 7.3%, respectively for the 12 month period ending January 31, 2018.
THE INFORMATION IN THIS STRUCTURAL AND COLLATERAL TERM SHEET IS NOT COMPLETE AND MAY BE AMENDED PRIOR TO THE TIME OF SALE. THIS TERM SHEET IS NOT AN OFFER TO SELL THESE SECURITIES AND IT IS NOT A SOLICITATION OF AN OFFER TO BUY THESE SECURITIES IN ANY JURISDICTION WHERE THE OFFER OR SALE IS NOT PERMITTED.
| 112 of 136 | |
| Structural and Collateral Term Sheet | JPMDB 2018-C8 |
| Steelyard Commons | |
The Steelyard Commons Property is located on the outskirts of downtown Cleveland, approximately one mile south of the city’s central business district. Access to the property is provided by Steelyard Drive, a north-south local thoroughfare that also provides access to Interstate 71. Interstate 71 is a primary north-south highway adjacent to the property and passes through Cleveland, Ohio. The highway leads to downtown Cleveland and connecting with Interstate 90 less than a half-mile north of the property. According to the appraisal, the property has a primary trade area consisting of a three-mile radius that contains approximately 134,000 people. The appraisal concluded market rental rates per square foot are $12.00 for anchor space, $19.00 for large in-line anchor space, $22.00 for small in-line space and $32.00 for outparcel space, compared to in place weighted average rental rates per square foot of $10.97 for anchor space, $13.05 for large in-line anchor space, $23.90 for small in-line space and $25.01 for outparcel space. Overall, the weighted average in-place rent of per square foot of approximately $15.83 (net of the antennae lease) is 17.8% below the appraisal concluded weighted average market rent of $19.27.
The appraisal identified seven competing retail centers, noting that the Steelyard Commons Property is superior in comparison as they are all considered Class B retail centers. The comparables range in size from 66,676 square feet to 251,562 square feet. The competitive properties were built between 1929 and 1993 with occupancies ranging from 91.3% to 100.0%.
| Historical and Current Occupancy(1)(2) | ||||
| 2014 | 2015 | 2016 | 2017 | Current(3) |
| 97.9% | 96.6% | 97.6% | 97.8% | 94.0% |
| (1) | Historical Occupancy reflects occupancy of the entire Steelyard Commons power center, inclusive of the non-collateral anchors. |
| (2) | Historical Occupancies are as of December 31 of each respective year. |
| (3) | Current occupancy is as of May 9, 2018. |
| Non-Owned Anchors | ||||
| Tenant | Ratings(1) Moody’s/S&P/Fitch | Net Rentable Area (SF) | Most Recent Sales | Most Recent Sales PSF |
| Walmart | Aa2/AA/AA | 217,941 | NAV | NAV |
| Target | A2/A/A- | 128,075 | NAV | NAV |
| Home Depot | A2/A/A | 103,403 | NAV | NAV |
| (1) | Ratings provided are for the parent company of the entity listed in the “Tenant” field, whether or not the parent company guarantees the lease. |
| Owned Tenant Summary(1) | |||||||
| Tenant | Ratings(2) Moody’s/S&P/Fitch | Net Rentable Area (SF) | % of Total NRA | Base Rent PSF | Sales PSF(3) | Occupancy Costs(3) | Lease Expiration Date |
| Aspire Fitness(4) | NA / NA / NA | 30,038 | 11.3% | $12.00 | NAV | NAV | 10/31/2032 |
| Marshall’s | A2 / A+ / NA | 28,608 | 10.8% | $9.89 | $263 | 3.8% | 5/31/2027 |
| K&G | NA / NA / NA | 22,410 | 8.4% | $12.00 | NAV | NAV | 8/31/2023 |
| Party City(5) | NA / NA / NA | 20,388 | 7.7% | $9.43 | $76 | 12.4% | 12/31/2025 |
| Old Navy | Baa2 / BB+ / BB+ | 19,000 | 7.2% | $14.50 | $190 | 7.6% | 7/31/2022 |
| Aldi | NA / NA / NA | 15,808 | 6.0% | $6.17 | NAV | NAV | 11/30/2028 |
| Petco | NA / CCC+ / NA | 15,261 | 5.8% | $16.00 | NAV | NAV | 5/31/2022 |
| Dollar Tree | Baa3 / BBB- / NA | 12,000 | 4.5% | $12.00 | NAV | NAV | 5/31/2022 |
| Rainbow Apparel | NA / NA / NA | 10,625 | 4.0% | $23.50 | $149 | 15.7% | 1/31/2023 |
| Famous Footwear | Ba3 / BB / BB+ | 7,020 | 2.6% | $17.75 | $271 | 6.6% | 3/31/2022 |
| (1) | Based on the underwritten rent roll dated May 9, 2018. |
| (2) | Ratings provided are for the parent company of the entity listed in the “Tenant” field, whether or not the parent company guarantees the lease. |
| (3) | Sales PSF and Occupancy Costs represent sales for the trailing 12-month period ending January 31, 2018 for tenants that report sales. |
| (4) | Aspire Fitness, which executed a lease in April 2017 is expected to open for business towards the end of May 2018. |
| (5) | Party City may terminate its lease between December 1, 2020 and January 27, 2021, with 12-months’ notice and the satisfaction of each of the following conditions: (i) Party City has continuously operated in the Steelyard Commons Property between December 1, 2018 and November 30, 2020 (ii) sales between December 1, 2019 and November 30, 2020 have not exceeded $1.7 million (compared to approximately $1.5 million reported as of the trailing 12-month period ended January 31, 2018) and (iii) subject to a termination fee of remaining unamortized portion of the improvement allowance. |
THE INFORMATION IN THIS STRUCTURAL AND COLLATERAL TERM SHEET IS NOT COMPLETE AND MAY BE AMENDED PRIOR TO THE TIME OF SALE. THIS TERM SHEET IS NOT AN OFFER TO SELL THESE SECURITIES AND IT IS NOT A SOLICITATION OF AN OFFER TO BUY THESE SECURITIES IN ANY JURISDICTION WHERE THE OFFER OR SALE IS NOT PERMITTED.
| 113 of 136 | |
| Structural and Collateral Term Sheet | JPMDB 2018-C8 |
| Steelyard Commons | |
Lease Rollover Schedule(1)(2)(3) | |||||||||
Year | Number of Leases Expiring | Net Rentable Area Expiring | % of NRA Expiring | Base Rent Expiring | % of Base Rent Expiring | Cumulative Net Rentable Area Expiring | Cumulative % of NRA Expiring | Cumulative Base Rent Expiring | Cumulative % of Base Rent Expiring |
| Vacant | NAP | 15,942 | 6.0% | NAP | NAP | 15,942 | 6.0% | NAP | NAP |
| 2018 & MTM | 1 | 3,382 | 1.3% | $116,882 | 3.0% | 19,324 | 7.3% | $116,882 | 3.0% |
| 2019 | 2 | 4,925 | 1.9% | 113,088 | 2.9% | 24,249 | 9.1% | $229,969 | 5.8% |
| 2020(4) | 2 | 1,862 | 0.7% | 63,351 | 1.6% | 26,111 | 9.8% | $293,320 | 7.4% |
| 2021 | 0 | 0 | 0.0% | 0 | 0.0% | 26,111 | 9.8% | $293,320 | 7.4% |
| 2022 | 15 | 77,321 | 29.1% | 1,454,865 | 36.8% | 103,432 | 39.0% | $1,748,186 | 44.2% |
| 2023 | 4 | 37,535 | 14.1% | 628,107 | 15.9% | 140,967 | 53.1% | $2,376,293 | 60.1% |
| 2024 | 0 | 0 | 0.0% | 0 | 0.0% | 140,967 | 53.1% | $2,376,293 | 60.1% |
| 2025 | 1 | 20,388 | 7.7% | 192,259 | 4.9% | 161,355 | 60.8% | $2,568,552 | 64.9% |
| 2026 | 2 | 6,675 | 2.5% | 153,564 | 3.9% | 168,030 | 63.3% | $2,722,116 | 68.8% |
| 2027 | 4 | 42,691 | 16.1% | 591,533 | 14.9% | 210,721 | 79.4% | $3,313,649 | 83.7% |
| 2028 | 3 | 24,627 | 9.3% | 282,850 | 7.1% | 235,348 | 88.7% | $3,596,499 | 90.9% |
| 2029 & Beyond | 1 | 30,038 | 11.3% | 360,456 | 9.1% | 265,386 | 100.0% | $3,956,955 | 100.0% |
| Total | 35 | 265,386 | 100.0% | $3,956,955 | 100.0% | ||||
| (1) | Based on the underwritten rent roll dated May 9, 2018. |
| (2) | Certain tenants may have termination or contraction options (which may become exercisable prior to the originally stated expiration date of the tenant lease) that are not considered in the above Lease Rollover Schedule. |
| (3) | Lease Rollover Schedule is not inclusive of square footage associated with the non-collateral anchor tenants (Walmart, Target and Home Depot). |
| (4) | 2020 includes a cell phone tower with no attributable square footage accounting for $7,491 in underwritten base rent. |
Operating History and Underwritten Net Cash Flow | |||||||
| 2014 | 2015 | 2016(1) | 2017(1)(2) | Underwritten(2) | Per Square Foot | %(3) | |
| Rents in Place | $4,070,974 | $3,944,392 | $3,906,247 | $3,618,955 | $3,956,955 | $14.91 | 40.3% |
| Rent Steps(4) | 0 | 0 | 0 | 0 | 47,386 | 0.18 | 0.5% |
| Vacant Income | 0 | 0 | 0 | 0 | 546,024 | 2.06 | 5.6% |
| Gross Potential Rent | $4,070,974 | $3,944,392 | $3,906,247 | $3,618,955 | $4,550,365 | $17.15 | 46.3% |
| Reimbursements | 4,830,462 | 4,704,960 | 4,770,126 | 4,772,507 | 5,269,807 | 19.86 | 53.7% |
| Net Rental Income | $8,901,436 | $8,649,352 | $8,676,373 | $8,391,462 | $9,820,172 | $37.00 | 100.0% |
| (Vacancy/Credit Loss) | 0 | 0 | 0 | 0 | (546,024) | (2.06) | (5.6)% |
| Other Income | 54,267 | 43,218 | 38,913 | 45,663 | 39,705 | 0.15 | 0.4% |
| Effective Gross Income | $8,955,703 | $8,692,570 | $8,715,286 | $8,437,125 | $9,313,853 | $35.10 | 94.8% |
| Total Expenses | $4,687,327 | $4,775,181 | $4,903,097 | $5,011,181 | 5,157,557 | $19.43 | 55.4% |
| Net Operating Income | $4,268,376 | $3,917,389 | $3,812,189 | $3,425,944 | $4,156,296 | $15.66 | 44.6% |
| Total TI/LC, Capex/RR | 0 | 0 | 0 | 0 | 253,077 | 0.95 | 2.7% |
| Net Cash Flow | $4,268,376 | $3,917,389 | $3,812,189 | $3,425,944 | $3,903,219 | $14.71 | 41.9% |
| (1) | The decrease in NOI from 2016 to 2017 reflects the downtime between Best Buy terminating its lease in March 2017 and the execution of the new lease with Aspire Fitness in April 2017 with rent commencement in April 2018. |
| (2) | The increase in NOI from 2017 to UW is primarily due to the inclusion of rents from newly signed leases in 2017 and 2018 accounting for $438,816 in annual rent and $253,763 in recoveries, which include the new lease for the largest tenant, Aspire Fitness, accounting for 8.0% of in place base rent. |
| (3) | % column represents percent of Net Rental Income for all revenue lines and percent of Effective Gross Income for the remainder of fields. |
| (4) | Underwritten Rent Steps taken through January 2019. |
Property Management.The Steelyard Commons Property is managed by First Interstate Properties, Ltd., an affiliate of the borrower.
Escrows and Reserves.At origination, the borrower deposited approximately $901,140 for remaining tenant improvement allowance obligations relating to the Aspire Fitness lease, $427,774 for real estate taxes and $161,454 for payment of a leasing commission relating to the Aspire Fitness lease.
Tax Escrows– On a monthly basis, the borrower is required to escrow 1/12 of the annual estimated tax payments, which currently equates to approximately $106,943.
THE INFORMATION IN THIS STRUCTURAL AND COLLATERAL TERM SHEET IS NOT COMPLETE AND MAY BE AMENDED PRIOR TO THE TIME OF SALE. THIS TERM SHEET IS NOT AN OFFER TO SELL THESE SECURITIES AND IT IS NOT A SOLICITATION OF AN OFFER TO BUY THESE SECURITIES IN ANY JURISDICTION WHERE THE OFFER OR SALE IS NOT PERMITTED.
| 114 of 136 | |
| Structural and Collateral Term Sheet | JPMDB 2018-C8 |
| Steelyard Commons | |
Insurance Escrows– The requirement for the borrower to make monthly deposits into the insurance escrow is waived provided that the borrower has provided the lender with reasonably satisfactory evidence that the Steelyard Commons Property is insured under a blanket insurance policy in accordance with the loan agreement.
Replacement Reserves – On a monthly basis, the borrower is required to escrow approximately $4,423 (approximately $0.20 per square foot annually) for replacement reserves.
TI/LC Reserves – On a monthly basis, the borrower is required to escrow approximately $16,667 (approximately $0.75 per square foot annually) for tenant improvements and leasing commissions. The tenant improvement and leasing commission reserve is subject to a cap of $1,000,000 (approximately $3.77 per square foot).
Lockbox / Cash Management.The Steelyard Commons Whole Loan is structured with a hard lockbox and springing cash management. The tenants are required to deposit all revenues directly into a lender controlled lockbox account. Prior to the occurrence of a Trigger Period (as defined below), on each business day all funds in the lockbox account are required to be transferred to or at the direction of the borrower. Upon the occurrence and during the continuance of a Trigger Period, all funds in the lockbox account are required to be swept on each business day to a segregated cash management account under the control of the lender and disbursed on each payment date in accordance with the loan documents. To the extent a Trigger Period (as defined below) is continuing, all excess cash flow on deposit in the cash management account is required to be held in the excess cash flow subaccount as additional collateral. The lender has been granted a first priority security interest in the cash management account.
A “Trigger Period” means the occurrence of (i) an event of default or the (ii) the date that the debt service coverage ratio, as calculated in the loan documents at the end of each calendar quarter, falls below 1.15x.
A Trigger Period may be cured (a) with respect to clause (i) above, upon the acceptance by the lender of a cure of such event of default, (b) with respect to clause (ii) above, upon the achievement of a debt service coverage ratio of 1.15x or greater for two consecutive calendar quarters.
THE INFORMATION IN THIS STRUCTURAL AND COLLATERAL TERM SHEET IS NOT COMPLETE AND MAY BE AMENDED PRIOR TO THE TIME OF SALE. THIS TERM SHEET IS NOT AN OFFER TO SELL THESE SECURITIES AND IT IS NOT A SOLICITATION OF AN OFFER TO BUY THESE SECURITIES IN ANY JURISDICTION WHERE THE OFFER OR SALE IS NOT PERMITTED.
| 115 of 136 | |
| Structural and Collateral Term Sheet | JPMDB 2018-C8 | |
| Constitution Plaza | ||
| Mortgage Loan Information | Property Information | |||
| Mortgage Loan Seller: | BSP | Single Asset / Portfolio: | Single Asset | |
| Original Principal Balance(1): | $30,000,000 | Title: | Fee | |
| Cut-off Date Principal Balance(1): | $29,975,491 | Property Type - Subtype: | Office – CBD | |
| % of Pool by IPB: | 4.2% | Net Rentable Area (SF): | 659,315 | |
| Loan Purpose: | Refinance | Location: | Hartford, CT | |
| Borrower: | Constitution Plaza Holding LLC | Year Built / Renovated: | 1962-1963 / 2004 | |
| Sponsor: | Aaron Berger | Occupancy: | 82.8% | |
| Interest Rate: | 5.99000% | Occupancy Date: | 4/1/2018 | |
| Note Date: | 4/18/2018 | Number of Tenants: | 32 | |
| Maturity Date: | 5/6/2023 | 2015 NOI: | $6,668,231 | |
| Interest-only Period: | None | 2016 NOI: | $6,898,989 | |
| Original Term: | 60 months | 2017 NOI: | $5,072,276 | |
| Original Amortization(2): | 357 months | TTM NOI: | N/A | |
| Amortization Type: | Balloon | UW Economic Occupancy: | 87.6% | |
| Call Protection(3): | L(25),Def(31),O(4) | UW Revenues: | $15,719,218 | |
| Lockbox / Cash Management(4): | Hard / Springing | UW Expenses: | $9,170,725 | |
| Additional Debt: | Yes | UW NOI: | $6,548,493 | |
| Additional Debt Balance: | $24,979,576 / $10,000,000 | UW NCF: | $5,665,607 | |
| Additional Debt Type: | Pari Passu / Mezzanine Loan | Appraised Value / Per SF: | $94,400,000 / $143 | |
| Appraisal Date: | 2/1/2018 | |||
| Escrows and Reserves | Financial Information(1) | |||||
| Initial | Monthly | Initial Cap | Cut-off Date Loan / SF: | $83 | ||
| Taxes: | $927,676 | $309,225 | N/A | Maturity Date Loan / SF: | $78 | |
| Insurance: | $0 | $19,223 | N/A | Cut-off Date LTV: | 58.2% | |
| Replacement Reserves: | $0 | $10,989 | N/A | Maturity Date LTV: | 54.4% | |
| TI/LC: | $0 | $68,679 | N/A | UW NCF DSCR: | 1.43x | |
| Other(5): | $4,022,202 | $3,797 | N/A | UW NOI Debt Yield: | 11.9% | |
| Sources and Uses | ||||||
| Sources | Proceeds | % of Total | Uses | Proceeds | % of Total | |
| Mortgage Loan(1) | $55,000,000 | 83.1% | Payoff Existing Debt | $57,218,691 | 86.4% | |
| Mezzanine Loan | 10,000,000 | 15.1 | Upfront Reserves | 4,949,877 | 7.5 | |
| Sponsor Equity | 1,189,584 | 1.8 | Closing Costs(6) | 4,021,016 | 6.1 | |
| Total Sources | $66,189,584 | 100.0% | Total Uses | $66,189,584 | 100.0% | |
| (1) | The Constitution Plaza loan is part of a whole loan evidenced by threepari passu notes with an aggregate original principal balance of $55.0 million. The Financial Information presented in the chart above reflects the $54,955,068 aggregate Cut-off Date balance of the Constitution Plaza Whole Loan (as defined below). |
| (2) | The Constitution Plaza Whole Loan will amortize in accordance with “Annex F – Assumed Principal Payment Schedule for the Constitution Plaza Whole Loan” in the Preliminary Prospectus. |
| (3) | The lockout period will be at least 25 payment dates beginning with and including the first payment date of June 6, 2018. Defeasance of the full $55.0 million Constitution Plaza Whole Loan is permitted after the date that is two years from the closing date of the securitization that includes the last note to be securitized based on the JPMDB 2018-C8 Cut-off Date. Actual lockout period may be longer. |
| (4) | In-place cash management shall commence upon (i) an event of default, (ii) DSCR being less than 1.10x, (iii) occurrence of a specified tenant sweep event, (iv) a mezzanine loan event of default. At origination, cash management for the Constitution Plaza Whole Loan was in-place and all excess cash flow will be swept until (i) an additional $750,000 has been deposited into the landlord obligations reserve and (ii) $325,000 has been paid to MSCO Real Estate Advisors LLC. |
| (5) | Initial Other Escrows and Reserves consist of (i) an initial deposit of $2,528,403 into the landlord obligations reserve, (ii) an initial deposit of $1,299,539 for gap rent and rent abatements related to the Trinity College and Black & Decker leases, (iii) an initial deposit of $152,500 for immediate repairs and (iv) an initial deposit of $41,760 into the Hartford BID reserve. On each monthly payment date beginning in June 2018 through the payment date in June 2022, $3,797 will be escrowed into the Hartford BID reserve account in connection with payments due to the Hartford BID, per The City of Hartford lease. |
| (6) | The City of Hartford executed an 11-year lease extension retroactively effective as of July 1, 2017. Prior to the execution of the lease extension, The City of Hartford had been paying holdover rent. Under the lease extension, The City of Hartford received eight months of free rent, totaling approximately $2.2 million. At origination, approximately $2.2 million was remitted to The City of Hartford in connection with the reimbursement of free rent payments. This payment to The City of Hartford is included in the calculation of closing costs. |
THE INFORMATION IN THIS STRUCTURAL AND COLLATERAL TERM SHEET IS NOT COMPLETE AND MAY BE AMENDED PRIOR TO THE TIME OF SALE. THIS TERM SHEET IS NOT AN OFFER TO SELL THESE SECURITIES AND IT IS NOT A SOLICITATION OF AN OFFER TO BUY THESE SECURITIES IN ANY JURISDICTION WHERE THE OFFER OR SALE IS NOT PERMITTED.
| 116 of 136 | |
| Structural and Collateral Term Sheet | JPMDB 2018-C8 | |
| Constitution Plaza | ||
The Loan.The Constitution Plaza loan is secured by a first mortgage lien on the borrower’s fee interest in an office complex comprised of six office buildings and two parking garage structures located in Hartford, Connecticut.
The whole loan has an outstanding principal balance as of the Cut-off Date of $54,955,068 (the “Constitution Plaza Whole Loan”), and is comprised of threepari passu notes, each as described below. The Constitution Plaza Whole Loan requires payments of interest and principal sufficient to amortize the loan over a 30-year amortization schedule, as set forth in Annex F of the Preliminary Prospectus. The controlling note, A-1, with an outstanding principal balance as of the Cut-off Date of $29,975,491 will be contributed to the JPMDB 2018-C8 Trust. The remaining notes are currently held by BSPRT Finance, LLC (“BSP”) as described in the “Whole Loan Summary” chart below and are expected to be contributed to one or more securitization trusts. The Constitution Plaza Whole Loan and the Constitution Plaza Mezzanine Loan (as defined below) are both structured with a five-year term and will mature on May 6, 2023. The Constitution Plaza property was previously securitized in FORT CRE 2016-1.
| Whole Loan Summary | |||||
| Note | Original Balance | Cut-off Date Balance | Note Holder | Controlling Piece | |
| A-1 | $30,000,000 | $29,975,491 | JPMDB 2018-C8 | Yes | |
| A-2 | 20,000,000 | 19,983,661 | BSP | No | |
| A-3 | 5,000,000 | 4,995,915 | BSP | No | |
| Total | $55,000,000 | $54,955,068 | |||
The Borrower. The Constitution Plaza borrower is Constitution Plaza Holding LLC, a Delaware limited liability company. The loan sponsor and nonrecourse carve-out guarantor is Aaron Berger, a private commercial real estate investor with a current portfolio totaling approximately 2.3 million square feet, primarily comprised of commercial and residential properties in the New York metro area.
The Property.The Constitution Plaza property is a 659,315 square foot office complex comprised of six Class A and Class B office buildings and two parking garages, located in downtown Hartford, Connecticut. The office buildings at the Constitution Plaza property were constructed between 1962 and 1963 and were renovated most recently in 2004. The office buildings range in size from single-story to 20-stories in height. The Constitution Plaza property features institutional quality office space, large conference rooms and lobbies, and window-to-window views of the Connecticut River and the city of Hartford’s high-rise buildings. Office buildings within the complex are situated around a northern and a southern common area plaza, which are connected via a pedestrian bridge and offer landscaped gardens, artistic sculptures, fountains, and outdoor seating. In addition to office space, the Constitution Plaza property provides the largest parking structure offered by any office building in Hartford through its two, four- and five-story enclosed parking garages, providing 1,634 underground parking spaces (approximately 2.5 spaces per 1,000 square feet).
The Constitution Plaza property benefits from frontage along State Street, Main Street, and Market Street and is highly accessible via a range of transportation options, including immediate access to Interstate 84 and Interstate 91, two of Connecticut’s major arteries, and is within walking distance of Connecticut Transit and Amtrak for local and commuter bus and train services. Amenities within the immediate area of the Constitution Plaza property include numerous shops, restaurants, hotels, and other attractions, such as the XL Center, a multi-purpose arena and convention center, and the State Convention Center. Bradley International Airport is a fifteen-minute drive from the Constitution Plaza property.
As of April 1, 2018, the Constitution Plaza property was 82.8% leased. The largest tenant, XL America, Inc (“XL America”), occupies approximately 19.1% of net rentable area through December 2027 and accounts for approximately 23.4% of underwritten base rent. XL America is a wholly owned subsidiary of XL Group, which offers insurance and reinsurance coverage services. As of year-end 2017, XL Group employed over 7,000 employees in 100 offices across 20 countries. XL America has expanded eight times at the Constitution Plaza property since originally taking occupancy in May 2005, more than tripling its original space of 38,095 square feet. The second largest tenant, Shipman & Goodwin, LLP (“Shipman & Goodwin”) occupies approximately 16.7% of net rentable area through July 2026 and accounts for approximately 20.2% of underwritten base rent. Shipman & Goodwin was founded in 1919 and provides award-winning law services to regional, national and international clients in a variety of fields. Shipman & Goodwin has an option to terminate its lease on one full floor of the property under its lease. Shipman & Goodwin took occupancy in 2003.The third largest tenant, UCONN School of Business, occupies approximately 9.6% of net rentable area through June 2027 and accounts for approximately 11.9% of underwritten base rent. Founded in 1941, the UCONN School of Business has evolved into one of the most comprehensive business schools in the nation, offering academic programs at the bachelor’s, master’s and doctorate levels and offering a variety of disciplines, such as accounting, management, marketing, and operations. The UCONN School of Business took occupancy in 2004 and has expanded at their space at the property from 39,081 square feet to 63,241 square feet. Other prominent tenants at the Constitution Plaza property include The City of Hartford, the State of Connecticut Department of Banking, Black & Decker and Trinity College.
THE INFORMATION IN THIS STRUCTURAL AND COLLATERAL TERM SHEET IS NOT COMPLETE AND MAY BE AMENDED PRIOR TO THE TIME OF SALE. THIS TERM SHEET IS NOT AN OFFER TO SELL THESE SECURITIES AND IT IS NOT A SOLICITATION OF AN OFFER TO BUY THESE SECURITIES IN ANY JURISDICTION WHERE THE OFFER OR SALE IS NOT PERMITTED.
| 117 of 136 | |
| Structural and Collateral Term Sheet | JPMDB 2018-C8 | |
| Constitution Plaza | ||
Recent leasing momentum at the Constitution Plaza property has been strong, with an aggregate of 302,390 square feet of extension or new leasing at the Constitution Plaza property since January 2016, representing approximately 45.9% of the property’s net rentable area. Overall, tenancy at the Constitution Plaza property has a weighted average lease term of 8.5 years and a weighted average remaining lease term of 6.3 years.
The Market. The Constitution Plaza property is located in the Hartford-West Hartford-East Hartford metropolitan statistical area of Hartford, Connecticut. The city of Hartford is nicknamed “The Insurance Capital of the World” as it houses many of the world’s largest insurance companies, including Aetna, MassMutual and United Health. The Hartford metropolitan statistical area is home to several universities, including Trinity College, and the University of Connecticut, both of which are tenants at the Constitution Plaza property, the University of Hartford, Hartford Seminary and Capital Community College. The Hartford metropolitan area is ranked second nationally per capita in economic activity. Top employers in the area include United Technologies, Hartford Financial Services Group, Aetna, St. Paul Travelers and Hartford Hospital.
In June 2017, Hartford and East Hartford won grants under the State of Connecticut’s new Innovation Places program, which will provide up to $2 million in grants to promote and develop start-up and technology firms in the city. The first project of the Innovation Places program was Hartford InsurTech Hub, a business accelerator which will partner with local insurance companies to develop new technologies for their operations. It is expected that similar future projects will be established through the Innovation Places program.
Construction projects near the Constitution Plaza property include the University of Connecticut’s new downtown Hartford campus and urban quad, which opened in September 2017 and has brought 2,500 graduate and undergraduate students and 250 faculty members to the Hartford central business district and will further integrate the University of Connecticut’s space at the property. Additionally, Trinity College has announced their new “Liberal Arts Action Lab” at their space at the property and Black & Decker announced it will open its new advanced manufacturing training center for start-up business and new technologies at the property.
According to Costar, as of 2017, the city of Hartford office market contained approximately 23.2 million square feet of office space with an overall vacancy rate of 7.6% and an average asking rent of $21.12 per square foot. Since 2013, vacancy has decreased by 4.8% and asking rents have increased by 6.9%. According to the appraisal, the 2017 population within a one-, three-and five- mile radius of the Constitution Plaza property was 13,307, 149,637 and 274,658, respectively. The 2017 average household income in a one-, three- and five- mile radius was $53,331, $53,313, and $75,375, respectively.
| Tenant Summary(1) | ||||||
| Tenant | Ratings(2) Moody’s/S&P/Fitch | Net Rentable Area (SF) | % of Total NRA | Base Rent PSF | % of Base Rent | Lease Expiration Date |
| XL America, Inc | NA / A- / NA | 126,183 | 19.1% | $22.22 | 23.4% | 12/31/2027 |
| Shipman & Goodwin, LLP(3) | NA / NA / NA | 110,145 | 16.7% | $22.00 | 20.2% | 7/31/2026 |
| UCONN School of Business | A1/AA-/A | 63,241 | 9.6% | $22.50 | 11.9% | 6/30/2027 |
| The City of Hartford(4) | B2 / BB+ / NA | 47,954 | 7.3% | $19.50 | 7.8% | 6/30/2028 |
| State of Connecticut Department of Banking(5) | A1 / A / A+ | 30,144 | 4.6% | $24.53 | 6.2% | 12/31/2020 |
| Black & Decker | Baa1 / A / A- | 23,051 | 3.5% | $22.00 | 4.2% | 4/30/2024 |
| Trinity College(6) | NA / NA / NA | 20,955 | 3.2% | $21.62 | 3.8% | 12/31/2032 |
| University of Connecticut | A1 / AA- / A | 14,178 | 2.2% | $24.59 | 2.9% | 8/31/2022 |
| BL Companies (Equipower Sublease) | NA / NA / NA | 12,108 | 1.8% | $15.00 | 1.5% | 1/31/2021 |
| Morrison Mahoney, LLP | NA / NA / NA | 11,900 | 1.8% | $20.45 | 2.0% | 4/30/2019 |
| (1) | Based on the underwritten rent roll dated April 1, 2018. |
| (2) | Ratings provided are for the parent company of the entity listed in the “Tenant” field, whether or not the parent company guarantees the lease. |
| (3) | Shipman & Goodwin, LLP has an option to terminate its lease on one full floor of the property (10,977 SF). |
| (4) | The City of Hartford may cancel its lease, effective on the last business day of any month after February 28, 2023, provided that (i) 12 months’ notice is provided prior to the cancellation date and (ii) the tenant has elected to relocate to a property owned by itself and has relocated to such property. |
| (5) | The State of Connecticut Department of Banking may terminate its lease after the third year anniversary of its lease term, January 1, 2019, in the event that space becomes available in a state-owned facility and the tenant moves into a State of Connecticut owned facility. Any such termination shall require a least 180 days in advance of the lease termination date. |
| (6) | Trinity College has not yet taken occupancy of its space in the 1 Constitution Plaza building. The lease commenced on April 16, 2018 and Trinity College will receive free rent on the space until three years after the lease commencement date; free rent in connection with the Trinity College space was reserved upfront at origination. |
THE INFORMATION IN THIS STRUCTURAL AND COLLATERAL TERM SHEET IS NOT COMPLETE AND MAY BE AMENDED PRIOR TO THE TIME OF SALE. THIS TERM SHEET IS NOT AN OFFER TO SELL THESE SECURITIES AND IT IS NOT A SOLICITATION OF AN OFFER TO BUY THESE SECURITIES IN ANY JURISDICTION WHERE THE OFFER OR SALE IS NOT PERMITTED.
| 118 of 136 | |
| Structural and Collateral Term Sheet | JPMDB 2018-C8 | |
| Constitution Plaza | ||
| Lease Rollover Schedule(1)(2) | |||||||||
| Year | Number of Leases Expiring | Net Rentable Area Expiring | % of NRA Expiring | Base Rent Expiring | % of Base Rent Expiring | Cumulative Net Rentable Area Expiring | Cumulative % of NRA Expiring | Cumulative Base Rent Expiring | Cumulative % of Base Rent Expiring |
| Vacant | NAP | 113,701 | 17.2% | NAP | NAP | 113,701 | 17.2% | NAP | NAP |
| 2018 & MTM | 7 | 14,541 | 2.2 | $280,694 | 2.3% | 128,242 | 19.5% | $280,694 | 2.3% |
| 2019 | 4 | 27,720 | 4.2 | 613,849 | 5.1 | 155,962 | 23.7% | $894,543 | 7.5% |
| 2020 | 2 | 40,421 | 6.1 | 1,011,917 | 8.4 | 196,383 | 29.8% | $1,906,459 | 15.9% |
| 2021 | 5 | 26,206 | 4.0 | 518,996 | 4.3 | 222,589 | 33.8% | $2,425,456 | 20.2% |
| 2022 | 6 | 39,211 | 5.9 | 898,174 | 7.5 | 261,800 | 39.7% | $3,323,630 | 27.7% |
| 2023 | 2 | 5,986 | 0.9 | 110,530 | 0.9 | 267,786 | 40.6% | $3,434,159 | 28.7% |
| 2024 | 1 | 23,051 | 3.5 | 507,122 | 4.2 | 290,837 | 44.1% | $3,941,281 | 32.9% |
| 2025 | 0 | 0 | 0.0 | 0 | 0.0 | 290,837 | 44.1% | $3,941,281 | 32.9% |
| 2026 | 1 | 110,145 | 16.7 | 2,423,158 | 20.2 | 400,982 | 60.8% | $6,364,439 | 53.1% |
| 2027 | 2 | 189,424 | 28.7 | 4,227,179 | 35.3 | 590,406 | 89.5% | $10,591,618 | 88.4% |
| 2028 | 1 | 47,954 | 7.3 | 935,103 | 7.8 | 638,360 | 96.8% | $11,526,721 | 96.2% |
| 2029 & Beyond | 1 | 20,955 | 3.2 | 453,091 | 3.8 | 659,315 | 100.0% | $11,979,812 | 100.0% |
| Total | 32 | 659,315 | 100.0% | $11,979,812 | 100.0% | ||||
| (1) | Based on the underwritten rent roll dated April 1, 2018 and includes rent steps through March 1, 2019. |
| (2) | Certain tenants may have termination or contraction options (which may become exercisable prior to the originally stated expiration date of the tenant lease) that are not considered in the above Lease Rollover Schedule. |
| Underwritten Net Cash Flow(1) | ||||||
| 2015 | 2016 | 2017 | Underwritten | Per Square Foot | %(1) | |
| Rents in Place(2) | $11,562,467 | $11,068,017 | $9,549,631 | $11,979,812 | $18.17 | 82.3% |
| Straight Line Rent | 0 | 0 | 0 | 37,846 | 0.06 | 0.3 |
| Vacant Income and Recoveries | 0 | 0 | 0 | 1,801,396 | 2.73 | 12.4 |
| Gross Potential Rent | $11,562,467 | $11,068,017 | $9,549,631 | $13,819,053 | $20.96 | 94.9% |
| Total Reimbursements | 1,168,576 | 1,270,607 | 804,472 | 740,846 | 1.12 | 5.1 |
| Net Rental Income | $12,731,042 | $12,338,624 | $10,354,102 | $14,559,899 | $22.08 | 100.0% |
| (Vacancy/Credit Loss) | 0 | 0 | 0 | (1,801,396) | (2.73) | (12.4) |
| Other Income | 2,808,496 | 2,789,907 | 2,960,714 | 2,960,714 | 4.49 | 20.3 |
| Effective Gross Income | $15,539,538 | $15,128,531 | $13,314,816 | $15,719,218 | $23.84 | 108.0% |
| Total Expenses | $8,871,307 | $8,229,542 | $8,242,540 | $9,170,725 | $13.91 | 58.3% |
| Net Operating Income | $6,668,231 | $6,898,989 | $5,072,276 | $6,548,493 | $9.93 | 41.7% |
| Total TI/LC, Capex/RR(3) | 956,007 | 956,007 | 956,007 | 882,886 | 1.34 | 5.6 |
| Net Cash Flow | $5,712,224 | $5,942,982 | $4,116,269 | $5,665,607 | $8.59 | 36.0% |
| Occupancy | 79.6% | 79.6% | 79.1% | 82.8% | ||
| (1) | % column represents the percent of Net Rental Income for all revenue lines and represents percent of Effective Gross Income for the remainder of the fields. |
| (2) | Underwritten Rents in Place includes contractual rent steps through March 1, 2019. |
| (3) | Underwritten Total TI/LC, Capex/RR includes the required Hartford BID Payment of $45,556. |
Additional Debt.On April 18, 2018, BSP originated a mezzanine loan with an outstanding principal balance as of the Cut-off date of $10.0 million (the “Constitution Plaza Mezzanine Loan”) to Constitution Plaza Mezz LLC. As of the Cut-off Date, BSP is the holder of the Constitution Plaza Mezzanine Loan. Constitution Plaza Mezz LLC is 100% controlled by Constitution Plaza Holding LLC, the borrower of the Constitution Plaza Whole Loan. The Constitution Plaza Mezzanine Loan is interest-only with an interest rate of 10.34500%per annum and is co-terminous with the Constitution Plaza Whole Loan. The Cut-off Date LTV and NCF DSCR on the combined Constitution Plaza Whole Loan and Constitution Plaza Mezzanine Loan is 68.8% and 1.13x, respectively.
The Constitution Plaza Whole Loan documents give the borrower a one-time right to obtain additional mezzanine financing only if the debt is obtained in connection with (i) a transfer of the property and assumption of the Constitution Plaza Whole Loan, (ii) the mezzanine lender does not approve of such transfer and related assumption under the Constitution Plaza Mezzanine Loan documents, and (iii) the Constitution Plaza Mezzanine Loan will be fully repaid in accordance with the terms of the loan documents. The replacement mezzanine financing must satisfy the following conditions, among others, (i) no event of default has occurred or is continuing and (ii) after giving effect to the permitted mezzanine loan, (a) the LTV will not be greater than 68.9% and (b) DSCR shall not be less than 1.13x.
THE INFORMATION IN THIS STRUCTURAL AND COLLATERAL TERM SHEET IS NOT COMPLETE AND MAY BE AMENDED PRIOR TO THE TIME OF SALE. THIS TERM SHEET IS NOT AN OFFER TO SELL THESE SECURITIES AND IT IS NOT A SOLICITATION OF AN OFFER TO BUY THESE SECURITIES IN ANY JURISDICTION WHERE THE OFFER OR SALE IS NOT PERMITTED.
| 119 of 136 | |
| Structural and Collateral Term Sheet | JPMDB 2018-C8 | |
| U-Haul AREC 27 Portfolio | ||
| Mortgage Loan Information | Property Information | |||
| Mortgage Loan Seller: | JPMCB | Single Asset / Portfolio: | Portfolio | |
| Original Principal Balance: | $28,500,000 | Title(2): | Fee | |
| Cut-off Date Principal Balance: | $28,397,637 | Property Type - Subtype: | Self Storage – Self Storage | |
| % of Pool by IPB: | 4.0% | Net Rentable Area (Units): | 4,445 | |
| Loan Purpose: | Recapitalization | Location: | Various | |
| Borrowers: | AREC 27, LLC and UHIL 27, LLC | Year Built / Renovated: | Various / Various | |
| Sponsor: | AMERCO | Occupancy: | 91.1% | |
| Interest Rate: | 4.33500% | Occupancy Date: | 3/31/2018 | |
| Note Date: | 3/29/2018 | Number of Tenants: | N/A | |
| Anticipated Repayment Date(1): | 4/1/2028 | 2015 NOI(3): | N/A | |
| Final Maturity Date(1): | 4/1/2038 | 2016 NOI(3): | N/A | |
| Interest-only Period: | None | 2017 NOI: | $2,664,054 | |
| Original Term(1): | 120 months | TTM NOI (as of 3/2018): | $2,824,239 | |
| Original Amortization: | 300 months | UW Economic Occupancy: | 93.2% | |
| Amortization Type: | ARD - Balloon | UW Revenues: | $4,542,028 | |
| Call Protection: | L(26),Def(91),O(3) | UW Expenses: | $1,363,455 | |
| Lockbox: | Soft / Springing | UW NOI: | $3,178,571 | |
| Additional Debt: | N/A | UW NCF: | $3,086,734 | |
| Additional Debt Balance: | N/A | Appraised Value / Per Unit: | $45,220,000 / $10,173 | |
| Additional Debt Type: | N/A | Appraisal Date: | Various | |
| Escrows and Reserves | Financial Information | ||||||||
| Initial | Monthly | Initial Cap | Cut-off Date Loan / Unit: | $6,389 | |||||
| Taxes(4): | $189,510 | Springing | N/A | Maturity Date Loan / Unit: | $4,677 | ||||
| Insurance(5): | $0 | Springing | N/A | Cut-off Date LTV: | 62.8% | ||||
| Replacement Reserves(6): | $45,918 | Springing | $45,918 | Maturity Date LTV: | 46.0% | ||||
| TI/LC: | $0 | $0 | N/A | UW NCF DSCR: | 1.65x | ||||
| Other(7): | $134,663 | $0 | N/A | UW NOI Debt Yield: | 11.2% | ||||
| Sources and Uses | ||||||
| Sources | Proceeds | % of Total | Uses | Proceeds | % of Total | |
| Mortgage Loan | $28,500,000 | 100.0% | Closing Costs | $534,900 | 1.9% | |
| Upfront Reserves | 370,091 | 1.3% | ||||
| Return of Equity(8) | 27,595,009 | 96.8% | ||||
| Total Sources | $28,500,000 | 100.0% | Total Uses | $28,500,000 | 100.0% | |
| (1) | The U-Haul AREC 27 Portfolio loan has an anticipated repayment date of April 1, 2028 (the “Anticipated Repayment Date” or “ARD”) and a final maturity date of April 1, 2038. From and after the Anticipated Repayment Date, in the event that the U-Haul AREC 27 Portfolio loan is not paid off on or before the ARD, the U-Haul AREC 27 Portfolio loan accrues interest at a fixed rate that is equal to the greater of (i) 7.33500% and (ii) the 10-year swap as of the ARD plus 4.35000% per annum, but in no event to exceed 9.33500%. On and after the ARD, until the final maturity date, the U-Haul AREC 27 Portfolio loan requires principal payments based on a 25-year amortization schedule assuming the initial interest rate. Original Term reflects the number of months through the Anticipated Repayment Date. See “Risk Factors—Risks Relating to the Mortgage Loans—Risks of Anticipated Repayment Date Loans” in the Preliminary Prospectus for additional details. |
| (2) | AREC 27, LLC owns the fee interests in the properties and UHIL 27, LLC owns a leasehold interest pursuant to an operating lease between the borrowers. Both the fee and leasehold interests have been pledged as collateral for the loan. |
| (3) | Historical financials are unavailable due to staggered acquisition timing of the individual properties in the portfolio. |
| (4) | The requirement for the borrowers to make monthly deposits into the tax escrow is waived so long as (i) no event of default has occurred and is continuing and (ii) the borrowers have deposited and maintained six months’ worth of taxes in the escrow account and provide satisfactory evidence that all taxes have been paid when due. |
| (5) | The requirement for the borrowers to make deposits to the insurance escrow is waived so long as (i) no event of default has occurred and is continuing and (ii) either (x) the borrowers provide satisfactory evidence that the properties are insured as part of a blanket policy in accordance with the loan documents or (y) if the properties are not insured by such blanket policy, the borrowers have deposited and maintained six months’ worth of insurance premiums in the escrow account. |
| (6) | The borrowers will be required to make monthly deposits into the replacement reserves escrow in the amount of $7,653 if the balance in the escrow falls below $45,918. The replacement reserves escrow will still be subject to the Initial Cap. |
| (7) | Initial Other Escrows and Reserves represents an escrow for certain deferred maintenance items. |
| (8) | The U-Haul AREC 27 Portfolio was previously unencumbered. The Sponsor acquired the properties between 1978 and 2016 for a basis of approximately $27.5 million. |
THE INFORMATION IN THIS STRUCTURAL AND COLLATERAL TERM SHEET IS NOT COMPLETE AND MAY BE AMENDED PRIOR TO THE TIME OF SALE. THIS TERM SHEET IS NOT AN OFFER TO SELL THESE SECURITIES AND IT IS NOT A SOLICITATION OF AN OFFER TO BUY THESE SECURITIES IN ANY JURISDICTION WHERE THE OFFER OR SALE IS NOT PERMITTED.
| 120 of 136 | |
| Structural and Collateral Term Sheet | JPMDB 2018-C8 | |
| U-Haul AREC 27 Portfolio | ||
The Loan.The U-Haul AREC 27 Portfolio loan is secured by a first mortgage lien on the fee interests in a 4,445 unit self-storage portfolio consisting of eight properties located across eight states. The U-Haul AREC 27 Portfolio loan has an ARD of April 1, 2028, a final maturity date of April 1, 2038 and will amortize on a 25-year schedule.
The borrowing entities for the U-Haul AREC 27 Portfolio loan are AREC 27, LLC and UHIL 27, LLC, each a Delaware limited liability company and special purpose entity.Theloansponsor and nonrecourse carve-out guarantor is AMERCO (NASDAQ: UHAL), which serves as the holding company for U-Haul International, Inc. (“U-Haul”). U-Haul is one of the largest North American operators of self-storage facilities and has been serving do-it-yourself movers since its founding in 1945. U-Haul operates approximately 1,440 self-storage locations in the United States and Canada with more than 581,000 rentable units comprising approximately 51.4 million square feet of rentable storage space. U-Haul locations provide customers with a variety of moving and storage supplies including self-storage, packing supplies and truck and trailer rentals.
The Portfolio.The U-Haul AREC 27 Portfolio is comprised of eight U-Haul branded self-storage facilities with an aggregate of 4,445 units totalingapproximately 391,334 square feet. The U-Haul AREC 27 Portfolio properties were constructed between 1920 and 2016. The loan sponsor has owned one property since 1978, acquired three properties between September 2011 and December 2013 and four properties between May 2015 and August 2016, at which time the portfolio was 74.4% occupied. Since acquisition of the assets, the loan sponsor has spent approximately $14.6 million across the portfolio, strategically deploying capital for the rebranding of several assets to U-Haul facilities. As of March 31, 2018, the portfolio was 91.1% occupied.
The U-Haul AREC 27 Portfolio is geographically diverse with each property located in a different state. The largest three states by allocated loan amount are Arizona (33.2%), Michigan (21.5%) and New Jersey (11.3%), which account for approximately 30.4%, 19.8% and 12.2% of underwritten net cash flow, respectively. The remaining five properties are located in Ohio, Louisiana, Pennsylvania, Idaho and Alabama, with no individual state accounting for more than 8.1% of allocated loan amount or 8.3% of underwritten net cash flow.
Goodyear.The Goodyear property is an 82,440 square foot, Class A facility with three single-story buildings and one three-story building. The 1,056-unit self-storage facility islocated in Goodyear, Arizona, approximately 21.5 miles west of Phoenix, on an approximately 12.8-acre site. According to the loan sponsor, the land was purchased in 2011 and subsequently underwent an approximately $7.5 million development, which was completed in 2015. The property consists of (i) 694 are interior climate-controlled units ranging in size from 25 to 200 square feet per unit, (ii) 285 interior non-climate-controlled units ranging in size from 25 to 200 square feet per unit (iii) 74 exterior, drive-up units ranging in size from 100 to 150 square feet per unit and (iv) three 40 square-foot U-Box units. The property was 92.0% occupied as of March 31, 2018 and features a leasing office with 48 parking spaces. According to the appraisal, as of year-end 2017, the population within a one-, three- and five-mile radius of the property was 4,684, 37,257 and 90,238, respectively, with a median household income of $51,999, $69,429 and $74,026, respectively.
NewCenter.The New Center propertyis a 53,595 square foot, Class A self-storage facility comprised of a single seven-story structure. The 843-unit facility islocated in Detroit, Michigan and situated on an approximately 2.46-acre site. The property was originally built in 1920, at which point it served as a bakery and warehouse for Nabisco. According to the loan sponsor, the property was purchased in 2012 and subsequently underwent an approximately $3.9 million redevelopment to convert the property to self-storage use, which was completed in 2013. The property consists of (i) 445 interior heated units ranging in size from 25 to 150 square feet per unit, (ii) 198 interior climate-controlled units, ranging in size from 25 to 300 square feet per unit, (iii) 168 25 square foot lockers and (iv) 32 40 square-foot U-Box units. The property also features a U-Box and U-Haul truck rental operation with trucks parked on-site. The property was 93.6% occupied as of March 31, 2018 and features a leasing office with 10 parking spaces. According to the appraisal, as of year-end 2017, the population within a one-, three- and five-mile radius of the property was 14,946, 119,079 and 307,711, respectively, with a median household income of $18,635, $20,888 and $23,075, respectively.
South Vineland.The South Vineland property is a 62,750 square foot, Class B self-storage facility with 15 buildings comprised of 524 self-storage units and 26 uncovered RV parking spaces. The propertyis located in Vineland, New Jersey, approximately 35.2 miles southwest of Philadelphia, Pennsylvania, on an approximately 9.6-acre site. The property was built in 1990 and was acquired by the loan sponsor in August 2016, at which time the property was 59.4% occupied. The property was 90.7% occupied as of March 31, 2018 and features a leasing office with 16 parking spaces. The property consists of (i) 485 non-climate-controlled units ranging in size from 20 to 600 square feet per unit and (ii) 39 climate-controlled units ranging in size from 50 to 150 square feet per unit. According to the appraisal, as of year-end 2017, the population within a one-, three- and five-mile radius of the property was 1,343, 33,451 and 79,023, respectively, with a median household income of $54,023, $44,610 and $49,276, respectively.
THE INFORMATION IN THIS STRUCTURAL AND COLLATERAL TERM SHEET IS NOT COMPLETE AND MAY BE AMENDED PRIOR TO THE TIME OF SALE. THIS TERM SHEET IS NOT AN OFFER TO SELL THESE SECURITIES AND IT IS NOT A SOLICITATION OF AN OFFER TO BUY THESE SECURITIES IN ANY JURISDICTION WHERE THE OFFER OR SALE IS NOT PERMITTED.
| 121 of 136 | |
| Structural and Collateral Term Sheet | JPMDB 2018-C8 | |
| U-Haul AREC 27 Portfolio | ||
| Portfolio Summary | |||||||||||||
| # | Location | Year Built | Allocated Loan Amount(1) | % of Cut-off Date Balance | Regular | Climate Controlled | RV | Total | March 2018 Occ. | UW NCF | % of UW NCF | Appraised Value | % |
| 1 | Goodyear, AZ(2) | 2015 | $9,416,059 | 33.2% | 362 | 694 | 0 | 1,056 | 92.0% | $938,950 | 30.4% | $15,000,000 | 33.2% |
| 2 | Detroit, MI(3)(4) | 1920 | 6,107,983 | 21.5% | 200 | 643 | 0 | 843 | 93.6% | 609,764 | 19.8 | 9,720,000 | 21.5% |
| 3 | Vineland, NJ | 1990 | 3,218,399 | 11.3% | 485 | 39 | 26 | 550 | 90.7% | 376,936 | 12.2 | 5,120,000 | 11.3% |
| 4 | Columbus, OH | 2000 | 2,301,703 | 8.1% | 13 | 481 | 0 | 494 | 99.0% | 257,420 | 8.3 | 3,670,000 | 8.1% |
| 5 | Lake Charles, LA | 1980 | 1,873,248 | 6.6% | 301 | 222 | 25 | 548 | 78.6% | 243,291 | 7.9 | 2,990,000 | 6.6% |
| 6 | Scranton, PA | 1986 | 1,833,391 | 6.5% | 260 | 0 | 5 | 265 | 90.2% | 226,101 | 7.3 | 2,920,000 | 6.5% |
| 7 | Prattville, AL | 2008 | 1,823,427 | 6.4% | 141 | 123 | 38 | 302 | 93.7% | 237,504 | 7.7 | 2,900,000 | 6.4% |
| 8 | Nampa, ID(5)(6) | 1978, 2016 | 1,823,427 | 6.4% | 182 | 179 | 26 | 387 | 89.9% | 196,768 | 6.4 | 2,900,000 | 6.4% |
Total / Wtd. Avg. | $28,397,637 | 100.0% | 1,944 | 2,381 | 120 | 4,445 | 91.1% | $3,086,734 | 100.0% | $45,220,000 | 100.0% | ||
| (1) | The U-Haul AREC 27 Portfolio is not subject to any property releases. |
| (2) | Includes 3 U-Box units. |
| (3) | Includes 168 lockers and 32 U-Box units. |
| (4) | Includes 445 heated units. |
| (5) | Includes 11 U-Box units. |
| (6) | Includes 18 heated units. |
| Operating History and Underwritten Net Cash Flow(1) | ||||||
| 2017 | TTM(2) | Underwritten | Per Unit | %(3) | |
| Rents in Place | $3,693,174 | $3,874,167 | $4,244,338 | $955 | 89.2% | |
| Vacant Income | 0 | 0 | 324,349 | 73 | 6.8% | |
| Gross Potential Rent | $3,693,174 | $3,874,167 | $4,568,686 | $1,028 | 96.0% | |
| Reimbursements | 164,510 | 171,431 | 188,100 | 42 | 4.0% | |
| Net Rental Income | $3,857,684 | $4,045,598 | $4,756,786 | $1,070 | 100.0% | |
| (Vacancy/Credit Loss) | 0 | 0 | (324,349) | (73) | (6.8)% | |
| Other Income | 98,249 | 109,589 | 109,589 | 25 | 2.3% | |
| Effective Gross Income | $3,955,933 | $4,155,186 | $4,542,028 | $1,022 | 95.5% | |
| Total Expenses | $1,291,879 | $1,330,949 | $1,363,455 | $307 | 30.0% | |
| Net Operating Income | $2,664,054 | $2,824,239 | $3,178,571 | $715 | 70.0% | |
| Total TI/LC, Capex/RR | 0 | 0 | 91,836 | 21 | 2.0% | |
| Net Cash Flow | $2,664,054 | $2,824,239 | $3,086,734 | $694 | 68.0% | |
| Occupancy | 89.1% | 91.1% | 93.2% | |||
| (1) | Historical financials unavailable due to acquisition timing of the individual properties in the portfolio. |
| (2) | TTM column represents the trailing 12 months ended March 31, 2018. |
| (3) | % column represents percent of Net Rental Income for all revenue lines and represents percent of Effective Gross Income for the remaining fields. |
Property Management. The U-Haul AREC 27 Portfolio will be managed by various affiliates of the borrowers.
After Acquired Adjacent Property. Provided no event of default has occurred and is continuing under the loan documents, the borrowers have the right to acquire the fee simple estate in vacant land that is adjacent and contiguous to an existing individual mortgaged property (an “After Acquired Adjacent Property”), provided that the lender has received, among other things: (a) a title insurance policy insuring the lien of the applicable mortgage encumbering the After Acquired Adjacent Property; (b) a settlement statement indicating that such After Acquired Adjacent Property was acquired without debt; (c) an environmental report showing no hazardous materials or risk of contamination at the adjacent property; (d) a REMIC opinion acceptable to the rating agencies; and (e) a confirmation from the rating agencies that such After Acquired Adjacent Property will not result in a withdrawal, qualification or downgrade of the respective ratings in effect immediately prior to such acquisition for the Certificates that are then outstanding. Any such After Acquired Adjacent Property will be encumbered by the lien of the mortgage on the related mortgaged property. The loan documents include a carve-out for any losses resulting from the acquisition of any After Acquired Adjacent Property.
THE INFORMATION IN THIS STRUCTURAL AND COLLATERAL TERM SHEET IS NOT COMPLETE AND MAY BE AMENDED PRIOR TO THE TIME OF SALE. THIS TERM SHEET IS NOT AN OFFER TO SELL THESE SECURITIES AND IT IS NOT A SOLICITATION OF AN OFFER TO BUY THESE SECURITIES IN ANY JURISDICTION WHERE THE OFFER OR SALE IS NOT PERMITTED.
| 122 of 136 | |
| Structural and Collateral Term Sheet | JPMDB 2018-C8 | |
| U-Haul AREC 27 Portfolio | ||
After Acquired Leasehold Property. Provided no event of default has occurred and is continuing under the loan documents, the borrowers have the right to acquire a leasehold estate in property that is operated as a storage facility, but that is not contiguous to an existing individual mortgaged property (an “After Acquired Leasehold Property”), provided, among other things: (a) fee simple title in the acquired property is owned by an affiliate of the guarantor and the borrowers execute and deliver to the lender a lease in the form attached to the loan agreement, not to be recorded; (b) an environmental report showing no hazardous materials or risk of contamination at the adjacent property; (c) a REMIC opinion acceptable to the rating agencies; and (d) a confirmation from the rating agencies that such After Acquired Leasehold Property will not result in a withdrawal, qualification or downgrade of the respective ratings in effect immediately prior to such acquisition for the Certificates that are then outstanding. Following any acquisition of an After Acquired Leasehold Property, the loan documents require that such After Acquired Leasehold Property only be operated as a remote storage facility, U-Box storage facility or vehicle or RV storage facility and not include any office, showroom, retail or administrative uses. The loan documents include a carve-out for any losses resulting from the acquisition, ownership or operation of any After Acquired Leasehold Property.
Property Releases.None.
THE INFORMATION IN THIS STRUCTURAL AND COLLATERAL TERM SHEET IS NOT COMPLETE AND MAY BE AMENDED PRIOR TO THE TIME OF SALE. THIS TERM SHEET IS NOT AN OFFER TO SELL THESE SECURITIES AND IT IS NOT A SOLICITATION OF AN OFFER TO BUY THESE SECURITIES IN ANY JURISDICTION WHERE THE OFFER OR SALE IS NOT PERMITTED.
| 123 of 136 | |
| Structural and Collateral Term Sheet | JPMDB 2018-C8 | |
| Northwest Business Center | ||
| Mortgage Loan Information | Property Information | |||
| Mortgage Loan Seller: | SMF VI | Single Asset / Portfolio: | Single Asset | |
| Original Principal Balance: | $22,750,000 | Title: | Fee | |
| Cut-off Date Principal Balance: | $22,750,000 | Property Type - Subtype: | Industrial – Flex | |
| % of Pool by IPB: | 3.2% | Net Rentable Area (SF): | 470,971 | |
| Loan Purpose: | Acquisition | Location: | Marietta, GA | |
| Borrowers(1): | Various | Year Built / Renovated: | 1982–1988 / N/A | |
| Sponsors: | Jeffrey J. Katke, Daniel P. Culler | Occupancy: | 90.6% | |
| and Richard M. Kent | Occupancy Date: | 4/1/2018 | ||
| Interest Rate: | 5.23000% | Number of Tenants: | 67 | |
| Note Date: | 4/23/2018 | 2015 NOI(2): | $1,675,710 | |
| Maturity Date: | 5/6/2028 | 2016 NOI(2): | $2,057,258 | |
| Interest-only Period: | 48 months | 2017 NOI(2): | $2,341,809 | |
| Original Term: | 120 months | TTM NOI (as of 2/2018)(2): | $2,396,519 | |
| Original Amortization: | 360 months | UW Economic Occupancy: | 91.3% | |
| Amortization Type: | IO-Balloon | UW Revenues: | $3,906,890 | |
| Call Protection: | L(12),Grtr1%orYM(104),O(4) | UW Expenses: | $1,064,403 | |
| Lockbox / Cash Management: | Springing / Springing | UW NOI(2): | $2,842,487 | |
| Additional Debt: | N/A | UW NCF: | $2,489,270 | |
| Additional Debt Balance: | N/A | Appraised Value / Per SF(3): | $34,200,000 / $73 | |
| Additional Debt Type: | N/A | Appraisal Date: | 2/7/2018 | |
| Escrows and Reserves | Financial Information | |||||||||
| Initial | Monthly | Initial Cap | Cut-off Date Loan / SF: | $48 | ||||||
| Taxes: | $190,192 | $23,774 | N/A | Maturity Date Loan / SF: | $44 | |||||
| Insurance(4): | $0 | Springing | N/A | Cut-off Date LTV: | 66.5% | |||||
| Replacement Reserves(5): | $533,597 | $3,925 | $141,300 | Maturity Date LTV: | 60.4% | |||||
| TI/LC(6): | $154,677 | $25,510 | $918,396 | UW NCF DSCR: | 1.65x | |||||
| Other(7): | $3,356,073 | $0 | N/A | UW NOI Debt Yield: | 12.5% | |||||
| Sources and Uses | ||||||||||
| Sources | Proceeds | % of Total | Uses | Proceeds | % of Total | |||||
| Mortgage Loan | $22,750,000 | 68.0% | Purchase Price | $28,700,000 | 85.8% | |||||
| Sponsor Equity | 10,688,339 | 32.0 | Upfront Reserves | 4,234,539 | 12.7 | |||||
| Closing Costs | 503,800 | 1.5 | ||||||||
| Total Sources | $33,438,339 | 100.0% | Total Uses | $33,438,339 | 100.0% | |||||
| (1) | The borrowers under the Northwest Business Center loan are Avistone Northwest H, LLC, Avistone Northwest S, LLC, Northwest 1, LLC, Northwest 2, LLC, Northwest 3, LLC, Northwest 4, LLC, Northwest 5, LLC, Northwest 6, LLC and Northwest 7, LLC. |
| (2) | Since 2015, 36 new leases, lease extensions or expansions have been executed at the property, comprising 27.7% of the net rentable area at the property and accounting for approximately $1.1 million in rental income (34.6% of underwritten base rent). As such, NOI has grown each year, including new leases that are only partially reflected in the TTM NOI and UW NOI is greater than TTM NOI. |
| (3) | The Appraised Value / Per SF represents the “hypothetical as-is” value of $34,200,000, which assumes planned renovations and capital expenditures at a cost of $4,083,000 were completed at the property as of February 7, 2018. At origination, the borrower deposited $3,889,670 for the planned renovations and capital expenditures as described below. The “as-is” value as of February 7, 2018 is $30,100,000, which results in a Cut-off Date LTV and Maturity Date LTV of 75.6% and 68.6%, respectively. |
| (4) | The requirement for the borrowers to make deposits to the insurance escrow are waived so long as (i) no sweep event has occurred and is continuing and (ii) the borrowers provide satisfactory evidence that the property is insured as part of a blanket policy in accordance with the loan documents. |
| (5) | At origination, the borrowers were required to escrow $533,597 for planned capital expenditures at the property, which amount does not count against the replacement reserve cap. |
| (6) | At origination, the borrowers were required to deposit into the TI/LC reserve: (i) approximately $118,027 for outstanding tenant improvements for Beamex, Inc. and (ii) $36,650 for outstanding tenant improvements for Olight World USA. These amounts do not count against the TI/LC reserve cap. |
| (7) | Other initial reserves represent: (i) $2,743,895 for deferred maintenance and (ii) $612,178 for capital improvements and space preparation of vacant suites. |
The Loan.The Northwest Business Center loan has an outstanding principal balance as of the Cut-off Date of $22.75 million and is secured by a first mortgage lien on the borrowers’ fee interest in a 470,971 square foot industrial flex property located in Marietta, Georgia. The loan has a 10-year term and, subsequent to a four-year interest-only period, will amortize on a 30-year schedule.
THE INFORMATION IN THIS STRUCTURAL AND COLLATERAL TERM SHEET IS NOT COMPLETE AND MAY BE AMENDED PRIOR TO THE TIME OF SALE. THIS TERM SHEET IS NOT AN OFFER TO SELL THESE SECURITIES AND IT IS NOT A SOLICITATION OF AN OFFER TO BUY THESE SECURITIES IN ANY JURISDICTION WHERE THE OFFER OR SALE IS NOT PERMITTED.
| 124 of 136 | |
| Structural and Collateral Term Sheet | JPMDB 2018-C8 | |
| Northwest Business Center | ||
The borrowing entities for the Northwest Business Center loan are Avistone Northwest H, LLC, Avistone Northwest S, LLC, Northwest 1, LLC, Northwest 2, LLC, Northwest 3, LLC, Northwest 4, LLC, Northwest 5, LLC, Northwest 6, LLC and Northwest 7, LLC, each a Delaware limited liability company and special purpose entity, as tenants-in-common. The loan sponsor and nonrecourse carve-out guarantors are Jeffrey J. Katke, Daniel P. Culler and Richard M. Kent.
Mr. Katke, Mr. Culler and Mr. Kent are principals at Avistone, LLC (“Avistone”). Avistone was founded in 2013 and is an investment management firm that currently owns and operates over 2.5 million square feet of industrial space throughout California, Georgia, Ohio, Texas and Florida.
The Property. The Northwest Business Center property is comprised of 12 industrial buildings located at 1335 & 1337-1351 Capital Circle Southeast and 2130, 2150, 2152, 2242, 2244, 2252, 2256, 2260, 2270 & 2275 Northwest Parkway Southeast in Marietta, Georgia. The property was constructed in phases between 1982 and 1988, and totals 470,971 square feet of net rentable area. The property offers approximately 65.4% office space, while the remaining is warehouse space. The property includes 850 parking spaces, resulting in a parking ratio of approximately 1.80 spaces per 1,000 square feet of net rentable area.
As of April 1, 2018, the property was 90.6% leased by 67 tenants and had an average occupancy level of 86.9% over the past three years. The largest tenant, The Original Mattress Factory, leases 12.0% of the net rentable area and accounts for 10.5% of the underwritten base rent. The Original Mattress Factory’s lease expires in July 2020 and such tenant has occupied the space since 2000. The Original Mattress Factory manufactures and brands mattresses and box springs and has over 100 factory and store locations in Florida, Georgia, Kentucky, Minnesota, North Carolina, Ohio, Pennsylvania, South Carolina and Virginia. The second largest tenant, Commissions, Inc leases 8.1% of the property’s net rentable area under two leases that expire in January 2022 (34,145 square feet) and October 2020 (3,928 square feet). Commissions, Inc has occupied space at the property since 2013 and expanded in 2016. Commissions, Inc is a real estate technology company that develops a conversion engine for real estate agents. Commissions, Inc accounts for approximately 8.8% of the underwritten base rent at the property. The third largest tenant, Engineered Solutions, leases 4.7% of the property’s net rentable area under a lease that expires in April 2023 and has occupied the space since 2011. Engineered Solutions provides foundation repair and waterproofing services. Engineered Solutions accounts for approximately 4.7% of the underwritten base rent at the property.
The Market.The Northwest Business Center property is located in Marietta, Cobb County, Georgia. The property is located west of Interstate-75, which provides access to the Atlanta central business district as well as to Interestate-85, which connects with most major arterials in the area. According to the appraisal, the 2017 median household income within a one-, three- and five-mile radius of the property was approximately $36,627, $48,635 and $56,624, respectively. In 2017, the estimated total population within a one-, three- and five-mile radius was approximately 17,936, 84,891 and 223,527, respectively.
The Northwest Business Center property is located in the Northwest Atlanta industrial submarket, and according to the appraisal, the 2017 year-end vacancy rate in the submarket was 4.9%, with average asking rents of $9.67 per square foot. The appraisal identified five properties as directly competitive with the Northwest Business Center property, ranging in size from 72,194 square feet to 300,083 square feet. The competitive properties reported occupancies ranging from 81% to 100%. The competitive properties have average asking rents ranging from $6.00 to $9.50 per square foot, versus weighted average in-place rents of $7.63 per square foot at the Northwest Business Center property.
According to the appraisal, the market rent for less than 4,000 square foot, 4,000 to 10,000 square foot, 10,000 to 40,000 square foot and greater than 40,000 square foot space is $8.75, $8.25, $7.00 and $6.00 per square foot, respectively.
THE INFORMATION IN THIS STRUCTURAL AND COLLATERAL TERM SHEET IS NOT COMPLETE AND MAY BE AMENDED PRIOR TO THE TIME OF SALE. THIS TERM SHEET IS NOT AN OFFER TO SELL THESE SECURITIES AND IT IS NOT A SOLICITATION OF AN OFFER TO BUY THESE SECURITIES IN ANY JURISDICTION WHERE THE OFFER OR SALE IS NOT PERMITTED.
| 125 of 136 | |
| Structural and Collateral Term Sheet | JPMDB 2018-C8 | |
| Northwest Business Center | ||
| Tenant Summary(1) | ||||||
| Tenant | Ratings Moody’s/S&P/Fitch | Net Rentable Area (SF) | % of Total NRA | Base Rent PSF | % of Total Base Rent | Lease Expiration Date |
| The Original Mattress Factory | NA / NA / NA | 56,616 | 12.0% | $6.06 | 10.5% | 7/31/2020 |
| Commissions, Inc(2) | NA / NA / NA | 38,073 | 8.1% | $7.52 | 8.8% | Various |
| Engineered Solutions | NA / NA / NA | 22,320 | 4.7% | $6.92 | 4.7% | 4/30/2023 |
| JSJ Partners/Prosource | NA / NA / NA | 16,740 | 3.6% | $6.72 | 3.5% | 9/30/2023 |
| Sierra Wireless America, Inc. | NA / NA / NA | 13,924 | 3.0% | $7.56 | 3.2% | 1/31/2022 |
| QuikTrip Corporation(3) | NA / NA / NA | 13,650 | 2.9% | $4.73 | 2.0% | Various |
| National Installation Solution | NA / NA / NA | 13,318 | 2.8% | $8.23 | 3.4% | 2/28/2022 |
| RBJK Marketing | NA / NA / NA | 12,446 | 2.6% | $9.40 | 3.6% | 12/31/2020 |
| CreaPharm | NA / NA / NA | 11,100 | 2.4% | $6.75 | 2.3% | 8/31/2022 |
| City Express, Inc. | NA / NA / NA | 11,100 | 2.4% | $6.00 | 2.0% | 1/31/2020 |
| (1) | Based on the underwritten rent roll dated April 1, 2018. |
| (2) | Commissions, Inc leases 34,145 square feet of space with a lease expiration in January 2022 and 3,928 square feet with a lease expiration in October 2020. |
| (3) | QuikTrip Corporation leases 11,100 square feet of space with a lease expiration in November 2021 and 2,550 square feet with a lease expiration in October 2021. |
| Lease Rollover Schedule(1) | |||||||||
| Year | Number of Leases Expiring | Net Rentable Area Expiring | % of NRA Expiring | Base Rent Expiring | % of Base Rent Expiring | Cumulative Net Rentable Area Expiring | Cumulative % of NRA Expiring | Cumulative Base Rent Expiring | Cumulative % of Base Rent Expiring |
| Vacant | NAP | 44,289 | 9.4% | NAP | NAP | 44,289 | 9.4% | NAP | NAP |
| 2018 & MTM | 9 | 28,793 | 6.1 | $217,548 | 6.7% | 73,082 | 15.5% | $217,548 | 6.7% |
| 2019 | 15 | 53,980 | 11.5 | 412,479 | 12.7 | 127,062 | 27.0% | $630,026 | 19.3% |
| 2020 | 19 | 145,343 | 30.9 | 1,083,201 | 33.3 | 272,405 | 57.8% | $1,713,227 | 52.6% |
| 2021 | 7 | 40,428 | 8.6 | 296,598 | 9.1 | 312,833 | 66.4% | $2,009,825 | 61.7% |
| 2022 | 10 | 94,222 | 20.0 | 741,956 | 22.8 | 407,055 | 86.4% | $2,751,781 | 84.5% |
| 2023 | 6 | 57,116 | 12.1 | 449,757 | 13.8 | 464,171 | 98.6% | $3,201,538 | 98.3% |
| 2024 | 1 | 6,800 | 1.4 | 55,368 | 1.7 | 470,971 | 100.0% | $3,256,906 | 100.0% |
| 2025 | 0 | 0 | 0.0 | 0 | 0.0 | 470,971 | 100.0% | $3,256,906 | 100.0% |
| 2026 | 0 | 0 | 0.0 | 0 | 0.0 | 470,971 | 100.0% | $3,256,906 | 100.0% |
| 2027 | 0 | 0 | 0.0 | 0 | 0.0 | 470,971 | 100.0% | $3,256,906 | 100.0% |
| 2028 | 0 | 0 | 0.0 | 0 | 0.0 | 470,971 | 100.0% | $3,256,906 | 100.0% |
| 2029 & Beyond | 0 | 0 | 0.0 | 0 | 0.0 | 470,971 | 100.0% | $3,256,906 | 100.0% |
| Total | 67 | 470,971 | 100.0% | $3,256,906 | 100.0% | ||||
| (1) | Based on the underwritten rent roll dated April 1, 2018. |
THE INFORMATION IN THIS STRUCTURAL AND COLLATERAL TERM SHEET IS NOT COMPLETE AND MAY BE AMENDED PRIOR TO THE TIME OF SALE. THIS TERM SHEET IS NOT AN OFFER TO SELL THESE SECURITIES AND IT IS NOT A SOLICITATION OF AN OFFER TO BUY THESE SECURITIES IN ANY JURISDICTION WHERE THE OFFER OR SALE IS NOT PERMITTED.
| 126 of 136 | |
| Structural and Collateral Term Sheet | JPMDB 2018-C8 | |
| Northwest Business Center | ||
| Operating History and Underwritten Net Cash Flow | |||||||
| 2015 | 2016 | 2017 | TTM(1) | Underwritten | Per Square Foot | %(2) | |
| Rents in Place(3) | $2,256,439 | $2,546,208 | $2,798,506 | $2,846,677 | $3,256,906 | $6.92 | 76.3% |
| Vacant Income | 0 | 0 | 0 | 0 | 373,331 | 0.79 | 8.7 |
| Gross Potential Rent | $2,256,439 | $2,546,208 | $2,798,506 | $2,846,677 | $3,630,237 | $7.71 | 85.1% |
| Total Reimbursements | 510,963 | 541,651 | 606,740 | 613,625 | 636,884 | 1.35 | 14.9 |
| Net Rental Income | $2,767,402 | $3,087,859 | $3,405,246 | $3,460,302 | $4,267,121 | $9.06 | 100.0% |
| Other Income | 17,135 | 9,581 | 13,950 | 13,100 | 13,100 | 0.03 | 0.3 |
| (Vacancy/Credit Loss) | 0 | 0 | 0 | 0 | (373,331) | (0.79) | (8.7) |
| Effective Gross Income | $2,784,537 | $3,097,440 | $3,419,196 | $3,473,402 | $3,906,890 | $8.30 | 91.6% |
| Total Expenses | $1,108,827 | $1,040,182 | $1,077,387 | $1,076,883 | $1,064,403 | $2.26 | 27.2% |
| Net Operating Income | $1,675,710 | $2,057,258 | $2,341,809 | $2,396,519 | $2,842,487 | $6.04 | 72.8% |
| Total TI/LC, Capex/RR | 0 | 0 | 0 | 0 | 353,217 | 0.75 | 9.0 |
| Net Cash Flow | $1,675,710 | $2,057,258 | $2,341,809 | $2,396,519 | $2,489,270 | $5.29 | 63.7% |
| Occupancy(4) | 81.2% | 89.9% | 89.7% | 90.6% | 91.3% | ||
| (1) | TTM represents the trailing 12-month period ending in February 28, 2018. |
| (2) | % column represents the percent of Net Rental Income for all revenue lines and represents the percent of Effective Gross Income for the remainder of fields. |
| (3) | Since 2015, 36 new leases, lease extensions or expansions have been executed at the property, comprising 27.7% of the net rentable area at the property and accounting for approximately $1.1 million in rental income (34.6% of underwritten base rent). As such, NOI has grown each year, including new leases that are only partially reflected in the TTM Rents in Place and Underwritten Rents in Place is greater than TTM Rents in Place. |
| (4) | Historical Occupancies are as of December 31 of each respective year. TTM Occupancy is as of April 1, 2018. Underwritten Occupancy represents economic occupancy. |
Partial Release.Following a lockout period, the borrowers are permitted to release the building located at 1335 Capital Circle Southeast from the lien of the mortgage subject to the prepayment of the loan in an amount equal to the greatest of (a) 120% of the allocated loan amount, (b) an amount that would result in a maximum loan-to-value ratio (as calculated in the loan documents) of the remaining collateral of 66.5%, (c) an amount that would result in minimum debt service coverage ratio (as calculated in the loan documents) immediately following such release of 1.55x and (d) an amount that would result in a minimum debt yield immediately following such release of 11.5%, and the satisfaction of other conditions.
THE INFORMATION IN THIS STRUCTURAL AND COLLATERAL TERM SHEET IS NOT COMPLETE AND MAY BE AMENDED PRIOR TO THE TIME OF SALE. THIS TERM SHEET IS NOT AN OFFER TO SELL THESE SECURITIES AND IT IS NOT A SOLICITATION OF AN OFFER TO BUY THESE SECURITIES IN ANY JURISDICTION WHERE THE OFFER OR SALE IS NOT PERMITTED.
| 127 of 136 | |
| Structural and Collateral Term Sheet | JPMDB 2018-C8 | |
| Texas Hotel Portfolio | ||
| Mortgage Loan Information | Property Information | |||
| Mortgage Loan Seller: | SMF VI | Single Asset / Portfolio: | Portfolio | |
| Original Principal Balance: | $20,725,000 | Title: | Fee | |
| Cut-off Date Principal Balance: | $20,693,565 | Property Type - Subtype: | Hotel – Various | |
| % of Pool by IPB: | 2.9% | Net Rentable Area (Rooms): | 327 | |
| Loan Purpose: | Refinance | Location: | Various, TX | |
| Borrowers: | Beaumont Summit Inn LLC, Van | Year Built / Renovated: | Various / Various | |
| Horn Summit Inn, LLC, Beaumont | Occupancy / ADR / RevPAR: | 75.8% / $102.32 / $77.56 | ||
| Palace Inn, LLC and Palace LQ, | Occupancy / ADR / RevPAR Date: | 2/28/2018 | ||
| LLC | Number of Tenants: | N/A | ||
| Sponsor: | Bharat Bhakta | 2015 NOI(1): | $1,080,370 | |
| Interest Rate: | 5.08500% | 2016 NOI(1)(2): | $1,352,501 | |
| Note Date: | 5/1/2018 | 2017 NOI(2): | $3,147,111 | |
| Maturity Date: | 5/6/2028 | TTM NOI (as of 2/2018)(2): | $3,666,610 | |
| Interest-only Period: | None | UW Occupancy / ADR / RevPAR: | 75.8% / $102.32 / $77.56 | |
| Original Term: | 120 months | UW Revenues: | $10,772,643 | |
| Original Amortization: | 300 months | UW Expenses: | $7,705,043 | |
| Amortization Type: | Balloon | UW NOI: | $3,067,600 | |
| Call Protection: | L(25),Def(91),O(4) | UW NCF: | $3,067,600 | |
| Lockbox / Cash Management: | Springing / Springing | Appraised Value / Per Room: | $39,000,000 / $119,266 | |
| Additional Debt: | N/A | Appraisal Date(3): | Various | |
| Additional Debt Balance: | N/A | |||
| Additional Debt Type: | N/A | |||
| Escrows and Reserves | Financial Information | |||||||||
| Initial | Monthly | Initial Cap | Cut-off Date Loan / Room: | $63,283 | ||||||
| Taxes: | $156,228 | $27,037 | N/A | Maturity Date Loan / Room: | $47,546 | |||||
| Insurance: | $139,066 | $13,907 | N/A | Cut-off Date LTV: | 53.1% | |||||
| FF&E Reserves(4): | $0 | 2% of Gross Revenues | N/A | Maturity Date LTV: | 39.9% | |||||
| TI/LC: | $0 | $0 | N/A | UW NCF DSCR: | 2.09x | |||||
| Other(5): | $14,063 | $0 | N/A | UW NOI Debt Yield: | 14.8% | |||||
| Sources and Uses | ||||||||||
| Sources | Proceeds | % of Total | Uses | Proceeds | % of Total | |||||
| Mortgage Loan | $20,725,000 | 100.0% | Payoff Existing Debt | $14,122,637 | 68.1% | |||||
| Closing Costs | 333,316 | 1.6 | ||||||||
| Upfront Reserves | 309,358 | 1.5 | ||||||||
| Return of Equity | 5,959,690 | 28.8 | ||||||||
| Total Sources | $20,725,000 | 100.0% | Total Uses | $20,725,000 | 100.0% | |||||
| (1) | The Holiday Inn Express Van Horn property was developed in 2016 and opened for business in December 2016. As such, 2015 NOI and 2016 NOI figures represent operations from only the Holiday Inn & Suites Beaumont property. |
| (2) | The Holiday Inn & Suites Beaumont property underwent an approximately $5.1 million property improvement plan (“PIP”) between March 2016 and August 2017 that affected NOI. As such, TTM NOI is higher than 2017 NOI. |
| (3) | The Appraisal Dates for Holiday Inn Express Van Horn and Holiday Inn & Suites Beaumont are March 26, 2018 and March 23, 2018, respectively. |
| (4) | An FF&E reserve is required under the loan documents in the amount of 2.0% of gross revenues beginning with the first payment date in June 2018 and up to and including the payment date in May 2019, 3.0% of gross revenues beginning with the payment date in June 2019 and up to and including the payment date in May 2020 and 4.0% of gross revenues beginning with the payment date in June 2020 and continuing through the remaining term of the loan. |
| (5) | Other Initial Escrows and Reserves represents deferred maintenance. |
The Loan.The Texas Hotel Portfolio loan has an outstanding principal balance as of the Cut-off Date of approximately $20.7 million and is secured by a first mortgage lien on the borrowers’ fee interests in a 74-room limited service hotel property located in Van Horn, Texas and a 253-room full service hotel property located in Beaumont, Texas. The loan has a 10-year term and will amortize on a 25-year schedule.
THE INFORMATION IN THIS STRUCTURAL AND COLLATERAL TERM SHEET IS NOT COMPLETE AND MAY BE AMENDED PRIOR TO THE TIME OF SALE. THIS TERM SHEET IS NOT AN OFFER TO SELL THESE SECURITIES AND IT IS NOT A SOLICITATION OF AN OFFER TO BUY THESE SECURITIES IN ANY JURISDICTION WHERE THE OFFER OR SALE IS NOT PERMITTED.
| 128 of 136 | |
| Structural and Collateral Term Sheet | JPMDB 2018-C8 | |
| Texas Hotel Portfolio | ||
The loan sponsor and nonrecourse carve-out guarantor is Bharat Bhakta. Bharat Bhakta is the founder of Summit 11 Investment Group, an owner, developer and operator of senior living and hospitality assets. Additionally, Mr. Bhakta is a key principal and chief development officer of Esperanto Developments, LLC, a fully integrated hotel operator and developer located in El Paso, Texas. Esperanto Developments, LLC currently oversees day-to-day operations of a portfolio of 18 hotels totaling 1,800 rooms, including the properties secured by the Texas Hotel Portfolio loan. The portfolio includes Wyndham, IHG and Choice franchise networks.
Holiday Inn & Suites Beaumont. The Holiday Inn & Suites Beaumont property is a 253-room full service hotel located in Beaumont, Texas. The property was built in 1984. The loan sponsor acquired the property in 2015 and invested in a PIP totaling approximately $5.1 million ($20,174 per room). The property is eight stories and features amenities including an on-site business center, an indoor heated pool, fitness center and 17,426 square feet of meeting space. Additionally, the property recently introduced a flexible new food and beverage concept labeled “The Greenery” which offers a selection of styles and cuisines. Beaumont is part of the “Golden Triangle” petrochemical and industrial complex. The petrochemical industry is Beaumont’s primary economic sector. Rice processing and shipbuilding are significant economic elements for the region, as well. Additionally, the Port of Beaumont is a deep-water port and was ranked the fifth busiest port in the United States by cargo tonnage in 2016. The port is also the busiest military port in the world for processing U.S. military equipment. Ford Park, a multi-purpose arena that seats approximately 8,500 people, is located approximately three miles from the property, along Interestate-10. Ford Park regularly holds events such as concerts, rodeos and other special events.
The appraisal identified one new hotel that is expected to open in June 2018 approximately 5.6 miles from the Holiday Inn & Suites Beaumont property. The Holiday Inn Beaumont East-Medical Center Area, which closed in 2009, is currently undergoing an $8.0 million renovation and expected to be approximately 75% competitive with the Holiday Inn & Suites Beaumont property.
| Historical Occupancy, ADR and RevPAR | |||||||||||
| Competitive Set(1) | Holiday Inn & Suites Beaumont(2) | Penetration Factor(3) | |||||||||
| Year | Occupancy | ADR | RevPAR | Occupancy | ADR | RevPAR | Occupancy | ADR | RevPAR | ||
| 2015 | 63.4% | $95.66 | $60.66 | 67.4% | $79.97 | $53.90 | 106.3% | 83.6% | 88.9% | ||
| 2016(4) | 65.0% | $97.02 | $63.09 | 61.3% | $86.62 | $53.10 | 94.3% | 89.3% | 84.2% | ||
| 2017(4) | 65.9% | $102.72 | $67.70 | 72.4% | $98.27 | $71.15 | 109.9% | 95.7% | 105.1% | ||
| TTM(5) | 67.8% | $103.35 | $70.05 | 76.8% | $101.01 | $77.58 | 113.3% | 97.7% | 110.7% | ||
| (1) | Data provided by STR, Inc. The competitive set contains the following properties: Holiday Inn Port Arthur Park Central, MCM Elegante Beaumont, Hampton Inn Beaumont, Hilton Garden Inn Beaumont and Residence Inn Beaumont. |
| (2) | Based on operating statements provided by the borrowers. |
| (3) | Penetration Factor is calculated based on data provided by STR, Inc. for the competitive set and borrower-provided statements for the property. |
| (4) | The Holiday Inn & Suites Beaumont property underwent an approximately $5.1 million PIP between March 2016 and August 2017 that impacted operations at the related property. |
| (5) | TTM represents the trailing 12-month period ending on February 28, 2018. |
| Competitive Hotels Profile(1) | ||||||||
| Rooms | Year Built | 2017 Estimated Market Mix | 2017 Estimated Operating Statistics | |||||
| Property | Commercial | Meeting & Group | Leisure | Occupancy | ADR | RevPAR | ||
| Holiday Inn & Suites Beaumont | 253 | 1984 | 55% | 10% | 35% | 72.4% | $98.27 | $71.15 |
| MCM Elegante Beaumont | 276 | 1984 | 50% | 15% | 35% | 55%-60% | $90-$95 | $50-$55 |
| Hilton Garden Inn Beaumont | 100 | 2007 | 80% | 10% | 10% | 80%-85% | $115-$120 | $95-$100 |
| Courtyard by Marriott Beaumont | 78 | 1998 | 80% | 10% | 10% | 80%-85% | $110-$115 | $90-$95 |
| Total(2) | 454 | |||||||
| (1) | Based on the appraisal. |
| (2) | Excludes the Holiday Inn & Suites Beaumont property. |
THE INFORMATION IN THIS STRUCTURAL AND COLLATERAL TERM SHEET IS NOT COMPLETE AND MAY BE AMENDED PRIOR TO THE TIME OF SALE. THIS TERM SHEET IS NOT AN OFFER TO SELL THESE SECURITIES AND IT IS NOT A SOLICITATION OF AN OFFER TO BUY THESE SECURITIES IN ANY JURISDICTION WHERE THE OFFER OR SALE IS NOT PERMITTED.
| 129 of 136 | |
| Structural and Collateral Term Sheet | JPMDB 2018-C8 | |
| Texas Hotel Portfolio | ||
Holiday Inn Express Van Horn. The Holiday Inn Express Van Horn property is a 74-room limited service hotel located in Van Horn, Texas. The property was developed by the loan sponsor in 2016 for approximately $7.0 million. The property is three stories and features 38 king and 25 queen room layouts along with 11 suite style room layouts. Amenities include an outdoor pool, fitness center, a full breakfast buffet and on-site guest laundry services. Major demand drivers in Van Horn include Blue Origin, the commercial space exploration program funded by Jeff Bezos. Blue Origin has a dedicated launch site located in Van Horn for its New Shepard shuttle program.
| Historical Occupancy, ADR and RevPAR(1) | |||||||||||
| Competitive Set(2) | Holiday Inn Express Van Horn(3) | Penetration Factor(4) | |||||||||
| Year | Occupancy | ADR | RevPAR | Occupancy | ADR | RevPAR | Occupancy | ADR | RevPAR | ||
| 2017 | 66.5% | $92.34 | $61.37 | 64.3% | $106.92 | $68.75 | 96.8% | 115.8% | 112.0% | ||
| TTM(5) | 68.6% | $93.73 | $64.28 | 72.4% | $107.06 | $77.51 | 105.6% | 114.2% | 120.6% | ||
| (1) | Holiday Inn Express Van Horn was developed in 2016 and opened for business in December 2016. As such, 2015 and 2016 Historical Occupancy, ADR and RevPAR are not available. |
| (2) | Data provided by STR, Inc. The competitive set contains the following properties: Red Roof Inn Van Horn, Quality Inn Van Horn, Hampton Inn Van Horn and Holiday Inn Express & Suites Fort Stockton. |
| (3) | Based on operating statements provided by the borrowers. |
| (4) | Penetration Factor is calculated based on data provided by STR, Inc. for the competitive set and borrower-provided statements for the property. |
| (5) | TTM represents the trailing 12-month period ending on February 28, 2018. |
| Competitive Hotels Profile(1) | ||||||||
| Rooms | Year Built | 2017 Estimated Market Mix | 2017 Estimated Operating Statistics | |||||
| Property | Commercial | Meeting & Group | Leisure | Occupancy | ADR | RevPAR | ||
| Holiday Inn Express Van Horn | 74 | 2016 | 35% | 5% | 60% | 64.3% | $106.92 | $68.75 |
| Hampton Inn Van Horn | 59 | 2009 | 40% | 5% | 55% | 70%-75% | $115-$120 | $85-$90 |
| Quality Inn Van Horn | 45 | 1996 | 30% | 10% | 60% | 70%-75% | $85-$90 | $60-$65 |
| Total(2) | 104 | |||||||
| (1) | Based on the appraisal. |
| (2) | Excludes the Holiday Inn Express Van Horn property. |
THE INFORMATION IN THIS STRUCTURAL AND COLLATERAL TERM SHEET IS NOT COMPLETE AND MAY BE AMENDED PRIOR TO THE TIME OF SALE. THIS TERM SHEET IS NOT AN OFFER TO SELL THESE SECURITIES AND IT IS NOT A SOLICITATION OF AN OFFER TO BUY THESE SECURITIES IN ANY JURISDICTION WHERE THE OFFER OR SALE IS NOT PERMITTED.
| 130 of 136 | |
| Structural and Collateral Term Sheet | JPMDB 2018-C8 | |
| Texas Hotel Portfolio | ||
| Operating History and Underwritten Net Cash Flow | |||||||
| 2015(1) | 2016(1)(2) | 2017(2) | TTM(2)(3) | Underwritten | Per Room(4) | % of Total Revenue(5) | |
| Occupancy | 67.4% | 61.3% | 70.6% | 75.8% | 75.8% | ||
| ADR | $79.97 | $86.62 | $100.05 | $102.32 | $102.32 | ||
| RevPAR | $53.90 | $53.10 | $70.60 | $77.56 | $77.56 | ||
| Room Revenue | $4,977,403 | $4,916,697 | $8,426,998 | $9,257,573 | $9,257,573 | $28,311 | 85.9% |
| Food & Beverage Revenue | 1,961,981 | 1,947,513 | 1,383,938 | 1,387,470 | 1,387,470 | 4,243 | 12.9 |
| Other Departmental Revenue | 107,283 | 90,095 | 122,111 | 127,600 | 127,600 | 390 | 1.2 |
| Total Revenue | $7,046,667 | $6,954,305 | $9,933,047 | $10,772,643 | $10,772,643 | $32,944 | 100.0% |
| Room Expense | $1,381,007 | $1,265,332 | $2,002,648 | $2,101,654 | $2,101,654 | $6,427 | 22.7% |
| Food & Beverage Expense | 1,362,745 | 1,351,698 | 1,050,539 | 1,030,464 | 1,030,464 | 3,151 | 74.3 |
| Other Departmental Expenses | 155,471 | 139,770 | 122,435 | 127,090 | 127,090 | 389 | 99.6 |
| Departmental Expenses | $2,899,223 | $2,756,800 | $3,175,622 | $3,259,208 | $3,259,208 | $9,967 | 30.3% |
| Departmental Profit | $4,147,444 | $4,197,505 | $6,757,425 | $7,513,436 | $7,513,436 | $22,977 | 69.7% |
| Operating Expenses | $2,234,291 | $1,931,736 | $2,287,207 | $2,387,868 | $2,387,868 | $7,302 | 22.2% |
| Gross Operating Profit | $1,913,153 | $2,265,769 | $4,470,218 | $5,125,567 | $5,125,567 | $15,675 | 47.6% |
| Fixed Expenses | $296,343 | $304,043 | $317,705 | $355,063 | $491,329 | $1,503 | 4.6% |
| Management Fees | 140,931 | 229,584 | 297,305 | 322,553 | 323,179 | 988 | 3.0 |
| Franchise Fee | 395,509 | 379,641 | 708,096 | 781,342 | 812,553 | 2,485 | 7.5 |
| FF&E | 0 | 0 | 0 | 0 | 430,906 | 1,318 | 4.0 |
| Total Other Expenses | $832,783 | $913,268 | $1,323,107 | $1,458,957 | $2,057,967 | $6,293 | 19.1% |
| Net Operating Income | $1,080,370 | $1,352,501 | $3,147,111 | $3,666,610 | $3,067,600 | $9,381 | 28.5% |
| Net Cash Flow | $1,080,370 | $1,352,501 | $3,147,111 | $3,666,610 | $3,067,600 | $9,381 | 28.5% |
| (1) | The Holiday Inn Express Van Horn property was developed in 2016 and opened for business in December 2016. As such, 2015 and 2016 operating history, Occupancy, ADR and RevPAR represents operations from the Holiday Inn & Suites Beaumont property only. |
| (2) | The Holiday Inn & Suites Beaumont property underwent an approximately $5.1 million PIP between March 2016 and August 2017 that impacted operations at the related property. |
| (3) | TTM represents the trailing 12-month period ending on February 28, 2018. |
| (4) | Per Room values based on 327 rooms. |
| (5) | % of Total Revenue for Room Expense, Food & Beverage Expense and Other Departmental Expenses is based on their corresponding revenue line item. |
Partial Release.Following a lockout period, the borrowers are permitted to release the Holiday Inn Express Van Horn property from the lien of the mortgage subject to, among other conditions, the prepayment of the loan in an amount equal to the greatest of (a) 150% of the allocated loan amount, (b) an amount equal to 100% of the sales proceeds for the released property, (c) an amount that would result in a maximum loan-to-value ratio of 55.0%, (d) an amount that would result in a minimum debt service coverage ratio of 2.20x, (e) an amount that would result in a minimum debt yield of 15.0% and (f) if the loan is securitized in a REMIC trust, the amount necessary such that the ratio of the unpaid principal balance of the loan to the value of the remaining property is greater than 125%, an amount as may be required such that the securitization will not fail to maintain its status as a REMIC trust as a result of such release.
THE INFORMATION IN THIS STRUCTURAL AND COLLATERAL TERM SHEET IS NOT COMPLETE AND MAY BE AMENDED PRIOR TO THE TIME OF SALE. THIS TERM SHEET IS NOT AN OFFER TO SELL THESE SECURITIES AND IT IS NOT A SOLICITATION OF AN OFFER TO BUY THESE SECURITIES IN ANY JURISDICTION WHERE THE OFFER OR SALE IS NOT PERMITTED.
| 131 of 136 | |
| Structural and Collateral Term Sheet | JPMDB 2018-C8 | |
| Troy Hotel Portfolio | ||
| Mortgage Loan Information | Property Information | |||
| Mortgage Loan Seller: | BSP | Single Asset / Portfolio: | Portfolio | |
| Original Principal Balance: | $17,000,000 | Title: | Fee | |
| Cut-off Date Principal Balance: | $17,000,000 | Property Type - Subtype: | Hotel – Various | |
| % of Pool by IPB: | 2.4% | Net Rentable Area (Rooms): | 177 | |
| Loan Purpose: | Refinance | Location: | Troy, MI | |
| Borrower: | Troy Hotels, Inc. | Year Built / Renovated: | 2016 / N/A | |
| Sponsor: | Malik Abdi Abdulnoor | Occupancy / ADR / RevPAR: | 77.4% / $122.21 / $94.62 | |
| Interest Rate: | 5.22000% | Occupancy / ADR / RevPAR Date: | 3/31/2018 | |
| Note Date: | 5/8/2018 | Number of Tenants: | N/A | |
| Maturity Date: | 6/6/2028 | 2015 NOI(1): | N/A | |
| Interest-only Period: | None | 2016 NOI(1): | N/A | |
| Original Term: | 120 months | 2017 NOI: | $3,200,588 | |
| Original Amortization: | 300 months | TTM NOI (as of 3/2018): | $3,339,098 | |
| Amortization Type: | Balloon | UW Occupancy / ADR / RevPAR: | 77.4% / $122.21 / $94.62 | |
| Call Protection: | L(24),Def(92),O(4) | UW Revenues: | $6,203,742 | |
| Lockbox / Cash Management: | Springing / Springing | UW Expenses: | $3,243,660 | |
| Additional Debt: | N/A | UW NOI: | $2,960,082 | |
| Additional Debt Balance: | N/A | UW NCF: | $2,711,933 | |
| Additional Debt Type: | N/A | Appraised Value / Per Room: | $29,800,000 / $168,362 | |
| Appraisal Date: | 4/13/2018 | |||
| Escrows and Reserves | Financial Information | |||||
| Initial | Monthly | Initial Cap | Cut-off Date Loan / Room: | $96,045 | ||
| Taxes: | $175,083 | $15,917 | N/A | Maturity Date Loan / Room: | $72,396 | |
| Insurance: | $0 | $5,177 | N/A | Cut-off Date LTV: | 57.0% | |
| FF&E Reserves: | $0 | 4% of Gross Revenues | N/A | Maturity Date LTV: | 43.0% | |
| TI/LC: | $0 | $0 | N/A | UW NCF DSCR: | 2.22x | |
| Other(2): | $0 | Springing | N/A | UW NOI Debt Yield: | 17.4% | |
| Sources and Uses | ||||||
| Sources | Proceeds | % of Total | Uses | Proceeds | % of Total | |
| Mortgage Loan | $17,000,000 | 100.0% | Payoff Existing Debt | $11,167,819 | 65.7% | |
| Closing Costs | 264,155 | 1.6 | ||||
| Upfront Reserves | 175,083 | 1.0 | ||||
| Return of Equity | 5,392,943 | 31.7 | ||||
| Total Sources | $17,000,000 | 100.0% | Total Uses | $17,000,000 | 100.0% | |
| (1) | 2015 and 2016 financials are not available due to the timing of construction. |
| (2) | Other Reserves represent a PIP reserve. On the date that any PIP is imposed by the franchisor pursuant to the franchise agreement, the borrower is required to deposit an amount equal to 125% of the amount required to pay for such PIP; provided, however, if such PIP requires FF&E expenditures, such portion of the PIP will be funded using funds held in the FF&E reserve account and the amount to be deposited into the PIP reserve account will be reduced by then-current amount of the funds held in the FF&E reserve account. |
THE INFORMATION IN THIS STRUCTURAL AND COLLATERAL TERM SHEET IS NOT COMPLETE AND MAY BE AMENDED PRIOR TO THE TIME OF SALE. THIS TERM SHEET IS NOT AN OFFER TO SELL THESE SECURITIES AND IT IS NOT A SOLICITATION OF AN OFFER TO BUY THESE SECURITIES IN ANY JURISDICTION WHERE THE OFFER OR SALE IS NOT PERMITTED.
| 132 of 136 | |
| Structural and Collateral Term Sheet | JPMDB 2018-C8 | |
| Troy Hotel Portfolio | ||
The Loan.The Troy Hotel Portfolio loan has an outstanding principal balance as of the Cut-off Date of $17.0 million and is secured by a first mortgage lien on the borrower’s fee interests in one limited service hotel and one extended stay hotel totaling 177 rooms located in Troy, Michigan. The Troy Hotel Portfolio loan has a 10-year term and amortizes on a 25-year schedule. The borrowing entity for the Troy Hotel Portfolio is Troy Hotels, Inc., a Michigan corporation and special purpose entity.
The loan sponsor and nonrecourse carve-out guarantor is Malik Abdi Abdulnoor, who owns 30% of the borrowing entity, and has over 30 years of real estate experience developing, owning and operating full service, limited service and extended stay hotels throughout the state of Michigan. Mr. Abdulnoor is the CEO of Mid America Lodging Group a hospitality property management company with 33 hotels under management for which Mr. Abdulnoor is the sole or primary member. Additionally, Mr. Abdulnoor is the CEO of Stellar Development/Midwest Lodging, which is focused on the development of new hotels and currently has eight operating hotels and multiple projects under development. As of year-end 2016, Abdulnoor’s portfolio included over 4,600 keys across 44 hotels and 31 development sites for an aggregate estimated market value of $362 million.
The Portfolio. The Troy Hotel Portfolio consists of two hotel properties totaling 177 rooms located in Troy, Michigan. The two properties are cross-collateralized and cross-defaulted. A summary of each individual portfolio property is provided below:
| Portfolio Summary | ||||||||
| Property | Location | Rooms | Year Built / Renovated | Cut-off Date ALA(1) | % of ALA | Appraised Value | UW NCF | % of UW NCF |
| TownePlace Suites by Marriott Troy | Troy, MI | 87 | 2016 / N/A | $8,574,092 | 50.4% | $15,200,000 | $1,367,786 | 50.4% |
| Fairfield Inn & Suites by Marriott Troy | Troy, MI | 90 | 2016 / N/A | 8,425,908 | 49.6 | 14,600,000 | 1,344,147 | 49.6 |
| Total | 177 | $17,000,000 | 100.0% | $29,800,000 | $2,711,933 | 100.0% | ||
| (1) | Allocated based on the respective UW NCF. |
| Historical Occupancy, ADR and RevPAR(1) | |||||||||
| Occupancy | ADR | RevPAR | |||||||
| Property | 2016 | 2017 | TTM(2) | 2016 | 2017 | TTM(2) | 2016 | 2017 | TTM(2) |
| TownePlace Suites by Marriott Troy | N/A | 77.8% | 76.9% | N/A | $123.82 | $126.49 | N/A | $96.37 | $97.26 |
| Fairfield Inn & Suites by Marriott Troy | N/A | 73.6% | 77.9% | N/A | $119.61 | $118.13 | N/A | $87.98 | $92.07 |
| Wtd. Avg.(3) | N/A | 75.7% | 77.4% | N/A | $121.74 | $122.21 | N/A | $92.10 | $94.62 |
| (1) | Based on operating statements provided by the borrowers. 2016 data is not available due to the timing of construction. |
| (2) | TTM as of March 31, 2018. |
| (3) | Weighted by room count. |
| Historical Occupancy, ADR and RevPAR Penetration Rates(1) | |||||||||
| Occupancy | ADR | RevPAR | |||||||
| Property | 2016 | 2017 | TTM(2) | 2016 | 2017 | TTM(2) | 2016 | 2017 | TTM(2) |
| TownePlace Suites by Marriott Troy | N/A | 98.6% | 98.2% | N/A | 114.4% | 117.1% | N/A | 112.8% | 115.0% |
| Fairfield Inn & Suites by Marriott Troy | N/A | 96.5% | 101.7% | N/A | 102.7% | 101.9% | N/A | 99.1% | 103.6% |
| Wtd. Avg.(3) | N/A | 97.5% | 99.9% | N/A | 108.4% | 109.4% | N/A | 105.8% | 109.2% |
| (1) | Penetration Rates are from reports provided by a third party data provider. 2016 data is not available due to the timing of construction. |
| (2) | TTM is as of March 31, 2018. |
| (3) | Weighted by room count. |
THE INFORMATION IN THIS STRUCTURAL AND COLLATERAL TERM SHEET IS NOT COMPLETE AND MAY BE AMENDED PRIOR TO THE TIME OF SALE. THIS TERM SHEET IS NOT AN OFFER TO SELL THESE SECURITIES AND IT IS NOT A SOLICITATION OF AN OFFER TO BUY THESE SECURITIES IN ANY JURISDICTION WHERE THE OFFER OR SALE IS NOT PERMITTED.
| 133 of 136 | |
| Structural and Collateral Term Sheet | JPMDB 2018-C8 | |
| Troy Hotel Portfolio | ||
The Market.The properties are located in southern Troy, Oakland County, within the Detroit-Warren-Dearborn MSA.Vehicular access to the properties is provided by Stephenson Highway and 14 Mile Road. The properties are also located within 2 miles of Interstate 75. The Detroit Metropolitan International Airport, which is located 25 miles from the properties, reported approximately 34.7 million passenger traffic in 2017 and has reported an increase in passenger traffic annually for the past five years. According to the appraisal, theDetroit-Warren-Dearborn MSA had an estimated 2017 population of approximately 4.3 million, which has remained stable since 2010. As of March 2018, unemployment in the Detroit-Warren-Dearborn MSA was 4.3%, compared to 4.7% for the state of Michigan and 4.1% for the United States over the same time period.
According to the appraiser, the properties are well situated with respect to demand generators that include corporations, medical facilities, retail centers and tourist attractions. Corporate and medical demand drivers include Valeo Inc. (adjacent), Kostal of America (adjacent), General Motors (6.6 miles), Magna International (7.0 miles) and Troy Beaumont Hospital (7.7 miles). Tourism and entertainment attractions include the Oakland Mall (1.7 miles), the Somerset Collection (5.3 miles), the Motown Historical Museum (14.4 miles), and The Henry Ford museum complex (23.4 miles) as well as casinos located in downtown Detroit and Windsor, Canada. Special events also generate demand during weekends such as the Detroit International Jazz Festival and the North American International Auto Show. Additionally, the newly constructed Little Caesars Arena (15.2 miles) (a recently opened multi-purpose arena in Midtown Detroit that serves as the new home of the Detroit Red Wing and Detroit Pistons) and the accompanying entertainment district are anticipated to increase Detroit’s tourism and leisure attractions.
The appraiser identified a new supply of four proposed hotels that are in various stages of development. The Hyatt Place Royal Oak (4.0 miles) is currently under construction and the Beaumont Hospital Hotel (4.5 miles) has been approved for construction. A Home2 Suites by Hilton Troy (4.8 miles) and a Tru by Hilton Troy (1.3 miles) are both in early stage of development. However, in consideration of the locations, operating profile, branding and/or estimated performance of these proposed hotels, most of these are considered secondarily competitive by the lender.
A summary of each individual property’s primary competitors is provided below:
TownePlace Suites by Marriott Troy – Competitive Hotels Profile(1) | |||||||||
| 2017 Estimated Market Mix | 2017 Estimated Operating Statistics(2) | ||||||||
| Property | Rooms | Year Opened | Meeting Space (SF) | Commercial | Leisure and Group | Extended -Stay | Occupancy | ADR | RevPAR |
| TownePlace Suites by Marriott Troy(3) | 87 | 2016 | - | 40% | 15% | 45% | 77.8% | $123.82 | $96.37 |
| Fairfield Inn & Suites by Marriott Troy(3) | 90 | 2016 | 494 | 65% | 35% | 0% | 73.6% | $119.61 | $87.98 |
| Residence Inn by Marriott Detroit Troy Madison Heights | 96 | 1985 | - | 30% | 15% | 55% | 72.5% | $112.50 | $82.50 |
| Homewood Suites by Hilton Detroit Troy | 150 | 2002 | 1,352 | 35% | 15% | 50% | 82.5% | $127.50 | $107.50 |
| Hawthorn Suites By Wyndham Troy MI | 152 | 1985 | 750 | 30% | 20% | 50% | 77.5% | $87.50 | $67.50 |
| Candlewood Suites Troy | 118 | 1998 | - | 30% | 20% | 50% | 77.5% | $92.50 | $67.50 |
| Total(4) | 606 | ||||||||
| (1) | Based on the appraisal. |
| (2) | 2017 Estimated Operating Statistics for Occupancy, ADR and RevPAR represent a midpoint in each respective data set. |
| (3) | 2017 Occupancy, ADR and RevPAR are actuals based on operating statements provided by the borrower. |
| (4) | Excludes the TownePlace Suites by Marriott Troy property. |
THE INFORMATION IN THIS STRUCTURAL AND COLLATERAL TERM SHEET IS NOT COMPLETE AND MAY BE AMENDED PRIOR TO THE TIME OF SALE. THIS TERM SHEET IS NOT AN OFFER TO SELL THESE SECURITIES AND IT IS NOT A SOLICITATION OF AN OFFER TO BUY THESE SECURITIES IN ANY JURISDICTION WHERE THE OFFER OR SALE IS NOT PERMITTED.
| 134 of 136 | |
| Structural and Collateral Term Sheet | JPMDB 2018-C8 | |
| Troy Hotel Portfolio | ||
Fairfield Inn & Suites by Marriott Troy – Competitive Hotels Profile(1) | |||||||||
| 2017 Estimated Market Mix | 2017 Estimated Operating Statistics(2) | ||||||||
| Property | Rooms | Year Opened | Meeting Space (SF) | Commercial | Leisure and Group | Extended -Stay | Occupancy | ADR | RevPAR |
| Fairfield Inn & Suites by Marriott Troy(3) | 90 | 2016 | 494 | 65% | 35% | 0% | 73.6% | $119.61 | $87.98 |
| TownePlace Suites by Marriott Troy(3) | 87 | 2016 | - | 40% | 15% | 45% | 77.8% | $123.82 | $96.37 |
| Hampton Inn Detroit Madison Heights South Troy | 123 | 1987 | 552 | 65% | 35% | 0% | 82.5% | $112.50 | $92.50 |
Holiday Inn Express Hotel & Suites Detroit North Troy | 117 | 2013 | 500 | 65% | 35% | 0% | 82.5% | $102.50 | $82.50 |
| Hampton Inn & Suites Detroit Troy | 122 | 2015 | 713 | 70% | 30% | 0% | 82.5% | $127.50 | $102.50 |
| Drury Inn & Suites Troy | 217 | 1984 | 1,050 | 65% | 35% | 0% | 67.5% | $122.50 | $82.50 |
| Total(4) | 666 | ||||||||
| (1) | Based on the appraisal. |
| (2) | 2017 Estimated Operating Statistics for Occupancy, ADR and RevPAR represent a midpoint in each respective data set. |
| (3) | 2017 Occupancy, ADR and RevPAR are actuals based on operating statements provided by the borrower. |
| (4) | Excludes the Fairfield Inn & Suites by Marriott Troy property. |
Operating History and Underwritten Net Cash Flow(1) | |||||
| 2017 | TTM(2) | Underwritten | Per Room(3) | % of Total Revenue(4) | |
| Occupancy | 75.7% | 77.4% | 77.4% | ||
| ADR | $121.74 | $122.21 | $122.21 | ||
| RevPAR | $92.10 | $94.62 | $94.62 | ||
| Room Revenue | $5,950,241 | $6,113,011 | $6,113,011 | $34,537 | 98.5% |
| Food & Beverage Revenue | 0 | 0 | 0 | 0 | 0.0 |
| Other Departmental Revenue | 87,883 | 90,731 | 90,731 | 513 | 1.5 |
| Total Revenue | $6,038,123 | $6,203,742 | $6,203,742 | $35,049 | 100.0% |
| Room Expense | $1,087,393 | $1,130,305 | $1,210,636 | $6,840 | 19.8% |
| Food & Beverage Expense | 0 | 0 | 0 | 0 | 0.0 |
| Other Departmental Expenses | 28,054 | 22,024 | 29,586 | 167 | 32.6 |
| Departmental Expenses | $1,115,447 | $1,152,330 | $1,240,222 | $7,007 | 20.0% |
| Departmental Profit | $4,922,676 | $5,051,413 | $4,963,520 | $28,042 | 80.0% |
| Management Fees | 181,144 | 186,112 | 186,112 | 1,051 | 3.0 |
| Franchise Fees | 481,785 | 446,904 | 412,468 | 2,330 | 6.6 |
| Property Taxes | 189,608 | 189,608 | 191,000 | 1,079 | 3.1 |
| Property Insurance | 40,400 | 40,400 | 62,119 | 351 | 1.0 |
| Other Expenses | 829,151 | 849,291 | 1,151,738 | 6,507 | 18.6 |
| Total General/Unallocated Expenses | $1,722,088 | $1,712,315 | $2,003,437 | $11,319 | 32.3% |
| Net Operating Income | $3,200,588 | $3,339,098 | $2,960,082 | $16,724 | 47.7% |
| FF&E | 241,525 | 248,150 | 248,150 | 1,402 | 4.0 |
| Net Cash Flow | $2,959,063 | $3,090,948 | $2,711,933 | $15,322 | 43.7% |
| (1) | 2015 and 2016 financials are not available due to the timing of construction. |
| (2) | TTM column represents the trailing 12-month period ending on March 31, 2018. |
| (3) | Per Room values are based on 177 guest rooms. |
(4) | % of Total Revenue for Room Expense, Food & Beverage Expense and Other Departmental Expenses are based on their corresponding revenue line items. |
THE INFORMATION IN THIS STRUCTURAL AND COLLATERAL TERM SHEET IS NOT COMPLETE AND MAY BE AMENDED PRIOR TO THE TIME OF SALE. THIS TERM SHEET IS NOT AN OFFER TO SELL THESE SECURITIES AND IT IS NOT A SOLICITATION OF AN OFFER TO BUY THESE SECURITIES IN ANY JURISDICTION WHERE THE OFFER OR SALE IS NOT PERMITTED.
| 135 of 136 | |
| Structural and Collateral Term Sheet | JPMDB 2018-C8 | |
| Contacts | ||
| J.P. Morgan CMBS Capital Markets & Banking | ||
| Contact | Phone Number | |
Kunal Singh Managing Director | kunal.k.singh@jpmorgan.com | (212) 834-5467 |
Brad Horn Executive Director | bradley.j.horn@jpmorgan.com | (212) 834-9708 |
| J.P. Morgan CMBS Trading | ||
| Contact | Phone Number | |
Andy Taylor Managing Director | andrew.b.taylor@jpmorgan.com | (212) 834-3111 |
Avinash Sharma Executive Director | avinash.sharma@jpmorgan.com | (212) 834-3111 |
| J.P. Morgan Securitized Products Syndicate | ||
| Contact | Phone Number | |
Andy Cherna Managing Director | andy.cherna@jpmorgan.com | (212) 834-4154 |
Maggie D’Arcy Associate | maggie.darcy@jpmchase.com | (212) 834-4154 |
| Deutsche Bank CMBS Capital Markets & Banking | ||
| Contact | Phone Number | |
Lainie Kaye Managing Director | lainie.kaye@db.com | (212) 250-5270 |
Natalie Grainger Director | natalie.grainger@db.com | (212) 250-1254 |
| Deutsche Bank CMBS Trading | ||
| Contact | Phone Number | |
Ryan Horvath Vice President | ryan.horvath@db.com | (212) 250-5149 |
| Deutsche Bank CMBS Structuring | ||
| Contact | Phone Number | |
Shaishav Agarwal Managing Director | shaishav.agarwal@db.com | (212) 250-6290 |
Dan Penn Director | daniel.penn@db.com | (212) 250-5149 |
THE INFORMATION IN THIS STRUCTURAL AND COLLATERAL TERM SHEET IS NOT COMPLETE AND MAY BE AMENDED PRIOR TO THE TIME OF SALE. THIS TERM SHEET IS NOT AN OFFER TO SELL THESE SECURITIES AND IT IS NOT A SOLICITATION OF AN OFFER TO BUY THESE SECURITIES IN ANY JURISDICTION WHERE THE OFFER OR SALE IS NOT PERMITTED.
| 136 of 136 | |