JP Morgan Chase Commercial Mortgage Securities
Filed: 3 Jun 19, 9:33pm
| FREE WRITING PROSPECTUS | ||
| FILED PURSUANT TO RULE 433 | ||
| REGISTRATION FILE NO.: 333-226123-04 | ||
| June [3], 2019 | JPMCC 2019-COR5 |
Free Writing Prospectus Structural and Collateral Term Sheet |
JPMCC 2019-COR5
This material is for your information, and none of J.P. Morgan Securities LLC (“JPMS”), Jefferies LLC and Drexel Hamilton, LLC, (each individually, an “Underwriter”, and together, the ‘‘Underwriters’’) are soliciting any action based upon it. This material is not to be construed as an offer to sell or the solicitation of any offer to buy any security in any jurisdiction where such an offer or solicitation would be illegal.
The depositor has filed a registration statement (including a prospectus) with the SEC (SEC File No. 333-226123) for the offering to which this free writing prospectus relates. Before you invest, you should read the prospectus in the registration statement and other documents the depositor has filed with the SEC for more complete information about the depositor, the issuing entity and this offering. You may get these documents for free by visiting EDGAR on the SEC Web site at www.sec.gov. Alternatively, the depositor, any underwriter or any dealer participating in the offering will arrange to send you the prospectus if you request it by calling (800) 408-1016 or by emailing the ABS Syndicate Desk atabs_synd@jpmorgan.com.
THE SECURITIES TO WHICH THIS INFORMATION RELATES WILL BE MORE FULLY DESCRIBED IN A PROSPECTUS (THE “PROSPECTUS”), WHICH IS NOT YET AVAILABLE. THE PROSPECTUS WILL CONTAIN MATERIAL INFORMATION THAT IS NOT CONTAINED IN THESE MATERIALS (INCLUDING WITHOUT LIMITATION A DETAILED DISCUSSION OF RISKS ASSOCIATED WITH AN INVESTMENT IN THE CERTIFICATES, UNDER THE HEADING“RISK FACTORS”IN THE PROSPECTUS).
Neither this document nor anything contained in this document shall form the basis for any contract or commitment whatsoever. The information contained in this document is preliminary as of the date of this document, supersedes any previous such information delivered to you and will be superseded by any such information subsequently delivered prior to the time of sale. These materials are subject to change, completion or amendment from time to time. This information is based upon management forecasts and reflects prevailing conditions and management’s views as of this date, all of which are subject to change.
J.P. Morgan is the marketing name for the investment banking businesses of JPMorgan Chase & Co. and its subsidiaries worldwide. Securities, syndicated loan arranging, financial advisory and other investment banking activities are performed by JPMS and its securities affiliates, and lending, derivatives and other commercial banking activities are performed by JPMorgan Chase Bank, National Association and its banking affiliates. JPMS is a member of SIPC and the NYSE.
THE UNDERWRITERS MAY FROM TIME TO TIME PERFORM INVESTMENT BANKING SERVICES FOR, OR SOLICIT INVESTMENT BANKING BUSINESS FROM, ANY COMPANY NAMED IN THESE MATERIALS. THE UNDERWRITERS AND/OR THEIR AFFILIATES OR RESPECTIVE EMPLOYEES MAY FROM TIME TO TIME HAVE A LONG OR SHORT POSITION IN ANY CERTIFICATE OR CONTRACT DISCUSSED IN THESE MATERIALS.
|
THE INFORMATION IN THIS STRUCTURAL AND COLLATERAL TERM SHEET IS NOT COMPLETE AND MAY BE AMENDED PRIOR TO THE TIME OF SALE. THIS TERM SHEET IS NOT AN OFFER TO SELL THESE SECURITIES AND IT IS NOT A SOLICITATION OF AN OFFER TO BUY THESE SECURITIES IN ANY JURISDICTION WHERE THE OFFER OR SALE IS NOT PERMITTED.

1 of 116
| June [3], 2019 | JPMCC 2019-COR5 |
THE REPUBLIC OF KOREA
IN KOREA. NEITHER THE ISSUER NOR ANY OF ITS AGENTS MAKE ANY REPRESENTATION WITH RESPECT TO THE ELIGIBILITY OF ANY RECIPIENTS OF THIS PROSPECTUS TO ACQUIRE THE OFFERED CERTIFICATES UNDER THE LAWS OF KOREA, INCLUDING, BUT WITHOUT LIMITATION, THE FOREIGN EXCHANGE TRANSACTION LAW AND REGULATIONS THEREUNDER (THE “FETL”). THE OFFERED CERTIFICATES HAVE NOT BEEN REGISTERED WITH THE FINANCIAL SERVICES COMMISSION OF KOREA FOR PUBLIC OFFERING IN KOREA, AND NONE OF THE OFFERED CERTIFICATES MAY BE OFFERED, SOLD OR DELIVERED, DIRECTLY OR INDIRECTLY, OR OFFERED OR SOLD TO ANY PERSON FOR RE-OFFERING OR RESALE, DIRECTLY OR INDIRECTLY IN KOREA OR TO ANY RESIDENT OF KOREA EXCEPT PURSUANT TO THE FINANCIAL INVESTMENT SERVICES AND CAPITAL MARKETS ACT AND THE DECREES AND REGULATIONS THEREUNDER (THE “FSCMA”), THE FETL AND ANY OTHER APPLICABLE LAWS, REGULATIONS AND MINISTERIAL GUIDELINES IN KOREA. WITHOUT PREJUDICE TO THE FOREGOING, THE NUMBER OF OFFERED CERTIFICATES OFFERED IN KOREA OR TO A RESIDENT OF KOREA SHALL BE LESS THAN FIFTY AND FOR A PERIOD OF ONE YEAR FROM THE ISSUE DATE OF THE OFFERED CERTIFICATES, NONE OF THE OFFERED CERTIFICATES MAY BE DIVIDED RESULTING IN AN INCREASED NUMBER OF OFFERED CERTIFICATES. FURTHERMORE, THE OFFERED CERTIFICATES MAY NOT BE RESOLD TO KOREAN RESIDENTS UNLESS THE PURCHASER OF THE OFFERED CERTIFICATES COMPLIES WITH ALL APPLICABLE REGULATORY REQUIREMENTS (INCLUDING, BUT NOT LIMITED TO, GOVERNMENT REPORTING APPROVAL REQUIREMENTS UNDER THE FETL AND ITS SUBORDINATE DECREES AND REGULATIONS) IN CONNECTION WITH THE PURCHASE OF THE OFFERED CERTIFICATES.
JAPAN
THE OFFERED CERTIFICATES HAVE NOT BEEN AND WILL NOT BE REGISTERED UNDER THE FINANCIAL INSTRUMENTS AND EXCHANGE LAW OF JAPAN, AS AMENDED (THE “FIEL”), AND DISCLOSURE UNDER THE FIEL HAS NOT BEEN AND WILL NOT BE MADE WITH RESPECT TO THE OFFERED CERTIFICATES. ACCORDINGLY, EACH UNDERWRITER HAS REPRESENTED AND AGREED THAT IT HAS NOT, DIRECTLY OR INDIRECTLY, OFFERED OR SOLD AND WILL NOT, DIRECTLY OR INDIRECTLY, OFFER OR SELL ANY OFFERED CERTIFICATES IN JAPAN OR TO, OR FOR THE BENEFIT OF, ANY RESIDENT OF JAPAN (WHICH TERM AS USED IN THIS PROSPECTUS MEANS ANY PERSON RESIDENT IN JAPAN, INCLUDING ANY CORPORATION OR OTHER ENTITY ORGANIZED UNDER THE LAWS OF JAPAN) OR TO OTHERS FOR REOFFERING OR RE-SALE, DIRECTLY OR INDIRECTLY, IN JAPAN OR TO, OR FOR THE BENEFIT OF, ANY RESIDENT OF JAPAN EXCEPT PURSUANT TO AN EXEMPTION FROM THE REGISTRATION REQUIREMENTS OF, AND OTHERWISE IN COMPLIANCE WITH, THE FIEL AND OTHER RELEVANT LAWS, REGULATIONS AND MINISTERIAL GUIDELINES OF JAPAN. AS PART OF THIS OFFERING OF THE OFFERED CERTIFICATES, THE UNDERWRITERS MAY OFFER THE OFFERED CERTIFICATES IN JAPAN TO UP TO 49 OFFEREES IN ACCORDANCE WITH THE ABOVE PROVISIONS.
THE INFORMATION IN THIS STRUCTURAL AND COLLATERAL TERM SHEET IS NOT COMPLETE AND MAY BE AMENDED PRIOR TO THE TIME OF SALE. THIS TERM SHEET IS NOT AN OFFER TO SELL THESE SECURITIES AND IT IS NOT A SOLICITATION OF AN OFFER TO BUY THESE SECURITIES IN ANY JURISDICTION WHERE THE OFFER OR SALE IS NOT PERMITTED.
2 of 116
| Structural and Collateral Term Sheet | JPMCC 2019-COR5 | |
| Collateral Characteristics | ||
| Loan Pool | ||
| Initial Pool Balance (“IPB”): | $698,637,121 | |
| Number of Mortgage Loans: | 46 | |
| Number of Mortgaged Properties: | 135 | |
| Average Cut-off Date Balance per Mortgage Loan: | $15,187,764 | |
| Weighted Average Current Mortgage Rate: | 4.79423% | |
| 10 Largest Mortgage Loans as % of IPB: | 63.1% | |
| Weighted Average Remaining Term to Maturity: | 112 months | |
| Weighted Average Seasoning: | 3 months | |
| Credit Statistics | ||
| Weighted Average UW NCF DSCR(1)(2): | 1.79x | |
| Weighted Average UW NOI Debt Yield(1): | 10.0% | |
| Weighted Average Cut-off Date Loan-to-Value Ratio (“LTV”)(1)(3): | 58.6% | |
| Weighted Average Maturity Date LTV(1)(3): | 54.5% | |
| Other Statistics | ||
| % of Mortgage Loans with Additional Debt: | 39.3% | |
| % of Mortgaged Properties with Single Tenants: | 8.2% | |
| Amortization | ||
| Weighted Average Original Amortization Term(4): | 355 months | |
| Weighted Average Remaining Amortization Term(4): | 354 months | |
| % of Mortgage Loans with Interest-Only: | 57.1% | |
| % of Mortgage Loans with Partial Interest-Only followed by Amortizing Balloon: | 21.9% | |
| % of Mortgage Loans with Amortizing Balloon: | 21.0% | |
| Lockbox / Cash Management(5) | ||
| % of Mortgage Loans with In-Place, Hard Lockboxes: | 80.9% | |
| % of Mortgage Loans with In-Place, Soft Lockboxes: | 9.8% | |
| % of Mortgage Loans with Springing Lockboxes: | 9.3% | |
| % of Mortgage Loans with In-Place Cash Management: | 50.3% | |
| % of Mortgage Loans with Springing Cash Management: | 49.7% | |
| Reserves | ||
| % of Mortgage Loans Requiring Monthly Tax Reserves: | 90.0% | |
| % of Mortgage Loans Requiring Monthly Insurance Reserves: | 52.2% | |
| % of Mortgage Loans Requiring Monthly CapEx Reserves(6): | 79.6% | |
| % of Mortgage Loans Requiring Monthly TI/LC Reserves(7): | 77.9% | |
| (1) | In the case of Loan Nos. 1, 2, 4, 5, 6, 9, 13, 14, 20, 28, 29, 30, 31, 32, 34, 35, 36, 37, 38, 39, 40, 41, 42, 43, 44, 45 and 46, the UW NCF DSCR, UW NOI Debt Yield, Cut-off Date LTV and Maturity Date LTV calculations include the related Pari Passu Companion Loan(s). In the case of Loan Nos. 2, 3, 4, 5, 13, 28, 29, 30, 31, 32, 34, 35, 36, 37, 38, 39, 40, 41, 42, 43, 44, 45 and 46, the UW NCF DSCR, UW NOI Debt Yield, Cut-off Date LTV and Maturity Date LTV calculations exclude the related Subordinate Companion Loan(s) and/or related mezzanine loan(s). |
| (2) | With respect to Loan No. 5, the UW NCF DSCR is calculated using the sum of the first 12 whole loan principal and interest payments after the Cut-off Date based on the assumed principal and interest payment schedule set forth in Annex G of the Preliminary Prospectus. |
| (3) | In the case of Loan Nos. 6, 11, 20 and 22, the Cut-off Date LTV and the Maturity Date LTV are calculated by using an appraised value based on certain hypothetical assumptions. Refer to “Description of the Mortgage Pool—Assessments of Property Value and Condition” and “—Appraised Value” in the Preliminary Prospectus for additional details. |
| (4) | Excludes 30 mortgage loans that are interest-only for the entire term. |
| (5) | For a more detailed description of Lockbox / Cash Management, refer to “Description of the Mortgage Pool—Certain Terms of the Mortgage Loans—Mortgaged Property Accounts” in the Preliminary Prospectus. |
| (6) | CapEx Reserves include FF&E reserves for hotel properties. |
| (7) | Calculated only with respect to the Cut-off Date Balance of mortgage loans secured or partially secured by retail, office and mixed use properties. |
THE INFORMATION IN THIS STRUCTURAL AND COLLATERAL TERM SHEET IS NOT COMPLETE AND MAY BE AMENDED PRIOR TO THE TIME OF SALE. THIS TERM SHEET IS NOT AN OFFER TO SELL THESE SECURITIES AND IT IS NOT A SOLICITATION OF AN OFFER TO BUY THESE SECURITIES IN ANY JURISDICTION WHERE THE OFFER OR SALE IS NOT PERMITTED.
3 of 116
| Structural and Collateral Term Sheet | JPMCC 2019-COR5 | |
| Collateral Characteristics | ||
Mortgage Loan Seller | Number of | Number of | Aggregate | % of IPB |
| LCM | 18 | 81 | $438,826,733 | 62.8% |
| JPMCB(1) | 28 | 54 | 259,810,388 | 37.2 |
| Total | 46 | 135 | $698,637,121 | 100.0% |
| (1) | In the case of Loan No. 6, the whole loan was co-originated by JPMCB and Société Générale Financial Corporation. JPMCB will contribute promissory note A-9 with a Cut-off Date Balance of $35.0 million to this securitization. |
| Ten Largest Mortgage Loans | |||||||||||
| No. | Loan Name | Mortgage Loan Seller | No. of Prop. | Cut-off Date Balance | % of IPB | SF / Units/ Rooms / Beds | Property Type | UW NCF DSCR(1)(2) | UW NOI Debt Yield(1) | Cut-off Date LTV(1)(3) | Maturity Date LTV(1)(3) |
| 1 | Brooklyn Renaissance Plaza | LCM | 1 | $64,920,607 | 9.3% | 289,180 | Office | 1.43x | 8.9% | 48.6% | 39.2% |
| 2 | Hyde Park Multifamily Portfolio | LCM | 42 | $60,000,000 | 8.6% | 839 | Multifamily | 1.84x | 8.8% | 60.5% | 60.5% |
| 3 | The Avenue | LCM | 1 | $60,000,000 | 8.6% | 394 | Multifamily | 1.82x | 9.4% | 50.0% | 50.0% |
| 4 | 3 Columbus Circle | JPMCB | 1 | $50,000,000 | 7.2% | 753,713 | Office | 2.91x | 12.3% | 45.4% | 45.4% |
| 5 | Hampton Roads Office Portfolio | LCM | 22 | $49,901,186 | 7.1% | 1,322,003 | Office | 1.34x | 10.4% | 71.7% | 60.3% |
| 6 | SWVP Portfolio | JPMCB | 4 | $35,000,000 | 5.0% | 1,192 | Hotel | 2.04x | 11.9% | 59.6% | 59.6% |
| 7 | Terrace at Traverse Mountain | LCM | 1 | $32,000,000 | 4.6% | 117,097 | Retail | 1.75x | 9.2% | 58.2% | 58.2% |
| 8 | Peppertree Plaza | LCM | 1 | $31,850,000 | 4.6% | 248,901 | Retail | 1.57x | 10.7% | 68.3% | 61.7% |
| 9 | Vie Portfolio | JPMCB | 6 | $29,000,000 | 4.2% | 1,799 | Multifamily | 1.90x | 9.9% | 62.5% | 62.5% |
| 10 | Gateway Center | JPMCB | 1 | $28,350,000 | 4.1% | 310,745 | Office | 1.70x | 9.3% | 69.7% | 69.7% |
| Top 3 Total/Weighted Average | 44 | $184,920,607 | 26.5% | 1.69x | 9.0% | 52.9% | 49.6% | ||||
| Top 5 Total/Weighted Average | 67 | $284,821,793 | 40.8% | 1.84x | 9.8% | 54.9% | 50.7% | ||||
| Top 10 Total/Weighted Average | 80 | $441,021,793 | 63.1% | 1.83x | 10.0% | 57.9% | 54.8% | ||||
| (1) | In the case of Loan Nos. 1, 2, 4, 5, 6 and 9, the UW NCF DSCR, UW NOI Debt Yield, Cut-off Date LTV and Maturity Date LTV calculations include the related Pari Passu Companion Loan(s). In the case of Loan Nos. 2, 3, 4 and 5, the UW NCF DSCR, UW NOI Debt Yield, Cut-off Date LTV and Maturity Date LTV calculations exclude the related Subordinate Companion Loan(s) and/or related mezzanine loan(s). |
| (2) | With respect to Loan No. 5, the UW NCF DSCR is calculated using the sum of the first 12 whole loan principal and interest payments after the Cut-off Date based on the assumed principal and interest payment schedule set forth in Annex G of the Preliminary Prospectus. |
| (3) | In the case of Loan No. 6, the Cut-off Date LTV and the Maturity Date LTV are calculated by using an appraised value based on certain hypothetical assumptions. Refer to “Description of the Mortgage Pool—Assessments of Property Value and Condition” and “—Appraised Value” in the Preliminary Prospectus for additional details. |
THE INFORMATION IN THIS STRUCTURAL AND COLLATERAL TERM SHEET IS NOT COMPLETE AND MAY BE AMENDED PRIOR TO THE TIME OF SALE. THIS TERM SHEET IS NOT AN OFFER TO SELL THESE SECURITIES AND IT IS NOT A SOLICITATION OF AN OFFER TO BUY THESE SECURITIES IN ANY JURISDICTION WHERE THE OFFER OR SALE IS NOT PERMITTED.
4 of 116
| Structural and Collateral Term Sheet | JPMCC 2019-COR5 | |
| Collateral Characteristics | ||
| Pari Passu Companion Loan Summary |
| Loan No. | Mortgage Loan | Note(s) | Original Balance ($) | Cut-off Date Balance ($) | Holder of Note | Lead Servicer for Whole Loan (Y/N) | Master Servicer Under Lead Securitization | Special Servicer Under Lead Securitization |
| 1 | Brooklyn Renaissance Plaza | Note A-1 | $65,000,000 | $64,920,607 | JPMCC 2019-COR5 | Y | Midland | Midland |
| Note A-2 | $25,000,000 | $24,969,464 | LCM | N | ||||
| Total | $90,000,000 | $89,890,072 | ||||||
2
| Hyde Park Multifamily Portfolio | Note A-1 | $60,000,000 | $60,000,000 | JPMCC 2019-COR5 | Y | Midland | Midland |
| Note A-2 | $46,750,000 | $46,750,000 | LCM | N | ||||
| Total | $106,750,000 | $106,750,000 | ||||||
| 4 | 3 Columbus Circle | NoteA-1-1, A-2-1 | $75,000,000 | $75,000,000 | Benchmark 2019-B10 | Y(2) | ||
| Note A-1-2-A | $50,000,000 | $50,000,000 | JPMCC 2019-COR5 | N | ||||
| Note A-1-3, A-2-4 | $100,000,000 | $100,000,000 | Benchmark 2019-B11(3) | N | ||||
| Note A-1-2-B, A-1-4, A-1-6, A-1-7, A-1-8 | $142,500,000 | $142,500,000 | JPMCB | N | ||||
| Note A-1-5 | $50,000,000 | $50,000,000 | CS | N | ||||
| Note A-2-2, A-2-3 | $50,000,000 | $50,000,000 | CF 2019-CF1 | N | ||||
| Note A-2-5-A | $12,500,000 | $12,500,000 | DBNY | N | ||||
| Note A-2-5-B | $10,000,000 | $10,000,000 | CCRE | N | ||||
| Note B-1(1) | $51,450,000 | $51,450,000 | Benchmark 2019-B10 | Y(2) | KeyBank | LNR | ||
| Note B-2(1) | $53,550,000 | $53,550,000 | Benchmark 2019-B10 | N | ||||
| Total | $595,000,000 | $595,000,000 | ||||||
5
| Hampton Roads Office Portfolio | Note A-1, A-5 | $50,000,000 | $49,901,186 | JPMCC 2019-COR5 | Y | Midland | Midland |
| Note A-2, A-3, A-4, A-6 | $83,000,000 | $82,835,969 | LCM | N | ||||
| Total | $133,000,000 | $132,737,155 | ||||||
6
| SWVP Portfolio | Note A-1, A-3 | $45,000,000 | $45,000,000 | BBCMS 2019-C3(4) | Y | Midland | Midland |
| Note A-2, A-4, A-5, A-6 | $55,000,000 | $55,000,000 | Société Générale | N | ||||
| Note A-7, A-8 | $50,000,000 | $50,000,000 | Benchmark 2019-B11(3) | N | ||||
| Note A-9 | $35,000,000 | $35,000,000 | JPMCC 2019-COR5 | N | ||||
| Note A-10 | $15,000,000 | $15,000,000 | JPMCB | N | ||||
| Total | $200,000,000 | $200,000,000 | ||||||
9
| Vie Portfolio | Note A-1 | $29,000,000 | $29,000,000 | JPMCC 2019-COR5 | Y | Midland | Midland |
| Note A-2 | $17,500,000 | $17,500,000 | Benchmark 2019-B10 | N | ||||
| Note A-3 | $28,885,000 | $28,885,000 | JPMCB | N | ||||
| Total | $75,385,000 | $75,385,000 | ||||||
13
| ICON Upper Side East Portfolio | Note A-1 | $8,500,000 | $8,500,000 | JPMCC 2019-ICON UES | Y | Midland | CWCapital |
| Note A-2 | $25,000,000 | $25,000,000 | JPMCC 2019-COR5 | N | ||||
| Note A-3 | $25,000,000 | $25,000,000 | JPMCB | N | ||||
| Note B(1) | $57,200,000 | $57,200,000 | JPMCC 2019-ICON UES | N | ||||
| Total | $115,700,000 | $115,700,000 | ||||||
14
| NOV Headquarters | Note A-1 | $20,000,000 | $20,000,000 | JPMCC 2019-COR5 | Y | Midland | Midland |
| Note A-2 | $19,200,000 | $19,200,000 | LCM | N | ||||
| Total | $39,200,000 | $39,200,000 | ||||||
20
| Greenleaf at Howell | Note A-1-A | $10,000,000 | $10,000,000 | JPMCC 2019-COR5 | N | ||
| Note A-1-B | $10,000,000 | $10,000,000 | JPMCB | N | ||||
| Note A-2 | $26,500,000 | $26,500,000 | Benchmark 2019-B11(3) | Y | Midland | Rialto | ||
| Total | $46,500,000 | $46,500,000 | ||||||
Various(5)
| ICON 18 Mortgage Loans(5) | Notes A-1 | $30,000,000 | $30,000,000 | JPMCC 2019-COR5 | Y | Midland | Situs |
| Notes A-2 | $60,771,256 | $60,771,256 | JPMCC 2019-ICON | N | ||||
| Notes B(1) | $83,928,744 | $83,928,744 | JPMCC 2019-ICON | N | ||||
| Total | $174,700,000 | $174,700,000 |
| (1) | Each note represents a subordinate companion loan. |
THE INFORMATION IN THIS STRUCTURAL AND COLLATERAL TERM SHEET IS NOT COMPLETE AND MAY BE AMENDED PRIOR TO THE TIME OF SALE. THIS TERM SHEET IS NOT AN OFFER TO SELL THESE SECURITIES AND IT IS NOT A SOLICITATION OF AN OFFER TO BUY THESE SECURITIES IN ANY JURISDICTION WHERE THE OFFER OR SALE IS NOT PERMITTED.
5 of 116
| Structural and Collateral Term Sheet | JPMCC 2019-COR5 | |
| Collateral Characteristics | ||
| (2) | With respect to the 3 Columbus Circle Whole Loan, the initial controlling note is Note B-1, so long as no 3 Columbus Circle Control Appraisal Period has occurred and is continuing. If and for so long as a 3 Columbus Circle Control Termination Eventhas occurred and is continuing, then the controlling note will be the Note A-1-1. See “Description of the Mortgage Pool—The Whole Loans—The Non-Serviced AB Whole Loans—The 3 Columbus Circle Whole Loan” in the Preliminary Prospectus. The 3 Columbus Circle Whole Loan is serviced pursuant to the Benchmark 2019-B10 Pooling and Servicing Agreement. |
| (3) | With respect to Loan Nos. 4, 6 and 20, Notes A-1-3, A-2-4, Notes A-7, A-8 and Note A-1, respectively, are expected to be contributed to the Benchmark 2019-B11 trust. |
| (4) | With respect to Loan No. 6, Notes A-1 and A-3 are expected to be contributed to the BBCMS 2019-C3 trust. |
| (5) | The ICON 18 mortgage loans are comprised of 18 separate uncrossed mortgage loans with the same borrower sponsor. Each of these mortgage loans are collectively referred to from time to time as the “ICON 18 Mortgage Loans”, and the related whole loans as the “ICON 18 Whole Loans”. Each ICON 18 mortgage loan is serviced pursuant to the JPMCC 2019-ICON trust and servicing agreement. The Master Servicer Under Lead Securitization and the Special Servicer Under Lead Securitization applicable to each ICON 18 mortgage loan is Midland Loan Services, a Division of PNC Bank, National Association and Situs Holdings, LLC, respectively. In addition, the Original Balance ($) and Cut-off Date Balance ($) represents the related ICON 18 mortgage loan notes in the aggregate. The Holder of Note set forth above reflects the current holder of each ICON mortgage loan Note A-1, Note A-2 and Note B, as applicable. Please see “Additional Debt Summary” below for more information. |
THE INFORMATION IN THIS STRUCTURAL AND COLLATERAL TERM SHEET IS NOT COMPLETE AND MAY BE AMENDED PRIOR TO THE TIME OF SALE. THIS TERM SHEET IS NOT AN OFFER TO SELL THESE SECURITIES AND IT IS NOT A SOLICITATION OF AN OFFER TO BUY THESE SECURITIES IN ANY JURISDICTION WHERE THE OFFER OR SALE IS NOT PERMITTED.
6 of 116
| Structural and Collateral Term Sheet | JPMCC 2019-COR5 | |
| Collateral Characteristics | ||
| Additional Debt Summary |
No. | Loan Name | Trust | Subordinate | Total Debt | Mortgage | Total | Mortgage | Total | Mortgage | Total |
| 2 | Hyde Park Multifamily Portfolio | $60,000,000 | $15,250,000 | $122,000,000 | 1.84x | 1.49x | 60.5% | 69.2% | 8.8% | 7.7% |
| 3 | The Avenue | $60,000,000 | $25,680,000 | $85,680,000 | 1.82x | 1.11x | 50.0% | 71.4% | 9.4% | 6.6% |
| 4 | 3 Columbus Circle | $50,000,000 | $105,000,000 | $595,000,000 | 2.91x | 2.40x | 45.4% | 55.1% | 12.3% | 10.2% |
| 5 | Hampton Roads Office Portfolio | $49,901,186 | $19,960,474 | $152,697,629 | 1.34x | 1.11x | 71.7% | 82.5% | 10.4% | 9.0% |
| 13 | ICON Upper East Side Portfolio | $25,000,000 | $57,200,000 | $115,700,000 | 2.63x | 1.33x | 29.1% | 57.5% | 12.2% | 6.2% |
| 28 | ICON 18 - 320-324 West 14th Street | $3,819,049 | $8,644,670 | $20,200,000 | 2.35x | 1.34x | 37.2% | 65.0% | 12.6% | 7.2% |
| 29 | ICON 18 - 446-450 West 19th Street | $3,170,508 | $9,706,968 | $19,300,000 | 2.32x | 1.15x | 30.6% | 61.7% | 12.4% | 6.2% |
| 30 | ICON 18 - 57-59 Second Avenue | $3,042,033 | $8,955,696 | $18,160,000 | 2.33x | 1.18x | 28.5% | 56.2% | 12.6% | 6.4% |
| 31 | ICON 18 - 43 West 27th Street | $2,972,307 | $8,506,667 | $17,500,000 | 2.34x | 1.20x | 28.2% | 54.9% | 12.6% | 6.5% |
| 32 | ICON 18 - 59-61 East 3rd Street | $2,266,072 | $6,408,526 | $13,265,000 | 2.28x | 1.18x | 27.4% | 53.1% | 12.3% | 6.4% |
| 34 | ICON 18 - 808 Lexington Avenue | $1,742,703 | $4,052,089 | $9,325,000 | 2.35x | 1.33x | 37.1% | 65.7% | 12.6% | 7.1% |
| 35 | ICON 18 - 1384 First Avenue | $1,623,750 | $4,687,006 | $9,600,000 | 2.49x | 1.28x | 29.1% | 56.8% | 13.5% | 6.9% |
| 36 | ICON 18 - 329 Union Street | $1,385,894 | $3,931,689 | $8,125,000 | 2.39x | 1.23x | 34.9% | 67.7% | 12.9% | 6.6% |
| 37 | ICON 18 - 350 East 13th Street | $1,349,016 | $4,003,272 | $8,085,000 | 2.36x | 1.19x | 32.7% | 64.7% | 12.6% | 6.4% |
| 38 | ICON 18 - 358 & 362 11th Street | $1,318,637 | $3,835,187 | $7,825,000 | 2.38x | 1.21x | 30.0% | 58.8% | 12.8% | 6.5% |
| 39 | ICON 18 - 610 East 9th Street | $1,249,447 | $3,719,537 | $7,500,000 | 2.35x | 1.18x | 28.6% | 56.8% | 12.7% | 6.4% |
| 40 | ICON 18 - 316 West 14th Street | $1,228,744 | $3,582,180 | $7,300,000 | 2.25x | 1.15x | 34.4% | 67.6% | 12.2% | 6.2% |
| 41 | ICON 18 - 402 East 12th Street | $1,207,464 | $3,571,565 | $7,225,000 | 2.34x | 1.18x | 30.7% | 60.7% | 12.7% | 6.4% |
| 42 | ICON 18 - 42 Sidney Place | $1,055,674 | $3,205,837 | $6,400,000 | 2.38x | 1.19x | 30.4% | 61.0% | 12.8% | 6.4% |
| 43 | ICON 18 - 522 East 5th Street | $815,544 | $2,432,401 | $4,900,000 | 2.37x | 1.19x | 27.1% | 53.8% | 12.9% | 6.5% |
| 44 | ICON 18 - 106 Bedford Avenue | $698,956 | $1,935,164 | $4,050,000 | 2.48x | 1.30x | 34.1% | 65.3% | 13.3% | 7.0% |
| 45 | ICON 18 - 295 DeGraw Street | $548,322 | $1,615,936 | $3,275,000 | 2.46x | 1.25x | 29.6% | 58.5% | 13.3% | 6.7% |
| 46 | ICON 18 - 413 South 5th Street | $505,879 | $1,134,356 | $2,665,000 | 2.33x | 1.34x | 35.6% | 62.0% | 12.5% | 7.2% |
| (1) | In the case of Loan Nos. 2, 3 and 5, Subordinate Debt Cut-off Date Balance represents one or more mezzanine loans. In the case of Loan Nos. 4, 13, 28, 29, 30, 31, 32, 34, 35, 36, 37, 38, 39, 40, 41, 42, 43, 44, 45 and 46, Subordinate Debt Cut-off Date Balance represents one or more Subordinate Companion Loans. |
| (2) | In the case of Loan Nos. 2, 4, 5, 13, 28, 29, 30, 31, 32, 34, 35, 36, 37, 38, 39, 40, 41, 42, 43, 44, 45 and 46, the UW NCF DSCR, UW NOI Debt Yield and Cut-off Date LTV calculations include the related Pari Passu Companion Loan(s). In the case of Loan Nos. 2, 3, 4, 5, 13, 28, 29, 30, 31, 32, 34, 35, 36, 37, 38, 39, 40, 41, 42, 43, 44, 45 and 46, the UW NCF DSCR, UW NOI Debt Yield and Cut-off Date LTV calculations exclude the related Subordinate Companion Loan(s) and/or related mezzanine loan(s). |
| (3) | With respect to Loan No. 5, the UW NCF DSCR is calculated using the sum of the first 12 whole loan principal and interest payments after the Cut-off Date based on the assumed principal and interest payment schedule set forth in Annex G of the Preliminary Prospectus. |
THE INFORMATION IN THIS STRUCTURAL AND COLLATERAL TERM SHEET IS NOT COMPLETE AND MAY BE AMENDED PRIOR TO THE TIME OF SALE. THIS TERM SHEET IS NOT AN OFFER TO SELL THESE SECURITIES AND IT IS NOT A SOLICITATION OF AN OFFER TO BUY THESE SECURITIES IN ANY JURISDICTION WHERE THE OFFER OR SALE IS NOT PERMITTED.
7 of 116
| Structural and Collateral Term Sheet | JPMCC 2019-COR5 | |
| Collateral Characteristics | ||
| Mortgaged Properties by Type(1) |
| Weighted Average | |||||||||
| Property Type | Property Subtype | Number of Properties | Cut-off Date Principal Balance | % of IPB | Occupancy | UW NCF DSCR(2)(3) | UW NOI Debt Yield(2) | Cut-off Date LTV(2)(4) | Maturity Date LTV(2)(4) |
| Office | CBD | 3 | $143,270,607 | 20.5% | 92.0% | 2.00x | 10.2% | 51.7% | 47.4% |
| Suburban | 26 | 124,901,186 | 17.9 | 93.5% | 1.45x | 9.5% | 69.5% | 61.4% | |
| Subtotal: | 29 | $268,171,793 | 38.4% | 92.7% | 1.75x | 9.9% | 60.0% | 53.9% | |
| Multifamily | Garden | 35 | $112,284,976 | 16.1% | 94.2% | 1.81x | 9.2% | 55.3% | 55.2% |
| Mid-Rise | 34 | 47,294,443 | 6.8 | 98.4% | 2.30x | 11.2% | 40.0% | 40.0% | |
| Student Housing | 6 | 39,078,891 | 5.6 | 91.2% | 1.72x | 9.7% | 66.2% | 61.7% | |
| Subtotal: | 75 | $198,658,310 | 28.4% | 94.6% | 1.91x | 9.8% | 53.8% | 52.8% | |
| Retail | Anchored | 5 | $112,650,000 | 16.1% | 93.0% | 1.54x | 9.8% | 67.6% | 61.5% |
| Freestanding | 1 | 7,600,000 | 1.1 | 100.0% | 1.72x | 9.2% | 62.3% | 62.3% | |
| Subtotal: | 6 | $120,250,000 | 17.2% | 93.5% | 1.56x | 9.8% | 67.2% | 61.5% | |
| Mixed Use | Retail/Office | 3 | $29,300,000 | 4.2% | 91.0% | 1.45x | 9.6% | 69.2% | 62.9% |
| Multifamily/Retail | 11 | 22,149,118 | 3.2 | 97.1% | 2.40x | 12.5% | 31.3% | 31.3% | |
| Multifamily/Office | 1 | 1,296,456 | 0.2 | 100.0% | 2.63x | 12.2% | 29.1% | 29.1% | |
| Subtotal: | 15 | $52,745,574 | 7.5% | 93.8% | 1.88x | 10.9% | 52.3% | 48.8% | |
| Hotel | Full Service | 4 | $35,000,000 | 5.0% | 80.2% | 2.04x | 11.9% | 59.6% | 59.6% |
| Subtotal: | 4 | $35,000,000 | 5.0% | 80.2% | 2.04x | 11.9% | 59.6% | 59.6% | |
| Manufactured Housing | Manufactured Housing | 3 | $18,029,940 | 2.6% | 98.1% | 1.56x | 10.2% | 55.3% | 45.6% |
| Subtotal: | 3 | $18,029,940 | 2.6% | 98.1% | 1.56x | 10.2% | 55.3% | 45.6% | |
| Other | Parking | 3 | $5,781,504 | 0.8% | 100.0% | 2.61x | 14.3% | 43.2% | 43.2% |
| Subtotal: | 3 | $5,781,504 | 0.8% | 100.0% | 2.61x | 14.3% | 43.2% | 43.2% | |
| Total / Weighted Average: | 135 | $698,637,121 | 100.0% | 93.0% | 1.79x | 10.0% | 58.6% | 54.5% | |
| (1) | Because this table presents information relating to the mortgaged properties and not mortgage loans, the information for mortgage loans secured by more than one mortgaged property is based on allocated loan amounts. |
| (2) | In the case of Loan Nos. 1, 2, 4, 5, 6, 9, 13, 14, 20, 28, 29, 30, 31, 32, 34, 35, 36, 37, 38, 39, 40, 41, 42, 43, 44, 45 and 46, the UW NCF DSCR, UW NOI Debt Yield, Cut-off Date LTV and Maturity Date LTV calculations include the related Pari Passu Companion Loan(s). In the case of Loan Nos. 2, 3, 4, 5, 13, 28, 29, 30, 31, 32, 34, 35, 36, 37, 38, 39, 40, 41, 42, 43, 44, 45 and 46, the UW NCF DSCR, UW NOI Debt Yield, Cut-off Date LTV and Maturity Date LTV calculations exclude the related Subordinate Companion Loan(s) and/or related mezzanine loan(s). |
| (3) | With respect to Loan No. 5, the UW NCF DSCR is calculated using the sum of the first 12 whole loan principal and interest payments after the Cut-off Date based on the assumed principal and interest payment schedule set forth in Annex G of the Preliminary Prospectus. |
| (4) | In the case of Loan Nos. 6, 11, 20 and 22, the Cut-off Date LTV and the Maturity Date LTV are calculated by using an appraised value based on certain hypothetical assumptions. Refer to “Description of the Mortgage Pool—Assessments of Property Value and Condition” and “—Appraised Value” in the Preliminary Prospectus for additional details. |
THE INFORMATION IN THIS STRUCTURAL AND COLLATERAL TERM SHEET IS NOT COMPLETE AND MAY BE AMENDED PRIOR TO THE TIME OF SALE. THIS TERM SHEET IS NOT AN OFFER TO SELL THESE SECURITIES AND IT IS NOT A SOLICITATION OF AN OFFER TO BUY THESE SECURITIES IN ANY JURISDICTION WHERE THE OFFER OR SALE IS NOT PERMITTED.
8 of 116
| Structural and Collateral Term Sheet | JPMCC 2019-COR5 | |
| Collateral Characteristics | ||
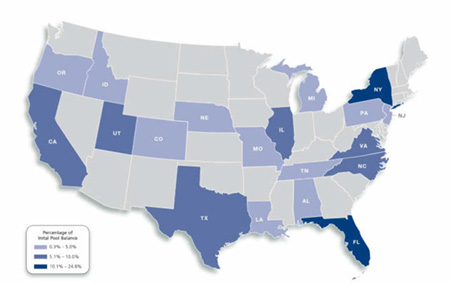
| Mortgaged Properties by Location(1) | ||||||||
Weighted Average | ||||||||
State | Number of Properties | Cut-off Date | % of | Occupancy | UW NCF DSCR(2)(3) | UW NOI Debt Yield(2) | Cut-off Date LTV(2)(4) | Maturity Date LTV(2)(4) |
| New York | 40 | $173,577,104 | 24.8% | 94.2% | 2.20x | 11.0% | 42.2% | 38.7% |
| Florida | 6 | 119,020,329 | 17.0 | 94.0% | 1.75x | 10.0% | 58.3% | 56.0% |
| Illinois | 43 | 66,500,000 | 9.5 | 94.5% | 1.79x | 8.9% | 60.8% | 60.3% |
| Utah | 2 | 57,750,000 | 8.3 | 89.7% | 1.50x | 9.1% | 65.5% | 59.2% |
| Virginia | 22 | 49,901,186 | 7.1 | 91.9% | 1.34x | 10.4% | 71.7% | 60.3% |
| California | 4 | 41,100,655 | 5.9 | 96.6% | 1.65x | 9.7% | 59.8% | 55.3% |
| Texas | 3 | 39,521,154 | 5.7 | 96.5% | 1.63x | 8.8% | 69.4% | 64.9% |
| North Carolina | 3 | 38,272,500 | 5.5 | 87.7% | 1.79x | 10.0% | 67.1% | 67.1% |
| Nebraska | 1 | 26,500,000 | 3.8 | 91.2% | 1.43x | 9.9% | 73.8% | 64.9% |
| Oregon | 2 | 21,404,285 | 3.1 | 93.6% | 1.49x | 9.5% | 65.3% | 58.3% |
| Louisiana | 1 | 18,602,500 | 2.7 | 78.7% | 2.04x | 11.9% | 59.6% | 59.6% |
| Idaho | 1 | 12,300,000 | 1.8 | 93.8% | 1.47x | 10.3% | 75.0% | 63.1% |
| New Jersey | 1 | 10,000,000 | 1.4 | 100.0% | 1.20x | 8.3% | 69.5% | 60.3% |
| Alabama | 1 | 7,890,031 | 1.1 | 86.0% | 1.90x | 9.9% | 62.5% | 62.5% |
| Colorado | 1 | 4,650,000 | 0.7 | 96.5% | 1.36x | 9.3% | 69.9% | 65.8% |
| Missouri | 1 | 3,700,000 | 0.5 | 100.0% | 2.65x | 14.6% | 42.3% | 42.3% |
| Michigan | 1 | 3,623,798 | 0.5 | 85.1% | 1.90x | 9.9% | 62.5% | 62.5% |
| Pennsylvania | 1 | 2,523,579 | 0.4 | 92.1% | 1.90x | 9.9% | 62.5% | 62.5% |
| Tennessee | 1 | 1,800,000 | 0.3 | 100.0% | 2.65x | 14.6% | 42.3% | 42.3% |
| Total / Weighted Average | 135 | $698,637,121 | 100.0% | 93.0% | 1.79x | 10.0% | 58.6% | 54.5% |
| (1) | Because this table represents information relating to the mortgaged properties and not mortgage loans, the information for the mortgage loans secured by more than one mortgaged property is based on allocated loan amounts. |
| (2) | In the case of Loan Nos. 1, 2, 4, 5, 6, 9, 13, 14, 20, 28, 29, 30, 31, 32, 34, 35, 36, 37, 38, 39, 40, 41, 42, 43, 44, 45 and 46, the UW NCF DSCR, UW NOI Debt Yield, Cut-off Date LTV and Maturity Date LTV calculations include the related Pari Passu Companion Loan(s). In the case of Loan Nos. 2, 3, 4, 5, 13, 28, 29, 30, 31, 32, 34, 35, 36, 37, 38, 39, 40, 41, 42, 43, 44, 45 and 46, the UW NCF DSCR, UW NOI Debt Yield, Cut-off Date LTV and Maturity Date LTV calculations exclude the related Subordinate Companion Loan(s) and/or related mezzanine loan(s). |
| (3) | With respect to Loan No. 5, the UW NCF DSCR is calculated using the sum of the first 12 whole loan principal and interest payments after the Cut-off Date based on the assumed principal and interest payment schedule set forth in Annex G of the Preliminary Prospectus. |
| (4) | In the case of Loan Nos. 6, 11, 20 and 22, the Cut-off Date LTV and the Maturity Date LTV are calculated by using an appraised value based on certain hypothetical assumptions. Refer to “Description of the Mortgage Pool—Assessments of Property Value and Condition” and “—Appraised Value” in the Preliminary Prospectus for additional details. |
THE INFORMATION IN THIS STRUCTURAL AND COLLATERAL TERM SHEET IS NOT COMPLETE AND MAY BE AMENDED PRIOR TO THE TIME OF SALE. THIS TERM SHEET IS NOT AN OFFER TO SELL THESE SECURITIES AND IT IS NOT A SOLICITATION OF AN OFFER TO BUY THESE SECURITIES IN ANY JURISDICTION WHERE THE OFFER OR SALE IS NOT PERMITTED.
9 of 116
| Structural and Collateral Term Sheet | JPMCC 2019-COR5 | |
| Collateral Characteristics | ||
| Cut-off Date Principal Balance |
Weighted Average | |||||||||||
| Range of Cut-off Date Principal Balances | Number of Loans | Cut-off Date Principal Balance | % of IPB | Mortgage Rate | Remaining Loan Term | UW NCF DSCR(1)(2) | UW NOI Debt Yield(1) | Cut-off Date LTV(1)(3) | Maturity Date LTV(1)(3) | ||
| $505,879 | - | $9,999,999 | 26 | $79,854,940 | 11.4% | 5.17572% | 86 | 1.92x | 11.3% | 49.3% | 45.7% |
| $10,000,000 | - | $19,999,999 | 6 | 80,510,388 | 11.5 | 4.74542% | 119 | 1.50x | 9.4% | 68.1% | 60.9% |
| $20,000,000 | - | $24,999,999 | 1 | 20,000,000 | 2.9 | 4.63000% | 118 | 1.71x | 8.2% | 68.8% | 68.8% |
| $25,000,000 | - | $49,999,999 | 9 | 283,351,186 | 40.6 | 4.96901% | 112 | 1.70x | 10.3% | 63.9% | 59.0% |
| $50,000,000 | - | $64,920,607 | 4 | 234,920,607 | 33.6 | 4.48444% | 117 | 1.95x | 9.7% | 51.3% | 48.7% |
| Total / Weighted Average: | 46 | $698,637,121 | 100.0% | 4.79423% | 112 | 1.79x | 10.0% | 58.6% | 54.5% | ||
| Mortgage Interest Rates |
Weighted Average | |||||||||||
| Range of Mortgage Interest Rates | Number of Loans | Cut-off Date Principal Balance | % of IPB | Mortgage Rate | Remaining Loan Term | UW NCF DSCR(1)(2) | UW NOI Debt Yield(1) | Cut-off Date LTV(1)(3) | Maturity Date LTV(1)(3) | ||
| 3.91400% | - | 4.41400% | 3 | $127,420,607 | 18.2% | 4.19733% | 118 | 2.04x | 10.4% | 48.7% | 43.4% |
| 4.41401% | - | 4.91400% | 9 | 239,625,000 | 34.3 | 4.69070% | 111 | 1.76x | 9.6% | 61.5% | 58.6% |
| 4.91401% | - | 5.38200% | 34 | 331,591,514 | 47.5 | 5.09841% | 110 | 1.71x | 10.2% | 60.4% | 55.9% |
| Total / Weighted Average: | 46 | $698,637,121 | 100.0% | 4.79423% | 112 | 1.79x | 10.0% | 58.6% | 54.5% | ||
| Original Term to Maturity in Months |
Weighted Average | |||||||||
| Original Term to Maturity in Months | Number of Loans | Cut-off Date Principal Balance | % of IPB | Mortgage Rate | Remaining Loan Term | UW NCF DSCR(1)(2) | UW NOI Debt Yield(1) | Cut-off Date LTV(1)(3) | Maturity Date LTV(1)(3) |
| 60 | 21 | $65,150,000 | 9.3% | 4.97182% | 57 | 2.41x | 12.4% | 34.2% | 33.9% |
| 120 | 24 | 607,737,121 | 87.0 | 4.76380% | 117 | 1.74x | 9.8% | 60.5% | 56.5% |
| 123 | 1 | 25,750,000 | 3.7 | 5.06300% | 118 | 1.20x | 8.9% | 74.6% | 60.4% |
| Total / Weighted Average: | 46 | $698,637,121 | 100.0% | 4.79423% | 112 | 1.79x | 10.0% | 58.6% | 54.5% |
| Remaining Term to Maturity in Months |
| Weighted Average | |||||||||||
| Range of Remaining Term to Maturity in Months | Number of Loans | Cut-off Date Principal Balance | % of IPB | Mortgage Rate | Remaining Loan Term | UW NCF DSCR(1)(2) | UW NOI Debt Yield(1) | Cut-off Date LTV(1)(3) | Maturity Date LTV(1)(3) | ||
| 55 | - | 84 | 21 | $65,150,000 | 9.3% | 4.97182% | 57 | 2.41x | 12.4% | 34.2% | 33.9% |
| 85 | - | 119 | 23 | 604,237,121 | 86.5 | 4.78452% | 117 | 1.72x | 9.8% | 61.1% | 56.5% |
| 120 | - | 120 | 2 | 29,250,000 | 4.2 | 4.59915% | 120 | 1.70x | 9.6% | 61.6% | 59.2% |
| Total / Weighted Average: | 46 | $698,637,121 | 100.0% | 4.79423% | 112 | 1.79x | 10.0% | 58.6% | 54.5% | ||
| (1) | In the case of Loan Nos. 1, 2, 4, 5, 6, 9, 13, 14, 20, 28, 29, 30, 31, 32, 34, 35, 36, 37, 38, 39, 40, 41, 42, 43, 44, 45 and 46, the UW NCF DSCR, UW NOI Debt Yield, Cut-off Date LTV and Maturity Date LTV calculations include the related Pari Passu Companion Loan(s). In the case of Loan Nos. 2, 3, 4, 5, 13, 28, 29, 30, 31, 32, 34, 35, 36, 37, 38, 39, 40, 41, 42, 43, 44, 45 and 46, the UW NCF DSCR, UW NOI Debt Yield, Cut-off Date LTV and Maturity Date LTV calculations exclude the related Subordinate Companion Loan(s) and/or related mezzanine loan(s). |
| (2) | With respect to Loan No. 5, the UW NCF DSCR is calculated using the sum of the first 12 whole loan principal and interest payments after the Cut-off Date based on the assumed principal and interest payment schedule set forth in Annex G of the Preliminary Prospectus. |
| (3) | In the case of Loan Nos. 6, 11, 20 and 22, the Cut-off Date LTV and the Maturity Date LTV are calculated by using an appraised value based on certain hypothetical assumptions. Refer to “Description of the Mortgage Pool—Assessments of Property Value and Condition” and “—Appraised Value” in the Preliminary Prospectus for additional details. |
THE INFORMATION IN THIS STRUCTURAL AND COLLATERAL TERM SHEET IS NOT COMPLETE AND MAY BE AMENDED PRIOR TO THE TIME OF SALE. THIS TERM SHEET IS NOT AN OFFER TO SELL THESE SECURITIES AND IT IS NOT A SOLICITATION OF AN OFFER TO BUY THESE SECURITIES IN ANY JURISDICTION WHERE THE OFFER OR SALE IS NOT PERMITTED.
10 of 116
| Structural and Collateral Term Sheet | JPMCC 2019-COR5 | |
| Collateral Characteristics | ||
| Original Amortization Term in Months |
| Weighted Average | |||||||||
| Original Amortization Term in Months | Number of Loans | Cut-off Date Principal Balance | % of IPB | Mortgage Rate | Remaining Loan Term | UW NCF DSCR(1)(2) | UW NOI Debt Yield(1) | Cut-off Date LTV(1)(3) | Maturity Date LTV(1)(3) |
| Interest Only | 30 | $399,200,000 | 57.1% | 4.76201% | 108 | 2.06x | 10.3% | 53.6% | 53.6% |
| 300 | 1 | 25,750,000 | 3.7 | 5.06300% | 118 | 1.20x | 8.9% | 74.6% | 60.4% |
| 360 | 15 | 273,687,121 | 39.2 | 4.81593% | 117 | 1.45x | 9.8% | 64.4% | 55.3% |
| Total / Weighted Average: | 46 | $698,637,121 | 100.0% | 4.79423% | 112 | 1.79x | 10.0% | 58.6% | 54.5% |
| Remaining Amortization Term in Months |
| Weighted Average | |||||||||||
| Range of Remaining Amortization Term in Months | Number of Loans | Cut-off Date Principal Balance | % of IPB | Mortgage Rate | Remaining Loan Term | UW NCF DSCR(1)(2) | UW NOI Debt Yield(1) | Cut-off Date LTV(1)(3) | Maturity Date LTV(1)(3) | ||
| Interest Only | 30 | $399,200,000 | 57.1% | 4.76201% | 108 | 2.06x | 10.3% | 53.6% | 53.6% | ||
| 300 | - | 359 | 7 | 172,337,121 | 24.7 | 4.86958% | 118 | 1.38x | 9.5% | 61.8% | 50.8% |
| 360 | - | 360 | 9 | 127,100,000 | 18.2 | 4.79323% | 116 | 1.49x | 10.0% | 69.9% | 62.4% |
| Total / Weighted Average: | 46 | $698,637,121 | 100.0% | 4.79423% | 112 | 1.79x | 10.0% | 58.6% | 54.5% | ||
| Amortization Types |
Weighted Average | |||||||||
| Amortization Types | Number of Loans | Cut-off Date Principal Balance | % of IPB | Mortgage Rate | Remaining Loan Term | UW NCF DSCR(1)(2) | UW NOI Debt Yield(1) | Cut-off Date LTV(1)(3) | Maturity Date LTV(1)(3) |
| Interest Only | 30 | $399,200,000 | 57.1% | 4.76201% | 108 | 2.06x | 10.3% | 53.6% | 53.6% |
| IO-Balloon | 10 | 152,850,000 | 21.9 | 4.83868% | 116 | 1.44x | 9.8% | 70.7% | 62.0% |
| Balloon | 6 | 146,587,121 | 21.0 | 4.83561% | 118 | 1.41x | 9.6% | 59.6% | 49.1% |
| Total / Weighted Average: | 46 | $698,637,121 | 100.0% | 4.79423% | 112 | 1.79x | 10.0% | 58.6% | 54.5% |
| Underwritten Net Cash Flow Debt Service Coverage Ratios(1)(2) |
| Weighted Average | |||||||||||
| Range of Underwritten Net Cash Flow Debt Service Coverage Ratios | Number of Loans | Cut-off Date Principal Balance | % of IPB | Mortgage Rate | Remaining Loan Term | UW NCF DSCR(1)(2) | UW NOI Debt Yield(1) | Cut-off Date LTV(1)(3) | Maturity Date LTV(1)(3) | ||
| 1.20x | - | 1.49x | 10 | $229,482,181 | 32.8% | 4.83064% | 117 | 1.37x | 9.4% | 65.5% | 55.3% |
| 1.50x | - | 1.75x | 10 | 162,154,940 | 23.2 | 4.90676% | 117 | 1.66x | 9.5% | 64.4% | 61.6% |
| 1.76x | 2.00x | 4 | 161,500,000 | 23.1 | 4.80657% | 116 | 1.84x | 9.4% | 57.1% | 56.7% | |
| 2.01x | 2.25x | 2 | 36,228,744 | 5.2 | 4.96824% | 117 | 2.05x | 11.9% | 58.7% | 58.7% | |
| 2.26x | - | 2.50x | 17 | 28,771,256 | 4.1 | 5.25420% | 55 | 2.36x | 12.7% | 31.3% | 31.3% |
| 2.51x | - | 2.75x | 2 | 30,500,000 | 4.4 | 4.65905% | 59 | 2.63x | 12.6% | 31.5% | 31.5% |
| 2.76x | - | 2.91x | 1 | 50,000,000 | 7.2 | 3.91400% | 117 | 2.91x | 12.3% | 45.4% | 45.4% |
| Total / Weighted Average: | 46 | $698,637,121 | 100.0% | 4.79423% | 112 | 1.79x | 10.0% | 58.6% | 54.5% | ||
| (1) | In the case of Loan Nos. 1, 2, 4, 5, 6, 9, 13, 14, 20, 28, 29, 30, 31, 32, 34, 35, 36, 37, 38, 39, 40, 41, 42, 43, 44, 45 and 46, the UW NCF DSCR, UW NOI Debt Yield, Cut-off Date LTV and Maturity Date LTV calculations include the related Pari Passu Companion Loan(s). In the case of Loan Nos. 2, 3, 4, 5, 13, 28, 29, 30, 31, 32, 34, 35, 36, 37, 38, 39, 40, 41, 42, 43, 44, 45 and 46, the UW NCF DSCR, UW NOI Debt Yield, Cut-off Date LTV and Maturity Date LTV calculations exclude the related Subordinate Companion Loan(s) and/or related mezzanine loan(s). |
| (2) | With respect to Loan No. 5, the UW NCF DSCR is calculated using the sum of the first 12 whole loan principal and interest payments after the Cut-off Date based on the assumed principal and interest payment schedule set forth in Annex G of the Preliminary Prospectus. |
| (3) | In the case of Loan Nos. 6, 11, 20 and 22, the Cut-off Date LTV and the Maturity Date LTV are calculated by using an appraised value based on certain hypothetical assumptions. Refer to “Description of the Mortgage Pool—Assessments of Property Value and Condition” and “—Appraised Value” in the Preliminary Prospectus for additional details. |
THE INFORMATION IN THIS STRUCTURAL AND COLLATERAL TERM SHEET IS NOT COMPLETE AND MAY BE AMENDED PRIOR TO THE TIME OF SALE. THIS TERM SHEET IS NOT AN OFFER TO SELL THESE SECURITIES AND IT IS NOT A SOLICITATION OF AN OFFER TO BUY THESE SECURITIES IN ANY JURISDICTION WHERE THE OFFER OR SALE IS NOT PERMITTED.
11 of 116
| Structural and Collateral Term Sheet | JPMCC 2019-COR5 | |
| Collateral Characteristics | ||
| LTV Ratios as of the Cut-off Date(1)(3) |
| Weighted Average | |||||||||||
| Range of Cut-off Date LTVs | Number of Loans | Cut-off Date Principal Balance | % of IPB | Mortgage Rate | Remaining Loan Term | UW NCF DSCR(1)(2) | UW NOI Debt Yield(1) | Cut-off Date LTV(1)(3) | Maturity Date LTV(1)(3) | ||
| 27.1% | - | 37.1% | 18 | $51,180,951 | 7.3% | 4.88551% | 57 | 2.49x | 12.4% | 29.9% | 29.9% |
| 37.2% | - | 47.1% | 3 | 59,319,049 | 8.5 | 4.13677% | 107 | 2.85x | 12.5% | 44.6% | 44.6% |
| 47.2% | - | 69.9% | 19 | 452,375,547 | 64.8 | 4.79017% | 117 | 1.70x | 9.5% | 59.3% | 56.5% |
| 70.0% | - | 75.0% | 6 | 135,761,574 | 19.4 | 5.06061% | 118 | 1.36x | 9.9% | 73.2% | 61.7% |
| Total / Weighted Average: | 46 | $698,637,121 | 100.0% | 4.79423% | 112 | 1.79x | 10.0% | 58.6% | 54.5% | ||
| LTV Ratios as of the Maturity Date(1)(3) |
Weighted Average | |||||||||||
| Range of Maturity Date LTVs | Number of Loans | Cut-off Date Principal Balance | % of IPB | Mortgage Rate | Remaining Loan Term | UW NCF DSCR(1)(2) | UW NOI Debt Yield(1) | Cut-off Date LTV(1)(3) | Maturity Date LTV(1)(3) | ||
| 27.1% | - | 49.9% | 25 | $193,450,547 | 27.7% | 4.50306% | 99 | 2.16x | 11.1% | 43.0% | 39.0% |
| 50.0% | - | 54.9% | 1 | 60,000,000 | 8.6 | 4.99243% | 115 | 1.82x | 9.4% | 50.0% | 50.0% |
| 55.0% | - | 59.9% | 4 | 86,000,000 | 12.3 | 4.84756% | 118 | 1.84x | 10.6% | 59.8% | 58.6% |
| 60.0% | - | 69.7% | 16 | 359,186,574 | 51.4 | 4.90517% | 117 | 1.57x | 9.5% | 68.2% | 62.7% |
| Total / Weighted Average: | 46 | $698,637,121 | 100.0% | 4.79423% | 112 | 1.79x | 10.0% | 58.6% | 54.5% | ||
| Prepayment Protection |
Weighted Average | |||||||||
| Prepayment Protection | Number of Loans | Cut-off Date Principal Balance | % of IPB | Mortgage Rate | Remaining Loan Term | UW NCF DSCR(1)(2) | UW NOI Debt Yield(1) | Cut-off Date LTV(1)(3) | Maturity Date LTV(1)(3) |
| Defeasance | 20 | $502,275,547 | 71.9% | 4.69473% | 117 | 1.80x | 9.8% | 58.4% | 55.0% |
| Yield Maintenance | 25 | 169,861,574 | 24.3 | 5.10314% | 96 | 1.81x | 10.7% | 56.8% | 51.4% |
| Defeasance or Yield Maintenance | 1 | 26,500,000 | 3.8 | 4.70000% | 119 | 1.43x | 9.9% | 73.8% | 64.9% |
| Total / Weighted Average: | 46 | $698,637,121 | 100.0% | 4.79423% | 112 | 1.79x | 10.0% | 58.6% | 54.5% |
| Loan Purpose |
Weighted Average | |||||||||
| Loan Purpose | Number of Loans | Cut-off Date Principal Balance | % of IPB | Mortgage Rate | Remaining Loan Term | UW NCF DSCR(1)(2) | UW NOI Debt Yield(1) | Cut-off Date LTV(1)(3) | Maturity Date LTV(1)(3) |
| Refinance | 35 | $424,335,935 | 60.7% | 4.68097% | 109 | 1.88x | 10.2% | 54.8% | 50.7% |
| Acquisition | 11 | 274,301,186 | 39.3 | 4.96944% | 117 | 1.64x | 9.8% | 64.6% | 60.4% |
| Total / Weighted Average: | 46 | $698,637,121 | 100.0% | 4.79423% | 112 | 1.79x | 10.0% | 58.6% | 54.5% |
| (1) | In the case of Loan Nos. 1, 2, 4, 5, 6, 9, 13, 14, 20, 28, 29, 30, 31, 32, 34, 35, 36, 37, 38, 39, 40, 41, 42, 43, 44, 45 and 46, the UW NCF DSCR, UW NOI Debt Yield, Cut-off Date LTV and Maturity Date LTV calculations include the related Pari Passu Companion Loan(s). In the case of Loan Nos. 2, 3, 4, 5, 13, 28, 29, 30, 31, 32, 34, 35, 36, 37, 38, 39, 40, 41, 42, 43, 44, 45 and 46, the UW NCF DSCR, UW NOI Debt Yield, Cut-off Date LTV and Maturity Date LTV calculations exclude the related Subordinate Companion Loan(s) and/or related mezzanine loan(s). |
| (2) | With respect to Loan No. 5, the UW NCF DSCR is calculated using the sum of the first 12 whole loan principal and interest payments after the Cut-off Date based on the assumed principal and interest payment schedule set forth in Annex G of the Preliminary Prospectus. |
| (3) | In the case of Loan Nos. 6, 11, 20 and 22, the Cut-off Date LTV and the Maturity Date LTV are calculated by using an appraised value based on certain hypothetical assumptions. Refer to “Description of the Mortgage Pool—Assessments of Property Value and Condition” and “—Appraised Value” in the Preliminary Prospectus for additional details. |
THE INFORMATION IN THIS STRUCTURAL AND COLLATERAL TERM SHEET IS NOT COMPLETE AND MAY BE AMENDED PRIOR TO THE TIME OF SALE. THIS TERM SHEET IS NOT AN OFFER TO SELL THESE SECURITIES AND IT IS NOT A SOLICITATION OF AN OFFER TO BUY THESE SECURITIES IN ANY JURISDICTION WHERE THE OFFER OR SALE IS NOT PERMITTED.
12 of 116
| Structural and Collateral Term Sheet | JPMCC 2019-COR5 | |
| Collateral Characteristics | ||
| Previous Securitization History(1) |
| No. | Loan Name | Cut-off Date Principal Balance | % of IPB | Location | Property Type | Previous Securitization |
| 4 | 3 Columbus Circle | $50,000,000 | 7.2% | New York, NY | Office | CGCMT 2015-GC29 |
| 9.03 | University View | $5,520,329 | 0.8% | Boca Raton, FL | Multifamily | UBSC 2011-C1 |
| 9.04 | Colonie | $3,656,497 | 0.5% | Amherst, NY | Multifamily | JPMBB 2015-C30 |
| 9.05 | Hillcrest Oakwood | $3,623,798 | 0.5% | Big Rapids, MI | Multifamily | JPMBB 2015-C30 |
| 9.06 | Southgate | $2,523,579 | 0.4% | State College, PA | Multifamily | JPMBB 2015-C30 |
| 26.01 | St. Louis Shoe Surface Lot | $3,700,000 | 0.5% | St. Louis, MO | Other | COMM 2014-UBS2 |
| 26.02 | Memphis Poplar Surface Lot | $1,800,000 | 0.3% | Memphis, TN | Other | COMM 2014-UBS2 |
| (1) | The table above represents the properties for which the previously existing debt was securitized, based on information provided by the related borrower or obtained through searches of a third-party database. |
THE INFORMATION IN THIS STRUCTURAL AND COLLATERAL TERM SHEET IS NOT COMPLETE AND MAY BE AMENDED PRIOR TO THE TIME OF SALE. THIS TERM SHEET IS NOT AN OFFER TO SELL THESE SECURITIES AND IT IS NOT A SOLICITATION OF AN OFFER TO BUY THESE SECURITIES IN ANY JURISDICTION WHERE THE OFFER OR SALE IS NOT PERMITTED.
13 of 116
| Structural and Collateral Term Sheet | JPMCC 2019-COR5 | |
| Brooklyn Renaissance | ||

THE INFORMATION IN THIS STRUCTURAL AND COLLATERAL TERM SHEET IS NOT COMPLETE AND MAY BE AMENDED PRIOR TO THE TIME OF SALE. THIS TERM SHEET IS NOT AN OFFER TO SELL THESE SECURITIES AND IT IS NOT A SOLICITATION OF AN OFFER TO BUY THESE SECURITIES IN ANY JURISDICTION WHERE THE OFFER OR SALE IS NOT PERMITTED.
14 of 116
| Structural and Collateral Term Sheet | JPMCC 2019-COR5 | |
| Brooklyn Renaissance | ||

THE INFORMATION IN THIS STRUCTURAL AND COLLATERAL TERM SHEET IS NOT COMPLETE AND MAY BE AMENDED PRIOR TO THE TIME OF SALE. THIS TERM SHEET IS NOT AN OFFER TO SELL THESE SECURITIES AND IT IS NOT A SOLICITATION OF AN OFFER TO BUY THESE SECURITIES IN ANY JURISDICTION WHERE THE OFFER OR SALE IS NOT PERMITTED.
15 of 116
| Structural and Collateral Term Sheet | JPMCC 2019-COR5 | |
| Brooklyn Renaissance | ||

THE INFORMATION IN THIS STRUCTURAL AND COLLATERAL TERM SHEET IS NOT COMPLETE AND MAY BE AMENDED PRIOR TO THE TIME OF SALE. THIS TERM SHEET IS NOT AN OFFER TO SELL THESE SECURITIES AND IT IS NOT A SOLICITATION OF AN OFFER TO BUY THESE SECURITIES IN ANY JURISDICTION WHERE THE OFFER OR SALE IS NOT PERMITTED.
16 of 116
| Structural and Collateral Term Sheet | JPMCC 2019-COR5 | |
| Brooklyn Renaissance Plaza | ||
| Mortgage Loan Information | Property Information | |||
| Mortgage Loan Seller: | LCM | Single Asset / Portfolio: | Single Asset | |
| Original Principal Balance(1): | $65,000,000 | Title: | Leasehold | |
| Cut-off Date Principal Balance(1): | $64,920,607 | Property Type - Subtype: | Office – CBD | |
| % of Pool by IPB: | 9.3% | Net Rentable Area (SF): | 289,180 | |
| Loan Purpose: | Refinance | Location: | Brooklyn, NY | |
| Borrower: | Brooklyn Renaissance Plaza II LLC | Year Built / Renovated: | 1998 / 2019 | |
| Sponsor: | Joshua L. Muss | Occupancy(3): | 88.5% | |
| Interest Rate: | 4.39000% | Occupancy Date(3): | 1/28/2019 | |
| Note Date: | 4/11/2019 | Number of Tenants(3): | 10 | |
| Maturity Date: | 5/6/2029 | 2016 NOI: | $6,770,519 | |
| Interest-only Period: | None | 2017 NOI: | $6,528,395 | |
| Original Term: | 120 months | 2018 NOI: | $7,356,524 | |
| Original Amortization: | 360 months | TTM NOI: | N/A | |
| Amortization Type: | Balloon | UW Economic Occupancy: | 88.4% | |
| Call Protection(2): | L(25),Def(91),O(4) | UW Revenues: | $14,691,541 | |
| Lockbox / Cash Management: | Hard / In Place | UW Expenses: | $6,697,245 | |
| Additional Debt: | Yes | UW NOI: | $7,994,296 | |
| Additional Debt Balance(1): | $24,969,464 | UW NCF: | $7,745,455 | |
| Additional Debt Type(1): | Pari Passu | Appraised Value / Per SF: | $185,000,000 / $640 | |
| Appraisal Date: | 12/11/2018 | |||
| Escrows and Reserves(4) | Financial Information(1) | |||||||
| Initial | Monthly | Initial Cap | Cut-off Date Loan / SF: | $311 | ||||
| Taxes: | $850,000 | $150,000 | N/A | Maturity Date Loan / SF: | $251 | |||
| Insurance: | $95,000 | $12,000 | N/A | Cut-off Date LTV: | 48.6% | |||
| Replacement Reserves: | $0 | $6,017 | $216,612 | Maturity Date LTV: | 39.2% | |||
| TI/LC: | $3,360,261 | $36,102 | $1,299,672 | UW NCF DSCR: | 1.43x | |||
| Other: | $39,128 | 1/12 of | N/A | UW NOI Debt Yield: | 8.9% | |||
| Ground Rent | ||||||||
| ||||||||
| Sources and Uses | ||||||||
| Sources | Proceeds | % of Total | Uses | Proceeds | % of Total | |||
| Whole Loan(1) | $90,000,000 | 100.0% | Return of Equity(5) | $73,068,982 | 81.2% | |||
| Closing Costs | 12,586,629 | 14.0 | ||||||
| Upfront Reserves | 4,344,389 | 4.8 | ||||||
| Total Sources | $90,000,000 | 100.0% | Total Uses | $90,000,000 | 100.0% | |||
| (1) | The Brooklyn Renaissance Plaza Loan (as defined below) is part of a whole loan evidence by twopari passu notes, with an aggregate outstanding principal balance as of the Cut-off Date of approximately $89.9 million. The Financial Information presented in the chart above reflects the Cut-off Date balance of the approximately $89.9 million Brooklyn Renaissance Plaza Whole Loan (as defined below). |
| (2) | The lockout period will be at least 25 payment dates beginning with and including the first payment date of June 6, 2019. Defeasance of the full Brooklyn Renaissance Plaza Whole Loan is permitted after the date that is the earlier to occur of the payment date that is (i) two years after the closing date of the securitization that includes the lastpari passu note to be securitized and (ii) November 2022. The assumed lockout period of 25 payments is based on the expected JPMCC 2019-COR5 securitization closing date in June 2019. The actual lockout period may be longer. |
| (3) | Occupancy excludes Amerigroup Community Care, which currently occupies 33,285 square feet (11.5% of net rentable area) but recently gave notice that it would be vacating its space at lease expiration on June 30, 2019. |
| (4) | For a full description of Escrows and Reserves, please refer to“Escrows and Reserves”below. |
| (5) | The Brooklyn Renaissance Plaza Property (as defined below) was previously unencumbered by debt. |
THE INFORMATION IN THIS STRUCTURAL AND COLLATERAL TERM SHEET IS NOT COMPLETE AND MAY BE AMENDED PRIOR TO THE TIME OF SALE. THIS TERM SHEET IS NOT AN OFFER TO SELL THESE SECURITIES AND IT IS NOT A SOLICITATION OF AN OFFER TO BUY THESE SECURITIES IN ANY JURISDICTION WHERE THE OFFER OR SALE IS NOT PERMITTED.
17 of 116
| Structural and Collateral Term Sheet | JPMCC 2019-COR5 | |
| Brooklyn Renaissance Plaza | ||
The Loan.The Brooklyn Renaissance Plaza loan, with an original principal balance of $65.0 million (the “Brooklyn Renaissance Plaza Loan”), is secured by a first mortgage lien on the borrower’s leasehold interest in a Class A office condominium unit comprised of 289,180 square feet of net rentable area located on floors 24 through 32 of the north tower (the “Brooklyn Renaissance Plaza Property”), which is within the Brooklyn Renaissance Plaza mixed use development (the “Brooklyn Renaissance Plaza Development”) located in downtown Brooklyn, New York. The Brooklyn Renaissance Plaza Loan is part of a whole loan that has an aggregate original principal balance as of the Cut-off Date of approximately $89.9 million (the “Brooklyn Renaissance Plaza Whole Loan”) and is comprised of twopari passu notes, each as described in the “Whole Loan Summary” chart below. The controlling Note A-1, with an outstanding principal balance as of the Cut-off Date of approximately $64.9 million, is being contributed to the JPMCC 2019-COR5 Trust. The non-controlling Note A-2, with an original principal balance of $25.0 million is held by LCM or an affiliate and expected to be contributed to one or more future securitizations or may otherwise be transferred at any time. The relationship between the holders of the Brooklyn Renaissance Plaza Whole Loan will be governed by a co-lender agreement as described under “Description of the Mortgage Pool—The Whole Loans—The Serviced Pari Passu Whole Loans” in the Preliminary Prospectus. The Brooklyn Renaissance Plaza Whole Loan has a 10-year term and amortizes on a 30-year schedule.The most recent prior financing of theBrooklyn RenaissancePlaza Property was not included in a securitization.
| Whole Loan Summary | ||||
| Notes | Original Balance | Cut-off Date Balance | Note Holder | Controlling Piece |
| A-1 | $65,000,000 | $64,920,607 | JPMCC 2019-COR5 | Yes |
| A-2 | 25,000,000 | 24,969,464 | LCM | No |
| Total | $90,000,000 | $89,890,072 | ||
The Borrower.The borrowing entity is Brooklyn Renaissance Plaza II LLC, a Delaware limited liability company structured to be bankruptcy remote with two independent directors. Legal counsel to the borrower delivered a non-consolidation opinion in connection with the origination of the Brooklyn Renaissance Plaza Whole Loan.
The Loan Sponsor.The loan sponsor and nonrecourse carve-out guarantor is Joshua L. Muss, a principal of Muss Development LLC (“Muss Development”). Founded in 1906 by Isaac Muss, Muss Development is a family-owned and operated, full-service real estate development and investment company that is currently led by Joshua Muss and his son, Jason Muss. Since its founding, Muss Development has developed more than 15.0 million square feet of commercial, residential, industrial and retail space throughout the five boroughs.
The Property.The Brooklyn Renaissance Plaza Property is a Class A office condominium unit comprised of 289,180 square feet of net rentable area located on floors 24 through 32 of the north tower that is within the Brooklyn Renaissance Plaza Development. Built in 1998 by the loan sponsor, the Brooklyn Renaissance Plaza Development is a mixed-use development comprised of five individual condominium units across two towers containing a total of approximately 1.5 million square feet. The north tower within the Brooklyn Renaissance Plaza Development (the “North Tower”) is a 32-story, mixed-use tower with office and retail space, and the south tower within the Brooklyn Renaissance Plaza Development is comprised of a 386-room Marriott hotel and a parking garage located on three lower levels and the ground floor. The Brooklyn Renaissance Plaza Development is comprised of five individual condominium units, all of which are owned by affiliates of the loan sponsor.
The Brooklyn Renaissance Plaza Property has unobstructed views of Staten Island, the East River, Manhattan and other parts of New York City. The loan sponsor recently completed an approximately $1.0 million comprehensive renovation of the lobby in the North Tower which features new ceilings, lighting, heightened security with the installation of turnstiles and a newly remodeled interior retail component.
The Brooklyn Renaissance Plaza Property is currently 88.5% occupied by 10 tenants and has reported an average historical occupancy of 100.0% since opening in 1998. Amerigroup Community Care which currently occupies 33,285 square feet (11.5% of net rentable area) recently gave notice that it would be vacating its space at lease expiration on June 30, 2019. Amerigroup Community Care was not included in the underwriting of the Brooklyn Renaissance Plaza Whole Loan. At origination, the borrower deposited $3.0 million for future leasing costs associated with the re-tenanting of this space at the Brooklyn Renaissance Plaza Property. Approximately 60.5% of net rentable area and 74.8% of underwritten base rent is attributable to investment grade tenants which include the USA GSA – Secret Service (“GSA”) (30.8% of net rentable area; rated Aaa/AAA/AA+ by Moody’s/Fitch/S&P), the NYC Department of Education (22.2% of net rentable area; rated Aa1/AA/AA by Moody’s/Fitch/S&P) and the NYC Department of Citywide Administration (7.5% of net rentable area; rated Aa1/AA/AA by Moody’s/Fitch/S&P).
The largest tenant at the Brooklyn Renaissance Plaza Property, the USA GSA – Secret Service (89,030 square feet; 30.8% of net rentable area; 41.7% of underwritten base rent; rated Aaa/AAA/AA+ by Moody’s/Fitch/S&P), is one of the oldest federal law enforcement agencies in the country and ranks among the most elite in the world. The Secret Service protects both national leaders and visiting foreign dignitaries while helping to secure the nation’s financial infrastructure through financial and cybercrime investigations.
THE INFORMATION IN THIS STRUCTURAL AND COLLATERAL TERM SHEET IS NOT COMPLETE AND MAY BE AMENDED PRIOR TO THE TIME OF SALE. THIS TERM SHEET IS NOT AN OFFER TO SELL THESE SECURITIES AND IT IS NOT A SOLICITATION OF AN OFFER TO BUY THESE SECURITIES IN ANY JURISDICTION WHERE THE OFFER OR SALE IS NOT PERMITTED.
18 of 116
| Structural and Collateral Term Sheet | JPMCC 2019-COR5 | |
| Brooklyn Renaissance Plaza | ||
The GSA has been a tenant at the Brooklyn Renaissance Plaza Property since October 2001, originally pursuant to a lease with Empire Insurance Company, the original tenant of the Brooklyn Renaissance Plaza Property (which lease was assigned to BRP Leasing, LLC (“BRP Leasing”), an affiliate of the borrower). At the expiration of the initial lease term in 2018, the GSA extended its lease for an additional five years through October 2023. According to the loan sponsor, the GSA is in the process of approving the attornment to the borrower of BRP Leasing’s rights under the lease which will permit the GSA to enter into a direct lease with the borrower. The GSA utilizes its space as a New York field office and currently pays base rent equal to $59.78 per square foot gross. The tenant has no termination options and no renewal options remaining.
The second largest tenant at the Brooklyn Renaissance Plaza Property, the NYC Department of Education (64,340 square feet; 22.2% of net rentable area; 25.7% of underwritten base rent;rated Aa1/AA/AA by Moody’s/Fitch/S&P), is the branch of municipal government in New York City that manages New York City's public school system. New York City’s public school system is the largest school system in the United States, with over 1.1 million students taught in more than 1,400 separate schools. The NYC Department of Education covers all five boroughs of New York City. Approximately 135,000 people work full-time in New York City’s public-school system.
The NYC Department of Education originally took occupancy at the Brooklyn Renaissance Plaza Property in 2017. The NYC Department of Education leases the entire 28th and 29th floors and currently pays base rent equal to $48.00 per square foot modified gross on a direct lease which commenced in November 2018 and extends for 15 years through October 2033. The NYC Department of Education has no termination options and no renewal options remaining.
The third largest tenant at the Brooklyn Renaissance Plaza Property is the United Federation of Teachers (“UFT”) (44,945 square feet; 15.5% of net rentable area; 13.6% of underwritten base rent). With over 200,000 members predominantly made up of education and healthcare professionals, the UFT is a federation of teachers, nurses and other similar professionals working in New York City’s five boroughs that negotiates and advocates on their behalf for fair and competitive salaries, enhanced professionalism and improved working condition. UFT supports policies, legislation and programs that promote attaining educational equity, closing the achievement gap and assuring parent and community voice in school governance. The UFT works to raise academic standards and strengthen instruction; reduce class size and overcrowding; create safer, more orderly schools; improve school facilities; and increase parent involvement in schools. The UFT offers a full spectrum of workshops and graduate-level courses to approximately 30,000 members annually. The UFT partners with institutions such as Mt. Saint Vincent, Baruch, NYIT and Adelphi, and offers master’s degrees in programs ranging from Literacy and Early Childhood Education to Teaching English as a Second Language and Special Education.
The UFT originally took occupancy at the Brooklyn Renaissance Plaza Property in October 1998 on a 15-year lease term and extended its lease in April 2014 for an additional 15 years through June 2029. The UFT leases the entire 25th floor and a portion of the 24th floor, and currently pays base rent equal to $38.78 per square foot modified gross. The UFT has no termination options and no renewal options remaining.
The Market.The Brooklyn Renaissance Plaza Property is located in the Downtown Brooklyn neighborhood of Brooklyn, New York. Since 2004, the neighborhood has experienced an increase in retail corridors such as the Fulton Street Mall, Atlantic Avenue and the transformation of DUMBO Heights. Downtown Brooklyn is also the site of the 18,100 seat Barclays Center, home to the NBA’s Brooklyn Nets, NCAA Men's Basketball tournaments and a number of concerts, conventions and other events throughout the year. Additional notable eateries and attractions in the area include the Brooklyn Bridge Park, Dekalb Market, Rocco’s Tacos & Tequila Bar (at the base of the Brooklyn Renaissance Plaza Development), Brooklyn Fare, Borough Hall, TKTS Downtown Brooklyn, Gotham Market and Fort Greene Park.
According to a market report, the Brooklyn Renaissance Plaza Property is located within the Downtown Brooklyn office submarket. For the full-year 2018, the Downtown Brooklyn office submarket contained approximately 23.9 million square feet, representing 43.9% of the total Brooklyn market. Overall average vacancy for the Downtown Brooklyn office market was 8.2% for the full-year 2018.
The appraisal included 12 rent comparables. Of the 12 comparables, one was triple net (“NNN”) with the remaining 11 full service gross (“FSG”). The one NNN rent comparable was equal to $50.00 per square foot while the 11 FSG rent comparables ranged from $43.00 to $70.00 per square foot with a weighted average of approximately $51.90 per square foot FSG. According to the appraisal, the in-place rents for tenants at the Brooklyn Renaissance Plaza Property are approximately 18.1% below market.
THE INFORMATION IN THIS STRUCTURAL AND COLLATERAL TERM SHEET IS NOT COMPLETE AND MAY BE AMENDED PRIOR TO THE TIME OF SALE. THIS TERM SHEET IS NOT AN OFFER TO SELL THESE SECURITIES AND IT IS NOT A SOLICITATION OF AN OFFER TO BUY THESE SECURITIES IN ANY JURISDICTION WHERE THE OFFER OR SALE IS NOT PERMITTED.
19 of 116
| Structural and Collateral Term Sheet | JPMCC 2019-COR5 | |
| Brooklyn Renaissance Plaza | ||
| Historical and Current Occupancy(1) | |||||||||
| 2010 | 2011 | 2012 | 2013 | 2014 | 2015 | 2016 | 2017 | 2018 | Current(2) |
| 100.0% | 100.0% | 100.0% | 100.0% | 100.0% | 100.0% | 100.0% | 100.0% | 100.0% | 88.5% |
| (1) | Historical Occupancies are as of December 31 of eachrespective year. |
| (2) | Current Occupancy is as of January 28, 2019 and excludes Amerigroup Community Care which currently occupies 33,285 square feet (11.5% of net rentable area) and recently gave notice that it would be vacating its space at lease expiration on June 30, 2019. |
| Tenant Summary(1) | ||||||
| Tenant | Ratings Moody’s/Fitch/S&P | Net Rentable Area (SF) | % of Total NRA | Base Rent PSF(2) | % of Total Base Rent(2) | Lease Expiration Date |
| USA GSA - Secret Service | Aaa / AAA / AA+ | 89,030 | 30.8% | $59.78 | 41.7% | 10/31/2023 |
| NYC Department of Education | Aa1 / AA / AA | 64,340 | 22.2 | $50.99 | 25.7 | 10/31/2033 |
| United Federation of Teachers | NR / NR / NR | 44,945 | 15.5 | $38.78 | 13.6 | 6/30/2029 |
| NYC Department of Citywide Administration(3) | Aa1 / AA / AA | 21,625 | 7.5 | $44.23 | 7.5 | 4/30/2021 |
| Motorola Solutions Inc.(4) | NR / NR / NR | 9,975 | 3.4 | $48.50 | 3.8 | 1/31/2022 |
| LTK Consulting Services Inc. | NR / NR / NR | 7,874 | 2.7 | $43.59 | 2.7 | 6/30/2026 |
| Brooklyn Chamber of Commerce | NR / NR / NR | 7,640 | 2.6 | $29.71 | 1.8 | 5/31/2023 |
| MetLife Services & Solutions(4)(5) | NR / NR / NR | 4,995 | 1.7 | $47.00 | 1.8 | 8/31/2021 |
| Black, Inc. | NR / NR / NR | 3,608 | 1.2 | $34.00 | 1.0 | 5/31/2021 |
| Epstein & Conroy(4) | NR / NR / NR | 1,863 | 0.6 | $33.21 | 0.5 | 1/31/2023 |
| Top 10 Total / Wtd. Avg. | 255,895 | 88.5% | $49.93 | 100.0% | ||
| Other Tenants | 0 | 0.0 | $0.00 | 0.0 | ||
| Total Occupied Space | 255,895 | 88.5% | $49.93 | 100.0% | ||
| Vacant | 33,285 | 11.5 | ||||
| Total | 289,180 | 100.0% | ||||
| (1) | Based on the underwritten rent roll dated as of January 28, 2019. |
| (2) | Base Rent includes average rent over the lease term for investment grade tenant the NYC Department of Education ($192,248). |
| (3) | NYC Department of Citywide Administration has the right to terminate its lease at any time by providing at least 12 months’ notice and payment of a termination fee. |
| (4) | Motorola Solutions Inc. has one, five-year renewal option remaining, MetLife Services & Solutions has one, five-year renewal option remaining, and Epstein & Conroy has one, five-year renewal option remaining. |
| (5) | MetLife Services & Solutions has a free rent period in the months of September 2019 and September 2020, each for approximately $19,564. At origination, the borrower deposited approximately $39,128 into a free rent reserve. |
Lease Rollover Schedule(1) | |||||||||
| Year | Number of Leases Expiring | Net Rentable Area Expiring | % of NRA Expiring | Base Rent Expiring(2) | % of Base Rent Expiring(2) | Cumulative Net Rentable Area Expiring | Cumulative % of NRA Expiring | Cumulative Base Rent Expiring(2) | Cumulative % of Base Rent Expiring(2) |
| Vacant | NAP | 33,285 | 11.5% | NAP | NAP | 33,285 | 11.5% | NAP | NAP |
| 2019 & MTM | 0 | 0 | 0.0% | $0 | 0.0% | 33,285 | 11.5% | $0 | 0.0% |
| 2020 | 0 | 0 | 0.0% | 0 | 0.0% | 33,285 | 11.5% | $0 | 0.0% |
| 2021 | 3 | 30,228 | 10.5% | 1,313,902 | 10.3% | 63,513 | 22.0% | $1,313,902 | 10.3% |
| 2022 | 1 | 9,975 | 3.4% | 483,788 | 3.8% | 73,488 | 25.4% | $1,797,690 | 14.1% |
| 2023 | 3 | 98,533 | 34.1% | 5,611,377 | 43.9% | 172,021 | 59.5% | $7,409,066 | 58.0% |
| 2024 | 0 | 0 | 0.0% | 0 | 0.0% | 172,021 | 59.5% | $7,409,066 | 58.0% |
| 2025 | 0 | 0 | 0.0% | 0 | 0.0% | 172,021 | 59.5% | $7,409,066 | 58.0% |
| 2026 | 1 | 7,874 | 2.7% | 343,193 | 2.7% | 179,895 | 62.2% | $7,752,260 | 60.7% |
| 2027 | 0 | 0 | 0.0% | 0 | 0.0% | 179,895 | 62.2% | $7,752,260 | 60.7% |
| 2028 | 0 | 0 | 0.0% | 0 | 0.0% | 179,895 | 62.2% | $7,752,260 | 60.7% |
| 2029 | 1 | 44,945 | 15.5% | 1,742,783 | 13.6% | 224,840 | 77.8% | $9,495,042 | 74.3% |
| 2030 & Beyond | 1 | 64,340 | 22.2% | 3,280,568 | 25.7% | 289,180 | 100.0% | $12,775,610 | 100.0% |
| Total | 10 | 289,180 | 100.0% | $12,775,610 | 100.0% | ||||
| (1) | Based on the underwritten rent roll dated January 28, 2019. |
| (2) | Base Rent Expiring includes $192,248 of average rent over the lease term for the NYC Department of Education. |
THE INFORMATION IN THIS STRUCTURAL AND COLLATERAL TERM SHEET IS NOT COMPLETE AND MAY BE AMENDED PRIOR TO THE TIME OF SALE. THIS TERM SHEET IS NOT AN OFFER TO SELL THESE SECURITIES AND IT IS NOT A SOLICITATION OF AN OFFER TO BUY THESE SECURITIES IN ANY JURISDICTION WHERE THE OFFER OR SALE IS NOT PERMITTED.
20 of 116
| Structural and Collateral Term Sheet | JPMCC 2019-COR5 | |
| Brooklyn Renaissance Plaza | ||
| Operating History and Underwritten Net Cash Flow | ||||||||||||
| 2016 | 2017 | 2018 | Underwritten | Per Square Foot | %(1) | |||||||
| Rents in Place(2) | $7,462,946 | $7,462,946 | $8,502,569 | $12,583,362 | $43.51 | 75.7 | % | |||||
| Straight Line Rent(3) | 0 | 0 | 0 | 192,248 | 0.66 | 1.2 | ||||||
| Vacant Income | 0 | 0 | 0 | 1,930,530 | 6.68 | 11.6 | ||||||
| Gross Potential Rent | $7,462,946 | $7,462,946 | $8,502,569 | $14,706,140 | $50.85 | 88.5 | % | |||||
| Total Reimbursements(2) | 3,568,169 | 3,785,081 | 3,999,970 | 1,912,225 | 6.61 | 11.5 | ||||||
| Total Other Income | 6,785 | 0 | 3,706 | 3,706 | 0.01 | 0.0 | ||||||
| Net Rental Income | $11,037,900 | $11,248,027 | $12,506,245 | $16,622,071 | $57.48 | 100.0 | % | |||||
| (Vacancy/Credit Loss) | 0 | 0 | 0 | (1,930,530) | (6.68) | (11.6 | ) | |||||
| Effective Gross Income | $11,037,900 | $11,248,027 | $12,506,245 | $14,691,541 | $50.80 | 88.4 | % | |||||
| Total Expenses | $4,267,381 | $4,719,632 | $5,149,721 | $6,697,245 | $23.16 | 45.6 | % | |||||
| Net Operating Income | $6,770,519 | $6,528,395 | $7,356,524 | $7,994,296 | $27.64 | 54.4 | % | |||||
| Total TI/LC, CapEx/RR | 0 | 0 | 0 | 248,841 | 0.86 | 1.7 | ||||||
| Net Cash Flow | $6,770,519 | $6,528,395 | $7,356,524 | $7,745,455 | $26.78 | 52.7 | % | |||||
| (1) | % column represents percent of Net Rental Income for all revenue lines and represents percent of Effective Gross Income for the remainder of the fields. |
| (2) | The increase in Underwritten Rents in Place and the decrease in Underwritten Total Reimbursements over the historical periods is primarily attributable to the GSA renewal in October 2018 which converted the base rent from modified gross to gross as well as the new direct lease with the NYC Department of Education which commenced in November 2018. |
| (3) | Based on the average rent over the lease term for the NYC Department of Education. |
Property Management.The Brooklyn Renaissance Plaza Property is managed by Renaissance Property Managers LLC, an affiliate of the borrower.
Escrows and Reserves. At origination, the borrower deposited into escrow $3,000,000 for tenant improvements and leasing commissions (related to leasing the Amerigroup Community Care space), $850,000 for real estate taxes, $200,000 for outstanding leasing expenses, approximately $160,261 for a lease buyout required pursuant to the Amerigroup Community Care lease, $95,000 for insurance premiums and approximately $39,128 for outstanding free rent.
Tax Escrows– On a monthly basis,the borrower is required to escrow 1/12 of the annual estimated tax payments which currently equates to $150,000.
Insurance Escrows– On a monthly basis,the borrower is required to escrow 1/12 of the annual estimated insurance premiums which currently equates to $12,000.
Replacement Reserves –On a monthly basis, the borrower is required to escrow $6,017 for replacement reserves, subject to a cap of $216,612.
TI/LC Reserves – On a monthly basis, the borrower is required to escrow $36,102 for tenant improvements and leasing commissions, subject to a cap of $1,299,672 (which cap is exclusive of the initial $3.0 million deposit for tenant improvements and leasing commissions relating to leasing the Amerigroup Community Care space and $200,000 deposit for tenant improvements relating to the GSA space).
Ground Rent Reserves –On a monthly basis, the borrower is required to escrow 1/12 of the annual ground rent payments.
Lockbox / Cash Management.The Brooklyn Renaissance Plaza Whole Loan is structured with a hard lockbox and in-place cash management. All rents are required to be deposited directly by the tenants into a lockbox account controlled by the lender. All funds in the lockbox account are required to be swept to a lender-controlled cash management account every business day and applied on each payment date to the payment of debt service and the funding of required reserves. Provided no Cash Trap Period (as defined below) is continuing, all funds remaining in the cash management account after payment of the aforementioned items will be transferred into the borrower’s operating account. During a Cash Trap Period, all excess cash in the cash management account will be retained by the lender as additional collateral for the Brooklyn Renaissance Plaza Whole Loan.
A “Cash Trap Period” will commence (i) upon an event of default and end upon the cure of such event of default,providedthat no other event of default is then continuing, (ii) if the debt yield is less than 7.0% for one calendar quarter (until such time that the debt yield is
THE INFORMATION IN THIS STRUCTURAL AND COLLATERAL TERM SHEET IS NOT COMPLETE AND MAY BE AMENDED PRIOR TO THE TIME OF SALE. THIS TERM SHEET IS NOT AN OFFER TO SELL THESE SECURITIES AND IT IS NOT A SOLICITATION OF AN OFFER TO BUY THESE SECURITIES IN ANY JURISDICTION WHERE THE OFFER OR SALE IS NOT PERMITTED.
21 of 116
| Structural and Collateral Term Sheet | JPMCC 2019-COR5 | |
| Brooklyn Renaissance Plaza | ||
greater than or equal to 7.0% for two consecutive quarters), (iii) 30 days after the death or incapacity of the loan sponsor (until an acceptable replacement guarantor is in place) or (iv) upon the commencement of a Lease Sweep Period (as defined below).
A “Lease Sweep Period” will commence on the first payment date following (i) the date that is (x) 12 months prior to the end of the term (including any renewal terms) of any Lease Sweep Lease (as defined below), other than the GSA lease, or (y) 18 months prior to the end of the term (including any renewal terms) of the GSA lease, (ii) the date required under a Lease Sweep Lease by which the applicable Lease Sweep Tenant (as defined below) is required to give notice of its exercise of a renewal option thereunder (and such renewal has not so been exercised), (iii) if any Lease Sweep Lease is surrendered, cancelled or terminated prior to its then-current expiration date, (iv) if any Lease Sweep Tenant goes dark or gives notice that it intends to discontinue its business at its premises;provided, however, that with respect to one (but not more than one) Lease Sweep Tenant, the Lease Sweep Period will commence six months after the date such Lease Sweep Tenant discontinues its business at its premises or give notice that it intends to discontinue its business if (a) the subject Lease Sweep Tenant is an investment grade rated entity or governmental entity and (b) the subject Lease Sweep Lease has at least three years remaining until the expiration of the term, (v) upon the occurrence and continuance of a monetary or material non-monetary default under any Lease Sweep Lease, (vi) upon the occurrence of a Lease Sweep Tenant insolvency proceeding or (vii) if less than 80.0% of net rentable area is tenanted pursuant to executed leases with tenants that are in occupancy, open for business and paying full unabated rent under their respective leases.
A “Lease Sweep Lease” means the GSA lease, the NYC Department of Education lease, the UFT lease and any other lease which covers 25,000 or more square feet.
A “Lease Sweep Tenant” means any tenant under a Lease Sweep Lease, or under one or more leases which when taken together would constitute a Lease Sweep Lease.
Ground Lease.The Brooklyn Renaissance Plaza Property is part of the Brooklyn Renaissance Plaza Development which is subject to a ground lease for a 99-year term through June 19, 2086, with no renewal options, between the City of New York and MWR Associates (c/o Muss Development). The original ground lease was subsequently severed into five separate ground leases, each of which relates to one of the five Brooklyn Renaissance Plaza Development commercial condominium units, and each of which was assigned to a unit owner. The ground lease for the Brooklyn Renaissance Plaza Property requires ground rent in an amount equal to approximately $98,208per annumthrough June 30, 2022, which will be adjusted every subsequent 10 years beginning July 1, 2022 (such adjustment date, the “Reappraisal Date”), and adjusted rent will be estimated based upon the right to develop the site consistent with the use and size of the existing improvements (not its highest and best use). The appraiser utilized the land residual approach via the income capitalization approach and projected that the ground rent for the Brooklyn Renaissance Plaza Property as of the first Reappraisal Date on July 1, 2022 is estimated to increase to $486,540per annum. Ground rent was underwritten based on the estimated July 1, 2022 ground rent equal to $486,540per annum.
Payment in Lieu of Taxes.The Brooklyn Renaissance Plaza Development is subject to a payment in lieu of taxes (“PILOT”) program pursuant to which PILOT payments are calculated based on the assessed value of the entire Brooklyn Renaissance Plaza Development and the Brooklyn Renaissance Plaza Property’s allocated share of 21.1538%, based on its common interest in the condominium. Under the PILOT program, taxes are payable on the subject land based on current assessments; however, the improvements are exempt from real estate taxes for 16 years. Taxes on the improvements are then phased in at 10.0% increments from year 17 through year 25 when the exemption ends. The PILOT program for the Brooklyn Renaissance Plaza Development is in year 21 of 25 and due to the short-term nature of the abatement, the full unabated real estate tax amount was underwritten.
Condominium.The Brooklyn Renaissance Plaza Development is divided into five condominium units, one of which is the Brooklyn Renaissance Plaza Property. Control of the condominium resides with a five-member board of managers designated by each condominium owner. All decisions and actions by the board require a vote of one or more of the managers representing more than 51% (other than major decisions, which require a vote of 66.67%). No amendment may materially and adversely affect the rights of an owner without the written consent of such owner and any permitted lender of such owner’s unit. Affiliates of the loan sponsor currently own all five of the condominium units.
THE INFORMATION IN THIS STRUCTURAL AND COLLATERAL TERM SHEET IS NOT COMPLETE AND MAY BE AMENDED PRIOR TO THE TIME OF SALE. THIS TERM SHEET IS NOT AN OFFER TO SELL THESE SECURITIES AND IT IS NOT A SOLICITATION OF AN OFFER TO BUY THESE SECURITIES IN ANY JURISDICTION WHERE THE OFFER OR SALE IS NOT PERMITTED.
22 of 116
| Structural and Collateral Term Sheet | JPMCC 2019-COR5 | |
| Hyde Park Multifamily Portfolio | ||

THE INFORMATION IN THIS STRUCTURAL AND COLLATERAL TERM SHEET IS NOT COMPLETE AND MAY BE AMENDED PRIOR TO THE TIME OF SALE. THIS TERM SHEET IS NOT AN OFFER TO SELL THESE SECURITIES AND IT IS NOT A SOLICITATION OF AN OFFER TO BUY THESE SECURITIES IN ANY JURISDICTION WHERE THE OFFER OR SALE IS NOT PERMITTED.
23 of 116
| Structural and Collateral Term Sheet | JPMCC 2019-COR5 | |
| Hyde Park Multifamily Portfolio | ||

THE INFORMATION IN THIS STRUCTURAL AND COLLATERAL TERM SHEET IS NOT COMPLETE AND MAY BE AMENDED PRIOR TO THE TIME OF SALE. THIS TERM SHEET IS NOT AN OFFER TO SELL THESE SECURITIES AND IT IS NOT A SOLICITATION OF AN OFFER TO BUY THESE SECURITIES IN ANY JURISDICTION WHERE THE OFFER OR SALE IS NOT PERMITTED.
24 of 116
| Structural and Collateral Term Sheet | JPMCC 2019-COR5 | |
| Hyde Park Multifamily Portfolio | ||
| Mortgage Loan Information | Properties Information | |||
| Mortgage Loan Seller: | LCM | Single Asset / Portfolio: | Portfolio | |
| Original Principal Balance(1): | $60,000,000 | Title: | Fee | |
| Cut-off Date Principal Balance(1): | $60,000,000 | Properties Type – Subtype: | Multifamily – Various | |
| % of Pool by IPB: | 8.6% | Net Rentable Area (Units)(4): | 839 | |
| Loan Purpose: | Refinance | Location: | Chicago, IL | |
| Borrowers(2): | Various | Year Built/Renovated: | Various / Various | |
| Sponsor: | Lyrical-Antheus Realty Partners | Occupancy(4): | 95.2% | |
| II, L.P. | Occupancy Date: | 2/28/2019 | ||
| Interest Rate: | 4.55400% | Number of Tenants: | N/A | |
| Note Date: | 1/30/2019 | 2016 NOI: | $7,979,218 | |
| Maturity Date: | 2/6/2029 | 2017 NOI: | $8,478,846 | |
| Interest-only Period: | 120 months | 2018 NOI: | $8,692,956 | |
| Original Term: | 120 months | TTM NOI (as of 2/2019): | $8,788,173 | |
| Original Amortization: | None | UW Economic Occupancy: | 90.8% | |
| Amortization Type: | Interest Only | UW Revenues: | $15,264,225 | |
| Call Protection(3): | L(28),Def(85),O(7) | UW Expenses: | $5,921,619 | |
| Lockbox / Cash Management: | Springing / Springing | UW NOI: | $9,342,606 | |
| Additional Debt(1): | Yes | UW NCF: | $9,090,906 | |
| Additional Debt Balance(1): | $46,750,000 / $15,250,000 | Appraised Value / Per Unit: | $176,385,000 / $210,232 | |
| Additional Debt Type(1): | Pari Passu / Mezzanine Loan | Appraisal Date: | 12/3/2018 | |
| Escrows and Reserves(5) | Financial Information(1) | |||||
| Initial | Monthly | Initial Cap | Cut-off Date Loan / Unit: | $127,235 | ||
| Taxes: | $700,000 | $119,000 | N/A | Maturity Date Loan / Unit: | $127,235 | |
| Insurance: | $225,000 | Springing | N/A | Cut-off Date LTV: | 60.5% | |
| Replacement Reserves: | $0 | $17,580 | N/A | Maturity Date LTV: | 60.5% | |
| TI/LC: | $0 | $0 | N/A | UW NCF DSCR: | 1.84x | |
| Other: | $0 | $0 | N/A | UW NOI Debt Yield: | 8.8% | |
| Sources and Uses | ||||||
| Sources | Proceeds | % of Total | Uses | Proceeds | % of Total | |
| Whole Loan(1) | $106,750,000 | 87.5% | Payoff Existing Debt | $115,181,393 | 94.4% | |
| Mezzanine Loan | 15,250,000 | �� 12.5 | Closing Costs | 3,504,348 | 2.9 | |
| Upfront Reserves | 925,000 | 0.8 | ||||
| Return of Equity | 2,389,259 | 2.0 | ||||
| Total Sources | $122,000,000 | 100.0% | Total Uses | $122,000,000 | 100.0% | |
| (1) | The Hyde Park Multifamily Portfolio Loan (as defined below) is part of a whole loan evidenced by twopari passu notes, with an aggregate outstanding principal balance as of the Cut-off Date of approximately $106.8 million. The Financial Information presented in the chart above reflects the Cut-off Date balance of the approximately $106.8 million Hyde Park Multifamily Portfolio Whole Loan (as defined below). |
| (2) | The borrowers are 1515-1521 E. 54th Street, LLC, 5034-5046 S. Woodlawn, LLC, 5111 S. Kimbark, LLC, 5118-5120 S. Greenwood, LLC, 5120 S. Hyde Park, LLC, 5128-5132 S. Cornell, LLC, 5202-5210 S. Cornell, LLC, 5218-5220 S. Kimbark, LLC, 5234-5244 S. Ingleside, LLC, 5237-5245 S. Kenwood, LLC, 5300-5308 S. Hyde Park, LLC, 5301-5307 S. Maryland, LLC, 5320-5326.5 S. Drexel, LLC, 5335-5337 S. Woodlawn, LLC, 5336-5338 S. Hyde Park, LLC, 5337 S. Hyde Park, LLC, 5350-5358 S. Maryland, LLC, 5400-5408 S. Ingleside, LLC, 5401-5403 S. Woodlawn, LLC, 5405-5407 S. Woodlawn, LLC, 5415 S. Woodlawn, LLC, 5452-5466 S. Ellis, LLC, 5457-5459 S. Blackstone, LLC, 5474-5480 S. Hyde Park, LLC, 5487-5491 S. Hyde Park, LLC, 5528-5532 S. Everett, LLC, 5715-5725 S. Kimbark, LLC, Greenwood 5201, LLC, 5524-5526 S. Everett, LLC, 5400-5406 S. Maryland, LLC, 5300-5308 S. Greenwood, LLC, 5335-5345 S. Kimbark, LLC, 5339-5345 S. Woodlawn, LLC, 5355-5361 S. Cottage Grove, LLC, 5401-5409 S. Cottage Grove, LLC, 5401-5405 S. Drexel, LLC, 5411-5421 S. Ellis, LLC, 5468-70 S. Hyde Park, LLC, 1509-1517 E. 57th Street, LLC, 5507-5509 S. Hyde Park, LLC, 1018 E. 54th Street Owner, LLC and 5110 S. Harper, LLC. |
| (3) | The lockout period will be at least 28 payment dates beginning with and including the first payment date of March 6, 2019. Defeasance of the full Hyde Park Multifamily Portfolio Whole Loan is permitted after the date that is the earlier to occur of (i) two years after the closing date of the securitization that includes the lastpari passu note to be securitized and (ii) August 2022. The assumed lockout period of 28 payments is based on the expected JPMCC 2019-COR5 securitization closing date in June 2019. The actual lockout period may be longer. Partial defeasance is permitted. See “Partial Releases” below. |
THE INFORMATION IN THIS STRUCTURAL AND COLLATERAL TERM SHEET IS NOT COMPLETE AND MAY BE AMENDED PRIOR TO THE TIME OF SALE. THIS TERM SHEET IS NOT AN OFFER TO SELL THESE SECURITIES AND IT IS NOT A SOLICITATION OF AN OFFER TO BUY THESE SECURITIES IN ANY JURISDICTION WHERE THE OFFER OR SALE IS NOT PERMITTED.
25 of 116
| Structural and Collateral Term Sheet | JPMCC 2019-COR5 | |
| Hyde Park Multifamily Portfolio | ||
| (4) | The Hyde Park Multifamily Portfolio Properties (as defined below) include 835 residential units that average approximately 891 square feet that are 95.2% occupied and four commercial retail units that average approximately 2,766 square feet and are 100.0% occupied as of the February 28, 2019 rent rolls. |
| (5) | For a full description of Escrows and Reserves, please refer to the “Escrows and Reserves” below. |
The Loan. The Hyde Park Multifamily Portfolio loan, with an original principal balance of $60.0 million (the “Hyde Park Multifamily Portfolio Loan”), is secured by a first mortgage lien on the borrowers’ fee simple interests in 41 multifamily properties (with a total of 835 residential units and four commercial units) and one surface parking lot (with 28 parking spaces) (collectively, the “Hyde Park Multifamily Portfolio Properties” or the “Hyde Park Multifamily Portfolio”) located in the Hyde Park neighborhood of Chicago, Illinois. The Hyde Park Multifamily Portfolio Loan is part of a whole loan that has an aggregate original principal balance as of the Cut-off Date of approximately $106.8 million (the “Hyde Park Multifamily Portfolio Whole Loan”) and is comprised of twopari passu notes, each as described in the “Whole Loan Summary” chart below. The controlling Note A-1, with an outstanding principal balance as of the Cut-off Date of $60.0 million, is being contributed to the JPMCC 2019-COR5 Trust. The non-controlling Note A-2, with an original principal balance as of the Cut-off Date of approximately $46.8 million is currently held by LCM or an affiliate and expected to be contributed to one or more future securitizations or may otherwise be transferred at any time. The relationship between the holders of the Hyde Park Multifamily Portfolio Whole Loan will be governed by a co-lender agreement as described under “Description of the Mortgage Pool—The Whole Loans—The Serviced Pari Passu Whole Loans” in the Preliminary Prospectus. The Hyde Park Multifamily Portfolio Whole Loan has a 10-year term and will be interest only for the entire term. The previously existing debt was not included in a securitization.
| Whole Loan Summary | ||||
| Notes | Original Balance | Cut-off Date Balance | Note Holder | Controlling Piece |
| A-1 | $60,000,000 | $60,000,000 | JPMCC 2019-COR5 | Yes |
| A-2 | 46,750,000 | 46,750,000 | LCM | No |
| Total | $106,750,000 | $106,750,000 | ||
The Borrowers. The borrowing entities are 1515-1521 E. 54th Street, LLC, 5034-5046 S. Woodlawn, LLC, 5111 S. Kimbark, LLC, 5118-5120 S. Greenwood, LLC, 5120 S. Hyde Park, LLC, 5128-5132 S. Cornell, LLC, 5202-5210 S. Cornell, LLC, 5218-5220 S. Kimbark, LLC, 5234-5244 S. Ingleside, LLC, 5237-5245 S. Kenwood, LLC, 5300-5308 S. Hyde Park, LLC, 5301-5307 S. Maryland, LLC, 5320-5326.5 S. Drexel, LLC, 5335-5337 S. Woodlawn, LLC, 5336-5338 S. Hyde Park, LLC, 5337 S. Hyde Park, LLC, 5350-5358 S. Maryland, LLC, 5400-5408 S. Ingleside, LLC, 5401-5403 S. Woodlawn, LLC, 5405-5407 S. Woodlawn, LLC, 5415 S. Woodlawn, LLC, 5452-5466 S. Ellis, LLC, 5457-5459 S. Blackstone, LLC, 5474-5480 S. Hyde Park, LLC, 5487-5491 S. Hyde Park, LLC, 5528-5532 S. Everett, LLC, 5715-5725 S. Kimbark, LLC, Greenwood 5201, LLC, 5524-5526 S. Everett, LLC, 5400-5406 S. Maryland, LLC, 5300-5308 S. Greenwood, LLC, 5335-5345 S. Kimbark, LLC, 5339-5345 S. Woodlawn, LLC, 5355-5361 S. Cottage Grove, LLC, 5401-5409 S. Cottage Grove, LLC, 5401-5405 S. Drexel, LLC, 5411-5421 S. Ellis, LLC, 5468-70 S. Hyde Park, LLC, 1509-1517 E. 57th Street, LLC, 5507-5509 S. Hyde Park, LLC, 1018 E. 54th Street Owner, LLC and 5110 S. Harper, LLC, each a Delaware limited liability company and special purpose entity structured to be bankruptcy remote with one independent director. Legal counsel to the borrowers delivered a non-consolidation opinion in connection with the origination of the Hyde Park Multifamily Portfolio Whole Loan.
The Loan Sponsor. The loan sponsor and nonrecourse carve-out guarantor is Lyrical-Antheus Realty Partners II, L.P., an affiliate of Antheus Capital. Antheus Capital is a private real estate company focused on the acquisition, development and redevelopment of apartment properties in select submarkets located throughout the United States. Antheus Capital was founded in 2002 by Eli Ungar and David Gefsky. Antheus Capital’s current portfolio consists of approximately 7,800 units and approximately 365,000 square feet of commercial space. Antheus Capital is one of the largest multifamily owners in the Hyde Park submarket.
THE INFORMATION IN THIS STRUCTURAL AND COLLATERAL TERM SHEET IS NOT COMPLETE AND MAY BE AMENDED PRIOR TO THE TIME OF SALE. THIS TERM SHEET IS NOT AN OFFER TO SELL THESE SECURITIES AND IT IS NOT A SOLICITATION OF AN OFFER TO BUY THESE SECURITIES IN ANY JURISDICTION WHERE THE OFFER OR SALE IS NOT PERMITTED.
26 of 116
| Structural and Collateral Term Sheet | JPMCC 2019-COR5 | |
| Hyde Park Multifamily Portfolio | ||
| Portfolio Summary | |||||||
| Property | Year Built / Renovated | # of Units | % of Total | Occupancy(1) | UW NOI | Allocated Whole Loan Amount | Appraised Value |
| 5452-5466 South Ellis Avenue | 1913 / 2000 | 31 | 3.7% | 100.0% | $471,443 | $5,023,463 | $8,275,000 |
| 5339-5345 South Woodlawn Avenue | 1912 / Various | 25 | 3.0% | 100.0% | 426,799 | 4,568,200 | 7,525,000 |
| 5335-5345 South Kimbark Avenue | 1913 / 2000 | 25 | 3.0% | 92.0% | 395,501 | 4,401,250 | 7,250,000 |
| 5715-5725 South Kimbark Avenue | 1911 / 2000 | 19 | 2.3% | 100.0% | 380,696 | 4,234,300 | 6,975,000 |
| 5034-5046 South Woodlawn Avenue | 1920 / 2000 | 45 | 5.4% | 93.3% | 413,511 | 4,128,075 | 6,800,000 |
| 1509 East 57th Street | 1888 / 2010 | 22 | 2.6% | 77.3% | 280,189 | 4,067,350 | 6,700,000 |
| 5320-5326 South Drexel Avenue | 1923 / 2009 | 31 | 3.7% | 96.8% | 335,488 | 3,748,675 | 6,175,000 |
| 5237-5245 South Kenwood(2) | 1910 / 2000 | 19 | 2.3% | 100.0% | 349,714 | 3,703,088 | 6,100,000 |
| 5411-5421 South Ellis Avenue | 1917 / 2000 | 31 | 3.7% | 100.0% | 352,749 | 3,627,225 | 5,975,000 |
| 5300-5308 South Hyde Park Boulevard | 1912 / 2000 | 38 | 4.5% | 92.1% | 315,707 | 3,369,275 | 5,550,000 |
| 5234-5244 South Ingleside Avenue | 1912 / 2010 | 23 | 2.7% | 100.0% | 288,137 | 3,323,688 | 5,475,000 |
| 5415 South Woodlawn Avenue | 1927 / Various | 38 | 4.5% | 89.5% | 335,988 | 3,308,550 | 5,450,000 |
| 5300-5308 South Greenwood Avenue | 1914 / 2000 | 25 | 3.0% | 96.0% | 288,556 | 3,293,325 | 5,425,000 |
| 5201 South Greenwood Avenue | 1914 / 2000 | 24 | 2.9% | 100.0% | 253,618 | 2,883,563 | 4,750,000 |
| 5401-5409 South Cottage Grove Avenue(2) | 1914 / 2010 | 22 | 2.6% | 100.0% | 257,208 | 2,868,425 | 4,725,000 |
| 5120 South Hyde Park Boulevard | 1923 / 2000 | 40 | 4.8% | 100.0% | 228,708 | 2,504,163 | 4,125,000 |
| 5350-5358 South Maryland Avenue | 1915 / 2010 | 21 | 2.5% | 95.2% | 212,444 | 2,482,900 | 4,160,000 |
| 5400-5406 South Maryland Avenue | 1897 / 2010 | 18 | 2.1% | 83.3% | 190,301 | 2,473,800 | 4,075,000 |
| 5474-5480 South Hyde Park Boulevard | 1910 / 2000 | 29 | 3.5% | 96.6% | 249,964 | 2,458,663 | 4,050,000 |
| 5528-5532 South Everett Avenue | 1912 / 2000 | 34 | 4.1% | 100.0% | 221,699 | 2,397,938 | 3,950,000 |
| 5487-5491 South Hyde Park Boulevard | 1905 / 2018 | 7 | 0.8% | 100.0% | 203,919 | 2,367,575 | 3,900,000 |
| 5400-5408 South Ingleside Avenue | 1916 / 2010 | 19 | 2.3% | 100.0% | 217,817 | 2,352,350 | 3,875,000 |
| 5401-5403 South Woodlawn Avenue | 1899 / 2000 | 12 | 1.4% | 100.0% | 220,964 | 2,276,488 | 3,750,000 |
| 5301-5307 South Maryland Avenue | 1897 / 2009 | 21 | 2.5% | 95.2% | 214,644 | 2,230,988 | 3,675,000 |
| 5355-5361 South Cottage Grove Avenue | 1910 / 2010 | 21 | 2.5% | 81.0% | 115,084 | 2,215,763 | 3,650,000 |
| 1515-1521 East 54th Street | 1916 / 2000 | 16 | 1.9% | 93.8% | 190,333 | 2,191,525 | 3,690,000 |
| 5111-5113 South Kimbark Avenue | 1910 / 2011 | 8 | 1.0% | 62.5% | 100,694 | 2,142,963 | 3,570,000 |
| 5507-5509 South Hyde Park Boulevard | 1906 / 2017 | 7 | 0.8% | 100.0% | 174,931 | 2,094,400 | 3,460,000 |
| 5337 South Hyde Park Boulevard | 1919 / 2000 | 23 | 2.7% | 100.0% | 183,594 | 2,048,900 | 3,375,000 |
| 5202-5210 South Cornell Avenue | 1907 / 2000 | 27 | 3.2% | 96.3% | 201,562 | 1,991,150 | 3,280,000 |
| 5118-5120 South Greenwood Avenue | 1912 / 2011 | 6 | 0.7% | 100.0% | 143,745 | 1,803,025 | 2,990,000 |
| 5335-5337 South Woodlawn Avenue | 1909 / 2000 | 6 | 0.7% | 100.0% | 145,444 | 1,724,100 | 2,880,000 |
| 5524-5526 South Everett Avenue | 1910 / 2017 | 7 | 0.8% | 85.7% | 110,593 | 1,699,775 | 2,820,000 |
| 5401-5405 South Drexel Boulevard | 1915 / 2010 | 13 | 1.5% | 100.0% | 135,686 | 1,532,825 | 2,525,000 |
| 5468-5470 South Hyde Park Boulevard | 1903 / 2000 | 6 | 0.7% | 100.0% | 110,986 | 1,517,688 | 2,500,000 |
| 5218-5220 South Kimbark Avenue | 1903 / 2000 | 6 | 0.7% | 100.0% | 124,968 | 1,511,563 | 2,520,000 |
| 5457-5459 South Blackstone Avenue | 1908 / 2000 | 19 | 2.3% | 94.7% | 131,044 | 1,335,513 | 2,380,000 |
| 5336-5338 South Hyde Park Boulevard | 1912 / 2000 | 19 | 2.3% | 94.7% | 119,078 | 1,244,513 | 2,050,000 |
| 5405-5407 South Woodlawn Avenue | 1921 / 2000 | 18 | 2.1% | 100.0% | 127,683 | 1,123,063 | 1,850,000 |
| 1018 East 54th Street | 1915 / 2000 | 9 | 1.1% | 77.8% | 57,305 | 1,056,300 | 1,760,000 |
| 5128-5132 South Cornell Avenue | 1905 / 2000 | 9 | 1.1% | 88.9% | 54,015 | 922,775 | 1,550,000 |
| 5110 South Harper Avenue(3) | NAP | 0 | NAP | 100.0% | 10,097 | 500,842 | 825,000 |
| Total / Wtd. Avg. | 839 | 100.0% | 95.2% | $9,342,606 | $106,750,000 | $176,385,000 | |
| (1) | Based on the underwritten rent rolls dated February 28, 2019. |
| (2) | Properties contain four commercial retail units that average 2,766 square feet. |
| (3) | Represents the income producing parking lot. |
The Properties. The Hyde Park Multifamily Portfolio Properties are comprised of 41 mid-rise and garden apartment buildings and one income producing parking lot. The Hyde Park Multifamily Portfolio Properties are all located within a 1.5-mile radius and are comprised of 835 residential units totaling 743,704 square feet and four commercial retail units totaling 11,062 square feet. As of the February 28,
THE INFORMATION IN THIS STRUCTURAL AND COLLATERAL TERM SHEET IS NOT COMPLETE AND MAY BE AMENDED PRIOR TO THE TIME OF SALE. THIS TERM SHEET IS NOT AN OFFER TO SELL THESE SECURITIES AND IT IS NOT A SOLICITATION OF AN OFFER TO BUY THESE SECURITIES IN ANY JURISDICTION WHERE THE OFFER OR SALE IS NOT PERMITTED.
27 of 116
| Structural and Collateral Term Sheet | JPMCC 2019-COR5 | |
| Hyde Park Multifamily Portfolio | ||
2019 rent rolls, the Hyde Park Multifamily Portfolio was 95.2% occupied with no single Hyde Park Multifamily Portfolio Property accounting for more than approximately 5.0% of underwritten net operating income. The 835 residential units average approximately 891 square feet and are 95.2% occupied and the four commercial units average approximately 2,766 square feet and are 100.0% occupied as of the February 28, 2019 rent rolls.
The Hyde Park Multifamily Portfolio Properties include 81 studio units, 229 one-bedroom units, 272 two-bedroom units, 172 three-bedroom units, 62 four-bedroom units, 16 five-bedroom units, three six-bedroom units, four commercial retail units and one income producing parking lot.
The Market. The Hyde Park Multifamily Portfolio Properties are concentrated in the south-side Chicago neighborhood of Hyde Park. Hyde Park is located approximately six miles south of the Chicago central business district and is home to several institutional demand drivers including the University of Chicago, University of Chicago Medical Center and the Museum of Science and Industry. As of 2017, the University of Chicago had a total enrollment of 16,016 students, of whom 5,971 were undergraduate and 10,045 were post-graduate.
According to a market report, the Hyde Park Multifamily Portfolio falls within the Bronzeville/Hyde Park/South Shore submarket within the Chicago-Naperville-Elgin, Illinois-Indiana-Wisconsin metropolitan statistical area. Effective rent in the Bronzeville/Hyde Park/South Shore submarket increased slightly from $1,311 per unit per month in the fourth quarter of 2018 to $1,326 per unit per month in the first quarter of 2019. The submarket's occupancy rate was equal to 93.5% in the first quarter of 2019, while the submarket's occupancy rate has averaged 94.2% since the second quarter of 1996.
| Historical and Current Occupancy(1) | |||||
| 2014 | 2015 | 2016 | 2017 | 2018 | Current(2) |
| 90.5% | 90.7% | 90.9% | 90.0% | 90.1% | 95.2% |
| (1) | Historical Occupancies are as of December 31 of each respective year. |
| (2) | Current occupancy is as of February 28, 2019. |
| Multifamily Unit Mix(1) | |||||||||
| Unit Type | # of Units | % of Total | Occupied Units | Occupancy(2) | Average Unit Size (SF) | Average Monthly Rental Rate | Average Monthly Rental Rate PSF | Average Monthly Market Rent | Average Monthly Market Rent PSF |
| Studio | 81 | 9.7% | 80 | 98.8% | 368 | $869 | $2.36 | $862 | $2.34 |
| 1 Bedroom | 229 | 27.4% | 225 | 98.3% | 655 | $1,185 | $1.81 | $1,190 | $1.82 |
| 2 Bedroom | 272 | 32.6% | 255 | 93.8% | 887 | $1,491 | $1.67 | $1,501 | $1.69 |
| 3 Bedroom | 172 | 20.6% | 163 | 94.8% | 1,097 | $2,059 | $1.88 | $2,052 | $1.87 |
| 4 Bedroom | 62 | 7.4% | 55 | 88.7% | 1,555 | $2,816 | $1.79 | $2,786 | $1.79 |
| 5 Bedroom | 16 | 1.9% | 14 | 87.5% | 1,864 | $3,174 | $1.59 | $3,082 | $1.65 |
| 6 Bedroom | 3 | 0.4% | 3 | 100.0% | 2,570 | $3,837 | $1.49 | $3,830 | $1.49 |
| Total / Wtd. Avg. | 835 | 100.0% | 795 | 95.2% | 891 | $1,588 | $1.79 | $1,587 | $1.80 |
| (1) | Based on the underwritten rent rolls dated February 28, 2019. |
| (2) | Occupancy is weighted based on the total occupied square footage. |
THE INFORMATION IN THIS STRUCTURAL AND COLLATERAL TERM SHEET IS NOT COMPLETE AND MAY BE AMENDED PRIOR TO THE TIME OF SALE. THIS TERM SHEET IS NOT AN OFFER TO SELL THESE SECURITIES AND IT IS NOT A SOLICITATION OF AN OFFER TO BUY THESE SECURITIES IN ANY JURISDICTION WHERE THE OFFER OR SALE IS NOT PERMITTED.
28 of 116
| Structural and Collateral Term Sheet | JPMCC 2019-COR5 | |
| Hyde Park Multifamily Portfolio | ||
| Operating History and Underwritten Net Cash Flow | |||||||
| 2016 | 2017 | 2018 | TTM(1) | Underwritten | Per Unit | %(2) | |
| Rents in Place | $14,908,773 | $15,253,403 | $15,896,270 | $16,002,558 | $15,153,084 | $18,061 | 104.3% |
| Vacant Income | 0 | 0 | 0 | 0 | 861,504 | 1,027 | 5.9 |
| Gross Potential Rent | $14,908,773 | $15,253,403 | $15,896,270 | $16,002,558 | $16,014,588 | $19,088 | 110.3% |
| (Vacancy/Credit Loss) | (2,559,747) | (1,931,119) | (2,085,427) | (2,092,149) | (1,490,462) | (1,776) | (10.3)-- |
| Net Rental Income | $12,349,025 | $13,322,284 | $13,810,843 | $13,910,409 | $14,524,126 | $17,311 | 100.0% |
| Commercial Income(3) | 5,145 | 9,674 | 9,269 | 10,628 | 191,758 | 229 | 1.3% |
| (Vacancy/Credit Loss) | 0 | 0 | 0 | 0 | (9,588) | (11) | (0.1)-- |
| Other Income | 632,845 | 645,428 | 562,341 | 557,929 | 557,929 | 665 | 3.8% |
| Effective Gross Income | $12,987,016 | $13,977,386 | $14,382,453 | $14,478,966 | $15,264,225 | $18,193 | 105.1% |
| Total Expenses | $5,007,798 | $5,498,541 | $5,689,497 | $5,690,793 | $5,921,619 | $7,058 | 38.8% |
| Net Operating Income | $7,979,218 | $8,478,846 | $8,692,956 | $8,788,173 | $9,342,606 | $11,135 | 61.2% |
| Replacement Reserves | 209,750 | 209,750 | 209,750 | 209,750 | 251,700 | 300 | 1.6 |
| Net Cash Flow | $7,769,468 | $8,269,096 | $8,483,206 | $8,578,423 | $9,090,906 | $10,835 | 59.6% |
| (1) | TTM column represents the trailing 12-month period ending February 28, 2019. |
| (2) | % column represents percent of Net Rental Income for all revenue lines and represents percent of Effective Gross Income for the remainder of the fields. |
| (3) | Historical Commercial Income represents commercial reimbursements. Historical commercial base rental income is included in Rents in Place. |
Property Management. TheHyde Park Multifamily Portfolio is managed by MAC Property Management, L.L.C., an affiliate of the borrowers.
Escrows and Reserves. At origination, the borrowers deposited into escrow $700,000 for real estate taxes and $225,000 for insurance premiums.
Tax Escrows– On a monthly basis,the borrowers are required to escrow 1/12 of the annual estimated tax payments, which currently equates to $119,000.
Insurance Escrows– On a monthly basis, if an acceptable blanket policy is no longer in place,the borrowers are required to escrow 1/12 of the annual estimated insurance premiums, which currently equates to $18,400.
Replacement Reserves –On a monthly basis,the borrowers are required to escrow$17,580 for replacement reserves.
Lockbox / Cash Management.The Hyde Park Multifamily Portfolio Whole Loan is structured with a springing lockbox and springing cash management. Upon the occurrence of a Cash Management Period (as defined below), all rents are required to be deposited into a lockbox account within one business day of receipt by the borrowers or the property manager. Upon the occurrence and during the continuance of a Cash Management Period, all funds in the lockbox account are required to be swept daily into a lender-controlled account, from which account such funds will be disbursed on each payment date in accordance with the loan documents and any excess will be retained by the lender as additional collateral for The Hyde Park Multifamily Portfolio Whole Loan.
A “Cash Management Period” will commence (i) upon an event of default (including an event of default under the mezzanine loan) or (ii) if, based on the Hyde Park Multifamily Portfolio Whole Loan and the related mezzanine loan, the debt service coverage ratio is less than 1.10x (until such time that the debt service coverage ratio is greater than or equal to 1.10x for two consecutive quarters).
Partial Releases.Commencing on the date that is the earlier to occur of two years after the securitization closing date of the lastpari passu note to be securitized and August 2022, the borrowers may obtain the release of any of the Hyde Park Multifamily Portfolio Properties,provided that, among other conditions, (i) no event of default has occurred and is continuing, (ii) the borrowers defease a portion of the Hyde Park Multifamily Portfolio Whole Loan in an amount equal to the greater of (a) 115.0% of the allocated loan amount of the Hyde Park Multifamily Portfolio Property being released and (b) 100.0% of net sales proceeds, (iii) the debt yield (as calculated in accordance with the loan documents) for the remaining Hyde Park Multifamily Portfolio Properties following the release is not less than the greater of (1) the debt yield immediately preceding such release and (2) 7.0%, (iv) after giving effect to such release, the loan-to-value ratio of the remaining Hyde Park Multifamily Portfolio Properties is no more than 125%, and (v) all defeasance conditions set forth in the loan documents are satisfied.
Additional Debt. A mezzanine loan was funded concurrently and is coterminous with the Hyde Park Multifamily Portfolio Whole Loan. The mezzanine loan has an original principal balance of approximately $15.3 million, accrues interest at a rate of 7.49000%per annum and is interest-only for the entire loan term. Including the mezzanine loan, the cumulative Cut-off Date LTV, cumulative UW NCF DSCR and cumulative UW NOI DY are 69.2%, 1.49x and 7.7%, respectively. The mezzanine loan is currently held by LCM or an affiliate
THE INFORMATION IN THIS STRUCTURAL AND COLLATERAL TERM SHEET IS NOT COMPLETE AND MAY BE AMENDED PRIOR TO THE TIME OF SALE. THIS TERM SHEET IS NOT AN OFFER TO SELL THESE SECURITIES AND IT IS NOT A SOLICITATION OF AN OFFER TO BUY THESE SECURITIES IN ANY JURISDICTION WHERE THE OFFER OR SALE IS NOT PERMITTED.
29 of 116
| Structural and Collateral Term Sheet | JPMCC 2019-COR5 | |
| The Avenue | ||

THE INFORMATION IN THIS STRUCTURAL AND COLLATERAL TERM SHEET IS NOT COMPLETE AND MAY BE AMENDED PRIOR TO THE TIME OF SALE. THIS TERM SHEET IS NOT AN OFFER TO SELL THESE SECURITIES AND IT IS NOT A SOLICITATION OF AN OFFER TO BUY THESE SECURITIES IN ANY JURISDICTION WHERE THE OFFER OR SALE IS NOT PERMITTED.
30 of 116
| Structural and Collateral Term Sheet | JPMCC 2019-COR5 | |
| The Avenue | ||

THE INFORMATION IN THIS STRUCTURAL AND COLLATERAL TERM SHEET IS NOT COMPLETE AND MAY BE AMENDED PRIOR TO THE TIME OF SALE. THIS TERM SHEET IS NOT AN OFFER TO SELL THESE SECURITIES AND IT IS NOT A SOLICITATION OF AN OFFER TO BUY THESE SECURITIES IN ANY JURISDICTION WHERE THE OFFER OR SALE IS NOT PERMITTED.
31 of 116
| Structural and Collateral Term Sheet | JPMCC 2019-COR5 | |
| The Avenue | ||
| Mortgage Loan Information | Property Information | |||
| Mortgage Loan Seller: | LCM | Single Asset / Portfolio: | Single Asset | |
| Original Principal Balance: | $60,000,000 | Title: | Fee | |
| Cut-off Date Principal Balance: | $60,000,000 | Property Type – Subtype: | Multifamily – Garden | |
| % of Pool by IPB: | 8.6% | Net Rentable Area (Units): | 394 | |
| Loan Purpose: | Acquisition | Location: | Davie, FL | |
| Borrower: | BP Avenue, LLC | Year Built/Renovated: | 2018 / N/A | |
| Sponsors: | Adam G. Walker, Ira Gober | Occupancy: | 93.9% | |
| Interest Rate: | 4.992432% | Occupancy Date: | 4/29/2019 | |
| Note Date: | 12/21/2018 | Number of Tenants: | N/A | |
| Maturity Date: | 1/6/2029 | 2018 NOI (as of 11/2018)(1): | $3,522,249 | |
| Interest-only Period: | 120 months | T-6 Ann. NOI (as of 11/2018)(1): | $5,478,795 | |
| Original Term: | 120 months | T-3 Ann. NOI (as of 11/2018)(1): | $6,202,814 | |
| Original Amortization: | None | T-1 Ann. NOI (as of 11/2018)(1): | $6,480,221 | |
| Amortization Type: | Interest Only | UW Economic Occupancy: | 92.9% | |
| Call Protection: | L(29),Def(88),O(3) | UW Revenues: | $9,584,976 | |
| Lockbox / Cash Management: | Hard / In Place | UW Expenses: | $3,927,916 | |
| Additional Debt: | Yes | UW NOI: | $5,657,060 | |
| Additional Debt Balance: | $25,680,000 | UW NCF: | $5,538,860 | |
| Additional Debt Type: | Mezzanine Loan | Appraised Value / Per Unit: | $120,000,000 / $304,569 | |
| Appraisal Date: | 11/27/2018 | |||
| Escrows and Reserves(2) | Financial Information | |||||
| Initial | Monthly | Initial Cap | Cut-off Date Loan / Unit: | $152,284 | ||
| Taxes: | $300,000 | $141,100 | N/A | Maturity Date Loan / Unit: | $152,284 | |
| Insurance: | $25,000 | $23,100 | N/A | Cut-off Date LTV: | 50.0% | |
| Replacement Reserves: | $0 | Springing | N/A | Maturity Date LTV: | 50.0% | |
| TI/LC: | $0 | $0 | N/A | UW NCF DSCR: | 1.82x | |
| Other: | $0 | $0 | N/A | UW NOI Debt Yield: | 9.4% | |
| Sources and Uses | ||||||
| Sources | Proceeds | % of Total | Uses | Proceeds | % of Total | |
| Mortgage Loan | $60,000,000 | 49.6% | Purchase Price(3) | $118,632,039 | 98.2% | |
| Mezzanine Loan | 25,680,000 | 21.2 | Closing Costs | 1,892,834 | 1.6 | |
| Sponsor Equity | 35,169,873 | 29.1 | Upfront Reserves | 325,000 | 0.3 | |
| Total Sources | $120,849,873 | 100.0% | Total Uses | $120,849,873 | 100.0% | |
| (1) | Historical cash flows are not available as The Avenue Property (as defined below) was recently constructed in 2018. The 2018 NOI as of November 30, 2018 represents the lease up period. T-6 Ann. NOI, T-3 Ann. NOI and T-1 Ann. NOI represent the annualized income from June 2018 to November 2018, September 2018 to November 2018 and the month of November 2018, respectively, and reflect the trailing 12-month expenses ending November 30, 2018 and a 3.0% management fee. There is a gap in the historical financials after the loan sponsors’ acquisition in December 2018 as well as a change in financial reporting and therefore a more recent trailing 12-month period is unavailable. |
| (2) | For a full description of Escrows and Reserves, please refer to the “Escrows and Reserves” below. |
| (3) | Purchase Price is net of $367,961 in prorations. |
The Loan. The Avenue mortgage loan (“The Avenue Loan”) has an outstanding principal balance as of the Cut-off Date of $60.0 million and is secured by a first mortgage lien on the borrower’s fee interest in a newly-constructed, 394-unit multifamily property located in Davie, Florida (“The Avenue Property”). The Avenue Loan has a 10-year term and will be interest only for the entire term. The previously existing debt was not included in a securitization.
The Borrower. The borrowing entity is BP Avenue, LLC, a Delaware limited liability company and special purpose entity structured to be bankruptcy remote with two independent directors. Legal counsel to the borrower delivered a non-consolidation opinion in connection with the origination of The Avenue Loan.
THE INFORMATION IN THIS STRUCTURAL AND COLLATERAL TERM SHEET IS NOT COMPLETE AND MAY BE AMENDED PRIOR TO THE TIME OF SALE. THIS TERM SHEET IS NOT AN OFFER TO SELL THESE SECURITIES AND IT IS NOT A SOLICITATION OF AN OFFER TO BUY THESE SECURITIES IN ANY JURISDICTION WHERE THE OFFER OR SALE IS NOT PERMITTED.
32 of 116
| Structural and Collateral Term Sheet | JPMCC 2019-COR5 | |
| The Avenue | ||
The Loan Sponsors. The loan sponsors and nonrecourse carve-out guarantors are Adam G. Walker and Ira Gober, on a joint and several basis. Mr. Walker and Mr. Gober are co-founders of Boardwalk Properties (“Boardwalk”). Based in Miami, Florida, Boardwalk’s portfolio consists of more than 900 rental units within 50 multifamily residential buildings, all located in South Florida. Boardwalk’s primary objective is the acquisition, improvement, maintenance, and management of multifamily residential properties in the South Florida region.
The Property. The Avenue Property is a newly-constructed, 394-unit, Class A multifamily garden complex built in 2018 on a 14.92-acre site located just south of Interstate 595 and east of Davie Road in Davie, Broward County, Florida. The Avenue Property has visibility from Interstate 595 and State Road 84 with over 209,000 cars daily. The Avenue Property is designed with the residential units situated in six, three- and four-story buildings. There is a clubhouse and pool at the eastern end of The Avenue Property with a large central lawn and another pool area on the western side. There are four detached garage buildings along the northern end of The Avenue Property. The clubhouse is an 11,956 square foot three-story building with a cyber café and coffee bar, billiards, lounge area, demonstration kitchen and state of the art fitness center.
The Avenue Property includes 176 one-bedroom, 190 two-bedroom and 28 three-bedroom floor plans with an average unit size of 999 square feet. Unit amenities include quartz countertops, quartz bathroom vanities, full size front load washer and dryer, spacious balconies, laminate wood floors, walk in closets, and stainless-steel appliances, including side-by-side refrigerator, glass top range/oven, microwave and dishwasher.
The Market. According to a market report, The Avenue Property falls within the Plantation/Davie/Weston submarket within the Fort Lauderdale-Pompano Beach-Deerfield Beach, Florida metropolitan statistical area. Effective rent in the Plantation/Davie/Weston submarket increased 1.5% from $1,674 per unit per month in the fourth quarter of 2018 to $1,713 per unit per month in the first quarter of 2019. The submarket's occupancy rate increased from 94.7% in the fourth quarter of 2018 to 95.1% in the first quarter of 2019, while the submarket's occupancy rate has averaged 95.3% since the second quarter of 1996. As of 2018, the population within a one-, three- and five-mile radius was approximately 10,569, 104,691 and 368,152, respectively. The 2018 average household income within a one-, three- and five-mile radius was $70,518, $74,223 and $73,704, respectively.
During the last 12 months ending March 31, 2019, 2,610 units were absorbed in lease-up properties across the overall market with 225 units absorbed in the Plantation/Davie/Weston submarket. The average absorption rate for lease-up properties in the overall market was 16 units per property, per month while Plantation/Davie/Weston submarket's average absorption was 28 units per property, per month. The Plantation/Davie/Weston submarket's average asking rent for new lease-up properties was $2,028 per unit per month, or $2.00 per square foot.
The appraisal identified eight comparable multifamily properties proximate to The Avenue Property. The Avenue Property comparables range from 232 to 500 units and indicate a quoted rental range of $1,522 to $2,077 per month for one-bedroom units, $1,667 to $2,431 per month for two-bedroom units and $2,131 to $2,896 per month for three-bedroom units. The comparable properties had occupancies ranging from 90.0% to 98.0% with a weighted average occupancy of approximately 94.0%.
| Historical and Current Occupancy(1) | ||||
| 2016 | 2017 | 2018 | Current(2) | |
| N/A | N/A | N/A | 93.9% | |
| (1) | The Avenue Property was recently constructed in 2018 and therefore no historical occupancy information is available. |
| (2) | Current occupancy is as of April 29, 2019. |
| Multifamily Unit Mix(1) | |||||||||
| Unit Type | # of Units | % of Total | Occupied Units | Occupancy | Average Unit Size (SF) | Average Monthly Rental Rate | Average Monthly Rental Rate PSF | Average Monthly Market Rent | Average Monthly Market Rent PSF |
| 1 BR – 1 BA | 176 | 44.7% | 158 | 89.8% | 756 | $1,748 | $2.31 | $1,786 | $2.36 |
| 2 BR – 2 BA | 190 | 48.2% | 184 | 96.8% | 1,169 | $2,166 | $1.85 | $2,201 | $1.88 |
| 3 BR – 2 BA | 28 | 7.1% | 28 | 100.0% | 1,379 | $2,476 | $1.80 | $2,593 | $1.88 |
| Total / Wtd. Avg. | 394 | 100.0% | 370 | 93.9% | 999 | $2,011 | $2.01 | $2,043 | $2.04 |
| (1) | Based on the underwritten rent roll dated April 29, 2019. |
THE INFORMATION IN THIS STRUCTURAL AND COLLATERAL TERM SHEET IS NOT COMPLETE AND MAY BE AMENDED PRIOR TO THE TIME OF SALE. THIS TERM SHEET IS NOT AN OFFER TO SELL THESE SECURITIES AND IT IS NOT A SOLICITATION OF AN OFFER TO BUY THESE SECURITIES IN ANY JURISDICTION WHERE THE OFFER OR SALE IS NOT PERMITTED.
33 of 116
| Structural and Collateral Term Sheet | JPMCC 2019-COR5 | |
| The Avenue | ||
Operating History and Underwritten Net Cash Flow(1) | |||||||
| TTM(1) | Ann. T-6(2) | Ann. T-3(2) | Ann. T-1(2) | Underwritten | Per Unit | %(3) | |
| Rents in Place | $5,473,687 | $7,348,949 | $8,119,863 | $8,373,914 | $8,929,679 | $22,664 | 101.5% |
| Vacant Income | 0 | 0 | 0 | 0 | 540,192 | 1,371 | 6.1 |
| Gross Potential Rent | $5,473,687 | $7,348,949 | $8,119,863 | $8,373,914 | $9,469,871 | $24,035 | 107.6% |
| (Vacancy/Credit Loss) | 0 | 0 | 0 | 0 | (671,544) | (1,704) | (7.6)-- |
| Net Rental Income | $5,473,687 | $7,348,949 | $8,119,863 | $8,373,914 | $8,798,327 | $22,331 | 100.0% |
| Other Income(4) | 637,571 | 779,876 | 755,223 | 786,648 | 786,648 | 1,997 | 8.9% |
| Effective Gross Income | $6,111,258 | $8,128,825 | $8,875,087 | $9,160,563 | $9,584,976 | $24,327 | 108.9% |
| Total Expenses | $2,589,010 | $2,650,030 | $2,672,272 | $2,680,341 | $3,927,916 | $9,969 | 41.0% |
| Net Operating Income | $3,522,249 | $5,478,795 | $6,202,814 | $6,480,221 | $5,657,060 | $14,358 | 59.0% |
| Replacement Reserves | 0 | 0 | 0 | 0 | 118,200 | 300 | 1.2 |
| Net Cash Flow | $3,522,249 | $5,478,795 | $6,202,814 | $6,480,221 | $5,538,860 | $14,058 | 57.8% |
| (1) | Historical cash flows are not available as The Avenue Property was recently constructed in 2018. The TTM column represents the trailing 12-month period ending November 30, 2018 which was during The Avenue Property’s lease up period. There is a gap in the historical financials after the loan sponsors’ acquisition in December 2018 as well as a change in financial reporting and therefore a more recent trailing 12-month period is unavailable. |
| (2) | T-6 Ann. NOI, T-3 Ann. NOI and T-1 Ann. NOI represent the annualized income from June 2018 to November 2018, September 2018 to November 2018 and the month of November 2018, respectively, and reflect the trailing 12-month expenses ending November 30, 2018 and a 3.0% management fee. |
| (3) | % column represents percent of Net Rental Income for all revenue lines and represents percent of Effective Gross Income for the remainder of the fields. |
| (4) | Other Income includes laundry, vending, utility, parking and miscellaneous other income. |
Property Management.The Avenue Property is managed by Urban Resource, LLC, an affiliate of the borrower.
Escrows and Reserves. At origination, the borrower deposited into escrow $300,000 for real estate taxes and $25,000 for insurance premiums.
Tax Escrows– On a monthly basis,the borrower is required to escrow 1/12 of the annual estimated tax payments which currently equates to $141,100.
Insurance Escrows– On a monthly basis,the borrower is required to escrow 1/12 of the annual estimated insurance premiums which currently equates to $23,100.
Replacement Reserves –Commencing on the payment date in January 2021 and each payment date thereafter, the borrower is required to escrow $6,567 for replacement reserves.
Lockbox / Cash Management.The Avenue Loan is structured with a hard lockbox and in place cash management. All rents are required to be deposited directly by the tenants into a lockbox account controlled by the lender. All funds in the lockbox account are required to be swept to a lender-controlled cash management account every business day and applied on each payment date to the payment of debt service and the funding of required reserves. Provided no Cash Trap Period (as defined below) is continuing, all funds remaining in the cash management account after payment of the aforementioned items will be transferred into the borrower’s operating account. During a Cash Trap Period, all excess cash in the cash management account will be retained by the lender as additional collateral for The Avenue Loan.
A “Cash Trap Period” will commence (i) upon an event of default (including an event of default under the mezzanine loan) and end upon the cure of such event of default,provided that no other event of default is then continuing, (ii) if the debt yield is less than 6.25% (including the mezzanine loan) or if the debt yield of The Avenue Loan is less than 7.0%, in each case, from and after December 31, 2019 and for two consecutive quarters (until such time that the debt yield is greater than or equal to 6.25% (including the mezzanine loan) and the debt yield of The Avenue Loan is greater than or equal to 7.0% for two consecutive quarters), (iii) if the debt service coverage is less than 1.05x (including the mezzanine loan) or the debt service coverage ratio of The Avenue Loan is less than 1.25x from and after December 31, 2019 and for two consecutive quarters (until such time that the debt service coverage ratio is greater than or equal to 1.05x (including the mezzanine loan) and the debt service coverage for The Avenue Loan is greater than or equal to 1.25x for two consecutive quarters) or (iv) upon the death or incapacity of either of the loan sponsors (until acceptable replacement guarantors are in place).
Additional Debt. A mezzanine loan was funded concurrently and is coterminous with The Avenue Loan. The mezzanine loan has an original principal balance of $25,680,000, accrues interest at a rate of 7.50000%per annum, and is interest-only for the entire mezzanine
THE INFORMATION IN THIS STRUCTURAL AND COLLATERAL TERM SHEET IS NOT COMPLETE AND MAY BE AMENDED PRIOR TO THE TIME OF SALE. THIS TERM SHEET IS NOT AN OFFER TO SELL THESE SECURITIES AND IT IS NOT A SOLICITATION OF AN OFFER TO BUY THESE SECURITIES IN ANY JURISDICTION WHERE THE OFFER OR SALE IS NOT PERMITTED.
34 of 116
| Structural and Collateral Term Sheet | JPMCC 2019-COR5 | |
| The Avenue | ||
loan term. Including the mezzanine loan and The Avenues Loan, the cumulative Cut-off Date LTV, cumulative UW NCF DSCR and cumulative UW NOI DY are 71.4%, 1.11x and 6.6%, respectively. The mezzanine loan is currently held by LCM or an affiliate.
The Avenue Loan documents permit the mezzanine borrower, on or prior to December 21, 2023, to request an additional advance of mezzanine debt from LCM in an amount not to exceed the lesser of (a) $14,320,000 and (b) the amount (based on The Avenue Loan, the existing mezzanine loan and the new mezzanine debt) which would result in (x) a loan-to-value ratio that is no greater than 70.0% (y) a debt yield that is no less than 7.0% and (z) a debt service coverage ratio that is no less than 1.15x;provided that, among other things, the advance is secured by the same equity interests as the initial mezzanine loan. If LCM, in its sole discretion, elects not to fund the additional advance, The Avenue Loan documents permit the mezzanine borrower, on a date that is at least 120 days after the JPMCC 2019-COR5 closing date and on or prior to December 21, 2023, to enter into a new mezzanine loan with a mezzanine lender,provided that, among other things, (i) the existing mezzanine loan is paid in full, (ii) the new mezzanine loan is in a maximum principal amount that does not exceed the lesser of (a) $40,000,000 and (b) the amount which would result in, based on The Avenue Loan and the new mezzanine loan (x) a loan-to-value ratio that is no greater than 70.0% (y) a debt yield that is no less than 7.0% and (z) a debt service coverage ratio that is no less than 1.15x, (iii) rating agency confirmation is obtained and (iv) the new mezzanine lender has entered into an intercreditor agreement with LCM satisfactory in all respects to LCM and the rating agencies.
THE INFORMATION IN THIS STRUCTURAL AND COLLATERAL TERM SHEET IS NOT COMPLETE AND MAY BE AMENDED PRIOR TO THE TIME OF SALE. THIS TERM SHEET IS NOT AN OFFER TO SELL THESE SECURITIES AND IT IS NOT A SOLICITATION OF AN OFFER TO BUY THESE SECURITIES IN ANY JURISDICTION WHERE THE OFFER OR SALE IS NOT PERMITTED.
35 of 116
| Structural and Collateral Term Sheet | JPMCC 2019-COR5 | |
| 3 Columbus Circle | ||

THE INFORMATION IN THIS STRUCTURAL AND COLLATERAL TERM SHEET IS NOT COMPLETE AND MAY BE AMENDED PRIOR TO THE TIME OF SALE. THIS TERM SHEET IS NOT AN OFFER TO SELL THESE SECURITIES AND IT IS NOT A SOLICITATION OF AN OFFER TO BUY THESE SECURITIES IN ANY JURISDICTION WHERE THE OFFER OR SALE IS NOT PERMITTED.
36 of 116
| Structural and Collateral Term Sheet | JPMCC 2019-COR5 | |
| 3 Columbus Circle | ||

THE INFORMATION IN THIS STRUCTURAL AND COLLATERAL TERM SHEET IS NOT COMPLETE AND MAY BE AMENDED PRIOR TO THE TIME OF SALE. THIS TERM SHEET IS NOT AN OFFER TO SELL THESE SECURITIES AND IT IS NOT A SOLICITATION OF AN OFFER TO BUY THESE SECURITIES IN ANY JURISDICTION WHERE THE OFFER OR SALE IS NOT PERMITTED.
37 of 116
| Structural and Collateral Term Sheet | JPMCC 2019-COR5 | |
| 3 Columbus Circle | ||

THE INFORMATION IN THIS STRUCTURAL AND COLLATERAL TERM SHEET IS NOT COMPLETE AND MAY BE AMENDED PRIOR TO THE TIME OF SALE. THIS TERM SHEET IS NOT AN OFFER TO SELL THESE SECURITIES AND IT IS NOT A SOLICITATION OF AN OFFER TO BUY THESE SECURITIES IN ANY JURISDICTION WHERE THE OFFER OR SALE IS NOT PERMITTED.
38 of 116
| Structural and Collateral Term Sheet | JPMCC 2019-COR5 | |
| 3 Columbus Circle | ||
| Mortgage Loan Information | Property Information | |||
| Mortgage Loan Seller(1): | JPMCB | Single Asset / Portfolio: | Single Asset | |
| Credit Assessment | Title: | Fee | ||
| (Fitch / KBRA / S&P)(2): | BBB- / A / N/A | Property Type - Subtype: | Office – CBD | |
| Original Principal Balance(3): | $50,000,000 | Net Rentable Area (SF): | 753,713 | |
| Cut-off Date Principal Balance(3): | $50,000,000 | Location: | New York, NY | |
| % of Pool by IPB: | 7.2% | Year Built / Renovated: | 1927 / 2010-2013 | |
| Loan Purpose: | Refinance | Occupancy: | 97.2% | |
| Borrowers: | 3 Columbus Circle LLC, | Occupancy Date: | 1/1/2019 | |
| 3 Columbus Circle LLC - Series A, | Number of Tenants: | 40 | ||
| 3 Columbus Circle LLC - Series B | 2016 NOI: | $35,192,550 | ||
| Sponsor: | Joseph Moinian | 2017 NOI: | $34,698,749 | |
| Interest Rate: | 3.91400% | 2018 NOI(6): | $40,091,035 | |
| Note Date: | 3/12/2019 | TTM NOI | N/A | |
| Maturity Date: | 3/11/2029 | UW Economic Occupancy: | 97.9% | |
| Interest-only Period: | 120 months | UW Revenues: | $79,416,007 | |
| Original Term: | 120 months | UW Expenses: | $18,918,555 | |
| Original Amortization: | None | UW NOI(6): | $60,497,452 | |
| Amortization Type: | Interest Only | UW NCF: | $56,594,080 | |
| Call Protection(4): | L(27),Def(88),O(5) | Appraised Value / Per SF: | $1,080,000,000 / $1,433 | |
| Lockbox / Cash Management: | Hard / In Place | Appraisal Date: | 1/1/2019 | |
| Additional Debt(3)(5): | Yes | |||
| Additional Debt Balance(3)(5): | $440,000,000 / $105,000,000 | |||
| Additional Debt Type: | Pari Passu / Subordinate Debt | |||
| Escrows and Reserves(7) | Financial Information(3) | ||||||||||||||
| Initial | Monthly | Initial Cap | Senior Notes | Whole Loan | |||||||||||
| Taxes: | $0 | Springing | N/A | Cut-off Date Loan / SF: | $650 | $789 | |||||||||
| Insurance: | $0 | Springing | N/A | Maturity Date Loan / SF: | $650 | $789 | |||||||||
| Replacement Reserves: | $0 | Springing | $1,000,000 | Cut-off Date LTV: | 45.4% | 55.1% | |||||||||
| TI/LC: | $0 | Springing | $5,000,000 | Maturity Date LTV: | 45.4% | 55.1% | |||||||||
| Other: | $2,668,685 | Springing | $40,000,000 | UW NCF DSCR: | 2.91x | 2.40x | |||||||||
| UW NOI Debt Yield: | 12.3% | 10.2% | |||||||||||||
| |||||||||||||||
| Sources and Uses | |||||||||||||||
| Sources | Proceeds | % of Total | Uses | Proceeds | % of Total | ||||||||||
| Senior Notes | $490,000,000 | 80.5% | Payoff Existing Debt(8) | $371,671,992 | 61.1% | ||||||||||
| Subordinate Debt | 105,000,000 | 17.2 | Young & Rubicam Condo Purchase(9) | 215,600,000 | 35.4 | ||||||||||
| Sponsor Equity | 13,763,711 | 2.3 | Closing Costs | 18,823,034 | 3.1 | ||||||||||
| Upfront Reserves | 2,668,685 | 0.4 | |||||||||||||
| Total Sources | $608,763,711 | 100.0% | Total Uses | $608,763,711 | 100.0% | ||||||||||
| (1) | The 3 Columbus Circle Whole Loan (as defined below) was originated by JPMCB. JPMCB is contributing Note A-1-2-A, with an original principal balance of $50.0 million, to the JPMCC 2019-COR5 Trust. |
| (2) | Fitch and KBRA provided the listed assessments for the 3 Columbus Circle Loan (as defined below) in the context of its inclusion in the mortgage pool. S&P does not provide a credit assessment but confirmed that the 3 Columbus Circle Loan has, in the context of its inclusion in the mortgage pool, credit characteristics consistent with an investment grade obligation. |
| (3) | The 3 Columbus Circle Loan consists of the non-controlling Note A-1-2-A and is part of the 3 Columbus Circle Whole Loan evidenced by 15 seniorpari passu notes and two subordinate notes, with an aggregate outstanding principal balance as of the Cut-off Date of $595.0 million. For additional information, see “The Loan” below. |
| (4) | The lockout period will be at least 27 payments beginning with and including the first payment date of April 11, 2019. The borrowers have the option to defease the full $595.0 million 3 Columbus Circle Whole Loan after the earlier to occur of (i) two years after the closing date of the securitization that includes the last note to be securitized and (ii) the third anniversary of the first payment date. The assumed lockout period of 27 months is based on the expected closing date of the JPMCC 2019-COR5 securitization in June 2019. The actual lockout period may be longer. |
| (5) | See “Additional Debt" below. |
THE INFORMATION IN THIS STRUCTURAL AND COLLATERAL TERM SHEET IS NOT COMPLETE AND MAY BE AMENDED PRIOR TO THE TIME OF SALE. THIS TERM SHEET IS NOT AN OFFER TO SELL THESE SECURITIES AND IT IS NOT A SOLICITATION OF AN OFFER TO BUY THESE SECURITIES IN ANY JURISDICTION WHERE THE OFFER OR SALE IS NOT PERMITTED.
39 of 116
| Structural and Collateral Term Sheet | JPMCC 2019-COR5 | |
| 3 Columbus Circle | ||
| (6) | The increase in Underwritten NOI from 2018 NOI is primarily attributable to (i) an additional 214,372 square foot lease executed with Young & Rubicam, Inc. on floors three through eight, accounting for approximately $16.3 million in underwritten base rent and (ii) rent steps through January 2020 or average rent over the loan term for investment grade tenants. |
| (7) | For a full description of Escrows and Reserves, please refer to“Escrows and Reserves”below. |
| (8) | Includes approximately $21.7 million in defeasance costs. |
| (9) | In conjunction with loan origination, Moinian executed a sale leaseback of floors three through eight to Young & Rubicam, Inc. For additional information, see “The Property” below. |
The Loan.The 3 Columbus Circle mortgage loan (the “3 Columbus Circle Loan”) is part of a whole loan with an aggregate outstanding principal balance as of the Cut-off Date of $595.0 million (the “3 Columbus Circle Whole Loan”), secured by the borrowers’ fee simple interest in 21 condominium units in a 26-story, 753,713 square foot Class A office building located on Broadway between West 57th and 58th Streets in New York, New York (the “3 Columbus Circle Property”).The 3 Columbus Circle Whole Loan is comprised of (i) a senior loan, comprised of 15pari passunotes with an aggregate principal balance as of the Cut-off Date of $490.0 million (the “3 Columbus Circle Senior Notes”), one of which (Note A-1-2-1 with an outstanding principal balance as of the Cut-off Date of $50.0 million) is being contributed to the JPMCC 2019-COR5 Trust and constitutes the 3 Columbus Circle Loan, and the remainder of which have been, or are expected to be, contributed to other securitization trusts and (ii) a subordinate loan, comprised of twopari passunotes, with an aggregate outstanding principal balance as of the Cut-off Date of $105.0 million (collectively, the “3 Columbus Circle Subordinate Companion Loan”), each as described below.The relationship between the holders of the 3 Columbus Circle Senior Notes and 3 Columbus Circle Subordinate Companion Loan will be governed by a co-lender agreement as described under“Description of the Mortgage Pool—The Whole Loans—The Non-Serviced AB Whole Loans—The 3 Columbus Circle Whole Loan”in the Preliminary Prospectus. The 3 Columbus Circle Whole Loan has a 10-year term and will be interest-only for the term of the loan. The most recent prior financing of the 3 Columbus Circle Property was securitized in CGCMT 2015-GC29, COMM 2015-CCRE22, COMM 2015-CCRE23 and WFCM 2015-LC20.
| Whole Loan Summary | |||||
| Note | Original Balance | Cut-off Date Balance | Note Holder | Controlling Piece | |
| Note A-1-1 | $50,000,000 | $50,000,000 | Benchmark 2019-B10 | No | |
| Note A-1-2-A | 50,000,000 | 50,000,000 | JPMCC 2019-COR5 | No | |
| Note A-1-2-B | 25,000,000 | 25,000,000 | JPMCB | No | |
| Note A-1-3 | 75,000,000 | 75,000,000 | Benchmark 2019-B11 | No | |
| Note A-1-4 | 40,000,000 | 40,000,000 | JPMCB | No | |
| Note A-1-5 | 50,000,000 | 50,000,000 | CS | No | |
| Note A-1-6 | 35,000,000 | 35,000,000 | JPMCB | No | |
| Note A-1-7 | 25,000,000 | 25,000,000 | JPMCB | No | |
| Note A-1-8 | 17,500,000 | 17,500,000 | JPMCB | No | |
| Note A-2-1 | 25,000,000 | 25,000,000 | BMARK 2019-B10 | No | |
| Note A-2-2 | 25,000,000 | 25,000,000 | CF 2019-C1 | No | |
| Note A-2-3 | 25,000,000 | 25,000,000 | CF 2019-C1 | No | |
| Note A-2-4 | 25,000,000 | 25,000,000 | Benchmark 2019-B11 | No | |
| Note A-2-5-A | 12,500,000 | 12,500,000 | DBNY | No | |
| Note A-2-5-B | 10,000,000 | 10,000,000 | CCRE | No | |
| Senior Notes | $490,000,000 | $490,000,000 | |||
| Note B-1 | 51,450,000 | 51,450,000 | Benchmark 2019-B10 | Yes | |
| Note B-2 | 53,550,000 | 53,550,000 | Benchmark 2019-B10 | No | |
| Whole Loan | $595,000,000 | $595,000,000 | |||
The Borrowers.The borrowers are 3 Columbus Circle LLC – Series A, 3 Columbus Circle LLC – Series B (each a “series” of 3 Columbus Circle LLC formed under the Delaware General Corporation Law) and 3 Columbus Circle LLC, a Delaware limited liability company. Each borrower is structured to be a single purpose bankruptcy-remote entity with 3 Columbus Circle LLC having two independent directors in its organizational structure. Two of the borrowers, 3 Columbus Circle LLC – Series A and 3 Columbus Circle LLC – Series B, own a portion of the 3 Columbus Circle Property as tenants-in-common. For additional information, please see “Description of the Mortgage Pool—Mortgage Pool Characteristics—Tenancies-in-Common or Diversified Ownership” in the Preliminary Prospectus. Legal counsel to the borrowers delivered a non-consolidation opinion in connection with the origination of the 3 Columbus Circle Whole Loan.
THE INFORMATION IN THIS STRUCTURAL AND COLLATERAL TERM SHEET IS NOT COMPLETE AND MAY BE AMENDED PRIOR TO THE TIME OF SALE. THIS TERM SHEET IS NOT AN OFFER TO SELL THESE SECURITIES AND IT IS NOT A SOLICITATION OF AN OFFER TO BUY THESE SECURITIES IN ANY JURISDICTION WHERE THE OFFER OR SALE IS NOT PERMITTED.
40 of 116
| Structural and Collateral Term Sheet | JPMCC 2019-COR5 | |
| 3 Columbus Circle | ||
The Loan Sponsor.The borrower sponsor and nonrecourse carve-out guarantor is Joseph Moinian, the key principal of The Moinian Group (“Moinian”). Founded in 1982, Moinian is a private real estate acquisition, ownership, development and management company. Joseph Moinian is the nonrecourse carve-out guarantor for the 3 Columbus Circle Whole Loan. Moinian has acquired commercial properties throughout the country, focusing on major cities such as New York, Chicago, Dallas and Los Angeles. Moinian develops, owns and operates properties across every asset category, including office, hotel, retail, condos and rental apartments. Notable New York City investments include the Oskar, The Sky, 17 Battery North & South and 535-545 Fifth Avenue, with a portfolio of more than 20.0 million square feet.
The Property.The 3 Columbus Circle Property is a Class A, 26-story, 753,713 square foot office building with ground floor retail located in the Midtown neighborhood of Manhattan, New York. The 3 Columbus Circle Property occupies the entire city block bounded by Broadway, Eighth Avenue, West 57th Street and West 58th Street, and features panoramic views of Central Park, the Hudson River and New York City. The 3 Columbus Circle Property serves as the national headquarters for its largest tenant, Young & Rubicam, Inc. (“Young & Rubicam”) (49.8% of net rentable area; rated BBB+/BBB by Fitch and S&P), and approximately 72.0% and 78.8% of net rentable area and underwritten base rent, respectively, is leased to investment grade tenants, including Nordstrom’s, CVS Pharmacy, Chase Bank, Versace and AT&T among others.
The 3 Columbus Circle Property’s bottom five floors were originally constructed in 1904 and underwent a 22-story expansion by Shreve, Lamb and Harmon in 1927, the architectural firm behind the Empire State Building. From 2010 to 2013, the 3 Columbus Circle Property underwent an approximately $82.5 million building-wide renovation, including an approximately $44.0 million energy-efficient glass façade surrounding the building’s original foundation. In addition to the façade, the lobby received an approximately $1.0 million expansion and renovation that widened the existing entrance on Broadway and replaced the existing lobby walls with 12-foot glass walls. The retail space received approximately $3.0 million in capital improvements, including floor-to-ceiling windows and fully redesigned restrooms. The 3 Columbus Circle Property features modern building systems, 12 passenger elevators, a loading dock and office terraces on multiple floors. The 3 Columbus Circle Property has earned Energy Star designation and LEED Silver certification.
Moinian acquired the 3 Columbus Circle Property in 2004 for approximately $250 million. In 2011, when the 3 Columbus Circle Property was 33.3% occupied, Moinian sold a 48.9% interest in the building to SL Green, and together, Moinian and SL Green began an extensive multi-year redevelopment plan to reposition the 3 Columbus Circle Property to a Class A asset. In 2012, while the redevelopment was underway, a 214,372 square foot condominium interest which covers floors three through eight was sold to Young & Rubicam for approximately $143.6 million. Renovations were completed in 2013, and the 3 Columbus Circle Property was leased up to 97.2% as of January 1, 2019. In 2018, Moinian repurchased SL Green’s interest in the 3 Columbus Circle Property for $227.5 million, and, in conjunction with the closing of the 3 Columbus Circle Whole Loan, Moinian repurchased Young & Rubicam’s condominium interest for $215.6 million. In conjunction with repurchase of the Young & Rubicam condominium interest, a new lease to Young & Rubicam was simultaneously executed for the space with an initial base rent set at $76.00 per square foot and a lease expiration of July 2033.
The 3 Columbus Circle Property is located in the Midtown West office submarket, proximate to other prominent buildings in Columbus Circle including the Time Warner Center and the Museum of Arts and Design. Nordstrom’s women’s store is expected to open in 2019 across the street at Central Park Tower. The Columbus Circle neighborhood benefits from nearby attractions including Central Park, Rockefeller Center, Radio City Music Hall, Lincoln Center for the Performing Arts and the Museum of Modern Art. In particular, the 3 Columbus Circle Property benefits from its location on Broadway, which is a major artery connecting the southern tip of Manhattan to Upper Manhattan. The 3 Columbus Circle Property’s frontage along Broadway, 8th Avenue, West 57th Street and West 58th Street provides its retail tenants with access to the pedestrian traffic in the area. The 3 Columbus Circle Property is accessible by public transportation with three subway lines within one block, New York Penn Station within an eight minute drive and LaGuardia Airport within a 21 minute drive.
As of January 1, 2019, the 3 Columbus Circle Property was 97.2% leased to a diversified roster of 40 tenants, including a mix of 32 office tenants, five telecom tenants and three investment grade retail tenants. The 3 Columbus Circle Property’s ten largest tenants occupy approximately 610,518 square feet (81.0% of net rentable area) and have a weighted average remaining lease term of approximately 13.0 years.
The largest tenant, Young & Rubicam (375,236 square feet; 49.8% of NRA; 39.9% of Underwritten Base Rent), a subsidiary of WPP (LSE: WPP) (rated BBB+/BBB by Fitch and S&P), is a marketing and communications company specializing in advertising, digital and social media, sales promotion, direct marketing and brand identity consulting. Young & Rubicam’s clients include a variety of companies including Campbell’s Soup Company, Colgate-Palmolive, Virgin Atlantic, Revlon, LG and Land Rover. Founded in 1923 and headquartered at the 3 Columbus Circle Property, Young & Rubicam has more than 190 offices in 95 countries. WPP is a global company in communications, commerce and technology services with over 150 companies. As of 2017, WPP reported £15.3 billion in revenue. Young & Rubicamhas occupied the 3 Columbus Circle Property since 2012 and currently occupies floors 9, 10, 11, 18 and 19 through August 2033 and its condominium interest through July 2033, both with two, ten-year renewal options.
THE INFORMATION IN THIS STRUCTURAL AND COLLATERAL TERM SHEET IS NOT COMPLETE AND MAY BE AMENDED PRIOR TO THE TIME OF SALE. THIS TERM SHEET IS NOT AN OFFER TO SELL THESE SECURITIES AND IT IS NOT A SOLICITATION OF AN OFFER TO BUY THESE SECURITIES IN ANY JURISDICTION WHERE THE OFFER OR SALE IS NOT PERMITTED.
41 of 116
| Structural and Collateral Term Sheet | JPMCC 2019-COR5 | |
| 3 Columbus Circle | ||
The second largest tenant, Emerge 212 3CC LLC (57,359 square feet; 7.6% of NRA; 4.7% of Underwritten Base Rent) (“Emerge212”), a subsidiary of SL Green Realty Corp. (NYSE: SLG) (rated Baa3/BBB/BBB- by Moody’s, Fitch and S&P), was founded in 1999 and is an operator of full-service office suites. Emerge212 provides fully-furnished, privately leased, flexible office space, providing tenants the ability to grow and contract along with business needs. In addition to office space, tenants receive full-service amenities such as cafe areas, charging stations, conference rooms and event space. Emerge212 is located exclusively in New York with locations at 3 Columbus Circle, 125 Park Avenue and 1185 Avenue of the Americas. SL Green Realty Corp. is a self-managed real estate investment trust and a large commercial landlord in New York City. As of 2017, SL Green Corp. reported approximately $1.5 billion in total revenue and approximately $14.0 billion in total assets. Emerge212 currently occupies floors 15 and 16 through November 2027 and licenses its space as shared workspace.
The third largest tenant, Nordstrom (46,991 square feet; 6.2% of NRA; 19.6% of U/W Base Rent) (rated Baa1/BBB+/BBB+ by Moody’s, Fitch and S&P) (NYSE: JWN) is one of the nation’s largest upscale apparel and shoe retailers, serving customers through multiple retail channels, discount stores, boutiques, catalogs and the Internet. The store at the 3 Columbus Circle Property serves as Nordstrom’s first men’s store and its first store in Manhattan. Nordstrom is expected to open its flagship women’s store across the street at Central Park Tower in fall 2019. In addition to its online business, which reaches 96 countries, Nordstrom operates 379 U.S. stores in 40 states as well as six Nordstrom stores in Canada. As of fiscal year ended February 3, 2018, Nordstrom reported approximately $15.1 billion in net sales and approximately $8.1 billion in total assets. Nordstrom occupies the largest retail space on the ground floor as well as space on the second floor through October 2039 and has two, ten-year renewal options.
The 3 Columbus Circle Property is located in Manhattan, New York, in the Midtown Westsubmarket within the greater Midtown office market. The Midtown West submarket contains approximately 31.0 million square feet of office inventory and is bordered by 72nd Street to the north, 42nd Street to the south, Seventh Avenue to the east and the Hudson River to the west. New York City’s largest employers include a diverse group of multinational corporations representing a variety of industries including healthcare, financial services, retail and education. 58 of the nation’s Fortune 500 corporations are headquartered in the New York Region including Verizon, J.P. Morgan Chase, Citigroup, IBM, MetLife, PepsiCo, American International Group, Morgan Stanley, New York Life Insurance, Goldman Sachs Group, TIAA, American Express and Time Warner.
As of the fourth quarter of 2018, the greater Midtown Class A office market consisted of approximately 181.1 million square feet of office space with an overall market vacancy of 9.3% and average asking rents of approximately $75.03 per square foot. The Midtown West Class A submarket totaled approximately 24.5 million square feet with average vacancy of 6.9% and average market asking rents of $76.87 per square foot. The overall Midtown office market achieved 23.7 million square feet in leasing activity in 2018 with overall and direct absorption levels totaling 7.3 million square feet and 8.1 million square feet, respectively.
The appraisal identified seven directly competitive Class A office rent comparables in the Midtown West submarket. Comparable buildings were built between 1950 and 2009 and range in size from 242,505 square feet to 790,000 square feet. Direct asking rents at the comparable properties ranged between $65.00 and $108.00 per square foot with a weighted average of approximately $82.47 per square foot. The 3 Columbus Circle Property’s in-place weighted average office rent is $71.11 per square foot, which compares favorably to the Appraisal’s Concluded Office Market Rent, which ranges from $77.00 per square foot to $100.00 per square foot, broken out by floor in the table below.
| Summary of Appraisal’s Concluded Office Market Rent(1) | |
| Floor(s) | Appraisal’s Concluded Office Market Rent PSF |
| 3, 5-15 | $77.00 |
| 4 | $80.00 |
| 16-18 | $85.00 |
| 19, 23-24 | $93.00 |
| 20-22 | $90.00 |
| 25-26 | $100.00 |
| (1) | Source: Appraisal. |
The appraisal identified five comparable retail spaces in the Manhattan market with rents ranging from $215.00 to $500.00 per square foot for grade space with a weighted average rent of approximately $338.58 per square foot. The 3 Columbus Circle Property’s in-place weighted average retail rent is $259.02 per square foot, which is above the appraisal’s concluded market rent of $194.51 per square foot.
THE INFORMATION IN THIS STRUCTURAL AND COLLATERAL TERM SHEET IS NOT COMPLETE AND MAY BE AMENDED PRIOR TO THE TIME OF SALE. THIS TERM SHEET IS NOT AN OFFER TO SELL THESE SECURITIES AND IT IS NOT A SOLICITATION OF AN OFFER TO BUY THESE SECURITIES IN ANY JURISDICTION WHERE THE OFFER OR SALE IS NOT PERMITTED.
42 of 116
| Structural and Collateral Term Sheet | JPMCC 2019-COR5 | |
| 3 Columbus Circle | ||
| Historical Occupancy(1) | ||||
| 2016 | 2017 | 2018 | Current(2) | |
| Occupancy | 98.4% | 91.9% | 98.0% | 97.2% |
| (1) | Historical occupancies are as of December 31 of each respective year. |
| (2) | Current Occupancy is based on the January 1, 2019 rent roll. |
| Tenant Summary(1) | |||||||
| Tenant | Type | Ratings Moody’s/Fitch/S&P(2) | Net Rentable Area (SF) | % of Total NRA | Base Rent PSF(3) | % of Total Base Rent | Lease Expiration Date |
| Young & Rubicam, Inc.(4) | Office | NR / BBB+ / BBB | 375,236 | 49.8% | $72.06 | 39.9% | Various |
| Emerge 212 3CC LLC | Office | Baa3 / BBB / BBB- | 57,359 | 7.6 | $55.00 | 4.7 | 11/30/2027 |
| Nordstrom(5) | Retail | Baa1 / BBB+ / BBB+ | 46,991 | 6.2 | $282.15 | 19.6 | 10/31/2039 |
| Jazz at Lincoln Center, Inc. | Office | NR / NR / NR | 30,653 | 4.1 | $52.00 | 2.4 | 4/30/2028 |
| Josephson(6) | Office | NR / NR / NR | 22,742 | 3.0 | $100.00 | 3.4 | 12/31/2032 |
| Versace USA, Inc. | Office | NR / BBB- / BBB- | 21,342 | 2.8 | $75.00 | 2.4 | 7/31/2025 |
| CVS Caremark Pharmacy | Retail | Baa2 / NR / BBB | 21,159 | 2.8 | $193.20 | 6.0 | 7/31/2028 |
| Trustees of Columbia(7) | Office | Aaa / NR / AAA | 14,162 | 1.9 | $77.77 | 1.6 | 8/31/2025 |
| Cohen and Company LLC | Office | NR / NR / NR | 11,166 | 1.5 | $83.00 | 1.4 | 2/28/2029 |
| Laura & John Arnold(8) | Office | NR / NR / NR | 9,708 | 1.3 | $56.00 | 0.8 | 7/31/2025 |
| Total Major Office and Retail | 610,518 | 81.0% | $91.04 | 82.0% | |||
| Other Occupied Office and Retail(9) | 121,646 | 16.1 | $99.39 | 17.8 | |||
| Total Occupied Office and Retail | 732,164 | 97.1% | $92.43 | 99.9% | |||
| Telecom | 218 | 0.1 | $328.03 | 0.1 | |||
| Total Occupied | 732,382 | 97.2% | $92.50 | 100.0% | |||
| Vacant(10) | 21,331 | 2.8 | |||||
| Total | 753,713 | 100.0% | |||||
| (1) | Based on the underwritten rent roll dated January 1, 2019. |
| (2) | In certain instances, ratings provided are those of the parent company of the entity shown, whether or not the parent company guarantees the lease. |
| (3) | Base Rent PSF includes rent steps through January 2020 and average rent over the loan term for investment grade tenants, including Young & Rubicam, Inc., Emerge 212 3CC LLC, Nordstrom, CVS Caremark Pharmacy, Chase Bank, Trustees of Columbia and AT&T Corp. |
| (4) | Young & Rubicam, Inc. leases 375,236 square feet, of which (i) 214,372 square feet is leased for $76.00 per square foot and is set to expire July 3033, (ii) 124,760 square feet is leased for $68.60 per square foot and is set to expire August 2033, (iii) 34,634 square feet is leased for $62.00 per square foot and is set to expire in August 2033 and (iv) 1,300 square feet is leased for $32.50 per square foot and is set to expire in August 2033. |
| (5) | Nordstrom leases 46,991 square feet, of which (i) 43,018 square feet is leased for $241.25 per square foot and (ii) 3,973 square feet is leased for $725.00 per square foot. |
| (6) | Josephson is an affiliate of the borrowers and its leased space serves as headquarters for affiliates of the borrowers. |
| (7) | Trustees of Columbia leases 14,162 square feet, of which (i) 6,031 square feet is leased for $76.53 per square foot, (ii) 5,020 square feet is leased for $78.79 per square foot and (iii) 3,111 square feet is leased for $78.51 per square foot. |
| (8) | Laura & John Arnold has the right to cancel its lease at the end of any month occurring between March 1, 2020 and March 1, 2023, with no less than nine months’ prior notice and the payment of a termination fee. |
| (9) | Other Occupied Office and Retail is inclusive of a 2,831 square foot management office with no attributable underwritten base rent. Subleases account for 20,015 square feet (2.7% of net rentable area). |
| (10) | Vacant space includes 21,231 square feet of office space and 100 square feet of storage space. |
THE INFORMATION IN THIS STRUCTURAL AND COLLATERAL TERM SHEET IS NOT COMPLETE AND MAY BE AMENDED PRIOR TO THE TIME OF SALE. THIS TERM SHEET IS NOT AN OFFER TO SELL THESE SECURITIES AND IT IS NOT A SOLICITATION OF AN OFFER TO BUY THESE SECURITIES IN ANY JURISDICTION WHERE THE OFFER OR SALE IS NOT PERMITTED.
43 of 116
| Structural and Collateral Term Sheet | JPMCC 2019-COR5 | |
| 3 Columbus Circle | ||
Lease Rollover Schedule(1)(2) | |||||||||||
| Year | Number of Leases Expiring | Net Rentable Area Expiring | % of NRA Expiring | Base Rent Expiring | % of Base Rent Expiring | Cumulative Net Rentable Area Expiring | Cumulative % of NRA Expiring | Cumulative Base Rent Expiring | Cumulative % of Base Rent Expiring | ||
| Vacant | NAP | 21,331 | 2.8% | NAP | NAP | 21,331 | 2.8% | NAP | NAP | ||
| MTM & 2019 | 0 | 0 | 0.0% | $0 | 0.0% | 21,331 | 2.8% | $0 | 0.0% | ||
| 2020 | 5 | 18,655 | 2.5% | 1,463,746 | 2.2% | 39,986 | 5.3% | $1,463,746 | 2.2% | ||
| 2021 | 5 | 19,013 | 2.5% | 1,584,749 | 2.3% | 58,999 | 7.8% | $3,048,495 | 4.5% | ||
| 2022 | 3 | 7,861 | 1.0% | 686,928 | 1.0% | 66,860 | 8.9% | $3,735,423 | 5.5% | ||
| 2023 | 5 | 18,327 | 2.4% | 1,483,170 | 2.2% | 85,187 | 11.3% | $5,218,593 | 7.7% | ||
| 2024 | 3 | 14,518 | 1.9% | 1,201,163 | 1.8% | 99,705 | 13.2% | $6,419,756 | 9.5% | ||
| 2025 | 5 | 60,820 | 8.1% | 4,494,341 | 6.6% | 160,525 | 21.3% | $10,914,097 | 16.1% | ||
| 2026 | 1 | 6,190 | 0.8% | 520,827 | 0.8% | 166,715 | 22.1% | $11,434,923 | 16.9% | ||
| 2027 | 1 | 57,359 | 7.6% | 3,154,745 | 4.7% | 224,074 | 29.7% | $14,589,668 | 21.5% | ||
| 2028 | 3 | 57,235 | 7.6% | 6,142,196 | 9.1% | 281,309 | 37.3% | $20,731,865 | 30.6% | ||
| 2029 and Thereafter(3) | 13 | 472,404 | 62.7% | 47,012,117 | 69.4% | 753,713 | 100.0% | $67,743,982 | 100.0% | ||
| Total | 44 | 753,713 | 100.0% | $67,743,982 | 100.0% | ||||||
| (1) | Based on the underwritten rent roll dated January 1, 2019. |
| (2) | Certain tenants may have termination or contraction options (which may become exercisable prior to the originally stated expiration date of the tenant lease) that are not considered in the above Lease Rollover Schedule. |
| (3) | 2029 and Thereafter is inclusive of a 2,831 square foot management office and a 3,021 square foot storage space that have no underwritten rent. |
| Operating History and Underwritten Net Cash Flow(1) | |||||||
| 2015 | 2016 | 2017 | 2018 | Underwritten | Per Square Foot | %(2) | |
| Base Rent(3) | $35,696,175 | $41,873,116 | $43,763,738 | $48,360,889 | $71,913,647 | $95.41 | 88.8% |
| Vacant Income | 0 | 0 | 0 | 0 | 1,977,018 | 2.62 | 2.4 |
| Gross Potential Rent | $35,696,175 | $41,873,116 | $43,763,738 | $48,360,889 | $73,890,665 | $98.04 | 91.2% |
| Total Reimbursements | 3,840,772 | 2,954,447 | 3,436,707 | 4,969,121 | 7,102,216 | 9.42 | 8.8 |
| Total Other Income(4) | 4,797,805 | 5,333,639 | 3,752,429 | 3,994,225 | 10,130 | 0.01 | 0.0 |
| Net Rental Income | $44,334,752 | $50,161,202 | $50,952,874 | $57,324,235 | $81,003,011 | $107.47 | 100.0% |
| (Vacancy/Credit Loss) | 0 | 0 | 0 | 0 | (1,587,003) | (2.11) | (2.0) |
| Effective Gross Income | $44,334,752 | $50,161,202 | $50,952,874 | $57,324,235 | $79,416,007 | $105.37 | 100.0% |
| Total Fixed Expenses | 7,341,633 | 7,763,377 | 8,781,856 | 9,797,054 | 10,509,084 | 13.94 | 13.2 |
| Total Operating Expenses | 7,370,199 | 7,205,275 | 7,472,268 | 7,436,146 | 8,409,471 | 11.16 | 10.6 |
| Net Operating Income(5) | $29,622,920 | $35,192,550 | $34,698,749 | $40,091,035 | $60,497,452 | $80.27 | 76.2% |
| TI/LC | 0 | 0 | 0 | 0 | 3,752,630 | 4.98 | 4.7 |
| Capital Expenditures | 0 | 0 | 0 | 0 | 150,743 | 0.20 | 0.2 |
| Net Cash Flow | $29,622,920 | $35,192,550 | $34,698,749 | $40,091,035 | $56,594,080 | $75.09 | 71.3% |
| (1) | Based on the underwritten rent roll dated January 1, 2019. |
| (2) | % column represents percent of Net Rental Income for all revenue lines and represents percent of Effective Gross Income for the remainder of the fields. |
| (3) | Underwritten Base Rent is inclusive of rent steps through January 2020 and straight line rent for investment grade tenants over the loan term, accounting for approximately $4.2 million in Underwritten Base Rent. Historic base rent does not include rent from Young & Rubicam. |
| (4) | Total Other Income from 2015 to 2018 included a condominium charge to Young & Rubicam for its share in building expenses. Underwritten rent reflects Young & Rubicam paying reimbursements under its lease. |
| (5) | The increase in Underwritten NOI from 2018 NOI is primarily attributable to (i) an additional 214,372 square feet lease executed with Young & Rubicam on floors three through eight, accounting for approximately $16.3 million in underwritten base rent and (ii) rent steps through January 2020. |
Property Management.The 3 Columbus Circle Property is managed by Columbus Property Management LLC, a New York limited liability company and an affiliate of the borrowers.
Escrows and Reserves.At loan origination, the borrowers deposited (i) approximately $1,820,891 into an outstanding tenant improvements and leasing commission reserve in connection with three leases and (ii) approximately $847,794 into a free rent reserve in connection with four leases.
THE INFORMATION IN THIS STRUCTURAL AND COLLATERAL TERM SHEET IS NOT COMPLETE AND MAY BE AMENDED PRIOR TO THE TIME OF SALE. THIS TERM SHEET IS NOT AN OFFER TO SELL THESE SECURITIES AND IT IS NOT A SOLICITATION OF AN OFFER TO BUY THESE SECURITIES IN ANY JURISDICTION WHERE THE OFFER OR SALE IS NOT PERMITTED.
44 of 116
| Structural and Collateral Term Sheet | JPMCC 2019-COR5 | |
| 3 Columbus Circle | ||
Tax Reserve. The borrowers are required to deposit into a real estate tax reserve, on a monthly basis, 1/12 of the estimated annual real estate taxes. In the event the borrowers provide evidence reasonably satisfactory to the lender that all taxes and other charges have been paid prior to the related due date and there is no event of default continuing, the requirement for monthly deposits into the tax reserve will be waived.
Insurance Reserve. The borrowers are required to deposit into an insurance reserve, on a monthly basis, 1/12 of estimated insurance premiums. In the event the borrowers obtain and maintain a blanket insurance policy acceptable to the lender and there is no event of default continuing, the requirement for monthly deposits into the insurance reserve will be waived.
Replacement Reserve. During the continuance of a Cash Sweep Event (as defined below), the borrowers are required to deposit into a replacement reserve, on a monthly basis, an amount equal to $12,500 for replacement reserves (approximately $0.20 per square foot annually), subject to a cap of $1,000,000 (approximately $1.33 per square foot).
TI/LC Reserve. During the continuance of a Cash Sweep Event, the borrowers are required to deposit into a TI/LC reserve, on a monthly basis, an amount equal to $62,900 for tenant improvement and leasing commission obligations (approximately $1.00 per square foot annually), subject to a cap of $5,000,000 (approximately $6.63 per square foot).
Young & Rubicam Reserve. During the continuance of a Cash Sweep Event caused by a Tenant Trigger (as defined below), the borrowers are required to deposit into a Young & Rubicam reserve an amount equal to all excess cash flow in the cash management account to cover expenses anticipated to be incurred in connection with re-leasing the Young & Rubicam space, subject to a cap of $40,000,000 (approximately $106.60 per square foot of Young & Rubicam space).
Lockbox / Cash Management. The 3 Columbus Circle Whole Loan is structured with a hard lockbox and in place cash management. The borrowers were required at origination to deliver tenant direction letters instructing all tenants to deposit rents into a lockbox account controlled by the lender. All funds in the lockbox account are required to be swept each business day into a cash management account controlled by the lender and disbursed on each payment date in accordance with the loan documents. All funds on deposit in the cash management account following the occurrence and during the continuance of a Cash Sweep Event following payment of debt service, required reserves and operating expenses are required to be deposited into the Young & Rubicam reserve or, to the extent the Cash Sweep Event is caused by a DSCR Trigger Event (as defined below), into the excess cash flow reserve, and in each case to be held and disbursed in accordance with the terms of the loan documents. During the continuance of an event of default, the lender may apply such funds in such order and priority as the lender determines. The lender has been granted a first priority security interest in the cash management account.
A “Cash Sweep Event” means the occurrence and continuation of (i) an event of default, (ii) any bankruptcy action of the borrowers or property manager, (iii) a DSCR Trigger Event (as defined below) or (iv) a Tenant Trigger (as defined below).
A Cash Sweep Event may be cured in accordance with the following conditions: with respect to a Cash Sweep Event caused solely by (a) clause (i) above, the acceptance of a cure by the lender of the related event of default, (b) clause (ii) above if the borrowers have replaced the manager with a qualified manager under a replacement management agreement within 90 days in accordance with the loan documents, (c) clause (iii) above, a DSCR Cure Event (as defined below) has taken place, (d) clause (iv) above, if the Cash Sweep Event is caused solely by the occurrence of (x) a Tenant BK Trigger (as defined below), Young & Rubicam or its parent company affirming the Young & Rubicam lease in the applicable bankruptcy proceeding, (y) a Tenant Vacancy Trigger (as defined below), the replacement of Young & Rubicam with an acceptable replacement tenant pursuant to lease(s) approved in accordance with the terms of the loan documents and such tenant has accepted possession of its premises under the lease(s), with all tenant improvement costs and free rent amounts reserved with the lender, or (z) any Tenant Trigger, upon the satisfaction of the Tenant Escrow Requirement (as defined below) (in which case, the borrowers are deemed to have cured any existing Tenant Trigger immediately upon such date). Each cure is also subject to the following conditions: (1) no other event of default may have occurred and be continuing; and (2) the borrowers pay the lender’s reasonable expenses in connection with such cure. Notwithstanding the foregoing, in no event will the borrowers have the right to cure a Cash Sweep Event occurring from a borrower bankruptcy.
“DSCR Trigger Event” means the debt service coverage ratio on the 3 Columbus Circle Whole Loan (as calculated in the loan documents) based on the trailing three-month period immediately preceding the date of determination is less than 1.30x.
“DSCR Cure Event” means the debt service coverage ratio on the 3 Columbus Circle Whole Loan (as calculated in the loan documents), based on the trailing three-month period immediately preceding the date of determination, is at least 1.30x for two consecutive quarters.
“Tenant Trigger” means either (i) a bankruptcy or certain insolvency actions of Young & Rubicam or its parent company (a “Tenant BK Trigger”) or (ii) if Young & Rubicam vacates, abandons or “goes dark” in 85% or more of its leased space (and no sub-tenant is then in occupancy of any of the space) (a “Tenant Vacancy Trigger”).
THE INFORMATION IN THIS STRUCTURAL AND COLLATERAL TERM SHEET IS NOT COMPLETE AND MAY BE AMENDED PRIOR TO THE TIME OF SALE. THIS TERM SHEET IS NOT AN OFFER TO SELL THESE SECURITIES AND IT IS NOT A SOLICITATION OF AN OFFER TO BUY THESE SECURITIES IN ANY JURISDICTION WHERE THE OFFER OR SALE IS NOT PERMITTED.
45 of 116
| Structural and Collateral Term Sheet | JPMCC 2019-COR5 | |
| 3 Columbus Circle | ||
“Tenant Escrow Requirement” means the balance of the Young & Rubicam reserve has reached the cap of $40,000,000.
Additional Debt. The 3 Columbus Circle Subordinate Companion Loan, with an aggregate outstanding principal balance as of the Cut-off Date of $105.0 million, accrues interest at a fixed rate of 3.91400%per annum. The 3 Columbus Circle Subordinate Companion Loan has a 120-month term and is interest only for the full term. For additional information, see“Description of the Mortgage Pool—The Whole Loans—The Non-Serviced AB Whole Loans—The 3 Columbus Circle Whole Loan”in the Preliminary Prospectus.
Partial Release.None.
THE INFORMATION IN THIS STRUCTURAL AND COLLATERAL TERM SHEET IS NOT COMPLETE AND MAY BE AMENDED PRIOR TO THE TIME OF SALE. THIS TERM SHEET IS NOT AN OFFER TO SELL THESE SECURITIES AND IT IS NOT A SOLICITATION OF AN OFFER TO BUY THESE SECURITIES IN ANY JURISDICTION WHERE THE OFFER OR SALE IS NOT PERMITTED.
46 of 116
| Structural and Collateral Term Sheet | JPMCC 2019-COR5 | |
| Hampton Roads Office Portfolio | ||

THE INFORMATION IN THIS STRUCTURAL AND COLLATERAL TERM SHEET IS NOT COMPLETE AND MAY BE AMENDED PRIOR TO THE TIME OF SALE. THIS TERM SHEET IS NOT AN OFFER TO SELL THESE SECURITIES AND IT IS NOT A SOLICITATION OF AN OFFER TO BUY THESE SECURITIES IN ANY JURISDICTION WHERE THE OFFER OR SALE IS NOT PERMITTED.
47 of 116
| Structural and Collateral Term Sheet | JPMCC 2019-COR5 | |
| Hampton Roads Office Portfolio | ||

THE INFORMATION IN THIS STRUCTURAL AND COLLATERAL TERM SHEET IS NOT COMPLETE AND MAY BE AMENDED PRIOR TO THE TIME OF SALE. THIS TERM SHEET IS NOT AN OFFER TO SELL THESE SECURITIES AND IT IS NOT A SOLICITATION OF AN OFFER TO BUY THESE SECURITIES IN ANY JURISDICTION WHERE THE OFFER OR SALE IS NOT PERMITTED.
48 of 116
| Structural and Collateral Term Sheet | JPMCC 2019-COR5 | |
| Hampton Roads Office Portfolio | ||
| Mortgage Loan Information | Property Information | |||
| Mortgage Loan Seller: | LCM | Single Asset / Portfolio: | Portfolio | |
| Original Principal Balance(1): | $50,000,000 | Title: | Fee | |
| Cut-off Date Principal Balance(1): | $49,901,186 | Property Type - Subtype: | Office – Suburban | |
| % of Pool by IPB: | 7.1% | Net Rentable Area (SF): | 1,322,003 | |
| Loan Purpose: | Acquisition | Location: | Various, VA | |
| Borrowers(2): | Various | Year Built / Renovated: | Various / N/A | |
| Sponsor: | Lawrence Heller | Occupancy: | 89.8% | |
| Interest Rate: | 5.30000% | Occupancy Date: | Various | |
| Note Date: | 3/28/2019 | Number of Tenants: | 137 | |
| Maturity Date: | 4/6/2029 | 2016 NOI: | $12,770,635 | |
| Interest-only Period: | None | 2017 NOI: | $13,066,164 | |
| Original Term: | 120 months | 2018 NOI: | $13,405,071 | |
| Original Amortization(3): | 360 months | TTM NOI: | N/A | |
| Amortization Type(3): | Balloon | UW Economic Occupancy: | 87.5% | |
| Call Protection(4): | L(26)Grtr1%orYM(91),O(3) | UW Revenues: | $22,413,140 | |
| Lockbox / Cash Management: | Hard / In Place | UW Expenses: | $8,667,060 | |
| Additional Debt: | Yes | UW NOI: | $13,746,078 | |
| Additional Debt Balance(1)(3): | $82,835,969 / $19,960,474 | UW NCF: | $11,746,570 | |
| Additional Debt Type(1)(3): | Pari Passu / Mezzanine Loan | Appraised Value / Per SF: | $185,200,000 / $140 | |
| Appraisal Date: | 1/7/2019 | |||
| Escrows and Reserves(5) | Financial Information(1) | ||||||
| Initial | Monthly | Initial Cap | Cut-off Date Loan / SF: | $100 | |||
| Taxes: | $600,000 | $150,800 | N/A | Maturity Date Loan / SF: | $84 | ||
| Insurance: | $30,000 | $22,200 | N/A | Cut-off Date LTV: | 71.7% | ||
| Replacement Reserves: | $250,000 | $33,050 | $4,000,000 | Maturity Date LTV: | 60.3% | ||
| TI/LC: | $1,500,000 | $168,555 | N/A | UW NCF DSCR: | 1.34x | ||
| Other | $1,311,289 | $0 | N/A | UW NOI Debt Yield: | 10.4% | ||
| Sources and Uses | |||||||
| Sources | Proceeds | % of Total | Uses | Proceeds | % of Total | ||
| Whole Loan(1) | $133,000,000 | 69.7% | Purchase Price | $183,000,000 | 95.9% | ||
| Mezzanine Loan | 20,000,000 | 10.5 | Closing Costs | 4,206,061 | 2.2 | ||
| Sponsor Equity | 37,897,350 | 19.9 | Upfront Reserves | 3,691,289 | 1.9 | ||
| Total Sources | $190,897,350 | 100.0% | Total Uses | $190,897,350 | 100.0% | ||
| (1) | The Hampton Roads Office Portfolio Loan (as defined below) is part of a whole loan evidence by sixpari passu notes, with an aggregate outstanding principal balance as of the Cut-off Date of approximately $132.7 million. The Financial Information presented in the chart above reflects the Cut-off Date Balance of the approximately $132.7 million Hampton Roads Office Portfolio Whole Loan (as defined below). |
| (2) | The borrowers are Hampton Roads I Owner, LLC, Hampton Roads II Owner, LLC, Hampton Roads III Owner, LLC, Hampton Roads IV Owner, LLC, Hampton Roads V Owner, LLC, Hampton Roads VI Owner, LLC, Hampton Roads VII Owner, LLC, Hampton Roads VIII Owner, LLC, Hampton Roads IX Owner, LLC, Hampton Roads TRS Holding A, LLC, Hampton Roads TRS Holding B, LLC and Hampton Roads TRS Holding C, LLC. |
| (3) | The Hampton Roads Office Portfolio Whole Loan amortizes pursuant to a fixed amortization schedule as set forth in Annex G to the Preliminary Prospectus. Debt service coverage ratios are calculated using the sum of the first 12 principal and interest payments after the Cut-off Date based on the assumed principal and interest payment schedule set forth in Annex G to the Preliminary Prospectus. |
| (4) | The lockout period will be at least 26 payment dates beginning with and including the first payment date of May 6, 2019. The borrowers may prepay the Hampton Roads Office Portfolio Whole Loan along with a yield maintenance premium after the date that is the earlier to occur of (i) two years after the closing date of the securitization that includes the lastpari passunote to be securitized and (ii) October 6, 2022. The assumed lockout period of 26 payments is based on the expected JPMCC 2019-COR5 securitization closing date in June 2019. The actual lockout period may be longer. Partial releases are permitted. See“Partial Releases” below. |
| (5) | For or a full description of Escrows and Reserves, please refer to“Escrows and Reserves”below. |
THE INFORMATION IN THIS STRUCTURAL AND COLLATERAL TERM SHEET IS NOT COMPLETE AND MAY BE AMENDED PRIOR TO THE TIME OF SALE. THIS TERM SHEET IS NOT AN OFFER TO SELL THESE SECURITIES AND IT IS NOT A SOLICITATION OF AN OFFER TO BUY THESE SECURITIES IN ANY JURISDICTION WHERE THE OFFER OR SALE IS NOT PERMITTED.
49 of 116
| Structural and Collateral Term Sheet | JPMCC 2019-COR5 | |
| Hampton Roads Office Portfolio | ||
The Loan.The Hampton Roads Office Portfolio loan, with a principal balance of approximately $49.9 million as of the Cut-off Date (the “Hampton Roads Office Portfolio Loan”), is secured by a first mortgage lien on the borrowers’ fee simple interest in 22 office properties comprised of 1,322,003 square feet of net rentable area (the “Hampton Roads Office Portfolio Properties” or the “Hampton Roads Office Portfolio”) located in Chesapeake, Hampton and Virginia Beach, Virginia. The Hampton Roads Office Portfolio Loan is part of a whole loan that has an aggregate outstanding principal balance as of the Cut-off Date of approximately $132.7 million (the “Hampton Roads Office Portfolio Whole Loan”) and is comprised of sixpari passu notes, each as described in the “Whole Loan Summary” chart below. The controlling Note A-1 and non-controlling Note A-5, with an aggregate outstanding principal balance as of the Cut-off Date of approximately $49.9 million, is being contributed to the JPMCC 2019-COR5 Trust. The non-controlling Notes A-2, A-3, A-4 and A-6 with an aggregate outstanding principal balance as of the Cut-off Date of approximately $82.8 million is held by LCM or an affiliate and expected to be contributed to one or more future securitizations or may otherwise be transferred at any time. The relationship between the holders of the Hampton Roads Office Portfolio Whole Loan will be governed by a co-lender agreement as described under “Description of the Mortgage Pool—The Whole Loans—The Non-Serviced Pari Passu Whole Loans” in the Preliminary Prospectus. The Hampton Roads Office Portfolio Loan has a 10-year term and amortizes pursuant to a fixed amortization schedule as set forth in Annex G to the Preliminary Prospectus.The most recent prior financing of theHampton Roads Office PortfolioProperties was not included in a securitization.
| Whole Loan Summary | ||||
| Notes | Original Balance | Cut-off Date Balance | Note Holder | Controlling Piece |
| A-1, A-5 | $50,000,000 | $49,901,186 | JPMCC 2019-COR5 | Yes |
| A-2 | 33,000,000 | 32,934,783 | LCM | No |
| A-3 | 20,000,000 | 19,960,474 | LCM | No |
| A-4 | 20,000,000 | 19,960,474 | LCM | No |
| A-6 | 10,000,000 | 9,980,237 | LCM | No |
| Total | $133,000,000 | $132,737,155 | ||
The Borrowers. The borrowing entities are Hampton Roads I Owner, LLC, Hampton Roads II Owner, LLC, Hampton Roads III Owner, LLC, Hampton Roads IV Owner, LLC, Hampton Roads V Owner, LLC, Hampton Roads VI Owner, LLC, Hampton Roads VII Owner, LLC, Hampton Roads VIII Owner, LLC, Hampton Roads IX Owner, LLC, Hampton Roads TRS Holding A, LLC, Hampton Roads TRS Holding B, LLC and Hampton Roads TRS Holding C, LLC, each a Delaware limited liability company and special purpose entity structured to be bankruptcy remote with two independent directors. Legal counsel to the borrowers delivered a non-consolidation opinion in connection with the origination of the Hampton Roads Portfolio Whole Loan.
The Loan Sponsor.The loan sponsor and nonrecourse carve-out guarantor is Lawrence Heller. Mr. Heller is the managing member of Acme Equities LLC, a private holding company that invests in the real estate, oil and gas, power, hotel and high yield markets. Mr. Heller has over 30 years of experience in the development and execution of deals involving real estate acquisitions, distressed oil and gas assets, real estate workouts, and high yield debt trading and has actively managed a portfolio of family real estate holdings comprised of over 175 properties throughout the United States. In addition, Mr. Heller has invested over $5.0 billion of capital over the past two decades.
THE INFORMATION IN THIS STRUCTURAL AND COLLATERAL TERM SHEET IS NOT COMPLETE AND MAY BE AMENDED PRIOR TO THE TIME OF SALE. THIS TERM SHEET IS NOT AN OFFER TO SELL THESE SECURITIES AND IT IS NOT A SOLICITATION OF AN OFFER TO BUY THESE SECURITIES IN ANY JURISDICTION WHERE THE OFFER OR SALE IS NOT PERMITTED.
50 of 116
| Structural and Collateral Term Sheet | JPMCC 2019-COR5 | |
| Hampton Roads Office Portfolio | ||
| Portfolio Summary | ||||||||
| Property Name | City | Year Built | Total SF | % of Total | Occupancy(1) | UW NOI | Allocated Whole Loan Original Balance | Appraised Value |
| 510 Independence Parkway | Chesapeake | 1999 | 97,081 | 7.3% | 89.4% | $1,158,451 | $11,030,000 | $14,100,000 |
| 676 Independence Parkway | Chesapeake | 2008 | 73,345 | 5.5% | 100.0% | 1,138,059 | 11,010,000 | 11,200,000 |
| 700 Independence Parkway | Chesapeake | 2001 | 96,807 | 7.3% | 96.8% | 1,090,718 | 9,050,000 | 13,400,000 |
| 1309 Executive Boulevard | Chesapeake | 2001 | 49,870 | 3.8% | 100.0% | 789,623 | 7,770,000 | 8,500,000 |
| 1317 Executive Boulevard | Chesapeake | 2007 | 73,583 | 5.6% | 89.7% | 786,921 | 7,560,000 | 12,400,000 |
| 200 Golden Oak Court | Virginia Beach | 1988 | 74,290 | 5.6% | 84.1% | 734,143 | 7,260,000 | 10,900,000 |
| 1301 Executive Boulevard | Chesapeake | 2006 | 50,020 | 3.8% | 100.0% | 734,393 | 7,070,000 | 8,100,000 |
| 505 Independence Parkway | Chesapeake | 2000 | 63,568 | 4.8% | 100.0% | 724,577 | 7,010,000 | 8,500,000 |
| 1313 Executive Boulevard | Chesapeake | 2002 | 49,870 | 3.8% | 100.0% | 666,481 | 6,360,000 | 8,500,000 |
| 208 Golden Oak Court | Virginia Beach | 1989 | 63,825 | 4.8% | 94.6% | 681,012 | 6,310,000 | 9,000,000 |
| 1305 Executive Boulevard | Chesapeake | 2002 | 49,865 | 3.8% | 100.0% | 560,171 | 6,090,000 | 7,100,000 |
| 500 Independence Parkway | Chesapeake | 2001 | 51,000 | 3.9% | 100.0% | 634,815 | 6,000,000 | 7,400,000 |
| 501 Independence Parkway | Chesapeake | 2000 | 63,474 | 4.8% | 83.9% | 577,702 | 5,880,000 | 8,000,000 |
| 1 Enterprise Parkway | Hampton | 1987 | 63,029 | 4.8% | 86.7% | 549,986 | 5,450,000 | 7,700,000 |
| 1457 Miller Store Road | Virginia Beach | 1988 | 65,192 | 4.9% | 100.0% | 509,981 | 5,060,000 | 6,100,000 |
| 2809 South Lynnhaven Road | Virginia Beach | 1987 | 62,924 | 4.8% | 79.8% | 581,922 | 4,360,000 | 9,500,000 |
| 22 Enterprise Parkway | Hampton | 1990 | 72,444 | 5.5% | 76.2% | 543,069 | 4,140,000 | 8,900,000 |
| 521 Butler Farm Road | Hampton | 1989 | 44,651 | 3.4% | 100.0% | 415,939 | 4,080,000 | 6,300,000 |
| 21 Enterprise Parkway | Hampton | 1998 | 75,915 | 5.7% | 63.6% | 387,210 | 3,820,000 | 9,100,000 |
| 484 Viking Drive | Virginia Beach | 1987 | 39,633 | 3.0% | 43.3% | 81,275 | 3,780,000 | 5,400,000 |
| 629 Phoenix Drive | Virginia Beach | 1996 | 24,549 | 1.9% | 100.0% | 262,829 | 2,640,000 | 2,900,000 |
| 5 Manhattan Square | Hampton | 1999 | 17,068 | 1.3% | 100.0% | 136,801 | 1,270,000 | 2,200,000 |
| Total / Wtd. Avg. | 1,322,003 | 100.0% | 89.8% | $13,746,078 | $133,000,000 | $185,200,000 | ||
| (1) | Based on the underwritten rent rolls dated as of March 1, 2019. |
The Properties.The Hampton Roads Office Portfolio Properties are comprised of 22 office properties totaling 1,322,003 square feet situated throughout Virginia in Chesapeake (11 properties, 54.3% of net rentable area; 64.5% of underwritten net operating income), Virginia Beach (six properties, 25.0% of net rentable area; 20.7% of underwritten net operating income) and Hampton (five properties, 20.7% of net rentable area; 14.8% of underwritten net operating income). The Hampton Roads Office Portfolio Properties are leased by a granular and diverse roster of publicly-traded and national and international firms, regional companies, and local businesses. The tenant base represents a broad range of industries including law, financial services, healthcare, military, logistics, technology, consumer goods, communications, insurance, and real estate and offers limited exposure, as no single tenant occupies more than 3.8% of net rentable area. Additionally, the Hampton Roads Office Portfolio has exhibited an average 10-year historical occupancy since 2009 equal to 88.8%. As of the March 1, 2019 underwritten rent rolls, the Hampton Roads Office Portfolio Properties were 89.8% leased to 137 tenants over 151 leases at a weighted average underwritten base rent equal to $14.87 per square foot.
The largest tenant at the Hampton Roads Office Portfolio is Cegedim Dendrite (“Cegedim”) (49,870 square feet; 3.8% of net rentable area; 4.8% of underwritten base rent). Founded in 1969, Cegedim is a global technology and services company that supplies services, technological tools, specialized software, data flow management services and databases. Cegedim’s offerings are targeted notably at healthcare professionals, healthcare industries, life science companies, and health insurance companies. Cegedim is the world’s leading provider of pharmaceutical-specific customer relationship management solutions with a 35.0% global market share. Cegedim employs more than 4,500 people in more than 10 countries. Cegedim fully occupies the 1309 Executive Boulevard property located in Chesapeake, Virginia, where it originally took occupancy in 2001 and is on a lease initially expiring in December 2020. Cegedim currently pays base rent equal to $17.05 per square foot, has no termination options and has two, five-year renewal options remaining.
The second largest tenant at the Hampton Roads Office Portfolio is Sutherland Global Services Inc. (“Sutherland”) (49,870 square feet; 3.8% of net rentable area; 4.0% of underwritten base rent). Found in 1986, Sutherland is a business process outsourcing and technology-enabled services company, that provides an integrated set of back-office and customer facing front-office services that support the entire customer lifecycle. Sutherland offers digital, customer engagement, and business process transformation services. Sutherland serves clients in banking and financial services, healthcare, technology, media and communications, retail, insurance, travel and hospitality, government industries in the United States and internationally.Sutherland fully occupies the 1313 Executive Boulevard property located
THE INFORMATION IN THIS STRUCTURAL AND COLLATERAL TERM SHEET IS NOT COMPLETE AND MAY BE AMENDED PRIOR TO THE TIME OF SALE. THIS TERM SHEET IS NOT AN OFFER TO SELL THESE SECURITIES AND IT IS NOT A SOLICITATION OF AN OFFER TO BUY THESE SECURITIES IN ANY JURISDICTION WHERE THE OFFER OR SALE IS NOT PERMITTED.
51 of 116
| Structural and Collateral Term Sheet | JPMCC 2019-COR5 | |
| Hampton Roads Office Portfolio | ||
in Chesapeake, Virginia, where it originally took occupancy in 2012 and is on a lease initially expiring in September 2024. Sutherland currently pays base rent equal to $14.10 per square foot, has no termination options and one, five-year renewal option remaining.
The third largest tenant at the Hampton Roads Office Portfolio is General Dynamics Info (“General Dynamics”) (46,745 square feet; 3.5% of net rentable area; 3.2% of underwritten base rent; rated A2/NR/A+ by Moody’s/Fitch/S&P). General Dynamics is an American aerospace and defense multinational corporation. General Dynamics is the world's fifth-largest defense contractor based on 2012 revenues and ranked No. 99 in the 2018 Fortune 500 list of the largest United States corporations by total revenue. General Dynamics has over 105,000 employees and reported over $36.0 billion of revenue in 2018. General Dynamics occupies 46,745 square feet at the 700 Independence Parkway property located in Chesapeake, Virginia, where it originally took occupancy in 2017and is on a lease initially expiring in January 2022. General Dynamics currently pays base rent equal to $12.02 per square foot, has no termination options and one, five-year renewal option remaining.
The Markets.The Hampton Roads Office Portfolio Properties are located across four individual submarkets within the Hampton Roads office market in Southeastern Virginia: Battlefield in Chesapeake (six properties; 33.7% of net rentable area; 38.7% of underwritten net operating income), Lynnhaven in Virginia Beach (six properties; 25.0% of net rentable area; 20.7% of underwritten net operating income), Greenbrier in Chesapeake (five properties; 20.7% of net rentable area; 25.7% of underwritten net operating income) and Hampton Roads Center in Hampton (five properties; 20.7% of net rentable area; 14.8% of underwritten net operating income). The majority of the Hampton Roads Office Portfolio Properties within each submarket are in close proximity to one another and are located within individual business parks.
According to a market report, as of the first quarter of 2019, the overall Hampton Roads office market contained approximately 53.0 million square feet across 3,522 buildings with an overall market vacancy of 8.3% and average asking rents of approximately $17.96 per square foot. The Battlefield office submarket contained approximately 1.3 million square feet across 46 buildings with an overall market vacancy of 2.4% and average asking rents of approximately $18.97 per square foot. The Lynnhaven office submarket contained approximately 1.9 million square feet across 74 buildings with an overall market vacancy of 13.0% and average asking rents of approximately $18.65 per square foot. The Greenbrier office submarket contained approximately 3.3 million square feet across 137 buildings with an overall market vacancy of 5.5% and average asking rents of approximately $17.99 per square foot. The Hampton Roads Center office submarket contained approximately 1.2 million square feet across 26 buildings with an overall market vacancy of 28.4% and average asking rents of approximately $14.13 per square foot. Based on the square footage of the Hampton Roads Office Portfolio Properties, the weighted average vacancy and average asking rents as of the first quarter of 2019 were equal to 11.1% and $17.69 per square foot, respectively.
| Historical and Current Occupancy(1) | ||||||||||
| 2009 | 2010 | 2011 | 2012 | 2013 | 2014 | 2015 | 2016 | 2017 | 2018 | Current(2) |
| 87.7% | 89.2% | 86.9% | 88.5% | 89.2% | 89.2% | 87.9% | 87.3% | 92.0% | 90.5% | 89.8% |
| (1) | Historical Occupancies are as of December 31 of eachrespective year. |
| (2) | Current Occupancy is as of March 1, 2019. |
THE INFORMATION IN THIS STRUCTURAL AND COLLATERAL TERM SHEET IS NOT COMPLETE AND MAY BE AMENDED PRIOR TO THE TIME OF SALE. THIS TERM SHEET IS NOT AN OFFER TO SELL THESE SECURITIES AND IT IS NOT A SOLICITATION OF AN OFFER TO BUY THESE SECURITIES IN ANY JURISDICTION WHERE THE OFFER OR SALE IS NOT PERMITTED.
52 of 116
| Structural and Collateral Term Sheet | JPMCC 2019-COR5 | |
| Hampton Roads Office Portfolio | ||
| Tenant Summary(1) | ||||||
| Tenant | Ratings(2) Moody’s/Fitch/S&P | Net Rentable Area (SF) | % of Total NRA | Base Rent PSF(3) | % of Total Base Rent(3) | Lease Expiration Date |
| Cegedim Dendrite(4) | NR / NR / NR | 49,870 | 3.8% | $17.05 | 4.8% | 12/31/2020 |
| Sutherland Global Services Inc.(4) | NR / NR / NR | 49,870 | 3.8 | $14.10 | 4.0 | 9/30/2024 |
| General Dynamics Info(4) | A2 / NR / A+ | 46,745 | 3.5 | $12.02 | 3.2 | 1/31/2022 |
| Ferguson Enterprises, Inc. | NR / NR / NR | 44,651 | 3.4 | $9.99 | 2.5 | 3/31/2021 |
| Children's Hospital of The King's Daughters, Inc.(4)(5) | NR / NR / NR | 38,213 | 2.9 | $12.57 | 2.7 | 5/31/2026 |
| Ultralife Corporation | NR / NR / NR | 32,522 | 2.5 | $8.99 | 1.7 | 4/30/2021 |
| Schenker, Inc.(4) | NR / NR / NR | 31,709 | 2.4 | $12.23 | 2.2 | Various(6) |
| Science Systems and Applications Inc.(5) | NR / NR / NR | 30,755 | 2.3 | $11.20 | 2.0 | 5/31/2021 |
| Antech Systems | NR / NR / NR | 28,609 | 2.2 | $18.87 | 3.1 | 5/31/2021 |
| United States Coast Guard Community Services Command | Aaa / AAA / AA+ | 27,498 | 2.1 | $14.78 | 2.3 | 1/31/2027 |
| Top 10 Total / Wtd. Avg. | 380,442 | 28.8% | $13.18 | 28.4% | ||
| Other Tenants | 806,568 | 61.0 | $15.67 | 71.6 | ||
| Total Occupied Space | 1,187,010 | 89.8% | $14.87 | 100.0% | ||
| Vacant | 134,993 | 10.2 | ||||
| Total | 1,322,003 | 100.0% | ||||
| (1) | Based on the underwritten rent rolls dated as of March 1, 2019. |
| (2) | In certain instances, ratings provided are those of the parent company of the entity shown, whether or not the parent company guarantees the lease. |
| (3) | Base Rent includes approximately $519,618 in contractual rent steps through April 2020 for certain tenants. |
| (4) | Cegedim Dendrite has two, five-year renewal options remaining, Sutherland Global Services Inc. has one, five-year renewal options remaining, General Dynamics Info has one, five-year renewal option remaining, Children's Hospital of The King's Daughters, Inc. has one, five-year renewal option remaining and Schenker, Inc. has two, five-year renewal options remaining. |
| (5) | Children's Hospital of The King's Daughters, Inc. has the right to terminate its lease at any time after May 31, 2023 by providing at least 12 months’ notice. Science Systems and Applications Inc. has the right to terminate its lease at any time by providing at least six months’ notice and payment of a termination fee. |
| (6) | Schenker, Inc. leases 26,283 square feet through January 2021 and 5,426 square feet through June 2022. |
Lease Rollover Schedule(1)(2) | |||||||||
| Year | Number of Leases Expiring | Net Rentable Area Expiring | % of NRA Expiring | Base Rent Expiring(3) | % of Base Rent Expiring(3) | Cumulative Net Rentable Area Expiring | Cumulative % of NRA Expiring | Cumulative Base Rent Expiring(3) | Cumulative % of Base Rent Expiring(3) |
| Vacant | NAP | 134,993 | 10.2% | NAP | NAP | 134,993 | 10.2% | NAP | NAP |
| 2019 & MTM | 19 | 101,031 | 7.6% | $1,404,801 | 8.0% | 236,024 | 17.9% | $1,404,801 | 8.0% |
| 2020 | 34 | 232,671 | 17.6% | 3,394,913 | 19.2% | 468,695 | 35.5% | $4,799,714 | 27.2% |
| 2021 | 38 | 366,781 | 27.7% | 5,289,654 | 30.0% | 835,476 | 63.2% | $10,089,368 | 57.1% |
| 2022 | 23 | 162,112 | 12.3% | 2,581,256 | 14.6% | 997,588 | 75.5% | $12,670,624 | 71.8% |
| 2023 | 18 | 103,500 | 7.8% | 1,869,353 | 10.6% | 1,101,088 | 83.3% | $14,539,976 | 82.4% |
| 2024 | 8 | 119,643 | 9.1% | 1,843,642 | 10.4% | 1,220,731 | 92.3% | $16,383,618 | 92.8% |
| 2025 | 2 | 26,786 | 2.0% | 384,827 | 2.2% | 1,247,517 | 94.4% | $16,768,445 | 95.0% |
| 2026 | 1 | 38,213 | 2.9% | 480,337 | 2.7% | 1,285,730 | 97.3% | $17,248,783 | 97.7% |
| 2027 | 1 | 27,498 | 2.1% | 406,420 | 2.3% | 1,313,228 | 99.3% | $17,655,203 | 100.0% |
| 2028 | 0 | 0 | 0.0% | 0 | 0.0% | 1,313,228 | 99.3% | $17,655,203 | 100.0% |
| 2029 | 0 | 0 | 0.0% | 0 | 0.0% | 1,313,228 | 99.3% | $17,655,203 | 100.0% |
| 2030 & Beyond | 7 | 8,775 | 0.7% | 0 | 0.0% | 1,322,003 | 100.0% | $17,655,203 | 100.0% |
| Total | 151 | 1,322,003 | 100.0% | $17,655,203 | 100.0% | ||||
| (1) | Based on the underwritten rent rolls dated March 1, 2019. |
| (2) | Certain tenants have lease termination options that may become exercisable prior to the originally stated expiration date of the tenant lease and that are not considered in the lease rollover schedule. |
| (3) | Base Rent Expiring includes approximately $519,618 in contractual rent steps through April 2020 for certain tenants. |
THE INFORMATION IN THIS STRUCTURAL AND COLLATERAL TERM SHEET IS NOT COMPLETE AND MAY BE AMENDED PRIOR TO THE TIME OF SALE. THIS TERM SHEET IS NOT AN OFFER TO SELL THESE SECURITIES AND IT IS NOT A SOLICITATION OF AN OFFER TO BUY THESE SECURITIES IN ANY JURISDICTION WHERE THE OFFER OR SALE IS NOT PERMITTED.
53 of 116
| Structural and Collateral Term Sheet | JPMCC 2019-COR5 | |
| Hampton Roads Office Portfolio | ||
| Operating History and Underwritten Net Cash Flow | ||||||
| 2016 | 2017 | 2018 | Underwritten | Per Square Foot | %(1) | |
| Rents in Place | $14,197,324 | $15,261,475 | $16,255,440 | $17,135,585 | $12.96 | 67.0% |
| Contractual Rent Steps(2) | 0 | 0 | 0 | 519,618 | 0.39 | 2.0 |
| Vacant Income | 0 | 0 | 0 | 2,621,779 | 1.98 | 10.2 |
| Gross Potential Rent | $14,197,324 | $15,261,475 | $16,255,440 | $20,276,982 | $15.34 | 79.3% |
| Total Reimbursements | 6,233,629 | 5,649,360 | 5,536,333 | 5,114,619 | 3.87 | 20.0 |
| Total Other Income | 165,751 | 176,645 | 170,993 | 188,993 | 0.14 | 0.7 |
| Net Rental Income | $20,596,703 | $21,087,482 | $21,962,768 | $25,580,594 | $19.35 | 100.0% |
| (Vacancy/Credit Loss) | 0 | 0 | 0 | (3,167,455) | (2.40) | (12.4) |
| Effective Gross Income | $20,596,703 | $21,087,482 | $21,962,768 | $22,413,140 | $16.95 | 87.6% |
| Total Expenses | $7,826,068 | $8,021,315 | $8,557,696 | $8,667,060 | $6.56 | 38.7% |
| Net Operating Income | $12,770,635 | $13,066,164 | $13,405,071 | $13,746,078 | $10.40 | 61.3% |
| Total TI/LC, CapEx/RR | 0 | 0 | 0 | 1,999,510 | 1.51 | 8.9 |
| Net Cash Flow | $12,770,635 | $13,066,164 | $13,405,071 | $11,746,570 | $8.89 | 52.4% |
| (1) | % column represents percent of Net Rental Income for all revenue lines and represents percent of Effective Gross Income for the remainder of the fields. |
| (2) | Based on the contractual rent steps through April 2020 for certain tenants. |
Property Management.The Hampton Roads Office Portfolio Properties are managed by LingComm, LLC, a third-party management company.
Escrows and Reserves. At origination, the borrowers deposited into escrow $1,500,000 for tenant improvements and leasing commissions, approximately $1,001,936 for outstanding tenant improvements and leasing commissions, $600,000 for real estate taxes, $250,000 for replacement reserves, $223,102 for required repairs, approximately $86,251 for outstanding free rent and $30,000 for insurance premiums.
Tax Escrows– On a monthly basis,the borrowers are required to escrow 1/12 of the annual estimated tax payments, which currently equates to $150,800.
Insurance Escrows– On a monthly basis,the borrowers are required to escrow 1/12 of the annual estimated insurance premiums, which currently equates to $22,200.
Replacement Reserves –On a monthly basis, the borrowers are required to escrow $33,050 for replacement reserves, subject to a cap of $4,000,000.
TI/LC Reserves – On a monthly basis, the borrowers are required to escrow $168,555 for tenant improvements and leasing commissions.
Lockbox / Cash Management.The Hampton Roads Office Portfolio Whole Loan is structured with a hard lockbox and in-place cash management. All rents are required to be deposited directly by the tenants into a lockbox account controlled by the lender. All funds in the lockbox account are required to be swept to a lender-controlled cash management account every business day and applied on each payment date to the payment of debt service and the funding of required reserves. Provided no Cash Trap Period (as defined below) is continuing, all funds remaining in the cash management account after payment of the aforementioned items will be transferred into the borrowers’ operating account. During a Cash Trap Period, all excess cash in the cash management account will be retained by the lender as additional collateral for the Hampton Roads Office Portfolio Whole Loan.
A “Cash Trap Period” will commence (i) upon an event of default (including an event of default under the mezzanine loan), (ii) from and after October 6, 2019, if the debt service coverage ratio is less than 1.10x (including the mezzanine loan) (until such time that the debt service coverage ratio is greater than or equal to 1.10x for two consecutive quarters) or (iii) upon 60 days after the death or incapacity of the loan sponsor.
Release Parcels. The Hampton Roads Office Portfolio Whole Loan provides for the release of two unimproved outparcel tracts consisting of approximately 0.814 acres and 0.998 acres, respectively,provided that, among other things, (i) the borrowers deposit $200,000 per release into the replacement reserve account and (ii) the release is in compliance with the REMIC conditions.
THE INFORMATION IN THIS STRUCTURAL AND COLLATERAL TERM SHEET IS NOT COMPLETE AND MAY BE AMENDED PRIOR TO THE TIME OF SALE. THIS TERM SHEET IS NOT AN OFFER TO SELL THESE SECURITIES AND IT IS NOT A SOLICITATION OF AN OFFER TO BUY THESE SECURITIES IN ANY JURISDICTION WHERE THE OFFER OR SALE IS NOT PERMITTED.
54 of 116
| Structural and Collateral Term Sheet | JPMCC 2019-COR5 | |
| Hampton Roads Office Portfolio | ||
Partial Releases. Commencing on the date that is two years after the securitization closing date of the lastpari passu note to be securitized, the borrowers may obtain the release of any of the Hampton Roads Office Portfolio Properties,provided that, among other conditions, (i) the borrowers prepay a portion of the Hampton Roads Office Portfolio Whole Loan equal to the greater of (a) 115.0% of the allocated loan amount of the Hampton Roads Office Portfolio Property being released and (b) 100.0% of net sales proceeds, in each case, together with the applicable yield maintenance fee, and (ii) the debt yield (as calculated in accordance with the loan documents) for the remaining Hampton Roads Office Portfolio Properties following the release is not less than the greater of (a) the debt yield immediately preceding such release and (b) 8.3%.
Additional Debt. A mezzanine loan was funded concurrently and is coterminous with the Hampton Roads Office Portfolio Whole Loan. The mezzanine loan has an original principal balance of $20.0 million, accrues interest at a rate of 7.97750%per annum, and amortizes pursuant to a fixed amortization schedule. Including the mezzanine loan, the cumulative Cut-off Date LTV, cumulative UW NCF DSCR and cumulative UW NOI DY are 82.5%, 1.11x and 9.0%, respectively. The mezzanine loan is currently held by LCM or an affiliate.
THE INFORMATION IN THIS STRUCTURAL AND COLLATERAL TERM SHEET IS NOT COMPLETE AND MAY BE AMENDED PRIOR TO THE TIME OF SALE. THIS TERM SHEET IS NOT AN OFFER TO SELL THESE SECURITIES AND IT IS NOT A SOLICITATION OF AN OFFER TO BUY THESE SECURITIES IN ANY JURISDICTION WHERE THE OFFER OR SALE IS NOT PERMITTED.
55 of 116
| Structural and Collateral Term Sheet | JPMCC 2019-COR5 | |
| SWVP Portfolio | ||

THE INFORMATION IN THIS STRUCTURAL AND COLLATERAL TERM SHEET IS NOT COMPLETE AND MAY BE AMENDED PRIOR TO THE TIME OF SALE. THIS TERM SHEET IS NOT AN OFFER TO SELL THESE SECURITIES AND IT IS NOT A SOLICITATION OF AN OFFER TO BUY THESE SECURITIES IN ANY JURISDICTION WHERE THE OFFER OR SALE IS NOT PERMITTED.
56 of 116
| Structural and Collateral Term Sheet | JPMCC 2019-COR5 | |
| SWVP Portfolio | ||

THE INFORMATION IN THIS STRUCTURAL AND COLLATERAL TERM SHEET IS NOT COMPLETE AND MAY BE AMENDED PRIOR TO THE TIME OF SALE. THIS TERM SHEET IS NOT AN OFFER TO SELL THESE SECURITIES AND IT IS NOT A SOLICITATION OF AN OFFER TO BUY THESE SECURITIES IN ANY JURISDICTION WHERE THE OFFER OR SALE IS NOT PERMITTED.
57 of 116
| Structural and Collateral Term Sheet | JPMCC 2019-COR5 | |
| SWVP Portfolio | ||
| Mortgage Loan Information | Property Information | |||
| Mortgage Loan Seller(1): | JPMCB | Single Asset / Portfolio: | Portfolio | |
| Original Principal Balance(2): | $35,000,000 | Title: | Fee | |
| Cut-off Date Principal Balance(2): | $35,000,000 | Property Type - Subtype: | Hotel – Full Service | |
| % of Pool by IPB: | 5.0% | Net Rentable Area (Rooms): | 1,192 | |
| Loan Purpose: | Refinance | Location: | Various | |
| Borrowers: | SWVP New Orleans LLC, SWVP | Year Built / Renovated: | Various / Various | |
| Sawgrass Mills LLC, SWVP Charlotte | Occupancy/ADR/RevPAR: | 80.3% / $150.49 / $120.88 | ||
| LLC, SWVP Raleigh LLC | Occupancy/ADR/RevPAR Date: | 1/31/2019 | ||
| Sponsor: | Southwest Value Partners Fund | Number of Tenants: | N/A | |
| XVI, LP | 2016 NOI: | $21,390,216 | ||
| Interest Rate: | 4.95800% | 2017 NOI: | $23,153,479 | |
| Note Date: | 4/18/2019 | 2018 NOI: | $23,248,958 | |
| Maturity Date: | 5/1/2029 | TTM NOI (as of 1/2019): | $23,723,247 | |
| Interest-only Period: | 120 months | UW Occupancy/ADR/RevPAR: | 80.3% / $150.49 / $120.88 | |
| Original Term: | 120 months | UW Revenues: | $67,719,285 | |
| Original Amortization: | None | UW Expenses: | $43,853,764 | |
| Amortization Type: | Interest Only | UW NOI: | $23,865,520 | |
| Call Protection(3): | L(25),Def(91),O(4) | UW NCF: | $20,479,556 | |
| Lockbox / Cash Management: | Hard / Springing | Appraised Value / Per Room(4): | $335,600,000 / $281,544 | |
| Additional Debt(2): | Yes | Appraisal Date: | 10/16/2018 | |
| Additional Debt Balance(2): | $165,000,000 | |||
| Additional Debt Type(2): | Pari Passu | |||
| Escrows and Reserves(5) | Financial Information(2) | ||||||
| Initial | Monthly | Initial Cap | Cut-off Date Loan / Room: | $167,785 | |||
| Taxes: | $822,222 | $205,555 | N/A | Maturity Date Loan / Room: | $167,785 | ||
| Insurance: | $990,844 | $82,570 | N/A | Cut-off Date LTV(4): | 59.6% | ||
| FF&E Reserves: | $0 | 5.0% of Gross Revenues | N/A | Maturity Date LTV(4): | 59.6% | ||
| Other: | $5,097,938 | Springing | N/A | UW NCF DSCR: | 2.04x | ||
| UW NOI Debt Yield: | 11.9% | ||||||
| Sources and Uses | |||||||
| Sources | Proceeds | % of Total | Uses | Proceeds | % of Total | |
| Whole Loan(2) | $200,000,000 | 100.0% | Payoff Existing Debt | $134,273,134 | 67.1% | |
| Upfront Reserves | 6,911,003 | 3.5 | ||||
| Closing Costs | 3,110,937 | 1.6 | ||||
| Return of Equity(6) | 55,704,926 | 27.9 | ||||
| Total Sources | $200,000,000 | 100.0% | Total Uses | $200,000,000 | 100.0% |
| (1) | The SWVP Portfolio Whole Loan (as defined below) was co-originated by Société Générale Financial Corporation (“SGFC”) and JPMCB. |
| (2) | The SWVP Portfolio Loan (as defined below) is part of a whole loan evidenced by 10pari passunotes with an aggregate original principal balance as of the Cut-off Date of $200.0 million. Financial Information presented in the chart above reflects the Cut-off Date balance of SWVP Portfolio Whole Loan. |
| (3) | The lockout period will be at least 25 payments beginning with and including the first payment date of June 1, 2019. Defeasance of the full $200.0 million SWVP Portfolio Whole Loan is permitted after the date that is the earlier to occur of (i) two years from the closing date of the securitization that includes the last note to be securitized and (ii) May 1, 2022 (the “Permitted Release Date”). The assumed lockout period of 25 months is based on the expected closing date of the JPMCC 2019-COR5 securitization in June 2019. The actual lockout period may be longer. |
| (4) | Appraised Value / Per Room, Cut-off Date LTV and Maturity Date LTV are calculated based on the As-Portfolio appraised value of $335,600,000, which assumes (i) the bulk sale value of the SWVP Portfolio Properties (as defined below) in one transaction to one purchaser and (ii) all funds required for the capital improvements in connection with such a bulk sale are escrowed. The sum of the individual As-Is appraised values of the SWVP Portfolio Properties without the capital deduction escrow is $316,600,000, which represents a Cut-off Date LTV and Maturity Date LTV of 63.2%. |
| (5) | For a full description of Escrows and Reserves, please refer to “Escrows and Reserves” below. |
| (6) | The loan sponsor has a total cost basis of approximately $209.4 million and will have approximately $9.4 million of remaining cash equity following the refinancing of the SWVP Portfolio Properties. |
THE INFORMATION IN THIS STRUCTURAL AND COLLATERAL TERM SHEET IS NOT COMPLETE AND MAY BE AMENDED PRIOR TO THE TIME OF SALE. THIS TERM SHEET IS NOT AN OFFER TO SELL THESE SECURITIES AND IT IS NOT A SOLICITATION OF AN OFFER TO BUY THESE SECURITIES IN ANY JURISDICTION WHERE THE OFFER OR SALE IS NOT PERMITTED.
58 of 116
| Structural and Collateral Term Sheet | JPMCC 2019-COR5 | |
| SWVP Portfolio | ||
The Loan.The SWVP Portfolio loan is part of a whole loan evidenced by 10pari passu promissory notes, each as described below, with an aggregate original principal balance of $200.0 million (the “SWVP Portfolio Whole Loan”),secured by the borrowers’ fee interests in four full service hotels located in Louisiana, Florida, and North Carolina (collectively, the “SWVP Portfolio Properties”). The non-controlling Note A-9, with an outstanding principal balance as of the Cut-off Date of $35,000,000, will be included in the JPMCC 2019-COR5 Trust. The remaining notes, which are currently held by the parties identified in the table below, are expected to be contributed to one or more future securitization trusts. The relationship between the holders of the SWVP Portfolio Whole Loan will be governed by a co-lender agreement as described under “Description of the Mortgage Pool—The Whole Loans—The Non-Serviced Pari Passu Whole Loans”in the Preliminary Prospectus.The SWVP Portfolio Whole Loan has a 10-year term and is interest-only for the full term of the loan.
| Whole Loan Summary | ||||
| Note | Original Balance | Cut-off Date Balance | Note Holder | Controlling Piece |
| A-1, A-3 | $45,000,000 | $45,000,000 | BBCMS 2019-C3 | Yes |
| A-2 | 30,000,000 | 30,000,000 | SGFC | No |
| A-4 | 10,000,000 | 10,000,000 | SGFC | No |
| A-5 | 10,000,000 | 10,000,000 | SGFC | No |
| A-6 | 5,000,000 | 5,000,000 | SGFC | No |
| A-7, A-8 | 50,000,000 | 50,000,000 | Benchmark 2019-B11 | No |
| A-9 | 35,000,000 | 35,000,000 | JPMCC 2019-COR5 | No |
| A-10 | 15,000,000 | 15,000,000 | JPMCB | No |
| Total | $200,000,000 | $200,000,000 | ||
The Borrowers. The borrowing entities are SWVP New Orleans LLC, SWVP Sawgrass Mills LLC, SWVP Raleigh LLC, and SWVP Charlotte LLC, each a Delaware limited liability company structured to be a special purpose entity with two independent directors. Legal counsel to the borrowers delivered a non-consolidation opinion in connection with the origination of the SWVP Portfolio Whole Loan.
The Loan Sponsor.The loan sponsor and nonrecourse carve-out guarantor is Southwest Value Partners Fund XVI, LP.Southwest Value Partners (“SWVP”), is a private real estate investment firm based in San Diego, California. SWVP currently owns and manages over 30 assets with an aggregate value of over $3.0 billion, including 13 hotels comprised of 3,867 rooms. SWVP’s consolidated hospitality portfolio consists of 13 operating properties and one hotel under construction for a total of 4,458 rooms, all of which are flagged by Hilton (five), Marriott (four), Hyatt (three) and IHG (one), along with one independent boutique. Since inception, SWVP has invested more than $1.5 billion of equity in over 100 transactions with a total capitalization of approximately $3.9 billion. SWVP acquired the SWVP Portfolio Properties between 2013 and 2015 for an aggregate purchase price of approximately $164.4 million. Since acquisition, SWVP has indicated that approximately $40.0 million in capital improvements have been invested across the SWVP Portfolio Properties. SWVP has a total cost basis of approximately $209.4 million and will have approximately $9.4 million of remaining cash equity following the refinancing of the SWVP Portfolio Properties. The guarantor (or a supplemental guarantor as permitted by the loan documents) is required to maintain a net worth of not less than $40.0 million and liquidity of not less than $10 million during the term of the SWVP Portfolio Whole Loan,provided that neither the guarantor nor any supplemental guarantor is required to maintain liquidity of not less than $10 million for any period during which the borrowers maintain liquidity of not less than $5,000,000.
The Properties. The SWVP Portfolio Properties are comprised of four full service hotel properties built between 1983 and 2001 totaling 1,192 rooms. As of January 31, 2019, the SWVP Portfolio Properties were 80.3% occupied.
| SWVP Portfolio Summary | |||||||
| Property Name – Location | Property Type – Subtype | No. of Rooms | Year Built / Renovated | Allocated Whole Loan Amount (“ALA”) | %of ALA | Appraised Value(1) | UW NCF |
| InterContinental –New Orleans, LA | Hotel – Full Service | 484 | 1983 / 2013 | $106,300,000 | 53.2% | $170,000,000 | $10,344,521 |
| DoubleTree Sunrise – Sunrise, FL | Hotel – Full Service | 252 | 2001 / 2011 | 37,000,000 | 18.5 | 61,000,000 | 3,980,206 |
| DoubleTree Charlotte – Charlotte, NC | Hotel – Full Service | 207 | 1985 / 2012 | 30,000,000 | 15.0 | 50,000,000 | 3,256,464 |
| DoubleTree RTP –Durham, NC | Hotel – Full Service | 249 | 1988 / 2013 | 26,700,000 | 13.4 | 40,200,000 | 2,898,365 |
| Total | 1,192 | $200,000,000 | 100.0% | $335,600,000 | $20,479,556 | ||
| (1) | Total Appraised Value reflects the As-Portfolio appraised value of $335,600,000, which assumes (i) the bulk sale value of the SWVP Portfolio Properties in one transaction to one purchaser and (ii) all funds required for the capital improvements in connection with such a bulk sale are escrowed. The sum of the individual As-Is appraised values of the SWVP Portfolio Properties is $316,600,000, which represents a Cut-off Date LTV and Maturity Date LTV of 63.2%. |
THE INFORMATION IN THIS STRUCTURAL AND COLLATERAL TERM SHEET IS NOT COMPLETE AND MAY BE AMENDED PRIOR TO THE TIME OF SALE. THIS TERM SHEET IS NOT AN OFFER TO SELL THESE SECURITIES AND IT IS NOT A SOLICITATION OF AN OFFER TO BUY THESE SECURITIES IN ANY JURISDICTION WHERE THE OFFER OR SALE IS NOT PERMITTED.
59 of 116
| Structural and Collateral Term Sheet | JPMCC 2019-COR5 | |
| SWVP Portfolio | ||
| Historical Occupancy, ADR and RevPAR(1) | ||||||||||||
| Occupancy | ADR | RevPAR | ||||||||||
| Property | 2016 | 2017 | 2018 | TTM(2) | 2016 | 2017 | 2018 | TTM(2) | 2016 | 2017 | 2018 | TTM(2) |
| InterContinental | 73.1% | 75.8% | 78.9% | 79.6% | $164.61 | $169.07 | $167.35 | $169.13 | $120.38 | $128.16 | $132.12 | $134.65 |
| DoubleTree Sunrise | 85.7% | 89.0% | 86.7% | 87.0% | $140.03 | $144.43 | $148.39 | $148.91 | $119.94 | $128.49 | $128.61 | $129.53 |
| DoubleTree Charlotte | 82.8% | 80.6% | 79.6% | 78.9% | $146.36 | $150.23 | $144.54 | $144.77 | $121.12 | $121.01 | $115.01 | $114.29 |
| DoubleTree RTP | 72.5% | 73.8% | 76.0% | 76.2% | $119.29 | $119.69 | $120.60 | $120.56 | $86.51 | $88.31 | $91.67 | $91.85 |
| Weighted Average(3) | 77.3% | 79.0% | 80.1% | 80.3% | $146.78 | $150.27 | $149.62 | $150.48 | $113.34 | $118.66 | $119.96 | $121.09 |
| (1) | Based on data provided by a third party market research report. The variances between the underwriting, the appraisal and the third party market research provider with respect to Occupancy, ADR and RevPAR at the SWVP Portfolio Properties are attributable to differing reporting methodologies, and/or timing differences. |
| (2) | TTM represents the trailing 12-month period ending January 31, 2019. |
| (3) | Weighted by room count. |
| Historical Occupancy, ADR and RevPAR Penetration Rates(1) | ||||||||||||
| Occupancy | ADR | RevPAR | ||||||||||
| Property | 2016 | 2017 | 2018 | TTM(2) | 2016 | 2017 | 2018 | TTM(2) | 2016 | 2017 | 2018 | TTM(2) |
| InterContinental | 97.0% | 96.3% | 101.2% | 102.0% | 94.4% | 96.8% | 93.4% | 94.3% | 91.6% | 93.2% | 94.6% | 96.2% |
| DoubleTree Sunrise | 113.5% | 115.3% | 112.8% | 113.3% | 117.7% | 116.1% | 116.7% | 120.9% | 133.7% | 133.9% | 131.7% | 137.0% |
| DoubleTree Charlotte | 108.7% | 110.0% | 116.4% | 116.1% | 102.1% | 103.0% | 99.5% | 99.9% | 111.0% | 113.2% | 115.8% | 116.0% |
| DoubleTree RTP | 98.5% | 100.3% | 100.3% | 99.9% | 100.0% | 101.4% | 100.9% | 105.6% | 98.5% | 101.7% | 101.2% | 105.4% |
| Weighted Average(3) | 102.8% | 103.5% | 106.1% | 106.4% | 101.9% | 102.9% | 101.0% | 103.2% | 105.3% | 107.1% | 107.5% | 110.2% |
| (1) | Based on data provided by a third party market research report. The variances between the underwriting, the appraisal and the third party market research provider with respect to Occupancy, ADR and RevPAR at the SWVP Portfolio Properties are attributable to differing reporting methodologies, and/or timing differences. |
| (2) | TTM represents the trailing 12-month period ending January 31, 2019. |
| (3) | Weighted by room count. |
InterContinental.The InterContinental property is a 484-room, 15-story, full service hotel located in downtown New Orleans, Louisiana. The InterContinental property is situated on a 1.10-acre lot and has a long term lease for 120 parking spaces with the adjacent property owner, resulting in a parking ratio of approximately 0.25 spaces per room. The InterContinental property was built in 1983 and renovated in 2013. The hotel has standard and suite-style guestrooms on levels four through 14 of the InterContinental property. Guestrooms feature a dresser with a 42-inch flat-panel television, a desk, an armchair, bedside tables, and a coffeemaker. Guestroom amenities includes high-speed Internet access, a telephone with voicemail and data port and a private deck or patio in select rooms. Hotel amenities include two restaurants, 24-hour room service, a rooftop pool with changing rooms and shower facilities, poolside dining, a fitness facility, on-site laundry facility, nanny/babysitting services, business center and over 30,000 square feet of flexible meeting/banquet space, which can accommodate over 1,000 people. Since acquisition, SWVP has invested approximately $28.5 million in capital improvements consisting of a redesigned lobby, removal of an escalator and elimination of leased outlets to create more meeting space.
The InterContinental property is located in New Orleans, within the parish of Orleans, Louisiana. Known for its multicultural heritage and world-famous music and cuisine, New Orleans is predominantly recognized as a tourist destination. In addition to tourism, the greater New Orleans area is a significant logistics center, owing to its access to the Mississippi River, the Gulf of Mexico and numerous railways. Major employers within the market include Ochsner Health System, University Medical Center, Tulane University and University of New Orleans. The InterContinental’s top corporate accounts represent many of the primary employers in the local marketplace, as well as high-volume demand drivers in the immediate vicinity of the hotel. According to SWVP, Shell, Pan America, Iberia Bank, Bank of America, the United States Fifth Circuit Court of Appeals, Louisiana State Bar Association and Jones Walker are some of the top corporate accounts at the InterContinental property and are located blocks from the hotel. Access to the InterContinental property is provided by St. Charles Avenue. The neighborhood surrounding the InterContinental property is comprised of high-rise office and residential buildings, hotels, world-renowned restaurants, upscale retail establishments, entertainment venues and tourism attractions. Some specific facilities in the area include the Ernest N. Morial Convention Center, the Mercedes-Benz Superdome, the Smoothie King Center and Harrah's New Orleans Hotel & Casino. New Orleans has hosted two NBA All-Star games, the NCAA Final Four, WWE's WrestleMania XXX, and Super Bowl XLVII. The InterContinental property is served by the Louis Armstrong New Orleans International Airport, which is located approximately 12.0 miles northwest of the hotel. The appraisal identified a 234-room hotel that is expected to directly compete with the InterContinental property. The competing property is estimated to open in September 2019. According to the appraisal, demand segmentation for the InterContinental property is 55% meeting and group, 25% commercial, and 20% leisure.
THE INFORMATION IN THIS STRUCTURAL AND COLLATERAL TERM SHEET IS NOT COMPLETE AND MAY BE AMENDED PRIOR TO THE TIME OF SALE. THIS TERM SHEET IS NOT AN OFFER TO SELL THESE SECURITIES AND IT IS NOT A SOLICITATION OF AN OFFER TO BUY THESE SECURITIES IN ANY JURISDICTION WHERE THE OFFER OR SALE IS NOT PERMITTED.
60 of 116
| Structural and Collateral Term Sheet | JPMCC 2019-COR5 | |
| SWVP Portfolio | ||
DoubleTree Sunrise. The DoubleTree Sunrise property is a 252-room, 10-story, full service hotel located in Sunrise, Florida. The DoubleTree Sunrise property is situated on a 4.22-acre site and has 293 parking spaces either onsite or available to it by way of a title insured easement and license, resulting in a parking ratio of approximately 1.16 spaces per room. The DoubleTree Sunrise property was built in 2001 and renovated in 2011. Guestrooms are configured as either standard or suites-style. Guestrooms feature an entertainment dresser with 37-inch television, a work desk, an armchair, an ottoman and a coffeemaker. Guestroom amenities include wireless, high-speed internet access and a telephone with voicemail and data port. Suites feature a separate living room with a 42-inch television, a large desk with high-speed wireless internet access, a chair with ottoman and a double sleeper sofa. Suites also feature a small refrigerator and microwave. Hotel amenities include a restaurant, an outdoor pool, outdoor whirlpool, fitness facility, laundry/valet service, airport/local shuttle, a business center and over 10,000 square feet of flexible meeting space. Since acquisition, SWVP has invested approximately $4.3 million in capital improvements consisting of a general refresh of all areas of the DoubleTree Sunrise property, including the reconstruction of the retail shop, refinished and reupholstered bar/lounge, new soft goods package in meeting rooms and a refresh of corridors, elevators and elevator lobbies. Guestrooms received new headboards, nightstands and desk chairs, while guestroom bathrooms were refinished and received new tile shower surrounds.
The DoubleTree Sunrise property is located in Sunrise, Florida. Sunrise is a suburb of Fort Lauderdale, which is the county seat of Broward County. Fort Lauderdale is a popular tourism and yachting destination in the South Florida region. Sunrise has a diverse economic base, with strong employers in finance, health care, manufacturing, marine, aviation, technology, life sciences and tourism. Major employers within the market include Nova Southeastern University, American Express, Spirit Airlines and Citrix. American Express is the #1 corporate account for the DoubleTree Sunrise property and had an ADR of approximately $156.00 for 2018. The American Express Company corporate offices is a regional headquarters office designed for 3,000 employees that opened in early 2017 on the southeast corner of Northwest 136th Street and Sunrise Boulevard. Sawgrass Mills is a 2.1 million square foot outlet mall located approximately 1.0 mile north of the DoubleTree Sunrise property and draws approximately 23.0 million visitors annually from more than 110 countries. Other major demand generators located within six miles of the DoubleTree Sunrise property include BB&T Center, MDLIVE, Sawgrass Technology Park, and Cigna Healthcare. BB&T is home to the NHL’s Florida Panthers and host of numerous events throughout the year. Access to the DoubleTree Sunrise property is provided by Yellow Toucan Road. The DoubleTree Sunrise property’s neighborhood will also feature Metropica, a 65-acre, $1.5 billion mixed-use development. Metropica will feature 785,000 square feet of office space and a major residential condominium component. The DoubleTree Sunrise property is served primarily by the Fort Lauderdale Hollywood International Airport, which is located approximately 10.0 miles southeast of the hotel. The appraisal identified a 174-room hotel that is expected to directly compete with the DoubleTree Sunrise property. The competing property is expected to open in August 2020. According to the appraisal, demand segmentation for the DoubleTree Sunrise property is 60% commercial, 20% meeting and group, and 20% leisure.
DoubleTree Charlotte. The DoubleTree Charlotte property is a 207-room, six-story, full service hotel located in Charlotte, North Carolina. The DoubleTree Charlotte property is situated on a 6.53-acre site and has 259 parking spaces, resulting in a parking ratio of approximately 1.25 spaces per room. The DoubleTree Charlotte property was built in 1985 and renovated in 2012. The hotel comprises two connected towers; the original tower is three stories and features the public spaces and guestrooms, while the six-story tower only contains guestrooms. All guestrooms are configured in a suite style. In-room amenities include a wet-bar or kitchenette, separate living areas, sofa beds, complimentary coffee and Wi-Fi access for a fee. Additionally, some suites feature balconies with views of the Garden Courtyard and Symphony Park. Hotel amenities include two full service restaurants, a Grab and Go Market, an outdoor pool, a business center, a fitness center, a gift shop and over 12,000 square feet of meeting space. Since acquisition, SWVP has completed $5.3 million in improvements including over $4.0 million in DoubleTree Charlotte property improvement plan items. Improvements included upgrading 14 suites, renovating the fitness room, and replacing the phone system. In 2019, the DoubleTree Charlotte property started an approximately $5.0 million capital improvement project that includes improvements to the guestrooms, guest suite bathrooms, corridors, lobby and dining area. The renovation of the lobby and restaurant are expected to commence in the fourth quarter of 2019.
The DoubleTree Charlotte property is located in Charlotte, North Carolina. The Charlotte market is the third largest financial center in the nation according to the appraisal. The area is also home to manufacturing, retail and wholesale trade, information, and an increasing number of international companies. Charlotte is home to eight Fortune 500 company headquarters that represent the finance, energy and manufacturing industries, as well as the retail sector. Major employers within the market include Carolinas Healthcare System, Wells Fargo, Charlotte-Mecklenburg Schools, Wal-Mart Store Inc. and Bank of America. The neighborhood surrounding the DoubleTree Charlotte property is comprised of restaurants, office buildings and retail shopping centers along the primary thoroughfares, with residential areas located along the secondary roadways. Other businesses in the area include the SouthPark shopping mall, Coca-Cola Bottling Company, and Nucor Corporation. Other demand generators include Bank of America Stadium, BB&T Ballpark, EpiCentre, Spectrum Center, NASCAR Hall of Fame, Blumenthal Performing Arts Center and AvidXchange Music Factory, as well as the Carowinds amusement park located in southwestern Charlotte. Access to the DoubleTree Charlotte property is provided by Morrison Boulevard, South Park Drive, Interstate 77 and Interstate 485, allowing easy access to the airport and Uptown Charlotte. The DoubleTree Charlotte property is served primarily by the Charlotte Douglas International Airport, which is located approximately seven miles to the northwest of the hotel. The appraisal identified two new hotels with a combined 320-rooms, which are expected to directly compete with the
THE INFORMATION IN THIS STRUCTURAL AND COLLATERAL TERM SHEET IS NOT COMPLETE AND MAY BE AMENDED PRIOR TO THE TIME OF SALE. THIS TERM SHEET IS NOT AN OFFER TO SELL THESE SECURITIES AND IT IS NOT A SOLICITATION OF AN OFFER TO BUY THESE SECURITIES IN ANY JURISDICTION WHERE THE OFFER OR SALE IS NOT PERMITTED.
61 of 116
| Structural and Collateral Term Sheet | JPMCC 2019-COR5 | |
| SWVP Portfolio | ||
DoubleTree Charlotte property. The competing properties are expected to open in 2020. According to the appraisal, demand segmentation for the DoubleTree Charlotte property is 43% commercial, 32% meeting and group, and 25% leisure.
DoubleTree RTP.The DoubleTree RTP property is a 249-room, five-story, full service hotel located in Durham, North Carolina. The DoubleTree RTP property is situated on a 12.50-acre site and has 366 parking spaces, resulting in a parking ratio of approximately 1.47 spaces per room. The DoubleTree RTP property was built in 1988 and renovated in 2013. The hotel offers a mix of guestrooms and suites, which are located on all levels of the DoubleTree RTP property's single building. Guestrooms feature one king or two double beds, two telephones with voicemail and data ports, a large work desk, high speed internet access available for a fee, a coffee maker, a hairdryer and an iron/board. Hotel amenities include a restaurant and lounge adjacent to the lobby, and seven meeting rooms on the first floor, which includes a large ballroom. Additional amenities consist of an outdoor pool, a fitness room, a lobby workstation, a market pantry and a vending area. Since acquisition, SWVP has invested approximately $1.8 million in capital improvements, including upgrades to the exterior lighting, parking lot, public spaces and restaurant.
The DoubleTree RTP property is located in Durham, North Carolina. Durham is part of the greater Raleigh/Durham economic base and is part of the Research Triangle Park, which includes the neighboring cities of Chapel Hill and Raleigh. The Durham economy has a diverse economic base within the healthcare, bioscience, technology and education sectors, including healthy employment levels at companies in the Research Triangle Park. Major employers in the market include Duke University, Duke University Health System, IBM, North Carolina State University, WakeMed Health & Hospitals, and UNC Rex Healthcare. The hotel’s top accounts encompass the prominent businesses in Research Triangle Park, including IBM, GlaxoSmithKline and Cisco. Access to the DoubleTree RTP property is provided by Page Creek Lane, Old Page Road and Interstate 40, which is the nearest major highway. The neighborhood surrounding the DoubleTree RTP property is comprised of restaurants, office buildings, and retail shopping centers along the primary thoroughfares, with residential areas located along some secondary roadways. Other specific businesses and entities in the area include Duke Medical Plaza Page Road, Alcami, Cenduit and Merrill Lynch Wealth Management. The DoubleTree RTP property is served by the Raleigh-Durham International Airport, which is located approximately two miles to the east of the hotel. The appraisal identified a proposed new hotel that has been approved by the Research Triangle Foundation and is currently in the planning stages. According to the appraisal, demand segmentation for the DoubleTree RTP property is 50% commercial, 30% leisure, and 20% meeting and group.
THE INFORMATION IN THIS STRUCTURAL AND COLLATERAL TERM SHEET IS NOT COMPLETE AND MAY BE AMENDED PRIOR TO THE TIME OF SALE. THIS TERM SHEET IS NOT AN OFFER TO SELL THESE SECURITIES AND IT IS NOT A SOLICITATION OF AN OFFER TO BUY THESE SECURITIES IN ANY JURISDICTION WHERE THE OFFER OR SALE IS NOT PERMITTED.
62 of 116
| Structural and Collateral Term Sheet | JPMCC 2019-COR5 | |
| SWVP Portfolio | ||
| Operating History and Underwritten Net Cash Flow | |||||||
| 2016 | 2017 | 2018 | TTM(1) | Underwritten | Per Room(2) | % of Total Revenue(3) | |
| Occupancy | 77.8% | 79.0% | 79.8% | 80.3% | 80.3% | ||
| ADR | $146.17 | $149.79 | $150.15 | $150.49 | $150.49 | ||
| RevPAR | $113.61 | $118.36 | $119.90 | $120.88 | $120.88 | ||
| Room Revenue | $49,492,887 | $51,496,118 | $52,165,543 | $52,476,386 | $52,593,360 | $44,122 | 77.7% |
| Food & Beverage Revenue | 11,453,086 | 13,034,557 | 12,432,826 | 12,931,530 | 12,931,530 | 10,849 | 19.1 |
| Other Departmental Revenue | 1,767,360 | 1,834,540 | 2,130,803 | 2,194,395 | 2,194,395 | 1,841 | 3.2 |
| Total Revenue | $62,713,333 | $66,365,215 | $66,729,172 | $67,602,311 | $67,719,285 | $56,811 | 100.0% |
| Room Expense | $10,639,861 | $11,122,787 | $11,210,546 | $11,329,879 | $11,352,438 | $9,524 | 21.6% |
| Food & Beverage Expense | 6,962,035 | 7,516,095 | 7,378,949 | 7,493,877 | 7,493,876 | 6,287 | 58.0 |
| Other Departmental Expenses | 443,506 | 427,338 | 434,921 | 436,195 | 436,432 | 366 | 19.9 |
| Departmental Expenses | $18,045,402 | $19,066,220 | $19,024,416 | $19,259,951 | $19,282,745 | $16,177 | 28.5% |
| Departmental Profit | $44,667,931 | $47,298,995 | $47,704,756 | $48,342,360 | $48,436,539 | $40,635 | 71.5% |
| Operating Expenses | $18,175,172 | $18,877,536 | $19,063,691 | $19,189,533 | $19,182,636 | $16,093 | 28.3% |
| Gross Operating Profit | $26,492,759 | $28,421,459 | $28,641,065 | $29,152,827 | $29,253,903 | $24,542 | 43.2% |
| Management Fees | $1,880,640 | $1,990,218 | $2,001,183 | $2,027,379 | $2,031,579 | $1,704 | 3.0% |
| Property Taxes | 2,301,211 | 2,396,596 | 2,394,820 | 2,395,025 | 2,394,820 | 2,009 | 3.5 |
| Property Insurance | 920,692 | 881,166 | 996,104 | 1,007,176 | 961,984 | 807 | 1.4 |
| Total Other Expenses | $5,102,543 | $5,267,980 | $5,392,107 | $5,429,580 | $5,388,383 | $4,520 | 8.0% |
| Net Operating Income | $21,390,216 | $23,153,479 | $23,248,958 | $23,723,247 | $23,865,520 | $20,021 | 35.2% |
| FF&E | 0 | 0 | 0 | 0 | 3,385,964 | 2,841 | 5.0 |
| Net Cash Flow | $21,390,216 | $23,153,479 | $23,248,958 | $23,723,247 | $20,479,556 | $17,181 | 30.2% |
| (1) | TTM reflects the trailing 12 month period ending January 31, 2019. |
| (2) | Per Room values are based on 1,192 guest rooms. |
| (3) | % of Total Revenue for Room Expense, Food & Beverage Expense and Other Departmental Expenses are based on their corresponding revenue line item. |
Property Management.The SWVP Portfolio Properties are managed by Dimension Development Two, LLC, a Louisiana limited liability company.
Franchise Agreements. The InterContinental property has a license agreement with Holiday Hospitality Franchising, LLC, a Delaware limited liability company, an affiliate of InterContinental Hotels Group. The current franchise agreement is effective as of January 23, 2013 for a term of approximately 20 years, with an expiration date of January 23, 2033. The franchise agreement provides for a royalty fee of 5.0% of gross room revenues and a services contribution of 3.0% of gross room revenues.
The DoubleTree Sunrise property has a franchise agreement with Hilton Franchise Holding LLC, a Delaware limited liability company (as successor in interest to Doubletree Franchise LLC). The current franchise agreement is effective as of May 28, 2014 for a term of approximately 15 years, with an expiration date of May 31, 2029. The franchise agreement provides for a royalty fee of 5.0% of gross room revenues and a program fee of 4.0% of gross room revenues.
The DoubleTree Charlotte property has a franchise agreement with Hilton Franchise Holding LLC, a Delaware limited liability company (as successor in interest to Doubletree Franchise LLC). The current franchise agreement is effective as of October 30, 2014 for a term of approximately 15 years, with an expiration date of October 31, 2029. The franchise agreement provides for a royalty fee of 5.0% of gross room revenues and a program fee of 4.0% of gross room revenues.
The DoubleTree RTP property has a franchise agreement with Hilton Franchise Holding LLC, a Delaware limited liability company. The current franchise agreement is effective as of May 28, 2015 for a term of approximately 15 years, with an expiration date of May 31, 2030. The franchise agreement provides for a royalty fee of 5.0% of gross room revenues and a program fee of 4.0% of gross room revenues.
THE INFORMATION IN THIS STRUCTURAL AND COLLATERAL TERM SHEET IS NOT COMPLETE AND MAY BE AMENDED PRIOR TO THE TIME OF SALE. THIS TERM SHEET IS NOT AN OFFER TO SELL THESE SECURITIES AND IT IS NOT A SOLICITATION OF AN OFFER TO BUY THESE SECURITIES IN ANY JURISDICTION WHERE THE OFFER OR SALE IS NOT PERMITTED.
63 of 116
| Structural and Collateral Term Sheet | JPMCC 2019-COR5 | |
| SWVP Portfolio | ||
| Franchise Agreement Summary | |||
| Property | Flag | Franchise Fee(1) | Expiration Date |
| InterContinental | Holiday Hospitality Franchising, LLC | 8.0% | January 23, 2033 |
| DoubleTree Sunrise | Hilton Franchise Holding LLC | 9.0% | May 31, 2029 |
| DoubleTree Charlotte | Hilton Franchise Holding LLC | 9.0% | October 31, 2029 |
| DoubleTree RTP | Hilton Franchise Holding LLC | 9.0% | May 31, 2030 |
| (1) | Includes marketing fees due under the franchise agreements. |
Escrows and Reserves.At origination, the borrowers deposited into escrow (i) $5,000,000 for property improvement reserves, (ii) $990,844 for insurance reserves, (iii) $822,222 for real estate taxes and (iv) $97,938 for deferred maintenance.
Tax Escrows- On a monthly basis, the borrowers are required to escrow 1/12 of the annual estimated tax payments, which currently equates to $205,555.
Insurance Escrows -On a monthly basis, the borrowers are required to escrow 1/12 of the annual estimated insurance premiums, which currently equates to $82,570.
FF&E Reserves- On a monthly basis, the borrowers are required to deposit an amount equal to the greater of (i) 1/12 of the amount required to be reserved annually for FF&E expenses with respect to its property under the applicable franchise agreement and (ii) 1/12 of 5.0% of aggregate annual rents (excluding hotel taxes) of its property based on the prior year (the “FF&E Reserve”).
PIP Reserves -In the event the borrowers are required to complete a property improvement plan (“PIP”), the borrowers are required to deposit an amount into a reserve for such PIP (the “PIP Reserve”) equal to (A) the estimated cost approved by the lender for such PIP over the immediately succeeding 12 month period exceeds (B)(i) the sum of (a) the amount on deposit in the FF&E Reserve allocated to such property and (b) the amount required to be deposited in the FF&E Reserve for such property over the immediately succeeding 12 month period, less (ii) the greater of (a) the sum of the Base FF&E Amounts (as set forth below) for each property not subject to such PIP and (b) the aggregate amount of budgeted approved capital expenses and FF&E expenses for such period for all SWVP Portfolio Properties, provided such deposit amount may not be less than $0, and the borrowers are entitled to certain credits set forth in the SWVP Portfolio Loan documents.
Hotel Tax Reserves -During the continuance of any Cash Management Period (as defined below), on a monthly basis, the borrowers are required to deposit an amount equal to the hotel taxes for the preceding monthly hotel tax reporting period (which is the period from and including the 21st day of any calendar month to and including the 20th day of the immediately succeeding calendar month).
“Base FF&E Amounts” means (i) with respect to the InterContinental, $1,603,580.56; (ii) with respect to the DoubleTree Sunrise, $727,295.74; (iii) with respect to the DoubleTree RTP, $538,471.37; and (iv) with respect to the DoubleTree Charlotte, $510,767.93.
Lockbox / Cash Management. The loan documents require a hard lockbox and springing cash management. The borrowers were required to send direction letters to all tenants, credit card companies and other payees instructing them to deposit all rents and credit card receipts directly into a lender controlled lockbox account for each property. The loan documents require that all rents received by the borrowers or property manager be deposited into the lockbox account within one business day of receipt. During the continuance of a Cash Management Period, all sums on deposit in the lockbox account are required to be transferred on a daily basis to a cash management account controlled by the lenders and applied and disbursed in accordance with the loan documents. Excess cash on deposit following application of funds for payment of debt service, required reserves and operating expenses will be applied as follows: (a) to the extent a Cash Management Period is in effect solely due to a Franchise Trigger Event (as defined below) to the PIP Reserve subaccount, and (b) to the extent a Cash Management Period is in effect (other than due solely as a result of a Franchise Trigger Event), to the excess cash collateral subaccount.
A “Cash Management Period” means the occurrence of any of the following: (i) the maturity date, (ii) an event of default, (iii) the date the debt service coverage ratio (as calculated in accordance with the loan documents) as of the last day of each calendar quarter during the term is less than 1.40x, (iv) the date that is 12 months prior to the maturity date, if both (a) the franchise agreement with respect to any property is scheduled to expire earlier than 24 months after the maturity date, and (b) the FF&E Reserve subaccount does not then have a balance that is equal to or greater than the product of the number of units at each property that has a franchise agreement expiring less than 24 months after the maturity date, multiplied by $20,000, (v) the date that is 12 months prior to the expiration or early termination, or if less than 12 months, the date upon which the expiration or early termination date becomes known to the borrowers if the borrowers have not provided evidence of the satisfaction of the New License Conditions (as defined below) as of such date, (vi) a PIP for the property
THE INFORMATION IN THIS STRUCTURAL AND COLLATERAL TERM SHEET IS NOT COMPLETE AND MAY BE AMENDED PRIOR TO THE TIME OF SALE. THIS TERM SHEET IS NOT AN OFFER TO SELL THESE SECURITIES AND IT IS NOT A SOLICITATION OF AN OFFER TO BUY THESE SECURITIES IN ANY JURISDICTION WHERE THE OFFER OR SALE IS NOT PERMITTED.
64 of 116
| Structural and Collateral Term Sheet | JPMCC 2019-COR5 | |
| SWVP Portfolio | ||
is required by the franchisor or replacement franchisor and the borrowers have not deposited the required PIP Reserve deposit, (clauses (iv), (v) or (vi) are referred to as a “Franchise Trigger Event”), or (vii) any voluntary or involuntary petition or bankruptcy action of the borrowers or property manager (“Insolvency Cash Management Trigger Event”).
A Cash Management Period will end upon satisfaction of certain terms and conditions including, without limitation, (A) with respect to the matters described in clause (ii) above, the cure of such event of default if no other event of default has occurred and is continuing, (B) with respect to the matter described in clause (iii) above, the lenders have determined that the property has achieved a debt service coverage ratio of at least 1.40x for two consecutive calculation dates, (C) with respect to the matter described in clause (iv) above, upon the repayment in full of the SWVP Portfolio Whole Loan, (D) with respect to the matter described in clause (v) above, the date upon which the borrowers satisfy the New License Conditions (subject to the satisfaction of the requirements in clause (E) with respect to the PIP required in connection with the satisfaction of the New License Conditions), (E) with respect to the matter described in clause (vi) above, the funds on deposit in the PIP Reserve are at least equal to the full amount of the estimated cost, as approved by the lenders, to satisfy any repairs, replacements, remediation, renovation or improvement required by the franchisor or any successor franchisor or licensor pursuant to any and all then existing PIPs, or (F) with respect to any matter described in clause (vii) above, the completion of an Insolvency Cash Management Trigger Cure (as defined below).
“Insolvency Cash Management Trigger Cure” means (1) with respect to an Insolvency Cash Management Trigger Event, any such petition or proceeding against the borrowers or manager which caused an Insolvency Cash Management Trigger Event is subject to a final nonappealable dismissal or (2) with respect to an Insolvency Cash Management Trigger Event pertaining to the manager, a replacement manager has been appointed for all of the SWVP Portfolio Properties.
“New License Conditions” means (i) the entering into of a replacement franchise agreement with an approved replacement flag or the extension or renewal of an existing franchise agreement, in each case for a term that does not expire until a date which is as least two years beyond the maturity date and contains market terms consistent with other license agreements issued by the approved replacement flag and (ii) a tri-party agreement or comfort letter has been issued by the approved replacement flag for the benefit of the lenders.
Partial Release. At any time on or after any payment date after the Permitted Release Date, any of the borrowers, with the exception of the SWVP New Orleans LLC borrower, may obtain the release of any of the SWVP Portfolio Properties, with the exception of the InterContinental property, provided that, among other conditions, (i) no event of default has occurred and is continuing (other than an event ofdefault which applies only to the property to be released), (ii) the borrowers prepay a portion of the SWVP Portfolio Whole Loan equal to the greater of (a) 120% of the allocated loan amount of the property being released and (b) an amount by which the principal balance of the SWVP Portfolio Whole Loan would need to be reduced to satisfy the following clauses (iii) and (iv), (iii) the debt service coverage ratio (as calculated in accordance with the loan documents) for the remaining properties following the release is not less than the greater of (1) the debt service coverage ratio immediately preceding such release and (2) 2.03x, (iv) the loan-to-value for the remaining properties is not greater than the lesser of (1) the loan-to-value immediately preceding such release and (2) 59.6%, and (v) all defeasance conditions set forth in the loan documents are satisfied.
THE INFORMATION IN THIS STRUCTURAL AND COLLATERAL TERM SHEET IS NOT COMPLETE AND MAY BE AMENDED PRIOR TO THE TIME OF SALE. THIS TERM SHEET IS NOT AN OFFER TO SELL THESE SECURITIES AND IT IS NOT A SOLICITATION OF AN OFFER TO BUY THESE SECURITIES IN ANY JURISDICTION WHERE THE OFFER OR SALE IS NOT PERMITTED.
65 of 116
| Structural and Collateral Term Sheet | JPMCC 2019-COR5 | |
| Terrace at Traverse Mountain | ||

THE INFORMATION IN THIS STRUCTURAL AND COLLATERAL TERM SHEET IS NOT COMPLETE AND MAY BE AMENDED PRIOR TO THE TIME OF SALE. THIS TERM SHEET IS NOT AN OFFER TO SELL THESE SECURITIES AND IT IS NOT A SOLICITATION OF AN OFFER TO BUY THESE SECURITIES IN ANY JURISDICTION WHERE THE OFFER OR SALE IS NOT PERMITTED.
66 of 116
| Structural and Collateral Term Sheet | JPMCC 2019-COR5 | |
| Terrace at Traverse Mountain | ||

THE INFORMATION IN THIS STRUCTURAL AND COLLATERAL TERM SHEET IS NOT COMPLETE AND MAY BE AMENDED PRIOR TO THE TIME OF SALE. THIS TERM SHEET IS NOT AN OFFER TO SELL THESE SECURITIES AND IT IS NOT A SOLICITATION OF AN OFFER TO BUY THESE SECURITIES IN ANY JURISDICTION WHERE THE OFFER OR SALE IS NOT PERMITTED.
67 of 116
| Structural and Collateral Term Sheet | JPMCC 2019-COR5 | |
| Terrace at Traverse Mountain | ||
| Mortgage Loan Information | Property Information | |||
| Mortgage Loan Seller: | LCM | Single Asset / Portfolio: | Single Asset | |
| Original Principal Balance: | $32,000,000 | Title: | Fee | |
| Cut-off Date Principal Balance: | $32,000,000 | Property Type - Subtype: | Retail – Anchored | |
| % of Pool by IPB: | 4.6% | Net Rentable Area (SF): | 117,097 | |
| Loan Purpose: | Refinance | Location: | Lehi, UT | |
| Borrower: | TMCV Retail #1 Retail Center, LLC | Year Built / Renovated: | 2016-2018 / N/A | |
| Sponsor: | Frank L. VanderSloot | Occupancy: | 90.0% | |
| Interest Rate: | 4.90000% | Occupancy Date: | 12/31/2018 | |
| Note Date: | 2/15/2019 | Number of Tenants: | 41 | |
| Maturity Date: | 3/6/2029 | 2016 NOI(1): | N/A | |
| Interest-only Period: | 120 months | 2017 NOI(1): | N/A | |
| Original Term: | 120 months | 2018 NOI(1): | $2,046,959 | |
| Original Amortization: | None | TTM NOI(1): | N/A | |
| Amortization Type: | Interest Only | UW Economic Occupancy: | 89.5% | |
| Call Protection: | L(27),Def(90),O(3) | UW Revenues: | $3,668,116 | |
| Lockbox / Cash Management: | Hard / Springing | UW Expenses: | $719,197 | |
| Additional Debt: | N/A | UW NOI: | $2,948,919 | |
| Additional Debt Balance: | N/A | UW NCF: | $2,780,299 | |
| Additional Debt Type: | N/A | Appraised Value / Per SF: | $54,950,000 / $469 | |
| Appraisal Date: | 12/7/2018 | |||
| Escrows and Reserves(2) | Financial Information | ||||||||
| Initial | Monthly | Initial Cap | Cut-off Date Loan / SF: | $273 | |||||
| Taxes: | $100,000 | $22,000 | N/A | Maturity Date Loan / SF: | $273 | ||||
| Insurance: | $2,700 | $2,700 | N/A | Cut-off Date LTV: | 58.2% | ||||
| Replacement Reserves: | $0 | $1,854 | N/A | Maturity Date LTV: | 58.2% | ||||
| TI/LC: | $0 | $9,758 | N/A | UW NCF DSCR: | 1.75x | ||||
| Other: | $284,084 | N/A | N/A | UW NOI Debt Yield: | 9.2% | ||||
| |||||||||
| Sources and Uses | |||||||||
| Sources | Proceeds | % of Total | Uses | Proceeds | % of Total | ||||
| Mortgage Loan | $32,000,000 | 80.7% | Payoff Existing Debt(3) | $34,505,208 | 87.0% | ||||
| Other Sources(3) | 7,650,000 | 19.3 | Closing Costs | 548,210 | 1.4 | ||||
| Upfront Reserves | 386,784 | 1.0 | |||||||
| Return of Equity | 4,209,799 | 10.6 | |||||||
| Total Sources | $39,650,000 | 100.0% | Total Uses | $39,650,000 | 100.0% | ||||
| (1) | 2015-2017 NOI are not available as the Terrace at Traverse Mountain Property (as defined below) was recently constructed between 2016 and 2018. 2018 NOI represents a partial year lease-up period. |
| (2) | For a full description of Escrows and Reserves, please refer to“Escrows and Reserves”below. |
| (3) | The construction loan related to the Terrace at Traverse Mountain Property (with a principal balance of approximately $34.5 million) was secured by the Terrace at Traverse Mountain Property as well as an adjacent Harmon’s grocery store (68,140 square feet) which is not part of the collateral for the Terrace at Traverse Mountain Loan (as defined below). An affiliate of LCM provided an affiliate of the borrower with an approximately $7.7 million floating-rate loan secured by the adjacent Harmons grocery store property. |
The Loan.The Terrace at Traverse Mountain mortgage loan (the “Terrace at Traverse Mountain Loan”) has an outstanding principal balance as of the Cut-off Date of $32.0 million and is secured by a first mortgage lien on the borrower’s fee interest in a newly-constructed, 117,097 square foot, anchored retail shopping center located in Lehi, Utah (the “Terrace at Traverse Mountain Property”). The Terrace at Traverse Mountain Loan has a 10-year term and requires interest-only payments for the term of the loan.
THE INFORMATION IN THIS STRUCTURAL AND COLLATERAL TERM SHEET IS NOT COMPLETE AND MAY BE AMENDED PRIOR TO THE TIME OF SALE. THIS TERM SHEET IS NOT AN OFFER TO SELL THESE SECURITIES AND IT IS NOT A SOLICITATION OF AN OFFER TO BUY THESE SECURITIES IN ANY JURISDICTION WHERE THE OFFER OR SALE IS NOT PERMITTED.
68 of 116
| Structural and Collateral Term Sheet | JPMCC 2019-COR5 | |
| Terrace at Traverse Mountain | ||
The Borrower.The borrowing entity is TMCV Retail #1 Retail Center, LLC, a Delaware limited liability company structured to be bankruptcy remote with one independent director. Legal counsel to the borrower delivered a non-consolidation opinion in connection with the origination of the Terrace at Traverse Mountain Loan.
The Loan Sponsor.The loan sponsor and nonrecourse carve-out guarantor is Frank L. VanderSloot. Mr. VanderSloot founded Melaleuca, a wellness retailer, which makes more than 400 products ranging from health supplements to eco-friendly household cleaners. Mr. Vandersloot owns an estimated 117,500 acres across Idaho, Utah and Montana. In 2018, Forbes listed Mr. VanderSloot as the 172nd wealthiest American with a net worth of approximately $4.2 billion.
The Property.The Terrace at Traverse Mountain Property is a 117,097 square foot, 90.0% leased, newly-constructed, anchored retail center located is located in Lehi, Utah. The Terrace at Traverse Mountain Property consists of a multi-tenant anchored retail center with a tenant composition of national and regional tenants including inline retail, midsize big box retail, banking and restaurant space. The Terrace at Traverse Mountain Property includes 14, one-story buildings, with a total net rentable area of approximately 117,097 square feet located on an approximately 24.2-acre lot and contains 643 surface parking spaces (approximately 5.5 per 1,000 square feet).
The Terrace at Traverse Mountain Property, recently constructed by the loan sponsor between 2016 and 2018, has a diverse mix of tenants and is anchored by Marshalls (22,000 square feet; 18.8% of net rentable area; 7.3% of underwritten base rent; rated A2/NR/A+ by Moody’s/Fitch/S&P). The remaining tenancy at the Terrace at Traverse Mountain Property includes 40 tenants with no single tenant leasing greater than 4.7% of net rentable area. As of the December 31, 2018 rent roll, the Terrace at Traverse Mountain Property was 90.0% leased to 41 tenants at weighted average underwritten rents equal to $27.80 per square foot. The Terrace at Traverse Mountain Property is shadow-anchored by a 68,140 square foot Harmons grocery store which is not part of the collateral for the Terrace at Traverse Mountain Loan.
The Market.The Terrace at Traverse Mountain Property is located in the Utah County submarket, within the greater Salt Lake City retail market. As of the first quarter of 2019, the Utah County retail submarket consisted of approximately 25.0 million square feet across 2,157 buildings with an overall market vacancy of 4.5% and average asking rents of approximately $17.02 per square foot. The appraisal identified five comparable mid box anchor retail leases at competitive properties ranging in size from 10,000 square feet to 50,216 square feet. Base rents for the comparable mid box anchor leases ranged from $8.47 per square foot to $15.75 per square foot, with a weighted average of $12.77 per square foot. The appraisal identified five comparable bank retail leases at competitive properties ranging in size from 2,320 square feet to 6,454 square feet. Base rents for the comparable bank retail leases ranged from $14.50 per square foot to $27.00 per square foot, with a weighted average of $22.17 per square foot. The appraisal identified five comparable restaurant leases at competitive properties ranging in size from 1,816 square feet to 6,628 square feet. Base rents for the comparable restaurant leases ranged from $13.75 per square foot to $30.00 per square foot, with a weighted average of $24.44 per square foot. The appraisal also identified five comparable inline leases at competitive properties ranging in size from 1,255 square feet to 3,500 square feet. Base rents for the comparable inline leases ranged from $27.00 per square foot to $34.00 per square foot, with a weighted average of $31.55 per square foot.
| Historical and Current Occupancy(1) | |||
| 2016 | 2017 | 2018 | Current(2) |
| N/A | N/A | N/A | 90.0% |
| (1) | TheTerrace at Traverse Mountain Property was recently constructed between 2016 and 2018 and therefore no historical occupancy information is available. |
| (2) | Current occupancy is as of December 31, 2018. |
THE INFORMATION IN THIS STRUCTURAL AND COLLATERAL TERM SHEET IS NOT COMPLETE AND MAY BE AMENDED PRIOR TO THE TIME OF SALE. THIS TERM SHEET IS NOT AN OFFER TO SELL THESE SECURITIES AND IT IS NOT A SOLICITATION OF AN OFFER TO BUY THESE SECURITIES IN ANY JURISDICTION WHERE THE OFFER OR SALE IS NOT PERMITTED.
69 of 116
| Structural and Collateral Term Sheet | JPMCC 2019-COR5 | |
| Terrace at Traverse Mountain | ||
| Tenant Summary(1) | ||||||||
| Tenant | Ratings(2) Moody’s/Fitch/S&P | Net Rentable Area (SF) | % of Total NRA | Base Rent PSF(3) | % of Total Base Rent(3) | Most Recent Sales PSF(4) | Occupancy Cost(4) | Lease Expiration Date |
| Marshalls(5) | A2 / NR / A+ | 22,000 | 18.8% | $9.76 | 7.3% | NAV | NAV | 8/31/2028 |
| R&R BBQ(5) | NR / NR / NR | 5,510 | 4.7 | $29.09 | 5.5 | NAV | NAV | 6/30/2027 |
| Tsunami(5) | NR / NR / NR | 5,280 | 4.5 | $31.00 | 5.6 | NAV | NAV | 11/30/2026 |
| Original Pancake(5) | NR / NR / NR | 4,200 | 3.6 | $35.00 | 5.0 | NAV | NAV | 12/31/2038 |
| Braza Grill Lehi(5) | NR / NR / NR | 4,000 | 3.4 | $33.00 | 4.5 | NAV | NAV | 8/31/2026 |
| Taqueria 27(5) | NR / NR / NR | 4,000 | 3.4 | $31.00 | 4.2 | NAV | NAV | 8/31/2025 |
| Café Rio(5) | NR / NR / NR | 3,497 | 3.0 | $31.00 | 3.7 | NAV | NAV | 10/31/2026 |
| Amara Day Spa(5) | NR / NR / NR | 3,000 | 2.6 | $32.90 | 3.4 | NAV | NAV | 8/31/2026 |
| JP Morgan Chase Bank(5) | A2 / AA- / A- | 2,999 | 2.6 | $40.02 | 4.1 | NAV | NAV | 10/31/2037 |
| Chedda Burger(5) | NR / NR / NR | 2,959 | 2.5 | $32.00 | 3.2 | NAV | NAV | 8/31/2026 |
| Top 10 Total / Wtd. Avg. | 57,445 | 49.1% | $23.74 | 46.5% | ||||
| Other Tenants | 47,970 | 41.0 | $32.67 | 53.5 | ||||
| Total Occupied Space | 105,415 | 90.0% | $27.80 | 100.0% | ||||
| Vacant | 11,682 | 10.0 | ||||||
| Total | 117,097 | 100.0% | ||||||
| (1) | Based on the underwritten rent roll dated as of December 31, 2018. |
| (2) | In certain instances, ratings provided are those of the parent company of the entity shown, whether or not the parent company guarantees the lease. |
| (3) | Base Rent includes average rent over the lease term for investment grade tenants Marshalls ($5,789) and JP Morgan Chase Bank ($9,043) and approximately $11,890 in contractual rent steps through April 2020 for certain tenants. |
| (4) | Most Recent Sales PSF and Occupancy Costs are not available as the Terrace at Traverse Mountain Property was recently constructed between 2016 and 2018. |
| (5) | Marshalls has four, five-year renewal options remaining, R&R BBQ has two, five-year renewal options remaining, Tsunami has two, five-year renewal options remaining, Original Pancake has two, five-year renewal options remaining, Braza Grill Lehi has two, 10-year renewal options remaining, Taqueria 27 has two, five-year renewal options remaining, Café Rio has two, five-year renewal options remaining, Amara Day Spa has two, five-year renewal options remaining, JP Morgan Chase Bank has four, five-year renewal options remaining and Chedda Burger has two, five-year renewal options remaining. |
| Lease Rollover Schedule(1)(2) | |||||||||
| Year | Number of Leases Expiring | Net Rentable Area Expiring | % of NRA Expiring | Base Rent Expiring(3) | % of Base Rent Expiring(3) | Cumulative Net Rentable Area Expiring | Cumulative % of NRA Expiring | Cumulative Base Rent Expiring(3) | Cumulative % of Base Rent Expiring(3) |
| Vacant | NAP | 11,682 | 10.0% | NAP | NAP | 11,682 | 10.0% | NAP | NAP |
| 2019 & MTM | 0 | 0 | 0.0% | $0 | 0.0% | 11,682 | 10.0% | $0 | 0.0% |
| 2020 | 0 | 0 | 0.0% | 0 | 0.0% | 11,682 | 10.0% | $0 | 0.0% |
| 2021 | 2 | 2,701 | 2.3% | 85,629 | 2.9% | 14,383 | 12.3% | $85,629 | 2.9% |
| 2022 | 8 | 13,075 | 11.2% | 419,847 | 14.3% | 27,458 | 23.4% | $505,476 | 17.2% |
| 2023 | 6 | 9,545 | 8.2% | 304,726 | 10.4% | 37,003 | 31.6% | $810,202 | 27.6% |
| 2024 | 1 | 943 | 0.8% | 27,661 | 0.9% | 37,946 | 32.4% | $837,863 | 28.6% |
| 2025 | 1 | 4,000 | 3.4% | 124,000 | 4.2% | 41,946 | 35.8% | $961,863 | 32.8% |
| 2026 | 12 | 28,670 | 24.5% | 938,805 | 32.0% | 70,616 | 60.3% | $1,900,668 | 64.8% |
| 2027 | 5 | 11,862 | 10.1% | 375,809 | 12.8% | 82,478 | 70.4% | $2,276,477 | 77.7% |
| 2028 | 3 | 25,199 | 21.5% | 322,343 | 11.0% | 107,677 | 92.0% | $2,598,820 | 88.7% |
| 2029 | 1 | 2,221 | 1.9% | 65,149 | 2.2% | 109,898 | 93.9% | $2,663,969 | 90.9% |
| 2030 & Beyond | 2 | 7,199 | 6.1% | 267,006 | 9.1% | 117,097 | 100.0% | $2,930,976 | 100.0% |
| Total | 41 | 117,097 | 100.0% | $2,930,976 | 100.0% | ||||
| (1) | Based on the underwritten rent roll dated December 31, 2018. |
| (2) | Certain tenants have lease termination options that may become exercisable prior to the originally stated expiration date of the tenant lease and that are not considered in the lease rollover schedule. |
| (3) | Base Rent Expiring includes average rent over the lease term for investment grade tenants Marshalls ($5,789) and JP Morgan Chase Bank ($9,043) and approximately $11,890 in contractual rent steps through April 2020 for certain tenants. |
THE INFORMATION IN THIS STRUCTURAL AND COLLATERAL TERM SHEET IS NOT COMPLETE AND MAY BE AMENDED PRIOR TO THE TIME OF SALE. THIS TERM SHEET IS NOT AN OFFER TO SELL THESE SECURITIES AND IT IS NOT A SOLICITATION OF AN OFFER TO BUY THESE SECURITIES IN ANY JURISDICTION WHERE THE OFFER OR SALE IS NOT PERMITTED.
70 of 116
| Structural and Collateral Term Sheet | JPMCC 2019-COR5 | |
| Terrace at Traverse Mountain | ||
| Operating History and Underwritten Net Cash Flow(1) | ||||||||
| 2018 | Underwritten | Per Square Foot | %(2) | |||||
| Rents in Place | $2,419,046 | $2,904,253 | $24.80 | 70.8 | % | |||
| Contractual Rent Steps(3) | 0 | 11,890 | 0.10 | 0.3 | ||||
| Straight Line Rent(4) | 0 | 14,833 | 0.13 | 0.4 | ||||
| Vacant Income | 0 | 373,824 | 3.19 | 9.1 | ||||
| Gross Potential Rent | $2,419,046 | $3,304,800 | $28.22 | 80.6 | % | |||
| Total Reimbursements | 61,403 | 719,197 | 6.14 | 17.5 | ||||
| Total Other Income | 6,606 | 75,356 | 0.64 | 1.8 | ||||
| Net Rental Income | $2,487,054 | $4,099,352 | $35.01 | 100.0 | % | |||
| (Vacancy/Credit Loss) | 0 | (431,236) | (3.68) | (10.5 | ) | |||
| Effective Gross Income | $2,487,054 | $3,668,116 | $31.33 | 89.5 | % | |||
| Total Operating Expenses | 440,095 | 719,197 | 6.14 | 19.6 | ||||
| Net Operating Income | $2,046,959 | $2,948,919 | $25.18 | 80.4 | % | |||
| Total TI/LC, Capex/RR | 0 | 168,620 | 1.44 | 4.6 | ||||
| Net Cash Flow | $2,046,959 | $2,780,299 | $23.74 | 75.8 | % | |||
| (1) | 2015-2017 NOI are not available as the Terrace at Traverse Mountain Property was recently constructed between 2016 and 2018. 2018 NOI represents a partial year lease-up period. |
| (2) | % column represents percent of Net Rental Income for all revenue lines and represents percent of Effective Gross Income for the remainder of the fields. |
| (3) | Based on the contractual rent steps through April 2020 for certain tenants. |
| (4) | Based on the average rent over the lease term for investment grade tenants Marshalls ($5,789) and JP Morgan Chase Bank ($9,043). |
Property Management.The Terrace at Traverse Mountain Property is managed by Gardner Batt, LLC, an affiliate of the borrower.
Escrows and Reserves. At origination, the borrower deposited approximately $284,084 for outstanding tenant improvements and leasing commissions, $100,000 for real estate taxes and $2,700 for insurance premiums.
Tax Escrows– On a monthly basis,the borrower is required to escrow 1/12 of the annual estimated tax premiums, which currently equates to $22,000.
Insurance Escrows– On a monthly basis,the borrower is required to escrow 1/12 of the annual estimated insurance premiums, which currently equates to $2,700.
Replacement Reserves –On a monthly basis, the borrower is required to escrow $1,854 for replacement reserves.
TI/LC Reserves – On a monthly basis, the borrower is required to escrow $9,758 for tenant improvements and leasing commissions.
Lockbox / Cash Management.The Terrace at Traverse Mountain Loan is structured with a hard lockbox and springing cash management. All rents are required to be deposited directly by the tenants into a lockbox account controlled by the lender. All funds in the lockbox account are required to be swept daily into the borrower’s operating account, unless a Cash Management Period (as defined below) is continuing. Upon the occurrence of a Cash Management Period, all funds in the lockbox account will be swept daily into a lender-controlled account, from which account such funds will be disbursed on each payment date in accordance with the loan documents and any excess will be retained by the lender as additional collateral for the Terrace at Traverse Mountain Loan.
A “Cash Management Period” will commence (i) upon an event of default, (ii) if the debt yield is less than 7.25%, (iii) upon the death or incapacity of the loan sponsor or (iv) upon the commencement of a Lease Sweep Period (as defined below).
A “Lease Sweep Period” will commence (i) on the date that is six months prior to the end of the term (including any renewal terms) of any Lease Sweep Lease (as defined below), (ii) on the date this is required under a Lease Sweep Lease (as defined below) by which the applicable Lease Sweep Tenant (as defined below) is required to give notice of its exercise of a renewal option thereunder (and such renewal has not so been exercised), (iii) if any Lease Sweep Lease is surrendered, cancelled or terminated prior to its then-current expiration date, (iv) if any Lease Sweep Tenant goes dark or gives notice that it intends to discontinue its business at its premises, (v) upon the occurrence and continuance of a default under any Lease Sweep Lease or (vi) upon the occurrence of a Lease Sweep Tenant insolvency proceeding.
THE INFORMATION IN THIS STRUCTURAL AND COLLATERAL TERM SHEET IS NOT COMPLETE AND MAY BE AMENDED PRIOR TO THE TIME OF SALE. THIS TERM SHEET IS NOT AN OFFER TO SELL THESE SECURITIES AND IT IS NOT A SOLICITATION OF AN OFFER TO BUY THESE SECURITIES IN ANY JURISDICTION WHERE THE OFFER OR SALE IS NOT PERMITTED.
71 of 116
| Structural and Collateral Term Sheet | JPMCC 2019-COR5 | |
| Terrace at Traverse Mountain | ||
A “Lease Sweep Lease” means any lease which covers 23,000 or more square feet.
A “Lease Sweep Tenant” means any tenant under a Lease Sweep Lease, or under one or more leases which when taken together would constitute a Lease Sweep Lease.
Partial Release.The Terrace at Traverse Mountain Loan provides for the release of an unimproved outparcel tract consisting of approximately 0.825 acres,provided that, among other things, the release is in compliance with the REMIC conditions.
THE INFORMATION IN THIS STRUCTURAL AND COLLATERAL TERM SHEET IS NOT COMPLETE AND MAY BE AMENDED PRIOR TO THE TIME OF SALE. THIS TERM SHEET IS NOT AN OFFER TO SELL THESE SECURITIES AND IT IS NOT A SOLICITATION OF AN OFFER TO BUY THESE SECURITIES IN ANY JURISDICTION WHERE THE OFFER OR SALE IS NOT PERMITTED.
72 of 116
| Structural and Collateral Term Sheet | JPMCC 2019-COR5 | |
| Peppertree Plaza | ||

THE INFORMATION IN THIS STRUCTURAL AND COLLATERAL TERM SHEET IS NOT COMPLETE AND MAY BE AMENDED PRIOR TO THE TIME OF SALE. THIS TERM SHEET IS NOT AN OFFER TO SELL THESE SECURITIES AND IT IS NOT A SOLICITATION OF AN OFFER TO BUY THESE SECURITIES IN ANY JURISDICTION WHERE THE OFFER OR SALE IS NOT PERMITTED.
73 of 116
| Structural and Collateral Term Sheet | JPMCC 2019-COR5 | |
| Peppertree Plaza | ||

THE INFORMATION IN THIS STRUCTURAL AND COLLATERAL TERM SHEET IS NOT COMPLETE AND MAY BE AMENDED PRIOR TO THE TIME OF SALE. THIS TERM SHEET IS NOT AN OFFER TO SELL THESE SECURITIES AND IT IS NOT A SOLICITATION OF AN OFFER TO BUY THESE SECURITIES IN ANY JURISDICTION WHERE THE OFFER OR SALE IS NOT PERMITTED.
74 of 116
| Structural and Collateral Term Sheet | JPMCC 2019-COR5 | |
| Peppertree Plaza | ||
| Mortgage Loan Information | Property Information | |||
| Mortgage Loan Seller: | LCM | Single Asset / Portfolio: | Single Asset | |
| Original Principal Balance: | $31,850,000 | Title: | Fee | |
| Cut-off Date Principal Balance: | $31,850,000 | Property Type - Subtype: | Retail – Anchored | |
| % of Pool by IPB: | 4.6% | Net Rentable Area (SF): | 248,901 | |
| Loan Purpose: | Acquisition | Location: | Margate, FL | |
| Borrower: | Peppertree Plaza, LLC | Year Built / Renovated: | 1980 / 2015 | |
| Sponsor: | Yoram Izhak | Occupancy: | 95.1% | |
| Interest Rate: | 4.90000% | Occupancy Date: | 5/1/2019 | |
| Note Date: | 12/20/2018 | Number of Tenants: | 48 | |
| Maturity Date: | 1/6/2029 | 2016 NOI: | $2,749,402 | |
| Interest-only Period: | 48 months | 2017 NOI: | $3,114,606 | |
| Original Term: | 120 months | 2018 NOI(1): | $3,275,104 | |
| Original Amortization: | 360 months | TTM NOI(1): | N/A | |
| Amortization Type: | IO–Balloon | UW Economic Occupancy: | 93.0% | |
| Call Protection: | L(29),Def(88),O(3) | UW Revenues: | $5,090,528 | |
| Lockbox / Cash Management: | Hard / Springing | UW Expenses: | $1,668,951 | |
| Additional Debt: | N/A | UW NOI: | $3,421,577 | |
| Additional Debt Balance: | N/A | UW NCF: | $3,175,165 | |
| Additional Debt Type: | N/A | Appraised Value / Per SF: | $46,600,000 / $187 | |
| Appraisal Date: | 12/4/2018 | |||
| Escrows and Reserves(2) | Financial Information | ||||||
| Initial | Monthly | Initial Cap | Cut-off Date Loan / SF: | $128 | |||
| Taxes: | $205,189 | $68,396 | N/A | Maturity Date Loan / SF: | $115 | ||
| Insurance: | $109,422 | $15,176 | N/A | Cut-off Date LTV: | 68.3% | ||
| Replacement Reserves: | $0 | $5,185 | $300,000 | Maturity Date LTV: | 61.7% | ||
| TI/LC: | $777,286 | $12,056 | $600,000 | UW NCF DSCR: | 1.57x | ||
| Other: | $119,882 | N/A | N/A | UW NOI Debt Yield: | 10.7% | ||
| Sources and Uses | ||||||
| Sources | Proceeds | % of Total | Uses | Proceeds | % of Total | |
| Mortgage Loan | $31,850,000 | 70.1% | Purchase Price(3) | $43,664,462 | 96.1% | |
| Sponsor Equity | 13,577,125 | 29.9 | Upfront Reserves | 1,211,778 | 2.7% | |
| Closing Costs | 550,884 | 1.2% | ||||
| Total Sources | $45,427,125 | 100.0% | Total Uses | $45,427,125 | 100.0% | |
| (1) | 2018 NOI represents the trailing 12-month period ending on August 31, 2018. There is a gap in the historical financials after the loan sponsor’s acquisition in December 2018 as well as a change in financial reporting and therefore a more recent trailing 12-month period is unavailable. |
| (2) | For a full description of Escrows and Reserves, please refer to“Escrows and Reserves”below. |
| (3) | Represents the net purchase price after prorations and adjustments. The gross purchase price was equal to $45.5 million. |
The Loan.The Peppertree Plaza mortgage loan (the “Peppertree Plaza Loan”) has an outstanding principal balance as of the Cut-off Date of approximately $31.9 million and is secured by a first mortgage lien on the borrower’s fee interest in a 248,901 square foot, anchored retail shopping center located in Margate, Florida (the “Peppertree Plaza Property”). The Peppertree Plaza Loan has a 10-year term and, following a four-year interest-only period, will amortize on a 30-year schedule.
The Borrower.The borrowing entity is Peppertree Plaza, LLC, a Delaware limited liability company structured to be bankruptcy remote with two independent directors. Legal counsel to the borrower delivered a non-consolidation opinion in connection with the origination of the Peppertree Plaza Loan.
THE INFORMATION IN THIS STRUCTURAL AND COLLATERAL TERM SHEET IS NOT COMPLETE AND MAY BE AMENDED PRIOR TO THE TIME OF SALE. THIS TERM SHEET IS NOT AN OFFER TO SELL THESE SECURITIES AND IT IS NOT A SOLICITATION OF AN OFFER TO BUY THESE SECURITIES IN ANY JURISDICTION WHERE THE OFFER OR SALE IS NOT PERMITTED.
75 of 116
| Structural and Collateral Term Sheet | JPMCC 2019-COR5 | |
| Peppertree Plaza | ||
The Loan Sponsor.The loan sponsor and nonrecourse carve-out guarantor is Yoram Izhak. Mr. Izhak is the president and CEO of IMC Equity Group (“IMC”). Incorporated in 2002, IMC is headquartered in North Miami, Florida. Originally started with only one employee, IMC has grown and developed into a full service commercial real estate holding company employing over 120 full-time employees.
The Property.The Peppertree Plaza Property is a 248,901 square foot, 95.1% leased grocery-anchored retail center located in Margate, Florida, within Broward County. Margate is bordered by Coconut Creek to the east, North Lauderdale to the south, and Coral Springs to the northwest. Margate is less than three miles west of Pompano Beach and approximately 30 miles north of Miami. The Peppertree Plaza Property is located at one of Broward County’s busiest intersections, with a traffic count of approximately 111,100 vehicles per day.
The Peppertree Plaza Property was originally built in 1980 and renovated in 2015. The Peppertree Plaza Property is situated on a 30.17-acre site and is improved with four, single-story buildings arranged in a U-shape pattern with 1,330 parking spaces (5.3 per 1,000 square feet) in the central surface parking lot. The Peppertree Plaza Property has diverse mix of anchors including Winn Dixie (56,000 square feet, 22.5% of net rentable area) which relocated to the Peppertree Plaza Property in 2010 from another location within the submarket, Sam Ash Music (25,460 square feet; 10.2% of net rentable area), which has been a tenant at the Peppertree Plaza Property for over 20 years, Planet Fitness (18,847 square feet, 7.6% of net rentable area) which had 4,153 members as of July 2018, and Office Depot (15,948 square feet, 6.4% of net rentable area), which extended its lease term in 2015 through March 2025. The remaining tenancy at the Peppertree Plaza Property includes 44 tenants with no single tenant leasing greater than 4.1% of net rentable area. As of the May 1, 2019 rent roll, the Peppertree Plaza Property was 95.1% leased to 48 tenants at a weighted average underwritten base rent equal to $14.97 per square foot.
The Market.The Peppertree Plaza Property is located in the Pompano Beach submarket, within the greater South Florida retail market. As of the first quarter of 2019, the Pompano Beach retail submarket consisted of approximately 16.0 million square feet across 1,077 buildings with an overall market vacancy of 5.5% and average asking rents of approximately $21.06 per square foot. The appraisal identified 26 comparable grocery anchor retail leases at competitive properties ranging in size from 12,500 square feet to 55,819 square feet. Base rents for the comparable grocery anchor leases ranged from $4.50 per square foot to $45.00 per square foot, with a weighted average of $12.51 per square foot. The appraisal identified 34 non-grocery anchor and junior anchor comparable retail leases at competitive properties ranging in size from 8,000 square feet to 65,000 square feet. Base rents for the comparable non-grocery anchor and junior anchor leases ranged from $9.75 per square foot to $27.00 per square foot, with a weighted average of $15.81 per square foot. The appraisal identified 19 comparable fitness leases at competitive properties ranging in size from 5,640 square feet to 55,000 square feet. Base rents for the comparable fitness leases ranged from $7.00 per square foot to $40.00 per square foot, with a weighted average of $17.92 per square foot. The appraisal also identified six comparable inline leases at competitive properties ranging in size from 1,200 square feet to 3,000 square feet. Base rents for the comparable inline leases ranged from $17.45 per square foot to $25.00 per square foot, with a weighted average of $20.34 per square foot.
| Historical and Current Occupancy | |||
| 2016 | 2017 | 2018(1) | Current(2) |
| 97.2% | 97.0% | 95.4% | 95.1% |
| (1) | 2018 represents occupancy as of August 31, 2018. |
| (2) | Current occupancy isas of May 1, 2019. |
THE INFORMATION IN THIS STRUCTURAL AND COLLATERAL TERM SHEET IS NOT COMPLETE AND MAY BE AMENDED PRIOR TO THE TIME OF SALE. THIS TERM SHEET IS NOT AN OFFER TO SELL THESE SECURITIES AND IT IS NOT A SOLICITATION OF AN OFFER TO BUY THESE SECURITIES IN ANY JURISDICTION WHERE THE OFFER OR SALE IS NOT PERMITTED.
76 of 116
| Structural and Collateral Term Sheet | JPMCC 2019-COR5 | |
| Peppertree Plaza | ||
| Tenant Summary(1) | ||||||||
| Tenant | Ratings Moody’s/Fitch/S&P | Net Rentable Area (SF) | % of Total NRA | Base Rent PSF(2) | % of Total Base Rent(2) | Most Recent Sales PSF | Occupancy Cost | Lease Expiration Date |
| Winn Dixie(3)(4) | NR / NR / NR | 56,000 | 22.5% | $8.50 | 13.4% | $351 | 4.3% | 6/30/2030 |
| Sam Ash Music(3) | NR / NR / NR | 25,460 | 10.2 | $9.00 | 6.5 | NAV | NAV | 3/31/2021 |
| Planet Fitness(3) | NR / NR / NR | 18,847 | 7.6 | $14.50 | 7.7 | NAV | NAV | 12/31/2025 |
| Office Depot(3)(4) | NR / NR / B | 15,948 | 6.4 | $11.21 | 5.0 | $241 | 7.4% | 3/31/2025 |
| Dollar Tree(3)(4) | Baa3 / NR / BBB- | 10,000 | 4.0 | $11.00 | 3.1 | $297 | 5.9% | 10/31/2030 |
| Goldfish Swim School(3)(5) | NR / NR / NR | 9,100 | 3.7 | $12.00 | 3.1 | NAV | NAV | 11/1/2029 |
| Military Recruiting Center(6) | Aaa / AAA / AA+ | 6,999 | 2.8 | $17.50 | 3.5 | NAV | NAV | 7/31/2021 |
| My Suite Beauty(3) | NR / NR / NR | 6,546 | 2.6 | $24.61 | 4.5 | NAV | NAV | 5/31/2027 |
| Learning City(3) | NR / NR / NR | 6,000 | 2.4 | $25.00 | 4.2 | NAV | NAV | 12/31/2028 |
| La Bamba Restaurant | NR / NR / NR | 5,453 | 2.2 | $28.82 | 4.4 | NAV | NAV | 9/30/2022 |
| Top 10 Total / Wtd. Avg. | 160,353 | 64.4% | $12.27 | 55.5% | ||||
| Other Tenants | 76,473 | 30.7 | $20.64 | 44.5 | ||||
| Total Occupied Space | 236,826 | 95.1% | $14.97 | 100.0% | ||||
| Vacant | 12,075 | 4.9 | ||||||
| Total | 248,901 | 100.0% | ||||||
| (1) | Based on the underwritten rent roll dated as of May 1, 2019. |
| (2) | Base Rent PSF includes approximately $57,603 in contractual rent steps through June 2020 for certain tenants. |
| (3) | Winn Dixie has six, five-year renewal options remaining, Sam Ash Music has two, five-year renewal options remaining, Planet Fitness has two, five-year renewal options remaining, Office Depot has two, five-year renewal options remaining, Dollar Tree has two, five-year renewal options remaining, Goldfish Swim School has two, five-year renewal options remaining, My Suite Beauty has two, five-year renewal options remaining and Learning City has two, five-year renewal options remaining. |
| (4) | Most Recent Sales PSF and Occupancy Cost for Winn Dixie and Office Depot represent sales for the trailing 12-month period ending December 31, 2018. Most Recent Sales PSF and Occupancy Cost for Dollar Tree represent annualized sales from January 2019 to April 2019. |
| (5) | Goldfish Swim School is not yet in occupancy as the tenant is currently building out its space and is estimated to commence paying rent in June 2019. |
| (6) | Military Recruiting Center has the right to terminate its lease at any time after May 31, 2019 by providing at least 90 days’ notice. |
Lease Rollover Schedule(1)(2) | |||||||||
| Year | Number of Leases Expiring | Net Rentable Area Expiring | % of NRA Expiring | Base Rent Expiring(3) | % of Base Rent Expiring(3) | Cumulative Net Rentable Area Expiring | Cumulative % of NRA Expiring | Cumulative Base Rent Expiring(3) | Cumulative % of Base Rent Expiring(3) |
| Vacant | NAP | 12,075 | 4.9% | NAP | NAP | 12,075 | 4.9% | NAP | NAP |
| 2019 & MTM | 4 | 4,084 | 1.6% | $89,783 | 2.5% | 16,159 | 6.5% | $89,783 | 2.5% |
| 2020 | 5 | 6,550 | 2.6% | 150,312 | 4.2% | 22,709 | 9.1% | $240,095 | 6.8% |
| 2021 | 16 | 58,908 | 23.7% | 872,087 | 24.6% | 81,617 | 32.8% | $1,112,181 | 31.4% |
| 2022 | 4 | 10,809 | 4.3% | 266,035 | 7.5% | 92,426 | 37.1% | $1,378,217 | 38.9% |
| 2023 | 6 | 13,275 | 5.3% | 321,173 | 9.1% | 105,701 | 42.5% | $1,699,390 | 47.9% |
| 2024 | 3 | 11,284 | 4.5% | 229,509 | 6.5% | 116,985 | 47.0% | $1,928,899 | 54.4% |
| 2025 | 3 | 36,920 | 14.8% | 502,310 | 14.2% | 153,905 | 61.8% | $2,431,208 | 68.6% |
| 2026 | 1 | 5,100 | 2.0% | 67,632 | 1.9% | 159,005 | 63.9% | $2,498,841 | 70.5% |
| 2027 | 1 | 6,546 | 2.6% | 161,068 | 4.5% | 165,551 | 66.5% | $2,659,908 | 75.0% |
| 2028 | 1 | 6,000 | 2.4% | 150,000 | 4.2% | 171,551 | 68.9% | $2,809,908 | 79.3% |
| 2029 | 2 | 11,350 | 4.6% | 149,700 | 4.2% | 182,901 | 73.5% | $2,959,608 | 83.5% |
| 2030 & Beyond | 2 | 66,000 | 26.5% | 586,000 | 16.5% | 248,901 | 100.0% | $3,545,608 | 100.0% |
| Total | 48 | 248,901 | 100.0% | $3,545,608 | 100.0% | ||||
| (1) | Based on the underwritten rent roll dated May 1, 2019. |
| (2) | Certain tenants have lease termination options that may become exercisable prior to the originally stated expiration date of the tenant lease and that are not considered in the lease rollover schedule. |
| (3) | Base Rent Expiring includes approximately $57,603 in contractual rent steps through June 2020 for certain tenants. |
THE INFORMATION IN THIS STRUCTURAL AND COLLATERAL TERM SHEET IS NOT COMPLETE AND MAY BE AMENDED PRIOR TO THE TIME OF SALE. THIS TERM SHEET IS NOT AN OFFER TO SELL THESE SECURITIES AND IT IS NOT A SOLICITATION OF AN OFFER TO BUY THESE SECURITIES IN ANY JURISDICTION WHERE THE OFFER OR SALE IS NOT PERMITTED.
77 of 116
| Structural and Collateral Term Sheet | JPMCC 2019-COR5 | |
| Peppertree Plaza | ||
| Operating History and Underwritten Net Cash Flow | ||||||
| 2016 | 2017 | 2018(1) | Underwritten | Per Square Foot | %(2) | |
| Rents in Place | $2,797,334 | $3,051,908 | $3,178,469 | $3,488,005 | $14.01 | 63.8% |
| Contractual Rent Steps(3) | 0 | 0 | 0 | 57,603 | 0.23 | 1.1 |
| Vacant Income | 0 | 0 | 0 | 181,325 | 0.73 | 3.3 |
| Gross Potential Rent | $2,797,334 | $3,051,908 | $3,178,469 | $3,726,933 | $14.97 | 68.2% |
| Percentage Rent | 2,620 | 0 | 0 | 0 | 0.00 | 0.0 |
| Total Reimbursements | 1,247,469 | 1,415,414 | 1,558,196 | 1,641,868 | 6.60 | 30.0 |
| Total Other Income | 71,165 | 110,991 | 52,625 | 96,053 | 0.39 | 1.8 |
| Net Rental Income | $4,118,588 | $4,578,313 | $4,789,289 | $5,464,854 | $21.96 | 100.0% |
| (Vacancy/Credit Loss) | 0 | 0 | 0 | (374,326) | (1.50) | (6.8) |
| Effective Gross Income | $4,118,588 | $4,578,313 | $4,789,289 | $5,090,528 | $20.45 | 93.2% |
| Total Operating Expenses | 1,369,186 | 1,463,707 | 1,514,185 | 1,668,951 | 6.71 | 32.8 |
| Net Operating Income | $2,749,402 | $3,114,606 | $3,275,104 | $3,421,577 | $13.75 | 67.2% |
| Total TI/LC, Capex/RR | 0 | 0 | 0 | 246,412 | 0.99 | 4.8 |
| Net Cash Flow | $2,749,402 | $3,114,606 | $3,275,104 | $3,175,165 | $12.76 | 62.4% |
| (1) | 2018 NOI represents the trailing 12-month period ending on August 31, 2018. There is a gap in the historical financials after the loan sponsor’s acquisition in December 2018 as well as a change in financial reporting and therefore a more recent trailing 12-month period is unavailable. |
| (2) | % column represents percent of Net Rental Income for all revenue lines and represents percent of Effective Gross Income for the remainder of the fields. |
| (3) | Based on the contractual rent steps through June 2020 for certain tenants. |
Property Management.The Peppertree Plaza Property is managed by IMC Property Management And Maintenance, Inc., an affiliate of the borrower.
Escrows and Reserves. At origination, the borrower deposited approximately $777,286 for outstanding tenant improvements and leasing commissions (relating to the Goldfish Swim School lease and the All Uniform lease), approximately $205,189 for real estate taxes, approximately $109,422 for insurance premiums, approximately $100,102 for free rent and $19,780 for required repairs.
Tax Escrows– On a monthly basis,the borrower is required to escrow 1/12 of the annual estimated tax premiums, which currently equates to approximately $68,396.
Insurance Escrows– On a monthly basis,the borrower is required to escrow 1/12 of the annual estimated insurance premiums, which currently equates to approximately $15,176.
Replacement Reserves –On a monthly basis, the borrower is required to escrow approximately $5,185 for replacement reserves, subject to a cap of $300,000.
TI/LC Reserves – On a monthly basis, the borrower is required to escrow approximately $12,056 for tenant improvements and leasing commissions, subject to a cap of $600,000.
Lockbox / Cash Management.The Peppertree Plaza Loan is structured with a hard lockbox and springing cash management. All rents are required to be deposited directly by the tenants into a lockbox account controlled by the lender. All funds in the lockbox account are required to be swept daily into the borrower’s operating account, unless a Cash Management Period (as defined below) is continuing. Upon the occurrence of a Cash Management Period, all funds in the lockbox account will be swept daily into a lender-controlled account, from which account such funds will be disbursed on each payment date in accordance with the loan documents and any excess will be retained by the lender as additional collateral for the Peppertree Plaza Loan.
A “Cash Management Period” will commence (i) upon an event of default, (ii) if the debt yield is less than 7.25%, (iii) upon the death or incapacity of the loan sponsor, (iv) if less than 70.0% of net rentable area is tenanted pursuant to executed leases with tenants that are in occupancy, open for business and paying full unabated rent under their respective leases or (v) upon the commencement of a Lease Sweep Period (as defined below).
A “Lease Sweep Period” will commence (i) on the date that is 12 months prior to the end of the term (including any renewal terms) of any Lease Sweep Lease (as defined below), (ii) on the date that is required under a Lease Sweep Lease by which the applicable Lease Sweep Tenant (defined below) is required to give notice of its exercise of a renewal option thereunder (and such renewal has not so been exercised), (iii) if any Lease Sweep Lease is surrendered, cancelled or terminated prior to its then-current expiration date, (iv) if any Lease
THE INFORMATION IN THIS STRUCTURAL AND COLLATERAL TERM SHEET IS NOT COMPLETE AND MAY BE AMENDED PRIOR TO THE TIME OF SALE. THIS TERM SHEET IS NOT AN OFFER TO SELL THESE SECURITIES AND IT IS NOT A SOLICITATION OF AN OFFER TO BUY THESE SECURITIES IN ANY JURISDICTION WHERE THE OFFER OR SALE IS NOT PERMITTED.
78 of 116
| Structural and Collateral Term Sheet | JPMCC 2019-COR5 | |
| Peppertree Plaza | ||
Sweep Tenant goes dark or gives notice that it intends to discontinue its business at its premises, (v) upon the occurrence and continuance of a default under any Lease Sweep Lease or (vi) upon the occurrence of a Lease Sweep Tenant insolvency proceeding.
A “Lease Sweep Lease” means the Winn Dixie lease and any lease which covers 40,000 or more square feet.
A “Lease Sweep Tenant” means any tenant under a Lease Sweep Lease, or under one or more leases which when taken together would constitute a Lease Sweep Lease.
THE INFORMATION IN THIS STRUCTURAL AND COLLATERAL TERM SHEET IS NOT COMPLETE AND MAY BE AMENDED PRIOR TO THE TIME OF SALE. THIS TERM SHEET IS NOT AN OFFER TO SELL THESE SECURITIES AND IT IS NOT A SOLICITATION OF AN OFFER TO BUY THESE SECURITIES IN ANY JURISDICTION WHERE THE OFFER OR SALE IS NOT PERMITTED.
79 of 116
| Structural and Collateral Term Sheet | JPMCC 2019-COR5 | |
| Vie Portfolio | ||

THE INFORMATION IN THIS STRUCTURAL AND COLLATERAL TERM SHEET IS NOT COMPLETE AND MAY BE AMENDED PRIOR TO THE TIME OF SALE. THIS TERM SHEET IS NOT AN OFFER TO SELL THESE SECURITIES AND IT IS NOT A SOLICITATION OF AN OFFER TO BUY THESE SECURITIES IN ANY JURISDICTION WHERE THE OFFER OR SALE IS NOT PERMITTED.
80 of 116
| Structural and Collateral Term Sheet | JPMCC 2019-COR5 | |
| Vie Portfolio | ||

THE INFORMATION IN THIS STRUCTURAL AND COLLATERAL TERM SHEET IS NOT COMPLETE AND MAY BE AMENDED PRIOR TO THE TIME OF SALE. THIS TERM SHEET IS NOT AN OFFER TO SELL THESE SECURITIES AND IT IS NOT A SOLICITATION OF AN OFFER TO BUY THESE SECURITIES IN ANY JURISDICTION WHERE THE OFFER OR SALE IS NOT PERMITTED.
81 of 116
| Structural and Collateral Term Sheet | JPMCC 2019-COR5 | |
| Vie Portfolio | ||

THE INFORMATION IN THIS STRUCTURAL AND COLLATERAL TERM SHEET IS NOT COMPLETE AND MAY BE AMENDED PRIOR TO THE TIME OF SALE. THIS TERM SHEET IS NOT AN OFFER TO SELL THESE SECURITIES AND IT IS NOT A SOLICITATION OF AN OFFER TO BUY THESE SECURITIES IN ANY JURISDICTION WHERE THE OFFER OR SALE IS NOT PERMITTED.
82 of 116
| Structural and Collateral Term Sheet | JPMCC 2019-COR5 | |
| Vie Portfolio | ||
| Mortgage Loan Information | Property Information | |||
| Mortgage Loan Seller: | JPMCB | Single Asset / Portfolio: | Portfolio | |
| Original Principal Balance(1): | $29,000,000 | Title: | Fee | |
| Cut-off Date Principal Balance(1): | $29,000,000 | Property Type – Subtype(3): | Multifamily – Various | |
| % of Pool by IPB: | 4.2% | Net Rentable Area (Beds/Units)(4): | 1,799 | |
| Loan Purpose: | Acquisition | Location: | Various | |
| Borrowers(2): | Various | Year Built / Renovated: | Various / N/A | |
| Sponsors: | Harold Rosenblum, Derrick Milam | Occupancy: | 90.0% | |
| Interest Rate: | 5.15000% | Occupancy Date: | Various | |
| Note Date: | 1/28/2019 | Number of Tenants: | N/A | |
| Maturity Date: | 2/1/2029 | 2016 NOI(5): | N/A | |
| Interest-only Period: | 120 months | 2017 NOI: | $6,386,245 | |
| Original Term: | 120 months | 2018 NOI: | $6,506,453 | |
| Original Amortization: | None | TTM NOI (as of 3/2019)(6): | $6,443,138 | |
| Amortization Type: | Interest Only | UW Economic Occupancy: | 87.6% | |
| Call Protection: | L(25),Grtr1%orYM(92),O(3) | UW Revenues: | $14,645,085 | |
| Lockbox / Cash Management: | Hard / In Place | UW Expenses: | $7,184,664 | |
| Additional Debt: | Yes | UW NOI(6): | $7,460,421 | |
| Additional Debt Balance(1): | $46,385,000 | UW NCF: | $7,460,421 | |
| Additional Debt Type(1): | Pari Passu | Appraised Value / Per Bed/Unit: | $120,600,000 / $67,037 | |
| Appraisal Date: | Various | |||
| Escrows and Reserves(7) | Financial Information(1) | ||||||||
| Initial | Monthly | Initial Cap | Cut-off Date Loan / Unit: | $41,904 | |||||
| Taxes: | $652,075 | $133,333 | N/A | Maturity Date Loan / Unit: | $41,904 | ||||
| Insurance: | $0 | Springing | N/A | Cut-off Date LTV: | 62.5% | ||||
| Replacement Reserves: | $25,738 | $25,738 | N/A | Maturity Date LTV: | 62.5% | ||||
| TI/LC: | $0 | $0 | N/A | UW NCF DSCR: | 1.90x | ||||
| Other: | $8,088,805 | $62,632 | N/A | UW NOI Debt Yield: | 9.9% | ||||
| Sources and Uses | ||||||
| Sources | Proceeds | % of Total | Uses | Proceeds | % of Total | |
| Mortgage Loan(1) | $75,385,000 | 59.1% | Purchase Price(8) | $116,055,000 | 91.0% | |
| Sponsor Equity | 52,212,028 | 40.9 | Upfront Reserves | 8,766,618 | 6.9 | |
| Closing Costs | 2,775,410 | 2.2 | ||||
| Total Sources | $127,597,028 | 100.0% | Total Uses | $127,597,028 | 100.0% | |
| (1) | The Vie Portfolio Loan (as defined below) is part of a whole loan evidenced by threepari passu notes, with an aggregate outstanding principal balance as of the Cut-off Date of approximately $75.4 million. The Financial Information presented in the chart above reflects the aggregate Cut-off Date Balance of the approximately $75.4 million Vie Portfolio Whole Loan (as defined below). |
| (2) | The borrowers are University Downs Funding Company LLC, University View Apartments Funding Company LLC, Ella Lofts Funding Company LLC, Hillcrest Oakwood Funding Company LLC, Southgate Funding Company LLC and Colonie Funding Company LLC. |
| (3) | The majority of the Vie Portfolio (as defined below) occupancy comes from student housing. |
| (4) | 1,799 units represents 430 beds at the University Downs Property, 252 beds at the Ella Lofts Property, 165 beds at the University View Property, 184 units at the Colonie property, 616 beds at the Hillcrest Oakwood property and 152 units at the Southgate property. |
| (5) | 2016 NOI is not available because the Ella Lofts Property did not open until fall 2016. |
| (6) | The increase in UW NOI from TTM NOI is primarily attributable to in-place rental rates, vacancy and rent rolls. |
| (7) | For a full description of Escrows and Reserves, please refer to “Escrows and Reserves” below. |
| (8) | Purchase price includes the recapitalization of the Hillcrest Oakwood property, Southgate property and Colonie property and the acquisition of the University Downs Property, Ella Lofts Property and University View Property. |
THE INFORMATION IN THIS STRUCTURAL AND COLLATERAL TERM SHEET IS NOT COMPLETE AND MAY BE AMENDED PRIOR TO THE TIME OF SALE. THIS TERM SHEET IS NOT AN OFFER TO SELL THESE SECURITIES AND IT IS NOT A SOLICITATION OF AN OFFER TO BUY THESE SECURITIES IN ANY JURISDICTION WHERE THE OFFER OR SALE IS NOT PERMITTED.
83 of 116
| Structural and Collateral Term Sheet | JPMCC 2019-COR5 | |
| Vie Portfolio | ||
The Loan.The Vie Portfolio loan (the “Vie Portfolio Loan”) is secured by a first mortgage lien on the borrower’s fee interests in six predominantly student-housing properties located in six states consisting of 1,463 beds across four properties and 336 units across two properties, for a total of 1,799 units (collectively, the “Vie Portfolio Properties” or the “Vie Portfolio”). The Vie Portfolio Loan is part of a whole loan that has an aggregate outstanding principal balance as of the Cut-off Date of approximately $75.4 million (the “Vie Portfolio Whole Loan”) and is comprised of threepari passunotes, each as described below. The controlling Note A-1, with an outstanding principal balance as of the Cut-off Date of approximately $29.0 million, will be contributed to the JPMCC 2019-COR5 Trust. The relationship between the holders of the Vie Portfolio Whole Loan will be governed by a co-lender agreement as described under the “Description of the Mortgage Pool—The Whole Loans—The Serviced Pari Passu Whole Loans” in the Preliminary Prospectus. The Vie Portfolio Whole Loan has a 10-year term and is interest-only for the full term.
| Whole Loan Summary | |||||
| Note | Original Balance | Cut-off Date Balance | Note Holder | Controlling Piece | |
| A-1 | $29,000,000 | $29,000,000 | JPMCC 2019-COR5 | Yes | |
| A-2 | 17,500,000 | 17,500,000 | Benchmark 2019-B10 | No | |
| A-3 | 28,885,000 | 28,885,000 | JPMCB | No | |
| Total | $75,385,000 | $75,385,000 | |||
The Borrowers.The borrowing entities are University Downs Funding Company LLC, University View Apartments Funding Company LLC, Ella Lofts Funding Company LLC, Hillcrest Oakwood Funding Company LLC, Southgate Funding Company LLC and Colonie Funding Company LLC, each a Delaware limited liability company and special purpose entity structured to be bankruptcy remote with two independent directors. Legal counsel to the borrower delivered a non-consolidation opinion in connection with the origination of the Vie Portfolio Whole Loan.
The Loan Sponsors.The loan sponsors are a joint venture between Vie Management (“Vie”), formerly known as The Woodlark Companies, and Sidra Capital. The non-recourse carveout guarantors are Harold Rosenblum and Derrick Milam, the key principals of Vie. Founded in 2001, Vie is a real estate investment company specializing in the acquisition, financing and ownership of multifamily housing and currently operates 10 multifamily properties in 10 states. Founded in 2009 and headquartered in Saudi Arabia, Sidra Capital is a financial services company that specializes in asset management, corporate finance and advisory and investment advisory. As of year-end 2018, Sidra Capital had approximately 6.6 billion Saudi Arabian Riyal under management, which is approximately $1.8 billion as of May 2, 2019.
Proceeds of the Vie Portfolio Whole Loan and approximately $52.2 million of sponsor equity were used to recapitalize the Hillcrest & Oakwood property, Southgate property and Colonie property and to acquire the University Downs Property, Ella Lofts Property and University View Property, for a total purchase price of approximately $116.1 million. Vie previously operated the Hillcrest & Oakwood property, Southgate property and Colonie property without Sidra Capital.
| Portfolio Summary | ||||||||||||||||
| Property | Net Rentable Area (SF)(1) | Year Built(1) | Allocated Whole Loan Amount | % of Allocated Loan Amount | Appraised Value | % of Appraised Value | UW NCF | % UW NCF | ||||||||
| University Downs | 233,420 | 2011 | $20,510,000 | 27.2 | % | $34,500,000 | 28.6 | % | $1,628,114 | 21.8 | % | |||||
| Ella Lofts | 85,754 | 2016 | 15,040,000 | 20.0 | $22,300,000 | 18.5 | 1,320,955 | 17.7 | ||||||||
| University View | 92,895 | 2009 | 14,350,000 | 19.0 | $21,600,000 | 17.9 | 1,128,740 | 15.1 | ||||||||
| Colonie | 177,600 | 1973 | 9,505,000 | 12.6 | $15,500,000 | 12.9 | 1,036,719 | 13.9 | ||||||||
| Hillcrest Oakwood | 264,768 | 1969/2002 | 9,420,000 | 12.5 | $17,200,000 | 14.3 | 1,451,765 | 19.5 | ||||||||
| Southgate | 160,039 | 1969 | 6,560,000 | 8.7 | $9,500,000 | 7.9 | 894,128 | 12.0 | ||||||||
| Total/Wtd. Avg. | 1,014,476 | $75,385,000 | 100.0 | % | $120,600,000 | 100.0 | % | $7,460,421 | 100.0 | % | ||||||
| (1) | Based on the appraisals. |
THE INFORMATION IN THIS STRUCTURAL AND COLLATERAL TERM SHEET IS NOT COMPLETE AND MAY BE AMENDED PRIOR TO THE TIME OF SALE. THIS TERM SHEET IS NOT AN OFFER TO SELL THESE SECURITIES AND IT IS NOT A SOLICITATION OF AN OFFER TO BUY THESE SECURITIES IN ANY JURISDICTION WHERE THE OFFER OR SALE IS NOT PERMITTED.
84 of 116
| Structural and Collateral Term Sheet | JPMCC 2019-COR5 | |
| Vie Portfolio | ||
| Portfolio Summary(1) | |||||
| Property | # of Beds/Units(2) | Location | University | Distance from Campus (miles) | Planned Capex Cost |
| University Downs | 430 | Tuscaloosa, AL | The University of Alabama | 1.0 | $4,680,567 |
| Ella Lofts | 252 | San Marcos, TX | Texas State University | 0.5 | 854,553 |
| University View | 165 | Boca Raton, FL | Florida Atlantic University | 0.2 | 796,280 |
| Colonie | 184 | Amherst, NY | The University of Buffalo | 1.1 | 2,634,062 |
| Hillcrest Oakwood | 616 | Big Rapids, MI | Ferris State University | 0.9 | 2,188,749 |
| Southgate | 152 | State College, PA | Pennsylvania State University | 0.4 | 3,022,982 |
| Total | 1,799 | $14,177,193 | |||
| (1) | Based on the appraisals. |
| (2) | The University Downs, Ella Lofts, University View and Hillcrest Oakwood properties are leased by the bed. The Colonie and Southgate properties are leased by the unit. |
The Properties. The Vie Portfolio is comprised of 1,463 beds across four properties and 336 units across two properties, for a total of 1,799 units. The Vie Portfolio Properties are predominantly student-housing properties located in six states, serving as off campus housing for nearby universities. The Vie Portfolio Properties are generally well located within their respective markets with proximity to local transportation and amenities. The loan sponsors plan to undertake a capital improvement plan totaling approximately $14.2 million ($7,881 per unit) across the Vie Portfolio. The loan sponsors’ capital improvement plan, which will include upgrades to units, flooring, appliances and landscaping, focuses on renovating the apartment interiors in an effort to capture higher rents and foster rental income growth for the Vie Portfolio. The Vie Portfolio is cross-collateralized and cross-defaulted.
| Historical and Current Occupancy(1)(2) | |||
| Property | 2016(3) | 2017 | Current(4) |
| University Downs | 76.3% | 89.2% | 86.0% |
| Ella Lofts | N/A | 99.3% | 98.0% |
| University View | 92.1% | 90.2% | 95.8% |
| Colonie(5) | 86.4% | 87.0% | 97.8% |
| Hillcrest Oakwood(6) | 94.8% | 76.8% | 85.1% |
| Southgate | 100.0% | 98.7% | 92.1% |
| Vie Portfolio | 88.9% | 87.0% | 90.0% |
| (1) | Historical occupancies are as of December of each respective year. |
| (2) | As of May 1, 2019, the Vie Portfolio Properties were approximately 54.0% pre-leased. |
| (3) | Ella Lofts 2016 occupancy is not available because the Ella Lofts Property did not open until fall 2016. |
| (4) | Current occupancy is based on the rent rolls dated December 2018 provided by the borrowers. |
| (5) | The decrease in 2017 occupancy from 2016 occupancy at the Colonie property is primarily due to renovations occurring in 2016 and 2017. |
| (6) | The decrease in occupancy from 2016 to 2017 at the Hillcrest Oakwood property was the result of new competition in the market along with poor on-sight management. The property manager was replaced in September 2018 and occupancy has since increased to 85.1%. |
University Downs Property
The largest Vie Portfolio Property by allocated loan amount, University Downs (the “University Downs Property”), is a 222-unit, 430-bed student housing property located in Tuscaloosa, Alabama, approximately 1.0 miles south of The University of Alabama. The University Downs Property offers a shuttle bus to the University of Alabama campus. The University of Alabama received a federal grant to build a vehicular and pedestrian bridge which will provide direct access from the University Downs Property to The University of Alabama campus. The University Downs Property was constructed in 2011 and is currently undergoing renovations with estimated costs of approximately $4.7 million in renovations, primarily consisting of upgrades to appliances, finishes and flooring, which are expected to be completed by November 2019.
The entire University Downs development includes 180 apartments and 272 condominium units. All 180 apartments and 42 of the condominium units are part of collateral for the Vie Portfolio Whole Loan. The University Downs Property consists of 56 one-bedroom units, 124 two-bedroom units and 42 three-bedroom units. 360 beds are from the apartments and 70 beds are from the condominium units. Each unit at the University Downs Property features air conditioning, in unit washer and dryer, dishwasher, walk-in closets and a patio or balcony. The University Downs Property also includes, a fitness room, a swimming pool, a gated entrance and 808 parking spaces, resulting in a parking ratio of approximately 1.9 parking spaces per bed. As of December 2018, the University Downs Property was 86.0% occupied with a weighted average asking rent of $686 per bed. Leases are either six or 12 months and parental guarantees are required.
THE INFORMATION IN THIS STRUCTURAL AND COLLATERAL TERM SHEET IS NOT COMPLETE AND MAY BE AMENDED PRIOR TO THE TIME OF SALE. THIS TERM SHEET IS NOT AN OFFER TO SELL THESE SECURITIES AND IT IS NOT A SOLICITATION OF AN OFFER TO BUY THESE SECURITIES IN ANY JURISDICTION WHERE THE OFFER OR SALE IS NOT PERMITTED.
85 of 116
| Structural and Collateral Term Sheet | JPMCC 2019-COR5 | |
| Vie Portfolio | ||
Founded in 1831, The University of Alabama is the oldest and largest public university in Alabama, with a total enrollment of 38,392 students as of the fall of 2018. Over the ten-year period ending in fall 2018, enrollment increased at an annual average rate of approximately 4.0%. According to the appraisal, enrollment at the University of Alabama is expected to increase by an average of 1.9% from 2018 to 2023. The campus currently has 35 residence halls which can accommodate 8,400 residents as well as 46 on-campus Greek housing facilities. Residence hall rates range between approximately $319 and $600 per bed per month. Due to the lack of on-campus supply for students, approximately 78.1% of enrolled students require non-residence hall housing. According to a third-party research report, The University of Alabama off campus student housing market had a 10.7% vacancy rate and an average monthly asking rent of $666 per bed as of the third quarter of 2018. The appraisal identified five comparable student housing properties ranging in size from 308 beds to 774 beds. Monthly rental rates for the comparable properties range from $609 per bed to $1,215 per bed, with a weighted average of approximately $902 per bed. The comparable properties reported occupancies ranging from 89.0% to 100.0%, with a weighted average occupancy of approximately 94.8%.
Ella Lofts Property
The second largest Vie Portfolio Property by allocated loan amount, Ella Lofts (the “Ella Lofts Property”), is a 75-unit, 252-bed student housing property located in San Marcos, Texas, approximately 0.5 miles northwest of Texas State University. The Ella Lofts Property was constructed in 2016 and is currently undergoing approximately $855,000 in renovations, including updates to the units, clubhouse, mechanicals and common areas, which are expected to be completed by September 2019. The Ella Lofts Property provides access to the San Marcos public bus transportation system, which is free for Texas State University students.
The unit mix consists of eight, one-bedroom units, 23 two-bedroom units and 44, four-bedroom units. Unit amenities include air conditioning, dishwasher and in unit washer and dryer. The Ella Lofts Property consists of four residential levels above a leasing office, retail space and garage, and features a clubhouse, swimming pool, tanning booth, bike room, security and a total of 260 parking spaces, resulting in a parking ratio of approximately 1.0 parking spaces per bed. As of December 2018, the Ella Lofts Property was 98.0% occupied with a weighted average asking rent of $776 per bed. Leases are 12 months and parental guarantees are required.
Texas State University had a fall 2018 total enrollment of 38,661 students, and is the fifth largest university in Texas. Over the ten-year period ending in fall 2018, enrollment increased at an annual average rate of 3.2%. Texas State University currently offers 23 on-campus residence halls, which can accommodate approximately 6,638 students, approximately 17.2% of the Texas State University student population. Texas State University’s on-campus housing rates range between approximately $608 and $1,110 per bed per month. According to projections from the Texas Board of Regents, Texas State University undergraduate enrollment and graduate enrollment is projected to grow approximately 1.5% and 3.0%, respectively, per year for the next eight years. According to the appraisal, there is a current deficit of student-oriented housing. Such deficit, together with the lack of available land for new construction near Texas State University, and the expected increase in students, is expected to keep demand for student housing near campus high for the foreseeable future. According to a third-party research report, the Texas State University off campus student housing market had a 4.4% vacancy rate and an average monthly asking rent of $667 per bed as of the third quarter of 2018. The appraisal identified four comparable properties ranging in size from 304 to 1,250 units, excluding a property expected to open in June 2019. Monthly rental rates for the comparable properties range from $585 per unit to $1,339 per unit, with a weighted average of approximately $845 per unit. The comparable properties reported occupancies ranging from 91.0% to 98.0%, with a weighted average occupancy of approximately 93.7%.
University View Property
The third largest Vie Portfolio Property by allocated loan amount, University View (the “University View Property”), is a 55-unit, 165-bed student housing property located in Boca Raton, Florida, approximately 0.2 miles east of Florida Atlantic University. The University View Property provides access to public bus transportation and is located within 27 miles of the Fort-Lauderdale Hollywood International Airport. The University View Property was constructed in 2009 and is currently undergoing approximately $796,000 in renovations, including landscaping, updating signage, parking lot work, exterior paint, HVAC maintenance and energy efficiency upgrades, which are expected to be completed by August 2019.
All 55 units at the University View Property are three-bedroom, fully-furnished units with air conditioning, in unit washer and dryer, a dishwasher, walk-in closets, and a patio or balcony. The University View Property, which consists of 11 buildings and one clubhouse, features a parking garage under each building, a fitness room, a clubhouse, a swimming pool and a gated entrance. In addition to the 110 garage spaces, there are 116 surface parking spaces, resulting in a parking ratio of approximately 1.4 parking spaces per bed. As of December 2018, the University View Property was 95.8% occupied with a weighted average asking rent of $1,002 per bed. Leases are either six, seven, ten or 12 months and parental guarantees are required.
Established in 1961, Florida Atlantic University opened in 1964 to become the first public university in southeast Florida. With its main campus located in Boca Raton, where the University View Property is located, and five satellite campuses, Florida Atlantic University has a total enrollment of approximately 30,000 students, approximately 80% of which attend classes at the Boca Raton campus. Over the
THE INFORMATION IN THIS STRUCTURAL AND COLLATERAL TERM SHEET IS NOT COMPLETE AND MAY BE AMENDED PRIOR TO THE TIME OF SALE. THIS TERM SHEET IS NOT AN OFFER TO SELL THESE SECURITIES AND IT IS NOT A SOLICITATION OF AN OFFER TO BUY THESE SECURITIES IN ANY JURISDICTION WHERE THE OFFER OR SALE IS NOT PERMITTED.
86 of 116
| Structural and Collateral Term Sheet | JPMCC 2019-COR5 | |
| Vie Portfolio | ||
ten-year period ending in fall 2018, enrollment has increased at an annual average rate of 3.4%. According to the appraisal, enrollment at Florida Atlantic University is expected to increase by an average of 1.2% from 2018 to 2023. The Boca Raton campus offers on campus housing to approximately 4,000 students with rates ranging between approximately $678 and $1,022 per bed per month. Due to the lack of on-campus housing supply for students, the Boca Raton off campus housing market has experienced occupancies above 90.0% for the trailing 12-month period ending October 2018. According to a third-party research report, the Florida Atlantic University Boca Raton off campus student housing market had a 5.0% vacancy rate and an average monthly asking rent of $1,046 per bed as of fall 2018. The appraisal identified five comparable student housing properties ranging in size from 128 units to 598 units. Monthly rental rates for the comparable properties range from $874 per unit to $1,980 per unit, with a weighted average of approximately $1,313 per unit. The comparable properties reported occupancies ranging from 87.0% to 100.0%, with a weighted average occupancy of approximately 92.8%.
| Unit Mix(1) | ||||||||||||||
| Unit Type | # of Beds/ Units | % of Total Beds | Occupied Beds/Units(2) | Occupancy(2) | Average Unit Size (SF)(3) | Average Market Rent Per Bed/Unit(3) | Average Monthly In-Place Rents(3) | |||||||
| University Downs | ||||||||||||||
| 1 BR / 1 BA | 42 | 9.8 | % | 40 | 95.2 | % | 770 | $1,050 | $1,001 | |||||
| 1 BR / 1 BA Condo | 14 | 3.3 | 14 | 100.0 | 730 | $1,050 | $975 | |||||||
| 2 BR / 2 BA | 192 | 44.7 | 168 | 87.5 | 1,091 | $850 | $655 | |||||||
| 2 BR / 2 BA Condo | 56 | 13.0 | 41 | 73.2 | 1,072 | $850 | $668 | |||||||
| 3 BR / 3 BA | 126 | 29.3 | 107 | 84.9 | 1,339 | $750 | $603 | |||||||
| Total / Wtd. Avg | 430 | 100.0 | % | 370 | 86.0 | % | 1,118 | $847 | $686 | |||||
| Ella Lofts | ||||||||||||||
| 1 BR / 1 BA | 8 | 3.2 | % | 8 | 100.0 | % | 471 | $1,154 | $1,270 | |||||
| 2 BR / 2 BA | 24 | 9.5 | 24 | 100.0 | 393 | $964 | $989 | |||||||
| 2 BR / 2 BA Double Occupancy | 44 | 17.5 | 44 | 100.0 | 230 | $600 | $605 | |||||||
| 4 BR / 4 BA | 176 | 69.8 | 171 | 97.2 | 354 | $751 | $768 | |||||||
| Total / Wtd. Avg | 252 | 100.0 | % | 247 | 98.0 | % | 340 | $758 | $776 | |||||
| University View | ||||||||||||||
| 3 BR / 3 BA | 165 | 100.0 | % | 158 | 95.8 | % | 563 | $1,150 | $1,002 | |||||
| Total / Wtd. Avg | 165 | 100.0 | % | 158 | 95.8 | % | 563 | $1,150 | $1,002 | |||||
| Colonie | ||||||||||||||
| 1 BR / 1 BA | 52 | 16.5 | % | 51 | 98.1 | % | 750 | $975 | $886 | |||||
| 2 BR / 1 BA | 132 | 83.5 | 129 | 97.7 | 1,050 | $1,175 | $1,014 | |||||||
| Total / Wtd. Avg | 184 | 100.0 | % | 180 | 97.8 | % | 965 | $1,118 | $978 | |||||
| Hillcrest Oakwood | ||||||||||||||
| 2 BR / 1 BA | 280 | 45.5 | % | 252 | 90.0 | % | 450 | $500 | $414 | |||||
| 4 BR / 2 BA | 336 | 54.5 | 272 | 81.0 | 413 | $450 | $423 | |||||||
| Total / Wtd. Avg | 616 | 100.0 | % | 524 | 85.1 | % | 430 | $473 | $419 | |||||
| Southgate | ||||||||||||||
| 1 BR / 1 BA | 47 | 16.8 | % | 46 | 97.9 | % | 728 | $890 | $833 | |||||
| 2 BR / 1.5 BA | 64 | 45.7 | 56 | 87.5 | 1,096 | $1,050 | $984 | |||||||
| 2 BR / 1.5 BA with Den | 16 | 11.4 | 16 | 100.0 | 1,096 | $1,050 | $999 | |||||||
| 3 BR / 3 BA | 24 | 25.7 | 21 | 87.5 | 1,559 | $1,320 | $1,241 | |||||||
| Efficiency | 1 | 0.4 | 1 | 100.0 | 728 | $825 | $770 | |||||||
| Total / Wtd. Avg. | 152 | 100.0 | % | 140 | 92.1 | % | 1,053 | $1,042 | $978 | |||||
| (1) | Based on the appraisal and rent rolls dated December, 2018 provided by the borrowers. |
| (2) | University Downs, Ella Lofts, University View and Hillcrest Oakwood properties rent by the bed and respective occupancies are based on occupied beds. Colonie and Southgate properties rent by the unit and respective occupancies are based on occupied units. |
| (3) | Average Unit Size (SF), Average Market Rent Per Bed/Unit and Average Monthly In-Place Rents represent a weighted average of the various bed or unit type layouts. |
| (4) | Market rents based on the appraisal’s concluded market rents. |
THE INFORMATION IN THIS STRUCTURAL AND COLLATERAL TERM SHEET IS NOT COMPLETE AND MAY BE AMENDED PRIOR TO THE TIME OF SALE. THIS TERM SHEET IS NOT AN OFFER TO SELL THESE SECURITIES AND IT IS NOT A SOLICITATION OF AN OFFER TO BUY THESE SECURITIES IN ANY JURISDICTION WHERE THE OFFER OR SALE IS NOT PERMITTED.
87 of 116
| Structural and Collateral Term Sheet | JPMCC 2019-COR5 | |
| Vie Portfolio | ||
| Underwritten Net Cash Flow(1) | ||||||||||||
| 2017 | 2018 | TTM(2) | Underwritten | Per Unit(3) | %(4) | |||||||
| Rents in Place(5) | $12,917,979 | $12,857,451 | $12,915,777 | $13,649,055 | $7,587 | 90.1 | % | |||||
| Vacant Income | 1,914,633 | 1,831,875 | 1,723,757 | 1,499,520 | 834 | 9.9 | ||||||
| Net Rental Income | $14,832,612 | $14,689,326 | $14,639,534 | $15,148,575 | $8,421 | 100.0 | % | |||||
| (Vacancy/Credit Loss/Concessions/Model Units)(6) | (2,514,745) | (2,205,490) | (2,104,067) | (1,668,557) | (927) | (11.0 | ) | |||||
| Other Income(7) | 1,060,466 | 1,181,089 | 1,130,770 | 1,165,066 | 648 | 7.7 | ||||||
| Effective Gross Income | $13,378,333 | $13,664,924 | $13,666,236 | $14,645,085 | $8,141 | 100.0 | % | |||||
| Total Expenses | $6,992,088 | $7,158,471 | $7,223,098 | $7,184,664 | $3,994 | 49.1 | % | |||||
| Net Operating Income(8) | $6,386,245 | $6,506,453 | $6,443,138 | $7,460,421 | $4,147 | 50.9 | % | |||||
| Replacement Reserves(9) | 0 | 0 | 0 | 0 | 0 | 0.0 | ||||||
| Net Cash Flow | $6,386,245 | $6,506,453 | $6,443,138 | $7,460,421 | $4,147 | 50.9 | % | |||||
| (1) | 2016 financials are not available because the Ella Lofts Property did not open until fall 2016. |
| (2) | TTM represents the trailing 12-month period ending March 31, 2019. |
| (3) | Based on 1,799 total units at the Vie Portfolio Properties. |
| (4) | Percentage column represents percent of Net Rental Income for all revenue lines and represents percent of Effective Gross Income for the remainder of the fields. |
| (5) | Underwritten Rents in Place is based on occupancy from the in-place rent roll as of December 2018 of approximately 90.0%. Average occupancy for the TTM period was approximately 85.4%. |
| (6) | 2018 Concessions decreased to $95,358 from 2017 Concessions of $404,736, primarily due to lower concessions at the Hillcrest Oakwood property. |
| (7) | Other income consists of consists of application fees, administrative fees, short term lease fee and charges, pet fees, resident service fees, utility fees, laundry room fees and amenity fees. |
| (8) | The increase in Underwritten Net Operating Income from TTM Net Operating Income is primarily attributable to an approximately $610,538 increase in Underwritten Net Operating Income from TTM Net Operating Income at the Hillcrest Oakwood property, related to the implementation of a new management team in September 2018. |
| (9) | No Replacement Reserves were underwritten due to the approximately $14.2 million ($6,885 per bed) renovation the loan sponsors plan to complete across the Vie Portfolio, of which approximately $7.1 million was reserved at loan origination. |
Property Management. The University Downs, Ella Lofts, University View, Colonie, Hillcrest and Oakwood and Southgate properties are managed by VIE Lofts at San Marcos Manager, LLC, VIE Villas at Boca Raton Manager, LLC, VIE at University Downs Manager, LLC, Colonie Apartments Buffalo Manager, LLC, Hillcrest Apartments Big Rapids Manager, LLC and Oakwood Apartments Big Rapids Manager, LLC and Southgate Apartments State College Manager, LLC, respectively. The University Downs condominium units are managed by VIE at University Downs Condominium Manager, LLC. Each manager is an affiliate of the loan sponsor.
Escrows and Reserves.At loan origination, the borrowers deposited (i) $652,075 into the tax reserve, (ii) $25,738 into the replacements reserve,(iii) $7,091,943 into the planned renovation reserve, (iv) $726,149 into the immediate repairs reserve, (v) $196,818 into the prepaid rent reserve, (vi) $61,875 into the seasonality reserve and (vii) $12,020 into the condominium assessments reserve.
Tax Reserve – On a monthly basis, the borrowers are required to deposit an amount equal to 1/12 of the estimated annual real estate taxes into a tax reserve account (initially estimated to be $133,333).
Insurance Reserve – On a monthly basis, the borrowers are required to deposit into an insurance reserve, 1/12 of estimated insurance premiums. So long as the borrowers maintain a blanket insurance policy acceptable to the lender and there is no event of default continuing, the requirement for monthly deposits into the insurance reserve is waived.
Replacements Reserve – On a monthly basis, the borrowers are required to deposit $25,738 into a replacement reserve.
Planned Renovation Reserve– At closing the borrowers deposited approximately $7.8 million to be used for planned capital improvements at Colonie, Hillcrest Oakwood and Southgate properties. In addition, on a monthly basis for the first 15 payment dates, the borrowers are required to deposit into a planned renovation reserve, approximately $50,257, of which approximately $25,128 are for planned renovations relating to the Colonie Property and approximately $25,128 are for planned renovations relating to the Southgate Property.
Prepaid Rent Reserve – Within two business days after receipt, the borrowers are required to deposit all rent which has been paid more than one month in advance into a prepaid rent reserve.
Seasonality Reserve – On a monthly basis for each of the payment dates occurring in March, April and May 2019, the borrowers were required to deposit into a seasonality reserve the amount of $12,375. In addition, following the initial three monthly deposits, on each monthly payment date occurring in October, November, December, January, February, March, April and May during the remaining term of the Vie Portfolio Whole Loan, the borrowers are required to reserve an amount equal to the amount which, if added to net operating
THE INFORMATION IN THIS STRUCTURAL AND COLLATERAL TERM SHEET IS NOT COMPLETE AND MAY BE AMENDED PRIOR TO THE TIME OF SALE. THIS TERM SHEET IS NOT AN OFFER TO SELL THESE SECURITIES AND IT IS NOT A SOLICITATION OF AN OFFER TO BUY THESE SECURITIES IN ANY JURISDICTION WHERE THE OFFER OR SALE IS NOT PERMITTED.
88 of 116
| Structural and Collateral Term Sheet | JPMCC 2019-COR5 | |
| Vie Portfolio | ||
income for the immediately preceding disbursement period for the reserve, would cause the debt service coverage ratio for such period to equal 1.35x.
Condominium Assessments Reserve – If at any time the amount on deposit into the condominium assessments reserve does not equal the product of (i) 150% and (ii) one month of assessments due from the borrowers to the condominium association, then the borrowers will be required to deposit the amounts necessary to bring the reserve to the stated amount on the next payment date.
Pre-Leasing Reserve – On a monthly basis, the borrowers are required to deposit into a pre-leasing reserve, the Pre-Leasing Trigger Amount (as defined below). The requirement for the monthly deposit is waived if (a) the debt service coverage ratio (as calculated pursuant to the loan agreement) equals or exceeds 1.60x and (b) the borrowers deliver evidence to the lender by April 1 of each calendar year commencing in 2020 that 55.0% of the beds at the Vie Portfolio Properties have been leased for the next succeeding school year.
A “Pre-Leasing Trigger Amount” means (1) $352,500 for each of the payment dates occurring in June, July and August of 2019 and (2) $282,000 for each of the payment dates occurring in April, May, June, July and August of any calendar year beginning with the 2020 calendar year.
Lockbox / Cash Management. The Vie Portfolio Whole Loan is structured with a hard lockbox and in place cash management. At loan origination and simultaneously with the execution of any lease with a commercial tenant, the borrowers are required to deliver tenant direction letters instructing all tenants at the Vie Portfolio Properties to deposit rents into the applicable lockbox account controlled by the lender. All funds in each lockbox account are required to be swept each business day into a cash management account controlled by the lender and disbursed on each payment date in accordance with the loan documents. During the continuance of an event of default, the lender may apply such funds in such order and priority as the lender determines. The lender has been granted a first priority security interest in the cash management account.
Condominium.The University Downs Property includes 42 condominium units that are subject to a condominium regime, which consists of a five-member board that governs a total of 272 condominium units. The related borrower does not have the right to appoint a board member or control the condominium association, as the units comprising a portion of the University Downs Property constitute only 15.51% of the association. However, the related condominium declaration may be amended only by the affirmative vote of a majority of the members of the condominium association and the lender. Please see “Description of the Mortgage Pool—Certain Mortgage Pool Characteristics—Condominium and Other Shared Interests” in the Preliminary Prospectus for additional information.
Partial Releases. The Ella Lofts and the University View Properties may not be released. However, on or after March 2, 2021, the borrowers may obtain the release of the Colonie property, Hillcrest Oakwood property, Southgate property or University Downs Property (each, an “Individual Property”) from the lien of the mortgage,provided that in no event will the borrowers be permitted to obtain a release of more than three of the Individual Properties and, among other things: (i) the borrowers pay to the lender the greater of (a) the sum of the release amount for such Individual Property being released, as set forth in the loan documents (the “Release Amount”), and 25.0% of the Release Amount for such Individual Property, and (b) 100.0% of the net sales proceeds for the applicable Individual Property, and, if such prepayment occurs prior to November 2, 2028, payment of the yield maintenance premium; (ii) the borrowers convey such Individual Property, concurrently with the release, to an entity other than another individual borrower; (iii) the release will not result in a loan-to-value ratio above 62.5%; (iv) the related borrowers deliver to the lender and each rating agency a REMIC opinion; (v) the release will not result in a debt service coverage ratio for the remaining Vie Portfolio Properties less than the greater of (a) the debt service coverage ratio immediately preceding such release and (b) 1.80x as adjusted pursuant to the loan documents; and (vi) the delivery of a rating agency confirmation. See “Description of the Mortgage Pool—Certain Terms of the Mortgage Loans—Partial Releases” in the Preliminary Prospectus for additional information.
THE INFORMATION IN THIS STRUCTURAL AND COLLATERAL TERM SHEET IS NOT COMPLETE AND MAY BE AMENDED PRIOR TO THE TIME OF SALE. THIS TERM SHEET IS NOT AN OFFER TO SELL THESE SECURITIES AND IT IS NOT A SOLICITATION OF AN OFFER TO BUY THESE SECURITIES IN ANY JURISDICTION WHERE THE OFFER OR SALE IS NOT PERMITTED.
89 of 116
| Structural and Collateral Term Sheet | JPMCC 2019-COR5 | |
| Gateway Center | ||

THE INFORMATION IN THIS STRUCTURAL AND COLLATERAL TERM SHEET IS NOT COMPLETE AND MAY BE AMENDED PRIOR TO THE TIME OF SALE. THIS TERM SHEET IS NOT AN OFFER TO SELL THESE SECURITIES AND IT IS NOT A SOLICITATION OF AN OFFER TO BUY THESE SECURITIES IN ANY JURISDICTION WHERE THE OFFER OR SALE IS NOT PERMITTED.
90 of 116
| Structural and Collateral Term Sheet | JPMCC 2019-COR5 | |
| Gateway Center | ||

THE INFORMATION IN THIS STRUCTURAL AND COLLATERAL TERM SHEET IS NOT COMPLETE AND MAY BE AMENDED PRIOR TO THE TIME OF SALE. THIS TERM SHEET IS NOT AN OFFER TO SELL THESE SECURITIES AND IT IS NOT A SOLICITATION OF AN OFFER TO BUY THESE SECURITIES IN ANY JURISDICTION WHERE THE OFFER OR SALE IS NOT PERMITTED.
91 of 116
| Structural and Collateral Term Sheet | JPMCC 2019-COR5 | |
| Gateway Center | ||
| Mortgage Loan Information | Property Information | |||
| Mortgage Loan Seller: | JPMCB | Single Asset / Portfolio: | Single Asset | |
| Original Principal Balance: | $28,350,000 | Title: | Fee | |
| Cut-off Date Principal Balance: | $28,350,000 | Property Type - Subtype: | Office – CBD | |
| % of Pool by IPB: | 4.1% | Net Rentable Area (SF): | 310,745 | |
| Loan Purpose: | Acquisition | Location: | Charlotte, NC | |
| Borrowers(1): | MZ Gateway Center LLC, Green | Year Built / Renovated: | 1987 / N/A | |
| Gateway Center LLC, Ho Weg | Occupancy: | 91.0% | ||
| Gateway Center LLC | Occupancy Date: | 1/1/2019
| ||
| Sponsors: | Sid Borenstein, Steven Green, | Number of Tenants: | 4 | |
| Shimmie Horn | 2016 NOI(2): | N/A | ||
| Interest Rate: | 4.95000% | 2017 NOI: | $2,306,043 | |
| Note Date: | 3/19/2019 | 2018 NOI: | $2,393,517 | |
| Maturity Date: | 4/1/2029 | TTM NOI: | N/A | |
| Interest-only Period: | 120 months | UW Economic Occupancy: | 88.2% | |
| Original Term: | 120 months | UW Revenues: | $5,674,740 | |
| Original Amortization: | None | UW Expenses: | $3,033,339 | |
| Amortization Type: | Interest Only | UW NOI: | $2,641,401 | |
| Call Protection: | L(26),Def(90),O(4) | UW NCF: | $2,417,726 | |
| Lockbox / Cash Management: | Hard / Springing | Appraised Value / Per SF(3): | $40,700,000 / $131 | |
| Additional Debt: | N/A | Appraised Dark Value / Per SF(3): | $41,300,000 / $133 | |
| Additional Debt Balance: | N/A | Appraisal Date: | 2/28/2019
| |
| Additional Debt Type: | N/A | |||
| Escrows and Reserves(4) | Financial Information | |||||
| Initial | Monthly | Initial Cap | Cut-off Date Loan / SF: | $91 | ||
| Taxes: | $326,282 | 81,570 | N/A | Maturity Date Loan / SF: | $91 | |
| Insurance: | $0 | Springing | N/A | Cut-off Date LTV: | 69.7% | |
| Replacement Reserves: | $5,179 | $5,179 | N/A | Maturity Date LTV: | 69.7% | |
| TI/LC: | $19,422 | $19,422 | N/A | UW NCF DSCR: | 1.70x | |
| Other: | $0 | $0 | N/A | UW NOI Debt Yield: | 9.3% | |
| Sources and Uses | ||||||
| Sources | Proceeds | % of Total | Uses | Proceeds | % of Total | |
| Mortgage Loan | $28,350,000 | 68.4% | Purchase Price | $40,500,000 | 97.7% | |
| Sponsor Equity | 13,106,930 | 31.6 | Closing Costs | 606,047 | 1.5 | |
| Upfront Reserves | 350,883 | 0.8 | ||||
| Total Sources | $41,456,930 | 100.0% | Total Uses | $41,456,930 | 100.0% | |
| (1) | The borrowers own the Gateway Center Property (as defined below) as tenants-in-common. |
| (2) | 2016 financials are not available due the acquisition of the Gateway Center Property by the seller in 2017. |
| (3) | The appraisal provided a “Hypothetical Go Dark Value” of $41,300,000, which assumes BofA (as defined below) vacates its space, which is thereafter leased at market rent. The Appraised Dark Value is higher than the as-is Appraised Value because BofA is paying below market rent. The Appraised Value Per SF represents the combined as-is values for the office improvements and certain excess land of the Gateway Center Property all of which is collateral for the Gateway Center Loan (as defined below). |
| (4) | For a full description of Escrows and Reserves, please refer to“Escrows and Reserves”below. |
The Loan.The Gateway Center mortgage loan (the “Gateway Center Loan”) is secured by a first mortgage lien on the borrowers’ tenancy-in-common interests in the fee interest in a 310,745 square foot Class B office building located in the central business district of Charlotte, North Carolina (the “Gateway Center Property”). The Gateway Center Loan has an outstanding principal balance as of the Cut-off Date of $28.35 million. The Gateway Center Loan has a 10-year term and will be interest-only for its entire term.
The Borrowers. The borrowing entities are MZ Gateway Center LLC, Green Gateway Center LLC and Ho Weg Gateway Center LLC, each a Delaware limited liability company structured to be a bankruptcy remote single-purpose entity with one independent director in its
THE INFORMATION IN THIS STRUCTURAL AND COLLATERAL TERM SHEET IS NOT COMPLETE AND MAY BE AMENDED PRIOR TO THE TIME OF SALE. THIS TERM SHEET IS NOT AN OFFER TO SELL THESE SECURITIES AND IT IS NOT A SOLICITATION OF AN OFFER TO BUY THESE SECURITIES IN ANY JURISDICTION WHERE THE OFFER OR SALE IS NOT PERMITTED.
92 of 116
| Structural and Collateral Term Sheet | JPMCC 2019-COR5 | |
| Gateway Center | ||
organizational structure. The borrowers own the Gateway Center Property through a tenancy-in-common structure. Legal counsel to the borrower delivered a non-consolidation opinion in connection with the origination of the Gateway Center Loan.
The Loan Sponsors.The loan sponsors and non-recourse carve-out guarantors of the Gateway Center Loan are Sid Borenstein, Steven Green and Shimmie Horn. Sid Borenstein and Shimmie Horn are on the board of directors of Hamilton Equity Partners, a New York based commercial real estate investment and management firm. Mr. Borenstein is the CEO and president of Hamilton Equity Partners and Mr. Horn is also a principal founder. Mr. Borenstein is also the founder of Sidney Borenstein & Company, a certified public accountancy firm that provides real estate structure, finance and tax advisory services to real estate sponsors throughout the greater New York City area. Mr. Borenstein has been an active real estate investment sponsor since the late 1980’s, and has investment experience in a diverse set of real estate asset classes including specialty care, multifamily, retail, hospitality and industrial properties. Aside from being a principal founder of Hamilton Equity Partners, Shimmie Horn is also the president and CEO of Triumph Hospitality, which represents the ownership and management of six New York based boutique hotels. Mr. Horn also owns and manages over 1,800 apartment units. Steven Green has an ownership interest in two properties in excess of approximately $34.0 million.
The Property.The Gateway Center Property is a Class B office building located in Charlotte, North Carolina, comprised of 310,745 square feet of net rentable area. Originally built in 1987, the Gateway Center Property is comprised of (i) a 10-story office tower and (ii) a 5-story office “base” building, which is wrapped around a center courtyard. The Gateway Center Property is situated on approximately 2.02-acre site and includes a 1.62-acre vacant parcel of excess land, which also serves as collateral for the Gateway Center Loan. The excess land parcel is zoned in Charlotte’s Uptown Mixed Use District, which allows for the land to be developed into any type of improvement. The Gateway Center Property contains both surface and subterranean parking which consists of 172-spaces, resulting in a parking ratio of approximately 0.55 spaces per 1,000 square feet.
As of January 1, 2019, the Gateway Center Property is 91.0% leased to four tenants. The largest tenant at the Gateway Center Property Bank of America (“BofA”) leases, 242,820 square feet and accounts for approximately 67.3% of underwritten base rent. Founded in 1874 and based in Charlotte, North Carolina, BofA is one of the world’s largest financial institutions which offers consumers, small businesses and larger corporations a full range of banking, investing, asset management, risk management and other financial products or services. BofA serves approximately 67.0 million consumer and small business clients, 4,400 retail financial centers, 1,800 lending centers, 2,200 financial centers and 1,500 business centers across all 50 states and more than 35 countries. The Gateway Center Property serves as a mission critical location and hub for BofA’s global technology and operations business lines. In 2018, BofA completed an approximately $13.0 million renovation of its second floor space. The renovation included the addition of standing desks, flexible workspaces, a lounge, café, new finishes and renovated restrooms. BofA has been a tenant at the Gateway Center Property since October 2004 and exercised its first extension option in the fourth quarter of 2018. BofA currently pays a NNN rent of $7.00 per square foot, which is approximately 30.8% below the appraiser concluded gross market rent when accounting for BofA’s reimbursements. BofA’s lease has an expiration date of September 30, 2024, with six, five-year extension options remaining and no termination options (other than customary termination options due to default or certain casualties or condemnations), with a final lease expiration date of September 30, 2054 if all extensions are exercised. Base rent will increase by 5.0% during each renewal period.
The second largest tenant at the Gateway Center Property, Johnson & Wales (“JWU”) leases 25,463 square feet and constitutes approximately 19.7% of underwritten base rent. Founded in 1914, JWU is a private, nonprofit, accredited institution with approximately 13,000 graduate, undergraduate and online students across four campuses in Providence, Rhode Island, North Miami, Florida, Denver, Colorado and Charlotte, North Carolina. The Gateway Center Property is adjacent to the JWU Charlotte campus. JWU’s space is primarily utilized as an admissions office, administrative offices, and a few additional classroom spaces. JWU’s lease has an expiration date of December 2026. There are no extension or termination options (other than customary termination options due to default or certain casualties or condemnations) under the lease. JWU has the right to terminate its lease at any time during the term of its lease, with a six-month notice.
The third largest tenant at the Gateway Center Property, ELS Education (“ELS”) leases 12,664 square feet and accounts for approximately 11.0% of underwritten base rent. Founded in 1961 and based in Princeton, New Jersey, ELS operates over 80 English learning center schools in nine countries and there are currently more than 50 locations throughout the United States. ELS operates through various language centers which are often based on college campuses, like JWU. ELS has helped students achieve their English language goals which has helped foreign students acclimate to universities throughout the United States. ELS has relationships with over 650 universities around the world. ELS has been at the Gateway Center Property since 2015 and there are currently no lease extension options upon lease expiration in November 2025. ELS has a one-time right to terminate its lease as of the last day of the 65th month of the term, November 30, 2020, by providing the landlord with 12 months’ notice, and the payment of a termination fee equal to approximately $422,613.
THE INFORMATION IN THIS STRUCTURAL AND COLLATERAL TERM SHEET IS NOT COMPLETE AND MAY BE AMENDED PRIOR TO THE TIME OF SALE. THIS TERM SHEET IS NOT AN OFFER TO SELL THESE SECURITIES AND IT IS NOT A SOLICITATION OF AN OFFER TO BUY THESE SECURITIES IN ANY JURISDICTION WHERE THE OFFER OR SALE IS NOT PERMITTED.
93 of 116
| Structural and Collateral Term Sheet | JPMCC 2019-COR5 | |
| Gateway Center | ||
The Gateway Center Property is located on the southeastern corner at the intersection of West Trade Street and Johnson and Wales Way. Located off I-77 and I-277, the Gateway Center Property is positioned in the Charlotte central business district (the “CBD”). The CBD is attractive to office tenants as it provides a multitude of amenities, easy vehicle access, restaurants and a wide array of attractions. According to the appraisal, the Charlotte market is well positioned to compete nationally for corporate headquarters. The Charlotte core based statistical area (“CBSA”) offers companies low business costs and an expanding infrastructure and transportation network. Charlotte is home to seven Fortune 500 companies, including BofA, Lowes Cos. Inc and Duke Energy Corporation. Charlotte is the nation’s third largest banking sector, trailing only New York, New York and San Francisco, California, and is home to a diverse background of top employers in the transportation, health care retail, manufacturing and energy sectors.
The Gateway Center Property is located within the Charlotte-Gastonia-Rock Hill CBSA (the “Charlotte CBSA”). The Charlotte CBSA is located in south central North Carolina, which covers approximately 3,200 square miles. The Charlotte CBSA expands over North Carolina and South Carolina and encompasses seven counties in North Carolina and three counties in South Carolina. According to the appraisal, as of year-end 2017, the estimated population was approximately 2.5 million, which resulted in the Charlotte CBSA being the 22nd largest CBSA in the United States. According to the appraisal, population CAGR within the Charlotte CBSA over the last ten years was 1.9% and is projected to grow approximately 2.0% over the next five years. As of year-end 2017, median household income within the Charlotte CBSA was $57,437, which is approximately 2.0% greater than the national average.
According to the appraisal, the Gateway Center Property is located in the Charlotte CBD submarket, which is often referred to as Uptown. Uptown covers two square miles in the heart of Charlotte’s office market and is a major employment center for the Charlotte office market. According to the appraisal, Uptown contains more than 22.0 million square feet, which is approximately 20.6% of the greater Charlotte office market inventory. As of year-end 2018, Uptown experienced a vacancy rate of 9.4%, which represents a decrease of 2.4% year-over-year. Since 2017, average asking rents within Uptown have risen 5.2% to $32.78. Uptown has also experienced positive net absorption of 554,810 square feet in 2018, which makes Uptown the highest absorbing submarket throughout the 19 submarkets that comprise the Charlotte office market.
| Historical and Current Occupancy(1) | |||
| 2016(2) | 2017 | 2018 | Current(3) |
| N/A | 91.0% | 91.0% | 91.0% |
| (1) | Historical Occupancies are as of December 31 of each respective year. |
| (2) | 2016 Occupancy is unavailable due to acquisition by the seller. |
| (3) | Current Occupancy is as of January 1, 2019. |
| Tenant Summary(1) | ||||||||
| Tenant | Ratings Moody’s/S&P/Fitch(2) | Net Rentable Area (SF) | % of Total NRA | Base Rent PSF(3) | % of Total Base Rent | Lease Type | Lease Expiration Date | |
| Bank of America | A2/A-/A+ | 242,820 | 78.1% | $7.70 | 67.3% | NNN | 9/30/2024 | |
| Johnson & Wales(4) | NR/NR/NR | 25,463 | 8.2% | $21.53 | 19.7% | Mod. Gross | 12/31/2026 | |
| ELS Education(5) | NR/NR/NR | 12,664 | 4.1% | $24.20 | 11.0% | Mod. Gross | 11/30/2025 | |
| Ngoc Bich Thi Hoang | NR/NR/NR | 666 | 0.2% | $32.62 | 0.8% | Gross | 1/31/2020 | |
| Management Office | NR/NR/NR | 1,038 | 0.3% | $30.00 | 1.1% | Gross | ||
| (1) | Based on the underwritten rent roll dated January 1, 2019. |
| (2) | Ratings provided are for the parent company of the entity listed in the “Tenant” field whether or not the parent company guarantees the lease. |
| (3) | Base Rent PSF is inclusive of rent steps through March 1, 2020 totaling $192,968. |
| (4) | Johnson & Waleshas the right to terminate its lease at any time during the term of its lease with a six-month notice. |
| (5) | ELS Education has a one-time right to terminate the lease as of November 30, 2020, with a 12-month notice and the payment of a termination fee. |
THE INFORMATION IN THIS STRUCTURAL AND COLLATERAL TERM SHEET IS NOT COMPLETE AND MAY BE AMENDED PRIOR TO THE TIME OF SALE. THIS TERM SHEET IS NOT AN OFFER TO SELL THESE SECURITIES AND IT IS NOT A SOLICITATION OF AN OFFER TO BUY THESE SECURITIES IN ANY JURISDICTION WHERE THE OFFER OR SALE IS NOT PERMITTED.
94 of 116
| Structural and Collateral Term Sheet | JPMCC 2019-COR5 | |
| Gateway Center | ||
| Lease Rollover Schedule(1) | |||||||||
| Year | Number of Leases Expiring | Net Rentable Area Expiring | % of NRA Expiring | Base Rent Expiring(2) | % of Base Rent Expiring | Cumulative Net Rentable Area Expiring | Cumulative % of NRA Expiring | Cumulative Base Rent Expiring | Cumulative % of Base Rent Expiring |
| Vacant | NAP | 28,094 | 9.0% | NAP | NAP | 28,094 | 9.0% | NAP | NAP |
| 2019 & MTM(3) | 1 | 1,038 | 0.3% | $31,140 | 1.1% | 29,132 | 9.4% | $31,140 | 1.1% |
| 2020 | 1 | 666 | 0.2% | $21,725 | 0.8% | 29,798 | 9.6% | $52,865 | 1.9% |
| 2021 | 0 | 0 | 0.0% | $0 | 0.0% | 29,798 | 9.6% | $52,865 | 1.9% |
| 2022 | 0 | 0 | 0.0% | $0 | 0.0% | 29,798 | 9.6% | $52,865 | 1.9% |
| 2023 | 0 | 0 | 0.0% | $0 | 0.0% | 29,798 | 9.6% | $52,865 | 1.9% |
| 2024 | 1 | 242,820 | 78.1% | $1,869,714 | 67.3% | 272,618 | 87.7% | $1,922,579 | 69.2% |
| 2025 | 1 | 12,664 | 4.1% | $306,469 | 11.0% | 285,282 | 91.8% | $2,229,048 | 80.3% |
| 2026 | 1 | 25,463 | 8.2% | $548,091 | 19.7% | 310,745 | 100.0% | $2,777,139 | 100.0% |
| 2027 | 0 | 0 | 0.0% | $0 | 0.0% | 310,745 | 100.0% | $2,777,139 | 100.0% |
| 2028 | 0 | 0 | 0.0% | $0 | 0.0% | 310,745 | 100.0% | $2,777,139 | 100.0% |
| 2029 and Thereafter | 0 | 0 | 0.0% | $0 | 0.0% | 310,745 | 100.0% | $2,777,139 | 100.0% |
| Total | 5 | 310,745 | 100.0% | $2,777,139 | 100.0% | ||||
| (1) | Based on the underwritten rent roll dated January 1, 2019. |
| (2) | Base Rent Expiring includes rent steps through March 1, 2020 totaling $192,968. |
| (3) | 2019 & MTM is inclusive of a management office associated with 1,038 square feet of net rentable area. |
| Operating History and Underwritten Net Cash Flow | |||||
| 2017 | 2018 | Underwritten | Per Square Foot | %(1) | |
| Base Rent(2) | $2,534,517 | $2,544,363 | $2,777,139 | $8.94 | 43.4% |
| Vacant Income | 0 | 0 | 730,444 | 2.35 | 11.4 |
| Gross Potential Rent | $2,534,517 | $2,544,363 | $3,507,583 | $11.29 | 54.8% |
| Total Reimbursements | 2,403,784 | 2,456,903 | 2,669,662 | 8.59 | 41.7 |
| Total Other Income(3) | 224,312 | 227,939 | 227,939 | 0.73 | 3.6 |
| Net Rental Income | $5,162,613 | $5,229,206 | $6,405,184 | $20.61 | 100.0% |
| Less: Vacancy | 0 | 0 | (730,444) | (2.35) | (12.9) |
| Effective Gross Income | $5,162,613 | $5,229,206 | $5,674,740 | $18.26 | 100.0% |
| Total Expenses | 2,856,569 | 2,835,688 | 3,033,339 | 9.76 | 53.5 |
| Net Operating Income | $2,306,043 | $2,393,517 | $2,641,401 | $8.50 | 46.5% |
| Total TI/LC, CapEx | 0 | 0 | 223,675 | 0.72 | 3.9 |
| Net Cash Flow | $2,306,043 | $2,393,517 | $2,417,726 | $7.78 | 42.6% |
| (1) | % column represents percent of Net Rental Income for all revenue lines and represents percent of Effective Gross Income for the remainder of the fields. |
| (2) | Underwritten Base Rent is inclusive of rent steps taken through March 1, 2020 totaling $192,968. |
| (3) | Other income is inclusive of antenna income, metered electric income and other miscellaneous income. |
Property Management. The Gateway Center Property is managed by Hamilton EQ Management LLC., an affiliate of the borrowers.
Escrows and Reserves.At loan origination, the borrowers deposited $326,282 into a tax reserve account, $19,422 into a rollover reserve account and $5,179 into a replacement reserve account.
Tax Escrows–On a monthly basis, the borrowers are required to deposit an amount equal to 1/12 of the estimated annual real estate taxes.
Insurance Escrows – Insurance escrows are waived so long as (i) no event of default has occurred and is continuing and (ii) the Gateway Center Property is covered by an acceptable blanket policy (which is currently maintained). If such condition is no longer satisfied, on each payment date, the borrowers will be required to fund an insurance reserve in an amount equal to 1/12 of the amount that the lender estimates will be necessary to pay the annual insurance premiums.
THE INFORMATION IN THIS STRUCTURAL AND COLLATERAL TERM SHEET IS NOT COMPLETE AND MAY BE AMENDED PRIOR TO THE TIME OF SALE. THIS TERM SHEET IS NOT AN OFFER TO SELL THESE SECURITIES AND IT IS NOT A SOLICITATION OF AN OFFER TO BUY THESE SECURITIES IN ANY JURISDICTION WHERE THE OFFER OR SALE IS NOT PERMITTED.
95 of 116
| Structural and Collateral Term Sheet | JPMCC 2019-COR5 | |
| Gateway Center | ||
Replacement Escrows – On a monthly basis, the borrowers are required to deposit an amount equal to $5,179 for replacement reserves (or approximately $0.20 per square foot annually). The reserve is not subject to a cap.
TI/LC Reserves –On a monthly basis, the borrowers are required to deposit an amount equal to approximately $19,422 for tenant improvements and leasing commission (or approximately $0.75 per square foot annually), subject to a cap of $2,100,000, in the event BofA renews it lease.
Lockbox / Cash Management.The Gateway Center Loan is structured with a hard lockbox and springing cash management. The borrowers were required at loan origination to send a tenant direction letter to the tenants at the Gateway Center Property instructing the tenants to deposit all rents and payments into a lender controlled lockbox account. To the extent no Cash Sweep Period (as defined below) is continuing, all funds in the lockbox account are required to be transferred to or at the direction of the borrowers. Following the occurrence and during the continuance of a Cash Sweep Period, all funds in the lockbox account are required to be swept each business day to a segregated cash management account under the control of the lender and disbursed in accordance with the loan documents. To the extent there is a Cash Sweep Period continuing, all excess cash flow after payment of debt service, required reserves and operating expenses are required to be held as additional collateral for the Gateway Center Loan. The lender has been granted a first priority security interest in the cash management account.
A “Cash Sweep Period” means each period commencing on the occurrence of a Cash Sweep Event (as defined below) and continuing until the earlier of the payment date next occurring following the related Cash Sweep Event Cure (as defined below) or payment (or defeasance) in full of all principal and interest on the Gateway Center Loan.
A “Cash Sweep Event” means the occurrence of (i) an event of default, (ii) any bankruptcy action of a borrower or property manager, (iii) the date on which the debt service coverage ratio (as calculated in the loan documents and based on the trailing three-month period immediately preceding the date of determination) is less than 1.25x, or (iv) the date on which (a) BofA vacates, surrenders or ceases to conduct its normal business operations at the demised premises, terminates or cancels its lease, or otherwise “goes dark” or gives notice of its intent to do any of the foregoing; (b) BofA becomes insolvent or a debtor in any bankruptcy action, or (c) BofA fails to renew its lease on or prior to the date that such renewal is required pursuant to the terms of the its lease.
A “Cash Sweep Event Cure” means (a) with respect to clause (i) above, the acceptance by the lender of a cure of such event of default (which may not be unreasonably withheld, conditioned or delayed unless the lender has accelerated the Gateway Center Loan, commenced foreclosure proceedings or initiated any other remedy), (b) with respect to clause (ii) above, only with respect to a bankruptcy action of a property manager, the borrowers replaces the property manager with a qualified manager under a replacement management agreement within 60 days of such bankruptcy action. (c) with respect to clause (iii) above, the debt service coverage ratio (as calculated in the loan documents and based on the trailing three-month period immediately preceding the date of determination) is at least 1.25x for two consecutive quarters, or (d) with respect to clause (iv) above, the lender’s receipt of evidence that the borrowers have entered into a new lease or leases with a replacement tenant or tenants reasonably acceptable to lender for not less than 65.0% of the demised premises that had previously been occupied by BofA in form and substance reasonably satisfactory to lender and otherwise in accordance with the terms of the loan agreement, (i) that each tenant under any such replacement lease has accepted possession and is in occupancy of all of the space demised under the lease and is paying full, unabated rent at the initial rental rate in accordance with the lease (provided, however, that a tenant may be entitled to a total of not more than three months of free or abated rent following the first anniversary of the rent commencement date of such lease) and (ii) that all current landlord obligations under any such replacement lease (including, without limitation, tenant improvements and leasing commission obligations) have been duly performed, completed and paid for (or reserved with the lender), such evidence to include, without limitation, a fully-executed lease and an acceptable tenant estoppel certificate from each such tenant. A Cash Sweep Event Cure resulting from an event of default or a bankruptcy or insolvency action of the property manager may not be cured more than two times in the aggregate during the term of the Gateway Center Loan, and the borrowers do not have the right to cure a Cash Sweep Event caused by a bankruptcy or insolvency action of a borrower.
Right of First Refusal. BofA has a right of first offer to purchase the Gateway Center Property in the event the borrowers elect to sell the Gateway Center Property so long as BofA remains in possession of at least 35% of the net rentable area of the Gateway Center Property, among other terms and conditions. BofA’s right of first offer is subordinate to any foreclosure or deed-in-lieu of foreclosure and, under the lease, expressly terminates upon either a foreclosure or deed-in-lieu.
THE INFORMATION IN THIS STRUCTURAL AND COLLATERAL TERM SHEET IS NOT COMPLETE AND MAY BE AMENDED PRIOR TO THE TIME OF SALE. THIS TERM SHEET IS NOT AN OFFER TO SELL THESE SECURITIES AND IT IS NOT A SOLICITATION OF AN OFFER TO BUY THESE SECURITIES IN ANY JURISDICTION WHERE THE OFFER OR SALE IS NOT PERMITTED.
96 of 116
| Structural and Collateral Term Sheet | JPMCC 2019-COR5 | |
| L Street Marketplace | ||
| Mortgage Loan Information | Property Information | |||
| Mortgage Loan Seller: | JPMCB | Single Asset / Portfolio: | Single Asset | |
| Original Principal Balance: | $26,500,000 | Title: | Fee | |
| Cut-off Date Principal Balance: | $26,500,000 | Property Type - Subtype: | Retail – Anchored | |
| % of Pool by IPB: | 3.8% | Net Rentable Area (SF): | 226,571 | |
| Loan Purpose: | Refinance | Location: | Omaha, NE | |
| Borrower: | T L Street Marketplace NE, LLC | Year Built / Renovated: | 2008 / NA | |
| Sponsor: | The 2005 ZST/TBT Descendants’ | Occupancy: | 91.2% | |
| Trust-T | Occupancy Date: | 4/1/2019 | ||
| Interest Rate: | 4.70000% | Number of Tenants: | 24 | |
| Note Date: | 4/12/2019 | 2016 NOI(1): | N/A | |
| Maturity Date: | 5/1/2029 | 2017 NOI: | $2,694,251 | |
| Interest-only Period: | 36 months | 2018 NOI: | $2,339,953 | |
| Original Term: | 120 months | TTM NOI (as of 3/2019)(2): | $2,079,924 | |
| Original Amortization: | 360 months | UW Economic Occupancy: | 92.6% | |
| Amortization Type: | IO-Balloon | UW Revenues: | $4,091,681 | |
| Call Protection: | L(25),DeforGrtr1%orYM(92),O(3) | UW Expenses: | $1,464,675 | |
| Lockbox / Cash Management | Hard / Springing | UW NOI(2): | $2,627,006 | |
| Additional Debt: | N/A | UW NCF: | $2,366,449 | |
| Additional Debt Balance: | N/A | Appraised Value / Per SF(3): | $35,900,000 / $158 | |
| Additional Debt Type: | N/A | Appraisal Date(3): | 3/1/2020 | |
| Escrows and Reserves(4) | Financial Information | ||||||
| Initial | Monthly | Initial Cap | Mortgage Loan | ||||
| Taxes: | $260,816 | $65,204 | N/A | Cut-off Date Loan / SF: | $117 | ||
| Insurance: | $0 | Springing | N/A | Maturity Date Loan / SF: | $103 | ||
| Replacement Reserves: | $2,832 | $2,832 | N/A | Cut-off Date LTV(3): | 73.8% | ||
| TI/LC: | $18,881 | $18,881 | $679,716 | Maturity Date LTV(3): | 64.9% | ||
| Other(4): | $635,108 | $0 | N/A | UW NCF DSCR: | 1.43x | ||
| UW NOI Debt Yield: | 9.9% | ||||||
| Sources and Uses | |||||||
| Sources | Proceeds | % of Total | Uses | Proceeds | % of Total | |
| Mortgage Loan | $26,500,000 | 94.6% | Payoff Existing Debt(6) | $26,953,754 | 96.2% | |
| Sponsor Equity | 1,518,960 | 5.4 | Upfront Reserves | 917,637 | 3.3 | |
| Closing Costs | 147,569 | 0.5 | ||||
| Total Sources | $28,018,960 | 100.0% | Total Uses | $28,018,960 | 100.0% |
| (1) | Full year 2016 financials are not available as the loan sponsor acquired the L Street Marketplace Property (as defined below) in July 2016. |
| (2) | The increase in Underwritten NOI from TTM NOI is primarily attributable to newly signed leases with Ross Dress for Less, Old Navy, Five Below, Nutrition 402 and Urban Classic. |
| (3) | Appraised Value / Per SF, Appraisal Date, Cut-off Date LTV and Maturity Date LTV are calculated based on the “Upon Stabilized” appraised value, which assumes that Old Navy and Five Below have taken occupancy of their respective spaces and all tenant improvements have been paid, which were reserved at loan origination. Five Below’s lease commenced on March 4, 2019. Old Navy has a signed lease that commences August 30, 2019 with no free rent. Old Navy accepted premises of its space on April 5, 2019. Based on the “Hypothetical” appraised value of $34,000,000, as of February 21, 2019, the Cut-off Date LTV and Maturity Date LTV are equal to 77.9% and 68.5%, respectively. The Hypothetical appraised value assumes that there are no outstanding tenant improvements for Five Below and Old Navy, which were reserved at loan origination. Based on the “As-Is” appraised value of $33,000,000, as of February 21, 2019, the Cut-off Date LTV and Maturity Date LTV are equal to 80.3% and 70.6%, respectively. |
| (4) | On a monthly basis, the borrower is required to deposit an amount equal to 1/12 of the estimated annual real estate taxes, which currently equates to $65,204 per month. The monthly deposits to the insurance reserve are waived so long as (i) no event of default has occurred and is continuing and (ii) the borrower provides the lender with satisfactory evidence (as determined by the lender) that the L Street Marketplace Property is insured in accordance with the loan documents pursuant to a blanket insurance policy acceptable to the lender. |
| (5) | Initial Other Escrows and Reserves consist of (i) an initial deposit of $629,065 into an outstanding TI reserve for Five Below ($95,210) and Old Navy ($533,855) and (ii) an initial deposit of $6,043 into a reserve for free rent associated with Nutrition 402. |
| (6) | Payoff Existing Debt includes the borrower sponsor’s approximately $6.1 million equity payment required under an existing credit line prior to origination. |
THE INFORMATION IN THIS STRUCTURAL AND COLLATERAL TERM SHEET IS NOT COMPLETE AND MAY BE AMENDED PRIOR TO THE TIME OF SALE. THIS TERM SHEET IS NOT AN OFFER TO SELL THESE SECURITIES AND IT IS NOT A SOLICITATION OF AN OFFER TO BUY THESE SECURITIES IN ANY JURISDICTION WHERE THE OFFER OR SALE IS NOT PERMITTED.
97 of 116
| Structural and Collateral Term Sheet | JPMCC 2019-COR5 | |
| L Street Marketplace | ||
The Loan. The L Street Marketplace mortgage loan (the “L Street Marketplace Loan”) has a Cut-off Date Principal Balance of $26.5 million and is secured by a first mortgage lien on the fee interest in a 226,571 square foot anchored retail property located in Omaha, Nebraska (the “L Street Marketplace Property”). The L Street Marketplace Loan has a 10-year term and following a three-year interest-only period, will amortize on a 30-year schedule.
The Borrower. The borrowing entity is T L Street Marketplace NE, LLC, a Delaware limited liability company structured to be a special purpose entity with one independent manager in its organizational structure. Legal counsel to the borrower delivered a non-consolidation opinion in connection with the origination of the L Street Marketplace Loan.
The Loan Sponsor.The loan sponsor and nonrecourse carve-out guarantor is The 2005 ZST/TBT Descendants’ Trust-T, of which Zaffar S. Tabani is the trustee. Zaffar S. Tabani is the founder, CEO and President of the Tabani Group, a commercial real estate company with a portfolio encompassing over 10 million square feet of commercial, hotel and residential real estate. Founded in 1981 and based in Dallas, Texas, the Tabani Group has holdings in multiple states nationwide, including Texas, Florida, Colorado, Georgia, Illinois and Pennsylvania. The loan documents require the guarantor to maintain a net worth and liquidity of at least $30.0 million and $3.0 million, respectively, during the term of the L Street Marketplace Loan.
The Property. The L Street Marketplace Property is a 226,571 square foot retail center anchored by Michaels, Ross Dress for Less, buybuy Baby and Cost Plus World Market and is shadow anchored by Target, which is not part of the collateral. Built in 2008 and situated on an approximately 24.9-acre site, the L Street Marketplace Property consists of one main center, one outlot and 1,996 parking spaces, resulting in a parking ratio of 8.8 spaces per 1,000 square feet of net rentable area. The borrower acquired the L Street Marketplace Property in July 2016 for $42.6 million ($188 per square foot) as one main center and seven outlots. Since acquisition, the borrower sold six of the seven outlots to separate users for approximately $13.4 million and spent approximately $4.8 million on capital expenditures for a total cost basis of approximately $34.0 million.
As of April 1, 2019, the L Street Marketplace Property was 91.2% leased to 24 tenants, all of which operate under NNN leases at the L Street Marketplace Property. The rent roll is granular with no tenant occupying more than 11.0% of net rentable area or contributing more than 8.3% of underwritten base rent. Investment grade tenants comprise 37.1% of net rentable area and 30.9% of underwritten base rent. The largest tenant, buybuy Baby (25,032 square feet; 11.0% of net rentable area; 8.2% of underwritten base rent) is a baby products chain with 119 locations across 35 states and Canada that offers merchandise for newborns to toddlers. buybuy Baby is a subsidiary of Bed Bath & Beyond, a home furnishings retailer with 1,017 stores located throughout the United States, Puerto Rico and Canada. The buybuy Baby lease expires in January 2026 and has five, five-year extension options remaining. The second largest tenant, Ross Dress for Less (23,734 square feet; 10.5% of net rentable area;8.2% of underwritten base rent) is the largest off-price apparel and home fashion chain in the United States with 1,480 locations in 38 states, the District of Columbia and Guam. The Ross Dress for Less lease expires inJanuary 2029 and has four, five-year extension options remaining. The Ross Dress for Less at the L Street Marketplace Property is its first store in Nebraska. The third largest tenant, Michaels (21,023 square feet; 9.3% of net rentable area; 7.8% of underwritten base rent), is the largest arts and crafts supplier in North America with 1,258 Michaels retail stores in 49 states and Canada. Michaels recently renewed its lease for five years, with a lease expiration in September 2024. The Michaels lease has three, five-year extension options remaining. Each of the top 10 tenants at the L Street Marketplace Property has renewal options. 11 new or renewal leases have been executed since 2018 at the L Street Marketplace Property, comprising 41.2% of net rentable area and 47.1% of underwritten base rent. The new tenants, Ross Dress for Less, Old Navy, Five Below, Nutrition 402 and Urban Classic, replaced big box retailers who vacated their spaces prior to the loan sponsor’s acquisition in 2016, including Best Buy, Books-a-Million and OfficeMax. Currently, Target and several non-collateral tenants reimburse the borrower for their share of common area expenses.
The Market. The L Street Marketplace Property is located within 10 miles of downtown Omaha, the largest city in Nebraska by population, and within 15 miles of the Omaha Eppley Airfield airport, along L Street, a primary regional thoroughfare with approximately 84,000 vehicles per day. The L Street retail corridor is anchored by Walmart Supercenter, Sam’s Club and Home Depot, all located immediately adjacent to the L Street Marketplace Property. The L Street Marketplace Property is located within the Omaha-Council Bluffs, NE-IA metropolitan statistical area (“Omaha MSA”) and regional access to the L Street Marketplace Property is provided by Interstate-80 and Interstate-680.
The L Street Marketplace Property is located in the Southwest Omaha Retail submarket, which has a total retail inventory of approximately 4.5 million square feet, a vacancy rate of 3.5% and an average effective rent of $13.86 per square foot. According to the appraisal, the 2018 estimated population within a one-, three- and five-mile radius of the L Street Marketplace Property is 8,013, 86,376 and 225,887, respectively. Additionally, the median household income within a one-, three- and five-mile radius of the L Street Marketplace Property is $58,168, $66,453 and $73,720, respectively. The median household income within a five-mile radius of the L Street Marketplace Property is approximately 17.3% and 30.7% higher than the estimated 2018 Omaha MSA and Nebraska median household income of $62,832 and $56,415, respectively.
THE INFORMATION IN THIS STRUCTURAL AND COLLATERAL TERM SHEET IS NOT COMPLETE AND MAY BE AMENDED PRIOR TO THE TIME OF SALE. THIS TERM SHEET IS NOT AN OFFER TO SELL THESE SECURITIES AND IT IS NOT A SOLICITATION OF AN OFFER TO BUY THESE SECURITIES IN ANY JURISDICTION WHERE THE OFFER OR SALE IS NOT PERMITTED.
98 of 116
| Structural and Collateral Term Sheet | JPMCC 2019-COR5 | |
| L Street Marketplace | ||
The appraisal identified four comparable junior anchor leases from three retail centers in the Omaha MSA. Comparable leases range from approximately 13,896 square feet to 50,000 square feet and base rent ranges from $7.00 to $11.00 per square foot. The appraisal also identified comparable in-line leases from six retail centers in the Omaha MSA. Comparable leases range from approximately 1,200 square feet to 2,000 square feet and base rent ranges from $12.95 to $18.00 per square foot. The weighted average base rent per square foot for the L Street Marketplace Property’s junior anchor and in-line tenants is approximately $9.70 and $16.78, respectively, which is in line with the appraisal’s concluded average market rents of $9.50 and $15.83, respectively.
| Tenant Summary(1) | ||||||||
| Tenant | Ratings Moody’s/Fitch/S&P(2) | Net Rentable Area (SF) | % of Total NRA | Base Rent PSF(3) | Lease Expiration(4) | % of Total Base Rent | Most Recent Sales PSF(5) | Occupancy Cost(5) |
| buybuy Baby(6) | Baa3 / NR / BB+ | 25,032 | 11.0% | $9.30 | 1/31/2026 | 8.2% | NAV | NAV |
| Ross Dress for Less | A3 / NR / A- | 23,734 | 10.5 | $9.75 | 1/31/2029 | 8.2 | $229 | 6.3% |
| Michaels | NR / NR / NR | 21,023 | 9.3 | $10.50 | 9/30/2024 | 7.8 | NAV | NAV |
| Cost Plus World Market(7) | Baa3 / NR / BB+ | 19,982 | 8.8 | $9.30 | 1/31/2026 | 6.6 | $163 | 8.6% |
| Old Navy | Baa2 / NR / BB+ | 15,253 | 6.7 | $14.82 | 8/31/2029 | 8.0 | NAV | NAV |
| Petco | NR / NR / CCC+ | 15,000 | 6.6 | $15.75 | 4/30/2024 | 8.3 | NAV | NAV |
| Ulta | NR / NR / NR | 10,118 | 4.5 | $19.50 | 9/30/2020 | 7.0 | NAV | NAV |
| Shoe Carnival | NR / NR / NR | 10,000 | 4.4 | $14.50 | 7/31/2023 | 5.1 | NAV | NAV |
| Kirkland’s | NR / NR / NR | 9,213 | 4.1 | $19.00 | 9/30/2022 | 6.2 | $141 | 17.3% |
| Five Below | NR / NR / NR | 8,871 | 3.9 | $14.00 | 1/31/2030 | 4.4 | NAV | NAV |
| Subtotal / Wtd. Avg. | 158,226 | 69.8% | $12.48 | 69.7% | ||||
| Remaining Tenants | 48,419 | 21.4% | $17.70 | 30.3% | ||||
| Vacant | 19,926 | 8.8% | NAP | NAP | ||||
| Total / Wtd. Avg. | 226,571 | 100.0% | $13.70 | 100.0% | ||||
| (1) | Based on the underwritten rent roll dated April 1, 2019. |
| (2) | Certain ratings are those of the parent company whether or not the parent company guarantees the lease. |
| (3) | Base Rent PSF reflects the following: (a) in-place leases based on the April 1, 2019 rent roll, (b) contractual rent steps underwritten through March 2020 and average rent over the loan term for investment grade tenants, including buybuy Baby, Ross Dress for Less, Old Navy and Cost Plus World Market. |
| (4) | Old Navy and Five Below have termination options which may become exercisable prior to the originally stated expiration date of the tenant lease. |
| (5) | Not all tenants at the L Street Marketplace Property are required to report sales. Occupancy Cost is inclusive of underwritten base rent and total reimbursements. |
| (6) | buybuy Baby, a subsidiary of Bed Bath & Beyond Inc., is under a sublease between Bed Bath & Beyond Inc., as the lessee, and buybuy Baby, as the sublessee. |
| (7) | Cost Plus World Market, a subsidiary of Bed Bath & Beyond Inc., is under a sublease between Bed Bath & Beyond Inc., as the lessee, and Cost Plus World Market, as the sublessee. |
| Lease Rollover Schedule(1)(2) | |||||||||
Year | Number of Leases Expiring | Net Rentable | % of NRA | Base Rent Expiring(3) | % of Base Rent Expiring | Cumulative Net Rentable Area Expiring | Cumulative % | Cumulative | Cumulative % of Base Rent Expiring |
| Vacant | NAP | 19,926 | 8.8% | NAP | NAP | 19,926 | 8.8% | NAP | NAP |
| 2019 & MTM | 2 | 7,028 | 3.1 | $139,826 | 4.9% | 26,954 | 11.9% | $139,826 | 4.9% |
| 2020 | 4 | 17,245 | 7.6 | 325,314 | 11.5 | 44,199 | 19.5% | $465,140 | 16.4% |
| 2021 | 2 | 11,529 | 5.1 | 198,492 | 7.0 | 55,728 | 24.6% | $663,632 | 23.4% |
| 2022 | 2 | 10,943 | 4.8 | 201,009 | 7.1 | 66,671 | 29.4% | $864,641 | 30.5% |
| 2023 | 4 | 22,978 | 10.1 | 315,833 | 11.2 | 89,649 | 39.6% | $1,180,474 | 41.7% |
| 2024 | 3 | 37,685 | 16.6 | 484,415 | 17.1 | 127,334 | 56.2% | $1,664,889 | 58.8% |
| 2025 | 0 | 0 | 0.0 | 0 | 0.0 | 127,334 | 56.2% | $1,664,889 | 58.8% |
| 2026 | 2 | 45,014 | 19.9 | 418,630 | 14.8 | 172,348 | 76.1% | $2,083,519 | 73.6% |
| 2027 | 0 | 0 | 0.0 | 0 | 0.0 | 172,348 | 76.1% | $2,083,519 | 73.6% |
| 2028 | 2 | 6,365 | 2.8 | 166,250 | 5.9 | 178,713 | 78.9% | $2,249,769 | 79.5% |
| 2029 | 2 | 38,987 | 17.2 | 457,532 | 16.2 | 217,700 | 96.1% | $2,707,301 | 95.6% |
| 2030 & Beyond | 1 | 8,871 | 3.9 | 124,194 | 4.4 | 226,571 | 100.0% | $2,831,495 | 100.0% |
| Total | 24 | 226,571 | 100.0% | $2,831,495 | 100.0% | ||||
| (1) | Based on the underwritten rent roll dated April 1, 2019. |
| (2) | Certain tenants may have termination or contraction options (which may become exercisable prior to the originally stated expiration date of the tenant lease) that are not considered in the above Lease Rollover Schedule. |
| (3) | Based Rent Expiring reflects the following: (a) in-place leases based on the April 1, 2019 rent roll and (b) contractual rent steps totaling approximately $24,106. |
THE INFORMATION IN THIS STRUCTURAL AND COLLATERAL TERM SHEET IS NOT COMPLETE AND MAY BE AMENDED PRIOR TO THE TIME OF SALE. THIS TERM SHEET IS NOT AN OFFER TO SELL THESE SECURITIES AND IT IS NOT A SOLICITATION OF AN OFFER TO BUY THESE SECURITIES IN ANY JURISDICTION WHERE THE OFFER OR SALE IS NOT PERMITTED.
99 of 116
| Structural and Collateral Term Sheet | JPMCC 2019-COR5 | |
| L Street Marketplace | ||
| Operating History and Underwritten Net Cash Flow(1) | ||||||
2017 | 2018 | TTM(2) | Underwritten | Per Square Foot | %(3) | |
| Rents In Place(4) | $3,995,550 | $3,300,385 | $3,280,953 | $2,831,495 | $12.50 | 64.1% |
| Vacant Income | 0 | 0 | 0 | 325,306 | 1.44 | 7.4 |
| Gross Potential Rent | $3,995,550 | $3,300,385 | $3,280,953 | $3,156,801 | $13.93 | 71.5% |
| Percentage Rent | 5,425 | (41,001) | (39,367) | 0 | 0.00 | 0.0 |
| Other Reimbursements | 1,029,859 | 1,095,846 | 966,275 | 1,247,396 | 5.51 | 28.2 |
| Other Income | 21,321 | 16,425 | 12,791 | 12,791 | 0.06 | 0.3 |
| Net Rental Income | $5,052,155 | $4,371,655 | $4,220,652 | $4,416,987 | $19.49 | 100.0% |
| (Vacancy/Credit Loss) | (932,555) | (611,620) | (712,063) | (325,306) | (1.44) | (7.4) |
| Effective Gross Income | $4,119,600 | $3,760,034 | $3,508,588 | $4,091,681 | $18.06 | 100.0% |
| Total Expenses | $1,425,348 | $1,420,082 | $1,428,664 | $1,464,675 | $6.46 | 35.8% |
| Net Operating Income(5) | $2,694,251 | $2,339,953 | $2,079,924 | $2,627,006 | $11.59 | 64.2% |
| TI/LC | 0 | 0 | 0 | 226,571 | 1.00 | 5.5 |
| Capital Expenditures | 0 | 0 | 0 | 33,986 | 0.15 | 0.8 |
| Net Cash Flow | $2,694,251 | $2,339,953 | $2,079,924 | $2,366,449 | $10.44 | 57.8% |
| Occupancy(6) | 81.3% | 79.9% | 91.2% | 92.6% | ||
| (1) | Full year 2016 financials are not available as the loan sponsor acquired the L Street Marketplace property in July 2016. |
| (2) | TTM column represents the trailing 12-month period ending March 31, 2019. |
| (3) | % column represents percentage of Net Rental Income for all revenue lines and represents Effective Gross Income for the remainder of the fields. |
| (4) | Underwritten Rents in Place includes contractual rent steps underwritten through March 2020 and average rent over the loan term for investment grade tenants, including buybuy Baby, Ross Dress for Less, Old Navy and Cost Plus World Market. |
| (5) | The increase in Underwritten Net Operating Income from TTM Net Operating Income is primarily attributable to newly signed leases with Ross Dress for Less, Old Navy, Five Below, Nutrition 402 and Urban Classic, which collectively account for approximately $704,710 in underwritten rent. |
| (6) | 2017 and 2018 occupancies are as of December 31 of each respective year. TTM occupancy reflects the April 1, 2019 rent roll. Underwritten Occupancy reflects economic occupancy. The increase in underwritten occupancy from 2018 occupancy is primarily attributable to newly signed leases with Ross Dress for Less, Old Navy, Five Below, Nutrition 402 and Urban Classic. |
Property Management.The L Street Marketplace Property is managed by AZT Corporation, a Texas corporation and borrower affiliate.
THE INFORMATION IN THIS STRUCTURAL AND COLLATERAL TERM SHEET IS NOT COMPLETE AND MAY BE AMENDED PRIOR TO THE TIME OF SALE. THIS TERM SHEET IS NOT AN OFFER TO SELL THESE SECURITIES AND IT IS NOT A SOLICITATION OF AN OFFER TO BUY THESE SECURITIES IN ANY JURISDICTION WHERE THE OFFER OR SALE IS NOT PERMITTED.
100 of 116
| Structural and Collateral Term Sheet | JPMCC 2019-COR5 | |
| Lone Peak | ||
| Mortgage Loan Information | Property Information | |||
| Mortgage Loan Seller: | LCM | Single Asset / Portfolio: | Single Asset | |
| Original Principal Balance: | $25,750,000 | Title: | Fee | |
| Cut-off Date Principal Balance: | $25,750,000 | Property Type - Subtype: | Office – Suburban | |
| % of Pool by IPB: | 3.7% | Net Rentable Area (SF): | 125,374 | |
| Loan Purpose: | Refinance | Location: | Lehi, UT | |
| Borrower: | Lone Peak Office Partners, LLC | Year Built / Renovated: | 2018 / N/A | |
| Loan Sponsor: | KC Gardner Company, L.C. | Occupancy: | 89.3% | |
| Interest Rate: | 5.06300% | Occupancy Date: | 3/1/2019 | |
| Note Date: | 12/21/2018 | Number of Tenants: | 3 | |
| Maturity Date: | 4/6/2029 | 2016 NOI(1): | N/A | |
| Interest-only Period: | 27 months | 2017 NOI(1): | N/A | |
| Original Term: | 123 months | 2018 NOI(1): | N/A | |
| Original Amortization: | 300 months | TTM NOI(1): | N/A | |
| Amortization Type: | IO-Balloon | UW Economic Occupancy: | 88.9% | |
| Call Protection: | L(29),Def(90),O(4) | UW Revenues: | $3,042,612 | |
| Lockbox / Cash Management: | Hard / In Place | UW Expenses: | $763,154 | |
| Additional Debt: | N/A | UW NOI: | $2,279,457 | |
| Additional Debt Balance: | N/A | UW NCF: | $2,174,143 | |
| Additional Debt Type: | N/A | Appraised Value / Per SF: | $34,520,000 / $275 | |
| Appraisal Date: | 10/3/2018 | |||
| Escrows and Reserves | Financial Information | ||||||
| Initial | Monthly | Initial Cap | Cut-off Date Loan / SF: | $205 | |||
| Taxes: | $50,000 | $22,000 | N/A | Maturity Date Loan / SF: | $166 | ||
| Insurance: | $0 | Springing | N/A | Cut-off Date LTV: | 74.6% | ||
| Replacement Reserves: | $0 | $2,612 | N/A | Maturity Date LTV: | 60.4% | ||
| TI/LC: | $0 | $10,448 | N/A | UW NCF DSCR: | 1.20x | ||
| Other(2)(3): | $2,486,427 | $0 | N/A | UW NOI Debt Yield: | 8.9% | ||
| Sources and Uses | ||||||
| Sources | Proceeds | % of Total | Uses | Proceeds | % of Total | |
| Mortgage Loan | $25,750,000 | 100.0% | Payoff Existing Debt | $20,512,418 | 79.7% | |
| Upfront Reserves | 2,536,427 | 9.9 | ||||
| Closing Costs | 365,231 | 1.4 | ||||
| Return of Equity | 2,335,924 | 9.1 | ||||
| Total Sources | $25,750,000 | 100.0% | Total Uses | $25,750,000 | 100.0% | |
| (1) | Historical cash flows are not available as the Lone Peak Property (as defined below) was recently constructed in 2018. |
| (2) | Initial Other Escrows and Reserves consist of (i) an initial deposit of $1,200,284 into the outstanding rollover reserve, (ii) an initial deposit of approximately $1,018,823 into the free rent reserve, and (iii) an initial deposit of $267,320 into the rollover reserve for approved leasing expenses. |
| (3) | On each payment date during a lease sweep period, all available cash will be deposited into the special rollover reserve account. |
The Loan.The Lone Peak mortgage loan, with an outstanding principal balance as of the Cut-off Date of approximately $25.8 million (the “Lone Peak Loan”), is secured by a first mortgage lien on the borrower’s fee interest in a newly-constructed, 125,374 square foot, Class A office building located in Lehi, Utah (the “Lone Peak Property”). The Lone Peak Loan has a 123-month term and, following a 27-month interest-only period, will amortize on a 25-year schedule.
The Borrower. The borrowing entity is Lone Peak Office Partners, LLC, a Utah limited liability company and special purpose entity structured to be bankruptcy remote with one independent director. The borrowing entity intends to convey a 15.21% tenant-in-common interest to an approved tenant-in-common borrower (and restructure its interest into a tenant-in-common interest). The borrower has the right to convey an additional 4.79% interest to another tenant-in-common borrowerprovided that, among other things, the new tenant-in-
THE INFORMATION IN THIS STRUCTURAL AND COLLATERAL TERM SHEET IS NOT COMPLETE AND MAY BE AMENDED PRIOR TO THE TIME OF SALE. THIS TERM SHEET IS NOT AN OFFER TO SELL THESE SECURITIES AND IT IS NOT A SOLICITATION OF AN OFFER TO BUY THESE SECURITIES IN ANY JURISDICTION WHERE THE OFFER OR SALE IS NOT PERMITTED.
101 of 116
| Structural and Collateral Term Sheet | JPMCC 2019-COR5 | |
| Lone Peak | ||
common borrower is acceptable to the lender and assumes all of the borrower’s liabilities and obligations under the loan documents on a joint and several basis.
The Loan Sponsor. The loan sponsor and nonrecourse carve-out guarantor is KC Gardner Company, L.C. (“The Gardner Company”). The Gardner Company is a privately-held commercial real estate company based in Salt Lake City, Utah. Founded in 2004, The Gardner Company specializes in the development of office, retail, industrial and medical buildings in Utah and Idaho, with one of the largest real estate portfolios in the region. The Gardner Company provides services ranging from initial planning to government relations and financing to architectural design and property management.
The Property.The Lone Peak Property is a recently constructed Class A, five-story office building totaling 125,374 square feet of net rentable area located in Lehi, Utah. The Lone Peak Property is situated on two adjacent parcels totaling approximately 8.5 acres and features floor-to-ceiling windows providing views of the surrounding mountains and is improved with tenant amenities such as a fitness room, game room, kitchen areas, basketball court and asphalt-paved parking areas offering 630 surface parking spaces (approximately 5.0 spaces per 1,000 square feet) including several electric vehicle charging stations. Construction of the Lone Peak Property was completed in 2018. The Lone Peak Property is currently 89.3% leased to three tenants, including Nature Sunshine Products (“Nature Sunshine”), Vivo, and Strala, Inc. (“Strala”).
The largest tenant, Nature Sunshine (NASDAQ: NATR), together with its subsidiaries, primarily engages in the manufacture and direct sale of nutritional and personal care products worldwide. Nature Sunshine was founded in 1972, has approximately 900 employees, and is headquartered at the Lone Peak Property. Nature Sunshine’s premises at the Lone Peak Property serves as its main corporate and sales location and houses a research/innovation center and a dedicated cafeteria and a fitness center. Nature Sunshine occupies 61,573 square feet across three spaces through March 2029 with no termination options and two six-year extension options at fair market rent.
The second largest tenant, Vivo, provides a variety of office space and services that can accommodate up to 20 people. Vivo leases 37,699 square feet across two spaces with coterminous lease expirations in August 2030 and no termination or extension options.
The third largest tenant, Strala, is a software as a service platform for marketing organizations seeking to improve omni-channel campaign tracking, real-time customer touchpoints, and content intelligence. Strala occupies 12,736 square feet on an 11-year lease expiring in July 2029 with no termination options and one five-year extension option.
There is a Master Lease Agreement in place for the remaining 13,366 square feet of vacant space.
The Market.The Loan Peak Property is situated in the heart of the dynamic North Utah County market. The Lone Peak Property is located a few blocks west of entrance/exit ramps to Interstate-15, Utah’s primary north/south arterial that provides access to the entire Utah Valley as well as to the Salt Lake Valley. Commuter rail access is available within walking distance (0.4-miles) via the UTA Frontrunner Lehi Station.
The Lone Peak Property is located in the Utah County office submarket, within the greater Salt Lake City office market. As of the first quarter of 2019, the greater Salt Lake City office market consisted of approximately 109.7 million square feet of office across 4,977 buildings with an overall market vacancy of 6.7% and average asking rents of approximately $21.44 per square foot. As of the first quarter of 2019, the Utah County office submarket consisted of approximately 21.1 million square feet of office space across 1,166 buildings with an overall market vacancy of 8.0% and average market asking rents of $21.67 per square foot.
The appraisal identified five comparable office leases ranging in size from 21,816 square feet to 145,646 square feet. Base rents for the comparable office leases ranged from $19.25 per square foot to $26.50 per square foot.
| Tenant Summary(1) | ||||||
| Tenant | Ratings Moody’s/Fitch/S&P | Net Rentable Area (SF) | % of Total NRA | Base Rent PSF | % of Total Base Rent | Lease Expiration Date |
| Nature Sunshine Products | NR / NR / NR | 61,573 | 49.1% | $26.91 | 48.4% | 03/31/2029 |
| Vivo | NR / NR / NR | 37,699 | 30.1% | $27.54 | 30.3% | 08/31/2030 |
| Strala, Inc. | NR / NR / NR | 12,736 | 10.2% | $27.30 | 10.2% | 07/31/2029 |
| (1) | Based on the underwritten rent roll dated as of March 1, 2019 inclusive of rent steps through April 1, 2020. |
THE INFORMATION IN THIS STRUCTURAL AND COLLATERAL TERM SHEET IS NOT COMPLETE AND MAY BE AMENDED PRIOR TO THE TIME OF SALE. THIS TERM SHEET IS NOT AN OFFER TO SELL THESE SECURITIES AND IT IS NOT A SOLICITATION OF AN OFFER TO BUY THESE SECURITIES IN ANY JURISDICTION WHERE THE OFFER OR SALE IS NOT PERMITTED.
102 of 116
| Structural and Collateral Term Sheet | JPMCC 2019-COR5 | |
| Lone Peak | ||
Lease Rollover Schedule(1) | |||||||||
| Year | Number of Leases Expiring | Net Rentable Area Expiring | % of NRA Expiring | Base Rent Expiring | % of Base Rent Expiring | Cumulative Net Rentable Area Expiring | Cumulative % of NRA Expiring | Cumulative Base Rent Expiring | Cumulative % of Base Rent Expiring |
| Vacant | NAP | 13,366 | 10.7% | NAP | NAP | 13,366 | 10.7% | NAP | NAP |
| 2019 & MTM | 0 | 0 | 0.0% | 0 | 0.0% | 13,366 | 10.7% | $0 | 0.0% |
| 2020 | 0 | 0 | 0.0% | 0 | 0.0% | 13,366 | 10.7% | $0 | 0.0% |
| 2021 | 0 | 0 | 0.0% | 0 | 0.0% | 13,366 | 10.7% | $0 | 0.0% |
| 2022 | 0 | 0 | 0.0% | 0 | 0.0% | 13,366 | 10.7% | $0 | 0.0% |
| 2023 | 0 | 0 | 0.0% | 0 | 0.0% | 13,366 | 10.7% | $0 | 0.0% |
| 2024 | 0 | 0 | 0.0% | 0 | 0.0% | 13,366 | 10.7% | $0 | 0.0% |
| 2025 | 0 | 0 | 0.0% | 0 | 0.0% | 13,366 | 10.7% | $0 | 0.0% |
| 2026 | 0 | 0 | 0.0% | 0 | 0.0% | 13,366 | 10.7% | $0 | 0.0% |
| 2027 | 0 | 0 | 0.0% | 0 | 0.0% | 13,366 | 10.7% | $0 | 0.0% |
| 2028 | 0 | 0 | 0.0% | 0 | 0.0% | 13,366 | 10.7% | $0 | 0.0% |
| 2029 | 2 | 74,309 | 59.3% | $2,004,328 | 65.9% | 87,675 | 69.9% | $2,004,328 | 65.9% |
| 2030 & Beyond | 1 | 37,699 | 30.1% | 1,038,284 | 34.1% | 125,374 | 100.0% | $3,042,612 | 100.0% |
| Total | 3 | 125,374 | 100.0% | $3,042,612 | 100.0% | ||||
| (1) | Based on the underwritten rent roll dated as of March 1, 2019 inclusive of rent steps through April 1, 2020. |
| Operating History and Underwritten Net Cash Flow(1) | |||
| Underwritten | Per Square Foot | %(2) | |
| Rents in Place(3) | $3,042,612 | $24.27 | 88.9% |
| Vacant Income | 380,931 | 3.04 | 11.1 |
| Gross Potential Rent | $3,423,543 | $27.31 | 100.0% |
| Total Reimbursements | 0 | 0.00 | 0.0 |
| Total Other Income | 0 | 0.00 | 0.0 |
| Net Rental Income | $3,423,543 | $27.31 | 100.0% |
| (Vacancy/Credit Loss) | (380,931) | (3.04) | (11.1) |
| Effective Gross Income | $3,042,612 | $24.27 | 88.9% |
| Total Expenses | $763,154 | $6.09 | 25.1% |
| Net Operating Income | $2,279,457 | $18.18 | 74.9% |
| Total TI/LC, CapEx/RR | 105,314 | 0.84 | 3.5 |
| Net Cash Flow | $2,174,143 | $17.34 | 71.5% |
| Occupancy(4) | 88.9% | ||
| (1) | Historical financials are not available, as the Lone Peak Property is a newly-constructed building that was completed in 2018. |
| (2) | % column represents percent of Net Rental Income for all revenue lines and represents percent of Effective Gross Income for the remainder of the fields. |
| (3) | Underwritten Rents in Place are inclusive of rent steps through April 1, 2020. |
| (4) | Underwritten occupancy represents in-place economic occupancy. The Lone Peak Property is 89.3% leased as of March 1, 2019. |
THE INFORMATION IN THIS STRUCTURAL AND COLLATERAL TERM SHEET IS NOT COMPLETE AND MAY BE AMENDED PRIOR TO THE TIME OF SALE. THIS TERM SHEET IS NOT AN OFFER TO SELL THESE SECURITIES AND IT IS NOT A SOLICITATION OF AN OFFER TO BUY THESE SECURITIES IN ANY JURISDICTION WHERE THE OFFER OR SALE IS NOT PERMITTED.
103 of 116
| Structural and Collateral Term Sheet | JPMCC 2019-COR5 | |
| ICON Upper East Side Portfolio | ||
| Mortgage Loan Information | Property Information | |||
| Mortgage Loan Seller: | JPMCB | Single Asset / Portfolio: | Portfolio | |
| Credit Assessment: | Title: | Fee | ||
| (Fitch / KBRA / S&P)(1) | BBB- / BBB+ / N/A | Property Type – Subtype: | Various – Various | |
| Original Principal Balance(2): | $25,000,000 | Net Rentable Area (Units)(6): | 350 | |
| Cut-off Date Principal Balance(2): | $25,000,000 | Location: | New York, NY | |
| % of Pool by IPB: | 3.6% | Year Built / Renovated: | Various / Various | |
| Loan Purpose: | Refinance | Occupancy(7): | 97.7% | |
| Borrowers(3): | Various | Occupancy Date: | 4/11/2019 | |
| Sponsor: | Icon Realty Management | Number of Tenants(8): | 3 | |
| Interest Rate: | 4.50000% | 2016 NOI: | $6,689,626 | |
| Note Date: | 4/17/2019 | 2017 NOI: | $7,063,038 | |
| Maturity Date: | 5/1/2024 | 2018 NOI: | $7,046,981 | |
| Interest-only Period: | 60 months | TTM NOI: | N/A | |
| Original Term: | 60 months | UW Economic Occupancy: | 95.3% | |
| Original Amortization: | None | UW Revenues: | $11,226,823 | |
| Amortization Type: | Interest Only | UW Expenses: | $4,103,552 | |
| Call Protection: | L(25),Grtr1%orYM(29),O(6) | UW NOI: | $7,123,271 | |
| Lockbox / Cash Management: | Soft / In Place | UW NCF(9): | $7,032,286 | |
| Additional Debt: | Yes | Appraised Value / Per Unit: | $201,300,000 / $575,143 | |
| Additional Debt Balance(2): | $33,500,000 / $57,200,000 | Appraisal Date: | Various | |
| Additional Debt Type(2): | Pari Passu / Subordinate | |||
| Escrows and Reserves | Financial Information(2) | ||||||||
| Initial | Monthly | Initial Cap | Senior Notes | Whole Loan | |||||
| Taxes: | $1,102,623 | $220,525 | N/A | Cut-off Date Loan / Unit: | $167,143 | $330,571 | |||
| Insurance(4): | $0 | Springing | N/A | Maturity Date Loan / Unit: | $167,143 | $330,571 | |||
| Replacement Reserves(5): | $7,268 | $7,268 | $261,651 | Cut-off Date LTV: | 29.1% | 57.5% | |||
| TI/LC(5): | $398 | $398 | $9,560 | Maturity Date LTV: | 29.1% | 57.5% | |||
| Other: | $0 | $0 | N/A | UW NCF DSCR: | 2.63x | 1.33x | |||
| UW NOI Debt Yield: | 12.2% | 6.2% | |||||||
| Sources and Uses | ||||||
| Sources | Proceeds | % of Total | Uses | Proceeds | % of Total | |
| Whole Loan(2) | $115,700,000 | 100.0% | Payoff Existing Debt | $87,925,709 | 76.0% | |
| Closing Costs | 2,936,716 | 2.5 | ||||
| Upfront Reserves | 1,110,289 | 1.0 | ||||
| Return of Equity | 23,727,286 | 20.5 | ||||
| Total Sources | $115,700,000 | 100.0% | Total Uses | $115,700,000 | 100.0% | |
| (1) | Fitch and KBRA provided the listed assessments for the ICON UES Portfolio Loan (as defined below) in the context of its inclusion in the mortgage pool. S&P does not provide a credit assessment but confirmed that the ICON UES Portfolio Loan has, in the context of its inclusion in the mortgage pool, credit characteristics consistent with an investment grade obligation. |
| (2) | The ICON UES Portfolio Loan is part of a whole loan evidenced by three seniorpari passunotes and one subordinate note, with an aggregate outstanding principal balance as of the Cut-off Date of $115.7 million. Financial Information presented in the chart above reflects the aggregate Cut-off Date Balance of the $58.5 million senior notes and the $115.7 million ICON UES Portfolio Whole Loan (as defined below). |
| (3) | The borrowers are 242 East 75 Realty Associates LLC, 1556 Second Realty Associates LLC, 228 East 84 Realty Associates LLC, 244 East 78 Realty Associates LLC, 323 East 78 Realty Associates LLC, 338 East 55 Realty Associates LLC, 332 East 71 Realty Associates LLC, 322 East 74 Realty Associates LLC, 340 East 61 Realty Associates LLC, 342 East 76 Realty Associates LLC, 340 East 81 Realty Associates LLC, 340 East 55 Realty Associates LLC, 409 East 81 Realty Associates LLC, 407 East 81 Realty Associates LLC, 344 East 55 Realty Associates LLC, 443 East 78 Realty Associates LLC, 419 East 82 Realty Associates LLC, 502 East 73 Realty Associates LLC and 513 East 82 Realty Associates LLC. |
THE INFORMATION IN THIS STRUCTURAL AND COLLATERAL TERM SHEET IS NOT COMPLETE AND MAY BE AMENDED PRIOR TO THE TIME OF SALE. THIS TERM SHEET IS NOT AN OFFER TO SELL THESE SECURITIES AND IT IS NOT A SOLICITATION OF AN OFFER TO BUY THESE SECURITIES IN ANY JURISDICTION WHERE THE OFFER OR SALE IS NOT PERMITTED.
104 of 116
| Structural and Collateral Term Sheet | JPMCC 2019-COR5 | |
| ICON Upper East Side Portfolio | ||
| (4) | The monthly deposits into the insurance reserve are waived so long as (i) no event of default has occurred and is continuing and (ii) the borrowers provide the lender with reasonably satisfactory evidence (as determined by the lender) that the ICON UES Properties (as defined below) are insured in accordance with the loan documents pursuant to a blanket insurance policy acceptable to the lender. |
| (5) | The loan documents provide that the cap for the replacement reserve is equal to 36 times the monthly contribution of $7,268, and the cap for the TI/LC reserve is equal to 24 times the monthly contribution of $398. |
| (6) | Net Rentable Area (Units) is reflective of 346 residential units and four commercial units. |
| (7) | Occupancy based solely on the weighted averaged of residential units is 97.7%. The weighted average occupancy of the commercial square footage is 85.1%. |
| (8) | Number of Tenants is reflective of three commercial tenants who currently occupy approximately 4,000 square feet of commercial space, encompassing the 1556 Second Avenue, 344 East 55th Street and 443 East 78th Street Properties out of the total 4,700 square feet of commercial space. The remaining 700 square feet of commercial space is associated with vacant commercial space at the 419 East 82nd Street Property. |
| (9) | UW NCF is based on the lender’s portfolio level underwriting, which applies additional vacancy at a portfolio level in excess of the in-place vacancy at the property level. Based on the in-place rent roll as of April 2019, the ICON Upper East Side Portfolio (as defined below) has a 2.8% economic vacancy rate, as compared to the underwritten portfolio level vacancy assumption of 5.0% for market rate and commercial units. Portfolio UW NCF varies from the aggregate individual underwritten cash flow for the all 19 ICON UES Portfolio Properties (as defined below), as vacancy was underwritten based on the in-place rent roll on a property level. |
The Loan.The ICON Upper East Side Portfolio loan (the “ICON UES Portfolio Loan”) is secured by a first mortgage lien on the borrowers’ fee interests in a portfolio of 19 multifamily and mixed use properties totaling 350 units, located throughout the Upper East Side neighborhood of Manhattan, New York (each, an “ICON UES Portfolio Property”, and together the “ICON UES Portfolio Properties” or the “ICON UES Portfolio”). The ICON UES Portfolio Loan is part of a whole loan that has an aggregate outstanding principal balance as of the Cut-off Date of $115.7 million (the “ICON UES Portfolio Whole Loan”) and is comprised of three seniorpari passunotes and one subordinate note, each as described below. The non-controlling Note A-2, with an outstanding principal balance as of the Cut-off Date of approximately $25.0 million, will be contributed to the JPMCC 2019-COR5 Trust. The remaining note is currently held by JPMCB, as shown in the chart below. The relationship between the holders of the ICON UES Portfolio Whole Loan will be governed by a co-lender agreement as described under the “Description of the Mortgage Pool—The Whole Loans—The Non-Serviced AB Whole Loans—The ICON UES Portfolio Whole Loan” in the Preliminary Prospectus. The ICON UES Portfolio Whole Loan has a 5-year term and is interest-only for the full term.
| Whole Loan Summary | |||||
| Note | Original Balance | Cut-off Date Balance | Note Holder | Controlling Piece | |
| A-1 | $8,500,000 | $8,500,000 | JPMCC 2019-ICON UES | Yes | |
| A-2 | 25,000,000 | 25,000,000 | JPMCC 2019-COR5 | No | |
| A-3 | 25,000,000 | 25,000,000 | JPMCB | No | |
| B | 57,200,000 | 57,200,000 | JPMCC 2019-ICON UES | No | |
| Total | $115,700,000 | $115,700,000 | |||
The Borrowers.The borrowing entities are 242 East 75 Realty Associates LLC, 1556 Second Realty Associates LLC, 228 East 84 Realty Associates LLC, 244 East 78 Realty Associates LLC, 323 East 78 Realty Associates LLC, 338 East 55 Realty Associates LLC, 332 East 71 Realty Associates LLC, 322 East 74 Realty Associates LLC, 340 East 61 Realty Associates LLC, 342 East 76 Realty Associates LLC, 340 East 81 Realty Associates LLC, 340 East 55 Realty Associates LLC, 409 East 81 Realty Associates LLC, 407 East 81 Realty Associates LLC, 344 East 55 Realty Associates LLC, 443 East 78 Realty Associates LLC, 419 East 82 Realty Associates LLC, 502 East 73 Realty Associates LLC and 513 East 82 Realty Associates LLC, each a Delaware limited liability company and special purpose entity structured to be bankruptcy remote with two independent directors. Legal counsel to the borrowers delivered a non-consolidation opinion in connection with the origination of the ICON UES Portfolio Whole Loan.
The Loan Sponsor.The loan sponsor, Icon Realty Management, is a private real estate investment, management and development company with a variety of real estate holdings in New York, New York. Icon Realty Management owns and manages over 1,800 apartment units located throughout Manhattan and Brooklyn. Founded in 2003 by Terrence Lowenberg and Todd Cohen, Icon Realty Management has acquired over 165 assets and executed over $1.75 billion of real estate transactions in office, mixed-use, multifamily and hospitality properties since its inception. Icon Realty Management’s existing investment portfolio is comprised of 112 assets and approximately 1.6 million square feet. Terrence Lowenberg and Todd Cohen serve as the non-recourse carveout guarantors under the ICON UES Portfolio Whole Loan.
THE INFORMATION IN THIS STRUCTURAL AND COLLATERAL TERM SHEET IS NOT COMPLETE AND MAY BE AMENDED PRIOR TO THE TIME OF SALE. THIS TERM SHEET IS NOT AN OFFER TO SELL THESE SECURITIES AND IT IS NOT A SOLICITATION OF AN OFFER TO BUY THESE SECURITIES IN ANY JURISDICTION WHERE THE OFFER OR SALE IS NOT PERMITTED.
105 of 116
| Structural and Collateral Term Sheet | JPMCC 2019-COR5 | |
| ICON Upper East Side Portfolio | ||
| Property | Total Units(1) | Year Built | Allocated Whole Loan Amount | % of Allocated Loan Amount | Appraised Value | UW NCF | % UW NCF(2) | |||||
| 244 East 78th Street | 24 | 1910 | $8,700,000 | 7.5 | % | $16,300,000 | $482,534 | 6.7 | % | |||
| 332 East 71st Street | 20 | 1925 | 7,100,000 | 6.1 | 12,900,000 | 418,973 | 5.8 | |||||
| 1556 Second Avenue | 7 | 1910 | 6,800,000 | 5.9 | 10,300,000 | 457,717 | 6.3 | |||||
| 323 East 78th Street | 16 | 1910 | 6,800,000 | 5.9 | 12,500,000 | 449,909 | 6.2 | |||||
| 502 East 73rd Street | 20 | 1910 | 6,800,000 | 5.9 | 10,400,000 | 338,801 | 4.7 | |||||
| 513 East 82nd Street | 20 | 1910 | 6,800,000 | 5.9 | 11,200,000 | 405,180 | 5.6 | |||||
| 344 East 55th Street | 20 | 1940 | 6,600,000 | 5.7 | 11,800,000 | 449,124 | 6.2 | |||||
| 228 East 84th Street | 18 | 1910 | 6,400,000 | 5.5 | 11,600,000 | 417,566 | 5.8 | |||||
| 340 East 81st Street | 16 | 1910 | 6,000,000 | 5.2 | 9,900,000 | 397,923 | 5.5 | |||||
| 419 East 82nd Street | 21 | 1910 | 6,000,000 | 5.2 | 10,200,000 | 360,324 | 5.0 | |||||
| 338 East 55th Street | 10 | 1950 | 5,900,000 | 5.1 | 8,800,000 | 425,907 | 5.9 | |||||
| 409 East 81st Street | 20 | 1900 | 5,700,000 | 4.9 | 10,000,000 | 379,930 | 5.2 | |||||
| 322 East 74th Street | 20 | 1910 | 5,600,000 | 4.8 | 10,500,000 | 372,422 | 5.1 | |||||
| 443 East 78th Street | 21 | 1924 | 5,600,000 | 4.8 | 9,600,000 | 310,565 | 4.3 | |||||
| 340 East 55th Street | 20 | 1920 | 5,400,000 | 4.7 | 10,000,000 | 327,616 | 4.5 | |||||
| 340 East 61st Street | 20 | 1910 | 5,200,000 | 4.5 | 8,700,000 | 349,380 | 4.8 | |||||
| 407 East 81st Street | 20 | 1920 | 5,200,000 | 4.5 | 9,800,000 | 315,036 | 4.4 | |||||
| 242 East 75th Street | 20 | 1910 | 4,800,000 | 4.1 | 8,900,000 | 306,216 | 4.2 | |||||
| 342 East 76th Street | 17 | 1910 | 4,300,000 | 3.7 | 7,900,000 | 274,354 | 3.8 | |||||
| Total/Wtd. Avg. | 350 | $115,700,000 | 100.0 | % | $201,300,000 | $7,032,286(3) | 100.0 | % | ||||
| (1) | Total units is comprised of 346 residential units and four commercial units associated with the 1556 Second Avenue, 344 East 55th Street, 419 East 82nd Street and 443 East 78th Street properties. |
| (2) | % UW NCF is based upon the aggregate individual property level underwritten net cash flow. |
| (3) | Total Portfolio UW NCF is based on the lender’s portfolio level underwriting, which applies additional vacancy at a portfolio level in excess of the in-place vacancy at the property level. Based on the in-place rent roll as of April 2019, the ICON UES Portfolio has a 2.8% economic vacancy rate, as compared to the underwritten portfolio level vacancy assumption of 5.0% for market rate and commercial units. Portfolio UW NCF varies from the aggregate individual UW NCF for the 19 ICON UES Portfolio Properties, as vacancy was underwritten based on the in-place rent roll on a property level. The incremental vacancy utilized to achieve the 5.0% economic vacancy at the portfolio level underwriting is equal to $207,191. |
The Portfolio. The ICON UES Portfolio consists of 19 properties, comprised of 346 residential units and 4,700 square feet of commercial space located throughout the Upper East Side neighborhood of Manhattan, New York. The ICON UES Portfolio is comprised of (i) 281 market-rate units, (ii) 58 rent-stabilized units, (iii) seven rent-controlled units and (iv) an additional 4,700 square feet of commercial space. Residential units within the ICON UES Portfolio consist of 113 studio, 185 one-bedroom, 35 two-bedroom, six, three-bedroom, four four-bedroom and three, five-bedroom apartments. The ICON UES Portfolio Properties were originally constructed between 1900 and 1950, with 14 of the ICON UES Portfolio Properties having undergone renovations since 2011. Newly renovated units include renovated kitchens with wood cabinets, granite or Caesarstone countertops, hardwood flooring, stainless steel appliances, microwaves and dishwashers. Renovated bathrooms include ceramic tile flooring and walls, porcelain sinks atop a wood vanity and porcelain tubs with chrome fixtures.
THE INFORMATION IN THIS STRUCTURAL AND COLLATERAL TERM SHEET IS NOT COMPLETE AND MAY BE AMENDED PRIOR TO THE TIME OF SALE. THIS TERM SHEET IS NOT AN OFFER TO SELL THESE SECURITIES AND IT IS NOT A SOLICITATION OF AN OFFER TO BUY THESE SECURITIES IN ANY JURISDICTION WHERE THE OFFER OR SALE IS NOT PERMITTED.
106 of 116
| Structural and Collateral Term Sheet | JPMCC 2019-COR5 | |
| ICON Upper East Side Portfolio | ||
| Historical and Current Occupancy(1) | ||||||||
| Property | 2016 | (2) | 2017 | (2) | 2018 | (2) | Current(2)(3) | |
| 244 East 78th Street | 95.8 | % | 100.0 | % | 95.8 | % | 91.7 | % |
| 332 East 71st Street | 90.0 | % | 95.0 | % | 95.0 | % | 95.0 | % |
| 1556 Second Avenue(4) | 83.3 | % | 50.0 | % | 83.3 | % | 83.3 | % |
| 323 East 78th Street | 100.0 | % | 100.0 | % | 100.0 | % | 100.0 | % |
| 502 East 73rd Street | 100.0 | % | 100.0 | % | 95.0 | % | 95.0 | % |
| 513 East 82nd Street | 100.0 | % | 95.0 | % | 95.0 | % | 95.0 | % |
| 344 East 55th Street | 100.0 | % | 95.0 | % | 100.0 | % | 100.0 | % |
| 228 East 84th Street | 100.0 | % | 100.0 | % | 94.0 | % | 100.0 | % |
| 340 East 81st Street | 93.8 | % | 100.0 | % | 100.0 | % | 100.0 | % |
| 419 East 82nd Street | 95.0 | % | 100.0 | % | 100.0 | % | 100.0 | % |
| 338 East 55th Street | 100.0 | % | 100.0 | % | 100.0 | % | 100.0 | % |
| 409 East 81st Street | 100.0 | % | 100.0 | % | 100.0 | % | 100.0 | % |
| 322 East 74th Street | 100.0 | % | 100.0 | % | 95.0 | % | 100.0 | % |
| 443 East 78th Street | 100.0 | % | 100.0 | % | 95.0 | % | 95.0 | % |
| 340 East 55th Street | 100.0 | % | 100.0 | % | 100.0 | % | 95.0 | % |
| 340 East 61st Street | 95.0 | % | 90.0 | % | 95.0 | % | 100.0 | % |
| 407 East 81st Street | 100.0 | % | 100.0 | % | 100.0 | % | 100.0 | % |
| 242 East 75th Street | 95.0 | % | 95.0 | % | 90.0 | % | 100.0 | % |
| 342 East 76th Street | 100.0 | % | 100.0 | % | 100.0 | % | 100.0 | % |
| Weighted Average | 97.9 | % | 98.3 | % | 97.0 | % | 97.7 | % |
| (1) | Historical occupancies are as of December 31 of each respective year. |
| (2) | Weighted Average occupancy is based solely on the weighted average occupancy of residential units. |
| (3) | Current occupancy is based on the April 11, 2019 rent roll residential units. The current occupancy based on the total 350 residential and commercial units is 97.4% |
| (4) | Occupancy in 2017 declined as sponsorship was completing renovations at the property. 2018 Occupancy decreased from 2017 as a result of leasing newly renovated units at market rates. |
244 East 78th Street
The largest ICON UES Portfolio Property by allocated loan amount, 244 East 78th Street (the “244 East 78th Street Property”), is a 24-unit, mid-rise, multifamily property located in New York, New York, on East 78th street between 2nd and 3rd Avenue. As of April 11, 2019, the 244 East 78th Street Property was 91.7% occupied by 22 tenants at a monthly average contractual in-place rent of $3,099 per unit. The 244 East 78th Street Property is a 5-story apartment building containing approximately 11,570 square feet of residential space. The 244 East 78th Street Property is comprised of nine studio, eight one-bedroom, three, two-bedroom, one three-bedroom, one four-bedroom and two five-bedroom units. Additionally, the unit mix is further broken down into 18 market rate units and six rent stabilized units. Built in 1910 and renovated in 2017, the 244 East 78th Street Property features a video intercom system, new entryway doors, a newly renovated lobby with slate floor tiles and marble staircases. Newly renovated units include in-unit washer and dryers, stainless steel appliances, hardwood floors and large windows.
332 East 71st Street
The second largest ICON UES Portfolio Property by allocated loan amount, 332 East 71st Street (the “332 East 71st Street Property”), is a 20-unit, mid-rise, multifamily property located in New York, New York, on East 71st street between 1st and 2nd Avenue. As of April 11, 2019, the 332 East 71st Street Property was 95.0% occupied by 19 tenants at a monthly average in-place rental rate of $2,970 per unit. The 332 East 71st Street Property is a 5-story apartment building containing approximately 9,735 square feet of residential space. The 332 East 71st Street Property is comprised of two studio and 18 one-bedroom units. Additionally, the unit mix is further broken down into 18 market rate units and two rent stabilized units. Built in 1925 and renovated in 2011, the 332 East 71st Street Property features new entryway doors, a newly renovated lobby with slate floor tiles and marble staircases. Newly renovated units include in-unit washer and dryers, stainless steel appliances, hardwood floors and large windows.
1556 Second Avenue
The third largest ICON UES Portfolio Property by allocated loan amount, 1556 Second Avenue (the “1556 Second Avenue Property”), is a 7-unit, mixed use, multifamily and retail property located in New York, New York, on the corner of 2nd Avenue and East 81st street. The 1556 Second Avenue Property is a 4-story apartment building containing approximately 3,583 square feet of residential space and 1,800 square feet of ground floor retail space. As of April 11, 2019, the 1556 Second Avenue Property was 83.3% occupied by 5 residential tenants at a monthly average in-place rental rate of $4,060 per unit. The ground floor retail space is currently occupied by Cascabel Taqueria a casual Mexican restaurant that has been a tenant at the 1556 Second Avenue Property since 2009 and pays a monthly in-
THE INFORMATION IN THIS STRUCTURAL AND COLLATERAL TERM SHEET IS NOT COMPLETE AND MAY BE AMENDED PRIOR TO THE TIME OF SALE. THIS TERM SHEET IS NOT AN OFFER TO SELL THESE SECURITIES AND IT IS NOT A SOLICITATION OF AN OFFER TO BUY THESE SECURITIES IN ANY JURISDICTION WHERE THE OFFER OR SALE IS NOT PERMITTED.
107 of 116
| Structural and Collateral Term Sheet | JPMCC 2019-COR5 | |
| ICON Upper East Side Portfolio | ||
place rent of $27,012. The 1556 Second Avenue Property is comprised of, one one-bedroom, four two-bedroom, one three-bedroom units and the additional 1,800 square feet of commercial space. Additionally, the unit mix is further broken down into six market rate units and one commercial unit. Built in 1910, the 1556 Second Avenue Property features newly renovated units with in-unit washer and dryers, stainless steel appliances and hardwood floors.
The Market.The ICON UES Portfolio Properties are located in the Upper East Side neighborhood of Manhattan, New York. New York City consists of five counties at the mouth of the Hudson River in the southeast area of New York State. The borough of Manhattan, forms the political, financial and cultural core of New York City. New York City is home to 58 Fortune 500 companies and the two largest stock exchanges in the world, the New York Stock Exchange and the NASDAQ Stock Market. Access to and from the ICON UES Portfolio Properties by automobile is via the FDR Drive located along the eastern border of Manhattan, and via the West Side Highway located along the Western border of Manhattan. Taxicabs also provide convenient street travel 24 hours a day. The New York City Subway system is one of the largest rapid transit system in the world with 472 stations in operation. According to REIS, as of Q4 2018, New York City’s average household income is $193,106, well above the average household incomes of $157,945 and $182,320 reported for top metropolitan areas and the northeast region, respectively. According to REIS, as of Q4 2018, the Upper East Side multifamily submarket had a vacancy rate of 2.8%, which is the second lowest among the nine submarkets in the New York Metro area and only 486 apartment units are expected to be added to the market between now and 2022. Inventory in the Upper East Side submarket has only grown 1.8% since 2014, with no growth in 2017 or 2018. According to REIS, the Upper East Side multifamily submarket asking rents were $4,352 as of Q4 2018, which is approximately 17.5% greater than that of the New York Metro.
Unit Mix(1) | ||||||||
| Property | Total # of Units | # of Residential Units | # of Commercial Units | Occupancy Residential Units | Occupancy Commercial Space | Residential (SF)(2) | Average Market Rent Per Unit(2) | Monthly Residential Revenue Per Unit(1) |
| 244 East 78th Street | 24 | 24 | 0 | 91.7% | NAP | 11,570 | $94.95 | $2,841 |
| 332 East 71st Street | 20 | 20 | 0 | 95.0% | NAP | 9,735 | $94.95 | $2,821 |
| 1556 Second Avenue | 7 | 6 | 1 | 83.3% | 100.0% | 3,583 | $94.95 | $3,383 |
| 323 East 78th Street | 16 | 16 | 0 | 100.0% | NAP | 8,650 | $94.95 | $3,773 |
| 502 East 73rd Street | 20 | 20 | 0 | 95.0% | NAP | 9,695 | $94.95 | $2,247 |
| 513 East 82nd Street | 20 | 20 | 0 | 95.0% | NAP | 11,700 | $94.95 | $2,624 |
| 344 East 55th Street | 20 | 19 | 1 | 100.0% | 100.0% | 10,000 | $71.56 | $2,739 |
| 228 East 84th Street | 18 | 18 | 0 | 100.0% | NAP | 9,555 | $94.95 | $2,875 |
| 340 East 81st Street | 16 | 16 | 0 | 100.0% | NAP | 8,350 | $94.95 | $2,892 |
| 419 East 82nd Street | 21 | 20 | 1 | 100.0% | 0.0% | 7,930 | $94.95 | $2,420 |
| 338 East 55th Street | 10 | 10 | 0 | 100.0% | NAP | 6,000 | $71.56 | $3,995 |
| 409 East 81st Street | 20 | 20 | 0 | 100.0% | NAP | 7,520 | $94.95 | $2,439 |
| 322 East 74th Street | 20 | 20 | 0 | 100.0% | NAP | 8,500 | $94.95 | $2,460 |
| 443 East 78th Street | 21 | 20 | 1 | 95.0% | 100.0% | 7,850 | $94.95 | $1,993 |
| 340 East 55th Street | 20 | 20 | 0 | 95.0% | NAP | 9,635 | $71.56 | $2,336 |
| 340 East 61st Street | 20 | 20 | 0 | 100.0% | NAP | 9,510 | $71.56 | $2,243 |
| 407 East 81st Street | 20 | 20 | 0 | 100.0% | NAP | 10,375 | $94.95 | $2,326 |
| 242 East 75th Street | 20 | 20 | 0 | 100.0% | NAP | 7,895 | $94.95 | $2,215 |
| 342 East 76th Street | 17 | 17 | 0 | 100.0% | NAP | 7,770 | $94.95 | $2,337 |
| Total / Wtd. Avg. | 350 | 346 | 4 | 97.7% | 85.1% | 165,823 | $90.03 | $2,604 |
| (1) | Based on the in-place rent roll as of April 11, 2019. |
| (2) | Based on each ICON UES Portfolio Property appraisal as of October 2018. |
THE INFORMATION IN THIS STRUCTURAL AND COLLATERAL TERM SHEET IS NOT COMPLETE AND MAY BE AMENDED PRIOR TO THE TIME OF SALE. THIS TERM SHEET IS NOT AN OFFER TO SELL THESE SECURITIES AND IT IS NOT A SOLICITATION OF AN OFFER TO BUY THESE SECURITIES IN ANY JURISDICTION WHERE THE OFFER OR SALE IS NOT PERMITTED.
108 of 116
| Structural and Collateral Term Sheet | JPMCC 2019-COR5 | |
| ICON Upper East Side Portfolio | ||
| Unit Mix(1) | ||||||||
| Property | Property Type | Property Subtype | Total # of Units | # of Residential Units | # of Commercial Units | Market Rate Units(2) | Rent Stabilized Units | Rent Controlled Units |
| 244 East 78th Street | Multifamily | Mid-Rise | 24 | 24 | 0 | 18 | 6 | 0 |
| 332 East 71st Street | Multifamily | Mid-Rise | 20 | 20 | 0 | 18 | 2 | 0 |
| 1556 Second Avenue | Mixed Use | Multifamily/Retail | 7 | 6 | 1 | 6 | 0 | 0 |
| 323 East 78th Street | Multifamily | Mid-Rise | 16 | 16 | 0 | 15 | 1 | 0 |
| 502 East 73rd Street | Multifamily | Mid-Rise | 20 | 20 | 0 | 13 | 6 | 1 |
| 513 East 82nd Street | Multifamily | Mid-Rise | 20 | 20 | 0 | 17 | 3 | 0 |
| 344 East 55th Street | Mixed Use | Multifamily/Retail | 20 | 19 | 1 | 16 | 3 | 0 |
| 228 East 84th Street | Multifamily | Mid-Rise | 18 | 18 | 0 | 15 | 2 | 1 |
| 340 East 81st Street | Multifamily | Mid-Rise | 16 | 16 | 0 | 13 | 3 | 0 |
| 419 East 82nd Street | Mixed Use | Multifamily/Office | 21 | 20 | 1 | 17 | 3 | 0 |
| 338 East 55th Street | Multifamily | Mid-Rise | 10 | 10 | 0 | 10 | 0 | 0 |
| 409 East 81st Street | Multifamily | Mid-Rise | 20 | 20 | 0 | 19 | 1 | 0 |
| 322 East 74th Street | Multifamily | Mid-Rise | 20 | 20 | 0 | 17 | 3 | 0 |
| 443 East 78th Street | Mixed Use | Multifamily/Retail | 21 | 20 | 1 | 17 | 1 | 2 |
| 340 East 55th Street | Multifamily | Mid-Rise | 20 | 20 | 0 | 14 | 5 | 1 |
| 340 East 61st Street | Multifamily | Mid-Rise | 20 | 20 | 0 | 14 | 5 | 1 |
| 407 East 81st Street | Multifamily | Mid-Rise | 20 | 20 | 0 | 12 | 8 | 0 |
| 242 East 75th Street | Multifamily | Mid-Rise | 20 | 20 | 0 | 16 | 3 | 1 |
| 342 East 76th Street | Multifamily | Mid-Rise | 17 | 17 | 0 | 14 | 3 | 0 |
| Total / Wtd. Avg. | 350 | 346 | 4 | 281 | 58 | 7 | ||
| (1) | Based on the in place rent rolls as of April 11, 2019. |
| (2) | Market Rate Units is inclusive of one employee occupied unit with no attributable underwritten base rent. Further, market-rate units is inclusive of one vacant rent stabilized unit that will be converted to market upon re-leasing to a market rate tenant. |
| Underwritten Net Cash Flow | ||||||
| 2016 | 2017 | 2018 | Underwritten | Per Unit(1) | %(2) | |
| Residential Rents in place Market Rate | $9,177,630 | $9,640,915 | $9,747,872 | $10,006,344 | $28,590 | 86.44% |
| Residential Rents in place Rent Stabilized | $1,038,497 | $1,015,332 | $1,004,127 | $776,559 | $2,219 | 6.7% |
| Residential Rents in place Rent Controlled(3) | $15,793 | $50,875 | ($8,991) | $29,712 | $85 | 0.3% |
| Residential Vacant Income | $0 | $0 | $0 | $293,664 | $839 | 2.5% |
| Commercial Rents In Place | $365,392 | $389,581 | $401,267 | $407,064 | $1,163 | 3.5% |
| Commercial Vacant Income | $0 | $0 | $0 | $42,000 | $120 | 0.4% |
| Commercial Reimbursements | $0 | $0 | $0 | $20,870 | $60 | 0.2% |
| Net Rental Income | $10,597,312 | $11,096,703 | $11,144,275 | $11,576,213 | $33,075 | 100.0% |
| (Vacancy/Credit Loss/Concessions/Model Units)(4) | ($485,361) | ($547,755) | ($433,756) | ($542,855) | ($1,551) | (4.7%) |
| Other Income(5) | $18,213 | $89,832 | $183,110 | $193,465 | $553 | 1.7% |
| Effective Gross Income | $10,130,164 | $10,638,780 | $10,893,629 | $11,226,823 | $32,077 | 97.0% |
| Total Expenses | $3,440,538 | $3,575,742 | $3,846,648 | $4,103,552 | $11,724 | 36.6% |
| Net Operating Income | $6,689,626 | $7,063,038 | $7,046,981 | $7,123,271 | $20,352 | 63.4% |
| Replacement Reserves | $0 | $0 | $0 | $90,985 | $260 | 0.8% |
| Net Cash Flow | $6,689,626 | $7,063,038 | $7,046,981 | $7,032,286 | $20,092 | 62.6% |
| Occupancy(6) | 97.9% | 98.3% | 97.0% | 97.7% | ||
| (1) | Based on 350 total units in the ICON UES Portfolio. |
| (2) | Percentage column represents percent of Net Rental Income for all revenue lines and represents percent of Effective Gross Income for the remainder of the fields. |
| (3) | The negative ($8,991) in 2018 Residential Rents in place Rent Controlled reflects abatements and additional refunds for historical renovation periods. |
| (4) | Vacancy is underwritten to 5.0% for residential rents in place for market rate units and commercial rents which is in excess of the ICON UES Portfolio in-place vacancy of ($335,664) or 2.8%. No vacancy allowance was underwritten for the rent stabilized and rent controlled units due to their below market rental rates. |
| (5) | Other Income is comprised of tenant reimbursements and expenses. Other Income is underwritten based off of the average of year end 2018 and the appraisers concluded value. |
| (6) | Historical occupancies are as of December 31 or each respective year. The weighted average occupancy is based solely on residential units. Current occupancy is based on the April 11, 2019 rent roll residential units. The current occupancy based on the total 350 residential and commercial units is 97.4% |
THE INFORMATION IN THIS STRUCTURAL AND COLLATERAL TERM SHEET IS NOT COMPLETE AND MAY BE AMENDED PRIOR TO THE TIME OF SALE. THIS TERM SHEET IS NOT AN OFFER TO SELL THESE SECURITIES AND IT IS NOT A SOLICITATION OF AN OFFER TO BUY THESE SECURITIES IN ANY JURISDICTION WHERE THE OFFER OR SALE IS NOT PERMITTED.
109 of 116
| Structural and Collateral Term Sheet | JPMCC 2019-COR5 | |
| ICON Upper East Side Portfolio | ||
Property Management. The ICON UES Portfolio Properties are managed by Icon Realty Management LLC, an affiliate of the loan sponsor.
Partial Releases. On or after the second business day after the payment date occurring in June 2021, the borrowers may obtain the release of an individual ICON UES Portfolio Property from the lien of the mortgage on such individual ICON UES Portfolio Property and the release of the related borrower’s obligations under the loan documents (other than those expressly stated to survive and exist as of the date of the release of such individual ICON UES Portfolio Property and related borrower),providedthat the related borrower satisfies certain conditions set forth in the loan documents, including, without limitation, the following: (i) the related borrower pays (a) the Adjusted Release Amount (defined below), (b) all interest accrued and unpaid on the entire principal balance of the allocated loan amount for the ICON UES Portfolio Property to be released for the full accrualperiod during which payment of the adjusted release amount occurs, and (c) if such payment occurs prior to the business day after the payment date which is six months prior to the maturity date, the applicable yield maintenance premium; (ii) no event of default has occurred and is continuing (unless release of the applicable individual ICON UES Portfolio Property cures such event of default); (iii) the related borrower conveys such individual ICON UES Portfolio Property, concurrently with the release, to an unaffiliated third party; (iv) the related borrower provides a partial release of mortgage endorsement to the lender’s title insurance policy in the form then being issued; (v) subsequent to such release, each remaining individual borrower continues to be a special purpose entity pursuant to, and in accordance with, the loan documents; (vi) the related borrower delivers to the lender and the rating agencies an additional insolvency opinion or an update of the insolvency opinion indicating that the release does not affect the opinions set forth therein; (vii) satisfaction of customary REMIC requirements; (viii) after giving effect to the release of the applicable individual ICON UES Portfolio Property, the debt service coverage ratio for the ICON UES Portfolio Properties then remaining (based on the period immediately preceding the release of the applicable individual ICON Property) is equal to or greater than the greater of (a) the debt service coverage ratio for all of the ICON UES Portfolio Properties then remaining, which includes the individual ICON UES Portfolio Property requested to be released, immediately preceding the release of the applicable individual ICON UES Portfolio Property, and (b) 1.37x; and (ix) the related borrower reimburses the lender and the applicable servicer for any reasonable actual third-party out-of-pocket costs and expenses the lender and applicable servicer incur. See “Description of the Mortgage Pool—Certain Terms of the Mortgage Loans—Partial Releases” in the Preliminary Prospectus for additional information.
“Adjusted Release Amount” means (a) with respect to the releases that result in the first 10.0% of the ICON UES Portfolio Whole Loan balance being paid down, 105.0% of the allocated loan amount for the applicable individual ICON UES Portfolio Property, (b) with respect to the releases that result in the next 10.0% of the ICON UES Portfolio Whole Loan balance being paid down, 115.0% of the allocated loan amount for the applicable individual ICON UES Portfolio Property, and (c) thereafter, 120.0% of the allocated loan amount for the applicable individual ICON UES Portfolio Property.
THE INFORMATION IN THIS STRUCTURAL AND COLLATERAL TERM SHEET IS NOT COMPLETE AND MAY BE AMENDED PRIOR TO THE TIME OF SALE. THIS TERM SHEET IS NOT AN OFFER TO SELL THESE SECURITIES AND IT IS NOT A SOLICITATION OF AN OFFER TO BUY THESE SECURITIES IN ANY JURISDICTION WHERE THE OFFER OR SALE IS NOT PERMITTED.
110 of 116
| Structural and Collateral Term Sheet | JPMCC 2019-COR5 | |
| NOV Headquarters | ||
| Mortgage Loan Information | Property Information | |||
| Mortgage Loan Seller: | LCM | Single Asset / Portfolio: | Single Asset | |
| Original Principal Balance(1): | $20,000,000 | Title: | Fee | |
| Cut-off Date Principal Balance(1): | $20,000,000 | Property Type - Subtype: | Office – Suburban | |
| % of Pool by IPB: | 2.9% | Net Rentable Area (SF): | 337,019 | |
| Loan Purpose: | Acquisition | Location: | Houston, TX | |
| Borrowers: | FM MCI NOV LLC, FM WPI NOV | Year Built / Renovated: | 1982 / 2009 | |
| LLC | Occupancy: | 100.0% | ||
| Sponsor: | Franklin B. Mandel | Occupancy Date: | 6/6/2019 | |
| Interest Rate: | 4.63000% | Number of Tenants: | 1 | |
| Note Date: | 3/29/2019 | 2016 NOI: | $3,500,000 | |
| Maturity Date: | 4/6/2029 | 2017 NOI: | $3,500,000 | |
| Interest-only Period: | 120 months | 2018 NOI: | $3,500,000 | |
| Original Term: | 120 months | TTM NOI (as of 2/2019): | $3,500,000 | |
| Original Amortization: | None | UW Economic Occupancy: | 95.0% | |
| Amortization Type: | Interest Only | UW Revenues: | $5,585,060 | |
| Call Protection(2): | L(26),Def(91),O(3) | UW Expenses: | $2,379,011 | |
| Lockbox / Cash Management: | Hard / Springing | UW NOI: | $3,206,049 | |
| Additional Debt: | Yes | UW NCF: | $3,138,646 | |
| Additional Debt Balance(1): | $19,200,000 | Appraised Value / Per SF: | $57,000,000 / $169 | |
| Additional Debt Type(1): | Pari Passu | Appraisal Date: | 1/30/2019 | |
| Escrows and Reserves | Financial Information(1) | ||||||
| Initial | Monthly | Initial Cap | Cut-off Date Loan / SF: | $116 | |||
| Taxes(3): | $0 | Springing | N/A | Maturity Date Loan / SF: | $116 | ||
| Insurance(4): | $0 | Springing | N/A | Cut-off Date LTV: | 68.8% | ||
| Replacement Reserves(5): | $0 | Springing | N/A | Maturity Date LTV: | 68.8% | ||
| TI/LC: | $0 | $0 | N/A | UW NCF DSCR: | 1.71x | ||
| Other(6): | $0 | $0 | N/A | UW NOI Debt Yield: | 8.2% | ||
| |||||||
Sources and Uses | |||||||
| Sources | Proceeds | % of Total | Uses | Proceeds | % of Total | ||
| Whole Loan(1) | $39,200,000 | 67.6% | Purchase Price | $56,910,569 | 98.1% | ||
| Sponsor Equity | 18,787,101 | 32.4 | Closing Costs | 1,076,532 | 1.9 | ||
| Total Sources | $57,987,101 | 100.0% | Total Uses | $57,987,101 | 100.0% | ||
| (1) | The NOV Headquarters Loan (as defined below) is part of a whole loan evidenced by twopari passu notes, with an aggregate outstanding principal balance as of the Cut-off Date of $39.2 million. The Financial Information presented in the chart above reflects the Cut-off Date balance of the $39.2 million NOV Headquarters Whole Loan (as defined below). |
| (2) | The lockout period will be at least 26 payment dates beginning with and including the first payment date of May 6, 2019. Defeasance of the full NOV Headquarters Whole Loan is permitted after the date that is the earlier to occur of the payment date that is (i) two years after the closing date of the securitization that includes the lastpari passu noteto be securitized and (ii) October 2022. The assumed lockout period of 26 payments is based on the expected JPMCC 2019-COR5 securitization closing date in June 2019. The actual lockout period may be longer. |
| (3) | Monthly reserves are required upon (i) a default under the NOV Headquarters Whole Loan, (ii) a termination of any kind to the NOV Lease or the NOV Lease guaranty, (iii) a default beyond any applicable notice and cure period has occurred and is continuing under the NOV Lease, or (iv) the NOV Lease tenant’s failure to pay real estate taxes under the NOV Lease. |
| (4) | Monthly reserves are required upon (i) a default under the NOV Headquarters Whole Loan, (ii) a termination of any kind to the NOV Lease or the NOV Lease guaranty, (iii) a default beyond any applicable notice and cure period has occurred and is continuing under the NOV Lease, (iv) the NOV Lease guarantor remains fails to satisfy their obligations and liabilities under the NOV Lease guaranty, (v) NOV Lease guarantor’s long-term unsecured debt is rated falls below “BBB-” by S&P or Baa3 by Moody’s, (vi) an amendment to the insurance and casualty provisions of the NOV Lease, or (vii) NOV Lease tenant fails to maintain the required insurance. |
THE INFORMATION IN THIS STRUCTURAL AND COLLATERAL TERM SHEET IS NOT COMPLETE AND MAY BE AMENDED PRIOR TO THE TIME OF SALE. THIS TERM SHEET IS NOT AN OFFER TO SELL THESE SECURITIES AND IT IS NOT A SOLICITATION OF AN OFFER TO BUY THESE SECURITIES IN ANY JURISDICTION WHERE THE OFFER OR SALE IS NOT PERMITTED.
111 of 116
| Structural and Collateral Term Sheet | JPMCC 2019-COR5 | |
| NOV Headquarters | ||
| (5) | Monthly reserves are required upon (i) a default under the NOV Headquarters Whole Loan, (ii) a termination of any kind to the NOV Lease or the NOV Lease guaranty, (iii) a default beyond any applicable notice and cure period has occurred and is continuing under the NOV Lease, or (iv) the NOV Lease tenant’s failure to make capital improvements to the NOV Headquarters Property under the NOV Lease. |
| (6) | On each payment date during a lease sweep period, all available cash will be deposited into the special rollover reserve account. |
The Loan.The NOV Headquarters mortgage loan, with an outstanding principal balance as of the Cut-off Date of $20.0 million (the “NOV Headquarters Loan”), is secured by a first mortgage lien on the borrowers’ fee interest in a 337,019 square foot, office complex consisting of three buildings (the “NOV Headquarters Property”), fully leased by National Oilwell Varco, Inc. (“NOV”) and located in the Woodlands-Sugar Land community of Houston, Texas. The NOV Headquarters Loan is part of a whole loan that has an aggregate original principal balance of $39.2 million (the “NOV Headquarters Whole Loan”) and is comprised of twopari passu notes, each as described in the “Whole Loan Summary” chart below. The controlling Note A-1, with an outstanding principal balance as of the Cut-off Date of approximately $20.0 million, is being contributed to the JPMCC 2019-COR5 Trust. The non-controlling Note A-2, with an original principal balance of $19.2 million is held by LCM or an affiliate and expected to be contributed to one or more future securitizations or may otherwise be transferred at any time. The NOV Headquarters Whole Loan has a 10-year term and requires interest only payments for the full term of the loan. Legal counsel to the borrower delivered a non-consolidation opinion in connection with the origination of the NOV Headquarters Whole Loan.
| Whole Loan Summary | ||||
| Notes | Original Balance | Cut-off Date Balance | Note Holder | Controlling Piece |
| A-1 | $20,000,000 | $20,000,000 | JPMCC 2019-COR5 | Yes |
| A-2 | 19,200,000 | 19,200,000 | LCM | No |
| Total | $39,200,000 | $39,200,000 | ||
The Borrowers.The borrowing entities are FM MCI NOV LLC and FM WPI NOV LLC, as tenants-in-common, each a special purpose Delaware limited liability company structured to be bankruptcy remote with one independent director.
The Loan Sponsor.The loan sponsor and nonrecourse carve-out guarantor is Franklin B. Mandel. Mr. Mandel has over 40 years of experience in the acquisition and management of shopping centers and net leased properties with a focus on single tenant, net leased properties across the United States.
The Property.The NOV Headquarters Property is an office complex consisting of three buildings, totaling 337,019 square feet situated on an approximately 13.46-acre site. The NOV Headquarters Property contains 1,286 parking spaces (approximately 3.8 spaces per 1,000 square feet). Primary access to the NOV Headquarters Property is provided by the Sam Houston Parkway/Beltway 8, Westpark Toll Road, Interstate 10, Westheimer and US 59. The NOV Headquarters Property is 100.0% leased by NOV (S&P/Moody’s/Fitch: BBB+/Baa1/NR, NYSE: NOV), a worldwide leader in the design, manufacture, and sale of equipment and components used in oil and gas drilling and production operations, and the provision of oilfield services to the oil and gas industry. The NOV Headquarters Property serves as NOV’s corporate headquarters and is subject to a 25-year, non-terminable absolute net lease that commenced in 2012 and expires in November 2037 with no termination options and no renewal options (the “NOV Lease”). NOV’s cost of occupancy is fixed at $10.39 per square foot throughout the remaining 18 years of the lease, which is 31% below the appraiser’s concluded market rent of $15.00 per square foot. NOV has occupied the NOV Headquarters Property since 2006 and has invested nearly $20 million (approximately $59.34 per square foot) of capital into capital improvements at the NOV Headquarters Property since occupancy.
The Market. The NOV Headquarters Property is located in the Southwest Beltway 8 submarket, within the Southwest Market Cluster of Houston. As of the first quarter of 2019, the Houston office market consisted of approximately 329.1 million square feet across 9,541 buildings with an overall market vacancy of 16.2% and average asking rents of approximately $29.19 per square foot. As of the first quarter of 2019, the Southwest Beltway 8 submarket consisted of approximately 7.5 million square feet across 192 buildings with an overall market vacancy of 17.1% and average market asking rents of $17.13 per square foot. There are no new deliveries nor buildings under construction in the submarket.
The appraisal identified eight lease comparables ranging in size from 136,800 square feet to 568,458 square feet. Base rents for the comparable leases ranged from $10.25 per square foot to $24.00 per square foot.
THE INFORMATION IN THIS STRUCTURAL AND COLLATERAL TERM SHEET IS NOT COMPLETE AND MAY BE AMENDED PRIOR TO THE TIME OF SALE. THIS TERM SHEET IS NOT AN OFFER TO SELL THESE SECURITIES AND IT IS NOT A SOLICITATION OF AN OFFER TO BUY THESE SECURITIES IN ANY JURISDICTION WHERE THE OFFER OR SALE IS NOT PERMITTED.
112 of 116
| Structural and Collateral Term Sheet | JPMCC 2019-COR5 | |
| NOV Headquarters | ||
| Tenant Summary(1) | ||||||
| Tenant | Ratings Moody’s/Fitch/S&P(2) | Net Rentable Area (SF) | % of Total NRA | Base Rent PSF | % of Total Base Rent | Lease Expiration Date |
| National Oilwell Varco, Inc. | Baa1/NR/BBB+ | 337,019 | 100.0% | $10.39 | 100.0% | 11/30/2037 |
| (1) | Based on the underwritten rent roll dated April 1, 2019. |
| (2) | Certain ratings are those of the parent company whether or not the parent guarantees the lease. |
Lease Rollover Schedule(1) | |||||||||
| Year | Number of Leases Expiring | Net Rentable Area Expiring | % of NRA Expiring | Base Rent Expiring | % of Base Rent Expiring | Cumulative Net Rentable Area Expiring | Cumulative % of NRA Expiring | Cumulative Base Rent Expiring | Cumulative % of Base Rent Expiring |
| Vacant | NAP | 0 | 0.0% | NAP | NAP | 0 | 0.0% | NAP | NAP |
| 2019 & MTM | 0 | 0 | 0.0% | $0 | 0.0% | 0 | 0.0% | $0 | 0.0% |
| 2020 | 0 | 0 | 0.0% | 0 | 0.0% | 0 | 0.0% | $0 | 0.0% |
| 2021 | 0 | 0 | 0.0% | 0 | 0.0% | 0 | 0.0% | $0 | 0.0% |
| 2022 | 0 | 0 | 0.0% | 0 | 0.0% | 0 | 0.0% | $0 | 0.0% |
| 2023 | 0 | 0 | 0.0% | 0 | 0.0% | 0 | 0.0% | $0 | 0.0% |
| 2024 | 0 | 0 | 0.0% | 0 | 0.0% | 0 | 0.0% | $0 | 0.0% |
| 2025 | 0 | 0 | 0.0% | 0 | 0.0% | 0 | 0.0% | $0 | 0.0% |
| 2026 | 0 | 0 | 0.0% | 0 | 0.0% | 0 | 0.0% | $0 | 0.0% |
| 2027 | 0 | 0 | 0.0% | 0 | 0.0% | 0 | 0.0% | $0 | 0.0% |
| 2028 | 0 | 0 | 0.0% | 0 | 0.0% | 0 | 0.0% | $0 | 0.0% |
| 2029 | 0 | 0 | 0.0% | 0 | 0.0% | 0 | 0.0% | $0 | 0.0% |
| 2030 & Beyond | 1 | 337,019 | 100.0% | 3,500,000 | 100.0% | 337,019 | 100.0% | $3,500,000 | 100.0% |
| Total | 1 | 337,019 | 100.0% | $3,500,000 | 100.0% | ||||
| (1) | Based on the underwritten rent roll dated April 1, 2019. |
| Operating History and Underwritten Net Cash Flow | |||||||
2016 | 2017 | 2018 | TTM(1) | Underwritten | Per Square Foot | %(2) | |
| Rents in Place | $3,500,000 | $3,500,000 | $3,500,000 | $3,500,000 | $3,500,000 | $10.39 | 59.5% |
| Vacant Income | 0 | 0 | 0 | 0 | 0 | 0.00 | 0.0 |
| Gross Potential Rent | $3,500,000 | $3,500,000 | $3,500,000 | $3,500,000 | $3,500,000 | $10.39 | 59.5% |
| Total Reimbursements | 0 | 0 | 0 | 0 | 2,379,011 | 7.06 | 40.5% |
| Total Other Income | 0 | 0 | 0 | 0 | 0 | 0.00 | 0.0 |
| Net Rental Income | $3,500,000 | $3,500,000 | $3,500,000 | $3,500,000 | $5,879,011 | $17.44 | 100.0% |
| Less: Vacancy | 0 | 0 | 0 | 0 | (293,951) | (0.87) | (5.0) |
| Effective Gross Income | $3,500,000 | $3,500,000 | $3,500,000 | $3,500,000 | $5,585,060 | $16.57 | 95.0% |
| Total Expenses | $0 | $0 | $0 | $0 | $2,379,011 | $7.06 | 42.6% |
| Net Operating Income | $3,500,000 | $3,500,000 | $3,500,000 | $3,500,000 | $3,206,049 | $9.51 | 57.4% |
| Total TI/LC, CapEx/RR | 0 | 0 | 0 | 0 | 67,404 | 0.20 | 1.2 |
| Net Cash Flow | $3,500,000 | $3,500,000 | $3,500,000 | $3,500,000 | $3,138,646 | $9.31 | 56.2% |
| Occupancy(3) | 100.0% | 100.0% | 100.0% | 100.0% | 95.0% | ||
| (1) | TTM column represents the trailing 12-month period ending on February 28, 2019. |
| (2) | % column represents percent of Net Rental Income for all revenue lines and represents percent of Effective Gross Income for the remainder of the fields. |
| (3) | Historical Occupancies are as of December 31 of each respective year. TTM Occupancy is as June 6, 2019. Underwritten Occupancy represents 5% minimum economic vacancy. The NOV Headquarters Property is 100% leased through November 2037 to an investment grade tenant with no termination options. |
THE INFORMATION IN THIS STRUCTURAL AND COLLATERAL TERM SHEET IS NOT COMPLETE AND MAY BE AMENDED PRIOR TO THE TIME OF SALE. THIS TERM SHEET IS NOT AN OFFER TO SELL THESE SECURITIES AND IT IS NOT A SOLICITATION OF AN OFFER TO BUY THESE SECURITIES IN ANY JURISDICTION WHERE THE OFFER OR SALE IS NOT PERMITTED.
113 of 116
| Structural and Collateral Term Sheet | JPMCC 2019-COR5 | |
| 8200 Wilshire | ||
| Mortgage Loan Information | Property Information | |||
| Mortgage Loan Seller: | LCM | Single Asset / Portfolio: | Single Asset | |
| Original Principal Balance: | $16,750,000 | Title: | Fee | |
| Cut-off Date Principal Balance: | $16,750,000 | Property Type - Subtype: | Office – Suburban | |
| % of Pool by IPB: | 2.4% | Net Rentable Area (SF): | 25,624 | |
| Loan Purpose: | Refinance | Location: | Beverly Hills, CA | |
| Borrowers: | 8200 Cardinal Associates LLC, | Year Built / Renovated(1): | 1979 / 2008, 2019 | |
| Wilem Realty LLC, Emcap 8200 | Occupancy: | 100.0% | ||
| LLC, EZY Holdings, LLC | Occupancy Date: | 6/6/2019 | ||
| Sponsors: | Peter Cohen, Roya Cohen, Afshine | Occupancy Date: | 6/6/2019 | |
| Emrani, Farzin Adam Emrani, | Number of Tenants: | 1 | ||
| Steven Yazdani, Saba Yazdani | 2016 NOI(2): | N/A | ||
| Interest Rate: | 4.80000% | 2017 NOI(2): | N/A | |
| Note Date: | 5/23/2019 | 2018 NOI(2): | N/A | |
| Maturity Date: | 6/6/2029 | TTM NOI(2): | N/A | |
| Interest-only Period: | 120 months | UW Economic Occupancy: | 92.1% | |
| Original Term: | 120 months | UW Revenues: | $1,773,247 | |
| Original Amortization: | None | UW Expenses: | $349,274 | |
| Amortization Type: | Interest Only | UW NOI: | $1,423,973 | |
| Call Protection: | L(24),Def(92),O(4) | UW NCF: | $1,345,051 | |
| Lockbox / Cash Management: | Hard / In Place | Appraised Value / Per SF: | $27,500,000 / $1,073 | |
| Additional Debt: | N/A | Appraisal Date: | 1/8/2019 | |
| Additional Debt Balance: | N/A | |||
| Additional Debt Type: | N/A | |||
| Escrows and Reserves | Financial Information | ||||||
| Initial | Monthly | Initial Cap | Cut-off Date Loan / SF: | $654 | |||
| Taxes: | $73,333 | $18,333 | N/A | Maturity Date Loan / SF: | $654 | ||
| Insurance: | $11,388 | $1,140 | N/A | Cut-off Date LTV: | 60.9% | ||
| Replacement Reserves: | $0 | $726 | N/A | Maturity Date LTV: | 60.9% | ||
| TI/LC(3): | $1,300,000 | Springing | N/A | UW NCF DSCR: | 1.65x | ||
| Other(4): | $954,087 | Springing | N/A | UW NOI Debt Yield: | 8.5% | ||
| Sources and Uses | ||||||||
| Sources | Proceeds | % of Total | Uses | Proceeds | % of Total | |||
| Mortgage Loan | $16,750,000 | 93.7% | Payoff Existing Debt | $15,347,012 | 85.8% | |||
| Sponsor Equity | 1,134,681 | 6.3 | Upfront Reserves | 2,338,808 | 13.1 | |||
| Closing Costs | 198,861 | 1.1 | ||||||
| Total Sources | $17,884,681 | 100.0% | Total Uses | $17,884,681 | 100.0% | |||
| (1) | Additional renovations are proposed for 2019; the borrowers as landlord will provide Cross Campus with a tenant improvement allowance of $768,720 ($30.00 per square foot of rentable area). |
| (2) | Historical cash flows are not available as the 8200 Wilshire Property (as defined below) was previously operating as an executive suite operation by a seller-affiliate entity. In 2018, Cross Campus executed a 12-year lease to occupy 100.0% of the 8200 Wilshire Property. |
| (3) | Of the $1.3 million initial rollover reserve, $1,268,720 is the tenant improvement allowance payable to Cross Campus pursuant to the Cross Campus lease; $31,280 is for the work to be performed by the borrowers as landlord under the Cross Campus lease. Monthly reserves are not required so long as (a) the Cross Campus lease is in full force and effect and Cross Campus is in occupancy of all of the premises demised under the Cross Campus lease and (b) no lease sweep period is then continuing. |
| (4) | Other reserves are inclusive of a $537,566 free rent reserve for the full rent abatement in place until March 2019, a $400,000 security deposit reserve of which 75% and 25% is disbursable to Cross Campus on the second anniversary and the third anniversary of the lease commencement date, respectively (so long as Cross Campus is not then in default under the Cross Campus lease), and, a $16,521 immediate repairs reserve, which is 125% of the amount identified in the engineering report. Pursuant to the loan documents, if Cross Campus defaults under the Cross Campus lease or any other cash management period occurs, the loan sponsor is obligated to deposit $1.0 million into the security deposit reserve. |
THE INFORMATION IN THIS STRUCTURAL AND COLLATERAL TERM SHEET IS NOT COMPLETE AND MAY BE AMENDED PRIOR TO THE TIME OF SALE. THIS TERM SHEET IS NOT AN OFFER TO SELL THESE SECURITIES AND IT IS NOT A SOLICITATION OF AN OFFER TO BUY THESE SECURITIES IN ANY JURISDICTION WHERE THE OFFER OR SALE IS NOT PERMITTED.
114 of 116
| Structural and Collateral Term Sheet | JPMCC 2019-COR5 | |
| 8200 Wilshire | ||
The Loan.The 8200 Wilshire mortgage loan, with an outstanding principal balance as of the Cut-off Date of $16.75 million (the “8200 Wilshire Loan”), is secured by a first mortgage lien on the borrowers’ fee interest in an 25,624 square foot office complex (the “8200 Wilshire Property”), fully leased by Cross Campus and located in Beverly Hills, California. The 8200 Wilshire Loan has a 10-year term and requires interest only payments for full term of the loan.
The Borrowers.The borrowing entities are 8200 Cardinal Associates LLC, Wilem Realty LLC, Emcap 8200 LLC, and EZY Holdings, LLC, four Delaware limited liability companies and special purpose entities structured to be bankruptcy remote.
The Loan Sponsors.The loan sponsors and nonrecourse carve-out guarantors are Peter Cohen, Roya Cohen, Afshine Emrani, Farzin Adam Emrani, Steven Yazdani, and Saba Yazdani. Peter Cohen is a Beverly Hills-based real estate developer. Mr. Cohen is the owner of Cardinal Equities LLC, a fully diversified commercial and residential real estate investment, development and management company that owns and manages over 1.5 million square feet of real estate, primarily in California.
The Property.The 8200 Wilshire Property is a 25,624 square foot, four-story Class A office building built in 1979 and last renovated in 2008, with extensive renovations planned over 2019. The 8200 Wilshire Property has a 43-space parking lot (approximately 1.68 spaces per 1,000 square feet). The 8200 Wilshire Property is located on the southwest corner of Wilshire Boulevard and San Vicente Boulevard, two major thoroughfares, with nearly 80,000 vehicles per day. The 8200 Wilshire Property is 100.0% leased through October 2030 by Cross Campus, a Santa Monica-based “co-working” company with five locations in Los Angeles and one location each in San Diego and Scottsdale. Cross Campus was founded in 2012 and delivers workspace and event hosting solutions to over 2,500 members ranging from startups and SME’s to Fortune 500 companies.
The Market. The 8200 Wilshire Property is located in the Beverly Hills office submarket, within the West Los Angeles office market of California. As of the first quarter of 2019, the West Los Angeles office market consisted of approximately 86.3 million square feet across 2,916 buildings with an overall market vacancy of 10.0% and average asking rents of approximately $52.30 per square foot. As of the first quarter of 2019, the Beverly Hills office submarket consisted of approximately 11.2 million square feet across 317 buildings with an overall market vacancy of 10.4% and average market asking rents of $65.44 per square foot, which is the highest in the market.
The appraisal identified eight lease comparables ranging in size of leased space from 52 square feet to 97,150 square feet. Rents for the comparable leases ranged from $44.40 per square foot to $78.00 per square foot, full service gross. All comparable leases generally exhibited 3% annual escalations.
| Tenant Summary(1) | |||||||
| Tenant | Ratings Moody’s/Fitch/S&P | Net Rentable Area (SF) | % of Total NRA | Base Rent PSF(2) | % of Total Base Rent | Lease Expiration Date | |
| Cross Campus | NR/NR/NR | 25,624 | 100.0% | $50.68 | 100.0% | 10/31/2030 | |
| (1) | Based on the underwritten rent roll dated April 1, 2019. |
| (2) | Based on the underwritten base rent of $50.68 per square foot using in-place rent with rent steps taken through April 1, 2020. |
THE INFORMATION IN THIS STRUCTURAL AND COLLATERAL TERM SHEET IS NOT COMPLETE AND MAY BE AMENDED PRIOR TO THE TIME OF SALE. THIS TERM SHEET IS NOT AN OFFER TO SELL THESE SECURITIES AND IT IS NOT A SOLICITATION OF AN OFFER TO BUY THESE SECURITIES IN ANY JURISDICTION WHERE THE OFFER OR SALE IS NOT PERMITTED.
115 of 116
| Structural and Collateral Term Sheet | JPMCC 2019-COR5 | |
| 8200 Wilshire | ||
Lease Rollover Schedule(1) | |||||||||
| Year | Number of Leases Expiring | Net Rentable Area Expiring | % of NRA Expiring | Base Rent Expiring(2) | % of Base Rent Expiring | Cumulative Net Rentable Area Expiring | Cumulative % of NRA Expiring | Cumulative Base Rent Expiring(2) | Cumulative % of Base Rent Expiring |
| Vacant | NAP | 0 | 0.0% | NAP | NAP | 0 | 0.0% | NAP | NAP |
| 2019 & MTM | 0 | 0 | 0.0% | $0 | 0.0% | 0 | 0.0% | $0 | 0.0% |
| 2020 | 0 | 0 | 0.0% | 0 | 0.0% | 0 | 0.0% | $0 | 0.0% |
| 2021 | 0 | 0 | 0.0% | 0 | 0.0% | 0 | 0.0% | $0 | 0.0% |
| 2022 | 0 | 0 | 0.0% | 0 | 0.0% | 0 | 0.0% | $0 | 0.0% |
| 2023 | 0 | 0 | 0.0% | 0 | 0.0% | 0 | 0.0% | $0 | 0.0% |
| 2024 | 0 | 0 | 0.0% | 0 | 0.0% | 0 | 0.0% | $0 | 0.0% |
| 2025 | 0 | 0 | 0.0% | 0 | 0.0% | 0 | 0.0% | $0 | 0.0% |
| 2026 | 0 | 0 | 0.0% | 0 | 0.0% | 0 | 0.0% | $0 | 0.0% |
| 2027 | 0 | 0 | 0.0% | 0 | 0.0% | 0 | 0.0% | $0 | 0.0% |
| 2028 | 0 | 0 | 0.0% | 0 | 0.0% | 0 | 0.0% | $0 | 0.0% |
| 2029 | 0 | 0 | 0.0% | 0 | 0.0% | 0 | 0.0% | $0 | 0.0% |
| 2030 & Beyond | 1 | 25,624 | 100.0% | 1,298,520 | 100.0% | 25,624 | 100.0% | $1,298,520 | 100.0% |
| Total | 1 | 25,624 | 100.0% | $1,298,520 | 100.0% | ||||
| (1) | Based on the underwritten rent roll dated April 1, 2019. |
| (2) | Based on the underwritten base rent of $50.68 per square foot using in-place rent with rent steps taken through April 1, 2020. |
| Operating History and Underwritten Net Cash Flow(1) | |||
| Underwritten | Per Square Foot | %(2) | |
| Rents in Place(3) | $1,298,520 | $50.68 | 67.4% |
| % Rents(4) | 164,348 | 6.41 | 8.5 |
| Gross Potential Rent | $1,462,868 | $57.09 | 76.0% |
| Total Reimbursements | 64,060 | 2.50 | 3.3 |
| Total Other Income(5) | 399,012 | 15.57 | 20.7 |
| Net Rental Income | $1,925,940 | $75.16 | 100.0% |
| Less: Vacancy(6) | (152,693) | (5.96) | (7.9) |
| Effective Gross Income | $1,773,247 | $69.20 | 92.1% |
| Total Expenses | $349,274 | $13.63 | 19.7% |
| Net Operating Income | $1,423,973 | $55.57 | 80.3% |
| Total TI/LC, CapEx/RR | 78,922 | 3.08 | 4.4 |
| Net Cash Flow | $1,345,051 | $52.49 | 75.9% |
| Occupancy(5) | 92.1% | ||
| (1) | Historical cash flows are not available as the 8200 Wilshire Property was previously operating as an executive suite operation by a seller-affiliate entity. In 2018, the Cross Campus executed a 12-year lease to occupy 100.0% of the 8200 Wilshire Property. |
| (2) | % column represents percent of Net Rental Income for all revenue lines and represents percent of Effective Gross Income for the remainder of the fields. |
| (3) | Based on the underwritten base rent of $50.68 per square foot using in-place rent with rent steps taken through April 1, 2020. |
| (4) | % Rents represents Clear Channel billboard rent paid under the signage lease. |
| (5) | Other Income is comprised of parking income, signage income and cell tower income. |
| (6) | Underwritten to a 10% vacancy assumption on Gross Potential Rent plus Reimbursements. |
THE INFORMATION IN THIS STRUCTURAL AND COLLATERAL TERM SHEET IS NOT COMPLETE AND MAY BE AMENDED PRIOR TO THE TIME OF SALE. THIS TERM SHEET IS NOT AN OFFER TO SELL THESE SECURITIES AND IT IS NOT A SOLICITATION OF AN OFFER TO BUY THESE SECURITIES IN ANY JURISDICTION WHERE THE OFFER OR SALE IS NOT PERMITTED.
116 of 116