| | | FREE WRITING PROSPECTUS |
| | | FILED PURSUANT TO RULE 433 |
| | | REGISTRATION FILE NO.: 333-226123-06 |
| | | |
| November [5], 2019 | | JPMDB 2019-COR6 |
Free Writing Prospectus Structural and Collateral Term Sheet |
JPMDB 2019-COR6 |
This material is for your information, and none of J.P. Morgan Securities LLC (“JPMS”), Deutsche Bank Securities Inc., Jefferies LLC and Drexel Hamilton, LLC, (each individually, an “Underwriter”, and together, the ‘‘Underwriters’’) are soliciting any action based upon it. This material is not to be construed as an offer to sell or the solicitation of any offer to buy any security in any jurisdiction where such an offer or solicitation would be illegal. The depositor has filed a registration statement (including a prospectus) with the SEC (SEC File No. 333-226123) for the offering to which this free writing prospectus relates. Before you invest, you should read the prospectus in the registration statement and other documents the depositor has filed with the SEC for more complete information about the depositor, the issuing entity and this offering. You may get these documents for free by visiting EDGAR on the SEC Web site at www.sec.gov. Alternatively, the depositor, any underwriter or any dealer participating in the offering will arrange to send you the prospectus if you request it by calling (800) 408-1016 or by emailing the ABS Syndicate Desk atabs_synd@jpmorgan.com. THE SECURITIES TO WHICH THIS INFORMATION RELATES WILL BE MORE FULLY DESCRIBED IN A PROSPECTUS (THE “PROSPECTUS”), WHICH IS NOT YET AVAILABLE. THE PROSPECTUS WILL CONTAIN MATERIAL INFORMATION THAT IS NOT CONTAINED IN THESE MATERIALS (INCLUDING WITHOUT LIMITATION A DETAILED DISCUSSION OF RISKS ASSOCIATED WITH AN INVESTMENT IN THE CERTIFICATES, UNDER THE HEADING“RISK FACTORS”IN THE PROSPECTUS). Neither this document nor anything contained in this document shall form the basis for any contract or commitment whatsoever. The information contained in this document is preliminary as of the date of this document, supersedes any previous such information delivered to you and will be superseded by any such information subsequently delivered prior to the time of sale. These materials are subject to change, completion or amendment from time to time. This information is based upon management forecasts and reflects prevailing conditions and management’s views as of this date, all of which are subject to change. J.P. Morgan is the marketing name for the investment banking businesses of JPMorgan Chase & Co. and its subsidiaries worldwide. Securities, syndicated loan arranging, financial advisory and other investment banking activities are performed by JPMS and its securitiesaffiliates, and lending, derivatives and other commercial banking activities are performed by JPMorgan Chase Bank, National Association and its banking affiliates. JPMS is a member of SIPC and the NYSE. THE UNDERWRITERS MAY FROM TIME TO TIME PERFORM INVESTMENT BANKING SERVICES FOR, OR SOLICIT INVESTMENT BANKING BUSINESS FROM, ANY COMPANY NAMED IN THESE MATERIALS. THE UNDERWRITERS AND/OR THEIR AFFILIATES OR RESPECTIVE EMPLOYEES MAY FROM TIME TO TIME HAVE A LONG OR SHORT POSITION IN ANY CERTIFICATE OR CONTRACT DISCUSSED IN THESE MATERIALS. |
|
THE INFORMATION IN THIS STRUCTURAL AND COLLATERAL TERM SHEET IS NOT COMPLETE AND MAY BE AMENDED PRIOR TO THE TIME OF SALE.THIS TERM SHEET IS NOT AN OFFER TO SELL THESE SECURITIES AND IT IS NOT A SOLICITATION OF AN OFFER TO BUY THESE SECURITIES IN ANY JURISDICTION WHERE THE OFFER OR SALE IS NOT PERMITTED.
| November [4], 2019 | | JPMDB 2019-COR6 |
THE REPUBLIC OF KOREA
THE OFFERED CERTIFICATES HAVE NOT BEEN REGISTERED WITH THE FINANCIAL SERVICES COMMISSION OF THE REPUBLIC OF KOREA FOR A PUBLIC OFFERING IN THE REPUBLIC OF KOREA. THE UNDERWRITERS HAVE THEREFORE REPRESENTED AND AGREED THAT THE OFFERED CERTIFICATES HAVE NOT BEEN AND WILL NOT BE OFFERED, SOLD OR DELIVERED DIRECTLY OR INDIRECTLY, OR OFFERED, SOLD OR DELIVERED TO ANY PERSON FOR RE-OFFERING OR RESALE, DIRECTLY OR INDIRECTLY IN THE REPUBLIC OF KOREA OR TO ANY RESIDENT OF THE REPUBLIC OF KOREA EXCEPT AS OTHERWISE PERMITTED UNDER APPLICABLE LAWS AND REGULATIONS OF THE REPUBLIC OF KOREA, INCLUDING THE FINANCIAL INVESTMENT SERVICES AND CAPITAL MARKETS ACT AND THE FOREIGN EXCHANGE TRANSACTIONS LAW AND THE DECREES AND REGULATIONS THEREUNDER.
JAPAN
THE OFFERED CERTIFICATES HAVE NOT BEEN AND WILL NOT BE REGISTERED UNDER THE FINANCIAL INSTRUMENTS AND EXCHANGE LAW OF JAPAN, AS AMENDED (THE “FIEL”), AND DISCLOSURE UNDER THE FIEL HAS NOT BEEN AND WILL NOT BE MADE WITH RESPECT TO THE OFFERED CERTIFICATES. ACCORDINGLY, EACH UNDERWRITER HAS REPRESENTED AND AGREED THAT IT HAS NOT, DIRECTLY OR INDIRECTLY, OFFERED OR SOLD AND WILL NOT, DIRECTLY OR INDIRECTLY, OFFER OR SELL ANY OFFERED CERTIFICATES IN JAPAN OR TO, OR FOR THE BENEFIT OF, ANY RESIDENT OF JAPAN (WHICH TERM AS USED IN THIS PROSPECTUS MEANS ANY PERSON RESIDENT IN JAPAN, INCLUDING ANY CORPORATION OR OTHER ENTITY ORGANIZED UNDER THE LAWS OF JAPAN) OR TO OTHERS FOR REOFFERING OR RE-SALE, DIRECTLY OR INDIRECTLY, IN JAPAN OR TO, OR FOR THE BENEFIT OF, ANY RESIDENT OF JAPAN EXCEPT PURSUANT TO AN EXEMPTION FROM THE REGISTRATION REQUIREMENTS OF, AND OTHERWISE IN COMPLIANCE WITH, THE FIEL AND OTHER RELEVANT LAWS, REGULATIONS AND MINISTERIAL GUIDELINES OF JAPAN. AS PART OF THIS OFFERING OF THE OFFERED CERTIFICATES, THE UNDERWRITERS MAY OFFER THE OFFERED CERTIFICATES IN JAPAN TO UP TO 49 OFFEREES IN ACCORDANCE WITH THE ABOVE PROVISIONS.
THE INFORMATION IN THIS STRUCTURAL AND COLLATERAL TERM SHEET IS NOT COMPLETE AND MAY BE AMENDED PRIOR TO THE TIME OF SALE.THIS TERM SHEET IS NOT AN OFFER TO SELL THESE SECURITIES AND IT IS NOT A SOLICITATION OF AN OFFER TO BUY THESE SECURITIES IN ANY JURISDICTION WHERE THE OFFER OR SALE IS NOT PERMITTED.
| Structural and Collateral Term Sheet | | JPMDB 2019-COR6 |
| |
| Collateral Characteristics |
| Loan Pool | |
| | Initial Pool Balance (“IPB”): | $807,180,797 |
| | Number of Mortgage Loans: | 32 |
| | Number of Mortgaged Properties: | 117 |
| | Average Cut-off Date Balance per Mortgage Loan: | $25,224,400 |
| | Weighted Average Current Mortgage Rate: | 3.94484% |
| | 10 Largest Mortgage Loans as % of IPB: | 57.5% |
| | Weighted Average Remaining Term to Maturity: | 115 months |
| | Weighted Average Seasoning: | 2 months |
| | | |
| Credit Statistics | |
| | Weighted Average UW NCF DSCR(1)(2): | 2.18x |
| | Weighted Average UW NOI Debt Yield(1): | 9.7% |
| | Weighted Average Cut-off Date Loan-to-Value Ratio (“LTV”)(1)(3): | 61.2% |
| | Weighted Average Maturity Date LTV(1)(3): | 58.2% |
| | | |
| Other Statistics | |
| | % of Mortgage Loans with Additional Debt: | 20.9% |
| | % of Mortgaged Properties with Single Tenants: | 14.6% |
| | | |
| Amortization | |
| | Weighted Average Original Amortization Term(4): | 359 months |
| | Weighted Average Remaining Amortization Term(4): | 357 months |
| | % of Mortgage Loans with Interest-Only: | 68.8% |
| | % of Mortgage Loans with Amortizing Balloon: | 21.2% |
| | % of Mortgage Loans with Partial Interest-Only followed by Amortizing Balloon: | 9.9% |
| | | |
| Lockbox / Cash Management(5) | |
| | % of Mortgage Loans with In-Place, Hard Lockboxes: | 76.0% |
| | % of Mortgage Loans with Springing Lockboxes: | 12.2% |
| | % of Mortgage Loans with In-Place, Soft Lockboxes: | 11.8% |
| | % of Mortgage Loans with In-Place Cash Management: | 10.6% |
| | % of Mortgage Loans with Springing Cash Management: | 89.4% |
| | | |
| Reserves | |
| | % of Mortgage Loans Requiring Monthly Tax Reserves: | 65.8% |
| | % of Mortgage Loans Requiring Monthly Insurance Reserves: | 34.9% |
| | % of Mortgage Loans Requiring Monthly CapEx Reserves(6): | 65.3% |
| | % of Mortgage Loans Requiring Monthly TI/LC Reserves(7): | 56.3% |
| | | |
| (1) | In the case of Loan Nos. 1, 2, 3, 4, 5, 7, 9, 11, 14, 16, 17, 18, 20 and 26, the UW NCF DSCR, UW NOI Debt Yield, Cut-off Date LTV and Maturity Date LTV calculations include the related Pari Passu Companion Loan(s). In the case of Loan Nos. 1, 5, 7 and 16, the UW NCF DSCR, UW NOI Debt Yield, Cut-off Date LTV and Maturity Date LTV calculations exclude the related Subordinate Companion Loan(s) and/or related mezzanine loan(s). |
| (2) | In the case of Loan No. 7, the UW NCF DSCR is calculated using the sum of the first 12 mortgage loan principal and interest payments after the Cut-off Date based on the assumed principal and interest payment schedule set forth in Annex H of the Preliminary Prospectus. |
| (3) | In the case of Loan Nos. 3, 17 and 20, the Cut-off Date LTV and the Maturity Date LTV are calculated by using an appraised value based on certain hypothetical assumptions. Refer to“Description of the Mortgage Pool—Assessments of Property Value and Condition” and“—Appraised Value” in the Preliminary Prospectus for additional details. |
| (4) | Excludes 20 mortgage loans that are interest-only for the entire term. |
| (5) | For a more detailed description of Lockbox / Cash Management, refer to“Description of the Mortgage Pool—Certain Terms of the Mortgage Loans—Mortgaged Property Accounts” in the Preliminary Prospectus. |
| (6) | CapEx Reserves include FF&E reserves for hotel properties. |
| (7) | Calculated only with respect to the Cut-off Date Balance of mortgage loans secured or partially secured by retail, office, industrial and mixed use properties. |
THE INFORMATION IN THIS STRUCTURAL AND COLLATERAL TERM SHEET IS NOT COMPLETE AND MAY BE AMENDED PRIOR TO THE TIME OF SALE. THIS TERM SHEET IS NOT AN OFFER TO SELL THESE SECURITIES AND IT IS NOT A SOLICITATION OF AN OFFER TO BUY THESE SECURITIES IN ANY JURISDICTION WHERE THE OFFER OR SALE IS NOT PERMITTED.
 | 3 of 95 |  |
| Structural and Collateral Term Sheet | | JPMDB 2019-COR6 |
| |
| Collateral Characteristics |
Mortgage Loan Seller | Number of
Mortgage Loans | Number of
Mortgaged
Properties | Aggregate
Cut-off Date
Balance | |
| LCM | 22 | 100 | $485,460,797 | 60.1% |
| JPMCB(1) | 9 | 16 | 259,220,000 | 32.32.1.1 |
| GACC(2) | 1 | 1 | 62,500,000 | 7.7% |
| Total | 32 | 117 | $807,180,797 | 100.0% |
| (1) | In the case of Loan No. 16, the whole loan was co-originated by JPMCB, Morgan Stanley Bank, N.A., Wells Fargo Bank, National Association and Goldman Sachs Bank USA. In the case of Loan Nos. 17 and 18, the whole loan was co-originated by JPMCB and Wells Fargo Bank, National Association. |
| (2) | In the case of Loan No. 1, such mortgage loan being sold by GACC was originated by an affiliate thereof, Deutsche Bank AG, New York Branch (“DBNY”). DBNY on the origination date transferred such mortgage loan to DBR Investments Co. Limited (“DBRI”), and DBRI will transfer such mortgage loan to GACC on or prior to the closing date. The Century Plaza Towers Whole Loan, with respect to which such mortgage loan is a part of, was co-originated by DBNY, Morgan Stanley Bank, N.A. and Wells Fargo Bank, National Association. |
| Ten Largest Mortgage Loans |
| |
| No. | Loan Name | Mortgage
Loan Seller | No.
of Prop. | Cut-off
Date
Balance | % of
IPB | SF / Units/ | Property
Type | UW
NCF
DSCR(1)(2) | UW NOI
Debt
Yield(1) | Cut-off
Date
LTV(1)(3) | Maturity
Date
LTV(1)(3) |
| 1 | Century Plaza Towers | GACC | 1 | $62,500,000 | 7.7% | 2,401,641 | Office | 4.09x | 13.5% | 39.1% | 39.1% |
| 2 | Los Angeles Leased Fee Portfolio | LCM | 8 | $61,000,000 | 7.6% | 556,202 | Other | 1.75x | 6.2% | 63.0% | 63.0% |
| 3 | Innovation Park | JPMCB | 1 | $55,000,000 | 6.8% | 1,854,729 | Office | 2.96x | 11.6% | 68.8% | 68.8% |
| 4 | 12555 & 12655 Jefferson | LCM | 2 | $54,000,000 | 6.7% | 193,908 | Office | 1.80x | 7.6% | 59.5% | 59.5% |
| 5 | Hyde Park Multifamily Portfolio | LCM | 42 | $46,750,000 | 5.8% | 839 | Multifamily | 1.82x | 8.7% | 60.5% | 60.5% |
| 6 | BJ’s Wholesale Club | JPMCB | 1 | $40,150,000 | 5.0% | 135,753 | Retail | 2.58x | 9.4% | 54.3% | 54.3% |
| 7 | Hampton Roads Office Portfolio | LCM | 22 | $39,723,151 | 4.9% | 1,322,003 | Office | 1.40x | 10.8% | 71.3% | 60.3% |
| 8 | Colorado Square | LCM | 1 | $37,050,001 | 4.6% | 245,509 | Office | 1.53x | 9.3% | 71.8% | 57.5% |
| 9 | Sunset North | JPMCB | 1 | $35,000,000 | 4.3% | 464,061 | Office | 2.63x | 9.1% | 66.1% | 66.1% |
| 10 | Jersey City Group 2 | JPMCB | 8 | $32,840,000 | 4.1% | 201 | Multifamily | 1.04x | 6.6% | 78.6% | 72.0% |
| | | | | | | | | | | | |
| | Top 3 Total/Weighted Average | 10 | $178,500,000 | 22.1% | | | 2.94x | 10.4% | 56.4% | 56.4% |
| | Top 5 Total/Weighted Average | 54 | $279,250,000 | 34.6% | | | 2.53x | 9.6% | 57.7% | 57.7% |
| | Top 10 Total/Weighted Average | 87 | $464,013,153 | 57.5% | | | 2.26x | 9.4% | 61.8% | 59.3% |
| (1) | In the case of Loan Nos. 1, 2, 3, 4, 5, 7 and 9, the UW NCF DSCR, UW NOI Debt Yield, Cut-off Date LTV and Maturity Date LTV calculations include the related Pari Passu Companion Loan(s). In the case of Loan Nos. 1, 5 and 7, the UW NCF DSCR, UW NOI Debt Yield, Cut-off Date LTV and Maturity Date LTV calculations exclude the related Subordinate Companion Loan(s) and/or related mezzanine loan(s). |
| (2) | With respect to Loan No. 7, the UW NCF DSCR is calculated using the sum of the first 12 whole loan principal and interest payments after the Cut-off Date based on the assumed principal and interest payment schedule set forth in Annex H of the Preliminary Prospectus. |
| (3) | In the case of Loan No. 3, the Cut-off Date LTV and the Maturity Date LTV are calculated by using an appraised value based on certain hypothetical assumptions. Refer to “Description of the Mortgage Pool—Assessments of Property Value and Condition” and “—Appraised Value” in the Preliminary Prospectus for additional details. |
THE INFORMATION IN THIS STRUCTURAL AND COLLATERAL TERM SHEET IS NOT COMPLETE AND MAY BE AMENDED PRIOR TO THE TIME OF SALE. THIS TERM SHEET IS NOT AN OFFER TO SELL THESE SECURITIES AND IT IS NOT A SOLICITATION OF AN OFFER TO BUY THESE SECURITIES IN ANY JURISDICTION WHERE THE OFFER OR SALE IS NOT PERMITTED.
| | 4 of 95 | |
| Structural and Collateral Term Sheet | | JPMDB 2019-COR6 |
| |
| Collateral Characteristics |
| Pari Passu Companion Loan Summary |
| Loan No. | Mortgage Loan | Note(s) | Original Balance
($) | Cut-off Date
Balance ($) | Holder of Note | Lead
Servicer for
Whole Loan
(Y/N) |
Master
Servicer
Under Lead
Securitization | Special Servicer
Under Lead
Securitization |
| 1 | Century Plaza Towers | A-1-S1, A-1-S2, A-1-S3, A-2-S1, A-2-S2, A-2-S3, A-2-C1, A-2-C3, A-2-C4, A-3-S1, A-3-S2, A-3-S3, A-3-C1, A-3-C3 | $525,000,000 | $525,000,000 | CPTS 2019-CPT | Yes(2) | Wells | CWCapital |
| | A-1-C3, A-1-C8 | $62,500,000 | $62,500,000 | JPMDB 2019-COR6 | No | | |
| | A-1-C1, A-1-C2, A-1-C4, A-1-C5, A-1-C6, A-1-C7, | $187,500,000 | $187,500,000 | DBRI | No | | |
| | | A-2-C2, A-2-C5, A-2-C6, A-2-C7 | $62,500,000 | $62,500,000 | MSBNA | No | | |
| | | A-3-C2, A-3-C4, A-3-C5 | $62,500,000 | $62,500,000 | WFBNA | No | | |
| | | B-1, B-2, B-3(1) | $300,000,000 | $300,000,000 | CPTS 2019-CPT | No(2) | | |
| | | Total | $1,200,000,000 | $1,200,000,000 | | | | |
| 2 | Los Angeles Leased Fee Portfolio | A-1 | $61,000,000 | $61,000,000 | JPMDB 2019-COR6 | Yes | Midland | Midland |
| | A-2 | $24,000,000 | $24,000,000 | LCM | No | | |
| | | Total | $85,000,000 | $85,000,000 | | | | |
| 3 | Innovation Park | A-1 | $60,000,000 | $60,000,000 | BMARK 2019-B14 | No(3) | | |
| | A-2 | $67,250,000 | $67,250,000 | JPMCB | Yes | (3) | (3) |
| | | A-3 | $55,000,000 | $55,000,000 | JPMDB 2019-COR6 | No | | |
| | | Total | $182,250,000 | $182,250,000 | | | | |
4 | 12555 &12655 Jefferson | A-1 | $54,000,000 | $54,000,000 | JPMDB 2019-COR6 | Yes | Midland | Midland |
| | A-2 | $30,000,000 | $30,000,000 | LCM | No | | |
| | | A-3 | $27,000,000 | $27,000,000 | LCM | No | | |
| | | Total | $111,000,000 | $111,000,000 | | | | |
5 | Hyde Park Multifamily Portfolio | A-1 | $60,000,000 | $60,000,000 | JPMCC 2019-COR5 | Yes | Midland | Midland |
| | A-2 | $46,750,000 | $46,750,000 | JPMDB 2019-COR6 | No | | |
| | | Total | $106,750,000 | $106,750,000 | | | | |
7 | Hampton Roads Office Portfolio | A-1, A-5 | $50,000,000 | $49,653,939 | JPMCC 2019-COR5 | Yes | Midland | Midland |
| | A-3, A-4 | $40,000,000 | $39,723,151 | JPMDB 2019-COR6 | No | | |
| | A-2 | $33,000,000 | $32,771,600 | LCM | No | | |
| | A-6 | $10,000,000 | $9,930,788 | LCM | No | | |
| | Total | $133,000,000 | $132,079,478 | | | | |
9 | Sunset North | A-1 | $75,000,000 | $75,000,000 | BMARK 2019-B13 | Yes | Midland | CWCapital |
| | | A-2 | $20,000,000 | $20,000,000 | BMARK 2019-B14 | No | | |
| | | A-3-1 | $35,000,000 | $35,000,000 | JPMDB 2019-COR6 | No | | |
| | | A-3-2 | $20,000,000 | $20,000,000 | JPMCB | No | | |
| | | Total | $150,000,000 | $150,000,000 | | | | |
| 11 | Belvedere Place | A-1 | $32,750,000 | $32,750,000 | JPMDB 2019-COR6 | Yes | Midland | Midland |
| | A-2 | $11,250,000 | $11,250,000 | LCM | No | | |
| | | Total | $44,000,000 | $44,000,000 | | | | |
14 | Brooklyn Renaissance Plaza | A-1 | $65,000,000 | $64,503,166 | JPMCC 2019-COR5 | Yes | Midland | Midland |
| | A-2 | $25,000,000 | $24,808,910 | JPMDB 2019-COR6 | No | | |
| | | Total | $90,000,000 | $89,312,076 | | | | |
| (1) | Each note represents a subordinate companion loan. |
| (2) | In the case of Loan No. 1, the initial control note is Note B-1. During the continuance of a Century Plaza Towers Control Appraisal Period, Note A-1-S1 will be the Control Note. See “Description of the Mortgage Pool—The Whole Loans—The Non-Serviced AB Whole Loans—The Century Plaza Towers Whole Loan” in the Preliminary Prospectus. |
| (3) | In the case of Loan No. 3, the whole loan is expected to be serviced under the BMARK 2019-B14 pooling and servicing agreement until such time the controlling note has been securitized, at which point such whole loan will be serviced under the pooling and servicing agreement related to such securitization. JPMCB holds the related controllingpari passucompanion loan and is entitled to exercise control rights until the securitization of such controllingpari passucompanion loan. |
THE INFORMATION IN THIS STRUCTURAL AND COLLATERAL TERM SHEET IS NOT COMPLETE AND MAY BE AMENDED PRIOR TO THE TIME OF SALE. THIS TERM SHEET IS NOT AN OFFER TO SELL THESE SECURITIES AND IT IS NOT A SOLICITATION OF AN OFFER TO BUY THESE SECURITIES IN ANY JURISDICTION WHERE THE OFFER OR SALE IS NOT PERMITTED.
| | 5 of 95 | |
| Structural and Collateral Term Sheet | | JPMDB 2019-COR6 |
| |
| Collateral Characteristics |
| Loan No. | Mortgage
Loan | Note(s) | Original
Balance ($) | Cut-off Date Balance ($) | Holder of Note | Lead
Servicer for
Whole
Loan
(Y/N) | Master
Servicer
Under
Lead
Securitization | Special
Servicer Under
Lead
Securitization |
| 16 | Grand Canal Shoppes | A-1-1, A-1-6 | $70,000,000 | $70,000,000 | MSC 2019-H7 | Yes(2) | Midland | LNR |
| | | A-1-2, A-2-1 | $100,000,000 | $100,000,000 | BANK 2019-BNK19 | No | | |
| | | A-3-1 | $50,000,000 | $50,000,000 | BMARK 2019-B12 | No | | |
| | | A-3-2 | $50,000,000 | $50,000,000 | BMARK 2019-B13 | No | | |
| | | A-4-1 | $60,000,000 | $60,000,000 | CGCMT 2019-GC41 | No | | |
| | | A-4-3 | $20,000,000 | $20,000,000 | GSMS 2019-GC42 | No | | |
| | | A-1-7, A-1-8, A-2-2-1 | $40,000,000 | $40,000,000 | BANK 2019-BNK20 | No | | |
| | | A-2-2-2 | $30,000,000 | $30,000,000 | CSAIL 2019-C17 | No | | |
| | | A-2-3, A-2-5 | $50,384,615 | $50,384,615 | UBS 2019-C17 | No | | |
| | | A-1-4 | $40,000,000 | $40,000,000 | BANK 2019-BNK21 | No | | |
| | | A-3-3-1, A-3-5 | $30,384,615 | $30,384,615 | BMARK 2019-B14 | No | | |
| | | A-1-3, A-1-5 | $53,846,154 | $53,846,154 | MSNBA | No | | |
| | | A-3-3-2 | $20,000,000 | $20,000,000 | JPMDB 2019-COR6 | No | | |
| | | A-3-4 | $25,000,000 | $25,000,000 | CCRE | No | | |
| | | A-4-2, A-4-4, A-4-5 | $95,384,615 | $95,384,615 | GSBI | No | | |
| | | A-2-4 | $25,000,000 | $25,000,000 | UBS AG | No | | |
| | | B-1(1) | $215,000,000 | $215,000,000 | CPPIB Credit Investment II Inc. | No(2) | | |
| | | Total | $975,000,000 | $975,000,000 | | | | |
17 | 600 & 620 National Avenue | A-1-1 | $38,950,000 | $38,950,000 | UBSCM 2019-C17 | Yes | Midland | CWCapital |
| | A-2-1-A | $20,000,000 | $20,000,000 | BMARK 2019-B14 | No | | |
| | | A-1-2 | $30,000,000 | $30,000,000 | WFM | No | | |
| | | A-2-2-A | $20,000,000 | $20,000,000 | JPMDB 2019-COR6 | No | | |
| | | A-2-1-B, A-2-2-B, A-2-3 | $28,950,000 | $28,950,000 | JPMCB | No | | |
| | | Total | $137,900,000 | $137,900,000 | | | | |
18 | Tysons Tower | A-1 | $50,000,000 | $50,000,000 | BANK 2019-BNK21 | Yes | Rialto | Wells |
| | A-2, A-3 | $45,000,000 | $45,000,000 | WFB | No | | |
| | A-4 | $40,000,000 | $40,000,000 | BMARK 2019-B14 | No | | |
| | | A-5 | $20,000,000 | $20,000,000 | JPMDB 2019-COR6 | No | | |
| | | A-6, A-7 | $35,000,000 | $35,000,000 | JPMCB | No | | |
| | | Total | $190,000,000 | $190,000,000 | | | | |
| 20 | Hilton Cincinnati Netherland Plaza | A-1 | $35,550,000 | $35,550,000 | BMARK 2019-B14 | Yes | Midland | Midland |
| | A-2 | $17,000,000 | $17,000,000 | JPMDB 2019-COR6 | No | | |
| | A-3 | $20,000,000 | $20,000,000 | JPMCB | No | | |
| | | Total | $72,500,000 | $72,500,000 | | | | |
| 26 | NOV Headquarters | A-1 | $20,000,000 | $20,000,000 | JPMCC 2019-COR5 | Yes | Midland | Midland |
| A-2 | $9,200,000 | $9,200,000 | JPMDB 2019-COR6 | No | | |
| | | A-3 | $10,000,000 | $10,000,000 | LCM | No | | |
| | | Total | $39,200,000 | $39,200,000 | | | | |
| (1) | Each note represents a subordinate companion loan. |
| (2) | In the case of Loan No. 16, the initial control note is Note B-1. During the continuance of a Grand Canal Shoppes Control Appraisal Period, Note A-1-1 will be the Control Note. See “Description of the Mortgage Pool—The Whole Loans—The Non-Serviced AB Whole Loans—The Grand Canal Shoppes Whole Loan” in the Preliminary Prospectus. |
THE INFORMATION IN THIS STRUCTURAL AND COLLATERAL TERM SHEET IS NOT COMPLETE AND MAY BE AMENDED PRIOR TO THE TIME OF SALE. THIS TERM SHEET IS NOT AN OFFER TO SELL THESE SECURITIES AND IT IS NOT A SOLICITATION OF AN OFFER TO BUY THESE SECURITIES IN ANY JURISDICTION WHERE THE OFFER OR SALE IS NOT PERMITTED.
| | 6 of 95 | |
| Structural and Collateral Term Sheet | | JPMDB 2019-COR6 |
| |
| Collateral Characteristics |
No. | Loan Name | Trust
Cut-off Date
Balance | Subordinate
Debt Cut-off
Date
Balance(1) | Total Debt
Cut-off Date
Balance | Mortgage
Loan UW
NCF
DSCR(2)(3) |
Total
Debt
UW
NCF
DSCR(3) | Mortgage Loan
Cut-off Date LTV(2) |
Total
Debt
Cut-off
Date
LTV | Mortgage
Loan UW
NOI Debt
Yield(2) | Total
Debt
UW NOI Debt
Yield |
| 1 | Century Plaza Towers | $62,500,000 | $300,000,000 | $1,200,000,000 | 4.09x | 3.07x | 39.1% | 52.1% | 13.5% | 10.1% |
| 5 | Hyde Park Multifamily Portfolio | $46,750,000 | $15,250,000 | $122,000,000 | 1.82x | 1.48x | 60.5% | 69.2% | 8.7% | 7.6% |
| 7 | Hampton Roads Office Portfolio | $39,723,151 | $19,861,576 | $151,941,054 | 1.40x | 1.16x | 71.3% | 82.0% | 10.8% | 9.4% |
| 16 | Grand Canal Shoppes | $20,000,000 | $215,000,000 | $975,000,000 | 2.46x | 1.67x | 46.3% | 59.5% | 9.6% | 7.5% |
| (1) | In the case of Loan Nos. 5 and 7, Subordinate Debt Cut-off Date Balance represents one or more mezzanine loans. In the case of Loan Nos. 1 and 16, Subordinate Debt Cut-off Date Balance represents one or more Subordinate Companion Loans. |
| (2) | In the case of Loan Nos. 1, 5, 7 and 16, the UW NCF DSCR, UW NOI Debt Yield and Cut-off Date LTV calculations include the related Pari Passu Companion Loan(s). In the case of Loan Nos. 1, 5, 7 and 16, the UW NCF DSCR, UW NOI Debt Yield and Cut-off Date LTV calculations exclude the related Subordinate Companion Loan(s) and/or related mezzanine loan(s). |
| (3) | With respect to Loan No. 7, the UW NCF DSCR is calculated using the sum of the first 12 mortgage loan principal and interest payments after the Cut-off Date based on the assumed principal and interest payment schedule set forth in Annex H of the Preliminary Prospectus. The Total Debt UW NCF DSCR is calculated using the sum of the first 12 total debt principal and interest payments after the Cut-off Date based on the assumed principal and interest payment schedule set forth in the related mortgage and mezzanine loan agreements. |
THE INFORMATION IN THIS STRUCTURAL AND COLLATERAL TERM SHEET IS NOT COMPLETE AND MAY BE AMENDED PRIOR TO THE TIME OF SALE. THIS TERM SHEET IS NOT AN OFFER TO SELL THESE SECURITIES AND IT IS NOT A SOLICITATION OF AN OFFER TO BUY THESE SECURITIES IN ANY JURISDICTION WHERE THE OFFER OR SALE IS NOT PERMITTED.
| | 7 of 95 | |
| Structural and Collateral Term Sheet | | JPMDB 2019-COR6 |
| |
| Collateral Characteristics |
| Mortgaged Properties by Type(1) |
| | | | | | Weighted Average |
| Property Type | Property Subtype | Number of
Properties | Cut-off Date
Principal
Balance | % of IPB | Occupancy | UW
NCF
DSCR(2)(3) | UW
NOI Debt
Yield(2) | Cut-off
Date
LTV(2)(4) | Maturity
Date
LTV(2)(4) |
| Office | Suburban | 31 | $280,753,630 | 34.8% | 95.9% | 2.22x | 10.2% | 66.2% | 62.6% |
| | CBD | 5 | 178,358,911 | 22.1 | 93.1% | 2.49x | 10.2% | 53.3% | 49.1% |
| | Medical | 4 | 9,200,000 | 1.1 | 100.0% | 1.50x | 10.0% | 58.7% | 53.9% |
| | Subtotal: | 40 | $468,312,541 | 58.0% | 94.9% | 2.31x | 10.2% | 61.2% | 57.3% |
| | | | | | | | | | |
| Multifamily | Garden | 40 | $67,106,565 | 8.3% | 94.3% | 1.44x | 7.7% | 69.4% | 66.1% |
| | Mid-Rise | 11 | 34,064,097 | 4.2 | 97.2% | 1.91x | 8.2% | 61.2% | 61.2% |
| | Subtotal: | 51 | $101,170,662 | 12.5% | 95.2% | 1.60x | 7.9% | 66.6% | 64.5% |
| | | | | | | | | | |
| Retail | Freestanding | 2 | $44,350,000 | 5.5% | 100.0% | 2.51x | 9.3% | 55.1% | 55.1% |
| | Anchored | 2 | 25,553,256 | 3.2 | 94.1% | 2.13x | 11.0% | 60.2% | 56.2% |
| | Specialty Retail | 1 | 20,000,000 | 2.5 | 94.0% | 2.46x | 9.6% | 46.3% | 46.3% |
| | Shadow Anchored | 1 | 3,395,000 | 0.4 | 92.2% | 2.52x | 11.5% | 67.9% | 67.9% |
| | Subtotal: | 6 | $93,298,256 | 11.6% | 96.8% | 2.40x | 9.9% | 55.1% | 54.0% |
| | | | | | | | | | |
| Other | Leased Fee | 8 | $61,000,000 | 7.6% | 100.0% | 1.75x | 6.2% | 63.0% | 63.0% |
| | Parking | 1 | 219,338 | 0.0 | 100.0% | 1.82x | 8.7% | 60.5% | 60.5% |
| | Subtotal: | 9 | $61,219,338 | 7.6% | 100.0% | 1.75x | 6.2% | 63.0% | 63.0% |
| | | | | | | | | | |
| Hotel | Extended Stay | 1 | $25,250,000 | 3.1% | 88.1% | 2.99x | 12.3% | 52.6% | 52.6% |
| | Full Service | 1 | 17,000,000 | 2.1 | 74.8% | 1.62x | 10.9% | 68.7% | 63.7% |
| | Subtotal: | 2 | $42,250,000 | 5.2% | 82.7% | 2.44x | 11.7% | 59.1% | 57.1% |
| | | | | | | | | | |
| Self Storage | Self Storage | 2 | $28,330,000 | 3.5% | 90.5% | 1.81x | 8.9% | 64.2% | 64.2% |
| | Subtotal: | 2 | $28,330,000 | 3.5% | 90.5% | 1.81x | 8.9% | 64.2% | 64.2% |
| | | | | | | | | | |
| Industrial | Flex | 6 | $11,060,700 | 1.4% | 100.0% | 2.49x | 16.8% | 50.8% | 41.0% |
| | Warehouse/Distribution | 1 | 1,539,300 | 0.2 | 100.0% | 1.64x | 10.6% | 66.9% | 55.1% |
| | Subtotal: | 7 | $12,600,000 | 1.6% | 100.0% | 2.39x | 16.1% | 52.8% | 42.7% |
| | Total / Weighted Average: | 117 | 807,180,797 | 100.0% | 94.8% | 2.18x | 9.7% | 61.2% | 58.2% |
| (1) | Because this table presents information relating to the mortgaged properties and not mortgage loans, the information for mortgage loans secured by more than one mortgaged property is based on allocated loan amounts. |
| (2) | In the case of Loan Nos. 1, 2, 3, 4, 5, 7, 9, 11, 14, 16, 17, 18, 20 and 26, the UW NCF DSCR, UW NOI Debt Yield, Cut-off Date LTV and Maturity Date LTV calculations include the related Pari Passu Companion Loan(s). In the case of Loan Nos. 1, 5, 7 and 16, the UW NCF DSCR, UW NOI Debt Yield, Cut-off Date LTV and Maturity Date LTV calculations exclude the related Subordinate Companion Loan(s) and/or related mezzanine loan(s). |
| (3) | With respect to Loan No. 7, the UW NCF DSCR is calculated using the sum of the first 12 whole loan principal and interest payments after the Cut-off Date based on the assumed principal and interest payment schedule set forth in Annex H of the Preliminary Prospectus. |
| (4) | In the case of Loan Nos. 3, 17 and 20, the Cut-off Date LTV and the Maturity Date LTV are calculated by using an appraised value based on certain hypothetical assumptions. Refer to “Description of the Mortgage Pool—Assessments of Property Value and Condition” and “—Appraised Value” in the Preliminary Prospectus for additional details. |
THE INFORMATION IN THIS STRUCTURAL AND COLLATERAL TERM SHEET IS NOT COMPLETE AND MAY BE AMENDED PRIOR TO THE TIME OF SALE. THIS TERM SHEET IS NOT AN OFFER TO SELL THESE SECURITIES AND IT IS NOT A SOLICITATION OF AN OFFER TO BUY THESE SECURITIES IN ANY JURISDICTION WHERE THE OFFER OR SALE IS NOT PERMITTED.
| | 8 of 95 | |
| Structural and Collateral Term Sheet | | JPMDB 2019-COR6 |
| |
| Collateral Characteristics |
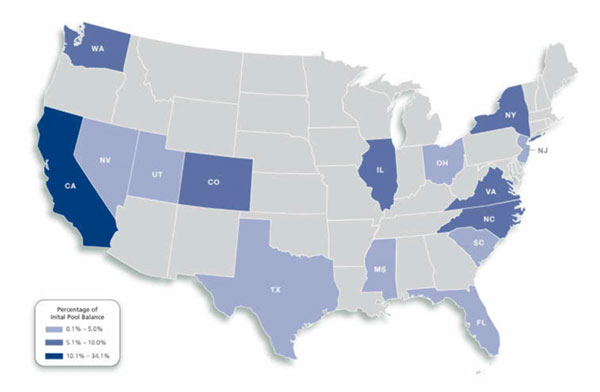
| Mortgaged Properties by Location(1) |
| |
| | | | | Weighted Average |
State | Number of
Properties | Cut-off Date
Principal
Balance | % of
IPB | Occupancy | UW
NCF DSCR(2)(3) | UW
NOI Debt
Yield(2) | Cut-off Date
LTV(2)(4) | Maturity Date LTV(2)(4) |
| California | 17 | 274,983,735 | 34.1% | 96.6% | 2.43x | 9.4% | 57.5% | 56.8% |
| Illinois | 44 | 68,550,000 | 8.5 | 95.4% | 1.86x | 8.5% | 60.9% | 60.9% |
| New York | 2 | 64,958,910 | 8.0 | 95.6% | 2.14x | 9.2% | 52.0% | 48.5% |
| North Carolina | 4 | 60,789,100 | 7.5 | 96.5% | 2.83x | 11.5% | 68.6% | 67.5% |
| Virginia | 24 | 60,258,551 | 7.5 | 93.9% | 1.96x | 10.9% | 64.9% | 57.5% |
| Colorado | 2 | 56,280,001 | 7.0 | 89.7% | 1.57x | 9.2% | 68.5% | 59.0% |
| Washington | 3 | 48,100,000 | 6.0 | 98.3% | 2.66x | 10.6% | 63.0% | 62.4% |
| New Jersey | 8 | 32,840,000 | 4.1 | 95.0% | 1.04x | 6.6% | 78.6% | 72.0% |
| Utah | 1 | 29,600,000 | 3.7 | 88.2% | 1.58x | 9.5% | 67.4% | 60.9% |
| South Carolina | 2 | 27,895,000 | 3.5 | 99.1% | 1.83x | 10.9% | 61.5% | 50.7% |
| Florida | 2 | 26,789,300 | 3.3 | 88.8% | 2.91x | 12.2% | 53.4% | 52.7% |
| Nevada | 1 | 20,000,000 | 2.5 | 94.0% | 2.46x | 9.6% | 46.3% | 46.3% |
| Texas | 5 | 18,400,000 | 2.3 | 100.0% | 1.61x | 9.1% | 63.8% | 61.4% |
| Ohio | 1 | 17,000,000 | 2.1 | 74.8% | 1.62x | 10.9% | 68.7% | 63.7% |
| Mississippi | 1 | 736,200 | 0.1 | 100.0% | 1.64x | 10.6% | 66.9% | 55.1% |
| Total / Weighted Average | 117 | $807,180,797 | 100.0% | 94.8% | 2.18x | 9.7% | 61.2% | 58.2% |
| (1) | Because this table represents information relating to the mortgaged properties and not mortgage loans, the information for the mortgage loans secured by more than one mortgaged property is based on allocated loan amounts. |
| (2) | In the case of Loan Nos. 1, 2, 3, 4, 5, 7, 9, 11, 14, 16, 17, 18, 20 and 26, the UW NCF DSCR, UW NOI Debt Yield, Cut-off Date LTV and Maturity Date LTV calculations include the related Pari Passu Companion Loan(s). In the case of Loan Nos. 1, 5, 7 and 16, the UW NCF DSCR, UW NOI Debt Yield, Cut-off Date LTV and Maturity Date LTV calculations exclude the related Subordinate Companion Loan(s) and/or related mezzanine loan(s). |
| (3) | With respect to Loan No. 7, the UW NCF DSCR is calculated using the sum of the first 12 whole loan principal and interest payments after the Cut-off Date based on the assumed principal and interest payment schedule set forth in Annex H of the Preliminary Prospectus. |
| (4) | In the case of Loan Nos. 3, 17 and 20, the Cut-off Date LTV and the Maturity Date LTV are calculated by using an appraised value based on certain hypothetical assumptions. Refer to “Description of the Mortgage Pool—Assessments of Property Value and Condition” and “—Appraised Value” in the Preliminary Prospectus for additional details. |
THE INFORMATION IN THIS STRUCTURAL AND COLLATERAL TERM SHEET IS NOT COMPLETE AND MAY BE AMENDED PRIOR TO THE TIME OF SALE. THIS TERM SHEET IS NOT AN OFFER TO SELL THESE SECURITIES AND IT IS NOT A SOLICITATION OF AN OFFER TO BUY THESE SECURITIES IN ANY JURISDICTION WHERE THE OFFER OR SALE IS NOT PERMITTED.
| | 9 of 95 | |
| Structural and Collateral Term Sheet | | JPMDB 2019-COR6 |
| |
| Collateral Characteristics |
| Cut-off Date Principal Balance |
| | | | | Weighted Average |
Range of Cut-off Date
Principal Balances | Number of
Loans | Cut-off Date
Principal
Balance | % of
IPB | Mortgage
Rate | Remaining
Loan Term | UW
NCF
DSCR(1)(2) | UW NOI
Debt
Yield(1) | Cut-off
Date
LTV(1)(3) | Maturity
Date
LTV(1)(3) |
| $3,395,000 | - | $9,999,999 | 9 | $65,398,256 | 8.1% | 4.28717% | 114 | 1.93x | 10.5% | 62.0% | 57.8% |
| $10,000,000 | - | $19,999,999 | 5 | 80,860,479 | 10.0 | 4.61616% | 93 | 1.84x | 10.0% | 64.7% | 62.4% |
| $20,000,000 | - | $24,999,999 | 5 | 109,308,910 | 13.5 | 3.87262% | 117 | 2.08x | 9.5% | 55.4% | 50.5% |
| $25,000,000 | - | $49,999,999 | 9 | 319,113,153 | 39.5 | 4.07770% | 117 | 1.99x | 9.5% | 65.0% | 60.7% |
| $50,000,000 | - | $62,500,000 | 4 | 232,500,000 | 28.8 | 3.46669% | 119 | 2.68x | 9.8% | 57.1% | 57.1% |
| Total / Weighted Average: | 32 | $807,180,797 | 100.0% | 3.94484% | 115 | 2.18x | 9.7% | 61.2% | 58.2% |
| | | | | Weighted Average |
Range of
Mortgage Interest Rates | Number
of Loans | Cut-off Date
Principal
Balance | % of
IPB | Mortgage
Rate | Remaining
Loan Term | UW
NCF
DSCR(1)(2) | UW NOI
Debt
Yield(1) | Cut-off
Date
LTV(1)(3) | Maturity
Date
LTV(1)(3) |
| 3.00450% | - | 3.99999% | 16 | $490,150,000 | 60.7% | 3.53174% | 119 | 2.56x | 9.8% | 58.3% | 57.8% |
| 4.00000% | - | 4.49999% | 7 | 129,434,390 | 16.0 | 4.14426% | 109 | 1.70x | 10.1% | 63.6% | 53.9% |
| 4.50000% | - | 4.99999% | 6 | 111,643,256 | 13.8 | 4.58227% | 115 | 1.53x | 8.3% | 66.2% | 62.9% |
| 5.00000% | - | 5.39000% | 3 | 75,953,151 | 9.4 | 5.33398% | 100 | 1.51x | 10.4% | 68.4% | 61.5% |
| Total / Weighted Average: | 32 | $807,180,797 | 100.0% | 3.94484% | 115 | 2.18x | 9.7% | 61.2% | 58.2% |
| | | | | | | | | | | | |
| Original Term to Maturity in Months |
| | | | | Weighted Average |
Original Term to
Maturity in Months | Number of
Loans | Cut-off Date Principal
Balance | % of
IPB | Mortgage
Rate | Remaining
Loan Term | UW
NCF
DSCR(1)(2) | UW NOI
Debt
Yield(1) | Cut-off
Date LTV(1)(3) | Maturity
Date LTV(1)(3) |
| 60 | 3 | $35,375,479 | 4.4% | 4.71509% | 59 | 1.68x | 10.7% | 70.2% | 65.0% |
| 120 | 29 | 771,805,319 | 95.6 | 3.90954% | 117 | 2.20x | 9.7% | 60.7% | 57.9% |
| Total / Weighted Average: | 32 | $807,180,797 | 100.0% | 3.94484% | 115 | 2.18x | 9.7% | 61.2% | 58.2% |
| Remaining Term to Maturity in Months |
| | | | | Weighted Average |
Range of Remaining Term
to Maturity in Months | Number of
Loans | Cut-off Date
Principal
Balance | % of
IPB | Mortgage
Rate | Remaining
Loan Term | UW
NCF
DSCR(1)(2) | UW NOI
Debt
Yield(1) | Cut-off
Date LTV(1)(3) | Maturity
Date LTV(1)(3) |
| 59 | - | 84 | 3 | $35,375,479 | 4.4% | 4.71509% | 59 | 1.68x | 10.7% | 70.2% | 65.0% |
| 85 | - | 119 | 21 | 554,415,319 | 68.7 | 4.01454% | 116 | 1.96x | 8.9% | 61.8% | 58.9% |
| 120 | 8 | 217,390,000 | 26.9 | 3.64175% | 120 | 2.82x | 11.5% | 58.0% | 55.5% |
| Total / Weighted Average: | 32 | $807,180,797 | 100.0% | 3.94484% | 115 | 2.18x | 9.7% | 61.2% | 58.2% |
| | | | | | | | | | | | |
| (1) | In the case of Loan Nos. 1, 2, 3, 4, 5, 7, 9, 11, 14, 16, 17, 18, 20 and 26, the UW NCF DSCR, UW NOI Debt Yield, Cut-off Date LTV and Maturity Date LTV calculations include the related Pari Passu Companion Loan(s). In the case of Loan Nos. 1, 5, 7 and 16, the UW NCF DSCR, UW NOI Debt Yield, Cut-off Date LTV and Maturity Date LTV calculations exclude the related Subordinate Companion Loan(s) and/or related mezzanine loan(s). |
| (2) | With respect to Loan No. 7, the UW NCF DSCR is calculated using the sum of the first 12 whole loan principal and interest payments after the Cut-off Date based on the assumed principal and interest payment schedule set forth in Annex H of the Preliminary Prospectus. |
| (3) | In the case of Loan Nos. 3, 17 and 20, the Cut-off Date LTV and the Maturity Date LTV are calculated by using an appraised value based on certain hypothetical assumptions. Refer to “Description of the Mortgage Pool—Assessments of Property Value and Condition” and “—Appraised Value” in the Preliminary Prospectus for additional details. |
THE INFORMATION IN THIS STRUCTURAL AND COLLATERAL TERM SHEET IS NOT COMPLETE AND MAY BE AMENDED PRIOR TO THE TIME OF SALE. THIS TERM SHEET IS NOT AN OFFER TO SELL THESE SECURITIES AND IT IS NOT A SOLICITATION OF AN OFFER TO BUY THESE SECURITIES IN ANY JURISDICTION WHERE THE OFFER OR SALE IS NOT PERMITTED.
| | 10 of 95 | |
| Structural and Collateral Term Sheet | | JPMDB 2019-COR6 |
| |
| Collateral Characteristics |
| Original Amortization Term in Months |
| | | | | Weighted Average |
Original
Amortization
Term in Months | Number
of Loans | Cut-off Date
Principal
Balance | % of
IPB | Mortgage
Rate | Remaining
Loan Term | UW
NCF
DSCR(1)(2) | UW NOI
Debt
Yield(1) | Cut-off
Date
LTV(1)(3) | Maturity
Date
LTV(1)(3) |
| Interest Only | 20 | $555,425,000 | 68.8% | 3.71279% | 117 | 2.48x | 9.6% | 58.7% | 58.7% |
| 300 | 1 | 4,000,000 | 0.5 | 3.80000% | 120 | 3.99x | 27.8% | 22.5% | 16.1% |
| 360 | 11 | 247,755,797 | 30.7 | 4.46742% | 109 | 1.47x | 9.6% | 67.2% | 57.8% |
| Total / Weighted Average: | 32 | $807,180,797 | 100.0% | 3.94484% | 115 | 2.18x | 9.7% | 61.2% | 58.2% |
| Remaining Amortization Term in Months |
| | | | | Weighted Average |
Range of Remaining
Amortization Term in Months | Number
of Loans | Cut-off Date
Principal
Balance | % of
IPB | Mortgage Rate | Remaining
Loan Term | UW
NCF
DSCR(1)(2) | UW NOI
Debt
Yield(1) | Cut-off
Date
LTV(1)(3) | Maturity
Date
LTV(1)(3) |
| Interest Only | 20 | $555,425,000 | 68.8% | 3.71279% | 117 | 2.48x | 9.6% | 58.7% | 58.7% |
| 300 | - | 359 | 6 | 130,015,797 | 16.1 | 4.54182% | 109 | 1.55x | 10.5% | 64.7% | 53.8% |
| 360 | 6 | 121,740,000 | 15.1 | 4.36602% | 111 | 1.47x | 9.3% | 68.5% | 60.8% |
| Total / Weighted Average: | 32 | $807,180,797 | 100.0% | 3.94484% | 115 | 2.18x | 9.7% | 61.2% | 58.2% |
| | | | | | | | | | | | |
| | | | | Weighted Average |
| Amortization Types | Number
of Loans | Cut-off Date
Principal
Balance | % of
IPB | Mortgage
Rate | Remaining
Loan Term | UW
NCF
DSCR(1)(2) | UW NOI
Debt
Yield(1) | Cut-off
Date
LTV(1)(3) | Maturity
Date
LTV(1)(3) |
| Interest Only | 20 | $555,425,000 | 68.8% | 3.71279% | 117 | 2.48x | 9.6% | 58.7% | 58.7% |
| Balloon | 8 | 171,515,797 | 21.2 | 4.55167% | 105 | 1.58x | 10.6% | 64.5% | 54.0% |
| IO-Balloon | 4 | 80,240,000 | 9.9 | 4.25405% | 118 | 1.36x | 8.5% | 70.9% | 64.0% |
| Total / Weighted Average: | 32 | $807,180,797 | 100.0% | 3.94484% | 115 | 2.18x | 9.7% | 61.2% | 58.2% |
| Underwritten Net Cash Flow Debt Service Coverage Ratios(1)(2) |
| | | | | Weighted Average |
Range of Underwritten Net
Cash Flow Debt Service
Coverage Ratios | Number
of Loans | Cut-off Date
Principal
Balance | % of
IPB | Mortgage
Rate | Remaining
Loan Term | UW
NCF
DSCR(1)(2) | UW NOI
Debt
Yield(1) | Cut-off
Date
LTV(1)(3) | Maturity
Date
LTV(1)(3) |
| 1.04x | - | 1.49x | 3 | $97,372,061 | 12.1% | 4.83881% | 116 | 1.29x | 8.9% | 67.9% | 58.9% |
| 1.50x | - | 1.74x | 10 | 178,813,736 | 22.2 | 4.37276% | 106 | 1.60x | 9.8% | 66.4% | 58.3% |
| 1.75x | - | 1.99x | 7 | 207,750,000 | 25.7 | 3.92996% | 117 | 1.82x | 7.5% | 62.1% | 62.1% |
| 2.00x | - | 2.24x | 1 | 9,100,000 | 1.1 | 3.90000% | 120 | 2.17x | 8.6% | 68.7% | 68.7% |
| 2.25x | - | 4.09x | 11 | 314,145,000 | 38.9 | 3.43532% | 118 | 3.03x | 11.4% | 55.3% | 55.2% |
| Total / Weighted Average: | 32 | $807,180,797 | 100.0% | 3.94484% | 115 | 2.18x | 9.7% | 61.2% | 58.2% |
| (1) | In the case of Loan Nos. 1, 2, 3, 4, 5, 7, 9, 11, 14, 16, 17, 18, 20 and 26, the UW NCF DSCR, UW NOI Debt Yield, Cut-off Date LTV and Maturity Date LTV calculations include the related Pari Passu Companion Loan(s). In the case of Loan Nos. 1, 5, 7 and 16, the UW NCF DSCR, UW NOI Debt Yield, Cut-off Date LTV and Maturity Date LTV calculations exclude the related Subordinate Companion Loan(s) and/or related mezzanine loan(s). |
| (2) | With respect to Loan No. 7, the UW NCF DSCR is calculated using the sum of the first 12 whole loan principal and interest payments after the Cut-off Date based on the assumed principal and interest payment schedule set forth in Annex H of the Preliminary Prospectus. |
| (3) | In the case of Loan Nos. 3, 17 and 20, the Cut-off Date LTV and the Maturity Date LTV are calculated by using an appraised value based on certain hypothetical assumptions. Refer to “Description of the Mortgage Pool—Assessments of Property Value and Condition” and “—Appraised Value” in the Preliminary Prospectus for additional details. |
THE INFORMATION IN THIS STRUCTURAL AND COLLATERAL TERM SHEET IS NOT COMPLETE AND MAY BE AMENDED PRIOR TO THE TIME OF SALE. THIS TERM SHEET IS NOT AN OFFER TO SELL THESE SECURITIES AND IT IS NOT A SOLICITATION OF AN OFFER TO BUY THESE SECURITIES IN ANY JURISDICTION WHERE THE OFFER OR SALE IS NOT PERMITTED.
| | 11 of 95 | |
| Structural and Collateral Term Sheet | | JPMDB 2019-COR6 |
| |
| Collateral Characteristics |
| LTV Ratios as of the Cut-off Date(1)(3) |
| | | | | Weighted Average |
Range of
Cut-off Date LTVs | Number
of Loans | Cut-off Date
Principal
Balance | % of
IPB | Mortgage
Rate | Remaining
Loan Term | UW
NCF
DSCR(1)(2) | UW NOI
Debt
Yield(1) | Cut-off
Date
LTV(1)(3) | Maturity
Date
LTV(1)(3) |
| 22.5% | - | 39.9% | 2 | $66,500,000 | 8.2% | 3.05235% | 120 | 4.08x | 14.4% | 38.1% | 37.7% |
| 40.0% | - | 49.9% | 2 | 44,808,910 | 5.6 | 4.10024% | 115 | 1.89x | 9.3% | 47.4% | 42.4% |
| 50.0% | - | 59.9% | 7 | 171,603,256 | 21.3 | 3.78747% | 119 | 2.29x | 9.4% | 56.1% | 55.3% |
| 60.0% | - | 69.9% | 16 | 379,675,000 | 47.0 | 3.94604% | 114 | 2.11x | 9.4% | 64.6% | 62.8% |
| 70.0% | - | 78.6% | 5 | 144,593,631 | 17.9 | 4.49078% | 111 | 1.44x | 8.9% | 73.0% | 64.2% |
| Total / Weighted Average: | 32 | $807,180,797 | 100.0% | 3.94484% | 115 | 2.18x | 9.7% | 61.2% | 58.2% |
| LTV Ratios as of the Maturity Date(1)(3) |
| | | | | Weighted Average |
Range of
Maturity Date LTVs | Number
of Loans | Cut-off Date
Principal
Balance | % of
IPB | Mortgage
Rate | Remaining
Loan Term | UW
NCF
DSCR(1)(2) | UW NOI
Debt
Yield(1) | Cut-off
Date
LTV(1)(3) | Maturity
Date
LTV(1)(3) |
| 16.1% | - | 39.9% | 3 | $91,308,910 | 11.3% | 3.41579% | 118 | 3.36x | 12.9% | 40.9% | 38.1% |
| 40.0% | - | 49.9% | 3 | 53,953,256 | 6.7 | 4.01423% | 118 | 1.97x | 10.3% | 54.7% | 47.3% |
| 50.0% | - | 54.9% | 4 | 94,600,000 | 11.7 | 3.62164% | 119 | 2.69x | 10.6% | 53.8% | 53.3% |
| 55.0% | - | 59.9% | 4 | 113,200,001 | 14.0 | 4.00018% | 118 | 1.72x | 8.4% | 63.9% | 58.4% |
| 60.0% | - | 72.0% | 18 | 454,118,630 | 56.3 | 4.09651% | 112 | 1.98x | 9.1% | 66.8% | 64.6% |
| Total / Weighted Average: | 32 | $807,180,797 | 100.0% | 3.94484% | 115 | 2.18x | 9.7% | 61.2% | 58.2% |
| | | | | Weighted Average |
| Prepayment Protection | Number
of Loans | Cut-off Date
Principal
Balance | % of
IPB | Mortgage
Rate | Remaining
Loan Term | UW
NCF
DSCR(1)(2) | UW NOI
Debt
Yield(1) | Cut-off
Date
LTV(1)(3) | Maturity
Date
LTV(1)(3) |
| Defeasance | 26 | $570,577,646 | 70.7% | 3.99512% | 114 | 1.91x | 9.0% | 62.9% | 59.5% |
| Yield Maintenance | 5 | 174,103,151 | 21.6 | 4.11763% | 117 | 2.38x | 10.6% | 63.4% | 60.8% |
| YM, then Defeasance or YM | 1 | 62,500,000 | 7.7 | 3.00450% | 120 | 4.09x | 13.5% | 39.1% | 39.1% |
| Total / Weighted Average: | 32 | $807,180,797 | 100.0% | 3.94484% | 115 | 2.18x | 9.7% | 61.2% | 58.2% |
| | | | | | | | | | |
| | | | | Weighted Average |
| Loan Purpose | Number
of Loans | Cut-off Date
Principal
Balance | % of
IPB | Mortgage
Rate | Remaining
Loan Term | UW
NCF
DSCR(1)(2) | UW NOI
Debt
Yield(1) | Cut-off
Date
LTV(1)(3) | Maturity
Date
LTV(1)(3) |
| Refinance | 19 | $507,482,167 | 62.9% | 3.98604% | 115 | 2.07x | 9.4% | 59.2% | 55.7% |
| Acquisition | 12 | 279,698,630 | 34.7 | 3.91406% | 114 | 2.31x | 10.1% | 65.4% | 63.3% |
| Recapitalization | 1 | 20,000,000 | 2.5 | 3.33000% | 119 | 3.07x | 11.0% | 52.1% | 52.1% |
| Total / Weighted Average: | 32 | $807,180,797 | 100.0% | 3.94484% | 115 | 2.18x | 9.7% | 61.2% | 58.2% |
| (1) | In the case of Loan Nos. 1, 2, 3, 4, 5, 7, 9, 11, 14, 16, 17, 18, 20 and 26, the UW NCF DSCR, UW NOI Debt Yield, Cut-off Date LTV and Maturity Date LTV calculations include the related Pari Passu Companion Loan(s). In the case of Loan Nos. 1, 5, 7 and 16, the UW NCF DSCR, UW NOI Debt Yield, Cut-off Date LTV and Maturity Date LTV calculations exclude the related Subordinate Companion Loan(s) and/or related mezzanine loan(s). |
| (2) | With respect to Loan No. 7, the UW NCF DSCR is calculated using the sum of the first 12 whole loan principal and interest payments after the Cut-off Date based on the assumed principal and interest payment schedule set forth in Annex H of the Preliminary Prospectus. |
| (3) | In the case of Loan Nos. 3, 17 and 20, the Cut-off Date LTV and the Maturity Date LTV are calculated by using an appraised value based on certain hypothetical assumptions. Refer to “Description of the Mortgage Pool—Assessments of Property Value and Condition” and “—Appraised Value” in the Preliminary Prospectus for additional details. |
THE INFORMATION IN THIS STRUCTURAL AND COLLATERAL TERM SHEET IS NOT COMPLETE AND MAY BE AMENDED PRIOR TO THE TIME OF SALE. THIS TERM SHEET IS NOT AN OFFER TO SELL THESE SECURITIES AND IT IS NOT A SOLICITATION OF AN OFFER TO BUY THESE SECURITIES IN ANY JURISDICTION WHERE THE OFFER OR SALE IS NOT PERMITTED.
| | 12 of 95 | |
| Structural and Collateral Term Sheet | | JPMDB 2019-COR6 |
| |
| Collateral Characteristics |
| Previous Securitization History(1) |
| No. | Property Name | Cut-off Date Principal
Balance | % of IPB | Location | Property
Type | Previous
Securitization |
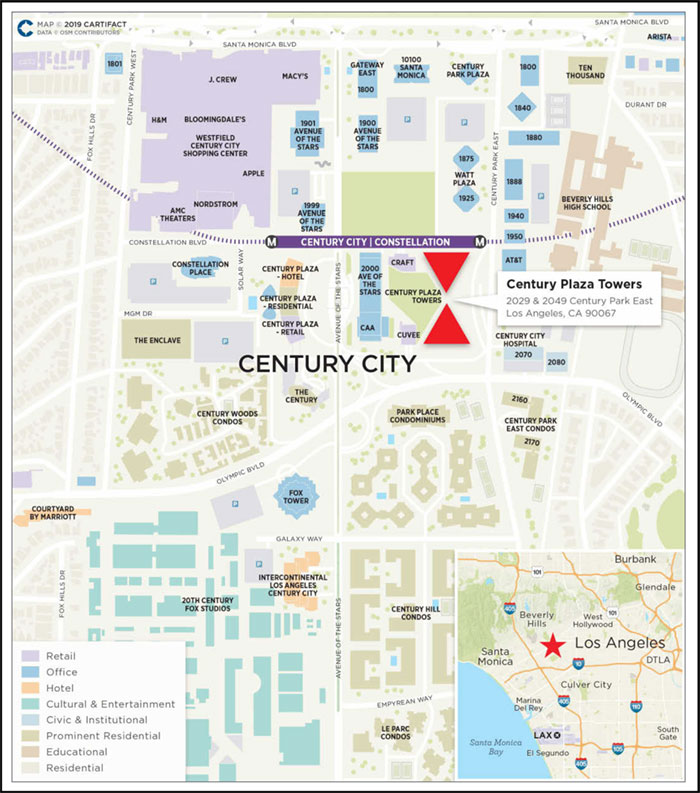
| 1 | Century Plaza Towers | $62,500,000 | 7.7% | Los Angeles, CA | Office | MSC 2014-CPT |
| 10 | Jersey City Group 2 | $32,840,000 | 4.1% | Jersey City, NJ | Multifamily | TRTX 2018-FL1 |
| 12 | Union Heights | $29,600,000 | 3.7% | Sandy, UT | Office | GSMS 2012-GCJ7 |
| 31 | Opus Seaway | $4,000,000 | 0.5% | Everett, WA | Industrial | COMM 2015-PC1 |
| (1) | The table above represents the properties for which the previously existing debt was securitized, based on information provided by the related borrower or obtained through searches of a third-party database. |
THE INFORMATION IN THIS STRUCTURAL AND COLLATERAL TERM SHEET IS NOT COMPLETE AND MAY BE AMENDED PRIOR TO THE TIME OF SALE. THIS TERM SHEET IS NOT AN OFFER TO SELL THESE SECURITIES AND IT IS NOT A SOLICITATION OF AN OFFER TO BUY THESE SECURITIES IN ANY JURISDICTION WHERE THE OFFER OR SALE IS NOT PERMITTED.
| | 13 of 95 | |
| Structural and Collateral Term Sheet | | JPMDB 2019-COR6 |
| |
| Century Plaza Towers |
THE INFORMATION IN THIS STRUCTURAL AND COLLATERAL TERM SHEET IS NOT COMPLETE AND MAY BE AMENDED PRIOR TO THE TIME OF SALE. THIS TERM SHEET IS NOT AN OFFER TO SELL THESE SECURITIES AND IT IS NOT A SOLICITATION OF AN OFFER TO BUY THESE SECURITIES IN ANY JURISDICTION WHERE THE OFFER OR SALE IS NOT PERMITTED.
| | 14 of 95 | |
| Structural and Collateral Term Sheet | | JPMDB 2019-COR6 |
| |
| Century Plaza Towers |
THE INFORMATION IN THIS STRUCTURAL AND COLLATERAL TERM SHEET IS NOT COMPLETE AND MAY BE AMENDED PRIOR TO THE TIME OF SALE. THIS TERM SHEET IS NOT AN OFFER TO SELL THESE SECURITIES AND IT IS NOT A SOLICITATION OF AN OFFER TO BUY THESE SECURITIES IN ANY JURISDICTION WHERE THE OFFER OR SALE IS NOT PERMITTED.
| | 15 of 95 | |
| Structural and Collateral Term Sheet | | JPMDB 2019-COR6 |
| |
| Century Plaza Towers |
THE INFORMATION IN THIS STRUCTURAL AND COLLATERAL TERM SHEET IS NOT COMPLETE AND MAY BE AMENDED PRIOR TO THE TIME OF SALE. THIS TERM SHEET IS NOT AN OFFER TO SELL THESE SECURITIES AND IT IS NOT A SOLICITATION OF AN OFFER TO BUY THESE SECURITIES IN ANY JURISDICTION WHERE THE OFFER OR SALE IS NOT PERMITTED.
| | 16 of 95 | |
| Structural and Collateral Term Sheet | | JPMDB 2019-COR6 |
| |
| Century Plaza Towers |
THE INFORMATION IN THIS STRUCTURAL AND COLLATERAL TERM SHEET IS NOT COMPLETE AND MAY BE AMENDED PRIOR TO THE TIME OF SALE. THIS TERM SHEET IS NOT AN OFFER TO SELL THESE SECURITIES AND IT IS NOT A SOLICITATION OF AN OFFER TO BUY THESE SECURITIES IN ANY JURISDICTION WHERE THE OFFER OR SALE IS NOT PERMITTED.
| | 17 of 95 | |
| Structural and Collateral Term Sheet | | JPMDB 2019-COR6 |
| |
| Century Plaza Towers |
| Mortgage Loan Information | | Property Information |
| Mortgage Loan Seller: | GACC | | Single Asset / Portfolio: | Single Asset |
| Original Principal Balance(1): | $62,500,000 | | Title: | Fee |
| Cut-off Date Principal Balance(1): | $62,500,000 | | Property Type - Subtype: | Office – CBD |
| % of Pool by IPB: | 7.7% | | Net Rentable Area (SF): | 2,401,641 |
| Loan Purpose: | Refinance | | Location: | Los Angeles, CA |
| Borrower: | One Hundred Towers L.L.C. | | Year Built / Renovated: | 1975 / 2015 |
| Sponsors(2): | SPF JVP LLC; Luminance | | Occupancy: | 92.9% |
| | Acquisition Venture LLC | | Occupancy Date: | 10/1/2019 |
| Interest Rate: | 3.00450% | | Number of Tenants: | 122 |
| Note Date: | 10/21/2019 | | 2016 NOI: | $80,783,345 |
| Maturity Date: | 11/9/2029 | | 2017 NOI: | $83,200,132 |
| Interest-only Period: | 120 months | | 2018 NOI: | $89,024,555 |
| Original Term: | 120 months | | TTM NOI (as of 9/2019)(5): | $83,342,918 |
| Original Amortization: | None | | UW Economic Occupancy: | 94.8% |
| Amortization Type: | Interest Only | | UW Revenues: | $158,615,968 |
| Call Protection(3): | Grtr1%orYM(24),Def or | | UW Expenses: | $37,470,212 |
| | Grtr1%orYM(91),O(5) | | UW NOI(5): | $121,145,756 |
| Lockbox / Cash Management: | Hard / Springing | | UW NCF: | $112,250,366 |
| Additional Debt(1): | Yes | | Appraised Value / Per SF: | $2,302,000,000 / $959 |
| Additional Debt Balance(1)(4): | $837,500,000 / $300,000,000 | | Appraisal Date: | 9/24/2019 |
| Additional Debt Type(1)(4): | Pari Passu /Subordinate Debt | | | |
| | | | |
| Escrows and Reserves(6) | | Financial Information(1)(1) |
| | Initial | Monthly | Initial Cap | | | Senior | Whole Loan | |
| Taxes: | $0 | Springing | N/A | | Cut-off Date Loan / SF: | $375 | $500 | |
| Insurance: | $0 | Springing | N/A | | Maturity Date Loan / SF: | $375 | $500 | |
| Replacement Reserves: | $0 | $0 | N/A | | Cut-off Date LTV: | 39.1% | 52.1% | |
| TI/LC: | $0 | $0 | N/A | | Maturity Date LTV: | 39.1% | 52.1% | |
| Other: | $100,769,680 | $0 | N/A | | UW NCF DSCR: | 4.09x | 3.07x | |
| | | | | | UW NOI Debt Yield: | 13.5% | 10.1% | |
| | | | | | | | |
| Sources and Uses |
| Sources | Proceeds | % of Total | | Uses | Proceeds | % of Total |
| Whole Loan | $1,200,000,000 | 100.0% | | Refinance Existing Debt | $823,449,563 | 68.6% |
| | | | | Upfront Reserves | 100,769,680 | 8.4 |
| | | | | Closing Costs | 2,834,724 | 0.2 |
| | | | | Return of Equity | 272,946,032 | 22.7 |
| Total Sources | $1,200,000,000 | 100.0% | | Total Uses | $1,200,000,000 | 100.0% |
| (1) | The Century Plaza Towers Loan (as defined below) consists of the non-controlling Notes A-1-C3 and A-1-C8, which is part of the Century Plaza Towers Whole Loan (as defined below) evidenced by 29 senior pari passu notes and three subordinate notes, with an aggregate outstanding principal balance as of the Cut-off Date of $1.2 billion. For additional information, see “The Loan” herein. |
| (2) | There is no non-recourse carveout guarantor or separate environmental indemnitor with respect to the Century Plaza Towers Whole Loan. |
| (3) | The lockout period, with respect to a defeasance of the Century Plaza Towers Whole Loan, will be at least 24 payment dates beginning with and including the first payment date of December 9, 2019. Defeasance of the full $1.2 billion Century Plaza Towers Whole Loan is permitted after the date that is the earlier of (i) two years from the closing date of the securitization that includes the lastpari passu note to be securitized and (ii) three years from October 21, 2019. Prepayment in whole, but not in part, of the Century Plaza Towers Whole Loan is permitted with the payment of yield maintenance prior to July 9, 2029 at any time. |
| (4) | See “Current Mezzanine or Subordinate Indebtedness” and “Future Mezzanine or Subordinate Indebtedness Permitted” below. |
| (5) | The increase in UW Net Operating Income from TTM TO Underwritten Net Operating Income is primarily attributable to (i) $2,354,778 in straight line rent taken through the earlier of the loan term or the lease term for thirteen tenants, (ii) $3,269,254 of rent steps taken through October 2020 and (iii) new leasing that has been executed since September 2019, accounting for 20.6% of NRA and 24.6% of UW Gross Potential Rent. |
| (6) | For a full description of Escrows and Reserves, please refer to “Escrows and Reserves” below. |
THE INFORMATION IN THIS STRUCTURAL AND COLLATERAL TERM SHEET IS NOT COMPLETE AND MAY BE AMENDED PRIOR TO THE TIME OF SALE. THIS TERM SHEET IS NOT AN OFFER TO SELL THESE SECURITIES AND IT IS NOT A SOLICITATION OF AN OFFER TO BUY THESE SECURITIES IN ANY JURISDICTION WHERE THE OFFER OR SALE IS NOT PERMITTED.
| | 18 of 95 | |
| Structural and Collateral Term Sheet | | JPMDB 2019-COR6 |
| |
| Century Plaza Towers |
The Loan.The Century Plaza Towers mortgage loan (the “Century Plaza Towers Loan”) is part of a whole loan with an aggregate outstanding principal balance as of the Cut-off Date of $1.2 billion (the “Century Plaza Towers Whole Loan”), secured by the borrower’s fee interest in a 2,401,641 square foot, Class A, office property located in the Century City submarket of Los Angeles, California (the “Century Plaza Towers Property”). The Century Plaza Towers Whole Loan is comprised of (i) a senior loan, comprised of 29pari passunotes with an aggregate principal balance as of the Cut-off Date of $900.0 million (the “Century Plaza Towers Senior Notes”), two of which (Notes A-1-C3 and A-1-C8 with an outstanding principal balance as of the Cut-off Date of $62.5 million) are being contributed to the JPMDB 2019-COR6 Trust and constitute the Century Plaza Towers Loan, and the remainder of which are expected to be contributed to one or more future securitization trusts and (ii) a subordinate loan, comprised of three notes, with an outstanding principal balance as of the Cut-off Date of $300.0 million (the “Century Plaza Towers Subordinate Companion Loan”), each as described below. The relationship between the holders of the Century Plaza Towers Senior Notes and Century Plaza Towers Subordinate Companion Loan will be governed by a co-lender agreement as described under“Description of the Mortgage Pool—The Whole Loans—The Non-Serviced AB Whole Loans—The Century Plaza Towers Whole Loan”in the Preliminary Prospectus. The Century Plaza Towers Whole Loan was co-originated by Deutsche Bank AG acting through its New York Branch (which subsequently transferred its notes to DBR Investments Co. Limited (“DBRI”)), Wells Fargo Bank, National Association (“WFBNA”), and Morgan Stanley Bank, N.A (“MSBNA”). The Century Plaza Towers Whole Loan has a 10-year term and is interest only for the length of the loan term.
| Whole Loan Summary |
| Note | Original Balance | Cut-off Date Balance | Note Holder | Controlling Piece |
| A-1-C3, A-1-C8 | $62,500,000 | $62,500,000 | JPMDB 2019-COR6 | No |
| A-1-S1, A-1-S2, A-1-S3, A-2-S1, A-2-S2, A-2-S3, A-2-C1, A-2-C3, A-2-C4 A-3-S1,A-3-S2, A-3-S3, A-3-C1, A-3-C3 | $525,000,000 | $525,000,000 | CPTS 2019-CPT | No |
| A-1-C1, A-1-C2, A-1-C4,A-1-C5, A-1-C6, A-1-C7 | $187,500,000 | $187,500,000 | DBRI | No |
| A-2-C2, A-2-C5, A-2-C6, A-2-C7 | $62,500,000 | $62,500,000 | MSBNA | No |
| A-3-C2, A-3-C4,A-3-C5 | $62,500,000 | $62,500,000 | WFBNA | No |
| Senior Notes | $900,000,000 | $900,000,000 | | |
| B-1, B-2, B-3 | 300,000,000 | 300,000,000 | CPTS 2019-CPT | Yes |
| Total | $1,200,000,000 | $1,200,000,000 | | |
The Borrower. The borrowing entity for the Century Plaza Towers Whole Loan is One Hundred Towers L.L.C., a special purpose entity, structured to be bankruptcy remote with two independent directors in its organizational structure.
The Loan Sponsors.The loan sponsor is a joint venture between (i) the Commingled Pension Trust Fund (Strategic Property) of JPMorgan Chase Bank, N.A. (“SPF”) and (ii) a joint venture between an institutional account managed by both Hines and Hines Investment Management Holdings Limited Partnership (the “Hines JV”) (together with SPF, the “Borrower Sponsor” or “JV”).As of June 30, 2019, SPF had a net asset value of $32.7 billion and a gross asset value of $42.7 billion. Hines JV is a privately owned global real estate investment, development and management firm, founded in 1957, with a presence in 219 cities in 23 countries and $124.3 billion of assets under management—including $63.8 billion for which Hines provides fiduciary investment management services and $60.5 billion for which Hines provides third party property-level services. There is no nonrecourse carveout guarantor or separate environmental indemnitor for the Century Plaza Towers Whole Loan.
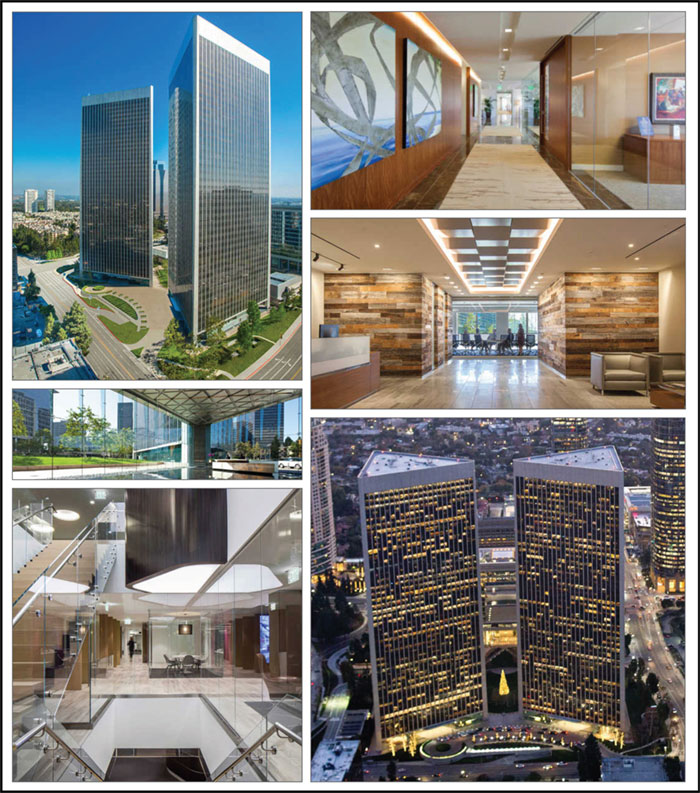
The Property. The Century Plaza Towers Property consists of two Class A, 44-story, trophy, office towers and contains 2,401,641 square feet of office space and a lower level retail concourse. In addition, the Century Plaza Towers Property has an underground garage containing a total of 6,566 parking spaces (of which 5,907 spaces are part of the collateral for the Century Plaza Towers Whole Loan). The Century Plaza Towers Property was originally developed in 1975 for Aluminum Company of America (“Alcoa”) and was designed by Minoru Yamasaki.
The Century Plaza Towers Property includes 26,000 square feet column-free flexible floor plates. The Century Plaza Towers Property underwent an $80.0 million renovation in 2008 and has had approximately $48.0 million of capital expenditures invested since 2014, including a multi-year program currently underway to fully renovate all restrooms, multi-tenant corridors, and elevator lobbies; nearly $28.0 million has been invested since 2015. Together with the property located at 2000 Avenue of the Stars (which is also owned by the loan sponsor), the Century Plaza Towers Property is part of Century Park, a 14-acre campus that includes a four-acre central park, restaurants, cafes, and other amenity retail.
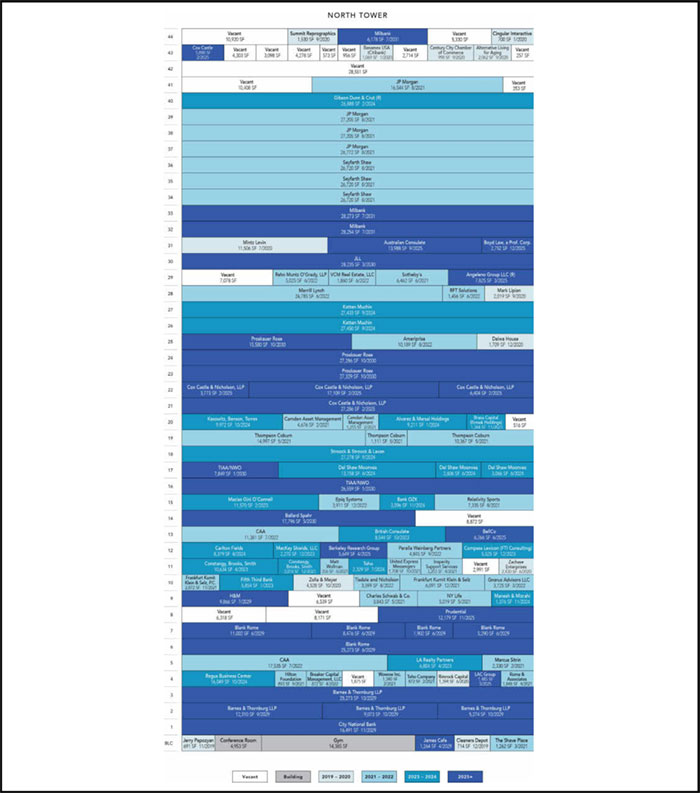
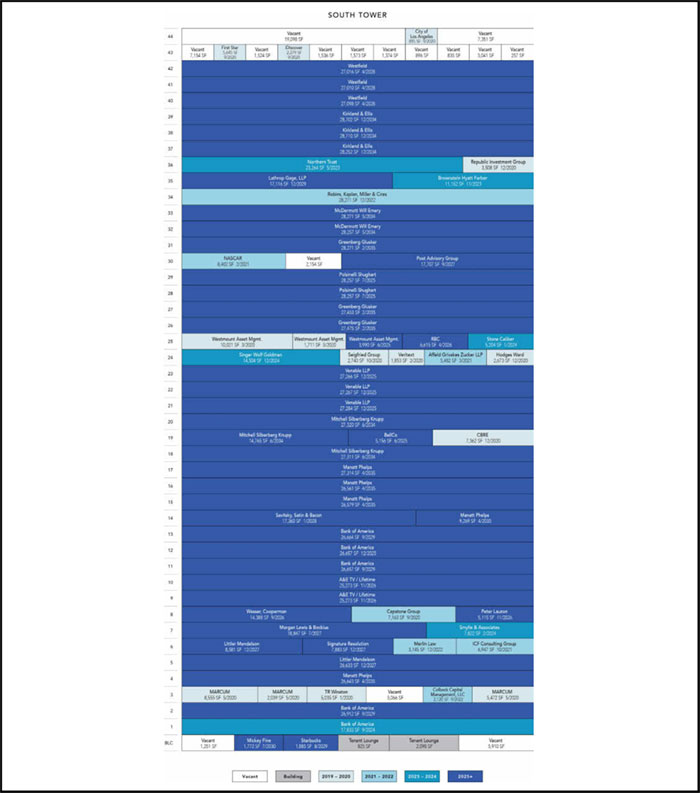
The Property is 92.9% leased as of October 1, 2019 to 122 distinct tenants across approximately 1.2 million square feet of office space in the North Tower, approximately 1.2 million square feet of office space in the South Tower and approximately 39,500 square feet of ground floor retail space. The largest tenants include Bank of America (6.2% of NRA / 6.5% of GPR / $56.98 Gross PSF / rated A2/A+/A- by Moody’s, Fitch and S&P), Manatt Phelps (4.8% of NRA / 5.5% of GPR / $62.26 Gross PSF / #105 in a magazine ranking of large law firms based on gross revenue), JPMorgan (4.1% of NRA / 4.2% of GPR / $57.00 Gross PSF / rated A2/AA-/A- by Moody’s, Fitch and S&P), Kirkland & Ellis (3.6% of NRA / 4.5% of GPR / $68.79 Gross PSF / #1 in a magazine ranking of large law firms based on gross revenue) and Greenberg Glusker (3.5% of NRA / 4.2% of GPR / $66.00 Gross PSF).
THE INFORMATION IN THIS STRUCTURAL AND COLLATERAL TERM SHEET IS NOT COMPLETE AND MAY BE AMENDED PRIOR TO THE TIME OF SALE. THIS TERM SHEET IS NOT AN OFFER TO SELL THESE SECURITIES AND IT IS NOT A SOLICITATION OF AN OFFER TO BUY THESE SECURITIES IN ANY JURISDICTION WHERE THE OFFER OR SALE IS NOT PERMITTED.
| | 19 of 95 | |
| Structural and Collateral Term Sheet | | JPMDB 2019-COR6 |
| |
| Century Plaza Towers |
The largest tenant, Bank of America (149,508 square feet; 6.2% of net rentable area; 6.5% of Underwritten Base Rent) is an investment and retail banking institution and financial services company based in Charlotte, North Carolina. It is the second largest banking institution in the United States by total assets. The institution’s corporate and investment banking division operates under the name Bank of America Merrill Lynch. Bank of America occupies four suites in the south tower on the 1st, 2nd, 11th and 12th floors totaling 98,059 square feet. Bank of America has signed a lease for an additional 26,664 square feet on the 13th floor of the South Tower and is expected to begin paying rent and take occupancy in January 2020. Merrill Lynch occupies one suite in the North Tower totaling 24,785 square feet. The firm pays approximately $54 to $61 of gross rent per square foot across the North and South Towers. Bank of America has been at the Century Plaza Towers Property since 1994. With respect to the additional space in the South Tower, we cannot assure you that Bank of America will begin paying rent or take occupancy as expected or at all.
The second largest tenant, Manatt Phelps (116,366 square feet; 4.8% of net rentable area; 5.5% of Underwritten Base Rent) is a Los Angeles-based law firm that has practices focused on banking, entertainment, media, technology, retail and consumer products, and real estate and energy. Founded in 1965, Manatt Phelps employs over 450 attorneys across Los Angeles, New York, Palo Alto, San Francisco, Orange County, Chicago, Washington, D.C. and Boston. The firm is ranked #105 in the 2019 Am Law rankings. Manatt Phelps has signed a lease for five suites in the South Tower on the 4th, 14th, 15th, 16th and 17th floors totaling 116,366 square feet and is expected to begin paying rent and take occupancy in stages starting in March 2020, with full occupancy of the space expected by May 2020. Manatt Phelps’s contractual rent under its lease is $62 gross rent per square foot. We cannot assure you that Manatt Phelps will begin paying rent or take occupancy as expected or at all.
The third largest tenant, JPMorgan (97,726 square feet; 4.1% of net rentable area; 4.2% of GPR) was founded in 1871, JPMorgan (NYSE: JPM) is a commercial, investment and retail banking institution founded by J.P. Morgan. Headquartered in New York City, JPMorgan is the largest bank in the United States. JPMorgan is affiliated with the borrower. JPMorgan occupies four suites in the North Tower on the 37th, 38th, 39th and 41st floors totaling 97,726 square feet and pays $57 gross rent per square foot. JPMorgan has been at the Century Plaza Towers Property since 2011.
The Century Plaza Towers Property is located in the Century City submarket of West Los Angeles, California. Situated between Beverly Hills to the east, Westwood, Brentwood, and Santa Monica to the west, and the residential neighborhoods of Bel Air, Holmby Hills, and Hollywood Hills to the north, Century City is located near the Westside’s amenities and housing communities. The Century Plaza Towers Property has access to the Santa Monica (I-10) and San Diego (I-405) Freeways and several additional major east-west thoroughfares including Santa Monica Boulevard and Olympic Boulevard.
Prior to the economic downturn in 2007-2008, vacancy rates in the Century City submarket declined to single digits, and reached an historical low direct vacancy rate of 7.1% in 2006. As the economic downturn affected the area, vacancy rates began to increase to 14.4% in 2010. As of year-end 2017, direct vacancy in the Century City submarket declined slightly to 8.2%, representing a 3.6% decrease since 2015. As of the second quarter in 2019, the direct vacancy rate was 6.1%, 80 basis points lower than year-end 2018 (6.9%).
The appraisal identified six directly competitive office sales comparables in the Los Angeles market. Comparable buildings were built between 1925 and 2017 and range in size from 201,922 square feet to 1,006,645 square feet. The weighted average occupancy of the sales comparables was 82.8% and the weighted average sales price per square foot was approximately $830.23. Through the first half of 2019, asking rates increased slightly by 1.1% to $52.72 per square foot.
| Historical and Current Occupancy |
| 2016(1) | 2017(1) | 2018(1) | Current(2) |
| 87.0% | 84.6% | 83.5% | 92.9% |
| (1) | Historical occupancy is as of December 31. |
| (2) | Current Occupancy is as of October 1, 2019. This is inclusive of tenants that have signed a lease but are not in physical occupancy yet. |
THE INFORMATION IN THIS STRUCTURAL AND COLLATERAL TERM SHEET IS NOT COMPLETE AND MAY BE AMENDED PRIOR TO THE TIME OF SALE. THIS TERM SHEET IS NOT AN OFFER TO SELL THESE SECURITIES AND IT IS NOT A SOLICITATION OF AN OFFER TO BUY THESE SECURITIES IN ANY JURISDICTION WHERE THE OFFER OR SALE IS NOT PERMITTED.
| | 20 of 95 | |
| Structural and Collateral Term Sheet | | JPMDB 2019-COR6 |
| |
| Century Plaza Towers |
| Tenant Summary(1) |
| Tenant | Ratings
Moody’s/Fitch/S&P(2) | Net Rentable Area
(SF) | % of
Total NRA | Base Rent
PSF(3) | % of Total
Base Rent | Lease
Expiration Date |
| Bank of America(2)(3) | A2 / A+ / A- | 149,508 | | 6.2% | $56.98 | 6.5% | Various(3) |
| Manatt Phelps(4) | NR / NR / NR | 116,366 | | 4.8 | $62.26 | 5.5 | 4/30/2035 |
| JPMorgan | A2 / AA- / A- | 97,726 | | 4.1 | $57.00 | 4.2 | 8/31/2021 |
| Kirkland & Ellis(5) | NR / NR / NR | 85,664 | | 3.6 | $68.79 | 4.5 | 12/31/2034 |
| Greenberg Glusker(6 | NR / NR / NR | 83,199 | | 3.5 | $66.00 | 4.2 | 2/28/2035 |
| Venable LLP | NR / NR / NR | 81,817 | | 3.4 | $57.70 | 3.6 | 12/31/2025 |
| Westfield(7) | NR / NR / A | 81,124 | | 3.4 | $52.30 | 3.2 | 4/30/2028 |
| Seyfarth Shaw | NR / NR / NR | 80,160 | | 3.3 | $78.51 | 4.8 | 8/31/2021 |
| Proskauer Rose(8) | NR / NR / NR | 70,195 | | 2.9 | $57.26 | 3.1 | 10/31/2030 |
| Mitchell Silberberg Knupp(9) | NR / NR / NR | 69,396 | | 2.9 | $56.40 | 3.0 | 6/30/2034 |
| Ten Largest Tenants | | 915,155 | | 38.1% | $61.09 | 42.6% | |
| Remaining Tenants | | 1,315,465 | | 54.8 | $57.21 | 57.4% | |
| Vacant | | 171,021 | | 7.1 | | | |
| Total | | 2,401,641 | | 100.0% | | | |
| (1) | Based on the October 1, 2019 rent roll. |
| (2) | The square feet of Bank of America includes 124,723 square feet occupied by Bank or America on floors 1 through 14 and 24,785 square feet occupied by Merrill Lynch on floors 25 through 33. In addition, the square feet for Bank of America includes 26,664 square feet, as to which Bank of America is expected to begin paying rent and take occupancy in January 2020. |
| (3) | Bank of America has various lease expiration dates: (i) 106,890 square feet with a lease expiration date of September 30, 2029, (ii) 17,833 square feet with a lease expiration date of September 30, 2024 and (iii) 24,785 square feet related to the Merrill Lynch space, with a lease expiration date of June 30, 2022. |
| (4) | Manatt Phelps is expected to begin paying rent and take occupancy in stages in March 2020, with full occupancy of the space expected in May 2020. |
| (5) | Kirkland & Ellis is expected to begin paying rent and take occupancy in January 2020. |
| (6) | Greenberg Glusker shall have the one-time right to terminate its lease as of March 1, 2032 upon written notice on or before March 1, 2031 and the payment of a termination fee. |
| (7) | Westfield has a one-time right to terminate its lease on April 30, 2025, with 15 months’ prior notice and the payment of a termination fee of approximately $3.5 million. |
| (8) | Proskauer Rose has a one-time right to terminate its lease on October 31, 2025, upon written notice on or before October 31, 2024 and the payment of a termination fee. |
| (9) | Mitchell Silberberg Knupp has a one-time right to terminate its lease on June 30, 2029, upon written notice on or before June 30, 2028 and the payment of a termination fee. |
| Lease Rollover Schedule(1)(2) |
| Year | Number of Leases Expiring | Net Rentable Area Expiring | % of NRA Expiring | Base Rent Expiring | % of Base Rent Expiring | Cumulative Net Rentable Area Expiring | Cumulative % of NRA Expiring | Cumulative
Base Rent
Expiring | Cumulative
% of Base
Rent
Expiring |
| Vacant | NAP | 171,021 | 7.1% | NAP | NAP | 171,021 | 7.1% | NAP | NAP |
| MTM & 2019 | 2 | 1,405 | 0.1% | $45,653 | 0.0% | 172,426 | 7.2% | $45,653 | 0.0% |
| 2020 | 26 | 96,896 | 4.0% | $4,857,092 | 3.7% | 269,322 | 11.2% | $4,902,745 | 3.7% |
| 2021 | 30 | 276,557 | 11.5% | $17,553,318 | 13.4% | 545,879 | 22.7% | $22,456,063 | 17.1% |
| 2022 | 15 | 122,719 | 5.1% | $7,206,505 | 5.5% | 668,598 | 27.8% | $29,662,568 | 22.6% |
| 2023 | 14 | 89,979 | 3.7% | $5,073,213 | 3.9% | 758,577 | 31.6% | $34,735,781 | 26.5% |
| 2024 | 18 | 224,254 | 9.3% | $13,455,101 | 10.3% | 982,831 | 40.9% | $48,190,882 | 36.7% |
| 2025 | 19 | 258,081 | 10.7% | $14,826,378 | 11.3% | 1,240,912 | 51.7% | $63,017,260 | 48.0% |
| 2026 | 5 | 76,664 | 3.2% | $4,565,856 | 3.5% | 1,317,576 | 54.9% | $67,583,116 | 51.5% |
| 2027 | 5 | 79,651 | 3.3% | $4,654,199 | 3.5% | 1,397,227 | 58.2% | $72,237,315 | 55.1% |
| 2028 | 4 | 98,484 | 4.1% | $5,249,665 | 4.0% | 1,495,711 | 62.3% | $77,486,980 | 59.1% |
| 2029 | 18 | 257,405 | 10.7% | $14,489,056 | 11.0% | 1,753,116 | 73.0% | $91,976,035 | 70.1% |
| 2030 and Thereafter(3) | 27 | 648,525 | 27.0% | 39,193,695 | 29.9% | 2,401,641 | 100.0% | $131,169,730 | 100.0% |
| Total | 183 | 2,401,641 | 100.0% | $131,169,730 | 100.0% | | | | |
| (1) | Based on the underwritten rent roll dated October 1, 2019. |
| (2) | Certain tenants may have termination or contraction options (which may become exercisable prior to the originally stated expiration date of the tenant lease) that are not considered in the above Lease Rollover Schedule. |
| (3) | 2030 and Thereafter is inclusive of 22,261 square feet of amenity space. |
THE INFORMATION IN THIS STRUCTURAL AND COLLATERAL TERM SHEET IS NOT COMPLETE AND MAY BE AMENDED PRIOR TO THE TIME OF SALE. THIS TERM SHEET IS NOT AN OFFER TO SELL THESE SECURITIES AND IT IS NOT A SOLICITATION OF AN OFFER TO BUY THESE SECURITIES IN ANY JURISDICTION WHERE THE OFFER OR SALE IS NOT PERMITTED.
| | 21 of 95 | |
| Structural and Collateral Term Sheet | | JPMDB 2019-COR6 |
| |
| Century Plaza Towers |
Operating History and Underwritten Net Cash Flow |
| | 2016 | 2017 | 2018 | TTM(1) | Underwritten | Per Square
Foot | %(2) |
| Rents in Place | $93,728,374 | $96,736,098 | $101,042,428 | $97,138,295 | $131,169,730 | $54.62 | 78.4% |
| Vacant Income | 0 | 0 | 0 | 0 | 14,339,776 | 5.97 | 8.6% |
| Gross Potential Rent | $93,728,374 | $96,736,098 | $101,042,428 | $97,138,295 | $145,509,506 | $60.59 | 87.0% |
| Total Reimbursements | 2,366,196 | 3,084,229 | 4,320,460 | 4,341,561 | 3,618,229 | 1.51 | 2.2% |
| Parking | 15,328,900 | 14,885,609 | 14,507,607 | 14,942,509 | 14,942,509 | 6.22 | 8.9% |
| Other Income(3) | 2,516,128 | 2,673,150 | 5,446,950 | 4,468,294 | 3,261,468 | 1.36 | 1.9% |
| Net Rental Income | $113,939,598 | $117,379,086 | $125,317,445 | $120,890,660 | $167,331,712 | $69.67 | 100.0% |
| (Vacancy/Credit Loss) | 0 | 0 | 0 | 0 | (8,715,744) | (3.63) | (5.2)% |
| Effective Gross Income | $113,939,597 | $117,379,087 | $125,317,446 | $120,890,660 | $158,615,968 | $66.04 | 94.8% |
| | | | | | | | |
| Total Expenses | $33,156,253 | $34,178,955 | $36,292,891 | $37,547,742 | $37,470,212 | $15.60 | 23.6% |
| | | | | | | | |
| Net Operating Income(4) | $80,783,345 | $83,200,132 | $89,024,555 | $83,342,918 | $121,145,756 | $50.44 | 76.4% |
| | | | | | | | |
| Total TI/LC, Capex/RR | 0 | 0 | 0 | 0 | 8,895,390 | 3.70 | 5.6% |
| Net Cash Flow | $80,783,345 | $83,200,132 | $89,024,555 | $83,342,918 | $112,250,366 | $46.74 | 70.8% |
| (1) | TTM column represents the trailing 12-month period ending on September 30, 2019. |
| (2) | % column represents percent of Net Rental Income for all revenue lines and represents percent of Effective Gross Income for the remainder of fields. |
| (3) | Other Income includes after-hours HVAC income, fitness center income, tenant services income, storage income, telecom & roof income, filming & events income, retail percentage rent income and a termination fee. |
| (4) | The main cause of the increase between TTM September 2019 Net Operating Income and Underwritten and Outstanding Net Operating Income is new leases that have been executed since September 2019, accounting for 20.6% of NRA and 24.6% of UW Gross Potential Revenue. |
Property Management. The Century Plaza Towers Property is managed byCBRE, Inc.
Escrows and Reserves.At origination, the borrower deposited (i) approximately $71,223,945 into a TI/LC reserve for outstanding landlord work and tenant allowances and (ii) $29,545,735 into a free rent reserve.
Tax Escrows– During a Trigger Period (as defined below),the borrower is required to deposit into a real estate tax reserve, on a monthly basis, 1/12 of the estimated annual real estate taxes.
Insurance Escrows –Insurance escrows are waived so long as (i) no event of default has occurred and is continuing and (ii) the Century Plaza Towers Property is covered by an acceptable blanket policy (which is currently maintained). If such condition is no longer satisfied, on each payment date, the borrowers will be required to fund an insurance reserve in an amount equal to 1/12 of the amount that the lender estimates will be necessary to pay the annual insurance premiums.
Lockbox / Cash Management. The Century Plaza Towers Whole Loan is structured with a hard lockbox and will have springing cash management during a Trigger Period. At origination, a clearing account controlled by the lender (the “Clearing Account”) was established by the borrower, into which all rents, revenues and receipts from the Century Plaza Towers Property are required to be deposited directly by the tenant (with respect to rents). If no Trigger Period (as defined below) exists, the funds in the Clearing Account are required to be swept on each business day into the borrower’s operating account and, if a Trigger Period exists, such funds are required to be swept on each business day into a cash management account controlled by the lender (the “CMA”) at a financial institution selected by the lender.
During a Trigger Period, all amounts on deposit in the CMA will be applied to the payment of all monthly amounts due under the Century Plaza Towers Whole Loan documents (including, without limitation, monthly deposits for reserves for taxes and insurance (unless an acceptable blanket policy is in place with regards to insurance), debt service and all other required reserves) and all property costs and expenses set forth in the lender-approved budget. Any funds remaining thereafter will be transferred to a cash collateral account, as additional collateral for the Century Plaza Towers Whole Loan. Under certain circumstances and for limited purposes described in the Century Plaza Towers Whole Loan documents, the borrower may request disbursements of such excess cash flow.
A “Trigger Period” will be continuing during any period when there exists (i) an uncured event of default under the Century Plaza Towers Whole Loan or under a mezzanine loan (one is incurred as described further below) or (ii) a Low Debt Yield Trigger (as defined below).
A “Low Debt Yield Trigger” will occur if the aggregate debt yield on the Whole Loan and any mezzanine loan is less than 5.0% at the end of two consecutive calendar quarters. A Low Debt Yield Trigger will cease to exist if such combined debt yield exceeds 5.0% at the end of any two consecutive calendar quarters. The debt yield may be tested by the lender quarterly.
THE INFORMATION IN THIS STRUCTURAL AND COLLATERAL TERM SHEET IS NOT COMPLETE AND MAY BE AMENDED PRIOR TO THE TIME OF SALE. THIS TERM SHEET IS NOT AN OFFER TO SELL THESE SECURITIES AND IT IS NOT A SOLICITATION OF AN OFFER TO BUY THESE SECURITIES IN ANY JURISDICTION WHERE THE OFFER OR SALE IS NOT PERMITTED.
| | 22 of 95 | |
| Structural and Collateral Term Sheet | | JPMDB 2019-COR6 |
| |
| Century Plaza Towers |
Current Mezzanine or Subordinate Indebtedness.The Century Plaza Towers Subordinate Companion Loan has an outstanding principal balance as of the Cut-off Date of $300.0 million, accrue interest at a fixed rate of 3.00450%per annum, has a 120-month term and is interest only for the full term. For additional information, see“Description of the Mortgage Pool—The Whole Loans—The Non-Serviced AB Whole Loans—The Century Plaza Towers Whole Loan”in the Preliminary Prospectus.
Future Mezzanine or Subordinate Indebtedness Permitted.The borrower will have a one-time right to cause its owners to incur a mezzanine loan, provided, among other conditions: (i) the aggregate loan-to-value ratio of the Century Plaza Towers Whole Loan and the mezzanine loan is equal to or less than 52.1% (or if a partial prepayment of the Century Plaza Towers Whole Loan has occurred in connection with a conversion, 51.1%), (ii) the aggregate debt service coverage ratio of the Century Plaza Towers Whole Loan and the mezzanine loan is equal to or greater than 3.12x (or if a partial prepayment of the Century Plaza Towers Whole Loan has occurred in connection with a conversion, 3.18x), (iii) the aggregate debt yield of the Century Plaza Towers Whole Loan and the mezzanine loan is equal to or greater than 9.5% (or if a partial prepayment of the Century Plaza Towers Whole Loan has occurred in connection with a conversion, 9.7%), (iv) the mezzanine loan is coterminous with the Century Plaza Towers Whole Loan and (v) entry into a customary intercreditor agreement acceptable to the lender and each rating agency rating securities backed by a portion of the Century Plaza Towers Whole Loan.
Partial Release.None.
Transfer of Development Credits. With respect to the Century Plaza Towers Whole Loan, if no event of default is continuing, the borrower has the right to convert the windowless top two floors (43rd and 44th floors) of each of the two towers comprising the Century Plaza Towers Property (the “Conversion Space”) into non-occupiable space and to transfer the development credits associated with the Conversion Space in connection with the anticipated commencement of the construction of an additional building at the adjacent 2000 Avenue of the Stars parcel owned by an affiliate of the borrower or to a third party in connection with a sale of the 2000 Avenue of the Stars parcel to a third party (the “Century Plaza Towers Conversion and Transfer”), provided that the borrower satisfies certain conditions set forth in the Century Plaza Towers Whole Loan documents, including, among others, (A) such Century Plaza Towers Conversion and Transfer is not reasonably expected to have a material adverse effect on the Century Plaza Towers Property and is on terms and conditions that are commercially reasonable and at arm’s length, (B) the borrower either (1) prepays the Century Plaza Towers Whole Loan in the amount of (i) $30,000,000, plus (ii) if prior to the open prepayment date, a prepayment premium (the “Prepayment Premium”) equal to the greater of 1.00% or the yield maintenance premium on the amount prepaid (the “Conversion Prepayment Amount”) or (2) if the transfer of the development rights is to an affiliate of the borrower, the borrower deposits with the lender cash or a letter of credit as collateral for the Century Plaza Towers Whole Loan in the amount of (i) $30,000,000, plus (ii) 105% of the Prepayment Premium that would be due if the prepayment were made as of such date and (C) the Century Plaza Towers Conversion and Transfer complies with any REMIC requirements. If the borrower transfers the development rights to an affiliate and deposits cash or a letter of credit as collateral for the Century Plaza Towers Whole Loan, the borrower may return the development rights to the borrower along with the delivery of a clean date down endorsement to the lender, in which case the lender is required to return the cash or letter of credit (as applicable) to the borrower. If the borrower’s affiliate is granted a permit to begin work on the proposed project at the 2000 Avenue of the Stars parcel or if such permit is not granted within five years after transfer of the development credits and the development credits have not been transferred back to the borrower as described above, then the borrower is required to promptly prepay the outstanding principal balance of the Century Plaza Towers Whole Loan in an amount equal to the Conversion Prepayment Amount (with any cash deposit applied to such prepayment, provided that the borrower must promptly pay the lender any difference between such cash deposit and the Conversion Prepayment Amount).
THE INFORMATION IN THIS STRUCTURAL AND COLLATERAL TERM SHEET IS NOT COMPLETE AND MAY BE AMENDED PRIOR TO THE TIME OF SALE. THIS TERM SHEET IS NOT AN OFFER TO SELL THESE SECURITIES AND IT IS NOT A SOLICITATION OF AN OFFER TO BUY THESE SECURITIES IN ANY JURISDICTION WHERE THE OFFER OR SALE IS NOT PERMITTED.
| | 23 of 95 | |
| Structural and Collateral Term Sheet | | JPMDB 2019-COR6 |
| |
| Los Angeles Leased Fee Portfolio |
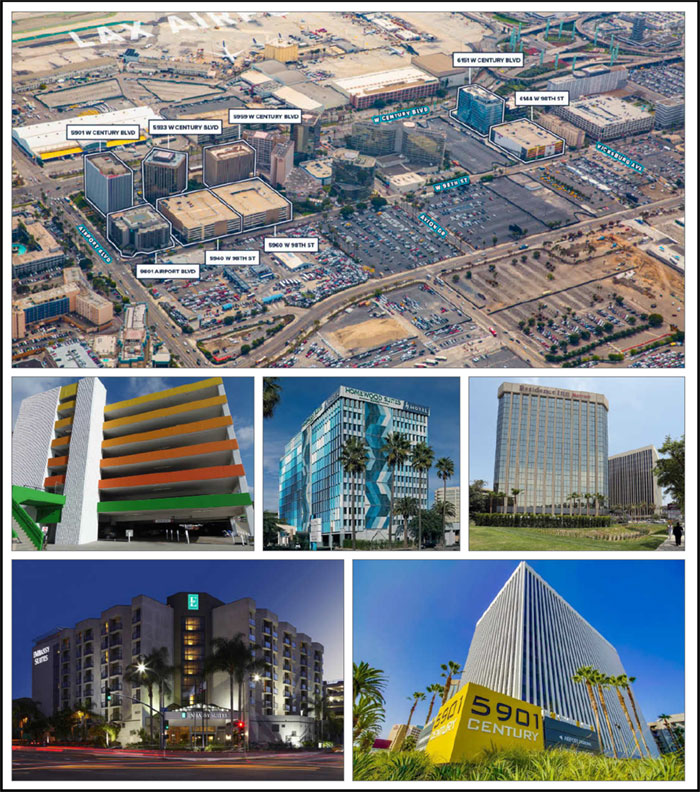
THE INFORMATION IN THIS STRUCTURAL AND COLLATERAL TERM SHEET IS NOT COMPLETE AND MAY BE AMENDED PRIOR TO THE TIME OF SALE. THIS TERM SHEET IS NOT AN OFFER TO SELL THESE SECURITIES AND IT IS NOT A SOLICITATION OF AN OFFER TO BUY THESE SECURITIES IN ANY JURISDICTION WHERE THE OFFER OR SALE IS NOT PERMITTED.
| | 24 of 95 | |
| Structural and Collateral Term Sheet | | JPMDB 2019-COR6 |
| |
| Los Angeles Leased Fee Portfolio |
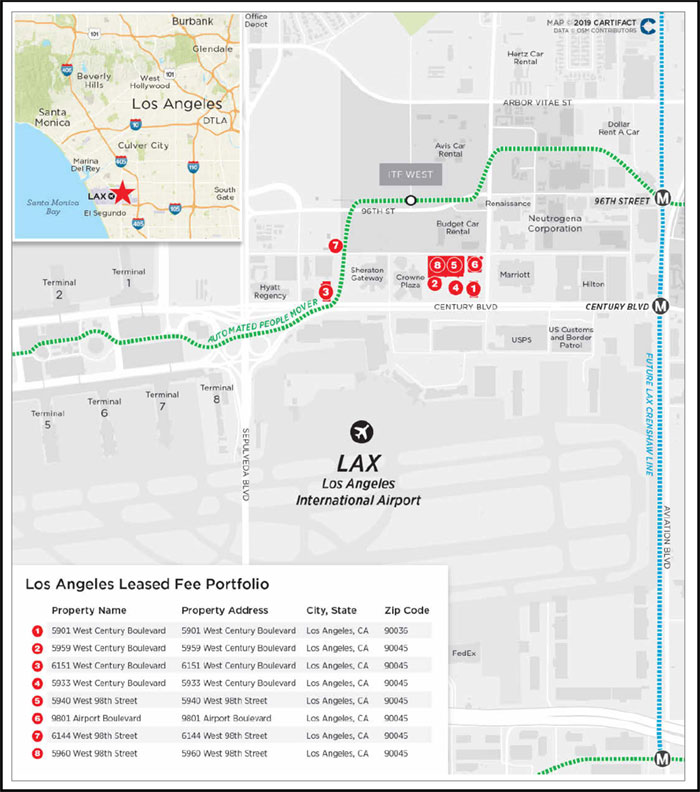
THE INFORMATION IN THIS STRUCTURAL AND COLLATERAL TERM SHEET IS NOT COMPLETE AND MAY BE AMENDED PRIOR TO THE TIME OF SALE. THIS TERM SHEET IS NOT AN OFFER TO SELL THESE SECURITIES AND IT IS NOT A SOLICITATION OF AN OFFER TO BUY THESE SECURITIES IN ANY JURISDICTION WHERE THE OFFER OR SALE IS NOT PERMITTED.
| | 25 of 95 | |
| Structural and Collateral Term Sheet | | JPMDB 2019-COR6 |
| |
| Los Angeles Leased Fee Portfolio |
| Mortgage Loan Information | | Property Information |
| Mortgage Loan Seller: | LCM | | Single Asset / Portfolio: | Portfolio |
| Original Principal Balance(1): | $61,000,000 | | Title: | Fee |
| Cut-off Date Principal Balance(1): | $61,000,000 | | Property Type - Subtype: | Other – Leased Fee |
| % of Pool by IPB: | 7.6% | | Net Rentable Area (SF): | 556,202 |
| Loan Purpose: | Refinance | | Location: | Los Angeles, CA |
| Borrower: | KOAR Airport Associates, LLC | | Year Built / Renovated: | N/A / N/A |
| Sponsor: | Paul Alanis, Cofinance, Inc. | | Occupancy: | 100.0% |
| Interest Rate: | 3.50000% | | Occupancy Date: | 11/6/2019 |
| Note Date: | 8/28/2019 | | Number of Tenants: | N/A |
| Maturity Date: | 9/6/2029 | | 2016 NOI(3): | N/A |
| Interest-only Period: | 120 months | | 2017 NOI: | $3,636,860 |
| Original Term: | 120 months | | 2018 NOI: | $3,972,571 |
| Original Amortization: | None | | TTM NOI (as of 6/2019)(4): | $4,160,964 |
| Amortization Type: | Interest Only | | UW Economic Occupancy: | N/A |
| Call Protection: | L(26),Def(90),O(4) | | UW Revenues: | $5,267,904 |
| Lockbox / Cash Management: | Hard / Springing | | UW Expenses: | $0 |
| Additional Debt(1)(2): | Yes | | UW NOI(4): | $5,267,904 |
| Additional Debt Balance(1)(2): | $24,000,000 | | UW NCF: | $5,267,904 |
| Additional Debt Type(1)(2): | Pari Passu | | Appraised Value / Per SF: | $134,900,000 / $243 |
| | | | Appraisal Date: | 7/4/2019 |
| | | | | |
| Escrows and Reserves(5) | | Financial Information(1) |
| | Initial | Monthly | Initial Cap | | Cut-off Date Loan / SF: | $153 | |
| Taxes: | $0 | Springing | N/A | | Maturity Date Loan / SF: | $153 | |
| Insurance: | $0 | Springing | N/A | | Cut-off Date LTV: | | 63.0% | |
| Replacement Reserves: | $0 | $0 | N/A | | Maturity Date LTV: | | 63.0% | |
| TI/LC: | $0 | $0 | N/A | | UW NCF DSCR: | | 1.75x | |
| Other | $0 | $0 | N/A | | UW NOI Debt Yield: | | 6.2% | |
| | | | | | | | |
| | | | | | | | |
|
| Sources and Uses |
| Sources | Proceeds | % of Total | | Uses | Proceeds | % of Total |
| Whole Loan(1) | $85,000,000 | 100.0% | | Payoff Existing Debt | $47,446,775 | 55.8% |
| | | % | | Closing Costs | 1,121,154 | 1.3 |
| | | | | Return of Equity | 36,432,070 | 42.9 |
| Total Sources | $85,000,000 | 100.0% | | Total Uses | $85,000,000 | 100.0% |
| | | | | | | | | | | | | | | | | |
| (1) | The Los Angeles Leased Fee Portfolio Loan (as defined below) is part of a whole loan evidence by twopari passu notes, with an aggregate outstanding principal balance as of the Cut-off Date of $85.0 million. The Financial Information presented in the chart above reflects the Cut-off Date Balance of the $85.0 million Los Angeles Leased Fee Portfolio Whole Loan (as defined below). |
| (2) | The lockout period will be at least 26 payment dates beginning with and including the first payment date of October 6, 2019. Defeasance of the full Los Angeles Leased Fee Portfolio Whole Loan is permitted after the date that is the earlier to occur of the payment date that is (i) two years after the closing date of the securitization that includes the last pari passu note to be securitized and (ii) September 6, 2022. The assumed lockout period of 26 payments is based on the expected JPMDB 2019-COR6 securitization closing date in November 2019. The actual lockout period may be longer. |
| (3) | 2016 NOI is not available as the Los Angeles Leased Fee Portfolio (as defined below) ground leases commenced at various dates in 2016. |
| (4) | The increase from TTM NOI to UW NOI is attributable to approximately $950,940 of underwritten average ground rent over loan term. |
| (5) | For a full description of Escrows and Reserves, please refer to“Escrows and Reserves”below. |
THE INFORMATION IN THIS STRUCTURAL AND COLLATERAL TERM SHEET IS NOT COMPLETE AND MAY BE AMENDED PRIOR TO THE TIME OF SALE. THIS TERM SHEET IS NOT AN OFFER TO SELL THESE SECURITIES AND IT IS NOT A SOLICITATION OF AN OFFER TO BUY THESE SECURITIES IN ANY JURISDICTION WHERE THE OFFER OR SALE IS NOT PERMITTED.
| | 26 of 95 | |
| Structural and Collateral Term Sheet | | JPMDB 2019-COR6 |
| |
| Los Angeles Leased Fee Portfolio |
The Loan.The Los Angeles Leased Fee Portfolio loan, with a principal balance of $61.0 million as of the Cut-off Date (the “Los Angeles Leased Fee Portfolio Loan”), is secured by a first priority fee simple mortgage encumbering the land beneath four hotel properties, three parking structures and one office property, all of which land is encumbered by eight separate, cross-collateralized and cross-defaulted, absolute triple net (“NNN”) ground leases totaling 556,202 square feet of land located adjacent to the Los Angeles International Airport (“LAX”) in Los Angeles, California, (collectively, the “Los Angeles Leased Fee Portfolio Properties” or the “Los Angeles Leased Fee Portfolio”). The Los Angeles Leased Fee Portfolio Loan is part of a whole loan that has an aggregate outstanding principal balance as of the Cut-off Date of $85.0 million (the “Los Angeles Leased Fee Portfolio Whole Loan”) and is comprised of twopari passu notes, each as described in the “Whole Loan Summary” chart below. The controlling Note A-1, with an outstanding principal balance as of the Cut-off Date of $61.0 million, is being contributed to the JPMDB 2019-COR6 Trust. The non-controlling Note A-2, with an outstanding principal balance as of the Cut-off Date of $24.0 million is held by LCM or an affiliate and expected to be contributed to one or more future securitizations or may otherwise be transferred at any time. The relationship between the holders of the Los Angeles Leased Fee Portfolio Whole Loan will be governed by a co-lender agreement as described under “Description of the Mortgage Pool—The Whole Loans—The Serviced Pari Passu Whole Loans” in the Preliminary Prospectus. The Los Angeles Leased Fee Portfolio Loan has a 10-year term and will be interest only for the entire term.The most recent prior financing of theLos Angeles Leased Fee PortfolioProperties was not included in a securitization.
| Whole Loan Summary |
| Note | Original Balance | Cut-off Date Balance | Note Holder | Controlling Piece |
| A-1 | $61,000,000 | $61,000,000 | JPMDB 2019-COR6 | Yes |
| A-2 | 24,000,000 | 24,000,000 | LCM | No |
| Total | $85,000,000 | $85,000,000 | | |
The Borrower. The borrowing entity is KOAR Airport Associates, LLC, a Delaware limited liability company and special purpose entity structured to be bankruptcy remote with two independent directors. Legal counsel to the borrowers delivered a non-consolidation opinion in connection with the origination of the Los Angeles Leased Fee Portfolio Loan.
The Loan Sponsors.The loan sponsors and nonrecourse carve-out guarantors are Paul Alanis and Cofinance, Inc., on a joint and several basis. Mr. Alanis is a principal of KOAR International, LLC (“KOAR”), a Los Angeles-based real estate development company. KOAR has advised investors who have acquired over $1 billion of assets in the Greater Los Angeles area. Cofinance, Inc. is a subsidiary of Cofinance Group SA (“Cofinance”), a Luxembourg-based real estate company. Through its subsidiaries, Cofinance owns, operates, develops and manages commercial real estate with approximately $750 million of asset under management across the United States (New York City, Los Angeles and the greater Northeast), France and Canada.
The Properties.The Los Angeles Leased Fee Portfolio consists of eight, ground leased land parcels totaling 556,202 square feet of land located adjacent to LAX in Los Angeles, California. Each of the eight land parcels is owned by the borrower and is improved with an asset subject to a 99-year, absolute NNN ground lease that commenced in 2016 and expires in December 2114 (96 years remaining) with no extension options. The eight ground leases are structured with contractual annual rent increases, fair market value resets, right of first negotiation in the event of a sale and no early termination options. The leasehold improvements, which are not collateral for the Los Angeles Leased Fee Portfolio Loan, total approximately 2.2 million square feet of net rentable area and include four hotels (one of which is currently being converted from an office building to a hotel), three parking structures and an office building. The following table presents certain information relating to the Los Angeles Leased Fee Portfolio Properties.
THE INFORMATION IN THIS STRUCTURAL AND COLLATERAL TERM SHEET IS NOT COMPLETE AND MAY BE AMENDED PRIOR TO THE TIME OF SALE. THIS TERM SHEET IS NOT AN OFFER TO SELL THESE SECURITIES AND IT IS NOT A SOLICITATION OF AN OFFER TO BUY THESE SECURITIES IN ANY JURISDICTION WHERE THE OFFER OR SALE IS NOT PERMITTED.
| | 27 of 95 | |
| Structural and Collateral Term Sheet | | JPMDB 2019-COR6 |
| |
| Los Angeles Leased Fee Portfolio |
| Portfolio Summary |
| Property Name | Total
Land SF | % of Total | Ground
Lease
Expiration | Leasehold Owner | Leased Fee
UW NOI(1) | % of Total | Appraised
Value | % of Total |
| 5901 West Century Boulevard | 71,003 | 12.8% | 12/31/2114 | ROX TRG Airport Blvd, LLC(2) | $812,081 | 15.4% | $21,700,000 | 16.1% |
| 5959 West Century Boulevard | 79,279 | 14.3% | 12/31/2114 | 5959 LLC | 708,834 | 13.5% | 19,000,000 | 14.1% |
| 6151 West Century Boulevard | 78,844 | 14.2% | 12/31/2114 | SVI Airport LLC | 680,761 | 12.9% | 18,000,000 | 13.3% |
| 5933 West Century Boulevard | 73,181 | 13.2% | 12/31/2114 | SVI LAX LLC | 601,110 | 11.4% | 16,400,000 | 12.2% |
| 5940 West 98th Street | 67,518 | 12.1% | 12/31/2114 | LR Century Parking I LLC et al. | 660,427 | 12.5% | 15,700,000 | 11.6% |
| 9801 Airport Boulevard | 62,726 | 11.3% | 12/31/2114 | BA LAX LLC | 558,210 | 10.6% | 15,000,000 | 11.1% |
| 6144 West 98th Street | 62,726 | 11.3% | 12/31/2114 | LR Century Parking VI | 644,875 | 12.2% | 14,900,000 | 11.0% |
| 5960 West 98th Street | 60,925 | 11.0% | 12/31/2114 | LR Century Parking I LLC | 601,606 | 11.4% | 14,200,000 | 10.5% |
| Total / Wtd. Avg. | 556,202 | 100.0% | | | | $5,267,904 | 100.0% | $134,900,000 | 100.0% |
| | | | | | | | | |
| (1) | Based on the average ground rent over loan term. |
| (2) | Represents the prior leasehold owner at the time of origination. The prior owner sold the leasehold improvements in October 2019 for approximately $45.0 million to a third party. |
The following table presents certain information relating to the improvements which underlie the Los Angeles Leased Fee Portfolio Properties.
| Look Through Portfolio Summary(1) |
| Property Name | Property
Type | Leasehold Property Name / Operator | Year Built /
Renovated | SF /
Rooms /
Spaces | Look
Through
NOI | Hypothetical
Stabilized Fee
Simple Appraised
Value(2) |
| 5901 West Century Boulevard | Office | Airport Center Building III | 1968 / 2017 | 306,243 | $4,106,826 | $68,400,000 |
| 5959 West Century Boulevard | Hotel | Hyatt House / Hyatt Place(3) | 1966 / 2020(3) | 401 | N/A(3) | 135,300,000 |
| 6151 West Century Boulevard | Hotel | Homewood Suites / Curio Collection by Hilton | 1963 / 2017 | 290 | 6,068,455 | 93,400,000 |
| 5933 West Century Boulevard | Hotel | Residence Inn | 1982 / 2015 | 231 | 5,245,797 | 80,700,000 |
| 5940 West 98th Street | Parking | L&R Century Parking | 1968 / N/A | 1,300 | 1,670,488 | 25,700,000 |
| 9801 Airport Boulevard | Hotel | Embassy Suites | 1989 / N/A | 222 | 3,519,458 | 54,100,000 |
| 6144 West 98th Street | Parking | L&R Century Parking | 1970 / N/A | 1,400 | 1,718,505 | 26,400,000 |
| 5960 West 98th Street | Parking | L&R Century Parking | 1982 / N/A | 1,300 | 1,652,575 | 25,400,000 |
| Total | | | | | $23,982,104 | $509,400,000 |
| (2) | The Hypothetical Stabilized Fee Simple Appraised Value assumes the properties are unencumbered by the ground leases. |
| (3) | The 5959 West Century Boulevard improvements are currently under construction. The improvements are being converted from an office building to a dual branded Hyatt Place/Hyatt House hotel. The Hyatt Place/Hyatt House hotel will be a 14-story tower with 401 rooms. The Hyatt Place will offer 272 guestrooms and the Hyatt House will offer 129 guestrooms. According to the appraisal, the total project cost is approximately $120.0 million and is expected to be completed by the first quarter of 2020. |
The 5901 West Century Boulevardproperty improvements consist of a 306,243 square foot, 15-story office building. The prior leasehold owner acquired the improvements in May 2017 for $12.5 million and performed an approximately $8.0 million renovation converting the spaces to a creative office design. In October 2019 the prior leasehold owner sold the leasehold improvements for approximately $45.0 million to a third party.
The 5959 West Century Boulevardproperty improvements are currently under construction as the improvements are being converted from an office building to a dual branded Hyatt Place/Hyatt House hotel. The Hyatt Place/Hyatt House hotel will be a 14-story tower with 401 rooms. The Hyatt Place will offer 272 guestrooms and the Hyatt House will offer 129 guestrooms. According to the appraisal, the total project cost is approximately $120.0 million and is expected to be completed by the first quarter of 2020.
The 6151 West Century Boulevardproperty improvements consists of a dual brand Homewood Suites and Curio Collection by Hilton hotel, in a 12-story tower with 290 rooms. The Homewood Suites hotel offers 122, all-suite rooms, and the Curio Collection by Hilton hotel offers 168 guestrooms. The improvements were constructed in 1963 and converted to a hotel in 2017. The hotel’s amenities include meeting rooms totaling 4,532 square feet, an outdoor swimming pool, fitness room, restaurant, free breakfast (Homewood Suites) and airport shuttle. Although the improvements offer only a limited number of parking spaces onsite, there is a seven-story parking garage immediately to the north adjacent to the hotel for guest parking.
THE INFORMATION IN THIS STRUCTURAL AND COLLATERAL TERM SHEET IS NOT COMPLETE AND MAY BE AMENDED PRIOR TO THE TIME OF SALE. THIS TERM SHEET IS NOT AN OFFER TO SELL THESE SECURITIES AND IT IS NOT A SOLICITATION OF AN OFFER TO BUY THESE SECURITIES IN ANY JURISDICTION WHERE THE OFFER OR SALE IS NOT PERMITTED.
| | 28 of 95 | |
| Structural and Collateral Term Sheet | | JPMDB 2019-COR6 |
| |
| Los Angeles Leased Fee Portfolio |
The 5933 West Century Boulevardproperty improvements consists of a Residence Inn LAX, an upscale, extended stay hotel with 231 guestrooms. The improvements were converted from an office building in an approximately $37.5 million conversion project which was completed in 2015. The hotel offers studio, one-bedroom, and two-bedroom guestrooms in a 12-story tower with three, ground floor retail spaces. The hotel amenities include four meeting rooms totaling 1,822 square feet, an outdoor swimming pool and deck area, fitness room, free breakfast and airport shuttle. The improvements do not offer any parking spaces; however, the hotel owner has the right to lease up to 300 spaces at a market rates from the adjacent seven-story parking garage immediately to the north.
The 5940 West 98th Streetproperty improvements consists of a one-building, 340,420 square foot concrete parking structure built in 1968. The improvements include seven levels of parking including six covered levels and one exposed rooftop level. The facility includes 1,300 parking spaces. Access to the parking garage is available via concrete curb cuts at 98th Street. Access is also available from Century Boulevard to the south via asphalt concrete driveways. The parking garage is operated by L&R Group of Companies, one of the largest parking property owners in the Los Angeles area.
The 6144 West 98th Streetproperty improvements consists of a one-building, 350,598 square foot concrete parking structure built in 1970. The improvements include seven levels of parking including six covered levels and one exposed rooftop level. The facility includes 1,400 parking spaces. Access to the parking garage is available via concrete curb cuts at 98th Street, with secondary access available from Century Boulevard to the south via driveways. The parking garage is operated by L&R Group of Companies.
The 9801 Airport Boulevardproperty improvements consists of an Embassy Suites, an extended stay hotel with 222 guestrooms. The hotel was built in 1989 and was built as a hotel. The hotel offers one-bedroom suites in an eight-story tower. The hotel amenities include meeting rooms totaling 4,532 square feet, an indoor swimming pool, fitness room, free breakfast and airport shuttle. Although the improvements offer only a limited number of parking spaces onsite, there is a seven-story parking garage parking garage immediately to the west.
The 5960 West 98th Streetproperty improvements consists of a one-building, 338,386 square foot concrete parking structure built in 1982. The improvements include seven levels of parking including six covered levels and one exposed rooftop level. The facility includes 1,300 parking spaces. Access to the parking garage is available via concrete curb cuts at 98th Street. Access is also available from Century Boulevard to the south via asphalt concrete driveways. The parking garage is operated by L&R Group of Companies.
The Los Angeles Leased Fee Portfolio Properties are located adjacent to LAX. According to the appraisal, LAX is the busiest airport on the West Coast and is a bustling domestic stop and an important international hub. The airport has a large impact on tourism and travel in the greater Los Angeles area as many international tourists use LAX as a gateway to the United States. Passenger travel at LAX has grown significantly and surpassed pre-recession passenger counts. According to the appraisal, total passenger counts recently reached a record level of nearly 84.5 million passengers. LAX is anticipated to undergo one of the largest public works project in California history in order to compete as a “world-class” airport.
Major developments have broken ground at LAX, including a $14 billion modernization program, including a $5.5 billion landside access modernization program to improve access to the airport, relieve congestion within the Central Terminal Area and surrounding streets, and connect with the future automated people mover station. A consolidated rent-a-car facility, roadway improvements, and an intermodal transportation facility – west will provide better transportation to the airport, remove shuttle trips to/from the terminal area, and provide more efficient access to rental cars. The people mover is under construction and scheduled for completion in 2023. There are also plans to extend the Green Line into the new Torrance transit center. The 4.6-mile extension of the light rail line, which currently ends at the northern border of Redondo Beach, would allow riders to connect to LAX via the future automated 96th Street Station.
THE INFORMATION IN THIS STRUCTURAL AND COLLATERAL TERM SHEET IS NOT COMPLETE AND MAY BE AMENDED PRIOR TO THE TIME OF SALE. THIS TERM SHEET IS NOT AN OFFER TO SELL THESE SECURITIES AND IT IS NOT A SOLICITATION OF AN OFFER TO BUY THESE SECURITIES IN ANY JURISDICTION WHERE THE OFFER OR SALE IS NOT PERMITTED.
| | 29 of 95 | |
| Structural and Collateral Term Sheet | | JPMDB 2019-COR6 |
| |
| Los Angeles Leased Fee Portfolio |
| Operating History and Underwritten Net Cash Flow |
| | | 2017 | | 2018 | | TTM(1) | | Underwritten | | Per Square Foot | | %(2) |
| Rents in Place | | $3,491,433 | $3,803,433 | $3,959,433 | $4,115,433 | $7.40 | 78.1% |
| Straight Line Rent(3) | | 0 | 0 | 0 | 950,940 | 1.71 | 18.1 |
| Vacant Income | | 0 | 0 | 0 | 0 | 0.00 | 0.0 |
| Gross Potential Rent | | $3,491,433 | $3,803,433 | $3,959,433 | $5,066,373 | $9.11 | 96.2% |
| Percentage Rent | | 145,427 | 169,138 | 201,531 | 201,531 | 0.36 | 3.8 |
| Total Reimbursements | | 0 | 0 | 0 | 0 | 0.00 | 0.0 |
| Total Other Income | | 0 | 0 | 0 | 0 | 0.00 | 0.0 |
| Net Rental Income | | $3,636,860 | $3,972,571 | $4,160,964 | $5,267,904 | $9.47 | 100.0% |
| (Vacancy/Credit Loss) | | 0 | 0 | 0 | 0 | 0.00 | 0.0 |
| Effective Gross Income | | $3,636,860 | $3,972,571 | $4,160,964 | $5,267,904 | $9.47 | 100.0% |
| | | | | | | | |
| Total Expenses | | $0 | $0 | $0 | $0 | $0.00 | 0.0% |
| | | | | | | | |
| Net Operating Income(4) | | $3,636,860 | $3,972,571 | $4,160,964 | $5,267,904 | $9.47 | 100.0% |
| | | | | | | | |
| Total TI/LC, CapEx/RR | | 0 | 0 | 0 | 0 | 0.00 | 0.0 |
| | | | | | | | |
| Net Cash Flow | | $3,636,860 | $3,972,571 | $4,160,964 | $5,267,904 | $9.47 | 100.0% |
| | | | | | | | | | | | |
| (1) | TTM column represents the trailing 12-month period ending June 30, 2019. |
| (2) | % column represents percent of Net Rental Income for all revenue lines and represents percent of Effective Gross Income for the remainder of the fields. |
| (3) | Based on the average ground rent over loan term. |
| (4) | The increase from TTM Net Operating Income to Underwritten Net Operating Income is attributable to approximately $950,940 of underwritten average ground rent over loan term. |
Property Management.The Los Angeles Leased Fee Portfolio Properties are self-managed.
Escrows and Reserves.
Tax Escrows– On a monthly basis, during the continuance of a Lease Sweep Period (as defined below),the borrower is required to escrow 1/12 of the projected annual estimated tax payments.
Insurance Escrows– On a monthly basis, during the continuance of a Lease Sweep Period (as defined below),the borrower is required to escrow 1/12 of the projected annual estimated insurance premiums.
Lockbox / Cash Management.The Los Angeles Leased Fee Portfolio Whole Loan is structured with a hard lockbox and springing cash management. All rents are required to be deposited directly by the tenants into a lockbox account controlled by the lender. All funds in the lockbox account are required to be swept daily into the borrower’s operating account, unless a Cash Management Period (as defined below) is continuing. Upon the occurrence of a Cash Management Period, all funds in the lockbox account will be swept daily into a lender-controlled account, from which account such funds will disbursed on each payment date in accordance with the Los Angeles Leased Fee Portfolio Whole Loan documents and any excess will be retained by the lender as additional collateral for the Los Angeles Leased Fee Portfolio Whole Loan.
A “Cash Management Period” will commence (i) upon an event of default, (ii) if the debt service coverage ratio is less than 1.15x (until such time that the debt service coverage ratio is greater than or equal to 1.15x for two consecutive quarters) or (iii) upon a Lease Sweep Period (as defined below).
A “Lease Sweep Period” will commence (i) on the date that is 12 months prior to the end of the term (including any renewal terms) of any Lease Sweep Lease (as defined below), (ii) on the date that is required under a Lease Sweep Lease by which the applicable Lease Sweep Tenant (defined below) is required to give notice of its exercise of a renewal option thereunder (and such renewal has not so been exercised), (iii) if any Lease Sweep Lease is surrendered, cancelled or terminated prior to its then-current expiration date, (iv) if any Lease Sweep Tenant (other than with respect to the 5959 West Century Boulevard property through August 27, 2020) goes dark or gives notice that it intends to discontinue its business at its premises;provided, however, a Lease Sweep Period will not commence pursuant to clause (iv) if, and to the extent that, such Lease Sweep Tenant (other than with respect to the 5959 West Century Boulevard property through August 27, 2020) has gone dark or gives notice that it intends to discontinue its business at its premises to renovate, reposition or restore its premises, provided, in each instance, the same is permitted under the applicable Lease Sweep Lease, (v) upon the occurrence and continuance of a monetary or material non-monetary default under any Lease Sweep Lease or (vi) upon the occurrence of a Lease Sweep Tenant insolvency proceeding.
THE INFORMATION IN THIS STRUCTURAL AND COLLATERAL TERM SHEET IS NOT COMPLETE AND MAY BE AMENDED PRIOR TO THE TIME OF SALE. THIS TERM SHEET IS NOT AN OFFER TO SELL THESE SECURITIES AND IT IS NOT A SOLICITATION OF AN OFFER TO BUY THESE SECURITIES IN ANY JURISDICTION WHERE THE OFFER OR SALE IS NOT PERMITTED.
| | 30 of 95 | |
| Structural and Collateral Term Sheet | | JPMDB 2019-COR6 |
| |
| Los Angeles Leased Fee Portfolio |
A “Lease Sweep Lease” means each of the leases between the borrower and the related ground tenant at each of the Los Angeles Leased Fee Portfolio Properties.
A “Lease Sweep Tenant” means any tenant under a Lease Sweep Lease.
Additional Debt.None.
Release Provisions. None.
THE INFORMATION IN THIS STRUCTURAL AND COLLATERAL TERM SHEET IS NOT COMPLETE AND MAY BE AMENDED PRIOR TO THE TIME OF SALE. THIS TERM SHEET IS NOT AN OFFER TO SELL THESE SECURITIES AND IT IS NOT A SOLICITATION OF AN OFFER TO BUY THESE SECURITIES IN ANY JURISDICTION WHERE THE OFFER OR SALE IS NOT PERMITTED.
| | 31 of 95 | |
| Structural and Collateral Term Sheet | | JPMDB 2019-COR6 |
| |
| Innovation Park |
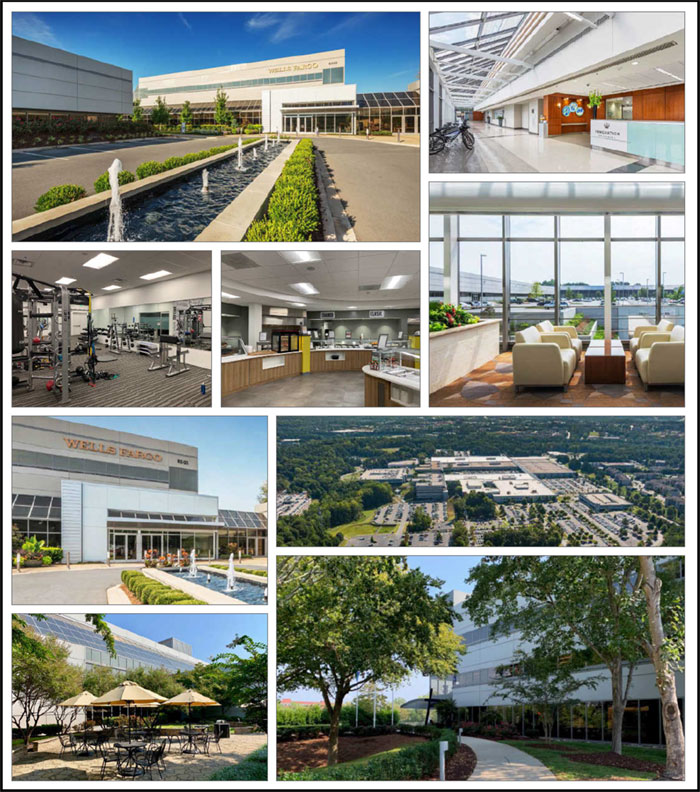
THE INFORMATION IN THIS STRUCTURAL AND COLLATERAL TERM SHEET IS NOT COMPLETE AND MAY BE AMENDED PRIOR TO THE TIME OF SALE. THIS TERM SHEET IS NOT AN OFFER TO SELL THESE SECURITIES AND IT IS NOT A SOLICITATION OF AN OFFER TO BUY THESE SECURITIES IN ANY JURISDICTION WHERE THE OFFER OR SALE IS NOT PERMITTED.
| | 32 of 95 | |
| Structural and Collateral Term Sheet | | JPMDB 2019-COR6 |
| |
| Innovation Park |
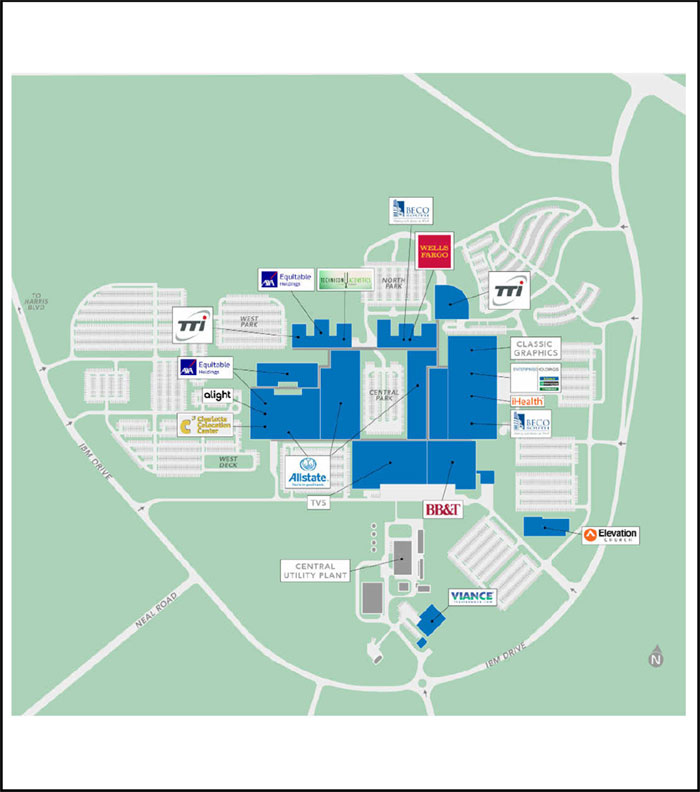
THE INFORMATION IN THIS STRUCTURAL AND COLLATERAL TERM SHEET IS NOT COMPLETE AND MAY BE AMENDED PRIOR TO THE TIME OF SALE. THIS TERM SHEET IS NOT AN OFFER TO SELL THESE SECURITIES AND IT IS NOT A SOLICITATION OF AN OFFER TO BUY THESE SECURITIES IN ANY JURISDICTION WHERE THE OFFER OR SALE IS NOT PERMITTED.
| | 33 of 95 | |
| Structural and Collateral Term Sheet | | JPMDB 2019-COR6 |
| |
| Innovation Park |

THE INFORMATION IN THIS STRUCTURAL AND COLLATERAL TERM SHEET IS NOT COMPLETE AND MAY BE AMENDED PRIOR TO THE TIME OF SALE. THIS TERM SHEET IS NOT AN OFFER TO SELL THESE SECURITIES AND IT IS NOT A SOLICITATION OF AN OFFER TO BUY THESE SECURITIES IN ANY JURISDICTION WHERE THE OFFER OR SALE IS NOT PERMITTED.
| | 34 of 95 | |
| Structural and Collateral Term Sheet | | JPMDB 2019-COR6 |
| |
| Innovation Park |
| Mortgage Loan Information | | Property Information |
| Mortgage Loan Seller: | JPMCB | | Single Asset / Portfolio: | Single Asset |
| Original Principal Balance(1): | $55,000,000 | | Title: | Fee |
| Cut-off Date Principal Balance(1): | $55,000,000 | | Property Type - Subtype: | Office – Suburban |
| % of Pool by IPB: | 6.8% | | Net Rentable Area (SF)(3): | 1,854,729 |
| Loan Purpose: | Acquisition | | Location: | Charlotte, NC |
| Borrower: | BRI 1881 Innovation Park, LLC | | Year Built / Renovated: | 1979-2013 / 2011 |
| Sponsors: | Aleph Investment Properties, | | Occupancy(2): | 96.1% |
| | LLLP, Aleph Investment Properties | | Occupancy Date: | 8/5/2019 |
| | (US), LLLP | | Number of Tenants: | 16 |
| Interest Rate: | 3.50500% | | 2016 NOI(3): | $15,306,649 |
| Note Date: | 10/18/2019 | | 2017 NOI(3): | $16,907,586 |
| Maturity Date: | 11/1/2029 | | 2018 NOI(3): | $18,648,044 |
| Interest-only Period: | 120 months | | TTM NOI (as of 8/2019)(3): | $19,635,371 |
| Original Term: | 120 months | | UW Economic Occupancy: | 94.8% |
| Original Amortization: | None | | UW Revenues: | $32,323,781 |
| Amortization Type: | Interest Only | | UW Expenses: | $11,117,049 |
| Call Protection: | L(25),Grtr1%orYM(91),O(4) | | UW NOI: | $21,206,732 |
| Lockbox / Cash Management: | Hard / Springing | | UW NCF: | $19,162,924 |
| Additional Debt(1): | Yes | | Appraised Value / Per SF(4): | $264,900,000 / $143 |
| Additional Debt Balance(1): | $127,250,000 | | Appraisal Date: | 8/22/2019 |
| Additional Debt Type(1): | Pari Passu | | | |
| | | | | |
| | | | | | | |
| Escrows and Reserves(5) | | Financial Information(1) |
| | Initial | Monthly | Initial Cap | | Cut-off Date Loan / SF: | $98 | | |
| Taxes: | $441,662 | $147,221 | N/A | | Maturity Date Loan / SF: | $98 | | |
| Insurance: | $0 | Springing | N/A | | Cut-off Date LTV(4): | 68.8% | | |
| Replacement Reserves: | $30,912 | $30,912 | N/A | | Maturity Date LTV(4): | 68.8% | | |
| TI/LC: | $115,921 | $115,921 | $1,400,000 | | UW NCF DSCR: | 2.96x | | |
| | | | | | UW NOI Debt Yield: | 11.6% | | |
| | | | | | | | |
| | | | | | | | | | |
| Sources and Uses |
| Sources | Proceeds | % of Total | | Uses | Proceeds | % of Total |
| Whole Loan | $182,250,000 | 64.2% | | Purchase Price | $270,000,000 | 95.1% |
| Sponsor Equity | 101,642,381 | 35.8 | | Closing Costs | 13,303,886 | 4.7 |
| | | | | Upfront Reserves | 588,495 | 0.2 |
| Total Sources | $283,892,381 | 100.0% | | Total Uses | $283,892,381 | 100.0% |
| (1) | The Innovation Park loan is part of a whole loan evidenced by threepari passu notes, with an aggregate outstanding principal balance as of the Cut-off Date of $182.25 million. The Financial Information presented in the chart above reflects the Cut-off Date balance of the $182.25 million Innovation Park Whole Loan (as defined below). |
| (2) | Occupancy is inclusive of (i) 38,553 square feet associated with amenity space and (ii) 118,829 square feet associated with vacancy for non-rentable space at the Innovation Park property with no attributable underwritten base rent. |
| (3) | The increase from 2016 NOI through TTM NOI is primarily attributable to a 146,881 square foot expansion by AXA Equitable consisting of (i) 38,200 square feet leased to AXA Equitable in October 2017 and (ii) 108,681 additional square feet leased to AXA Equitable in September 2018, in total representing 7.9% of total net rentable area and 13.9% of total underwritten base rent at the Innovation Park property. |
| (4) | Appraised Value / Per SF, Cut-off Date LTV and Maturity Date LTV are calculated based on the “Hypothetical As-Is” appraised value of $264.9 million. As of the date of origination, there were no outstanding tenant improvement and leasing commission obligations remaining. Based on the As-Is appraised value of $262.9 million as of August 22, 2019, the Cut-off Date LTV and Maturity Date LTV are equal to 69.3% and 69.3%, respectively. |
| (5) | For a full description of Escrows and Reserves, please refer to “Escrows and Reserves” below. |
THE INFORMATION IN THIS STRUCTURAL AND COLLATERAL TERM SHEET IS NOT COMPLETE AND MAY BE AMENDED PRIOR TO THE TIME OF SALE. THIS TERM SHEET IS NOT AN OFFER TO SELL THESE SECURITIES AND IT IS NOT A SOLICITATION OF AN OFFER TO BUY THESE SECURITIES IN ANY JURISDICTION WHERE THE OFFER OR SALE IS NOT PERMITTED.
| | 35 of 95 | |
| Structural and Collateral Term Sheet | | JPMDB 2019-COR6 |
| |
| Innovation Park |
The Loan. The Innovation Park loan is part of a whole loan evidenced by three pari passu promissory notes, each as described below, with an aggregate original balance of $182.25 million (the “Innovation Park Whole Loan”), secured by a first mortgage lien on the borrower’s fee interest in a 1,854,729 square foot Class A office complex located in Charlotte, North Carolina. The non-controlling Note A-2, with an outstanding principal balance as of the Cut-off Date of $55.0 million, will be included in the JPMDB 2019-COR6 Trust. The non-controlling Notes A-1 and the controlling Note A-3 have been or are expected to be contributed to other securitization trusts, outlined in the chart below. The relationship between the holders of the Innovation Park Whole Loan will be governed by a co-lender agreement as described under “Description of the Mortgage Pool—The Whole Loans—The Serviced Pari Passu Whole Loansin the Preliminary Prospectus. The Innovation Park Whole Loan has a ten-year term and is interest-only for the entire term.
| Whole Loan Summary |
| Note | Original Balance | Cut-off Date Balance | Note Holder | Controlling
Piece |
| A-1 | $60,000,000 | $60,000,000 | Benchmark 2019-B14 | No |
| A-2 | $67,250,000 | $67,250,000 | JPMCB | Yes |
| A-3 | $55,000,000 | $55,000,000 | JPMDB 2019-COR6 | No |
| Total | $182,250,000 | $182,250,000 | | |
The Borrower. The borrower is BRI 1881 Innovation Park, LLC, a Delaware limited liability company and special purpose entity with two independent directors in its organizational structure.
The Loan Sponsors. The loan sponsors and non-recourse guarantors are Aleph Investment Properties (US), LLLP and Aleph Investment Properties, LLLP. The borrower is a joint-venture between Accesso Partners, LLC (“Accesso Partners”) and Partners Group AG, (SIX: PGHN) (“Partners Group”). Accesso Partners is a real estate investment and property development group that currently owns a portfolio of over $3.0 billion in assets totaling over 15.0 million square feet of office space across 44 properties, 21 major cities and eight states. Headquartered in Hallandale Beach, Florida, Accesso Partners offers a full range of services including acquisition, asset management, property management construction and accounting with additional offices in Houston, Dallas, Minneapolis, Atlanta and Chicago. Partners Group is a global private markets investment manager, serving over 900 institutional investors worldwide. Since inception, Partners Group has over $91 billion in assets under management and employs over 1,300 professionals across 20 offices worldwide. Partners Group has invested over $100 billion in private equity, private real estate, private debt and private infrastructure on behalf of its clients. Partners Group is one of the largest private markets investment managers in the world.
The Property. The Innovation Park property is a 1,854,729 square foot office complex located in Charlotte, North Carolina, consisting of 11 interconnected office buildings, a free standing industrial flex building, a free standing 1,200 seat chapel, a central utility plant and two parking structures. The Innovation Park property is situated on an approximately 202-acre site which includes an approximately 89.2 acre vacant parcel of undeveloped excess land, which does not serve as collateral for the Innovation Park Whole Loan. The Innovation Park property includes two parking structures containing 7,601 surface and garage parking spaces, resulting in a parking ratio of approximately 4.12 spaces per 1,000 square feet. Of the 7,601 parking spaces, 2,366 spaces serve as collateral for the Innovation Park Whole Loan. The buildings were completed between 1979 and 2013, while the parking structures were constructed in 2005 and 2012. The Innovation Park property was originally constructed as IBM’s research and development campus and was repositioned as the Innovation Park property in 2011 after IBM vacated a majority of the Innovation Park property. After acquiring the Innovation Park property in 2010, the prior owner made significant upgrades including a number of on-campus amenities such as two fitness centers with locker rooms, a cafeteria, two conference centers and extensive landscaping and tenant lounge areas. The prior owner reportedly invested over $54.4 million in tenant improvements since 2010 and approximately $19.7 million in total capital expenditures since 2016.
As of August 5, 2019, the Innovation Park property was 96.1% leased to 16 tenants representing several industries including financial services, insurance, technology and design. In addition, approximately 42.4% of the net rentable area at the Innovation Park property is leased to investment grade tenants. The largest tenant at the Innovation Park property, AXA Equitable (NYSE: EQH) (Moody’s/S&P/Fitch: A2/A/A-) (“AXA”), accounts for approximately 15.7% of net rentable area and approximately 25.3% of underwritten base rent. Founded in 1859, AXA is a financial services company that offers a variety of variable annuity products, term, variable and universal life insurance products, employee benefit products and investment products principally to individuals, small and medium-sized businesses and professional and trade associations. As of the second quarter of 2019, AXA reported approximately $6.9 billion in net income, and as of the year end 2018, AXA had $618.6 billion in assets under management. The space leased by AXA at the Innovation Park property serves as its life-insurance operations and service center where approximately 600 AXA employees work. AXA has been a tenant at Innovation Park since 2013 and has a lease expiration date of November 30, 2028 with one five-year extension option remaining. AXA originally leased 144,647 square feet, subsequently expanded by 38,200 square feet in 2017 and expanded by an additional 108,681 square feet in 2018. AXA has the right to terminate its lease with respect to 144,647 square feet (approximately 50% of their leased space) in December 2024 with 12 months’ prior written notice and the payment of a termination fee.
THE INFORMATION IN THIS STRUCTURAL AND COLLATERAL TERM SHEET IS NOT COMPLETE AND MAY BE AMENDED PRIOR TO THE TIME OF SALE. THIS TERM SHEET IS NOT AN OFFER TO SELL THESE SECURITIES AND IT IS NOT A SOLICITATION OF AN OFFER TO BUY THESE SECURITIES IN ANY JURISDICTION WHERE THE OFFER OR SALE IS NOT PERMITTED.
| | 36 of 95 | |
| Structural and Collateral Term Sheet | | JPMDB 2019-COR6 |
| |
| Innovation Park |
The second largest tenant at the Innovation Park property, Allstate Insurance Company (“Allstate”) (NYSE: ALL) (Moody’s/S&P/Fitch: A3/A-/BBB+) accounts for approximately 13.9% of net rentable area and approximately 22.4% of underwritten base rent. Founded in 1931 and serving approximately 16 million households in the United States, Allstate offers a variety of insurance product options including auto, homeowners, renters, condominium and stand-alone scheduled personal property through different distribution channels including Allstate exclusive agencies, independent agencies, online and call centers. As of year-end 2018, Allstate had nearly $39.8 billion in revenues and $112.2 billion in assets. The Innovation Park property serves as Allstate’s current operations center. Allstate has been at Innovation Park since 2014 and has a lease expiration of December 31, 2027 with two, five-year extension options. Allstate originally leased 217,062 square feet at the property and expanded by 40,311 square feet in July 2019. Allstate has the right to terminate its lease in November 2022 with nine months’ prior written notice and the payment of a termination fee.
The third largest tenant at the Innovation Park property, Classic Graphics, accounts for approximately 12.9% of net rentable area and approximately 4.5% of underwritten base rent. Classic Graphics specializes in custom large format signage, trade show displays and other visual communications solutions. Class Graphics is a subsidiary of the IMAGINE group (“IMAGINE”), which consists of a family of five companies focused on delivering visual communications solutions to brands across the retail, entertainment, gaming, quick service restaurant and consumer packaged goods industries. Classic Graphic has been a tenant since 2011 and has a lease expiration date of January 31, 2026 with one, five-year extension option remaining. Classic Graphics originally leased 179,775 square feet and subsequently expanded by 58,969 square feet in 2013. Classic Graphics has the right to terminate its lease with respect to 58,969 square feet in December 31 2020, with nine months’ prior written notice and the payment of a termination fee.
The loan sponsors expect to convert approximately 242,992 square feet of industrial space in Building 001, currently leased through 2023, and Building 002, currently vacant, to office space with the goal of putting the space to more efficient use at higher rental rates. The loan sponsor has budgeted approximately $130 per square foot, or $31.6 million, in capital expenses and tenant improvements associated with the conversion. In addition, the loan sponsors have indicated that they expect the outlying parcels which are not included in the collateral to be converted to retail, residential and office use.
The Innovation Park property is located in Charlotte, North Carolina, approximately nine miles north of Charlotte’s central business district. According to the appraisal, the city of Charlotte is the nation’s third largest banking center and home to the headquarters of six Fortune 500 companies including Bank of America, Lowe’s Home Improvement Warehouse, Duke Energy, Nucor and Sonic Automotive. According to the Bureau of Labor Statistics, as of April 2019, the labor pool in the Charlotte metro area grew 3.0% year-over-year and the number of new jobs increased 2.5%. In addition to strong job growth, Charlotte has experienced strong infrastructure development including the 2018 completion of the $1.2 billion LYNX Blue line rail extension, Charlotte’s 18.9 mile long light rail service. The Innovation Park property is located within University City, the second largest employment center in Charlotte. University City is comprised of over 11 million square feet of office space, 4.8 million of which is LEED certified, and consists of approximately 73,000 employees, 23 Fortune 500 companies and three headquarter locations. The area benefits from its proximity to the University of North Carolina at Charlotte which has an enrollment of over 25,000 students as well as Carolina’s Medical Center – University. Additional demand drivers within University City include University Research Park, University Executive Park Atrium Health University City, Belgate Shopping Center, Concord Mills Mall and Charlotte Motor Speedway, one of NASCAR’s racing venues.
As of the second quarter of 2019, the Charlotte office market consisted of approximately 110 million square feet of office space with an overall vacancy rate of 7.9% and average asking rents of $26.07 per square foot. The University City submarket totaled approximately 8.6 million square feet with an average vacancy of 10.4% and average asking rents of $23.91 per square foot. The overall Charlotte office market achieved 2.5 million square feet in leasing activity through mid-year 2019 and projects positive net absorption through year end 2019.
The appraiser identified seven office rent comparables for the Innovation Park property. Comparable buildings were built between 1972 and 2017 and range in size from 56,871 to 199,571 square feet. Direct asking rents at the comparable properties ranged between $22.00 and $29.50 per square foot with a weighted average office rent of approximately $25.30 per square foot. The Innovation Park property’s in-place weighted average office rent is $19.30 per square foot, below the appraisal’s concluded office market rent of $25.00 per square foot.
THE INFORMATION IN THIS STRUCTURAL AND COLLATERAL TERM SHEET IS NOT COMPLETE AND MAY BE AMENDED PRIOR TO THE TIME OF SALE. THIS TERM SHEET IS NOT AN OFFER TO SELL THESE SECURITIES AND IT IS NOT A SOLICITATION OF AN OFFER TO BUY THESE SECURITIES IN ANY JURISDICTION WHERE THE OFFER OR SALE IS NOT PERMITTED.
| | 37 of 95 | |
| Structural and Collateral Term Sheet | | JPMDB 2019-COR6 |
| |
| Innovation Park |
The appraisal identified eleven industrial rent comparables for the Innovation Park property with rents ranging from $4.50 to $7.35 per square foot with a weighted average of $5.54 per square foot. The Innovation Park property’s in-place weighted average industrial rent is $5.07 per square foot, in-line with the appraisal’s concluded industrial rent of $5.50 per square foot.
| Historical and Current Occupancy(1) |
| 2016 | 2017 | 2018 | Current(2)(3) |
| 96.1% | 95.4% | 95.9% | 96.1% |
| (1) | Historical Occupancies are as of December 31 of each respective year. |
| (2) | Current Occupancy is as of August 5, 2019. |
| (3) | Occupancy is inclusive of (i) 38,553 square feet associated with amenity space and (ii) 118,829 square feet associated with vacancy for non-rentable space at the Innovation Park property with no attributable underwritten base rent. |
| Tenant Summary(1) |
| Tenant | Ratings
Moody’s/S&P/Fitch(2) | Net Rentable
Area (SF) | % of
Total NRA | Base Rent
PSF(3)(4) | % of Total
Base Rent(3) | Lease Expiration |
| AXA Equitable(5) | A2 / A / A- | 291,528 | 15.7% | $23.93 | 25.3% | 11/30/2028 |
| Allstate Insurance Company(6) | A3 / A- / BBB+ | 257,393 | 13.9% | $24.04 | 22.4% | 12/31/2027 |
| Classic Graphics(7) | NR / NR / NR | 238,744 | 12.9% | $5.23 | 4.5% | 1/31/2026 |
| Alight Solutions LLC(8) | NR / NR / NR | 216,377 | 11.7% | $16.06 | 12.6% | 11/30/2025 |
| Wells Fargo Bank | A2 / A- / A+ | 196,613 | 10.6% | $22.76 | 16.2% | 3/31/2025 |
| TVS | NR / NR / NR | 183,324 | 9.9% | $5.16 | 3.4% | 4/30/2023 |
| TTI Worldwide | NR / NR / NR | 75,335 | 4.1% | $23.14 | 6.3% | 12/31/2026 |
| BB&T | A2 / A- / A+ | 40,666 | 2.2% | $12.66 | 1.9% | 5/31/2024 |
| Elevation Church | NR / NR / NR | 36,890 | 2.0% | $14.20 | 1.9% | 3/31/2025 |
| Framatone | NR / NR / NR | 31,858 | 1.7% | $22.32 | 2.6% | 10/31/2023 |
| Top 10 Total / Wtd. Avg. | | 1,568,728 | 84.6% | $17.09 | 97.2% | |
| Remaining Tenants | | 57,016 | 3.1% | $13.59 | 2.8% | |
| Building & Amenity(9) | | 157,382 | 8.5% | | | |
| Total Occupied Space | | 1,783,126 | 96.1% | | | |
| Vacant | | 71,603 | 3.9% | | | |
| Total / Wtd. Avg. | | 1,854,729 | 100.0% | $15.47 | 100.0% | |
| (1) | Based on the underwritten rent roll dated August 5, 2019. |
| (2) | Certain ratings are those of the parent company whether or not the parent company guarantees the lease. |
| (3) | Base Rent PSF is inclusive of (a) contractual rent steps through June 2020 and (b) straight line rent for investment grade tenants over the loan term. |
(4) Base Rent PSF is inclusive of (i) 38,553 square feet associated with amenity space and (ii) 118,829 square feet associated with vacancy for non-rentable space at the Innovation Park property with no attributable underwritten base rent.
| (5) | AXA Equitable has the right to terminate its lease with respect to 144,647 square feet on December 31, 2024, with 12 months’ prior written notice and a termination fee equal to the unamortized amounts of brokerage commissions, rent abatements and landlord work costs related to such space. |
| (6) | Allstate Insurance Company has the right to terminate its lease on November 30, 2022, with nine months’ prior written notice and the payment of a termination fee equal to the unamortized amounts of brokerage commissions, rent abatements and landlord work costs related to such space. |
| (7) | Classic Graphics has the right to terminate its lease with respect to 58,969 square feet on December 31, 2020, with nine months’ prior written notice and the payment of a termination fee equal to the unamortized amounts of brokerage commissions, landlord work costs related to tenant spaces and the cost of dividing the existing space from any additional space leased to Classic Graphics. |
| (8) | Alight Solutions LLC has the right to terminate its lease on November 30, 2022 with 12 months’ prior notice and the payment of a termination fee equal to three months base rent and unamortized brokerage commissions, rent abatements and landlord work costs related to such space. |
| (9) | Building & Amenity is inclusive of (i) 38,553 square feet associated with amenity space and (ii) 118,829 square feet associated with vacancy for non-rentable space at the Innovation Park property with no attributable underwritten base rent. |
THE INFORMATION IN THIS STRUCTURAL AND COLLATERAL TERM SHEET IS NOT COMPLETE AND MAY BE AMENDED PRIOR TO THE TIME OF SALE. THIS TERM SHEET IS NOT AN OFFER TO SELL THESE SECURITIES AND IT IS NOT A SOLICITATION OF AN OFFER TO BUY THESE SECURITIES IN ANY JURISDICTION WHERE THE OFFER OR SALE IS NOT PERMITTED.
| | 38 of 95 | |
| Structural and Collateral Term Sheet | | JPMDB 2019-COR6 |
| |
| Innovation Park |
| Lease Rollover Schedule(1)(2) |
Year | Number
of Leases
Expiring | Net
Rentable
Area
Expiring | % of NRA
Expiring | Base Rent
Expiring(3) | % of Base
Rent
Expiring | Cumulative
Net Rentable
Area Expiring | Cumulative
% of NRA
Expiring | Cumulative
Base Rent
Expiring | Cumulative
% of Base
Rent
Expiring |
| Vacant | NAP | 71,603 | 3.9% | NAP | NAP | 71,603 | 3.9% | NAP | NAP |
| 2019 & MTM | 0 | 0 | 0.0% | $0 | 0.0% | 71,603 | 3.9% | $0 | 0.0% |
| 2020 | 0 | 0 | 0.0% | 0 | 0.0% | 71,603 | 3.9% | $0 | 0.0% |
| 2021 | 0 | 0 | 0.0% | 0 | 0.0% | 71,603 | 3.9% | $0 | 0.0% |
| 2022 | 1 | 22,775 | 1.2% | 241,643 | 0.9% | 94,378 | 5.1% | $241,643 | 0.9% |
| 2023 | 4 | 223,538 | 12.1% | 1,735,498 | 6.3% | 317,916 | 17.1% | $1,977,141 | 7.2% |
| 2024 | 2 | 61,909 | 3.3% | 875,549 | 3.2% | 379,825 | 20.5% | $2,852,689 | 10.3% |
| 2025 | 3 | 449,880 | 24.3% | 8,473,891 | 30.7% | 829,705 | 44.7% | $11,326,581 | 41.1% |
| 2026 | 2 | 314,079 | 16.9% | 2,991,809 | 10.8% | 1,143,784 | 61.7% | $14,318,389 | 51.9% |
| 2027 | 1 | 257,393 | 13.9% | 6,187,005 | 22.4% | 1,401,177 | 75.5% | $20,505,394 | 74.4% |
| 2028(4) | 3 | 301,483 | 16.3% | 7,028,908 | 25.5% | 1,702,660 | 91.8% | $27,534,302 | 99.8% |
| 2029 & Beyond(5) | 8 | 152,069 | 8.2% | 42,484 | 0.2% | 1,854,729 | 100.0% | $27,576,787 | 100.0% |
| Total | 24 | 1,854,729 | 100.0% | $27,576,787 | 100.0% | | | | |
| (1) | Based on the underwritten rent roll dated August 5, 2019. |
| (2) | Certain tenants may have termination or contraction options (which may become exercisable prior to the originally stated expiration date of the tenant lease) that are not considered in the above Lease Rollover Schedule. |
| (3) | Base Rent Expiring is inclusive of (a) contractual rent steps through June 2020 and (b) straight line rent for investment grade tenants over the loan term accounting for approximately $2.0 million in underwritten base rent. |
| (4) | 2028 is inclusive of 7,731 square feet leased to Bon Appetit Management Company that serves as amenity space for tenants at the Innovation Park property. |
| (5) | 2029 & Beyond is inclusive of (i) 30,822 square feet associated with amenity space and (ii) 118,829 square feet associated with vacancy for non-rentable space at the Innovation Park property with no attributable underwritten base rent. |
| Underwritten Net Cash Flow |
| | 2016 | 2017 | 2018 | TTM(1) | Underwritten | Per Square
Foot | %(2) |
| Base Rent(3) | $21,832,902 | $23,050,139 | $24,785,667 | $25,837,745 | $27,576,787 | $14.87 | 81.3% |
| Vacant Income | 0 | 0 | 0 | 0 | 1,500,862 | 0.81 | 4.4 |
| Gross Potential Rent | $21,832,902 | $23,050,139 | $24,785,667 | $25,837,745 | $29,077,649 | $15.68 | 85.7% |
| Total Reimbursements | 3,715,621 | 3,914,912 | 4,512,707 | 4,848,580 | 4,847,972 | 2.61 | 14.3 |
| Net Rental Income | $25,548,523 | $26,965,051 | $29,298,373 | $30,686,325 | $33,925,621 | $18.29 | 100.0% |
| (Vacancy / Credit Loss) | 0 | 0 | 0 | 0 | (1,751,094) | (0.94) | (5.2) |
| Other Income | 169,565 | 157,973 | 213,576 | 149,254 | 149,254 | 0.08 | 0.4 |
| Effective Gross Income | $25,718,088 | $27,123,025 | $29,511,950 | $30,835,578 | $32,323,781 | $17.43 | 95.3% |
| Total Expenses | 10,411,439 | $10,215,438 | $10,863,906 | $11,200,207 | $11,117,049 | $5.99 | 34.4 |
| Net Operating Income(4) | $15,306,649 | $16,907,586 | $18,648,044 | $19,635,371 | $21,206,732 | $11.43 | 65.6% |
| Total TI/LC, CapEx | 0 | 0 | 0 | 0 | 2,043,807 | 1.10 | 6.3 |
| Net Cash Flow | $15,306,649 | $16,907,586 | $18,648,044 | $19,635,371 | $19,162,924 | $10.33 | 59.3% |
| (1) | TTM column represents the trailing 12-month period ending August 31, 2019. |
| (2) | % column represents percent of Net Rental Income for all revenue lines and represents percent of Effective Gross Income for the remainder of the fields. |
| (3) | Base Rent is inclusive of (a) contractual rent steps through June 2020 and (b) straight line rent for investment grade tenants over the loan term accounting for approximately $2.0 million in underwritten base rent. |
| (4) | The increase from 2016 NOI through TTM NOI was attributable to a 146,881 square foot expansion by AXA Equitable inclusive of (i) 38,200 square feet leased to AXA Equitable in October 2017 and (ii) 108,681 additional square feet leased to AXA Equitable in September 2018 representing 7.9% of total net rentable area and 13.9% of underwritten total rent at the Innovation Park property. |
Property Management.The Innovation Park property is managed by Accesso Services LLC, a Florida limited liability company and an affiliate of the loan sponsors.
THE INFORMATION IN THIS STRUCTURAL AND COLLATERAL TERM SHEET IS NOT COMPLETE AND MAY BE AMENDED PRIOR TO THE TIME OF SALE. THIS TERM SHEET IS NOT AN OFFER TO SELL THESE SECURITIES AND IT IS NOT A SOLICITATION OF AN OFFER TO BUY THESE SECURITIES IN ANY JURISDICTION WHERE THE OFFER OR SALE IS NOT PERMITTED.
| | 39 of 95 | |
| Structural and Collateral Term Sheet | | JPMDB 2019-COR6 |
| |
| Innovation Park |
Escrows and Reserves.At loan origination, the borrowers deposited approximately $441,662 into a tax reserve account, $30,912 into a replacement reserve account and $115,921 into a rollover reserve account.
Tax Escrows–On a monthly basis, theborrowersare required to deposit an amount equal to 1/12 of the estimated annual real estate taxes (initially estimated to be $147,221).
Insurance Escrows – Insurance escrows are waived so long as (i) no event of default has occurred and is continuing and (ii) the Innovation Park property is covered by an acceptable blanket policy (which is currently maintained). If such condition is no longer satisfied, on each payment date, the borrowers will be required to fundaninsurance reserve in an amount equal to 1/12 of the amount that the lender estimates will be necessary to pay the annual insurance premiums.
Replacement Escrows – On a monthly basis, the borrowers are required to depositapproximately$30,912 for replacement reserves (or approximately $0.20 per square foot annually). The replacement reserve is not subject to a cap.
TI/LC Reserves – On a monthly basis through the payment date occurring in November 2022, the borrowers are required to deposit $115,921 for tenant improvements and leasing commission (or approximately $0.75 per square foot annually). On each monthly payment date thereafter, the borrower is required to pay $193,201. Monthly payments made prior to October 2022 are waived if the applicable amount of funds on deposit in the TI/LC Reserve account is equal to or greater than $1,400,000. The aggregate amount of the applicable amount of funds on deposit may not exceed a cap of $5,000,000 on any payment date.
Lockbox / Cash Management.The Innovation Park Whole Loan is structured with a hard lockbox and springing cash management. The borrower was required at loan origination to send tenant direction letters instructing the tenants to deposit all rents and payments into a lender controlled lockbox account. To the extent no Cash Sweep Period (as defined below) is continuing, all funds in the lockbox account are required to be transferred to or at the direction of the borrowers. Following the occurrence and during the continuance of a Cash Sweep Period, all funds in the lockbox account are required to be swept each business day to a segregated cash management account under the control of the lender and disbursed in accordance with the Innovation Park Whole Loan documents. To the extent there is a Cash Sweep Period continuing, all excess cash flow after payment of debt service, required reserves and operating expenses are required to be held as additional collateral for the Innovation Park Whole Loan. The lender has been granted a first priority security interest in the cash management account.
A “Cash Sweep Period” means each period commencing on the occurrence of a Cash Sweep Event (as defined below) and continuing until the earlier of the payment date next occurring following the related Cash Sweep Event Cure (as defined below) or payment in full of all principal and interest on the Innovation Park Whole Loan.
A “Cash Sweep Event” means the occurrence of (i) an event of default, (ii) any bankruptcy action of a borrower or property manager, (iii) the date on which the debt service coverage ratio (as calculated in the Innovation Park Whole Loan documents and based on the trailing six-month period immediately preceding the date of determination) is less than 1.75x, or (iv) the event of default under any new mezzanine loans permitted under the Innovation Park Whole Loan documents as described below and more fully set forth in the Innovation Park Whole Loan documents.
A “Cash Sweep Event Cure” means (a) with respect to clause (i) above, the acceptance by the lender of a cure of such event of default (b) with respect to clause (ii) above, (1) only with respect to a bankruptcy action of a property manager, the borrowers replaces the property manager with a qualified manager under a replacement management agreement within 60 days of such bankruptcy action or, if such bankruptcy action is involuntary and not consented to or colluded in by the property manager or any of its affiliates, such bankruptcy action is discharged, stayed or dismissed within 60 days of such filing without any adverse consequences to the Innovation Park Whole Loan or the Innovation Park property, determined in the lender’s sole discretion, and (2)only with respect to a bankruptcy action of theborrower that is involuntary and not consented to or colluded in by the borrower, if such bankruptcy action is involuntary and not consented to or colluded in by the property manager or any of its affiliates, such bankruptcy action is discharged, stayed or dismissed within 60 days of such filing without any adverse consequences to the Innovation Park Whole Loan or the Innovation Park property, determined in the lender’s sole discretion,(c) with respect to clause (iii) above, the debt service coverage ratio (as calculated in the Innovation park Whole Loan documents and based on the trailing six-month period immediately preceding the date of determination) is at least 1.75x for two consecutive quarters, or (d) with respect to clause (iv) above, such event of default relating to any New Mezzanine Loan (as defined below) has been cured in accordance with the terms of the related New Mezzanine Loan documents.Each cure is also subject to the following conditions: (1) no other event of default may have occurred and be continuing; (2) a Cash Sweep Event Cure may occur no more than a total of two times in the aggregate during the term of the Innovation Park Whole Loan; (3) a Cash Sweep Event Cure following a DSCR trigger event may occur an unlimited number of times during the term of the Innovation Park Whole Loan and (4) the borrower pays the lender’s reasonable expenses in connection with such cure. Notwithstanding the foregoing, except as provide in clause (b)(2) above, in no event will the borrower have the right to cure a Cash Sweep Event occurring from a bankruptcy of the borrower.
THE INFORMATION IN THIS STRUCTURAL AND COLLATERAL TERM SHEET IS NOT COMPLETE AND MAY BE AMENDED PRIOR TO THE TIME OF SALE. THIS TERM SHEET IS NOT AN OFFER TO SELL THESE SECURITIES AND IT IS NOT A SOLICITATION OF AN OFFER TO BUY THESE SECURITIES IN ANY JURISDICTION WHERE THE OFFER OR SALE IS NOT PERMITTED.
| | 40 of 95 | |
| Structural and Collateral Term Sheet | | JPMDB 2019-COR6 |
| |
| Innovation Park |
Future Mezzanine or Subordinate Indebtedness Permitted.So long as no new transfer and assumption mezzanine loan is then currently outstanding, in connection with a bona fide sale of the Innovation Park property to a third party or funding tenant improvement and leasing commission obligations under any new lease approved by the lender and any new mezzanine lender in order to convert the existing industrial space at the Innovation Park property to office use (individually and collectively, a “New Mezzanine Loan”),the direct or indirect equity holders of the borrower are permitted to incur a New Mezzanine Loan from an institutional lender secured by a pledge of their direct or indirect equity interests in the borrower so long as, among other things: (a) no event of default has occurred and is continuing, (b) the lender and such institutional lender have entered into a customary subordination and intercreditor agreement reasonably acceptable to the lender, (c) immediately after giving effect to the closing of such mezzanine loan, the loan-to-value ratio (as calculated in the Innovation Park Whole Loan documents) may not exceed 68.8%, (d) immediately after giving effect to the closing of such mezzanine loan, the debt service coverage ratio (as calculated in the Innovation Park Whole Loan documents) is not less than 2.46x, (e) the maturity date of the mezzanine loan is not earlier than the maturity date of the Innovation Park Whole Loan and (f) rating agency confirmation is obtained.
Partial Release.None.
THE INFORMATION IN THIS STRUCTURAL AND COLLATERAL TERM SHEET IS NOT COMPLETE AND MAY BE AMENDED PRIOR TO THE TIME OF SALE. THIS TERM SHEET IS NOT AN OFFER TO SELL THESE SECURITIES AND IT IS NOT A SOLICITATION OF AN OFFER TO BUY THESE SECURITIES IN ANY JURISDICTION WHERE THE OFFER OR SALE IS NOT PERMITTED.
| | 41 of 95 | |
| Structural and Collateral Term Sheet | | JPMDB 2019-COR6 |
| |
| 12555 & 12655 Jefferson |
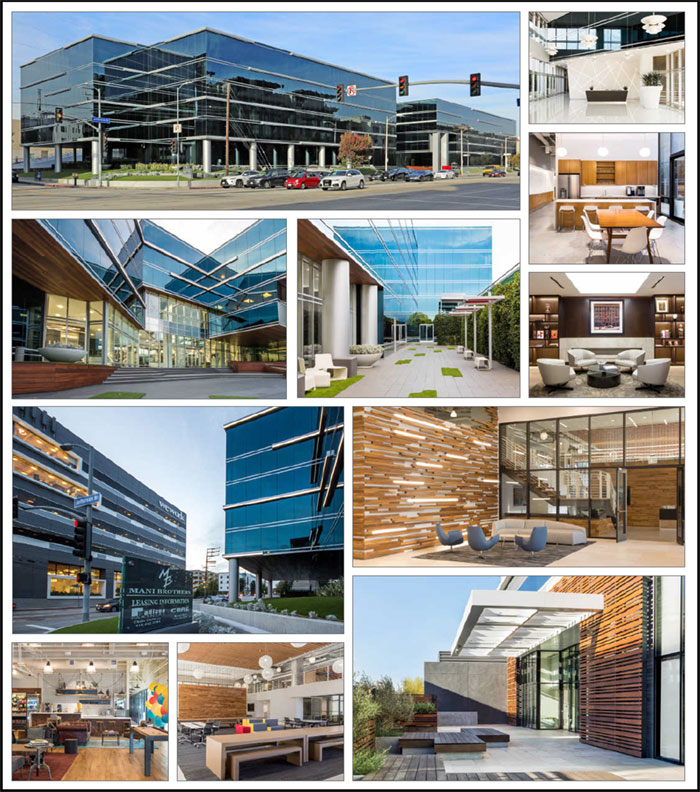
THE INFORMATION IN THIS STRUCTURAL AND COLLATERAL TERM SHEET IS NOT COMPLETE AND MAY BE AMENDED PRIOR TO THE TIME OF SALE. THIS TERM SHEET IS NOT AN OFFER TO SELL THESE SECURITIES AND IT IS NOT A SOLICITATION OF AN OFFER TO BUY THESE SECURITIES IN ANY JURISDICTION WHERE THE OFFER OR SALE IS NOT PERMITTED.
| | 42 of 95 | |
| Structural and Collateral Term Sheet | | JPMDB 2019-COR6 |
| |
| 12555 & 12655 Jefferson |
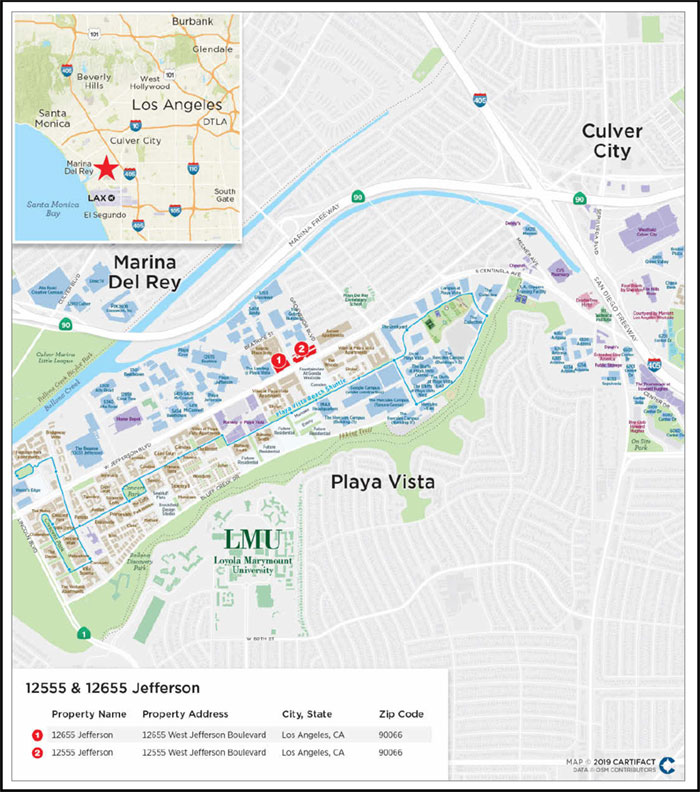
THE INFORMATION IN THIS STRUCTURAL AND COLLATERAL TERM SHEET IS NOT COMPLETE AND MAY BE AMENDED PRIOR TO THE TIME OF SALE. THIS TERM SHEET IS NOT AN OFFER TO SELL THESE SECURITIES AND IT IS NOT A SOLICITATION OF AN OFFER TO BUY THESE SECURITIES IN ANY JURISDICTION WHERE THE OFFER OR SALE IS NOT PERMITTED.
| | 43 of 95 | |
| Structural and Collateral Term Sheet | | JPMDB 2019-COR6 |
| |
| 12555 & 12655 Jefferson |
| Mortgage Loan Information | | Property Information |
| Mortgage Loan Seller: | LCM | | Single Asset / Portfolio: | Portfolio |
| Original Principal Balance(1): | $54,000,000 | | Title: | Fee |
| Cut-off Date Principal Balance(1): | $54,000,000 | | Property Type - Subtype: | Office – CBD |
| % of Pool by IPB: | 6.7% | | Net Rentable Area (SF): | 193,908 |
| Loan Purpose: | Refinance | | Location: | Los Angeles, CA |
| Borrowers: | Mani 12555 Jefferson (DE), LLC, | | Year Built / Renovated: | 1985 / Various |
| | Mani Jefferson Landing (DE), LLC | | Occupancy(3): | 88.0% |
| Sponsors: | Simon Mani, Daniel Mani | | Occupancy Date: | 9/1/2019 |
| Interest Rate: | 3.92500% | | Number of Tenants(3): | 8 |
| Note Date: | 9/16/2019 | | 2016 NOI(4): | N/A |
| Maturity Date: | 10/6/2029 | | 2017 NOI: | $6,414,993 |
| Interest-only Period: | 120 months | | 2018 NOI: | $7,943,743 |
| Original Term: | 120 months | | TTM NOI (as of 5/2019): | $8,177,002 |
| Original Amortization: | None | | UW Economic Occupancy: | 87.5% |
| Amortization Type: | Interest Only | | UW Revenues: | $12,691,019 |
| Call Protection(2): | L(25),Def(91),O(4) | | UW Expenses: | $4,254,586 |
| Lockbox / Cash Management: | Soft / Springing | | UW NOI: | $8,436,433 |
| Additional Debt(1): | Yes | | UW NCF: | $7,944,846 |
| Additional Debt Balance(1)(2): | $57,000,000 | | Appraised Value / Per SF: | $186,650,000 / $963 |
| Additional Debt Type(1)(2): | Pari Passu | | Appraisal Date: | 6/28/2019 |
| | | | | |
| Escrows and Reserves(5) | | Financial Information(1) |
| | Initial | Monthly | Initial Cap | | Cut-off Date Loan / SF: | | | | $572 | |
| Taxes: | $1,250,000 | $137,610 | N/A | | Maturity Date Loan / SF: | | | | $572 | |
| Insurance: | $6,000 | $5,900 | N/A | | Cut-off Date LTV: | | | | 59.5% | |
| Replacement Reserves: | $0 | $4,040 | N/A | | Maturity Date LTV: | | | | 59.5% | |
| TI/LC: | $2,538,191 | $16,159 | Various | | UW NCF DSCR: | | | | 1.80x | |
| Other | $3,544,603 | $0 | N/A | | UW NOI Debt Yield: | | | | 7.6% | |
| | | | | | | | |
| | | | | | | | |
|
| Sources and Uses |
| Sources | Proceeds | % of Total | | Uses | Proceeds | % of Total |
| Whole Loan(1) | $111,000,000 | 96.1% | | Payoff Existing Debt | $107,473,387 | 93.1% |
| Sponsor Equity | 4,482,179 | 3.9 | | Upfront Reserves | 7,338,794 | 6.4 |
| | | | | Closing Costs | 669,997 | 0.6 |
| Total Sources | $115,482,179 | 100.0% | | Total Uses | $115,482,179 | 100.0% |
| | | | | | | | | | | | | | | | |
| (1) | The 12555 & 12655 Jefferson Loan (as defined below) is part of a whole loan evidence by threepari passu notes, with an aggregate outstanding principal balance as of the Cut-off Date of $111.0 million. The Financial Information presented in the chart above reflects the Cut-off Date Balance of the $111.0 million 12555 & 12655 Jefferson Whole Loan (as defined below). |
| (2) | The lockout period will be at least 25 payment dates beginning with and including the first payment date of November 6, 2019. Defeasance of the full 12555 & 12655 Jefferson Whole Loan is permitted after the date that is the earlier to occur of the payment date that is (i) two years after the closing date of the securitization that includes the last pari passu note to be securitized and (ii) April 6, 2023. The assumed lockout period of 25 payments is based on the expected JPMDB 2019-COR6 securitization closing date in November 2019. The actual lockout period may be longer. |
| (3) | Occupancy and number of tenants excludes AegisMedia Americas, Inc. / Dentsu, which currently leases 17,867 square feet (9.2% of net rentable area) through November 30, 2023 but is currently dark. Including this tenant, the 12555 & 12655 Jefferson Properties (as defined below) are 97.2% leased. |
| (4) | 2016 NOI is not available as the 12555 & 12655 Jefferson Properties (as defined below) were significantly renovated during this time. |
| (5) | For a full description of Escrows and Reserves, please refer to“Escrows and Reserves”below. |
THE INFORMATION IN THIS STRUCTURAL AND COLLATERAL TERM SHEET IS NOT COMPLETE AND MAY BE AMENDED PRIOR TO THE TIME OF SALE. THIS TERM SHEET IS NOT AN OFFER TO SELL THESE SECURITIES AND IT IS NOT A SOLICITATION OF AN OFFER TO BUY THESE SECURITIES IN ANY JURISDICTION WHERE THE OFFER OR SALE IS NOT PERMITTED.
| | 44 of 95 | |
| Structural and Collateral Term Sheet | | JPMDB 2019-COR6 |
| |
| 12555 & 12655 Jefferson |
The Loan.The 12555 & 12655 Jefferson loan, with a principal balance of $54.0 million as of the Cut-off Date (the “12555 & 12655 Jefferson Loan”), is secured by a first mortgage lien on the borrowers’ fee simple interest in two adjacent office properties comprised of 193,908 square feet of net rentable area (the “12555 & 12655 Jefferson Properties”) located in Los Angeles, California. The 12555 & 12655 Jefferson Loan is part of a whole loan that has an aggregate outstanding principal balance as of the Cut-off Date of $111.0 million (the “12555 & 12655 Jefferson Whole Loan”) and is comprised of threepari passu notes, each as described in the “Whole Loan Summary” chart below. The controlling Note A-1, with an aggregate outstanding principal balance as of the Cut-off Date of $54.0 million, is being contributed to the JPMDB 2019-COR6 Trust. The non-controlling Notes A-2 and A-3, with an aggregate outstanding principal balance as of the Cut-off Date of $57.0 million is held by LCM or an affiliate and expected to be contributed to one or more future securitizations or may otherwise be transferred at any time. The relationship between the holders of the 12555 & 12655 Jefferson Whole Loan will be governed by a co-lender agreement as described under “Description of the Mortgage Pool—The Whole Loans—The Serviced Pari Passu Whole Loans” in the Preliminary Prospectus. The 12555 & 12655 Jefferson Loan has a 10-year term and will be interest only for the entire term.The most recent prior financing of the12555 & 12655 JeffersonProperties was not included in a securitization.
| Whole Loan Summary |
| Note | Original Balance | Cut-off Date Balance | Note Holder | Controlling Piece |
| A-1 | $54,000,000 | $54,000,000 | JPMDB 2019-COR6 | Yes |
| A-2 | 30,000,000 | 30,000,000 | LCM | No |
| A-3 | 27,000,000 | 27,000,000 | LCM | No |
| Total | $111,000,000 | $111,000,000 | | |
The Borrowers. The borrowing entities are Mani 12555 Jefferson (DE), LLC and Mani Jefferson Landing (DE), LLC, each a Delaware limited liability company and special purpose entity structured to be bankruptcy remote with two independent directors. Legal counsel to the borrowers delivered a non-consolidation opinion in connection with the origination of the 12555 & 12655 Jefferson Whole Loan.
The Loan Sponsors.The loan sponsors and nonrecourse carve-out guarantors are Simon Mani and Daniel Mani, on a joint and several basis. Simon Mani and Daniel Mani founded Mani Brothers Real Estate Investment Group, a privately-held real estate investment firm that owns, renovates, operates, manages and leases 1.3 million square feet of commercial property.
The loan sponsors acquired the 12655 Jefferson property (“The Landing”) in November 2017 for approximately $80.0 million. In addition to the purchase price of $80.0 million, the loans sponsors were responsible for the payment of approximately $1.2 million in rent abatements and approximately $800,000 in leasing commissions, increasing the effective purchase price to approximately $82.0 million. The prior owner, Hudson Pacific Properties (“HPP”), acquired The Landing physically vacant in 2014, but 100.0% leased to Edutrek International (“Edutrek”) under an existing lease that was to expire in July 2015 who vacated the building in 2009. After the Edutrek lease expired in July 2015, HPP commenced an approximately $10.0 million renovation including capital repairs, core and shell work and leasing costs to bring occupancy at The Landing to 100.0%.
The loans sponsors acquired the 12555 Jefferson property (“Twelve555”) in March 2015 for approximately $48.5 million in an off-market transaction. At the time of acquisition, Twelve555 was 60.4% leased. Since acquiring Twelve555, the loan sponsors commenced an approximately $8.0 million renovation to the common areas, lobby and the façade. Additionally, a new space on the first floor was created by enclosing a portion of the building on the ground level which added 4,127 rentable square feet. After completing the renovation, the loans sponsors secured a new 15-year lease with Providence Health System (“Providence”) (rated Aa3/AA-/AA- by Moody’s/Fitch/S&P) for the entire third floor, significantly increasing the value of Twelve555. The loans sponsors report a total cost basis in the 12555 & 12655 Jefferson Properties of approximately $138.5 million.
| Portfolio Summary |
| Property Name | Year Built /
Renovated | Total SF | % of Total | Occupancy(1)(2) | UW NOI | Allocated Whole
Loan Original
Balance | Appraised
Value |
| The Landing | 1985 / 2015-2016 | 100,756 | 52.0% | 82.3% | $3,709,962 | $56,000,000 | $94,150,000 |
| Twelve555 | 1985 / 2016-2017 | 93,152 | 48.0% | 94.1% | 4,726,471 | 55,000,000 | 92,500,000 |
| Total / Wtd. Avg. | | 193,908 | 100.0% | 88.0% | $8,436,433 | $111,000,000 | $186,650,000 |
| | | | | | | | | |
| (1) | Based on the underwritten rent rolls dated as of September 1, 2019. |
| (2) | Occupancy excludes AegisMedia Americas, Inc. / Dentsu, which currently leases 17,867 square feet (9.2% of net rentable area) through November 30, 2023 but is currently dark. Including this tenant, the 12555 & 12655 Jefferson Properties are 97.2% leased. |
THE INFORMATION IN THIS STRUCTURAL AND COLLATERAL TERM SHEET IS NOT COMPLETE AND MAY BE AMENDED PRIOR TO THE TIME OF SALE. THIS TERM SHEET IS NOT AN OFFER TO SELL THESE SECURITIES AND IT IS NOT A SOLICITATION OF AN OFFER TO BUY THESE SECURITIES IN ANY JURISDICTION WHERE THE OFFER OR SALE IS NOT PERMITTED.
| | 45 of 95 | |
| Structural and Collateral Term Sheet | | JPMDB 2019-COR6 |
| |
| 12555 & 12655 Jefferson |
The Properties.The 12555 & 12655 Jefferson Properties are comprised of two, adjacent, Class A office properties comprised of 193,908 square feet of net rentable area located on the north side of Jefferson Boulevard, between Centinela Avenue to the north and Lincoln Boulevard to the south, in the Playa Vista community within West Los Angeles.
The Landing is a six-story, multi-tenant, Class A office building situated on a 1.11-acre site. The Landing was built in 1985 and was most recently renovated over 2015-2016. The Landing also includes a parking garage totaling 268 spaces (approximately 2.7 spaces per 1,000 square feet). As of the September 1, 2019 underwritten rent roll, The Landing was 100.0% leased by two tenants; however, AegisMedia Americas, Inc. / Dentsu, which currently leases 17,867 square feet (9.2% of net rentable area) through November 30, 2023, is currently dark and has been excluded from the underwriting. Excluding AegisMedia Americas, Inc. / Dentsu, The Landing is 82.3% occupied at an underwritten base rent equal to $57.72 per square foot.
Twelve555 is six-story, multi-tenant, Class A office building situated on a 1.876-acre site. Twelve555 was built in 1985 and was most recently renovated over 2016-2017. Twelve555 also includes a parking garage totaling 307 spaces (approximately 3.3 spaces per 1,000 square feet). As of the September 1, 2019 underwritten rent roll, Twelve555 was 94.1% leased to seven tenants at a weighted average underwritten base rent equal to $47.55 per square foot.
As of the September 1, 2019 underwritten rent rolls, the 12555 & 12655 Jefferson Properties were 88.0% occupied by eight tenants at a weighted average underwritten base rent equal to $52.49 per square foot excluding AegisMedia Americas, Inc. / Dentsu, which currently leases 17,867 square feet (9.2% of net rentable area) through November 30, 2023 but is currently dark.
The largest tenant at the 12555 & 12655 Jefferson Properties is WeWork (82,889 square feet; 42.7% of net rentable area; 53.4% of underwritten base rent). WeWork provides furnished and fully-serviced shared workspaces, primarily to small and midmarket enterprises. WeWork has been a tenant since 2016 and has a lease expiration of August 2028 with one, five-year renewal option remaining and no termination options. WeWork currently pays UW base rent equal to $57.72 per square foot.
The second largest tenant at the 12555 & 12655 Jefferson Properties is Providence (35,562 square feet; 18.3% of net rentable area; 23.2% of underwritten base rent; rated Aa3/AA-/AA- by Moody’s/Fitch/S&P). Providence is the third largest not-for-profit health system in the United States. Providence’s system includes more than 82,000 employees with services including acute care, physician clinics, long-term and assisted living, palliative and hospice care, home health, supportive housing and education. Providence has been a tenant since2016 and has a lease expiration of July 2031 with two, five-year renewal options remaining and no termination options. Providence currently pays base rent equal to $49.83 per square foot. UW base rent of $58.41 is based on average rent over the loan term.
The third largest tenant at the 12555 & 12655 Jefferson Properties is Cardinia Real Estate (“Cardinia”) (15,955 square feet; 8.2% of net rentable area; 7.0% of underwritten base rent). Cardinia is a subsidiary of Ominicom Group, a global network of leading marketing communications companies which offers a range of marketing solutions including brand advertising, customer relationship management, media planning and buying services, public relations and numerous specialty communications services. Cardinia has been a tenant since 2018 and has a lease expiration ofSeptember 2024 with two renewal options (one, five-year and one, four-year) remaining and no termination options.Cardinia currently pays base rent equal to $37.95 per square foot. Cardinia’s base rent steps to $39.08 on 10/1/2020.
The 12555 & 12655 Jefferson Properties are located in the Marina Del Rey/Venice office submarket, within the overall Los Angeles office market. According to a market report, as of the third quarter of 2019, the overall Los Angeles office market contained approximately 443.2 million square feet across 18,715 buildings with an overall market vacancy of 9.8% and average asking rents of approximately $37.96 per square foot. As of the third quarter of 2019, the Marina Del Rey/Venice office submarket contained approximately 10.3 million square feet across 453 buildings with an overall market vacancy of 11.5% and average asking rents of approximately $59.65 per square foot.
The appraisals for 12555 & 12655 Jefferson Properties included 14 rent comparables. Of the 14 comparables, one was triple net (“NNN”) with the remaining 13 full service gross (“FSG”). The one NNN rent comparable was equal to $40.80 per square foot while the 13 FSG rent comparables ranged from $51.60 to $72.00 per square foot with a weighted average of approximately $62.97 per square foot.
THE INFORMATION IN THIS STRUCTURAL AND COLLATERAL TERM SHEET IS NOT COMPLETE AND MAY BE AMENDED PRIOR TO THE TIME OF SALE. THIS TERM SHEET IS NOT AN OFFER TO SELL THESE SECURITIES AND IT IS NOT A SOLICITATION OF AN OFFER TO BUY THESE SECURITIES IN ANY JURISDICTION WHERE THE OFFER OR SALE IS NOT PERMITTED.
| | 46 of 95 | |
| Structural and Collateral Term Sheet | | JPMDB 2019-COR6 |
| |
| 12555 & 12655 Jefferson |
| Historical and Current Occupancy(1) |
| 2016(2) | 2017 | 2018 | Current(3)(4) |
| N/A | 90.6% | 93.7% | 88.0% |
| (1) | Historical Occupancies are as of December 31 of eachrespective year. |
| (2) | 2016 Occupancy is not available as the 12555 & 12655 Jefferson Properties were significantly renovated during this time. |
| (3) | Current Occupancy is as of the rent rolls dated September 1, 2019. |
| (4) | Current Occupancy excludes AegisMedia Americas, Inc. / Dentsu, which currently leases 17,867 square feet (9.2% of net rentable area) through November 30, 2023 but is currently dark. Including this tenant, the 12555 & 12655 Jefferson Properties are 97.2% leased. |
| Tenant Summary(1) |
| Tenant | Ratings
Moody’s/Fitch/S&P(2) | Net Rentable
Area (SF) | % of
Total NRA | Base Rent
PSF(3) | % of Total
Base Rent(3) | Lease
Expiration Date |
| WeWork(4) | NR / CCC / B | 82,889 | 42.7% | $57.72 | 53.4% | 8/31/2028 |
| Providence Health System(4) | Aa3 / AA- / AA- | 35,562 | 18.3% | $58.41 | 23.2% | 7/31/2031 |
| Cardinia Real Estate(4) | Baa1 / NR / BBB+ | 15,955 | 8.2% | $39.08 | 7.0% | 9/30/2024 |
| Starkey Laboratories(4)(5) | NR / NR / NR | 11,595 | 6.0% | $36.81 | 4.8% | 8/31/2020 |
| KTGY Group(4) | NR / NR / NR | 8,407 | 4.3% | $36.86 | 3.5% | 1/14/2020 |
| Campus Explorer(4) | NR / NR / NR | 6,017 | 3.1% | $45.19 | 3.0% | 4/30/2021 |
| Randy Taylor Consulting(4) | NR / NR / NR | 5,834 | 3.0% | $43.88 | 2.9% | 6/30/2023 |
| Social Code(4) | NR / NR / NR | 4,292 | 2.2% | $47.21 | 2.3% | 7/31/2022 |
| Total Occupied Space | | 170,551 | 88.0% | $52.49 | 100.0% | |
| Vacant | | 23,357 | 12.0% | | | |
| Total | | 193,908 | 100.0% | | | |
| (1) | Based on the underwritten rent rolls dated as of September 1, 2019. |
| (2) | In certain instances, ratings provided are those of the parent company of the entity shown, whether or not the parent company guarantees the lease. |
| (3) | Base Rent includes approximately $178,693 in contractual rent steps through October 2020 for certain tenants and approximately $305,105 of average rent over the loan term for Providence Health System. |
| (4) | WeWork has one, five-year renewal option remaining, Providence Health System has two, five-year renewal options remaining, Cardinia Real Estate has one, four-year renewal option remaining and one five-year renewal option remaining, Starkey Laboratories has one, five-year renewal option remaining, KTGY Group has one, five-year renewal option remaining, Campus Explorer has one, three-year renewal option remaining, Randy Taylor Consulting has one, three-year renewal option remaining and Social Code has one, five-year renewal option remaining. |
| (5) | Starkey Laboratories subleases all of its space to Good Leaf, Inc. through August 31, 2020 at a base rent equal to $37.20 per square foot. |
| Lease Rollover Schedule(1) |
| Year | Number
of Leases
Expiring | Net
Rentable
Area
Expiring | % of
NRA
Expiring | Base Rent
Expiring(2) | % of Base
Rent
Expiring(2) | Cumulative
Net Rentable
Area
Expiring | Cumulative
% of NRA
Expiring | Cumulative
Base Rent
Expiring(2) | | Cumulative
% of Base
Rent
Expiring(2) |
| Vacant | NAP | 23,357 | 12.0% | NAP | NAP | 23,357 | 12.0% | NAP | NAP |
| 2019 & MTM | 0 | 0 | 0.0% | $0 | 0.0% | 23,357 | 12.0% | $0 | 0.0% |
| 2020 | 2 | 20,002 | 10.3% | 736,690 | 8.2% | 43,359 | 22.4% | $736,690 | 8.2% |
| 2021 | 1 | 6,017 | 3.1% | 271,934 | 3.0% | 49,376 | 25.5% | $1,008,624 | 11.3% |
| 2022 | 1 | 4,292 | 2.2% | 202,607 | 2.3% | 53,668 | 27.7% | $1,211,231 | 13.5% |
| 2023 | 1 | 5,834 | 3.0% | 255,984 | 2.9% | 59,502 | 30.7% | $1,467,215 | 16.4% |
| 2024 | 1 | 15,955 | 8.2% | 623,578 | 7.0% | 75,457 | 38.9% | $2,090,794 | 23.4% |
| 2025 | 0 | 0 | 0.0% | 0 | 0.0% | 75,457 | 38.9% | $2,090,794 | 23.4% |
| 2026 | 0 | 0 | 0.0% | 0 | 0.0% | 75,457 | 38.9% | $2,090,794 | 23.4% |
| 2027 | 0 | 0 | 0.0% | 0 | 0.0% | 75,457 | 38.9% | $2,090,794 | 23.4% |
| 2028 | 1 | 82,889 | 42.7% | 4,784,353 | 53.4% | 158,346 | 81.7% | $6,875,147 | 76.8% |
| 2029 | 0 | 0 | 0.0% | 0 | 0.0% | 158,346 | 81.7% | $6,875,147 | 76.8% |
| 2030 & Beyond | 1 | 35,562 | 18.3% | 2,077,101 | 23.2% | 193,908 | 100.0% | $8,952,248 | 100.0% |
| Total | 8 | 193,908 | 100.0% | $8,952,248 | 100.0% | | | | |
| | | | | | | | | | | |
| (1) | Based on the underwritten rent rolls dated September 1, 2019. |
| (2) | Base Rent Expiring includes approximately $178,693 in contractual rent steps through October 2020 for certain tenants and approximately $305,105 of average rent over the loan term for Providence Health System. |
THE INFORMATION IN THIS STRUCTURAL AND COLLATERAL TERM SHEET IS NOT COMPLETE AND MAY BE AMENDED PRIOR TO THE TIME OF SALE. THIS TERM SHEET IS NOT AN OFFER TO SELL THESE SECURITIES AND IT IS NOT A SOLICITATION OF AN OFFER TO BUY THESE SECURITIES IN ANY JURISDICTION WHERE THE OFFER OR SALE IS NOT PERMITTED.
| | 47 of 95 | |
| Structural and Collateral Term Sheet | | JPMDB 2019-COR6 |
| |
| 12555 & 12655 Jefferson |
| Operating History and Underwritten Net Cash Flow |
| | 2017 | 2018 | TTM(1) | Underwritten | Per Square Foot | %(2) |
| Rents in Place | $6,720,770 | $8,568,895 | $8,685,684 | $8,468,449 | $43.67 | 59.7% |
| Straight Line Rent(3) | 0 | 0 | 0 | 305,105 | 1.57 | 2.2 |
| Contractual Rent Steps(4) | 0 | 0 | 0 | 178,693 | 0.92 | 1.3 |
| Vacant Income | 0 | 0 | 0 | 1,482,532 | 7.65 | 10.5 |
| Gross Potential Rent | $6,720,770 | $8,568,895 | $8,685,684 | $10,434,780 | $53.81 | 73.6% |
| Total Reimbursements | 1,342,889 | 1,504,938 | 1,587,427 | 1,753,297 | 9.04 | 12.4 |
| Total Other Income(5) | 1,594,176 | 1,861,639 | 1,985,475 | 1,985,475 | 10.24 | 14.0 |
| Net Rental Income | $9,657,835 | $11,935,471 | $12,258,586 | $14,173,551 | $73.09 | 100.0% |
| (Vacancy/Credit Loss) | 0 | 0 | 0 | (1,482,532) | (7.65) | (10.5) |
| Effective Gross Income | $9,657,835 | $11,935,471 | $12,258,586 | $12,691,019 | $65.45 | 89.5% |
| | | | | | | |
| Total Expenses | $3,242,842 | $3,991,728 | $4,081,585 | $4,254,586 | $21.94 | 33.5% |
| | | | | | | |
| Net Operating Income | $6,414,993 | $7,943,743 | $8,177,002 | $8,436,433 | $43.51 | 66.5% |
| | | | | | | |
| Total TI/LC, CapEx/RR | 0 | 0 | 0 | 491,587 | 2.54 | 3.9 |
| | | | | | | |
| Net Cash Flow | $6,414,993 | $7,943,743 | $8,177,002 | $7,944,846 | $40.97 | 62.6% |
| | | | | | | | | | | | |
| (1) | TTM column represents the trailing 12-month period ending May 31, 2019. |
| (2) | % column represents percent of Net Rental Income for all revenue lines and represents percent of Effective Gross Income for the remainder of the fields. |
| (3) | Based on the average rent over the loan term for investment grade tenant Providence Health System. |
| (4) | Based on the contractual rent steps through October 2020 for certain tenants. |
| (5) | Total Other Income includes parking income ($1,966,366) and miscellaneous other income ($19,109). |
Property Management.The 12555 & 12655 Jefferson Properties are managed by Mani Brothers, LLC, an affiliate of the borrowers.
Escrows and Reserves. At origination, the borrowers deposited into escrow $3,500,000 for an Earnout Reserve (as defined below), $2,538,191 for outstanding tenant improvements and leasing commissions, $1,250,000 for real estate taxes, $44,603 for outstanding free rent and $6,000 for insurance premiums.
Tax Escrows– On a monthly basis,the borrowers are required to escrow 1/12 of the annual estimated tax payments, which currently equates to $137,610.
Insurance Escrows– On a monthly basis,the borrowers are required to escrow 1/12 of the annual estimated insurance premiums, which currently equates to $5,900.
Replacement Reserves –On a monthly basis, the borrowers are required to escrow approximately $4,040 for replacement reserves.
TI/LC Reserves – On a monthly basis, the borrowers are required to escrow $16,159 for tenant improvements and leasing commissions, subject to a cap of (i) $1,000,000 if the 12555 & 12655 Jefferson Properties are less than 94.0% leased or (ii) $400,000 if 12555 & 12655 Jefferson Properties are greater than or equal to 94.0% leased.
Earnout Reserve– Provided no default or event of default has occurred and is continuing, the lender will release the $3,500,000 in the Earnout Reserve to the borrowers upon the 12555 & 12655 Jefferson Properties achieving a debt yield equal to or greater than 7.5%.
THE INFORMATION IN THIS STRUCTURAL AND COLLATERAL TERM SHEET IS NOT COMPLETE AND MAY BE AMENDED PRIOR TO THE TIME OF SALE. THIS TERM SHEET IS NOT AN OFFER TO SELL THESE SECURITIES AND IT IS NOT A SOLICITATION OF AN OFFER TO BUY THESE SECURITIES IN ANY JURISDICTION WHERE THE OFFER OR SALE IS NOT PERMITTED.
| | 48 of 95 | |
| Structural and Collateral Term Sheet | | JPMDB 2019-COR6 |
| |
| 12555 & 12655 Jefferson |
Lockbox / Cash Management.The 12555 & 12655 Jefferson Whole Loan is structured with a soft lockbox and springing cash management. All rents are required to be deposited into a lockbox account within one business day of receipt by the borrower or property manager. All funds in the lockbox account are required to be swept daily into the borrowers’ operating account, unless a Cash Management Period (as defined below) is continuing. Upon the occurrence of a Cash Management Period, funds in the lockbox account will be swept daily into a lender-controlled account, from which account such funds will be disbursed on each payment date in accordance with the 12555 & 12655 Jefferson Whole Loan documents and any excess will be retained by the lender as additional collateral for the 12555 & 12655 Jefferson Whole Loan.
A “Cash Management Period” will commence (i) upon an event of default, (ii) if the debt yield is less than 5.4% (a “Cash Management Debt Yield Trigger”) (until such time that the debt yield is greater than or equal to 5.4% for two consecutive quarters) or (iii) upon a Lease Sweep Period (as defined below).
Notwithstanding the foregoing, the borrowers may avoid the commencement or continuance of Cash Management Period by depositing with lender cash or a letter of credit (“LOC”) which (i) with respect to a Cash Management Debt Yield Trigger, the amount of such cash or LOC when added to the net operating income of the 12555 & 12655 Jefferson Properties would result in a debt yield that is equal to or greater than 5.4% or (ii) with respect to a Cash Management Period triggered by a Lease Sweep Period, cash or an LOC in an amount equal to $1,300,000.
A “Lease Sweep Period” will commence (i) with respect to the WeWork or Providence leases (but not any other lease that is a Lease Sweep Lease (as defined below)), upon the earlier to occur of (x) on the date that is 12 months prior to the end of the lease term (including any renewal terms), or (y) on the date by which the applicable Lease Sweep Tenant (defined below) is required to give notice of its exercise of a renewal option under the Leases Sweep Lease (and such renewal has not so been exercised), (ii) if any Lease Sweep Lease is surrendered, cancelled or terminated prior to its then-current expiration date, (iii) if any Lease Sweep Tenant goes dark or gives notice that it intends to discontinue its business at its premises, (iv) upon the occurrence and continuance of a monetary or material non-monetary default under any Lease Sweep Lease or (vi) upon the occurrence of a Lease Sweep Tenant insolvency proceeding.
Notwithstanding the foregoing, the borrowers may avoid the commencement or continuance of a Lease Sweep Period, provided that borrowers deposit with lender cash or a LOC in an amount equal to $2,200,000.
A “Lease Sweep Lease” means the WeWork lease, the Providence lease and any other lease which covers 25,000 or more square feet.
A “Lease Sweep Tenant” means any tenant under a Lease Sweep Lease, or under one or more leases (leased by such tenant and/or its affiliates) which when taken together would constitute a Lease Sweep Lease.
Additional Debt. None permitted.
Release Provisions. None permitted.
THE INFORMATION IN THIS STRUCTURAL AND COLLATERAL TERM SHEET IS NOT COMPLETE AND MAY BE AMENDED PRIOR TO THE TIME OF SALE. THIS TERM SHEET IS NOT AN OFFER TO SELL THESE SECURITIES AND IT IS NOT A SOLICITATION OF AN OFFER TO BUY THESE SECURITIES IN ANY JURISDICTION WHERE THE OFFER OR SALE IS NOT PERMITTED.
| | 49 of 95 | |
| Structural and Collateral Term Sheet | | JPMDB 2019-COR6 |
| |
| Hyde Park Multifamily Portfolio |
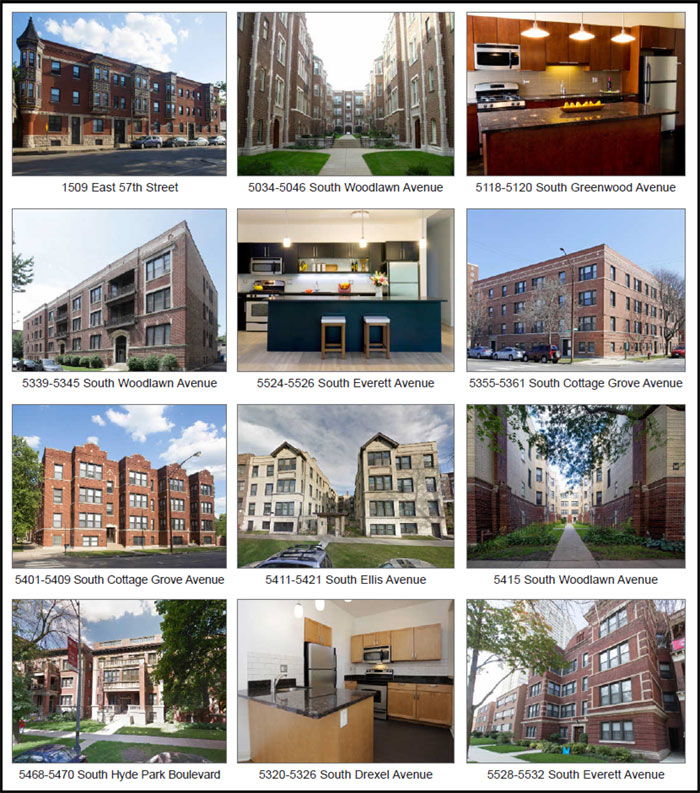
THE INFORMATION IN THIS STRUCTURAL AND COLLATERAL TERM SHEET IS NOT COMPLETE AND MAY BE AMENDED PRIOR TO THE TIME OF SALE. THIS TERM SHEET IS NOT AN OFFER TO SELL THESE SECURITIES AND IT IS NOT A SOLICITATION OF AN OFFER TO BUY THESE SECURITIES IN ANY JURISDICTION WHERE THE OFFER OR SALE IS NOT PERMITTED.
| | 50 of 95 | |
| Structural and Collateral Term Sheet | | JPMDB 2019-COR6 |
| |
| Hyde Park Multifamily Portfolio |
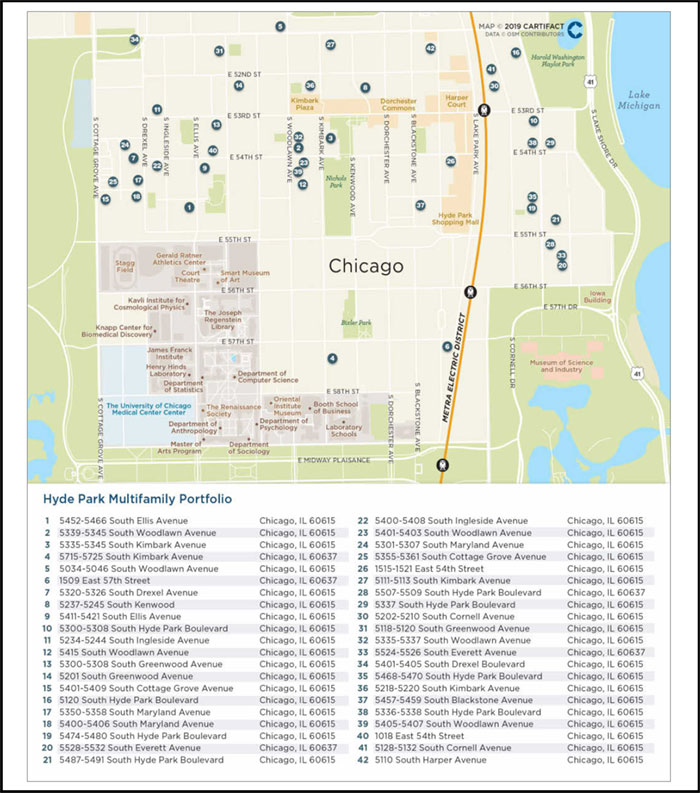
THE INFORMATION IN THIS STRUCTURAL AND COLLATERAL TERM SHEET IS NOT COMPLETE AND MAY BE AMENDED PRIOR TO THE TIME OF SALE. THIS TERM SHEET IS NOT AN OFFER TO SELL THESE SECURITIES AND IT IS NOT A SOLICITATION OF AN OFFER TO BUY THESE SECURITIES IN ANY JURISDICTION WHERE THE OFFER OR SALE IS NOT PERMITTED.
| | 51 of 95 | |
| Structural and Collateral Term Sheet | | JPMDB 2019-COR6 |
| |
| Hyde Park Multifamily Portfolio |
| Mortgage Loan Information | | Properties Information |
| Mortgage Loan Seller: | LCM | | Single Asset / Portfolio: | Portfolio |
| Original Principal Balance(1): | $46,750,000 | | Title: | Fee |
| Cut-off Date Principal Balance(1): | $46,750,000 | | Properties Type – Subtype: | Multifamily – Various |
| % of Pool by IPB: | 5.8% | | Net Rentable Area (Units)(3): | 839 |
| Loan Purpose: | Refinance | | Location: | Chicago, IL |
| Borrowers(2): | Various | | Year Built/Renovated: | Various / Various |
| Sponsor: | Lyrical-Antheus Realty Partners | | Occupancy(3): | 94.5% |
| | II, L.P. | | Occupancy Date: | 7/31/2019 |
| Interest Rate: | 4.55400% | | Number of Tenants: | N/A |
| Note Date: | 1/30/2019 | | 2016 NOI: | $7,979,218 |
| Maturity Date: | 2/6/2029 | | 2017 NOI: | $8,478,846 |
| Interest-only Period: | 120 months | | 2018 NOI: | $8,692,956 |
| Original Term: | 120 months | | TTM NOI (as of 7/2019): | $8,889,707 |
| Original Amortization: | None | | UW Economic Occupancy: | 89.2% |
| Amortization Type: | Interest Only | | UW Revenues: | $15,559,768 |
| Call Protection: | L(33),Def(80),O(7) | | UW Expenses: | $6,319,284 |
| Lockbox / Cash Management: | Springing / Springing | | UW NOI: | $9,240,484 |
| Additional Debt: | Yes | | UW NCF: | $8,988,484 |
| Additional Debt Balance(1): | $60,000,000 / $15,250,000 | | Appraised Value / Per Unit: | $176,385,000 / $210,232 |
| Additional Debt Type(1): | Pari Passu / Mezzanine Loan | | Appraisal Date: | 12/3/2018 |
| | | | | |
| Escrows and Reserves(4) | | Financial Information(1) |
| | Initial | Monthly | Initial Cap | | | Whole Loan | Total Debt |
| Taxes: | $700,000 | $119,000 | N/A | | Cut-off Date Loan / Unit: | $127,235 | $145,411 |
| Insurance: | $225,000 | Springing | N/A | | Maturity Date Loan / Unit: | $127,235 | $145,411 |
| Replacement Reserves: | $0 | $17,580 | N/A | | Cut-off Date LTV: | 60.5% | 69.2% |
| TI/LC: | $0 | $0 | N/A | | Maturity Date LTV: | 60.5% | 69.2% |
| Other: | $0 | $0 | N/A | | UW NCF DSCR: | 1.82x | 1.48x |
| | | | | | UW NOI Debt Yield: | 8.7% | 7.6% |
| | | | | | | | |
| Sources and Uses |
| Sources | Proceeds | % of Total | | Uses | Proceeds | % of Total |
| Whole Loan(1) | $106,750,000 | 87.5% | | Payoff Existing Debt | $115,181,393 | 94.4% |
| Mezzanine Loan | 15,250,000 | 12.5 | | Closing Costs | 3,504,348 | 2.9% |
| | | | | Upfront Reserves | 925,000 | 0.8% |
| | | | | Return of Equity | 2,389,259 | 2.0% |
| Total Sources | $122,000,000 | 100.0% | | Total Uses | $122,000,000 | 100.0% |
| (1) | The Hyde Park Multifamily Portfolio Loan (as defined below) is part of a whole loan evidenced by twopari passu notes, with an aggregate outstanding principal balance as of the Cut-off Date of approximately $106.8 million. The Financial Information presented in the chart above reflects the Cut-off Date balance of the approximately $106.8 million Hyde Park Multifamily Portfolio Whole Loan (as defined below). |
| (2) | The borrowers are 1515-1521 E. 54th Street, LLC, 5034-5046 S. Woodlawn, LLC, 5111 S. Kimbark, LLC, 5118-5120 S. Greenwood, LLC, 5120 S. Hyde Park, LLC, 5128-5132 S. Cornell, LLC, 5202-5210 S. Cornell, LLC, 5218-5220 S. Kimbark, LLC, 5234-5244 S. Ingleside, LLC, 5237-5245 S. Kenwood, LLC, 5300-5308 S. Hyde Park, LLC, 5301-5307 S. Maryland, LLC, 5320-5326.5 S. Drexel, LLC, 5335-5337 S. Woodlawn, LLC, 5336-5338 S. Hyde Park, LLC, 5337 S. Hyde Park, LLC, 5350-5358 S. Maryland, LLC, 5400-5408 S. Ingleside, LLC, 5401-5403 S. Woodlawn, LLC, 5405-5407 S. Woodlawn, LLC, 5415 S. Woodlawn, LLC, 5452-5466 S. Ellis, LLC, 5457-5459 S. Blackstone, LLC, 5474-5480 S. Hyde Park, LLC, 5487-5491 S. Hyde Park, LLC, 5528-5532 S. Everett, LLC, 5715-5725 S. Kimbark, LLC, Greenwood 5201, LLC, 5524-5526 S. Everett, LLC, 5400-5406 S. Maryland, LLC, 5300-5308 S. Greenwood, LLC, 5335-5345 S. Kimbark, LLC, 5339-5345 S. Woodlawn, LLC, 5355-5361 S. Cottage Grove, LLC, 5401-5409 S. Cottage Grove, LLC, 5401-5405 S. Drexel, LLC, 5411-5421 S. Ellis, LLC, 5468-70 S. Hyde Park, LLC, 1509-1517 E. 57th Street, LLC, 5507-5509 S. Hyde Park, LLC, 1018 E. 54th Street Owner, LLC and 5110 S. Harper, LLC. |
| (3) | The Hyde Park Multifamily Portfolio Properties (as defined below) include 835 residential units that average approximately 891 square feet that are 94.5% occupied and four commercial retail units that average approximately 2,766 square feet and are 100.0% occupied as of the underwritten July 31, 2019 rent rolls. |
| (4) | For a full description of Escrows and Reserves, please refer to the “Escrows and Reserves” below. |
THE INFORMATION IN THIS STRUCTURAL AND COLLATERAL TERM SHEET IS NOT COMPLETE AND MAY BE AMENDED PRIOR TO THE TIME OF SALE. THIS TERM SHEET IS NOT AN OFFER TO SELL THESE SECURITIES AND IT IS NOT A SOLICITATION OF AN OFFER TO BUY THESE SECURITIES IN ANY JURISDICTION WHERE THE OFFER OR SALE IS NOT PERMITTED.
| | 52 of 95 | |
| Structural and Collateral Term Sheet | | JPMDB 2019-COR6 |
| |
| Hyde Park Multifamily Portfolio |
The Loan. The Hyde Park Multifamily Portfolio loan, with an original principal balance of approximately $46.8 million (the “Hyde Park Multifamily Portfolio Loan”), is secured by a first mortgage lien on the borrowers’ fee simple interests in 41 multifamily properties (with a total of 835 residential units and four commercial units) and one surface parking lot (with 28 parking spaces) (collectively, the “Hyde Park Multifamily Portfolio Properties” or the “Hyde Park Multifamily Portfolio”) located in the Hyde Park neighborhood of Chicago, Illinois. The Hyde Park Multifamily Portfolio Loan is part of a whole loan that has an aggregate original principal balance as of the Cut-off Date of approximately $106.8 million (the “Hyde Park Multifamily Portfolio Whole Loan”) and is comprised of twopari passu notes, each as described in the “Whole Loan Summary” chart below. The non-controlling Note A-2, with an outstanding principal balance as of the Cut-off Date of approximately $46.8 million, is being contributed to the JPMDB 2019-COR6 Trust. The controlling Note A-1, with an original principal balance as of the Cut-off Date of $60.0 million was contributed to the JPMCC 2019-COR5 Trust. The relationship between the holders of the Hyde Park Multifamily Portfolio Whole Loan will be governed by a co-lender agreement as described under “Description of the Mortgage Pool—The Whole Loans—The Non-Serviced Pari Passu Whole Loans” in the Preliminary Prospectus. The Hyde Park Multifamily Portfolio Whole Loan has a 10-year term and will be interest only for the entire term. The previously existing debt was not included in a securitization.
| Whole Loan Summary |
| Notes | Original Balance | Cut-off Date Balance | Note Holder | Controlling Piece |
| A-1 | $60,000,000 | $60,000,000 | JPMCC 2019-COR5 | Yes |
| A-2 | 46,750,000 | 46,750,000 | JPMDB 2019-COR6 | No |
| Total | $106,750,000 | $106,750,000 | | |
The Borrowers. The borrowing entities are 1515-1521 E. 54th Street, LLC, 5034-5046 S. Woodlawn, LLC, 5111 S. Kimbark, LLC, 5118-5120 S. Greenwood, LLC, 5120 S. Hyde Park, LLC, 5128-5132 S. Cornell, LLC, 5202-5210 S. Cornell, LLC, 5218-5220 S. Kimbark, LLC, 5234-5244 S. Ingleside, LLC, 5237-5245 S. Kenwood, LLC, 5300-5308 S. Hyde Park, LLC, 5301-5307 S. Maryland, LLC, 5320-5326.5 S. Drexel, LLC, 5335-5337 S. Woodlawn, LLC, 5336-5338 S. Hyde Park, LLC, 5337 S. Hyde Park, LLC, 5350-5358 S. Maryland, LLC, 5400-5408 S. Ingleside, LLC, 5401-5403 S. Woodlawn, LLC, 5405-5407 S. Woodlawn, LLC, 5415 S. Woodlawn, LLC, 5452-5466 S. Ellis, LLC, 5457-5459 S. Blackstone, LLC, 5474-5480 S. Hyde Park, LLC, 5487-5491 S. Hyde Park, LLC, 5528-5532 S. Everett, LLC, 5715-5725 S. Kimbark, LLC, Greenwood 5201, LLC, 5524-5526 S. Everett, LLC, 5400-5406 S. Maryland, LLC, 5300-5308 S. Greenwood, LLC, 5335-5345 S. Kimbark, LLC, 5339-5345 S. Woodlawn, LLC, 5355-5361 S. Cottage Grove, LLC, 5401-5409 S. Cottage Grove, LLC, 5401-5405 S. Drexel, LLC, 5411-5421 S. Ellis, LLC, 5468-70 S. Hyde Park, LLC, 1509-1517 E. 57th Street, LLC, 5507-5509 S. Hyde Park, LLC, 1018 E. 54th Street Owner, LLC and 5110 S. Harper, LLC, each a Delaware limited liability company and special purpose entity structured to be bankruptcy remote with one independent director. Legal counsel to the borrowers delivered a non-consolidation opinion in connection with the origination of the Hyde Park Multifamily Portfolio Whole Loan.
The Loan Sponsor. The loan sponsor and nonrecourse carve-out guarantor is Lyrical-Antheus Realty Partners II, L.P., an affiliate of Antheus Capital. Antheus Capital is a private real estate company focused on the acquisition, development and redevelopment of apartment properties in select submarkets located throughout the United States. Antheus Capital was founded in 2002 by Eli Ungar and David Gefsky. Antheus Capital’s current portfolio consists of approximately 7,800 units and approximately 365,000 square feet of commercial space. Antheus Capital is one of the largest multifamily owners in the Hyde Park neighborhood.
THE INFORMATION IN THIS STRUCTURAL AND COLLATERAL TERM SHEET IS NOT COMPLETE AND MAY BE AMENDED PRIOR TO THE TIME OF SALE. THIS TERM SHEET IS NOT AN OFFER TO SELL THESE SECURITIES AND IT IS NOT A SOLICITATION OF AN OFFER TO BUY THESE SECURITIES IN ANY JURISDICTION WHERE THE OFFER OR SALE IS NOT PERMITTED.
| | 53 of 95 | |
| Structural and Collateral Term Sheet | | JPMDB 2019-COR6 |
| |
| Hyde Park Multifamily Portfolio |
| Portfolio Summary |
| Property | Year Built / Renovated | # of
Units | % of
Total | Occupancy(1) | UW NOI | Allocated
Whole Loan
Amount | Appraised
Value |
| 5452-5466 South Ellis Avenue | 1913 / 2000 | 31 | 3.7% | 90.3% | $463,480 | $5,023,463 | $8,275,000 |
| 5339-5345 South Woodlawn Avenue | 1912 / Various | 25 | 3.0% | 84.0% | 412,008 | 4,568,200 | 7,525,000 |
| 5335-5345 South Kimbark Avenue | 1913 / 2000 | 25 | 3.0% | 88.0% | 388,898 | 4,401,250 | 7,250,000 |
| 5715-5725 South Kimbark Avenue | 1911 / 2000 | 19 | 2.3% | 100.0% | 362,864 | 4,234,300 | 6,975,000 |
| 5034-5046 South Woodlawn Avenue | 1920 / 2000 | 45 | 5.4% | 100.0% | 398,684 | 4,128,075 | 6,800,000 |
| 1509 East 57th Street | 1888 / 2010 | 22 | 2.6% | 63.6% | 378,166 | 4,067,350 | 6,700,000 |
| 5320-5326 South Drexel Avenue | 1923 / 2009 | 31 | 3.7% | 87.1% | 313,233 | 3,748,675 | 6,175,000 |
| 5237-5245 South Kenwood(2) | 1910 / 2000 | 19 | 2.3% | 100.0% | 314,697 | 3,703,088 | 6,100,000 |
| 5411-5421 South Ellis Avenue | 1917 / 2000 | 31 | 3.7% | 90.3% | 337,744 | 3,627,225 | 5,975,000 |
| 5300-5308 South Hyde Park Boulevard | 1912 / 2000 | 38 | 4.5% | 100.0% | 284,575 | 3,369,275 | 5,550,000 |
| 5234-5244 South Ingleside Avenue | 1912 / 2010 | 23 | 2.7% | 95.7% | 298,584 | 3,323,688 | 5,475,000 |
| 5415 South Woodlawn Avenue | 1927 / Various | 38 | 4.5% | 97.4% | 323,248 | 3,308,550 | 5,450,000 |
| 5300-5308 South Greenwood Avenue | 1914 / 2000 | 25 | 3.0% | 92.0% | 282,903 | 3,293,325 | 5,425,000 |
| 5201 South Greenwood Avenue | 1914 / 2000 | 24 | 2.9% | 100.0% | 254,029 | 2,883,563 | 4,750,000 |
| 5401-5409 South Cottage Grove Avenue(2) | 1914 / 2010 | 22 | 2.6% | 100.0% | 236,969 | 2,868,425 | 4,725,000 |
| 5120 South Hyde Park Boulevard | 1923 / 2000 | 40 | 4.8% | 100.0% | 230,974 | 2,504,163 | 4,125,000 |
| 5350-5358 South Maryland Avenue | 1915 / 2010 | 21 | 2.5% | 95.2% | 204,334 | 2,482,900 | 4,160,000 |
| 5400-5406 South Maryland Avenue | 1897 / 2010 | 18 | 2.1% | 88.9% | 224,026 | 2,473,800 | 4,075,000 |
| 5474-5480 South Hyde Park Boulevard | 1910 / 2000 | 29 | 3.5% | 93.1% | 226,878 | 2,458,663 | 4,050,000 |
| 5528-5532 South Everett Avenue | 1912 / 2000 | 34 | 4.1% | 100.0% | 216,566 | 2,397,938 | 3,950,000 |
| 5487-5491 South Hyde Park Boulevard | 1905 / 2018 | 7 | 0.8% | 100.0% | 185,459 | 2,367,575 | 3,900,000 |
| 5400-5408 South Ingleside Avenue | 1916 / 2010 | 19 | 2.3% | 84.2% | 206,995 | 2,352,350 | 3,875,000 |
| 5401-5403 South Woodlawn Avenue | 1899 / 2000 | 12 | 1.4% | 100.0% | 208,822 | 2,276,488 | 3,750,000 |
| 5301-5307 South Maryland Avenue | 1897 / 2009 | 21 | 2.5% | 100.0% | 183,770 | 2,230,988 | 3,675,000 |
| 5355-5361 South Cottage Grove Avenue | 1910 / 2010 | 21 | 2.5% | 95.2% | 171,109 | 2,215,763 | 3,650,000 |
| 1515-1521 East 54th Street | 1916 / 2000 | 16 | 1.9% | 93.8% | 183,996 | 2,191,525 | 3,690,000 |
| 5111-5113 South Kimbark Avenue | 1910 / 2011 | 8 | 1.0% | 87.5% | 174,372 | 2,142,963 | 3,570,000 |
| 5507-5509 South Hyde Park Boulevard | 1906 / 2017 | 7 | 0.8% | 100.0% | 166,384 | 2,094,400 | 3,460,000 |
| 5337 South Hyde Park Boulevard | 1919 / 2000 | 23 | 2.7% | 100.0% | 161,470 | 2,048,900 | 3,375,000 |
| 5202-5210 South Cornell Avenue | 1907 / 2000 | 27 | 3.2% | 100.0% | 177,305 | 1,991,150 | 3,280,000 |
| 5118-5120 South Greenwood Avenue | 1912 / 2011 | 6 | 0.7% | 100.0% | 133,886 | 1,803,025 | 2,990,000 |
| 5335-5337 South Woodlawn Avenue | 1909 / 2000 | 6 | 0.7% | 100.0% | 129,701 | 1,724,100 | 2,880,000 |
| 5524-5526 South Everett Avenue | 1910 / 2017 | 7 | 0.8% | 100.0% | 137,584 | 1,699,775 | 2,820,000 |
| 5401-5405 South Drexel Boulevard | 1915 / 2010 | 13 | 1.5% | 84.6% | 131,433 | 1,532,825 | 2,525,000 |
| 5468-5470 South Hyde Park Boulevard | 1903 / 2000 | 6 | 0.7% | 100.0% | 112,987 | 1,517,688 | 2,500,000 |
| 5218-5220 South Kimbark Avenue | 1903 / 2000 | 6 | 0.7% | 100.0% | 124,751 | 1,511,563 | 2,520,000 |
| 5457-5459 South Blackstone Avenue | 1908 / 2000 | 19 | 2.3% | 89.5% | 122,700 | 1,335,513 | 2,380,000 |
| 5336-5338 South Hyde Park Boulevard | 1912 / 2000 | 19 | 2.3% | 100.0% | 109,195 | 1,244,513 | 2,050,000 |
| 5405-5407 South Woodlawn Avenue | 1921 / 2000 | 18 | 2.1% | 100.0% | 125,162 | 1,123,063 | 1,850,000 |
| 1018 East 54th Street | 1915 / 2000 | 9 | 1.1% | 77.8% | 72,257 | 1,056,300 | 1,760,000 |
| 5128-5132 South Cornell Avenue | 1905 / 2000 | 9 | 1.1% | 100.0% | 57,679 | 922,775 | 1,550,000 |
| 5110 South Harper Avenue(3) | NAP | 0 | NAP | 100.0% | 10,603 | 500,842 | 825,000 |
| Total / Wtd. Avg. | | 839 | 100.0% | 94.5% | $9,240,484 | $106,750,000 | $176,385,000 |
| (1) | Based on the underwritten rent rolls dated July 31, 2019. |
| (2) | Properties contain four commercial retail units that average 2,766 square feet. |
| (3) | Represents the 28-space, income producing parking lot. |
THE INFORMATION IN THIS STRUCTURAL AND COLLATERAL TERM SHEET IS NOT COMPLETE AND MAY BE AMENDED PRIOR TO THE TIME OF SALE. THIS TERM SHEET IS NOT AN OFFER TO SELL THESE SECURITIES AND IT IS NOT A SOLICITATION OF AN OFFER TO BUY THESE SECURITIES IN ANY JURISDICTION WHERE THE OFFER OR SALE IS NOT PERMITTED.
| | 54 of 95 | |
| Structural and Collateral Term Sheet | | JPMDB 2019-COR6 |
| |
| Hyde Park Multifamily Portfolio |
The Properties. The Hyde Park Multifamily Portfolio Properties are comprised of 41 mid-rise and garden apartment buildings and one income producing parking lot. The Hyde Park Multifamily Portfolio Properties are all located within a 1.5-mile radius and are comprised of 835 residential units totaling 743,704 square feet and four commercial retail units totaling 11,062 square feet. As of the July 31, 2019 rent rolls, the Hyde Park Multifamily Portfolio was 94.5% occupied with no single Hyde Park Multifamily Portfolio Property accounting for more than approximately 5.0% of underwritten net operating income. The 835 residential units average approximately 891 square feet and are 94.5% occupied and the four commercial units average approximately 2,766 square feet and are 100.0% occupied as of the July 31, 2019 rent rolls.
The Hyde Park Multifamily Portfolio Properties include 81 studio units, 229 one-bedroom units, 271 two-bedroom units, 173 three-bedroom units, 64 four-bedroom units, 14 five-bedroom units, three six-bedroom units, four commercial retail units and one income producing parking lot.
The Hyde Park Multifamily Portfolio Properties are concentrated in the south-side Chicago neighborhood of Hyde Park. Hyde Park is located approximately six miles south of the Chicago central business district and is home to several institutional demand drivers including the University of Chicago, University of Chicago Medical Center and the Museum of Science and Industry. As of 2017, the University of Chicago had a total enrollment of 16,016 students, of whom 5,971 were undergraduate and 10,045 were post-graduate.
According to a market report, the Hyde Park Multifamily Portfolio falls within the Bronzeville/Hyde Park/South Shore submarket within the Chicago-Naperville-Elgin, Illinois-Indiana-Wisconsin metropolitan statistical area. Effective rent in the Bronzeville/Hyde Park/South Shore submarket increased slightly from $1,340 per unit per month in the second quarter of 2019 to $1,358 per unit per month in the third quarter of 2019. The submarket’s occupancy rate was equal to 94.9% in the third quarter of 2019, while the submarket’s occupancy rate has averaged 94.6% since the second quarter of 1996.
| Historical and Current Occupancy(1) |
| 2014 | 2015 | 2016 | 2017 | 2018 | Current(2) |
| 90.5% | 90.7% | 90.9% | 90.0% | 90.1% | 94.5% |
| (1) | Historical Occupancies are as of December 31 of each respective year. |
| (2) | Current occupancy is as of July 31, 2019. |
| Multifamily Unit Mix(1) |
| Unit Type | # of
Units | % of
Total | Occupied
Units | Occupancy(2) | Average Unit Size (SF) | Average
Monthly
Rental
Rate | Average
Monthly
Rental
Rate PSF | Average
Monthly
Market
Rent | Average
Monthly
Market
Rent PSF |
| Studio | 81 | 9.7% | 81 | 100.0% | 368 | $893 | $2.43 | $862 | $2.34 |
| 1 Bedroom | 229 | 27.4% | 220 | 96.1% | 655 | $1,200 | $1.85 | $1,190 | $1.82 |
| 2 Bedroom | 271 | 32.5% | 262 | 96.7% | 886 | $1,527 | $1.72 | $1,501 | $1.69 |
| 3 Bedroom | 173 | 20.7% | 153 | 88.4% | 1,098 | $2,115 | $1.91 | $2,049 | $1.87 |
| 4 Bedroom | 64 | 7.7% | 56 | 87.5% | 1,537 | $2,902 | $1.84 | $2,777 | $1.81 |
| 5 Bedroom | 14 | 1.7% | 14 | 100.0% | 1,992 | $3,260 | $1.64 | $3,165 | $1.59 |
| 6 Bedroom | 3 | 0.4% | 3 | 100.0% | 2,570 | $3,865 | $1.50 | $3,830 | $1.49 |
| Total / Wtd. Avg. | 835 | 100.0% | 789 | 94.5% | 891 | $1,622 | $1.83 | $1,584 | $1.80 |
| (1) | Based on the underwritten rent rolls dated July 31, 2019. |
| (2) | Occupancy is weighted based on the total occupied square footage. |
THE INFORMATION IN THIS STRUCTURAL AND COLLATERAL TERM SHEET IS NOT COMPLETE AND MAY BE AMENDED PRIOR TO THE TIME OF SALE. THIS TERM SHEET IS NOT AN OFFER TO SELL THESE SECURITIES AND IT IS NOT A SOLICITATION OF AN OFFER TO BUY THESE SECURITIES IN ANY JURISDICTION WHERE THE OFFER OR SALE IS NOT PERMITTED.
| | 55 of 95 | |
| Structural and Collateral Term Sheet | | JPMDB 2019-COR6 |
| |
| Hyde Park Multifamily Portfolio |
| Operating History and Underwritten Net Cash Flow |
| | 2016 | 2017 | 2018 | TTM(1) | Underwritten | Per Unit | %(2) |
| Rents in Place | $14,908,773 | $15,253,403 | $15,896,270 | $16,265,022 | $15,356,640 | $18,304 | 104.2% |
| Vacant Income | 0 | 0 | 0 | 0 | 1,140,072 | 1,359 | 7.7 |
| Gross Potential Rent | $14,908,773 | $15,253,403 | $15,896,270 | $16,265,022 | $16,496,712 | $19,662 | 112.0% |
| (Vacancy/Credit Loss) | (2,559,747) | (1,931,119) | (2,085,427) | (2,007,973) | (1,764,457) | (2,103) | (12.0)-- |
| Net Rental Income | $12,349,025 | $13,322,284 | $13,810,843 | $14,257,049 | $14,732,255 | $17,559 | 100.0% |
| Commercial Income(3) | 5,145 | 9,674 | 9,269 | 14,899 | 197,251 | 235 | 1.3% |
| (Vacancy/Credit Loss) | 0 | 0 | 0 | 0 | (9,863) | (12) | (0.1)-- |
| Other Income | 632,845 | 645,428 | 562,341 | 640,125 | 640,125 | 763 | 4.3% |
| Effective Gross Income | $12,987,016 | $13,977,386 | $14,382,453 | $14,912,073 | $15,559,768 | $18,546 | 105.6% |
| Total Expenses | $5,007,798 | $5,498,541 | $5,689,497 | $6,022,366 | $6,319,284 | $7,532 | 40.6% |
| Net Operating Income | $7,979,218 | $8,478,846 | $8,692,956 | $8,889,707 | $9,240,484 | $11,014 | 59.4% |
| Replacement Reserves | 0 | 0 | 0 | 0 | 252,000 | 300 | 1.6 |
| Net Cash Flow | $7,979,218 | $8,478,846 | $8,692,956 | $8,889,707 | $8,988,484 | $10,713 | 57.8% |
| (1) | TTM column represents the trailing 12-month period ending July 31, 2019. |
| (2) | % column represents percent of Net Rental Income for all revenue lines and represents percent of Effective Gross Income for the remainder of the fields. |
| (3) | Historical Commercial Income represents commercial reimbursements. Historical commercial base rental income is included in Rents in Place. |
Property Management. TheHyde Park Multifamily Portfolio is managed by MAC Property Management, L.L.C., an affiliate of the borrowers.
Escrows and Reserves. At origination, the borrowers deposited into escrow $700,000 for real estate taxes and $225,000 for insurance premiums.
Tax Escrows– On a monthly basis,the borrowers are required to escrow 1/12 of the annual estimated tax payments, which currently equates to $119,000.
Insurance Escrows– On a monthly basis, if an acceptable blanket policy is no longer in place,the borrowers are required to escrow 1/12 of the annual estimated insurance premiums, which currently equates to $18,400.
Replacement Reserves –On a monthly basis,the borrowers are required to escrow$17,580 for replacement reserves.
Lockbox / Cash Management.The Hyde Park Multifamily Portfolio Whole Loan is structured with a springing lockbox and springing cash management. Upon the occurrence of a Cash Management Period (as defined below), all rents are required to be deposited into a lockbox account within one business day of receipt by the borrowers or the property manager. Upon the occurrence and during the continuance of a Cash Management Period, all funds in the lockbox account are required to be swept daily into a lender-controlled account, from which account such funds will be disbursed on each payment date in accordance with the Hyde Park Multifamily Portfolio Whole Loan documents and any excess will be retained by the lender as additional collateral for the Hyde Park Multifamily Portfolio Whole Loan.
A “Cash Management Period” will commence (i) upon an event of default (including an event of default under the mezzanine loan) or (ii) if, based on the Hyde Park Multifamily Portfolio Whole Loan and the related mezzanine loan, the debt service coverage ratio is less than 1.10x (until such time that the debt service coverage ratio is greater than or equal to 1.10x for two consecutive quarters).
Additional Debt.A mezzanine loan was funded concurrently and is coterminous with the Hyde Park Multifamily Portfolio Whole Loan. The mezzanine loan has an original principal balance of approximately $15.3 million, accrues interest at a rate of 7.49000%per annum and is interest-only for the entire loan term. Including the mezzanine loan, the cumulative Cut-off Date LTV, cumulative UW NCF DSCR and cumulative UW NOI DY are 69.2%, 1.48x and 7.6%, respectively. The mezzanine loan is currently held by LCM or an affiliate.
THE INFORMATION IN THIS STRUCTURAL AND COLLATERAL TERM SHEET IS NOT COMPLETE AND MAY BE AMENDED PRIOR TO THE TIME OF SALE. THIS TERM SHEET IS NOT AN OFFER TO SELL THESE SECURITIES AND IT IS NOT A SOLICITATION OF AN OFFER TO BUY THESE SECURITIES IN ANY JURISDICTION WHERE THE OFFER OR SALE IS NOT PERMITTED.
| | 56 of 95 | |
| Structural and Collateral Term Sheet | | JPMDB 2019-COR6 |
| |
| Hyde Park Multifamily Portfolio |
Partial Release.Commencing on the payment date that is after the earlier to occur of (i) two years from the securitization closing date of the lastpari passu note to be securitized and (ii) August 2022, the borrowers may obtain the release of any of the Hyde Park Multifamily Portfolio Properties,provided that, among other conditions, (i) no event of default has occurred and is continuing, (ii) the borrowers defease a portion of the Hyde Park Multifamily Portfolio Whole Loan in an amount equal to the greater of (a) 115.0% of the allocated loan amount of the Hyde Park Multifamily Portfolio Property being released and (b) 100.0% of net sales proceeds, (iii) the debt yield (as calculated in accordance with the Hyde Park Multifamily Portfolio Whole Loan documents) for the remaining Hyde Park Multifamily Portfolio Properties following the release is not less than the greater of (1) the debt yield immediately preceding such release and (2) 7.0%, (iv) after giving effect to such release, the loan-to-value ratio of the remaining Hyde Park Multifamily Portfolio Properties is no more than 125%, and (v) all defeasance conditions set forth in the Hyde Park Multifamily Portfolio Whole Loan documents are satisfied.
THE INFORMATION IN THIS STRUCTURAL AND COLLATERAL TERM SHEET IS NOT COMPLETE AND MAY BE AMENDED PRIOR TO THE TIME OF SALE. THIS TERM SHEET IS NOT AN OFFER TO SELL THESE SECURITIES AND IT IS NOT A SOLICITATION OF AN OFFER TO BUY THESE SECURITIES IN ANY JURISDICTION WHERE THE OFFER OR SALE IS NOT PERMITTED.
| | 57 of 95 | |
| Structural and Collateral Term Sheet | | JPMDB 2019-COR6 |
|
| BJ’s Wholesale Club |
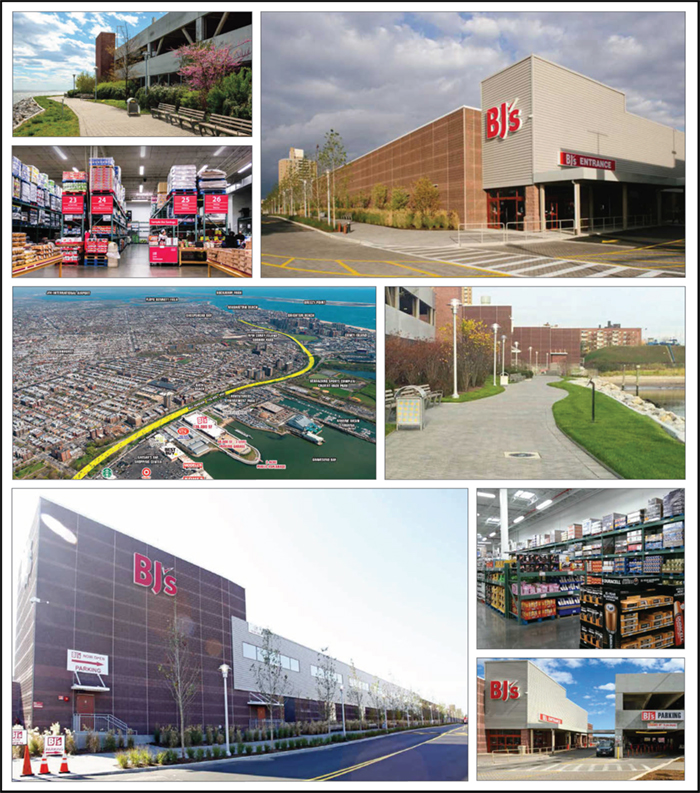
THE INFORMATION IN THIS STRUCTURAL AND COLLATERAL TERM SHEET IS NOT COMPLETE AND MAY BE AMENDED PRIOR TO THE TIME OF SALE. THIS TERM SHEET IS NOT AN OFFER TO SELL THESE SECURITIES AND IT IS NOT A SOLICITATION OF AN OFFER TO BUY THESE SECURITIES IN ANY JURISDICTION WHERE THE OFFER OR SALE IS NOT PERMITTED.
| | 58 of 95 | |
| Structural and Collateral Term Sheet | | JPMDB 2019-COR6 |
|
| BJ’s Wholesale Club |

THE INFORMATION IN THIS STRUCTURAL AND COLLATERAL TERM SHEET IS NOT COMPLETE AND MAY BE AMENDED PRIOR TO THE TIME OF SALE. THIS TERM SHEET IS NOT AN OFFER TO SELL THESE SECURITIES AND IT IS NOT A SOLICITATION OF AN OFFER TO BUY THESE SECURITIES IN ANY JURISDICTION WHERE THE OFFER OR SALE IS NOT PERMITTED.
| | 59 of 95 | |
| Structural and Collateral Term Sheet | | JPMDB 2019-COR6 |
|
| BJ’s Wholesale Club |
| Mortgage Loan Information | | Property Information |
| Mortgage Loan Seller: | JPMCB | | Single Asset / Portfolio: | Single Asset |
| Original Principal Balance: | $40,150,000 | | Title: | Fee |
| Cut-off Date Principal Balance: | $40,150,000 | | Property Type - Subtype: | Retail – Freestanding |
| % of Pool by IPB: | 5.0% | | Net Rentable Area (SF): | 135,753 |
| Loan Purpose: | Acquisition | | Location: | Brooklyn, NY |
| Borrower: | LHL Shore Parkway, LLC | | Year Built / Renovated: | 2014 / N/A |
| Sponsor: | LHL Holdings, L.P. | | Occupancy(1): | 100.0% |
| Interest Rate: | 3.57000% | | Occupancy Date: | 11/1/2019 |
| Note Date: | 9/25/2019 | | Number of Tenants: | 1 |
| Maturity Date: | 10/1/2029 | | 2016 NOI(2): | N/A |
| Interest-only Period: | 120 months | | 2017 NOI(2): | N/A |
| Original Term: | 120 months | 2018 NOI(2): | N/A |
| Original Amortization: | None | TTM NOI (as of 3/2019): | $3,830,045 |
| Amortization Type: | Interest Only | | UW Economic Occupancy: | 95.0% |
| Call Protection: | L(25),Grtr1%orYM(92),O(3) | | UW Revenues: | $4,895,930 |
| Lockbox / Cash Management: | Hard / Springing | | UW Expenses: | $1,133,964 |
| Additional Debt: | N/A | | UW NOI: | $3,761,966 |
| Additional Debt Balance: | N/A | | UW NCF: | $3,748,391 |
| Additional Debt Type: | N/A | | Appraised Value / Per SF: | $74,000,000 / $545 |
| | | | Appraised Dark Value / Per SF(3): | $48,000,000 / $354 |
| | | | Appraisal Date: | 8/20/2019 |
| | | | | |
| Escrows and Reserves(4) | | Financial Information |
| | Initial | Monthly | Initial Cap | | Cut-off Date Loan / SF: | $296 |
| Taxes: | $0 | Springing | N/A | | Maturity Date Loan / SF: | $296 |
| Insurance: | $0 | Springing | N/A | | Cut-off Date LTV: | 54.3% |
| Replacement Reserves: | $0 | Springing | N/A | | Maturity Date LTV: | 54.3% |
| Other: | $0 | $0 | N/A | | UW NCF DSCR: | 2.58x |
| | | | | | UW NOI Debt Yield: | 9.4% |
| | | | | | | |
| |
| Sources and Uses |
| Sources | Proceeds | % of Total | | Uses | Proceeds | % of Total |
| Mortgage Loan | $40,150,000 | 54.4% | | Purchase Price | $73,000,000 | 98.8% |
| Sponsor Equity | 33,715,717 | 45.6 | | Closing Costs | 865,717 | 1.2 |
| Total Sources | $73,865,717 | 100.0% | | Total Uses | $73,865,717 | 100.0% |
| | | | | | | | | | | | |
| (1) | BJ’s Wholesale Club (“BJ’s”) has occupied the BJ’s Wholesale Club property since it was constructed in 2014. |
| (2) | Historical financial information was not provided when the loan sponsor acquired the BJ’s Wholesale Club property. |
| (3) | The appraisal provided a “Hypothetical Go Dark” value of $48.0 million, as of August 20, 2019, which assumes that BJ’s vacates its space, which is thereafter leased at market rent. Based on the “Hypothetical Go Dark” value, the Cut-off Date LTV and Maturity Date LTV are both equal to 83.6%. |
| (4) | For a full description of Escrows and Reserves, please refer to “Escrows and Reserves” below. |
The Loan. The BJ’s Wholesale Club loan is secured by a first mortgage lien on the borrower’s fee interest in a 135,753 square foot freestanding retail property fully occupied by BJ’s with an adjacent parking garage and two-acre esplanade located in Brooklyn, New York. The BJ’s Wholesale Club loan has a 10-year term and is interest-only for the entire term.
The Borrower. The borrowing entity for the BJ’s Wholesale Club loan is LHL Shore Parkway, LLC, a Delaware limited liability company and special purpose entity with at least one independent director.
The Loan Sponsor. The loan sponsor and nonrecourse carve-out guarantor is LHL Holdings, L.P., an affiliate of Algin Management Company (“Algin”). Founded in 1957, Algin is a family owned New York City real estate company. Algin owns and manages over 30 multifamily apartment buildings throughout New York City, including over 3,500 apartment units and approximately 100,000 square feet of retail and commercial space.
THE INFORMATION IN THIS STRUCTURAL AND COLLATERAL TERM SHEET IS NOT COMPLETE AND MAY BE AMENDED PRIOR TO THE TIME OF SALE. THIS TERM SHEET IS NOT AN OFFER TO SELL THESE SECURITIES AND IT IS NOT A SOLICITATION OF AN OFFER TO BUY THESE SECURITIES IN ANY JURISDICTION WHERE THE OFFER OR SALE IS NOT PERMITTED.
| | 60 of 95 | |
| Structural and Collateral Term Sheet | | JPMDB 2019-COR6 |
|
| BJ’s Wholesale Club |
The Property. The BJ’s Wholesale Club property includes a 135,753 square foot freestanding retail building, parking garage and public esplanade located on an approximately 10.7 acre site in Brooklyn, New York. The three-level parking garage offers 442 parking spaces, resulting in a parking ratio of approximately 3.26 spaces per 1,000 square feet of net rentable area. The two-acre public esplanade provides waterfrontage along Gravesend Bay and offers shoppers and residents a walking and jogging path, benches and a grass field which BJ’s is responsible for maintaining. The BJ’s Wholesale Club property includes a Dunkin’ Donuts and a liquor store operated by BJ’s.
The previous owner, Thor Equities, began construction of the BJ’s Wholesale Club property in 2012. Since completion in 2014, the BJ’s Wholesale Club property has been 100.0% occupied by BJ’s (NYSE: BJ, S&P: B+), the nation’s third largest membership warehouse club. As of the fiscal year ended February 2019, BJ’s operates 216 clubs across 16 states, serving approximately 5.5 million members. BJ’s primarily offers two core types of memberships including a standard and higher tier membership with annual fees of $55 and $110, respectively. As of year-end 2018, the higher tier membership accounted for approximately 23.0% of memberships and approximately 39.0% of spending. As of the fiscal year ended February 2, 2019, BJ’s reported approximately $13.0 billion in total revenues. According to the loan sponsor, the BJ’s Wholesale Club property generated approximately $110.0 million in sales in 2018 compared to the BJ’s national average of approximately $58.9 million. BJ’s lease requires NNN rent of $31.10 per square foot and expires in September 2034 with six, five-year extension options and no termination options (the “BJ’s Lease”).
The BJ’s Wholesale Club property is located within a primarily residential area that benefits from close proximity to a variety of attractions including Adventurer’s Amusement Park, Bensonhurst Park, Calvert Vaux Park, Marine Basin Marina and Coney Island. The BJ’s Wholesale Club property is located adjacent to Caesar’s Bay Shopping Center, which features national retailers including Best Buy, Kohl’s, Pearle Vision, Modell’s Sporting Goods and The Vitamin Shoppe, with Target expected to open in 2020 according to the appraisal. Caesar’s Bay Shopping Center also offers retail and dining options including Five Guys, Olive Garden, Starbucks, TD Bank, T-Mobile, Verizon Wireless and Wendy’s. There are two additional BJ’s locations within Brooklyn, located approximately 5.7 miles and 7.7 miles to the northeast of the BJ’s Wholesale Club property, which serve different markets on the east side of the borough.
| Collateral Tenant Summary(1) |
| Tenant | Ratings
Moody’s/S&P/ Fitch | Net Rentable Area (SF) | % of
Total NRA | Base Rent
PSF(2) | Lease
Expiration(3) | % of Total
Base Rent | Most
Recent Sales PSF(4) | Occupancy
Cost(4) |
| BJ’s Wholesale Club | NR / B+ / NR | 135,753 | 100.0% | $31.10 | 9/19/2034 | 100.0% | NAV | NAV |
| (1) | Based on the underwritten rent roll. |
| (2) | Base Rent PSF includes contractual rent steps through September 2019. BJ’s has a 6.0% rent step in 2024. |
| (3) | BJ’s has six successive, five-year extension options and no termination options. |
| (4) | BJ’s does not report sales. |
The BJ’s Wholesale Club property is located along the South Brooklyn waterfront in Brooklyn, New York on Shore Parkway, a service road for the Belt Parkway, which is a major thoroughfare within the city of New York with a traffic count of approximately 150,000 vehicles per day. The BJ’s Wholesale Club property is also accessible via the Van Wyck Expressway (Interstate 678) which runs along the eastern boundary of Brooklyn and connects with Interstate 95, Interstate 278 and the Long Island Expressway (Interstate 495). The BJ’s Wholesale Club property is located approximately 11.0 miles to the southwest of John F. Kennedy International Airport. Subway access is available via the New York City subway, which is located approximately four blocks away from the BJ’s Wholesale Club property.
According to the appraisal, the BJ’s Wholesale Club property is located in the South Brooklyn retail submarket within Kings County, New York, which contains approximately 42.7 million square feet of retail space. From the second quarter of 2014 to the second quarter of 2019, the submarket vacancy has decreased from 5.4% to 3.2%, and average asking rents have increased from $36.20 to $46.52 over the same time period. According to the appraisal, Brooklyn’s estimated 2018 population was 2,691,705, a 7.5% increase from 2010 and the highest increase among the five boroughs of New York City. According to the appraisal, over the next five years, Brooklyn’s population is expected to increase by 4.0%. The 2019 total population within the BJ’s Wholesale Club property’s zip code and Kings County, New York is 93,817 and 2,674,116, respectively. The 2019 median household income within the BJ’s Wholesale Club property’s zip code and Kings County, New York is $56,528 and $58,062, respectively.
THE INFORMATION IN THIS STRUCTURAL AND COLLATERAL TERM SHEET IS NOT COMPLETE AND MAY BE AMENDED PRIOR TO THE TIME OF SALE. THIS TERM SHEET IS NOT AN OFFER TO SELL THESE SECURITIES AND IT IS NOT A SOLICITATION OF AN OFFER TO BUY THESE SECURITIES IN ANY JURISDICTION WHERE THE OFFER OR SALE IS NOT PERMITTED.
| | 61 of 95 | |
| Structural and Collateral Term Sheet | | JPMDB 2019-COR6 |
|
| BJ’s Wholesale Club |
The appraisal identified five comparable leases ranging in size from 17,000 square feet to 111,248 square feet. Base rent for the comparable NNN leases range from $25.54 per square foot to $45.35 per square foot. The base rent at the BJ’s Wholesale Club property is $31.10 per square foot, in-line with the appraisal’s concluded market rent of $30.00 per square foot. The comparable leases are detailed in the table below:
| Appraisal Comparable Leases |
| Property | Location | Year Built / Renovated | Tenant | Lease Area | Lease Term (Years) | Base Rent PSF | Reimbursements |
| BJ’s Wholesale Club(1) | Brooklyn, NY | 2014 / N/A | BJ’s | 135,753 | 20 | $31.10 | NNN |
| 4804-4822 New Utrecht Avenue | Brooklyn, NY | 1920 / 2019 | Amazing Savings | 17,000 | 10 | $41.18 | NNN |
| 2501-2503 Grand Concourse | Bronx, NY | 1930 / 2002 | Marshalls | 32,600 | 10 | $30.80 | NNN |
| 242-06 61st Avenue | Queens, NY | 1964 / NA | Lowe’s | 94,176 | 15 | $39.00 | NNN |
| 66 Boerum Place | Brooklyn, NY | 1905 / NA | Planet Fitness | 20,950 | 15 | $45.35 | NNN |
| 1 Dekalb Avenue | Brooklyn, NY | 2016 / NA | Century 21 | 111,248 | 15 | $25.54 | NNN |
| (1) | Based on the underwritten rent roll. |
| Historical and Current Occupancy(1) |
| 2016 | 2017 | 2018 | Current(2) |
| 100.0% | 100.0% | 100.0% | 100.0% |
| (1) | Historical Occupancies are as of December 31 of each respective year. |
| (2) | Current Occupancy is as of November 1, 2019. |
| Lease Rollover Schedule(1) |
| Year | Number of Leases Expiring | Net Rentable Area Expiring | % of NRA Expiring | Base Rent Expiring(2) | % of Base Rent Expiring | Cumulative Net Rentable Area Expiring | Cumulative % of NRA Expiring | Cumulative Base Rent Expiring | Cumulative % of Base Rent Expiring |
| Vacant | NAP | NAP | 0.0% | NAP | NAP | 0 | 0.0% | NAP | NAP |
| 2019 & MTM | 0 | 0 | 0.0% | $0 | 0.0% | 0 | 0.0% | $0 | 0.0% |
| 2020 | 0 | 0 | 0.0% | 0 | 0.0% | 0 | 0.0% | $0 | 0.0% |
| 2021 | 0 | 0 | 0.0% | 0 | 0.0% | 0 | 0.0% | $0 | 0.0% |
| 2022 | 0 | 0 | 0.0% | 0 | 0.0% | 0 | 0.0% | $0 | 0.0% |
| 2023 | 0 | 0 | 0.0% | 0 | 0.0% | 0 | 0.0% | $0 | 0.0% |
| 2024 | 0 | 0 | 0.0% | 0 | 0.0% | 0 | 0.0% | $0 | 0.0% |
| 2025 | 0 | 0 | 0.0% | 0 | 0.0% | 0 | 0.0% | $0 | 0.0% |
| 2026 | 0 | 0 | 0.0% | 0 | 0.0% | 0 | 0.0% | $0 | 0.0% |
| 2027 | 0 | 0 | 0.0% | 0 | 0.0% | 0 | 0.0% | $0 | 0.0% |
| 2028 | 0 | 0 | 0.0% | 0 | 0.0% | 0 | 0.0% | $0 | 0.0% |
| 2029 and Thereafter | 1 | 135,753 | 100.0% | $4,222,591 | 100.0% | 135,753 | 100.0% | $4,222,591 | 100.0% |
| Total | 1 | 135,753 | 100.0% | $4,222,591 | 100.0% | | | | |
| | | | | | | | | | | | |
| (1) | Based on the underwritten rent roll. |
| (2) | Base Rent Expiring is inclusive of $201,076 in contractual rent steps underwritten through September 2019. |
THE INFORMATION IN THIS STRUCTURAL AND COLLATERAL TERM SHEET IS NOT COMPLETE AND MAY BE AMENDED PRIOR TO THE TIME OF SALE. THIS TERM SHEET IS NOT AN OFFER TO SELL THESE SECURITIES AND IT IS NOT A SOLICITATION OF AN OFFER TO BUY THESE SECURITIES IN ANY JURISDICTION WHERE THE OFFER OR SALE IS NOT PERMITTED.
| | 62 of 95 | |
| Structural and Collateral Term Sheet | | JPMDB 2019-COR6 |
|
| BJ’s Wholesale Club |
| Cash Flow Analysis(1) |
| | TTM(2) | Underwritten | Per Square Foot | %(3) |
| Rents in Place(4) | $4,021,515 | $4,222,591 | $31.10 | 81.9% |
| Vacant Income | 0 | 0 | 0.00 | 0.0% |
| Gross Potential Rent | $4,021,515 | $4,222,591 | $31.10 | 81.9% |
| Total Reimbursements | 0 | 931,019 | 6.86 | 18.1% |
| Net Rental Income | $4,021,515 | $5,153,610 | $37.96 | 100.0% |
| (Vacancy/Credit Loss) | 0 | (257,681) | (1.90) | (5.0)% |
| Effective Gross Income | $4,021,515 | $4,895,930 | $36.06 | 95.0% |
| Total Expenses(5) | 191,470 | 1,133,964 | 8.35 | 23.2% |
| Net Operating Income | $3,830,045 | $3,761,966 | $27.71 | 76.8% |
| Total TI/LC, Capex/RR | 0 | 13,575 | 0.10 | 0.3% |
| Net Cash Flow | $3,830,045 | $3,748,391 | $27.61 | 76.6% |
| (1) | Historical financial information was not provided when the sponsor acquired the BJ’s Wholesale Club Property. |
| (2) | TTM represents the trailing 12-month period ending on March 31, 2019 |
| (3) | % column represents percent of Net Rental Income for all revenue lines and percent of Effective Gross Income for the remainder of fields. |
| (4) | Underwritten Rents in Place is inclusive of $201,076 in contractual rent steps underwritten through September 2019. |
| (5) | The property currently benefits from a 25 year ICAP tax abatement and BJ’s reimburses for real estate taxes. Underwritten Total Expenses reflect the average of the appraisal’s projected real estate taxes over the loan term of approximately $931,019. |
Property Management. The BJ’s Wholesale Club property is managed by Algin Management Co., LLC, an affiliate of the loan sponsor.
Escrows and Reserves.
Tax Escrows– On a monthly basis, the borrower is required to deposit an amount equal to 1/12 of the estimated annual real estate taxes into a tax reserve. The requirement for monthly deposits in to the tax reserve is waived so long as (i) no event of default has occurred and is continuing under the BJ’s Wholesale Club loan documents, (ii) the BJ’s lease is in effect, (iii) the BJ’s Wholesale Club property consists of one or more entire tax parcels occupied by BJ’s, (iv) BJ’s pays taxes directly to the taxing authority and (v) BJ’s provides the lender with satisfactory evidence that real estate taxes have been paid for the applicable period.
Insurance Escrows– On a monthly basis, the borrower is required to deposit into an insurance reserve an amount equal to 1/12 of the estimated insurance premiums. So long as either (i) the borrower maintains a blanket insurance policy acceptable to the lender, or (ii) the BJ’s Lease requires BJ’s to provide insurance coverage for the BJ’s Wholesale Club property which satisfies the requirements of the mortgage loan agreement, and there is no event of default continuing under the BJ’s Wholesale Club loan documents, the requirement for monthly deposits into the insurance reserve is waived.
Replacement Reserves – On a monthly basis upon the occurrence and continuance of a Cash Sweep Event (as defined below), the borrower is required to deposit $2,250 into a replacement reserve.
A “Cash Sweep Event” means the occurrence of (i) an event of default under the BJ’s Wholesale Club loan documents, (ii) any bankruptcy action of the borrower or manager, (iii) the date that the debt service coverage ratio (as calculated in the BJ’s Wholesale Club loan documents) based on the trailing 12-month period falls below 1.50x (a “DSCR Trigger Event”), (iv) a BJ’s Trigger Event (as defined below) or (v) BJ’s is downgraded to B- or less by S&P or the equivalent by two or more rating agencies (a “Downgrade Trigger Event”).
THE INFORMATION IN THIS STRUCTURAL AND COLLATERAL TERM SHEET IS NOT COMPLETE AND MAY BE AMENDED PRIOR TO THE TIME OF SALE. THIS TERM SHEET IS NOT AN OFFER TO SELL THESE SECURITIES AND IT IS NOT A SOLICITATION OF AN OFFER TO BUY THESE SECURITIES IN ANY JURISDICTION WHERE THE OFFER OR SALE IS NOT PERMITTED.
| | 63 of 95 | |
| Structural and Collateral Term Sheet | | JPMDB 2019-COR6 |
|
| BJ’s Wholesale Club |
A Cash Sweep Event may be cured in accordance with the following conditions: with respect to a Cash Sweep Event caused solely by (a) clause (i) above, the acceptance of a cure by the lender of the related event of default under the BJ’s Wholesale Club loan documents, (b) clause (ii) above, with respect to (1) a bankruptcy action of the borrower, if the bankruptcy action is involuntary and not consented to or colluded in by the borrower, guarantor or any of their affiliates and such bankruptcy action is discharged, stayed or dismissed within 90 days of filing or (2) a bankruptcy action of the manager, if the borrower replaces the manager with a qualified manager under a replacement management agreement within 60 days in accordance with the BJ’s Wholesale Club loan documents, (c) a DSCR Trigger Event, the achievement of a debt service coverage ratio of 1.50x or greater for two consecutive calendar quarters based upon the trailing 12 month period , (d) a BJ’s Trigger Event, the occurrence of a BJ’s Trigger Event Cure (as defined below) or (e) a Downgrade Trigger Event, the credit rating of BJ’s is increased to at least B+ by S&P or the equivalent by at least the number of rating agencies that downgraded the credit rating of BJ’s. Each cure is also subject to the following conditions: (1) no other event of default under the BJ’s Wholesale Club loan documents may have occurred and be continuing; (2) a Cash Sweep Event Cure caused by an event of default or bankruptcy action of the borrower or manager may occur no more than a total of two times in the aggregate during the term of the BJ’s Wholesale Club loan; (3) a Cash Sweep Event caused by a DSCR Trigger Event, a BJ’s Trigger Event or a Downgrade Trigger Event may be cured an unlimited number of times during the term of the BJ’s Wholesale Club loan and (4) the borrower pays the lender’s reasonable expenses in connection with such cure.
A “BJ’s Trigger Event” means (i) BJ’s terminates its lease, goes dark, vacates or abandons its premises at the BJ’s Wholesale Club property, or gives notice of its intention to do so, (ii) BJ’s subleases 40.0% or more of its space presently occupied pursuant to the BJ’s Lease (excluding the space occupied by Dunkin’ Donuts and the space presently used for the sale of liquor) or (iii) a BJ’s bankruptcy.
A “BJ’s Trigger Event Cure” means (a) the borrower enters into one or more leases with one or more replacement tenants subject to the approval of the lender, and the lender has received satisfactory evidence that such tenants are in physical occupancy of their spaces in accordance with the related terms and conditions set forth in the BJ’s Wholesale Club loan documents, or (b) solely with respect to clause (ii) above, the amount on deposit in the excess cash flow reserve equals $7.0 million, and all tenants under subleases with BJ’s (excluding Dunkin’ Donuts and the space presently used for the sale of liquor) are in occupancy of their respective subleased spaces.
Lockbox / Cash Management.The BJ’s Wholesale Club loan is structured with a hard lockbox and springing cash management. The borrower is required to deliver tenant direction letters to all tenants instructing the tenants to deposit all rents and payments into a lender-controlled lockbox account. To the extent no Cash Sweep Event has occurred and is continuing, all funds in the lockbox account are required to be transferred to or at the direction of the borrower. Following the occurrence and during the continuance of a Cash Sweep Event, all funds in the lockbox account are required to be swept each business day to a segregated cash management account under the control of the lender and disbursed in accordance with the BJ’s Wholesale Club loan documents. To the extent a Cash Sweep Event has occurred and is continuing, all excess cash flow after payment of debt service, required reserves and operating expenses are required to be held as additional collateral for the BJ’s Wholesale Club loan. The lender has been granted a first priority security interest in the cash management account.
Partial Release.None.
Tax Abatement. The BJ’s Wholesale Club property currently benefits from a 25-year tax abatement from the Industrial & Commercial Abatement Program (the “ICAP”) provided by the New York City Department of Finance. The ICAP for the BJ’s Wholesale Club property commenced in the tax year 2014/2015 and is scheduled to expire in the tax year 2039/2040. However, the BJ’s Wholesale Club loan was underwritten based on the full tax amount. Please see “Description of the Mortgage Pool – Real Estate and Other Tax Considerations” in the Preliminary Prospectus for additional information.
Environmental History. The environmental site assessment report (the “ESA”) obtained at origination indicated that the prior investigations at the BJ’s Wholesale Club property identified areas of concern which were remediated through installation of the appropriate engineering controls (the “Controls”), including, without limitation, monitoring for groundwater and methane and hydrogen sulfide. Subsequently, a Site Management Plan (“SMP”) was implemented to include certain restrictions and requirements, including, without limitation, a requirement for an annual written statement (the “Annual Statement”) to be submitted to the New York State Department of Environmental Conservation (“NYSDEC”) and/or New York City Office of Environmental Remediation (“NYC OER”), certifying to the continued effectiveness of the Controls and stating that nothing has occurred that impairs the ability of the Controls to protect public health and environment or that constitutes a failure to comply with the SMP. The ESA noted that the BJ’s Wholesale Club property has received conditional regulatory closure and was required to continue the methane monitoring. Based on the foregoing, the ESA indicated that the conditions at the BJ’s Wholesale Club property are considered a controlled recognized environmental condition, and recommended continued implementation of the SMP and annual submission of the Annual Statement to the NYSDEC and/or the NYC OER. Please see “Description of the Mortgage Pool – Environmental Considerations” in the Preliminary Prospectus for additional information.
THE INFORMATION IN THIS STRUCTURAL AND COLLATERAL TERM SHEET IS NOT COMPLETE AND MAY BE AMENDED PRIOR TO THE TIME OF SALE. THIS TERM SHEET IS NOT AN OFFER TO SELL THESE SECURITIES AND IT IS NOT A SOLICITATION OF AN OFFER TO BUY THESE SECURITIES IN ANY JURISDICTION WHERE THE OFFER OR SALE IS NOT PERMITTED.
| | 64 of 95 | |
| Structural and Collateral Term Sheet | | JPMDB 2019-COR6 |
|
| Hampton Roads Office Portfolio |

THE INFORMATION IN THIS STRUCTURAL AND COLLATERAL TERM SHEET IS NOT COMPLETE AND MAY BE AMENDED PRIOR TO THE TIME OF SALE. THIS TERM SHEET IS NOT AN OFFER TO SELL THESE SECURITIES AND IT IS NOT A SOLICITATION OF AN OFFER TO BUY THESE SECURITIES IN ANY JURISDICTION WHERE THE OFFER OR SALE IS NOT PERMITTED.
| | 65 of 95 | |
| Structural and Collateral Term Sheet | | JPMDB 2019-COR6 |
|
| Hampton Roads Office Portfolio |

THE INFORMATION IN THIS STRUCTURAL AND COLLATERAL TERM SHEET IS NOT COMPLETE AND MAY BE AMENDED PRIOR TO THE TIME OF SALE. THIS TERM SHEET IS NOT AN OFFER TO SELL THESE SECURITIES AND IT IS NOT A SOLICITATION OF AN OFFER TO BUY THESE SECURITIES IN ANY JURISDICTION WHERE THE OFFER OR SALE IS NOT PERMITTED.
| | 66 of 95 | |
| Structural and Collateral Term Sheet | | JPMDB 2019-COR6 |
|
| Hampton Roads Office Portfolio |
| Mortgage Loan Information | | Property Information |
| Mortgage Loan Seller: | LCM | | Single Asset / Portfolio: | Portfolio |
| Original Principal Balance(1): | $40,000,000 | | Title: | Fee |
| Cut-off Date Principal Balance(1): | $39,723,151 | | Property Type - Subtype: | Office – Suburban |
| % of Pool by IPB: | 4.9% | | Net Rentable Area (SF): | 1,322,003 |
| Loan Purpose: | Acquisition | | Location: | Various, VA |
| Borrowers(2): | Various | | Year Built / Renovated: | Various / N/A |
| Sponsor: | Lawrence Heller | | Occupancy: | 88.5% |
| Interest Rate: | 5.30000% | | Occupancy Date: | Various |
| Note Date: | 3/28/2019 | | Number of Tenants: | 138 |
| Maturity Date: | 4/6/2029 | | 2016 NOI: | $12,770,635 |
| Interest-only Period: | None | | 2017 NOI: | $13,066,165 |
| Original Term: | 120 months | | 2018 NOI: | $13,467,187 |
| Original Amortization(3): | 360 months | | TTM NOI (as of 7/2019): | $14,482,053 |
| Amortization Type(3): | Balloon | | UW Economic Occupancy: | 86.4% |
| Call Protection(4): | L(31),Grtr1%orYM(86),O(3) | | UW Revenues: | $22,491,550 |
| Lockbox / Cash Management: | Hard / In Place | | UW Expenses: | $8,208,420 |
| Additional Debt: | Yes | | UW NOI: | $14,283,130 |
| Additional Debt Balance(1)(3): | $92,356,321 / $19,880,300 | | UW NCF: | $12,283,620 |
| Additional Debt Type(1)(3): | Pari Passu / Mezzanine Loan | | Appraised Value / Per SF: | $185,200,000 / $140 |
| | | | Appraisal Date: | 1/7/2019 |
| | | | | |
| Escrows and Reserves(5) | | Financial Information(1) |
| | Initial | Monthly | Initial Cap | | | Whole Loan | Total Debt |
| Taxes: | $600,000 | $150,800 | N/A | | Cut-off Date Loan / SF: | $100 | $115 |
| Insurance: | $30,000 | $22,200 | N/A | | Maturity Date Loan / SF: | $84 | $97 |
| Replacement Reserves: | $250,000 | $33,050 | $4,000,000 | | Cut-off Date LTV: | 71.3% | 82.0% |
| TI/LC: | $1,500,000 | $168,555 | N/A | | Maturity Date LTV: | 60.3% | 69.3% |
| Other | $1,311,289 | $0 | N/A | | UW NCF DSCR: | 1.40x | 1.16x |
| | | | | | UW NOI Debt Yield: | 10.8% | 9.4% |
| | | | | | | | |
|
| |
| Sources and Uses |
| Sources | Proceeds | % of Total | | Uses | Proceeds | % of Total |
| Whole Loan(1) | $133,000,000 | 69.7% | | Purchase Price | $183,000,000 | 95.9% |
| Mezzanine Loan | 20,000,000 | 10.5 | | Closing Costs | 4,206,061 | 2.2% |
| Sponsor Equity | 37,897,350 | 19.9 | | Upfront Reserves | 3,691,289 | 1.9% |
| Total Sources | $190,897,350 | 100.0% | | Total Uses | $190,897,350 | 100.0% |
| | | | | | | | | | | | | | | |
| (1) | The Hampton Roads Office Portfolio Loan (as defined below) is part of a whole loan evidence by sixpari passu notes, with an aggregate outstanding principal balance as of the Cut-off Date of approximately $132.1 million. The Financial Information presented in the chart above reflects the Cut-off Date Balance of the approximately $132.1 million Hampton Roads Office Portfolio Whole Loan (as defined below). |
| (2) | The borrowers are Hampton Roads I Owner, LLC, Hampton Roads II Owner, LLC, Hampton Roads III Owner, LLC, Hampton Roads IV Owner, LLC, Hampton Roads V Owner, LLC, Hampton Roads VI Owner, LLC, Hampton Roads VII Owner, LLC, Hampton Roads VIII Owner, LLC, Hampton Roads IX Owner, LLC, Hampton Roads TRS Holding A, LLC, Hampton Roads TRS Holding B, LLC and Hampton Roads TRS Holding C, LLC. |
| (3) | The Hampton Roads Office Portfolio Whole Loan amortizes pursuant to a fixed amortization schedule as set forth in Annex H to the Preliminary Prospectus. Debt service coverage ratios are calculated using the sum of the first 12 principal and interest payments after the Cut-off Date based on the assumed principal and interest payment schedule set forth in Annex H to the Preliminary Prospectus. |
| (4) | The lockout period will be at least 31 payment dates beginning with and including the first payment date of May 6, 2019. The borrowers may prepay the Hampton Roads Office Portfolio Whole Loan along with a yield maintenance premium after the date that is the earlier to occur of (i) two years after the closing date of the securitization that includes the lastpari passunote to be securitized and (ii) October 6, 2022. The assumed lockout period of 31 payments is based on the expected JPMDB 2019-COR6 securitization closing date in November 2019. The actual lockout period may be longer. Partial releases are permitted. See“Partial Releases” below. |
| (5) | For a full description of Escrows and Reserves, please refer to“Escrows and Reserves”below. |
THE INFORMATION IN THIS STRUCTURAL AND COLLATERAL TERM SHEET IS NOT COMPLETE AND MAY BE AMENDED PRIOR TO THE TIME OF SALE. THIS TERM SHEET IS NOT AN OFFER TO SELL THESE SECURITIES AND IT IS NOT A SOLICITATION OF AN OFFER TO BUY THESE SECURITIES IN ANY JURISDICTION WHERE THE OFFER OR SALE IS NOT PERMITTED.
| | 67 of 95 | |
| Structural and Collateral Term Sheet | | JPMDB 2019-COR6 |
|
| Hampton Roads Office Portfolio |
The Loan.The Hampton Roads Office Portfolio loan, with a principal balance of approximately $39.7 million as of the Cut-off Date (the “Hampton Roads Office Portfolio Loan”), is secured by a first mortgage lien on the borrowers’ fee simple interest in 22 office properties comprised of 1,322,003 square feet of net rentable area (the “Hampton Roads Office Portfolio Properties” or the “Hampton Roads Office Portfolio”) located in Chesapeake, Hampton and Virginia Beach, Virginia. The Hampton Roads Office Portfolio Loan is part of a whole loan that has an aggregate outstanding principal balance as of the Cut-off Date of approximately $132.1 million (the “Hampton Roads Office Portfolio Whole Loan”) and is comprised of sixpari passu notes, each as described in the “Whole Loan Summary” chart below. The non-controlling Notes A-3 and A-4, with an aggregate outstanding principal balance as of the Cut-off Date of approximately $39.7 million, is being contributed to the JPMDB 2019-COR6 Trust. The controlling Notes A-1 and A-5, with an aggregate outstanding principal balance as of the Cut-off Date of approximately $49.7 million were contributed to the JPMCC 2019-COR5 Trust. The non-controlling Notes A-2 and A-6, with an aggregate outstanding principal balance as of the Cut-off Date of approximately $42.7 million, are held by LCM or an affiliate and expected to be contributed to one or more future securitizations or may otherwise be transferred at any time. The relationship between the holders of the Hampton Roads Office Portfolio Whole Loan will be governed by a co-lender agreement as described under “Description of the Mortgage Pool—The Whole Loans—The Non-Serviced Pari Passu Whole Loans” in the Preliminary Prospectus. The Hampton Roads Office Portfolio Loan has a 10-year term and amortizes pursuant to a fixed amortization schedule as set forth in Annex H to the Preliminary Prospectus.The most recent prior financing of theHampton Roads Office PortfolioProperties was not included in a securitization.
| Whole Loan Summary |
| Note | Original Balance | Cut-off Date Balance | Note Holder | Controlling Piece |
| A-1, A-5 | $50,000,000 | $49,653,939 | JPMCC 2019-COR5 | Yes |
| A-3, A-4 | 40,000,000 | 39,723,151 | JPMDB 2019-COR6 | No |
| A-2 | 33,000,000 | 32,771,600 | LCM | No |
| A-6 | 10,000,000 | 9,930,788 | LCM | No |
| Total | $133,000,000 | $132,079,478 | | |
The Borrowers. The borrowing entities are Hampton Roads I Owner, LLC, Hampton Roads II Owner, LLC, Hampton Roads III Owner, LLC, Hampton Roads IV Owner, LLC, Hampton Roads V Owner, LLC, Hampton Roads VI Owner, LLC, Hampton Roads VII Owner, LLC, Hampton Roads VIII Owner, LLC, Hampton Roads IX Owner, LLC, Hampton Roads TRS Holding A, LLC, Hampton Roads TRS Holding B, LLC and Hampton Roads TRS Holding C, LLC, each a Delaware limited liability company and special purpose entity structured to be bankruptcy remote with two independent directors. Legal counsel to the borrowers delivered a non-consolidation opinion in connection with the origination of the Hampton Roads Portfolio Whole Loan.
The Loan Sponsor.The loan sponsor and nonrecourse carve-out guarantor is Lawrence Heller. Mr. Heller is the managing member of Acme Equities LLC, a private holding company that invests in the real estate, oil and gas, power, hotel and high yield markets. Mr. Heller has over 30 years of experience in the development and execution of deals involving real estate acquisitions, distressed oil and gas assets, real estate workouts, and high yield debt trading and has actively managed a portfolio of family real estate holdings comprised of over 175 properties throughout the United States. In addition, Mr. Heller has invested over $5.0 billion of capital over the past decade.
The Properties.The Hampton Roads Office Portfolio Properties are comprised of 22 office properties totaling 1,322,003 square feet situated throughout Virginia in Chesapeake (11 properties, 54.3% of net rentable area; 65.7% of underwritten net operating income), Virginia Beach (six properties, 25.0% of net rentable area; 21.1% of underwritten net operating income) and Hampton (five properties, 20.7% of net rentable area; 13.1% of underwritten net operating income). The Hampton Roads Office Portfolio Properties are leased by a granular and diverse roster of publicly-traded and national and international firms, regional companies, and local businesses. The tenant base represents a broad range of industries including law, financial services, healthcare, military, logistics, technology, consumer goods, communications, insurance, and real estate and offers limited exposure, as no single tenant occupies more than 3.8% of net rentable area. Additionally, the Hampton Roads Office Portfolio has exhibited an average 10-year historical occupancy since 2009 equal to 88.8%. As of the August 31, 2019 underwritten rent rolls, the Hampton Roads Office Portfolio Properties were 88.5% leased to 138 tenants over 154 leases at a weighted average underwritten base rent equal to $15.49 per square foot.
THE INFORMATION IN THIS STRUCTURAL AND COLLATERAL TERM SHEET IS NOT COMPLETE AND MAY BE AMENDED PRIOR TO THE TIME OF SALE. THIS TERM SHEET IS NOT AN OFFER TO SELL THESE SECURITIES AND IT IS NOT A SOLICITATION OF AN OFFER TO BUY THESE SECURITIES IN ANY JURISDICTION WHERE THE OFFER OR SALE IS NOT PERMITTED.
| | 68 of 95 | |
| Structural and Collateral Term Sheet | | JPMDB 2019-COR6 |
|
| Hampton Roads Office Portfolio |
| Portfolio Summary |
| Property Name | City | Year Built | Total SF | % of Total | Occupancy(1) | UW NOI | Allocated Whole Loan Original Balance | Appraised Value |
| 510 Independence Parkway | Chesapeake | 1999 | 97,081 | 7.3% | 89.4% | $1,177,063 | $11,030,000 | $14,100,000 |
| 676 Independence Parkway | Chesapeake | 2008 | 73,345 | 5.5% | 100.0% | 1,168,144 | 11,010,000 | 11,200,000 |
| 700 Independence Parkway | Chesapeake | 2001 | 96,807 | 7.3% | 100.0% | 1,091,349 | 9,050,000 | 13,400,000 |
| 1309 Executive Boulevard | Chesapeake | 2001 | 49,870 | 3.8% | 100.0% | 793,477 | 7,770,000 | 8,500,000 |
| 1317 Executive Boulevard | Chesapeake | 2007 | 73,583 | 5.6% | 100.0% | 1,123,742 | 7,560,000 | 12,400,000 |
| 200 Golden Oak Court | Virginia Beach | 1988 | 74,290 | 5.6% | 84.1% | 804,828 | 7,260,000 | 10,900,000 |
| 1301 Executive Boulevard | Chesapeake | 2006 | 50,020 | 3.8% | 100.0% | 728,185 | 7,070,000 | 8,100,000 |
| 505 Independence Parkway | Chesapeake | 2000 | 63,568 | 4.8% | 97.2% | 769,826 | 7,010,000 | 8,500,000 |
| 1313 Executive Boulevard | Chesapeake | 2002 | 49,870 | 3.8% | 100.0% | 667,712 | 6,360,000 | 8,500,000 |
| 208 Golden Oak Court | Virginia Beach | 1989 | 63,825 | 4.8% | 94.6% | 715,592 | 6,310,000 | 9,000,000 |
| 1305 Executive Boulevard | Chesapeake | 2002 | 49,865 | 3.8% | 81.2% | 470,235 | 6,090,000 | 7,100,000 |
| 500 Independence Parkway | Chesapeake | 2001 | 51,000 | 3.9% | 100.0% | 654,058 | 6,000,000 | 7,400,000 |
| 501 Independence Parkway | Chesapeake | 2000 | 63,474 | 4.8% | 90.1% | 743,090 | 5,880,000 | 8,000,000 |
| 1 Enterprise Parkway | Hampton | 1987 | 63,029 | 4.8% | 65.2% | 360,625 | 5,450,000 | 7,700,000 |
| 1457 Miller Store Road | Virginia Beach | 1988 | 65,192 | 4.9% | 100.0% | 521,930 | 5,060,000 | 6,100,000 |
| 2809 South Lynnhaven Road | Virginia Beach | 1987 | 62,924 | 4.8% | 74.9% | 572,631 | 4,360,000 | 9,500,000 |
| 22 Enterprise Parkway | Hampton | 1990 | 72,444 | 5.5% | 76.2% | 571,304 | 4,140,000 | 8,900,000 |
| 521 Butler Farm Road | Hampton | 1989 | 44,651 | 3.4% | 100.0% | 427,505 | 4,080,000 | 6,300,000 |
| 21 Enterprise Parkway | Hampton | 1998 | 75,915 | 5.7% | 59.0% | 376,638 | 3,820,000 | 9,100,000 |
| 484 Viking Drive | Virginia Beach | 1987 | 39,633 | 3.0% | 43.3% | 133,955 | 3,780,000 | 5,400,000 |
| 629 Phoenix Drive | Virginia Beach | 1996 | 24,549 | 1.9% | 100.0% | 270,336 | 2,640,000 | 2,900,000 |
| 5 Manhattan Square | Hampton | 1999 | 17,068 | 1.3% | 100.0% | 140,904 | 1,270,000 | 2,200,000 |
| Total / Wtd. Avg. | | | 1,322,003 | 100.0% | 88.5% | $14,283,130 | $133,000,000 | $185,200,000 |
| (1) | Based on the underwritten rent rolls dated as of August 31, 2019. |
The largest tenant at the Hampton Roads Office Portfolio is Cegedim Dendrite (“Cegedim”) (49,870 square feet; 3.8% of net rentable area; 4.7% of underwritten base rent). Founded in 1969, Cegedim is a global technology and services company that supplies services, technological tools, specialized software, data flow management services and databases. Cegedim’s offerings are targeted notably at healthcare professionals, healthcare industries, life science companies, and health insurance companies. Cegedim is the world’s leading provider of pharmaceutical-specific customer relationship management solutions with a 35.0% global market share. Cegedim employs more than 4,500 people in more than 10 countries. Cegedim fully occupies the 1309 Executive Boulevard property located in Chesapeake, Virginia, where it originally took occupancy in 2001 and is on a lease initially expiring in December 2020. Cegedim currently pays base rent equal to $17.05 per square foot, has no termination options and has two, five-year renewal options remaining.
The second largest tenant at the Hampton Roads Office Portfolio is Sutherland Global Services Inc. (“Sutherland”) (49,870 square feet; 3.8% of net rentable area; 3.9% of underwritten base rent). Found in 1986, Sutherland is a business process outsourcing and technology-enabled services company, that provides an integrated set of back-office and customer facing front-office services that support the entire customer lifecycle. Sutherland offers digital, customer engagement, and business process transformation services. Sutherland serves clients in banking and financial services, healthcare, technology, media and communications, retail, insurance, travel and hospitality, government industries in the United States and internationally.Sutherland fully occupies the 1313 Executive Boulevard property located in Chesapeake, Virginia, where it originally took occupancy in 2012 and is on a lease initially expiring in September 2024. Sutherland currently pays base rent equal to $14.10 per square foot, has no termination options and one, five-year renewal option remaining.
The third largest tenant at the Hampton Roads Office Portfolio is General Dynamics Info (“General Dynamics”) (46,745 square feet; 3.5% of net rentable area; 3.1% of underwritten base rent; rated A2/NR/A+ by Moody’s/Fitch/S&P). General Dynamics is an American aerospace and defense multinational corporation. General Dynamics is the world’s fifth-largest defense contractor based on 2012 revenues and ranked No. 99 in the 2018 Fortune 500 list of the largest United States corporations by total revenue. General Dynamics has over 105,000 employees and reported over $36.0 billion of revenue in 2018. General Dynamics occupies 46,745 square feet at the 700 Independence Parkway property located in Chesapeake, Virginia, where it originally took occupancy in 2017and is on a lease initially expiring in January 2022. General Dynamics currently pays base rent equal to $12.02 per square foot, has no termination options and one, five-year renewal option remaining.
THE INFORMATION IN THIS STRUCTURAL AND COLLATERAL TERM SHEET IS NOT COMPLETE AND MAY BE AMENDED PRIOR TO THE TIME OF SALE. THIS TERM SHEET IS NOT AN OFFER TO SELL THESE SECURITIES AND IT IS NOT A SOLICITATION OF AN OFFER TO BUY THESE SECURITIES IN ANY JURISDICTION WHERE THE OFFER OR SALE IS NOT PERMITTED.
| | 69 of 95 | |
| Structural and Collateral Term Sheet | | JPMDB 2019-COR6 |
|
| Hampton Roads Office Portfolio |
The Hampton Roads Office Portfolio Properties are located across four individual submarkets within the Hampton Roads office market in Southeastern Virginia: Battlefield in Chesapeake (six properties; 33.7% of net rentable area; 39.2% of underwritten net operating income), Lynnhaven in Virginia Beach (six properties; 25.0% of net rentable area; 21.1% of underwritten net operating income), Greenbrier in Chesapeake (five properties; 20.7% of net rentable area; 26.5% of underwritten net operating income) and Hampton Roads Center in Hampton (five properties; 20.7% of net rentable area; 13.1% of underwritten net operating income). The majority of the Hampton Roads Office Portfolio Properties within each submarket are in close proximity to one another and are located within individual business parks.
According to a market report, as of the third quarter of 2019, the overall Hampton Roads office market contained approximately 53.1 million square feet across 3,541 buildings with an overall market vacancy of 8.5% and average asking rents of approximately $17.86 per square foot. The Battlefield office submarket contained approximately 1.3 million square feet across 46 buildings with an overall market vacancy of 3.6% and average asking rents of approximately $17.91 per square foot. The Lynnhaven office submarket contained approximately 1.9 million square feet across 73 buildings with an overall market vacancy of 11.6% and average asking rents of approximately $18.68 per square foot. The Greenbrier office submarket contained approximately 3.3 million square feet across 140 buildings with an overall market vacancy of 4.4% and average asking rents of approximately $18.54 per square foot. The Hampton Roads Center office submarket contained approximately 1.2 million square feet across 26 buildings with an overall market vacancy of 21.7% and average asking rents of approximately $13.98 per square foot. Based on the square footage of the Hampton Roads Office Portfolio Properties, the weighted average vacancy and average asking rents as of the third quarter of 2019 were equal to 9.5% and $17.42 per square foot, respectively.
| Historical and Current Occupancy(1) |
| 2009 | 2010 | 2011 | 2012 | 2013 | 2014 | 2015 | 2016 | 2017 | 2018 | Current(2) |
| 87.7% | 89.2% | 86.9% | 88.5% | 89.2% | 89.2% | 87.9% | 87.3% | 92.0% | 90.5% | 88.5% |
(1) Historical Occupancies are as of December 31 of eachrespective year.
(2) Current Occupancy is as of the rent rolls dated August 31, 2019.
| Tenant Summary(1) |
| Tenant | Ratings
Moody’s/Fitch/S&P(2) | Net Rentable Area (SF) | % of
Total NRA | Base Rent PSF(3) | % of Total
Base Rent(3) | Lease
Expiration Date |
| Cegedim Dendrite(4) | NR / NR / NR | 49,870 | 3.8% | $17.05 | 4.7% | 12/31/2020 |
| Sutherland Global Services Inc.(4) | NR / NR / NR | 49,870 | 3.8% | $14.10 | 3.9% | 9/30/2024 |
| General Dynamics Info(4) | A2 / NR / A+ | 46,745 | 3.5% | $12.02 | 3.1% | 1/31/2022 |
| Ferguson Enterprises, Inc. | NR / NR / NR | 44,651 | 3.4% | $10.24 | 2.5% | 3/31/2021 |
| Children’s Hospital of The King’s Daughters, Inc.(4)(5) | NR / NR / NR | 38,213 | 2.9% | $12.94 | 2.7% | 5/31/2026 |
| Antech Systems(6) | NR / NR / NR | 33,413 | 2.5% | $19.36 | 3.6% | Various(6) |
| Ultralife Corporation | NR / NR / NR | 32,522 | 2.5% | $9.26 | 1.7% | 4/30/2021 |
| Schenker, Inc.(4)(7) | NR / NR / NR | 31,709 | 2.4% | $12.30 | 2.2% | Various(7) |
| Science Systems and Applications Inc.(8) | NR / NR / NR | 30,755 | 2.3% | $11.54 | 2.0% | 5/31/2021 |
| United States Coast Guard Community Services Command | Aaa / AAA / AA+ | 27,498 | 2.1% | $15.23 | 2.3% | 1/31/2027 |
| Top 10 Total / Wtd. Avg. | | 385,246 | 29.1% | $13.44 | 28.6% | |
| Other Tenants | | 785,175 | 59.4% | $16.49 | 71.4% | |
| Total Occupied Space | | 1,170,421 | 88.5% | $15.49 | 100.0% | |
| Vacant | | 151,582 | 11.5% | | | |
| Total | | 1,322,003 | 100.0% | | | |
| (1) | Based on the underwritten rent rolls dated as of August 31, 2019. |
| (2) | In certain instances, ratings provided are those of the parent company of the entity shown, whether or not the parent company guarantees the lease. |
| (3) | Base Rent includes approximately $507,663 in contractual rent steps through November 2020 for certain tenants. |
| (4) | Cegedim Dendrite has two, five-year renewal options remaining, Sutherland Global Services Inc. has one, five-year renewal options remaining, General Dynamics Info has one, five-year renewal option remaining, Children’s Hospital of The King’s Daughters, Inc. has one, five-year renewal option remaining and Schenker, Inc. has two, five-year renewal options remaining. |
| (5) | Children’s Hospital of The King’s Daughters, Inc. has the right to terminate its lease at any time after May 31, 2023 by providing at least 12 months’ notice. |
| (6) | Antech Systems leases 5,028 square feet through May 2021, 4,804 square feet through May 2022 and 23,581 square feet through May 2023. |
| (7) | Schenker, Inc. leases 26,283 square feet through January 2021 and 5,426 square feet through June 2022. |
| (8) | Science Systems and Applications Inc. has the right to terminate its lease at any time by providing at least six months’ notice and payment of a termination fee. |
THE INFORMATION IN THIS STRUCTURAL AND COLLATERAL TERM SHEET IS NOT COMPLETE AND MAY BE AMENDED PRIOR TO THE TIME OF SALE. THIS TERM SHEET IS NOT AN OFFER TO SELL THESE SECURITIES AND IT IS NOT A SOLICITATION OF AN OFFER TO BUY THESE SECURITIES IN ANY JURISDICTION WHERE THE OFFER OR SALE IS NOT PERMITTED.
| | 70 of 95 | |
| Structural and Collateral Term Sheet | | JPMDB 2019-COR6 |
|
| Hampton Roads Office Portfolio |
| Lease Rollover Schedule(1)(2) |
| Year | Number of
Leases Expiring | Net Rentable Area Expiring | % of NRA Expiring | Base Rent Expiring(3) | % of Base Rent Expiring(3) | Cumulative Net Rentable Area Expiring | Cumulative % of NRA Expiring | Cumulative Base Rent Expiring(3) | Cumulative % of Base Rent Expiring(3) |
| Vacant | NAP | 151,582 | 11.5% | NAP | NAP | 151,582 | 11.5% | NAP | NAP |
| 2019 & MTM | 5 | 28,348 | 2.1% | $386,179 | 2.1% | 179,930 | 13.6% | $386,179 | 2.1% |
| 2020 | 36 | 226,347 | 17.1% | 3,391,156 | 18.7% | 406,277 | 30.7% | $3,777,334 | 20.8% |
| 2021 | 37 | 340,900 | 25.8% | 4,894,521 | 27.0% | 747,177 | 56.5% | $8,671,855 | 47.8% |
| 2022 | 26 | 170,041 | 12.9% | 2,779,998 | 15.3% | 917,218 | 69.4% | $11,451,853 | 63.2% |
| 2023 | 20 | 130,864 | 9.9% | 2,389,039 | 13.2% | 1,048,082 | 79.3% | $13,840,892 | 76.3% |
| 2024 | 15 | 139,422 | 10.5% | 2,305,645 | 12.7% | 1,187,504 | 89.8% | $16,146,537 | 89.1% |
| 2025 | 4 | 32,090 | 2.4% | 501,226 | 2.8% | 1,219,594 | 92.3% | $16,647,764 | 91.8% |
| 2026 | 1 | 38,213 | 2.9% | 494,604 | 2.7% | 1,257,807 | 95.1% | $17,142,368 | 94.6% |
| 2027 | 2 | 29,796 | 2.3% | 450,062 | 2.5% | 1,287,603 | 97.4% | $17,592,430 | 97.0% |
| 2028 | 0 | 0 | 0.0% | 0 | 0.0% | 1,287,603 | 97.4% | $17,592,430 | 97.0% |
| 2029 | 0 | 0 | 0.0% | 0 | 0.0% | 1,287,603 | 97.4% | $17,592,430 | 97.0% |
| 2030 & Beyond | 8 | 34,400 | 2.6% | 537,263 | 3.0% | 1,322,003 | 100.0% | $18,129,693 | 100.0% |
| Total | 154 | 1,322,003 | 100.0% | $18,129,693 | 100.0% | | | | |
| | | | | | | | | | | |
| (1) | Based on the underwritten rent rolls dated August 31, 2019. |
| (2) | Certain tenants have lease termination options that may become exercisable prior to the originally stated expiration date of the tenant lease and that are not considered in the lease rollover schedule. |
| (3) | Base Rent Expiring includes approximately $507,663 in contractual rent steps through November 2020 for certain tenants. |
| Operating History and Underwritten Net Cash Flow |
| | 2016 | 2017 | 2018 | TTM(1) | Underwritten | Per Square Foot | %(1) |
| Rents in Place | $14,197,324 | $15,261,475 | $16,317,558 | $16,921,722 | $17,622,030 | $13.33 | 67.7% |
| Contractual Rent Steps(2) | 0 | 0 | 0 | 0 | 507,663 | 0.38 | 2.0 |
| Vacant Income | 0 | 0 | 0 | 0 | 2,936,081 | 2.22 | 11.3 |
| Gross Potential Rent | $14,197,324 | $15,261,475 | $16,317,558 | $16,921,722 | $21,065,775 | $15.93 | 80.9% |
| Total Reimbursements | 6,233,629 | 5,649,360 | 5,536,333 | 5,450,439 | 4,763,361 | 3.60 | 18.3 |
| Total Other Income | 165,751 | 176,645 | 170,993 | 176,268 | 194,268 | 0.15 | 0.7 |
| Net Rental Income | $20,596,704 | $21,087,480 | $22,024,884 | $22,548,429 | $26,023,404 | $19.68 | 100.0% |
| (Vacancy/Credit Loss) | 0 | 0 | 0 | 0 | (3,531,853) | (2.67) | (13.6) |
| Effective Gross Income | $20,596,704 | $21,087,480 | $22,024,884 | $22,548,429 | $22,491,550 | $17.01 | 86.4% |
| Total Expenses | $7,826,069 | $8,021,316 | $8,557,697 | $8,066,376 | $8,208,420 | $6.21 | 36.5% |
| Net Operating Income | $12,770,635 | $13,066,165 | $13,467,187 | $14,482,053 | $14,283,130 | $10.80 | 63.5% |
| Total TI/LC, CapEx/RR | 0 | 0 | 0 | 0 | 1,999,510 | 1.51 | 8.9 |
| Net Cash Flow | $12,770,635 | $13,066,165 | $13,467,187 | $14,482,053 | $12,283,620 | $9.29 | 54.6% |
| | | | | | | | | | | | | |
| (1) | TTM column represents the trailing 12-month period ending July 31, 2019. |
| (2) | % column represents percent of Net Rental Income for all revenue lines and represents percent of Effective Gross Income for the remainder of the fields. |
| (3) | Based on the contractual rent steps through November 2020 for certain tenants. |
Property Management.The Hampton Roads Office Portfolio Properties are managed by LingComm, LLC, a third-party management company.
THE INFORMATION IN THIS STRUCTURAL AND COLLATERAL TERM SHEET IS NOT COMPLETE AND MAY BE AMENDED PRIOR TO THE TIME OF SALE. THIS TERM SHEET IS NOT AN OFFER TO SELL THESE SECURITIES AND IT IS NOT A SOLICITATION OF AN OFFER TO BUY THESE SECURITIES IN ANY JURISDICTION WHERE THE OFFER OR SALE IS NOT PERMITTED.
| | 71 of 95 | |
| Structural and Collateral Term Sheet | | JPMDB 2019-COR6 |
|
| Hampton Roads Office Portfolio |
Escrows and Reserves. At origination, the borrowers deposited into escrow $1,500,000 for tenant improvements and leasing commissions, approximately $1,001,936 for outstanding tenant improvements and leasing commissions, $600,000 for real estate taxes, $250,000 for replacement reserves, $223,102 for required repairs, approximately $86,251 for outstanding free rent and $30,000 for insurance premiums.
Tax Escrows– On a monthly basis,the borrowers are required to escrow 1/12 of the annual estimated tax payments, which currently equates to $150,800.
Insurance Escrows– On a monthly basis,the borrowers are required to escrow 1/12 of the annual estimated insurance premiums, which currently equates to $22,200.
Replacement Reserves –On a monthly basis, the borrowers are required to escrow $33,050 for replacement reserves, subject to a cap of $4,000,000.
TI/LC Reserves – On a monthly basis, the borrowers are required to escrow $168,555 for tenant improvements and leasing commissions.
Lockbox / Cash Management.The Hampton Roads Office Portfolio Whole Loan is structured with a hard lockbox and in place cash management. All rents are required to be deposited directly by the tenants into a lockbox account controlled by the lender. All funds in the lockbox account are required to be swept to a lender-controlled cash management account every business day and applied on each payment date to the payment of debt service and the funding of required reserves. Provided no Cash Trap Period (as defined below) is continuing, all funds remaining in the cash management account after payment of the aforementioned items will be transferred into the borrowers’ operating account. During a Cash Trap Period, all excess cash in the cash management account will be retained by the lender as additional collateral for the Hampton Roads Office Portfolio Whole Loan.
A “Cash Trap Period” will commence (i) upon an event of default (including an event of default under the mezzanine loan), (ii) from and after October 6, 2019, if the debt service coverage ratio is less than 1.10x (including the mezzanine loan) (until such time that the debt service coverage ratio is greater than or equal to 1.10x for two consecutive quarters) or (iii) upon 60 days after the death or incapacity of the loan sponsor.
Additional Debt. A mezzanine loan was funded concurrently and is coterminous with the Hampton Roads Office Portfolio Whole Loan. The mezzanine loan has an original principal balance of $20.0 million, accrues interest at a rate of 7.97750%per annum, and amortizes pursuant to a fixed amortization schedule. Including the mezzanine loan, the cumulative Cut-off Date LTV, cumulative UW NCF DSCR and cumulative UW NOI DY are 82.0%, 1.16x and 9.4%, respectively. The mezzanine loan is currently held by LCM or an affiliate.
Release Parcels. The Hampton Roads Office Portfolio Whole Loan provides for the release of two unimproved outparcel tracts consisting of approximately 0.814 acres and 0.998 acres, respectively,provided that, among other things, (i) the borrowers deposit $200,000 per release into the replacement reserve account and (ii) the release is in compliance with the REMIC conditions.
Partial Release. Commencing on the date that is the earlier to occur of (x) two years after the securitization closing date of the lastpari passu note to be securitized and (y) October 6, 2022, the borrowers may obtain the release of any of the Hampton Roads Office Portfolio Properties,provided that, among other conditions, (i) the borrowers prepay a portion of the Hampton Roads Office Portfolio Whole Loan equal to the greater of (a) 115.0% of the allocated loan amount of the Hampton Roads Office Portfolio Property being released and (b) 100.0% of net sales proceeds, in each case, together with the applicable yield maintenance premium, and (ii) the debt yield (as calculated in accordance with the Hampton Roads Office Portfolio Whole Loan documents) for the remaining Hampton Roads Office Portfolio Properties following the release is not less than the greater of (a) the debt yield immediately preceding such release and (b) 8.3%.
THE INFORMATION IN THIS STRUCTURAL AND COLLATERAL TERM SHEET IS NOT COMPLETE AND MAY BE AMENDED PRIOR TO THE TIME OF SALE. THIS TERM SHEET IS NOT AN OFFER TO SELL THESE SECURITIES AND IT IS NOT A SOLICITATION OF AN OFFER TO BUY THESE SECURITIES IN ANY JURISDICTION WHERE THE OFFER OR SALE IS NOT PERMITTED.
| | 72 of 95 | |
| Structural and Collateral Term Sheet | | JPMDB 2019-COR6 |
| |
| Colorado Square |
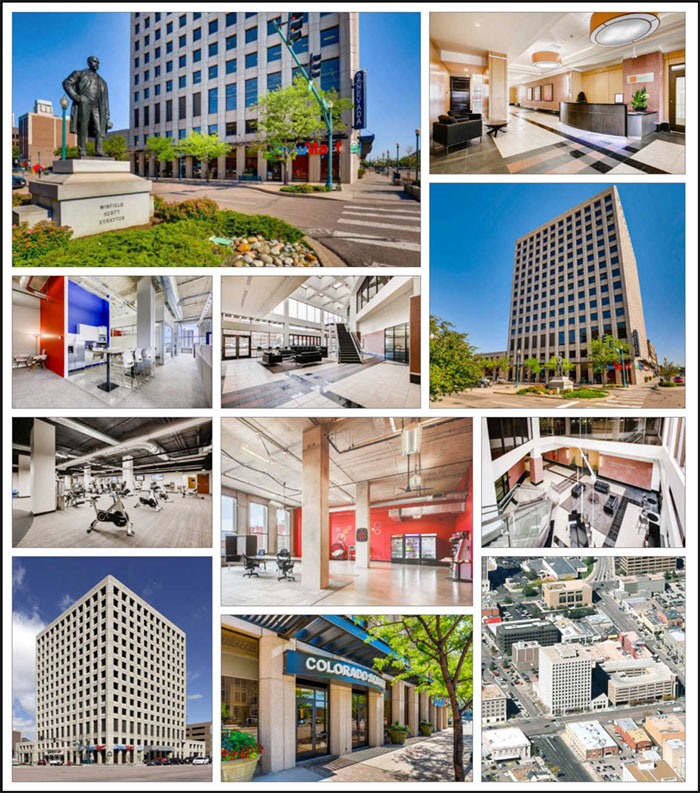
THE INFORMATION IN THIS STRUCTURAL AND COLLATERAL TERM SHEET IS NOT COMPLETE AND MAY BE AMENDED PRIOR TO THE TIME OF SALE. THIS TERM SHEET IS NOT AN OFFER TO SELL THESE SECURITIES AND IT IS NOT A SOLICITATION OF AN OFFER TO BUY THESE SECURITIES IN ANY JURISDICTION WHERE THE OFFER OR SALE IS NOT PERMITTED.
| | 73 of 95 | |
| Structural and Collateral Term Sheet | | JPMDB 2019-COR6 |
| |
| Colorado Square |
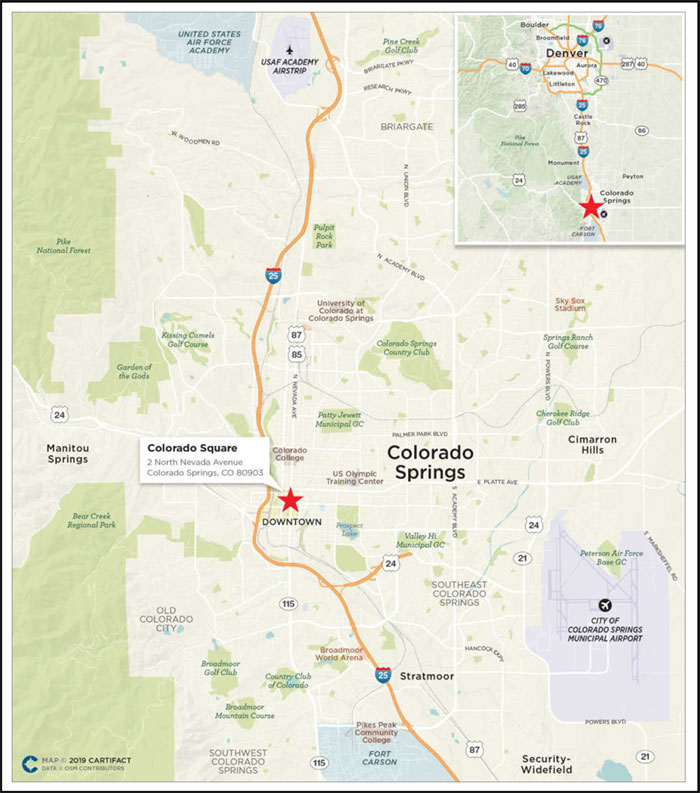
THE INFORMATION IN THIS STRUCTURAL AND COLLATERAL TERM SHEET IS NOT COMPLETE AND MAY BE AMENDED PRIOR TO THE TIME OF SALE. THIS TERM SHEET IS NOT AN OFFER TO SELL THESE SECURITIES AND IT IS NOT A SOLICITATION OF AN OFFER TO BUY THESE SECURITIES IN ANY JURISDICTION WHERE THE OFFER OR SALE IS NOT PERMITTED.
| | 74 of 95 | |
| Structural and Collateral Term Sheet | | JPMDB 2019-COR6 |
| |
| Colorado Square |
| Mortgage Loan Information | | Property Information |
| Mortgage Loan Seller: | LCM | | Single Asset / Portfolio: | Single Asset |
| Original Principal Balance: | $37,200,000 | | Title: | Fee |
| Cut-off Date Principal Balance: | $37,050,001 | | Property Type - Subtype: | Office – CBD |
| % of Pool by IPB: | 4.6% | | Net Rentable Area (SF): | 245,509 |
| Loan Purpose: | Refinance | | Location: | Colorado Springs, CO |
| Borrower: | Unico Colorado Square LLC | | Year Built / Renovated: | 1976 / 2000, 2018 |
| Sponsor: | Unico Investment Group LLC | | Occupancy: | 90.6% |
| Interest Rate: | 4.10000% | | Occupancy Date: | 6/30/2019 |
| Note Date: | 7/11/2019 | | Number of Tenants: | 14 |
| Maturity Date: | 8/6/2029 | | 2016 NOI(1): | N/A |
| Interest-only Period: | None | | 2017 NOI(1): | N/A |
| Original Term: | 120 months | | 2018 NOI: | $2,320,854 |
| Original Amortization: | 360 months | | TTM NOI (as of 5/2019)(2): | $2,352,134 |
| Amortization Type: | Balloon | | UW Economic Occupancy: | 90.6% |
| Call Protection: | L(27),Def(86),O(7) | | UW Revenues: | $5,860,001 |
| Lockbox / Cash Management: | Hard / Springing | | UW Expenses: | $2,398,116 |
| Additional Debt: | N/A | | UW NOI(2): | $3,461,885 |
| Additional Debt Balance: | N/A | | UW NCF: | $3,307,214 |
| Additional Debt Type: | N/A | | Appraised Value / Per SF: | $51,600,000 / $210 |
| | | | Appraisal Date: | 5/24/2019 |
| | | | | |
| Escrows and Reserves(3) | | Financial Information |
| | Initial | Monthly | Initial Cap | | Cut-off Date Loan / SF: | $151 | |
| Taxes: | $105,000 | $56,000 | N/A | | Maturity Date Loan / SF: | $121 | |
| Insurance: | $0 | Springing | N/A | | Cut-off Date LTV: | 71.8% | |
| Replacement Reserves: | $0 | $5,115 | $175,000 | | Maturity Date LTV: | 57.5% | |
| TI/LC: | $897,141 | $10,230 | N/A | | UW NCF DSCR: | 1.53x | |
| Other | $1,220,493 | $0 | N/A | | UW NOI Debt Yield: | 9.3% | |
| | | | | | | | |
| Sources and Uses |
| Sources | Proceeds | % of Total | | Uses | Proceeds | % of Total |
| Mortgage Loan | $37,200,000 | 100.0% | | Payoff Existing Debt | $25,394,462 | 68.3% |
| | | | | Upfront Reserves | 2,222,634 | 6.0% |
| | | | | Closing Costs | 473,140 | 1.3% |
| | | | | Return of Equity | 9,109,763 | 24.5% |
| Total Sources | $37,200,000 | 100.0% | | Total Uses | $37,200,000 | 100.0% |
| (1) | 2016 NOI and 2017 NOI are not available as the loan sponsor acquired the Colorado Square Property (as defined below) in July 2017 and commenced a renovation which was completed in 2018. |
| (2) | The increase from TTM NOI to UW NOI is primarily attributable to (i) the Colorado Square Property’s renovation that was completed in 2018 and the subsequent lease up from 78.1% occupancy in 2018 to 90.6% current occupancy and (ii) approximately $232,371 of average rent over the loan term for Colorado Interstate Gas. |
| (3) | For a full description of Escrows and Reserves, please refer to“Escrows and Reserves”below. |
The Loan.The Colorado Square mortgage loan (the “Colorado Square Loan”) has an outstanding principal balance as of the Cut-off Date of approximately $37.1 million and is secured by a first priority mortgage lien on the borrower’s fee interest in a Class A office building totaling 245,509 square feet of net rentable area (the “Colorado Square Property”) located in the central business district of Colorado Springs, Colorado. The Colorado Square Loan has a 10-year term and amortizes on a 30-year schedule.The most recent prior financing of theColorado SquareProperty was not included in a securitization.
The Borrower. The borrowing entity is Unico Colorado Square LLC, a Delaware limited liability company and special purpose entity structured to be bankruptcy remote with one independent director. Legal counsel to the borrowers delivered a non-consolidation opinion in connection with the origination of the Colorado Square Loan.
THE INFORMATION IN THIS STRUCTURAL AND COLLATERAL TERM SHEET IS NOT COMPLETE AND MAY BE AMENDED PRIOR TO THE TIME OF SALE. THIS TERM SHEET IS NOT AN OFFER TO SELL THESE SECURITIES AND IT IS NOT A SOLICITATION OF AN OFFER TO BUY THESE SECURITIES IN ANY JURISDICTION WHERE THE OFFER OR SALE IS NOT PERMITTED.
| | 75 of 95 | |
| Structural and Collateral Term Sheet | | JPMDB 2019-COR6 |
| |
| Colorado Square |
The Loan Sponsor.The loan sponsor and nonrecourse carve-out guarantor is Unico Investment Group LLC (“Unico”). Unico is a private real estate firm offering investment, development, management and sustainability services in emerging markets across the United States. Founded in 1953 and headquartered in Seattle, Washington, the company employs nearly 300 real estate professionals nationwide. The company currently is invested in or actively managing a portfolio in excess of $4.3 billion of office, multifamily and mixed-use properties. Unico acquired the Colorado Square Property in July 2017 for approximately $34.6 million and has a current basis of $39.7 million.
The Property.The Colorado Square Property is a 14-story, Class A office building totaling 245,509 square feet originally constructed in 1976, renovated in 2000 and most recently renovated and updated in 2018. Recent renovations include the lobby, lobby lounge, common area hallways, common area bathrooms, basement storage and a newly constructed basement fitness center including showers and lockers as an amenity to tenants. As of the June 30, 2019 underwritten rent rolls, the Colorado Square Property was 90.6% leased to 15 tenants at a weighted average underwritten base rent equal to $17.79 per square foot.
The largest tenant at the Colorado Square Property is Colorado Interstate Gas (“CIG”) (141,531 square feet; 57.6% of net rentable area; 68.9% of underwritten base rent; rated Baa2/BBB/BBB by Moody’s/Fitch/S&P). CIG is a subsidiary of Kinder Morgan, one of the largest energy infrastructure companies in North America. Kinder Morgan owns an interest in or operates approximately 84,000 miles of pipelines and 157 terminals and has approximately 11,000 employees. The company’s pipelines transport natural gas, refined petroleum products, crude oil, carbon dioxide and more. CIG was an original tenant at the Colorado Square Property since it was constructed in 1976. CIG has a lease expiration of June 2033 with no renewal options and a one-time termination option effective in June 2030, with 12-months prior notice and payment of a termination fee in the amount equal to the sum of any unamortized tenant improvements and leasing commissions and three months of base rent. CIG currently pays base rent equal to $18.31 per square foot. UW base rent of $18.31 is based on average rent over the loan term.
The second largest tenant at the Colorado Square Property is Vladimir Jones (11,364 square feet; 4.6% of net rentable area; 5.4% of underwritten base rent). Vladimir Jones is Colorado’s original independent, integrated advertising agency, with offices in Denver and Colorado Springs. Vladimir Jones recently took occupancy in 2019 and has a lease expiration of August 2027 with one, five-year renewal options remaining and no termination options. Vladimir Jones currently pays base rent equal to $18.00 per square foot.
The third largest tenant at the Colorado Square Property is HighJump Software (“HighJump”) (11,000 square feet; 4.5% of net rentable area; 4.9% of underwritten base rent). HighJump is a provider of supply chain management software including warehouse management systems, eCommerce, direct store delivery software, transportation management systems, ERP data collection, inventory management and electronic data interchange. HighJump has been a tenant since February 2019 and has a lease expiration of June 2026 with one, five-year renewal option remaining and no termination options. HighJump currently pays base rent equal to $16.75 per square foot.
The Colorado Square Property is located in the central business district office submarket, within the overall Colorado Springs office market. According to a market report, as of the third quarter of 2019, the overall Colorado Springs office market contained approximately 29.0 million square feet across 1,741 buildings with an overall market vacancy of 9.0% and average asking rents of $16.71 per square foot. As of the third quarter of 2019, the central business district office submarket contained approximately 3.5 million square feet across 114 buildings with an overall market vacancy of 7.7% and average asking rents of $18.39 per square foot. The appraisal for the Colorado Square Property included five triple net (“NNN”) rent comparables. The rent comparables ranged from $15.50 to $19.00 per square foot with a weighted average of approximately $16.25 per square foot.
| Historical and Current Occupancy(1) |
| 2016(2) | 2017 | 2018 | Current(3) |
| N/A | 72.3% | 78.1% | 90.6% |
| (1) | Historical Occupancies are as of December 31 of eachrespective year. |
| (2) | 2016 Occupancy is not available as the loan sponsor acquired the Colorado Square Property in July 2017 and 2016 occupancy was not provided. |
| (3) | Current Occupancy is as of the rent roll dated June 30, 2019. |
THE INFORMATION IN THIS STRUCTURAL AND COLLATERAL TERM SHEET IS NOT COMPLETE AND MAY BE AMENDED PRIOR TO THE TIME OF SALE. THIS TERM SHEET IS NOT AN OFFER TO SELL THESE SECURITIES AND IT IS NOT A SOLICITATION OF AN OFFER TO BUY THESE SECURITIES IN ANY JURISDICTION WHERE THE OFFER OR SALE IS NOT PERMITTED.
| | 76 of 95 | |
| Structural and Collateral Term Sheet | | JPMDB 2019-COR6 |
| |
| Colorado Square |
| Tenant Summary(1) |
| Tenant | Ratings
Moody’s/Fitch/S&P | Net Rentable
Area (SF) | % of
Total NRA | Base Rent
PSF(2) | % of Total
Base Rent(2) | Lease
Expiration Date |
| Colorado Interstate Gas(3) | Baa2 / BBB- / BBB | 141,531 | 57.6% | $18.31 | 68.9% | 6/30/2033 |
| Vladimir Jones(4)(5) | NR / NR / NR | 11,364 | 4.6% | $18.00 | 5.4% | 8/31/2027 |
| HighJump Software(4) | NR / NR / NR | 11,000 | 4.5% | $16.75 | 4.9% | 6/30/2026 |
| Welkin Sciences, LLC(4) | NR / NR / NR | 9,196 | 3.7% | $15.11 | 3.3% | 7/31/2022 |
| Exigo(4) | NR / NR / NR | 7,441 | 3.0% | $16.50 | 3.3% | 9/30/2022 |
| IAI(4)(5) | NR / NR / NR | 7,249 | 3.0% | $17.50 | 3.4% | 6/30/2026 |
| Rod Emert Associates(4) | NR / NR / NR | 5,338 | 2.2% | $15.75 | 2.2% | 1/31/2026 |
| EST, Inc(5) | NR / NR / NR | 4,557 | 1.9% | $18.75 | 2.3% | 10/31/2026 |
| Kimley-Horn and Associates(4) | NR / NR / NR | 4,008 | 1.6% | $15.50 | 1.7% | 7/31/2022 |
| Petra Financial Advisors(4) | NR / NR / NR | 3,765 | 1.5% | $16.00 | 1.6% | 4/30/2026 |
| Top 10 Total / Wtd. Avg. | | 205,449 | 83.6% | $17.82 | 97.4% | |
| Other Tenants(6) | | 16,982 | 6.9% | $16.86 | 2.6% | |
| Total Occupied Space | | 222,431 | 90.6% | $16.97 | 100.0% | |
| Vacant | | 23,078 | 9.4% | | | |
| Total | | 245,509 | 100.0% | | | |
| (1) | Based on the underwritten rent rolls dated as of June 30, 2019. |
| (2) | Base Rent includes approximately $27,777 in contractual rent steps through September 2020 for certain tenants and approximately $232,371 of average rent over the loan term for Colorado Interstate Gas. |
| (3) | Colorado Interstate Gas has a one-time termination option effective in June 2030, with 12-months prior notice and payment of a termination fee in the amount equal to the sum of any unamortized tenant improvements and leasing commissions and three months of base rent. |
| (4) | Vladimir Jones has one, five-year renewal option remaining, HighJump Software has one, five-year renewal option remaining, Exigo has one, five-year renewal option remaining, IAI has one, five-year renewal option remaining, Welkin Sciences, LLC has two, five-year renewal options remaining, Rod Emert Associates has one, five-year renewal option remaining, Kimley-Horn and Associates has two, three-year renewal options remaining and Petra Financial Advisors has one, five-year renewal option remaining. |
| (5) | Vladimir Jones has a free rent period through February 2020 for $102,276, IAI has a free rent period through March 2020 for approximately $12,386 and EST, Inc has a free rent period through May 2021 for approximately $65,658 for an aggregate of approximately $180,320 in free rent. At origination, the borrower deposited approximately $180,320 into a free rent reserve. |
| (6) | Other Tenants includes an 11,108 square foot fitness center which has no attributable rent and has been excluded from the Other Tenants Base Rent PSF calculation. |
| Lease Rollover Schedule(1) |
| Year | Number of
Leases
Expiring | Net
Rentable
Area
Expiring | % of NRA
Expiring | Base Rent
Expiring(2) | % of Base
Rent Expiring(2) | Cumulative
Net Rentable
Area
Expiring | Cumulative
% of NRA
Expiring | Cumulative
Base Rent
Expiring(2) | Cumulative
% of Base
Rent
Expiring(2) |
| Vacant | NAP | 23,078 | 9.4% | NAP | NAP | 23,078 | 9.4% | NAP | NAP |
| 2019 & MTM | 1 | 1,413 | 0.6% | $24,021 | 0.6% | 24,491 | 10.0% | $24,021 | 0.6% |
| 2020 | 1 | 1,246 | 0.5% | 19,936 | 0.5% | 25,737 | 10.5% | $43,957 | 1.2% |
| 2021 | 0 | 0 | 0.0% | 0 | 0.0% | 25,737 | 10.5% | $43,957 | 1.2% |
| 2022 | 4 | 21,445 | 8.7% | 337,909 | 9.0% | 47,182 | 19.2% | $381,866 | 10.2% |
| 2023 | 1 | 2,415 | 1.0% | 41,055 | 1.1% | 49,597 | 20.2% | $422,921 | 11.2% |
| 2024 | 0 | 0 | 0.0% | 0 | 0.0% | 49,597 | 20.2% | $422,921 | 11.2% |
| 2025 | 0 | 0 | 0.0% | 0 | 0.0% | 49,597 | 20.2% | $422,921 | 11.2% |
| 2026 | 5 | 31,909 | 13.0% | 540,865 | 14.4% | 81,506 | 33.2% | $963,786 | 25.6% |
| 2027 | 1 | 11,364 | 4.6% | 204,552 | 5.4% | 92,870 | 37.8% | $1,168,338 | 31.1% |
| 2028 | 0 | 0 | 0.0% | 0 | 0.0% | 92,870 | 37.8% | $1,168,338 | 31.1% |
| 2029 | 0 | 0 | 0.0% | 0 | 0.0% | 92,870 | 37.8% | $1,168,338 | 31.1% |
| 2030 & Beyond(3) | 1 | 152,639 | 62.2% | 2,591,692 | 68.9% | 245,509 | 100.0% | $3,760,030 | 100.0% |
| Total | 14 | 245,509 | 100.0% | $3,760,030 | 100.0% | | | | |
| | | | | | | | | | |
| (1) | Based on the underwritten rent roll dated June 30, 2019. |
| (2) | Base Rent Expiring includes approximately $27,777 in contractual rent steps through September 2020 for certain tenants and approximately $232,371 of average rent over the loan term for Colorado Interstate Gas. |
| (3) | 2030 & Beyond includes an 11,108 square foot fitness center which is not considered an expiring lease. |
THE INFORMATION IN THIS STRUCTURAL AND COLLATERAL TERM SHEET IS NOT COMPLETE AND MAY BE AMENDED PRIOR TO THE TIME OF SALE. THIS TERM SHEET IS NOT AN OFFER TO SELL THESE SECURITIES AND IT IS NOT A SOLICITATION OF AN OFFER TO BUY THESE SECURITIES IN ANY JURISDICTION WHERE THE OFFER OR SALE IS NOT PERMITTED.
| | 77 of 95 | |
| Structural and Collateral Term Sheet | | JPMDB 2019-COR6 |
| |
| Colorado Square |
| Operating History and Underwritten Net Cash Flow |
| | 2018 | TTM(1) | Underwritten | Per Square
Foot | %(2) |
| Rents in Place | $2,808,324 | $2,823,778 | $3,499,882 | $14.26 | 54.1% |
| Straight Line Rent(3) | 0 | 0 | 232,371 | 0.95 | 3.6 |
| Contractual Rent Steps(4) | 0 | 0 | 27,777 | 0.11 | 0.4 |
| Vacant Income | 0 | 0 | 610,652 | 2.49 | 9.4 |
| Gross Potential Rent | $2,808,324 | $2,823,778 | $4,370,682 | $17.80 | 67.5% |
| Total Reimbursements | 1,565,621 | 1,703,229 | 2,096,811 | 8.54 | 32.4 |
| Total Other Income | 2,463 | 3,160 | 3,160 | 0.01 | 0.0 |
| Net Rental Income | $4,376,408 | $4,530,167 | $6,470,653 | $26.36 | 100.0% |
| (Vacancy/Credit Loss) | 0 | 0 | (610,652) | (2.49) | (9.4) |
| Effective Gross Income | $4,376,408 | $4,530,167 | $5,860,001 | $23.87 | 90.6% |
| | | | | | |
| Total Expenses | $2,055,554 | $2,178,033 | $2,398,116 | $9.77 | 40.9% |
| | | | | | |
| Net Operating Income(5) | $2,320,854 | $2,352,134 | $3,461,885 | $14.10 | 59.1% |
| | | | | | |
| Total TI/LC, CapEx/RR | 0 | 0 | 154,671 | 0.63 | 2.6 |
| | | | | | |
| Net Cash Flow | $2,320,854 | $2,352,134 | $3,307,214 | $13.47 | 56.4% |
| | | | | | |
| (1) | TTM column represents the trailing 12-month period ending May 31, 2019. |
| (2) | % column represents percent of Net Rental Income for all revenue lines and represents percent of Effective Gross Income for the remainder of the fields. |
| (3) | Based on the average rent over the loan term for Colorado Interstate Gas. |
| (4) | Based on the contractual rent steps through September 2020 for certain tenants. |
| (5) | The increase from TTM NOI to Underwritten NOI is primarily attributable to (i) the Colorado Square Property’s renovation that was completed in 2018 and the subsequent lease up from 78.1% occupancy in 2018 to 90.6% current occupancy and (ii) approximately $232,371 of average rent over the loan term for Colorado Interstate Gas. |
Property Management.The Colorado Square Property is managed by Unico Properties LLC, an affiliate of the borrower.
Escrows and Reserves. At origination, the borrowers deposited into escrow $1,000,000 for a Vladimir Jones Holdback Reserve (as defined below), $897,141 for outstanding tenant improvements and leasing commissions, approximately $180,320 for outstanding free rent, $105,000 for real estate taxes and $40,173 for required repairs.
Tax Escrows– On a monthly basis,the borrower is required to escrow 1/12 of the annual estimated tax payments, which currently equates to $56,000.
Insurance Escrows– On a monthly basis, if an acceptable blanket policy is no longer in place,the borrower is required to escrow 1/12 of the annual estimated insurance premiums.
Replacement Reserves –On a monthly basis, the borrower is required to escrow $5,115 for replacement reserves.
TI/LC Reserves – On a monthly basis, the borrower is required to escrow $10,230 for tenant improvements and leasing commissions.
Vladimir Jones Holdback Reserve – Provided no default or event of default has occurred and is continuing, the lender will release the $1,000,000 in the Vladimir Jones Holdback Reserve to the borrower upon Vladimir Jones paying full unabated rent.
Lockbox / Cash Management.The Colorado Square Loan is structured with a hard lockbox and springing cash management. All rents are required to be deposited directly by the tenants into a lockbox account controlled by the lender. All funds in the lockbox account are required to be swept daily into the borrower’s operating account, unless a Cash Management Period is continuing. Upon the occurrence of a Cash Management Period, all funds in the lockbox account will be swept daily into a lender-controlled account, from which account such funds will disbursed on each payment date in accordance with the Colorado Square Loan documents and any excess will be retained by the lender as additional collateral for the Colorado Square Loan.
A “Cash Management Period” will commence (i) upon an event of default, (ii) if the debt service coverage ratio is less than 1.15x (until such time that the debt service coverage ratio is greater than or equal to 1.15x for two consecutive quarters) or (iii) upon a Lease Sweep Period (as defined below).
THE INFORMATION IN THIS STRUCTURAL AND COLLATERAL TERM SHEET IS NOT COMPLETE AND MAY BE AMENDED PRIOR TO THE TIME OF SALE. THIS TERM SHEET IS NOT AN OFFER TO SELL THESE SECURITIES AND IT IS NOT A SOLICITATION OF AN OFFER TO BUY THESE SECURITIES IN ANY JURISDICTION WHERE THE OFFER OR SALE IS NOT PERMITTED.
| | 78 of 95 | |
| Structural and Collateral Term Sheet | | JPMDB 2019-COR6 |
| |
| Colorado Square |
A “Lease Sweep Period” will commence (i) on the date that is 12 months prior to the end of the term (including any renewal terms) of any Lease Sweep Lease (as defined below), (ii) on the date that is 12 months prior to the Colorado Square Loan maturity date, unless borrower delivers evidence to the lender that Colorado Interstate Gas has waived its termination option pursuant to the Colorado Interstate Gas lease, (iii) on the date that is required under a Lease Sweep Lease by which the applicable Lease Sweep Tenant (defined below) is required to give notice of its exercise of a renewal option thereunder (and such renewal has not so been exercised), (iv) if any Lease Sweep Lease is surrendered, cancelled or terminated prior to its then-current expiration date, (v) if any Lease Sweep Tenant goes dark or gives notice that it intends to discontinue its business at its premises, (vi) upon the occurrence and continuance of a default under any Lease Sweep Lease or (vii) upon the occurrence of an insolvency proceeding for any Lease Sweep Tenant.
A “Lease Sweep Lease” means any lease which covers 35,000 or more square foot.
A “Lease Sweep Tenant” means any tenant under a Lease Sweep Lease, or under one or more leases (leased by such tenant and/or its affiliates) which when taken together would constitute a Lease Sweep Lease.
Additional Debt. None permitted.
THE INFORMATION IN THIS STRUCTURAL AND COLLATERAL TERM SHEET IS NOT COMPLETE AND MAY BE AMENDED PRIOR TO THE TIME OF SALE. THIS TERM SHEET IS NOT AN OFFER TO SELL THESE SECURITIES AND IT IS NOT A SOLICITATION OF AN OFFER TO BUY THESE SECURITIES IN ANY JURISDICTION WHERE THE OFFER OR SALE IS NOT PERMITTED.
| | 79 of 95 | |
| Structural and Collateral Term Sheet | | JPMDB 2019-COR6 |
| |
| Sunset North |

THE INFORMATION IN THIS STRUCTURAL AND COLLATERAL TERM SHEET IS NOT COMPLETE AND MAY BE AMENDED PRIOR TO THE TIME OF SALE. THIS TERM SHEET IS NOT AN OFFER TO SELL THESE SECURITIES AND IT IS NOT A SOLICITATION OF AN OFFER TO BUY THESE SECURITIES IN ANY JURISDICTION WHERE THE OFFER OR SALE IS NOT PERMITTED.
| | 80 of 95 | |
| Structural and Collateral Term Sheet | | JPMDB 2019-COR6 |
| |
| Sunset North |

THE INFORMATION IN THIS STRUCTURAL AND COLLATERAL TERM SHEET IS NOT COMPLETE AND MAY BE AMENDED PRIOR TO THE TIME OF SALE. THIS TERM SHEET IS NOT AN OFFER TO SELL THESE SECURITIES AND IT IS NOT A SOLICITATION OF AN OFFER TO BUY THESE SECURITIES IN ANY JURISDICTION WHERE THE OFFER OR SALE IS NOT PERMITTED.
| | 81 of 95 | |
| Structural and Collateral Term Sheet | | JPMDB 2019-COR6 |
| |
| Sunset North |
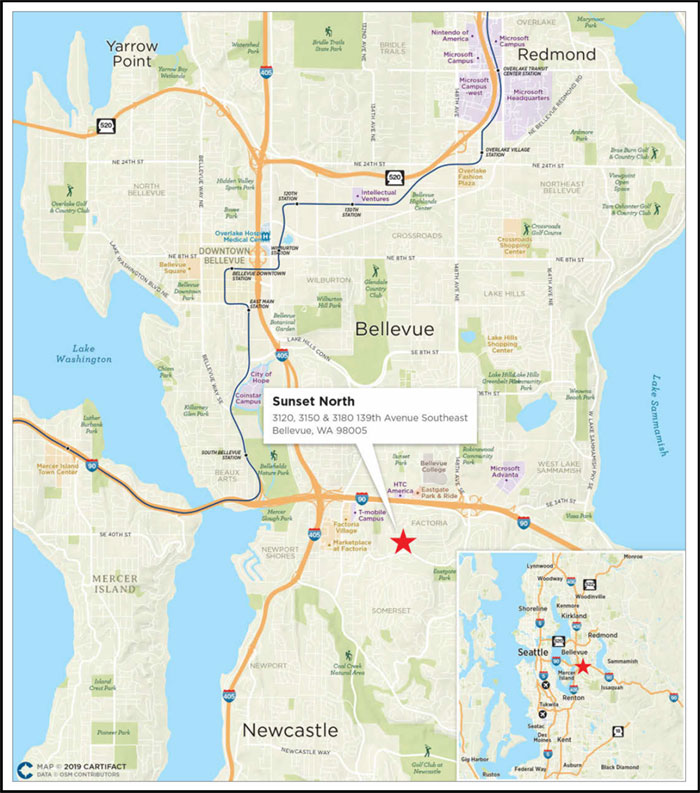
THE INFORMATION IN THIS STRUCTURAL AND COLLATERAL TERM SHEET IS NOT COMPLETE AND MAY BE AMENDED PRIOR TO THE TIME OF SALE. THIS TERM SHEET IS NOT AN OFFER TO SELL THESE SECURITIES AND IT IS NOT A SOLICITATION OF AN OFFER TO BUY THESE SECURITIES IN ANY JURISDICTION WHERE THE OFFER OR SALE IS NOT PERMITTED.
| | 82 of 95 | |
| Structural and Collateral Term Sheet | | JPMDB 2019-COR6 |
| |
| Sunset North |
| Mortgage Loan Information | | Property Information |
| Mortgage Loan Seller: | JPMCB | | Single Asset / Portfolio: | Single Asset |
| Original Principal Balance(1): | $35,000,000 | | Title: | Fee |
| Cut-off Date Principal Balance(1): | $35,000,000 | | Property Type - Subtype: | Office – Suburban |
| % of Pool by IPB: | 4.3% | | Net Rentable Area (SF): | 464,061 |
| Loan Purpose: | Acquisition | | Location: | Bellevue, WA |
| Borrower: | Sunset North Owner, LLC | | Year Built / Renovated: | 1999, 2000 / 2016-2019 |
| Loan Sponsor: | Kennedy-Wilson Holdings, Inc. | | Occupancy(3): | 98.8% |
| Interest Rate: | 3.25000% | | Occupancy Date: | 9/30/2019 |
| Note Date: | 9/10/2019 | | Number of Tenants: | 9 |
| Maturity Date: | 10/1/2029 | | 2016 NOI(4): | N/A |
| Interest-only Period: | 120 months | | 2017 NOI(5): | $10,907,542 |
| Original Term: | 120 months | 2018 NOI(5)(6): | $13,545,687 |
| Original Amortization: | None | TTM NOI (as of 7/2019)(6)(7): | $6,799,024 |
| Amortization Type: | Interest Only | | UW Economic Occupancy: | 95.0% |
| Call Protection(2): | L(25),D(91),O(4) | | UW Revenues: | $19,978,769 |
| Lockbox / Cash Management: | Hard / Springing | | UW Expenses: | $6,362,971 |
| Additional Debt(1): | Yes | | UW NOI(3)(7)(9): | $13,615,798 |
| Additional Debt Balance(1): | $115,000,000 | | UW NCF: | $13,003,237 |
| Additional Debt Type(1): | Pari Passu | | Appraised Value / Per SF: | $227,100,000 / $489 |
| | | | Appraisal Date: | 8/21/2019 |
| | | | | |
| Escrows and Reserves(8) | | Financial Information(1) |
| | Initial | Monthly | Initial Cap | | Cut-off Date Loan / SF: | $323 |
| Taxes: | $153,562 | $153,562 | N/A | | Maturity Date Loan / SF: | $323 |
| Insurance: | $166,282 | $33,256 | N/A | | Cut-off Date LTV: | 66.1% |
| Replacement Reserves: | $12,375 | $12,375 | $445,499 | | Maturity Date LTV: | 66.1% |
| TI/LC: | $38,672 | $38,672 | $928,122 | | UW NCF DSCR: | 2.63x |
| Outstanding TI/LC: | $14,380,754 | N/A | N/A | | UW NOI Debt Yield: | 9.1% |
| Free Rent: | $406,710 | N/A | N/A | | | |
| | | | | | | |
| |
| Sources and Uses |
| Sources | Proceeds | % of Total | | Uses | Proceeds | % of Total |
| Whole Loan | $150,000,000 | 64.9% | | Purchase Price | $212,017,031 | 91.8% |
| Sponsor Equity | 80,998,765 | 35.1 | | Upfront Reserves | 15,158,355 | 6.6 |
| | | | | Closing Costs | 3,823,379 | 1.7 |
| Total Sources | $230,998,765 | 100.0% | | Total Uses | $230,998,765 | 100.0% |
| | | | | | | | | | | | | |
| (1) | The Sunset North Loan (as defined below) consists of the non-controlling Note A-3-1 and is part of the Sunset North Whole Loan (as defined below) evidenced by fourpari passu notes with an aggregate outstanding principal balance as of the Cut-off Date of $150.0 million. For additional information, see “The Loan” below. |
| (2) | The lockout period will be at least 25 payment dates beginning with and including the first payment date of November 1, 2019. Defeasance of the full $150,000,000 Sunset North Whole Loan is permitted after the date that is the earlier to occur of (i) November 1, 2023 or (ii) the date that is two years from the closing date of the securitization that includes the lastpari passu note to be securitized. The assumed lockout period of 25 payments is based on the expected JPMDB 2019-COR6 securitization closing date in November 2019. The actual lockout period may be longer. |
| (3) | Occupancy and UW NOI are inclusive of WeWork, which has executed its lease, taken possession of its space and begun paying rent, but has not yet taken occupancy. According to the Sponsor, WeWork is expected to take occupancy in November 2019. |
| (4) | 2016 NOI is not available as the previous owner acquired the Sunset North Property in March 2016 and was not provided comprehensive first quarter operating history. |
| (5) | The increase in 2018 NOI from 2017 NOI is primarily attributable to a $6.3 million fee associated with Boeing having terminated its lease in April 2018. |
| (6) | The decrease in TTM NOI from 2018 NOI is primarily attributable to Boeing’s departure in April 2018, for which a $6.3 million termination fee was paid in the first half of 2018. Following Boeing’s departure, the sponsor has executed several new leases executed in late 2018 and early 2019, for which tenants had not yet begun paying rent in the trailing 12 month period ending July 31, 2019. |
| (7) | The increase in Underwritten NOI from TTM NOI respectively, is primarily attributable to new leases taking effect following The Boeing Company’s (“Boeing”) departure from the Sunset North Property (as defined below) in April 2018, including (i) WeWork for 78,303 square foot (16.9% of net rentable area), (ii) GM Cruise for 32,331 square foot (7.0% of net rentable area), (iii) ArenaNet for a 32,432 square foot expansion space (7.0% of net rentable area), (iv) Farmers New World Life Insurance for 60,166 square foot (13.0% of net rentable area) and (v) Farmers Credit Union executing a 1,161 square foot lease (0.3% of net rentable area). WeWork has executed its lease, taken possession of its space and begun paying rent, but has not yet taken occupancy. According to the borrower sponsor, WeWork is expected to complete buildout of its space and take occupancy in November 2019. We cannot assure you that WeWork will take occupancy as expected, or at all. |
THE INFORMATION IN THIS STRUCTURAL AND COLLATERAL TERM SHEET IS NOT COMPLETE AND MAY BE AMENDED PRIOR TO THE TIME OF SALE. THIS TERM SHEET IS NOT AN OFFER TO SELL THESE SECURITIES AND IT IS NOT A SOLICITATION OF AN OFFER TO BUY THESE SECURITIES IN ANY JURISDICTION WHERE THE OFFER OR SALE IS NOT PERMITTED.
| | 83 of 95 | |
| Structural and Collateral Term Sheet | | JPMDB 2019-COR6 |
| |
| Sunset North |
| (8) | For a full description of Escrows and Reserves, please refer to “Escrows and Reserves” below. |
The Loan. The Sunset North mortgage loan (the “Sunset North Loan”) is part of a whole loan with an outstanding principal balance as of the Cut-off Date of $150.0 million (the “Sunset North Whole Loan”) evidenced by fourpari passu notes that are together secured by a first mortgage encumbering the borrower’s fee interest in a 464,061 square foot Class A office campus consisting of three buildings located in Bellevue, Washington (the “Sunset North Property”). The Sunset North Loan, which is evidenced by the non-controlling Note A-3-1, has an original principal balance and outstanding principal balance as of the Cut-off Date of $35.0 million. The controlling Note A-1 and the non-controlling Note A-2 were contributed to the Benchmark 2019-B13 transaction and the Benchmark 2019-B14 transaction, respectively. The non-controlling Note A-3-2 is expected to be contributed to other securitization trusts. The relationship between the holders of the Sunset North Whole Loan will be governed by a co-lender agreement as described under“Description of the Mortgage Pool—The Whole Loans—The Non-Serviced Pari Passu Whole Loans”in the Preliminary Prospectus. The Sunset North Whole Loan has a 10-year interest-only term and accrues interest at a rate of 3.25000%per annum. The Sunset North Whole Loan proceeds along with borrower sponsor equity were used to acquire the Sunset North Property, fund upfront reserves and pay closing costs.
| Whole Loan Summary |
| Note | Original Balance | Cut-off Date Balance | Note Holder | Controlling Piece |
| A-1 | $75,000,000 | $75,000,000 | Benchmark 2019-B13 | Yes |
| A-2 | $20,000,000 | $20,000,000 | Benchmark 2019-B14 | No |
| A-3-1 | $35,000,000 | $35,000,000 | JPMDB 2019-COR6 | No |
| A-3-2 | $20,000,000 | $20,000,000 | JPMCB | No |
| Total | $150,000,000 | $150,000,000 | | |
The Borrower. The borrower is Sunset North Owner, LLC, a Delaware limited liability company structured to be a bankruptcy-remote entity with two independent directors in its organizational structure.
The Loan Sponsor. The loan sponsor and non-recourse carveout guarantor is Kennedy-Wilson Holdings, Inc., an affiliate of Kennedy Wilson. Kennedy Wilson (NYSE: KW) is a global real estate investment company focused on multifamily and office properties located in the western United States, United Kingdom and Ireland. Headquartered in Beverly Hills, California, Kennedy Wilson has approximately 350 employees and 16 global offices located throughout the United States, Europe and Japan. As of year-end 2018, Kennedy Wilson had an ownership interest in approximately 53 million square foot of property globally, including 28,613 multifamily rental units and 18.9 million square foot of commercial property. As of year-end 2018, Kennedy Wilson held a portfolio of approximately $11.3 billion in assets, which generated approximately $1.0 billion in total revenue. Legal counsel to the borrower delivered a non-consolidation opinion in connection with the origination of the Sunset North Whole Loan.
The Property. The Sunset North Property is a 464,061 square foot, Class A office campus consisting of three buildings located in Bellevue, Washington. Each building is LEED Silver Certified and consists of five stories of above-grade office space and two levels of structured parking with a total of 1,595 parking spaces, resulting in a parking ratio of approximately 3.4 spaces per 1,000 square foot of net rentable area.
The Sunset North buildings were built in 1999 and 2000 and were acquired in 2016 by M-M Properties for approximately $155.2 million ($334.42 per square foot). Since 2016, M-M Properties spent approximately $22.4 million ($48.27 per square foot) in capital improvements including renovations to the lobbies, common areas and building exteriors, resulting in a cost basis of approximately $177.6 million ($382.69 per square foot). In April 2018, Boeing vacated its space at the Sunset North Property at its lease expiration, at which time it had occupied approximately 208,846 square foot (45.0% of net rentable area). Since Boeing’s departure in April 2018, the Sunset North Property has experienced strong leasing momentum. Following Boeing’s departure, new leases accounting for 204,493 square feet were executed to backfill Boeing’s space, including (i) WeWork for 78,303 square feet (16.9% of net rentable area), (ii) GM Cruise for 32,331 square feet (7.0% of net rentable area), (iii) ArenaNet for a 32,432 square foot expansion space (7.0% of net rentable area), (iv) Farmers New World Life Insurance for 60,166 square feet (13.0% of net rentable area) and (v) Farmers Credit Union for 1,161 square foot lease (0.3% of net rentable area). WeWork has executed its lease, taken possession of its space and begun paying rent, but has not yet taken occupancy. According to the Sponsor, WeWork is expected to complete buildout of its space and take occupancy in November 2019.
THE INFORMATION IN THIS STRUCTURAL AND COLLATERAL TERM SHEET IS NOT COMPLETE AND MAY BE AMENDED PRIOR TO THE TIME OF SALE. THIS TERM SHEET IS NOT AN OFFER TO SELL THESE SECURITIES AND IT IS NOT A SOLICITATION OF AN OFFER TO BUY THESE SECURITIES IN ANY JURISDICTION WHERE THE OFFER OR SALE IS NOT PERMITTED.
| | 84 of 95 | |
| Structural and Collateral Term Sheet | | JPMDB 2019-COR6 |
| |
| Sunset North |
As of September 30, 2019, the Sunset North Property was 98.8% leased to nine distinct tenants operating in a variety of industries including financial services, insurance, automotive, technology and real estate. The Sunset North Property tenants have a weighted average remaining lease term of approximately 8.0 years. The largest tenant at the Sunset North Property, Intellectual Ventures, (152,633 square feet; 32.9% of NRA; 32.1% of Underwritten Base Rent) is a global invention and investment business. Established in 2000, Intellectual Ventures operates four primary investment funds:Invention Investment Fund, which provides companies access to inventions through licensing, strategic partnerships and patent sales;Invention Science Fund, which invests in emerging technology fields for energy, communications and security industries,Global Good Fund, which is funded by Bill Gates and invests in global health and development technologies; andDeep Science Fund, which investigates applications for inventions and ideas in advanced chemistry, physical sciences and biomedical devices. Intellectual Ventures has more than 30 strategic partnerships and a portfolio or more than 35,000 intellectual property assets. Intellectual Ventures executed its lease at the Sunset North Property in 2010 and currently occupies all five floors in one of the three buildings through May 2025 with two, five year extension options and no termination options.
The second largest tenant,ArenaNet (96,839 square feet; 20.9% of NRA; 20.3% of Underwritten Base Rent) is a subsidiary of NCSOFT, is a game developer and publisher which has sold over 9.5 million copies of its multiplayer online role playing games. Founded in 2000, ArenaNet is headquartered at the Sunset North Property. NCSOFT was established in 1997 and headquartered in Seoul, South Korea, NCSOFT is a gaming publisher with services in the Americas, Europe, Australia and New Zealand. In 2010, ArenaNet executed its initial lease for 64,407 square feet. at the Sunset North Property and in June 2019 following Boeing’s departure, expanded its space by 32,432 square feet. ArenaNet’s lease expires in May 2029 with two, five year extension options and no termination options.
The third largest tenant, WeWork (78,303 square feet; 16.9% of NRA; 19.8% of Underwritten Base Rent)WeWork offers co-working office space including private offices, office suites, custom suites and shared work spaces for entrepreneurs, startups, small businesses and large corporations. Founded in 2010, WeWork has a network of more than 500 workspaces in over 22 countries. Amenities in workspaces include soundproofed phone booths, optimized workstations, bookable conference rooms, complimentary refreshments, onsite staff, multi-function printers, Wi-Fi access, mail and package handling, office supplies and bike storage. Members also receive access to business and lifestyle benefits from WeWork partners including Slack, Amazon Web Services, Avis, Lyft, Equinox, Ticketmaster and Dell. WeWork has executed its lease, taken possession of its space and begun paying rent, but has not yet taken occupancy. According to the borrower sponsor, WeWork is in the process of completing the buildout of its space and is expected to take occupancy in November 2019. We cannot assure you that WeWork will take occupancy as expected or at all or commence paying rent under its lease. In connection with its lease, WeWork provided a $7.5 million surety bond payable to the landlord and its successors upon an event of default under the lease. The balance of the surety bond begins reducing on an annual basis between years three and eight of the lease and then remains at $2.0 million.
The Sunset North Property is located in Bellevue, King County, at the interchange of Interstate 90 and Interstate 405 and approximately 10 miles east of the Seattle central business district, offering its tenants access to local demand drivers including the Marketplace at Factoria Shopping Center, Newport Corporate Center and Bellevue Community College. According to the appraisal, Bellevue is the metropolitan hub for high tech companies operating in software development, internet and network services, multi and digital media and biotech, including Puget Sound Energy, PACCAR, Western Wireless, T-Mobile USA and Esterline Technologies. The Sunset North Property is part of the Seattle-Tacoma-Bellevue metropolitan statistical area, in which the top four employers are Boeing, Microsoft, Amazon and the University of Washington. According to the appraisal, the estimated 2019 population within a one-, three- and five-mile radius of the Sunset North Property is 12,182, 103,277 and 226,943, respectively. Additionally, according to the appraisal, over the same period, the average household income within a one-, three- and five-mile radius was $130,736, $163,977 and $176,633, respectively.
The Sunset North Property is located within the Eastside I-90 Corridor Class A submarket of the Puget Sound office market. As of the second quarter of 2019, the Puget Sound Class A office market consisted of approximately 73.5 million square foot of office space with a total vacancy rate of 9.2% and direct asking rents of approximately $39.92 per square foot. The Eastside I-90 Corridor Class A submarket totaled approximately 5.3 million square foot with a total vacancy of 6.6% and direct market asking rents of $38.10 per square foot. From 2013 to the second quarter, in the Eastside I-90 Corridor submarket, total vacancy has decreased by approximately 54.5% and average asking rents have increased by approximately 27.4%.
The appraisal identified 18 competitive office rent comparables located across eight properties in Bellevue, Washington. The comparable properties were built between 1983 and 2008 and range in size between 81,522 square foot to 601,081 square foot NNN rents range from $24.45 to $33.00 per square foot, with a weighted average of approximately $26.86 per square foot. The appraisal’s concluded office market rent for the Sunset North Property is $30.00 per square foot, which is approximately 10.2% higher than the Sunset North Property’s in-place weighted average office rent of $27.22 per square foot.
THE INFORMATION IN THIS STRUCTURAL AND COLLATERAL TERM SHEET IS NOT COMPLETE AND MAY BE AMENDED PRIOR TO THE TIME OF SALE. THIS TERM SHEET IS NOT AN OFFER TO SELL THESE SECURITIES AND IT IS NOT A SOLICITATION OF AN OFFER TO BUY THESE SECURITIES IN ANY JURISDICTION WHERE THE OFFER OR SALE IS NOT PERMITTED.
| | 85 of 95 | |
| Structural and Collateral Term Sheet | | JPMDB 2019-COR6 |
| |
| Sunset North |
| Historical and Current Occupancy(1) |
| 2016 | 2017 | 2018 | Current(2) |
| 98.7% | 99.5% | 71.9% | 98.8% |
| (1) | Historical Occupancies are as of December 31 of each respective year. |
| (2) | Current Occupancy is as of September 30, 2019. |
| Tenant Summary(1) |
| Tenant | Ratings
Moody’s/Fitch/S&P(2) | Net Rentable
Area (SF) | % of Total
NRA | Base Rent
PSF | % of Total
Base Rent | Lease Expiration(3) |
| Intellectual Ventures | NR / NR / NR | 152,633 | 32.9% | $27.00 | 32.1% | 5/31/2025 |
| ArenaNet | NR / NR / NR | 96,839 | 20.9% | $27.00 | 20.3 | 5/31/2029 |
| WeWork(4) | NR / NR / NR | 78,303 | 16.9% | $32.50 | 19.8 | 12/31/2031 |
| Farmers(5) | A+ / A1 / AA- | 61,327 | 13.2% | $28.00 | 13.4 | 5/31/2029 |
| GM Cruise | BBB / Baa3 / BBB | 32,331 | 7.0% | $30.00 | 7.5 | 11/30/2026 |
| Lydig Construction | NR / NR / NR | 22,662 | 4.9% | $25.25 | 4.5 | 4/30/2021 |
| Akvelon(6) | NR / NR / NR | 6,954 | 1.5% | $27.00 | 1.5 | 7/31/2023 |
| NC Interactive(7) | NR / NR / NR | 4,269 | 0.9% | $28.50 | 0.9 | 5/31/2021 |
| Sister’s Deli (Sik & Hee) | NR / NR / NR | 1,725 | 0.4% | $0.00 | 0.0 | 6/30/2039 |
| Management Office | NR / NR / NR | 1,274 | 0.3% | $0.00 | 0.0 | 6/30/2039 |
| Subtotal / Wtd. Avg. | | 458,317 | 98.8% | $28.04 | 100.0% | |
| Vacant | | 5,744 | 1.2% | NAP | | |
| Total / Wtd. Avg. | | 464,061 | 100.0% | | | |
| (1) | Based on the underwritten rent roll dated September 30, 2019 inclusive of rent steps through September 2020. |
| (2) | In certain instances, ratings provided are those of the parent company of the entity shown, whether or not the parent guarantees the lease. In the case of Farmers, Farmers New World is an indirect subsidiary of Zurich Insurance Company Limited. |
| (3) | Certain tenants may have termination or contraction options (which may become exercisable prior to the originally stated expiration date of the tenant lease). See “Description of the Mortgage Pool—Tenant Issues—Lease Expirations and Terminations” in the Preliminary Prospectus. |
| (4) | WeWork has executed its lease, taken possession of its space and begun paying rent, but has not yet taken occupancy. According to the borrower sponsor, WeWork is expected to complete buildout of its space and take occupancy in November 2019. |
| (5) | Farmers includes (i) 60,166 square foot leased to Farmers New World with the right to terminate its lease on or after June 30, 2026 with no less than 12 months’ prior written notice and payment of a termination fee equal to a) all rent through and including October 2026 and b) the unamortized cost of all free or abated rent, tenant improvement allowances, reasonable attorneys’ fees and leasing commissions actually paid or provided by the broker and (ii) 1,161 square foot leased to Farmers Credit Union with the right to terminate its lease on or after August 31, 2026 with no less than 12 months’ prior written notice and the payment of a termination fee equal to a) all rent through and including December 2026 and b) the unamortized cost of all free or abated rent, tenant improvement allowances, reasonable attorneys’ fees and leasing commissions actually paid or provided by the broker. |
| (6) | Akvelon has the right to terminate its lease as of May 31, 2021, with nine months’ prior notice and the payment of an approximately $285,900 termination fee. |
| (7) | NC Interactive has the right to terminate its lease with no less than 13 months’ prior written notice and the payment of an approximately $162,723 termination fee. |
| Lease Rollover Schedule(1) |
Year | Number
of
Leases
Expiring | Net Rentable
Area
Expiring | % of NRA
Expiring | Base Rent
Expiring(3) | % of Base
Rent
Expiring | Cumulative
Net Rentable
Area
Expiring | Cumulative
% of NRA
Expiring | Cumulative
Base Rent
Expiring | Cumulative
% of Base
Rent
Expiring |
| Vacant | NAP | 5,744 | 1.2% | NAP | NAP | 5,744 | 1.2% | NAP | NAP |
| 2019 & MTM | 0 | 0 | 0.0 | $0 | 0.0% | 5,744 | 1.2% | $0 | 0.0% |
| 2020 | 0 | 0 | 0.0 | 0 | 0.0 | 5,744 | 1.2% | $0 | 0.0% |
| 2021 | 2 | 26,931 | 5.8 | 693,882 | 5.4 | 32,675 | 7.0% | $693,882 | 5.4% |
| 2022 | 0 | 0 | 0.0 | 0 | 0.0 | 32,675 | 7.0% | $693,882 | 5.4% |
| 2023 | 1 | 6,954 | 1.5 | 187,758 | 1.5 | 39,629 | 8.5% | $881,640 | 6.9% |
| 2024 | 0 | 0 | 0.0 | 0 | 0.0 | 39,629 | 8.5% | $881,640 | 6.9% |
| 2025 | 1 | 152,633 | 32.9 | 4,121,091 | 32.1 | 192,262 | 41.4% | $5,002,731 | 38.9% |
| 2026 | 1 | 32,331 | 7.0 | 969,930 | 7.5 | 224,593 | 48.4% | $5,972,661 | 46.5% |
| 2027 | 0 | 0 | 0.0 | 0 | 0.0 | 224,593 | 48.4% | $5,972,661 | 46.5% |
| 2028 | 0 | 0 | 0.0 | 0 | 0.0 | 224,593 | 48.4% | $5,972,661 | 46.5% |
| 2029 | 3 | 158,166 | 34.1 | 4,332,038 | 33.7 | 382,759 | 82.5% | $10,304,699 | 80.2% |
| 2030 & Beyond(2) | 3 | 81,302 | 17.5 | 2,544,848 | 19.8 | 464,061 | 100.0% | $12,849,546 | 100.0% |
| Total | 11 | 464,061 | 100.0% | $12,849,546 | 100.0% | | | | |
| | | | | | | | | | | |
| (1) | Based on the underwritten rent roll dated September 30, 2019 inclusive of rent steps through September 2020. |
| (2) | 2030 & Beyond is inclusive of (i) 1,725 square foot associated with a deli with no attributable underwritten base rent and (ii) 1,274 square foot associated with a management office with no attributable underwritten base rent. |
THE INFORMATION IN THIS STRUCTURAL AND COLLATERAL TERM SHEET IS NOT COMPLETE AND MAY BE AMENDED PRIOR TO THE TIME OF SALE. THIS TERM SHEET IS NOT AN OFFER TO SELL THESE SECURITIES AND IT IS NOT A SOLICITATION OF AN OFFER TO BUY THESE SECURITIES IN ANY JURISDICTION WHERE THE OFFER OR SALE IS NOT PERMITTED.
| | 86 of 95 | |
| Structural and Collateral Term Sheet | | JPMDB 2019-COR6 |
| |
| Sunset North |
| Operating History and Underwritten Net Cash Flow |
| 2017 | 2018 | TTM(1) | Underwritten | Per Square
Foot | %(7) |
| Base Rent(2) | $10,098,734 | $7,579,746 | $7,065,128 | $12,849,546 | $27.69 | 61.1% |
| Vacant Income | 0 | 0 | 0 | 171,120 | 0.37 | 0.8 |
| Gross Potential Rent | $10,098,734 | $7,579,746 | $7,065,128 | $13,020,666 | $28.06 | 61.9% |
| Other Reimbursements | 4,700,218 | 3,816,450 | 3,819,019 | 6,707,106 | 14.45 | 31.9 |
| Parking Income | 420,000 | 378,600 | 364,800 | 1,122,765 | 2.42 | 5.3 |
| Termination Fees(3) | 0 | 6,333,197 | 0 | 0 | 0.00 | 0.0 |
| Other Income | 227,129 | 260,139 | 308,265 | 179,746 | 0.39 | 0.9 |
| Net Rental Income | $15,446,081 | $18,368,132 | $11,557,212 | $21,030,283 | $45.32 | 100.0% |
| (Vacancy/Credit Loss) | 0 | 0 | 0 | (1,051,514) | (2.27) | (5.3) |
| Effective Gross Income | $15,446,081 | $18,368,132 | $11,557,212 | $19,978,769 | $43.05 | 95.0% |
| | | | | | | |
| Total Expenses | $4,538,540 | $4,822,445 | $4,758,188 | $6,362,971 | $13.71 | 31.8% |
| | | | | | | |
| Net Operating Income(4)(5)(6) | $10,907,542 | $13,545,687 | $6,799,024 | $13,615,798 | $29.34 | 68.2% |
| | | | | | | |
| TI/LC | 0 | 0 | 0 | 464,061 | 1.00 | 2.3 |
| Capital Expenditures | 0 | 0 | 0 | 148,500 | 0.32 | 0.7 |
| | | | | | | |
| Net Cash Flow | $10,907,542 | $13,545,687 | $6,799,024 | $13,003,237 | $28.02 | 65.1% |
| (1) | TTM column represents the trailing 12-month period ending on July 31, 2019. |
| (2) | Underwritten Base Rent is based on the underwritten rent roll dated September 30, 2019 inclusive of rent steps through September 2020. |
| (3) | 2018 Termination Fees are associated with the Boeing’s departure in April 2018. |
| (4) | The increase in 2018 Net Operating Income from 2017 Net Operating Income is primarily attributable to a $6.3 million fee associated with Boeing having terminated its lease in April 2018. |
| (5) | The decrease in TTM 7/31/2019 Net Operating Income from 2018 Net Operating Income is primarily attributable to Boeing’s departure in April 2018, for which a $6.3 million termination fee was paid in the first half of 2018. Following Boeing’s departure, the sponsor has executed several new leases executed in late 2018 and early 2019, for which tenants had not yet begun paying rent in the trailing 12 month period ending July 31, 2019. |
| (6) | The increase in U/W Net Operating Income from TTM 7/31/2019 Net Operating Income is primarily attributable to new leases taking effect following Boeing’s departure from the Sunset North Property in April 2018, including (i) WeWork for 78,303 square foot (16.9% of net rentable area), (ii) GM Cruise for 32,331 square foot (7.0% of net rentable area), (iii) ArenaNet for a 32,432 square foot expansion space (7.0% of net rentable area), (iv) Farmers New World for 60,166 square foot (13.0% of net rentable area) and (v) Farmers Credit union executing a 1,161 square foot lease (0.3% of net rentable area). WeWork has executed its lease, taken possession of its space and begun paying rent but has not yet taken occupancy. According to the sponsor, WeWork is expected to complete buildout of its space and take occupancy in November 2019. |
| (7) | % column represents percent of Net Rental Income for all revenue lines and represents percent of Effective Gross Income for the remainder of the fields. |
Property Management.The Sunset North Property is managed by MMP Washington Commercial Services, LLC, a Delaware limited liability company and an affiliate of the borrower.
Lockbox / Cash Management.The Sunset North Whole Loan is structured with a hard lockbox and springing cash management. The borrower was required at origination to deliver tenant direction letters instructing all tenants to deposit rents into a lockbox account controlled by the lender. So long as no Cash Sweep Event (as defined below) then exists, all funds deposited into the lockbox account are required to be transferred on each business day to or at the direction of the borrower. All funds on deposit in the cash management account following the occurrence and during the continuance of a Cash Sweep Event following payment of taxes and insurance, debt service, required reserves and operating expenses are required to be deposited into the excess cash flow reserve, and in each case to be held and disbursed in accordance with the terms of the Sunset North Whole Loan documents. During the continuance of an event of default, the lender may apply such funds in such order and priority as the lender determines. The lender has been granted a first priority security interest in the cash management account.
A “Cash Sweep Event” means the occurrence and continuation of (i) an event of default, (ii) any bankruptcy action of the borrower, (iii) any bankruptcy action of the property manager unless, with respect to a property manager that is not affiliated to the borrower, the borrower replaces the property manager within 40 days with a qualified manager under a replacement management agreement within 40 days of such bankruptcy action, (iv) a DSCR Trigger Event (as defined below) or (v) a Tenant Trigger Event (as defined below).
THE INFORMATION IN THIS STRUCTURAL AND COLLATERAL TERM SHEET IS NOT COMPLETE AND MAY BE AMENDED PRIOR TO THE TIME OF SALE. THIS TERM SHEET IS NOT AN OFFER TO SELL THESE SECURITIES AND IT IS NOT A SOLICITATION OF AN OFFER TO BUY THESE SECURITIES IN ANY JURISDICTION WHERE THE OFFER OR SALE IS NOT PERMITTED.
| | 87 of 95 | |
| Structural and Collateral Term Sheet | | JPMDB 2019-COR6 |
| |
| Sunset North |
A Cash Sweep Event may be cured if, with respect to a Cash Sweep Event caused solely by (a) clause (i) above, the lender has accepted a cure by the borrower of the related event of default, (b) clause (iii) above, the borrower has replaced the property manager with a qualified manager under a replacement management agreement in accordance with the Sunset North Whole Loan documents, (c) clause (iii) above, a DSCR Cure Event (as defined below) has taken place, or (d) clause (iv) above, either (x) Farmers New World Life Insurance Company or ArenaNet renews their lease or (y) the premises leased to either Farmers New World Life Insurance Company or ArenaNet is re-let to one or more tenants reasonably acceptable to the lender. A Cash Sweep Event may be cured no more than a total of five times in the aggregate during the term of the Loan (but a Cash Sweep Event caused by a DSCR Trigger Event or a Tenant Trigger Event may be cured an unlimited number of times).
A “DSCR Cure Event” means the debt service coverage ratio of the Sunset North Whole Loan (as calculated in accordance with the Sunset North Whole Loan documents), based on the trailing three-month period immediately preceding the date of determination, is at least 1.50x for two consecutive quarters.
A “DSCR Trigger Event” means the debt service coverage ratio of the Sunset North Whole Loan (as calculated in accordance with the Sunset North Whole Loan documents) based on the trailing three-month period immediately preceding the date of determination is less than 1.50x.
A “Tenant Trigger Event” means that both Farmers New World Life Insurance Company and ArenaNet, LLC do not renew their respective leases prior to 12 months prior to the expiration dates of their respective leases.
Escrows and Reserves.At loan origination, the borrower deposited (i) approximately $14,380,754 into outstanding TI/LC reserve in connection with five leases, (ii) approximately $406,710 into a free rent reserve in connection with two leases, (iii) approximately $166,282 into an insurance reserve, (iv) approximately $153,562 into a real estate tax reserve, (v) approximately $38,672 into a rollover reserve and (vii) $12,375 into a replacement reserve.
Tax Reserve.The borrower is required to deposit into a real estate tax reserve, on a monthly basis, 1/12 of the estimated annual real estate taxes, which currently equates to approximately $153,562 per month (approximately $0.33 per square foot).
Insurance Reserve.The borrower is required to deposit into an insurance reserve, on a monthly basis, 1/12 of estimated insurance premiums, which currently equates to approximately $33,256 per month (approximately $0.07 per square foot). In the event the borrower obtains and maintains a blanket insurance policy acceptable to the lender and no event of default has occurred and is continuing, the requirement for monthly deposits into the insurance reserve will be waived.
TI/LC Reserve. The borrower is required to deposit into the TI/LC reserve, on a monthly basis, approximately $38,672 (approximately $1.00 per square foot annually), subject to a cap of $928,122 (approximately $2.00 per square foot).
Replacement Reserve. The borrower is required to deposit into the replacement reserve, on a monthly basis, $12,375 (approximately $0.32 per square foot annually), subject to a cap of approximately $445,499 (approximately $0.96 per square foot).
Current Mezzanine or Subordinate Indebtedness. None.
Future Mezzanine or Subordinate Indebtedness Permitted. None.
Partial Release. None.
THE INFORMATION IN THIS STRUCTURAL AND COLLATERAL TERM SHEET IS NOT COMPLETE AND MAY BE AMENDED PRIOR TO THE TIME OF SALE. THIS TERM SHEET IS NOT AN OFFER TO SELL THESE SECURITIES AND IT IS NOT A SOLICITATION OF AN OFFER TO BUY THESE SECURITIES IN ANY JURISDICTION WHERE THE OFFER OR SALE IS NOT PERMITTED.
| | 88 of 95 | |
| Structural and Collateral Term Sheet | | JPMDB 2019-COR6 |
| |
| Jersey City Group 2 |
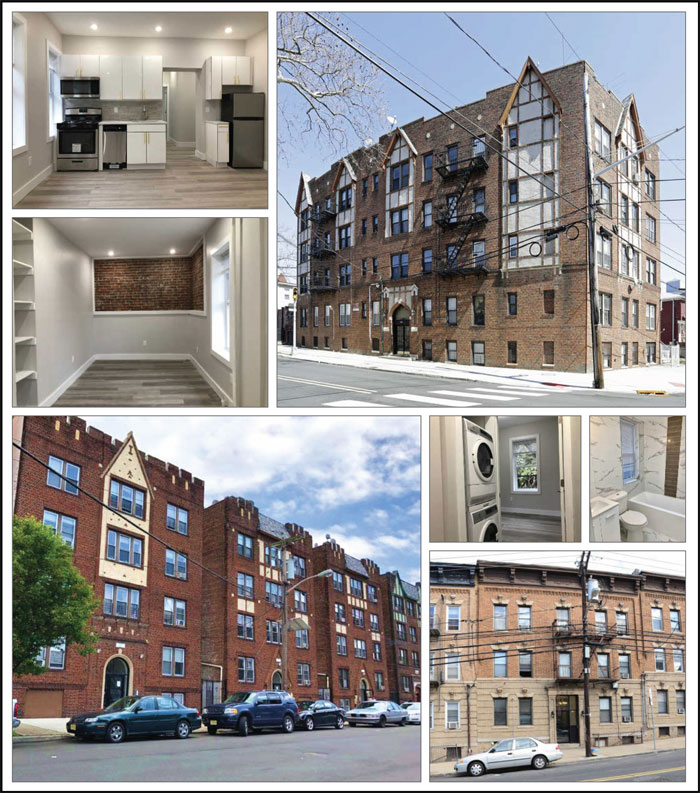
THE INFORMATION IN THIS STRUCTURAL AND COLLATERAL TERM SHEET IS NOT COMPLETE AND MAY BE AMENDED PRIOR TO THE TIME OF SALE. THIS TERM SHEET IS NOT AN OFFER TO SELL THESE SECURITIES AND IT IS NOT A SOLICITATION OF AN OFFER TO BUY THESE SECURITIES IN ANY JURISDICTION WHERE THE OFFER OR SALE IS NOT PERMITTED.
| | 89 of 95 | |
| Structural and Collateral Term Sheet | | JPMDB 2019-COR6 |
| |
| Jersey City Group 2 |
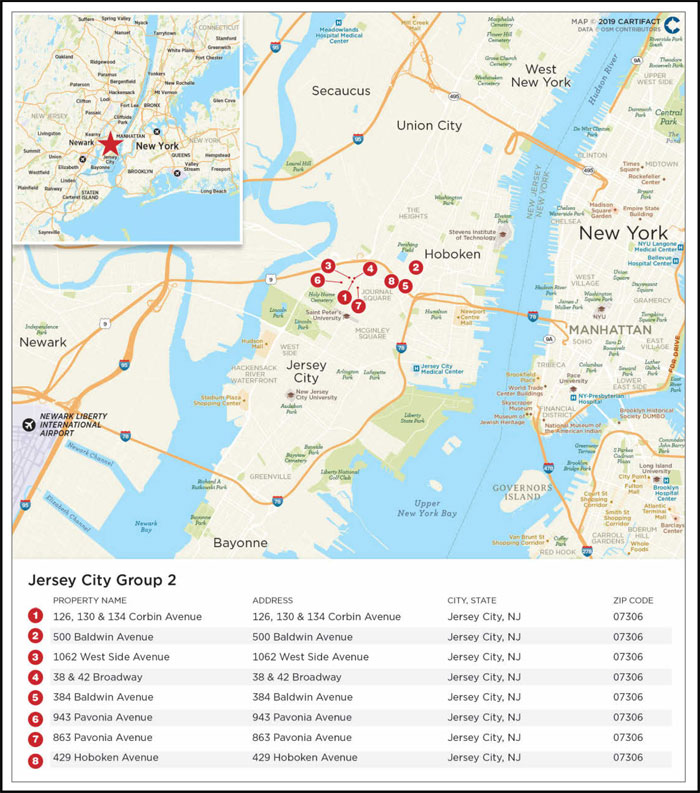
THE INFORMATION IN THIS STRUCTURAL AND COLLATERAL TERM SHEET IS NOT COMPLETE AND MAY BE AMENDED PRIOR TO THE TIME OF SALE. THIS TERM SHEET IS NOT AN OFFER TO SELL THESE SECURITIES AND IT IS NOT A SOLICITATION OF AN OFFER TO BUY THESE SECURITIES IN ANY JURISDICTION WHERE THE OFFER OR SALE IS NOT PERMITTED.
| | 90 of 95 | |
| Structural and Collateral Term Sheet | | JPMDB 2019-COR6 |
| |
| Jersey City Group 2 |
| Mortgage Loan Information | | Property Information |
| Mortgage Loan Seller: | JPMCB | | Single Asset / Portfolio: | Portfolio |
| Original Principal Balance: | $32,840,000 | | Title: | Fee |
| Cut-off Date Principal Balance: | $32,840,000 | | Property Type – Subtype: | Multifamily – Garden |
| % of Pool by IPB: | 4.1% | | Net Rentable Area (Units)(1): | 201 |
| Loan Purpose: | Refinance | | Location: | Jersey City, NJ |
| Borrower: | SBR Group 2 LLC | | Year Built / Renovated(2): | Various / Various |
| Sponsors: | Joseph Ehrman, Barry Schreiber | | Occupancy(3): | 95.0% |
| Interest Rate: | 4.62000% | | Occupancy Date: | 9/30/2019 |
| Note Date: | 10/25/2019 | | Number of Tenants(4): | 4 |
| Maturity Date: | 11/1/2029 | | 2016 NOI(5): | N/A |
| Interest-only Period: | 60 months | | 2017 NOI(5): | N/A |
| Original Term: | 120 months | | 2018 NOI: | $1,588,877 |
| Original Amortization: | 360 months | | TTM NOI (as of 8/2019)(6): | $1,653,665 |
| Amortization Type: | IO-Balloon | | UW Economic Occupancy: | 93.7% |
| Call Protection: | L(24),Def(93),O(3) | | UW Revenues: | $2,956,771 |
| Lockbox / Cash Management: | Springing / Springing | | UW Expenses: | $802,072 |
| Additional Debt: | N/A | | UW NOI(6): | $2,154,699 |
| Additional Debt Balance: | N/A | | UW NCF: | $2,104,449 |
| Additional Debt Type: | N/A | | Appraised Value / Per Unit: | $41,800,000 / $207,960 |
| | | | Appraisal Date: | Various |
| | | | | |
| | | | | | | |
| Escrows and Reserves(7) | | Financial Information |
| | Initial | Monthly | Initial Cap | | | |
| Taxes: | $117,697 | $29,424 | N/A | | Cut-off Date Loan / Unit: | $163,383 |
| Insurance: | $0 | Springing | N/A | | Maturity Date Loan / Unit: | $149,789 |
| Replacement Reserves: | $4,118 | $4,188 | $50,250 | | Cut-off Date LTV: | 78.6% |
| TI/LC: | $0 | $0 | N/A | | Maturity Date LTV: | 72.0% |
| Other: | $101,500 | $0 | N/A | | UW NCF DSCR(8): | 1.04x |
| | | | | | UW NOI Debt Yield: | 6.6% |
| | | | | | |
| Sources and Uses |
| Sources | Proceeds | % of Total | | Uses | Proceeds | % of Total |
| Mortgage Loan | $32,840,000 | 100.0% | | Payoff Existing Debt | $28,010,053 | 85.3% |
| | | | | Closing Costs | 590,988 | 1.8 |
| | | | | Upfront Reserves | 223,315 | 0.7 |
| | | | | Return of Equity | 4,015,644 | 12.2 |
| Total Sources | $32,840,000 | 100.0% | | Total Uses | $32,840,000 | 100.0% |
| (1) | Net Rentable Area (Units) is reflective of 201 residential units and excludes five commercial units, totaling 3,325 square feet, associated with the 1062 West Side Avenue property. |
| (2) | See “Portfolio Summary” table below for additional information. |
| (3) | Occupancy based solely on residential units is 95.0% as of September 30, 2019. Occupancy of the commercial square footage is 100.0%. |
| (4) | Number of Tenants is reflective of four commercial tenants who currently occupy five commercial units, totaling 3,325 square feet, at the 1062 West Side Avenue property. |
| (5) | 2016 NOI and 2017 NOI are not available as the Jersey City Group 2 Portfolio properties were acquired in 2017. |
| (6) | The increase in Underwritten NOI from TTM NOI is primarily attributable to recent renovations and management changes which led to decreased repairs and maintenance and utility costs. |
| (7) | For a full description of Escrows and Reserves, please refer to “Escrows and Reserves” below. |
| (8) | The current UW NCF DSCR is 1.37x based on an interest-only debt service payment. The Jersey City Group 2 loan has an initial 60 month interest only period. The UW NCF DSCR of 1.04x is based on an amortizing debt service payment starting in month 61. |
THE INFORMATION IN THIS STRUCTURAL AND COLLATERAL TERM SHEET IS NOT COMPLETE AND MAY BE AMENDED PRIOR TO THE TIME OF SALE. THIS TERM SHEET IS NOT AN OFFER TO SELL THESE SECURITIES AND IT IS NOT A SOLICITATION OF AN OFFER TO BUY THESE SECURITIES IN ANY JURISDICTION WHERE THE OFFER OR SALE IS NOT PERMITTED.
| | 91 of 95 | |
| Structural and Collateral Term Sheet | | JPMDB 2019-COR6 |
| |
| Jersey City Group 2 |
The Loan.The Jersey City Group 2 loan is secured by a first mortgage lien on the borrower’s fee interest in a portfolio of eight multifamily properties totaling 201 residential units and 3,325 square feet of commercial space located on the west side of Jersey City, New Jersey (the “Jersey City Group 2 Portfolio”). The Jersey City Group 2 loan has a 10-year term and following a five-year interest-only period, will amortize on a 30-year schedule.
The Borrower.The borrowing entity is SBR Group 2 LLC, a Delaware limited liability company and special purpose entity.
The Loan Sponsors.The loan sponsors and non-recourse carve-out guarantors are Joseph Ehrman and Barry Schreiber, who serve as principals at Optimum Properties. Founded in 1999, Optimum Properties is a real estate firm focused on purchasing, remodeling and positioning residential units primarily located in Baltimore, Maryland, Cherry Hill, New Jersey, Howell, New Jersey and Jersey City, New Jersey. Optimum Properties’ portfolio is currently valued in excess of $500.0 million and includes over 2,000 units in the Jersey City market.
Portfolio Summary |
| Property | Units | Year Built/ Renovated | Allocated Loan
Amount | % of Allocated
Loan Amount | Appraised
Value | % of Portfolio
Appraised Value | Historical
Capital
Expenditures(2) |
| 126, 130 & 134 Corbin Avenue | 63 | 1901 / 2019 | $10,291,962 | 31.3% | $13,100,000 | 31.3% | $623,122 |
| 500 Baldwin Avenue | 29 | 1900 / 2019 | 4,792,440 | 14.6% | 6,100,000 | 14.6% | 128,326 |
| 1062 West Side Avenue(1) | 24 | 1920 / 2019 | 4,556,746 | 13.9% | 5,800,000 | 13.9% | 160,770 |
| 38 & 42 Broadway | 24 | 1900 / 2019 | 3,692,536 | 11.2% | 4,700,000 | 11.2% | 295,918 |
| 384 Baldwin Avenue | 20 | 1900 / 2019 | 2,749,761 | 8.4% | 3,500,000 | 8.4% | 81,686 |
| 943 Pavonia Avenue | 17 | 1900 / 2019 | 2,671,196 | 8.1% | 3,400,000 | 8.1% | 92,976 |
| 863 Pavonia Avenue | 13 | 1923 / 2019 | 2,199,809 | 6.7% | 2,800,000 | 6.7% | 10,000 |
| 429 Hoboken Avenue | 16 | 1900 / 2019 | 1,885,550 | 5.7% | 2,400,000 | 5.7% | 122,386 |
| Total | 206 | | $32,840,000 | 100.0% | $41,800,000 | 100.0% | $1,515,184 |
| (1) | Units for the 1062 West Side Avenue property inclusive of five commercial units comprised of 3,325 feet. |
| (2) | Historical Capital Expenditures represent the sum of unit-level renovations and common area upgrades since the Jersey City Group 2 Portfolio was acquired in 2017. |
The Portfolio. The Jersey City Group 2 Portfolio consists of eight properties, comprised of 201 residential units and 3,325 square feet of commercial space located on the west side of Jersey City, New Jersey. The Jersey City Group 2 Portfolio unit mix includes nine studio, 143 one-bedroom, 46 two-bedroom, two three-bedroom and one super units. The Jersey City Group 2 Portfolio properties were originally constructed between 1900 and 1923, and all eight properties underwent renovations between 2017 and 2019. In 2017, the loan sponsors acquired the Jersey City Group 2 Portfolio as part of a larger portfolio of multifamily properties comprised of 569 units located in Jersey City, New Jersey for a total cost of $97.0 million. All 569 units were refinanced for a total of approximately $113.2 million, of which approximately $32.8 million was allocated to the Jersey City Group 2 Portfolio. Since acquisition the loan sponsors have invested approximately $1.5 million in property renovations across the Jersey City Group 2 Portfolio. Unit renovations include upgrades to bathrooms, kitchen finishes, stainless steel appliances and hardwood floors. Common area renovations include upgrades to lobbies, awnings, staircases, roofing, sidewalks, electricals, fire systems, boilers, boiler controls systems, electronic water meters and new laundry rooms.
All of the units across theJersey City Group 2 Portfolioare subject to rent control which limits annual rent increases to the lesser of CPI or 4.0%. When units become vacant the landlord can increase monthly rents by $1.35 per $100 of improvements up to $5,000 and by $1.55 per $100 of improvements of $5,000 to $10,000. Since acquiring theJersey City Group 2 Portfolio, the loan sponsors have completed renovations on 35 units out of a total of 201 residential units.
126, 130 & 134 Corbin Avenue
The largest Jersey City Group 2 Portfolio property by allocated loan amount, 126, 130 & 134 Corbin Avenue, is a 63-unit, low-rise, multifamily property located in Jersey City, New Jersey on Corbin Avenue. As of September 30, 2019, the 126, 130 & 134 Corbin Avenue property was 92.1% occupied. The 126, 130 & 134 Corbin Avenue property is comprised of four studio, fifty-five one-bedroom, two two-bedroom, one three-bedroom and one super units. Since 2017, the 126, 130 & 134 Corbin Avenue property has undergone $379,922 in apartment renovations and $243,200 in common area upgrades, including updates to the entrance and lobby as well as upgrades to the video surveillance system and laundry room appliances. The appraisal concluded an average market rent of $1,607 per unit, which is approximately 20.3% above the 126, 130 & 134 Corbin Avenue property’s average occupied rent per unit of $1,281.
THE INFORMATION IN THIS STRUCTURAL AND COLLATERAL TERM SHEET IS NOT COMPLETE AND MAY BE AMENDED PRIOR TO THE TIME OF SALE. THIS TERM SHEET IS NOT AN OFFER TO SELL THESE SECURITIES AND IT IS NOT A SOLICITATION OF AN OFFER TO BUY THESE SECURITIES IN ANY JURISDICTION WHERE THE OFFER OR SALE IS NOT PERMITTED.
| | 92 of 95 | |
| Structural and Collateral Term Sheet | | JPMDB 2019-COR6 |
| |
| Jersey City Group 2 |
500 Baldwin Avenue
The second largest Jersey City Group 2 Portfolio property by allocated loan amount, 500 Baldwin Avenue, is a 29-unit, low-rise, multifamily property located in Jersey City, New Jersey on Baldwin Avenue. As of September 30, 2019, the 500 Baldwin Avenue property was 100.0% occupied. The 500 Baldwin Avenue property is comprised of two studio, twenty one-bedroom, six two-bedroom, and one three-bedroom units. Since 2017, the 500 Baldwin Avenue property has undergone $106,826 in apartment renovations and $21,500 in common area upgrades, including updates to appliances in the laundry room as well as roof and entranceway upgrades. The appraisal concluded an average market rent of $1,573 per unit, which is approximately 23.8% above the 500 Baldwin Avenue property’s average occupied rent per unit of $1,199.
1062 West Side Avenue
The third largest Jersey City Group 2 Portfolio property by allocated loan amount, 1062 West Side Avenue, is a 19-unit, low-rise, multifamily property located in Jersey City, New Jersey. The 1062 West Side Avenue property also encompasses four commercial tenants across five commercial units on the ground floor. As of September 30, 2019, the 1062 West Side Avenue property’s 19 residential units were 94.7% occupied and the five commercial units were 100.0% occupied. The 1062 West Side Avenue property is comprised of two studio, eleven one-bedroom and six two-bedroom units. Since 2017, the 1062 West Side Avenue property has undergone $118,770 in apartment renovations and $42,000 in common area upgrades, which included updates to the entrance and lobby as well as upgrades to the video surveillance system. The appraisal concluded an average market rent of $1,600 per unit, which is approximately 12.0% above the 1062 West Side Avenue property’s average occupied rent per unit of $1,408.
The Jersey City Group 2 Portfolio properties are located on the west side of Jersey City, New Jersey, an area anchored by the revitalization of the Journal Square neighborhood. According to the appraisal, in 2008, Journal Square began a redevelopment plan focused on fostering the central business district and shopping area by introducing new higher density residential, retail and commercial offerings. The Jersey City Group 2 Portfolio properties offer convenient access to the Journal Square Transportation Center, a station that is home to the New Jersey Transit, private bus lines and two Port Authority Trans-Hudson (“PATH”) lines. The PATH is a 24-hour, 13.9 mile rapid transit system that serves over 200,000 passengers daily and connects neighborhoods in New Jersey to Newark Penn Station and Manhattan. The Jersey City Group 2 Portfolio properties also offer access Interstate 78, Interstate 95 and Route 139 and are located approximately 6.4 miles to the northeast of Newark Liberty International Airport. According to the appraisal, the Jersey City Group 2 Portfolio properties are located in New York-Jersey City-White Plains metropolitan statistical area, which reported a median household income of approximately $72,300 as of May 2019. According to the appraisal, the Jersey City Group 2 Portfolio properties are located in the Hudson County multifamily submarket of the Northern New Jersey multifamily market. As of the first quarter of 2019, the Northern New Jersey multifamily market and Hudson County multifamily submarket had inventory of 239,416 and 58,428, respectively, and overall vacancy rates of 4.8% and 6.6%, respectively. As of the first quarter of 2019, average asking rent for the Hudson County submarket was $3,331 per unit, an approximately 9.8% increase from the first quarter of 2017.
| Historical and Current Occupancy(1)(2) |
| 2017 | 2018 | Current(3) |
| 89.5% | 91.8% | 96.5% |
| (1) | Historical and Current Occupancy reflect the larger portfolio of multifamily properties comprised of 569 residential units that the loan sponsors acquired in 2017. Occupancy for the 201 residential units in the Jersey City Group 2 Portfolio was not available. |
| (2) | Historical Occupancies are as of December 31 of each respective year. |
| (3) | Current Occupancy is as of September 30, 2019. |
THE INFORMATION IN THIS STRUCTURAL AND COLLATERAL TERM SHEET IS NOT COMPLETE AND MAY BE AMENDED PRIOR TO THE TIME OF SALE. THIS TERM SHEET IS NOT AN OFFER TO SELL THESE SECURITIES AND IT IS NOT A SOLICITATION OF AN OFFER TO BUY THESE SECURITIES IN ANY JURISDICTION WHERE THE OFFER OR SALE IS NOT PERMITTED.
| | 93 of 95 | |
| Structural and Collateral Term Sheet | | JPMDB 2019-COR6 |
| |
| Jersey City Group 2 |
| Unit Mix(1) |
| Property | # of
Residential
Units | # of
Commercial
Units | Occupancy
Residential
Units | Occupancy
Commercial
Space | Average
Market
Rent Per
Unit(2) | Average
Occupied
Rent Per
Unit | %
Below
Market |
| 126, 130 & 134 Corbin Avenue | 63 | 0 | 92.1% | NAP | $1,607 | $1,281 | 20.3% |
| 500 Baldwin Avenue | 29 | 0 | 100.0% | NAP | $1,573 | $1,199 | 23.8% |
| 1062 West Side Avenue | 19 | 5 | 94.7% | 100.0% | $1,600 | $1,408 | 12.0% |
| 38 & 42 Broadway | 24 | 0 | 91.7% | NAP | $1,675 | $1,187 | 29.1% |
| 384 Baldwin Avenue | 20 | 0 | 95.0% | NAP | $1,544 | $1,113 | 27.9% |
| 943 Pavonia Avenue | 17 | 0 | 94.1% | NAP | $1,532 | $1,250 | 18.4% |
| 863 Pavonia Avenue | 13 | 0 | 100.0% | NAP | $1,652 | $1,350 | 18.3% |
| 429 Hoboken Avenue | 16 | 0 | 100.0% | NAP | $1,489 | $1,000 | 32.8% |
| Total / Wtd. Avg. | 201 | 5 | 95.0% | 100.0% | $1,590 | $1,232 | 22.6% |
| (1) | Based on the underwritten rent roll as of September 30, 2019. |
| (2) | Based on each Jersey City Group 2 Portfolio property appraisal as of October 2019. |
| Underwritten Net Cash Flow |
| | 2018 | TTM | Underwritten | Per Unit(1) | %(2) |
| Residential Rents in Place | $2,531,724 | $2,629,166 | $2,807,652 | $13,629 | 90.8% |
| Vacant Income | 0 | 0 | 194,400 | 944 | 6.3 |
| Commercial Rents in Place | 54,820 | 75,944 | 89,471 | 17,894 | 2.9 |
| Net Rental Income | $2,586,544 | $2,705,109 | $3,091,523 | $15,007 | 100.0% |
| Other Income(3) | 34,480 | 39,622 | 59,649 | 290 | 1.9 |
| (Vacancy/Credit Loss) | 0 | 0 | (194,400) | (944) | (6.6) |
| Effective Gross Income | $2,621,024 | $2,744,732 | $2,956,771 | $14,353 | 100.0% |
| Total Expenses(4) | $1,032,147 | $1,091,067 | $802,072 | $3,894 | 27.1% |
| Net Operating Income(5) | $1,588,877 | $1,653,665 | $2,154,699 | $10,460 | 72.9% |
| Replacement Reserves | 0 | 0 | 50,250 | 244 | 1.7 |
| Net Cash Flow | $1,588,877 | $1,653,665 | $2,104,449 | $10,216 | 71.2% |
| (1) | Residential Rents in Place Per Unit and Commercial Rents in Place Per Unit are calculated based on 201 residential and five commercial units, respectively. The remaining line items are based on 206 total units in the Jersey City Group 2 Portfolio. |
| (2) | % column represents percent of Net Rental Income for all revenue lines and represents percent of Effective Gross Income for the remainder of the fields. |
| (3) | Other Income includes laundry, antenna, storage and parking income. The increase in Other Income is primarily the result of additional laundry facilities and storage that was added as part of the recent renovations across the Jersey City Group 2 Portfolio. |
| (4) | The decrease in Total Expenses is primarily the result of management changes across the Jersey City Group 2 Portfolio along with decreased R&M and Utility costs due to the addition of electronic water meters, new and refurbished boilers and new boiler control systems that were put in place as part of recent renovations. |
| (5) | The increase in Underwritten Net Operating Income from TTM Net Operating Income is primarily attributable to the increase in Other Income and decrease in Total Expenses described above. |
Property Management. The Jersey City Group 2 Portfolio is managed by Sixth Boro Management LLC, an affiliate of the borrower.
Escrows and Reserves. At loan origination, the borrowers deposited approximately$117,697 into a tax reserve account, $4,118 into a replacement reserve account and $101,500 into an environmental reserve account.
Tax Reserve - On a monthly basis, the borrowers are required to deposit into a real estate tax reserve an amount equal to 1/12 of the estimated annual real estate taxes, which currently equates to $29,424 per month.
Insurance Reserve - The borrowers are required to deposit into an insurance reserve, on a monthly basis, an amount equal to 1/12 of the estimated insurance premiums. In the event the borrowers obtain and maintain a blanket insurance policy acceptable to the lender and no event of default under the Jersey City Group 2 loan has occurred and is continuing, the requirement for monthly deposits into the insurance reserve will be waived.
THE INFORMATION IN THIS STRUCTURAL AND COLLATERAL TERM SHEET IS NOT COMPLETE AND MAY BE AMENDED PRIOR TO THE TIME OF SALE. THIS TERM SHEET IS NOT AN OFFER TO SELL THESE SECURITIES AND IT IS NOT A SOLICITATION OF AN OFFER TO BUY THESE SECURITIES IN ANY JURISDICTION WHERE THE OFFER OR SALE IS NOT PERMITTED.
| | 94 of 95 | |
| Structural and Collateral Term Sheet | | JPMDB 2019-COR6 |
| |
| Jersey City Group 2 |
Replacement Reserve - On a monthly basis, the borrowers are required to escrow$4,188for replacement reserves, subject to a cap of$50,250.
Lockbox / Cash Management. The Jersey City Group 2 loan is structured with a springing lockbox and springing cash management. Upon the occurrence of a Cash Sweep Event (as defined below), all rents are required to be deposited into a lockbox account by the borrowers or the property manager within two business after receipt thereof. Upon the occurrence and during the continuance of a Cash Sweep Event, all funds in the lockbox account are required to be swept within two business days into a lender-controlled account, from which account such funds will be disbursed on each payment date in accordance with the Jersey City Group 2 loan documents and any excess will be retained by the lender as additional collateral for the Jersey City Group 2 loan.
A “Cash Sweep Event” means the occurrence of (i) an event of default (ii) any bankruptcy action of the borrower or manager or (iii) a DSCR Trigger Event (as defined below).
A “DSCR Trigger Event” means (i) during the interest only period, that as of the date of determination, the debt service coverage ratio based on the trailing 12 month period immediately preceding the date of such determination as reasonably determined by the lender is less than 1.15x; and (ii) during the amortization period, that as of the date of determination, the debt service coverage ratio based on the trailing 12 month period immediately preceding the date of such determination as reasonably determined by the lender is less than 1.05x.
A “DSCR Cure Event” means (i) during the interest only period that as of the date of determination, the debt service coverage ratio based on the trailing 12 month period immediately preceding the date of such determination as reasonably determined by the lender for two consecutive quarters is not less than 1.15x, and (ii) during the amortization period that as of the date of determination, the debt service coverage ratio based on the trailing 12 month period immediately preceding the date of such determination as reasonably determined by the lender for two consecutive quarters is not less than 1.05x.
Partial Release.None.
THE INFORMATION IN THIS STRUCTURAL AND COLLATERAL TERM SHEET IS NOT COMPLETE AND MAY BE AMENDED PRIOR TO THE TIME OF SALE. THIS TERM SHEET IS NOT AN OFFER TO SELL THESE SECURITIES AND IT IS NOT A SOLICITATION OF AN OFFER TO BUY THESE SECURITIES IN ANY JURISDICTION WHERE THE OFFER OR SALE IS NOT PERMITTED.
| | 95 of 95 | |