| | | FREE WRITING PROSPECTUS |
| | | FILED PURSUANT TO RULE 433 |
| | | REGISTRATION FILE NO.: 333-226123-06 |
| | | |
| November 6, 2019 | | JPMDB 2019-COR6 |
Free Writing Prospectus Structural and Collateral Term Sheet |
JPMDB 2019-COR6 |
$807,180,797 (Approximate Mortgage Pool Balance) |
| |
$696,193,000 (Approximate Offered Certificates) |
| |
J.P. Morgan Chase Commercial Mortgage Securities Corp. Depositor |
|
| |
JPMDB Commercial Mortgage Securities Trust 2019-COR6, Commercial Mortgage Pass-Through Certificates Series 2019-COR6 |
|
| |
JPMorgan Chase Bank, National Association
LoanCore Capital Markets LLC
German American Capital Corporation Sponsors and Mortgage Loan Sellers |
| |
| J.P. Morgan | | Deutsche Bank Securities |
| | Co-Lead Managers and
Joint Bookrunners | |
| | | |
| Jefferies | | Drexel Hamilton |
| | Co-Managers | |
THE INFORMATION IN THIS STRUCTURAL AND COLLATERAL TERM SHEET IS NOT COMPLETE AND MAY BE AMENDED PRIOR TO THE TIME OF SALE. THIS TERM SHEET IS NOT AN OFFER TO SELL THESE SECURITIES AND IT IS NOT A SOLICITATION OF AN OFFER TO BUY THESE SECURITIES IN ANY JURISDICTION WHERE THE OFFER OR SALE IS NOT PERMITTED.
| November 6, 2019 | | JPMDB 2019-COR6 |
This material is for your information, and none of J.P. Morgan Securities LLC (“JPMS”), Deutsche Bank Securities Inc. (“DBSI”), Jefferies LLC (“Jefferies”) or Drexel Hamilton, LLC (“Drexel”) (each individually, an “Underwriter”, and together, the ‘‘Underwriters’’) are soliciting any action based upon it. This material is not to be construed as an offer to sell or the solicitation of any offer to buy any security in any jurisdiction where such an offer or solicitation would be illegal.
The Depositor has filed a registration statement (including a prospectus) with the SEC (SEC File no. 333-226123) for the offering to which this free writing prospectus relates. Before you invest, you should read the prospectus in the registration statement and other documents the Depositor has filed with the SEC for more complete information about the Depositor, the issuing entity and this offering. You may get these documents for free by visiting EDGAR on the SEC Website at www.sec.gov. Alternatively, the Depositor or any Underwriter or any dealer participating in the offering will arrange to send you the prospectus if you request itby calling (800) 408-1016 or by emailing the ABS Syndicate Desk at abs_synd@jpmorgan.com.
Neither this document nor anything contained in this document shall form the basis for any contract or commitment whatsoever. The information contained in this document is preliminary as of the date of this document, supersedes any previous such information delivered to you and will be superseded by any such information subsequently delivered prior to the time of sale. These materials are subject to change, completion or amendment from time to time.
This document has been prepared by the Underwriters for information purposes only and does not constitute, in whole or in part, a prospectus for the purposes of Regulation (EU) 2017/1129 (as amended) and/or Part VI of the Financial Services and Markets Act 2000 (as amended) or other offering document.
The attached information contains certain tables and other statistical analyses (the “Computational Materials”) that have been prepared in reliance upon information furnished by the Mortgage Loan Sellers. Numerous assumptions were used in preparing the Computational Materials, which may or may not be reflected in this document. The Computational Materials should not be construed as either projections or predictions or as legal, tax, financial or accounting advice. You should consult your own counsel, accountant and other advisors as to the legal, tax, business, financial and related aspects of a purchase of these certificates. Any weighted average lives, yields and principal payment periods shown in the Computational Materials are based on prepayment and/or loss assumptions, and changes in such prepayment and/or loss assumptions may dramatically affect such weighted average lives, yields and principal payment periods. In addition, it is possible that prepayments or losses on the underlying assets will occur at rates higher or lower than the rates shown in the Computational Materials. The specific characteristics of the certificates may differ from those shown in the Computational Materials due to differences between the final underlying assets and the preliminary underlying assets used in preparing the Computational Materials. The principal amount and designation of any certificate described in the Computational Materials are subject to change prior to issuance. None of the Underwriters nor any of their respective affiliates make any representation or warranty as to the actual rate or timing of payments or losses on any of the underlying assets or the payments or yield on the certificates.
This information is based upon management forecasts and reflects prevailing conditions and management’s views as of this date, all of which are subject to change.
This document contains forward-looking statements. Those statements are subject to certain risks and uncertainties that could cause the success of collections and the actual cash flow generated to differ materially from the information set forth in this document. While such information reflects projections prepared in good faith based upon methods and data that are believed to be reasonable and accurate as of their dates, the Depositor undertakes no obligation to revise these forward-looking statements to reflect subsequent events or circumstances. Investors should not place undue reliance on forward-looking statements and are advised to make their own independent analysis and determination with respect to the forecasted periods, which reflect the Depositor’s view only as of the date of this document.
J.P. Morgan is the marketing name for the investment banking businesses of JPMorgan Chase & Co. and its subsidiaries worldwide. Securities, syndicated loan arranging, financial advisory and other investment banking activities are performed by JPMS and its securities affiliates, and lending, derivatives and other commercial banking activities are performed by JPMorgan Chase Bank, National Association and its banking affiliates. JPMS is a member of SIPC and the NYSE. Securities and investment banking activities in the United States are performed by Deutsche Bank Securities Inc., a member of NYSE, FINRA and SIPC, and its broker-dealer affiliates. Lending and other commercial banking activities in the United States are performed by Deutsche Bank AG, acting through its New York Branch.
Capitalized terms used in this material but not defined herein shall have the meanings ascribed to them in the Preliminary Prospectus (as defined below).
THE CERTIFICATES REFERRED TO IN THESE MATERIALS ARE SUBJECT TO MODIFICATION OR REVISION (INCLUDING THE POSSIBILITY THAT ONE OR MORE CLASSES OF CERTIFICATES MAY BE SPLIT, COMBINED OR ELIMINATED AT ANY TIME PRIOR TO ISSUANCE OR AVAILABILITY OF A FINAL PROSPECTUS) AND ARE OFFERED ON A “WHEN, AS AND IF ISSUED” BASIS.
THE UNDERWRITERS MAY FROM TIME TO TIME PERFORM INVESTMENT BANKING SERVICES FOR, OR SOLICIT INVESTMENT BANKING BUSINESS FROM, ANY COMPANY NAMED IN THESE MATERIALS. THE UNDERWRITERS AND/OR THEIR AFFILIATES OR RESPECTIVE EMPLOYEES MAY FROM TIME TO TIME HAVE A LONG OR SHORT POSITION IN ANY CERTIFICATE OR CONTRACT DISCUSSED IN THESE MATERIALS.
| THE INFORMATION IN THIS STRUCTURAL AND COLLATERAL TERM SHEET IS NOT COMPLETE AND MAY BE AMENDED PRIOR TO THE TIME OF SALE. THIS TERM SHEET IS NOT AN OFFER TO SELL THESE SECURITIES AND IT IS NOT A SOLICITATION OF AN OFFER TO BUY THESE SECURITIES IN ANY JURISDICTION WHERE THE OFFER OR SALE IS NOT PERMITTED. |
| |
 | 2 of 145 |  |
| Structural and Collateral Term Sheet | | JPMDB 2019-COR6 |
| |
| Indicative Capital Structure |
Publicly Offered Certificates
| Class | Expected Ratings
(S&P / Fitch / KBRA) | Approximate
Initial Certificate
Balance or
Notional
Amount(1) | Approximate
Initial Available
Certificate
Balance or
Notional
Amount(1) | Approximate
Initial Retained
Certificate
Balance or
Notional
Amount(1)(2) | Approximate
Initial Credit
Support(3) | Expected
Weighted
Avg. Life
(years)(4) | Expected
Principal
Window(4) | Certificate
Principal
to Value
Ratio(5) | Underwritten
NOI Debt
Yield(6) |
| A-1 | AAA(sf) / AAAsf / AAA(sf) | $15,090,000 | $14,753,000 | $337,000 | 30.000% | 2.58 | 12/2019 – 10/2024 | 42.8% | 13.9% |
| A-2 | AAA(sf) / AAAsf / AAA(sf) | $33,100,000 | $32,361,000 | $739,000 | 30.000% | 4.92 | 10/2024 – 11/2024 | 42.8% | 13.9% |
| A-3 | AAA(sf) / AAAsf / AAA(sf) | (7) | (7) | (7) | 30.000% | (7) | (7) | 42.8% | 13.9% |
| A-4 | AAA(sf) / AAAsf / AAA(sf) | (7) | (7) | (7) | 30.000% | (7) | (7) | 42.8% | 13.9% |
| A-SB | AAA(sf) / AAAsf / AAA(sf) | $19,610,000 | $19,172,000 | $438,000 | 30.000% | 7.28 | 11/2024 – 4/2029 | 42.8% | 13.9% |
| X-A | AA-(sf) / AAAsf / AAA(sf) | $622,538,000(8) | $608,652,000(8) | $13,886,000(8) | N/A | N/A | N/A | N/A | N/A |
| X-B | NR / A-sf / AAA(sf) | $73,655,000(8) | $72,011,000(8) | $1,644,000(8) | N/A | N/A | N/A | N/A | N/A |
| A-S | AA-(sf) / AAAsf / AAA(sf) | $57,512,000 | $56,229,000 | $1,283,000 | 22.875% | 9.92 | 10/2029 – 11/2029 | 47.2% | 12.6% |
| B | NR / AA-sf / AA(sf) | $34,305,000 | $33,539,000 | $766,000 | 18.625% | 9.96 | 11/2029 – 11/2029 | 49.8% | 11.9% |
| C | NR / A-sf / A(sf) | $39,350,000 | $38,472,000 | $878,000 | 13.750% | 9.96 | 11/2029 – 11/2029 | 52.8% | 11.2% |
Privately Offered Certificates(9)
| Class | Expected Ratings
(S&P / Fitch / KBRA) | Approximate
Initial Certificate
Balance or
Notional
Amount(1)(10) | Approximate
Initial Available
Certificate
Balance or
Notional
Amount(1)(10) | Approximate
Initial Retained
Certificate
Balance or
Notional
Amount(1)(2)(10) | Approximate
Initial Credit
Support | Expected
Weighted
Avg. Life
(years)(4) | Expected
Principal
Window(4) | Certificate
Principal
to Value
Ratio(5) | Underwritten
NOI Debt
Yield(6) |
| X-D | NR / BBB-sf / BBB-(sf) | $45,404,000(8) | $44,391,000(8) | $1,013,000(8) | N/A | N/A | N/A | N/A | N/A |
| X-F | NR / NR / BBB-(sf) | $9,081,000(8) | $8,878,000(8) | $203,000(8) | N/A | N/A | N/A | N/A | N/A |
| D | NR / BBBsf / BBB+(sf) | $24,215,000 | $23,675,000 | $540,000 | 10.750% | 9.96 | 11/2029 – 11/2029 | 54.6% | 10.9% |
| E | NR / BBB-sf / BBB-(sf) | $21,189,000 | $20,716,000 | $473,000 | 8.125% | 9.96 | 11/2029 – 11/2029 | 56.2% | 10.6% |
| F | NR / NR / BBB-(sf) | $9,081,000 | $8,878,000 | $203,000 | 7.000% | 9.96 | 11/2029 – 11/2029 | 56.9% | 10.4% |
| G-RR | NR / NR / BB-(sf) | $17,152,000 | $16,769,000 | $383,000 | 4.875% | 9.96 | 11/2029 – 11/2029 | 58.2% | 10.2% |
| H-RR | NR / NR / B-(sf) | $8,072,000 | $7,891,000 | $181,000 | 3.875% | 9.96 | 11/2029 – 11/2029 | 58.8% | 10.1% |
| NR-RR | NR / NR / NR | $31,278,797 | $30,580,797 | $698,000 | 0.000% | 9.96 | 11/2029 – 11/2029 | 61.2% | 9.7% |
| (1) | In the case of each such Class, subject to a permitted variance of plus or minus 5%, including in connection with any variation in the certificate balances and notional amounts of the classes comprising the VRR Interest following the calculation of the actual fair value of the ABS interests (as such term is defined in Regulation RR) issued by the issuing entity. In addition, the notional amounts of the Class X-A, Class X-B, Class X-D and Class X-F Certificates may vary depending upon the final pricing of the Classes of Principal Balance Certificates whose Certificate Balances comprise such notional amounts, and, if as a result of such pricing the pass-through rate of any Class of the Class X-A, Class X-B, Class X-D and Class X-F Certificates, as applicable, would be equal to zero at all times, such Class of Certificates will not be issued on the closing date of this securitization. |
| (2) | On the Closing Date, LoanCore Capital Markets LLC or a majority-owned affiliate of LCM is expected to satisfy the U.S. risk retention requirements of LCM, as retaining sponsor, through the purchase and retention of (i) approximately 2.230% of the certificate balance or notional amount, as applicable, of each class of certificates (other than the Class R certificates) (collectively, the “VRR Interest”) and (ii) the Class G-RR, Class H-RR and Class NR-RR certificates (collectively, excluding the portion of each such class comprising the VRR Interest, the “HRR Certificates”). The certificate balance or notional amount of each class of certificates is subject to change based on the final pricing of all certificates and the final determination of the VRR Interest and the HRR Certificates that will be retained as described under “Credit Risk Retention” in the Preliminary Prospectus. For more information regarding the methodology and key inputs and assumptions used to determine the sizing of the VRR Interest and the HRR Certificates, see “Credit Risk Retention” in the Preliminary Prospectus. |
| (3) | The credit support percentages set forth for Class A-1, Class A-2, Class A-3, Class A-4 and Class A-SB Certificates represent the approximate initial credit support for the Class A-1, Class A-2, Class A-3, Class A-4 and Class A-SB Certificates in the aggregate. |
| (4) | Assumes 0% CPR / 0% CDR and a November 26, 2019 closing date. Based on modeling assumptions as described in the Preliminary Prospectus dated November 6, 2019 (the “Preliminary Prospectus”). |
| (5) | The “Certificate Principal to Value Ratio” for any Class of Principal Balance Certificates (other than the Class A-1, Class A-2, Class A-3, Class A-4 and Class A-SB Certificates) is calculated as the product of (a) the weighted average Cut-off Date LTV for the mortgage loans, and (b) a fraction, the numerator of which is the total initial Certificate Balance of such Class of Certificates and all Classes of Principal Balance Certificates senior to such Class of Certificates and the denominator of which is the total initial Certificate Balance of all of the Principal Balance Certificates. The Class A-1, Class A-2, Class A-3, Class A-4 and Class A-SB Certificate Principal to Value Ratios are calculated in the aggregate for those Classes as if they were a single Class Investors should note, however, that excess mortgaged property value associated with a mortgage loan will not be available to offset losses on any other mortgage loan. |
| (6) | The “Underwritten NOI Debt Yield” for any Class of Principal Balance Certificates (other than the Class A-1, Class A-2, Class A-3, Class A-4 and Class A-SB Certificates) is calculated as the product of (a) the weighted average UW NOI DY for the mortgage loans and (b) the total initial Certificate Balance of all of the Classes of Principal Balance Certificates divided by the total initial Certificate Balance for such Class and all Classes of Principal Balance Certificates senior to such Class of Certificates. The Underwritten NOI Debt Yield for each of the Class A-1, Class A-2, Class A-3, Class A-4 and Class A-SB Certificates is calculated in the aggregate for those Classes as if they were a single Class. Investors should note, however, that net operating income from any mortgaged property supports only the related mortgage loan and will not be available to support any other mortgage loan. |
| THE INFORMATION IN THIS STRUCTURAL AND COLLATERAL TERM SHEET IS NOT COMPLETE AND MAY BE AMENDED PRIOR TO THE TIME OF SALE. THIS TERM SHEET IS NOT AN OFFER TO SELL THESE SECURITIES AND IT IS NOT A SOLICITATION OF AN OFFER TO BUY THESE SECURITIES IN ANY JURISDICTION WHERE THE OFFER OR SALE IS NOT PERMITTED. |
| |
| | 3 of 145 | |
| Structural and Collateral Term Sheet | | JPMDB 2019-COR6 |
| |
| Indicative Capital Structure |
| (7) | The exact initial certificate balances of the Class A-3 and Class A-4 Certificates are unknown and will be determined based on the final pricing of those Classes of Certificates. However, the respective initial Certificate Balances (and corresponding available and retained portions thereof), weighted average lives and principal windows of the Class A-3 and Class A-4 Certificates are expected to be within the applicable ranges reflected in the following chart. The aggregate initial Certificate Balance of the Class A-3 and Class A-4 Certificates is expected to be approximately $497,226,000 subject to a variance of plus or minus 5%. |
| | Class of
Certificates | Expected Range of Initial
Certificate Balance | Expected Range of Initial
Available Certificate Balance | Expected Range of Initial
Retained Certificate
Balance | Expected
Range of
Weighted
Avg. Life (Yrs) | Expected Range of Principal
Window |
| | Class A-3 | $51,141,000 – $178,992,000 | $50,000,000 – $175,000,000 | $1,141,000 – $3,992,000 | 9.15 – 9.38 | 12/2028–2/2029 / 12/2028–8/2029 |
| | Class A-4 | $318,234,000 – $446,085,000 | $311,137,000 – $436,137,000 | $7,097,000 – $9,948,000 | 9.82 – 9.72 | 8/2029–10/2029 / 2/2029–10/2029 |
| (8) | The Class X-A, Class X-B, Class X-D and Class X-F Notional Amounts are defined in the Preliminary Prospectus. |
| (9) | The Class X-D, Class X-F, Class D, Class E, Class F, Class G-RR, Class H-RR and Class NR-RR Certificates are not being offered by the Preliminary Prospectus or this Term Sheet. The Class R Certificates are not shown above. |
| (10) | The initial Certificate Balance or Notional Amount of each of the Class X-F, Class F, Class G-RR, Class H-RR and Class NR-RR Certificates is subject to change based on final pricing of all certificates and the final determination of the Class G-RR, Class H-RR and Class NR-RR Certificates and the VRR Interest that will be retained as described under “Credit Risk Retention” in the Preliminary Prospectus to satisfy the U.S. risk retention requirements of LoanCore Capital Markets LLC, as retaining sponsor. For more information regarding the methodology and key inputs and assumptions used to determine the sizing of the Class G-RR, Class H-RR and Class NR-RR certificates, see “Credit Risk Retention” in the Preliminary Prospectus. |
| THE INFORMATION IN THIS STRUCTURAL AND COLLATERAL TERM SHEET IS NOT COMPLETE AND MAY BE AMENDED PRIOR TO THE TIME OF SALE. THIS TERM SHEET IS NOT AN OFFER TO SELL THESE SECURITIES AND IT IS NOT A SOLICITATION OF AN OFFER TO BUY THESE SECURITIES IN ANY JURISDICTION WHERE THE OFFER OR SALE IS NOT PERMITTED. |
| |
| | 4 of 145 | |
| Structural and Collateral Term Sheet | | JPMDB 2019-COR6 |
| |
| Summary of Transaction Terms |
| Securities Offered: | $696,193,000 monthly pay, multi-class, commercial mortgage REMIC Pass-Through Certificates. |
| Co-Lead Managers and Joint Bookrunners: | J.P. Morgan Securities LLC and Deutsche Bank Securities Inc. |
| Co-Managers: | Jefferies LLC and Drexel Hamilton, LLC. |
| Mortgage Loan Sellers: | JPMorgan Chase Bank, National Association (“JPMCB”) (32.1%), LoanCore Capital Markets LLC (“LCM”) (60.1%) and German American Capital Corporation (“GACC”) (7.7%). |
| Master Servicer: | Midland Loan Services, a Division of PNC Bank, National Association. |
| Special Servicer: | Midland Loan Services, a Division of PNC Bank, National Association. |
| Directing Certificateholder: | LoanCore Capital Markets LLC or its affiliate. |
| Trustee: | Wells Fargo Bank, National Association. |
| Certificate Administrator: | Wells Fargo Bank, National Association. |
| Operating Advisor: | Pentalpha Surveillance LLC. |
| Asset Representations Reviewer: | Pentalpha Surveillance LLC. |
| Rating Agencies: | S&P Global Ratings, a Standard & Poor’s Financial Services LLC business (“S&P”), Fitch Ratings, Inc. (“Fitch”) and Kroll Bond Rating Agency Inc. (“KBRA”). |
| U.S. Credit Risk Retention: | LCM is expected to act as the “retaining sponsor” for this securitization and intends to satisfy the U.S. credit risk retention requirement through the purchase by LCM or its “majority-owned affiliate” (as defined in Regulation RR), on the Closing Date, of (i) an “eligible vertical interest”, which will consist of approximately 2.230% of the certificate balance or notional amount of each class of certificates (other than the Class R Certificates) issued by the issuing entity and (ii) an “eligible horizontal residual interest”, which will consist (excluding the portion thereof that comprises a part of the VRR Interest) of the Class G-RR, Class H-RR and Class NR-RR Certificates. The restrictions on hedging and transfer under the credit risk retention rules as in effect on the closing date of this transaction will expire on and after the date that is the latest of (i) the date on which the aggregate principal balance of the mortgage loans has been reduced to 33% of the aggregate principal balance of the mortgage loans as of the Cut-off Date; (ii) the date on which the total unpaid principal obligations under the Certificates has been reduced to 33% of the aggregate total unpaid principal obligations under the Certificates as of the Closing Date; or (iii) two years after the Closing Date. Notwithstanding any references in this term sheet to the credit risk retention rules, Regulation RR, the retaining sponsor and other risk retention related matters, in the event the credit risk retention rules and/or Regulation RR (or any relevant portion thereof) are repealed or determined by applicable regulatory agencies to be no longer applicable to this securitization transaction, none of the retaining sponsor or any other party will be required to comply with or act in accordance with the credit risk retention rules and/or Regulation RR (or such relevant portion thereof). For additional information, see “Credit Risk Retention” in the Preliminary Prospectus. |
| EU Credit Risk Retention: | The transaction is not structured to satisfy the EU risk retention and due diligence requirements. |
| Pricing Date: | On or about November 12, 2019. |
| Closing Date: | On or about November 26, 2019. |
| Cut-off Date: | With respect to each mortgage loan, the related due date in November 2019, or with respect to any mortgage loan that has its first due date in December 2019, the date that would otherwise have been the related due date in November 2019. |
| Distribution Date: | The 4th business day after the Determination Date in each month, commencing in December 2019. |
| Determination Date: | 9thday of each month, or if the 9th day is not a business day, the next succeeding business day, commencing in December 2019. |
| Assumed Final Distribution Date: | The Distribution Date in November 2029, which is the latest anticipated repayment date of the Certificates. |
| Rated Final Distribution Date: | The Distribution Date in November 2052. |
| Tax Treatment: | The Publicly Offered Certificates are expected to be treated as REMIC “regular interests” for U.S. federal income tax purposes. |
| THE INFORMATION IN THIS STRUCTURAL AND COLLATERAL TERM SHEET IS NOT COMPLETE AND MAY BE AMENDED PRIOR TO THE TIME OF SALE. THIS TERM SHEET IS NOT AN OFFER TO SELL THESE SECURITIES AND IT IS NOT A SOLICITATION OF AN OFFER TO BUY THESE SECURITIES IN ANY JURISDICTION WHERE THE OFFER OR SALE IS NOT PERMITTED. |
| |
| | 5 of 145 | |
| Structural and Collateral Term Sheet | | JPMDB 2019-COR6 |
| |
| Summary of Transaction Terms |
| Form of Offering: | The Class A-1, Class A-2, Class A-3, Class A-4, Class A-SB, Class X-A, Class X-B, Class A-S, Class B and Class C Certificates (the “Publicly Offered Certificates”) will be offered publicly. The Class X-D, Class X-F, Class D, Class E, Class F, Class G-RR, Class H-RR, Class NR-RR and Class R Certificates (the “Privately Offered Certificates”) will be offered domestically to Qualified Institutional Buyers and to Institutional Accredited Investors (other than the Class R Certificates) and to institutions that are not U.S. Persons pursuant to Regulation S. |
| SMMEA Status: | The Certificates will not constitute “mortgage related securities” for purposes of SMMEA. |
| ERISA: | The Publicly Offered Certificates are expected to be ERISA eligible. |
| Optional Termination: | On any Distribution Date on which the aggregate principal balance of the pool of mortgage loans is less than 1% of the aggregate principal balance of the mortgage loans as of the Cut-off Date, certain entities specified in the Preliminary Prospectus will have the option to purchase all of the remaining mortgage loans (and all property acquired through exercise of remedies in respect of any mortgage loan) at the price specified in the Preliminary Prospectus. Refer to “Pooling and Servicing Agreement—Termination; Retirement of Certificates” in the Preliminary Prospectus. |
| Minimum Denominations: | The Publicly Offered Certificates (other than the Class X-A and Class X-B Certificates) will be issued in minimum denominations of $10,000 and integral multiples of $1 in excess of $10,000. The Class X-A and Class X-B Certificates will be issued in minimum denominations of $1,000,000 and in integral multiples of $1 in excess of $1,000,000. |
| Settlement Terms: | DTC, Euroclear and Clearstream Banking. |
| Analytics: | The transaction is expected to be modeled by Intex Solutions, Inc. and Trepp, LLC and is expected to be available on Bloomberg L.P., Blackrock Financial Management, Inc., Interactive Data Corporation, CMBS.com, Inc., Markit Group Limited, Moody’s Analytics, MBS Data, LLC, RealInsight and Thomson Reuters Corporation. |
| Risk Factors: | THE CERTIFICATES INVOLVE CERTAIN RISKS AND MAY NOT BE SUITABLE FOR ALL INVESTORS. REFER TO “RISK FACTORS” IN THE PRELIMINARY PROSPECTUS. |
| THE INFORMATION IN THIS STRUCTURAL AND COLLATERAL TERM SHEET IS NOT COMPLETE AND MAY BE AMENDED PRIOR TO THE TIME OF SALE. THIS TERM SHEET IS NOT AN OFFER TO SELL THESE SECURITIES AND IT IS NOT A SOLICITATION OF AN OFFER TO BUY THESE SECURITIES IN ANY JURISDICTION WHERE THE OFFER OR SALE IS NOT PERMITTED. |
| |
| | 6 of 145 | |
| Structural and Collateral Term Sheet | | JPMDB 2019-COR6 |
| |
| Collateral Characteristics |
| Loan Pool | |
| | Initial Pool Balance (“IPB”): | $807,180,797 |
| | Number of Mortgage Loans: | 32 |
| | Number of Mortgaged Properties: | 117 |
| | Average Cut-off Date Balance per Mortgage Loan: | $25,224,400 |
| | Weighted Average Current Mortgage Rate: | 3.94484% |
| | 10 Largest Mortgage Loans as % of IPB: | 57.5% |
| | Weighted Average Remaining Term to Maturity: | 115 months |
| | Weighted Average Seasoning: | 2 months |
| | | |
| Credit Statistics | |
| | Weighted Average UW NCF DSCR(1)(2): | 2.18x |
| | Weighted Average UW NOI Debt Yield(1): | 9.7% |
| | Weighted Average Cut-off Date Loan-to-Value Ratio (“LTV”)(1)(3): | 61.2% |
| | Weighted Average Maturity Date LTV(1)(3): | 58.2% |
| | | |
| Other Statistics | |
| | % of Mortgage Loans with Additional Debt: | 20.9% |
| | % of Mortgaged Properties with Single Tenants: | 14.6% |
| | | |
| Amortization | |
| | Weighted Average Original Amortization Term(4): | 359 months |
| | Weighted Average Remaining Amortization Term(4): | 357 months |
| | % of Mortgage Loans with Interest-Only: | 68.8% |
| | % of Mortgage Loans with Amortizing Balloon: | 21.2% |
| | % of Mortgage Loans with Partial Interest-Only followed by Amortizing Balloon: | 9.9% |
| | | |
| Lockbox / Cash Management(5) | |
| | % of Mortgage Loans with In-Place, Hard Lockboxes: | 76.0% |
| | % of Mortgage Loans with Springing Lockboxes: | 12.2% |
| | % of Mortgage Loans with In-Place, Soft Lockboxes: | 11.8% |
| | % of Mortgage Loans with In-Place Cash Management: | 10.6% |
| | % of Mortgage Loans with Springing Cash Management: | 89.4% |
| | | |
| Reserves | |
| | % of Mortgage Loans Requiring Monthly Tax Reserves: | 65.8% |
| | % of Mortgage Loans Requiring Monthly Insurance Reserves: | 34.9% |
| | % of Mortgage Loans Requiring Monthly CapEx Reserves(6): | 65.3% |
| | % of Mortgage Loans Requiring Monthly TI/LC Reserves(7): | 56.3% |
| | | |
| (1) | In the case of Loan Nos. 1, 2, 3, 4, 5, 7, 9, 11, 14, 16, 17, 18, 20 and 26, the UW NCF DSCR, UW NOI Debt Yield, Cut-off Date LTV and Maturity Date LTV calculations include the related Pari Passu Companion Loan(s). In the case of Loan Nos. 1, 5, 7 and 16, the UW NCF DSCR, UW NOI Debt Yield, Cut-off Date LTV and Maturity Date LTV calculations exclude the related Subordinate Companion Loan(s) and/or related mezzanine loan(s). |
| (2) | In the case of Loan No. 7, the UW NCF DSCR is calculated using the sum of the first 12 mortgage loan principal and interest payments after the Cut-off Date based on the assumed principal and interest payment schedule set forth in Annex H of the Preliminary Prospectus. |
| (3) | In the case of Loan Nos. 3, 17 and 20, the Cut-off Date LTV and the Maturity Date LTV are calculated by using an appraised value based on certain hypothetical assumptions. Refer to“Description of the Mortgage Pool—Assessments of Property Value and Condition” and“—Appraised Value” in the Preliminary Prospectus for additional details. |
| (4) | Excludes 20 mortgage loans that are interest-only for the entire term. |
| (5) | For a more detailed description of Lockbox / Cash Management, refer to“Description of the Mortgage Pool—Certain Terms of the Mortgage Loans—Mortgaged Property Accounts” in the Preliminary Prospectus. |
| (6) | CapEx Reserves include FF&E reserves for hotel properties. |
| (7) | Calculated only with respect to the Cut-off Date Balance of mortgage loans secured or partially secured by retail, office, industrial and mixed use properties. |
| THE INFORMATION IN THIS STRUCTURAL AND COLLATERAL TERM SHEET IS NOT COMPLETE AND MAY BE AMENDED PRIOR TO THE TIME OF SALE. THIS TERM SHEET IS NOT AN OFFER TO SELL THESE SECURITIES AND IT IS NOT A SOLICITATION OF AN OFFER TO BUY THESE SECURITIES IN ANY JURISDICTION WHERE THE OFFER OR SALE IS NOT PERMITTED. |
| |
| | 7 of 145 | |
| Structural and Collateral Term Sheet | | JPMDB 2019-COR6 |
| |
| Collateral Characteristics |
Mortgage Loan Seller | Number of
Mortgage Loans | Number of
Mortgaged
Properties | Aggregate
Cut-off Date
Balance | |
| LCM | 22 | 100 | $485,460,797 | 60.1% |
| JPMCB(1) | 9 | 16 | 259,220,000 | 32.1 |
| GACC(2) | 1 | 1 | 62,500,000 | 7.7 |
| Total | 32 | 117 | $807,180,797 | 100.0% |
| (1) | In the case of Loan No. 16, the whole loan was co-originated by JPMCB, Morgan Stanley Bank, N.A., Wells Fargo Bank, National Association and Goldman Sachs Bank USA. In the case of Loan Nos. 17 and 18, the whole loan was co-originated by JPMCB and Wells Fargo Bank, National Association. |
| (2) | In the case of Loan No. 1, such mortgage loan being sold by GACC was originated by an affiliate thereof, Deutsche Bank AG, New York Branch (“DBNY”). DBNY on the origination date transferred such mortgage loan to DBR Investments Co. Limited (“DBRI”), and DBRI will transfer such mortgage loan to GACC on or prior to the closing date. The Century Plaza Towers Whole Loan, with respect to which such mortgage loan is a part of, was co-originated by DBNY, Morgan Stanley Bank, N.A. and Wells Fargo Bank, National Association. |
| Ten Largest Mortgage Loans |
| |
| No. | Loan Name | Mortgage
Loan Seller | No.
of Prop. | Cut-off
Date
Balance | % of
IPB | SF / Units | Property
Type | UW
NCF
DSCR(1)(2) | UW NOI
Debt
Yield(1) | Cut-off
Date
LTV(1)(3) | Maturity
Date
LTV(1)(3) |
| 1 | Century Plaza Towers | GACC | 1 | $62,500,000 | 7.7% | 2,401,641 | Office | 4.09x | 13.5% | 39.1% | 39.1% |
| 2 | Los Angeles Leased Fee Portfolio | LCM | 8 | $61,000,000 | 7.6% | 556,202 | Other | 1.75x | 6.2% | 63.0% | 63.0% |
| 3 | Innovation Park | JPMCB | 1 | $55,000,000 | 6.8% | 1,854,729 | Office | 2.96x | 11.6% | 68.8% | 68.8% |
| 4 | 12555 & 12655 Jefferson | LCM | 2 | $54,000,000 | 6.7% | 193,908 | Office | 1.80x | 7.6% | 59.5% | 59.5% |
| 5 | Hyde Park Multifamily Portfolio | LCM | 42 | $46,750,000 | 5.8% | 839 | Multifamily | 1.82x | 8.7% | 60.5% | 60.5% |
| 6 | BJ's Wholesale Club | JPMCB | 1 | $40,150,000 | 5.0% | 135,753 | Retail | 2.58x | 9.4% | 54.3% | 54.3% |
| 7 | Hampton Roads Office Portfolio | LCM | 22 | $39,723,151 | 4.9% | 1,322,003 | Office | 1.40x | 10.8% | 71.3% | 60.3% |
| 8 | Colorado Square | LCM | 1 | $37,050,001 | 4.6% | 245,509 | Office | 1.53x | 9.3% | 71.8% | 57.5% |
| 9 | Sunset North | JPMCB | 1 | $35,000,000 | 4.3% | 464,061 | Office | 2.63x | 9.1% | 66.1% | 66.1% |
| 10 | Jersey City Group 2 | JPMCB | 8 | $32,840,000 | 4.1% | 201 | Multifamily | 1.04x | 6.6% | 78.6% | 72.0% |
| | | | | | | | | | | | |
| | Top 3 Total/Weighted Average | 10 | $178,500,000 | 22.1% | | | 2.94x | 10.4% | 56.4% | 56.4% |
| | Top 5 Total/Weighted Average | 54 | $279,250,000 | 34.6% | | | 2.53x | 9.6% | 57.7% | 57.7% |
| | Top 10 Total/Weighted Average | 87 | $464,013,153 | 57.5% | | | 2.26x | 9.4% | 61.8% | 59.3% |
| (1) | In the case of Loan Nos. 1, 2, 3, 4, 5, 7 and 9, the UW NCF DSCR, UW NOI Debt Yield, Cut-off Date LTV and Maturity Date LTV calculations include the related Pari Passu Companion Loan(s). In the case of Loan Nos. 1, 5 and 7, the UW NCF DSCR, UW NOI Debt Yield, Cut-off Date LTV and Maturity Date LTV calculations exclude the related Subordinate Companion Loan(s) and/or related mezzanine loan(s). |
| (2) | With respect to Loan No. 7, the UW NCF DSCR is calculated using the sum of the first 12 whole loan principal and interest payments after the Cut-off Date based on the assumed principal and interest payment schedule set forth in Annex H of the Preliminary Prospectus. |
| (3) | In the case of Loan No. 3, the Cut-off Date LTV and the Maturity Date LTV are calculated by using an appraised value based on certain hypothetical assumptions. Refer to “Description of the Mortgage Pool—Assessments of Property Value and Condition” and “—Appraised Value” in the Preliminary Prospectus for additional details. |
| THE INFORMATION IN THIS STRUCTURAL AND COLLATERAL TERM SHEET IS NOT COMPLETE AND MAY BE AMENDED PRIOR TO THE TIME OF SALE. THIS TERM SHEET IS NOT AN OFFER TO SELL THESE SECURITIES AND IT IS NOT A SOLICITATION OF AN OFFER TO BUY THESE SECURITIES IN ANY JURISDICTION WHERE THE OFFER OR SALE IS NOT PERMITTED. |
| |
| | 8 of 145 | |
| Structural and Collateral Term Sheet | | JPMDB 2019-COR6 |
| |
| Collateral Characteristics |
| Pari Passu Companion Loan Summary |
| Loan No. | Mortgage Loan | Note(s) | Original Balance ($) | Cut-off Date
Balance ($) | Holder of Note | Lead
Servicer for
Whole Loan
(Y/N) | Master
Servicer
Under Lead
Securitization | Special Servicer
Under Lead
Securitization |
| 1 | Century Plaza Towers | A-1-S1, A-1-S2, A-1-S3, A-2-S1, A-2-S2, A-2-S3, A-2-C1, A-2-C3, A-2-C4, A-3-S1, A-3-S2, A-3-S3, A-3-C1, A-3-C3 | $525,000,000 | $525,000,000 | CPTS 2019-CPT | Yes | Wells | CWCapital |
| | A-1-C3, A-1-C8 | $62,500,000 | $62,500,000 | JPMDB 2019-COR6 | No | | |
| | A-1-C1, A-1-C2, A-1-C4, A-1-C5, A-1-C6, A-1-C7, | $187,500,000 | $187,500,000 | DBRI | No | | |
| | | A-2-C2, A-2-C5, A-2-C6, A-2-C7 | $62,500,000 | $62,500,000 | MSBNA | No | | |
| | | A-3-C2, A-3-C4, A-3-C5 | $62,500,000 | $62,500,000 | WFBNA | No | | |
| | | B-1, B-2, B-3(1) | $300,000,000 | $300,000,000 | CPTS 2019-CPT | No | | |
| | | Total | $1,200,000,000 | $1,200,000,000 | | | | |
| 2 | Los Angeles Leased Fee Portfolio | A-1 | $61,000,000 | $61,000,000 | JPMDB 2019-COR6 | Yes | Midland | Midland |
| | A-2 | $24,000,000 | $24,000,000 | LCM | No | | |
| | | Total | $85,000,000 | $85,000,000 | | | | |
| 3 | Innovation Park | A-1 | $60,000,000 | $60,000,000 | BMARK 2019-B14 | No(2) | | |
| | A-2 | $67,250,000 | $67,250,000 | JPMCB | Yes | (2) | (2) |
| | | A-3 | $55,000,000 | $55,000,000 | JPMDB 2019-COR6 | No | | |
| | | Total | $182,250,000 | $182,250,000 | | | | |
| 4 | 12555 &12655 Jefferson | A-1 | $54,000,000 | $54,000,000 | JPMDB 2019-COR6 | Yes | Midland | Midland |
| | A-2 | $30,000,000 | $30,000,000 | LCM | No | | |
| | | A-3 | $27,000,000 | $27,000,000 | LCM | No | | |
| | | Total | $111,000,000 | $111,000,000 | | | | |
5 | Hyde Park Multifamily Portfolio | A-1 | $60,000,000 | $60,000,000 | JPMCC 2019-COR5 | Yes | Midland | Midland |
| | A-2 | $46,750,000 | $46,750,000 | JPMDB 2019-COR6 | No | | |
| | | Total | $106,750,000 | $106,750,000 | | | | |
7 | Hampton Roads Office Portfolio | A-1, A-5 | $50,000,000 | $49,653,939 | JPMCC 2019-COR5 | Yes | Midland | Midland |
| | A-3, A-4 | $40,000,000 | $39,723,151 | JPMDB 2019-COR6 | No | | |
| | A-2 | $33,000,000 | $32,771,600 | LCM | No | | |
| | A-6 | $10,000,000 | $9,930,788 | LCM | No | | |
| | Total | $133,000,000 | $132,079,478 | | | | |
9 | Sunset North | A-1 | $75,000,000 | $75,000,000 | BMARK 2019-B13 | Yes | Midland | CWCapital |
| | | A-2 | $20,000,000 | $20,000,000 | BMARK 2019-B14 | No | | |
| | | A-3 | $35,000,000 | $35,000,000 | JPMDB 2019-COR6 | No | | |
| | | A-4 | $20,000,000 | $20,000,000 | JPMCB | No | | |
| | | Total | $150,000,000 | $150,000,000 | | | | |
| 11 | Belvedere Place | A-1 | $32,750,000 | $32,750,000 | JPMDB 2019-COR6 | Yes | Midland | Midland |
| | A-2 | $11,250,000 | $11,250,000 | LCM | No | | |
| | | Total | $44,000,000 | $44,000,000 | | | | |
14 | Brooklyn Renaissance Plaza | A-1 | $65,000,000 | $64,503,166 | JPMCC 2019-COR5 | Yes | Midland | Midland |
| | A-2 | $25,000,000 | $24,808,910 | JPMDB 2019-COR6 | No | | |
| | | Total | $90,000,000 | $89,312,076 | | | | |
| (1) | Each note represents a subordinate companion loan. |
| (2) | In the case of Loan No. 3, the whole loan is expected to be serviced under the BMARK 2019-B14 pooling and servicing agreement until such time the controlling note has been securitized, at which point such whole loan will be serviced under the pooling and servicing agreement related to such securitization. JPMCB holds the related controllingpari passucompanion loan and is entitled to exercise control rights until the securitization of such controllingpari passucompanion loan. |
| THE INFORMATION IN THIS STRUCTURAL AND COLLATERAL TERM SHEET IS NOT COMPLETE AND MAY BE AMENDED PRIOR TO THE TIME OF SALE. THIS TERM SHEET IS NOT AN OFFER TO SELL THESE SECURITIES AND IT IS NOT A SOLICITATION OF AN OFFER TO BUY THESE SECURITIES IN ANY JURISDICTION WHERE THE OFFER OR SALE IS NOT PERMITTED. |
| |
| | 9 of 145 | |
| Structural and Collateral Term Sheet | | JPMDB 2019-COR6 |
| |
| Collateral Characteristics |
| Loan No. | Mortgage Loan | Note(s) | Original
Balance ($) | Cut-off Date
Balance ($) | Holder of Note | Lead
Servicer for
Whole Loan
(Y/N) | Master
Servicer
Under Lead
Securitization | Special Servicer
Under Lead
Securitization |
| 16 | Grand Canal Shoppes | A-1-1, A-1-6 | $70,000,000 | $70,000,000 | MSC 2019-H7 | Yes(2) | Midland | LNR |
| | | A-1-2, A-2-1 | $100,000,000 | $100,000,000 | BANK 2019-BNK19 | No | | |
| | | A-3-1 | $50,000,000 | $50,000,000 | BMARK 2019-B12 | No | | |
| | | A-3-2 | $50,000,000 | $50,000,000 | BMARK 2019-B13 | No | | |
| | | A-4-1 | $60,000,000 | $60,000,000 | CGCMT 2019-GC41 | No | | |
| | | A-4-3 | $20,000,000 | $20,000,000 | GSMS 2019-GC42 | No | | |
| | | A-1-7, A-1-8, A-2-2-1 | $40,000,000 | $40,000,000 | BANK 2019-BNK20 | No | | |
| | | A-2-2-2 | $30,000,000 | $30,000,000 | CSAIL 2019-C17 | No | | |
| | | A-2-3, A-2-5 | $50,384,615 | $50,384,615 | UBS 2019-C17 | No | | |
| | | A-1-4 | $40,000,000 | $40,000,000 | BANK 2019-BNK21 | No | | |
| | | A-3-3-1, A-3-5 | $30,384,615 | $30,384,615 | BMARK 2019-B14 | No | | |
| | | A-1-3, A-1-5 | $53,846,154 | $53,846,154 | MSNBA | No | | |
| | | A-3-3-2 | $20,000,000 | $20,000,000 | JPMDB 2019-COR6 | No | | |
| | | A-3-4 | $25,000,000 | $25,000,000 | CCRE | No | | |
| | | A-4-2, A-4-4, A-4-5 | $95,384,615 | $95,384,615 | GSBI | No | | |
| | | A-2-4 | $25,000,000 | $25,000,000 | UBS AG | No | | |
| | | B-1(1) | $215,000,000 | $215,000,000 | CPPIB Credit Investment II Inc. | No(2) | | |
| | | Total | $975,000,000 | $975,000,000 | | | | |
17 | 600 & 620 National Avenue | A-1-1 | $38,950,000 | $38,950,000 | UBSCM 2019-C17 | Yes | Midland | CWCapital |
| | A-2-1-A | $20,000,000 | $20,000,000 | BMARK 2019-B14 | No | | |
| | | A-1-2 | $30,000,000 | $30,000,000 | WFCM 2019-C53 | No | | |
| | | A-2-2-A | $20,000,000 | $20,000,000 | JPMDB 2019-COR6 | No | | |
| | | A-2-1-B, A-2-2-B, A-2-3 | $28,950,000 | $28,950,000 | JPMCB | No | | |
| | | Total | $137,900,000 | $137,900,000 | | | | |
18 | Tysons Tower | A-1 | $50,000,000 | $50,000,000 | BANK 2019-BNK21 | Yes | Rialto | Wells |
| | A-2, A-3 | $45,000,000 | $45,000,000 | BANK 2019-BNK22 | No | | |
| | | A-4 | $40,000,000 | $40,000,000 | BMARK 2019-B14 | No | | |
| | | A-5, A-7 | $35,000,000 | $35,000,000 | JPMCB | No | | |
| | | A-6 | $20,000,000 | $20,000,000 | JPMDB 2019-COR6 | No | | |
| | | Total | $190,000,000 | $190,000,000 | | | | |
| 20 | Hilton Cincinnati Netherland Plaza | A-1 | $35,500,000 | $35,500,000 | BMARK 2019-B14 | Yes | Midland | Midland |
| | A-2 | $17,000,000 | $17,000,000 | JPMDB 2019-COR6 | No | | |
| | A-3 | $20,000,000 | $20,000,000 | JPMCB | No | | |
| | | Total | $72,500,000 | $72,500,000 | | | | |
| 26 | NOV Headquarters | A-1 | $20,000,000 | $20,000,000 | JPMCC 2019-COR5 | Yes | Midland | Midland |
| | A-2 | $9,200,000 | $9,200,000 | JPMDB 2019-COR6 | No | | |
| | | A-3 | $10,000,000 | $10,000,000 | LCM | No | | |
| | | Total | $39,200,000 | $39,200,000 | | | | |
| (1) | Each note represents a subordinate companion loan. |
| (2) | In the case of Loan No. 16, the initial control note is Note B-1. During the continuance of a Grand Canal Shoppes Control Appraisal Period, Note A-1-1 will be the Control Note. See “Description of the Mortgage Pool—The Whole Loans—The Non-Serviced AB Whole Loans—The Grand Canal Shoppes Whole Loan” in the Preliminary Prospectus. |
| THE INFORMATION IN THIS STRUCTURAL AND COLLATERAL TERM SHEET IS NOT COMPLETE AND MAY BE AMENDED PRIOR TO THE TIME OF SALE. THIS TERM SHEET IS NOT AN OFFER TO SELL THESE SECURITIES AND IT IS NOT A SOLICITATION OF AN OFFER TO BUY THESE SECURITIES IN ANY JURISDICTION WHERE THE OFFER OR SALE IS NOT PERMITTED. |
| |
| | 10 of 145 | |
| Structural and Collateral Term Sheet | | JPMDB 2019-COR6 |
| |
| Collateral Characteristics |
No. | Loan Name | Trust
Cut-off Date
Balance | Subordinate
Debt Cut-off
Date
Balance(1) | Total Debt
Cut-off Date
Balance | Mortgage
Loan UW
NCF
DSCR(2)(3) | Total
Debt
UW
NCF
DSCR(3) | Mortgage
Loan
Cut-off
Date
LTV(2) | Total
Debt
Cut-off
Date
LTV | Mortgage
Loan UW
NOI Debt
Yield(2) | Total
Debt
UW NOI
Debt
Yield |
| 1 | Century Plaza Towers | $62,500,000 | $300,000,000 | $1,200,000,000 | 4.09x | 3.07x | 39.1% | 52.1% | 13.5% | 10.1% |
| 5 | Hyde Park Multifamily Portfolio | $46,750,000 | $15,250,000 | $122,000,000 | 1.82x | 1.48x | 60.5% | 69.2% | 8.7% | 7.6% |
| 7 | Hampton Roads Office Portfolio | $39,723,151 | $19,861,576 | $151,941,054 | 1.40x | 1.16x | 71.3% | 82.0% | 10.8% | 9.4% |
| 16 | Grand Canal Shoppes | $20,000,000 | $215,000,000 | $975,000,000 | 2.46x | 1.67x | 46.3% | 59.5% | 9.6% | 7.5% |
| (1) | In the case of Loan Nos. 5 and 7, Subordinate Debt Cut-off Date Balance represents one or more mezzanine loans. In the case of Loan Nos. 1 and 16, Subordinate Debt Cut-off Date Balance represents one or more Subordinate Companion Loans. |
| (2) | In the case of Loan Nos. 1, 5, 7 and 16, the UW NCF DSCR, UW NOI Debt Yield and Cut-off Date LTV calculations include the related Pari Passu Companion Loan(s). In the case of Loan Nos. 1, 5, 7 and 16, the UW NCF DSCR, UW NOI Debt Yield and Cut-off Date LTV calculations exclude the related Subordinate Companion Loan(s) and/or related mezzanine loan(s). |
| (3) | With respect to Loan No. 7, the UW NCF DSCR is calculated using the sum of the first 12 mortgage loan principal and interest payments after the Cut-off Date based on the assumed principal and interest payment schedule set forth in Annex H of the Preliminary Prospectus. The Total Debt UW NCF DSCR is calculated using the sum of the first 12 total debt principal and interest payments after the Cut-off Date based on the assumed principal and interest payment schedule set forth in the related mortgage and mezzanine loan agreements. |
| THE INFORMATION IN THIS STRUCTURAL AND COLLATERAL TERM SHEET IS NOT COMPLETE AND MAY BE AMENDED PRIOR TO THE TIME OF SALE. THIS TERM SHEET IS NOT AN OFFER TO SELL THESE SECURITIES AND IT IS NOT A SOLICITATION OF AN OFFER TO BUY THESE SECURITIES IN ANY JURISDICTION WHERE THE OFFER OR SALE IS NOT PERMITTED. |
| |
| | 11 of 145 | |
| Structural and Collateral Term Sheet | | JPMDB 2019-COR6 |
| |
| Collateral Characteristics |
| Mortgaged Properties by Type(1) |
| | | | | | Weighted Average |
| Property Type | Property Subtype | Number
of
Properties | Cut-off Date
Principal
Balance | % of IPB | Occupancy | UW
NCF
DSCR(2)(3) | UW
NOI Debt
Yield(2) | Cut-off
Date
LTV(2)(4) | Maturity
Date
LTV(2)(4) |
| Office | Suburban | 31 | $280,753,630 | 34.8% | 95.9% | 2.22x | 10.2% | 66.2% | 62.6% |
| | CBD | 5 | 178,358,911 | 22.1 | 93.1% | 2.49x | 10.2% | 53.3% | 49.1% |
| | Medical | 4 | 9,200,000 | 1.1 | 100.0% | 1.50x | 10.0% | 58.7% | 53.9% |
| | Subtotal: | 40 | $468,312,541 | 58.0% | 94.9% | 2.31x | 10.2% | 61.2% | 57.3% |
| | | | | | | | | | |
| Multifamily | Garden | 40 | $67,106,565 | 8.3% | 94.3% | 1.44x | 7.7% | 69.4% | 66.1% |
| | Mid-Rise | 11 | 34,064,097 | 4.2 | 97.2% | 1.91x | 8.2% | 61.2% | 61.2% |
| | Subtotal: | 51 | $101,170,662 | 12.5% | 95.2% | 1.60x | 7.9% | 66.6% | 64.5% |
| | | | | | | | | | |
| Retail | Freestanding | 2 | $44,350,000 | 5.5% | 100.0% | 2.51x | 9.3% | 55.1% | 55.1% |
| | Anchored | 2 | 25,553,256 | 3.2 | 94.1% | 2.13x | 11.0% | 60.2% | 56.2% |
| | Specialty Retail | 1 | 20,000,000 | 2.5 | 94.0% | 2.46x | 9.6% | 46.3% | 46.3% |
| | Shadow Anchored | 1 | 3,395,000 | 0.4 | 92.2% | 2.52x | 11.5% | 67.9% | 67.9% |
| | Subtotal: | 6 | $93,298,256 | 11.6% | 96.8% | 2.40x | 9.9% | 55.1% | 54.0% |
| | | | | | | | | | |
| Other | Leased Fee | 8 | $61,000,000 | 7.6% | 100.0% | 1.75x | 6.2% | 63.0% | 63.0% |
| | Parking | 1 | 219,338 | 0.0 | 100.0% | 1.82x | 8.7% | 60.5% | 60.5% |
| | Subtotal: | 9 | $61,219,338 | 7.6% | 100.0% | 1.75x | 6.2% | 63.0% | 63.0% |
| | | | | | | | | | |
| Hotel | Extended Stay | 1 | $25,250,000 | 3.1% | 88.1% | 2.99x | 12.3% | 52.6% | 52.6% |
| | Full Service | 1 | 17,000,000 | 2.1 | 74.8% | 1.62x | 10.9% | 68.7% | 63.7% |
| | Subtotal: | 2 | $42,250,000 | 5.2% | 82.7% | 2.44x | 11.7% | 59.1% | 57.1% |
| | | | | | | | | | |
| Self Storage | Self Storage | 2 | $28,330,000 | 3.5% | 90.5% | 1.81x | 8.9% | 64.2% | 64.2% |
| | Subtotal: | 2 | $28,330,000 | 3.5% | 90.5% | 1.81x | 8.9% | 64.2% | 64.2% |
| | | | | | | | | | |
| Industrial | Flex | 6 | $11,060,700 | 1.4% | 100.0% | 2.49x | 16.8% | 50.8% | 41.0% |
| | Warehouse/Distribution | 1 | 1,539,300 | 0.2 | 100.0% | 1.64x | 10.6% | 66.9% | 55.1% |
| | Subtotal: | 7 | $12,600,000 | 1.6% | 100.0% | 2.39x | 16.1% | 52.8% | 42.7% |
| | Total / Weighted Average: | 117 | $807,180,797 | 100.0% | 94.8% | 2.18x | 9.7% | 61.2% | 58.2% |
| (1) | Because this table presents information relating to the mortgaged properties and not mortgage loans, the information for mortgage loans secured by more than one mortgaged property is based on allocated loan amounts. |
| (2) | In the case of Loan Nos. 1, 2, 3, 4, 5, 7, 9, 11, 14, 16, 17, 18, 20 and 26, the UW NCF DSCR, UW NOI Debt Yield, Cut-off Date LTV and Maturity Date LTV calculations include the related Pari Passu Companion Loan(s). In the case of Loan Nos. 1, 5, 7 and 16, the UW NCF DSCR, UW NOI Debt Yield, Cut-off Date LTV and Maturity Date LTV calculations exclude the related Subordinate Companion Loan(s) and/or related mezzanine loan(s). |
| (3) | With respect to Loan No. 7, the UW NCF DSCR is calculated using the sum of the first 12 whole loan principal and interest payments after the Cut-off Date based on the assumed principal and interest payment schedule set forth in Annex H of the Preliminary Prospectus. |
| (4) | In the case of Loan Nos. 3, 17 and 20, the Cut-off Date LTV and the Maturity Date LTV are calculated by using an appraised value based on certain hypothetical assumptions. Refer to “Description of the Mortgage Pool—Assessments of Property Value and Condition” and “—Appraised Value” in the Preliminary Prospectus for additional details. |
| THE INFORMATION IN THIS STRUCTURAL AND COLLATERAL TERM SHEET IS NOT COMPLETE AND MAY BE AMENDED PRIOR TO THE TIME OF SALE. THIS TERM SHEET IS NOT AN OFFER TO SELL THESE SECURITIES AND IT IS NOT A SOLICITATION OF AN OFFER TO BUY THESE SECURITIES IN ANY JURISDICTION WHERE THE OFFER OR SALE IS NOT PERMITTED. |
| |
| | 12 of 145 | |
| Structural and Collateral Term Sheet | | JPMDB 2019-COR6 |
| |
| Collateral Characteristics |
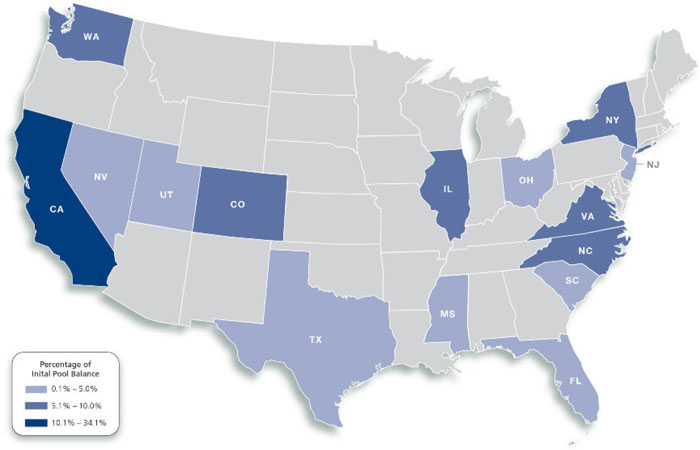
| Mortgaged Properties by Location(1) |
| |
| | | | | Weighted Average |
State | Number of Properties | Cut-off Date
Principal
Balance | % of
IPB | Occupancy | UW
NCF DSCR(2)(3) | UW
NOI Debt
Yield(2) | Cut-off Date
LTV(2)(4) | Maturity Date
LTV(2)(4) |
| California | 17 | $274,983,735 | 34.1% | 96.6% | 2.43x | 9.4% | 57.5% | 56.8% |
| Illinois | 44 | 68,550,000 | 8.5 | 95.4% | 1.86x | 8.5% | 60.9% | 60.9% |
| New York | 2 | 64,958,910 | 8.0 | 95.6% | 2.14x | 9.2% | 52.0% | 48.5% |
| North Carolina | 4 | 60,789,100 | 7.5 | 96.5% | 2.83x | 11.5% | 68.6% | 67.5% |
| Virginia | 24 | 60,258,551 | 7.5 | 93.9% | 1.96x | 10.9% | 64.9% | 57.5% |
| Colorado | 2 | 56,280,001 | 7.0 | 89.7% | 1.57x | 9.2% | 68.5% | 59.0% |
| Washington | 3 | 48,100,000 | 6.0 | 98.3% | 2.66x | 10.6% | 63.0% | 62.4% |
| New Jersey | 8 | 32,840,000 | 4.1 | 95.0% | 1.04x | 6.6% | 78.6% | 72.0% |
| Utah | 1 | 29,600,000 | 3.7 | 88.2% | 1.58x | 9.5% | 67.4% | 60.9% |
| South Carolina | 2 | 27,895,000 | 3.5 | 99.1% | 1.83x | 10.9% | 61.5% | 50.7% |
| Florida | 2 | 26,789,300 | 3.3 | 88.8% | 2.91x | 12.2% | 53.4% | 52.7% |
| Nevada | 1 | 20,000,000 | 2.5 | 94.0% | 2.46x | 9.6% | 46.3% | 46.3% |
| Texas | 5 | 18,400,000 | 2.3 | 100.0% | 1.61x | 9.1% | 63.8% | 61.4% |
| Ohio | 1 | 17,000,000 | 2.1 | 74.8% | 1.62x | 10.9% | 68.7% | 63.7% |
| Mississippi | 1 | 736,200 | 0.1 | 100.0% | 1.64x | 10.6% | 66.9% | 55.1% |
| Total / Weighted Average | 117 | $807,180,797 | 100.0% | 94.8% | 2.18x | 9.7% | 61.2% | 58.2% |
| (1) | Because this table represents information relating to the mortgaged properties and not mortgage loans, the information for the mortgage loans secured by more than one mortgaged property is based on allocated loan amounts. |
| (2) | In the case of Loan Nos. 1, 2, 3, 4, 5, 7, 9, 11, 14, 16, 17, 18, 20 and 26, the UW NCF DSCR, UW NOI Debt Yield, Cut-off Date LTV and Maturity Date LTV calculations include the related Pari Passu Companion Loan(s). In the case of Loan Nos. 1, 5, 7 and 16, the UW NCF DSCR, UW NOI Debt Yield, Cut-off Date LTV and Maturity Date LTV calculations exclude the related Subordinate Companion Loan(s) and/or related mezzanine loan(s). |
| (3) | With respect to Loan No. 7, the UW NCF DSCR is calculated using the sum of the first 12 whole loan principal and interest payments after the Cut-off Date based on the assumed principal and interest payment schedule set forth in Annex H of the Preliminary Prospectus. |
| (4) | In the case of Loan Nos. 3, 17 and 20, the Cut-off Date LTV and the Maturity Date LTV are calculated by using an appraised value based on certain hypothetical assumptions. Refer to “Description of the Mortgage Pool—Assessments of Property Value and Condition” and “—Appraised Value” in the Preliminary Prospectus for additional details. |
| THE INFORMATION IN THIS STRUCTURAL AND COLLATERAL TERM SHEET IS NOT COMPLETE AND MAY BE AMENDED PRIOR TO THE TIME OF SALE. THIS TERM SHEET IS NOT AN OFFER TO SELL THESE SECURITIES AND IT IS NOT A SOLICITATION OF AN OFFER TO BUY THESE SECURITIES IN ANY JURISDICTION WHERE THE OFFER OR SALE IS NOT PERMITTED. |
| |
| | 13 of 145 | |
| Structural and Collateral Term Sheet | | JPMDB 2019-COR6 |
| |
| Collateral Characteristics |
| Cut-off Date Principal Balance |
| | | | | Weighted Average |
Range of Cut-off Date
Principal Balances | Number of
Loans | Cut-off Date
Principal
Balance | % of
IPB | Mortgage
Rate | Remaining
Loan Term | UW
NCF
DSCR(1)(2) | UW NOI
Debt
Yield(1) | Cut-off
Date
LTV(1)(3) | Maturity
Date
LTV(1)(3) |
| $3,395,000 | - | $9,999,999 | 9 | $65,398,256 | 8.1% | 4.28717% | 114 | 1.93x | 10.5% | 62.0% | 57.8% |
| $10,000,000 | - | $19,999,999 | 5 | 80,860,479 | 10.0 | 4.61616% | 93 | 1.84x | 10.0% | 64.7% | 62.4% |
| $20,000,000 | - | $24,999,999 | 5 | 109,308,910 | 13.5 | 3.87262% | 117 | 2.08x | 9.5% | 55.4% | 50.5% |
| $25,000,000 | - | $49,999,999 | 9 | 319,113,153 | 39.5 | 4.07770% | 117 | 1.99x | 9.5% | 65.0% | 60.7% |
| $50,000,000 | - | $62,500,000 | 4 | 232,500,000 | 28.8 | 3.46669% | 119 | 2.68x | 9.8% | 57.1% | 57.1% |
| Total / Weighted Average: | 32 | $807,180,797 | 100.0% | 3.94484% | 115 | 2.18x | 9.7% | 61.2% | 58.2% |
| | | | | Weighted Average |
Range of
Mortgage Interest Rates | Number
of Loans | Cut-off Date
Principal
Balance | % of
IPB | Mortgage
Rate | Remaining
Loan Term | UW
NCF
DSCR(1)(2) | UW NOI
Debt
Yield(1) | Cut-off
Date
LTV(1)(3) | Maturity
Date
LTV(1)(3) |
| 3.00450% | - | 3.99999% | 16 | $490,150,000 | 60.7% | 3.53174% | 119 | 2.56x | 9.8% | 58.3% | 57.8% |
| 4.00000% | - | 4.49999% | 7 | 129,434,390 | 16.0 | 4.14426% | 109 | 1.70x | 10.1% | 63.6% | 53.9% |
| 4.50000% | - | 4.99999% | 6 | 111,643,256 | 13.8 | 4.58227% | 115 | 1.53x | 8.3% | 66.2% | 62.9% |
| 5.00000% | - | 5.39000% | 3 | 75,953,151 | 9.4 | 5.33398% | 100 | 1.51x | 10.4% | 68.4% | 61.5% |
| Total / Weighted Average: | 32 | $807,180,797 | 100.0% | 3.94484% | 115 | 2.18x | 9.7% | 61.2% | 58.2% |
| | | | | | | | | | | | |
| Original Term to Maturity in Months |
| | | | | Weighted Average |
Original Term to
Maturity in Months | Number of
Loans | Cut-off Date Principal
Balance | % of
IPB | Mortgage
Rate | Remaining
Loan Term | UW
NCF
DSCR(1)(2) | UW NOI
Debt
Yield(1) | Cut-off
Date LTV(1)(3) | Maturity
Date LTV(1)(3) |
| 60 | 3 | $35,375,479 | 4.4% | 4.71509% | 59 | 1.68x | 10.7% | 70.2% | 65.0% |
| 120 | 29 | 771,805,319 | 95.6 | 3.90954% | 117 | 2.20x | 9.7% | 60.7% | 57.9% |
| Total / Weighted Average: | 32 | $807,180,797 | 100.0% | 3.94484% | 115 | 2.18x | 9.7% | 61.2% | 58.2% |
| Remaining Term to Maturity in Months |
| | | | | Weighted Average |
Range of Remaining Term
to Maturity in Months | Number of
Loans | Cut-off Date
Principal
Balance | % of
IPB | Mortgage
Rate | Remaining
Loan Term | UW
NCF
DSCR(1)(2) | UW NOI
Debt
Yield(1) | Cut-off
Date LTV(1)(3) | Maturity
Date LTV(1)(3) |
| 59 | - | 84 | 3 | $35,375,479 | 4.4% | 4.71509% | 59 | 1.68x | 10.7% | 70.2% | 65.0% |
| 85 | - | 119 | 21 | 554,415,319 | 68.7 | 4.01454% | 116 | 1.96x | 8.9% | 61.8% | 58.9% |
| 120 | 8 | 217,390,000 | 26.9 | 3.64175% | 120 | 2.82x | 11.5% | 58.0% | 55.5% |
| Total / Weighted Average: | 32 | $807,180,797 | 100.0% | 3.94484% | 115 | 2.18x | 9.7% | 61.2% | 58.2% |
| | | | | | | | | | | | |
| (1) | In the case of Loan Nos. 1, 2, 3, 4, 5, 7, 9, 11, 14, 16, 17, 18, 20 and 26, the UW NCF DSCR, UW NOI Debt Yield, Cut-off Date LTV and Maturity Date LTV calculations include the related Pari Passu Companion Loan(s). In the case of Loan Nos. 1, 5, 7 and 16, the UW NCF DSCR, UW NOI Debt Yield, Cut-off Date LTV and Maturity Date LTV calculations exclude the related Subordinate Companion Loan(s) and/or related mezzanine loan(s). |
| (2) | With respect to Loan No. 7, the UW NCF DSCR is calculated using the sum of the first 12 whole loan principal and interest payments after the Cut-off Date based on the assumed principal and interest payment schedule set forth in Annex H of the Preliminary Prospectus. |
| (3) | In the case of Loan Nos. 3, 17 and 20, the Cut-off Date LTV and the Maturity Date LTV are calculated by using an appraised value based on certain hypothetical assumptions. Refer to “Description of the Mortgage Pool—Assessments of Property Value and Condition” and “—Appraised Value” in the Preliminary Prospectus for additional details. |
| THE INFORMATION IN THIS STRUCTURAL AND COLLATERAL TERM SHEET IS NOT COMPLETE AND MAY BE AMENDED PRIOR TO THE TIME OF SALE. THIS TERM SHEET IS NOT AN OFFER TO SELL THESE SECURITIES AND IT IS NOT A SOLICITATION OF AN OFFER TO BUY THESE SECURITIES IN ANY JURISDICTION WHERE THE OFFER OR SALE IS NOT PERMITTED. |
| |
| | 14 of 145 | |
| Structural and Collateral Term Sheet | | JPMDB 2019-COR6 |
| |
| Collateral Characteristics |
| Original Amortization Term in Months |
| | | | | Weighted Average |
Original
Amortization
Term in Months | Number
of Loans | Cut-off Date
Principal
Balance | % of
IPB | Mortgage
Rate | Remaining
Loan Term | UW
NCF
DSCR(1)(2) | UW NOI
Debt
Yield(1) | Cut-off
Date
LTV(1)(3) | Maturity
Date
LTV(1)(3) |
| Interest Only | 20 | $555,425,000 | 68.8% | 3.71279% | 117 | 2.48x | 9.6% | 58.7% | 58.7% |
| 300 | 1 | 4,000,000 | 0.5 | 3.80000% | 120 | 3.99x | 27.8% | 22.5% | 16.1% |
| 360 | 11 | 247,755,797 | 30.7 | 4.46742% | 109 | 1.47x | 9.6% | 67.2% | 57.8% |
| Total / Weighted Average: | 32 | $807,180,797 | 100.0% | 3.94484% | 115 | 2.18x | 9.7% | 61.2% | 58.2% |
| Remaining Amortization Term in Months |
| | | | | Weighted Average |
Range of Remaining
Amortization Term in Months | Number
of Loans | Cut-off Date
Principal
Balance | % of
IPB | Mortgage Rate | Remaining
Loan Term | UW
NCF
DSCR(1)(2) | UW NOI
Debt
Yield(1) | Cut-off
Date
LTV(1)(3) | Maturity
Date
LTV(1)(3) |
| Interest Only | 20 | $555,425,000 | 68.8% | 3.71279% | 117 | 2.48x | 9.6% | 58.7% | 58.7% |
| 300 | - | 359 | 6 | 130,015,797 | 16.1 | 4.54182% | 109 | 1.55x | 10.5% | 64.7% | 53.8% |
| 360 | 6 | 121,740,000 | 15.1 | 4.36602% | 111 | 1.47x | 9.3% | 68.5% | 60.8% |
| Total / Weighted Average: | 32 | $807,180,797 | 100.0% | 3.94484% | 115 | 2.18x | 9.7% | 61.2% | 58.2% |
| | | | | | | | | | | | |
| | | | | Weighted Average |
| Amortization Types | Number
of Loans | Cut-off Date
Principal
Balance | % of
IPB | Mortgage
Rate | Remaining
Loan Term | UW
NCF
DSCR(1)(2) | UW NOI
Debt
Yield(1) | Cut-off
Date
LTV(1)(3) | Maturity
Date
LTV(1)(3) |
| Interest Only | 20 | $555,425,000 | 68.8% | 3.71279% | 117 | 2.48x | 9.6% | 58.7% | 58.7% |
| Balloon | 8 | 171,515,797 | 21.2 | 4.55167% | 105 | 1.58x | 10.6% | 64.5% | 54.0% |
| IO-Balloon | 4 | 80,240,000 | 9.9 | 4.25405% | 118 | 1.36x | 8.5% | 70.9% | 64.0% |
| Total / Weighted Average: | 32 | $807,180,797 | 100.0% | 3.94484% | 115 | 2.18x | 9.7% | 61.2% | 58.2% |
| Underwritten Net Cash Flow Debt Service Coverage Ratios(1)(2) |
| | | | | Weighted Average |
Range of Underwritten Net
Cash Flow Debt Service
Coverage Ratios | Number
of Loans | Cut-off Date
Principal
Balance | % of
IPB | Mortgage
Rate | Remaining
Loan Term | UW
NCF
DSCR(1)(2) | UW NOI
Debt
Yield(1) | Cut-off
Date
LTV(1)(3) | Maturity
Date
LTV(1)(3) |
| 1.04x | - | 1.49x | 3 | $97,372,061 | 12.1% | 4.83881% | 116 | 1.29x | 8.9% | 67.9% | 58.9% |
| 1.50x | - | 1.74x | 10 | 178,813,736 | 22.2 | 4.37276% | 106 | 1.60x | 9.8% | 66.4% | 58.3% |
| 1.75x | - | 1.99x | 7 | 207,750,000 | 25.7 | 3.92996% | 117 | 1.82x | 7.5% | 62.1% | 62.1% |
| 2.00x | - | 2.24x | 1 | 9,100,000 | 1.1 | 3.90000% | 120 | 2.17x | 8.6% | 68.7% | 68.7% |
| 2.25x | - | 4.09x | 11 | 314,145,000 | 38.9 | 3.43532% | 118 | 3.03x | 11.4% | 55.3% | 55.2% |
| Total / Weighted Average: | 32 | $807,180,797 | 100.0% | 3.94484% | 115 | 2.18x | 9.7% | 61.2% | 58.2% |
| (1) | In the case of Loan Nos. 1, 2, 3, 4, 5, 7, 9, 11, 14, 16, 17, 18, 20 and 26, the UW NCF DSCR, UW NOI Debt Yield, Cut-off Date LTV and Maturity Date LTV calculations include the related Pari Passu Companion Loan(s). In the case of Loan Nos. 1, 5, 7 and 16, the UW NCF DSCR, UW NOI Debt Yield, Cut-off Date LTV and Maturity Date LTV calculations exclude the related Subordinate Companion Loan(s) and/or related mezzanine loan(s). |
| (2) | With respect to Loan No. 7, the UW NCF DSCR is calculated using the sum of the first 12 whole loan principal and interest payments after the Cut-off Date based on the assumed principal and interest payment schedule set forth in Annex H of the Preliminary Prospectus. |
| (3) | In the case of Loan Nos. 3, 17 and 20, the Cut-off Date LTV and the Maturity Date LTV are calculated by using an appraised value based on certain hypothetical assumptions. Refer to “Description of the Mortgage Pool—Assessments of Property Value and Condition” and “—Appraised Value” in the Preliminary Prospectus for additional details. |
| THE INFORMATION IN THIS STRUCTURAL AND COLLATERAL TERM SHEET IS NOT COMPLETE AND MAY BE AMENDED PRIOR TO THE TIME OF SALE. THIS TERM SHEET IS NOT AN OFFER TO SELL THESE SECURITIES AND IT IS NOT A SOLICITATION OF AN OFFER TO BUY THESE SECURITIES IN ANY JURISDICTION WHERE THE OFFER OR SALE IS NOT PERMITTED. |
| |
| | 15 of 145 | |
| Structural and Collateral Term Sheet | | JPMDB 2019-COR6 |
| |
| Collateral Characteristics |
| LTV Ratios as of the Cut-off Date(1)(3) |
| | | | | Weighted Average |
Range of
Cut-off Date LTVs | Number
of Loans | Cut-off Date
Principal
Balance | % of
IPB | Mortgage
Rate | Remaining
Loan Term | UW
NCF
DSCR(1)(2) | UW NOI
Debt
Yield(1) | Cut-off
Date
LTV(1)(3) | Maturity
Date
LTV(1)(3) |
| 22.5% | - | 39.9% | 2 | $66,500,000 | 8.2% | 3.05235% | 120 | 4.08x | 14.4% | 38.1% | 37.7% |
| 40.0% | - | 49.9% | 2 | 44,808,910 | 5.6 | 4.10024% | 115 | 1.89x | 9.3% | 47.4% | 42.4% |
| 50.0% | - | 59.9% | 7 | 171,603,256 | 21.3 | 3.78747% | 119 | 2.29x | 9.4% | 56.1% | 55.3% |
| 60.0% | - | 69.9% | 16 | 379,675,000 | 47.0 | 3.94604% | 114 | 2.11x | 9.4% | 64.6% | 62.8% |
| 70.0% | - | 78.6% | 5 | 144,593,631 | 17.9 | 4.49078% | 111 | 1.44x | 8.9% | 73.0% | 64.2% |
| Total / Weighted Average: | 32 | $807,180,797 | 100.0% | 3.94484% | 115 | 2.18x | 9.7% | 61.2% | 58.2% |
| LTV Ratios as of the Maturity Date(1)(3) |
| | | | | Weighted Average |
Range of
Maturity Date LTVs | Number
of Loans | Cut-off Date
Principal
Balance | % of
IPB | Mortgage
Rate | Remaining
Loan Term | UW
NCF
DSCR(1)(2) | UW NOI
Debt
Yield(1) | Cut-off
Date
LTV(1)(3) | Maturity
Date
LTV(1)(3) |
| 16.1% | - | 39.9% | 3 | $91,308,910 | 11.3% | 3.41579% | 118 | 3.36x | 12.9% | 40.9% | 38.1% |
| 40.0% | - | 49.9% | 3 | 53,953,256 | 6.7 | 4.01423% | 118 | 1.97x | 10.3% | 54.7% | 47.3% |
| 50.0% | - | 54.9% | 4 | 94,600,000 | 11.7 | 3.62164% | 119 | 2.69x | 10.6% | 53.8% | 53.3% |
| 55.0% | - | 59.9% | 4 | 113,200,001 | 14.0 | 4.00018% | 118 | 1.72x | 8.4% | 63.9% | 58.4% |
| 60.0% | - | 72.0% | 18 | 454,118,630 | 56.3 | 4.09651% | 112 | 1.98x | 9.1% | 66.8% | 64.6% |
| Total / Weighted Average: | 32 | $807,180,797 | 100.0% | 3.94484% | 115 | 2.18x | 9.7% | 61.2% | 58.2% |
| | | | | Weighted Average |
| Prepayment Protection | Number
of Loans | Cut-off Date
Principal
Balance | % of
IPB | Mortgage
Rate | Remaining
Loan Term | UW
NCF
DSCR(1)(2) | UW NOI
Debt
Yield(1) | Cut-off
Date
LTV(1)(3) | Maturity
Date
LTV(1)(3) |
| Defeasance | 26 | $570,577,646 | 70.7% | 3.99512% | 114 | 1.91x | 9.0% | 62.9% | 59.5% |
| Yield Maintenance | 5 | 174,103,151 | 21.6 | 4.11763% | 117 | 2.38x | 10.6% | 63.4% | 60.8% |
| YM, then Defeasance or YM | 1 | 62,500,000 | 7.7 | 3.00450% | 120 | 4.09x | 13.5% | 39.1% | 39.1% |
| Total / Weighted Average: | 32 | $807,180,797 | 100.0% | 3.94484% | 115 | 2.18x | 9.7% | 61.2% | 58.2% |
| | | | | | | | | | |
| | | | | Weighted Average |
| Loan Purpose | Number
of Loans | Cut-off Date
Principal
Balance | % of
IPB | Mortgage
Rate | Remaining
Loan Term | UW
NCF
DSCR(1)(2) | UW NOI
Debt
Yield(1) | Cut-off
Date
LTV(1)(3) | Maturity
Date
LTV(1)(3) |
| Refinance | 19 | $507,482,167 | 62.9% | 3.98604% | 115 | 2.07x | 9.4% | 59.2% | 55.7% |
| Acquisition | 12 | 279,698,630 | 34.7 | 3.91406% | 114 | 2.31x | 10.1% | 65.4% | 63.3% |
| Recapitalization | 1 | 20,000,000 | 2.5 | 3.33000% | 119 | 3.07x | 11.0% | 52.1% | 52.1% |
| Total / Weighted Average: | 32 | $807,180,797 | 100.0% | 3.94484% | 115 | 2.18x | 9.7% | 61.2% | 58.2% |
| (1) | In the case of Loan Nos. 1, 2, 3, 4, 5, 7, 9, 11, 14, 16, 17, 18, 20 and 26, the UW NCF DSCR, UW NOI Debt Yield, Cut-off Date LTV and Maturity Date LTV calculations include the related Pari Passu Companion Loan(s). In the case of Loan Nos. 1, 5, 7 and 16, the UW NCF DSCR, UW NOI Debt Yield, Cut-off Date LTV and Maturity Date LTV calculations exclude the related Subordinate Companion Loan(s) and/or related mezzanine loan(s). |
| (2) | With respect to Loan No. 7, the UW NCF DSCR is calculated using the sum of the first 12 whole loan principal and interest payments after the Cut-off Date based on the assumed principal and interest payment schedule set forth in Annex H of the Preliminary Prospectus. |
| (3) | In the case of Loan Nos. 3, 17 and 20, the Cut-off Date LTV and the Maturity Date LTV are calculated by using an appraised value based on certain hypothetical assumptions. Refer to “Description of the Mortgage Pool—Assessments of Property Value and Condition” and “—Appraised Value” in the Preliminary Prospectus for additional details. |
| THE INFORMATION IN THIS STRUCTURAL AND COLLATERAL TERM SHEET IS NOT COMPLETE AND MAY BE AMENDED PRIOR TO THE TIME OF SALE. THIS TERM SHEET IS NOT AN OFFER TO SELL THESE SECURITIES AND IT IS NOT A SOLICITATION OF AN OFFER TO BUY THESE SECURITIES IN ANY JURISDICTION WHERE THE OFFER OR SALE IS NOT PERMITTED. |
| |
| | 16 of 145 | |
| Structural and Collateral Term Sheet | | JPMDB 2019-COR6 |
| |
| Collateral Characteristics |
| Previous Securitization History(1) |
| No. | Property Name | Cut-off Date Principal
Balance | % of IPB | Location | Property
Type | Previous
Securitization |
| 1 | Century Plaza Towers | $62,500,000 | 7.7% | Los Angeles, CA | Office | MSC 2014-CPT |
| 10 | Jersey City Group 2 | $32,840,000 | 4.1% | Jersey City, NJ | Multifamily | TRTX 2018-FL1 |
| 12 | Union Heights | $29,600,000 | 3.7% | Sandy, UT | Office | GSMS 2012-GCJ7 |
| 31 | Opus Seaway | $4,000,000 | 0.5% | Everett, WA | Industrial | COMM 2015-PC1 |
| (1) | The table above represents the properties for which the previously existing debt was securitized, based on information provided by the related borrower or obtained through searches of a third-party database. |
| THE INFORMATION IN THIS STRUCTURAL AND COLLATERAL TERM SHEET IS NOT COMPLETE AND MAY BE AMENDED PRIOR TO THE TIME OF SALE. THIS TERM SHEET IS NOT AN OFFER TO SELL THESE SECURITIES AND IT IS NOT A SOLICITATION OF AN OFFER TO BUY THESE SECURITIES IN ANY JURISDICTION WHERE THE OFFER OR SALE IS NOT PERMITTED. |
| |
| | 17 of 145 | |
| Structural and Collateral Term Sheet | | JPMDB 2019-COR6 |
| |
| Class A-2(1) |
No. | Loan Name | Location | Cut-off Date
Balance | % of IPB | Maturity Date Balance | % of Certificate Class(2) | Original Loan Term | Remaining Loan Term | UW NCF DSCR(1) | UW NOI
Debt
Yield(1) | Cut-off
Date
LTV(1) | Maturity Date
LTV(1) |
| 20 | Hilton Cincinnati Netherland Plaza | Cincinnati, OH | $17,000,000 | 2.1% | $15,761,725 | 47.6% | 60 | 60 | 1.62x | 10.9% | 68.7% | 63.7% |
| 22 | Prospect Park | Rancho Cordova, CA | 14,980,479 | 1.9 | 13,637,903 | 41.2% | 60 | 59 | 1.55x | 10.4% | 72.4% | 65.9% |
| 32 | Prince Creek Village Center | Murrells Inlet, SC | 3,395,000 | 0.4 | 3,395,000 | 10.3% | 60 | 59 | 2.52x | 11.5% | 67.9% | 67.9% |
| Total / Weighted Average: | | $35,375,479 | 4.4% | $32,794,628 | 99.1% | 60 | 59 | 1.68x | 10.7% | 70.2% | 65.0% |
| (1) | The table above presents the mortgage loans whose balloon payments would be applied to pay down the certificate balance of the Class A-2 Certificates, assuming a 0% CPR and applying the “Modeling Assumptions” described in the Preliminary Prospectus, including the assumptions that (i) none of the mortgage loans in the pool experience prepayments, defaults or losses; (ii) there are no extensions of maturity dates of any mortgage loans in the pool; and (iii) each mortgage loan in the pool is paid in full on its stated maturity date. Each Class of Certificates, including the Class A-2 Certificates, evidences undivided ownership interests in the entire pool of mortgage loans. Debt service coverage ratio, debt yield and loan-to-value ratio information does not take into account subordinate debt (whether or not secured by the mortgaged property), if any, that exists or is allowed under the terms of any mortgage loan. See Annex A-1 to the Preliminary Prospectus. |
| (2) | Reflects the percentage equal to the Maturity Date Balance divided by the initial Class A-2 Certificate Balance. |
| (3) | In the case of Loan No. 20, the UW NCF DSCR, UW NOI Debt Yield, Cut-off Date LTV and Maturity Date LTV calculations include the related Pari Passu Companion Loans. |
| THE INFORMATION IN THIS STRUCTURAL AND COLLATERAL TERM SHEET IS NOT COMPLETE AND MAY BE AMENDED PRIOR TO THE TIME OF SALE. THIS TERM SHEET IS NOT AN OFFER TO SELL THESE SECURITIES AND IT IS NOT A SOLICITATION OF AN OFFER TO BUY THESE SECURITIES IN ANY JURISDICTION WHERE THE OFFER OR SALE IS NOT PERMITTED. |
| |
| | 18 of 145 | |
| Structural and Collateral Term Sheet | | JPMDB 2019-COR6 |
| |
| Structural Overview |
| ■ Accrual: | | Each Class of Certificates (other than the Class R Certificates) will accrue interest on a 30/360 basis. The Class R Certificates will not accrue interest. |
| ■ Distribution of Interest: | | On each Distribution Date, accrued interest for each Class of Certificates (other than the Class R) at the applicable pass-through rate will be distributed in the following order of priority to the extent of Available Funds: first, to the Class A-1, Class A-2, Class A-3, Class A-4, Class A-SB, Class X-A, Class X-B, Class X-D and Class X-F Certificates (the “Senior Certificates”), on apro rata basis, based on the interest entitlement for each such Class on such date, and then to the Class A-S, Class B, Class C, Class D, Class E, Class F, Class G-RR, Class H-RR and Class NR-RR Certificates, in that order, in each case until the interest entitlement for such date payable to each such Class is paid in full. The pass-through rate applicable to the Class A-1, Class A-2, Class A-3, Class A-4, Class A-SB, Class A-S, Class B, Class C, Class D, Class E, Class F, Class G-RR, Class H-RR and Class NR-RR Certificates on each Distribution Date, will be aper annum rate equal to one of (i) a fixed rate, (ii) the weighted average of the net mortgage rates on the mortgage loans (in each case adjusted, if necessary, to accrue on the basis of a 360-day year consisting of twelve 30-day months), (iii) the lesser of a specified fixed rate and the rate described in clause (ii) above, or (iv) the rate described in clause (ii) above less a specified percentage. The pass-through rate for the Class X-A Certificates for any Distribution Date will be aper annum rate equal to the excess, if any, of (a) the weighted average of the net mortgage rates on the mortgage loans (in each case adjusted, if necessary, to accrue on the basis of a 360-day year consisting of twelve 30-day months), over (b) the weighted average of the pass-through rates on the Class A-1, Class A-2, Class A-3, Class A-4, Class A-SB and Class A-S Certificates for the related Distribution Date, weighted on the basis of their respective Certificate Balances outstanding immediately prior to that Distribution Date. The pass-through rate for the Class X-B Certificates for any Distribution Date will be aper annum rate equal to the excess, if any, of (a) the weighted average of the net mortgage rates on the mortgage loans (in each case adjusted, if necessary, to accrue on the basis of a 360-day year consisting of twelve 30-day months), over (b) the weighted average of the pass-through rates on the Class B and Class C certificates for the related Distribution Date, weighted on the basis of their respective certificate balances outstanding immediately prior to that Distribution Date. The pass-through rate for the Class X-D Certificates for any Distribution Date will be aper annum rate equal to the excess, if any, of (a) the weighted average of the net mortgage rates on the mortgage loans (in each case adjusted, if necessary, to accrue on the basis of a 360-day year consisting of twelve 30-day months), over (b) the weighted average of the pass-through rates on the Class D and Class E Certificates for the related Distribution Date, weighted on the basis of their respective certificate balances outstanding immediately prior to that Distribution Date. The pass-through rate for the Class X-F Certificates for any Distribution Date will be aper annum rate equal to the excess, if any, of (a) the weighted average of the net mortgage rates on the mortgage loans (in each case adjusted, if necessary, to accrue on the basis of a 360-day year consisting of twelve 30-day months), over (b) the pass-through rate on the Class F Certificates for the related Distribution Date. See “Description of the Certificates—Distributions” in the Preliminary Prospectus. |
| ■ Distribution of Principal: | | On any Distribution Date prior to the Cross-Over Date, payments in respect of principal will be distributed, up to the Available Funds: first, to the Class A-SB Certificates until the Certificate Balance of the Class A-SB Certificates is reduced to the Class A-SB planned principal balance for the related Distribution Date set forth in Annex G to the Preliminary Prospectus,second, to the Class A-1 Certificates, until the Certificate Balance of such Class is reduced to zero,third, to the Class A-2 Certificates, until the Certificate Balance of such Class is reduced to zero,fourth, to the Class A-3 Certificates, until the Certificate Balance of such Class is reduced to zero,fifth, to the Class A-4 Certificates, until the Certificate Balance of such Class is reduced to zero,sixth, to the Class A-SB Certificates, until the Certificate Balance of such Class is reduced to zero and then to the Class A-S, Class B, Class C, Class D, Class E, Class F, Class G-RR, Class H-RR and Class NR-RR Certificates, in that order, until the Certificate Balance of each such Class is reduced to zero. On any Distribution Date on or after the Cross-Over Date, payments in respect of principal will be distributed, up to the Available Funds, to the Class A-1, Class A-2, Class A-3, Class A-4 and |
| THE INFORMATION IN THIS STRUCTURAL AND COLLATERAL TERM SHEET IS NOT COMPLETE AND MAY BE AMENDED PRIOR TO THE TIME OF SALE. THIS TERM SHEET IS NOT AN OFFER TO SELL THESE SECURITIES AND IT IS NOT A SOLICITATION OF AN OFFER TO BUY THESE SECURITIES IN ANY JURISDICTION WHERE THE OFFER OR SALE IS NOT PERMITTED. |
| |
| | 19 of 145 | |
| Structural and Collateral Term Sheet | | JPMDB 2019-COR6 |
| |
| Structural Overview |
| | Class A-SB Certificates,pro rata based on the Certificate Balance of each such Class until the Certificate Balance of each such Class is reduced to zero. The “Cross-Over Date” means the Distribution Date on which the aggregate Certificate Balances of the Class A-S, Class B, Class C, Class D, Class E, Class F, Class G-RR, Class H-RR and Class NR-RR Certificates have been reduced to zero as a result of the allocation of realized losses to such Classes. The Class X-A, Class X-B, Class X-D and Class X-F Certificates (the “Class X Certificates”) will not be entitled to receive distributions of principal; however, the notional amount of the Class X-A Certificates will be reduced by the aggregate amount of principal distributions, realized losses and trust fund expenses, if any, allocated to the Class A-1, Class A-2, Class A-3, Class A-4, Class A-SB and Class A-S Certificates, the notional amount of the Class X-B Certificates will be reduced by the aggregate amount of principal distributions, realized losses and trust fund expenses, if any, allocated to the Class B and Class C Certificates, the notional amount of the Class X-D Certificates will be reduced by the aggregate amount of principal distributions, realized losses and trust fund expenses, if any, allocated to the Class D and Class E Certificates and the notional amount of the Class X-F Certificates will be reduced by the aggregate amount of principal distributions, released losses and trust fund expenses, if any, allocated to the Class F Certificates. See “Description of the Certificates—Distributions” in the Preliminary Prospectus. |
| ■ Yield Maintenance / Fixed Penalty Allocation: | | For purposes of the distribution of Yield Maintenance Charges on any Distribution Date any Yield Maintenance Charges collected in respect of the mortgage loans will be allocated pro rata among five groups (based on the aggregate amount of principal distributed to the Principal Balance Certificates in each group), consisting of (a) the Class A-1, Class A-2, Class A-3, Class A-4, Class A-SB, Class A-S and Class X-A Certificates (“YM Group A”), (b) the Class B, Class C and Class X-B Certificates (“YM Group B”), (c) the Class X-D, Class D and Class E Certificates (“YM Group D”), (d) the Class X-F and Class F Certificates (“YM Group F”) and (e) the Class G-RR, Class H-RR and Class NR-RR Certificates (“YM Group RR”). As among the Classes of Certificates in each YM Group, other than the YM Group RR, each Class of Certificates entitled to distributions of principal will receive an amount calculated generally in accordance with the following formula and as more specifically described in the Preliminary Prospectus, with any remaining Yield Maintenance Charges on such Distribution Date being distributed to the class of Class X Certificates in such YM Group. |
| YM Charge | X | Principal Paid to Class | X | (Pass-Through Rate on Class – Discount Rate) |
| Total Principal Paid to the related YM Group | (Mortgage Rate on Loan – Discount Rate) |
| | | As among the Classes of Certificates in the YM Group RR, each Class of Certificates in such YM Group entitled to distributions of principal will receive an amount calculated generally in accordance with the following formula and as more specifically described in the Preliminary Prospectus. |
| | YM Charge | X | Principal Paid to Class | | |
| | Total Principal Paid to the related YM Group | |
| | | No Yield Maintenance Charges will be distributed to the Class R Certificates. |
| ■ Realized Losses: | | On each Distribution Date, losses on the mortgage loans will be allocated first to the Class NR-RR, Class H-RR, Class G-RR, Class F, Class E, Class D, Class C, Class B and Class A-S Certificates, in that order, in each case until the Certificate Balance of all such Classes have been reduced to zero, and then, to the Class A-1, Class A-2, Class A-3, Class A-4 and Class A-SB Certificates,pro rata, based on the Certificate Balance of each such Class, until the Certificate Balance of each such Class has been reduced to zero. The notional amounts of the Class X-A, Class X-B, Class X-D and Class X-F Certificates will be reduced by the aggregate amount of realized losses allocated to Certificates that are components of the notional amounts of the Class X-A, Class X-B, Class X-D and Class X-F Certificates, respectively. Losses on each Whole Loan will be allocated first, to any related subordinate companion loan(s) until reduced to zero and then to the related mortgage loan and any relatedpari passu companion loans,pro rata, based on their respective principal balances. |
| THE INFORMATION IN THIS STRUCTURAL AND COLLATERAL TERM SHEET IS NOT COMPLETE AND MAY BE AMENDED PRIOR TO THE TIME OF SALE. THIS TERM SHEET IS NOT AN OFFER TO SELL THESE SECURITIES AND IT IS NOT A SOLICITATION OF AN OFFER TO BUY THESE SECURITIES IN ANY JURISDICTION WHERE THE OFFER OR SALE IS NOT PERMITTED. |
| |
| | 20 of 145 | |
| Structural and Collateral Term Sheet | | JPMDB 2019-COR6 |
| |
| Structural Overview |
| | | See “Description of the Certificates—Subordination; Allocation of Realized Losses” in the Preliminary Prospectus. |
| ■ Interest Shortfalls: | | A shortfall with respect to the amount of available funds distributable in respect of interest can result from, among other sources: (a) delinquencies and defaults by borrowers; (b) shortfalls resulting from the application of appraisal reductions to reduce P&I Advances; (c) shortfalls resulting from interest on Advances made by the Master Servicer, the Special Servicer or the Trustee; (d) shortfalls resulting from the payment of Special Servicing Fees and other additional compensation that the Special Servicer is entitled to receive; (e) shortfalls resulting from extraordinary expenses of the trust, including indemnification payments payable to the Depositor, the Master Servicer, the Special Servicer, the Certificate Administrator, the Trustee, the Operating Advisor and the Asset Representations Reviewer; (f) shortfalls resulting from a modification of a mortgage loan’s interest rate or principal balance; and (g) shortfalls resulting from other unanticipated or default-related expenses of the trust. Any such shortfalls that decrease the amount of available funds distributable in respect of interest to the Certificateholders will reduce distributions to the classes of Certificates (other than the Class R Certificates) beginning with those with the lowest payment priorities, in reverse sequential order. See “Description of the Certificates—Distributions—Priority of Distributions” in the Preliminary Prospectus. |
| ■ Appraisal Reduction Amounts: | | With respect to mortgage loans serviced under the Pooling and Servicing Agreement, upon the occurrence of certain trigger events with respect to a mortgage loan, which are generally tied to certain events of default under the related mortgage loan documents, the Special Servicer will be obligated to obtain an appraisal of the related mortgaged property and the Master Servicer will calculate the Appraisal Reduction Amount. The “Appraisal Reduction Amount” is generally the amount by which the current principal balance of the related mortgage loan or serviced whole loan, plus outstanding advances, real estate taxes, unpaid servicing fees and certain similar amounts exceeds the sum of (a) 90% of the appraised value of the related mortgaged property, (b) the amount of any escrows, letters of credit and reserves and (c) all insurance and casualty proceeds and condemnation awards that are collateral for the related mortgage loan. With respect to the Non-Serviced Whole Loans, any Appraisal Reduction Amount will be similarly determined pursuant to the related trust and servicing agreement or pooling and servicing agreement, as applicable, under which it is serviced. In general, the Appraisal Reduction Amount that is allocated to a mortgage loan is notionally allocated to reduce, in reverse sequential order, the Certificate Balance of each Class of Certificates (other than the Class A-1, Class A-2, Class A-3, Class A-4 and Class A-SB) beginning with the Class NR-RR Certificates for certain purposes, including certain voting rights, the determination of the controlling class and the determination of an Operating Advisor Consultation Event. As a result of calculating one or more Appraisal Reduction Amounts (and, in the case of any Whole Loan, to the extent allocated to the related mortgage loan), the amount of any required P&I Advance will be reduced, which will have the effect of reducing the amount of interest available to the most subordinate class of certificates then-outstanding (i.e.,first, to Class NR-RR Certificates;second, to the Class H-RR Certificates;third, to the Class G-RR Certificates;fourth,to the Class F Certificates;fifth, to the Class E Certificates;sixth, to the Class D Certificates,seventh, to the Class C Certificates,eighth, to the Class B Certificates,ninth, to the Class A-S Certificates and finally,pro rata based on their respective interest entitlements, to the Senior Certificates). With respect to each Serviced Whole Loan, the Appraisal Reduction Amount is notionally allocated,first, to any related serviced subordinate companion loan(s),then pro rata, between the related mortgage loan and any related servicedpari passu companion loan(s), based upon their respective principal balances. |
| ■ Appraisal Reduced Interest: | | Accrued and unpaid interest at the related Mortgage Rate for a mortgage loan that is not advanced by the Master Servicer or the Trustee as backup master servicer due to the application of Appraisal Reduction Amounts to such mortgage loan. |
| ■ Master Servicer Advances: | | The Master Servicer will be required to advance certain delinquent scheduled mortgage loan payments of principal and interest and certain property protection advances, in each case, to the extent the Master Servicer deems such advances to be recoverable. At any time that an Appraisal Reduction Amount exists, the amount that would otherwise be required to be advanced by the Master Servicer in respect of delinquent payments of interest on any mortgage loan will be reduced to equal the product of (x) the interest portion of the amount that would be advanced |
| THE INFORMATION IN THIS STRUCTURAL AND COLLATERAL TERM SHEET IS NOT COMPLETE AND MAY BE AMENDED PRIOR TO THE TIME OF SALE. THIS TERM SHEET IS NOT AN OFFER TO SELL THESE SECURITIES AND IT IS NOT A SOLICITATION OF AN OFFER TO BUY THESE SECURITIES IN ANY JURISDICTION WHERE THE OFFER OR SALE IS NOT PERMITTED. |
| |
| | 21 of 145 | |
| Structural and Collateral Term Sheet | | JPMDB 2019-COR6 |
| |
| Structural Overview |
| | | without regard to any Appraisal Reduction Amount and (y) a fraction, the numerator of which is the then-outstanding principal balance of the mortgage loan minus the Appraisal Reduction Amount and the denominator of which is the then-outstanding principal balance of the mortgage loan. The Master Servicer will not make any principal or interest advances with respect to any companion loan. |
| ■ Whole Loans: | | 14 mortgage loans are each evidenced by one mortgage loan and one or more companion loans (each a “Companion Loan” and collectively with the related mortgage loan, a “Whole Loan”), secured by the same mortgage(s) on the related mortgaged property(ies). Each such mortgage loan and its related Companion Loan(s) are subject to an intercreditor agreement. None of these Companion Loans will be part of the trust. In the case of all of the Whole Loans, referred to as the “Century Plaza Towers Whole Loan”, the “Los Angeles Leased Fee Portfolio”, the “Innovation Park Whole Loan”, the “12555 & 12655 Jefferson Whole Loan”, the “Hyde Park Multifamily Portfolio Whole Loan”, the “Hampton Roads Office Portfolio Whole Loan”, the “Sunset North Whole Loan”, the “Belvedere Place Whole Loan”, the “Brooklyn Renaissance Plaza Whole Loan”, the “Grand Canal Shoppes Whole Loan”, the “600 & 620 National Avenue Whole Loan”, the “Tysons Tower Whole Loan”, the “Hilton Cincinnati Netherland Plaza Whole Loan” and the “NOV Headquarters Whole Loan”, one or more related Companion Loans arepari passu with the related mortgage loan (these Companion Loans are also referred to as the “Pari Passu Companion Loans”). In the case of each of the Century Plaza Towers Whole Loan and the Grand Canal Shoppes Whole Loan, one or more related Companion Loans are subordinate in right of payment to the related mortgage loan and any related Pari Passu Companion Loans (these Companion Loans are also referred to as the “Subordinate Companion Loans”). The Century Plaza Towers Whole Loan, the Innovation Park Whole Loan, the Hyde Park Multifamily Portfolio Whole Loan, the Hampton Roads Office Portfolio Whole Loan the Sunset North Whole, the Brooklyn Renaissance Plaza Whole Loan, the Grand Canal Shoppes Whole Loan, the 600 & 620 National Avenue Whole Loan, the Tysons Tower Whole Loan, the Hilton Cincinnati Netherland Plaza Whole Loan and the NOV Headquarters Whole Loan (each a “Non-Serviced Whole Loan”), are being serviced and administered pursuant to the applicable trust and servicing agreement or pooling and servicing agreement as described under “Description of the Mortgage Pool—The Whole Loans—The Non-Serviced Pari Passu Whole Loans”, “—The Non-Serviced AB Whole Loans” and “Pooling and Servicing Agreement—Servicing of the Non-Serviced Mortgage Loans” in the Preliminary Prospectus. |
| ■ Highlighted Servicing Provisions: | | The following are certain servicing provisions of note: A mortgage loan may become a specially serviced loan as a result of an imminent or reasonably foreseeable default only if the Master Servicer determines such default is not likely to be cured by the related borrower within 60 days. However, if the Special Servicer believes an imminent default exists and the Master Servicer does not transfer the mortgage loan to special servicing, it is entitled to request the Master Servicer deliver an explanation in the form of an officer’s certificate to the Depositor and the Special Servicer setting forth its determination and the related reasoning. A mortgage loan will not become a specially serviced loan for up to 120 days in circumstances where the related borrower does not make its balloon payment at maturity upon satisfaction of certain conditions, including that the borrower has, prior to such maturity date, provided documentation from an acceptable lender, including, without limitation, an executed term sheet or refinancing commitment or an executed purchase and sale agreement, in each case, that is consistent with CMBS market practices and is reasonably satisfactory in form and substance to the Master Servicer evidencing an expected refinancing of the mortgage loan or sale of the related mortgaged property. In order to streamline the servicing and administration of the mortgage loans with the goal of reducing the amount of time a CMBS borrower has to wait for certain approvals from the lender, “major decisions” will be administered solely by the Special Servicer, thereby reducing the number of parties involved in the approval process. Under these updated terms, the Special Servicer will be directly responsible for obtaining the consent of the Directing Certificateholder for “major decisions” involving all mortgage loans, rather than requiring the Master Servicer’s involvement in the approval process for Non-Specially Serviced Loans. In prior CMBS transactions, the master servicer would commonly prepare a recommendation related to a particular approval and be required to obtain the consent of the special servicer (who, in turn, |
| THE INFORMATION IN THIS STRUCTURAL AND COLLATERAL TERM SHEET IS NOT COMPLETE AND MAY BE AMENDED PRIOR TO THE TIME OF SALE. THIS TERM SHEET IS NOT AN OFFER TO SELL THESE SECURITIES AND IT IS NOT A SOLICITATION OF AN OFFER TO BUY THESE SECURITIES IN ANY JURISDICTION WHERE THE OFFER OR SALE IS NOT PERMITTED. |
| |
| | 22 of 145 | |
| Structural and Collateral Term Sheet | | JPMDB 2019-COR6 |
| |
| Structural Overview |
| | would commonly be required to obtain the consent of the Directing Certificateholder before providing its consent to the master servicer) prior to taking any action with respect to that “major decision”. In addition, certain revisions have been incorporated in the scope of the “major decisions” in the Preliminary Prospectus, that limit the involvement of the Directing Certificateholder in (1) the replacement of the related property management company, (2) the approval of releases of certain performance escrows and earnouts, and (3) the consent to modifications of any mezzanine intercreditor agreement in circumstances when the Directing Certificateholder is affiliated with the mezzanine lender. The Certificate Administrator will be required to identify the then-current Directing Certificateholder as part of its monthly distribution date statement. See“Description of the Certificates” and“Pooling and Servicing Agreement” in the Preliminary Prospectus. |
| ■ Liquidated Loan Waterfall: | | On liquidation of any mortgage loan, all net liquidation proceeds related to the mortgage loan (but not any related Companion Loan) will be applied so that amounts allocated as a recovery of accrued and unpaid interest will not, in the first instance, include any delinquent interest that was not advanced as a result of Appraisal Reduction Amounts or interest that accrued on any junior note(s) if such mortgage loan is an AB Modified Loan. After the adjusted interest amount is so allocated, any remaining liquidation proceeds will be allocated to offset certain advances and to pay principal on the mortgage loan until the unpaid principal amount of the mortgage loan has been reduced to zero. Any remaining liquidation proceeds will then be allocated to pay delinquent interest that was not advanced as a result of Appraisal Reduction Amounts and any interest that accrued on any junior note(s) if such mortgage loan is an AB Modified Loan. Any liquidation proceeds in respect of each such mortgage loan in excess of the related outstanding balance willfirst be applied to offset any interest shortfalls allocated to the Certificates (other than the Class R Certificates), in sequential order, andthen to offset any realized losses allocated to the Certificates (other than the Class R Certificates), in sequential order. Any liquidation proceeds remaining after such applications will be distributed to the Class R Certificates. |
| ■ Sale of Defaulted Loans and REO Properties: | | The Special Servicer is required to solicit offers for any defaulted loan (other than a non-serviced mortgage loan) in such a manner as will be reasonably likely to maximize the value of the defaulted loan on a net present value basis, if the Special Servicer determines that no satisfactory arrangements can be made for collection of delinquent payments and the sale would be in the best economic interests of the certificateholders (or, in the case of any Serviced Whole Loan, the certificateholders and any holders of the related Serviced Companion Loans, as a collective whole, taking into account thepari passu or subordinate nature of such Serviced Companion Loans), on a net present value basis. Additionally, the Special Servicer may offer to sell any REO property if, and when, the Special Servicer determines that such a sale would be in the best economic interest of the issuing entity and the holders of any related Companion Loans, on a net present value basis. In the case of each non-serviced mortgage loan, under certain circumstances permitted under the related intercreditor agreement, to the extent that such non-serviced mortgage loan is not sold together with the related non-serviced companion loan by the special servicer for the related Non-Serviced Whole Loans, the Special Servicer will be entitled to sell (with respect to any mortgage loan other than an Excluded Loan, with the consent of the Directing Certificateholder if no Control Termination Event has occurred and is continuing) such non-serviced mortgage loan if it determines in accordance with the servicing standard that such action would be in the best interests of the certificateholders and the special servicer will be entitled to a liquidation fee to the same extent that the special servicer would be entitled to such liquidation fee had such non-serviced mortgage loan been a serviced mortgage loan. The Special Servicer is required to accept a cash offer received from any person for any defaulted loan or REO property in an amount at least equal to par plus accrued interest plus all other outstanding amounts due under such mortgage loan and any outstanding expenses of the trust relating to such mortgage loan (the “Purchase Price”) except as described in the Preliminary Prospectus. With respect to the Serviced Whole Loans, any such sale of the related defaulted loan is required to also include the related Companion Loans, if any, and the prices will be adjusted accordingly. |
| THE INFORMATION IN THIS STRUCTURAL AND COLLATERAL TERM SHEET IS NOT COMPLETE AND MAY BE AMENDED PRIOR TO THE TIME OF SALE. THIS TERM SHEET IS NOT AN OFFER TO SELL THESE SECURITIES AND IT IS NOT A SOLICITATION OF AN OFFER TO BUY THESE SECURITIES IN ANY JURISDICTION WHERE THE OFFER OR SALE IS NOT PERMITTED. |
| |
| | 23 of 145 | |
| Structural and Collateral Term Sheet | | JPMDB 2019-COR6 |
| |
| Structural Overview |
| | Within 30 days of a defaulted loan becoming a specially serviced loan, the Special Servicer is required to order an appraisal and, within 30 days of receipt of such appraisal, is required to determine the fair value of such defaulted loan in accordance with the applicable servicing standard. If, however, the Special Servicer is already in the process of obtaining an appraisal with respect to the related mortgaged property, the Special Servicer is required to make its fair value determination as soon as reasonably practicable (but in any event within 30 days) after its receipt of such appraisal. Additionally, with respect to the mortgage loans that have mezzanine debt or permit mezzanine debt in the future, the mezzanine lenders may have the option to purchase the related mortgage loan after certain events of default under such mortgage loan. The Directing Certificateholder will not have a right of first refusal to purchase a defaulted loan. If the Special Servicer does not receive a cash offer at least equal to the Purchase Price, the Special Servicer may purchase the defaulted loan or REO property at the Purchase Price. If the Special Servicer does not purchase the defaulted loan or REO property at the Purchase Price, the Special Servicer is required to accept the highest offer received from any person that is determined to be a fair price (supported by an appraisal required to be obtained by the Special Servicer within 30 days of a mortgage loan becoming a specially serviced loan) for such defaulted loan or REO property, if the highest offeror is a person other than an Interested Person. If the highest offer is made by an Interested Person, the Trustee will determine (based upon the most recent appraisal or updated appraisal conducted in accordance with the terms of the Pooling and Servicing Agreement) whether the offer constitutes a fair price for the defaulted loan or REO property provided that no offer from an Interested Person will constitute a fair price unless (A) it is the highest offer received and (B) if the offer is less than the applicable Purchase Price, at least two other offers are received from independent third parties and the Trustee may conclusively rely on the opinion of an independent appraiser or other independent expert retained by the Trustee in connection with making such determination. Neither the Trustee nor any of its affiliates may make an offer for or purchase any specially serviced loan or REO property. An “Interested Person” is any person that is (i) a party to the Pooling and Servicing Agreement, the Directing Certificateholder, any sponsor, any Borrower Party, any independent contractor engaged by the Special Servicer, any holder of a mezzanine loan (but only with respect to the related mortgage loan) or any known affiliate of any such person or, (ii) with respect to a defaulted whole loan, the depositor, the master servicer, the special servicer (or independent contractor engaged by such special servicer) or the trustee for any securitization that includes a related Companion Loan and each holder of any related Companion Loan, or any known affiliate of any such person. The Special Servicer is not required to accept the highest offer for a defaulted loan or REO property if the Special Servicer determines, in accordance with the servicing standard (and subject to the requirements of any related intercreditor agreement), that a rejection of such offer would be in the best interests of the Certificateholders and, with respect to any Serviced Whole Loan, the holder of the related Companion Loans, as a collective whole, as if such Certificateholders and, if applicable, the related Companion Loan Holder(s) constituted a single lender), and may accept a lower offer (so long as such lower offer was not made by the Special Servicer or any of its affiliates) if it determines that acceptance of such lower offer would be in the best interests of the Certificateholders and, with respect to any Serviced Whole Loan, the holder of the related Companion Loans, as a collective whole, as if such Certificateholders and, if applicable, the related Companion Loan Holder(s) constituted a single lender). If title to any mortgaged property is acquired by the trust fund, the Special Servicer will be required to sell such mortgaged property prior to the close of the third calendar year beginning after the year of acquisition, unless (a) the IRS grants or has not denied an extension of time to sell such mortgaged property or (b) the Special Servicer, Trustee and the Certificate Administrator receive an opinion of independent counsel to the effect that the holding of the property by the trust longer than the above-referenced three-year period will not result in the imposition of a tax on any REMIC of the trust fund or cause any REMIC of the trust fund to fail to qualify as a REMIC. The foregoing applies to mortgage loans serviced under the Pooling and Servicing Agreement. With respect to each Non-Serviced Whole Loan, if the special servicer under the applicable trust and servicing agreement or pooling and servicing agreement determines to sell the related Companion Loan(s) as described above, then the applicable special servicer will be required to sell the related non-serviced mortgage loan, included in the JPMDB 2019-COR6 trust, and the related Companion Loan(s), as a single loan. In connection with any such sale, the then-applicable special servicer will be required to follow procedures substantially similar to those set forth above. |
| THE INFORMATION IN THIS STRUCTURAL AND COLLATERAL TERM SHEET IS NOT COMPLETE AND MAY BE AMENDED PRIOR TO THE TIME OF SALE. THIS TERM SHEET IS NOT AN OFFER TO SELL THESE SECURITIES AND IT IS NOT A SOLICITATION OF AN OFFER TO BUY THESE SECURITIES IN ANY JURISDICTION WHERE THE OFFER OR SALE IS NOT PERMITTED. |
| |
| | 24 of 145 | |
| Structural and Collateral Term Sheet | | JPMDB 2019-COR6 |
| |
| Structural Overview |
| ■ Control Eligible Certificates: | | Classes G-RR, H-RR and NR-RR. |
| ■ Control Rights: | | The Control Eligible Certificates will have certain control rights attached to them. The “Directing Certificateholder” will be with respect to each mortgage loan the Controlling Class Certificateholder (or its representative) selected by more than 50% of the Controlling Class Certificateholders;provided,however, that (1) absent that selection, (2) until a Directing Certificateholder is so selected or (3) upon receipt of a notice from a majority of the Controlling Class Certificateholders that a Directing Certificateholder is no longer designated, the Controlling Class Certificateholder that owns the largest aggregate Certificate Balance of the Controlling Class (or its representative) will be the Directing Certificateholder;provided,however, that in the case of this clause (3), in the event no one holder owns the largest aggregate Certificate Balance of the Controlling Class, then there will be no Directing Certificateholder until appointed in accordance with the terms of the Pooling and Servicing Agreement. With respect to any mortgage loan (other than any non-serviced mortgage loan or any Excluded Loan), unless a Control Termination Event has occurred and is continuing, the Directing Certificateholder will be entitled to direct the Special Servicer to take, or refrain from taking, certain actions with respect to such mortgage loan. Furthermore, the Directing Certificateholder will also have the right to receive notice and provide consent with respect to certain material actions that the Master Servicer and the Special Servicer plan on taking with respect to a mortgage loan (other than any non-serviced mortgage loan or any Excluded Loan). With respect to any mortgage loan that has or may in the future have mezzanine debt, pursuant to the related intercreditor agreement, the related mezzanine lender may have certain consent rights with respect to certain modifications related to such mortgage loan. A “Borrower Party” means a borrower, a mortgagor, a manager of a mortgaged property, an Accelerated Mezzanine Loan Lender, any other person controlling or controlled by or under common control with such borrower, mortgagor, manager or Accelerated Mezzanine Loan Lender, as applicable, or any other person owning, directly or indirectly, 25% or more of the beneficial interests in such borrower, mortgagor, manager or Accelerated Mezzanine Loan Lender, as applicable. For purposes of this definition, “control” when used with respect to any specified person means the power to direct the management and policies of such person, directly or indirectly, whether through the ownership of voting securities, by contract or otherwise and the terms “controlling” and “controlled” have meanings correlative to the foregoing. An “Accelerated Mezzanine Loan Lender” means a mezzanine lender under a mezzanine loan that has been accelerated or as to which foreclosure or enforcement proceedings have been commenced against the equity collateral pledged to secure such mezzanine loan, or a holder of a preferred equity interest under a mortgage loan that has exercised its remedies under the operating agreement to remove and replace the manager of the borrower. An “Excluded Loan” is a mortgage loan or Whole Loan with respect to which the Directing Certificateholder or the holder of the majority of the controlling class is a Borrower Party. As of the Closing Date, it is expected that there will be no Excluded Loans in this securitization. With respect to the Serviced Whole Loans, direction, consent and consultation rights with respect to the related Whole Loan are subject to certain consultation rights of the holders of the related Companion Loans pursuant to the related intercreditor agreement. With respect to any Non-Serviced Whole Loan, direction, consent and consultation rights with respect to the related Whole Loan will be exercised by the directing certificateholder or controlling class representative under the applicable trust and servicing agreement or pooling and servicing agreement or the holder of the related controlling Companion Loan, as applicable. |
| ■ Directing Certificateholder: | | LoanCore Capital Markets LLC, or one of its affiliates, is expected to be appointed as the initial directing certificateholder with respect to all serviced mortgage loans (other than the Excluded Loans). |
| ■ Controlling Class: | | The “Controlling Class” will at any date of determination be the most subordinate Class of Control Eligible Certificates then outstanding that has an aggregate Certificate Balance, as notionally reduced by any Cumulative Appraisal Reduction Amounts allocable to such Class, equal to no less than 25% of the initial Certificate Balance for such Class;provided that if at any time the Certificate Balances of the certificates other than the Control Eligible Certificates have been reduced to zero as a result of the allocation of principal payments on the mortgage loans, then the Controlling Class will be the most subordinate Class among the Control Eligible Certificates that has an aggregate Certificate Balance greater than zero without regard to any Cumulative |
| THE INFORMATION IN THIS STRUCTURAL AND COLLATERAL TERM SHEET IS NOT COMPLETE AND MAY BE AMENDED PRIOR TO THE TIME OF SALE. THIS TERM SHEET IS NOT AN OFFER TO SELL THESE SECURITIES AND IT IS NOT A SOLICITATION OF AN OFFER TO BUY THESE SECURITIES IN ANY JURISDICTION WHERE THE OFFER OR SALE IS NOT PERMITTED. |
| |
| | 25 of 145 | |
| Structural and Collateral Term Sheet | | JPMDB 2019-COR6 |
| |
| Structural Overview |
| | Appraisal Reduction Amounts. The Controlling Class as of the Closing Date will be the Class NR-RR Certificates. Each holder of a certificate of the Controlling Class is referred to herein as a “Controlling Class Certificateholder”. |
| ■ Control Termination Event: | | A “Control Termination Event” will occur when the Class G-RR Certificates have a Certificate Balance (taking into account the application of any Cumulative Appraisal Reduction Amounts to notionally reduce the Certificate Balance of such class) of less than 25% of the initial Certificate Balance of that class;provided that a Control Termination Event will not be deemed to be continuing in the event the Certificate Balances of all Classes of Principal Balance Certificates other than the Control Eligible Certificates have been reduced to zero. The “Cumulative Appraisal Reduction Amount” as of any date of determination, is equal to the sum of (i) with respect to any mortgage loan, all Appraisal Reduction Amounts then in effect, and (ii) with respect to any AB Modified Loan, any Collateral Deficiency Amount then in effect. An “AB Modified Loan” means any corrected loan (1) that became a corrected loan (which includes for purposes of this definition any non-serviced mortgage loan that became a “corrected loan” (or any term substantially similar thereto) pursuant to the trust and servicing agreement or pooling and servicing agreement, as applicable, governing such non-serviced mortgage loan) due to a modification thereto that resulted in the creation of an A/B note structure (or similar structure) and as to which the new junior note(s) did not previously exist or the principal amount of the new junior note(s) was previously part of either an A note held by the issuing entity or the original unmodified mortgage loan and (2) as to which an Appraisal Reduction Amount is not in effect. The “Collateral Deficiency Amount” means, with respect to any AB Modified Loan as of any date of determination, the excess of (i) the principal balance of such AB Modified Loan (taking into account the related junior note(s) and anypari passu notes included therein), over (ii) the sum of (in the case of a Whole Loan, solely to the extent allocable to the subject mortgage loan) (x) the most recent Appraised Value for the related mortgaged property or mortgaged properties, plus (y) solely to the extent not reflected or taken into account in such Appraised Value and to the extent on deposit with, or otherwise under the control of, the lender as of the date of such determination, any capital or additional collateral contributed by the related borrower at the time the mortgage loan became (and as part of the modification related to) such AB Modified Loan for the benefit of the related mortgaged property or mortgaged properties (provided, that in the case of a non-serviced mortgage loan, the amounts set forth in this clause (y) will be taken into account solely to the extent relevant information is received by the Master Servicer), plus (z) any other escrows or reserves (in addition to any amounts set forth in the immediately preceding clause (y)) held by the lender in respect of such AB Modified Loan as of the date of such determination. Upon the occurrence and during the continuance of a Control Termination Event, the Controlling Class will no longer have any control rights and the Directing Certificateholder will relinquish its right to direct certain actions of the Special Servicer and will no longer have consent rights with respect to certain actions that the Master Servicer or the Special Servicer plan on taking with respect to a mortgage loan. Following the occurrence and during the continuance of a Control Termination Event, the Directing Certificateholder will retain consultation rights with the Special Servicer with respect to certain material actions that the Special Servicer plans on taking with respect to any mortgage loan other than an Excluded Loan. Such consultation rights will continue until the occurrence of a Consultation Termination Event. |
| ■ Consultation Termination Event: | | A “Consultation Termination Event” will occur when there is no class of Control Eligible Certificates that has a then-outstanding Certificate Balance at least equal to 25% of the initial Certificate Balance of that class, in each case, without regard to the application of any Cumulative Appraisal Reduction Amounts;provided that a Consultation Termination Event will not be deemed to be continuing in the event the Certificate Balances of all Classes of Principal Balance Certificates other than the Control Eligible Certificates have been reduced to zero. Upon the occurrence of a Consultation Termination Event, there will be no Class of Certificates that will act as the Controlling Class and the Directing Certificateholder will have no rights under the Pooling and Servicing Agreement, other than those rights generally available to all Certificateholders. |
| THE INFORMATION IN THIS STRUCTURAL AND COLLATERAL TERM SHEET IS NOT COMPLETE AND MAY BE AMENDED PRIOR TO THE TIME OF SALE. THIS TERM SHEET IS NOT AN OFFER TO SELL THESE SECURITIES AND IT IS NOT A SOLICITATION OF AN OFFER TO BUY THESE SECURITIES IN ANY JURISDICTION WHERE THE OFFER OR SALE IS NOT PERMITTED. |
| |
| | 26 of 145 | |
| Structural and Collateral Term Sheet | | JPMDB 2019-COR6 |
| |
| Structural Overview |
| ■ Operating Advisor Consultation Event: | | An “Operating Advisor Consultation Event” will occur when the Certificate Balances of the Class G-RR, Class H-RR and Class NR-RR Certificates in the aggregate (taking into account the application of any Cumulative Appraisal Reduction Amounts to notionally reduce the Certificate Balances of such classes) is 25% or less of the initial Certificate Balances of such classes in the aggregate. |
| ■ Appraised-Out Class: | | A Class of Control Eligible Certificates that has been determined, as a result of Appraisal Reduction Amounts or Collateral Deficiency Amounts allocable to such Class, to no longer be the Controlling Class. |
| ■ Remedies Available to Holders of an Appraised-Out Class: | | Holders of the majority of any Appraised-Out Class will have the right, at their sole expense, to require the Special Servicer to order a supplemental appraisal report from an MAI appraiser (selected by the Special Servicer) for any mortgage loan (or Serviced Whole Loan) that results in the Class becoming an Appraised-Out Class. Upon receipt of that supplemental appraisal, the Special Servicer will be required to determine, in accordance with the Servicing Standard, whether, based on its assessment of the supplemental appraisal, any recalculation of the Appraisal Reduction Amount or Collateral Deficiency Amount is warranted, and if so warranted, the Master Servicer will be required to recalculate the Appraisal Reduction Amount or Collateral Deficiency Amount, as applicable, based on the supplemental appraisal and if required by such recalculation, the Appraised-Out Class will be reinstated as the Controlling Class. The holders of an Appraised-Out Class requesting a supplemental appraisal are not permitted to exercise any control or consent rights of the Controlling Class until such time, if any, as the Class is reinstated as the Controlling Class. |
| ■ Operating Advisor: | | The Operating Advisor will initially be Pentalpha Surveillance LLC. The Operating Advisor will have certain review and consultation rights relating to the performance of the Special Servicer and with respect to its actions taken in connection with the resolution and/or liquidation of specially serviced loans. With respect to each mortgage loan (other than a non-serviced mortgage loan) or Serviced Whole Loan, the Operating Advisor will be responsible for: ● reviewing the actions of the Special Servicer with respect to any Specially Serviced Loan; ● reviewing (i) all reports by the Special Servicer made available to Privileged Persons on the Certificate Administrator’s website and (ii) each Final Asset Status Report; ● recalculating and reviewing for accuracy and consistency with the Pooling and Servicing Agreement the mathematical calculations and the corresponding application of the non-discretionary portion of the applicable formulas required to be utilized in connection with net present value calculations used in the Special Servicer’s determination of what course of action to take in connection with the workout or liquidation of a Specially Serviced Loan; and ● preparing an annual report (if any mortgage loan (other than any non-serviced mortgage loan) or Serviced Whole Loan was a Specially Serviced Loan at any time during the prior calendar year or an Operating Advisor Consultation Event occurred during the prior calendar year) that sets forth whether the Operating Advisor believes, in its sole discretion exercised in good faith, that the Special Servicer is operating in compliance with the Servicing Standard with respect to its performance of its duties under the Pooling and Servicing Agreement with respect to Specially Serviced Loans (and, after the occurrence and continuance of an Operating Advisor Consultation Event, with respect to Major Decisions on Non-Specially Serviced Loans) during the prior calendar year on a “trust-level basis”. The Operating Advisor will identify (1) which, if any, standards the Operating Advisor believes, in its sole discretion exercised in good faith, the Special Servicer has failed to comply with and (2) any material deviations from the Special Servicer’s obligations under the Pooling and Servicing Agreement with respect to the resolution or liquidation of any Specially Serviced Loan or REO Property (other than with respect to any REO Property related to any non-serviced mortgage loan). In preparing any Operating Advisor Annual Report, the Operating Advisor will not be required to report on instances of non-compliance with, or deviations from, the Servicing Standard or the Special Servicer’s obligations under the Pooling and Servicing Agreement that the Operating Advisor determines, in its sole discretion exercised in good faith, to be immaterial. With respect to each mortgage loan (other than any non-serviced mortgage loan) or Serviced Whole Loan, after the Operating Advisor has received notice that an Operating Advisor |
| THE INFORMATION IN THIS STRUCTURAL AND COLLATERAL TERM SHEET IS NOT COMPLETE AND MAY BE AMENDED PRIOR TO THE TIME OF SALE. THIS TERM SHEET IS NOT AN OFFER TO SELL THESE SECURITIES AND IT IS NOT A SOLICITATION OF AN OFFER TO BUY THESE SECURITIES IN ANY JURISDICTION WHERE THE OFFER OR SALE IS NOT PERMITTED. |
| |
| | 27 of 145 | |
| Structural and Collateral Term Sheet | | JPMDB 2019-COR6 |
| |
| Structural Overview |
| | Consultation Event has occurred and is continuing, in addition to the duties described above, the Operating Advisor will be required to perform the following additional duties: ● to consult (on a non-binding basis) with the Special Servicer in respect of Asset Status Reports and ● to consult (on a non-binding basis) with the Special Servicer with respect to Major Decisions processed by the Special Servicer or for which the consent of the Special Servicer is required. In addition, if at any time the Operating Advisor determines, in its sole discretion exercised in good faith, that (1) the Special Servicer is not performing its duties as required under the Pooling and Servicing Agreement or is otherwise not acting in accordance with the Servicing Standard and (2) the replacement of the Special Servicer would be in the best interest of the certificateholders as a collective whole, then, the Operating Advisor will have the right to recommend the replacement of the Special Servicer and will submit its formal recommendation to the Trustee and the Certificate Administrator (along with its rationale, its proposed replacement special servicer and other relevant information justifying its recommendation). The Operating Advisor’s recommendation to replace the Special Servicer must be confirmed by an affirmative vote of holders of Principal Balance Certificates evidencing at least a majority of a quorum of certificateholders (which, for this purpose, is the holders of Principal Balance Certificates that (i) evidence at least 20% of the Voting Rights (taking into account the application of any Appraisal Reduction Amounts to notionally reduce the respective Certificate Balances) of all Principal Balance Certificates on an aggregate basis, and (ii) consist of at least three Certificateholders or certificate owners that are not affiliated with each other). In the event the holders of Principal Balance Certificates evidencing at least a majority of a quorum of certificateholders elect to remove and replace the Special Servicer (which requisite affirmative votes must be received within 180 days of the posting of the notice of the Operating Advisor’s recommendation to replace the Special Servicer to the Certificate Administrator’s website), the Certificate Administrator will be required to receive a Rating Agency Confirmation from each of the Rating Agencies at that time. |
| ■ Replacement of Operating Advisor: | | The Operating Advisor may be terminated or removed under certain circumstances and a replacement operating advisor appointed as described in the Preliminary Prospectus. Any replacement operating advisor (or the personnel responsible for supervising the obligations of the replacement operating advisor) must be an institution (A) that is a special servicer or operating advisor on a commercial mortgage-backed securities transaction rated by S&P, Fitch and KBRA (including, in the case of the Operating Advisor, this transaction) but has not been special servicer or operating advisor on a transaction for which any of S&P, Fitch and KBRA has qualified, downgraded or withdrawn its rating or ratings of, one or more classes of certificates for such transaction publicly citing servicing concerns with the operating advisor in its capacity as special servicer or operating advisor on such commercial mortgage-backed securities transaction as the sole or a material factor in such rating action; (B) that can and will make the representations and warranties of the operating advisor set forth in the Pooling and Servicing Agreement; (C) that is not (and is not affiliated or risk retention affiliated with) the Depositor, the Trustee, the Certificate Administrator, the Master Servicer, the Special Servicer, a Mortgage Loan Seller, the Directing Certificateholder, a depositor, a trustee, a certificate administrator, a master servicer or special servicer with respect to any securitization that includes a Companion Loan, or any of their respective affiliates; (D) that has not been paid by any Special Servicer or successor special servicer any fees, compensation or other remuneration (x) in respect of its obligations hereunder or (y) for the appointment or recommendation for replacement of a successor special servicer to become the Special Servicer; (E) that (x) has been regularly engaged in the business of analyzing and advising clients in commercial mortgage-backed securities matters and that has at least 5 years of experience in collateral analysis and loss projections and (y) has at least 5 years of experience in commercial real estate asset management and experience in the workout and management of distressed commercial real estate assets and (F) that does not directly or indirectly, through one or more affiliates or otherwise, own or have derivative exposure in any interest in any certificates, any mortgage loans, any Companion Loan or any securities backed by a Companion Loan or otherwise have any financial interest in the securitization transaction to which the PSA relates, other than in fees from its role as operating advisor and asset representations reviewer (to the extent it also acts as the asset representations reviewer). |
| THE INFORMATION IN THIS STRUCTURAL AND COLLATERAL TERM SHEET IS NOT COMPLETE AND MAY BE AMENDED PRIOR TO THE TIME OF SALE. THIS TERM SHEET IS NOT AN OFFER TO SELL THESE SECURITIES AND IT IS NOT A SOLICITATION OF AN OFFER TO BUY THESE SECURITIES IN ANY JURISDICTION WHERE THE OFFER OR SALE IS NOT PERMITTED. |
| |
| | 28 of 145 | |
| Structural and Collateral Term Sheet | | JPMDB 2019-COR6 |
| |
| Structural Overview |
| ■ Asset Representations Reviewer: | | The Asset Representations Reviewer will be required to review certain delinquent mortgage loans after a specified delinquency threshold has been exceeded and notification from the Certificate Administrator that the required percentage of Certificateholders have voted to direct a review of such delinquent mortgage loans. An “Asset Review Trigger” will occur when either (1) mortgage loans with an aggregate outstanding principal balance of 25.0% or more of the aggregate outstanding principal balance of all of the mortgage loans (including any REO Loans (or a portion of any REO Loan in the case of a Whole Loan) held by the issuing entity as of the end of the applicable Collection Period are Delinquent Loans, (2)(A) prior to and including the second anniversary of the Closing Date, at least 10 mortgage loans are Delinquent Loans and the outstanding principal balance of such Delinquent Loans in the aggregate constitutes at least 15.0% of the aggregate outstanding principal balance of all of the mortgage loans (including any REO Loans (or a portion of any REO Loan in the case of a Whole Loan)) held by the issuing entity as of the end of the applicable Collection Period or (B) after the second anniversary of the Closing Date, at least 15 mortgage loans are Delinquent Loans and the outstanding principal balance of such Delinquent Loans in the aggregate constitutes at least 20.0% of the aggregate outstanding principal balance of all of the mortgage loans (including any REO Loans (or a portion of any REO Loan in the case of a Whole Loan)) held by the issuing entity as of the end of the applicable Collection Period. Following the determination that an Asset Review Trigger has occurred, the Certificate Administrator will include in the Form 10-D relating to the distribution period in which the Asset Review Trigger occurred a description of the events that caused the Asset Review Trigger to occur. Once an Asset Review Trigger has occurred, Certificateholders evidencing not less than 5% of the voting rights may deliver to the Certificate Administrator a written direction requesting a vote on whether to commence an Asset Review within 90 days after the filing of the Form 10-D reporting the occurrence of the Asset Review Trigger (an “Asset Review Vote Election”). If directed by such Certificateholders, a vote of all Certificateholders will commence and an Asset Review will occur if a majority of Certificateholders voting (assuming Certificateholders representing a minimum of 5% of the voting rights respond) vote affirmatively within 150 days of the Asset Review Vote Election. If the vote does not pass, then no Certificateholder may request a vote or cast a vote for an Asset Review and the Asset Representations Reviewer will not be required to review any delinquent mortgage loan until an additional mortgage loan becomes a Delinquent Loan, an Asset Review Trigger occurs as a result or is otherwise in effect, another Asset Review Vote Election is made and a majority of Certificateholders voting (assuming Certificateholders representing a minimum of 5% of the voting rights respond) vote affirmatively within 150 days of such Asset Review Vote Election. |
| ■ Replacement of the Asset Representations Reviewer: | | The Asset Representations Reviewer may be terminated and replaced without cause. Upon (i) the written direction of Certificateholders evidencing not less than 25% of the voting rights (without regard to the application of any Appraisal Reduction Amounts) requesting a vote to terminate and replace the Asset Representations Reviewer with a proposed successor asset representations reviewer that is an Eligible Asset Representations Reviewer, (ii) payment by such holders to the Certificate Administrator of the reasonable fees and out-of-pocket expenses to be incurred by the Certificate Administrator in connection with administering such vote and (iii) receipt by the trustee of the Rating Agency Confirmation with respect to such removal, the Certificate Administrator will promptly provide notice to all Certificateholders and the Asset Representations Reviewer of such request by posting such notice on its website, and by mailing to all Certificateholders and the Asset Representations Reviewer. Upon the written direction of Certificateholders evidencing at least 75% of a Certificateholder Quorum (without regard to the application of any Appraisal Reduction Amounts), the Trustee will terminate all of the rights and obligations of the Asset Representations Reviewer under the Pooling and Servicing Agreement by written notice to the Asset Representations Reviewer, and the proposed successor asset representations reviewer will be appointed. |
| THE INFORMATION IN THIS STRUCTURAL AND COLLATERAL TERM SHEET IS NOT COMPLETE AND MAY BE AMENDED PRIOR TO THE TIME OF SALE. THIS TERM SHEET IS NOT AN OFFER TO SELL THESE SECURITIES AND IT IS NOT A SOLICITATION OF AN OFFER TO BUY THESE SECURITIES IN ANY JURISDICTION WHERE THE OFFER OR SALE IS NOT PERMITTED. |
| |
| | 29 of 145 | |
| Structural and Collateral Term Sheet | | JPMDB 2019-COR6 |
| |
| Structural Overview |
| ■ Appointment and Replacement of Special Servicer: | | The Directing Certificateholder will appoint the initial Special Servicer as of the Closing Date. Prior to the occurrence and continuance of a Control Termination Event, the Special Servicer may generally be replaced at any time, with or without cause by the Directing Certificateholder. If the Special Servicer obtains knowledge that it is a Borrower Party with respect to any mortgage loan (other than the Non-Serviced Mortgage Loans) or Serviced Whole Loan (any such mortgage loan or Serviced Whole Loan, an “Excluded Special Servicer Loan”), the Special Servicer will be required to resign as Special Servicer of that Excluded Special Servicer Loan. Prior to the occurrence and continuance of a Control Termination Event, if the applicable Excluded Special Servicer Loan is not also an Excluded Loan, the controlling class certificateholders or the Directing Certificateholder on their behalf will be required to select a successor special servicer that is not a Borrower Party in accordance with the terms of the Pooling and Servicing Agreement (an “Excluded Special Servicer”) for the related Excluded Special Servicer Loan. After the occurrence and during the continuance of a Control Termination Event or if at any time the applicable Excluded Special Servicer Loan is also an Excluded Loan, the resigning Special Servicer will be required to use reasonable efforts to select the related Excluded Special Servicer. Upon the occurrence and during the continuance of a Control Termination Event, the Directing Certificateholder will no longer have the right to replace the Special Servicer and such replacement will occur based on a vote of holders of all voting eligible Classes of Certificates as described below. The Operating Advisor may also recommend the replacement of the Special Servicer at any time as described in “Operating Advisor” above. |
| ■ Replacement of Special Servicer by Vote of Certificateholders: | | After the occurrence and during the continuance of a Control Termination Event and upon (a) the written direction of holders of Principal Balance Certificates evidencing not less than 25% of the Voting Rights of the Principal Balance Certificates (taking into account the application of Appraisal Reduction Amounts to notionally reduce the Certificate Balances of the Principal Balance Certificates) requesting a vote to replace the Special Servicer with a replacement special servicer, (b) payment by such requesting holders to the Certificate Administrator of all reasonable fees and expenses to be incurred by the Certificate Administrator in connection with administering such vote and (c) delivery by such holders to the Certificate Administrator and the Trustee of written confirmations from each Rating Agency that the appointment of such replacement special servicer will not result in a downgrade, withdrawal or qualification of the Certificates (which confirmations will be obtained at the expense of such holders), the Certificate Administrator will be required to post notice of such direction on its website and by mail, and conduct the solicitation of votes of all Certificates in such regard, which such vote must occur within 180 days of the posting of such notice. Upon the written direction of holders of Principal Balance Certificates evidencing at least 50% of a Certificateholder Quorum, the Trustee will immediately replace the Special Servicer with a qualified replacement special servicer designated by such holders of Certificates. A “Certificateholder Quorum” means, in connection with any solicitation of votes in connection with the replacement of the Special Servicer or the Asset Representations Reviewer described above, the holders of Certificates evidencing at least 50% of the aggregate Voting Rights (taking into account the application of realized losses and, other than with respect to the termination of the Asset Representations Reviewer, the application of any Appraisal Reduction Amounts to notionally reduce the Certificate Balance of the Certificates) of all Principal Balance Certificates on an aggregate basis. With respect to each of the Serviced Whole Loan, subject to the related intercreditor agreement, the holders of the related Pari Passu Companion Loans, under certain circumstances following a servicer termination event with respect to the Special Servicer, will be entitled to direct the Trustee (and the Trustee will be required) to terminate the Special Servicer solely with respect to such Serviced Whole Loan. A replacement special servicer will be selected by the Trustee or, prior to a Control Termination Event, by the Directing Certificateholder;provided,however, that any successor special servicer appointed to replace the Special Servicer with respect to such Whole Loan can generally not be the person (or its affiliate) that was terminated at the direction of the holder of the related Pari Passu Companion Loan. |
| THE INFORMATION IN THIS STRUCTURAL AND COLLATERAL TERM SHEET IS NOT COMPLETE AND MAY BE AMENDED PRIOR TO THE TIME OF SALE. THIS TERM SHEET IS NOT AN OFFER TO SELL THESE SECURITIES AND IT IS NOT A SOLICITATION OF AN OFFER TO BUY THESE SECURITIES IN ANY JURISDICTION WHERE THE OFFER OR SALE IS NOT PERMITTED. |
| |
| | 30 of 145 | |
| Structural and Collateral Term Sheet | | JPMDB 2019-COR6 |
| |
| Structural Overview |
| | With respect to any Non-Serviced Whole Loan, subject to the related intercreditor agreement, the JPMDB 2019-COR6 trust as holder of the related mortgage loan has similar termination rights in the event of a servicer termination event with respect to the special servicer under the applicable trust and servicing agreement or pooling and servicing agreement, as applicable, as described above, which may be exercised by the Directing Certificateholder prior to the Control Termination Event. However, the successor special servicer will be selected pursuant to the applicable trust and servicing agreement or pooling and servicing agreement, as applicable, by the related directing holder prior to a control event under such trust and servicing agreement or pooling and servicing agreement, as applicable. The Master Servicer and Special Servicer are entitled to certain fees in connection with the servicing and administration of the mortgage loans as more fully described in “Pooling and Servicing Agreement—Servicing and Other Compensation and Payment of Expenses” in the Preliminary Prospectus. |
| ■ Dispute Resolution Provisions: | | Each Mortgage Loan Seller will be subject to the dispute resolution provisions set forth in the Pooling and Servicing Agreement to the extent those provisions are triggered with respect to any mortgage loan sold to the Depositor by a Mortgage Loan Seller and such Mortgage Loan Seller will be obligated under the related mortgage loan purchase agreement to comply with all applicable provisions and to take part in any mediation or arbitration proceedings that may result. Generally, in the event that a request to repurchase a mortgage loan (a “Repurchase Request”) is not “Resolved” (as defined below) within 180 days after the related Mortgage Loan Seller receives such Repurchase Request (a “Resolution Failure”), then the Enforcing Servicer (as defined below) will be required to send a notice to the “Initial Requesting Certificateholder” (if any) indicating the Enforcing Servicer’s intended course of action with respect to the Repurchase Request. If (a) the Enforcing Servicer’s intended course of action with respect to the Repurchase Request does not involve pursuing further action to exercise rights against the related Mortgage Loan Seller with respect to the Repurchase Request and the Initial Requesting Certificateholder, if any, or any other Certificateholder or Certificate Owner wishes to exercise its right to refer the matter to mediation (including nonbinding arbitration) or arbitration, or (b) the Enforcing Servicer’s intended course of action is to pursue further action to exercise rights against the related Mortgage Loan Seller with respect to the Repurchase Request but the Initial Requesting Certificateholder, if any, or any other Certificateholder or Certificate Owner does not agree with the dispute resolution method selected by the Enforcing Servicer, then the Initial Requesting Certificateholder, if any, or such other Certificateholder or Certificate Owner may deliver a written notice to the Enforcing Servicer indicating its intent to exercise its right to refer the matter to either mediation or arbitration. The Enforcing Servicer will be required to consult with any Certificateholder or Certificate Owner that delivers a notice of its intent to exercise its dispute resolution rights (a “Requesting Certificateholder”) so that a Requesting Certificateholder may consider the views of the Enforcing Servicer as to the claims underlying the Repurchase Request and possible dispute resolution methods. If a Requesting Certificateholder elects to exercise its right to refer the matter to either mediation or arbitration, then it will become the party responsible for enforcing the Repurchase Request and must promptly submit the matter to mediation (including nonbinding arbitration) or arbitration. Failure to make an election to exercise that right or failure to begin the elected form of proceedings within the certain timeframe set forth in the Pooling and Servicing Agreement will generally waive the Certificateholders’ or Certificate Owners’ rights with respect to the related Repurchase Request. The “Enforcing Servicer” will be (a) with respect to a specially serviced loan, the Special Servicer, and (b) with respect to a non-specially serviced loan, (i) in the case of a Repurchase Request made by the Special Servicer, the Directing Certificateholder or a Controlling Class Certificateholder, the Master Servicer, and (ii) in the case of a Repurchase Request made by any person other than the Special Servicer, the Directing Certificateholder or a Controlling Class Certificateholder, (A) prior to a Resolution Failure relating to such non-specially serviced loan, the Master Servicer, and (B) from and after a Resolution Failure relating to such non-specially serviced Loan, the Special Servicer. “Resolved” means, with respect to a Repurchase Request, (i) that the related Material Defect has been cured, (ii) the related mortgage loan has been repurchased in accordance with the related mortgage loan purchase agreement, (iii) a mortgage loan has been substituted for the related mortgage loan in accordance with the related mortgage loan purchase agreement, (iv) the applicable Mortgage Loan Seller has made a Loss of Value Payment, (v) a contractually binding agreement is entered into between the Enforcing Servicer, on behalf of the issuing entity, and the |
| THE INFORMATION IN THIS STRUCTURAL AND COLLATERAL TERM SHEET IS NOT COMPLETE AND MAY BE AMENDED PRIOR TO THE TIME OF SALE. THIS TERM SHEET IS NOT AN OFFER TO SELL THESE SECURITIES AND IT IS NOT A SOLICITATION OF AN OFFER TO BUY THESE SECURITIES IN ANY JURISDICTION WHERE THE OFFER OR SALE IS NOT PERMITTED. |
| |
| | 31 of 145 | |
| Structural and Collateral Term Sheet | | JPMDB 2019-COR6 |
| |
| Structural Overview |
| | related Mortgage Loan Seller that settles the related Mortgage Loan Seller’s obligations under the related mortgage loan purchase agreement, or (vi) the related mortgage loan is no longer property of the issuing entity as a result of a sale or other disposition in accordance with the Pooling and Servicing Agreement. |
| ■ Investor Communications: | | The Certificate Administrator is required to include on any Form 10–D any request received from a Certificateholder to communicate with other Certificateholders related to Certificateholders exercising their rights under the terms of the Pooling and Servicing Agreement. Any Certificateholder wishing to communicate with other Certificateholders regarding the exercise of its rights under the terms of the Pooling and Servicing Agreement should deliver a written request signed by an authorized representative of the requesting investor to the Certificate Administrator at the address below: 9062 Old Annapolis Road Columbia, Maryland 21045 Attention: Corporate Trust Administration Group – JPMDB 2019-COR6 With a copy to: trustadministrationgroup@wellsfargo.com |
| ■ Master Servicer and Special Servicer Compensation: | | The Master Servicer is entitled to a fee (the “Servicing Fee”) payable monthly from interest received in respect of each mortgage loan, any related REO loan and any related Serviced Companion Loan that will accrue at the related servicing fee rate described in the Preliminary Prospectus. The Special Servicer is also entitled to a fee (the “Special Servicing Fee”) with respect to each specially serviced loan and REO loan (other than a non-serviced mortgage loan) at the special servicing fee rate described in the Preliminary Prospectus. In addition to the Servicing Fee, Special Servicing Fee and certain other fees described below, the Master Servicer and Special Servicer are entitled to retain and share certain additional servicing compensation, including assumption application fees, assumption fees, defeasance fees, processing fees and certain Excess Modification Fees and consent fees with respect to the mortgage loans. The Special Servicer may also be entitled to either a Workout Fee or Liquidation Fee, but not both, from recoveries in respect of any particular mortgage loan. An “Excess Modification Fee” with respect to any mortgage loan (other than the non-serviced mortgage loans) or Serviced Whole Loan is the sum of (A) the excess, if any, of (i) any and all Modification Fees with respect to a mortgage loan or Serviced Whole Loan, as applicable, over (ii) all unpaid or unreimbursed additional expenses described in the Preliminary Prospectus (excluding Special Servicing Fees, Workout Fees and Liquidation Fees) outstanding or previously incurred on behalf of the issuing entity with respect to the related mortgage loan or Serviced Whole Loan, as applicable, and reimbursed from such Modification Fees and (B) expenses previously paid or reimbursed from Modification Fees as described in clause (A), which expenses have been recovered from the related borrower or otherwise. With respect to the Master Servicer and Special Servicer, the Excess Modification Fees collected and earned by such servicer from the related borrower (taken in the aggregate with any other Excess Modification Fees collected and earned by such servicer from the related borrower within the prior 18 months of the collection of the current Excess Modification Fees) will be subject to a cap of 1.00% of the outstanding principal balance of the related mortgage loan or Serviced Whole Loan, as applicable, on the closing date of the related modification, extension, waiver or amendment. A “Modification Fee” with respect to any mortgage loan (other than the non-serviced mortgage loans) or Serviced Companion Loan is generally any fee with respect to a modification, extension, waiver or amendment of any mortgage loan and/or related Serviced Companion Loan (other than all assumption fees, assumption application fees, consent fees, defeasance fees, Special Servicing Fees, Liquidation Fees or Workout Fees). A “Workout Fee” will generally be payable with respect to each corrected loan (as more specifically described in the Preliminary Prospectus) and will be calculated at a rate of 1.00% of payments of principal and interest on the respective mortgage loan for so long as it remains a corrected loan, subject to a maximum of $1,000,000 in the aggregate with respect to any particular corrected loan. After receipt by the Special Servicer of Workout Fees with respect to a corrected loan in an amount equal to $25,000, any Workout Fees in excess of such amount will be reduced by the Excess Modification Fee Amount;provided that in the event the Workout Fee, collected over the course of such workout calculated at the Workout Fee Rate is less than $25,000, then the Special Servicer will be entitled to an amount from the final payment on the |
| THE INFORMATION IN THIS STRUCTURAL AND COLLATERAL TERM SHEET IS NOT COMPLETE AND MAY BE AMENDED PRIOR TO THE TIME OF SALE. THIS TERM SHEET IS NOT AN OFFER TO SELL THESE SECURITIES AND IT IS NOT A SOLICITATION OF AN OFFER TO BUY THESE SECURITIES IN ANY JURISDICTION WHERE THE OFFER OR SALE IS NOT PERMITTED. |
| |
| | 32 of 145 | |
| Structural and Collateral Term Sheet | | JPMDB 2019-COR6 |
| |
| Structural Overview |
| | related corrected loan (including any related Serviced Companion Loan) that would result in the total Workout Fees payable to the Special Servicer in respect of that corrected loan (including any related Serviced Companion Loan) to be $25,000. The “Excess Modification Fee Amount” for any corrected loan is an amount equal to any Excess Modification Fees paid by or on behalf of the related borrower with respect to the related mortgage loan (including the related Serviced Companion Loan, unless prohibited under the related intercreditor agreement) and received and retained by the Master Servicer or the Special Servicer, as applicable, as compensation within the prior 18 months of the related modification, waiver, extension or amendment resulting in the mortgage loan or REO loan being a corrected loan, but only to the extent those fees have not previously been deducted from a Workout Fee or Liquidation Fee. A “Liquidation Fee” will generally be payable with respect to each specially serviced loan or REO property (except with respect to any non-serviced mortgage loan) as to which the Special Servicer obtains a full or partial recovery of the related asset. The Liquidation Fee for each specially serviced loan will be payable at in an amount equal to the lesser of (i) a rate of 1.00% of the liquidation proceeds (exclusive of default interest) (or, if such rate would result in an aggregate liquidation fee of less than $25,000, then the rate will be equal to such higher rate as would result in an aggregate liquidation fee equal to $25,000) and (ii) $1,000,000. The Liquidation Fees will be reduced by the amount of any Excess Modification Fees received by the Special Servicer with respect to the related mortgage loan (including a Serviced Companion Loan) or REO property as additional compensation within the prior 18 months, but only to the extent those fees have not previously been deducted from a Workout Fee or Liquidation Fee. Similar fees to those described above will be payable to the applicable special servicer for the Non-Serviced Whole Loans under the related trust and servicing agreement or pooling and servicing agreement, as applicable. Subject to certain limited exceptions, in connection with its duties under the Pooling and Servicing Agreement, the Special Servicer and its affiliates are prohibited from receiving or retaining any compensation (other than compensation specifically provided for under the Pooling and Servicing Agreement) from anyone in connection with the disposition, workout or foreclosure of any mortgage loan, the management or disposition of any REO property, or the performance of any other special servicing duties under the Pooling and Servicing Agreement. In the event the Special Servicer does receive any such compensation, it will be required to disclose those fees to the Certificate Administrator who will include it as part of the statement to Certificateholders. In addition, no liquidation fee will be payable to the Special Servicer if a mortgage loan or Serviced Whole Loan becomes a specially serviced loan only because of a maturity default and the related liquidation proceeds are received within 90 days following the related maturity date as a result of the related mortgage loan or Serviced Whole Loan being refinanced or otherwise repaid in full. See “Pooling and Servicing Agreement—Servicing and Other Compensation and Payment of Expenses” in the Preliminary Prospectus. |
| ■ Deal Website: | | The Certificate Administrator will maintain a deal website to which certain persons will have access to certain information including, but not limited to the following, which will be posted: ■ special notices; ■ summaries of any final asset status reports; ■ appraisals in connection with Appraisal Reductions plus any second appraisals ordered; ■ an “Investor Q&A Forum”; ■ a voluntary investor registry; ■ SEC EDGAR filings; and ■ risk retention. |
| THE INFORMATION IN THIS STRUCTURAL AND COLLATERAL TERM SHEET IS NOT COMPLETE AND MAY BE AMENDED PRIOR TO THE TIME OF SALE. THIS TERM SHEET IS NOT AN OFFER TO SELL THESE SECURITIES AND IT IS NOT A SOLICITATION OF AN OFFER TO BUY THESE SECURITIES IN ANY JURISDICTION WHERE THE OFFER OR SALE IS NOT PERMITTED. |
| |
| | 33 of 145 | |
| Structural and Collateral Term Sheet | | JPMDB 2019-COR6 |
| |
| Century Plaza Towers |
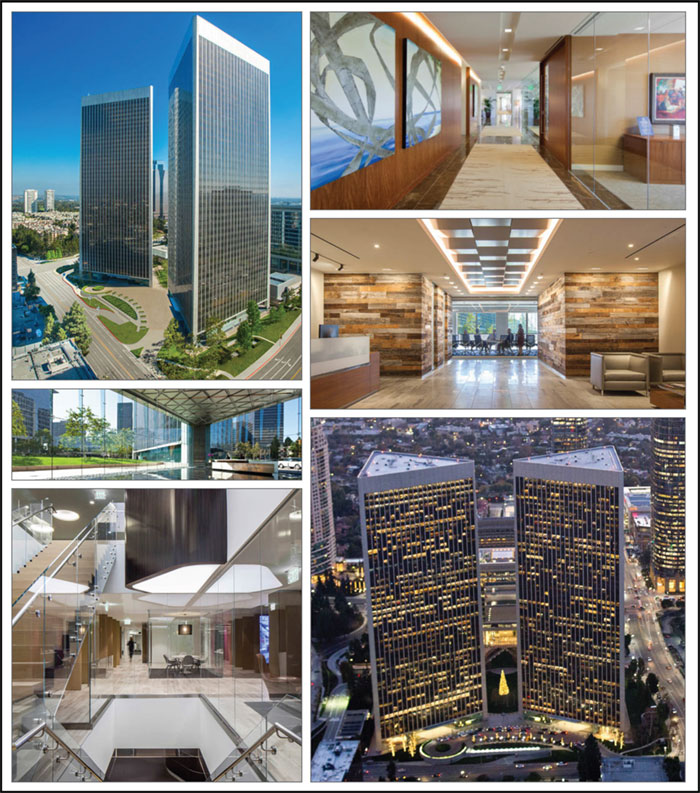
| THE INFORMATION IN THIS STRUCTURAL AND COLLATERAL TERM SHEET IS NOT COMPLETE AND MAY BE AMENDED PRIOR TO THE TIME OF SALE. THIS TERM SHEET IS NOT AN OFFER TO SELL THESE SECURITIES AND IT IS NOT A SOLICITATION OF AN OFFER TO BUY THESE SECURITIES IN ANY JURISDICTION WHERE THE OFFER OR SALE IS NOT PERMITTED. |
| |
| | 34 of 145 | |
| Structural and Collateral Term Sheet | | JPMDB 2019-COR6 |
| |
| Century Plaza Towers |
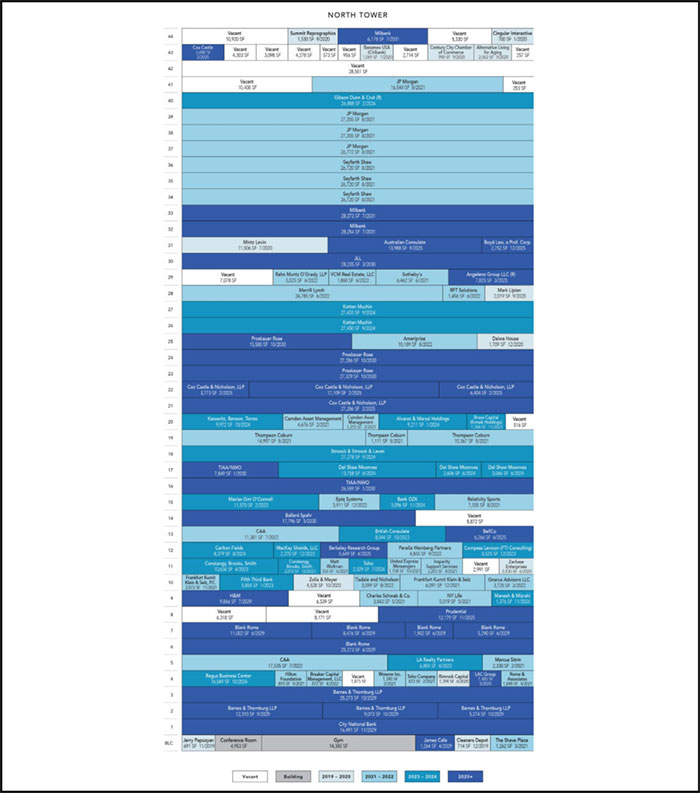
| THE INFORMATION IN THIS STRUCTURAL AND COLLATERAL TERM SHEET IS NOT COMPLETE AND MAY BE AMENDED PRIOR TO THE TIME OF SALE. THIS TERM SHEET IS NOT AN OFFER TO SELL THESE SECURITIES AND IT IS NOT A SOLICITATION OF AN OFFER TO BUY THESE SECURITIES IN ANY JURISDICTION WHERE THE OFFER OR SALE IS NOT PERMITTED. |
| |
| | 35 of 145 | |
| Structural and Collateral Term Sheet | | JPMDB 2019-COR6 |
| |
| Century Plaza Towers |
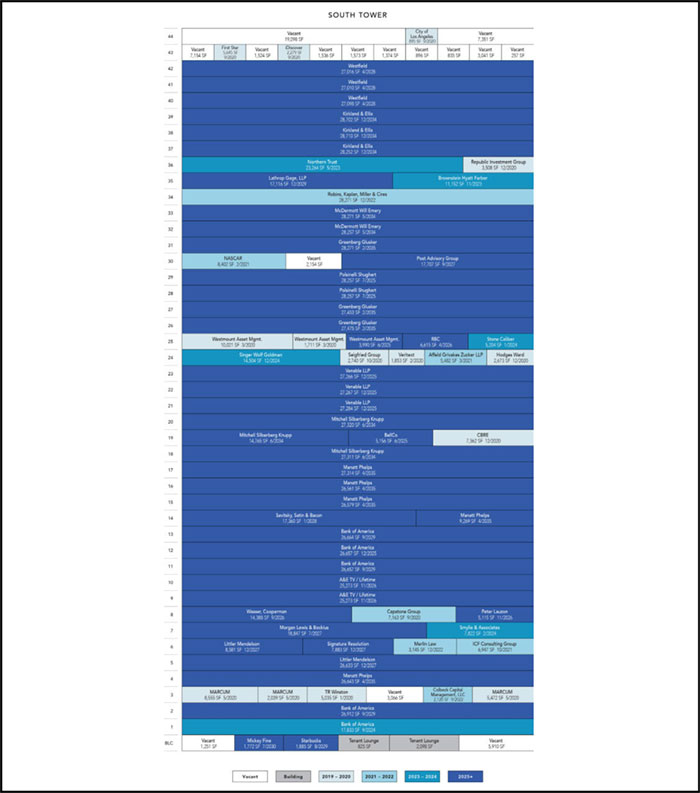
| THE INFORMATION IN THIS STRUCTURAL AND COLLATERAL TERM SHEET IS NOT COMPLETE AND MAY BE AMENDED PRIOR TO THE TIME OF SALE. THIS TERM SHEET IS NOT AN OFFER TO SELL THESE SECURITIES AND IT IS NOT A SOLICITATION OF AN OFFER TO BUY THESE SECURITIES IN ANY JURISDICTION WHERE THE OFFER OR SALE IS NOT PERMITTED. |
| |
| | 36 of 145 | |
| Structural and Collateral Term Sheet | | JPMDB 2019-COR6 |
| |
| Century Plaza Towers |
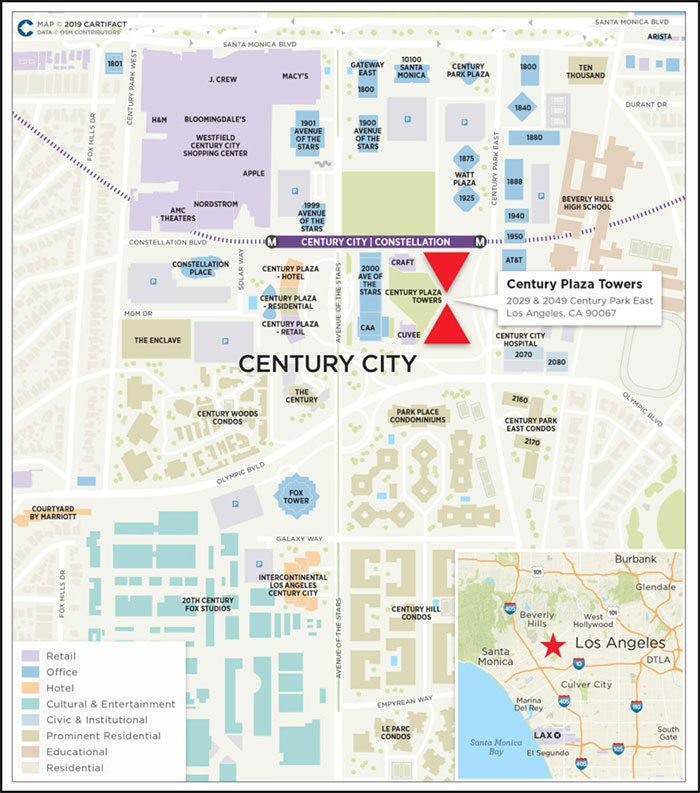
| THE INFORMATION IN THIS STRUCTURAL AND COLLATERAL TERM SHEET IS NOT COMPLETE AND MAY BE AMENDED PRIOR TO THE TIME OF SALE. THIS TERM SHEET IS NOT AN OFFER TO SELL THESE SECURITIES AND IT IS NOT A SOLICITATION OF AN OFFER TO BUY THESE SECURITIES IN ANY JURISDICTION WHERE THE OFFER OR SALE IS NOT PERMITTED. |
| |
| | 37 of 145 | |
| Structural and Collateral Term Sheet | | JPMDB 2019-COR6 |
| Century Plaza Towers |
| |
| Mortgage Loan Information | | Property Information |
| Mortgage Loan Seller: | GACC | | Single Asset / Portfolio: | Single Asset |
| Original Principal Balance(1): | $62,500,000 | | Title: | Fee |
| Cut-off Date Principal Balance(1): | $62,500,000 | | Property Type - Subtype: | Office – CBD |
| % of Pool by IPB: | 7.7% | | Net Rentable Area (SF): | 2,401,641 |
| Loan Purpose: | Refinance | | Location: | Los Angeles, CA |
| Borrower: | One Hundred Towers L.L.C. | | Year Built / Renovated: | 1975 / 2015 |
| Sponsors(2): | SPF JVP LLC; Luminance | | Occupancy: | 92.9% |
| | Acquisition Venture LLC | | Occupancy Date: | 10/1/2019 |
| Interest Rate: | 3.00450% | | Number of Tenants: | 122 |
| Note Date: | 10/21/2019 | | 2016 NOI: | $80,783,345 |
| Maturity Date: | 11/9/2029 | | 2017 NOI: | $83,200,132 |
| Interest-only Period: | 120 months | | 2018 NOI: | $89,024,555 |
| Original Term: | 120 months | | TTM NOI (as of 9/2019)(5): | $83,342,918 |
| Original Amortization: | None | | UW Economic Occupancy: | 94.8% |
| Amortization Type: | Interest Only | | UW Revenues: | $158,615,968 |
| Call Protection(3): | Grtr1%orYM(24),Defor | | UW Expenses: | $37,470,212 |
| | Grtr1%orYM(91),O(5) | | UW NOI(5): | $121,145,756 |
| Lockbox / Cash Management: | Hard / Springing | | UW NCF: | $112,250,366 |
| Additional Debt(1)(4): | Yes | | Appraised Value / Per SF: | $2,302,000,000 / $959 |
| Additional Debt Balance(1)(4): | $837,500,000 / $300,000,000 | | Appraisal Date: | 9/24/2019 |
| Additional Debt Type(1)(4): | Pari Passu /Subordinate Debt | | | |
| | | | | |
| | | | | | | |
| Escrows and Reserves(6) | | Financial Information(1)(1) |
| | Initial | Monthly | Initial Cap | | | Senior | Whole Loan |
| Taxes: | $0 | Springing | N/A | | Cut-off Date Loan / SF: | $375 | $500 |
| Insurance: | $0 | Springing | N/A | | Maturity Date Loan / SF: | $375 | $500 |
| Replacement Reserves: | $0 | $0 | N/A | | Cut-off Date LTV: | 39.1% | 52.1% |
| TI/LC: | $0 | $0 | N/A | | Maturity Date LTV: | 39.1% | 52.1% |
| Other: | $100,769,680 | $0 | N/A | | UW NCF DSCR: | 4.09x | 3.07x |
| | | | | | UW NOI Debt Yield: | 13.5% | 10.1% |
| | | | | | | | |
| | | | | | | | |
| Sources and Uses |
| Sources | Proceeds | % of Total | | Uses | Proceeds | % of Total |
| Whole Loan(1) | $1,200,000,000 | 100.0% | | Payoff Existing Debt | $823,449,563 | 68.6 | % |
| | | | | Upfront Reserves | 100,769,680 | 8.4 | |
| | | | | Closing Costs | 2,834,724 | 0.2 | |
| | | | | Return of Equity | 272,946,032 | 22.7 | |
| Total Sources | $1,200,000,000 | 100.0% | | Total Uses | $1,200,000,000 | 100.0 | % |
| (1) | The Century Plaza Towers Loan (as defined below) consists of the non-controlling Notes A-1-C3 and A-1-C8, which is part of the Century Plaza Towers Whole Loan (as defined below) evidenced by 29 seniorpari passu notes and three subordinate notes, with an aggregate outstanding principal balance as of the Cut-off Date of $1.2 billion. |
| (2) | There is no non-recourse carveout guarantor or separate environmental indemnitor with respect to the Century Plaza Towers Whole Loan. |
| (3) | Defeasance of the full $1.2 billion Century Plaza Towers Whole Loan is permitted after the date that is the earlier of (i) two years from the closing date of the securitization that includes the lastpari passu note to be securitized and (ii) October 21, 2022. Prepayment in whole, but not in part, of the Century Plaza Towers Whole Loan is permitted with the payment of yield maintenance prior to July 9, 2029 at any time. |
| (4) | See “Current Mezzanine or Subordinate Indebtedness” and “Future Mezzanine or Subordinate Indebtedness Permitted” below. |
| (5) | The increase in UW NOI from TTM NOI is primarily attributable to (i) new leases that have been executed since September 2019, accounting for 20.6% of net rentable area and 24.6% of Underwritten Gross Potential Revenue, (ii) $2,354,778 in straight line rent taken through the earlier of the loan term or the lease term for 14 tenants and (iii) $3,269,254 of rent steps taken through October 2020. |
| (6) | For a full description of Escrows and Reserves, please refer to “Escrows and Reserves” below. |
| THE INFORMATION IN THIS STRUCTURAL AND COLLATERAL TERM SHEET IS NOT COMPLETE AND MAY BE AMENDED PRIOR TO THE TIME OF SALE. THIS TERM SHEET IS NOT AN OFFER TO SELL THESE SECURITIES AND IT IS NOT A SOLICITATION OF AN OFFER TO BUY THESE SECURITIES IN ANY JURISDICTION WHERE THE OFFER OR SALE IS NOT PERMITTED. |
| |
| | 38 of 145 | |
| Structural and Collateral Term Sheet | | JPMDB 2019-COR6 |
| |
| Century Plaza Towers |
The Loan.The Century Plaza Towers mortgage loan (the “Century Plaza Towers Loan”) is part of a whole loan with an aggregate outstanding principal balance as of the Cut-off Date of $1.2 billion (the “Century Plaza Towers Whole Loan”), secured by the borrower’s fee interest in a 2,401,641 square foot, Class A, office property located in the Century City submarket of Los Angeles, California (the “Century Plaza Towers Property”). The Century Plaza Towers Whole Loan is comprised of (i) a senior loan, comprised of 29pari passunotes with an aggregate principal balance as of the Cut-off Date of $900.0 million (the “Century Plaza Towers Senior Notes”), two of which (Notes A-1-C3 and A-1-C8 with an outstanding principal balance as of the Cut-off Date of $62.5 million) are being contributed to the JPMDB 2019-COR6 Trust and constitute the Century Plaza Towers Loan, and the remainder of which are expected to be contributed to one or more future securitization trusts and (ii) a subordinate loan, comprised of three notes, with an outstanding principal balance as of the Cut-off Date of $300.0 million (the “Century Plaza Towers Subordinate Companion Loan”), each as described below. The relationship between the holders of the Century Plaza Towers Senior Notes and Century Plaza Towers Subordinate Companion Loan will be governed by a co-lender agreement as described under“Description of the Mortgage Pool—The Whole Loans—The Non-Serviced AB Whole Loans—The Century Plaza Towers Whole Loan”in the Preliminary Prospectus. The Century Plaza Towers Whole Loan was co-originated by Deutsche Bank AG acting through its New York Branch (which subsequently transferred its notes to DBR Investments Co. Limited (“DBRI”)), Wells Fargo Bank, National Association (“WFBNA”), and Morgan Stanley Bank, N.A (“MSBNA”). The Century Plaza Towers Whole Loan has a 10-year term and is interest only for the length of the loan term.
| Whole Loan Summary |
| Note | Original Balance | Cut-off Date Balance | Note Holder | Controlling Piece |
| A-1-C3, A-1-C8 | $62,500,000 | $62,500,000 | JPMDB 2019-COR6 | No |
| A-1-S1, A-1-S2, A-1-S3, A-2-S1, A-2-S2, A-2-S3, A-2-C1, A-2-C3, A-2-C4 A-3-S1,A-3-S2, A-3-S3, A-3-C1, A-3-C3 | 525,000,000 | 525,000,000 | CPTS 2019-CPT | No |
| A-1-C1, A-1-C2, A-1-C4,A-1-C5, A-1-C6, A-1-C7 | 187,500,000 | 187,500,000 | DBRI | No |
| A-2-C2, A-2-C5, A-2-C6, A-2-C7 | 62,500,000 | 62,500,000 | MSBNA | No |
| A-3-C2, A-3-C4,A-3-C5 | 62,500,000 | 62,500,000 | WFBNA | No |
| Senior Notes | $900,000,000 | $900,000,000 | | |
| B-1, B-2, B-3 | $300,000,000 | $300,000,000 | CPTS 2019-CPT | Yes |
| Total | $1,200,000,000 | $1,200,000,000 | | |
The Borrower. The borrowing entity for the Century Plaza Towers Whole Loan is One Hundred Towers L.L.C., a special purpose entity, structured to be bankruptcy remote with two independent directors in its organizational structure.
The Loan Sponsors.The loan sponsor is a joint venture between (i) the Commingled Pension Trust Fund (Strategic Property) of JPMorgan Chase Bank, N.A. (“SPF”) and (ii) a joint venture between an institutional account managed by both Hines and Hines Investment Management Holdings Limited Partnership (the “Hines JV”) (together with SPF, the “Borrower Sponsor”). As of June 30, 2019, SPF had a net asset value of $32.7 billion and a gross asset value of $42.7 billion. Hines JV is a privately owned global real estate investment, development and management firm, founded in 1957, with a presence in 219 cities in 23 countries and $124.3 billion of assets under management—including $63.8 billion for which Hines provides fiduciary investment management services and $60.5 billion for which Hines provides third party property-level services. There is no nonrecourse carveout guarantor or separate environmental indemnitor for the Century Plaza Towers Whole Loan.
The Property. The Century Plaza Towers Property consists of two Class A, 44-story, office towers and contains 2,401,641 square feet of office space and a lower level retail concourse. In addition, the Century Plaza Towers Property has an underground garage containing a total of 6,566 parking spaces (of which 5,907 spaces are part of the collateral for the Century Plaza Towers Whole Loan). The Century Plaza Towers Property was originally developed in 1975 for Aluminum Company of America (“Alcoa”) and was designed by Minoru Yamasaki.
The Century Plaza Towers Property includes 26,000 square feet column-free flexible floor plates. The Century Plaza Towers Property underwent an $80.0 million renovation in 2008 and has had approximately $48.0 million of capital expenditures invested since 2014, including a multi-year program currently underway to fully renovate all restrooms, multi-tenant corridors and elevator lobbies; nearly $28.0 million has been invested since 2015. Together with the property located at 2000 Avenue of the Stars (which is also owned by the Borrower Sponsor), the Century Plaza Towers Property is part of Century Park, a 14-acre campus that includes a four-acre central park, restaurants, cafes and other amenity retail.
| THE INFORMATION IN THIS STRUCTURAL AND COLLATERAL TERM SHEET IS NOT COMPLETE AND MAY BE AMENDED PRIOR TO THE TIME OF SALE. THIS TERM SHEET IS NOT AN OFFER TO SELL THESE SECURITIES AND IT IS NOT A SOLICITATION OF AN OFFER TO BUY THESE SECURITIES IN ANY JURISDICTION WHERE THE OFFER OR SALE IS NOT PERMITTED. |
| |
| | 39 of 145 | |
| Structural and Collateral Term Sheet | | JPMDB 2019-COR6 |
| |
| Century Plaza Towers |
The Century Plaza Towers Property is 92.9% leased as of October 1, 2019 to 122 tenants across approximately 1.2 million square feet of office space in the North Tower, approximately 1.2 million square feet of office space in the South Tower and approximately 39,500 square feet of ground floor retail space. The largest tenants include Bank of America (6.2% of net rentable area; 6.5% of gross potential rent; $56.98 gross rent per square foot; rated A2/A+/A- by Moody’s, Fitch and S&P), Manatt Phelps (4.8% of net rentable area; 5.5% of gross potential rent; $62.26 gross rent per square foot; #105 in a 2019 magazine ranking of large law firms based on gross revenue), JPMorgan (4.1% of net rentable area; 4.2% of gross potential rent; $57.00 gross rent per square foot; rated A2/AA-/A- by Moody’s, Fitch and S&P), Kirkland & Ellis (3.6% of net rentable area; 4.5% of gross potential rent; $68.79 gross rent per square foot; #1 in a 2019 magazine ranking of large law firms based on gross revenue) and Greenberg Glusker (3.5% of net rentable area; 4.2% of gross potential rent; $66.00 gross rent per square foot).
The largest tenant, Bank of America (149,508 square feet; 6.2% of net rentable area; 6.5% of underwritten base rent), is an investment and retail banking institution and financial services company based in Charlotte, North Carolina. It is the second largest banking institution in the United States by total assets. The institution’s corporate and investment banking division operates under the name Bank of America Merrill Lynch. Bank of America occupies four suites in the South Tower on the 1st, 2nd, 11th and 12th floors totaling 98,059 square feet. Bank of America has signed a lease for an additional 26,664 square feet on the 13th floor of the South Tower and is expected to begin paying rent and take occupancy in January 2020. Merrill Lynch occupies one suite in the North Tower totaling 24,785 square feet. The firm pays approximately $54 to $61 of gross rent per square foot across the North and South Towers. Bank of America has been at the Century Plaza Towers Property since 1994. With respect to the additional space in the South Tower, we cannot assure you that Bank of America will begin paying rent or take occupancy as expected or at all. Bank of America has the right to terminate its lease as of September 30, 2026 upon written notice prior to September 30, 2025 and payment of a termination fee.
The second largest tenant, Manatt Phelps (116,366 square feet; 4.8% of net rentable area; 5.5% of underwritten base rent), is a Los Angeles-based law firm that has practices focused on banking, entertainment, media, technology, retail and consumer products, and real estate and energy. Founded in 1965, Manatt Phelps employs over 450 attorneys across Los Angeles, New York, Palo Alto, San Francisco, Orange County, Chicago, Washington, D.C. and Boston. The firm is ranked #105 in a 2019 magazine ranking of large law firms based on gross revenue. Manatt Phelps has signed a lease for five suites in the South Tower on the 4th, 14th, 15th, 16th and 17th floors totaling 116,366 square feet and is expected to begin paying rent and take occupancy in stages starting in March 2020, with full occupancy of the space expected by May 2020. Manatt Phelps’s contractual rent under its lease is $62 gross rent per square foot. We cannot assure you that Manatt Phelps will begin paying rent or take occupancy as expected or at all.
The third largest tenant, JPMorgan (97,726 square feet; 4.1% of net rentable area; 4.2% of underwritten base rent), was founded in 1871. JPMorgan (NYSE: JPM) is a commercial, investment and retail banking institution founded by J.P. Morgan. Headquartered in New York, New York, JPMorgan is the largest bank in the United States. JPMorgan is affiliated with the borrower. JPMorgan occupies four suites in the North Tower on the 37th, 38th, 39th and 41st floors totaling 97,726 square feet and pays $57 gross rent per square foot. JPMorgan has been at the Century Plaza Towers Property since 2011.
The Century Plaza Towers Property is located in the Century City submarket of West Los Angeles, California. Situated between Beverly Hills to the east, Westwood, Brentwood and Santa Monica to the west, and the residential neighborhoods of Bel Air, Holmby Hills and Hollywood Hills to the north, Century City is located near the Westside’s amenities and housing communities. The Century Plaza Towers Property has access to the Santa Monica (I-10) and San Diego (I-405) Freeways and several additional major east-west thoroughfares including Santa Monica Boulevard and Olympic Boulevard.
Prior to the economic downturn in 2007-2008, vacancy rates in the Century City submarket declined to single digits, and reached a historical low direct vacancy rate of 7.1% in 2006. As the economic downturn affected the area, vacancy rates began to increase to 14.4% in 2010. As of year-end 2017, direct vacancy in the Century City submarket declined slightly to 8.2%, representing a 3.6% decrease since 2015. As of the second quarter in 2019, the direct vacancy rate was 6.1%, 80 basis points lower than year-end 2018 (6.9%).
The appraisal identified seven directly competitive office sales comparables in the Los Angeles market. Comparable buildings were built between 1925 and 2017 and range in size from 201,922 square feet to 1,006,645 square feet. The weighted average occupancy of the sales comparables was 82.8% and the weighted average sales price per square foot was approximately $830.23. Through the first half of 2019, asking rates increased slightly by 1.1% to $52.72 per square foot.
| Historical and Current Occupancy(1) |
| 2016 | 2017 | 2018 | Current(2) |
| 87.0% | 84.6% | 83.5% | 92.9% |
| (1) | Historical Occupancies are as of December 31 of each respective year. |
| (2) | Current Occupancy is as of October 1, 2019. This is inclusive of tenants that have signed a lease but are not in physical occupancy yet. |
| THE INFORMATION IN THIS STRUCTURAL AND COLLATERAL TERM SHEET IS NOT COMPLETE AND MAY BE AMENDED PRIOR TO THE TIME OF SALE. THIS TERM SHEET IS NOT AN OFFER TO SELL THESE SECURITIES AND IT IS NOT A SOLICITATION OF AN OFFER TO BUY THESE SECURITIES IN ANY JURISDICTION WHERE THE OFFER OR SALE IS NOT PERMITTED. |
| |
| | 40 of 145 | |
| Structural and Collateral Term Sheet | | JPMDB 2019-COR6 |
| |
| Century Plaza Towers |
| Tenant Summary(1) |
| Tenant | | Ratings
Moody’s/Fitch/S&P(2) | | Net Rentable
Area (SF) | | % of
Total NRA | | Base Rent
PSF(3) | | % of Total
Base Rent | | Lease
Expiration Date |
| Bank of America(3)(4) | | A2 / A+ / A- | | 149,508 | | | 6.2 | % | | $56.98 | | 6.5 | % | | Various(3) |
| Manatt Phelps(5) | | NR / NR / NR | | 116,366 | | | 4.8 | | | $62.26 | | 5.5 | | | 4/30/2035 |
| JPMorgan(6) | | A2 / AA- / A- | | 97,726 | | | 4.1 | | | $57.00 | | 4.2 | | | 8/31/2021 |
| Kirkland & Ellis(7) | | NR / NR / NR | | 85,664 | | | 3.6 | | | $68.79 | | 4.5 | | | 12/31/2034 |
| Greenberg Glusker(8) | | NR / NR / NR | | 83,199 | | | 3.5 | | | $66.00 | | 4.2 | | | 2/28/2035 |
| Venable LLP | | NR / NR / NR | | 81,817 | | | 3.4 | | | $57.70 | | 3.6 | | | 12/31/2025 |
| Westfield(9) | | NR / NR / A | | 81,124 | | | 3.4 | | | $52.30 | | 3.2 | | | 4/30/2028 |
| Seyfarth Shaw | | NR / NR / NR | | 80,160 | | | 3.3 | | | $78.51 | | 4.8 | | | 8/31/2021 |
| Proskauer Rose(10) | | NR / NR / NR | | 70,195 | | | 2.9 | | | $57.26 | | 3.1 | | | 10/31/2030 |
| Mitchell Silberberg Knupp(11) | | NR / NR / NR | | 69,396 | | | 2.9 | | | $56.40 | | 3.0 | | | 6/30/2034 |
| Ten Largest Tenants | | | | 915,155 | | | 38.1 | % | | $61.09 | | 42.6 | % | | |
| Remaining Tenants | | | | 1,315,465 | | | 54.8 | | | $57.21 | | 57.4 | % | | |
| Vacant | | | | 171,021 | | | 7.1 | | | | | | | | |
| Total | | | | 2,401,641 | | | 100.0 | % | | | | | | | |
| (1) | Based on the October 1, 2019 rent roll. |
| (2) | Certain ratings are those of the parent company, whether or not the parent company guarantees the lease. |
| (3) | The square feet of Bank of America includes 124,723 square feet occupied by Bank or America on floors 1 through 14 and 24,785 square feet occupied by Merrill Lynch on floors 25 through 33. In addition, the square feet for Bank of America includes 26,664 square feet, as to which Bank of America is expected to begin paying rent and take occupancy in January 2020. We cannot assure you that Bank of America will begin paying rent or take occupancy of such space as expected or at all. |
| (4) | Bank of America has various lease expiration dates: (i) 106,890 square feet with a lease expiration date of September 30, 2029, (ii) 17,833 square feet with a lease expiration date of September 30, 2024 and (iii) 24,785 square feet related to the Merrill Lynch space, with a lease expiration date of June 30, 2022. Bank of America has the right to terminate its lease as of September 30, 2026 upon written notice prior to September 30, 2025 and payment of a termination fee. |
| (5) | Manatt Phelps is expected to begin paying rent and take occupancy in stages in March 2020, with full occupancy of the space expected in May 2020. We cannot assure you that Manatt Phelps will begin paying rent or take occupancy of such space as expected or at all. |
| (6) | JPMorgan is an affiliate of the borrower. |
| (7) | Kirkland & Ellis is expected to begin paying rent and take occupancy in January 2020. We cannot assure you that Kirkland & Ellis will begin paying rent or take occupancy of such space as expected or at all. Kirkland & Ellis has the one time right to terminate its lease as of January 1, 2032 upon notice on or before January 1, 2031 and the payment of a termination fee. |
| (8) | Greenberg Glusker is expected to take occupancy and begin paying rent in March 2020. We cannot assure you that Greenberg Glusker will begin paying rent or take occupancy of such space as expected or at all. Greenberg Glusker has the one-time right to terminate its lease as of March 1, 2032 upon written notice on or before March 1, 2031 and the payment of a termination fee. |
| (9) | Westfield has a one-time right to terminate its lease on April 30, 2025, with 15 months’ prior notice and the payment of a termination fee of approximately $3.5 million. |
| (10) | Proskauer Rose has a one-time right to terminate its lease on October 31, 2025, upon written notice on or before October 31, 2024 and the payment of a termination fee. |
| (11) | Mitchell Silberberg Knupp has a one-time right to terminate its lease on June 30, 2029, upon written notice on or before June 30, 2028 and the payment of a termination fee. |
| Lease Rollover Schedule(1)(2) |
| Year | | Number of
Leases
Expiring | | Net Rentable
Area Expiring | | % of NRA
Expiring | | Base Rent
Expiring | | | % of Base Rent Expiring | | Cumulative Net Rentable Area Expiring | | Cumulative % of NRA Expiring | | Cumulative
Base Rent
Expiring | | | Cumulative % of Base Rent Expiring |
| Vacant | | NAP | | | 171,021 | | | 7.1 | % | | NAP | | | NAP | | | 171,021 | | | 7.1 | % | | NAP | | | NAP | |
| MTM & 2019 | | 2 | | | 1,405 | | | 0.1 | | | $45,653 | | | 0.0 | % | | 172,426 | | | 7.2 | % | | $45,653 | | | 0.0 | % |
| 2020 | | 26 | | | 96,896 | | | 4.0 | | | $4,857,092 | | | 3.7 | | | 269,322 | | | 11.2 | % | | $4,902,745 | | | 3.7 | % |
| 2021 | | 30 | | | 276,557 | | | 11.5 | | | $17,553,318 | | | 13.4 | | | 545,879 | | | 22.7 | % | | $22,456,063 | | | 17.1 | % |
| 2022 | | 15 | | | 122,719 | | | 5.1 | | | $7,206,505 | | | 5.5 | | | 668,598 | | | 27.8 | % | | $29,662,568 | | | 22.6 | % |
| 2023 | | 14 | | | 89,979 | | | 3.7 | | | $5,073,213 | | | 3.9 | | | 758,577 | | | 31.6 | % | | $34,735,781 | | | 26.5 | % |
| 2024 | | 18 | | | 224,254 | | | 9.3 | | | $13,455,101 | | | 10.3 | | | 982,831 | | | 40.9 | % | | $48,190,882 | | | 36.7 | % |
| 2025 | | 19 | | | 258,081 | | | 10.7 | | | $14,826,378 | | | 11.3 | | | 1,240,912 | | | 51.7 | % | | $63,017,260 | | | 48.0 | % |
| 2026 | | 5 | | | 76,664 | | | 3.2 | | | $4,565,856 | | | 3.5 | | | 1,317,576 | | | 54.9 | % | | $67,583,116 | | | 51.5 | % |
| 2027 | | 5 | | | 79,651 | | | 3.3 | | | $4,654,199 | | | 3.5 | | | 1,397,227 | | | 58.2 | % | | $72,237,315 | | | 55.1 | % |
| 2028 | | 4 | | | 98,484 | | | 4.1 | | | $5,249,665 | | | 4.0 | | | 1,495,711 | | | 62.3 | % | | $77,486,980 | | | 59.1 | % |
| 2029 | | 18 | | | 257,405 | | | 10.7 | | | $14,489,056 | | | 11.0 | | | 1,753,116 | | | 73.0 | % | | $91,976,035 | | | 70.1 | % |
| 2030 and Beyond(3) | | 27 | | | 648,525 | | | 27.0 | | | $39,193,695 | | | 29.9 | | | 2,401,641 | | | 100.0 | % | | $131,169,730 | | | 100.0 | % |
| Total | | 183 | | | 2,401,641 | | | 100.0 | % | | $131,169,730 | | | 100.0 | % | | | | | | | | | | | | |
| (1) | Based on the underwritten rent roll dated October 1, 2019. |
| (2) | Certain tenants may have termination or contraction options (which may become exercisable prior to the originally stated expiration date of the tenant lease) that are not considered in the above Lease Rollover Schedule. |
| (3) | 2030 and Beyond is inclusive of 22,261 square feet of amenity space. |
| THE INFORMATION IN THIS STRUCTURAL AND COLLATERAL TERM SHEET IS NOT COMPLETE AND MAY BE AMENDED PRIOR TO THE TIME OF SALE. THIS TERM SHEET IS NOT AN OFFER TO SELL THESE SECURITIES AND IT IS NOT A SOLICITATION OF AN OFFER TO BUY THESE SECURITIES IN ANY JURISDICTION WHERE THE OFFER OR SALE IS NOT PERMITTED. |
| |
| | 41 of 145 | |
| Structural and Collateral Term Sheet | | JPMDB 2019-COR6 |
| |
| Century Plaza Towers |
Operating History and Underwritten Net Cash Flow |
| | | 2016 | | | 2017 | | | 2018 | | | TTM(1) | | | Underwritten | | | Per Square Foot | | | %(2) | |
| Rents in Place | | $93,728,374 | | | $96,736,098 | | | $101,042,428 | | | $97,138,295 | | | $131,169,730 | | | $54.62 | | | 78.4 | % |
| Vacant Income | | 0 | | | 0 | | | 0 | | | 0 | | | 14,339,776 | | | 5.97 | | | 8.6 | |
| Gross Potential Rent | | $93,728,374 | | | $96,736,098 | | | $101,042,428 | | | $97,138,295 | | | $145,509,506 | | | $60.59 | | | 87.0 | % |
| Total Reimbursements | | 2,366,196 | | | 3,084,229 | | | 4,320,460 | | | 4,341,561 | | | 3,618,229 | | | 1.51 | | | 2.2 | |
| Parking | | 15,328,900 | | | 14,885,609 | | | 14,507,607 | | | 14,942,509 | | | 14,942,509 | | | 6.22 | | | 8.9 | |
| Other Income(3) | | 2,516,128 | | | 2,673,150 | | | 5,446,950 | | | 4,468,294 | | | 3,261,468 | | | 1.36 | | | 1.9 | |
| Net Rental Income | | $113,939,597 | | | $117,379,087 | | | $125,317,446 | | | $120,890,660 | | | $167,331,712 | | | $69.67 | | | 100.0 | % |
| (Vacancy/Credit Loss) | | 0 | | | 0 | | | 0 | | | 0 | | | (8,715,744 | ) | | (3.63 | ) | | (5.2 | ) |
| Effective Gross Income | | $113,939,597 | | | $117,379,087 | | | $125,317,446 | | | $120,890,660 | | | $158,615,968 | | | $66.04 | | | 94.8 | % |
| | | | | | | | | | | | | | | | | | | | | | |
| Total Expenses | | $33,156,253 | | | $34,178,955 | | | $36,292,891 | | | $37,547,742 | | | $37,470,212 | | | $15.60 | | | 23.6 | % |
| | | | | | | | | | | | | | | | | | | | | | |
| Net Operating Income(4) | | $80,783,345 | | | $83,200,132 | | | $89,024,555 | | | $83,342,918 | | | $121,145,756 | | | $50.44 | | | 76.4 | % |
| | | | | | | | | | | | | | | | | | | | | | |
| Total TI/LC, Capex/RR | | 0 | | | 0 | | | 0 | | | 0 | | | 8,895,390 | | | 3.70 | | | 5.6 | |
| Net Cash Flow | | $80,783,345 | | | $83,200,132 | | | $89,024,555 | | | $83,342,918 | | | $112,250,366 | | | $46.74 | | | 70.8 | % |
| (1) | TTM column represents the trailing 12-month period ending on September 30, 2019. |
| (2) | % column represents percent of Net Rental Income for all revenue lines and represents percent of Effective Gross Income for the remainder of the fields. |
| (3) | Other Income includes after-hours HVAC income, fitness center income, tenant services income, storage income, telecom & roof income, filming & events income, retail percentage rent income and a termination fee. |
| (4) | The increase in Underwritten Net Operating Income from TTM Net Operating Income is primarily attributable to (i) new leases that have been executed since September 2019, accounting for 20.6% of net rentable area and 24.6% of Underwritten Gross Potential Revenue, (ii) $2,354,778 in straight line rent taken through the earlier of the loan term or the lease term for 14 tenants and (iii) $3,269,254 of rent steps taken through October 2020. |
Property Management. The Century Plaza Towers Property is managed byCBRE, Inc.
Escrows and Reserves.At origination, the borrower deposited (i) approximately $71,223,945 into a TI/LC reserve for outstanding landlord work and tenant allowances and (ii) $29,545,735 into a free rent reserve.
Tax Escrows– During a Trigger Period (as defined below), the borrower is required to deposit into a real estate tax reserve, on a monthly basis, 1/12 of the estimated annual real estate taxes.
Insurance Escrows –Insurance escrows are waived so long as (i) no event of default has occurred and is continuing and (ii) the Century Plaza Towers Property is covered by an acceptable blanket policy (which is currently maintained). If such condition is no longer satisfied, on each payment date, the borrowers will be required to fund an insurance reserve in an amount equal to 1/12 of the amount that the lender estimates will be necessary to pay the annual insurance premiums.
Lockbox / Cash Management. The Century Plaza Towers Whole Loan is structured with a hard lockbox and will have springing cash management during a Trigger Period. At origination, a clearing account controlled by the lender (the “Clearing Account”) was established by the borrower, into which all rents, revenues and receipts from the Century Plaza Towers Property are required to be deposited directly by the tenant (with respect to rents). If no Trigger Period (as defined below) exists, the funds in the Clearing Account are required to be swept on each business day into the borrower’s operating account and, if a Trigger Period exists, such funds are required to be swept on each business day into a cash management account controlled by the lender (the “CMA”) at a financial institution selected by the lender.
During a Trigger Period, all amounts on deposit in the CMA are required to be applied to the payment of all monthly amounts due under the Century Plaza Towers Whole Loan documents (including, without limitation, monthly deposits for reserves for taxes and insurance (unless an acceptable blanket policy is in place with regard to insurance), debt service and all other required reserves) and all property costs and expenses set forth in the lender-approved budget. Any funds remaining thereafter are required to be transferred to a cash collateral account, as additional collateral for the Century Plaza Towers Whole Loan. Under certain circumstances and for limited purposes described in the Century Plaza Towers Whole Loan documents, the borrower may request disbursements of such excess cash flow.
A “Trigger Period” will be continuing during any period when there exists (i) an uncured event of default under the Century Plaza Towers Whole Loan or under a mezzanine loan (if one is incurred as described further below) or (ii) a Low Debt Yield Trigger (as defined below).
A “Low Debt Yield Trigger” will occur if the aggregate debt yield on the Century Plaza Towers Whole Loan and any mezzanine loan is less than 5.0% at the end of two consecutive calendar quarters. A Low Debt Yield Trigger will cease to exist if such combined debt yield exceeds 5.0% at the end of any two consecutive calendar quarters. The debt yield may be tested by the lender quarterly.
| THE INFORMATION IN THIS STRUCTURAL AND COLLATERAL TERM SHEET IS NOT COMPLETE AND MAY BE AMENDED PRIOR TO THE TIME OF SALE. THIS TERM SHEET IS NOT AN OFFER TO SELL THESE SECURITIES AND IT IS NOT A SOLICITATION OF AN OFFER TO BUY THESE SECURITIES IN ANY JURISDICTION WHERE THE OFFER OR SALE IS NOT PERMITTED. |
| |
| | 42 of 145 | |
| Structural and Collateral Term Sheet | | JPMDB 2019-COR6 |
| |
| Century Plaza Towers |
Current Mezzanine or Subordinate Indebtedness.The Century Plaza Towers Subordinate Companion Loan has an outstanding principal balance as of the Cut-off Date of $300.0 million, accrues interest at a fixed rate of 3.00450%per annum, has a 120-month term and is interest only for the full term. For additional information, see“Description of the Mortgage Pool—The Whole Loans—The Non-Serviced AB Whole Loans—The Century Plaza Towers Whole Loan”in the Preliminary Prospectus.
Future Mezzanine or Subordinate Indebtedness Permitted.The borrower will have a one-time right to cause its owners to incur a mezzanine loan, provided, among other conditions: (i) the aggregate loan-to-value ratio of the Century Plaza Towers Whole Loan and the mezzanine loan is equal to or less than 52.1% (or if a partial prepayment of the Century Plaza Towers Whole Loan has occurred in connection with a Century Plaza Towers Conversion and Transfer (as defined below), 51.5%), (ii) the aggregate debt service coverage ratio of the Century Plaza Towers Whole Loan and the mezzanine loan is equal to or greater than 3.12x (or if a partial prepayment of the Century Plaza Towers Whole Loan has occurred in connection with a Century Plaza Towers Conversion and Transfer, 3.18x), (iii) the aggregate debt yield of the Century Plaza Towers Whole Loan and the mezzanine loan is equal to or greater than 9.5% (or if a partial prepayment of the Century Plaza Towers Whole Loan has occurred in connection with a Century Plaza Towers Conversion and Transfer, 9.7%), (iv) the mezzanine loan is coterminous with the Century Plaza Towers Whole Loan and (v) entry into a customary intercreditor agreement acceptable to the lender and each rating agency rating securities backed by a portion of the Century Plaza Towers Whole Loan.
Partial Release.None.
Transfer of Development Credits. With respect to the Century Plaza Towers Whole Loan, if no event of default is continuing, the borrower has the right to convert the windowless top two floors (43rd and 44th floors) of each of the two towers comprising the Century Plaza Towers Property (the “Conversion Space”) into non-occupiable space and to transfer the development credits associated with the Conversion Space in connection with the anticipated commencement of the construction of an additional building at the adjacent 2000 Avenue of the Stars parcel owned by an affiliate of the borrower or to a third party in connection with a sale of the 2000 Avenue of the Stars parcel to a third party (the “Century Plaza Towers Conversion and Transfer”), provided that the borrower satisfies certain conditions set forth in the Century Plaza Towers Whole Loan documents, including, among others, (A) such Century Plaza Towers Conversion and Transfer is not reasonably expected to have a material adverse effect on the Century Plaza Towers Property and is on terms and conditions that are commercially reasonable and at arm’s length, (B) the borrower either (1) prepays the Century Plaza Towers Whole Loan in the amount of (i) $30,000,000, plus (ii) if prior to the open prepayment date, a prepayment premium (the “Prepayment Premium”) equal to the greater of 1.00% or the yield maintenance premium on the amount prepaid (the “Conversion Prepayment Amount”) or (2) if the transfer of the development rights is to an affiliate of the borrower, the borrower deposits with the lender cash or a letter of credit as collateral for the Century Plaza Towers Whole Loan in the amount of (i) $30,000,000, plus (ii) 105% of the Prepayment Premium that would be due if the prepayment were made as of such date and (C) the Century Plaza Towers Conversion and Transfer complies with any REMIC requirements. If the borrower transfers the development rights to an affiliate and deposits cash or a letter of credit as collateral for the Century Plaza Towers Whole Loan, the borrower may return the development rights to the borrower along with the delivery of a clean date down endorsement to the lender, in which case the lender is required to return the cash or letter of credit (as applicable) to the borrower. If the borrower’s affiliate is granted a permit to begin work on the proposed project at the 2000 Avenue of the Stars parcel or if such permit is not granted within five years after transfer of the development credits and the development credits have not been transferred back to the borrower as described above, then the borrower is required to promptly prepay the outstanding principal balance of the Century Plaza Towers Whole Loan in an amount equal to the Conversion Prepayment Amount (with any cash deposit applied to such prepayment, provided that the borrower must promptly pay the lender any difference between such cash deposit and the Conversion Prepayment Amount).
| THE INFORMATION IN THIS STRUCTURAL AND COLLATERAL TERM SHEET IS NOT COMPLETE AND MAY BE AMENDED PRIOR TO THE TIME OF SALE. THIS TERM SHEET IS NOT AN OFFER TO SELL THESE SECURITIES AND IT IS NOT A SOLICITATION OF AN OFFER TO BUY THESE SECURITIES IN ANY JURISDICTION WHERE THE OFFER OR SALE IS NOT PERMITTED. |
| |
| | 43 of 145 | |
| Structural and Collateral Term Sheet | | JPMDB 2019-COR6 |
| |
| Los Angeles Leased Fee Portfolio |
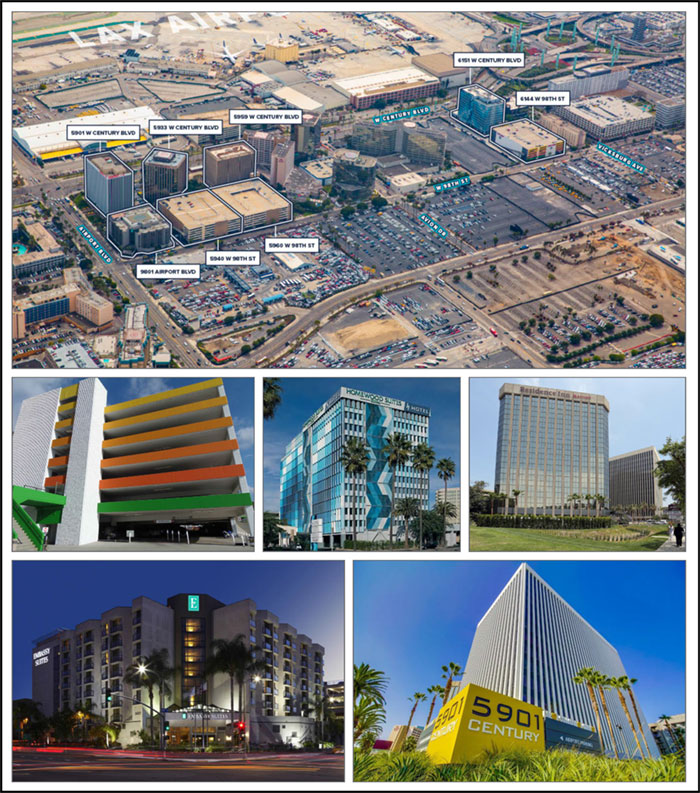
| THE INFORMATION IN THIS STRUCTURAL AND COLLATERAL TERM SHEET IS NOT COMPLETE AND MAY BE AMENDED PRIOR TO THE TIME OF SALE. THIS TERM SHEET IS NOT AN OFFER TO SELL THESE SECURITIES AND IT IS NOT A SOLICITATION OF AN OFFER TO BUY THESE SECURITIES IN ANY JURISDICTION WHERE THE OFFER OR SALE IS NOT PERMITTED. |
| |
| | 44 of 145 | |
| Structural and Collateral Term Sheet | | JPMDB 2019-COR6 |
| |
| Los Angeles Leased Fee Portfolio |
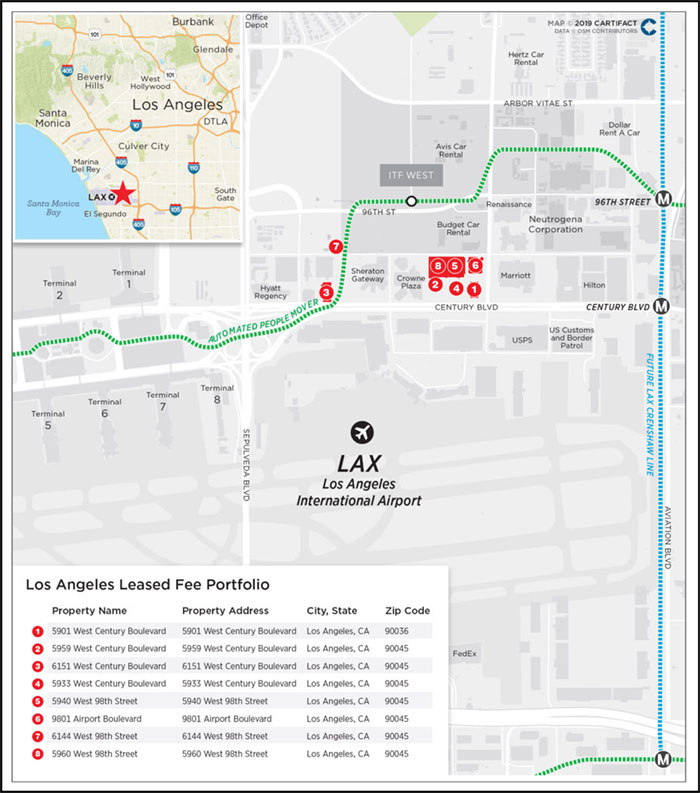
| THE INFORMATION IN THIS STRUCTURAL AND COLLATERAL TERM SHEET IS NOT COMPLETE AND MAY BE AMENDED PRIOR TO THE TIME OF SALE. THIS TERM SHEET IS NOT AN OFFER TO SELL THESE SECURITIES AND IT IS NOT A SOLICITATION OF AN OFFER TO BUY THESE SECURITIES IN ANY JURISDICTION WHERE THE OFFER OR SALE IS NOT PERMITTED. |
| |
| | 45 of 145 | |
| Structural and Collateral Term Sheet | | JPMDB 2019-COR6 |
| |
| Los Angeles Leased Fee Portfolio |
| Mortgage Loan Information | | Property Information |
| Mortgage Loan Seller: | LCM | | Single Asset / Portfolio: | Portfolio |
| Original Principal Balance(1): | $61,000,000 | | Title: | Fee |
| Cut-off Date Principal Balance(1): | $61,000,000 | | Property Type - Subtype: | Other – Leased Fee |
| % of Pool by IPB: | 7.6% | | Net Rentable Area (SF): | 556,202 |
| Loan Purpose: | Refinance | | Location: | Los Angeles, CA |
| Borrower: | KOAR Airport Associates, LLC | | Year Built / Renovated: | N/A / N/A |
| Sponsor: | Paul Alanis, Cofinance, Inc. | | Occupancy: | 100.0% |
| Interest Rate: | 3.50000% | | Occupancy Date: | 11/6/2019 |
| Note Date: | 8/28/2019 | | Number of Tenants: | N/A |
| Maturity Date: | 9/6/2029 | | 2016 NOI(3): | N/A |
| Interest-only Period: | 120 months | | 2017 NOI: | $3,636,860 |
| Original Term: | 120 months | | 2018 NOI: | $3,972,571 |
| Original Amortization: | None | | TTM NOI (as of 6/2019)(4): | $4,160,964 |
| Amortization Type: | Interest Only | | UW Economic Occupancy: | 100.0% |
| Call Protection(2): | L(26),Def(90),O(4) | | UW Revenues: | $5,267,904 |
| Lockbox / Cash Management: | Hard / Springing | | UW Expenses: | $0 |
| Additional Debt(1): | Yes | | UW NOI(4): | $5,267,904 |
| Additional Debt Balance(1): | $24,000,000 | | UW NCF: | $5,267,904 |
| Additional Debt Type(1): | Pari Passu | | Appraised Value / Per SF: | $134,900,000 / $243 |
| | | | Appraisal Date: | 7/4/2019 |
| | | | | |
| | | | | | |
| Escrows and Reserves(5) | | Financial Information(1) |
| | Initial | Monthly | Initial Cap | | Cut-off Date Loan / SF: | $153 | |
| Taxes: | $0 | Springing | N/A | | Maturity Date Loan / SF: | $153 | |
| Insurance: | $0 | Springing | N/A | | Cut-off Date LTV: | 63.0% | |
| Replacement Reserves: | $0 | $0 | N/A | | Maturity Date LTV: | 63.0% | |
| TI/LC: | $0 | $0 | N/A | | UW NCF DSCR: | 1.75x | |
| Other: | $0 | $0 | N/A | | UW NOI Debt Yield: | 6.2% | |
| | | | | | |
| Sources and Uses |
| Sources | Proceeds | % of Total | | Uses | Proceeds | % of Total | |
| Whole Loan(1) | $85,000,000 | 100.0% | | Payoff Existing Debt | $47,446,775 | 55.8 | % |
| | | % | | Closing Costs | 1,121,154 | 1.3 | |
| | | | | Return of Equity | 36,432,070 | 42.9 | |
| Total Sources | $85,000,000 | 100.0% | | Total Uses | $85,000,000 | 100.0 | % |
| (1) | The Los Angeles Leased Fee Portfolio Loan (as defined below) is part of a whole loan evidenced by twopari passu notes, with an aggregate outstanding principal balance as of the Cut-off Date of $85.0 million. The Financial Information presented in the chart above reflects the Cut-off Date Balance of the $85.0 million Los Angeles Leased Fee Portfolio Whole Loan (as defined below). |
| (2) | The lockout period will be at least 26 payment dates beginning with and including the first payment date of October 6, 2019. Defeasance of the full Los Angeles Leased Fee Portfolio Whole Loan is permitted after the date that is the earlier to occur of the payment date that is (i) two years after the closing date of the securitization that includes the last pari passu note to be securitized and (ii) September 6, 2022. The assumed lockout period of 26 payments is based on the expected JPMDB 2019-COR6 securitization closing date in November 2019. The actual lockout period may be longer. |
| (3) | 2016 NOI is not available as the Los Angeles Leased Fee Portfolio (as defined below) ground leases commenced at various dates in 2016. |
| (4) | The increase from TTM NOI to UW NOI is attributable to approximately $950,940 of underwritten average ground rent over loan term. |
| (5) | For a full description of Escrows and Reserves, please refer to“Escrows and Reserves”below. |
| THE INFORMATION IN THIS STRUCTURAL AND COLLATERAL TERM SHEET IS NOT COMPLETE AND MAY BE AMENDED PRIOR TO THE TIME OF SALE. THIS TERM SHEET IS NOT AN OFFER TO SELL THESE SECURITIES AND IT IS NOT A SOLICITATION OF AN OFFER TO BUY THESE SECURITIES IN ANY JURISDICTION WHERE THE OFFER OR SALE IS NOT PERMITTED. |
| |
| | 46 of 145 | |
| Structural and Collateral Term Sheet | | JPMDB 2019-COR6 |
| |
| Los Angeles Leased Fee Portfolio |
The Loan.The Los Angeles Leased Fee Portfolio loan, with a principal balance of $61.0 million as of the Cut-off Date (the “Los Angeles Leased Fee Portfolio Loan”), is secured by a first priority fee simple mortgage encumbering the land beneath four hotel properties, three parking structures and one office property, all of which land is encumbered by eight separate, cross-collateralized and cross-defaulted, absolute triple net (“NNN”) ground leases totaling 556,202 square feet of land located adjacent to the Los Angeles International Airport (“LAX”) in Los Angeles, California (collectively, the “Los Angeles Leased Fee Portfolio Properties” or the “Los Angeles Leased Fee Portfolio”). The Los Angeles Leased Fee Portfolio Loan is part of a whole loan that has an aggregate outstanding principal balance as of the Cut-off Date of $85.0 million (the “Los Angeles Leased Fee Portfolio Whole Loan”) and is comprised of twopari passu notes, each as described in the “Whole Loan Summary” chart below. The controlling Note A-1, with an outstanding principal balance as of the Cut-off Date of $61.0 million, is being contributed to the JPMDB 2019-COR6 Trust. The non-controlling Note A-2, with an outstanding principal balance as of the Cut-off Date of $24.0 million, is held by LCM or an affiliate and expected to be contributed to one or more future securitizations or may otherwise be transferred at any time. The relationship between the holders of the Los Angeles Leased Fee Portfolio Whole Loan will be governed by a co-lender agreement as described under “Description of the Mortgage Pool—The Whole Loans—The Serviced Pari Passu Whole Loans” in the Preliminary Prospectus. The Los Angeles Leased Fee Portfolio Loan has a 10-year term and will be interest only for the entire term.The most recent prior financing of theLos Angeles Leased Fee PortfolioProperties was not included in a securitization.
| Whole Loan Summary |
| Note | Original Balance | Cut-off Date Balance | Note Holder | Controlling Piece |
| A-1 | $61,000,000 | $61,000,000 | JPMDB 2019-COR6 | Yes |
| A-2 | 24,000,000 | 24,000,000 | LCM | No |
| Total | $85,000,000 | $85,000,000 | | |
The Borrower. The borrowing entity is KOAR Airport Associates, LLC, a Delaware limited liability company and special purpose entity structured to be bankruptcy remote with two independent directors. Legal counsel to the borrowers delivered a non-consolidation opinion in connection with the origination of the Los Angeles Leased Fee Portfolio Loan.
The Loan Sponsors.The loan sponsors and nonrecourse carve-out guarantors are Paul Alanis and Cofinance, Inc., on a joint and several basis. Mr. Alanis is a principal of KOAR International, LLC (“KOAR”), a Los Angeles-based real estate development company. KOAR has advised investors who have acquired over $1 billion of assets in the Greater Los Angeles area. Cofinance, Inc. is a subsidiary of Cofinance Group SA (“Cofinance”), a Luxembourg-based real estate company. Through its subsidiaries, Cofinance owns, operates, develops and manages commercial real estate with approximately $750 million of asset under management across the United States (New York City, Los Angeles and the greater Northeast), France and Canada.
The Properties.The Los Angeles Leased Fee Portfolio consists of eight, ground leased land parcels totaling 556,202 square feet of land located adjacent to LAX in Los Angeles, California. Each of the eight land parcels is owned by the borrower and is improved with an asset subject to a 99-year, absolute NNN ground lease that commenced in 2016 and expires in December 2114 (96 years remaining) with no extension options. The eight ground leases are structured with contractual annual rent increases, fair market value resets, right of first negotiation in the event of a sale and no early termination options. The leasehold improvements, which are not collateral for the Los Angeles Leased Fee Portfolio Loan, total approximately 2.2 million square feet of net rentable area and include four hotels (one of which is currently being converted from an office building to a hotel), three parking structures and an office building. The following table presents certain information relating to the Los Angeles Leased Fee Portfolio Properties.
| THE INFORMATION IN THIS STRUCTURAL AND COLLATERAL TERM SHEET IS NOT COMPLETE AND MAY BE AMENDED PRIOR TO THE TIME OF SALE. THIS TERM SHEET IS NOT AN OFFER TO SELL THESE SECURITIES AND IT IS NOT A SOLICITATION OF AN OFFER TO BUY THESE SECURITIES IN ANY JURISDICTION WHERE THE OFFER OR SALE IS NOT PERMITTED. |
| |
| | 47 of 145 | |
| Structural and Collateral Term Sheet | | JPMDB 2019-COR6 |
| |
| Los Angeles Leased Fee Portfolio |
Portfolio Summary |
| Property Name | | Total Land SF | | % of
Total | | Ground Lease Expiration | | Leasehold Owner | | Leased Fee UW NOI(1) | | % of Total | | Appraised Value | | % of
Total |
| 5901 West Century Boulevard | | 71,003 | | 12.8 | % | | 12/31/2114 | | ROX TRG Airport Blvd, LLC(2) | | $812,081 | | 15.4 | % | | $21,700,000 | | 16.1 | % |
| 5959 West Century Boulevard | | 79,279 | | 14.3 | | | 12/31/2114 | | 5959 LLC | | 708,834 | | 13.5 | | | 19,000,000 | | 14.1 | |
| 6151 West Century Boulevard | | 78,844 | | 14.2 | | | 12/31/2114 | | SVI Airport LLC | | 680,761 | | 12.9 | | | 18,000,000 | | 13.3 | |
| 5933 West Century Boulevard | | 73,181 | | 13.2 | | | 12/31/2114 | | SVI LAX LLC | | 601,110 | | 11.4 | | | 16,400,000 | | 12.2 | |
| 5940 West 98th Street | | 67,518 | | 12.1 | | | 12/31/2114 | | LR Century Parking I LLC et al. | | 660,427 | | 12.5 | | | 15,700,000 | | 11.6 | |
| 9801 Airport Boulevard | | 62,726 | | 11.3 | | | 12/31/2114 | | BA LAX LLC | | 558,210 | | 10.6 | | | 15,000,000 | | 11.1 | |
| 6144 West 98th Street | | 62,726 | | 11.3 | | | 12/31/2114 | | LR Century Parking VI | | 644,875 | | 12.2 | | | 14,900,000 | | 11.0 | |
| 5960 West 98th Street | | 60,925 | | 11.0 | | | 12/31/2114 | | LR Century Parking I LLC | | 601,606 | | 11.4 | | | 14,200,000 | | 10.5 | |
| Total | | 556,202 | | 100.0 | % | | | | | | $5,267,904 | | 100.0 | % | | $134,900,000 | | 100.0 | % |
| (1) | Based on the average ground rent over loan term. |
| (2) | Represents the prior leasehold owner at the time of origination. The prior owner sold the leasehold improvements in October 2019 for approximately $45.0 million to a third party. |
The following table presents certain information relating to the improvements which underlie the Los Angeles Leased Fee Portfolio Properties.
| Look Through Portfolio Summary(1) |
| Property Name | | Property
Type | | Leasehold Property Name / Operator | | Year Built /
Renovated | | SF /
Rooms /
Spaces | | | Look
Through
NOI | | Hypothetical
Stabilized Fee
Simple Appraised
Value(2) | |
| 5901 West Century Boulevard | | Office | | Airport Center Building III | | 1968 / 2017 | | 306,243 | | | $4,106,826 | | $68,400,000 | |
| 5959 West Century Boulevard | | Hotel | | Hyatt House / Hyatt Place(3) | | 1966 / 2020(3) | | 401 | | | N/A(3) | | 135,300,000 | |
| 6151 West Century Boulevard | | Hotel | | Homewood Suites / Curio Collection by Hilton | | 1963 / 2017 | | 290 | | | 6,068,455 | | 93,400,000 | |
| 5933 West Century Boulevard | | Hotel | | Residence Inn | | 1982 / 2015 | | 231 | | | 5,245,797 | | 80,700,000 | |
| 5940 West 98th Street | | Parking | | L&R Century Parking | | 1968 / N/A | | 1,300 | | | 1,670,488 | | 25,700,000 | |
| 9801 Airport Boulevard | | Hotel | | Embassy Suites | | 1989 / N/A | | 222 | | | 3,519,458 | | 54,100,000 | |
| 6144 West 98th Street | | Parking | | L&R Century Parking | | 1970 / N/A | | 1,400 | | | 1,718,505 | | 26,400,000 | |
| 5960 West 98th Street | | Parking | | L&R Century Parking | | 1982 / N/A | | 1,300 | | | 1,652,575 | | 25,400,000 | |
| Total | | | | | | | | | | | $23,982,104 | | $509,400,000 | |
| (2) | The Hypothetical Stabilized Fee Simple Appraised Value assumes the properties are unencumbered by the ground leases. |
| (3) | The 5959 West Century Boulevard improvements are currently under construction. The improvements are being converted from an office building to a dual branded Hyatt Place/Hyatt House hotel. The Hyatt Place/Hyatt House hotel will be a 14-story tower with 401 rooms. The Hyatt Place will offer 272 guestrooms and the Hyatt House will offer 129 guestrooms. According to the appraisal, the total project cost is approximately $120.0 million and is expected to be completed by the first quarter of 2020. |
Ground Rent Summary |
| Property Name | | 2020 Rent | | 2021 Rent | | 2022 Rent | | 2023 Rent | | 2024 Rent | | 2025 Rent | | 2026 Rent | | 2027 Rent | | 2028 Rent | | 2029 Rent |
| 5901 West Century Boulevard | | $713,951 | | $735,370 | | $757,431 | | $780,154 | | $803,558 | | $827,665 | | $852,495 | | $878,070 | | $904,412 | | $931,544 |
| 5959 West Century Boulevard | | 623,180 | | 641,875 | | 661,132 | | 680,966 | | 701,395 | | 722,436 | | 744,110 | | 766,433 | | 789,426 | | 813,109 |
| 6151 West Century Boulevard | | 600,000 | | 618,000 | | 636,540 | | 655,636 | | 675,305 | | 695,564 | | 716,431 | | 737,924 | | 760,062 | | 782,864 |
| 5933 West Century Boulevard | | 500,000 | | 525,000 | | 550,000 | | 575,000 | | 600,000 | | 625,000 | | 643,750 | | 663,063 | | 682,954 | | 703,443 |
| 5940 West 98th Street(1) | | 587,662 | | 603,544 | | 619,903 | | 636,753 | | 654,108 | | 671,983 | | 690,395 | | 709,360 | | 728,893 | | 749,012 |
| 9801 Airport Boulevard | | 491,000 | | 505,730 | | 520,902 | | 536,529 | | 552,625 | | 569,204 | | 586,280 | | 603,868 | | 621,984 | | 640,644 |
| 6144 West 98th Street(2) | | 577,224 | | 591,990 | | 607,199 | | 622,864 | | 638,999 | | 655,618 | | 672,735 | | 690,367 | | 708,527 | | 727,232 |
| 5960 West 98th Street(3) | | 535,948 | | 550,279 | | 565,040 | | 580,243 | | 595,903 | | 612,033 | | 628,646 | | 645,758 | | 663,383 | | 681,537 |
| Total | | $4,628,964 | | $4,771,787 | | $4,918,146 | | $5,068,144 | | $5,221,892 | | $5,379,502 | | $5,534,841 | | $5,694,842 | | $5,859,640 | | $6,029,384 |
| (1) | Ground rent includes approximately $58,251 of percentage rent paid by the leasehold improvements as of the trailing 12-month period ending June 30, 2019. |
| (2) | Ground rent includes approximately $85,030 of percentage rent paid by the leasehold improvements as of the trailing 12-month period ending June 30, 2019. |
| (3) | Ground rent includes approximately $58,251 of percentage rent paid by the leasehold improvements as of the trailing 12-month period ending June 30, 2019. |
| THE INFORMATION IN THIS STRUCTURAL AND COLLATERAL TERM SHEET IS NOT COMPLETE AND MAY BE AMENDED PRIOR TO THE TIME OF SALE. THIS TERM SHEET IS NOT AN OFFER TO SELL THESE SECURITIES AND IT IS NOT A SOLICITATION OF AN OFFER TO BUY THESE SECURITIES IN ANY JURISDICTION WHERE THE OFFER OR SALE IS NOT PERMITTED. |
| |
| | 48 of 145 | |
| Structural and Collateral Term Sheet | | JPMDB 2019-COR6 |
| |
| Los Angeles Leased Fee Portfolio |
The 5901 West Century Boulevardproperty improvements consist of a 306,243 square foot, 15-story office building. The prior leasehold owner acquired the improvements in May 2017 for $12.5 million and performed an approximately $8.0 million renovation converting the spaces to a creative office design. In October 2019 the prior leasehold owner sold the leasehold improvements for approximately $45.0 million to a third party.
The 5959 West Century Boulevardproperty improvements are currently under construction as the improvements are being converted from an office building to a dual branded Hyatt Place/Hyatt House hotel. The Hyatt Place/Hyatt House hotel will be a 14-story tower with 401 rooms. The Hyatt Place will offer 272 guestrooms and the Hyatt House will offer 129 guestrooms. According to the appraisal, the total project cost is approximately $120.0 million and is expected to be completed by the first quarter of 2020.
The 6151 West Century Boulevardproperty improvements consists of a dual brand Homewood Suites and Curio Collection by Hilton hotel, in a 12-story tower with 290 rooms. The Homewood Suites hotel offers 122, all-suite rooms, and the Curio Collection by Hilton hotel offers 168 guestrooms. The improvements were constructed in 1963 and converted to a hotel in 2017. The hotel’s amenities include meeting rooms totaling 4,532 square feet, an outdoor swimming pool, fitness room, restaurant, free breakfast (Homewood Suites) and airport shuttle. Although the improvements offer only a limited number of parking spaces onsite, there is a seven-story parking garage immediately to the north adjacent to the hotel for guest parking.
The 5933 West Century Boulevardproperty improvements consists of a Residence Inn LAX, an upscale, extended stay hotel with 231 guestrooms. The improvements were converted from an office building in an approximately $37.5 million conversion project which was completed in 2015. The hotel offers studio, one-bedroom, and two-bedroom guestrooms in a 12-story tower with three, ground floor retail spaces. The hotel amenities include four meeting rooms totaling 1,822 square feet, an outdoor swimming pool and deck area, fitness room, free breakfast and airport shuttle. The improvements do not offer any parking spaces; however, the hotel owner has the right to lease up to 300 spaces at market rates from the adjacent seven-story parking garage immediately to the north.
The 5940 West 98th Streetproperty improvements consists of a one-building, 340,420 square foot concrete parking structure built in 1968. The improvements include seven levels of parking including six covered levels and one exposed rooftop level. The facility includes 1,300 parking spaces. Access to the parking garage is available via concrete curb cuts at 98th Street. Access is also available from Century Boulevard to the south via asphalt concrete driveways. The parking garage is operated by L&R Group of Companies, one of the largest parking property owners in the Los Angeles area.
The 6144 West 98th Streetproperty improvements consists of a one-building, 350,598 square foot concrete parking structure built in 1970. The improvements include seven levels of parking including six covered levels and one exposed rooftop level. The facility includes 1,400 parking spaces. Access to the parking garage is available via concrete curb cuts at 98th Street, with secondary access available from Century Boulevard to the south via driveways. The parking garage is operated by L&R Group of Companies.
The 9801 Airport Boulevardproperty improvements consists of an Embassy Suites, an extended stay hotel with 222 guestrooms. The hotel was built in 1989 and was built as a hotel. The hotel offers one-bedroom suites in an eight-story tower. The hotel amenities include meeting rooms totaling 4,532 square feet, an indoor swimming pool, fitness room, free breakfast and airport shuttle. Although the improvements offer only a limited number of parking spaces onsite, there is a seven-story parking garage parking garage immediately to the west.
The 5960 West 98th Streetproperty improvements consists of a one-building, 338,386 square foot concrete parking structure built in 1982. The improvements include seven levels of parking including six covered levels and one exposed rooftop level. The facility includes 1,300 parking spaces. Access to the parking garage is available via concrete curb cuts at 98th Street. Access is also available from Century Boulevard to the south via asphalt concrete driveways. The parking garage is operated by L&R Group of Companies.
The Los Angeles Leased Fee Portfolio Properties are located adjacent to LAX. According to the appraisal, LAX is the busiest airport on the West Coast and is a bustling domestic stop and an important international hub. The airport has a large impact on tourism and travel in the greater Los Angeles area as many international tourists use LAX as a gateway to the United States. Passenger travel at LAX has grown significantly and surpassed pre-recession passenger counts. According to the appraisal, total passenger counts recently reached a record level of nearly 84.5 million passengers. LAX is anticipated to undergo one of the largest public works project in California history in order to compete as a “world-class” airport.
Major developments have broken ground at LAX, including a $14 billion modernization program, including a $5.5 billion landside access modernization program to improve access to the airport, relieve congestion within the Central Terminal Area and surrounding streets, and connect with the future automated people mover station. A consolidated rent-a-car facility, roadway improvements, and an intermodal transportation facility – west will provide better transportation to the airport, remove shuttle trips to/from the terminal area, and provide more efficient access to rental cars. The people mover is under construction and scheduled for completion in 2023. There are also plans to extend the Green Line into the new Torrance transit center. The 4.6-mile extension of the light rail line, which currently ends at the northern border of Redondo Beach, would allow riders to connect to LAX via the future automated 96th Street Station.
| THE INFORMATION IN THIS STRUCTURAL AND COLLATERAL TERM SHEET IS NOT COMPLETE AND MAY BE AMENDED PRIOR TO THE TIME OF SALE. THIS TERM SHEET IS NOT AN OFFER TO SELL THESE SECURITIES AND IT IS NOT A SOLICITATION OF AN OFFER TO BUY THESE SECURITIES IN ANY JURISDICTION WHERE THE OFFER OR SALE IS NOT PERMITTED. |
| |
| | 49 of 145 | |
| Structural and Collateral Term Sheet | | JPMDB 2019-COR6 |
| |
| Los Angeles Leased Fee Portfolio |
| Operating History and Underwritten Net Cash Flow |
| | | 2017 | | | 2018 | | | TTM(1) | | | Underwritten | | | Per Square Foot | | | %(2) | |
| Rents in Place | | $3,491,433 | | | $3,803,433 | | | $3,959,433 | | | $4,115,433 | | | $7.40 | | | 78.1 | % |
| Straight Line Rent(3) | | 0 | | | 0 | | | 0 | | | 950,940 | | | 1.71 | | | 18.1 | |
| Vacant Income | | 0 | | | 0 | | | 0 | | | 0 | | | 0.00 | | | 0.0 | |
| Gross Potential Rent | | $3,491,433 | | | $3,803,433 | | | $3,959,433 | | | $5,066,373 | | | $9.11 | | | 96.2 | % |
| Percentage Rent | | 145,427 | | | 169,138 | | | 201,531 | | | 201,531 | | | 0.36 | | | 3.8 | |
| Total Reimbursements | | 0 | | | 0 | | | 0 | | | 0 | | | 0.00 | | | 0.0 | |
| Total Other Income | | 0 | | | 0 | | | 0 | | | 0 | | | 0.00 | | | 0.0 | |
| Net Rental Income | | $3,636,860 | | | $3,972,571 | | | $4,160,964 | | | $5,267,904 | | | $9.47 | | | 100.0 | % |
| (Vacancy/Credit Loss) | | 0 | | | 0 | | | 0 | | | 0 | | | 0.00 | | | 0.0 | |
| Effective Gross Income | | $3,636,860 | | | $3,972,571 | | | $4,160,964 | | | $5,267,904 | | | $9.47 | | | 100.0 | % |
| | | | | | | | | | | | | | | | | | | |
| Total Expenses | | $0 | | | $0 | | | $0 | | | $0 | | | $0.00 | | | 0.0 | % |
| | | | | | | | | | | | | | | | | | | |
| Net Operating Income(4) | | $3,636,860 | | | $3,972,571 | | | $4,160,964 | | | $5,267,904 | | | $9.47 | | | 100.0 | % |
| | | | | | | | | | | | | | | | | | | |
| Total TI/LC, CapEx/RR | | 0 | | | 0 | | | 0 | | | 0 | | | 0.00 | | | 0.0 | |
| | | | | | | | | | | | | | | | | | | |
| Net Cash Flow | | $3,636,860 | | | $3,972,571 | | | $4,160,964 | | | $5,267,904 | | | $9.47 | | | 100.0 | % |
| (1) | TTM column represents the trailing 12-month period ending June 30, 2019. |
| (2) | % column represents percent of Net Rental Income for all revenue lines and represents percent of Effective Gross Income for the remainder of the fields. |
| (3) | Based on the average ground rent over loan term. |
| (4) | The increase from TTM Net Operating Income to Underwritten Net Operating Income is attributable to approximately $950,940 of underwritten average ground rent over loan term. |
Property Management.The Los Angeles Leased Fee Portfolio Properties are self-managed.
Escrows and Reserves.
Tax Escrows– On a monthly basis, and only during the continuance of a Lease Sweep Period (as defined below),the borrower is required to escrow 1/12 of the projected annual estimated tax payments.
Insurance Escrows– On a monthly basis, and only during the continuance of a Lease Sweep Period,the borrower is required to escrow 1/12 of the projected annual estimated insurance premiums.
Lockbox / Cash Management.The Los Angeles Leased Fee Portfolio Whole Loan is structured with a hard lockbox and springing cash management. All rents are required to be deposited directly by the tenants into a lockbox account controlled by the lender. All funds in the lockbox account are required to be swept daily into the borrower’s operating account, unless a Cash Management Period (as defined below) is continuing. Upon the occurrence of a Cash Management Period, all funds in the lockbox account will be swept daily into a lender-controlled account, from which account such funds will disbursed on each payment date in accordance with the Los Angeles Leased Fee Portfolio Whole Loan documents and any excess will be retained by the lender as additional collateral for the Los Angeles Leased Fee Portfolio Whole Loan.
A “Cash Management Period” will commence (i) upon an event of default, (ii) if the debt service coverage ratio is less than 1.15x (until such time that the debt service coverage ratio is greater than or equal to 1.15x for two consecutive quarters) or (iii) upon a Lease Sweep Period (as defined below).
A “Lease Sweep Period” will commence (i) on the date that is 12 months prior to the end of the term (including any renewal terms) of any Lease Sweep Lease (as defined below), (ii) on the date that is required under a Lease Sweep Lease by which the applicable Lease Sweep Tenant (defined below) is required to give notice of its exercise of a renewal option thereunder (and such renewal has not so been exercised), (iii) if any Lease Sweep Lease is surrendered, cancelled or terminated prior to its then-current expiration date, (iv) if any Lease Sweep Tenant (other than with respect to the 5959 West Century Boulevard property through August 27, 2020) goes dark or gives notice that it intends to discontinue its business at its premises;provided, however, a Lease Sweep Period will not commence pursuant to clause (iv) if, and to the extent that, such Lease Sweep Tenant (other than with respect to the 5959 West Century Boulevard property through August 27, 2020) has gone dark or gives notice that it intends to discontinue its business at its premises to renovate, reposition or restore its premises, provided, in each instance, the same is permitted under the applicable Lease Sweep Lease, (v) upon the occurrence and continuance of a monetary or material non-monetary default under any Lease Sweep Lease or (vi) upon the occurrence of a Lease Sweep Tenant insolvency proceeding.
| THE INFORMATION IN THIS STRUCTURAL AND COLLATERAL TERM SHEET IS NOT COMPLETE AND MAY BE AMENDED PRIOR TO THE TIME OF SALE. THIS TERM SHEET IS NOT AN OFFER TO SELL THESE SECURITIES AND IT IS NOT A SOLICITATION OF AN OFFER TO BUY THESE SECURITIES IN ANY JURISDICTION WHERE THE OFFER OR SALE IS NOT PERMITTED. |
| |
| | 50 of 145 | |
| Structural and Collateral Term Sheet | | JPMDB 2019-COR6 |
| |
| Los Angeles Leased Fee Portfolio |
A “Lease Sweep Lease” means each of the leases between the borrower and the related ground tenant at each of the Los Angeles Leased Fee Portfolio Properties.
A “Lease Sweep Tenant” means any tenant under a Lease Sweep Lease.
Additional Debt.None.
Release Provisions. None.
| THE INFORMATION IN THIS STRUCTURAL AND COLLATERAL TERM SHEET IS NOT COMPLETE AND MAY BE AMENDED PRIOR TO THE TIME OF SALE. THIS TERM SHEET IS NOT AN OFFER TO SELL THESE SECURITIES AND IT IS NOT A SOLICITATION OF AN OFFER TO BUY THESE SECURITIES IN ANY JURISDICTION WHERE THE OFFER OR SALE IS NOT PERMITTED. |
| |
| | 51 of 145 | |
| Structural and Collateral Term Sheet | | JPMDB 2019-COR6 |
| |
| Innovation Park |

| THE INFORMATION IN THIS STRUCTURAL AND COLLATERAL TERM SHEET IS NOT COMPLETE AND MAY BE AMENDED PRIOR TO THE TIME OF SALE. THIS TERM SHEET IS NOT AN OFFER TO SELL THESE SECURITIES AND IT IS NOT A SOLICITATION OF AN OFFER TO BUY THESE SECURITIES IN ANY JURISDICTION WHERE THE OFFER OR SALE IS NOT PERMITTED. |
| |
| | 52 of 145 | |
| Structural and Collateral Term Sheet | | JPMDB 2019-COR6 |
| |
| Innovation Park |
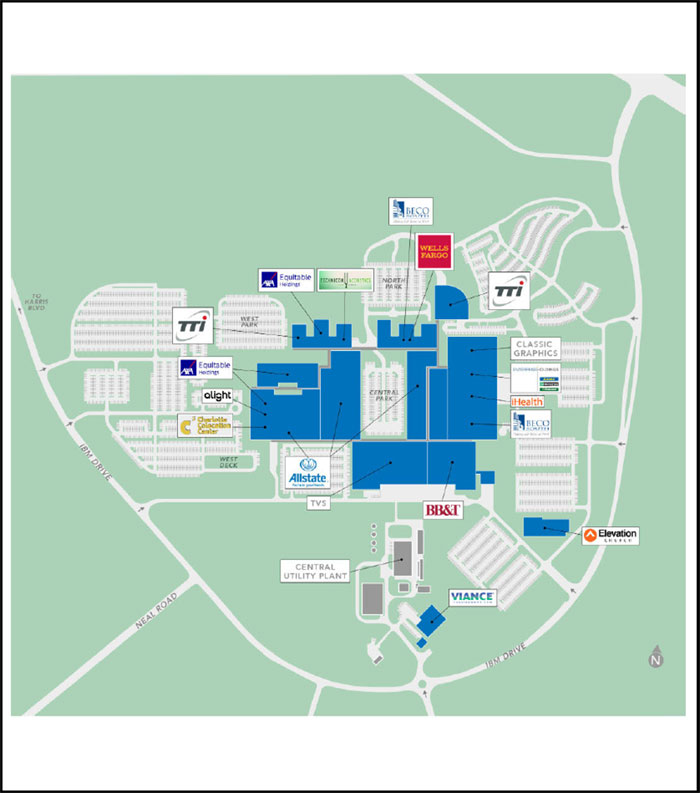
| THE INFORMATION IN THIS STRUCTURAL AND COLLATERAL TERM SHEET IS NOT COMPLETE AND MAY BE AMENDED PRIOR TO THE TIME OF SALE. THIS TERM SHEET IS NOT AN OFFER TO SELL THESE SECURITIES AND IT IS NOT A SOLICITATION OF AN OFFER TO BUY THESE SECURITIES IN ANY JURISDICTION WHERE THE OFFER OR SALE IS NOT PERMITTED. |
| |
| | 53 of 145 | |
| Structural and Collateral Term Sheet | | JPMDB 2019-COR6 |
| |
| Innovation Park |
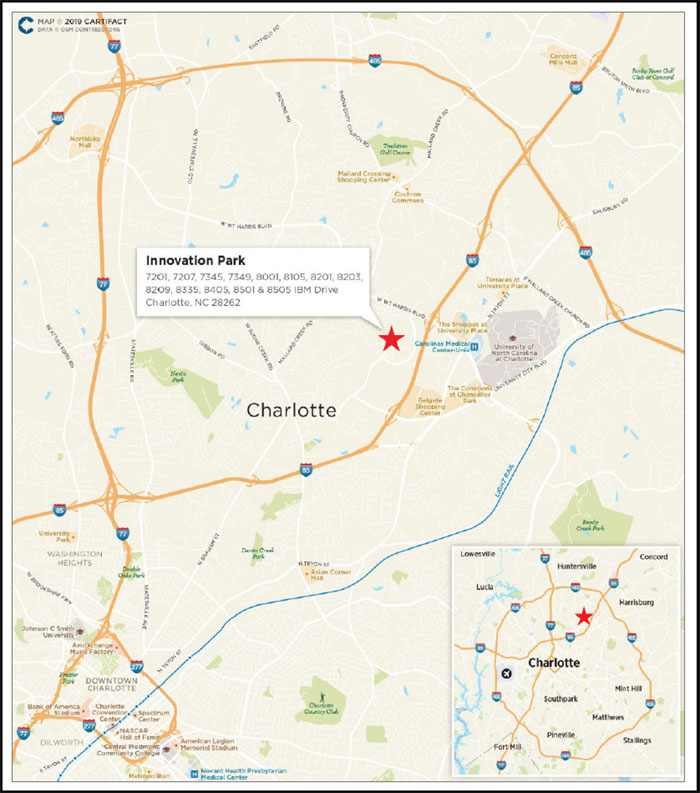
| THE INFORMATION IN THIS STRUCTURAL AND COLLATERAL TERM SHEET IS NOT COMPLETE AND MAY BE AMENDED PRIOR TO THE TIME OF SALE. THIS TERM SHEET IS NOT AN OFFER TO SELL THESE SECURITIES AND IT IS NOT A SOLICITATION OF AN OFFER TO BUY THESE SECURITIES IN ANY JURISDICTION WHERE THE OFFER OR SALE IS NOT PERMITTED. |
| |
| | 54 of 145 | |
| Structural and Collateral Term Sheet | | JPMDB 2019-COR6 |
| |
| Innovation Park |
| Mortgage Loan Information | | Property Information |
| Mortgage Loan Seller: | JPMCB | | Single Asset / Portfolio: | Single Asset |
| Original Principal Balance(1): | $55,000,000 | | Title: | Fee |
| Cut-off Date Principal Balance(1): | $55,000,000 | | Property Type - Subtype: | Office – Suburban |
| % of Pool by IPB: | 6.8% | | Net Rentable Area (SF)(3): | 1,854,729 |
| Loan Purpose: | Acquisition | | Location: | Charlotte, NC |
| Borrower: | BRI 1881 Innovation Park, LLC | | Year Built / Renovated: | 1979-2013 / 2011 |
| Sponsors: | Aleph Investment Properties, | | Occupancy(2): | 96.1% |
| | LLLP, Aleph Investment Properties | | Occupancy Date: | 8/5/2019 |
| | (US), LLLP | | Number of Tenants: | 16 |
| Interest Rate: | 3.50500% | | 2016 NOI(3): | $15,306,649 |
| Note Date: | 10/18/2019 | | 2017 NOI(3): | $16,907,586 |
| Maturity Date: | 11/1/2029 | | 2018 NOI(3): | $18,648,044 |
| Interest-only Period: | 120 months | | TTM NOI (as of 8/2019)(3): | $19,635,371 |
| Original Term: | 120 months | | UW Economic Occupancy: | 94.8% |
| Original Amortization: | None | | UW Revenues: | $32,323,781 |
| Amortization Type: | Interest Only | | UW Expenses: | $11,117,049 |
| Call Protection: | L(25),Grtr1%orYM(91),O(4) | | UW NOI: | $21,206,732 |
| Lockbox / Cash Management: | Hard / Springing | | UW NCF: | $19,162,924 |
| Additional Debt(1): | Yes | | Appraised Value / Per SF(4): | $264,900,000 / $143 |
| Additional Debt Balance(1): | $127,250,000 | | Appraisal Date: | 8/22/2019 |
| Additional Debt Type(1): | Pari Passu | | | |
| | | | | |
| | | | | | | |
| Escrows and Reserves(5) | | Financial Information(1) |
| | Initial | Monthly | Initial Cap | | Cut-off Date Loan / SF: | $98 | | |
| Taxes: | $441,662 | $147,221 | N/A | | Maturity Date Loan / SF: | $98 | | |
| Insurance: | $0 | Springing | N/A | | Cut-off Date LTV(4): | 68.8% | | |
| Replacement Reserves: | $30,912 | $30,912 | N/A | | Maturity Date LTV(4): | 68.8% | | |
| TI/LC: | $115,921 | $115,921 | $1,400,000 | | UW NCF DSCR: | 2.96x | | |
| | | | | | UW NOI Debt Yield: | 11.6% | | |
| | | | | | | | |
| | | | | | | | | | |
| Sources and Uses |
| Sources | Proceeds | % of Total | | Uses | Proceeds | % of Total |
| Whole Loan(1) | $182,250,000 | 64.2% | | Purchase Price | $270,000,000 | 95.1% |
| Sponsor Equity | 101,642,381 | 35.8 | | Closing Costs | 13,303,886 | 4.7 |
| | | | | Upfront Reserves | 588,495 | 0.2 |
| Total Sources | $283,892,381 | 100.0% | | Total Uses | $283,892,381 | 100.0% |
| (1) | The Innovation Park Loan (as defined below) is part of a whole loan evidenced by threepari passu notes, with an aggregate outstanding principal balance as of the Cut-off Date of $182.25 million. The Financial Information presented in the chart above reflects the Cut-off Date balance of the $182.25 million Innovation Park Whole Loan (as defined below). |
| (2) | Occupancy is inclusive of (i) 38,553 square feet associated with amenity space and (ii) 118,829 square feet associated with vacancy for non-rentable space at the Innovation Park Property (as defined below) with no attributable underwritten base rent. |
| (3) | The increase from 2016 NOI through TTM NOI is primarily attributable to a 146,881 square foot expansion by AXA Equitable consisting of (i) 38,200 square feet leased to AXA Equitable in October 2017 and (ii) 108,681 additional square feet leased to AXA Equitable in September 2018, in total representing 7.9% of total net rentable area and 13.9% of total underwritten base rent at the Innovation Park Property. |
| (4) | Appraised Value / Per SF, Cut-off Date LTV and Maturity Date LTV are calculated based on the “Hypothetical As-Is” appraised value of $264.9 million. As of the date of origination, there were no outstanding tenant improvement and leasing commission obligations remaining. Based on the As-Is appraised value of $262.9 million as of August 22, 2019, the Cut-off Date LTV and Maturity Date LTV are equal to 69.3% and 69.3%, respectively. |
| (5) | For a full description of Escrows and Reserves, please refer to “Escrows and Reserves” below. |
| THE INFORMATION IN THIS STRUCTURAL AND COLLATERAL TERM SHEET IS NOT COMPLETE AND MAY BE AMENDED PRIOR TO THE TIME OF SALE. THIS TERM SHEET IS NOT AN OFFER TO SELL THESE SECURITIES AND IT IS NOT A SOLICITATION OF AN OFFER TO BUY THESE SECURITIES IN ANY JURISDICTION WHERE THE OFFER OR SALE IS NOT PERMITTED. |
| |
| | 55 of 145 | |
| Structural and Collateral Term Sheet | | JPMDB 2019-COR6 |
| |
| Innovation Park |
The Loan. The Innovation Park loan has an outstanding principal balance as of the Cut-off Date of $55.0 million (the “Innovation Park Loan”), is part of a whole loan evidenced by threepari passu promissory notes, each as described below, with an aggregate original balance of $182.25 million (the “Innovation Park Whole Loan”), and is secured by a first mortgage lien on the borrower’s fee interest in a 1,854,729 square foot, Class A office complex (the “Innovation Park Property”) located in Charlotte, North Carolina. The non-controlling Note A-3, with an outstanding principal balance as of the Cut-off Date of $55.0 million, will be included in the JPMDB 2019-COR6 Trust. The non-controlling Note A-1 and the controlling Note A-2 have been or are expected to be contributed to other securitization trusts, outlined in the chart below. The relationship between the holders of the Innovation Park Whole Loan will be governed by a co-lender agreement as described under “Description of the Mortgage Pool—The Whole Loans—The Serviced Pari Passu Whole Loansin the Preliminary Prospectus. The Innovation Park Whole Loan has a 10-year term and is interest-only for the entire term.
| Whole Loan Summary |
| Note | Original Balance | Cut-off Date Balance | Note Holder | Controlling
Piece |
| A-1 | $60,000,000 | $60,000,000 | Benchmark 2019-B14 | No |
| A-2 | $67,250,000 | $67,250,000 | JPMCB | Yes |
| A-3 | $55,000,000 | $55,000,000 | JPMDB 2019-COR6 | No |
| Total | $182,250,000 | $182,250,000 | | |
The Borrower. The borrower is BRI 1881 Innovation Park, LLC, a Delaware limited liability company and special purpose entity with two independent directors in its organizational structure.
The Loan Sponsors. The loan sponsors and non-recourse guarantors are Aleph Investment Properties (US), LLLP and Aleph Investment Properties, LLLP. The borrower is a joint-venture between Accesso Partners, LLC (“Accesso Partners”) and Partners Group AG (SIX: PGHN) (“Partners Group”). Accesso Partners is a real estate investment and property development group that currently owns a portfolio of over $3.0 billion in assets totaling over 15.0 million square feet of office space across 44 properties, 21 major cities and eight states. Headquartered in Hallandale Beach, Florida, Accesso Partners offers a full range of services including acquisition, asset management, property management construction and accounting with additional offices in Houston, Dallas, Minneapolis, Atlanta and Chicago. Partners Group is a global private markets investment manager, serving over 900 institutional investors worldwide. Since inception, Partners Group has over $91 billion in assets under management and employs over 1,300 professionals across 20 offices worldwide. Partners Group has invested over $100 billion in private equity, private real estate, private debt and private infrastructure on behalf of its clients. Partners Group is one of the largest private markets investment managers in the world.
The Property. The Innovation Park Property is a 1,854,729 square foot office complex located in Charlotte, North Carolina, consisting of 11 interconnected office buildings, a free standing industrial flex building, a free standing 1,200 seat chapel, a central utility plant and two parking structures. The Innovation Park Property is situated on an approximately 202-acre site which includes an approximately 89.2 acre vacant parcel of undeveloped excess land, which does not serve as collateral for the Innovation Park Whole Loan. The Innovation Park Property includes two parking structures containing 7,601 surface and garage parking spaces, resulting in a parking ratio of approximately 4.12 spaces per 1,000 square feet. Of the 7,601 parking spaces, 2,366 spaces serve as collateral for the Innovation Park Whole Loan. The buildings were completed between 1979 and 2013, while the parking structures were constructed in 2005 and 2012. The Innovation Park Property was originally constructed as IBM’s research and development campus and was repositioned as the Innovation Park Property in 2011 after IBM vacated a majority of the Innovation Park Property. After acquiring the Innovation Park Property in 2010, the prior owner made significant upgrades including a number of on-campus amenities such as two fitness centers with locker rooms, a cafeteria, two conference centers and extensive landscaping and tenant lounge areas. The prior owner reportedly invested over $54.4 million in tenant improvements since 2010 and approximately $19.7 million in total capital expenditures since 2016.
As of August 5, 2019, the Innovation Park Property was 96.1% leased to 16 tenants representing several industries including financial services, insurance, technology and design. In addition, approximately 42.4% of the net rentable area at the Innovation Park Property is leased to investment grade tenants. The largest tenant at the Innovation Park Property, AXA Equitable (NYSE: EQH) (Moody’s/S&P/Fitch: A2/A/A-) (“AXA”), accounts for approximately 15.7% of net rentable area and approximately 25.3% of underwritten base rent. Founded in 1859, AXA is a financial services company that offers a variety of variable annuity products, term, variable and universal life insurance products, employee benefit products and investment products principally to individuals, small and medium-sized businesses and professional and trade associations. As of the second quarter of 2019, AXA reported approximately $6.9 billion in net income, and as of the year end 2018, AXA had $618.6 billion in assets under management. The space leased by AXA at the Innovation Park Property serves as its life-insurance operations and service center where approximately 600 AXA employees work. AXA has been a tenant at the Innovation Park Property since 2013 and has a lease expiration date of November 30, 2028 with one five-year extension option remaining. AXA originally leased 144,647 square feet, subsequently expanded by 38,200 square feet in 2017 and expanded by an additional 108,681 square feet in 2018. AXA has the right to terminate its lease with respect to 144,647 square feet (approximately 50% of their leased space) in December 2024 with 12 months’ prior written notice and the payment of a termination fee.
| THE INFORMATION IN THIS STRUCTURAL AND COLLATERAL TERM SHEET IS NOT COMPLETE AND MAY BE AMENDED PRIOR TO THE TIME OF SALE. THIS TERM SHEET IS NOT AN OFFER TO SELL THESE SECURITIES AND IT IS NOT A SOLICITATION OF AN OFFER TO BUY THESE SECURITIES IN ANY JURISDICTION WHERE THE OFFER OR SALE IS NOT PERMITTED. |
| |
| | 56 of 145 | |
| Structural and Collateral Term Sheet | | JPMDB 2019-COR6 |
| |
| Innovation Park |
The second largest tenant at the Innovation Park Property, Allstate Insurance Company (“Allstate”) (NYSE: ALL) (Moody’s/S&P/Fitch: A3/A-/BBB+), accounts for approximately 13.9% of net rentable area and approximately 22.4% of underwritten base rent. Founded in 1931 and serving approximately 16 million households in the United States, Allstate offers a variety of insurance product options including auto, homeowners, renters, condominium and stand-alone scheduled personal property through different distribution channels including Allstate exclusive agencies, independent agencies, online and call centers. As of year-end 2018, Allstate had nearly $39.8 billion in revenues and $112.2 billion in assets. The Innovation Park Property serves as Allstate’s current operations center. Allstate has been at the Innovation Park Property since 2014 and has a lease expiration of December 31, 2027 with two, five-year extension options. Allstate originally leased 217,062 square feet at the Innovation Park Property and expanded by 40,311 square feet in July 2019. Allstate has the right to terminate its lease in November 2022 with nine months’ prior written notice and the payment of a termination fee.
The third largest tenant at the Innovation Park Property, Classic Graphics, accounts for approximately 12.9% of net rentable area and approximately 4.5% of underwritten base rent. Classic Graphics specializes in custom large format signage, trade show displays and other visual communications solutions. Class Graphics is a subsidiary of the IMAGINE group (“IMAGINE”), which consists of a family of five companies focused on delivering visual communications solutions to brands across the retail, entertainment, gaming, quick service restaurant and consumer packaged goods industries. Classic Graphic has been a tenant since 2011 and has a lease expiration date of January 31, 2026 with one, five-year extension option remaining. Classic Graphics originally leased 179,775 square feet and subsequently expanded by 58,969 square feet in 2013. Classic Graphics has the right to terminate its lease with respect to 58,969 square feet in December 31 2020, with nine months’ prior written notice and the payment of a termination fee.
The loan sponsors expect to convert approximately 242,992 square feet of industrial space in building 001, currently leased through 2023, and building 002, currently vacant, to office space with the goal of putting the space to more efficient use at higher rental rates. The loan sponsor has budgeted approximately $130 per square foot, or $31.6 million, in capital expenses and tenant improvements associated with the conversion. In addition, the loan sponsors have indicated that they expect the outlying parcels which are not included in the collateral to be converted to retail, residential and office use.
The Innovation Park Property is located in Charlotte, North Carolina, approximately nine miles north of Charlotte’s central business district. According to the appraisal, the city of Charlotte is the nation’s third largest banking center and home to the headquarters of six Fortune 500 companies including Bank of America, Lowe’s Home Improvement Warehouse, Duke Energy, Nucor and Sonic Automotive. According to the Bureau of Labor Statistics, as of April 2019, the labor pool in the Charlotte metro area grew 3.0% year-over-year and the number of new jobs increased 2.5%. In addition to strong job growth, Charlotte has experienced strong infrastructure development including the 2018 completion of the $1.2 billion LYNX Blue line rail extension, Charlotte’s 18.9 mile long light rail service. The Innovation Park Property is located within University City, the second largest employment center in Charlotte. University City is comprised of over 11 million square feet of office space, 4.8 million of which is LEED certified, and consists of approximately 73,000 employees, 23 Fortune 500 companies and three headquarter locations. The area benefits from its proximity to the University of North Carolina at Charlotte which has an enrollment of over 25,000 students as well as Carolina’s Medical Center – University. Additional demand drivers within University City include University Research Park, University Executive Park Atrium Health University City, Belgate Shopping Center, Concord Mills Mall and Charlotte Motor Speedway, one of NASCAR’s racing venues.
According to the appraisal, as of the second quarter of 2019, the Charlotte office market consisted of approximately 110 million square feet of office space with an overall vacancy rate of 7.9% and average asking rents of $26.07 per square foot. The University City submarket totaled approximately 8.6 million square feet with an average vacancy of 10.4% and average asking rents of $23.91 per square foot. The overall Charlotte office market achieved 2.5 million square feet in leasing activity through mid-year 2019 and projects positive net absorption through year end 2019.
The appraisal identified seven office rent comparables for the Innovation Park Property. Comparable buildings were built between 1972 and 2017 and range in size from 56,871 to 199,571 square feet. Direct asking rents at the comparable properties ranged between $22.00 and $29.50 per square foot with a weighted average office rent of approximately $25.30 per square foot. The Innovation Park Property’s in-place weighted average office rent is $19.30 per square foot, below the appraisal’s concluded office market rent of $25.00 per square foot.
| THE INFORMATION IN THIS STRUCTURAL AND COLLATERAL TERM SHEET IS NOT COMPLETE AND MAY BE AMENDED PRIOR TO THE TIME OF SALE. THIS TERM SHEET IS NOT AN OFFER TO SELL THESE SECURITIES AND IT IS NOT A SOLICITATION OF AN OFFER TO BUY THESE SECURITIES IN ANY JURISDICTION WHERE THE OFFER OR SALE IS NOT PERMITTED. |
| |
| | 57 of 145 | |
| Structural and Collateral Term Sheet | | JPMDB 2019-COR6 |
| |
| Innovation Park |
The appraisal identified 11 industrial rent comparables for the Innovation Park Property with rents ranging from $4.50 to $7.35 per square foot with a weighted average of $5.54 per square foot. The Innovation Park Property’s in-place weighted average industrial rent is $5.07 per square foot, in-line with the appraisal’s concluded industrial rent of $5.50 per square foot.
| Historical and Current Occupancy(1) |
| 2016 | 2017 | 2018 | Current(2)(3) |
| 96.1% | 95.4% | 95.9% | 96.1% |
| (1) | Historical Occupancies are as of December 31 of each respective year. |
| (2) | Current Occupancy is as of August 5, 2019. |
| (3) | Occupancy is inclusive of (i) 38,553 square feet associated with amenity space and (ii) 118,829 square feet associated with vacancy for non-rentable space at the Innovation Park Property with no attributable underwritten base rent. |
| Tenant Summary(1) |
| Tenant | Ratings
Moody’s/S&P/Fitch(2) | Net Rentable
Area (SF) | % of
Total NRA | Base Rent
PSF(3)(4) | % of Total
Base Rent(3) | Lease Expiration |
| AXA Equitable(5) | A2 / A / A- | 291,528 | 15.7% | $23.93 | 25.3% | 11/30/2028 |
| Allstate Insurance Company(6) | A3 / A- / BBB+ | 257,393 | 13.9% | $24.04 | 22.4% | 12/31/2027 |
| Classic Graphics(7) | NR / NR / NR | 238,744 | 12.9% | $5.23 | 4.5% | 1/31/2026 |
| Alight Solutions LLC(8) | NR / NR / NR | 216,377 | 11.7% | $16.06 | 12.6% | 11/30/2025 |
| Wells Fargo Bank | A2 / A- / A+ | 196,613 | 10.6% | $22.76 | 16.2% | 3/31/2025 |
| TVS | NR / NR / NR | 183,324 | 9.9% | $5.16 | 3.4% | 4/30/2023 |
| TTI Worldwide | NR / NR / NR | 75,335 | 4.1% | $23.14 | 6.3% | 12/31/2026 |
| BB&T | A2 / A- / A+ | 40,666 | 2.2% | $12.66 | 1.9% | 5/31/2024 |
| Elevation Church | NR / NR / NR | 36,890 | 2.0% | $14.20 | 1.9% | 3/31/2025 |
| Framatone | NR / NR / NR | 31,858 | 1.7% | $22.32 | 2.6% | 10/31/2023 |
| Top 10 Total / Wtd. Avg. | | 1,568,728 | 84.6% | $17.09 | 97.2% | |
| Remaining Tenants | | 57,016 | 3.1% | $13.59 | 2.8% | |
| Building & Amenity(9) | | 157,382 | 8.5% | | | |
| Total Occupied Space | | 1,783,126 | 96.1% | | | |
| Vacant | | 71,603 | 3.9% | | | |
| Total / Wtd. Avg. | | 1,854,729 | 100.0% | $15.47 | 100.0% | |
| (1) | Based on the underwritten rent roll dated August 5, 2019. |
| (2) | Certain ratings are those of the parent company whether or not the parent company guarantees the lease. |
| (3) | Base Rent PSF is inclusive of (a) contractual rent steps through June 2020 and (b) straight line rent for investment grade tenants over the Innovation Park Loan term. |
(4) Base Rent PSF is inclusive of (i) 38,553 square feet associated with amenity space and (ii) 118,829 square feet associated with vacancy for non-rentable space at the Innovation Park Property with no attributable underwritten base rent.
| (5) | AXA Equitable has the right to terminate its lease with respect to 144,647 square feet on December 31, 2024, with 12 months’ prior written notice and a termination fee equal to the unamortized amounts of brokerage commissions, rent abatements and landlord work costs related to such space. |
| (6) | Allstate Insurance Company has the right to terminate its lease on November 30, 2022, with nine months’ prior written notice and the payment of a termination fee equal to the unamortized amounts of brokerage commissions, rent abatements and landlord work costs related to such space. |
| (7) | Classic Graphics has the right to terminate its lease with respect to 58,969 square feet on December 31, 2020, with nine months’ prior written notice and the payment of a termination fee equal to the unamortized amounts of brokerage commissions, landlord work costs related to tenant spaces and the cost of dividing the existing space from any additional space leased to Classic Graphics. |
| (8) | Alight Solutions LLC has the right to terminate its lease on November 30, 2022 with 12 months’ prior notice and the payment of a termination fee equal to three months base rent and unamortized brokerage commissions, rent abatements and landlord work costs related to such space. |
| (9) | Building & Amenity is inclusive of (i) 38,553 square feet associated with amenity space and (ii) 118,829 square feet associated with vacancy for non-rentable space at the Innovation Park Property with no attributable underwritten base rent. |
| THE INFORMATION IN THIS STRUCTURAL AND COLLATERAL TERM SHEET IS NOT COMPLETE AND MAY BE AMENDED PRIOR TO THE TIME OF SALE. THIS TERM SHEET IS NOT AN OFFER TO SELL THESE SECURITIES AND IT IS NOT A SOLICITATION OF AN OFFER TO BUY THESE SECURITIES IN ANY JURISDICTION WHERE THE OFFER OR SALE IS NOT PERMITTED. |
| |
| | 58 of 145 | |
| Structural and Collateral Term Sheet | | JPMDB 2019-COR6 |
| |
| Innovation Park |
| Lease Rollover Schedule(1)(2) |
Year | Number
of Leases
Expiring | Net
Rentable
Area
Expiring | % of NRA
Expiring | Base Rent
Expiring(3) | % of Base
Rent
Expiring | Cumulative
Net Rentable
Area Expiring | Cumulative
% of NRA
Expiring | Cumulative
Base Rent
Expiring | Cumulative
% of Base
Rent
Expiring |
| Vacant | NAP | 71,603 | 3.9% | NAP | NAP | 71,603 | 3.9% | NAP | NAP |
| 2019 & MTM | 0 | 0 | 0.0% | $0 | 0.0% | 71,603 | 3.9% | $0 | 0.0% |
| 2020 | 0 | 0 | 0.0% | 0 | 0.0% | 71,603 | 3.9% | $0 | 0.0% |
| 2021 | 0 | 0 | 0.0% | 0 | 0.0% | 71,603 | 3.9% | $0 | 0.0% |
| 2022 | 1 | 22,775 | 1.2% | 241,643 | 0.9% | 94,378 | 5.1% | $241,643 | 0.9% |
| 2023 | 4 | 223,538 | 12.1% | 1,735,498 | 6.3% | 317,916 | 17.1% | $1,977,141 | 7.2% |
| 2024 | 2 | 61,909 | 3.3% | 875,549 | 3.2% | 379,825 | 20.5% | $2,852,689 | 10.3% |
| 2025 | 3 | 449,880 | 24.3% | 8,473,891 | 30.7% | 829,705 | 44.7% | $11,326,581 | 41.1% |
| 2026 | 2 | 314,079 | 16.9% | 2,991,809 | 10.8% | 1,143,784 | 61.7% | $14,318,389 | 51.9% |
| 2027 | 1 | 257,393 | 13.9% | 6,187,005 | 22.4% | 1,401,177 | 75.5% | $20,505,394 | 74.4% |
| 2028(4) | 3 | 301,483 | 16.3% | 7,028,908 | 25.5% | 1,702,660 | 91.8% | $27,534,302 | 99.8% |
| 2029 & Beyond(5) | 8 | 152,069 | 8.2% | 42,484 | 0.2% | 1,854,729 | 100.0% | $27,576,787 | 100.0% |
| Total | 24 | 1,854,729 | 100.0% | $27,576,787 | 100.0% | | | | |
| (1) | Based on the underwritten rent roll dated August 5, 2019. |
| (2) | Certain tenants may have termination or contraction options (which may become exercisable prior to the originally stated expiration date of the tenant lease) that are not considered in the above Lease Rollover Schedule. |
| (3) | Base Rent Expiring is inclusive of (i) contractual rent steps through June 2020 and (ii) straight line rent for investment grade tenants over the Innovation Park Loan term accounting for approximately $2.0 million in underwritten base rent. |
| (4) | 2028 is inclusive of 7,731 square feet leased to Bon Appetit Management Company that serves as amenity space for tenants at the Innovation Park Property. |
| (5) | 2029 & Beyond is inclusive of (i) 30,822 square feet associated with amenity space and (ii) 118,829 square feet associated with vacancy for non-rentable space at the Innovation Park Property with no attributable underwritten base rent. |
| Underwritten Net Cash Flow |
| | 2016 | 2017 | 2018 | TTM(1) | Underwritten | Per Square
Foot | %(2) |
| Base Rent(3) | $21,832,902 | $23,050,139 | $24,785,667 | $25,837,745 | $27,576,787 | $14.87 | 81.3% |
| Vacant Income | 0 | 0 | 0 | 0 | 1,500,862 | 0.81 | 4.4 |
| Gross Potential Rent | $21,832,902 | $23,050,139 | $24,785,667 | $25,837,745 | $29,077,649 | $15.68 | 85.7% |
| Total Reimbursements | 3,715,621 | 3,914,912 | 4,512,707 | 4,848,580 | 4,847,972 | 2.61 | 14.3 |
| Net Rental Income | $25,548,523 | $26,965,051 | $29,298,373 | $30,686,325 | $33,925,621 | $18.29 | 100.0% |
| (Vacancy / Credit Loss) | 0 | 0 | 0 | 0 | (1,751,094) | (0.94) | (5.2) |
| Other Income | 169,565 | 157,973 | 213,576 | 149,254 | 149,254 | 0.08 | 0.4 |
| Effective Gross Income | $25,718,088 | $27,123,025 | $29,511,950 | $30,835,578 | $32,323,781 | $17.43 | 95.3% |
| Total Expenses | 10,411,439 | $10,215,438 | $10,863,906 | $11,200,207 | $11,117,049 | $5.99 | 34.4 |
| Net Operating Income(4) | $15,306,649 | $16,907,586 | $18,648,044 | $19,635,371 | $21,206,732 | $11.43 | 65.6% |
| Total TI/LC, CapEx | 0 | 0 | 0 | 0 | 2,043,807 | 1.10 | 6.3 |
| Net Cash Flow | $15,306,649 | $16,907,586 | $18,648,044 | $19,635,371 | $19,162,924 | $10.33 | 59.3% |
| (1) | TTM column represents the trailing 12-month period ending August 31, 2019. |
| (2) | % column represents percent of Net Rental Income for all revenue lines and represents percent of Effective Gross Income for the remainder of the fields. |
| (3) | Base Rent is inclusive of (i) contractual rent steps through June 2020 and (ii) straight line rent for investment grade tenants over the Innovation Park Loan term accounting for approximately $2.0 million in underwritten base rent. |
| (4) | The increase from 2016 NOI through TTM NOI was attributable to a 146,881 square foot expansion by AXA Equitable inclusive of (i) 38,200 square feet leased to AXA Equitable in October 2017 and (ii) 108,681 additional square feet leased to AXA Equitable in September 2018 representing 7.9% of total net rentable area and 13.9% of underwritten total rent at the Innovation Park Property. |
Property Management. The Innovation Park Property is managed by Accesso Services LLC, a Florida limited liability company and an affiliate of the loan sponsors.
| THE INFORMATION IN THIS STRUCTURAL AND COLLATERAL TERM SHEET IS NOT COMPLETE AND MAY BE AMENDED PRIOR TO THE TIME OF SALE. THIS TERM SHEET IS NOT AN OFFER TO SELL THESE SECURITIES AND IT IS NOT A SOLICITATION OF AN OFFER TO BUY THESE SECURITIES IN ANY JURISDICTION WHERE THE OFFER OR SALE IS NOT PERMITTED. |
| |
| | 59 of 145 | |
| Structural and Collateral Term Sheet | | JPMDB 2019-COR6 |
| |
| Innovation Park |
Escrows and Reserves.At loan origination, the borrowers deposited approximately $441,662 into a tax reserve account, $30,912 into a replacement reserve account and $115,921 into a rollover reserve account.
Tax Escrows–On a monthly basis, theborrowersare required to deposit an amount equal to 1/12 of the estimated annual real estate taxes (initially estimated to be $147,221).
Insurance Escrows – Insurance escrows are waived so long as (i) no event of default has occurred and is continuing and (ii) the Innovation Park Property is covered by an acceptable blanket policy (which is currently maintained). If such condition is no longer satisfied, on each payment date, the borrowers will be required to fund an insurance reserve in an amount equal to 1/12 of the amount that the lender estimates will be necessary to pay the annual insurance premiums.
Replacement Escrows – On a monthly basis, the borrowers are required to depositapproximately$30,912 for replacement reserves (or approximately $0.20 per square foot annually). The replacement reserve is not subject to a cap.
TI/LC Reserves – On a monthly basis through the payment date occurring in November 2022, the borrowers are required to deposit $115,921 for tenant improvements and leasing commission (or approximately $0.75 per square foot annually). On each monthly payment date thereafter, the borrower is required to pay $193,201. Monthly payments made prior to October 2022 are waived if the applicable amount of funds on deposit in the TI/LC Reserve account is equal to or greater than $1,400,000. The aggregate amount of the applicable amount of funds on deposit may not exceed a cap of $5,000,000 on any payment date.
Lockbox / Cash Management.The Innovation Park Whole Loan is structured with a hard lockbox and springing cash management. The borrower was required at loan origination to send tenant direction letters instructing the tenants to deposit all rents and payments into a lender controlled lockbox account. To the extent no Cash Sweep Period (as defined below) is continuing, all funds in the lockbox account are required to be transferred to or at the direction of the borrowers. Following the occurrence and during the continuance of a Cash Sweep Period, all funds in the lockbox account are required to be swept each business day to a segregated cash management account under the control of the lender and disbursed in accordance with the Innovation Park Whole Loan documents. To the extent there is a Cash Sweep Period continuing, all excess cash flow after payment of debt service, required reserves and operating expenses are required to be held as additional collateral for the Innovation Park Whole Loan. The lender has been granted a first priority security interest in the cash management account.
A “Cash Sweep Period” means each period commencing on the occurrence of a Cash Sweep Event (as defined below) and continuing until the earlier of the payment date next occurring following the related Cash Sweep Event Cure (as defined below) or payment in full of all principal and interest on the Innovation Park Whole Loan.
A “Cash Sweep Event” means the occurrence of (i) an event of default, (ii) any bankruptcy action of a borrower or property manager, (iii) the date on which the debt service coverage ratio (as calculated in the Innovation Park Whole Loan documents and based on the trailing six-month period immediately preceding the date of determination) is less than 1.75x, or (iv) the event of default under any new mezzanine loans permitted under the Innovation Park Whole Loan documents as described below and more fully set forth in the Innovation Park Whole Loan documents.
A “Cash Sweep Event Cure” means (a) with respect to clause (i) above, the acceptance by the lender of a cure of such event of default (b) with respect to clause (ii) above, (1) only with respect to a bankruptcy action of a property manager, the borrowers replaces the property manager with a qualified manager under a replacement management agreement within 60 days of such bankruptcy action or, if such bankruptcy action is involuntary and not consented to or colluded in by the property manager or any of its affiliates, such bankruptcy action is discharged, stayed or dismissed within 60 days of such filing without any adverse consequences to the Innovation Park Whole Loan or the Innovation Park Property, determined in the lender’s sole discretion, and (2) only with respect to a bankruptcy action of the borrower that is involuntary and not consented to or colluded in by the borrower, if such bankruptcy action is involuntary and not consented to or colluded in by the property manager or any of its affiliates, such bankruptcy action is discharged, stayed or dismissed within 60 days of such filing without any adverse consequences to the Innovation Park Whole Loan or the Innovation Park Property, determined in the lender’s sole discretion, (c) with respect to clause (iii) above, the debt service coverage ratio (as calculated in the Innovation park Whole Loan documents and based on the trailing six-month period immediately preceding the date of determination) is at least 1.75x for two consecutive quarters, or (d) with respect to clause (iv) above, such event of default relating to any New Mezzanine Loan (as defined below) has been cured in accordance with the terms of the related New Mezzanine Loan documents. Each cure is also subject to the following conditions: (1) no other event of default may have occurred and be continuing; (2) a Cash Sweep Event Cure may occur no more than a total of two times in the aggregate during the term of the Innovation Park Whole Loan; (3) a Cash Sweep Event Cure following a DSCR trigger event may occur an unlimited number of times during the term of the Innovation Park Whole Loan and (4) the borrower pays the lender’s reasonable expenses in connection with such cure. Notwithstanding the foregoing, except as provide in clause (b)(2) above, in no event will the borrower have the right to cure a Cash Sweep Event occurring from a bankruptcy of the borrower.
| THE INFORMATION IN THIS STRUCTURAL AND COLLATERAL TERM SHEET IS NOT COMPLETE AND MAY BE AMENDED PRIOR TO THE TIME OF SALE. THIS TERM SHEET IS NOT AN OFFER TO SELL THESE SECURITIES AND IT IS NOT A SOLICITATION OF AN OFFER TO BUY THESE SECURITIES IN ANY JURISDICTION WHERE THE OFFER OR SALE IS NOT PERMITTED. |
| |
| | 60 of 145 | |
| Structural and Collateral Term Sheet | | JPMDB 2019-COR6 |
| |
| Innovation Park |
Future Mezzanine or Subordinate Indebtedness Permitted.So long as no new transfer and assumption mezzanine loan is then currently outstanding, in connection with a bona fide sale of the Innovation Park Property to a third party or funding tenant improvement and leasing commission obligations under any new lease approved by the lender and any new mezzanine lender in order to convert the existing industrial space at the Innovation Park Property to office use (individually and collectively, a “New Mezzanine Loan”),the direct or indirect equity holders of the borrower are permitted to incur a New Mezzanine Loan from an institutional lender secured by a pledge of their direct or indirect equity interests in the borrower so long as, among other things: (a) no event of default has occurred and is continuing, (b) the lender and such institutional lender have entered into a customary subordination and intercreditor agreement reasonably acceptable to the lender, (c) immediately after giving effect to the closing of such mezzanine loan, the loan-to-value ratio (as calculated in the Innovation Park Whole Loan documents) may not exceed 68.8%, (d) immediately after giving effect to the closing of such mezzanine loan, the debt service coverage ratio (as calculated in the Innovation Park Whole Loan documents) is not less than 2.46x, (e) the maturity date of the mezzanine loan is not earlier than the maturity date of the Innovation Park Whole Loan and (f) rating agency confirmation is obtained.
Partial Release.None.
| THE INFORMATION IN THIS STRUCTURAL AND COLLATERAL TERM SHEET IS NOT COMPLETE AND MAY BE AMENDED PRIOR TO THE TIME OF SALE. THIS TERM SHEET IS NOT AN OFFER TO SELL THESE SECURITIES AND IT IS NOT A SOLICITATION OF AN OFFER TO BUY THESE SECURITIES IN ANY JURISDICTION WHERE THE OFFER OR SALE IS NOT PERMITTED. |
| |
| | 61 of 145 | |
| Structural and Collateral Term Sheet | | JPMDB 2019-COR6 |
| |
| 12555 & 12655 Jefferson |

| THE INFORMATION IN THIS STRUCTURAL AND COLLATERAL TERM SHEET IS NOT COMPLETE AND MAY BE AMENDED PRIOR TO THE TIME OF SALE. THIS TERM SHEET IS NOT AN OFFER TO SELL THESE SECURITIES AND IT IS NOT A SOLICITATION OF AN OFFER TO BUY THESE SECURITIES IN ANY JURISDICTION WHERE THE OFFER OR SALE IS NOT PERMITTED. |
| |
| | 62 of 145 | |
| Structural and Collateral Term Sheet | | JPMDB 2019-COR6 |
| |
| 12555 & 12655 Jefferson |
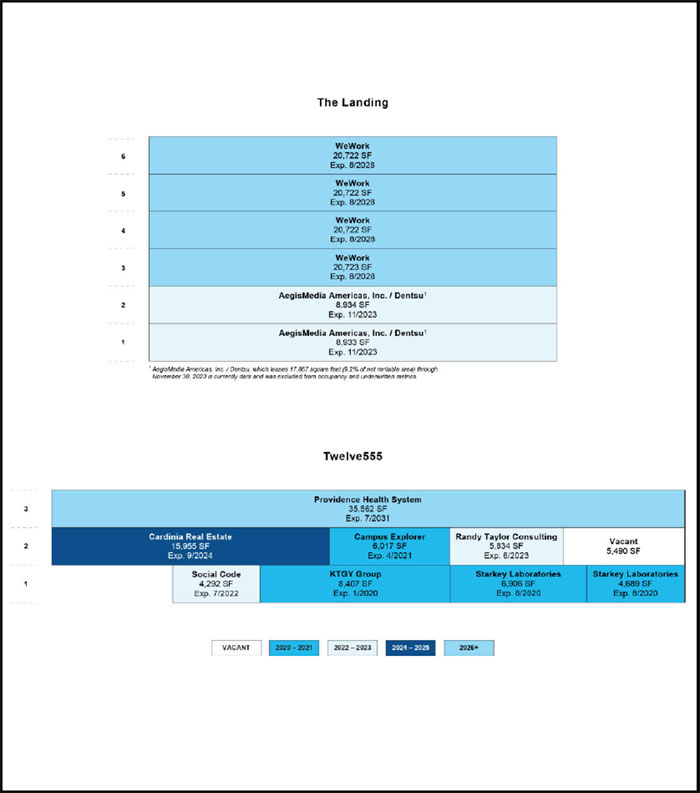
| THE INFORMATION IN THIS STRUCTURAL AND COLLATERAL TERM SHEET IS NOT COMPLETE AND MAY BE AMENDED PRIOR TO THE TIME OF SALE. THIS TERM SHEET IS NOT AN OFFER TO SELL THESE SECURITIES AND IT IS NOT A SOLICITATION OF AN OFFER TO BUY THESE SECURITIES IN ANY JURISDICTION WHERE THE OFFER OR SALE IS NOT PERMITTED. |
| |
| | 63 of 145 | |
| Structural and Collateral Term Sheet | | JPMDB 2019-COR6 |
| |
| 12555 & 12655 Jefferson |
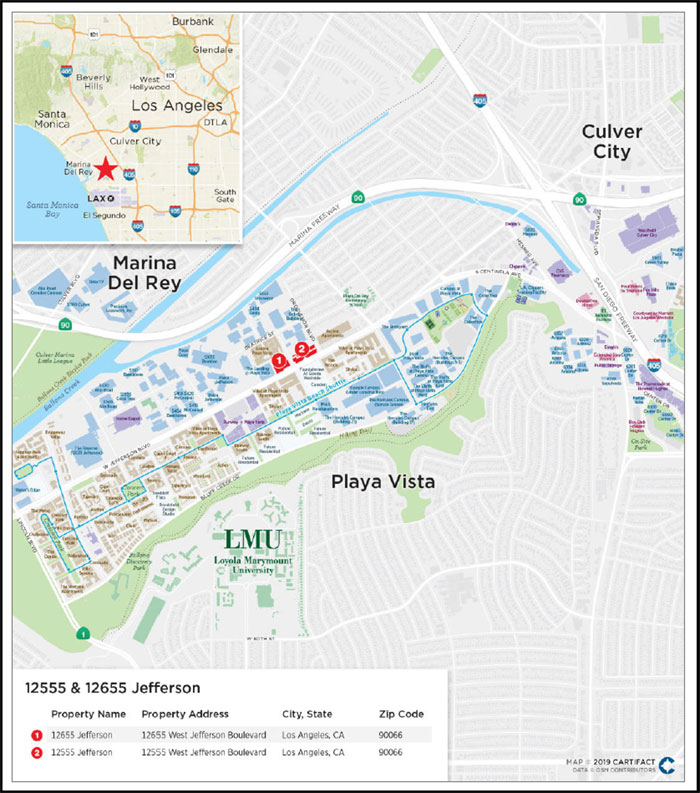
| THE INFORMATION IN THIS STRUCTURAL AND COLLATERAL TERM SHEET IS NOT COMPLETE AND MAY BE AMENDED PRIOR TO THE TIME OF SALE. THIS TERM SHEET IS NOT AN OFFER TO SELL THESE SECURITIES AND IT IS NOT A SOLICITATION OF AN OFFER TO BUY THESE SECURITIES IN ANY JURISDICTION WHERE THE OFFER OR SALE IS NOT PERMITTED. |
| |
| | 64 of 145 | |
| Structural and Collateral Term Sheet | | JPMDB 2019-COR6 |
| |
| 12555 & 12655 Jefferson |
| Mortgage Loan Information | | Property Information |
| Mortgage Loan Seller: | LCM | | Single Asset / Portfolio: | Portfolio |
| Original Principal Balance(1): | $54,000,000 | | Title: | Fee |
| Cut-off Date Principal Balance(1): | $54,000,000 | | Property Type - Subtype: | Office – CBD |
| % of Pool by IPB: | 6.7% | | Net Rentable Area (SF): | 193,908 |
| Loan Purpose: | Refinance | | Location: | Los Angeles, CA |
| Borrowers: | Mani 12555 Jefferson (DE), LLC, | | Year Built / Renovated: | 1985 / Various |
| | Mani Jefferson Landing (DE), LLC | | Occupancy(3): | 88.0% |
| Sponsors: | Simon Mani, Daniel Mani | | Occupancy Date: | 9/1/2019 |
| Interest Rate: | 3.92500% | | Number of Tenants(3): | 8 |
| Note Date: | 9/16/2019 | | 2016 NOI(4): | N/A |
| Maturity Date: | 10/6/2029 | | 2017 NOI: | $6,414,993 |
| Interest-only Period: | 120 months | | 2018 NOI: | $7,943,743 |
| Original Term: | 120 months | | TTM NOI (as of 5/2019): | $8,177,002 |
| Original Amortization: | None | | UW Economic Occupancy: | 87.5% |
| Amortization Type: | Interest Only | | UW Revenues: | $12,691,019 |
| Call Protection(2): | L(25),Def(91),O(4) | | UW Expenses: | $4,254,586 |
| Lockbox / Cash Management: | Soft / Springing | | UW NOI: | $8,436,433 |
| Additional Debt(1): | Yes | | UW NCF: | $7,944,846 |
| Additional Debt Balance(1): | $57,000,000 | | Appraised Value / Per SF: | $186,650,000 / $963 |
| Additional Debt Type(1): | Pari Passu | | Appraisal Date: | 6/28/2019 |
| | | | | |
| Escrows and Reserves(5) | | Financial Information(1) |
| | Initial | Monthly | Initial Cap | | Cut-off Date Loan / SF: | | | | $572 | |
| Taxes: | $1,250,000 | $137,610 | N/A | | Maturity Date Loan / SF: | | | | $572 | |
| Insurance: | $6,000 | $5,900 | N/A | | Cut-off Date LTV: | | | | 59.5% | |
| Replacement Reserves: | $0 | $4,040 | N/A | | Maturity Date LTV: | | | | 59.5% | |
| TI/LC: | $2,538,191 | $16,159 | Various | | UW NCF DSCR: | | | | 1.80x | |
| Other | $3,544,603 | $0 | N/A | | UW NOI Debt Yield: | | | | 7.6% | |
| | | | | | | | |
| | | | | | | | |
|
| Sources and Uses |
| Sources | Proceeds | % of Total | | Uses | Proceeds | % of Total |
| Whole Loan(1) | $111,000,000 | 96.1% | | Payoff Existing Debt | $107,473,387 | 93.1% |
| Sponsor Equity | 4,482,179 | 3.9 | | Upfront Reserves | 7,338,794 | 6.4 |
| | | | | Closing Costs | 669,997 | 0.6 |
| Total Sources | $115,482,179 | 100.0% | | Total Uses | $115,482,179 | 100.0% |
| | | | | | | | | | | | | | | | |
| (1) | The 12555 & 12655 Jefferson Loan (as defined below) is part of a whole loan evidenced by threepari passu notes, with an aggregate outstanding principal balance as of the Cut-off Date of $111.0 million. The Financial Information presented in the chart above reflects the Cut-off Date Balance of the $111.0 million 12555 & 12655 Jefferson Whole Loan (as defined below). |
| (2) | The lockout period will be at least 25 payment dates beginning with and including the first payment date of November 6, 2019. Defeasance of the full 12555 & 12655 Jefferson Whole Loan is permitted after the date that is the earlier to occur of the payment date that is (i) two years after the closing date of the securitization that includes the last pari passu note to be securitized and (ii) April 6, 2023. The assumed lockout period of 25 payments is based on the expected JPMDB 2019-COR6 securitization closing date in November 2019. The actual lockout period may be longer. |
| (3) | Occupancy and number of tenants excludes AegisMedia Americas, Inc. / Dentsu, which currently leases 17,867 square feet (9.2% of net rentable area) through November 30, 2023 but is currently dark. Including this tenant, the 12555 & 12655 Jefferson Properties (as defined below) are 97.2% leased. |
| (4) | 2016 NOI is not available as the 12555 & 12655 Jefferson Properties (as defined below) were significantly renovated during this time. |
| (5) | For a full description of Escrows and Reserves, please refer to“Escrows and Reserves”below. |
| THE INFORMATION IN THIS STRUCTURAL AND COLLATERAL TERM SHEET IS NOT COMPLETE AND MAY BE AMENDED PRIOR TO THE TIME OF SALE. THIS TERM SHEET IS NOT AN OFFER TO SELL THESE SECURITIES AND IT IS NOT A SOLICITATION OF AN OFFER TO BUY THESE SECURITIES IN ANY JURISDICTION WHERE THE OFFER OR SALE IS NOT PERMITTED. |
| |
| | 65 of 145 | |
| Structural and Collateral Term Sheet | | JPMDB 2019-COR6 |
| |
| 12555 & 12655 Jefferson |
The Loan. The 12555 & 12655 Jefferson loan, with a principal balance of $54.0 million as of the Cut-off Date (the “12555 & 12655 Jefferson Loan”), is secured by a first mortgage lien on the borrowers’ fee simple interest in two adjacent office properties comprised of 193,908 square feet of net rentable area (the “12555 & 12655 Jefferson Properties”) located in Los Angeles, California. The 12555 & 12655 Jefferson Loan is part of a whole loan that has an aggregate outstanding principal balance as of the Cut-off Date of $111.0 million (the “12555 & 12655 Jefferson Whole Loan”) and is comprised of threepari passu notes, each as described in the “Whole Loan Summary” chart below. The controlling Note A-1, with an aggregate outstanding principal balance as of the Cut-off Date of $54.0 million, is being contributed to the JPMDB 2019-COR6 Trust. The non-controlling Notes A-2 and A-3, with an aggregate outstanding principal balance as of the Cut-off Date of $57.0 million, are held by LCM or an affiliate and expected to be contributed to one or more future securitizations or may otherwise be transferred at any time. The relationship between the holders of the 12555 & 12655 Jefferson Whole Loan will be governed by a co-lender agreement as described under “Description of the Mortgage Pool—The Whole Loans—The Serviced Pari Passu Whole Loans” in the Preliminary Prospectus. The 12555 & 12655 Jefferson Loan has a 10-year term and will be interest only for the entire term. The most recent prior financing of the 12555 & 12655 Jefferson Properties was not included in a securitization.
| Whole Loan Summary |
| Note | Original Balance | Cut-off Date Balance | Note Holder | Controlling Piece |
| A-1 | $54,000,000 | $54,000,000 | JPMDB 2019-COR6 | Yes |
| A-2 | 30,000,000 | 30,000,000 | LCM | No |
| A-3 | 27,000,000 | 27,000,000 | LCM | No |
| Total | $111,000,000 | $111,000,000 | | |
The Borrowers. The borrowing entities are Mani 12555 Jefferson (DE), LLC and Mani Jefferson Landing (DE), LLC, each a Delaware limited liability company and special purpose entity structured to be bankruptcy remote with two independent directors. Legal counsel to the borrowers delivered a non-consolidation opinion in connection with the origination of the 12555 & 12655 Jefferson Whole Loan.
The Loan Sponsors.The loan sponsors and nonrecourse carve-out guarantors are Simon Mani and Daniel Mani, on a joint and several basis. Simon Mani and Daniel Mani founded Mani Brothers Real Estate Investment Group, a privately-held real estate investment firm that owns, renovates, operates, manages and leases 1.3 million square feet of commercial property.
The loan sponsors acquired the 12655 Jefferson property (“The Landing”) in November 2017 for approximately $80.0 million. In addition to the purchase price of $80.0 million, the loan sponsors were responsible for the payment of approximately $1.2 million in rent abatements and approximately $800,000 in leasing commissions, increasing the effective purchase price to approximately $82.0 million. The prior owner, Hudson Pacific Properties (“HPP”), acquired The Landing physically vacant in 2014, but 100.0% leased to Edutrek International (“Edutrek”) under an existing lease that was to expire in July 2015 who vacated the building in 2009. After the Edutrek lease expired in July 2015, HPP commenced an approximately $10.0 million renovation including capital repairs, core and shell work and leasing costs to bring occupancy at The Landing to 100.0%.
The loan sponsors acquired the 12555 Jefferson property (“Twelve555”) in March 2015 for approximately $48.5 million in an off-market transaction. At the time of acquisition, Twelve555 was 60.4% leased. Since acquiring Twelve555, the loan sponsors commenced an approximately $8.0 million renovation to the common areas, lobby and the façade. Additionally, a new space on the first floor was created by enclosing a portion of the building on the ground level which added 4,127 rentable square feet. After completing the renovation, the loan sponsors secured a new 15-year lease with Providence Health System (“Providence”) (rated Aa3/AA-/AA- by Moody’s/Fitch/S&P) for the entire third floor, significantly increasing the value of Twelve555. The loan sponsors report a total cost basis in the 12555 & 12655 Jefferson Properties of approximately $138.5 million.
| Portfolio Summary |
| Property Name | Year Built /
Renovated | Total SF | % of Total | Occupancy(1)(2) | UW NOI | Allocated Whole
Loan Original
Balance | Appraised
Value |
| The Landing | 1985 / 2015-2016 | 100,756 | 52.0% | 82.3% | $3,709,962 | $56,000,000 | $94,150,000 |
| Twelve555 | 1985 / 2016-2017 | 93,152 | 48.0% | 94.1% | 4,726,471 | 55,000,000 | 92,500,000 |
| Total / Wtd. Avg. | | 193,908 | 100.0% | 88.0% | $8,436,433 | $111,000,000 | $186,650,000 |
| | | | | | | | | |
| (1) | Based on the underwritten rent rolls dated as of September 1, 2019. |
| (2) | Occupancy excludes AegisMedia Americas, Inc. / Dentsu, which currently leases 17,867 square feet (9.2% of net rentable area) through November 30, 2023 but is currently dark. Including this tenant, the 12555 & 12655 Jefferson Properties are 97.2% leased. |
| THE INFORMATION IN THIS STRUCTURAL AND COLLATERAL TERM SHEET IS NOT COMPLETE AND MAY BE AMENDED PRIOR TO THE TIME OF SALE. THIS TERM SHEET IS NOT AN OFFER TO SELL THESE SECURITIES AND IT IS NOT A SOLICITATION OF AN OFFER TO BUY THESE SECURITIES IN ANY JURISDICTION WHERE THE OFFER OR SALE IS NOT PERMITTED. |
| |
| | 66 of 145 | |
| Structural and Collateral Term Sheet | | JPMDB 2019-COR6 |
| |
| 12555 & 12655 Jefferson |
The Properties.The 12555 & 12655 Jefferson Properties are comprised of two, adjacent, Class A office properties comprised of 193,908 square feet of net rentable area located on the north side of Jefferson Boulevard, between Centinela Avenue to the north and Lincoln Boulevard to the south, in the Playa Vista community within West Los Angeles.
The Landing is a six-story, multi-tenant, Class A office building situated on a 1.11-acre site. The Landing was built in 1985 and was most recently renovated between 2015 and 2016. The Landing also includes a parking garage totaling 268 spaces (approximately 2.7 spaces per 1000 square feet). As of the September 1, 2019 underwritten rent roll, The Landing was 100.0% leased by two tenants; however, AegisMedia Americas, Inc. / Dentsu, which currently leases 17,867 square feet (9.2% of net rentable area) through November 30, 2023, is currently dark and has been excluded from the underwriting. Excluding AegisMedia Americas, Inc. / Dentsu, The Landing is 82.3% occupied at an underwritten base rent equal to $57.72 per square foot.
Twelve555 is three-story, multi-tenant, Class A office building situated on a 1.876-acre site. Twelve555 was built in 1985 and was most recently renovated between 2016-2017. Twelve555 also includes a parking garage totaling 307 spaces (approximately 3.3 spaces per 1,000 square feet). As of the September 1, 2019 underwritten rent roll, Twelve555 was 94.1% leased to seven tenants at a weighted average underwritten base rent equal to $47.55 per square foot.
As of the September 1, 2019 underwritten rent rolls, the 12555 & 12655 Jefferson Properties were 88.0% occupied by eight tenants at a weighted average underwritten base rent equal to $52.49 per square foot excluding AegisMedia Americas, Inc. / Dentsu, which currently leases 17,867 square feet (9.2% of net rentable area) through November 30, 2023 but is currently dark.
The largest tenant at the 12555 & 12655 Jefferson Properties is WeWork (82,889 square feet; 42.7% of net rentable area; 53.4% of underwritten base rent). WeWork provides furnished and fully-serviced shared workspaces, primarily to small and midmarket enterprises. WeWork has been a tenant since 2016 and has a lease expiration of August 2028 with one, five-year renewal option remaining and no termination options. WeWork currently pays UW base rent equal to $57.72 per square foot.
The second largest tenant at the 12555 & 12655 Jefferson Properties is Providence (35,562 square feet; 18.3% of net rentable area; 23.2% of underwritten base rent; rated Aa3/AA-/AA- by Moody’s/Fitch/S&P). Providence is the third largest not-for-profit health system in the United States. Providence’s system includes more than 82,000 employees with services including acute care, physician clinics, long-term and assisted living, palliative and hospice care, home health, supportive housing and education. Providence has been a tenant since2016 and has a lease expiration of July 2031 with two, five-year renewal options remaining and no termination options. Providence currently pays base rent equal to $49.83 per square foot. UW base rent of $58.41 is based on average rent over the loan term.
The third largest tenant at the 12555 & 12655 Jefferson Properties is Cardinia Real Estate (“Cardinia”) (15,955 square feet; 8.2% of net rentable area; 7.0% of underwritten base rent). Cardinia is a subsidiary of Ominicom Group, a global network of leading marketing communications companies which offers a range of marketing solutions including brand advertising, customer relationship management, media planning and buying services, public relations and numerous specialty communications services. Cardinia has been a tenant since 2018 and has a lease expiration of September 2024 with two renewal options (one, five-year and one, four-year) remaining and no termination options. Cardinia currently pays base rent equal to $37.95 per square foot. Cardinia’s base rent steps to $39.08 per square foot on 10/1/2020.
The 12555 & 12655 Jefferson Properties are located in the Marina Del Rey/Venice office submarket, within the overall Los Angeles office market. According to a market report, as of the third quarter of 2019, the overall Los Angeles office market contained approximately 443.2 million square feet across 18,715 buildings with an overall market vacancy of 9.8% and average asking rents of approximately $37.96 per square foot. As of the third quarter of 2019, the Marina Del Rey/Venice office submarket contained approximately 10.3 million square feet across 453 buildings with an overall market vacancy of 11.5% and average asking rents of approximately $59.65 per square foot.
The appraisals for 12555 & 12655 Jefferson Properties included 14 rent comparables. Of the 14 comparables, one was triple net (“NNN”) with the remaining 13 full service gross (“FSG”). The one NNN rent comparable was equal to $40.80 per square foot while the 13 FSG rent comparables ranged from $51.60 to $72.00 per square foot with a weighted average of approximately $62.97 per square foot.
| THE INFORMATION IN THIS STRUCTURAL AND COLLATERAL TERM SHEET IS NOT COMPLETE AND MAY BE AMENDED PRIOR TO THE TIME OF SALE. THIS TERM SHEET IS NOT AN OFFER TO SELL THESE SECURITIES AND IT IS NOT A SOLICITATION OF AN OFFER TO BUY THESE SECURITIES IN ANY JURISDICTION WHERE THE OFFER OR SALE IS NOT PERMITTED. |
| |
| | 67 of 145 | |
| Structural and Collateral Term Sheet | | JPMDB 2019-COR6 |
| |
| 12555 & 12655 Jefferson |
| Historical and Current Occupancy(1) |
| 2016(2) | 2017 | 2018 | Current(3)(4) |
| N/A | 90.6% | 93.7% | 88.0% |
| (1) | Historical Occupancies are as of December 31 of eachrespective year. |
| (2) | 2016 Occupancy is not available as the 12555 & 12655 Jefferson Properties were significantly renovated during this time. |
| (3) | Current Occupancy is as of the rent rolls dated September 1, 2019. |
| (4) | Current Occupancy excludes AegisMedia Americas, Inc. / Dentsu, which currently leases 17,867 square feet (9.2% of net rentable area) through November 30, 2023 but is currently dark. Including this tenant, the 12555 & 12655 Jefferson Properties are 97.2% leased. |
| Tenant Summary(1) |
| Tenant | Ratings
Moody’s/Fitch/S&P(2) | Net Rentable
Area (SF) | % of
Total NRA | Base Rent
PSF(3) | % of Total
Base Rent(3) | Lease
Expiration Date |
| WeWork(4) | NR / CCC / B- | 82,889 | 42.7% | $57.72 | 53.4% | 8/31/2028 |
| Providence Health System(4) | Aa3 / AA- / AA- | 35,562 | 18.3% | $58.41 | 23.2% | 7/31/2031 |
| Cardinia Real Estate(4) | Baa1 / NR / BBB+ | 15,955 | 8.2% | $39.08 | 7.0% | 9/30/2024 |
| Starkey Laboratories(4)(5) | NR / NR / NR | 11,595 | 6.0% | $36.81 | 4.8% | 8/31/2020 |
| KTGY Group(4) | NR / NR / NR | 8,407 | 4.3% | $36.86 | 3.5% | 1/14/2020 |
| Campus Explorer(4) | NR / NR / NR | 6,017 | 3.1% | $45.19 | 3.0% | 4/30/2021 |
| Randy Taylor Consulting(4) | NR / NR / NR | 5,834 | 3.0% | $43.88 | 2.9% | 6/30/2023 |
| Social Code(4) | NR / NR / NR | 4,292 | 2.2% | $47.21 | 2.3% | 7/31/2022 |
| Total Occupied Space | | 170,551 | 88.0% | $52.49 | 100.0% | |
| Vacant | | 23,357 | 12.0% | | | |
| Total | | 193,908 | 100.0% | | | |
| (1) | Based on the underwritten rent rolls dated as of September 1, 2019. |
| (2) | In certain instances, ratings provided are those of the parent company of the entity shown, whether or not the parent company guarantees the lease. |
| (3) | Base Rent includes approximately $178,693 in contractual rent steps through October 2020 for certain tenants and approximately $305,105 of average rent over the loan term for Providence Health System. |
| (4) | WeWork has one, five-year renewal option remaining, Providence Health System has two, five-year renewal options remaining, Cardinia Real Estate has one, four-year renewal option remaining and one five-year renewal option remaining, Starkey Laboratories has one, five-year renewal option remaining, KTGY Group has one, five-year renewal option remaining, Campus Explorer has one, three-year renewal option remaining, Randy Taylor Consulting has one, three-year renewal option remaining and Social Code has one, five-year renewal option remaining. |
| (5) | Starkey Laboratories subleases all of its space to Good Leaf, Inc. through August 31, 2020 at a base rent equal to $37.20 per square foot. |
| Lease Rollover Schedule(1) |
| Year | Number
of Leases
Expiring | Net
Rentable
Area
Expiring | % of
NRA
Expiring | Base Rent
Expiring(2) | % of Base
Rent
Expiring(2) | Cumulative
Net Rentable
Area
Expiring | Cumulative
% of NRA
Expiring | Cumulative
Base Rent
Expiring(2) | | Cumulative
% of Base
Rent
Expiring(2) |
| Vacant | NAP | 23,357 | 12.0% | NAP | NAP | 23,357 | 12.0% | NAP | NAP |
| 2019 & MTM | 0 | 0 | 0.0% | $0 | 0.0% | 23,357 | 12.0% | $0 | 0.0% |
| 2020 | 2 | 20,002 | 10.3% | 736,690 | 8.2% | 43,359 | 22.4% | $736,690 | 8.2% |
| 2021 | 1 | 6,017 | 3.1% | 271,934 | 3.0% | 49,376 | 25.5% | $1,008,624 | 11.3% |
| 2022 | 1 | 4,292 | 2.2% | 202,607 | 2.3% | 53,668 | 27.7% | $1,211,231 | 13.5% |
| 2023 | 1 | 5,834 | 3.0% | 255,984 | 2.9% | 59,502 | 30.7% | $1,467,215 | 16.4% |
| 2024 | 1 | 15,955 | 8.2% | 623,578 | 7.0% | 75,457 | 38.9% | $2,090,794 | 23.4% |
| 2025 | 0 | 0 | 0.0% | 0 | 0.0% | 75,457 | 38.9% | $2,090,794 | 23.4% |
| 2026 | 0 | 0 | 0.0% | 0 | 0.0% | 75,457 | 38.9% | $2,090,794 | 23.4% |
| 2027 | 0 | 0 | 0.0% | 0 | 0.0% | 75,457 | 38.9% | $2,090,794 | 23.4% |
| 2028 | 1 | 82,889 | 42.7% | 4,784,353 | 53.4% | 158,346 | 81.7% | $6,875,147 | 76.8% |
| 2029 | 0 | 0 | 0.0% | 0 | 0.0% | 158,346 | 81.7% | $6,875,147 | 76.8% |
| 2030 & Beyond | 1 | 35,562 | 18.3% | 2,077,101 | 23.2% | 193,908 | 100.0% | $8,952,248 | 100.0% |
| Total | 8 | 193,908 | 100.0% | $8,952,248 | 100.0% | | | | |
| | | | | | | | | | | |
| (1) | Based on the underwritten rent rolls dated September 1, 2019. |
| (2) | Base Rent Expiring includes approximately $178,693 in contractual rent steps through October 2020 for certain tenants and approximately $305,105 of average rent over the loan term for Providence Health System. |
| THE INFORMATION IN THIS STRUCTURAL AND COLLATERAL TERM SHEET IS NOT COMPLETE AND MAY BE AMENDED PRIOR TO THE TIME OF SALE. THIS TERM SHEET IS NOT AN OFFER TO SELL THESE SECURITIES AND IT IS NOT A SOLICITATION OF AN OFFER TO BUY THESE SECURITIES IN ANY JURISDICTION WHERE THE OFFER OR SALE IS NOT PERMITTED. |
| |
| | 68 of 145 | |
| Structural and Collateral Term Sheet | | JPMDB 2019-COR6 |
| |
| 12555 & 12655 Jefferson |
| Operating History and Underwritten Net Cash Flow |
| | 2017 | 2018 | TTM(1) | Underwritten | Per Square Foot | %(2) |
| Rents in Place | $6,720,770 | $8,568,895 | $8,685,684 | $8,468,449 | $43.67 | 59.7% |
| Straight Line Rent(3) | 0 | 0 | 0 | 305,105 | 1.57 | 2.2 |
| Contractual Rent Steps(4) | 0 | 0 | 0 | 178,693 | 0.92 | 1.3 |
| Vacant Income | 0 | 0 | 0 | 1,482,532 | 7.65 | 10.5 |
| Gross Potential Rent | $6,720,770 | $8,568,895 | $8,685,684 | $10,434,780 | $53.81 | 73.6% |
| Total Reimbursements | 1,342,889 | 1,504,938 | 1,587,427 | 1,753,297 | 9.04 | 12.4 |
| Total Other Income(5) | 1,594,176 | 1,861,639 | 1,985,475 | 1,985,475 | 10.24 | 14.0 |
| Net Rental Income | $9,657,835 | $11,935,471 | $12,258,586 | $14,173,551 | $73.09 | 100.0% |
| (Vacancy/Credit Loss) | 0 | 0 | 0 | (1,482,532) | (7.65) | (10.5) |
| Effective Gross Income | $9,657,835 | $11,935,471 | $12,258,586 | $12,691,019 | $65.45 | 89.5% |
| | | | | | | |
| Total Expenses | $3,242,842 | $3,991,728 | $4,081,585 | $4,254,586 | $21.94 | 33.5% |
| | | | | | | |
| Net Operating Income | $6,414,993 | $7,943,743 | $8,177,002 | $8,436,433 | $43.51 | 66.5% |
| | | | | | | |
| Total TI/LC, CapEx/RR | 0 | 0 | 0 | 491,587 | 2.54 | 3.9 |
| | | | | | | |
| Net Cash Flow | $6,414,993 | $7,943,743 | $8,177,002 | $7,944,846 | $40.97 | 62.6% |
| | | | | | | | | | | | |
| (1) | TTM column represents the trailing 12-month period ending May 31, 2019. |
| (2) | % column represents percent of Net Rental Income for all revenue lines and represents percent of Effective Gross Income for the remainder of the fields. |
| (3) | Based on the average rent over the loan term for investment grade tenant Providence Health System. |
| (4) | Based on the contractual rent steps through October 2020 for certain tenants. |
| (5) | Total Other Income includes parking income ($1,966,366) and miscellaneous other income ($19,109). |
Property Management.The 12555 & 12655 Jefferson Properties are managed by Mani Brothers, LLC, an affiliate of the borrowers.
Escrows and Reserves. At origination, the borrowers deposited into escrow $3,500,000 for an Earnout Reserve (as defined below), $2,538,191 for outstanding tenant improvements and leasing commissions, $1,250,000 for real estate taxes, $44,603 for outstanding free rent and $6,000 for insurance premiums.
Tax Escrows– On a monthly basis,the borrowers are required to escrow 1/12 of the annual estimated tax payments, which currently equates to $137,610.
Insurance Escrows– On a monthly basis,the borrowers are required to escrow 1/12 of the annual estimated insurance premiums, which currently equates to $5,900.
Replacement Reserves –On a monthly basis, the borrowers are required to escrow approximately $4,040 for replacement reserves.
TI/LC Reserves – On a monthly basis, the borrowers are required to escrow $16,159 for tenant improvements and leasing commissions, subject to a cap of (i) $1,000,000 if the 12555 & 12655 Jefferson Properties are less than 94.0% leased or (ii) $400,000 if 12555 & 12655 Jefferson Properties are greater than or equal to 94.0% leased.
Earnout Reserve– Provided no default or event of default has occurred and is continuing, the lender will release the $3,500,000 in the Earnout Reserve to the borrowers upon the 12555 & 12655 Jefferson Properties achieving a debt yield equal to or greater than 7.5%.
| THE INFORMATION IN THIS STRUCTURAL AND COLLATERAL TERM SHEET IS NOT COMPLETE AND MAY BE AMENDED PRIOR TO THE TIME OF SALE. THIS TERM SHEET IS NOT AN OFFER TO SELL THESE SECURITIES AND IT IS NOT A SOLICITATION OF AN OFFER TO BUY THESE SECURITIES IN ANY JURISDICTION WHERE THE OFFER OR SALE IS NOT PERMITTED. |
| |
| | 69 of 145 | |
| Structural and Collateral Term Sheet | | JPMDB 2019-COR6 |
| |
| 12555 & 12655 Jefferson |
Lockbox / Cash Management.The 12555 & 12655 Jefferson Whole Loan is structured with a soft lockbox and springing cash management. All rents are required to be deposited into a lockbox account within one business day of receipt by the borrower or property manager. All funds in the lockbox account are required to be swept daily into the borrowers’ operating account, unless a Cash Management Period (as defined below) is continuing. Upon the occurrence of a Cash Management Period, funds in the lockbox account will be swept daily into a lender-controlled account, from which account such funds will be disbursed on each payment date in accordance with the 12555 & 12655 Jefferson Whole Loan documents and any excess will be retained by the lender as additional collateral for the 12555 & 12655 Jefferson Whole Loan.
A “Cash Management Period” will commence (i) upon an event of default, (ii) if the debt yield is less than 5.4% (a “Cash Management Debt Yield Trigger”) (until such time that the debt yield is greater than or equal to 5.4% for two consecutive quarters) or (iii) upon a Lease Sweep Period (as defined below).
Notwithstanding the foregoing, the borrowers may avoid the commencement or continuance of Cash Management Period by depositing with lender cash or a letter of credit (“LOC”) which (i) with respect to a Cash Management Debt Yield Trigger, the amount of such cash or LOC when added to the net operating income of the 12555 & 12655 Jefferson Properties would result in a debt yield that is equal to or greater than 5.4% or (ii) with respect to a Cash Management Period triggered by a Lease Sweep Period, cash or an LOC in an amount equal to $1,300,000.
A “Lease Sweep Period” will commence (i) with respect to the WeWork or Providence leases (but not any other lease that is a Lease Sweep Lease (as defined below)), upon the earlier to occur of (x) on the date that is 12 months prior to the end of the lease term (including any renewal terms), or (y) on the date by which the applicable Lease Sweep Tenant (defined below) is required to give notice of its exercise of a renewal option under the Leases Sweep Lease (and such renewal has not so been exercised), (ii) if any Lease Sweep Lease is surrendered, cancelled or terminated prior to its then-current expiration date, (iii) if any Lease Sweep Tenant goes dark or gives notice that it intends to discontinue its business at its premises, (iv) upon the occurrence and continuance of a monetary or material non-monetary default under any Lease Sweep Lease or (vi) upon the occurrence of a Lease Sweep Tenant insolvency proceeding.
Notwithstanding the foregoing, the borrowers may avoid the commencement or continuance of a Lease Sweep Period, provided that the borrowers deposit with lender cash or a LOC in an amount equal to $2,200,000.
A “Lease Sweep Lease” means the WeWork lease, the Providence lease and any other lease which covers 25,000 or more square feet.
A “Lease Sweep Tenant” means any tenant under a Lease Sweep Lease, or under one or more leases (leased by such tenant and/or its affiliates) which when taken together would constitute a Lease Sweep Lease.
Additional Debt. None.
Release Provisions. None.
| THE INFORMATION IN THIS STRUCTURAL AND COLLATERAL TERM SHEET IS NOT COMPLETE AND MAY BE AMENDED PRIOR TO THE TIME OF SALE. THIS TERM SHEET IS NOT AN OFFER TO SELL THESE SECURITIES AND IT IS NOT A SOLICITATION OF AN OFFER TO BUY THESE SECURITIES IN ANY JURISDICTION WHERE THE OFFER OR SALE IS NOT PERMITTED. |
| |
| | 70 of 145 | |
| Structural and Collateral Term Sheet | | JPMDB 2019-COR6 |
[THIS PAGE INTENTIONALLY LEFT BLANK]
| THE INFORMATION IN THIS STRUCTURAL AND COLLATERAL TERM SHEET IS NOT COMPLETE AND MAY BE AMENDED PRIOR TO THE TIME OF SALE. THIS TERM SHEET IS NOT AN OFFER TO SELL THESE SECURITIES AND IT IS NOT A SOLICITATION OF AN OFFER TO BUY THESE SECURITIES IN ANY JURISDICTION WHERE THE OFFER OR SALE IS NOT PERMITTED. |
| |
| | 71 of 145 | |
| Structural and Collateral Term Sheet | | JPMDB 2019-COR6 |
| |
| Hyde Park Multifamily Portfolio |
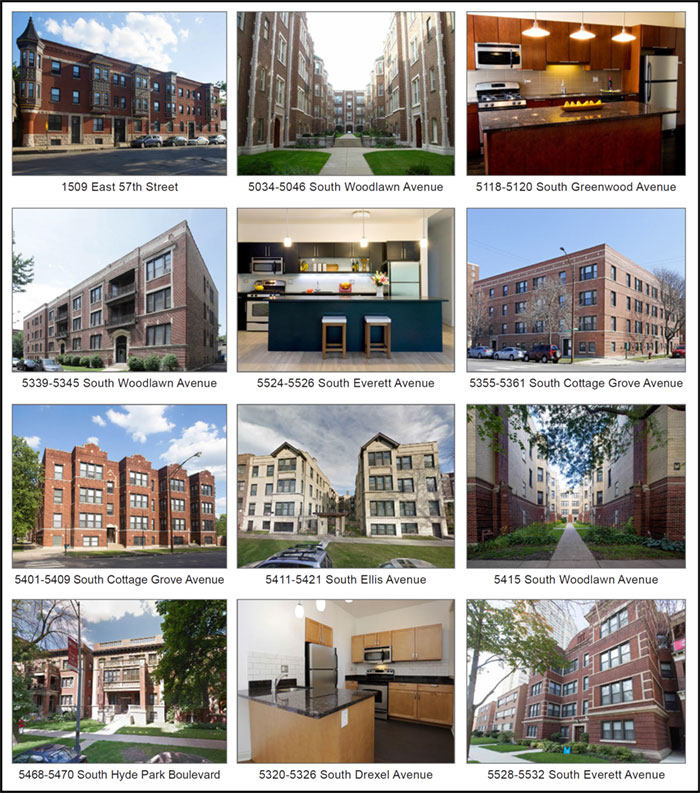
| THE INFORMATION IN THIS STRUCTURAL AND COLLATERAL TERM SHEET IS NOT COMPLETE AND MAY BE AMENDED PRIOR TO THE TIME OF SALE. THIS TERM SHEET IS NOT AN OFFER TO SELL THESE SECURITIES AND IT IS NOT A SOLICITATION OF AN OFFER TO BUY THESE SECURITIES IN ANY JURISDICTION WHERE THE OFFER OR SALE IS NOT PERMITTED. |
| |
| | 72 of 145 | |
| Structural and Collateral Term Sheet | | JPMDB 2019-COR6 |
| |
| Hyde Park Multifamily Portfolio |
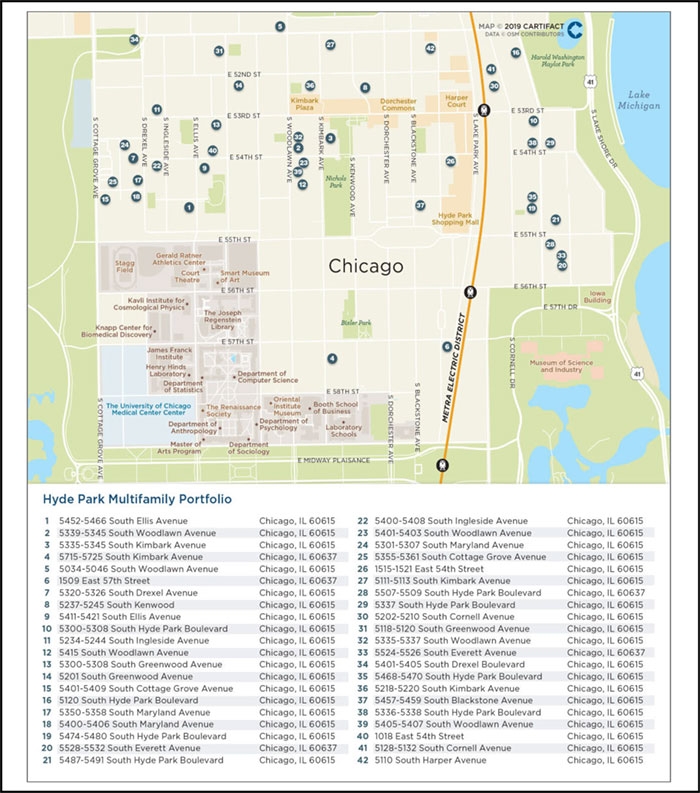
| THE INFORMATION IN THIS STRUCTURAL AND COLLATERAL TERM SHEET IS NOT COMPLETE AND MAY BE AMENDED PRIOR TO THE TIME OF SALE. THIS TERM SHEET IS NOT AN OFFER TO SELL THESE SECURITIES AND IT IS NOT A SOLICITATION OF AN OFFER TO BUY THESE SECURITIES IN ANY JURISDICTION WHERE THE OFFER OR SALE IS NOT PERMITTED. |
| |
| | 73 of 145 | |
| Structural and Collateral Term Sheet | | JPMDB 2019-COR6 |
| |
| Hyde Park Multifamily Portfolio |
| Mortgage Loan Information | | Properties Information |
| Mortgage Loan Seller: | LCM | | Single Asset / Portfolio: | Portfolio |
| Original Principal Balance(1): | $46,750,000 | | Title: | Fee |
| Cut-off Date Principal Balance(1): | $46,750,000 | | Properties Type – Subtype: | Multifamily – Various |
| % of Pool by IPB: | 5.8% | | Net Rentable Area (Units)(3): | 839 |
| Loan Purpose: | Refinance | | Location: | Chicago, IL |
| Borrowers(2): | Various | | Year Built/Renovated: | Various / Various |
| Sponsor: | Lyrical-Antheus Realty Partners | | Occupancy(3): | 94.5% |
| | II, L.P. | | Occupancy Date: | 7/31/2019 |
| Interest Rate: | 4.55400% | | Number of Tenants: | N/A |
| Note Date: | 1/30/2019 | | 2016 NOI: | $7,979,218 |
| Maturity Date: | 2/6/2029 | | 2017 NOI: | $8,478,846 |
| Interest-only Period: | 120 months | | 2018 NOI: | $8,692,956 |
| Original Term: | 120 months | | TTM NOI (as of 7/2019): | $8,889,707 |
| Original Amortization: | None | | UW Economic Occupancy: | 89.2% |
| Amortization Type: | Interest Only | | UW Revenues: | $15,559,768 |
| Call Protection: | L(33),Def(80),O(7) | | UW Expenses: | $6,319,284 |
| Lockbox / Cash Management: | Springing / Springing | | UW NOI: | $9,240,484 |
| Additional Debt(1): | Yes | | UW NCF: | $8,988,484 |
| Additional Debt Balance(1): | $60,000,000 / $15,250,000 | | Appraised Value / Per Unit: | $176,385,000 / $210,232 |
| Additional Debt Type(1): | Pari Passu / Mezzanine Loan | | Appraisal Date: | 12/3/2018 |
| | | | | |
| Escrows and Reserves(4) | | Financial Information(1) |
| | Initial | Monthly | Initial Cap | | | Whole Loan | Total Debt |
| Taxes: | $700,000 | $119,000 | N/A | | Cut-off Date Loan / Unit: | $127,235 | $145,411 |
| Insurance: | $225,000 | Springing | N/A | | Maturity Date Loan / Unit: | $127,235 | $145,411 |
| Replacement Reserves: | $0 | $17,580 | N/A | | Cut-off Date LTV: | 60.5% | 69.2% |
| TI/LC: | $0 | $0 | N/A | | Maturity Date LTV: | 60.5% | 69.2% |
| Other: | $0 | $0 | N/A | | UW NCF DSCR: | 1.82x | 1.48x |
| | | | | | UW NOI Debt Yield: | 8.7% | 7.6% |
| | | | | | | | |
| Sources and Uses |
Sources | Proceeds | % of Total | | Uses | Proceeds | % of Total |
| Whole Loan(1) | $106,750,000 | 87.5 | % | | Payoff Existing Debt | $115,181,393 | 94.4 | % |
| Mezzanine Loan | 15,250,000 | 12.5 | | | Closing Costs | 3,504,348 | 2.9 | |
| | | | | | Upfront Reserves | 925,000 | 0.8 | |
| | | | | �� | Return of Equity | 2,389,259 | 2.0 | |
| Total Sources | $122,000,000 | 100.0 | % | | Total Uses | $122,000,000 | 100.0 | % |
| (1) | The Hyde Park Multifamily Portfolio Loan (as defined below) is part of a whole loan evidenced by twopari passu notes, with an aggregate outstanding principal balance as of the Cut-off Date of approximately $106.8 million. The Financial Information presented in the chart above reflects the Cut-off Date balance of the approximately $106.8 million Hyde Park Multifamily Portfolio Whole Loan (as defined below). |
| (2) | The borrowers are 1515-1521 E. 54th Street, LLC, 5034-5046 S. Woodlawn, LLC, 5111 S. Kimbark, LLC, 5118-5120 S. Greenwood, LLC, 5120 S. Hyde Park, LLC, 5128-5132 S. Cornell, LLC, 5202-5210 S. Cornell, LLC, 5218-5220 S. Kimbark, LLC, 5234-5244 S. Ingleside, LLC, 5237-5245 S. Kenwood, LLC, 5300-5308 S. Hyde Park, LLC, 5301-5307 S. Maryland, LLC, 5320-5326.5 S. Drexel, LLC, 5335-5337 S. Woodlawn, LLC, 5336-5338 S. Hyde Park, LLC, 5337 S. Hyde Park, LLC, 5350-5358 S. Maryland, LLC, 5400-5408 S. Ingleside, LLC, 5401-5403 S. Woodlawn, LLC, 5405-5407 S. Woodlawn, LLC, 5415 S. Woodlawn, LLC, 5452-5466 S. Ellis, LLC, 5457-5459 S. Blackstone, LLC, 5474-5480 S. Hyde Park, LLC, 5487-5491 S. Hyde Park, LLC, 5528-5532 S. Everett, LLC, 5715-5725 S. Kimbark, LLC, Greenwood 5201, LLC, 5524-5526 S. Everett, LLC, 5400-5406 S. Maryland, LLC, 5300-5308 S. Greenwood, LLC, 5335-5345 S. Kimbark, LLC, 5339-5345 S. Woodlawn, LLC, 5355-5361 S. Cottage Grove, LLC, 5401-5409 S. Cottage Grove, LLC, 5401-5405 S. Drexel, LLC, 5411-5421 S. Ellis, LLC, 5468-70 S. Hyde Park, LLC, 1509-1517 E. 57th Street, LLC, 5507-5509 S. Hyde Park, LLC, 1018 E. 54th Street Owner, LLC and 5110 S. Harper, LLC. |
| (3) | The Hyde Park Multifamily Portfolio Properties (as defined below) include 835 residential units that average approximately 891 square feet that are 94.5% occupied and four commercial retail units that average approximately 2,766 square feet and are 100.0% occupied as of the underwritten July 31, 2019 rent rolls. |
| (4) | For a full description of Escrows and Reserves, please refer to the “Escrows and Reserves” below. |
| THE INFORMATION IN THIS STRUCTURAL AND COLLATERAL TERM SHEET IS NOT COMPLETE AND MAY BE AMENDED PRIOR TO THE TIME OF SALE. THIS TERM SHEET IS NOT AN OFFER TO SELL THESE SECURITIES AND IT IS NOT A SOLICITATION OF AN OFFER TO BUY THESE SECURITIES IN ANY JURISDICTION WHERE THE OFFER OR SALE IS NOT PERMITTED. |
| |
| | 74 of 145 | |
| Structural and Collateral Term Sheet | | JPMDB 2019-COR6 |
| |
| Hyde Park Multifamily Portfolio |
The Loan. The Hyde Park Multifamily Portfolio loan, with an original principal balance of approximately $46.8 million (the “Hyde Park Multifamily Portfolio Loan”), is secured by a first mortgage lien on the borrowers’ fee simple interests in 41 multifamily properties (with a total of 835 residential units and four commercial units) and one surface parking lot (with 28 parking spaces) (collectively, the “Hyde Park Multifamily Portfolio Properties” or the “Hyde Park Multifamily Portfolio”) located in the Hyde Park neighborhood of Chicago, Illinois. The Hyde Park Multifamily Portfolio Loan is part of a whole loan that has an aggregate original principal balance as of the Cut-off Date of approximately $106.8 million (the “Hyde Park Multifamily Portfolio Whole Loan”) and is comprised of twopari passu notes, each as described in the “Whole Loan Summary” chart below. The non-controlling Note A-2, with an outstanding principal balance as of the Cut-off Date of approximately $46.8 million, is being contributed to the JPMDB 2019-COR6 Trust. The controlling Note A-1, with an original principal balance as of the Cut-off Date of $60.0 million, was contributed to the JPMCC 2019-COR5 Trust. The relationship between the holders of the Hyde Park Multifamily Portfolio Whole Loan will be governed by a co-lender agreement as described under “Description of the Mortgage Pool—The Whole Loans—The Non-Serviced Pari Passu Whole Loans” in the Preliminary Prospectus. The Hyde Park Multifamily Portfolio Whole Loan has a 10-year term and will be interest only for the entire term. The previously existing debt was not included in a securitization.
| Whole Loan Summary |
| Notes | Original Balance | Cut-off Date Balance | Note Holder | Controlling Piece |
| A-1 | $60,000,000 | $60,000,000 | JPMCC 2019-COR5 | Yes |
| A-2 | 46,750,000 | 46,750,000 | JPMDB 2019-COR6 | No |
| Total | $106,750,000 | $106,750,000 | | |
The Borrowers. The borrowing entities are 1515-1521 E. 54th Street, LLC, 5034-5046 S. Woodlawn, LLC, 5111 S. Kimbark, LLC, 5118-5120 S. Greenwood, LLC, 5120 S. Hyde Park, LLC, 5128-5132 S. Cornell, LLC, 5202-5210 S. Cornell, LLC, 5218-5220 S. Kimbark, LLC, 5234-5244 S. Ingleside, LLC, 5237-5245 S. Kenwood, LLC, 5300-5308 S. Hyde Park, LLC, 5301-5307 S. Maryland, LLC, 5320-5326.5 S. Drexel, LLC, 5335-5337 S. Woodlawn, LLC, 5336-5338 S. Hyde Park, LLC, 5337 S. Hyde Park, LLC, 5350-5358 S. Maryland, LLC, 5400-5408 S. Ingleside, LLC, 5401-5403 S. Woodlawn, LLC, 5405-5407 S. Woodlawn, LLC, 5415 S. Woodlawn, LLC, 5452-5466 S. Ellis, LLC, 5457-5459 S. Blackstone, LLC, 5474-5480 S. Hyde Park, LLC, 5487-5491 S. Hyde Park, LLC, 5528-5532 S. Everett, LLC, 5715-5725 S. Kimbark, LLC, Greenwood 5201, LLC, 5524-5526 S. Everett, LLC, 5400-5406 S. Maryland, LLC, 5300-5308 S. Greenwood, LLC, 5335-5345 S. Kimbark, LLC, 5339-5345 S. Woodlawn, LLC, 5355-5361 S. Cottage Grove, LLC, 5401-5409 S. Cottage Grove, LLC, 5401-5405 S. Drexel, LLC, 5411-5421 S. Ellis, LLC, 5468-70 S. Hyde Park, LLC, 1509-1517 E. 57th Street, LLC, 5507-5509 S. Hyde Park, LLC, 1018 E. 54th Street Owner, LLC and 5110 S. Harper, LLC, each a Delaware limited liability company and special purpose entity structured to be bankruptcy remote with one independent director. Legal counsel to the borrowers delivered a non-consolidation opinion in connection with the origination of the Hyde Park Multifamily Portfolio Whole Loan.
The Loan Sponsor. The loan sponsor and nonrecourse carve-out guarantor is Lyrical-Antheus Realty Partners II, L.P., an affiliate of Antheus Capital. Antheus Capital is a private real estate company focused on the acquisition, development and redevelopment of apartment properties in select submarkets located throughout the United States. Antheus Capital was founded in 2002 by Eli Ungar and David Gefsky. Antheus Capital’s current portfolio consists of approximately 7,800 units and approximately 365,000 square feet of commercial space. Antheus Capital is one of the largest multifamily owners in the Hyde Park neighborhood in Chicago, Illinois.
| THE INFORMATION IN THIS STRUCTURAL AND COLLATERAL TERM SHEET IS NOT COMPLETE AND MAY BE AMENDED PRIOR TO THE TIME OF SALE. THIS TERM SHEET IS NOT AN OFFER TO SELL THESE SECURITIES AND IT IS NOT A SOLICITATION OF AN OFFER TO BUY THESE SECURITIES IN ANY JURISDICTION WHERE THE OFFER OR SALE IS NOT PERMITTED. |
| |
| | 75 of 145 | |
| Structural and Collateral Term Sheet | | JPMDB 2019-COR6 |
| |
| Hyde Park Multifamily Portfolio |
| Portfolio Summary |
| Property | Year Built / Renovated | # of Units | % of Total | Occupancy(1) | UW NOI | Allocated Whole Loan Amount | Appraised Value |
| 5452-5466 South Ellis Avenue | 1913 / 2000 | 31 | 3.7% | 90.3% | | $463,480 | $5,023,463 | $8,275,000 |
| 5339-5345 South Woodlawn Avenue | 1912 / Various | 25 | 3.0% | 84.0% | | 412,008 | 4,568,200 | 7,525,000 |
| 5335-5345 South Kimbark Avenue | 1913 / 2000 | 25 | 3.0% | 88.0% | | 388,898 | 4,401,250 | 7,250,000 |
| 5715-5725 South Kimbark Avenue | 1911 / 2000 | 19 | 2.3% | 100.0% | | 362,864 | 4,234,300 | 6,975,000 |
| 5034-5046 South Woodlawn Avenue | 1920 / 2000 | 45 | 5.4% | 100.0% | | 398,684 | 4,128,075 | 6,800,000 |
| 1509 East 57th Street | 1888 / 2010 | 22 | 2.6% | 63.6% | | 378,166 | 4,067,350 | 6,700,000 |
| 5320-5326 South Drexel Avenue | 1923 / 2009 | 31 | 3.7% | 87.1% | | 313,233 | 3,748,675 | 6,175,000 |
| 5237-5245 South Kenwood(2) | 1910 / 2000 | 19 | 2.3% | 100.0% | | 314,697 | 3,703,088 | 6,100,000 |
| 5411-5421 South Ellis Avenue | 1917 / 2000 | 31 | 3.7% | 90.3% | | 337,744 | 3,627,225 | 5,975,000 |
| 5300-5308 South Hyde Park Boulevard | 1912 / 2000 | 38 | 4.5% | 100.0% | | 284,575 | 3,369,275 | 5,550,000 |
| 5234-5244 South Ingleside Avenue | 1912 / 2010 | 23 | 2.7% | 95.7% | | 298,584 | 3,323,688 | 5,475,000 |
| 5415 South Woodlawn Avenue | 1927 / Various | 38 | 4.5% | 97.4% | | 323,248 | 3,308,550 | 5,450,000 |
| 5300-5308 South Greenwood Avenue | 1914 / 2000 | 25 | 3.0% | 92.0% | | 282,903 | 3,293,325 | 5,425,000 |
| 5201 South Greenwood Avenue | 1914 / 2000 | 24 | 2.9% | 100.0% | | 254,029 | 2,883,563 | 4,750,000 |
| 5401-5409 South Cottage Grove Avenue(2) | 1914 / 2010 | 22 | 2.6% | 100.0% | | 236,969 | 2,868,425 | 4,725,000 |
| 5120 South Hyde Park Boulevard | 1923 / 2000 | 40 | 4.8% | 100.0% | | 230,974 | 2,504,163 | 4,125,000 |
| 5350-5358 South Maryland Avenue | 1915 / 2010 | 21 | 2.5% | 95.2% | | 204,334 | 2,482,900 | 4,160,000 |
| 5400-5406 South Maryland Avenue | 1897 / 2010 | 18 | 2.1% | 88.9% | | 224,026 | 2,473,800 | 4,075,000 |
| 5474-5480 South Hyde Park Boulevard | 1910 / 2000 | 29 | 3.5% | 93.1% | | 226,878 | 2,458,663 | 4,050,000 |
| 5528-5532 South Everett Avenue | 1912 / 2000 | 34 | 4.1% | 100.0% | | 216,566 | 2,397,938 | 3,950,000 |
| 5487-5491 South Hyde Park Boulevard | 1905 / 2018 | 7 | 0.8% | 100.0% | | 185,459 | 2,367,575 | 3,900,000 |
| 5400-5408 South Ingleside Avenue | 1916 / 2010 | 19 | 2.3% | 84.2% | | 206,995 | 2,352,350 | 3,875,000 |
| 5401-5403 South Woodlawn Avenue | 1899 / 2000 | 12 | 1.4% | 100.0% | | 208,822 | 2,276,488 | 3,750,000 |
| 5301-5307 South Maryland Avenue | 1897 / 2009 | 21 | 2.5% | 100.0% | | 183,770 | 2,230,988 | 3,675,000 |
| 5355-5361 South Cottage Grove Avenue | 1910 / 2010 | 21 | 2.5% | 95.2% | | 171,109 | 2,215,763 | 3,650,000 |
| 1515-1521 East 54th Street | 1916 / 2000 | 16 | 1.9% | 93.8% | | 183,996 | 2,191,525 | 3,690,000 |
| 5111-5113 South Kimbark Avenue | 1910 / 2011 | 8 | 1.0% | 87.5% | | 174,372 | 2,142,963 | 3,570,000 |
| 5507-5509 South Hyde Park Boulevard | 1906 / 2017 | 7 | 0.8% | 100.0% | | 166,384 | 2,094,400 | 3,460,000 |
| 5337 South Hyde Park Boulevard | 1919 / 2000 | 23 | 2.7% | 100.0% | | 161,470 | 2,048,900 | 3,375,000 |
| 5202-5210 South Cornell Avenue | 1907 / 2000 | 27 | 3.2% | 100.0% | | 177,305 | 1,991,150 | 3,280,000 |
| 5118-5120 South Greenwood Avenue | 1912 / 2011 | 6 | 0.7% | 100.0% | | 133,886 | 1,803,025 | 2,990,000 |
| 5335-5337 South Woodlawn Avenue | 1909 / 2000 | 6 | 0.7% | 100.0% | | 129,701 | 1,724,100 | 2,880,000 |
| 5524-5526 South Everett Avenue | 1910 / 2017 | 7 | 0.8% | 100.0% | | 137,584 | 1,699,775 | 2,820,000 |
| 5401-5405 South Drexel Boulevard | 1915 / 2010 | 13 | 1.5% | 84.6% | | 131,433 | 1,532,825 | 2,525,000 |
| 5468-5470 South Hyde Park Boulevard | 1903 / 2000 | 6 | 0.7% | 100.0% | | 112,987 | 1,517,688 | 2,500,000 |
| 5218-5220 South Kimbark Avenue | 1903 / 2000 | 6 | 0.7% | 100.0% | | 124,751 | 1,511,563 | 2,520,000 |
| 5457-5459 South Blackstone Avenue | 1908 / 2000 | 19 | 2.3% | 89.5% | | 122,700 | 1,335,513 | 2,380,000 |
| 5336-5338 South Hyde Park Boulevard | 1912 / 2000 | 19 | 2.3% | 100.0% | | 109,195 | 1,244,513 | 2,050,000 |
| 5405-5407 South Woodlawn Avenue | 1921 / 2000 | 18 | 2.1% | 100.0% | | 125,162 | 1,123,063 | 1,850,000 |
| 1018 East 54th Street | 1915 / 2000 | 9 | 1.1% | 77.8% | | 72,257 | 1,056,300 | 1,760,000 |
| 5128-5132 South Cornell Avenue | 1905 / 2000 | 9 | 1.1% | 100.0% | | 57,679 | 922,775 | 1,550,000 |
| 5110 South Harper Avenue(3) | NAP | 0 | NAP | 100.0% | | 10,603 | 500,842 | 825,000 |
| Total / Wtd. Avg. | | 839 | 100.0% | 94.5% | | $9,240,484 | $106,750,000 | $176,385,000 |
| (1) | Based on the underwritten rent rolls dated July 31, 2019. |
| (2) | Properties contain four commercial retail units that average 2,766 square feet. |
| (3) | Represents the 28-space, income producing parking lot. |
| THE INFORMATION IN THIS STRUCTURAL AND COLLATERAL TERM SHEET IS NOT COMPLETE AND MAY BE AMENDED PRIOR TO THE TIME OF SALE. THIS TERM SHEET IS NOT AN OFFER TO SELL THESE SECURITIES AND IT IS NOT A SOLICITATION OF AN OFFER TO BUY THESE SECURITIES IN ANY JURISDICTION WHERE THE OFFER OR SALE IS NOT PERMITTED. |
| |
| | 76 of 145 | |
| Structural and Collateral Term Sheet | | JPMDB 2019-COR6 |
| |
| Hyde Park Multifamily Portfolio |
The Properties. The Hyde Park Multifamily Portfolio Properties are comprised of 41 mid-rise and garden apartment buildings and one income producing parking lot. The Hyde Park Multifamily Portfolio Properties are all located within a 1.5-mile radius and are comprised of 835 residential units totaling 743,704 square feet and four commercial retail units totaling 11,062 square feet. As of the July 31, 2019 rent rolls, the Hyde Park Multifamily Portfolio was 94.5% occupied with no single Hyde Park Multifamily Portfolio property accounting for more than approximately 5.0% of underwritten net operating income. The 835 residential units average approximately 891 square feet and are 94.5% occupied and the four commercial units average approximately 2,766 square feet and are 100.0% occupied as of the July 31, 2019 rent rolls.
The Hyde Park Multifamily Portfolio Properties include 81 studio units, 229 one-bedroom units, 271 two-bedroom units, 173 three-bedroom units, 64 four-bedroom units, 14 five-bedroom units, three six-bedroom units, four commercial retail units and one income producing parking lot.
The Hyde Park Multifamily Portfolio Properties are concentrated in the south-side Chicago neighborhood of Hyde Park. Hyde Park is located approximately six miles south of the Chicago central business district and is home to several institutional demand drivers including the University of Chicago, University of Chicago Medical Center and the Museum of Science and Industry. As of 2017, the University of Chicago had a total enrollment of 16,016 students, of whom 5,971 were undergraduate and 10,045 were post-graduate.
According to a market report, the Hyde Park Multifamily Portfolio falls within the Bronzeville/Hyde Park/South Shore submarket within the Chicago-Naperville-Elgin, Illinois-Indiana-Wisconsin metropolitan statistical area. Effective rent in the Bronzeville/Hyde Park/South Shore submarket increased slightly from $1,340 per unit per month in the second quarter of 2019 to $1,358 per unit per month in the third quarter of 2019. The submarket's occupancy rate was equal to 94.9% in the third quarter of 2019, while the submarket's occupancy rate has averaged 94.6% since the second quarter of 1996.
Historical and Current Occupancy(1) |
| 2014 | 2015 | 2016 | 2017 | 2018 | Current(2) |
| 90.5% | 90.7% | 90.9% | 90.0% | 90.1% | 94.5% |
| (1) | Historical Occupancies are as of December 31 of each respective year. |
| (2) | Current occupancy is as of July 31, 2019. |
| Multifamily Unit Mix(1) |
| Unit Type | # of Units | % of Total | Occupied Units | Occupancy(2) | Average Unit Size (SF) | Average Monthly Rental Rate | Average Monthly Rental Rate PSF | Average Monthly Market Rent | Average Monthly Market Rent PSF |
| Studio | 81 | 9.7% | 81 | 100.0% | 368 | $893 | $2.43 | $862 | $2.34 |
| 1 Bedroom | 229 | 27.4 | 220 | 96.1% | 655 | $1,200 | $1.85 | $1,190 | $1.82 |
| 2 Bedroom | 271 | 32.5 | 262 | 96.7% | 886 | $1,527 | $1.72 | $1,501 | $1.69 |
| 3 Bedroom | 173 | 20.7 | 153 | 88.4% | 1,098 | $2,115 | $1.91 | $2,049 | $1.87 |
| 4 Bedroom | 64 | 7.7 | 56 | 87.5% | 1,537 | $2,902 | $1.84 | $2,777 | $1.81 |
| 5 Bedroom | 14 | 1.7 | 14 | 100.0% | 1,992 | $3,260 | $1.64 | $3,165 | $1.59 |
| 6 Bedroom | 3 | 0.4 | 3 | 100.0% | 2,570 | $3,865 | $1.50 | $3,830 | $1.49 |
| Total / Wtd. Avg. | 835 | 100.0% | 789 | 94.5% | 891 | $1,622 | $1.83 | $1,584 | $1.80 |
| (1) | Based on the underwritten rent rolls dated July 31, 2019. |
| (2) | Occupancy is weighted based on the total occupied square footage. |
| THE INFORMATION IN THIS STRUCTURAL AND COLLATERAL TERM SHEET IS NOT COMPLETE AND MAY BE AMENDED PRIOR TO THE TIME OF SALE. THIS TERM SHEET IS NOT AN OFFER TO SELL THESE SECURITIES AND IT IS NOT A SOLICITATION OF AN OFFER TO BUY THESE SECURITIES IN ANY JURISDICTION WHERE THE OFFER OR SALE IS NOT PERMITTED. |
| |
| | 77 of 145 | |
| Structural and Collateral Term Sheet | | JPMDB 2019-COR6 |
| |
| Hyde Park Multifamily Portfolio |
| Operating History and Underwritten Net Cash Flow |
| | 2016 | 2017 | 2018 | TTM(1) | Underwritten | Per Unit | %(2) |
| Rents in Place | $14,908,773 | $15,253,403 | $15,896,270 | $16,265,022 | $15,356,640 | $18,304 | 104.2% |
| Vacant Income | 0 | 0 | 0 | 0 | 1,140,072 | 1,359 | 7.7 |
| Gross Potential Rent | $14,908,773 | $15,253,403 | $15,896,270 | $16,265,022 | $16,496,712 | $19,662 | 112.0% |
| (Vacancy/Credit Loss) | (2,559,747) | (1,931,119) | (2,085,427) | (2,007,973) | (1,764,457) | (2,103) | (12.0)-- |
| Net Rental Income | $12,349,025 | $13,322,284 | $13,810,843 | $14,257,049 | $14,732,255 | $17,559 | 100.0% |
| Commercial Income(3) | 5,145 | 9,674 | 9,269 | 14,899 | 197,251 | 235 | 1.3% |
| (Vacancy/Credit Loss) | 0 | 0 | 0 | 0 | (9,863) | (12) | (0.1)-- |
| Other Income | 632,845 | 645,428 | 562,341 | 640,125 | 640,125 | 763 | 4.3% |
| Effective Gross Income | $12,987,016 | $13,977,386 | $14,382,453 | $14,912,073 | $15,559,768 | $18,546 | 105.6% |
| Total Expenses | $5,007,798 | $5,498,541 | $5,689,497 | $6,022,366 | $6,319,284 | $7,532 | 40.6% |
| Net Operating Income | $7,979,218 | $8,478,846 | $8,692,956 | $8,889,707 | $9,240,484 | $11,014 | 59.4% |
| Replacement Reserves | 0 | 0 | 0 | 0 | 252,000 | 300 | 1.6 |
| Net Cash Flow | $7,979,218 | $8,478,846 | $8,692,956 | $8,889,707 | $8,988,484 | $10,713 | 57.8% |
| (1) | TTM column represents the trailing 12-month period ending July 31, 2019. |
| (2) | % column represents percent of Net Rental Income for all revenue lines and represents percent of Effective Gross Income for the remainder of the fields. |
| (3) | Historical Commercial Income represents commercial reimbursements. Historical commercial base rental income is included in Rents in Place. |
Property Management. TheHyde Park Multifamily Portfolio is managed by MAC Property Management, L.L.C., an affiliate of the borrowers.
Escrows and Reserves. At origination, the borrowers deposited into escrow $700,000 for real estate taxes and $225,000 for insurance premiums.
Tax Escrows– On a monthly basis,the borrowers are required to escrow 1/12 of the annual estimated tax payments, which currently equates to $119,000.
Insurance Escrows– On a monthly basis, if an acceptable blanket policy is no longer in place,the borrowers are required to escrow 1/12 of the annual estimated insurance premiums, which currently equates to $18,400.
Replacement Reserves –On a monthly basis,the borrowers are required to escrow$17,580 for replacement reserves.
Lockbox / Cash Management.The Hyde Park Multifamily Portfolio Whole Loan is structured with a springing lockbox and springing cash management. Upon the occurrence of a Cash Management Period (as defined below), all rents are required to be deposited into a lockbox account within one business day of receipt by the borrowers or the property manager. Upon the occurrence and during the continuance of a Cash Management Period, all funds in the lockbox account are required to be swept daily into a lender-controlled account, from which account such funds will be disbursed on each payment date in accordance with the Hyde Park Multifamily Portfolio Whole Loan documents and any excess will be retained by the lender as additional collateral for the Hyde Park Multifamily Portfolio Whole Loan.
A “Cash Management Period” will commence (i) upon an event of default (including an event of default under the mezzanine loan) or (ii) if, based on the Hyde Park Multifamily Portfolio Whole Loan and the related mezzanine loan, the debt service coverage ratio is less than 1.10x (until such time that the debt service coverage ratio is greater than or equal to 1.10x for two consecutive quarters).
Current Mezzanine or Subordinate Indebtedness.A mezzanine loan was funded concurrently and is coterminous with the Hyde Park Multifamily Portfolio Whole Loan. The mezzanine loan has an original principal balance of approximately $15.3 million, accrues interest at a rate of 7.49000%per annum and is interest-only for the entire loan term. Including the mezzanine loan, the cumulative Cut-off Date LTV, cumulative UW NCF DSCR and cumulative UW NOI DY are 69.2%, 1.48x and 7.6%, respectively. The mezzanine loan is currently held by LCM or an affiliate.
| THE INFORMATION IN THIS STRUCTURAL AND COLLATERAL TERM SHEET IS NOT COMPLETE AND MAY BE AMENDED PRIOR TO THE TIME OF SALE. THIS TERM SHEET IS NOT AN OFFER TO SELL THESE SECURITIES AND IT IS NOT A SOLICITATION OF AN OFFER TO BUY THESE SECURITIES IN ANY JURISDICTION WHERE THE OFFER OR SALE IS NOT PERMITTED. |
| |
| | 78 of 145 | |
| Structural and Collateral Term Sheet | | JPMDB 2019-COR6 |
| |
| Hyde Park Multifamily Portfolio |
Partial Release.Commencing on the payment date that is after the earlier to occur of (i) two years from the securitization closing date of the lastpari passu note to be securitized and (ii) August 2022, the borrowers may obtain the release of any of the Hyde Park Multifamily Portfolio Properties in connection with a sale of the related mortgaged property to an unaffiliated third-party,provided that, among other conditions, (i) no event of default has occurred and is continuing, (ii) the borrowers defease a portion of the Hyde Park Multifamily Portfolio Whole Loan in an amount equal to the greater of (a) 115.0% of the allocated loan amount of the Hyde Park Multifamily Portfolio property being released and (b) 100.0% of net sales proceeds, (iii) the debt yield (as calculated in accordance with the Hyde Park Multifamily Portfolio Whole Loan documents) for the remaining Hyde Park Multifamily Portfolio Properties following the release is not less than the greater of (1) the debt yield immediately preceding such release and (2) 7.0%, (iv) the release complies with the customary REMIC requirements, and (v) all defeasance conditions set forth in the Hyde Park Multifamily Portfolio Whole Loan documents are satisfied.
| THE INFORMATION IN THIS STRUCTURAL AND COLLATERAL TERM SHEET IS NOT COMPLETE AND MAY BE AMENDED PRIOR TO THE TIME OF SALE. THIS TERM SHEET IS NOT AN OFFER TO SELL THESE SECURITIES AND IT IS NOT A SOLICITATION OF AN OFFER TO BUY THESE SECURITIES IN ANY JURISDICTION WHERE THE OFFER OR SALE IS NOT PERMITTED. |
| |
| | 79 of 145 | |
| Structural and Collateral Term Sheet | | JPMDB 2019-COR6 |
| |
| BJ’s Wholesale Club |
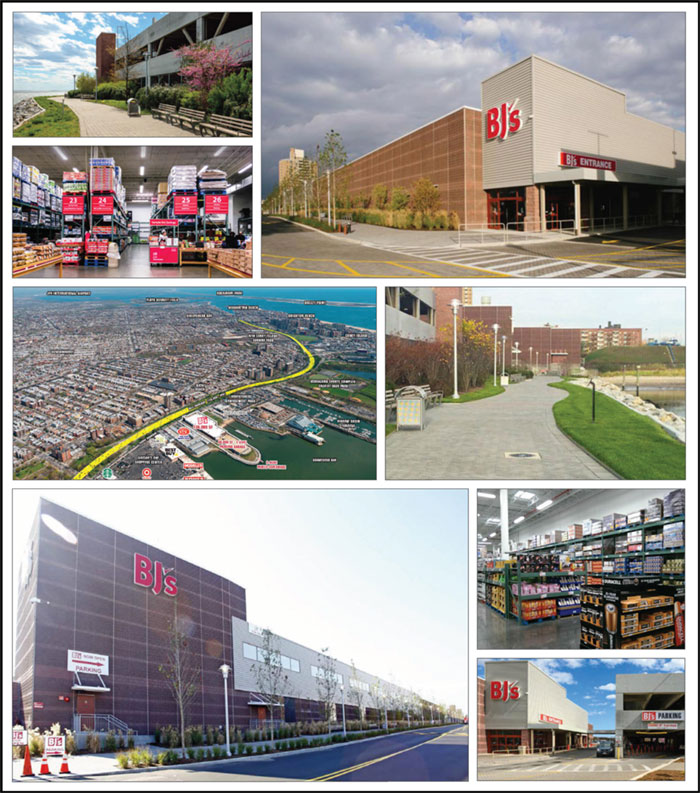
| THE INFORMATION IN THIS STRUCTURAL AND COLLATERAL TERM SHEET IS NOT COMPLETE AND MAY BE AMENDED PRIOR TO THE TIME OF SALE. THIS TERM SHEET IS NOT AN OFFER TO SELL THESE SECURITIES AND IT IS NOT A SOLICITATION OF AN OFFER TO BUY THESE SECURITIES IN ANY JURISDICTION WHERE THE OFFER OR SALE IS NOT PERMITTED. |
| |
| | 80 of 145 | |
| Structural and Collateral Term Sheet | | JPMDB 2019-COR6 |
| |
| BJ’s Wholesale Club |
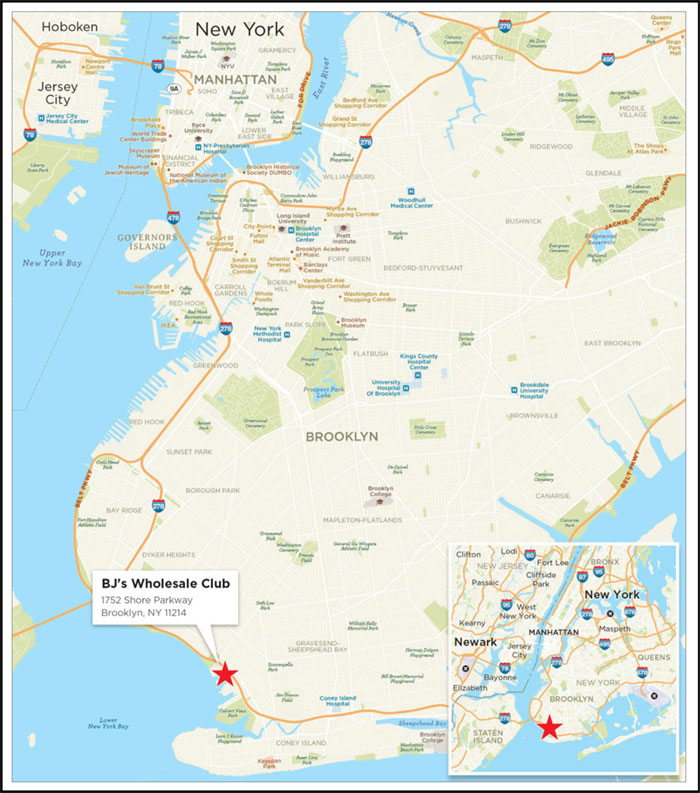
| THE INFORMATION IN THIS STRUCTURAL AND COLLATERAL TERM SHEET IS NOT COMPLETE AND MAY BE AMENDED PRIOR TO THE TIME OF SALE. THIS TERM SHEET IS NOT AN OFFER TO SELL THESE SECURITIES AND IT IS NOT A SOLICITATION OF AN OFFER TO BUY THESE SECURITIES IN ANY JURISDICTION WHERE THE OFFER OR SALE IS NOT PERMITTED. |
| |
| | 81 of 145 | |
| Structural and Collateral Term Sheet | | JPMDB 2019-COR6 |
| |
| BJ’s Wholesale Club |
| Mortgage Loan Information | | Property Information |
| Mortgage Loan Seller: | JPMCB | | Single Asset / Portfolio: | Single Asset |
| Original Principal Balance: | $40,150,000 | | Title: | Fee |
| Cut-off Date Principal Balance: | $40,150,000 | | Property Type - Subtype: | Retail – Freestanding |
| % of Pool by IPB: | 5.0% | | Net Rentable Area (SF): | 135,753 |
| Loan Purpose: | Acquisition | | Location: | Brooklyn, NY |
| Borrower: | LHL Shore Parkway, LLC | | Year Built / Renovated: | 2014 / N/A |
| Sponsor: | LHL Holdings, L.P. | | Occupancy(1): | 100.0% |
| Interest Rate: | 3.57000% | | Occupancy Date: | 11/1/2019 |
| Note Date: | 9/25/2019 | | Number of Tenants: | 1 |
| Maturity Date: | 10/1/2029 | | 2016 NOI(2): | N/A |
| Interest-only Period: | 120 months | | 2017 NOI(2): | N/A |
| Original Term: | 120 months | 2018 NOI(2): | N/A |
| Original Amortization: | None | TTM NOI (as of 3/2019): | $3,830,045 |
| Amortization Type: | Interest Only | | UW Economic Occupancy: | 95.0% |
| Call Protection: | L(25),Grtr1%orYM(92),O(3) | | UW Revenues: | $4,895,930 |
| Lockbox / Cash Management: | Hard / Springing | | UW Expenses: | $1,133,964 |
| Additional Debt: | N/A | | UW NOI: | $3,761,966 |
| Additional Debt Balance: | N/A | | UW NCF: | $3,748,391 |
| Additional Debt Type: | N/A | | Appraised Value / Per SF: | $74,000,000 / $545 |
| | | | Appraised Dark Value / Per SF(3): | $48,000,000 / $354 |
| | | | Appraisal Date: | 8/20/2019 |
| | | | | |
| Escrows and Reserves(4) | | Financial Information |
| | Initial | Monthly | Initial Cap | | Cut-off Date Loan / SF: | $296 |
| Taxes: | $0 | Springing | N/A | | Maturity Date Loan / SF: | $296 |
| Insurance: | $0 | Springing | N/A | | Cut-off Date LTV: | 54.3% |
| Replacement Reserves: | $0 | Springing | N/A | | Maturity Date LTV: | 54.3% |
| Other: | $0 | $0 | N/A | | UW NCF DSCR: | 2.58x |
| | | | | | UW NOI Debt Yield: | 9.4% |
| | | | | | | |
| Sources and Uses |
| Sources | Proceeds | % of Total | | Uses | Proceeds | % of Total |
| Mortgage Loan | $40,150,000 | 54.4% | | Purchase Price | $73,000,000 | 98.8% |
| Sponsor Equity | 33,715,717 | 45.6 | | Closing Costs | 865,717 | 1.2 |
| Total Sources | $73,865,717 | 100.0% | | Total Uses | $73,865,717 | 100.0% |
| (1) | BJ’s Wholesale Club (“BJ’s”) has occupied the BJ’s Wholesale Club Property (as defined below) since it was constructed in 2014. |
| (2) | Historical financial information was not provided when the loan sponsor acquired the BJ’s Wholesale Club Property. |
| (3) | The appraisal provided a “Hypothetical Go Dark” value of $48.0 million, as of August 20, 2019, which assumes that BJ’s vacates its space, which is thereafter leased at market rent. Based on the “Hypothetical Go Dark” value, the Cut-off Date LTV and Maturity Date LTV are both equal to 83.6%. |
| (4) | For a full description of Escrows and Reserves, please refer to “Escrows and Reserves” below. |
The Loan. The BJ’s Wholesale Club mortgage loan has an outstanding principal balance as of the Cut-off Date of $40.15 million (the “BJ’s Wholesale Club Loan”) and is secured by a first mortgage lien on the borrower’s fee interest in a 135,753 square foot freestanding retail property fully (the “BJ’s Wholesale Club Property”) occupied by BJ’s with an adjacent parking garage and two-acre esplanade located in Brooklyn, New York. The BJ’s Wholesale Club Loan has a 10-year term and is interest-only for the entire term.
The Borrower. The borrowing entity for the BJ’s Wholesale Club Loan is LHL Shore Parkway, LLC, a Delaware limited liability company and special purpose entity with at least one independent director.
The Loan Sponsor. The loan sponsor and nonrecourse carve-out guarantor is LHL Holdings, L.P., an affiliate of Algin Management Company (“Algin”). Founded in 1957, Algin is a family owned New York City real estate company. Algin owns and manages over 30 multifamily apartment buildings throughout New York City, including over 3,500 apartment units and approximately 100,000 square feet of retail and commercial space.
| THE INFORMATION IN THIS STRUCTURAL AND COLLATERAL TERM SHEET IS NOT COMPLETE AND MAY BE AMENDED PRIOR TO THE TIME OF SALE. THIS TERM SHEET IS NOT AN OFFER TO SELL THESE SECURITIES AND IT IS NOT A SOLICITATION OF AN OFFER TO BUY THESE SECURITIES IN ANY JURISDICTION WHERE THE OFFER OR SALE IS NOT PERMITTED. |
| |
| | 82 of 145 | |
| Structural and Collateral Term Sheet | | JPMDB 2019-COR6 |
| |
| BJ’s Wholesale Club |
The Property. The BJ’s Wholesale Club Property includes a 135,753 square foot freestanding retail building, parking garage and public esplanade located on an approximately 10.7 acre site in Brooklyn, New York. The three-level parking garage offers 442 parking spaces, resulting in a parking ratio of approximately 3.26 spaces per 1,000 square feet of net rentable area. The two-acre public esplanade provides waterfrontage along Gravesend Bay and offers shoppers and residents a walking and jogging path, benches and a grass field which BJ’s is responsible for maintaining. The BJ’s Wholesale Club Property includes a Dunkin’ Donuts and a liquor store operated by BJ’s.
The previous owner, Thor Equities, began construction of the BJ’s Wholesale Club Property in 2012. Since completion in 2014, the BJ’s Wholesale Club Property has been 100.0% occupied by BJ’s (NYSE: BJ, S&P: B+), the nation’s third largest membership warehouse club. As of the fiscal year ended February 2019, BJ’s operates 216 clubs across 16 states, serving approximately 5.5 million members. BJ’s primarily offers two core types of memberships including a standard and higher tier membership with annual fees of $55 and $110, respectively. As of year-end 2018, the higher tier membership accounted for approximately 23.0% of memberships and approximately 39.0% of spending. As of the fiscal year ended February 2, 2019, BJ’s reported approximately $13.0 billion in total revenues. According to the loan sponsor, the BJ’s Wholesale Club Property generated approximately $110.0 million in sales in 2018 compared to the BJ’s national average of approximately $58.9 million. BJ’s lease requires triple net (“NNN”) rent of $31.10 per square foot and expires in September 2034 with six, five-year extension options and no termination options (the “BJ’s Lease”).
The BJ’s Wholesale Club Property is located within a primarily residential area that benefits from close proximity to a variety of attractions including Adventurer’s Amusement Park, Bensonhurst Park, Calvert Vaux Park, Marine Basin Marina and Coney Island. The BJ’s Wholesale Club Property is located adjacent to Caesar’s Bay Shopping Center, which features national retailers including Best Buy, Kohl’s, Pearle Vision, Modell’s Sporting Goods and The Vitamin Shoppe, with Target expected to open in 2020 according to the appraisal. Caesar’s Bay Shopping Center also offers retail and dining options including Five Guys, Olive Garden, Starbucks, TD Bank, T-Mobile, Verizon Wireless and Wendy’s. There are two additional BJ’s locations within Brooklyn, located approximately 5.7 miles and 7.7 miles to the northeast of the BJ’s Wholesale Club Property, which serve different markets on the east side of the borough.
| Collateral Tenant Summary(1) |
| Tenant | Ratings
Moody’s/S&P/ Fitch | Net Rentable Area (SF) | % of
Total NRA | Base Rent
PSF(2) | Lease
Expiration(3) | % of Total
Base Rent | Most
Recent Sales PSF(4) | Occupancy
Cost(4) |
| BJ’s Wholesale Club | NR / B+ / NR | 135,753 | 100.0% | $31.10 | 9/19/2034 | 100.0% | NAV | NAV |
| (1) | Based on the underwritten rent roll. |
| (2) | Base Rent PSF includes contractual rent steps through September 2019. BJ’s has a 6.0% rent step in 2024. |
| (3) | BJ’s has six successive, five-year extension options and no termination options. |
| (4) | BJ’s does not report sales. |
The BJ’s Wholesale Club Property is located along the South Brooklyn waterfront in Brooklyn, New York on Shore Parkway, a service road for the Belt Parkway, which is a major thoroughfare within the city of New York with a traffic count of approximately 150,000 vehicles per day. The BJ’s Wholesale Club Property is also accessible via the Van Wyck Expressway (Interstate 678) which runs along the eastern boundary of Brooklyn and connects with Interstate 95, Interstate 278 and the Long Island Expressway (Interstate 495). The BJ’s Wholesale Club Property is located approximately 11.0 miles to the southwest of John F. Kennedy International Airport. Subway access is available via the New York City subway, which is located approximately four blocks away from the BJ’s Wholesale Club Property.
According to the appraisal, the BJ’s Wholesale Club Property is located in the South Brooklyn retail submarket within Kings County, New York, which contains approximately 42.7 million square feet of retail space. From the second quarter of 2014 to the second quarter of 2019, the submarket vacancy has decreased from 5.4% to 3.2%, and average asking rents have increased from $36.20 to $46.52 over the same time period. According to the appraisal, Brooklyn’s estimated 2018 population was 2,691,705, a 7.5% increase from 2010 and the highest increase among the five boroughs of New York City. According to the appraisal, over the next five years, Brooklyn’s population is expected to increase by 4.0%. The 2019 total population within the BJ’s Wholesale Club Property’s zip code and Kings County, New York is 93,817 and 2,674,116, respectively. The 2019 median household income within the BJ’s Wholesale Club Property’s zip code and Kings County, New York is $56,528 and $58,062, respectively.
| THE INFORMATION IN THIS STRUCTURAL AND COLLATERAL TERM SHEET IS NOT COMPLETE AND MAY BE AMENDED PRIOR TO THE TIME OF SALE. THIS TERM SHEET IS NOT AN OFFER TO SELL THESE SECURITIES AND IT IS NOT A SOLICITATION OF AN OFFER TO BUY THESE SECURITIES IN ANY JURISDICTION WHERE THE OFFER OR SALE IS NOT PERMITTED. |
| |
| | 83 of 145 | |
| Structural and Collateral Term Sheet | | JPMDB 2019-COR6 |
| |
| BJ’s Wholesale Club |
The appraisal identified five comparable leases ranging in size from 17,000 square feet to 111,248 square feet. Base rent for the comparable NNN leases range from $25.54 per square foot to $45.35 per square foot. The base rent at theBJ’s Wholesale Club Property is $31.10 per square foot, in-line with the appraisal’s concluded market rent of $30.00 per square foot. The comparable leases are detailed in the table below:
| Appraisal Comparable Leases |
| Property | Location | Year Built / Renovated | Tenant | Lease Area | Lease Term (Years) | Base Rent PSF | Reimbursements |
| BJ’s Wholesale Club(1) | Brooklyn, NY | 2014 / N/A | BJ’s | 135,753 | 20 | $31.10 | NNN |
| 4804-4822 New Utrecht Avenue | Brooklyn, NY | 1920 / 2019 | Amazing Savings | 17,000 | 10 | $41.18 | NNN |
| 2501-2503 Grand Concourse | Bronx, NY | 1930 / 2002 | Marshalls | 32,600 | 10 | $30.80 | NNN |
| 242-06 61st Avenue | Queens, NY | 1964 / NA | Lowe’s | 94,176 | 15 | $39.00 | NNN |
| 66 Boerum Place | Brooklyn, NY | 1905 / NA | Planet Fitness | 20,950 | 15 | $45.35 | NNN |
| 1 Dekalb Avenue | Brooklyn, NY | 2016 / NA | Century 21 | 111,248 | 15 | $25.54 | NNN |
| (1) | Based on the underwritten rent roll. |
| Historical and Current Occupancy(1) |
| 2016 | 2017 | 2018 | Current(2) |
| 100.0% | 100.0% | 100.0% | 100.0% |
| (1) | Historical Occupancies are as of December 31 of each respective year. |
| (2) | Current Occupancy is as of November 1, 2019. |
| Lease Rollover Schedule(1) |
| Year | Number of Leases Expiring | Net Rentable Area Expiring | % of NRA Expiring | Base Rent Expiring(2) | % of Base Rent Expiring | Cumulative Net Rentable Area Expiring | Cumulative % of NRA Expiring | Cumulative Base Rent Expiring | Cumulative % of Base Rent Expiring |
| Vacant | NAP | NAP | 0.0% | NAP | NAP | 0 | 0.0% | NAP | NAP |
| 2019 & MTM | 0 | 0 | 0.0% | $0 | 0.0% | 0 | 0.0% | $0 | 0.0% |
| 2020 | 0 | 0 | 0.0% | 0 | 0.0% | 0 | 0.0% | $0 | 0.0% |
| 2021 | 0 | 0 | 0.0% | 0 | 0.0% | 0 | 0.0% | $0 | 0.0% |
| 2022 | 0 | 0 | 0.0% | 0 | 0.0% | 0 | 0.0% | $0 | 0.0% |
| 2023 | 0 | 0 | 0.0% | 0 | 0.0% | 0 | 0.0% | $0 | 0.0% |
| 2024 | 0 | 0 | 0.0% | 0 | 0.0% | 0 | 0.0% | $0 | 0.0% |
| 2025 | 0 | 0 | 0.0% | 0 | 0.0% | 0 | 0.0% | $0 | 0.0% |
| 2026 | 0 | 0 | 0.0% | 0 | 0.0% | 0 | 0.0% | $0 | 0.0% |
| 2027 | 0 | 0 | 0.0% | 0 | 0.0% | 0 | 0.0% | $0 | 0.0% |
| 2028 | 0 | 0 | 0.0% | 0 | 0.0% | 0 | 0.0% | $0 | 0.0% |
| 2029 and Beyond | 1 | 135,753 | 100.0% | $4,222,591 | 100.0% | 135,753 | 100.0% | $4,222,591 | 100.0% |
| Total | 1 | 135,753 | 100.0% | $4,222,591 | 100.0% | | | | |
| | | | | | | | | | | | |
| (1) | Based on the underwritten rent roll. |
| (2) | Base Rent Expiring is inclusive of $201,076 in contractual rent steps underwritten through September 2019. |
| THE INFORMATION IN THIS STRUCTURAL AND COLLATERAL TERM SHEET IS NOT COMPLETE AND MAY BE AMENDED PRIOR TO THE TIME OF SALE. THIS TERM SHEET IS NOT AN OFFER TO SELL THESE SECURITIES AND IT IS NOT A SOLICITATION OF AN OFFER TO BUY THESE SECURITIES IN ANY JURISDICTION WHERE THE OFFER OR SALE IS NOT PERMITTED. |
| |
| | 84 of 145 | |
| Structural and Collateral Term Sheet | | JPMDB 2019-COR6 |
| |
| BJ’s Wholesale Club |
| Cash Flow Analysis(1) |
| | TTM(2) | Underwritten | Per Square Foot | %(3) |
| Rents in Place(4) | $4,021,515 | $4,222,591 | $31.10 | 81.9% |
| Vacant Income | 0 | 0 | 0.00 | 0.0% |
| Gross Potential Rent | $4,021,515 | $4,222,591 | $31.10 | 81.9% |
| Total Reimbursements | 0 | 931,019 | 6.86 | 18.1% |
| Net Rental Income | $4,021,515 | $5,153,610 | $37.96 | 100.0% |
| (Vacancy/Credit Loss) | 0 | (257,681) | (1.90) | (5.0)% |
| Effective Gross Income | $4,021,515 | $4,895,930 | $36.06 | 95.0% |
| Total Expenses(5) | 191,470 | 1,133,964 | 8.35 | 23.2% |
| Net Operating Income | $3,830,045 | $3,761,966 | $27.71 | 76.8% |
| Total TI/LC, Capex/RR | 0 | 13,575 | 0.10 | 0.3% |
| Net Cash Flow | $3,830,045 | $3,748,391 | $27.61 | 76.6% |
| (1) | Historical financial information was not provided when the sponsor acquired the BJ’s Wholesale Club Property. |
| (2) | TTM represents the trailing 12-month period ending on March 31, 2019. |
| (3) | % column represents percent of Net Rental Income for all revenue lines and percent of Effective Gross Income for the remainder of fields. |
| (4) | Underwritten Rents in Place is inclusive of $201,076 in contractual rent steps underwritten through September 2019. |
| (5) | The BJ’s Wholesale Club Property currently benefits from a 25 year ICAP (as defined below) tax abatement and BJ’s reimburses for real estate taxes. Underwritten Total Expenses reflect the average of the appraisal’s projected real estate taxes over the loan term of approximately $931,019. |
Property Management. The BJ’s Wholesale Club Property is managed by Algin Management Co., LLC, an affiliate of the loan sponsor.
Escrows and Reserves.
Tax Escrows– On a monthly basis, the borrower is required to deposit an amount equal to 1/12 of the estimated annual real estate taxes into a tax reserve. The requirement for monthly deposits in to the tax reserve is waived so long as (i) no event of default has occurred and is continuing under the BJ’s Wholesale Club Loan documents, (ii) the BJ’s Lease is in effect, (iii) the BJ’s Wholesale Club Property consists of one or more entire tax parcels occupied by BJ’s, (iv) BJ’s pays taxes directly to the taxing authority and (v) BJ’s provides the lender with satisfactory evidence that real estate taxes have been paid for the applicable period.
Insurance Escrows– On a monthly basis, the borrower is required to deposit into an insurance reserve an amount equal to 1/12 of the estimated insurance premiums. So long as either (i) the borrower maintains a blanket insurance policy acceptable to the lender, or (ii) the BJ’s Lease requires BJ’s to provide insurance coverage for the BJ’s Wholesale Club Property which satisfies the requirements of the mortgage loan agreement, and there is no event of default continuing under the BJ’s Wholesale Club Loan documents, the requirement for monthly deposits into the insurance reserve is waived.
Replacement Reserves – On a monthly basis upon the occurrence and continuance of a Cash Sweep Event (as defined below), the borrower is required to deposit $2,250 into a replacement reserve.
A “Cash Sweep Event” means the occurrence of (i) an event of default under the BJ’s Wholesale Club Loan documents, (ii) any bankruptcy action of the borrower or manager, (iii) the date that the debt service coverage ratio (as calculated in the BJ’s Wholesale Club Loan documents) based on the trailing 12-month period falls below 1.50x (a “DSCR Trigger Event”), (iv) a BJ’s Trigger Event (as defined below) or (v) BJ’s is downgraded to B- or less by S&P or the equivalent by two or more rating agencies (a “Downgrade Trigger Event”).
| THE INFORMATION IN THIS STRUCTURAL AND COLLATERAL TERM SHEET IS NOT COMPLETE AND MAY BE AMENDED PRIOR TO THE TIME OF SALE. THIS TERM SHEET IS NOT AN OFFER TO SELL THESE SECURITIES AND IT IS NOT A SOLICITATION OF AN OFFER TO BUY THESE SECURITIES IN ANY JURISDICTION WHERE THE OFFER OR SALE IS NOT PERMITTED. |
| |
| | 85 of 145 | |
| Structural and Collateral Term Sheet | | JPMDB 2019-COR6 |
| |
| BJ’s Wholesale Club |
A Cash Sweep Event may be cured in accordance with the following conditions: with respect to a Cash Sweep Event caused solely by (a) clause (i) above, the acceptance of a cure by the lender of the related event of default under the BJ’s Wholesale Club Loan documents, (b) clause (ii) above, with respect to (1) a bankruptcy action of the borrower, if the bankruptcy action is involuntary and not consented to or colluded in by the borrower, guarantor or any of their affiliates and such bankruptcy action is discharged, stayed or dismissed within 90 days of filing or (2) a bankruptcy action of the manager, if the borrower replaces the manager with a qualified manager under a replacement management agreement within 60 days in accordance with the BJ’s Wholesale Club Loan documents, (c) a DSCR Trigger Event, the achievement of a debt service coverage ratio of 1.50x or greater for two consecutive calendar quarters based upon the trailing 12 month period , (d) a BJ’s Trigger Event, the occurrence of a BJ’s Trigger Event Cure (as defined below) or (e) a Downgrade Trigger Event, the credit rating of BJ’s is increased to at least B+ by S&P or the equivalent by at least the number of rating agencies that downgraded the credit rating of BJ’s. Each cure is also subject to the following conditions: (1) no other event of default under the BJ’s Wholesale Club Loan documents may have occurred and be continuing; (2) a Cash Sweep Event Cure caused by an event of default or bankruptcy action of the borrower or manager may occur no more than a total of two times in the aggregate during the term of the BJ’s Wholesale Club Loan; (3) a Cash Sweep Event caused by a DSCR Trigger Event, a BJ’s Trigger Event or a Downgrade Trigger Event may be cured an unlimited number of times during the term of the BJ’s Wholesale Club Loan and (4) the borrower pays the lender’s reasonable expenses in connection with such cure.
A “BJ’s Trigger Event” means (i) BJ’s terminates its lease, goes dark, vacates or abandons its premises at the BJ’s Wholesale Club Property, or gives notice of its intention to do so, (ii) BJ’s subleases 40.0% or more of its space presently occupied pursuant to the BJ’s Lease (excluding the space occupied by Dunkin’ Donuts and the space presently used for the sale of liquor) or (iii) a BJ’s bankruptcy.
A “BJ’s Trigger Event Cure” means (a) the borrower enters into one or more leases with one or more replacement tenants subject to the approval of the lender, and the lender has received satisfactory evidence that such tenants are in physical occupancy of their spaces in accordance with the related terms and conditions set forth in the BJ’s Wholesale Club Loan documents, or (b) solely with respect to clause (ii) above, the amount on deposit in the excess cash flow reserve equals $7.0 million, and all tenants under subleases with BJ’s (excluding Dunkin’ Donuts and the space presently used for the sale of liquor) are in occupancy of their respective subleased spaces.
Lockbox / Cash Management.The BJ’s Wholesale Club Loan is structured with a hard lockbox and springing cash management. The borrower is required to deliver tenant direction letters to all tenants instructing the tenants to deposit all rents and payments into a lender-controlled lockbox account. To the extent no Cash Sweep Event has occurred and is continuing, all funds in the lockbox account are required to be transferred to or at the direction of the borrower. Following the occurrence and during the continuance of a Cash Sweep Event, all funds in the lockbox account are required to be swept each business day to a segregated cash management account under the control of the lender and disbursed in accordance with the BJ’s Wholesale Club Loan documents. To the extent a Cash Sweep Event has occurred and is continuing, all excess cash flow after payment of debt service, required reserves and operating expenses are required to be held as additional collateral for the BJ’s Wholesale Club Loan. The lender has been granted a first priority security interest in the cash management account.
Tax Abatement. The BJ’s Wholesale Club Property currently benefits from a 25-year tax abatement from the Industrial & Commercial Abatement Program (the “ICAP”) provided by the New York City Department of Finance. The ICAP for the BJ’s Wholesale Club Property commenced in the tax year 2014/2015 and is scheduled to expire in the tax year 2039/2040. However, the BJ’s Wholesale Club Loan was underwritten based on the full tax amount. Please see “Description of the Mortgage Pool – Real Estate and Other Tax Considerations” in the Preliminary Prospectus for additional information.
Environmental History. The environmental site assessment report (the “ESA”) obtained at origination indicated that the prior investigations at the BJ’s Wholesale Club Property identified areas of concern which were remediated through installation of the appropriate engineering controls (the “Controls”), including, without limitation, monitoring for groundwater and methane and hydrogen sulfide. Subsequently, a Site Management Plan (“SMP”) was implemented to include certain restrictions and requirements, including, without limitation, a requirement for an annual written statement (the “Annual Statement”) to be submitted to the New York State Department of Environmental Conservation (“NYSDEC”) and/or New York City Office of Environmental Remediation (“NYC OER”), certifying to the continued effectiveness of the Controls and stating that nothing has occurred that impairs the ability of the Controls to protect public health and environment or that constitutes a failure to comply with the SMP. The ESA noted that the BJ’s Wholesale Club Property has received conditional regulatory closure and was required to continue the methane monitoring. Based on the foregoing, the ESA indicated that the conditions at the BJ’s Wholesale Club Property are considered a controlled recognized environmental condition, and recommended continued implementation of the SMP and annual submission of the Annual Statement to the NYSDEC and/or the NYC OER. Please see “Description of the Mortgage Pool – Environmental Considerations” in the Preliminary Prospectus for additional information.
Additional Debt. None.
Partial Release.None.
| THE INFORMATION IN THIS STRUCTURAL AND COLLATERAL TERM SHEET IS NOT COMPLETE AND MAY BE AMENDED PRIOR TO THE TIME OF SALE. THIS TERM SHEET IS NOT AN OFFER TO SELL THESE SECURITIES AND IT IS NOT A SOLICITATION OF AN OFFER TO BUY THESE SECURITIES IN ANY JURISDICTION WHERE THE OFFER OR SALE IS NOT PERMITTED. |
| |
| | 86 of 145 | |
| Structural and Collateral Term Sheet | | JPMDB 2019-COR6 |
[THIS PAGE INTENTIONALLY LEFT BLANK]
| THE INFORMATION IN THIS STRUCTURAL AND COLLATERAL TERM SHEET IS NOT COMPLETE AND MAY BE AMENDED PRIOR TO THE TIME OF SALE. THIS TERM SHEET IS NOT AN OFFER TO SELL THESE SECURITIES AND IT IS NOT A SOLICITATION OF AN OFFER TO BUY THESE SECURITIES IN ANY JURISDICTION WHERE THE OFFER OR SALE IS NOT PERMITTED. |
| |
| | 87 of 145 | |
| Structural and Collateral Term Sheet | | JPMDB 2019-COR6 |
|
| Hampton Roads Office Portfolio |
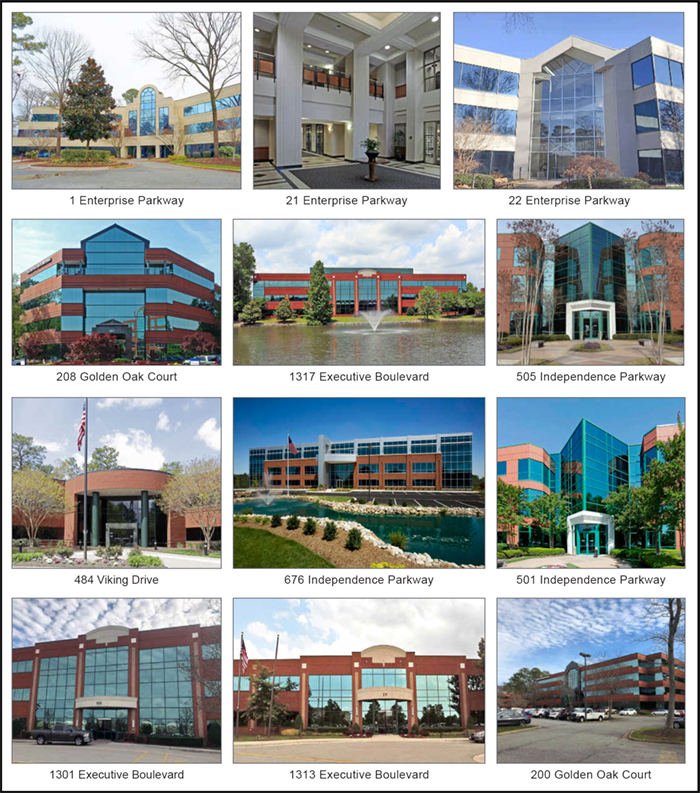
| THE INFORMATION IN THIS STRUCTURAL AND COLLATERAL TERM SHEET IS NOT COMPLETE AND MAY BE AMENDED PRIOR TO THE TIME OF SALE. THIS TERM SHEET IS NOT AN OFFER TO SELL THESE SECURITIES AND IT IS NOT A SOLICITATION OF AN OFFER TO BUY THESE SECURITIES IN ANY JURISDICTION WHERE THE OFFER OR SALE IS NOT PERMITTED. |
| |
| | 88 of 145 | |
| Structural and Collateral Term Sheet | | JPMDB 2019-COR6 |
|
| Hampton Roads Office Portfolio |
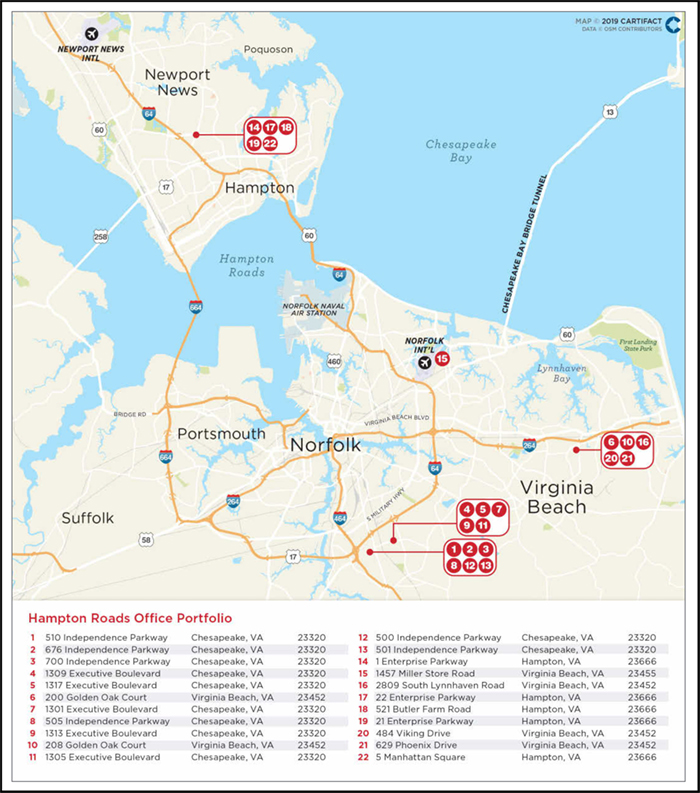
| THE INFORMATION IN THIS STRUCTURAL AND COLLATERAL TERM SHEET IS NOT COMPLETE AND MAY BE AMENDED PRIOR TO THE TIME OF SALE. THIS TERM SHEET IS NOT AN OFFER TO SELL THESE SECURITIES AND IT IS NOT A SOLICITATION OF AN OFFER TO BUY THESE SECURITIES IN ANY JURISDICTION WHERE THE OFFER OR SALE IS NOT PERMITTED. |
| |
| | 89 of 145 | |
| Structural and Collateral Term Sheet | | JPMDB 2019-COR6 |
|
| Hampton Roads Office Portfolio |
| Mortgage Loan Information | | Property Information |
| Mortgage Loan Seller: | LCM | | Single Asset / Portfolio: | Portfolio |
| Original Principal Balance(1): | $40,000,000 | | Title: | Fee |
| Cut-off Date Principal Balance(1): | $39,723,151 | | Property Type - Subtype: | Office – Suburban |
| % of Pool by IPB: | 4.9% | | Net Rentable Area (SF): | 1,322,003 |
| Loan Purpose: | Acquisition | | Location: | Various, VA |
| Borrowers(2): | Various | | Year Built / Renovated: | Various / N/A |
| Sponsor: | Lawrence Heller | | Occupancy: | 88.5% |
| Interest Rate: | 5.30000% | | Occupancy Date: | Various |
| Note Date: | 3/28/2019 | | Number of Tenants: | 138 |
| Maturity Date: | 4/6/2029 | | 2016 NOI: | $12,770,635 |
| Interest-only Period: | None | | 2017 NOI: | $13,066,165 |
| Original Term: | 120 months | | 2018 NOI: | $13,467,187 |
| Original Amortization(3): | 360 months | | TTM NOI (as of 7/2019): | $14,482,053 |
| Amortization Type(3): | Balloon | | UW Economic Occupancy: | 86.4% |
| Call Protection(4): | L(31),Grtr1%orYM(86),O(3) | | UW Revenues: | $22,491,550 |
| Lockbox / Cash Management: | Hard / In Place | | UW Expenses: | $8,208,420 |
| Additional Debt(1)(3): | Yes | | UW NOI: | $14,283,130 |
| Additional Debt Balance(1)(3): | $92,356,327 / $19,861,576 | | UW NCF: | $12,283,620 |
| Additional Debt Type(1)(3): | Pari Passu / Mezzanine Loan | | Appraised Value / Per SF: | $185,200,000 / $140 |
| | | | Appraisal Date: | 1/7/2019 |
| | | | | |
| Escrows and Reserves(5) | | Financial Information(1) |
| | Initial | Monthly | Initial Cap | | | Whole Loan | Total Debt |
| Taxes: | $600,000 | $150,800 | N/A | | Cut-off Date Loan / SF: | $100 | $115 |
| Insurance: | $30,000 | $22,200 | N/A | | Maturity Date Loan / SF: | $84 | $97 |
| Replacement Reserves: | $250,000 | $33,050 | $4,000,000 | | Cut-off Date LTV: | 71.3% | 82.0% |
| TI/LC: | $1,500,000 | $168,555 | N/A | | Maturity Date LTV: | 60.3% | 69.3% |
| Other | $1,311,289 | $0 | N/A | | UW NCF DSCR: | 1.40x | 1.16x |
| | | | | | UW NOI Debt Yield: | 10.8% | 9.4% |
| | | | | | | | |
|
| |
| Sources and Uses |
| Sources | Proceeds | % of Total | | Uses | Proceeds | % of Total |
| Whole Loan(1) | $133,000,000 | 69.7% | | Purchase Price | $183,000,000 | 95.9% |
| Mezzanine Loan | 20,000,000 | 10.5 | | Closing Costs | 4,206,061 | 2.2% |
| Sponsor Equity | 37,897,350 | 19.9 | | Upfront Reserves | 3,691,289 | 1.9% |
| Total Sources | $190,897,350 | 100.0% | | Total Uses | $190,897,350 | 100.0% |
| | | | | | | | | | | | | | | |
| (1) | The Hampton Roads Office Portfolio Loan (as defined below) is part of a whole loan evidenced by sixpari passu notes, with an aggregate outstanding principal balance as of the Cut-off Date of approximately $132.1 million. The Financial Information presented in the chart above reflects the Cut-off Date Balance of the approximately $132.1 million Hampton Roads Office Portfolio Whole Loan (as defined below). |
| (2) | The borrowers are Hampton Roads I Owner, LLC, Hampton Roads II Owner, LLC, Hampton Roads III Owner, LLC, Hampton Roads IV Owner, LLC, Hampton Roads V Owner, LLC, Hampton Roads VI Owner, LLC, Hampton Roads VII Owner, LLC, Hampton Roads VIII Owner, LLC, Hampton Roads IX Owner, LLC, Hampton Roads TRS Holding A, LLC, Hampton Roads TRS Holding B, LLC and Hampton Roads TRS Holding C, LLC. |
| (3) | The Hampton Roads Office Portfolio Whole Loan amortizes pursuant to a fixed amortization schedule as set forth in Annex H to the Preliminary Prospectus. Debt service coverage ratios are calculated using the sum of the first 12 principal and interest payments after the Cut-off Date based on the assumed principal and interest payment schedule set forth in Annex H to the Preliminary Prospectus. |
| (4) | The lockout period will be at least 31 payment dates beginning with and including the first payment date of May 6, 2019. The borrowers may prepay the Hampton Roads Office Portfolio Whole Loan along with a yield maintenance premium after the date that is the earlier to occur of (i) two years after the closing date of the securitization that includes the lastpari passunote to be securitized and (ii) October 6, 2022. The assumed lockout period of 31 payments is based on the expected JPMDB 2019-COR6 securitization closing date in November 2019. The actual lockout period may be longer. Partial releases are permitted. See“Partial Releases” below. |
| (5) | For a full description of Escrows and Reserves, please refer to“Escrows and Reserves”below. |
| THE INFORMATION IN THIS STRUCTURAL AND COLLATERAL TERM SHEET IS NOT COMPLETE AND MAY BE AMENDED PRIOR TO THE TIME OF SALE. THIS TERM SHEET IS NOT AN OFFER TO SELL THESE SECURITIES AND IT IS NOT A SOLICITATION OF AN OFFER TO BUY THESE SECURITIES IN ANY JURISDICTION WHERE THE OFFER OR SALE IS NOT PERMITTED. |
| |
| | 90 of 145 | |
| Structural and Collateral Term Sheet | | JPMDB 2019-COR6 |
|
| Hampton Roads Office Portfolio |
The Loan.The Hampton Roads Office Portfolio loan, with a principal balance of approximately $39.7 million as of the Cut-off Date (the “Hampton Roads Office Portfolio Loan”), is secured by a first mortgage lien on the borrowers’ fee simple interest in 22 office properties comprised of 1,322,003 square feet of net rentable area (the “Hampton Roads Office Portfolio Properties” or the “Hampton Roads Office Portfolio”) located in Chesapeake, Hampton and Virginia Beach, Virginia. The Hampton Roads Office Portfolio Loan is part of a whole loan that has an aggregate outstanding principal balance as of the Cut-off Date of approximately $132.1 million (the “Hampton Roads Office Portfolio Whole Loan”) and is comprised of sixpari passu notes, each as described in the “Whole Loan Summary” chart below. The non-controlling Notes A-3 and A-4, with an aggregate outstanding principal balance as of the Cut-off Date of approximately $39.7 million, are being contributed to the JPMDB 2019-COR6 Trust. The controlling Notes A-1 and A-5, with an aggregate outstanding principal balance as of the Cut-off Date of approximately $49.7 million, were contributed to the JPMCC 2019-COR5 Trust. The non-controlling Notes A-2 and A-6, with an aggregate outstanding principal balance as of the Cut-off Date of approximately $42.7 million, are held by LCM or an affiliate and expected to be contributed to one or more future securitizations or may otherwise be transferred at any time. The relationship between the holders of the Hampton Roads Office Portfolio Whole Loan will be governed by a co-lender agreement as described under “Description of the Mortgage Pool—The Whole Loans—The Non-Serviced Pari Passu Whole Loans” in the Preliminary Prospectus. The Hampton Roads Office Portfolio Loan has a 10-year term and amortizes pursuant to a fixed amortization schedule as set forth in Annex H to the Preliminary Prospectus.The most recent prior financing of theHampton Roads Office PortfolioProperties was not included in a securitization.
| Whole Loan Summary |
| Note | Original Balance | Cut-off Date Balance | Note Holder | Controlling Piece |
| A-1, A-5 | $50,000,000 | $49,653,939 | JPMCC 2019-COR5 | Yes |
| A-3, A-4 | 40,000,000 | 39,723,151 | JPMDB 2019-COR6 | No |
| A-2 | 33,000,000 | 32,771,600 | LCM | No |
| A-6 | 10,000,000 | 9,930,788 | LCM | No |
| Total | $133,000,000 | $132,079,478 | | |
The Borrowers. The borrowing entities are Hampton Roads I Owner, LLC, Hampton Roads II Owner, LLC, Hampton Roads III Owner, LLC, Hampton Roads IV Owner, LLC, Hampton Roads V Owner, LLC, Hampton Roads VI Owner, LLC, Hampton Roads VII Owner, LLC, Hampton Roads VIII Owner, LLC, Hampton Roads IX Owner, LLC, Hampton Roads TRS Holding A, LLC, Hampton Roads TRS Holding B, LLC and Hampton Roads TRS Holding C, LLC, each a Delaware limited liability company and special purpose entity structured to be bankruptcy remote with two independent directors. Legal counsel to the borrowers delivered a non-consolidation opinion in connection with the origination of the Hampton Roads Portfolio Whole Loan.
The Loan Sponsor.The loan sponsor and nonrecourse carve-out guarantor is Lawrence Heller. Mr. Heller is the managing member of Acme Equities LLC, a private holding company that invests in the real estate, oil and gas, power, hotel and high yield markets. Mr. Heller has over 30 years of experience in the development and execution of deals involving real estate acquisitions, distressed oil and gas assets, real estate workouts, and high yield debt trading and has actively managed a portfolio of family real estate holdings comprised of over 175 properties throughout the United States. In addition, Mr. Heller has invested over $5.0 billion of capital over the past decade.
The Properties.The Hampton Roads Office Portfolio Properties are comprised of 22 office properties totaling 1,322,003 square feet situated throughout Virginia in Chesapeake (11 properties, 54.3% of net rentable area; 65.7% of underwritten net operating income), Virginia Beach (six properties, 25.0% of net rentable area; 21.1% of underwritten net operating income) and Hampton (five properties, 20.7% of net rentable area; 13.1% of underwritten net operating income). The Hampton Roads Office Portfolio Properties are leased by a granular and diverse roster of publicly-traded and national and international firms, regional companies, and local businesses. The tenant base represents a broad range of industries including law, financial services, healthcare, military, logistics, technology, consumer goods, communications, insurance, and real estate and offers limited exposure, as no single tenant occupies more than 3.8% of net rentable area. Additionally, the Hampton Roads Office Portfolio has exhibited an average 10-year historical occupancy since 2009 equal to 88.8%. As of the August 31, 2019 underwritten rent rolls, the Hampton Roads Office Portfolio Properties were 88.5% leased to 138 tenants over 154 leases at a weighted average underwritten base rent equal to $15.49 per square foot.
| THE INFORMATION IN THIS STRUCTURAL AND COLLATERAL TERM SHEET IS NOT COMPLETE AND MAY BE AMENDED PRIOR TO THE TIME OF SALE. THIS TERM SHEET IS NOT AN OFFER TO SELL THESE SECURITIES AND IT IS NOT A SOLICITATION OF AN OFFER TO BUY THESE SECURITIES IN ANY JURISDICTION WHERE THE OFFER OR SALE IS NOT PERMITTED. |
| |
| | 91 of 145 | |
| Structural and Collateral Term Sheet | | JPMDB 2019-COR6 |
|
| Hampton Roads Office Portfolio |
| Portfolio Summary |
| Property Name | City | Year Built | Total SF | % of Total | Occupancy(1) | UW NOI | Allocated Whole Loan Original Balance | Appraised Value |
| 510 Independence Parkway | Chesapeake | 1999 | 97,081 | 7.3% | 89.4% | $1,177,063 | $11,030,000 | $14,100,000 |
| 676 Independence Parkway | Chesapeake | 2008 | 73,345 | 5.5% | 100.0% | 1,168,144 | 11,010,000 | 11,200,000 |
| 700 Independence Parkway | Chesapeake | 2001 | 96,807 | 7.3% | 100.0% | 1,091,349 | 9,050,000 | 13,400,000 |
| 1309 Executive Boulevard | Chesapeake | 2001 | 49,870 | 3.8% | 100.0% | 793,477 | 7,770,000 | 8,500,000 |
| 1317 Executive Boulevard | Chesapeake | 2007 | 73,583 | 5.6% | 100.0% | 1,123,742 | 7,560,000 | 12,400,000 |
| 200 Golden Oak Court | Virginia Beach | 1988 | 74,290 | 5.6% | 84.1% | 804,828 | 7,260,000 | 10,900,000 |
| 1301 Executive Boulevard | Chesapeake | 2006 | 50,020 | 3.8% | 100.0% | 728,185 | 7,070,000 | 8,100,000 |
| 505 Independence Parkway | Chesapeake | 2000 | 63,568 | 4.8% | 97.2% | 769,826 | 7,010,000 | 8,500,000 |
| 1313 Executive Boulevard | Chesapeake | 2002 | 49,870 | 3.8% | 100.0% | 667,712 | 6,360,000 | 8,500,000 |
| 208 Golden Oak Court | Virginia Beach | 1989 | 63,825 | 4.8% | 94.6% | 715,592 | 6,310,000 | 9,000,000 |
| 1305 Executive Boulevard | Chesapeake | 2002 | 49,865 | 3.8% | 81.2% | 470,235 | 6,090,000 | 7,100,000 |
| 500 Independence Parkway | Chesapeake | 2001 | 51,000 | 3.9% | 100.0% | 654,058 | 6,000,000 | 7,400,000 |
| 501 Independence Parkway | Chesapeake | 2000 | 63,474 | 4.8% | 90.1% | 743,090 | 5,880,000 | 8,000,000 |
| 1 Enterprise Parkway | Hampton | 1987 | 63,029 | 4.8% | 65.2% | 360,625 | 5,450,000 | 7,700,000 |
| 1457 Miller Store Road | Virginia Beach | 1988 | 65,192 | 4.9% | 100.0% | 521,930 | 5,060,000 | 6,100,000 |
| 2809 South Lynnhaven Road | Virginia Beach | 1987 | 62,924 | 4.8% | 74.9% | 572,631 | 4,360,000 | 9,500,000 |
| 22 Enterprise Parkway | Hampton | 1990 | 72,444 | 5.5% | 76.2% | 571,304 | 4,140,000 | 8,900,000 |
| 521 Butler Farm Road | Hampton | 1989 | 44,651 | 3.4% | 100.0% | 427,505 | 4,080,000 | 6,300,000 |
| 21 Enterprise Parkway | Hampton | 1998 | 75,915 | 5.7% | 59.0% | 376,638 | 3,820,000 | 9,100,000 |
| 484 Viking Drive | Virginia Beach | 1987 | 39,633 | 3.0% | 43.3% | 133,955 | 3,780,000 | 5,400,000 |
| 629 Phoenix Drive | Virginia Beach | 1996 | 24,549 | 1.9% | 100.0% | 270,336 | 2,640,000 | 2,900,000 |
| 5 Manhattan Square | Hampton | 1999 | 17,068 | 1.3% | 100.0% | 140,904 | 1,270,000 | 2,200,000 |
| Total / Wtd. Avg. | | | 1,322,003 | 100.0% | 88.5% | $14,283,130 | $133,000,000 | $185,200,000 |
| (1) | Based on the underwritten rent rolls dated as of August 31, 2019. |
The largest tenant at the Hampton Roads Office Portfolio is Cegedim Dendrite (“Cegedim”) (49,870 square feet; 3.8% of net rentable area; 4.7% of underwritten base rent). Founded in 1969, Cegedim is a global technology and services company that supplies services, technological tools, specialized software, data flow management services and databases. Cegedim’s offerings are targeted notably at healthcare professionals, healthcare industries, life science companies, and health insurance companies. Cegedim is the world’s leading provider of pharmaceutical-specific customer relationship management solutions with a 35.0% global market share. Cegedim employs more than 4,500 people in more than 10 countries. Cegedim fully occupies the 1309 Executive Boulevard property located in Chesapeake, Virginia, where it originally took occupancy in 2001 and is on a lease initially expiring in December 2020. Cegedim currently pays base rent equal to $17.05 per square foot, has no termination options and has two, five-year renewal options remaining.
The second largest tenant at the Hampton Roads Office Portfolio is Sutherland Global Services Inc. (“Sutherland”) (49,870 square feet; 3.8% of net rentable area; 3.9% of underwritten base rent). Found in 1986, Sutherland is a business process outsourcing and technology-enabled services company, that provides an integrated set of back-office and customer facing front-office services that support the entire customer lifecycle. Sutherland offers digital, customer engagement, and business process transformation services. Sutherland serves clients in banking and financial services, healthcare, technology, media and communications, retail, insurance, travel and hospitality, government industries in the United States and internationally.Sutherland fully occupies the 1313 Executive Boulevard property located in Chesapeake, Virginia, where it originally took occupancy in 2012 and is on a lease initially expiring in September 2024. Sutherland currently pays base rent equal to $14.10 per square foot, has no termination options and one, five-year renewal option remaining.
The third largest tenant at the Hampton Roads Office Portfolio is General Dynamics Info (“General Dynamics”) (46,745 square feet; 3.5% of net rentable area; 3.1% of underwritten base rent; rated A2/NR/A+ by Moody’s/Fitch/S&P). General Dynamics is an American aerospace and defense multinational corporation. General Dynamics is the world’s fifth-largest defense contractor based on 2012 revenues and ranked No. 99 in the 2018 Fortune 500 list of the largest United States corporations by total revenue. General Dynamics has over 105,000 employees and reported over $36.0 billion of revenue in 2018. General Dynamics occupies 46,745 square feet at the 700 Independence Parkway property located in Chesapeake, Virginia, where it originally took occupancy in 2017and is on a lease initially expiring in January 2022. General Dynamics currently pays base rent equal to $12.02 per square foot, has no termination options and one, five-year renewal option remaining.
| THE INFORMATION IN THIS STRUCTURAL AND COLLATERAL TERM SHEET IS NOT COMPLETE AND MAY BE AMENDED PRIOR TO THE TIME OF SALE. THIS TERM SHEET IS NOT AN OFFER TO SELL THESE SECURITIES AND IT IS NOT A SOLICITATION OF AN OFFER TO BUY THESE SECURITIES IN ANY JURISDICTION WHERE THE OFFER OR SALE IS NOT PERMITTED. |
| |
| | 92 of 145 | |
| Structural and Collateral Term Sheet | | JPMDB 2019-COR6 |
|
| Hampton Roads Office Portfolio |
The Hampton Roads Office Portfolio Properties are located across four individual submarkets within the Hampton Roads office market in Southeastern Virginia: Battlefield in Chesapeake (six properties; 33.7% of net rentable area; 39.2% of underwritten net operating income), Lynnhaven in Virginia Beach (six properties; 25.0% of net rentable area; 21.1% of underwritten net operating income), Greenbrier in Chesapeake (five properties; 20.7% of net rentable area; 26.5% of underwritten net operating income) and Hampton Roads Center in Hampton (five properties; 20.7% of net rentable area; 13.1% of underwritten net operating income). The majority of the Hampton Roads Office Portfolio Properties within each submarket are in close proximity to one another and are located within individual business parks.
According to a market report, as of the third quarter of 2019, the overall Hampton Roads office market contained approximately 53.1 million square feet across 3,541 buildings with an overall market vacancy of 8.5% and average asking rents of approximately $17.86 per square foot. The Battlefield office submarket contained approximately 1.3 million square feet across 46 buildings with an overall market vacancy of 3.6% and average asking rents of approximately $17.91 per square foot. The Lynnhaven office submarket contained approximately 1.9 million square feet across 73 buildings with an overall market vacancy of 11.6% and average asking rents of approximately $18.68 per square foot. The Greenbrier office submarket contained approximately 3.3 million square feet across 140 buildings with an overall market vacancy of 4.4% and average asking rents of approximately $18.54 per square foot. The Hampton Roads Center office submarket contained approximately 1.2 million square feet across 26 buildings with an overall market vacancy of 21.7% and average asking rents of approximately $13.98 per square foot. Based on the square footage of the Hampton Roads Office Portfolio Properties, the weighted average vacancy and average asking rents as of the third quarter of 2019 were equal to 9.5% and $17.42 per square foot, respectively.
| Historical and Current Occupancy(1) |
| 2009 | 2010 | 2011 | 2012 | 2013 | 2014 | 2015 | 2016 | 2017 | 2018 | Current(2) |
| 87.7% | 89.2% | 86.9% | 88.5% | 89.2% | 89.2% | 87.9% | 87.3% | 92.0% | 90.5% | 88.5% |
(1) Historical Occupancies are as of December 31 of eachrespective year.
(2) Current Occupancy is as of the rent rolls dated August 31, 2019.
| Tenant Summary(1) |
| Tenant | Ratings
Moody’s/Fitch/S&P(2) | Net Rentable Area (SF) | % of
Total NRA | Base Rent PSF(3) | % of Total
Base Rent(3) | Lease
Expiration Date |
| Cegedim Dendrite(4) | NR / NR / NR | 49,870 | 3.8% | $17.05 | 4.7% | 12/31/2020 |
| Sutherland Global Services Inc.(4) | NR / NR / NR | 49,870 | 3.8% | $14.10 | 3.9% | 9/30/2024 |
| General Dynamics Info(4) | A2 / NR / A+ | 46,745 | 3.5% | $12.02 | 3.1% | 1/31/2022 |
| Ferguson Enterprises, Inc. | NR / NR / NR | 44,651 | 3.4% | $10.24 | 2.5% | 3/31/2021 |
| Children’s Hospital of The King’s Daughters, Inc.(4)(5) | NR / NR / NR | 38,213 | 2.9% | $12.94 | 2.7% | 5/31/2026 |
| Antech Systems(6) | NR / NR / NR | 33,413 | 2.5% | $19.36 | 3.6% | Various(6) |
| Ultralife Corporation | NR / NR / NR | 32,522 | 2.5% | $9.26 | 1.7% | 4/30/2021 |
| Schenker, Inc.(4)(7) | NR / NR / NR | 31,709 | 2.4% | $12.30 | 2.1% | Various(7) |
| Science Systems and Applications Inc.(8) | NR / NR / NR | 30,755 | 2.3% | $11.54 | 2.0% | 5/31/2021 |
| United States Coast Guard Community Services | Aaa / AAA / AA+ | 27,498 | 2.1% | $15.23 | 2.3% | 1/31/2027 |
| Top 10 Total / Wtd. Avg. | | 385,246 | 29.1% | $13.44 | 28.6% | |
| Other Tenants | | 785,175 | 59.4% | $16.49 | 71.4% | |
| Total Occupied Space | | 1,170,421 | 88.5% | $15.49 | 100.0% | |
| Vacant | | 151,582 | 11.5% | | | |
| Total | | 1,322,003 | 100.0% | | | |
| (1) | Based on the underwritten rent rolls dated as of August 31, 2019. |
| (2) | In certain instances, ratings provided are those of the parent company of the entity shown, whether or not the parent company guarantees the lease. |
| (3) | Base Rent includes approximately $507,663 in contractual rent steps through November 2020 for certain tenants. |
| (4) | Cegedim Dendrite has two, five-year renewal options remaining, Sutherland Global Services Inc. has one, five-year renewal options remaining, General Dynamics Info has one, five-year renewal option remaining, Children’s Hospital of The King’s Daughters, Inc. has one, five-year renewal option remaining and Schenker, Inc. has two, five-year renewal options remaining. |
| (5) | Children’s Hospital of The King’s Daughters, Inc. has the right to terminate its lease at any time after May 31, 2023 by providing at least 12 months’ notice. |
| (6) | Antech Systems leases 5,028 square feet through May 2021, 4,804 square feet through May 2022 and 23,581 square feet through May 2023. |
| (7) | Schenker, Inc. leases 26,283 square feet through January 2021 and 5,426 square feet through June 2022. |
| (8) | Science Systems and Applications Inc. has the right to terminate its lease at any time by providing at least six months’ notice and payment of a termination fee. |
| THE INFORMATION IN THIS STRUCTURAL AND COLLATERAL TERM SHEET IS NOT COMPLETE AND MAY BE AMENDED PRIOR TO THE TIME OF SALE. THIS TERM SHEET IS NOT AN OFFER TO SELL THESE SECURITIES AND IT IS NOT A SOLICITATION OF AN OFFER TO BUY THESE SECURITIES IN ANY JURISDICTION WHERE THE OFFER OR SALE IS NOT PERMITTED. |
| |
| | 93 of 145 | |
| Structural and Collateral Term Sheet | | JPMDB 2019-COR6 |
|
| Hampton Roads Office Portfolio |
| Lease Rollover Schedule(1)(2) |
| Year | Number
of Leases
Expiring | Net
Rentable
Area
Expiring | % of
NRA
Expiring | Base Rent Expiring(3) | % of Base
Rent
Expiring(3) | Cumulative
Net Rentable
Area Expiring | Cumulative
% of NRA
Expiring | Cumulative
Base Rent
Expiring(3) | Cumulative
% of Base
Rent
Expiring(3) |
| Vacant | NAP | 151,582 | 11.5% | NAP | NAP | 151,582 | 11.5% | NAP | NAP |
| 2019 & MTM | 5 | 28,348 | 2.1% | $386,179 | 2.1% | 179,930 | 13.6% | $386,179 | 2.1% |
| 2020 | 36 | 226,347 | 17.1% | 3,391,156 | 18.7% | 406,277 | 30.7% | $3,777,334 | 20.8% |
| 2021 | 37 | 340,900 | 25.8% | 4,894,521 | 27.0% | 747,177 | 56.5% | $8,671,855 | 47.8% |
| 2022 | 26 | 170,041 | 12.9% | 2,779,998 | 15.3% | 917,218 | 69.4% | $11,451,853 | 63.2% |
| 2023 | 20 | 130,864 | 9.9% | 2,389,039 | 13.2% | 1,048,082 | 79.3% | $13,840,892 | 76.3% |
| 2024 | 15 | 139,422 | 10.5% | 2,305,645 | 12.7% | 1,187,504 | 89.8% | $16,146,537 | 89.1% |
| 2025 | 4 | 32,090 | 2.4% | 501,226 | 2.8% | 1,219,594 | 92.3% | $16,647,764 | 91.8% |
| 2026 | 1 | 38,213 | 2.9% | 494,604 | 2.7% | 1,257,807 | 95.1% | $17,142,368 | 94.6% |
| 2027 | 2 | 29,796 | 2.3% | 450,062 | 2.5% | 1,287,603 | 97.4% | $17,592,430 | 97.0% |
| 2028 | 0 | 0 | 0.0% | 0 | 0.0% | 1,287,603 | 97.4% | $17,592,430 | 97.0% |
| 2029 | 0 | 0 | 0.0% | 0 | 0.0% | 1,287,603 | 97.4% | $17,592,430 | 97.0% |
| 2030 & Beyond | 8 | 34,400 | 2.6% | 537,263 | 3.0% | 1,322,003 | 100.0% | $18,129,693 | 100.0% |
| Total | 154 | 1,322,003 | 100.0% | $18,129,693 | 100.0% | | | | |
| (1) | Based on the underwritten rent rolls dated August 31, 2019. |
| (2) | Certain tenants have lease termination options that may become exercisable prior to the originally stated expiration date of the tenant lease and that are not considered in the lease rollover schedule. |
| (3) | Base Rent Expiring includes approximately $507,663 in contractual rent steps through November 2020 for certain tenants. |
| Operating History and Underwritten Net Cash Flow |
| | 2016 | 2017 | 2018 | TTM(1) | Underwritten | Per Square
Foot | %(2) |
| Rents in Place | $14,197,324 | $15,261,475 | $16,317,558 | $16,921,722 | $17,622,030 | $13.33 | 67.7% |
| Contractual Rent Steps(3) | 0 | 0 | 0 | 0 | 507,663 | 0.38 | 2.0 |
| Vacant Income | 0 | 0 | 0 | 0 | 2,936,081 | 2.22 | 11.3 |
| Gross Potential Rent | $14,197,324 | $15,261,475 | $16,317,558 | $16,921,722 | $21,065,775 | $15.93 | 80.9% |
| Total Reimbursements | 6,233,629 | 5,649,360 | 5,536,333 | 5,450,439 | 4,763,361 | 3.60 | 18.3 |
| Total Other Income | 165,751 | 176,645 | 170,993 | 176,268 | 194,268 | 0.15 | 0.7 |
| Net Rental Income | $20,596,704 | $21,087,480 | $22,024,884 | $22,548,429 | $26,023,404 | $19.68 | 100.0% |
| (Vacancy/Credit Loss) | 0 | 0 | 0 | 0 | (3,531,853) | (2.67) | (13.6) |
| Effective Gross Income | $20,596,704 | $21,087,480 | $22,024,884 | $22,548,429 | $22,491,550 | $17.01 | 86.4% |
| Total Expenses | $7,826,069 | $8,021,316 | $8,557,697 | $8,066,376 | $8,208,420 | $6.21 | 36.5% |
| Net Operating Income | $12,770,635 | $13,066,165 | $13,467,187 | $14,482,053 | $14,283,130 | $10.80 | 63.5% |
| Total TI/LC, CapEx/RR | 0 | 0 | 0 | 0 | 1,999,510 | 1.51 | 8.9 |
| Net Cash Flow | $12,770,635 | $13,066,165 | $13,467,187 | $14,482,053 | $12,283,620 | $9.29 | 54.6% |
| | | | | | | | | | | | | |
| (1) | TTM column represents the trailing 12-month period ending July 31, 2019. |
| (2) | % column represents percent of Net Rental Income for all revenue lines and represents percent of Effective Gross Income for the remainder of the fields. |
| (3) | Based on the contractual rent steps through November 2020 for certain tenants. |
Property Management.The Hampton Roads Office Portfolio Properties are managed by LingComm, LLC, a third-party management company.
| THE INFORMATION IN THIS STRUCTURAL AND COLLATERAL TERM SHEET IS NOT COMPLETE AND MAY BE AMENDED PRIOR TO THE TIME OF SALE. THIS TERM SHEET IS NOT AN OFFER TO SELL THESE SECURITIES AND IT IS NOT A SOLICITATION OF AN OFFER TO BUY THESE SECURITIES IN ANY JURISDICTION WHERE THE OFFER OR SALE IS NOT PERMITTED. |
| |
| | 94 of 145 | |
| Structural and Collateral Term Sheet | | JPMDB 2019-COR6 |
|
| Hampton Roads Office Portfolio |
Escrows and Reserves. At origination, the borrowers deposited into escrow $1,500,000 for anticipated tenant improvements and leasing commissions, approximately $1,001,936 for outstanding tenant improvements and leasing commissions, $600,000 for real estate taxes, $250,000 for replacement reserves, $223,102 for required repairs, approximately $86,251 for outstanding free rent and $30,000 for insurance premiums.
Tax Escrows– On a monthly basis,the borrowers are required to escrow 1/12 of the annual estimated tax payments, which currently equates to $150,800.
Insurance Escrows– On a monthly basis,the borrowers are required to escrow 1/12 of the annual estimated insurance premiums, which currently equates to $22,200.
Replacement Reserves –On a monthly basis, the borrowers are required to escrow $33,050 for replacement reserves, subject to a cap of $4,000,000.
TI/LC Reserves – On a monthly basis, the borrowers are required to escrow $168,555 for tenant improvements and leasing commissions.
Lockbox / Cash Management.The Hampton Roads Office Portfolio Whole Loan is structured with a hard lockbox and in place cash management. All rents are required to be deposited directly by the tenants into a lockbox account controlled by the lender. All funds in the lockbox account are required to be swept to a lender-controlled cash management account every business day and applied on each payment date to the payment of debt service and the funding of required reserves. Provided no Cash Trap Period (as defined below) is continuing, all funds remaining in the cash management account after payment of the aforementioned items will be transferred into the borrowers’ operating account. During a Cash Trap Period, all excess cash in the cash management account will be retained by the lender as additional collateral for the Hampton Roads Office Portfolio Whole Loan.
A “Cash Trap Period” will commence (i) upon an event of default (including an event of default under the mezzanine loan), (ii) from and after October 6, 2019, if the debt service coverage ratio is less than 1.10x (including the mezzanine loan) (until such time that the debt service coverage ratio is greater than or equal to 1.10x for two consecutive quarters) or (iii) upon 60 days after the death or incapacity of the loan sponsor.
Current Mezzanine or Subordinate Indebtedness.A mezzanine loan was funded concurrently and is coterminous with the Hampton Roads Office Portfolio Whole Loan. The mezzanine loan has an original principal balance of $20.0 million, accrues interest at a rate of 7.97750%per annum, and amortizes pursuant to a fixed amortization schedule. Including the mezzanine loan, the cumulative Cut-off Date LTV, cumulative UW NCF DSCR and cumulative UW NOI DY are 82.0%, 1.16x and 9.4%, respectively. The mezzanine loan is currently held by LCM or an affiliate.
Release Parcels. The Hampton Roads Office Portfolio Whole Loan provides for the release of two unimproved outparcel tracts consisting of approximately 0.814 acres and 0.998 acres, respectively,provided that, among other things, (i) the borrowers deposit $200,000 per release into the replacement reserve account and (ii) the release is in compliance with the REMIC conditions.
Partial Release. Commencing on the date that is the earlier to occur of (x) two years after the securitization closing date of the lastpari passu note to be securitized and (y) October 6, 2022, the borrowers may obtain the release of any of the Hampton Roads Office Portfolio Properties,provided that, among other conditions, (i) the borrowers prepay a portion of the Hampton Roads Office Portfolio Whole Loan equal to the greater of (a) 115.0% of the allocated loan amount of the Hampton Roads Office Portfolio Property being released and (b) 100.0% of net sales proceeds multiplied by the fraction obtained by dividing the then outstanding principal balance of the Hampton Roads Office Portfolio Whole Loan by the sum of the outstanding principal balances of the Hampton Roads Office Portfolio Whole Loan and the related mezzanine loan, in each case, together with the applicable yield maintenance premium, (ii) the debt yield (as calculated in accordance with the Hampton Roads Office Portfolio Whole Loan documents) for the remaining Hampton Roads Office Portfolio Properties following the release is not less than the greater of (a) the debt yield immediately preceding such release and (b) 8.3%, and (iii) the release complies with customary REMIC requirements.
| THE INFORMATION IN THIS STRUCTURAL AND COLLATERAL TERM SHEET IS NOT COMPLETE AND MAY BE AMENDED PRIOR TO THE TIME OF SALE. THIS TERM SHEET IS NOT AN OFFER TO SELL THESE SECURITIES AND IT IS NOT A SOLICITATION OF AN OFFER TO BUY THESE SECURITIES IN ANY JURISDICTION WHERE THE OFFER OR SALE IS NOT PERMITTED. |
| |
| | 95 of 145 | |
| Structural and Collateral Term Sheet | | JPMDB 2019-COR6 |
| |
| Colorado Square |
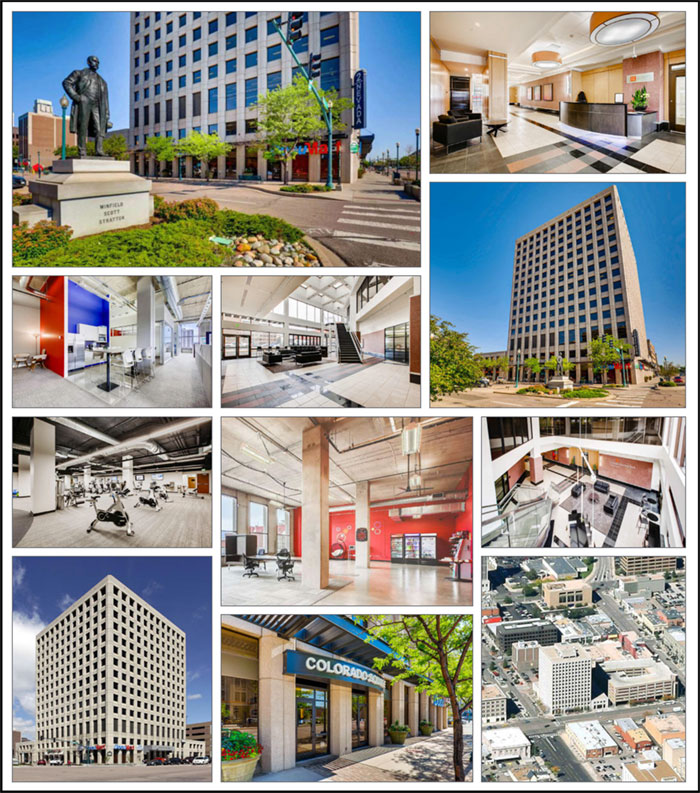
| THE INFORMATION IN THIS STRUCTURAL AND COLLATERAL TERM SHEET IS NOT COMPLETE AND MAY BE AMENDED PRIOR TO THE TIME OF SALE. THIS TERM SHEET IS NOT AN OFFER TO SELL THESE SECURITIES AND IT IS NOT A SOLICITATION OF AN OFFER TO BUY THESE SECURITIES IN ANY JURISDICTION WHERE THE OFFER OR SALE IS NOT PERMITTED. |
| |
| | 96 of 145 | |
| Structural and Collateral Term Sheet | | JPMDB 2019-COR6 |
| |
| Colorado Square |
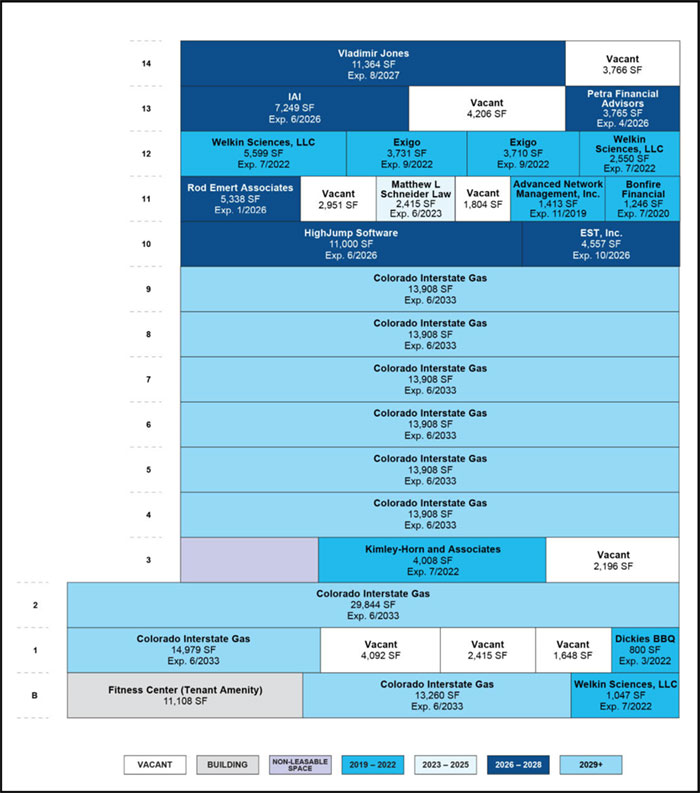
| THE INFORMATION IN THIS STRUCTURAL AND COLLATERAL TERM SHEET IS NOT COMPLETE AND MAY BE AMENDED PRIOR TO THE TIME OF SALE. THIS TERM SHEET IS NOT AN OFFER TO SELL THESE SECURITIES AND IT IS NOT A SOLICITATION OF AN OFFER TO BUY THESE SECURITIES IN ANY JURISDICTION WHERE THE OFFER OR SALE IS NOT PERMITTED. |
| |
| | 97 of 145 | |
| Structural and Collateral Term Sheet | | JPMDB 2019-COR6 |
| |
| Colorado Square |

| THE INFORMATION IN THIS STRUCTURAL AND COLLATERAL TERM SHEET IS NOT COMPLETE AND MAY BE AMENDED PRIOR TO THE TIME OF SALE. THIS TERM SHEET IS NOT AN OFFER TO SELL THESE SECURITIES AND IT IS NOT A SOLICITATION OF AN OFFER TO BUY THESE SECURITIES IN ANY JURISDICTION WHERE THE OFFER OR SALE IS NOT PERMITTED. |
| |
| | 98 of 145 | |
| Structural and Collateral Term Sheet | | JPMDB 2019-COR6 |
| |
| Colorado Square |
| Mortgage Loan Information | | Property Information |
| Mortgage Loan Seller: | LCM | | Single Asset / Portfolio: | Single Asset |
| Original Principal Balance: | $37,200,000 | | Title: | Fee |
| Cut-off Date Principal Balance: | $37,050,001 | | Property Type - Subtype: | Office – CBD |
| % of Pool by IPB: | 4.6% | | Net Rentable Area (SF): | 245,509 |
| Loan Purpose: | Refinance | | Location: | Colorado Springs, CO |
| Borrower: | Unico Colorado Square LLC | | Year Built / Renovated: | 1976 / 2000, 2018 |
| Sponsor: | Unico Investment Group LLC | | Occupancy: | 90.6% |
| Interest Rate: | 4.10000% | | Occupancy Date: | 6/30/2019 |
| Note Date: | 7/11/2019 | | Number of Tenants: | 14 |
| Maturity Date: | 8/6/2029 | | 2016 NOI(1): | N/A |
| Interest-only Period: | None | | 2017 NOI(1): | N/A |
| Original Term: | 120 months | | 2018 NOI: | $2,320,854 |
| Original Amortization: | 360 months | | TTM NOI (as of 5/2019)(2): | $2,352,134 |
| Amortization Type: | Balloon | | UW Economic Occupancy: | 90.6% |
| Call Protection: | L(27),Def(86),O(7) | | UW Revenues: | $5,860,001 |
| Lockbox / Cash Management: | Hard / Springing | | UW Expenses: | $2,398,116 |
| Additional Debt: | N/A | | UW NOI(2): | $3,461,885 |
| Additional Debt Balance: | N/A | | UW NCF: | $3,307,214 |
| Additional Debt Type: | N/A | | Appraised Value / Per SF: | $51,600,000 / $210 |
| | | | Appraisal Date: | 5/24/2019 |
| | | | | |
| Escrows and Reserves(3) | | Financial Information |
| | Initial | Monthly | Initial Cap | | Cut-off Date Loan / SF: | $151 | |
| Taxes: | $105,000 | $56,000 | N/A | | Maturity Date Loan / SF: | $121 | |
| Insurance: | $0 | Springing | N/A | | Cut-off Date LTV: | 71.8% | |
| Replacement Reserves: | $0 | $5,115 | $175,000 | | Maturity Date LTV: | 57.5% | |
| TI/LC: | $897,141 | $10,230 | N/A | | UW NCF DSCR: | 1.53x | |
| Other | $1,220,493 | $0 | N/A | | UW NOI Debt Yield: | 9.3% | |
| | | | | | | | |
| Sources and Uses |
| Sources | Proceeds | % of Total | | Uses | Proceeds | % of Total |
| Mortgage Loan | $37,200,000 | 100.0% | | Payoff Existing Debt | $25,394,462 | 68.3% |
| | | | | Upfront Reserves | 2,222,634 | 6.0% |
| | | | | Closing Costs | 473,140 | 1.3% |
| | | | | Return of Equity | 9,109,763 | 24.5% |
| Total Sources | $37,200,000 | 100.0% | | Total Uses | $37,200,000 | 100.0% |
| (1) | 2016 NOI and 2017 NOI are not available as the loan sponsor acquired the Colorado Square Property (as defined below) in July 2017 and commenced a renovation which was completed in 2018. |
| (2) | The increase from TTM NOI to UW NOI is primarily attributable to (i) the Colorado Square Property’s renovation that was completed in 2018 and the subsequent lease up from 78.1% occupancy in 2018 to 90.6% current occupancy and (ii) approximately $232,371 of average rent over the loan term for Colorado Interstate Gas. |
| (3) | For a full description of Escrows and Reserves, please refer to“Escrows and Reserves”below. |
The Loan. The Colorado Square mortgage loan has an outstanding principal balance as of the Cut-off Date of approximately $37.1 million (the “Colorado Square Loan”) and is secured by a first priority mortgage lien on the borrower’s fee interest in a Class A office building totaling 245,509 square feet of net rentable area (the “Colorado Square Property”) located in the central business district of Colorado Springs, Colorado. The Colorado Square Loan has a 10-year term and amortizes on a 30-year schedule. The most recent prior financing of the Colorado Square Property was not included in a securitization.
The Borrower. The borrowing entity is Unico Colorado Square LLC, a Delaware limited liability company and special purpose entity structured to be bankruptcy remote with one independent director. Legal counsel to the borrowers delivered a non-consolidation opinion in connection with the origination of the Colorado Square Loan.
| THE INFORMATION IN THIS STRUCTURAL AND COLLATERAL TERM SHEET IS NOT COMPLETE AND MAY BE AMENDED PRIOR TO THE TIME OF SALE. THIS TERM SHEET IS NOT AN OFFER TO SELL THESE SECURITIES AND IT IS NOT A SOLICITATION OF AN OFFER TO BUY THESE SECURITIES IN ANY JURISDICTION WHERE THE OFFER OR SALE IS NOT PERMITTED. |
| |
| | 99 of 145 | |
| Structural and Collateral Term Sheet | | JPMDB 2019-COR6 |
| |
| Colorado Square |
The Loan Sponsor.The loan sponsor and nonrecourse carve-out guarantor is Unico Investment Group LLC (“Unico”). Unico is a private real estate firm offering investment, development, management and sustainability services in emerging markets across the United States. Founded in 1953 and headquartered in Seattle, Washington, the company employs nearly 300 real estate professionals nationwide. The company currently is invested in or actively managing a portfolio in excess of $4.3 billion of office, multifamily and mixed-use properties. Unico acquired the Colorado Square Property in July 2017 for approximately $34.6 million and has a current basis of $39.7 million.
The Property.The Colorado Square Property is a 14-story, Class A office building totaling 245,509 square feet originally constructed in 1976, renovated in 2000 and most recently renovated and updated in 2018. Recent renovations include the lobby, lobby lounge, common area hallways, common area bathrooms, basement storage and a newly constructed basement fitness center including showers and lockers as an amenity to tenants. As of the June 30, 2019 underwritten rent rolls, the Colorado Square Property was 90.6% leased to 14 tenants at a weighted average underwritten base rent equal to $17.79 per square foot.
The largest tenant at the Colorado Square Property is Colorado Interstate Gas (“CIG”) (141,531 square feet; 57.6% of net rentable area; 68.9% of underwritten base rent; rated Baa2/BBB/BBB by Moody’s/Fitch/S&P). CIG is a subsidiary of Kinder Morgan, one of the largest energy infrastructure companies in North America. Kinder Morgan owns an interest in or operates approximately 84,000 miles of pipelines and 157 terminals and has approximately 11,000 employees. The company’s pipelines transport natural gas, refined petroleum products, crude oil, carbon dioxide and more. CIG was an original tenant at the Colorado Square Property since it was constructed in 1976. CIG has a lease expiration of June 2033 with no renewal options and a one-time termination option effective in June 2030, with 12-months prior notice and payment of a termination fee in the amount equal to the sum of any unamortized tenant improvements and leasing commissions and three months of base rent. CIG currently pays base rent equal to $18.31 per square foot. UW base rent of $18.31 is based on average rent over the loan term.
The second largest tenant at the Colorado Square Property is Vladimir Jones (11,364 square feet; 4.6% of net rentable area; 5.4% of underwritten base rent). Vladimir Jones is Colorado’s original independent, integrated advertising agency, with offices in Denver and Colorado Springs. Vladimir Jones recently took occupancy in 2019 and has a lease expiration of August 2027 with one, five-year renewal options remaining and no termination options. Vladimir Jones currently pays base rent equal to $18.00 per square foot.
The third largest tenant at the Colorado Square Property is HighJump Software (“HighJump”) (11,000 square feet; 4.5% of net rentable area; 4.9% of underwritten base rent). HighJump is a provider of supply chain management software including warehouse management systems, eCommerce, direct store delivery software, transportation management systems, ERP data collection, inventory management and electronic data interchange. HighJump has been a tenant since February 2019 and has a lease expiration of June 2026 with one, five-year renewal option remaining and no termination options. HighJump currently pays base rent equal to $16.75 per square foot.
The Colorado Square Property is located in the central business district office submarket, within the overall Colorado Springs office market. According to a market report, as of the third quarter of 2019, the overall Colorado Springs office market contained approximately 29.0 million square feet across 1,741 buildings with an overall market vacancy of 9.0% and average asking rents of $16.71 per square foot. As of the third quarter of 2019, the central business district office submarket contained approximately 3.5 million square feet across 114 buildings with an overall market vacancy of 7.7% and average asking rents of $18.39 per square foot. The appraisal for the Colorado Square Property included five triple net rent comparables. The rent comparables ranged from $15.50 to $19.00 per square foot with a weighted average of approximately $16.25 per square foot.
| Historical and Current Occupancy(1)(2) |
| 2016(3) | 2017 | 2018 | Current(4) |
| N/A | 72.3% | 78.1% | 90.6% |
| (1) | Historical Occupancies are as of December 31 of eachrespective year. |
| (2) | The increase from Historical Occupancies to Current Occupancy is primarily due to the Colorado Square Property’s 2018 renovation and subsequent lease up. |
| (3) | 2016 Occupancy is not available as the loan sponsor acquired the Colorado Square Property in July 2017 and 2016 occupancy was not provided. |
| (4) | Current Occupancy is as of the rent roll dated June 30, 2019. |
| THE INFORMATION IN THIS STRUCTURAL AND COLLATERAL TERM SHEET IS NOT COMPLETE AND MAY BE AMENDED PRIOR TO THE TIME OF SALE. THIS TERM SHEET IS NOT AN OFFER TO SELL THESE SECURITIES AND IT IS NOT A SOLICITATION OF AN OFFER TO BUY THESE SECURITIES IN ANY JURISDICTION WHERE THE OFFER OR SALE IS NOT PERMITTED. |
| |
| | 100 of 145 | |
| Structural and Collateral Term Sheet | | JPMDB 2019-COR6 |
| |
| Colorado Square |
| Tenant Summary(1) |
| Tenant | Ratings
Moody’s/Fitch/S&P | Net Rentable
Area (SF) | % of
Total NRA | Base Rent
PSF(2) | % of Total
Base Rent(2) | Lease
Expiration Date |
| Colorado Interstate Gas(3) | Baa2 / BBB / BBB | 141,531 | 57.6% | $18.31 | 68.9% | 6/30/2033 |
| Vladimir Jones(4)(5) | NR / NR / NR | 11,364 | 4.6% | $18.00 | 5.4% | 8/31/2027 |
| HighJump Software(4) | NR / NR / NR | 11,000 | 4.5% | $16.75 | 4.9% | 6/30/2026 |
| Welkin Sciences, LLC(4) | NR / NR / NR | 9,196 | 3.7% | $15.11 | 3.7% | 7/31/2022 |
| Exigo(4) | NR / NR / NR | 7,441 | 3.0% | $16.50 | 3.3% | 9/30/2022 |
| IAI(4)(5) | NR / NR / NR | 7,249 | 3.0% | $17.50 | 3.4% | 6/30/2026 |
| Rod Emert Associates(4) | NR / NR / NR | 5,338 | 2.2% | $15.75 | 2.2% | 1/31/2026 |
| EST, Inc(5) | NR / NR / NR | 4,557 | 1.9% | $18.75 | 2.3% | 10/31/2026 |
| Kimley-Horn and Associates(4) | NR / NR / NR | 4,008 | 1.6% | $15.50 | 1.7% | 7/31/2022 |
| Petra Financial Advisors(4) | NR / NR / NR | 3,765 | 1.5% | $16.00 | 1.6% | 4/30/2026 |
| Top 10 Total / Wtd. Avg. | | 205,449 | 83.7% | $17.82 | 97.4% | |
| Other Tenants(6) | | 16,982 | 6.9% | $16.86 | 2.6% | |
| Total Occupied Space | | 222,431 | 90.6% | $17.79 | 100.0% | |
| Vacant | | 23,078 | 9.4% | | | |
| Total | | 245,509 | 100.0% | | | |
| (1) | Based on the underwritten rent rolls dated as of June 30, 2019. |
| (2) | Base Rent includes approximately $27,777 in contractual rent steps through September 2020 for certain tenants and approximately $232,371 of average rent over the loan term for Colorado Interstate Gas. |
| (3) | Colorado Interstate Gas has a one-time termination option effective in June 2030, with 12-months prior notice and payment of a termination fee in the amount equal to the sum of any unamortized tenant improvements and leasing commissions and three months of base rent. |
| (4) | Vladimir Jones has one, five-year renewal option remaining, HighJump Software has one, five-year renewal option remaining, Welkin Sciences, LLC has two, five-year renewal options remaining, Exigo has one, five-year renewal option remaining, IAI has one, five-year renewal option remaining, Rod Emert Associates has one, five-year renewal option remaining, Kimley-Horn and Associates has two, three-year renewal options remaining and Petra Financial Advisors has one, five-year renewal option remaining. |
| (5) | Vladimir Jones has a free rent period through February 2020 for $102,276, IAI has a free rent period through March 2020 for approximately $12,386 and EST, Inc has a free rent period through May 2021 for approximately $65,658 for an aggregate of approximately $180,320 in free rent. At origination, the borrower deposited approximately $180,320 into a free rent reserve. |
| (6) | Other Tenants includes an 11,108 square foot fitness center which has no attributable rent and has been excluded from the Other Tenants Base Rent PSF calculation. |
| Lease Rollover Schedule(1) |
| Year | Number of
Leases
Expiring | Net
Rentable
Area
Expiring | % of NRA
Expiring | Base Rent
Expiring(2) | % of Base
Rent Expiring(2) | Cumulative
Net Rentable
Area
Expiring | Cumulative
% of NRA
Expiring | Cumulative
Base Rent
Expiring(2) | Cumulative
% of Base
Rent
Expiring(2) |
| Vacant | NAP | 23,078 | 9.4% | NAP | NAP | 23,078 | 9.4% | NAP | NAP |
| 2019 & MTM | 1 | 1,413 | 0.6% | $24,021 | 0.6% | 24,491 | 10.0% | $24,021 | 0.6% |
| 2020 | 1 | 1,246 | 0.5% | 19,936 | 0.5% | 25,737 | 10.5% | $43,957 | 1.2% |
| 2021 | 0 | 0 | 0.0% | 0 | 0.0% | 25,737 | 10.5% | $43,957 | 1.2% |
| 2022 | 4 | 21,445 | 8.7% | 337,909 | 9.0% | 47,182 | 19.2% | $381,866 | 10.2% |
| 2023 | 1 | 2,415 | 1.0% | 41,055 | 1.1% | 49,597 | 20.2% | $422,921 | 11.2% |
| 2024 | 0 | 0 | 0.0% | 0 | 0.0% | 49,597 | 20.2% | $422,921 | 11.2% |
| 2025 | 0 | 0 | 0.0% | 0 | 0.0% | 49,597 | 20.2% | $422,921 | 11.2% |
| 2026 | 5 | 31,909 | 13.0% | 540,865 | 14.4% | 81,506 | 33.2% | $963,786 | 25.6% |
| 2027 | 1 | 11,364 | 4.6% | 204,552 | 5.4% | 92,870 | 37.8% | $1,168,338 | 31.1% |
| 2028 | 0 | 0 | 0.0% | 0 | 0.0% | 92,870 | 37.8% | $1,168,338 | 31.1% |
| 2029 | 0 | 0 | 0.0% | 0 | 0.0% | 92,870 | 37.8% | $1,168,338 | 31.1% |
| 2030 & Beyond(3) | 1 | 152,639 | 62.2% | 2,591,692 | 68.9% | 245,509 | 100.0% | $3,760,030 | 100.0% |
| Total | 14 | 245,509 | 100.0% | $3,760,030 | 100.0% | | | | |
| | | | | | | | | | |
| (1) | Based on the underwritten rent roll dated June 30, 2019. |
| (2) | Base Rent Expiring includes approximately $27,777 in contractual rent steps through September 2020 for certain tenants and approximately $232,371 of average rent over the loan term for Colorado Interstate Gas. |
| (3) | 2030 & Beyond includes an 11,108 square foot fitness center which is not considered an expiring lease. |
| THE INFORMATION IN THIS STRUCTURAL AND COLLATERAL TERM SHEET IS NOT COMPLETE AND MAY BE AMENDED PRIOR TO THE TIME OF SALE. THIS TERM SHEET IS NOT AN OFFER TO SELL THESE SECURITIES AND IT IS NOT A SOLICITATION OF AN OFFER TO BUY THESE SECURITIES IN ANY JURISDICTION WHERE THE OFFER OR SALE IS NOT PERMITTED. |
| |
| | 101 of 145 | |
| Structural and Collateral Term Sheet | | JPMDB 2019-COR6 |
| |
| Colorado Square |
| Operating History and Underwritten Net Cash Flow |
| | 2018 | TTM(1) | Underwritten | Per Square
Foot | %(2) |
| Rents in Place | $2,808,324 | $2,823,778 | $3,499,882 | $14.26 | 54.1% |
| Straight Line Rent(3) | 0 | 0 | 232,371 | 0.95 | 3.6 |
| Contractual Rent Steps(4) | 0 | 0 | 27,777 | 0.11 | 0.4 |
| Vacant Income | 0 | 0 | 610,652 | 2.49 | 9.4 |
| Gross Potential Rent | $2,808,324 | $2,823,778 | $4,370,682 | $17.80 | 67.5% |
| Total Reimbursements | 1,565,621 | 1,703,229 | 2,096,811 | 8.54 | 32.4 |
| Total Other Income | 2,463 | 3,160 | 3,160 | 0.01 | 0.0 |
| Net Rental Income | $4,376,408 | $4,530,167 | $6,470,652 | $26.36 | 100.0% |
| (Vacancy/Credit Loss) | 0 | 0 | (610,652) | (2.49) | (9.4) |
| Effective Gross Income | $4,376,408 | $4,530,167 | $5,860,001 | $23.87 | 90.6% |
| | | | | | |
| Total Expenses | $2,055,554 | $2,178,033 | $2,398,116 | $9.77 | 40.9% |
| | | | | | |
| Net Operating Income(5) | $2,320,854 | $2,352,134 | $3,461,885 | $14.10 | 59.1% |
| | | | | | |
| Total TI/LC, CapEx/RR | 0 | 0 | 154,671 | 0.63 | 2.6 |
| | | | | | |
| Net Cash Flow | $2,320,854 | $2,352,134 | $3,307,214 | $13.47 | 56.4% |
| | | | | | |
| (1) | TTM column represents the trailing 12-month period ending May 31, 2019. |
| (2) | % column represents percent of Net Rental Income for all revenue lines and represents percent of Effective Gross Income for the remainder of the fields. |
| (3) | Based on the average rent over the loan term for Colorado Interstate Gas. |
| (4) | Based on the contractual rent steps through September 2020 for certain tenants. |
| (5) | The increase from TTM NOI to Underwritten NOI is primarily attributable to (i) the Colorado Square Property’s renovation that was completed in 2018 and the subsequent lease up from 78.1% occupancy in 2018 to 90.6% current occupancy and (ii) approximately $232,371 of average rent over the loan term for Colorado Interstate Gas. |
Property Management.The Colorado Square Property is managed by Unico Properties LLC, an affiliate of the borrower.
Escrows and Reserves. At origination, the borrowers deposited into escrow $1,000,000 for a Vladimir Jones Holdback Reserve (as defined below), $897,141 for outstanding tenant improvements and leasing commissions, approximately $180,320 for outstanding free rent, $105,000 for real estate taxes and $40,173 for required repairs.
Tax Escrows– On a monthly basis,the borrower is required to escrow 1/12 of the annual estimated tax payments, which currently equates to $56,000.
Insurance Escrows– On a monthly basis, if an acceptable blanket policy is no longer in place,the borrower is required to escrow 1/12 of the annual estimated insurance premiums.
Replacement Reserves –On a monthly basis, the borrower is required to escrow $5,115 for replacement reserves subject to a cap of $175,000.
TI/LC Reserves – On a monthly basis, the borrower is required to escrow $10,230 for tenant improvements and leasing commissions.
Vladimir Jones Holdback Reserve – Provided no default or event of default has occurred and is continuing, the lender will release the $1,000,000 in the Vladimir Jones Holdback Reserve to the borrower upon Vladimir Jones paying full unabated rent.
Lockbox / Cash Management. The Colorado Square Loan is structured with a hard lockbox and springing cash management. All rents are required to be deposited directly by the tenants into a lockbox account controlled by the lender. All funds in the lockbox account are required to be swept daily into the borrower’s operating account, unless a Cash Management Period (as defined below) is continuing. Upon the occurrence of a Cash Management Period, all funds in the lockbox account will be swept daily into a lender-controlled account, from which account such funds will disbursed on each payment date in accordance with the Colorado Square Loan documents and any excess will be retained by the lender as additional collateral for the Colorado Square Loan.
A “Cash Management Period” will commence (i) upon an event of default, (ii) if the debt service coverage ratio is less than 1.15x (until such time that the debt service coverage ratio is greater than or equal to 1.15x for two consecutive quarters) or (iii) upon a Lease Sweep Period (as defined below).
| THE INFORMATION IN THIS STRUCTURAL AND COLLATERAL TERM SHEET IS NOT COMPLETE AND MAY BE AMENDED PRIOR TO THE TIME OF SALE. THIS TERM SHEET IS NOT AN OFFER TO SELL THESE SECURITIES AND IT IS NOT A SOLICITATION OF AN OFFER TO BUY THESE SECURITIES IN ANY JURISDICTION WHERE THE OFFER OR SALE IS NOT PERMITTED. |
| |
| | 102 of 145 | |
| Structural and Collateral Term Sheet | | JPMDB 2019-COR6 |
| |
| Colorado Square |
A “Lease Sweep Period” will commence (i) on the date that is 12 months prior to the end of the term (including any renewal terms) of any Lease Sweep Lease (as defined below), (ii) on the date that is 12 months prior to the Colorado Square Loan maturity date, unless borrower delivers evidence to the lender that CIG has waived its termination option pursuant to the CIG lease, (iii) on the date that is required under a Lease Sweep Lease by which the applicable Lease Sweep Tenant (defined below) is required to give notice of its exercise of a renewal option thereunder (and such renewal has not so been exercised), (iv) if any Lease Sweep Lease is surrendered, cancelled or terminated prior to its then-current expiration date, (v) if any Lease Sweep Tenant goes dark or gives notice that it intends to discontinue its business at its premises, (vi) upon the occurrence and continuance of a default under any Lease Sweep Lease or (vii) upon the occurrence of an insolvency proceeding for any Lease Sweep Tenant.
A “Lease Sweep Lease” means any lease which covers 35,000 or more square foot.
A “Lease Sweep Tenant” means any tenant under a Lease Sweep Lease, or under one or more leases (leased by such tenant and/or its affiliates) which when taken together would constitute a Lease Sweep Lease.
Additional Debt. None.
Partial Release. None.
| THE INFORMATION IN THIS STRUCTURAL AND COLLATERAL TERM SHEET IS NOT COMPLETE AND MAY BE AMENDED PRIOR TO THE TIME OF SALE. THIS TERM SHEET IS NOT AN OFFER TO SELL THESE SECURITIES AND IT IS NOT A SOLICITATION OF AN OFFER TO BUY THESE SECURITIES IN ANY JURISDICTION WHERE THE OFFER OR SALE IS NOT PERMITTED. |
| |
| | 103 of 145 | |
| Structural and Collateral Term Sheet | | JPMDB 2019-COR6 |
| |
| Sunset North |
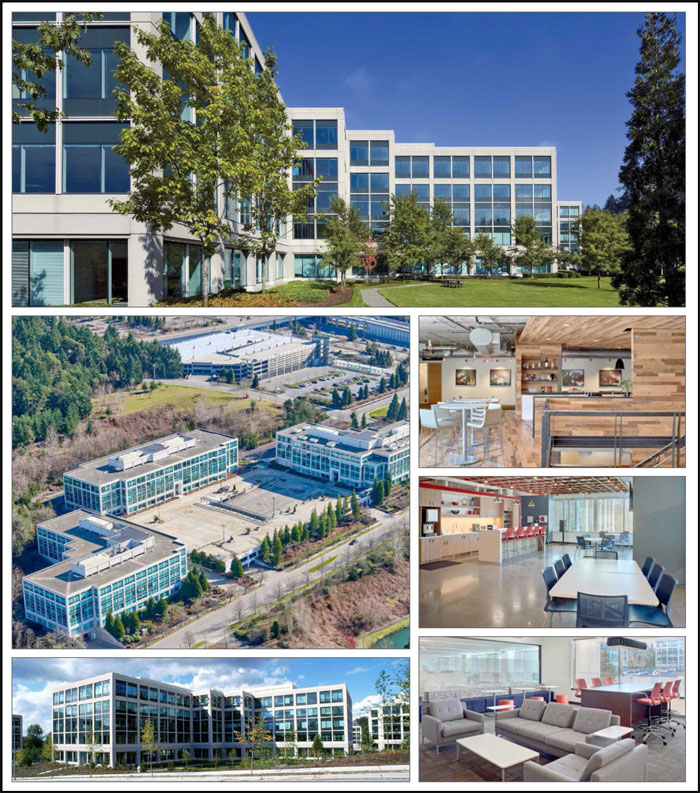
| THE INFORMATION IN THIS STRUCTURAL AND COLLATERAL TERM SHEET IS NOT COMPLETE AND MAY BE AMENDED PRIOR TO THE TIME OF SALE. THIS TERM SHEET IS NOT AN OFFER TO SELL THESE SECURITIES AND IT IS NOT A SOLICITATION OF AN OFFER TO BUY THESE SECURITIES IN ANY JURISDICTION WHERE THE OFFER OR SALE IS NOT PERMITTED. |
| |
| | 104 of 145 | |
| Structural and Collateral Term Sheet | | JPMDB 2019-COR6 |
| |
| Sunset North |

| THE INFORMATION IN THIS STRUCTURAL AND COLLATERAL TERM SHEET IS NOT COMPLETE AND MAY BE AMENDED PRIOR TO THE TIME OF SALE. THIS TERM SHEET IS NOT AN OFFER TO SELL THESE SECURITIES AND IT IS NOT A SOLICITATION OF AN OFFER TO BUY THESE SECURITIES IN ANY JURISDICTION WHERE THE OFFER OR SALE IS NOT PERMITTED. |
| |
| | 105 of 145 | |
| Structural and Collateral Term Sheet | | JPMDB 2019-COR6 |
| |
| Sunset North |

| THE INFORMATION IN THIS STRUCTURAL AND COLLATERAL TERM SHEET IS NOT COMPLETE AND MAY BE AMENDED PRIOR TO THE TIME OF SALE. THIS TERM SHEET IS NOT AN OFFER TO SELL THESE SECURITIES AND IT IS NOT A SOLICITATION OF AN OFFER TO BUY THESE SECURITIES IN ANY JURISDICTION WHERE THE OFFER OR SALE IS NOT PERMITTED. |
| |
| | 106 of 145 | |
| Structural and Collateral Term Sheet | | JPMDB 2019-COR6 |
| |
| Sunset North |
| Mortgage Loan Information | | Property Information |
| Mortgage Loan Seller: | JPMCB | | Single Asset / Portfolio: | Single Asset |
| Original Principal Balance(1): | $35,000,000 | | Title: | Fee |
| Cut-off Date Principal Balance(1): | $35,000,000 | | Property Type - Subtype: | Office – Suburban |
| % of Pool by IPB: | 4.3% | | Net Rentable Area (SF): | 464,061 |
| Loan Purpose: | Acquisition | | Location: | Bellevue, WA |
| Borrower: | Sunset North Owner, LLC | | Year Built / Renovated: | 1999, 2000 / 2016-2019 |
| Loan Sponsor: | Kennedy-Wilson Holdings, Inc. | | Occupancy(3): | 98.8% |
| Interest Rate: | 3.25000% | | Occupancy Date: | 9/30/2019 |
| Note Date: | 9/10/2019 | | Number of Tenants: | 9 |
| Maturity Date: | 10/1/2029 | | 2016 NOI(4): | N/A |
| Interest-only Period: | 120 months | | 2017 NOI(5): | $10,907,542 |
| Original Term: | 120 months | 2018 NOI(5)(6): | $13,545,687 |
| Original Amortization: | None | TTM NOI (as of 7/2019)(6)(7): | $6,799,024 |
| Amortization Type: | Interest Only | | UW Economic Occupancy: | 95.0% |
| Call Protection(2): | L(25),Def(91),O(4) | | UW Revenues: | $19,978,769 |
| Lockbox / Cash Management: | Hard / Springing | | UW Expenses: | $6,362,971 |
| Additional Debt(1): | Yes | | UW NOI(3)(7)(9): | $13,615,798 |
| Additional Debt Balance(1): | $115,000,000 | | UW NCF: | $13,003,237 |
| Additional Debt Type(1): | Pari Passu | | Appraised Value / Per SF: | $227,100,000 / $489 |
| | | | Appraisal Date: | 8/21/2019 |
| | | | | |
| Escrows and Reserves(8) | | Financial Information(1) |
| | Initial | Monthly | Initial Cap | | Cut-off Date Loan / SF: | $323 |
| Taxes: | $153,562 | $153,562 | N/A | | Maturity Date Loan / SF: | $323 |
| Insurance: | $166,282 | $33,256 | N/A | | Cut-off Date LTV: | 66.1% |
| Replacement Reserves: | $12,375 | $12,375 | $445,499 | | Maturity Date LTV: | 66.1% |
| TI/LC: | $38,672 | $38,672 | $928,122 | | UW NCF DSCR: | 2.63x |
| Outstanding TI/LC: | $14,380,754 | N/A | N/A | | UW NOI Debt Yield: | 9.1% |
| Free Rent: | $406,710 | N/A | N/A | | | |
| | | | |
| Sources and Uses |
| Sources | Proceeds | % of Total | | Uses | Proceeds | % of Total |
| Whole Loan(1) | $150,000,000 | 64.9% | | Purchase Price | $212,017,031 | 91.8% |
| Sponsor Equity | 80,998,765 | 35.1 | | Upfront Reserves | 15,158,355 | 6.6 |
| | | | | Closing Costs | 3,823,379 | 1.7 |
| Total Sources | $230,998,765 | 100.0% | | Total Uses | $230,998,765 | 100.0% |
| (1) | The Sunset North Loan (as defined below) consists of the non-controlling Note A-3 and is part of the Sunset North Whole Loan (as defined below) evidenced by fourpari passu notes with an aggregate outstanding principal balance as of the Cut-off Date of $150.0 million. |
| (2) | The lockout period will be at least 25 payment dates beginning with and including the first payment date of November 1, 2019. Defeasance of the full $150,000,000 Sunset North Whole Loan is permitted after the date that is the earlier to occur of (i) November 1, 2023 or (ii) the date that is two years from the closing date of the securitization that includes the lastpari passu note to be securitized. The assumed lockout period of 25 payments is based on the expected JPMDB 2019-COR6 securitization closing date in November 2019. The actual lockout period may be longer. |
| (3) | Occupancy and UW NOI are inclusive of WeWork, which has executed its lease, taken possession of its space and begun paying rent, but has not yet taken occupancy. According to the Sponsor, WeWork is expected to take occupancy in November 2019. |
| (4) | 2016 NOI is not available as the previous owner acquired the Sunset North Property in March 2016 and was not provided comprehensive first quarter operating history. |
| (5) | The increase in 2018 NOI from 2017 NOI is primarily attributable to a $6.3 million fee associated with Boeing having terminated its lease in April 2018. |
| (6) | The decrease in TTM NOI from 2018 NOI is primarily attributable to Boeing’s departure in April 2018, for which a $6.3 million termination fee was paid in the first half of 2018. Following Boeing’s departure, the sponsor has executed several new leases executed in late 2018 and early 2019, for which tenants had not yet begun paying rent in the trailing 12 month period ending July 31, 2019. |
| (7) | The increase in Underwritten NOI from TTM NOI respectively, is primarily attributable to new leases taking effect following The Boeing Company’s (“Boeing”) departure from the Sunset North Property (as defined below) in April 2018, including (i) WeWork for 78,303 square foot (16.9% of net rentable area), (ii) GM Cruise for 32,331 square foot (7.0% of net rentable area), (iii) ArenaNet for a 32,432 square foot expansion space (7.0% of net rentable area), (iv) Farmers New World Life Insurance for 60,166 square foot (13.0% of net rentable area) and (v) Farmers Credit Union executing a 1,161 square foot lease (0.3% of net rentable area). WeWork has executed its lease, taken possession of its space and begun paying rent, but has not yet taken occupancy. According to the borrower sponsor, WeWork is expected to complete buildout of its space and take occupancy in November 2019. We cannot assure you that WeWork will take occupancy as expected, or at all. |
| (8) | For a full description of Escrows and Reserves, please refer to “Escrows and Reserves” below. |
| THE INFORMATION IN THIS STRUCTURAL AND COLLATERAL TERM SHEET IS NOT COMPLETE AND MAY BE AMENDED PRIOR TO THE TIME OF SALE. THIS TERM SHEET IS NOT AN OFFER TO SELL THESE SECURITIES AND IT IS NOT A SOLICITATION OF AN OFFER TO BUY THESE SECURITIES IN ANY JURISDICTION WHERE THE OFFER OR SALE IS NOT PERMITTED. |
| |
| | 107 of 145 | |
| Structural and Collateral Term Sheet | | JPMDB 2019-COR6 |
| |
| Sunset North |
The Loan. The Sunset North mortgage loan, with an outstanding principal balance as of the Cut-off Date of $35.0 million (the “Sunset North Loan”), is part of a whole loan with an outstanding principal balance as of the Cut-off Date of $150.0 million (the “Sunset North Whole Loan”) evidenced by fourpari passu notes that are together secured by a first mortgage encumbering the borrower’s fee interest in a 464,061 square foot Class A office campus consisting of three buildings located in Bellevue, Washington (the “Sunset North Property”). The non-controlling Note A-3, with an outstanding principal balance as of the Cut-off Date of $35.0 million, is being contributed to the JPMDB 2019-COR6 Trust. The controlling Note A-1 and the non-controlling Note A-2 were contributed to the Benchmark 2019-B13 transaction and the Benchmark 2019-B14 transaction, respectively. The non-controlling Note A-4 is expected to be contributed to other securitization trusts. The relationship between the holders of the Sunset North Whole Loan will be governed by a co-lender agreement as described under“Description of the Mortgage Pool—The Whole Loans—The Non-Serviced Pari Passu Whole Loans”in the Preliminary Prospectus. The Sunset North Whole Loan has a 10-year interest-only term and accrues interest at a rate of 3.25000%per annum. The Sunset North Whole Loan proceeds along with borrower sponsor equity were used to acquire the Sunset North Property, fund upfront reserves and pay closing costs.
| Whole Loan Summary |
| Note | Original Balance | Cut-off Date Balance | Note Holder | Controlling Piece |
| A-1 | $75,000,000 | $75,000,000 | Benchmark 2019-B13 | Yes |
| A-2 | 20,000,000 | 20,000,000 | Benchmark 2019-B14 | No |
| A-3 | 35,000,000 | 35,000,000 | JPMDB 2019-COR6 | No |
| A-4 | 20,000,000 | 20,000,000 | JPMCB | No |
| Total | $150,000,000 | $150,000,000 | | |
The Borrower. The borrower is Sunset North Owner, LLC, a Delaware limited liability company structured to be a bankruptcy-remote entity with two independent directors in its organizational structure.
The Loan Sponsor. The loan sponsor and non-recourse carveout guarantor is Kennedy-Wilson Holdings, Inc., an affiliate of Kennedy Wilson. Kennedy Wilson (NYSE: KW) is a global real estate investment company focused on multifamily and office properties located in the western United States, United Kingdom and Ireland. Headquartered in Beverly Hills, California, Kennedy Wilson has approximately 350 employees and 16 global offices located throughout the United States, Europe and Japan. As of year-end 2018, Kennedy Wilson had an ownership interest in approximately 53 million square foot of property globally, including 28,613 multifamily rental units and 18.9 million square foot of commercial property. As of year-end 2018, Kennedy Wilson held a portfolio of approximately $11.3 billion in assets, which generated approximately $1.0 billion in total revenue. Legal counsel to the borrower delivered a non-consolidation opinion in connection with the origination of the Sunset North Whole Loan.
The Property. The Sunset North Property is a 464,061 square foot, Class A office campus consisting of three buildings located in Bellevue, Washington. Each building is LEED Silver Certified and consists of five stories of above-grade office space and two levels of structured parking with a total of 1,595 parking spaces, resulting in a parking ratio of approximately 3.4 spaces per 1,000 square foot of net rentable area.
The Sunset North buildings were built in 1999 and 2000 and were acquired in 2016 by M-M Properties for approximately $155.2 million ($334.42 per square foot). Since 2016, M-M Properties spent approximately $22.4 million ($48.27 per square foot) in capital improvements including renovations to the lobbies, common areas and building exteriors, resulting in a cost basis of approximately $177.6 million ($382.69 per square foot). In April 2018, Boeing vacated its space at the Sunset North Property at its lease expiration, at which time it had occupied approximately 208,846 square foot (45.0% of net rentable area). Since Boeing’s departure in April 2018, the Sunset North Property has experienced strong leasing momentum. Following Boeing’s departure, new leases accounting for 204,493 square feet were executed to backfill Boeing’s space, including (i) WeWork for 78,303 square feet (16.9% of net rentable area), (ii) GM Cruise for 32,331 square feet (7.0% of net rentable area), (iii) ArenaNet for a 32,432 square foot expansion space (7.0% of net rentable area), (iv) Farmers New World Life Insurance for 60,166 square feet (13.0% of net rentable area) and (v) Farmers Credit Union for 1,161 square foot lease (0.3% of net rentable area). WeWork has executed its lease, taken possession of its space and begun paying rent, but has not yet taken occupancy. According to the Sponsor, WeWork is expected to complete buildout of its space and take occupancy in November 2019.
| THE INFORMATION IN THIS STRUCTURAL AND COLLATERAL TERM SHEET IS NOT COMPLETE AND MAY BE AMENDED PRIOR TO THE TIME OF SALE. THIS TERM SHEET IS NOT AN OFFER TO SELL THESE SECURITIES AND IT IS NOT A SOLICITATION OF AN OFFER TO BUY THESE SECURITIES IN ANY JURISDICTION WHERE THE OFFER OR SALE IS NOT PERMITTED. |
| |
| | 108 of 145 | |
| Structural and Collateral Term Sheet | | JPMDB 2019-COR6 |
| |
| Sunset North |
As of September 30, 2019, the Sunset North Property was 98.8% leased to nine distinct tenants operating in a variety of industries including financial services, insurance, automotive, technology and real estate. The Sunset North Property tenants have a weighted average remaining lease term of approximately 8.0 years. The largest tenant at the Sunset North Property, Intellectual Ventures (152,633 square feet; 32.9% of net rentable area; 32.1% of underwritten base rent), is a global invention and investment business. Established in 2000, Intellectual Ventures operates four primary investment funds:Invention Investment Fund, which provides companies access to inventions through licensing, strategic partnerships and patent sales;Invention Science Fund, which invests in emerging technology fields for energy, communications and security industries,Global Good Fund, which is funded by Bill Gates and invests in global health and development technologies; andDeep Science Fund, which investigates applications for inventions and ideas in advanced chemistry, physical sciences and biomedical devices. Intellectual Ventures has more than 30 strategic partnerships and a portfolio or more than 35,000 intellectual property assets. Intellectual Ventures executed its lease at the Sunset North Property in 2010 and currently occupies all five floors in one of the three buildings through May 2025 with two, five year extension options and no termination options.
The second largest tenant, ArenaNet (96,839 square feet; 20.9% of net rentable area; 20.3% of underwritten base rent), is a subsidiary of NCSOFT, is a game developer and publisher which has sold over 9.5 million copies of its multiplayer online role playing games. Founded in 2000, ArenaNet is headquartered at the Sunset North Property. NCSOFT was established in 1997 and headquartered in Seoul, South Korea, NCSOFT is a gaming publisher with services in the Americas, Europe, Australia and New Zealand. In 2010, ArenaNet executed its initial lease for 64,407 square feet at the Sunset North Property and in June 2019 following Boeing’s departure, expanded its space by 32,432 square feet. ArenaNet’s lease expires in May 2029 with two, five year extension options and no termination options.
The third largest tenant, WeWork (78,303 square feet; 16.9% of net rentable area; 19.8% of underwritten base rent), offers co-working office space including private offices, office suites, custom suites and shared work spaces for entrepreneurs, startups, small businesses and large corporations. Founded in 2010, WeWork has a network of more than 500 workspaces in over 22 countries. Amenities in workspaces include soundproofed phone booths, optimized workstations, bookable conference rooms, complimentary refreshments, onsite staff, multi-function printers, Wi-Fi access, mail and package handling, office supplies and bike storage. Members also receive access to business and lifestyle benefits from WeWork partners including Slack, Amazon Web Services, Avis, Lyft, Equinox, Ticketmaster and Dell. WeWork has executed its lease, taken possession of its space and begun paying rent, but has not yet taken occupancy. According to the borrower sponsor, WeWork is in the process of completing the buildout of its space and is expected to take occupancy in November 2019. We cannot assure you that WeWork will take occupancy as expected or at all or commence paying rent under its lease. In connection with its lease, WeWork provided a surety bond in the amount of $7.5 million (the “Surety Limit”) payable to the landlord and its successors upon an event of default by the tenant under the lease. Provided that WeWork is not in default under its lease, the Surety Limit may be annually reduced commencing on the day immediately following the third anniversary of the lease commencement date until the day immediately following the eighth anniversary of the lease commencement date to no less than $2.0 million.
The Sunset North Property is located in Bellevue, King County, at the interchange of Interstate 90 and Interstate 405 and approximately 10 miles east of the Seattle central business district, offering its tenants access to local demand drivers including the Marketplace at Factoria Shopping Center, Newport Corporate Center and Bellevue Community College. According to the appraisal, Bellevue is the metropolitan hub for high tech companies operating in software development, internet and network services, multi and digital media and biotech, including Puget Sound Energy, PACCAR, Western Wireless, T-Mobile USA and Esterline Technologies. The Sunset North Property is part of the Seattle-Tacoma-Bellevue metropolitan statistical area, in which the top four employers are Boeing, Microsoft, Amazon and the University of Washington. According to the appraisal, the estimated 2019 population within a one-, three- and five-mile radius of the Sunset North Property is 12,182, 103,277 and 226,943, respectively. Additionally, according to the appraisal, over the same period, the average household income within a one-, three- and five-mile radius was $130,736, $163,977 and $176,633, respectively.
The Sunset North Property is located within the Eastside I-90 Corridor Class A submarket of the Puget Sound office market. As of the second quarter of 2019, the Puget Sound Class A office market consisted of approximately 73.5 million square foot of office space with a total vacancy rate of 9.2% and direct asking rents of approximately $39.92 per square foot. The Eastside I-90 Corridor Class A submarket totaled approximately 5.3 million square foot with a total vacancy of 6.6% and direct market asking rents of $38.10 per square foot. From 2013 to the second quarter, in the Eastside I-90 Corridor submarket, total vacancy has decreased by approximately 54.5% and average asking rents have increased by approximately 27.4%.
The appraisal identified 18 competitive office rent comparables located across eight properties in Bellevue, Washington. The comparable properties were built between 1983 and 2008 and range in size between 81,522 square foot to 601,081 square foot. NNN rents range from $24.45 to $33.00 per square foot, with a weighted average of approximately $26.86 per square foot. The appraisal’s concluded office market rent for the Sunset North Property is $30.00 per square foot, which is approximately 10.2% higher than the Sunset North Property’s in-place weighted average office rent of $27.22 per square foot.
| THE INFORMATION IN THIS STRUCTURAL AND COLLATERAL TERM SHEET IS NOT COMPLETE AND MAY BE AMENDED PRIOR TO THE TIME OF SALE. THIS TERM SHEET IS NOT AN OFFER TO SELL THESE SECURITIES AND IT IS NOT A SOLICITATION OF AN OFFER TO BUY THESE SECURITIES IN ANY JURISDICTION WHERE THE OFFER OR SALE IS NOT PERMITTED. |
| |
| | 109 of 145 | |
| Structural and Collateral Term Sheet | | JPMDB 2019-COR6 |
| |
| Sunset North |
| Historical and Current Occupancy(1) |
| 2016 | 2017 | 2018 | Current(2) |
| 98.7% | 99.5% | 71.9% | 98.8% |
| (1) | Historical Occupancies are as of December 31 of each respective year. |
| (2) | Current Occupancy is as of September 30, 2019. |
| Tenant Summary(1) |
| Tenant | Ratings
Moody’s/Fitch/S&P(2) | Net Rentable
Area (SF) | % of Total
NRA | Base Rent
PSF | % of Total
Base Rent | Lease Expiration |
| Intellectual Ventures | NR / NR / NR | 152,633 | 32.9% | $27.00 | 32.1% | 5/31/2025 |
| ArenaNet | NR / NR / NR | 96,839 | 20.9% | $27.00 | 20.3 | 5/31/2029 |
| WeWork(3) | NR / CCC / B- | 78,303 | 16.9% | $32.50 | 19.8 | 12/31/2031 |
| Farmers(4) | A+ / A1 / AA- | 61,327 | 13.2% | $28.00 | 13.4 | 5/31/2029 |
| GM Cruise | BBB / Baa3 / BBB | 32,331 | 7.0% | $30.00 | 7.5 | 11/30/2026 |
| Lydig Construction | NR / NR / NR | 22,662 | 4.9% | $25.25 | 4.5 | 4/30/2021 |
| Akvelon(5) | NR / NR / NR | 6,954 | 1.5% | $27.00 | 1.5 | 7/31/2023 |
| NC Interactive(6) | NR / NR / NR | 4,269 | 0.9% | $28.50 | 0.9 | 5/31/2021 |
| Sister’s Deli (Sik & Hee) | NR / NR / NR | 1,725 | 0.4% | $0.00 | 0.0 | 6/30/2039 |
| Management Office | NR / NR / NR | 1,274 | 0.3% | $0.00 | 0.0 | 6/30/2039 |
| Subtotal / Wtd. Avg. | | 458,317 | 98.8% | $28.04 | 100.0% | |
| Vacant | | 5,744 | 1.2% | NAP | | |
| Total / Wtd. Avg. | | 464,061 | 100.0% | | | |
| (1) | Based on the underwritten rent roll dated September 30, 2019 inclusive of rent steps through September 2020. |
| (2) | In certain instances, ratings provided are those of the parent company of the entity shown, whether or not the parent guarantees the lease. In the case of Farmers, Farmers New World is an indirect subsidiary of Zurich Insurance Company Limited. |
| (3) | WeWork has executed its lease, taken possession of its space and begun paying rent, but has not yet taken occupancy. According to the borrower sponsor, WeWork is expected to complete buildout of its space and take occupancy in November 2019. |
| (4) | Farmers includes (i) 60,166 square foot leased to Farmers New World which has the right to terminate its lease on or after June 30, 2026 with no less than 12 months’ prior written notice and payment of a termination fee equal to a) all rent through and including October 2026 and b) the unamortized cost of all free or abated rent, tenant improvement allowances, reasonable attorneys’ fees and leasing commissions actually paid or provided by the broker and (ii) 1,161 square foot leased to Farmers Credit Union which has the right to terminate its lease on or after August 31, 2026 with no less than 12 months’ prior written notice and the payment of a termination fee equal to a) all rent through and including December 2026 and b) the unamortized cost of all free or abated rent, tenant improvement allowances, reasonable attorneys’ fees and leasing commissions actually paid or provided by the broker. |
| (5) | Akvelon has the right to terminate its lease as of May 31, 2021, with nine months’ prior notice and the payment of an approximately $285,900 termination fee. |
| (6) | NC Interactive has the right to terminate its lease with no less than 13 months’ prior written notice and the payment of an approximately $165,723 termination fee. |
| Lease Rollover Schedule(1) |
Year | Number
of
Leases
Expiring | Net Rentable
Area
Expiring | % of NRA
Expiring | Base Rent
Expiring(3) | % of Base
Rent
Expiring | Cumulative
Net Rentable
Area
Expiring | Cumulative
% of NRA
Expiring | Cumulative
Base Rent
Expiring | Cumulative
% of Base
Rent
Expiring |
| Vacant | NAP | 5,744 | 1.2% | NAP | NAP | 5,744 | 1.2% | NAP | NAP |
| 2019 & MTM | 0 | 0 | 0.0 | $0 | 0.0% | 5,744 | 1.2% | $0 | 0.0% |
| 2020 | 0 | 0 | 0.0 | 0 | 0.0 | 5,744 | 1.2% | $0 | 0.0% |
| 2021 | 2 | 26,931 | 5.8 | 693,882 | 5.4 | 32,675 | 7.0% | $693,882 | 5.4% |
| 2022 | 0 | 0 | 0.0 | 0 | 0.0 | 32,675 | 7.0% | $693,882 | 5.4% |
| 2023 | 1 | 6,954 | 1.5 | 187,758 | 1.5 | 39,629 | 8.5% | $881,640 | 6.9% |
| 2024 | 0 | 0 | 0.0 | 0 | 0.0 | 39,629 | 8.5% | $881,640 | 6.9% |
| 2025 | 1 | 152,633 | 32.9 | 4,121,091 | 32.1 | 192,262 | 41.4% | $5,002,731 | 38.9% |
| 2026 | 1 | 32,331 | 7.0 | 969,930 | 7.5 | 224,593 | 48.4% | $5,972,661 | 46.5% |
| 2027 | 0 | 0 | 0.0 | 0 | 0.0 | 224,593 | 48.4% | $5,972,661 | 46.5% |
| 2028 | 0 | 0 | 0.0 | 0 | 0.0 | 224,593 | 48.4% | $5,972,661 | 46.5% |
| 2029 | 3 | 158,166 | 34.1 | 4,332,038 | 33.7 | 382,759 | 82.5% | $10,304,699 | 80.2% |
| 2030 & Beyond(2) | 3 | 81,302 | 17.5 | 2,544,848 | 19.8 | 464,061 | 100.0% | $12,849,546 | 100.0% |
| Total | 11 | 464,061 | 100.0% | $12,849,546 | 100.0% | | | | |
| | | | | | | | | | | |
| (1) | Based on the underwritten rent roll dated September 30, 2019 inclusive of rent steps through September 2020. |
| (2) | 2030 & Beyond is inclusive of (i) 1,725 square foot associated with a deli with no attributable underwritten base rent and (ii) 1,274 square foot associated with a management office with no attributable underwritten base rent. |
| THE INFORMATION IN THIS STRUCTURAL AND COLLATERAL TERM SHEET IS NOT COMPLETE AND MAY BE AMENDED PRIOR TO THE TIME OF SALE. THIS TERM SHEET IS NOT AN OFFER TO SELL THESE SECURITIES AND IT IS NOT A SOLICITATION OF AN OFFER TO BUY THESE SECURITIES IN ANY JURISDICTION WHERE THE OFFER OR SALE IS NOT PERMITTED. |
| |
| | 110 of 145 | |
| Structural and Collateral Term Sheet | | JPMDB 2019-COR6 |
| |
| Sunset North |
| Operating History and Underwritten Net Cash Flow |
| 2017 | 2018 | TTM(1) | Underwritten | Per Square
Foot | %(2) |
| Base Rent(3) | $10,098,734 | $7,579,746 | $7,065,128 | $12,849,546 | $27.69 | 61.1% |
| Vacant Income | 0 | 0 | 0 | 171,120 | 0.37 | 0.8 |
| Gross Potential Rent | $10,098,734 | $7,579,746 | $7,065,128 | $13,020,666 | $28.06 | 61.9% |
| Other Reimbursements | 4,700,218 | 3,816,450 | 3,819,019 | 6,707,106 | 14.45 | 31.9 |
| Parking Income | 420,000 | 378,600 | 364,800 | 1,122,765 | 2.42 | 5.3 |
| Termination Fees(4) | 0 | 6,333,197 | 0 | 0 | 0.00 | 0.0 |
| Other Income | 227,129 | 260,139 | 308,265 | 179,746 | 0.39 | 0.9 |
| Net Rental Income | $15,446,081 | $18,368,132 | $11,557,212 | $21,030,283 | $45.32 | 100.0% |
| (Vacancy/Credit Loss) | 0 | 0 | 0 | (1,051,514) | (2.27) | (5.3) |
| Effective Gross Income | $15,446,081 | $18,368,132 | $11,557,212 | $19,978,769 | $43.05 | 95.0% |
| | | | | | | |
| Total Expenses | $4,538,540 | $4,822,445 | $4,758,188 | $6,362,971 | $13.71 | 31.8% |
| | | | | | | |
| Net Operating Income(5)(6)(7) | $10,907,542 | $13,545,687 | $6,799,024 | $13,615,798 | $29.34 | 68.2% |
| | | | | | | |
| TI/LC | 0 | 0 | 0 | 464,061 | 1.00 | 2.3 |
| Capital Expenditures | 0 | 0 | 0 | 148,500 | 0.32 | 0.7 |
| | | | | | | |
| Net Cash Flow | $10,907,542 | $13,545,687 | $6,799,024 | $13,003,237 | $28.02 | 65.1% |
| (1) | TTM column represents the trailing 12-month period ending on July 31, 2019. |
| (2) | % column represents percent of Net Rental Income for all revenue lines and represents percent of Effective Gross Income for the remainder of the fields. |
| (3) | Underwritten Base Rent is based on the underwritten rent roll dated September 30, 2019 inclusive of rent steps through September 2020. |
| (4) | 2018 Termination Fees are associated with the Boeing’s departure in April 2018. |
| (5) | The increase in 2018 Net Operating Income from 2017 Net Operating Income is primarily attributable to a $6.3 million fee associated with Boeing having terminated its lease in April 2018. |
| (6) | The decrease in TTM Net Operating Income from 2018 Net Operating Income is primarily attributable to Boeing’s departure in April 2018, for which a $6.3 million termination fee was paid in the first half of 2018. Following Boeing’s departure, the sponsor has executed several new leases executed in late 2018 and early 2019, for which tenants had not yet begun paying rent in the trailing 12 month period ending July 31, 2019. |
| (7) | The increase in Underwritten Net Operating Income from TTM Net Operating Income is primarily attributable to new leases taking effect following Boeing’s departure from the Sunset North Property in April 2018, including (i) WeWork for 78,303 square foot (16.9% of net rentable area), (ii) GM Cruise for 32,331 square foot (7.0% of net rentable area), (iii) ArenaNet for a 32,432 square foot expansion space (7.0% of net rentable area), (iv) Farmers New World for 60,166 square foot (13.0% of net rentable area) and (v) Farmers Credit union executing a 1,161 square foot lease (0.3% of net rentable area). WeWork has executed its lease, taken possession of its space and begun paying rent but has not yet taken occupancy. According to the sponsor, WeWork is expected to complete buildout of its space and take occupancy in November 2019. |
Property Management.The Sunset North Property is managed by MMP Washington Commercial Services, LLC, a Delaware limited liability company and an affiliate of the borrower.
Lockbox / Cash Management.The Sunset North Whole Loan is structured with a hard lockbox and springing cash management. The borrower was required at origination to deliver tenant direction letters instructing all tenants to deposit rents into a lockbox account controlled by the lender. So long as no Cash Sweep Event (as defined below) then exists, all funds deposited into the lockbox account are required to be transferred on each business day to or at the direction of the borrower. All funds on deposit in the cash management account following the occurrence and during the continuance of a Cash Sweep Event following payment of taxes and insurance, debt service, required reserves and operating expenses are required to be deposited into the excess cash flow reserve, and in each case to be held and disbursed in accordance with the terms of the Sunset North Whole Loan documents. During the continuance of an event of default, the lender may apply such funds in such order and priority as the lender determines. The lender has been granted a first priority security interest in the cash management account.
A “Cash Sweep Event” means the occurrence and continuation of (i) an event of default, (ii) any bankruptcy action of the borrower, (iii) any bankruptcy action of the property manager unless, with respect to a property manager that is not affiliated to the borrower, the borrower replaces the property manager within 40 days with a qualified manager under a replacement management agreement within 40 days of such bankruptcy action, (iv) a DSCR Trigger Event (as defined below) or (v) a Tenant Trigger Event (as defined below).
| THE INFORMATION IN THIS STRUCTURAL AND COLLATERAL TERM SHEET IS NOT COMPLETE AND MAY BE AMENDED PRIOR TO THE TIME OF SALE. THIS TERM SHEET IS NOT AN OFFER TO SELL THESE SECURITIES AND IT IS NOT A SOLICITATION OF AN OFFER TO BUY THESE SECURITIES IN ANY JURISDICTION WHERE THE OFFER OR SALE IS NOT PERMITTED. |
| |
| | 111 of 145 | |
| Structural and Collateral Term Sheet | | JPMDB 2019-COR6 |
| |
| Sunset North |
A Cash Sweep Event may be cured if, with respect to a Cash Sweep Event caused solely by (a) clause (i) above, the lender has accepted a cure by the borrower of the related event of default, (b) clause (iii) above, the borrower has replaced the property manager with a qualified manager under a replacement management agreement in accordance with the Sunset North Whole Loan documents, (c) clause (iii) above, a DSCR Cure Event (as defined below) has taken place, or (d) clause (iv) above, either (x) Farmers New World Life Insurance Company or ArenaNet renews their lease or (y) the premises leased to either Farmers New World Life Insurance Company or ArenaNet is re-let to one or more tenants reasonably acceptable to the lender. A Cash Sweep Event may be cured no more than a total of five times in the aggregate during the term of the Loan (but a Cash Sweep Event caused by a DSCR Trigger Event or a Tenant Trigger Event may be cured an unlimited number of times).
A “DSCR Cure Event” means the debt service coverage ratio of the Sunset North Whole Loan (as calculated in accordance with the Sunset North Whole Loan documents), based on the trailing three-month period immediately preceding the date of determination, is at least 1.50x for two consecutive quarters.
A “DSCR Trigger Event” means the debt service coverage ratio of the Sunset North Whole Loan (as calculated in accordance with the Sunset North Whole Loan documents) based on the trailing three-month period immediately preceding the date of determination is less than 1.50x.
A “Tenant Trigger Event” means that both Farmers New World Life Insurance Company and ArenaNet, LLC do not renew their respective leases prior to 12 months prior to the expiration dates of their respective leases.
Escrows and Reserves.At loan origination, the borrower deposited (i) approximately $14,380,754 into outstanding TI/LC reserve in connection with five leases, (ii) approximately $406,710 into a free rent reserve in connection with two leases, (iii) approximately $166,282 into an insurance reserve, (iv) approximately $153,562 into a real estate tax reserve, (v) approximately $38,672 into a rollover reserve and (vii) $12,375 into a replacement reserve.
Tax Reserve.The borrower is required to deposit into a real estate tax reserve, on a monthly basis, 1/12 of the estimated annual real estate taxes, which currently equates to approximately $153,562 per month (approximately $0.33 per square foot).
Insurance Reserve.The borrower is required to deposit into an insurance reserve, on a monthly basis, 1/12 of estimated insurance premiums, which currently equates to approximately $33,256 per month (approximately $0.07 per square foot). In the event the borrower obtains and maintains a blanket insurance policy acceptable to the lender and no event of default has occurred and is continuing, the requirement for monthly deposits into the insurance reserve will be waived.
TI/LC Reserve. The borrower is required to deposit into the TI/LC reserve, on a monthly basis, approximately $38,672 (approximately $1.00 per square foot annually), subject to a cap of $928,122 (approximately $2.00 per square foot).
Replacement Reserve. The borrower is required to deposit into the replacement reserve, on a monthly basis, $12,375 (approximately $0.32 per square foot annually), subject to a cap of approximately $445,499 (approximately $0.96 per square foot).
Additional Debt. None.
Partial Release. None.
| THE INFORMATION IN THIS STRUCTURAL AND COLLATERAL TERM SHEET IS NOT COMPLETE AND MAY BE AMENDED PRIOR TO THE TIME OF SALE. THIS TERM SHEET IS NOT AN OFFER TO SELL THESE SECURITIES AND IT IS NOT A SOLICITATION OF AN OFFER TO BUY THESE SECURITIES IN ANY JURISDICTION WHERE THE OFFER OR SALE IS NOT PERMITTED. |
| |
| | 112 of 145 | |
| Structural and Collateral Term Sheet | | JPMDB 2019-COR6 |
[THIS PAGE INTENTIONALLY BLANK]
| THE INFORMATION IN THIS STRUCTURAL AND COLLATERAL TERM SHEET IS NOT COMPLETE AND MAY BE AMENDED PRIOR TO THE TIME OF SALE. THIS TERM SHEET IS NOT AN OFFER TO SELL THESE SECURITIES AND IT IS NOT A SOLICITATION OF AN OFFER TO BUY THESE SECURITIES IN ANY JURISDICTION WHERE THE OFFER OR SALE IS NOT PERMITTED. |
| |
| | 113 of 145 | |
| Structural and Collateral Term Sheet | | JPMDB 2019-COR6 |
| |
| Jersey City Group 2 |
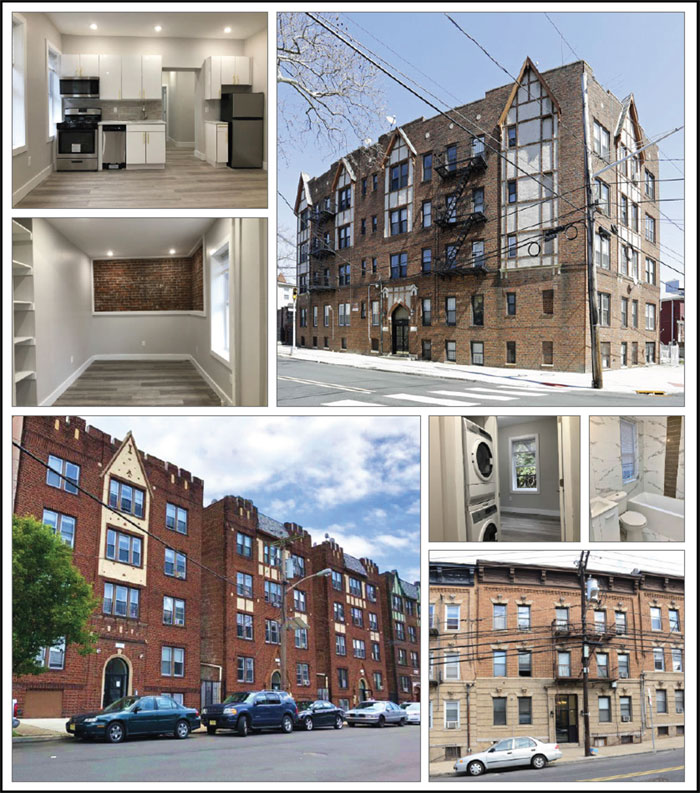
| THE INFORMATION IN THIS STRUCTURAL AND COLLATERAL TERM SHEET IS NOT COMPLETE AND MAY BE AMENDED PRIOR TO THE TIME OF SALE. THIS TERM SHEET IS NOT AN OFFER TO SELL THESE SECURITIES AND IT IS NOT A SOLICITATION OF AN OFFER TO BUY THESE SECURITIES IN ANY JURISDICTION WHERE THE OFFER OR SALE IS NOT PERMITTED. |
| |
| | 114 of 145 | |
| Structural and Collateral Term Sheet | | JPMDB 2019-COR6 |
| |
| Jersey City Group 2 |
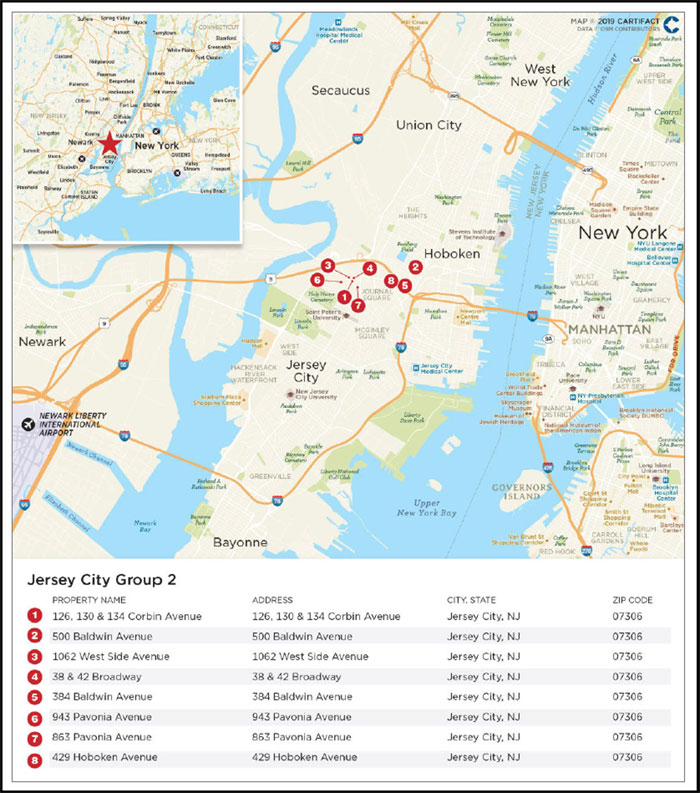
| THE INFORMATION IN THIS STRUCTURAL AND COLLATERAL TERM SHEET IS NOT COMPLETE AND MAY BE AMENDED PRIOR TO THE TIME OF SALE. THIS TERM SHEET IS NOT AN OFFER TO SELL THESE SECURITIES AND IT IS NOT A SOLICITATION OF AN OFFER TO BUY THESE SECURITIES IN ANY JURISDICTION WHERE THE OFFER OR SALE IS NOT PERMITTED. |
| |
| | 115 of 145 | |
| Structural and Collateral Term Sheet | | JPMDB 2019-COR6 |
| |
| Jersey City Group 2 |
| Mortgage Loan Information | | Property Information |
| Mortgage Loan Seller: | JPMCB | | Single Asset / Portfolio: | Portfolio |
| Original Principal Balance: | $32,840,000 | | Title: | Fee |
| Cut-off Date Principal Balance: | $32,840,000 | | Property Type – Subtype: | Multifamily – Garden |
| % of Pool by IPB: | 4.1% | | Net Rentable Area (Units)(1): | 201 |
| Loan Purpose: | Refinance | | Location: | Jersey City, NJ |
| Borrower: | SBR Group 2 LLC | | Year Built / Renovated(2): | Various / Various |
| Sponsors: | Joseph Ehrman, Barry Schreiber | | Occupancy(3): | 95.0% |
| Interest Rate: | 4.62000% | | Occupancy Date: | 9/30/2019 |
| Note Date: | 10/25/2019 | | Number of Tenants(4): | 4 |
| Maturity Date: | 11/1/2029 | | 2016 NOI(5): | N/A |
| Interest-only Period: | 60 months | | 2017 NOI(5): | N/A |
| Original Term: | 120 months | | 2018 NOI: | $1,588,877 |
| Original Amortization: | 360 months | | TTM NOI (as of 8/2019)(6): | $1,653,665 |
| Amortization Type: | IO-Balloon | | UW Economic Occupancy: | 93.7% |
| Call Protection: | L(24),Def(93),O(3) | | UW Revenues: | $2,956,771 |
| Lockbox / Cash Management: | Springing / Springing | | UW Expenses: | $802,072 |
| Additional Debt: | N/A | | UW NOI(6): | $2,154,699 |
| Additional Debt Balance: | N/A | | UW NCF: | $2,104,449 |
| Additional Debt Type: | N/A | | Appraised Value / Per Unit: | $41,800,000 / $207,960 |
| | | | Appraisal Date: | Various |
| | | | | |
| | | | | | | |
| Escrows and Reserves(7) | | Financial Information |
| | Initial | Monthly | Initial Cap | | | |
| Taxes: | $117,697 | $29,424 | N/A | | Cut-off Date Loan / Unit: | $163,383 |
| Insurance: | $0 | Springing | N/A | | Maturity Date Loan / Unit: | $149,789 |
| Replacement Reserves: | $4,118 | $4,188 | $50,250 | | Cut-off Date LTV: | 78.6% |
| TI/LC: | $0 | $0 | N/A | | Maturity Date LTV: | 72.0% |
| Other: | $101,500 | $0 | N/A | | UW NCF DSCR(8): | 1.04x |
| | | | | | UW NOI Debt Yield: | 6.6% |
| | | | | | |
| Sources and Uses |
| Sources | Proceeds | % of Total | | Uses | Proceeds | % of Total |
| Mortgage Loan | $32,840,000 | 100.0% | | Payoff Existing Debt | $28,010,053 | 85.3% |
| | | | | Closing Costs | 590,988 | 1.8 |
| | | | | Upfront Reserves | 223,315 | 0.7 |
| | | | | Return of Equity | 4,015,644 | 12.2 |
| Total Sources | $32,840,000 | 100.0% | | Total Uses | $32,840,000 | 100.0% |
| (1) | Net Rentable Area (Units) is reflective of 201 residential units and excludes five commercial units, totaling 3,325 square feet, associated with the 1062 West Side Avenue property. |
| (2) | See “Portfolio Summary” table below for additional information. |
| (3) | Occupancy based solely on residential units is 95.0% as of September 30, 2019. Occupancy of the commercial square footage is 100.0%. |
| (4) | Number of Tenants is reflective of four commercial tenants who currently occupy five commercial units, totaling 3,325 square feet, at the 1062 West Side Avenue property. |
| (5) | 2016 NOI and 2017 NOI are not available as the Jersey City Group 2 Portfolio properties were acquired in 2017. |
| (6) | The increase in Underwritten NOI from TTM NOI is primarily attributable to (i) rent growth and (ii) renovations and management changes which led to decreased repairs and maintenance and utility costs. |
| (7) | For a full description of Escrows and Reserves, please refer to “Escrows and Reserves” below. |
| (8) | The current UW NCF DSCR is 1.37x based on an interest-only debt service payment. The Jersey City Group 2 Loan (as defined below) has an initial 60 month interest only period. The UW NCF DSCR of 1.04x is based on an amortizing debt service payment starting in month 61. |
| THE INFORMATION IN THIS STRUCTURAL AND COLLATERAL TERM SHEET IS NOT COMPLETE AND MAY BE AMENDED PRIOR TO THE TIME OF SALE. THIS TERM SHEET IS NOT AN OFFER TO SELL THESE SECURITIES AND IT IS NOT A SOLICITATION OF AN OFFER TO BUY THESE SECURITIES IN ANY JURISDICTION WHERE THE OFFER OR SALE IS NOT PERMITTED. |
| |
| | 116 of 145 | |
| Structural and Collateral Term Sheet | | JPMDB 2019-COR6 |
| |
| Jersey City Group 2 |
The Loan.The Jersey City Group 2 mortgage loan has an outstanding principal balance as of the Cut-off Date of $32.84 million (the ”Jersey City Group 2 Loan”) and is secured by a first mortgage lien on the borrower’s fee interest in a portfolio of eight multifamily properties totaling 201 residential units and 3,325 square feet of commercial space located on the west side of Jersey City, New Jersey (the “Jersey City Group 2 Portfolio”). The Jersey City Group 2 Loan has a 10-year term and following a five-year interest-only period, will amortize on a 30-year schedule.
The Borrower.The borrowing entity is SBR Group 2 LLC, a Delaware limited liability company and special purpose entity.
The Loan Sponsors.The loan sponsors and non-recourse carve-out guarantors are Joseph Ehrman and Barry Schreiber, who serve as principals at Optimum Properties. Founded in 1999, Optimum Properties is a real estate firm focused on purchasing, remodeling and positioning residential units primarily located in Baltimore, Maryland, Cherry Hill, New Jersey, Howell, New Jersey and Jersey City, New Jersey. Optimum Properties’ portfolio is currently valued in excess of $500.0 million and includes over 2,000 units in the Jersey City market.
Portfolio Summary |
| Property | Units | Year Built/ Renovated | Allocated Loan
Amount | % of Allocated
Loan Amount | Appraised
Value | % of Portfolio
Appraised Value | Historical
Capital
Expenditures(2) |
| 126, 130 & 134 Corbin Avenue | 63 | 1901 / 2019 | $10,291,962 | 31.3% | $13,100,000 | 31.3% | $623,122 |
| 500 Baldwin Avenue | 29 | 1900 / 2019 | 4,792,440 | 14.6% | 6,100,000 | 14.6% | 128,326 |
| 1062 West Side Avenue(1) | 24 | 1920 / 2019 | 4,556,746 | 13.9% | 5,800,000 | 13.9% | 160,770 |
| 38 & 42 Broadway | 24 | 1900 / 2019 | 3,692,536 | 11.2% | 4,700,000 | 11.2% | 295,918 |
| 384 Baldwin Avenue | 20 | 1900 / 2019 | 2,749,761 | 8.4% | 3,500,000 | 8.4% | 81,686 |
| 943 Pavonia Avenue | 17 | 1900 / 2019 | 2,671,196 | 8.1% | 3,400,000 | 8.1% | 92,976 |
| 863 Pavonia Avenue | 13 | 1923 / 2019 | 2,199,809 | 6.7% | 2,800,000 | 6.7% | 10,000 |
| 429 Hoboken Avenue | 16 | 1900 / 2019 | 1,885,550 | 5.7% | 2,400,000 | 5.7% | 122,386 |
| Total | 206 | | $32,840,000 | 100.0% | $41,800,000 | 100.0% | $1,515,184 |
| (1) | Units for the 1062 West Side Avenue property inclusive of five commercial units comprised of 3,325 feet. |
| (2) | Historical Capital Expenditures represent the sum of unit-level renovations and common area upgrades since the Jersey City Group 2 Portfolio was acquired in 2017. |
The Portfolio. The Jersey City Group 2 Portfolio consists of eight properties, comprised of 201 residential units and 3,325 square feet of commercial space located on the west side of Jersey City, New Jersey. The Jersey City Group 2 Portfolio unit mix includes nine studio, 143 one-bedroom, 46 two-bedroom, two three-bedroom and one super units. The Jersey City Group 2 Portfolio properties were originally constructed between 1900 and 1923, and all eight properties underwent renovations between 2017 and 2019. In 2017, the loan sponsors acquired the Jersey City Group 2 Portfolio as part of a larger portfolio of multifamily properties comprised of 569 units located in Jersey City, New Jersey for a total cost of $97.0 million. All 569 units were refinanced for a total of approximately $96.0 million, of which approximately $32.8 million was allocated to the Jersey City Group 2 Portfolio. Since acquisition the loan sponsors have invested approximately $1.5 million in property renovations across the Jersey City Group 2 Portfolio. Unit renovations include upgrades to bathrooms, kitchen finishes, stainless steel appliances and hardwood floors. Common area renovations include upgrades to lobbies, awnings, staircases, roofing, sidewalks, electricals, fire systems, boilers, boiler controls systems, electronic water meters and new laundry rooms.
All of the units across the Jersey City Group 2 Portfolio are subject to rent control which limits annual rent increases to the lesser of consumer price index or 4.0%. When units become vacant the landlord can increase monthly rents by $1.35 per $100 of improvements up to $5,000 and by $1.55 per $100 of improvements of $5,000 to $10,000. Since acquiring the Jersey City Group 2 Portfolio, the loan sponsors have completed renovations on 35 units out of a total of 201 residential units.
126, 130 & 134 Corbin Avenue
The largest Jersey City Group 2 Portfolio property by allocated loan amount, 126, 130 & 134 Corbin Avenue, is a 63-unit, low-rise, multifamily property located in Jersey City, New Jersey on Corbin Avenue. As of September 30, 2019, the 126, 130 & 134 Corbin Avenue property was 92.1% occupied. The 126, 130 & 134 Corbin Avenue property is comprised of four studio, fifty-five one-bedroom, two two-bedroom, one three-bedroom and one super units. Since 2017, the 126, 130 & 134 Corbin Avenue property has undergone $379,922 in apartment renovations and $243,200 in common area upgrades, including updates to the entrance and lobby as well as upgrades to the video surveillance system and laundry room appliances. The appraisal concluded an average market rent of $1,607 per unit, which is approximately 20.3% above the 126, 130 & 134 Corbin Avenue property’s average occupied rent of $1,281 per unit.
| THE INFORMATION IN THIS STRUCTURAL AND COLLATERAL TERM SHEET IS NOT COMPLETE AND MAY BE AMENDED PRIOR TO THE TIME OF SALE. THIS TERM SHEET IS NOT AN OFFER TO SELL THESE SECURITIES AND IT IS NOT A SOLICITATION OF AN OFFER TO BUY THESE SECURITIES IN ANY JURISDICTION WHERE THE OFFER OR SALE IS NOT PERMITTED. |
| |
| | 117 of 145 | |
| Structural and Collateral Term Sheet | | JPMDB 2019-COR6 |
| |
| Jersey City Group 2 |
500 Baldwin Avenue
The second largest Jersey City Group 2 Portfolio property by allocated loan amount, 500 Baldwin Avenue, is a 29-unit, low-rise, multifamily property located in Jersey City, New Jersey on Baldwin Avenue. As of September 30, 2019, the 500 Baldwin Avenue property was 100.0% occupied. The 500 Baldwin Avenue property is comprised of two studio, twenty one-bedroom, six two-bedroom, and one three-bedroom units. Since 2017, the 500 Baldwin Avenue property has undergone $106,826 in apartment renovations and $21,500 in common area upgrades, including updates to appliances in the laundry room as well as roof and entranceway upgrades. The appraisal concluded an average market rent of $1,573 per unit, which is approximately 23.8% above the 500 Baldwin Avenue property’s average occupied rent of $1,199 per unit.
1062 West Side Avenue
The third largest Jersey City Group 2 Portfolio property by allocated loan amount, 1062 West Side Avenue, is a 19-unit, low-rise, multifamily property located in Jersey City, New Jersey. The 1062 West Side Avenue property also encompasses four commercial tenants across five commercial units on the ground floor. As of September 30, 2019, the 1062 West Side Avenue property’s 19 residential units were 94.7% occupied and the five commercial units were 100.0% occupied. The 1062 West Side Avenue property is comprised of two studio, eleven one-bedroom and six two-bedroom units. Since 2017, the 1062 West Side Avenue property has undergone $118,770 in apartment renovations and $42,000 in common area upgrades, which included updates to the entrance and lobby as well as upgrades to the video surveillance system. The appraisal concluded an average market rent of $1,600 per unit, which is approximately 12.0% above the 1062 West Side Avenue property’s average occupied rent of $1,408 per unit.
The Jersey City Group 2 Portfolio properties are located on the west side of Jersey City, New Jersey, an area anchored by the revitalization of the Journal Square neighborhood. According to the appraisal, in 2008, Journal Square began a redevelopment plan focused on fostering the central business district and shopping area by introducing new higher density residential, retail and commercial offerings. The Jersey City Group 2 Portfolio properties offer convenient access to the Journal Square Transportation Center, a station that is home to the New Jersey Transit, private bus lines and two Port Authority Trans-Hudson (“PATH”) lines. The PATH is a 24-hour, 13.9 mile rapid transit system that serves over 200,000 passengers daily and connects neighborhoods in New Jersey to Newark Penn Station and Manhattan. The Jersey City Group 2 Portfolio properties also offer access Interstate 78, Interstate 95 and Route 139 and are located approximately 6.4 miles to the northeast of Newark Liberty International Airport. According to the appraisal, the Jersey City Group 2 Portfolio properties are located in New York-Jersey City-White Plains metropolitan statistical area, which reported a median household income of approximately $72,300 as of May 2019. According to the appraisal, the Jersey City Group 2 Portfolio properties are located in the Hudson County multifamily submarket of the Northern New Jersey multifamily market. As of the first quarter of 2019, the Northern New Jersey multifamily market and Hudson County multifamily submarket had inventory of 239,416 and 58,428, respectively, and overall vacancy rates of 4.8% and 6.6%, respectively. As of the first quarter of 2019, average asking rent for the Hudson County submarket was $3,331 per unit, an approximately 9.8% increase from the first quarter of 2017.
| Historical and Current Occupancy(1)(2) |
| 2017 | 2018 | Current(3) |
| 89.5% | 91.8% | 96.5% |
| (1) | Historical and Current Occupancy reflect the larger portfolio of multifamily properties comprised of 569 residential units that the loan sponsors acquired in 2017. Occupancy for the 201 residential units in the Jersey City Group 2 Portfolio was not available. |
| (2) | Historical Occupancies are as of December 31 of each respective year. |
| (3) | Current Occupancy is as of September 30, 2019. |
| THE INFORMATION IN THIS STRUCTURAL AND COLLATERAL TERM SHEET IS NOT COMPLETE AND MAY BE AMENDED PRIOR TO THE TIME OF SALE. THIS TERM SHEET IS NOT AN OFFER TO SELL THESE SECURITIES AND IT IS NOT A SOLICITATION OF AN OFFER TO BUY THESE SECURITIES IN ANY JURISDICTION WHERE THE OFFER OR SALE IS NOT PERMITTED. |
| |
| | 118 of 145 | |
| Structural and Collateral Term Sheet | | JPMDB 2019-COR6 |
| |
| Jersey City Group 2 |
| Unit Mix(1) |
| Property | # of
Residential
Units | # of
Commercial
Units | Occupancy
Residential
Units | Occupancy
Commercial
Space | Average
Market
Rent Per
Unit(2) | Average
Occupied
Rent Per
Unit | %
Below
Market |
| 126, 130 & 134 Corbin Avenue | 63 | 0 | 92.1% | NAP | $1,607 | $1,281 | 20.3% |
| 500 Baldwin Avenue | 29 | 0 | 100.0% | NAP | $1,573 | $1,199 | 23.8% |
| 1062 West Side Avenue | 19 | 5 | 94.7% | 100.0% | $1,600 | $1,408 | 12.0% |
| 38 & 42 Broadway | 24 | 0 | 91.7% | NAP | $1,675 | $1,187 | 29.1% |
| 384 Baldwin Avenue | 20 | 0 | 95.0% | NAP | $1,544 | $1,113 | 27.9% |
| 943 Pavonia Avenue | 17 | 0 | 94.1% | NAP | $1,532 | $1,250 | 18.4% |
| 863 Pavonia Avenue | 13 | 0 | 100.0% | NAP | $1,652 | $1,350 | 18.3% |
| 429 Hoboken Avenue | 16 | 0 | 100.0% | NAP | $1,489 | $1,000 | 32.8% |
| Total / Wtd. Avg. | 201 | 5 | 95.0% | 100.0% | $1,590 | $1,232 | 22.6% |
| (1) | Based on the underwritten rent roll as of September 30, 2019. |
| (2) | Based on each Jersey City Group 2 Portfolio property appraisal as of October 2019. |
| Underwritten Net Cash Flow |
| | 2018 | TTM | Underwritten | Per Unit(1) | %(2) |
| Residential Rents in Place | $2,531,724 | $2,629,166 | $2,807,652 | $13,629 | 90.8% |
| Vacant Income | 0 | 0 | 194,400 | 944 | 6.3 |
| Commercial Rents in Place | 54,820 | 75,944 | 89,471 | 17,894 | 2.9 |
| Net Rental Income | $2,586,544 | $2,705,109 | $3,091,523 | $15,007 | 100.0% |
| Other Income(3) | 34,480 | 39,622 | 59,649 | 290 | 1.9 |
| (Vacancy/Credit Loss) | 0 | 0 | (194,400) | (944) | (6.6) |
| Effective Gross Income | $2,621,024 | $2,744,732 | $2,956,771 | $14,353 | 100.0% |
| Total Expenses(4) | $1,032,147 | $1,091,067 | $802,072 | $3,894 | 27.1% |
| Net Operating Income(5) | $1,588,877 | $1,653,665 | $2,154,699 | $10,460 | 72.9% |
| Replacement Reserves | 0 | 0 | 50,250 | 244 | 1.7 |
| Net Cash Flow | $1,588,877 | $1,653,665 | $2,104,449 | $10,216 | 71.2% |
| (1) | Residential Rents in Place Per Unit and Commercial Rents in Place Per Unit are calculated based on 201 residential and five commercial units, respectively. The remaining line items are based on 206 total units in the Jersey City Group 2 Portfolio. |
| (2) | % column represents percent of Net Rental Income for all revenue lines and represents percent of Effective Gross Income for the remainder of the fields. |
| (3) | Other Income includes laundry, antenna, storage and parking income. The increase in Other Income is primarily the result of additional laundry facilities and storage that was added as part of the recent renovations across the Jersey City Group 2 Portfolio. |
| (4) | The decrease in Total Expenses is primarily the result of management changes across the Jersey City Group 2 Portfolio along with decreased repairs and maintenance and Utility costs due to the addition of electronic water meters, new and refurbished boilers and new boiler control systems that were put in place as part of recent renovations. |
| (5) | The increase in Underwritten Net Operating Income from TTM Net Operating Income is primarily attributable to (i) rent growth and (ii) the increase in Other Income and decrease in Total Expenses described above. |
Property Management. The Jersey City Group 2 Portfolio is managed by Sixth Boro Management LLC, an affiliate of the borrower.
| THE INFORMATION IN THIS STRUCTURAL AND COLLATERAL TERM SHEET IS NOT COMPLETE AND MAY BE AMENDED PRIOR TO THE TIME OF SALE. THIS TERM SHEET IS NOT AN OFFER TO SELL THESE SECURITIES AND IT IS NOT A SOLICITATION OF AN OFFER TO BUY THESE SECURITIES IN ANY JURISDICTION WHERE THE OFFER OR SALE IS NOT PERMITTED. |
| |
| | 119 of 145 | |
| Structural and Collateral Term Sheet | | JPMDB 2019-COR6 |
| |
| Jersey City Group 2 |
Escrows and Reserves. At loan origination, the borrowers deposited approximately$117,697 into a tax reserve account, $4,118 into a replacement reserve account and $101,500 into an environmental reserve account.
Tax Reserve - On a monthly basis, the borrowers are required to deposit into a real estate tax reserve an amount equal to 1/12 of the estimated annual real estate taxes, which currently equates to $29,424 per month.
Insurance Reserve - The borrowers are required to deposit into an insurance reserve, on a monthly basis, an amount equal to 1/12 of the estimated insurance premiums. In the event the borrowers obtain and maintain a blanket insurance policy acceptable to the lender and no event of default under the Jersey City Group 2 Loan has occurred and is continuing, the requirement for monthly deposits into the insurance reserve will be waived.
Replacement Reserve - On a monthly basis, the borrowers are required to escrow$4,188for replacement reserves, subject to a cap of$50,250.
Lockbox / Cash Management. The Jersey City Group 2 Loan is structured with a springing lockbox and springing cash management. Upon the occurrence of a Cash Sweep Event (as defined below), all rents are required to be deposited into a lockbox account by the borrowers or the property manager within two business after receipt thereof. Upon the occurrence and during the continuance of a Cash Sweep Event, all funds in the lockbox account are required to be swept within two business days into a lender-controlled account, from which account such funds will be disbursed on each payment date in accordance with the Jersey City Group 2 Loan documents and any excess will be retained by the lender as additional collateral for the Jersey City Group 2 Loan.
A “Cash Sweep Event” means the occurrence of (i) an event of default (ii) any bankruptcy action of the borrower or manager or (iii) a DSCR Trigger Event (as defined below).
A “DSCR Trigger Event” means (i) during the interest only period, that as of the date of determination, the debt service coverage ratio based on the trailing 12 month period immediately preceding the date of such determination as reasonably determined by the lender is less than 1.15x; and (ii) during the amortization period, that as of the date of determination, the debt service coverage ratio based on the trailing 12 month period immediately preceding the date of such determination as reasonably determined by the lender is less than 1.05x.
A “DSCR Cure Event” means (i) during the interest only period that as of the date of determination, the debt service coverage ratio based on the trailing 12 month period immediately preceding the date of such determination as reasonably determined by the lender for two consecutive quarters is not less than 1.15x, and (ii) during the amortization period that as of the date of determination, the debt service coverage ratio based on the trailing 12 month period immediately preceding the date of such determination as reasonably determined by the lender for two consecutive quarters is not less than 1.05x.
Additional Debt. None.
Partial Release.None.
| THE INFORMATION IN THIS STRUCTURAL AND COLLATERAL TERM SHEET IS NOT COMPLETE AND MAY BE AMENDED PRIOR TO THE TIME OF SALE. THIS TERM SHEET IS NOT AN OFFER TO SELL THESE SECURITIES AND IT IS NOT A SOLICITATION OF AN OFFER TO BUY THESE SECURITIES IN ANY JURISDICTION WHERE THE OFFER OR SALE IS NOT PERMITTED. |
| |
| | 120 of 145 | |
| Structural and Collateral Term Sheet | | JPMDB 2019-COR6 |
[THIS PAGE INTENTIONALLY LEFT BLANK]
| THE INFORMATION IN THIS STRUCTURAL AND COLLATERAL TERM SHEET IS NOT COMPLETE AND MAY BE AMENDED PRIOR TO THE TIME OF SALE. THIS TERM SHEET IS NOT AN OFFER TO SELL THESE SECURITIES AND IT IS NOT A SOLICITATION OF AN OFFER TO BUY THESE SECURITIES IN ANY JURISDICTION WHERE THE OFFER OR SALE IS NOT PERMITTED. |
| |
| | 121 of 145 | |
| Structural and Collateral Term Sheet | | JPMDB 2019-COR6 |
| |
| Belvedere Place |
| Mortgage Loan Information | | Property Information |
| Mortgage Loan Seller: | LCM | | Single Asset / Portfolio: | Single Asset |
| Original Principal Balance(1): | $32,750,000 | | Title: | Fee |
| Cut-off Date Principal Balance(1): | $32,750,000 | | Property Type - Subtype: | Office – Suburban |
| % of Pool by IPB: | 4.1% | | Net Rentable Area (SF): | 102,502 |
| Loan Purpose: | Acquisition | | Location: | Mill Valley, CA |
| Borrower: | Belvedere Place Property Owner | | Year Built / Renovated: | 2000 / N/A |
| | LLC | | Occupancy: | 100.0% |
| Sponsors: | Mark R. Hamilton, Anthony O. | | Occupancy Date: | 8/9/2019 |
| | Zanze, Kurt E. Houtkooper, David | | Number of Tenants: | 8 |
| | P. Messing | | 2016 NOI(3): | N/A |
| Interest Rate: | 3.54000% | | 2017 NOI: | $1,021,795 |
| Note Date: | 8/9/2019 | | 2018 NOI: | $2,458,181 |
| Maturity Date: | 9/6/2029 | | TTM NOI (as of 5/2019)(4): | $2,887,590 |
| Interest-only Period: | 120 months | | UW Economic Occupancy: | 92.0% |
| Original Term: | 120 months | | UW Revenues: | $6,480,910 |
| Original Amortization: | None | | UW Expenses: | $1,897,439 |
| Amortization Type: | Interest Only | | UW NOI(4): | $4,583,471 |
| Call Protection(2): | L(26),Def(90),O(4) | | UW NCF: | $4,131,437 |
| Lockbox / Cash Management: | Hard / Springing | | Appraised Value / Per SF: | $71,000,000 / $693 |
| Additional Debt(1): | Yes | | Appraisal Date: | 7/23/2019 |
| Additional Debt Balance(1): | $11,250,000 | | | |
| Additional Debt Type(1): | Pari Passu | | | |
| | | | | |
| Escrows and Reserves | | Financial Information(1) |
| | Initial | Monthly | Initial Cap | | Cut-off Date Loan / SF: | $429 | |
| Taxes: | $500,000 | $65,000 | N/A | | Maturity Date Loan / SF: | $429 | |
| Insurance(5): | $0 | Springing | N/A | | Cut-off Date LTV: | 62.0% | |
| Replacement Reserves: | $0 | $1,742 | $104,544 | | Maturity Date LTV: | 62.0% | |
| TI/LC: | $2,830,667 | $0 | N/A | | UW NCF DSCR: | 2.62x | |
| Other(6): | $316,522 | $0 | N/A | | UW NOI Debt Yield: | 10.4% | |
| | | | | | | |
|
| Sources and Uses |
| Sources | Proceeds | % of Total | | Uses | Proceeds | % of Total |
| Whole Loan(1) | $44,000,000 | 61.0% | | Purchase Price | $67,062,921 | 93.0% |
| Sponsor Equity | 28,111,157 | 39.0% | | Prorations and Adjustments | (998,915) | (1.4)% |
| | | | | Upfront Reserves | 3,647,189 | 5.1% |
| | | | | Closing Costs | 2,399,963 | 3.3% |
| Total Sources | $72,111,157 | 100.0% | | Total Uses | $72,111,157 | 100.0% |
| | | | | | | | |
| (1) | The Belvedere Place Loan (as defined below) is part of a whole loan evidenced by twopari passu notes, with an aggregate outstanding principal balance as of the Cut-off Date of $44.0 million. The Financial Information presented in the chart above reflects the Cut-off Date Balance of the $44.0 million Belvedere Place Whole Loan (as defined below). |
| (2) | The lockout period will be at least 26 payment dates beginning with and including the first payment date of October 6, 2019. Defeasance of the full Belvedere Place Whole Loan is permitted after the date that is the earlier to occur of the payment date that is (i) two years after the closing date of the securitization that includes the last pari passu note to be securitized and (ii) September 6, 2022. The assumed lockout period of 26 payments is based on the expected JPMDB 2019-COR6 securitization closing date in November 2019. The actual lockout period may be longer. |
| (3) | 2016 NOI is not available as the Belvedere Place Property (as defined below) was acquired by the prior owner in November 2016. |
| (4) | The increase from TTM NOI to UW NOI is primarily attributable to (i) the Belvedere Place Property’s renovation that was completed in 2018 by the prior owner and the subsequent lease up from 72.5% occupancy in 2018 to 100.0% current occupancy, (ii) approximately $54,146 of average rent over the loan term for Merrill Lynch and UBS, (iii) and approximately $93,627 in contractual rent steps through August 2020 for certain tenants. |
| (5) | The Belvedere Place Property is covered under a blanket policy and no insurance escrow will be required so long as the borrower provides proof of an acceptable blanket policy coverage. |
| (6) | Initial Other Escrows and Reserves consist of an initial deposit of $316,522 into a free rent reserve for WeWork. |
| THE INFORMATION IN THIS STRUCTURAL AND COLLATERAL TERM SHEET IS NOT COMPLETE AND MAY BE AMENDED PRIOR TO THE TIME OF SALE. THIS TERM SHEET IS NOT AN OFFER TO SELL THESE SECURITIES AND IT IS NOT A SOLICITATION OF AN OFFER TO BUY THESE SECURITIES IN ANY JURISDICTION WHERE THE OFFER OR SALE IS NOT PERMITTED. |
| |
| | 122 of 145 | |
| Structural and Collateral Term Sheet | | JPMDB 2019-COR6 |
| |
| Belvedere Place |
The Loan.The Belvedere Place loan, with a principal balance of $32.75 million as of the Cut-off Date (the “Belvedere Place Loan”), is secured by a first mortgage lien on the borrower’s fee simple interest in a two-building, multi-tenant office campus and two adjoining structured parking garages (the “Belvedere Place Property”), situated on a 10.7-acre site approximately 15 miles north of San Francisco, in Marin County, California. The Belvedere Place Loan is part of a whole loan that has an aggregate outstanding principal balance as of the Cut-off Date of $44.0 million (the “Belvedere Place Whole Loan”) and is comprised of twopari passu notes, each as described in the “Whole Loan Summary” chart below. The controlling Note A-1, with an aggregate outstanding principal balance as of the Cut-off Date of $32.75 million, is being contributed to the JPMDB 2019-COR6 Trust. The non-controlling Note A-2, with an aggregate outstanding principal balance as of the Cut-off Date of $11.25 million, is held by LCM or an affiliate and expected to be contributed to one or more future securitizations or may otherwise be transferred at any time. The relationship between the holders of the Belvedere Place Whole Loan will be governed by a co-lender agreement as described under “Description of the Mortgage Pool—The Whole Loans—The Serviced Pari Passu Whole Loans” in the Preliminary Prospectus. The Belvedere Place Loan has a 10-year term and will be interest only for the entire term.
| Whole Loan Summary |
| Note | Original Balance | Cut-off Date Balance | Note Holder | Controlling Piece |
| A-1 | $32,750,000 | $32,750,000 | JPMDB 2019-COR6 | Yes |
| A-2 | 11,250,000 | 11,250,000 | LCM | No |
| Total | $44,000,000 | $44,000,000 | | |
The Borrower. The borrowing entity is Belvedere Place Property Owner LLC, a Delaware limited liability company and special purpose entity structured to be bankruptcy remote with two independent directors. Legal counsel to the borrower delivered a non-consolidation opinion in connection with the origination of the Belvedere Place Whole Loan.
The Loan Sponsors.The loan sponsors and nonrecourse carve-out guarantors are Mark R. Hamilton, Anthony O. Zanze, Kurt E. Houtkooper, and David P. Messing, on a joint and several basis. Mr. Hamilton, Mr. Zanze, Mr. Houtkooper, and Mr. Messing are the principals of Graham Street Realty, a commercial real estate investment company founded in 2007 and based in San Francisco, which focuses on multi-tenant office buildings.
The loan sponsors acquired the Belvedere Place Property in conjunction with loan closing for approximately $67.1 million. In addition to the purchase price of $67.1 million, the loan sponsors were responsible for the payment of approximately $3.1 million in rent abatements and leasing commissions, increasing the effective purchase price to approximately $70.2 million. The prior owner, a joint-venture between privately-held investment advisor Angelo, Gordon & Co. and ScanlanKemperBard Companies, acquired the Belvedere Place Property in a November 2016 off-market transaction for $46.8 million. After acquiring the Belvedere Place Property, the prior owner invested over $6.1 million in tenant improvements and interior/exterior renovations in order to enhance the Class A office product to a level that would appeal to creative office users.
The Property.The Belvedere Place Property is comprised of two adjacent, three-story, Class A suburban office buildings totaling 102,502 square feet and two adjoining structured parking garages located Mill Valley, Marin County, California. Originally constructed in 2000, the Belvedere Place Property consists of 12 office suites within two institutional quality buildings featuring best-in-class construction and tenant buildouts, direct-access garage parking, and recently renovated lobbies with 20-foot ceilings and expansive window lines offering tenants panoramic views of Mount Tamalpais and the surrounding hills above the North Bay. The Belvedere Place Property is well parked, including 411 stalls (a combined parking ratio of 3.9 per 1,000 square feet) featuring a three level structured garage in addition to the asphalt paved surface parking
The Belvedere Place Property is currently 100.0% leased and occupied by eight tenants on a full-service gross basis, with a weighted-average underwritten base rent of $67.32 per square foot and remaining term of 8.2 years as of the underwritten rent roll dated August 9, 2019.
The largest tenant is WeWork (46,116 square feet, 45.0% of net rentable area; 46.2% of underwritten base rent). WeWork provides furnished and fully-serviced shared workspaces, primarily to small and midmarket enterprises. WeWork has been a tenant since 2018 and has a lease expiration of December 2030 with two, five-year renewal options remaining and no termination options. WeWork currently pays a weighted average underwritten base rent equal to $69.18 per square foot, which escalates 2.5% per annum across two coterminous leases. WeWork is currently in occupancy of 20,838 square feet and they are in the process of completing tenant improvement work on the remaining 25,278 square foot space that has been delivered to them. WeWork is expected to take occupancy of the 25,278 square foot space by March 2020, for which they are currently in a free rent period. The borrower reserved $316,522 at origination of the Belvedere Place Loan for the remaining free rent period. The Belvedere Place Property represents WeWork’s only location in the Marin County area, which is a growing market for WeWork due to an older and more affluent demographic in the Marin County area.
| THE INFORMATION IN THIS STRUCTURAL AND COLLATERAL TERM SHEET IS NOT COMPLETE AND MAY BE AMENDED PRIOR TO THE TIME OF SALE. THIS TERM SHEET IS NOT AN OFFER TO SELL THESE SECURITIES AND IT IS NOT A SOLICITATION OF AN OFFER TO BUY THESE SECURITIES IN ANY JURISDICTION WHERE THE OFFER OR SALE IS NOT PERMITTED. |
| |
| | 123 of 145 | |
| Structural and Collateral Term Sheet | | JPMDB 2019-COR6 |
| |
| Belvedere Place |
The second largest tenant at the Belvedere Place Property is Redwood Trust, Inc. (“Redwood”) (21,370 square feet; 20.8% of net rentable area; 20.3% of underwritten base rent; publicly traded on the NYSE as RWT). Founded in 1994 and headquartered at the Belvedere Place Property, Redwood is a publicly traded specialty finance company focused on making credit-sensitive investments in residential mortgages/related assets and engaging in mortgage banking activities. Redwood has been a tenant since2012 and has a lease expiration of May 2028 with one, five-year renewal option remaining and no termination options. Redwood currently pays underwritten base rent equal to $65.57 per square foot, which escalates 3% per annum.
The third largest tenant at the Belvedere Place Property is Merrill Lynch (18,450 square feet; 18.0% of net rentable area; 17.6% of underwritten base rent, rated AA-/A+ by Fitch/S&P). Founded in 1914, Merrill Lynch handles over $1.2 trillion in assets from clients in countries world-wide and employs over 15,000 financial advisors. Merrill Lynch has been a tenant since 2005 and has a lease expiration ofJune 2022 with two, five-year renewal options remaining and no termination options.Merrill Lynch currently pays underwritten base rent equal to $65.76 per square foot, which escalates 3% per annum. The underwritten base rent of $65.76 per square foot is based on average rent over the loan term.
The Market.The Belvedere Place Property is located within the Corte Madera/Mill Valley submarket, which represents the smallest among three office submarkets comprising the overall San Rafael office market. The Belvedere Place Property is the only Class A property in the submarket. According to the U.S. Census Bureau, there is a population of approximately 109,000 people within a five-mile radius of the Belvedere Place Property, which accounts for approximately 42% of the overall Marin County population. Across 192 cities nationwide with populations of 10,000 to 150,000 people, Mill Valley ranked as the 12th best “beach city” to live in in the U.S. and the 5th best in California, as of June 25, 2019, per a third party ranking. In addition, Mill Valley was ranked as the best city in California for education, health and safety. The combination of Mill Valley's idyllic location nestled beneath Mount Tamalpais and proximate to coastal communities such as Stinson Beach, coupled with its relative ease of access to San Francisco has made it a popular home for many high-income commuters.
According a third party market report, as of the fourth quarter of 2019, the Corte Madera/Mill Valley office submarket consisted of approximately 2.2 million rentable square feet of office space with an overall vacancy rate of 7.4% and average rents of $46.72 per square foot. The appraisal identified six comparable office leases in the Belvedere Place Property’s office market leasing assumption category ranging in size from 29,430 square feet to 84,482 square feet. Base rents for the comparable office leases ranged from $54.00 per square foot to $78.00 per square foot, with a weighted average of approximately $67.65 per square foot. All of the comparable leases identified by the appraisal are structured as full service leases. Per the underwritten rent roll dated as of August 9, 2019, in-place tenants are paying an average $67.32 per square foot on a modified gross basis, inclusive of the average rent over the lease term for Merrill Lynch and UBS. The appraisal concluded a market rent of $69.00 per square foot on a full service gross basis which is slightly above the Belvedere Place Property’s weighted average base rent.
Historical and Current Occupancy(1) |
| 2016(2) | 2017(3) | 2018(3) | Current(4) |
| N/A | 59.9% | 72.5% | 100.0% |
| (1) | Historical Occupancies are as of December 31 of eachrespective year. |
| (2) | 2016 Occupancy is not available as the Belvedere Place Property was acquired by the prior owner in November 2016. |
| (3) | 2017 and 2018 Occupancies are reflective of ongoing renovations in 2018 by the prior owner. |
| (4) | Current Occupancy is as of the rent roll dated August 9, 2019. |
| THE INFORMATION IN THIS STRUCTURAL AND COLLATERAL TERM SHEET IS NOT COMPLETE AND MAY BE AMENDED PRIOR TO THE TIME OF SALE. THIS TERM SHEET IS NOT AN OFFER TO SELL THESE SECURITIES AND IT IS NOT A SOLICITATION OF AN OFFER TO BUY THESE SECURITIES IN ANY JURISDICTION WHERE THE OFFER OR SALE IS NOT PERMITTED. |
| |
| | 124 of 145 | |
| Structural and Collateral Term Sheet | | JPMDB 2019-COR6 |
| |
| Belvedere Place |
| Tenant Summary(1) |
| Tenant | Ratings
Moody’s/Fitch/S&P(2) | Net Rentable
Area (SF) | % of
Total NRA | Base Rent
PSF(3) | % of Total
Base Rent(3) | Lease
Expiration Date |
| WeWork(4) | NR / CCC / B- | 46,116 | 45.0% | $69.18 | 46.2% | 12/31/2030 |
| Redwood(4) | NR / NR / NR | 21,370 | 20.8% | $65.57 | 20.3% | 5/31/2028 |
| Merrill Lynch(4) | NR / AA- / A+ | 18,450 | 18.0% | $65.76 | 17.6% | 6/30/2022 |
| UBS(4) | Aa3 / NR / NR | 7,107 | 6.9% | $61.35 | 6.3% | 3/31/2027 |
| RW Baird(4) | NR / NR / NR | 4,195 | 4.1% | $70.43 | 4.3% | 10/31/2024 |
| Spitfire(4) | NR / NR / NR | 2,404 | 2.3% | $71.93 | 2.5% | 3/31/2025 |
| Relevant Wealth Advisors(4) | NR / NR / NR | 2,155 | 2.1% | $71.07 | 2.2% | 1/31/2024 |
| IvanGems | NR / NR / NR | 705 | 0.7% | $53.87 | 0.6% | 1/15/2023 |
| Total Occupied Space | | 102,502 | 100.0% | $67.32 | 100.0% | |
| Vacant | | 0 | 0.0% | | | |
| Total | | 102,502 | 100.0% | | | |
| (1) | Based on the underwritten rent roll dated as of August 9, 2019. |
| (2) | In certain instances, ratings provided are those of the parent company of the entity shown, whether or not the parent company guarantees the lease. |
| (3) | Base Rent includes approximately $93,627 in contractual rent steps through August 2020 for certain tenants, approximately $38,859 of average rent over the loan term for Merrill Lynch and approximately $15,287 of average rent over the loan term for UBS. |
| (4) | WeWork has two, five-year renewal options remaining, Redwood has one, five-year renewal option remaining, Merrill Lynch has two, five-year renewal options remaining, UBS has two, five-year renewal options remaining, RW Baird has one, five-year renewal option remaining, Spitfire has one, five-year renewal option remaining, and Relevant Wealth Advisors has one, five-year renewal option remaining. |
Lease Rollover Schedule(1) |
| Year | Number of
Leases
Expiring | Net
Rentable
Area
Expiring | % of
NRA
Expiring | Base Rent Expiring(2) | % of Base
Rent
Expiring(2) | Cumulative
Net Rentable
Area
Expiring | Cumulative
% of NRA
Expiring | Cumulative
Base Rent
Expiring(2) | Cumulative
% of Base
Rent
Expiring(2) |
| Vacant | NAP | 0 | 0.0% | NAP | NAP | 0 | 0.0% | NAP | NAP |
| 2019 & MTM | 0 | 0 | 0.0% | $0 | 0.0% | 0 | 0.0% | $0 | 0.0% |
| 2020 | 0 | 0 | 0.0% | 0 | 0.0% | 0 | 0.0% | $0 | 0.0% |
| 2021 | 0 | 0 | 0.0% | 0 | 0.0% | 0 | 0.0% | $0 | 0.0% |
| 2022 | 1 | 18,450 | 18.0% | 1,213,216 | 17.6% | 18,450 | 18.0% | $1,213,216 | 17.6% |
| 2023 | 1 | 705 | 0.7% | 37,977 | 0.6% | 19,155 | 18.7% | $1,251,193 | 18.1% |
| 2024 | 2 | 6,350 | 6.2% | 448,604 | 6.5% | 25,505 | 24.9% | $1,699,798 | 24.6% |
| 2025 | 1 | 2,404 | 2.3% | 172,917 | 2.5% | 27,909 | 27.2% | $1,872,715 | 27.1% |
| 2026 | 0 | 0 | 0.0% | 0 | 0.0% | 27,909 | 27.2% | $1,872,715 | 27.1% |
| 2027 | 1 | 7,107 | 6.9% | 436,009 | 6.3% | 35,016 | 34.2% | $2,308,724 | 33.5% |
| 2028 | 1 | 21,370 | 20.8% | 1,401,160 | 20.3% | 56,386 | 55.0% | $3,709,884 | 53.8% |
| 2029 | 0 | 0 | 0.0% | 0 | 0.0% | 56,386 | 55.0% | $3,709,884 | 53.8% |
| 2030 & Beyond | 1 | 46,116 | 45.0% | 3,190,159 | 46.2% | 102,502 | 100.0% | $6,900,043 | 100.0% |
| Total | 8 | 102,502 | 100.0% | $6,900,043 | 100.0% | | | | |
| (1) | Based on the underwritten rent roll dated August 9, 2019. |
| (2) | Base Rent expiring includes approximately $93,627 in contractual rent steps through August 2020 for certain tenants, approximately $38,859 of average rent over the loan term for Merrill Lynch and approximately $15,287 of average rent over the loan term for UBS. |
| THE INFORMATION IN THIS STRUCTURAL AND COLLATERAL TERM SHEET IS NOT COMPLETE AND MAY BE AMENDED PRIOR TO THE TIME OF SALE. THIS TERM SHEET IS NOT AN OFFER TO SELL THESE SECURITIES AND IT IS NOT A SOLICITATION OF AN OFFER TO BUY THESE SECURITIES IN ANY JURISDICTION WHERE THE OFFER OR SALE IS NOT PERMITTED. |
| |
| | 125 of 145 | |
| Structural and Collateral Term Sheet | | JPMDB 2019-COR6 |
| |
| Belvedere Place |
| Operating History and Underwritten Net Cash Flow |
| | 2017 | 2018 | TTM(1) | Underwritten | Per Square
Foot | %(2) |
| Rents in Place | $2,496,625 | $4,032,037 | $4,551,564 | $6,752,269 | $65.87 | 95.9% |
| Straight Line Rent(3) | 0 | 0 | 0 | 54,147 | 0.53 | 0.8% |
| Contractual Rent Steps(4) | 0 | 0 | 0 | 93,627 | 0.91 | 1.3% |
| Vacant Income | 0 | 0 | 0 | 0 | 0.00 | 0.0% |
| Gross Potential Rent | $2,496,625 | $4,032,037 | $4,551,564 | $6,900,043 | $67.32 | 98.0% |
| Total Reimbursements | 40,174 | 44,831 | 33,528 | 75,235 | 0.73 | 1.1% |
| Total Other Income(5) | 60,000 | 76,546 | 67,023 | 63,654 | 0.62 | 0.9% |
| Net Rental Income | $2,596,799 | $4,153,415 | $4,652,115 | $7,038,932 | $68.67 | 100.0% |
| (Vacancy/Credit Loss) | 0 | 0 | 0 | (558,022) | (5.44) | (7.9)% |
| Effective Gross Income | $2,596,799 | $4,153,415 | $4,652,115 | $6,480,910 | $63.23 | 92.1% |
| | | | | | | |
| Total Expenses | $1,575,004 | $1,695,234 | $1,764,525 | $1,897,439 | $18.51 | 29.3% |
| | | | | | | |
| Net Operating Income(6) | $1,021,795 | $2,458,181 | $2,887,590 | $4,583,471 | $44.72 | 70.7% |
| | | | | | | |
| Total TI/LC, CapEx/RR | 0 | 0 | 0 | 452,034 | 4.41 | 7.0% |
| | | | | | | |
| Net Cash Flow | $1,021,795 | $2,458,181 | $2,887,590 | $4,131,437 | $40.31 | 63.7% |
| (1) | TTM column represents the trailing 12-month period ending May 31, 2019. |
| (2) | % column represents percent of Net Rental Income for all revenue lines and represents percent of Effective Gross Income for the remainder of the fields. |
| (3) | Based on the average rent over the loan term for Merrill Lynch and UBS. |
| (4) | Based on the contractual rent steps through August 2020 for certain tenants. |
| (5) | Total Other Income includes parking income ($63,654). |
| (6) | The increase from TTM Net Operating Income to Underwritten Net Operating Income is primarily attributable to (i) the Belvedere Place Property’s renovation that was completed in 2018 by the prior owner and the subsequent lease up from 72.5% occupancy in 2018 to 100.0% current occupancy, (ii) approximately $54,146 of average rent over the loan term for Merrill Lynch and UBS, (iii) and approximately $93,627 in contractual rent steps through August 2020 for certain tenants. |
Property Management.The Belvedere Place Property is managed by Paramount Property Company Ltd., an affiliate of the borrower.
| THE INFORMATION IN THIS STRUCTURAL AND COLLATERAL TERM SHEET IS NOT COMPLETE AND MAY BE AMENDED PRIOR TO THE TIME OF SALE. THIS TERM SHEET IS NOT AN OFFER TO SELL THESE SECURITIES AND IT IS NOT A SOLICITATION OF AN OFFER TO BUY THESE SECURITIES IN ANY JURISDICTION WHERE THE OFFER OR SALE IS NOT PERMITTED. |
| |
| | 126 of 145 | |
| Structural and Collateral Term Sheet | JPMDB 2019-COR6 |
[THIS PAGE INTENTIONALLY LEFT BLANK]
| THE INFORMATION IN THIS STRUCTURAL AND COLLATERAL TERM SHEET IS NOT COMPLETE AND MAY BE AMENDED PRIOR TO THE TIME OF SALE. THIS TERM SHEET IS NOT AN OFFER TO SELL THESE SECURITIES AND IT IS NOT A SOLICITATION OF AN OFFER TO BUY THESE SECURITIES IN ANY JURISDICTION WHERE THE OFFER OR SALE IS NOT PERMITTED. |
| |
| | 127 of 145 | |
| Structural and Collateral Term Sheet | | JPMDB 2019-COR6 |
| |
| Union Heights |
| Mortgage Loan Information | | Property Information |
| Mortgage Loan Seller: | LCM | | Single Asset / Portfolio: | Single Asset |
| Original Principal Balance: | $29,600,000 | | Title: | Fee |
| Cut-off Date Principal Balance: | $29,600,000 | | Property Type - Subtype: | Office – Suburban |
| % of Pool by IPB: | 3.7% | | Net Rentable Area (SF): | 142,899 |
| Loan Purpose: | Refinance | | Location: | Sandy, UT |
| Borrowers: | Raddon Union Heights Office | | Year Built / Renovated: | 2007 / N/A |
| | Owner, LLC, Raddon 49, LLC | | Occupancy(1): | 88.2% |
| Sponsor: | Ronald A. Raddon | | Occupancy Date: | 6/30/2019 |
| Interest Rate: | 3.75000% | | Number of Tenants(1): | 10 |
| Note Date: | 8/22/2019 | | 2016 NOI: | $2,016,508 |
| Maturity Date: | 9/6/2029 | | 2017 NOI: | $2,451,070 |
| Interest-only Period: | 60 months | | 2018 NOI: | $2,817,090 |
| Original Term: | 120 months | | TTM NOI (as of 5/2019): | $3,018,000 |
| Original Amortization: | 360 months | | UW Economic Occupancy: | 88.6% |
| Amortization Type: | IO-Balloon | | UW Revenues: | $3,951,732 |
| Call Protection: | L(26),Def(90),O(4) | | UW Expenses: | $1,136,066 |
| Lockbox / Cash Management: | Hard / Springing | | UW NOI: | $2,815,666 |
| Additional Debt: | N/A | | UW NCF: | $2,592,054 |
| Additional Debt Balance: | N/A | | Appraised Value / Per SF: | $43,900,000 / $307 |
| Additional Debt Type: | N/A | | Appraisal Date: | 7/29/2019 |
| | | | | |
| Escrows and Reserves | | Financial Information |
| | Initial | Monthly | Initial Cap | | Cut-off Date Loan / SF: | $207 | |
| Taxes: | $375,000 | $30,920 | N/A | | Maturity Date Loan / SF: | $187 | |
| Insurance: | $13,000 | $2,600 | N/A | | Cut-off Date LTV: | 67.4% | |
| Replacement Reserves: | $0 | $2,977 | N/A | | Maturity Date LTV: | 60.9% | |
| TI/LC: | $1,078,730 | $20,244 | N/A | | UW NCF DSCR: | 1.58x | |
| Other: | $0 | $0 | N/A | | UW NOI Debt Yield: | 9.5% | |
| | | | | | | |
|
| Sources and Uses |
| Sources | Proceeds | % of Total | | Uses | Proceeds | % of Total |
| Mortgage Loan | $29,600,000 | 100.0% | | Payoff Existing Debt | $23,561,174 | 79.6% |
| | | | | Upfront Reserves | 1,466,730 | 5.0% |
| | | | | Closing Costs | 542,274 | 1.8% |
| | | | | Return of Equity | 4,029,822 | 13.6% |
| Total Sources | $29,600,000 | 100.0% | | Total Uses | $29,600,000 | 100.0% |
| | | | | | | | |
| (1) | Occupancy excludes Corporate Alliance of Utah, which leased 6,622 square feet at the Union Heights Property (4.6% of net rentable area) through September 30, 2019 and vacated. |
| THE INFORMATION IN THIS STRUCTURAL AND COLLATERAL TERM SHEET IS NOT COMPLETE AND MAY BE AMENDED PRIOR TO THE TIME OF SALE. THIS TERM SHEET IS NOT AN OFFER TO SELL THESE SECURITIES AND IT IS NOT A SOLICITATION OF AN OFFER TO BUY THESE SECURITIES IN ANY JURISDICTION WHERE THE OFFER OR SALE IS NOT PERMITTED. |
| |
| | 128 of 145 | |
| Structural and Collateral Term Sheet | | JPMDB 2019-COR6 |
| |
| Union Heights |
The Loan.The Union Heights loan, with a principal balance of $29.6 million as of the Cut-off Date (the “Union Heights Loan”), is secured by a first mortgage lien on the borrowers’ fee simple interest in a six-story, Class A office condominium unit comprised of 142,899 square feet of net rentable area (the “Union Heights Property”), which is within the Union Heights mixed use development (the
“Union Heights Development”) located in Sandy, Utah. The Union Heights Loan has a 10-year term and, following a five-year interest-only period, will amortize on a 30-year schedule.
The Borrowers. The borrowing entities are Raddon Union Heights Office Owner, LLC, a Utah limited liability company, and Raddon 49, LLC, a Delaware limited liability company, as tenants-in-common, each a special purpose entity structured to be bankruptcy remote with one independent director. Legal counsel to the borrowers delivered a non-consolidation opinion in connection with the origination of the Union Heights Loan.
The Loan Sponsor.The loan sponsor and nonrecourse carve-out guarantor is Ronald A. Raddon. Mr. Raddon is the founder and Chief Executive Officer of Raddon Companies, a diversified commercial real estate firm based in Draper Utah, which was founded 40 years ago. Mr. Raddon has built several award winning commercial and residential projects throughout Utah and Raddon Companies’ current portfolio includes five office properties in Utah. For the past 15 years, Mr. Raddon has focused on commercial development, constructing over 1.5 million square feet of retail and office space.
The Property.The Union Heights Property is a six-story, Class A office condominium unit comprised of 142,899 square feet of net rentable area located in Sandy, Utah. Built in 2007 by the loan sponsor, the Union Heights Development is a mixed-use development comprised of six individual condominium units and one parking unit. The retail component of the Union Heights Development totals approximately 93,526 square feet (not collateral and owned by a third party) and includes a Century 16 movie theatre, several restaurants, and in-line retail tenants, providing tenants with multiple entertainment, retail and dining amenities within a very short walk. Parking at the Union Heights Property is provided via a reciprocal easement agreement with the adjacent Union Heights Development’s retail component and a shared three-story parking garage for a total of 654 parking spaces (4.58 spaces per 1,000 square feet) excluding the 213 additional surface parking spaces that are dedicated to the retail component. Other immediate uses surrounding the Union Heights Property include additional retail directly behind the Union Heights Property anchored by Macey’s grocery store, a retail corridor less than one-mile north of the Union Heights Property anchored by a Walmart Supercenter, Dick’s Sporting Goods, the Home Depot, and Target, the Ridge Apartments directly east across Union Park from the Union Heights Property, and several single-family homes. The Union Heights Property has main building entrances located at the north and south elevations through double glass doors, each leading to the central lobby area. First floor tenants have glass partition walls adjoining the lobby. The lobby area has granite tile floors, stained wood, and stainless steel walls with high-end decorative lighting.
The Union Heights Development is divided into six individual condominium units and one parking unit, one of which is the Union Heights Property. Control of the condominium resides with a three to five-member board of managers designated by each condominium owner. The borrower or an affiliate of the borrower owns one of the seven units and has 11.05% interest in the condominium. All decisions and actions by the board require a vote of one or more of the managers representing more than 67%. No amendment may materially and adversely affect the rights of an owner without the written consent of such owner and any permitted lender of such owner’s unit.
The Union Heights Property is currently 88.2% leased by a diverse mix of 10 national, regional, and local tenants. The largest three tenants occupy 54.6% of net rentable area and consist of Green River Capital LLC and Red Bell Real Estate, LLC (“Green River”) (33,280 square feet, 23.3% of net rentable area), Zions Bank, N.A. (“Zions Bank”) (28,546 square feet, 20.0% of net rentable area), and Performance Matters LLC (“Performance Matters”) (16,160 square feet, 11.3% of net rentable area). No other tenant occupies more than 9.8% net rentable area. All leases are structured on a full-service gross basis with tenants required to reimburse the borrower for their pro rata share of operating expenses over a base year stop. The Union Heights Property’s in-place tenants reflect an average tenancy length of 6.8 years and approximately 53.6% of the net rentable area has extended or exercised renewal options.
The Market.The Union Heights Property is located in the community of Midvale, along Union Park Avenue. Interstate 215, a belt route through the Salt Lake Valley, is located less than two miles north of the Union Heights Property. Interstate 215 provides access to Interstate 15 and Interstate 80, the major north/south and east/west highways through Utah, respectively. Interstate 15, the primary north/south transportation corridor through the state, is five miles west of the Union Heights Property. The central business district of downtown Salt Lake City is approximately 15 miles northwest of the Union Heights Property. According to the appraisal, Salt Lake County has a higher level of household income than median household income in Utah with median household income of $75,190, which is 4.1% greater than the corresponding figure for Utah. The Union Heights Property is located within the Central East submarket, which is an established submarket with no known major construction projects.
| THE INFORMATION IN THIS STRUCTURAL AND COLLATERAL TERM SHEET IS NOT COMPLETE AND MAY BE AMENDED PRIOR TO THE TIME OF SALE. THIS TERM SHEET IS NOT AN OFFER TO SELL THESE SECURITIES AND IT IS NOT A SOLICITATION OF AN OFFER TO BUY THESE SECURITIES IN ANY JURISDICTION WHERE THE OFFER OR SALE IS NOT PERMITTED. |
| |
| | 129 of 145 | |
| Structural and Collateral Term Sheet | | JPMDB 2019-COR6 |
| |
| Union Heights |
According to the appraisal, the Union Heights Property is located in the Central East submarket within the Union Park District office submarket. According to a third party market report, as of the fourth quarter of 2019, the Union Park District office submarket consisted of approximately four million rentable square feet of office space with an overall vacancy rate of 6.6% and average rents of $21.46 per square foot. The appraisal identified nine comparable office leases in Salt Lake county ranging in size from 2,301 square feet of leased area to 27,815 square feet of leased area. Base rents for the comparable office leases ranged from $21.50 per square foot to $34.00 per square foot, with a weighted average of approximately $27.74 per square foot. Seven of the comparable leases identified by the appraisal are structured as full service leases and two comparable leases are on a triple net basis. Per the underwritten rent roll dated as of June 30, 2019, in-place tenants are paying an average $28.86 per square foot on a modified gross basis, inclusive of the average rent over the lease term for Zions Bank. The appraisal concluded a market rent of $28.50 per square foot on a full service gross basis which is in line with the Union Heights Property’s weighted average base rent.
| Historical and Current Occupancy(1) |
| 2016 | 2017 | 2018 | Current(2)(3) |
| 93.2% | 93.2% | 91.9% | 88.2% |
| (1) | Historical Occupancies are as of December 31 of eachrespective year. |
| (2) | Current Occupancy is as of the rent rolls dated June 30, 2019. |
| (3) | Occupancy excludes Corporate Alliance of Utah, which leased 6,622 square feet at the Union Heights Property (4.6% of net rentable area) through September 30, 2019 and vacated. |
| Tenant Summary(1) |
| Tenant | Ratings
Moody’s/Fitch/S&P(2) | Net Rentable
Area (SF) | % of
Total NRA | Base Rent PSF(3)(4) | % of Total
Base Rent(3)(4) | Lease
Expiration Date |
| Green River(5) | NR / NR / NR | 33,280 | 23.3% | $27.86 | 25.5% | 8/31/2024 |
| Zions Bank | Baa2 / BBB / BBB+ | 28,546 | 20.0% | $30.28 | 23.8% | Various(6) |
| Performance Matters(5) | NR / NR / NR | 16,160 | 11.3% | $29.83 | 13.3% | 11/30/2021 |
| Coldwell Banker Residential(5) | NR / NR / NR | 13,987 | 9.8% | $27.81 | 10.7% | 10/31/2023 |
| Veritas Funding | NR / NR / NR | 13,016 | 9.1% | $27.26 | 9.8% | 5/31/2023 |
| Ameriprise Financial Services(5) | NR / NR / NR | 9,054 | 6.3% | $28.33 | 7.1% | 6/30/2022 |
| First American Title Company(5) | NR / NR / NR | 4,630 | 3.2% | $29.58 | 3.8% | 10/31/2023 |
| Guaranteed Rate | NR / NR / NR | 3,519 | 2.5% | $30.77 | 3.0% | 2/28/2023 |
| D.A. Davidson & Co. | NR / NR / NR | 2,734 | 1.9% | $30.72 | 2.3% | 1/31/2021 |
| Dennis Astill | NR / NR / NR | 1,125 | 0.8% | $30.24 | 0.9% | 6/30/2023 |
| Total Occupied Space | | 126,051 | 88.2% | $28.86 | 100.0% | |
| Vacant | | 16,848 | 11.8% | | | |
| Total | | 142,899 | 100.0% | | | |
| (1) | Based on the underwritten rent roll dated as of June 30, 2019. |
| (2) | In certain instances, ratings provided are those of the parent company of the entity shown, whether or not the parent company guarantees the lease. |
| (3) | Base rent includes average rent over the lease term of $24,483 for Zions Bank’s 16,667 square foot space. |
| (4) | Base Rent includes approximately $89,684 in contractual rent steps through October 2020 for certain tenants. |
| (5) | Green River has two, five-year renewal options remaining, Performance Matters has one, five-year renewal option remaining, Coldwell Banker Residential has one, five-year renewal option remaining, Ameriprise Financial Services has two, three-year renewal option remaining, and First American Title Company has one, five-year renewal option remaining. |
| (6) | Zions Bank leases 16,667 square feet through May 2023 and 11,879 square feet through March 2021. |
| THE INFORMATION IN THIS STRUCTURAL AND COLLATERAL TERM SHEET IS NOT COMPLETE AND MAY BE AMENDED PRIOR TO THE TIME OF SALE. THIS TERM SHEET IS NOT AN OFFER TO SELL THESE SECURITIES AND IT IS NOT A SOLICITATION OF AN OFFER TO BUY THESE SECURITIES IN ANY JURISDICTION WHERE THE OFFER OR SALE IS NOT PERMITTED. |
| |
| | 130 of 145 | |
| Structural and Collateral Term Sheet | | JPMDB 2019-COR6 |
| |
| Union Heights |
| Lease Rollover Schedule(1)(2) |
| Year | Number
of Leases
Expiring | Net
Rentable
Area
Expiring | % of
NRA
Expiring | Base Rent
Expiring(3)(4) | % of Base
Rent
Expiring(3)(4) | Cumulative
Net
Rentable
Area
Expiring | Cumulative
% of NRA
Expiring | Cumulative
Base Rent
Expiring(3)(4) | Cumulative
% of Base
Rent
Expiring(3)(4) |
| Vacant | NAP | 16,848 | 12.0% | NAP | NAP | 16,848 | 11.8% | NAP | NAP |
| 2019 & MTM | 0 | 0 | 0.0% | $0 | 0.0% | 16,848 | 11.8% | $0 | 0.0% |
| 2020 | 0 | 0 | 0.0% | 0 | 0.0% | 16,848 | 11.8% | $0 | 0.0% |
| 2021 | 3 | 30,773 | 21.5% | 916,609 | 25.2% | 47,621 | 33.3% | 916,609 | 25.2% |
| 2022 | 1 | 9,054 | 6.3% | 256,500 | 7.1% | 56,675 | 39.7% | $1,173,108 | 32.3% |
| 2023 | 6 | 52,944 | 37.0% | 1,536,854 | 42.3% | 109,619 | 76.7% | $2,709,963 | 74.5% |
| 2024 | 1 | 33,280 | 23.3% | 927,332 | 25.5% | 142,899 | 100.0% | $3,637,295 | 100.0% |
| 2025 | 0 | 0 | 0.0% | 0 | 0.0% | 142,899 | 100.0% | $3,637,295 | 100.0% |
| 2026 | 0 | 0 | 0.0% | 0 | 0.0% | 142,899 | 100.0% | $3,637,295 | 100.0% |
| 2027 | 0 | 0 | 0.0% | 0 | 0.0% | 142,899 | 100.0% | $3,637,295 | 100.0% |
| 2028 | 0 | 0 | 0.0% | 0 | 0.0% | 142,899 | 100.0% | $3,637,295 | 100.0% |
| 2029 | 0 | 0 | 0.0% | 0 | 0.0% | 142,899 | 100.0% | $3,637,295 | 100.0% |
| 2030 & Beyond | 0 | 0 | 0.0% | 0 | 0.0% | 142,899 | 100.0% | $3,637,295 | 100.0% |
| Total | 11 | 142,899 | 100.0% | $3,637,295 | 100.0% | | | | |
| | | | | | | | | | |
| (1) | Based on the underwritten rent roll dated as of June 30, 2019. |
| (2) | Certain tenants have lease termination options that may become exercisable prior to the originally stated expiration date of the tenant lease and that are not considered in the lease rollover schedule. |
| (3) | Base Rent Expiring includes average rent over the lease term of $24,483 for Zions Bank’s 16,667 square foot space. |
| (4) | Base Rent Expiring includes approximately $89,684 in contractual rent steps through October 2020 for certain tenants. |
| Operating History and Underwritten Net Cash Flow |
| | 2017 | 2018 | TTM(1) | Underwritten | Per Square
Foot | %(2) |
| Rents in Place | $3,205,791 | $3,684,602 | $3,882,761 | $3,033,784 | $21.23 | 68.5% |
| Straight Line Rent(3) | 0 | 0 | 0 | 513,827 | 3.60 | 11.6% |
| Contractual Rent Steps(4) | 0 | 0 | 0 | 89,684 | 0.63 | 2.0% |
| Vacant Income | 0 | 0 | 0 | 480,168 | 3.36 | 10.8% |
| Gross Potential Rent | $3,205,791 | $3,684,602 | $3,882,761 | $4,117,463 | $28.81 | 92.9% |
| Total Reimbursements | 245,562 | 110,261 | 84,626 | 97,492 | 0.7 | 2.2% |
| Total Other Income(5) | 58,558 | 58,091 | 59,062 | 216,945 | 1.52 | 4.9% |
| Net Rental Income | $3,509,911 | $3,852,954 | $4,026,449 | $4,431,900 | $31.01 | 100.0% |
| (Vacancy/Credit Loss) | 0 | 0 | 0 | (480,168) | (3.36) | (10.8)% |
| Effective Gross Income | $3,509,911 | $3,852,954 | $4,026,449 | $3,951,732 | $27.65 | 89.2% |
| | | | | | | |
| Total Expenses | $1,058,841 | $1,035,864 | $1,008,449 | $1,136,066 | $7.95 | 28.7% |
| | | | | | | |
| Net Operating Income | $2,451,070 | $2,817,090 | $3,018,000 | $2,815,666 | $19.70 | 71.3% |
| | | | | | | |
| Total TI/LC, CapEx/RR | 0 | 0 | 0 | 223,612 | 1.56 | 5.7% |
| | | | | | | |
| Net Cash Flow | $2,451,070 | $2,817,090 | $3,018,000 | $2,592,054 | $18.14 | 65.6% |
| | | | | | | |
| (1) | TTM column represents the trailing 12-month period ending May 31, 2019. |
| (2) | % column represents percent of Net Rental Income for all revenue lines and represents percent of Effective Gross Income for the remainder of the fields. |
| (3) | Based on the average rent over the lease term for Zions Bank’s 16,667 square foot space. |
| (4) | Based on the contractual rent steps through October 2020 for certain tenants. |
| (5) | Other income includes antenna income of $157,883. |
Property Management.The Union Heights Property is managed by Raddon Asset Services, a Utah limited liability company and an affiliate of the borrower.
| THE INFORMATION IN THIS STRUCTURAL AND COLLATERAL TERM SHEET IS NOT COMPLETE AND MAY BE AMENDED PRIOR TO THE TIME OF SALE. THIS TERM SHEET IS NOT AN OFFER TO SELL THESE SECURITIES AND IT IS NOT A SOLICITATION OF AN OFFER TO BUY THESE SECURITIES IN ANY JURISDICTION WHERE THE OFFER OR SALE IS NOT PERMITTED. |
| |
| | 131 of 145 | |
| Structural and Collateral Term Sheet | | JPMDB 2019-COR6 |
| |
| The Residence Inn by Marriott South Beach |
| Mortgage Loan Information | | Property Information |
| Mortgage Loan Seller: | LCM | | Single Asset / Portfolio: | Single Asset |
| Original Principal Balance: | $25,250,000 | | Title: | Fee |
| Cut-off Date Principal Balance: | $25,250,000 | | Property Type - Subtype: | Hotel – Extended Stay |
| % of Pool by IPB: | 3.1% | | Net Rentable Area (Rooms): | 116 |
| Loan Purpose: | Refinance | | Location: | Miami Beach, FL |
| Borrower: | Sobe 17 Owner, LLC | | Year Built / Renovated: | 2016 / N/A |
| Sponsors: | Richard Finvarb, Ronald Finvarb | | Occupancy/ADR/RevPAR: | 88.1% / $186.06 / $163.93 |
| Interest Rate: | 3.57100% | | Occupancy/ADR/RevPAR Date: | 8/31/2019 |
| Note Date: | 10/9/2019 | | Number of Tenants: | N/A |
| Maturity Date: | 11/6/2029 | | 2016 NOI(1): | N/A |
| Interest-only Period: | 120 months | | 2017 NOI: | $2,778,376 |
| Original Term: | 120 months | | 2018 NOI: | $3,027,389 |
| Original Amortization: | None | | TTM NOI (as of 8/2019): | $3,217,708 |
| Amortization Type: | Interest Only | | UW Occupancy/ADR/RevPAR: | 87.5% / $186.06 / $162.80 |
| Call Protection: | L(24),Def(92),O(4) | | UW Revenues: | $7,405,620 |
| Lockbox / Cash Management: | Hard / Springing | | UW Expenses: | $4,305,102 |
| Additional Debt: | N/A | | UW NOI: | $3,100,518 |
| Additional Debt Balance: | N/A | | UW NCF: | $2,730,237 |
| Additional Debt Type: | N/A | | Appraised Value / Per Room: | $48,000,000 / $413,793 |
| | | | Appraisal Date: | 9/1/2019 |
| | | | | |
| Escrows and Reserves | | Financial Information |
| | Initial | Monthly | Initial Cap | | Cut-off Date Loan / Room: | | $217,672 |
| Taxes(2): | $0 | Springing | N/A | | Maturity Date Loan / Room: | | $217,672 |
| Insurance(3): | $0 | Springing | N/A | | Cut-off Date LTV: | | 52.6% |
| FF&E Reserves(4): | $0 | Springing | N/A | | Maturity Date LTV: | | 52.6% |
| TI/LC: | $0 | $0 | N/A | | UW NCF DSCR: | | 2.99x |
| Other(5): | $6,250 | $0 | N/A | | UW NOI Debt Yield: | | 12.3% |
| | | | | | | | |
| |
| Sources and Uses |
| Sources | Proceeds | % of Total | | Uses | Proceeds | % of Total |
| Mortgage Loan | $25,250,000 | 100.0% | | Payoff Existing Debt | $22,594,056 | 89.5% |
| | | | | Closing Costs | 392,582 | 1.6% |
| | | | | Upfront Reserves | 6,250 | 0.0% |
| | | | | Return of Equity | 2,257,112 | 8.9% |
| Total Sources | $25,250,000 | 100.0% | | Total Uses | $25,250,000 | 100.0% |
| (1) | Full year 2016 financials are not available as The Residence Inn by Marriott South Beach Property (as defined below) opened mid-year 2016. |
| (2) | Tax reserves are waived so long as (i) no event of default, (ii) Marriott (as defined below) management agreement in full force and effect, (iii) Marriott remains fully responsible for the payment of real estate taxes, and (iv) evidence of payment provided to the lender prior to delinquency. |
| (3) | Insurance reserves are waived so long as (i) no event of default, (ii) Marriott has obtained such policies that are required under the loan agreement and (iii) insurance premiums are timely paid and evidence thereof is provided to the lender. |
| (4) | The monthly deposits into the FF&E Reserve are waived so long as (i) the management agreement with Marriott is in full force and effect and (ii) funds are being transferred into the manager FF&E reserve pursuant to the management agreement with Marriott. |
| (5) | Other reserves are made up of a deferred maintenance reserve in the amount of $6,250, which is 125% of the engineer’s immediate repairs estimate. |
| THE INFORMATION IN THIS STRUCTURAL AND COLLATERAL TERM SHEET IS NOT COMPLETE AND MAY BE AMENDED PRIOR TO THE TIME OF SALE. THIS TERM SHEET IS NOT AN OFFER TO SELL THESE SECURITIES AND IT IS NOT A SOLICITATION OF AN OFFER TO BUY THESE SECURITIES IN ANY JURISDICTION WHERE THE OFFER OR SALE IS NOT PERMITTED. |
| |
| | 132 of 145 | |
| Structural and Collateral Term Sheet | | JPMDB 2019-COR6 |
| |
| The Residence Inn by Marriott South Beach |
The Loan.The Residence Inn by Marriott South Beach mortgage loan (“The Residence Inn by Marriott South Beach Loan”) has an outstanding principal balance as of the Cut-off Date of $25.25 million and is secured by a first mortgage lien on the borrower’s fee simple interest in a 116-room, upscale extended-stay hotel, which opened in 2016, located in the South Beach area of Miami Beach, Florida (“The Residence Inn by Marriott South Beach Property”). The Residence Inn by Marriott South Beach Loan has a 10-year term and is interest-only for the full term of the loan.
The Borrower. The borrowing entity is Sobe 17 Owner, LLC, a Delaware limited liability company structured to be bankruptcy remote with one independent director.
The Loan Sponsors.The loan sponsors and nonrecourse carve-out guarantors are Richard Finvarb and Ronald Finvarb, on a joint and several basis. Richard and Ronald Finvarb are the principals of the Finvarb Group, a Miami based real estate development company founded over 40 years ago. The Finvarb Group’s consolidated hospitality portfolio consists of eight operating properties and one hotel under construction, eight of which are flagged by Marriott and four of which are located in the south Miami Beach area. Richard Finvarb has been developing successful real estate projects since 1974 and Ronald Finvarb previously served as Executive Director of Business & Legal Affairs for two publicly-traded companies, including a division of General Electric (NYSE: GE), and also for Cisnero Group, a large, privately-held media, entertainment, telecommunications, technology and consumer products organizations. The loan sponsors originally acquired the land of The Residence Inn by Marriott South Beach Property in 2013, which they subsequently developed for a cost of approximately $31.8 million.
The Property. The Residence Inn by Marriott South Beach Property was built in 2016 and has a total of 116 rooms. As of August 31, 2019, The Residence Inn by Marriott South Beach Property was 88.1% occupied. The Residence Inn by Marriott South Beach Property is a five-story building and is configured with 56 queen/queen bedrooms, 44 king bedrooms and 16 one-bedroom suite rooms. The ground floor contains the lobby, front desk, a 391 square foot meeting room, a business center, and a complimentary breakfast dining area. Immediately to the right of the entrance is a valet parking drop off, which leads to a 66-space underground parking garage, managed by USA Parking System. The Residence Inn by Marriott South Beach Property also includes a 655 square foot ground floor, retail space adjacent to the parking garage, which is currently vacant and being marketed at $100.00 per square foot on a triple net basis. Guestrooms feature a work desk and chair, one or two nightstands, a dresser, sofa chair, flat screen televisions, AM/FM radio stereo with an alarm clock, direct dial telephone with voice mail, hairdryer, iron/ironing board, in-room coffee/tea maker and complimentary wired and wireless high-speed internet access. In addition, suites provide a separate living area with a pull-out sofa. Hotel amenities include in-room kitchenettes, complimentary breakfast, a lobby with a 24-hour front desk, 391 square feet of meeting space as discussed prior, and a rooftop pool with panoramic views of South Beach and Biscayne Bay, Wi-Fi, fitness center, beach service and bike rental.
| Occupancy | ADR | RevPAR |
| 2016(1) | 2017 | 2018 | TTM(2) | 2016(1) | 2017 | 2018 | TTM(2) | 2016(1) | 2017 | 2018 | TTM(2) |
| N/A | 89.3% | 88.8% | 88.1% | N/A | $165.68 | $176.90 | $186.06 | N/A | $148.01 | $157.10 | $163.93 |
| (1) | Full year 2016 financials are not available as The Residence Inn by Marriott South Beach Property opened mid-year 2016. |
| (2) | TTM represents the trailing 12-month period ending August 31, 2019. |
The Market. The Residence Inn by Marriott South Beach Property is located in the City of Miami Beach, a 10-mile-long barrier island located off the east coast of Miami, separated from the mainland by the Intracoastal Waterway (Interstate 195) and Biscayne Bay. The City of Miami Beach is located in eastern Miami-Dade County, approximately five miles east of the Miami Central Business District, approximately 45 miles south of the Fort Lauderdale Central Business District and approximately 12 miles east of the Miami International Airport, one of the busiest airports in the world and the largest United States hub to Latin America and the Caribbean. The Residence Inn by Marriott South Beach Property is 1.5 blocks north of an upscale section of the Lincoln Road shopping district, which contains many shops including Anthropologie, John Varvatos, Steve Madden and Zara, as well as restaurants including Rosa Mexicano and Dolce Italian. Other nearby demand generators include the Miami Beach Convention Center, Miami Beach City Hall, New World Symphony, the Fillmore Miami Beach, and Sunset Harbour. Miami has consistently ranked as one of the top five lodging markets in the country due to its world-class tourism attractions and strategic location for international commerce.
According to the Greater Miami Convention and Visitors Bureau, over 3,200 hotel rooms and 23 hotels are planned for 2019, while 14,139 rooms and 78 hotels are currently in the pipeline at various construction/planning stages. At approximately 55,970 rooms in inventory today, the available rooms are expected to increase to approximately 65,000 by 2021. According to the appraisal, extended-stay hotels showed some of the strongest demand growth in maintaining occupancy above its long term average, despite new room construction adding more than 83,000 new rooms over the last three years.
| THE INFORMATION IN THIS STRUCTURAL AND COLLATERAL TERM SHEET IS NOT COMPLETE AND MAY BE AMENDED PRIOR TO THE TIME OF SALE. THIS TERM SHEET IS NOT AN OFFER TO SELL THESE SECURITIES AND IT IS NOT A SOLICITATION OF AN OFFER TO BUY THESE SECURITIES IN ANY JURISDICTION WHERE THE OFFER OR SALE IS NOT PERMITTED. |
| |
| | 133 of 145 | |
| Structural and Collateral Term Sheet | | JPMDB 2019-COR6 |
| |
| The Residence Inn by Marriott South Beach |
The appraisal identified only one hotel in the immediate area considered to be a direct competitor to the Residence Inn by Marriott South Beach Property. The five-story, 96-room, Kimpton Palomar hotel, with approximately 45,000 square feet of street-level retail space is currently being developed by the sponsor and is anticipated to open in January 2020. The proposed hotel will feature modern guestrooms, a fitness center, a rooftop pool, two restaurants, in-room spa services, and valet parking, amongst other standard amenities. The loan sponsor anecdotally projected that the Kimpton Palomar hotel will have an ADR of $275, as compared to The Residence Inn by Marriott South Beach Property’s underwritten ADR of $186.06. The price point differential signifies that the two hotels are likely targeting different cliental.
| Operating History and Underwritten Net Cash Flow(1) |
| | 2017 | 2018 | TTM(2) | Underwritten | Per Room(3) | % of Total
Revenue(4) |
| Occupancy | 89.3% | 88.8% | 88.1% | 87.5% | | |
| ADR | $165.68 | $176.90 | $186.06 | $186.06 | | |
| RevPAR | $148.01 | $157.10 | $163.93 | $162.80 | | |
| | | | | | | |
| Room Revenue | $6,266,907 | $6,651,533 | $6,940,809 | $6,892,952 | $59,422 | 93.1% |
| Food & Beverage Revenue | 11,115 | 11,437 | 37,801 | 37,801 | 326 | 0.5 |
| Other Departmental Revenue | 98,249 | 111,998 | 107,534 | 107,534 | 927 | 1.5 |
| Other Income(5) | 156,709 | 250,988 | 367,333 | 367,333 | 3,167 | 5.0 |
| Total Revenue | $6,532,980 | $7,025,956 | $7,453,477 | $7,405,620 | $63,842 | 100.0% |
| | | | | | | |
| Room Expense | $1,292,225 | $1,268,768 | $1,313,246 | $1,304,191 | $11,243 | 18.9% |
| Food & Beverage Expense | 2,718 | 1,449 | 7,217 | 7,217 | 62 | 19.1 |
| Other Departmental Expenses | 36,828 | 42,333 | 43,377 | 43,377 | 374 | 40.3 |
| Departmental Expenses | $1,331,771 | $1,312,550 | $1,363,840 | $1,354,785 | $11,679 | 18.3% |
| | | | | | | |
| Departmental Profit | $5,201,209 | $5,713,406 | $6,089,637 | $6,050,835 | $52,162 | 81.7% |
| | | | | | | |
| Operating Expenses | $1,482,136 | $1,645,028 | $1,690,681 | $1,690,681 | $14,575 | 22.8% |
| Gross Operating Profit | $3,719,073 | $4,068,378 | $4,398,956 | $4,360,154 | $37,588 | 58.9% |
| | | | | | | |
| Management Fees | $326,649 | $351,298 | $410,016 | $444,337 | $3,830 | 6.0% |
| Property Taxes | 418,069 | 417,905 | 408,410 | 450,260 | 3,882 | 6.1 |
| Property Insurance | 195,979 | 271,786 | 362,822 | 365,038 | 3,147 | 4.9 |
| Total Other Expenses | $940,697 | $1,040,989 | $1,181,248 | $1,259,635 | $10,859 | 17.0% |
| | | | | | | |
| Net Operating Income | $2,778,376 | $3,027,389 | $3,217,708 | $3,100,518 | $26,729 | 41.9% |
| FF&E | 183,179 | 267,404 | 335,478 | 370,281 | 3,192 | 5.0 |
| Net Cash Flow | $2,595,197 | $2,759,985 | $2,882,230 | $2,730,237 | $23,537 | 36.9% |
| (1) | Full year 2016 financials are not available as The Residence Inn by Marriott South Beach Property opened mid-year 2016. |
| (2) | TTM reflects the trailing 12 month period ending August 31, 2019. |
| (3) | Per Room values are based on 116 guest rooms. |
| (4) | % of Total Revenue for Room Expense, Food & Beverage Expense and Other Departmental Expenses are based on their corresponding revenue line item. |
| (5) | Other Income is inclusive of parking income, amenity fees and retail lease income. |
Property Management. The Residence Inn by Marriott South Beach Property is managed by Residence Inn by Marriott, LLC (“Marriott”). The management agreement commenced in 2016 upon the opening of The Residence Inn by Marriott South Beach Property, currently runs through December 31, 2046 and contains two, 10-year renewal options.
| THE INFORMATION IN THIS STRUCTURAL AND COLLATERAL TERM SHEET IS NOT COMPLETE AND MAY BE AMENDED PRIOR TO THE TIME OF SALE. THIS TERM SHEET IS NOT AN OFFER TO SELL THESE SECURITIES AND IT IS NOT A SOLICITATION OF AN OFFER TO BUY THESE SECURITIES IN ANY JURISDICTION WHERE THE OFFER OR SALE IS NOT PERMITTED. |
| |
| | 134 of 145 | |
| Structural and Collateral Term Sheet | | JPMDB 2019-COR6 |
[THIS PAGE INTENTIONALLY LEFT BLANK]
| THE INFORMATION IN THIS STRUCTURAL AND COLLATERAL TERM SHEET IS NOT COMPLETE AND MAY BE AMENDED PRIOR TO THE TIME OF SALE. THIS TERM SHEET IS NOT AN OFFER TO SELL THESE SECURITIES AND IT IS NOT A SOLICITATION OF AN OFFER TO BUY THESE SECURITIES IN ANY JURISDICTION WHERE THE OFFER OR SALE IS NOT PERMITTED. |
| |
| | 135 of 145 | |
| Structural and Collateral Term Sheet | | JPMDB 2019-COR6 |
| |
| Brooklyn Renaissance Plaza |
| Mortgage Loan Information | | Property Information |
| Mortgage Loan Seller: | LCM | | Single Asset / Portfolio: | Single Asset |
| Original Principal Balance(1): | $25,000,000 | | Title(2): | Leasehold |
| Cut-off Date Principal Balance(1): | $24,808,910 | | Property Type - Subtype: | Office – CBD |
| % of Pool by IPB: | 3.1% | | Net Rentable Area (SF): | 289,180 |
| Loan Purpose: | Refinance | | Location: | Brooklyn, NY |
| Borrower: | Brooklyn Renaissance Plaza II LLC | | Year Built / Renovated: | 1998 / 2019 |
| Sponsor: | Joshua L. Muss | | Occupancy: | 88.5% |
| Interest Rate: | 4.39000% | | Occupancy Date: | 1/28/2019 |
| Note Date: | 4/11/2019 | | Number of Tenants: | 10 |
| Maturity Date: | 5/6/2029 | | 2016 NOI: | $6,770,519 |
| Interest-only Period: | None | | 2017 NOI: | $6,528,395 |
| Original Term: | 120 months | | 2018 NOI: | $7,356,524 |
| Original Amortization: | 360 months | | TTM NOI: | N/A |
| Amortization Type: | Balloon | | UW Economic Occupancy: | 88.4% |
| Call Protection: | L(30),Def(86),O(4) | | UW Revenues: | $14,691,541 |
| Lockbox / Cash Management: | Hard / In Place | | UW Expenses: | $6,697,245 |
| Additional Debt(1): | Yes | | UW NOI: | $7,994,296 |
| Additional Debt Balance(1): | $64,503,166 | | UW NCF: | $7,745,455 |
| Additional Debt Type(1): | Pari Passu | | Appraised Value / Per SF: | $185,000,000 / $640 |
| | | | Appraisal Date: | 12/11/2018 |
| | | | | |
| Escrows and Reserves | | Financial Information(1) |
| | Initial | Monthly | Initial Cap | | Cut-off Date Loan / SF: | $309 | |
| Taxes: | $850,000 | $150,000 | N/A | | Maturity Date Loan / SF: | $251 | |
| Insurance: | $95,000 | $12,000 | N/A | | Cut-off Date LTV: | 48.3% | |
| Replacement Reserves: | $0 | $6,017 | $216,612 | | Maturity Date LTV: | 39.2% | |
| TI/LC: | $3,360,261 | $36,102 | $1,299,672 | | UW NCF DSCR: | 1.43x | |
| Other(3): | $39,128 | 1/12 of | N/A | | UW NOI Debt Yield: | 9.0% | |
| | | Ground Rent | | | | | |
| | | | | | | |
| |
| Sources and Uses |
| Sources | Proceeds | % of Total | | Uses | Proceeds | % of Total |
| Whole Loan(1) | $90,000,000 | 100.0% | | Return of Equity(4) | $73,068,982 | 81.2% |
| | | | | Closing Costs(5) | 12,586,629 | 14.0% |
| | | | | Upfront Reserves | 4,344,389 | 4.8% |
| Total Sources | $90,000,000 | 100.0% | | Total Uses | $90,000,000 | 100.0% |
| | | | | | | | |
| (1) | The Brooklyn Renaissance Plaza Loan (as defined below) is part of a whole loan evidenced by twopari passu notes, with an aggregate outstanding principal balance as of the Cut-off Date of approximately $89.3 million. The Financial Information presented in the chart above reflects the Cut-off Date balance of the approximately $89.3 million Brooklyn Renaissance Plaza Whole Loan (as defined below). |
| (2) | The Brooklyn Renaissance Plaza Property (as defined below) is part of the Brooklyn Renaissance Plaza Development which is subject to a ground lease for a 99-year term through June 19, 2086, with no renewal options, between the City of New York and MWR Associates (c/o Muss Development). The original ground lease was subsequently severed into five separate ground leases, each of which relates to one of the five Brooklyn Renaissance Plaza Development commercial condominium units, and each of which was assigned to a unit owner. The ground lease for the Brooklyn Renaissance Plaza Property requires ground rent in an amount equal to approximately $98,208 per annum through June 30, 2022, which will be adjusted every subsequent 10 years beginning July 1, 2022 (such adjustment date, the “Reappraisal Date”), and adjusted rent will be estimated based upon the right to develop the site consistent with the use and size of the existing improvements (not its highest and best use). The appraiser utilized the land residual approach via the income capitalization approach and projected that the ground rent for the Brooklyn Renaissance Plaza Property as of the first Reappraisal Date on July 1, 2022 is estimated to increase to $486,540 per annum. Ground rent was underwritten based on the estimated July 1, 2022 ground rent equal to $486,540 per annum. |
| (3) | Initial Other Escrows and Reserves consist of an initial deposit of $39,128 into a free rent reserve for MetLife Services & Solutions. |
| (4) | The Brooklyn Renaissance Plaza Property was previously unencumbered by debt. |
| (5) | Closing costs include approximately $8.6 million of costs associated with a payment to the City of New York in connection with the proceeds payment requirement set forth in the ground lease. |
| THE INFORMATION IN THIS STRUCTURAL AND COLLATERAL TERM SHEET IS NOT COMPLETE AND MAY BE AMENDED PRIOR TO THE TIME OF SALE. THIS TERM SHEET IS NOT AN OFFER TO SELL THESE SECURITIES AND IT IS NOT A SOLICITATION OF AN OFFER TO BUY THESE SECURITIES IN ANY JURISDICTION WHERE THE OFFER OR SALE IS NOT PERMITTED. |
| |
| | 136 of 145 | |
| Structural and Collateral Term Sheet | | JPMDB 2019-COR6 |
| |
| Brooklyn Renaissance Plaza |
The Loan.The Brooklyn Renaissance Plaza loan, with a principal balance of approximately $24.8 million as of the Cut-off Date (the “Brooklyn Renaissance Plaza Loan”), is secured by a first mortgage lien on the borrower’s leasehold interest in a Class A office condominium unit comprised of 289,180 square feet of net rentable area located on floors 24 through 32 of the north tower (the “Brooklyn Renaissance Plaza Property”), which is within the Brooklyn Renaissance Plaza mixed use development (the “Brooklyn Renaissance Plaza Development”) located in downtown Brooklyn, New York. The Brooklyn Renaissance Plaza Loan is part of a whole loan that has an aggregate original principal balance as of the Cut-off Date of approximately $89.3 million (the “Brooklyn Renaissance Plaza Whole Loan”) and is comprised of twopari passu notes, each as described in the “Whole Loan Summary” chart below. The non-controlling Note A-2, with an outstanding principal balance as of the Cut-off Date of approximately $24.8 million, is being contributed to the JPMDB 2019-COR6 Trust. The controlling Note A-1, with an aggregate outstanding principal balance as of the Cut-off Date of approximately $64.5 million, was contributed to the JPMCC 2019-COR5 Trust. The relationship between the holders of the Brooklyn Renaissance Plaza Whole Loan will be governed by a co-lender agreement as described under “Description of the Mortgage Pool—The Whole Loans—The Non-Serviced Pari Passu Whole Loans” in the Preliminary Prospectus. The Brooklyn Renaissance Plaza Whole Loan has a 10-year term and amortizes on a 30-year schedule.The most recent prior financing of theBrooklyn RenaissancePlaza Property was not included in a securitization.
| Whole Loan Summary |
| Notes | Original Balance | Cut-off Date Balance | Note Holder | Controlling Piece |
| A-1 | $65,000,000 | $64,503,166 | JPMCC 2019-COR5 | Yes |
| A-2 | 25,000,000 | 24,808,910 | JPMDB 2019-COR6 | No |
| Total | $90,000,000 | $89,312,076 | | |
The Borrower.The borrowing entity is Brooklyn Renaissance Plaza II LLC, a Delaware limited liability company structured to be bankruptcy remote with two independent directors. Legal counsel to the borrower delivered a non-consolidation opinion in connection with the origination of the Brooklyn Renaissance Plaza Whole Loan.
The Loan Sponsor.The loan sponsor and nonrecourse carve-out guarantor is Joshua L. Muss, a principal of Muss Development LLC (“Muss Development”). Founded in 1906 by Isaac Muss, Muss Development is a family-owned and operated, full-service real estate development and investment company that is currently led by Joshua Muss and his son, Jason Muss. Since its founding, Muss Development has developed more than 15.0 million square feet of commercial, residential, industrial and retail space throughout the five boroughs.
The Property.The Brooklyn Renaissance Plaza Property is a Class A office condominium unit comprised of 289,180 square feet of net rentable area located on floors 24 through 32 of the north tower that is within the Brooklyn Renaissance Plaza Development. Built in 1998 by the loan sponsor, the Brooklyn Renaissance Plaza Development is a mixed-use development comprised of five individual condominium units across two towers containing a total of approximately 1.5 million square feet. The north tower within the Brooklyn Renaissance Plaza Development (the “North Tower”) is a 32-story, mixed-use tower with office and retail space, and the south tower within the Brooklyn Renaissance Plaza Development is comprised of a 386-room Marriott hotel and a parking garage located on three lower levels and the ground floor. The Brooklyn Renaissance Plaza Development is comprised of five individual condominium units, all of which are owned by affiliates of the loan sponsor.
The Brooklyn Renaissance Plaza Development is divided into five condominium units, one of which is the Brooklyn Renaissance Plaza Property. Control of the condominium resides with a five-member board of managers designated by each condominium owner. All decisions and actions by the board require a vote of one or more of the managers representing more than 51% (other than major decisions, which require a vote of 66.67%). No amendment may materially and adversely affect the rights of an owner without the written consent of such owner and any permitted lender of such owner’s unit. Affiliates of the loan sponsor currently own all five of the condominium units.
The Brooklyn Renaissance Plaza Property has unobstructed views of Staten Island, the East River, Manhattan and other parts of New York City. The loan sponsor recently completed an approximately $1.0 million comprehensive renovation of the lobby in the North Tower which features new ceilings, lighting, heightened security with the installation of turnstiles and a newly remodeled interior retail component.
The Brooklyn Renaissance Plaza Property is currently 88.5% occupied by 10 tenants and has reported an average historical occupancy of 100.0% since opening in 1998. Approximately 60.5% of net rentable area and 74.8% of underwritten base rent is attributable to investment grade tenants which include the USA GSA – Secret Service (“GSA”) (30.8% of net rentable area; rated Aaa/AAA/AA+ by Moody’s/Fitch/S&P), the NYC Department of Education (22.2% of net rentable area; rated Aa1/AA/AA by Moody’s/Fitch/S&P) and the NYC Department of Citywide Administration (7.5% of net rentable area; rated Aa1/AA/AA by Moody’s/Fitch/S&P).
| THE INFORMATION IN THIS STRUCTURAL AND COLLATERAL TERM SHEET IS NOT COMPLETE AND MAY BE AMENDED PRIOR TO THE TIME OF SALE. THIS TERM SHEET IS NOT AN OFFER TO SELL THESE SECURITIES AND IT IS NOT A SOLICITATION OF AN OFFER TO BUY THESE SECURITIES IN ANY JURISDICTION WHERE THE OFFER OR SALE IS NOT PERMITTED. |
| |
| | 137 of 145 | |
| Structural and Collateral Term Sheet | | JPMDB 2019-COR6 |
| |
| Brooklyn Renaissance Plaza |
The largest tenant at the Brooklyn Renaissance Plaza Property, the USA GSA – Secret Service (89,030 square feet; 30.8% of net rentable area; 41.7% of underwritten base rent; rated Aaa/AAA/AA+ by Moody’s/Fitch/S&P), is one of the oldest federal law enforcement agencies in the country and ranks among the most elite in the world. The Secret Service protects both national leaders and visiting foreign dignitaries while helping to secure the nation’s financial infrastructure through financial and cybercrime investigations.
The GSA has been a tenant at the Brooklyn Renaissance Plaza Property since October 2001, originally pursuant to a lease with Empire Insurance Company, the original tenant of the Brooklyn Renaissance Plaza Property (which lease was assigned to BRP Leasing, LLC (“BRP Leasing”), an affiliate of the borrower). At the expiration of the initial lease term in 2018, the GSA extended its lease for an additional five years through October 2023. According to the loan sponsor, the GSA is in the process of approving the attornment to the borrower of BRP Leasing’s rights under the lease which will permit the GSA to enter into a direct lease with the borrower. The GSA utilizes its space as a New York field office and currently pays base rent equal to $59.78 per square foot gross. The tenant has no termination options and no renewal options remaining.
The second largest tenant at the Brooklyn Renaissance Plaza Property, the NYC Department of Education (64,340 square feet; 22.2% of net rentable area; 25.7% of underwritten base rent;rated Aa1/AA/AA by Moody’s/Fitch/S&P), is the branch of municipal government in New York City that manages New York City's public school system. New York City’s public school system is the largest school system in the United States, with over 1.1 million students taught in more than 1,400 separate schools. The NYC Department of Education covers all five boroughs of New York City. Approximately 135,000 people work full-time in New York City’s public-school system.
The NYC Department of Education originally took occupancy at the Brooklyn Renaissance Plaza Property in 2017. The NYC Department of Education leases the entire 28th and 29th floors and currently pays base rent equal to $48.00 per square foot modified gross on a direct lease which commenced in November 2018 and extends for 15 years through October 2033. The NYC Department of Education has no termination options and no renewal options remaining.
The third largest tenant at the Brooklyn Renaissance Plaza Property is the United Federation of Teachers (“UFT”) (44,945 square feet; 15.5% of net rentable area; 13.6% of underwritten base rent). With over 200,000 members predominantly made up of education and healthcare professionals, the UFT is a federation of teachers, nurses and other similar professionals working in New York City’s five boroughs that negotiates and advocates on their behalf for fair and competitive salaries, enhanced professionalism and improved working conditions. UFT supports policies, legislation and programs that promote attaining educational equity, closing the achievement gap and assuring parent and community voice in school governance. The UFT works to raise academic standards and strengthen instruction; reduce class size and overcrowding; create safer, more orderly schools; improve school facilities; and increase parent involvement in schools. The UFT offers a full spectrum of workshops and graduate-level courses to approximately 30,000 members annually. The UFT partners with institutions such as Mt. Saint Vincent, Baruch, NYIT and Adelphi, and offers master’s degrees in programs ranging from Literacy and Early Childhood Education to Teaching English as a Second Language and Special Education.
The UFT originally took occupancy at the Brooklyn Renaissance Plaza Property in October 1998 on a 15-year lease term and extended its lease in April 2014 for an additional 15 years through June 2029. The UFT leases the entire 25th floor and a portion of the 24th floor, and currently pays base rent equal to $38.78 per square foot modified gross. The UFT has no termination options and no renewal options remaining.
The Market.The Brooklyn Renaissance Plaza Property is located in the Downtown Brooklyn neighborhood of Brooklyn, New York. Since 2004, the neighborhood has experienced an increase in retail corridors such as the Fulton Street Mall, Atlantic Avenue and the transformation of DUMBO Heights. Downtown Brooklyn is also the site of the 18,100 seat Barclays Center, home to the NBA’s Brooklyn Nets, NCAA Men's Basketball tournaments and a number of concerts, conventions and other events throughout the year. Additional notable eateries and attractions in the area include the Brooklyn Bridge Park, Dekalb Market, Rocco’s Tacos & Tequila Bar (at the base of the Brooklyn Renaissance Plaza Development), Brooklyn Fare, Borough Hall, TKTS Downtown Brooklyn, Gotham Market and Fort Greene Park.
According to a market report, the Brooklyn Renaissance Plaza Property is located within the Downtown Brooklyn office submarket. As of the third quarter of 2019, the Downtown Brooklyn office submarket contained approximately 24.8 million square feet across 205 buildings with an overall market vacancy of 9.5% and average asking rents of approximately $51.05 per square foot.
The appraisal included 12 rent comparables. Of the 12 comparables, one was triple net (“NNN”) with the remaining 11 full service gross (“FSG”). The one NNN rent comparable was equal to $50.00 per square foot while the 11 FSG rent comparables ranged from $43.00 to $70.00 per square foot with a weighted average of approximately $51.90 per square foot FSG. According to the appraisal, the in-place rents for tenants at the Brooklyn Renaissance Plaza Property are approximately 18.1% below market.
| THE INFORMATION IN THIS STRUCTURAL AND COLLATERAL TERM SHEET IS NOT COMPLETE AND MAY BE AMENDED PRIOR TO THE TIME OF SALE. THIS TERM SHEET IS NOT AN OFFER TO SELL THESE SECURITIES AND IT IS NOT A SOLICITATION OF AN OFFER TO BUY THESE SECURITIES IN ANY JURISDICTION WHERE THE OFFER OR SALE IS NOT PERMITTED. |
| |
| | 138 of 145 | |
| Structural and Collateral Term Sheet | | JPMDB 2019-COR6 |
| |
| Brooklyn Renaissance Plaza |
| Historical and Current Occupancy(1) |
| 2010 | 2011 | 2012 | 2013 | 2014 | 2015 | 2016 | 2017 | 2018 | Current(2) |
| 100.0% | 100.0% | 100.0% | 100.0% | 100.0% | 100.0% | 100.0% | 100.0% | 100.0% | 88.5% |
| (1) | Historical Occupancies are as of December 31 of eachrespective year. |
| (2) | Current Occupancy is as of January 28, 2019. |
| Tenant Summary(1) |
| Tenant | Ratings
Moody’s/Fitch/S&P | Net Rentable
Area (SF) | % of
Total NRA | Base Rent
PSF(2) | % of Total
Base Rent(2) | Lease
Expiration Date |
| USA GSA - Secret Service | Aaa / AAA / AA+ | 89,030 | 30.8% | $59.78 | 41.7% | 10/31/2023 |
| NYC Department of Education | Aa1 / AA / AA | 64,340 | 22.2% | $50.99 | 25.7% | 10/31/2033 |
| United Federation of Teachers | NR / NR / NR | 44,945 | 15.5% | $38.78 | 13.6% | 6/30/2029 |
| NYC Department of Citywide | Aa1 / AA / AA | 21,625 | 7.5% | $44.23 | 7.5% | 4/30/2021 |
| Motorola Solutions Inc.(4) | NR / NR / NR | 9,975 | 3.4% | $48.50 | 3.8% | 1/31/2022 |
| LTK Consulting Services Inc. | NR / NR / NR | 7,874 | 2.7% | $43.59 | 2.7% | 6/30/2026 |
| Brooklyn Chamber of Commerce | NR / NR / NR | 7,640 | 2.6% | $29.71 | 1.8% | 5/31/2023 |
| MetLife Services & Solutions(4)(5) | NR / NR / NR | 4,995 | 1.7% | $47.00 | 1.8% | 8/31/2021 |
| Black, Inc. | NR / NR / NR | 3,608 | 1.2% | $34.00 | 1.0% | 5/31/2021 |
| Epstein & Conroy(4) | NR / NR / NR | 1,863 | 0.6% | $33.21 | 0.5% | 1/31/2023 |
| Top 10 Total / Wtd. Avg. | | 255,895 | 88.5% | $49.93 | 100.0% | |
| Other Tenants | | 0 | 0.0% | $0.00 | 0.0% | |
| Total Occupied Space | | 255,895 | 88.5% | $49.93 | 100.0% | |
| Vacant | | 33,285 | 11.5% | | | |
| Total | | 289,180 | 100.0% | | | |
| (1) | Based on the underwritten rent roll dated as of January 28, 2019. |
| (2) | Base Rent includes average rent over the lease term for investment grade tenant the NYC Department of Education ($192,248). |
| (3) | NYC Department of Citywide Administration has the right to terminate its lease at any time by providing at least 12 months’ notice and payment of a termination fee. |
| (4) | Motorola Solutions Inc. has one, five-year renewal option remaining, MetLife Services & Solutions has one, five-year renewal option remaining, and Epstein & Conroy has one, five-year renewal option remaining. |
| (5) | MetLife Services & Solutions has a free rent period in the months of September 2019 and September 2020, each for approximately $19,564. At origination, the borrower deposited approximately $39,128 into a free rent reserve. |
| Lease Rollover Schedule(1) |
| Year | Number
of
Leases
Expiring | Net
Rentable
Area
Expiring | % of
NRA
Expiring | Base
Rent
Expiring(2) | % of Base
Rent
Expiring(2) | Cumulative
Net Rentable
Area Expiring | Cumulative
% of NRA
Expiring | Cumulative
Base Rent
Expiring(2) | Cumulative %
of Base Rent
Expiring(2) |
| Vacant | NAP | 33,285 | 11.5% | NAP | NAP | 33,285 | 11.5% | NAP | NAP |
| 2019 & MTM | 0 | 0 | 0.0% | $0 | 0.0% | 33,285 | 11.5% | $0 | 0.0% |
| 2020 | 0 | 0 | 0.0% | 0 | 0.0% | 33,285 | 11.5% | $0 | 0.0% |
| 2021 | 3 | 30,228 | 10.5% | 1,313,902 | 10.3% | 63,513 | 22.0% | $1,313,902 | 10.3% |
| 2022 | 1 | 9,975 | 3.4% | 483,788 | 3.8% | 73,488 | 25.4% | $1,797,690 | 14.1% |
| 2023 | 3 | 98,533 | 34.1% | 5,611,377 | 43.9% | 172,021 | 59.5% | $7,409,066 | 58.0% |
| 2024 | 0 | 0 | 0.0% | 0 | 0.0% | 172,021 | 59.5% | $7,409,066 | 58.0% |
| 2025 | 0 | 0 | 0.0% | 0 | 0.0% | 172,021 | 59.5% | $7,409,066 | 58.0% |
| 2026 | 1 | 7,874 | 2.7% | 343,193 | 2.7% | 179,895 | 62.2% | $7,752,260 | 60.7% |
| 2027 | 0 | 0 | 0.0% | 0 | 0.0% | 179,895 | 62.2% | $7,752,260 | 60.7% |
| 2028 | 0 | 0 | 0.0% | 0 | 0.0% | 179,895 | 62.2% | $7,752,260 | 60.7% |
| 2029 | 1 | 44,945 | 15.5% | 1,742,783 | 13.6% | 224,840 | 77.8% | $9,495,042 | 74.3% |
| 2030 & Beyond | 1 | 64,340 | 22.2% | 3,280,568 | 25.7% | 289,180 | 100.0% | $12,775,610 | 100.0% |
| Total | 10 | 289,180 | 100.0% | $12,775,610 | 100.0% | | | | |
| (1) | Based on the underwritten rent roll dated January 28, 2019. |
| (2) | Base Rent Expiring includes $192,248 of average rent over the lease term for the NYC Department of Education. |
| THE INFORMATION IN THIS STRUCTURAL AND COLLATERAL TERM SHEET IS NOT COMPLETE AND MAY BE AMENDED PRIOR TO THE TIME OF SALE. THIS TERM SHEET IS NOT AN OFFER TO SELL THESE SECURITIES AND IT IS NOT A SOLICITATION OF AN OFFER TO BUY THESE SECURITIES IN ANY JURISDICTION WHERE THE OFFER OR SALE IS NOT PERMITTED. |
| |
| | 139 of 145 | |
| Structural and Collateral Term Sheet | | JPMDB 2019-COR6 |
| |
| Brooklyn Renaissance Plaza |
| Operating History and Underwritten Net Cash Flow |
| | 2016 | 2017 | 2018 | Underwritten | Per Square Foot | %(1) |
| Rents in Place(2) | $7,462,946 | $7,462,946 | $8,502,569 | $12,583,362 | $43.51 | 75.7% |
| Straight Line Rent(3) | 0 | 0 | 0 | 192,248 | 0.66 | 1.2% |
| Vacant Income | 0 | 0 | 0 | 1,930,530 | 6.68 | 11.6% |
| Gross Potential Rent | $7,462,946 | $7,462,946 | $8,502,569 | $14,706,140 | $50.85 | 88.5% |
| Total Reimbursements(2) | 3,568,169 | 3,785,081 | 3,999,970 | 1,912,225 | 6.61 | 11.5% |
| Total Other Income | 6,785 | 0 | 3,706 | 3,706 | 0.01 | 0.0% |
| Net Rental Income | $11,037,900 | $11,248,027 | $12,506,245 | $16,622,071 | $57.48 | 100.0% |
| (Vacancy/Credit Loss) | 0 | 0 | 0 | (1,930,530) | (6.68) | (11.6)% |
| Effective Gross Income | $11,037,900 | $11,248,027 | $12,506,245 | $14,691,541 | $50.80 | 88.4% |
| Total Expenses(4) | $4,267,381 | $4,719,632 | $5,149,721 | $6,697,245 | $23.16 | 45.6% |
| Net Operating Income | $6,770,519 | $6,528,395 | $7,356,524 | $7,994,296 | $27.64 | 54.4% |
| Total TI/LC, CapEx/RR | 0 | 0 | 0 | 248,841 | 0.86 | 1.7% |
| Net Cash Flow | $6,770,519 | $6,528,395 | $7,356,524 | $7,745,455 | $26.78 | 52.7% |
| (1) | % column represents percent of Net Rental Income for all revenue lines and represents percent of Effective Gross Income for the remainder of the fields. |
| (2) | The increase in Underwritten Rents in Place and the decrease in Underwritten Total Reimbursements over the historical periods is primarily attributable to the GSA renewal in October 2018 which converted the base rent from modified gross to gross as well as the new direct lease with the NYC Department of Education which commenced in November 2018. |
| (3) | Based on the average rent over the lease term for the NYC Department of Education. |
| (4) | The increase in Underwritten Total Expenses from 2018 Total Expenses is primarily attributable to approximately $822,001 in higher underwritten real estate taxes as well as an approximately $388,332 higher underwritten ground lease expense. The Brooklyn Renaissance Plaza Development is subject to a payment in lieu of taxes (“PILOT”) program pursuant to which PILOT payments are calculated based on the assessed value of the entire Brooklyn Renaissance Plaza Development and the Brooklyn Renaissance Plaza Property’s allocated share of 21.1538%, based on its common interest in the condominium. Under the PILOT program, taxes are payable on the subject land based on current assessments; however, the improvements are exempt from real estate taxes for 16 years. Taxes on the improvements are then phased in at 10.0% increments from year 17 through year 25 when the exemption ends. The PILOT program for the Brooklyn Renaissance Plaza Development is in year 21 of 25 and due to the short-term nature of the abatement, the full unabated real estate tax amount was underwritten. |
Property Management.The Brooklyn Renaissance Plaza Property is managed by Renaissance Property Managers LLC, an affiliate of the borrower.
| THE INFORMATION IN THIS STRUCTURAL AND COLLATERAL TERM SHEET IS NOT COMPLETE AND MAY BE AMENDED PRIOR TO THE TIME OF SALE. THIS TERM SHEET IS NOT AN OFFER TO SELL THESE SECURITIES AND IT IS NOT A SOLICITATION OF AN OFFER TO BUY THESE SECURITIES IN ANY JURISDICTION WHERE THE OFFER OR SALE IS NOT PERMITTED. |
| |
| | 140 of 145 | |
| Structural and Collateral Term Sheet | | JPMDB 2019-COR6 |
[THIS PAGE INTENTIONALLY LEFT BLANK]
| THE INFORMATION IN THIS STRUCTURAL AND COLLATERAL TERM SHEET IS NOT COMPLETE AND MAY BE AMENDED PRIOR TO THE TIME OF SALE. THIS TERM SHEET IS NOT AN OFFER TO SELL THESE SECURITIES AND IT IS NOT A SOLICITATION OF AN OFFER TO BUY THESE SECURITIES IN ANY JURISDICTION WHERE THE OFFER OR SALE IS NOT PERMITTED. |
| |
| | 141 of 145 | |
| Structural and Collateral Term Sheet | | JPMDB 2019-COR6 |
| |
| 8571 Rivers Avenue |
| Mortgage Loan Information | | Property Information |
| Mortgage Loan Seller: | LCM | | Single Asset / Portfolio: | Single Asset |
| Original Principal Balance: | $24,500,000 | | Title(1): | Fee / Leasehold |
| Cut-off Date Principal Balance: | $24,500,000 | | Property Type - Subtype: | Office – Suburban |
| % of Pool by IPB: | 3.0% | | Net Rentable Area (SF)(2): | 173,582 |
| Loan Purpose: | Refinance | | Location: | North Charleston, SC |
| Borrower: | API-N. Charleston, LLC | | Year Built / Renovated: | 1995 / 2017 |
| Sponsors: | G. Steele Dewey IV, Steven J. | | Occupancy(2): | 100.0% |
| | Townley, Randolph W. Green, John | | Occupancy Date: | 11/6/2019 |
| | Kneisel | | Number of Tenants: | 1 |
| Interest Rate: | 4.05000% | | 2016 NOI(3): | N/A |
| Note Date: | 10/11/2019 | | 2017 NOI(3): | N/A |
| Maturity Date: | 11/6/2029 | | 2018 NOI(3): | N/A |
| Interest-only Period: | None | | TTM NOI(3): | N/A |
| Original Term: | 120 months | | UW Economic Occupancy: | 95.0% |
| Original Amortization: | 360 months | | UW Revenues: | $3,823,548 |
| Amortization Type: | Balloon | | UW Expenses: | $1,169,529 |
| Call Protection: | L(24),Def(92),O(4) | | UW NOI: | $2,654,020 |
| Lockbox / Cash Management: | Hard / Springing | | UW NCF: | $2,441,373 |
| Additional Debt: | N/A | | Appraised Value / Per SF(5): | $40,400,000 / $233 |
| Additional Debt Balance: | N/A | | Appraisal Date: | 9/10/2019 |
| Additional Debt Type: | N/A | | | |
| | | | | |
| Escrows and Reserves | | Financial Information |
| | Initial | Monthly | Initial Cap | | Cut-off Date Loan / SF: | $141 | |
| Taxes: | $452,254 | $38,818 | N/A | | Maturity Date Loan / SF: | $112 | |
| Insurance: | $115,368 | $12,819 | N/A | | Cut-off Date LTV: | 60.6% | |
| Replacement Reserves: | $0 | $2,893 | N/A | | Maturity Date LTV: | 48.3% | |
| TI/LC: | $3,814,538 | $0 | N/A | | UW NCF DSCR: | 1.73x | |
| Other(4): | $402,698 | Springing | N/A | | UW NOI Debt Yield: | 10.8% | |
| | | | | | |
|
| Sources and Uses |
| Sources | Proceeds | % of Total | | Uses | Proceeds | % of Total |
| Mortgage Loan | $24,500,000 | 97.3% | | Payoff Existing Debt | $18,842,348 | 74.8% |
| Sponsor Equity | 680,378 | 2.7% | | Upfront Reserves | 4,784,858 | 19.0% |
| | | | | Closing Costs | 1,553,172 | 6.2% |
| Total Sources | $25,180,378 | 100.0% | | Total Uses | $25,180,378 | 100.0% |
| (1) | The borrower’s ownership in the 8571 Rivers Avenue Property (as defined below) is an estate for years through June 29, 2025 at which time the borrower’s fee estate will revert to a ground lease interest. In connection with the origination of the 8571 Rivers Avenue Loan (as defined below), the borrower entered into a ground lease with a third party that will take effect on June 30, 2025 (the “Ground Lease”). The Ground Lease has a 25 year initial term with five 5-year extension options and continues through June 29, 2075 with annual ground rent payments of $495,000 per year (flat for the term of the Ground Lease) commencing in June 2025. The Ground Lease also contains mortgagee notice and cure rights. In addition, commencing on June 30, 2025, or at any time during the term of the Ground Lease, the borrower has the right to purchase the ground lessor’s fee simple interest in perpetuity, at the fair market value of the land excluding any improvements, but also taking into consideration the $495,000 ground rents in determination of the purchase price. The 8571 Rivers Avenue Loan was underwritten to include $297,000 per year in annual ground rent payments, which represents average ground rent payments during the 15 years after origination of the 8571 Rivers Avenue Loan. |
| (2) | T-Mobile PCS Holdings, LLC (“T-Mobile”) currently occupies 129,232 square feet and the tenant exercised its expansion option for an additional 44,350 square feet (the “Expansion Premises”). The Expansion Premises are currently under construction with an expected rent commencement date of May 2020. |
| (3) | The T-Mobile lease commenced in March 2018. No historical cash flow information is available prior to the commencement of the T-Mobile lease. |
| (4) | Other reserves consist of (i) an upfront deposit of $402,698 for the T-Mobile Expansion Premises rent through the expected rent commencement date of May 2020 and (ii) a monthly ground lease reserve equal to 1/12th of the estimated ground rent due over the next 12 months, which monthly reserve payments are required commencing on the July 2025 payment date and continue until the date on which the borrower acquires the fee simple interest of the 8571 Rivers Avenue Property. |
| (5) | The appraisal valued the 8571 Rivers Avenue Property assuming the purchase option is exercised and deducted the cost of the land acquisition to arrive at the appraised value.
|
| THE INFORMATION IN THIS STRUCTURAL AND COLLATERAL TERM SHEET IS NOT COMPLETE AND MAY BE AMENDED PRIOR TO THE TIME OF SALE. THIS TERM SHEET IS NOT AN OFFER TO SELL THESE SECURITIES AND IT IS NOT A SOLICITATION OF AN OFFER TO BUY THESE SECURITIES IN ANY JURISDICTION WHERE THE OFFER OR SALE IS NOT PERMITTED. |
| |
| | 142 of 145 | |
| Structural and Collateral Term Sheet | | JPMDB 2019-COR6 |
| |
| 8571 Rivers Avenue |
The Loan.The 8571 Rivers Avenue loan, with an outstanding principal balance of $24.5 million as of the Cut-off Date (the “8571 Rivers Avenue Loan”), is secured by a first mortgage lien on the borrower’s fee simple and leasehold interest in an office property comprised of 173,582 square feet of net rentable area (the “8571 Rivers Avenue Property”) located in North Charleston, SC. The 8571 Rivers Avenue Loan has a 10-year term and will amortize on a 30-year schedule.
The Borrower. The borrowing entity is API-N. Charleston, LLC, a Delaware limited liability company and special purpose entity structured to be bankruptcy remote with at least two independent directors. The borrower’s ownership in the 8571 Rivers Avenue Property is an estate for years through June 29, 2025 at which time the borrower’s fee estate will revert to a ground lease interest. In addition, the borrower has an option to purchase the fee simple interest at fair market value on June 30, 2025 or any time during the ground lease term.
The Loan Sponsors.The loan sponsors and nonrecourse carve-out guarantors are G. Steele Dewey IV, Steven J. Townley, Randolph W. Green, and John Kneisel, on a joint and several basis. The sponsors are principals and investors of Aston Properties, a Charlotte based real estate company founded in 1980 with experience in the development, management and investment in southeastern commercial real estate assets. Aston Properties’ current portfolio consists of 44 properties across the Southeast and Mid-Atlantic.The guarantors are required to maintain a net worth of not less than $20.0 million and liquidity of not less than $2.0 million during the term of the 8571 Rivers Avenue Loan.
The Property.The 8571 Rivers Avenue Property is a call center office facility comprised of 173,582 square feet of net rentable area located on a 19.43 acre parcel in North Charleston, South Carolina. The 8571 Rivers Avenue Property contains 1,344 parking spaces, representing a parking ratio of 8 spaces per 1,000 square feet. The 8571 Rivers Avenue Property was built in 1995 and was operated as a K-Mart until March 2017 when the store closed. After K-Mart vacated, the 8571 Rivers Avenue Property was extensively renovated and converted into a call center that was subsequently 100.0% leased to T-Mobile. T-Mobile currently occupies 129,232 square feet and exercised its expansion option for an additional 44,350 square feet in August 2019 to occupy the entire building. The Expansion Premises is currently being renovated and the borrower anticipates that T-Mobile will take occupancy and commence paying rent for the Expansion Premises in May 2020. T-Mobile’s lease commenced in March 2018 and has a term of 148 months, expiring in July 2030 with three, five-year renewal options. The T-Mobile lease is guaranteed by T-Mobile USA, Inc. (Moody’s: Ba2) and T-Mobile’s parent company is Deutsche Telekom AG (S&P: BBB+ / Moody’s: Baa1 / Fitch: BBB+). T-Mobile employs a 1,200 person workforce at the 8571 Rivers Avenue Property, making it their largest U.S. call center. T-Mobile USA, Inc., together with its subsidiaries, provides mobile communications services in the United States, Puerto Rico, and the U.S. Virgin Islands. In 2017, T-Mobile had over 44,000 employees, revenue of $40.6 billion, and over 55 million customers.
The Market.The 8571 Rivers Avenue Property is located in the Charleston-North Charleston, SC metropolitan statistical area. According to the appraisal, the area has a population of 798,940 people, which has increased 2.1% per annum since 2010 and is expected to increase 1.9% per annum through 2024. The area includes a total of 398,707 employees and has a 3.4% unemployment rate. The Charleston office market continues to thrive with one of the lowest vacancy rates and one of the highest asking rates in the Southeast. Primary access to the 8571 Rivers Avenue Property neighborhood is provided by Interstate 26, Highway 642 and Rivers Avenue, also known as Highway 78. Interstate 26 is primarily a six-lane, variable width right-of-way, traversing the neighborhood in a northwest-southeast direction. Highway 78 is an arterial road that connects the subject neighborhood. The commute to the Charleston's central business district is approximately twenty minutes. The commute to the Charleston International Airport is around 12 minutes.
According to the appraisal, the 8571 Rivers Avenue Property is located in the North Charleston office submarket. According to a third party market report, as of the fourth quarter of 2019, the North Charleston office submarket consisted of approximately 10 million rentable square feet of office space with an overall vacancy rate of 7.2% and average rents of $24.10 per square foot. The appraisal identified eight comparable office leases in the Charleston market area ranging in size from 50,254 square feet of leased area to 172,000 square feet of leased area. Base rents for the comparable office leases ranged from $16.75 per square foot to $25.12 per square foot, with a weighted average of approximately $20.28 per square foot. Seven of the comparable leases identified by the appraisal are on a triple net basis and one comparable lease is on an absolute net basis. Per T-Mobile’s 2018 executed lease, and including the Expansion Premises, T-Mobile is required to pay $17.80 per square foot on a triple net basis as of November 2019 on their 129,232 square feet of occupied space, with a contractual rent step to $18.16 per square foot in April 2020. The appraisal concluded a market rent of $18.00 per square foot which is in line with the 8571 Rivers Avenue Property’s base rent.
| THE INFORMATION IN THIS STRUCTURAL AND COLLATERAL TERM SHEET IS NOT COMPLETE AND MAY BE AMENDED PRIOR TO THE TIME OF SALE. THIS TERM SHEET IS NOT AN OFFER TO SELL THESE SECURITIES AND IT IS NOT A SOLICITATION OF AN OFFER TO BUY THESE SECURITIES IN ANY JURISDICTION WHERE THE OFFER OR SALE IS NOT PERMITTED. |
| |
| | 143 of 145 | |
| Structural and Collateral Term Sheet | | JPMDB 2019-COR6 |
| |
| 8571 Rivers Avenue |
| Tenant Summary(1) |
| Tenant | Ratings
Moody’s/Fitch/S&P(2) | Net Rentable
Area (SF) | % of
Total NRA | Base Rent
PSF(3) | % of Total
Base Rent(3) | Lease
Expiration Date |
| T-Mobile PCS Holdings LLC(4) | Baa1 / BBB+ / BBB+ | 173,582 | 100.0% | $18.16 | 100.0% | 7/31/2030 |
| Total Occupied Space | | 173,582 | 100.0% | $18.16 | 100.0% | |
| Vacant | | 0 | 0 | | | |
| Total | | 173,582 | 100.0% | | | |
| (1) | Based on the in-place T-Mobile lease that commenced in March 2018 including the Expansion Premises. |
| (2) | In certain instances, ratings provided are those of the parent company of the entity shown, whether or not the parent company guarantees the lease. |
| (3) | Base Rent includes approximately $62,499 in contractual rent steps over the loan term. |
| (4) | T-Mobile has three, five-year renewal options remaining. |
| Lease Rollover Schedule(1) |
| Year | Number
of Leases
Expiring | Net
Rentable
Area
Expiring | % of
NRA
Expiring | Base Rent
Expiring(2) | % of Base
Rent
Expiring(2) | Cumulative
Net Rentable
Area
Expiring | Cumulative
% of NRA
Expiring | Cumulative
Base Rent
Expiring(2) | Cumulative
% of Base
Rent
Expiring(2) |
| Vacant | NAP | 0 | 0.0% | NAP | NAP | 0 | 0.0% | NAP | NAP |
| 2019 & MTM | 0 | 0 | 0.0% | $0 | 0.0% | 0 | 0.0% | $0 | 0.0% |
| 2020 | 0 | 0 | 0.0% | 0 | 0.0% | 0 | 0.0% | $0 | 0.0% |
| 2021 | 0 | 0 | 0.0% | 0 | 0.0% | 0 | 0.0% | $0 | 0.0% |
| 2022 | 0 | 0 | 0.0% | 0 | 0.0% | 0 | 0.0% | $0 | 0.0% |
| 2023 | 0 | 0 | 0.0% | 0 | 0.0% | 0 | 0.0% | $0 | 0.0% |
| 2024 | 0 | 0 | 0.0% | 0 | 0.0% | 0 | 0.0% | $0 | 0.0% |
| 2025 | 0 | 0 | 0.0% | 0 | 0.0% | 0 | 0.0% | $0 | 0.0% |
| 2026 | 0 | 0 | 0.0% | 0 | 0.0% | 0 | 0.0% | $0 | 0.0% |
| 2027 | 0 | 0 | 0.0% | 0 | 0.0% | 0 | 0.0% | $0 | 0.0% |
| 2028 | 0 | 0 | 0.0% | 0 | 0.0% | 0 | 0.0% | $0 | 0.0% |
| 2029 | 0 | 0 | 0.0% | 0 | 0.0% | 0 | 0.0% | $0 | 0.0% |
| 2030 & Beyond | 1 | 173,582 | 100.0% | 3,152,259 | 100.0% | 173,582 | 100.0% | $3,152,259 | 100.0% |
| Total | 1 | 173,582 | 100.0% | $3,152,259 | 100.0% | | | | |
| | | | | | | | | | | |
| (1) | Based on the in-place T-Mobile lease that commenced in March 2018 including the Expansion Premises. |
| (2) | Base Rent Expiring includes approximately $62,499 in contractual rent steps over the loan term. |
| Operating History and Underwritten Net Cash Flow(1) |
| | Underwritten | Per Square
Foot | %(2) |
| Rents in Place | $3,089,760 | $17.80 | 76.8% |
| Contractual Rent Steps(3) | 62,499 | 0.36 | 1.6% |
| Vacant Income | 0 | 0.00 | 0.0% |
| Gross Potential Rent | $3,152,259 | $18.16 | 78.3% |
| Total Reimbursements | 872,529 | 5.03 | 21.7% |
| Total Other Income | 0 | 0.00 | 0.0% |
| Net Rental Income | $4,024,788 | $23.19 | 100.0% |
| (Vacancy/Credit Loss) | (201,239) | (1.16) | (5.0)% |
| Effective Gross Income | $3,823,548 | $22.03 | 95.0% |
| | | | |
| Total Expenses | $1,169,529 | $6.74 | 30.6% |
| | | | |
| Net Operating Income | $2,654,020 | $15.29 | 69.4% |
| | | | |
| Total TI/LC, CapEx/RR | 212,647 | 1.23 | 5.6% |
| | | | |
| Net Cash Flow | $2,441,373 | $14.06 | 63.9% |
| (1) | The T-Mobile lease commenced in March 2018. No historical cash flow information is available prior to the commencement of the T-Mobile lease. |
| (2) | % column represents percent of Net Rental Income for all revenue lines and represents percent of Effective Gross Income for the remainder of the fields. |
| (3) | Based on the April 2020 contractual rent step. |
Property Management.The 8571 Rivers Avenue Property is managed by Aston Properties, Inc., a North Carolina corporation and an affiliate of the borrower.
| THE INFORMATION IN THIS STRUCTURAL AND COLLATERAL TERM SHEET IS NOT COMPLETE AND MAY BE AMENDED PRIOR TO THE TIME OF SALE. THIS TERM SHEET IS NOT AN OFFER TO SELL THESE SECURITIES AND IT IS NOT A SOLICITATION OF AN OFFER TO BUY THESE SECURITIES IN ANY JURISDICTION WHERE THE OFFER OR SALE IS NOT PERMITTED. |
| |
| | 144 of 145 | |
| Structural and Collateral Term Sheet | | JPMDB 2019-COR6 |
| |
| Contacts |
| J.P. Morgan CMBS Capital Markets & Banking |
| Contact | E-mail | Phone Number |
Kunal Singh Managing Director | kunal.k.singh@jpmorgan.com | (212) 834-5467 |
| | | |
Brad Horn Executive Director | bradley.j.horn@jpmorgan.com | (212) 834-9708 |
| | | |
| J.P. Morgan CMBS Trading |
| Contact | E-mail | Phone Number |
Avinash Sharma Executive Director | avinash.sharma@jpmorgan.com | (212) 834-3111 |
| | | |
Derrick Fetzer Vice President | derrick.e.fetzer@jpmchase.com | (212) 834-3111 |
| | | |
| J.P. Morgan Securitized Products Syndicate |
| Contact | E-mail | Phone Number |
Andy Cherna Managing Director | andy.cherna@jpmorgan.com | (212) 834-4154 |
| | | |
Kailin Twomey Associate | kailin.e.twomey@jpmchase.com | (212) 834-4154 |
| | | |
| Deutsche Bank CMBS Capital Markets & Banking |
| Contact | E-mail | Phone Number |
Lainie Kaye Managing Director | lainie.kaye@db.com | (212) 250-5270 |
| | | |
Natalie Grainger Director | natalie.grainger@db.com | (212) 250-1254 |
| | | |
| Deutsche Bank CMBS Trading |
| Contact | E-mail | Phone Number |
| | | |
Ryan Horvath Vice President | ryan.horvath@db.com | (212) 250-5149 |
| | | |
| Deutsche Bank CMBS Structuring |
| Contact | E-mail | Phone Number |
Shaishav Agarwal Managing Director | shaishav.agarwal@db.com | (212) 250-6290 |
| | | |
Dan Penn Director | daniel.penn@db.com | (212) 250-5149 |
| | | |
| LoanCore CMBS Capital Markets & Banking |
| Contact | E-mail | Phone Number |
Dan Bennett Head of Capital Markets | dbennett@loancore.com | (203) 861-6037 |
| | | |
Adam Francks Managing Director | afrancks@loancore.com | (203) 861-6019 |
| | | |
| LoanCore CMBS Structuring |
| Contact | E-mail | Phone Number |
Derek Barcelona Managing Director | dbarcelona@loancore.com | (203) 861-6085 |
| | | |
Vincent Wong Associate | vwong@loancore.com | (203) 861-6085 |
| THE INFORMATION IN THIS STRUCTURAL AND COLLATERAL TERM SHEET IS NOT COMPLETE AND MAY BE AMENDED PRIOR TO THE TIME OF SALE. THIS TERM SHEET IS NOT AN OFFER TO SELL THESE SECURITIES AND IT IS NOT A SOLICITATION OF AN OFFER TO BUY THESE SECURITIES IN ANY JURISDICTION WHERE THE OFFER OR SALE IS NOT PERMITTED. |
| |
| | 145 of 145 | |