UNITED STATES
SECURITIES AND EXCHANGE COMMISSION
Washington, D.C. 20549
FORM N-CSR
CERTIFIED SHAREHOLDER REPORT OF REGISTERED MANAGEMENT
INVESTMENT COMPANIES
Investment Company Act file number 811-07619
Nuveen Investment Trust
(Exact name of registrant as specified in charter)
Nuveen Investments
333 West Wacker Drive, Chicago, IL 60606
(Address of principal executive offices) (Zip code)
Kevin J. McCarthy
Nuveen Investments
333 West Wacker Drive
Chicago, IL 60606
(Name and address of agent for service)
Registrant’s telephone number, including area code: (312) 917-7700
Date of fiscal year end: August 31
Date of reporting period: August 31, 2015
Form N-CSR is to be used by management investment companies to file reports with the Commission not later than 10 days after the transmission to stockholders of any report that is required to be transmitted to stockholders under Rule 30e-1 under the Investment Company Act of 1940 (17 CFR 270.30e-1). The Commission may use the information provided on Form N-CSR in its regulatory, disclosure review, inspection, and policy making roles.
A registrant is required to disclose the information specified by Form N-CSR, and the Commission will make this information public. A registrant is not required to respond to the collection of information contained in Form N-CSR unless the Form displays a currently valid Office of Management and Budget (“OMB”) control number. Please direct comments concerning the accuracy of the information collection burden estimate and any suggestions for reducing the burden to Secretary, Securities and Exchange Commission, 450 Fifth Street, NW, Washington, DC 20549-0609. The OMB has reviewed this collection of information under the clearance requirements of 44 U.S.C. ss.3507.
ITEM 1. REPORTS TO STOCKHOLDERS.
| | |
| | |  |
| Mutual Funds | |
| | |
| | | |
| | | Nuveen Asset Allocation Funds |
| | | | | | |
| | | | | | | Annual Report August 31, 2015 |
| | | | | | | | | | | | | | |
| | | | | | | Share Class / Ticker Symbol | | |
| | | Fund Name | | | | Class A | | Class C | | Class R3 | | Class I | | |
|
| | Nuveen Intelligent Risk Conservative Allocation Fund | | | | NICAX | | NICCX | | NICRX | | NICIX | | |
| | Nuveen Intelligent Risk Growth Allocation Fund | | | | NIGAX | | NIGCX | | NIGRX | | NIGIX | | |
| | Nuveen Intelligent Risk Moderate Allocation Fund | | | | NIDAX | | NIMCX | | NIMRX | | NIMIX | | |
| | | | | | | | | | | | |
| | | | | | |
| | | | |
| | | | | | | | |
| | |
| | Life is Complex. | | |
| | |
| | Nuveen makes things e-simple. | | |
| | |
| | It only takes a minute to sign up for e-Reports. Once enrolled, you’ll receive an e-mail as soon as your Nuveen Fund information is ready. No more waiting for delivery by regular mail. Just click on the link within the e-mail to see the report and save it on your computer if you wish. | | |
| | | | |
| | | | | | Free e-Reports right to your e-mail! | | |
| | | |
| | | | | | www.investordelivery.com If you receive your Nuveen Fund distributions and statements from your
financial advisor or brokerage account. |
| | | | |
| | | | or | | www.nuveen.com/accountaccess If you receive your Nuveen Fund distributions and statements directly from Nuveen. Must be preceded by or accompanied by a prospectus. NOT FDIC INSURED MAY LOSE VALUE
NO BANK GUARANTEE | | |
| | | | | | | | | | |
| | | | | | | | | | | | | |

Table
of Contents
Chairman’s Letter
to Shareholders

Dear Shareholders,
For better or for worse, the financial markets have spent the past year waiting for the U.S. Federal Reserve (Fed) to end its accomodative monetary policy. The policy has propped up stock and bond markets since the Great Recession, but the question remains: how will markets behave without its influence? This uncertainty has been a considerable source of volatility for stock and bond prices lately, despite the Fed carefully conveying its intention to raise rates slowly and only when the economy shows evidence of readiness.
There may be at least one rate hike before the end of 2015. After all, the U.S. has reached “full employment” by the Fed’s standards and growth has resumed – albeit unevenly. But the picture remains somewhat uncertain. Inflation has remained stubbornly low, most recently weighed down by an unexpectedly sharp decline in commodity prices since mid-2014. With the Fed poised to tighten and foreign central banks easing, the U.S. dollar has surged against other currencies, which has weighed on corporate earnings and further contributed to commodity price weakness. U.S. consumers have benefited from an improved labor market and lower prices at the gas pump, but the overall pace of economic expansion has been lackluster.
Nevertheless, the global recovery continues to be led by the United States. Policy makers around the world are deploying their available tools to try to bolster Europe and Japan’s fragile growth, and manage China’s slowdown. Contagion fears ebb and flow with the headlines about Greece and China. Greece reluctantly agreed to a third bailout package from the European Union in July and China’s central bank and government intervened aggressively to try to stem the sell-off in stock prices. But persistent structural problems in these economies will continue to garner market attention.
Wall Street is fond of saying “markets don’t like uncertainty,” and asset prices are likely to continue to churn in the current macro environment. In times like these, you can look to a professional investment manager with the experience and discipline to maintain the proper perspective on short-term events. And if the daily headlines do concern you, I encourage you to reach out to your financial advisor. Your financial advisor can help you evaluate your investment strategies in light of current events, your time horizon and risk tolerance. On behalf of the other members of the Nuveen Fund Board, we look forward to continuing to earn your trust in the months and years ahead.
Sincerely,

William J. Schneider
Chairman of the Board
October 26, 2015
Portfolio Managers’
Comments
Nuveen Intelligent Risk Conservative Allocation Fund
Nuveen Intelligent Risk Growth Allocation Fund
Nuveen Intelligent Risk Moderate Allocation Fund
These Funds feature portfolio management by Nuveen Asset Management, LLC, an affiliate of Nuveen Investments, Inc. Portfolio manager James A. Colon, CFA, has managed the Funds since their inception in May 2012. David R. Wilson, CFA, joined the Funds’ management team in December 2013.
Here the management team discusses economic and equity market conditions, key investment strategies and the Funds’ performance during the twelve-month reporting period ended August 31, 2015.
What factors affected the U.S. economy and markets during the twelve-month reporting period ended August 31, 2015?
During this reporting period, the U.S. economy continued to expand at a moderate pace. The Federal Reserve (Fed) maintained efforts to bolster growth and promote progress toward its mandates of maximum employment and price stability by holding the benchmark fed funds rate at the record low level of zero to 0.25% that it established in December 2008. At its October 2014 meeting, the Fed announced that it would end its bond-buying stimulus program as of November 1, 2014, after tapering its monthly asset purchases of mortgage-backed and longer-term Treasury securities from the original $85 billion per month to $15 billion per month over the course of seven consecutive meetings (December 2013 through September 2014). In making the announcement, the Fed cited substantial improvement in the labor market as well as sufficient underlying strength in the broader economy to support ongoing progress toward maximum employment in a context of price stability. The Fed also reiterated that it would continue to look at a wide range of factors, including labor market conditions, indicators of inflationary pressures and readings on financial developments, in determining future actions. Additionally, the Fed stated that it would likely maintain the current target range for the fed funds rate for a considerable time, especially if projected inflation continued to run below the Fed’s 2% longer run goal. However, if economic data shows faster progress, the Fed indicated that it could raise the fed funds rate sooner than expected.
The Fed changed its language slightly in December, indicating it would be “patient” in normalizing monetary policy. This shift helped ease investors’ worries that the Fed might raise rates too soon. However, as employment data released early in 2015 continued to look strong, anticipation began building that the Fed could raise its main policy rate as soon as June. As widely expected, after its March meeting, the Fed eliminated “patient” from its statement, but also highlighted the policymakers’ less optimistic view of the economy’s overall health as well as downgraded their inflation projections. The Fed’s April meeting seemed to further signal that a June rate hike was off the table. While the Fed attributed the first quarter’s economic weakness to temporary factors, the meeting minutes from April revealed that many Committee members believed the economic data available in June would be insufficient to meet the Fed’s criteria for initiating a rate increase. The June meeting bore out that presumption and the Fed decided to keep the target rate near zero. But the Committee also continued to telegraph the likelihood of at least one rate increase in 2015, which many analysts forecasted for September. During the September 2015 meeting (subsequent to the close of this reporting period), the Fed decided to keep the federal funds rate near zero despite broad speculation that it would increase rates. The Committee said it will keep the rate near zero until the economy has seen further improvement toward reaching the Fed’s goals of maximum employment and inflation approaching 2%. This assessment will take into account a wide range of information, including measures of labor market conditions, indicators of inflation pressures and inflation expectations, and readings on financial and international developments.
Certain statements in this report are forward-looking statements. Discussions of specific investments are for illustration only and are not intended as recommendations of individual investments. The forward-looking statements and other views expressed herein are those of the portfolio managers as of the date of this report. Actual future results or occurrences may differ significantly from those anticipated in any forward-looking statements and the views expressed herein are subject to change at any time, due to numerous market and other factors. The Funds disclaim any obligation to update publicly or revise any forward-looking statements or views expressed herein.
Refer to the Glossary of Terms Used in this Report for further definition of the terms used within this section.
Portfolio Managers’ Comments (continued)
The U.S. economy proved to be fairly resilient compared to other economies around the globe, boosted by an improving job market, declining gas prices and low mortgage rates. According to the government’s revised estimate, the U.S. economy increased at a 3.9% annualized rate in the second quarter of 2015, as measured by GDP, compared with a decrease of 0.6% in the first quarter of 2015 and increases of 5.0% in the third quarter 2014 and 2.2% in the fourth quarter 2014. The increase in real GDP in the second quarter reflected positive contributions from personal consumption expenditures, exports, state and local government spending and residential fixed investment that were partly offset by negative contributions from federal government spending, private inventory investment and nonresidential fixed investment. The Consumer Price Index (CPI) rose 0.2% year-over-year as of August 2015. The core CPI (which excludes food and energy) increased 1.8% during the same period, below the Fed’s unofficial longer term inflation objective of 2.0%. As of August 2015, the U.S. unemployment rate was 5.1%, a figure that is also considered “full employment” by some Fed officials. The housing market continued to post consistent gains as of its most recent reading for July 2015. The average home price in the S&P/Case-Shiller Index of 20 major metropolitan areas rose 5.0% for the twelve months ended July 2015 (most recent data available at the time this report was prepared).
Meanwhile, a number of issues weighed on economies across the globe including geopolitical turmoil, weak growth overseas and sharply falling oil prices, which were caused by the faltering global economy and the Organization of the Petroleum Exporting Countries (OPEC’s) refusal to cede market share. Falling oil prices propelled significant appreciation in the U.S. dollar, which hit a multi-year high versus a basket of other major currencies, supported by the confident Fed and weaker data coming out of Europe, Japan and China. In an effort to improve their economic growth, countries across the globe maintained extraordinarily accommodative monetary policies. The European Central Bank (ECB) launched a massive quantitative easing program via a government bond-buying program that pumped more than 1 trillion euros into the weak eurozone economy, while other central banks around the world enacted more than 30 policy easing actions during the first few months of 2015.
Later in the reporting period, political drama dominated the news including the escalating tensions over Greece’s debt issues and aggressive policy intervention by the Chinese government to deflate the country’s stock market bubble. Greece took front and center in world market headlines with defaults on its payments to the International Monetary Fund and threats of a potential exit from the European Monetary Union (EMU). By mid-July, Greece had agreed to austerity measures in return for more bailout funds. Meanwhile, after skyrocketing for nearly a year, China’s stock market suddenly shifted gears in June and embarked on a massive sell-off that quickly spilled over to the rest of the world. Investors pulled money out of Chinese stocks despite efforts by the country’s central bank to prop up the market by cutting interest rates to a record low. A number of factors helped fuel the sell-off, including weak Chinese economic data and falling commodity prices. By August 2015, oil prices had fallen to their lowest levels of the reporting period with prices for West Texas Intermediate (WTI) crude dipping below the $40/barrel level for a short time.
The environment during the reporting period proved to be challenging for the riskier areas of the bond market with corporate bonds, particularly in the high yield area, falling short of Treasuries and the broader bond market. The high yield segment was down nearly 3% as bonds from energy and commodity-related issuers exhibited significant volatility due to the sharp drop in oil prices and uncertainty about base commodity prices. The broader bond market, as measured by the Barclays Aggregate Bond Index, posted a return of 1.56% for the reporting period.
How did the Funds perform during the twelve-month reporting period ended August 31, 2015?
The tables in the Fund Performance and Expense Ratios section of this report provide total return performance information for the Funds for the one-year and since inception periods ended August 31, 2015. Each Fund’s Class A Share total returns at net asset value (NAV) are compared with the performance of the appropriate Morningstar Index and Lipper classification average.
What strategies were used to manage the Funds during the twelve-month reporting period ended August 31, 2015 and how did these strategies influence performance?
We manage each of the three risk categories of our Intelligent Risk Funds (Conservative, Growth and Moderate) using the same investment process. Our goal with each Fund is to provide investors with a stable level of risk that matches their risk tolerance through changing market conditions. Therefore, each Fund targets its own explicit daily volatility range that we believe to be appropriate for its risk category:
| | | | |
| Fund | | Daily Volatility Target (Annualized) | |
Nuveen Intelligent Risk Conservative Allocation Fund | | | 3.5% to 7% | |
Nuveen Intelligent Risk Growth Allocation Fund | | | 12% to 18% | |
Nuveen Intelligent Risk Moderate Allocation Fund | | | 7% to 12% | |
To keep each Fund’s volatility within its target range, we use our proprietary risk forecasting models to forecast future volatility across asset classes, and in turn, use that information to construct a risk-targeted portfolio. Risk forecasting and portfolio construction processes attempt to limit fluctuations in each portfolio’s volatility primarily by having exposure to a variety of different asset classes and dynamically adjusting exposure to these asset classes. To gain exposure to the various asset classes, the Funds are currently invested in a diverse blend of exchange-traded funds (ETFs) with broad exposures in equities, fixed income, real estate, commodities and cash.
Each Fund’s wide-ranging investable universe gives us the flexibility to reduce exposure to risky assets during periods of high volatility and increase exposure to risky assets during periods of low volatility, while maintaining a stable risk profile. This strategy offers the potential to meet each Fund’s investment objective in a range of economic environments by capitalizing on market upswings, while mitigating risk in down markets. Our goal is to proactively anticipate market volatility to protect investors from unintentionally taking on risk that is inconsistent with each Fund’s respective risk tolerance.
What was the overall volatility environment during the twelve-month reporting period?
Throughout much of the reporting period, annualized volatility remained below historical averages across many asset classes. One notable exception was 20+ year U.S. Treasury volatility, which remained above its historical average for two-thirds of the twelve-month reporting period. Specifically, 20+ year U.S. Treasury volatility averaged 14% and reached as high as 21% during the reporting period, compared to a historical average of 12.6%. Continued and growing debate over the timing and magnitude of future Fed action caused interest rate volatility, which generally translates to total return volatility, especially in longer duration fixed income assets. Aside from a few temporary spikes in high yield fixed income volatility, the volatility of other fixed income asset classes tracked by the investment team remained relatively stable and below their historic averages. By the end of the reporting period, however, the volatility levels of many fixed income asset classes were either close to or above historical averages.
Equity market volatility remained muted for a substantial portion of the twelve-month reporting period until spiking at the end of August due to global growth concerns after China released weak economic growth numbers. Until this point, investors had been experiencing consistently low levels of volatility in equities. For example, U.S. large-cap equity volatility remained below its historical average of 19.6% for 96% of the reporting period, ranging from a low of 8.5% in September 2014 to a high of 33.7% by the end of August 2015. This trend was consistent among the other equity asset classes tracked by the investment team, including U.S. small-cap, international developed and emerging market equities.
In other markets, unstable oil prices affected both the commodities and natural resource markets. Both areas of the market had been well below their historical average volatility levels at the beginning of the reporting period, but saw spikes in volatility in December. After trending back below average levels at the end of February, volatility across real assets spiked at the end of August along with broad equity markets. For example, at the end of the reporting period, natural resource equity volatility stood at 42%, well above its historical average of 27%.
How did the Funds perform and what changes were made to their portfolio allocations during this reporting period ended August 31, 2015?
Nuveen Intelligent Risk Conservative Allocation Fund
During the reporting period, the Nuveen Intelligent Risk Conservative Allocation Fund stayed within its target volatility range 93% of the time. An overweight to more volatile equity asset classes during the first half of the reporting period helped keep the Fund’s volatility within the target range during the low volatility environment. Shareholders should note that the benchmark does not employ the same volatility management strategy as the Fund and therefore the benchmark’s performance was greater than the Fund’s during a period where the Fund had lower exposure than the benchmark to volatile assets that performed well and higher exposure to uncorrelated asset classes such as commodities that performed poorly.
The Fund’s Class A Shares at NAV underperformed the Morningstar index and Lipper average for the twelve-month reporting period ended August 31, 2015. The Morningstar benchmark is heavily concentrated in fixed income and equities, but has very little exposure to real asset categories such as commodities and natural resources. Consequently, when real assets dramatically underperform most other asset classes, as they did during the reporting period, the Fund will tend to underperform the benchmark due to its broader diversification.
Portfolio Managers’ Comments (continued)
As has historically been the case in this Fund, our team allocated slightly more than half of its assets to fixed income securities on average during the reporting period. Gains in 20+ year U.S. Treasuries and municipal bonds outpaced those of U.S. equities; however, international equities and commodity-based investments continued to be a drag on the Fund’s performance. During the reporting period, 20+ year U.S. Treasuries advanced 5.4% as measured by the Barclays 20+ Year U.S. Treasury Bond Index, posting the largest gain of all the indexes tracked for the Fund. Municipal bonds posted a 2.5% gain, as measured by the Barclays Municipal Bond Index, while U.S. large-cap equities finished the reporting period up just 0.4% as measured by the Russell 1000® Index. As previously mentioned, the largest losses were seen in commodities and natural resources due in large part to oil price volatility. Natural resources, as measured by the S&P North American Natural Resources Index, suffered losses of 35.6% during the reporting period. A diversified blend of commodities, as measured by the Bloomberg Commodity Index, fared only slightly better than natural resources and finished with a loss of 28.1% return during the reporting period.
As volatility in real assets increased, we reduced the Fund’s allocations to real estate, commodities and natural resources. By the end of the reporting period, the Fund had no exposure to natural resource equities, but continued to hold approximately 7% in diversified commodity exposure and an additional 7% in dedicated gold exposure. With the proceeds, we initiated and increased its position in high yield bonds and short-term U.S. Treasuries. At the end of the reporting period, the Fund was markedly more defensive than it was at the beginning of the reporting period, with an overall increase in fixed income assets of 22%. As of August 31, 2015, the Fund was positioned with an underweight to equities and an overweight to fixed income relative to historical levels. Real asset exposure in the Fund was in line with its historical average.
Nuveen Intelligent Risk Growth Allocation Fund
During the reporting period, the Nuveen Intelligent Risk Growth Allocation Fund stayed within its target volatility range 66% of the time. However, if we were to extend the bottom of its 12% to 18% range to 10%, the Fund would have stayed in its volatility range 94% of the time. This indicates that when the Fund was outside of its target range, it was delivering volatility levels below its target range. Shareholders should note that the benchmark does not employ the same volatility management strategy as the Fund and therefore the benchmark’s performance was greater than the Fund’s during a period where the Fund had lower exposure than the benchmark to volatile assets that performed well and higher exposure to uncorrelated asset classes such as commodities that performed poorly.
The Fund’s Class A Shares at NAV underperformed the Morningstar index and Lipper average for the twelve-month reporting period ended August 31, 2015. The Morningstar benchmark is heavily concentrated in equities with a modest allocation to fixed income securities, but has very little exposure to real asset categories such as natural resources and commodities. Consequently, when real assets dramatically underperform most other asset classes, as they did during the reporting period, the Fund will tend to underperform the benchmark due to its broader diversification.
Due to the persistently low volatility levels across asset classes, our team allocated the majority of the Fund’s assets to equities throughout the reporting period. Also, because of the low volatility environment, we did not hold any fixed income investments in the Fund until the end of the reporting period. Although small-cap U.S. equities and large-cap U.S. equities produced minimal gains, U.S. equities were the main positive contributors to the Fund’s return over the past twelve months. Small caps remained flat, returning 0.0% during the reporting period, as measured by the Russell 2000® Index, while large caps gained only 0.4%, as measured by the Russell 1000® Index. However, international developed market and emerging market equities both posted losses, detracting from the Fund’s performance. For example, emerging market equities lost 21.2% during the reporting period, according to the FTSE Emerging Markets Index. Natural resources were the largest detractor of the Fund’s performance with a loss of 35.6% as measured by the S&P North American Natural Resources Index during the reporting period.
The most notable change we made to allocations during the reporting period was to decrease the Fund’s exposure to international developed equities from 32% to 4%. We reallocated most of the proceeds into emerging market equities, which increased from 1% to 21% during the reporting period. Due to the spike in volatility in late August, we initiated a position in long duration U.S. Treasuries at the end of the reporting period. As of August 31, 2015, the Fund was positioned with overweights to equities and fixed income and an underweight to real assets relative to historical levels. Unless the heightened volatility seen at the end of August remains, we expect to continue allocating a substantial amount of the Fund into global equities to capitalize on the supportive environment for higher risk investments.
Nuveen Intelligent Risk Moderate Allocation Fund
During the reporting period, the Nuveen Intelligent Risk Moderate Allocation Fund stayed within its target volatility range 96% of the time. An overweight to more volatile asset classes helped keep the Fund’s volatility within the target range. Shareholders should note that the benchmark does not employ the same volatility management strategy as the Fund and therefore the benchmark’s performance was greater than the Fund’s during a period where the Fund had lower exposure than the benchmark to volatile assets that performed well and higher exposure to uncorrelated asset classes such as commodities that performed poorly.
The Fund’s Class A Shares at NAV underperformed the Morningstar index and Lipper average for the twelve-month reporting period ended August 31, 2015. The Morningstar benchmark is heavily concentrated in equities followed by fixed income securities, but has very little exposure to real asset categories such as commodities and natural resources. Consequently, when real assets dramatically underperform most other asset classes, as they did during the reporting period, the Fund will tend to underperform the benchmark due to its broader diversification.
We maintained the Fund’s relatively large allocation to global equities and commodities and a reduced allocation to fixed income during the reporting period. By concentrating the Fund’s exposures in more volatile asset classes, we were able to keep volatility consistently within its target range. At the end of the reporting period, volatility spiked due to global growth concerns, and we increased allocations in defensive fixed income assets to keep overall portfolio volatility within its target range.
Our allocations to large-cap U.S. equities and long duration U.S. Treasuries in the Fund benefited investors, while allocations to commodities and natural resources hindered performance. U.S. large-cap equities finished the reporting period up 0.4% as measured by the Russell 1000® Index and long duration U.S. Treasuries gained 5.4%, according to the Barclays 20+ Year U.S. Treasury Bond Index. However, allocations to commodities and natural resources, which we use to help diversify risk in the Fund, did prove to be a drag on performance. The commodities asset class finished the reporting period with a loss of 28.1% return as measured by Bloomberg Commodity Index, while natural resources lost 35.6% during the reporting period, as measured by the S&P North American Natural Resources Index. Although the Fund’s exposure to gold varied throughout the reporting period, that asset class also declined and ended the reporting period down almost 12%, according to Bloomberg.
Our team began increasing the Fund’s exposure to long duration U.S. Treasuries early in the reporting period. By the end of the reporting period, the Fund had a target allocation of approximately 21% to long duration U.S. Treasuries, which benefited investors. While we did decrease overall exposure to real assets, the Fund continued to hold approximately 14% in dedicated gold exposure, 9% in commodities and 4% in natural resources at the end of the reporting period. We maintained the Fund’s meaningful exposure to gold as a hedge against substantial global market declines, geopolitical events and unexpected inflation.
While we prefer to balance risk across the Fund’s asset classes, the low volatility environment suggested that riskier asset classes, such as equities, would perform well and help keep the Fund within its target volatility range of 7% to 12%. Due to heightened volatility at the end of the reporting period, the Fund ended the reporting period positioned somewhat more defensively than it was at the beginning of the reporting period. As of August 31, 2015, the Fund was positioned with underweights to equities and real assets and an overweight to fixed income relative to historical levels.
Risk Considerations
and Dividend Information
Risk Considerations
Mutual fund investing involves risk; principal loss is possible. There is no guarantee that the Funds will achieve their investment objectives and the portfolio managers’ asset allocation decisions may adversely affect Fund performance. Each Fund is exposed to the risks of the underlying derivative instruments, ETFs, municipal bonds, corporate bonds, foreign government bonds, equity securities, commodities, real estate, asset-backed securities, mortgage-backed securities, inflation-protected securities and short-term securities that may be held in the portfolio. These risks include market risk, frequent trading risk, index methodology risk, other investment companies risk, liquidity risk, interest rate risk, and credit risk. As interest rates rise, bond prices fall. The credit risk and liquidity risk is heightened for non-investment grade or high-yield securities. The use of derivatives involves substantial financial risks and transaction costs. Commodities may be highly volatile and foreign investments are subject to additional risks including currency fluctuations, and economic or political instability. These risks are magnified in emerging markets. In addition, each Fund will bear its proportionate share of any fees and expenses paid by the ETFs in which it invests.
Dividend Information for Nuveen Intelligent Risk Conservation Allocation Fund
Nuveen Intelligent Risk Conservative Allocation Fund seeks to pay regular monthly dividends out of its net investment income at a rate that reflects the Fund’s past and projected net income performance. To permit the Fund to maintain a more stable monthly dividend, it may pay dividends at a rate that may be more or less than the amount of net income actually earned by the Fund during the period. If the Fund has cumulatively earned more than it has paid in dividends, it will hold the excess in reserve as undistributed net investment income (UNII) as part of the Fund’s net asset value. Conversely, if the Fund has cumulatively paid in dividends more than it has earned, the excess will constitute a negative UNII that will likewise be reflected in the Fund’s net asset value. The Fund will, over time, pay all its net investment income as dividends to shareholders. As of August 31, 2015, Nuveen Intelligent Risk Conservative Allocation Fund had a zero UNII balance for tax purposes and a negative UNII balance for financial reporting purposes.
During the fiscal year end August 31, 2015, market fluctuations caused uneven income flows that in turn resulted in lower-than-expected net investment income for the Nuveen Intelligent Risk Conservative Allocation Fund. As a result, the Fund paid out more in its monthly dividends than the amount of its net investment income; as a further result, the Fund later re-characterized a portion of the regular monthly distributions for each class of the Fund’s shares, as outlined in the following table, as capital gains. The Fund also paid a separate capital gain distribution during the year.
The following table presents the regular, monthly distributions for the Nuveen Intelligent Risk Conservative Allocation Fund for the fiscal year ended August 31, 2015. The final determination of the source and characteristics of all distributions will be made in early 2016 and reported to shareholders on Form 1099-DIV at that time.
Nuveen Intelligent Risk Conservative Allocation Fund
| | | | | | | | | | | | | | | | |
| For year ended August 31, 2015 | | Class A Shares | | | Class C Shares | | | Class R3 Shares | | | Class I Shares | |
Cumulative regular monthly distribution, per share: | | | | | | | | | | | | | | | | |
From net investment income | | $ | 0.16 | | | $ | 0.01 | | | $ | 0.11 | | | $ | 0.21 | |
From net realized capital gains | | | 0.10 | | | | 0.10 | | | | 0.10 | | | | 0.10 | |
Return of capital | | | – | | | | – | | | | – | | | | – | |
Total | | $ | 0.26 | | | $ | 0.11 | | | $ | 0.21 | | | $ | 0.31 | |
For financial reporting purposes, the composition and per share amounts of the Fund’s dividends for the reporting period are presented in this report’s Statement of Changes in Net Assets and Financial Highlights, respectively. For income tax purposes, distribution information for each Fund as of its most recent tax year end is presented in Note 6—Income Tax Information within the Notes to Financial Statements of this report.
Dividend Information for Nuveen Intelligent Risk Moderate Allocation Fund
Nuveen Intelligent Risk Moderate Allocation Fund pays quarterly dividends out of its income earned, net of expenses (net investment income). During the current fiscal period, dividend payments earned by the Fund were re-characterized by the ETFs in which the Fund invests as either a capital gain distribution or a return of capital. Due to the ETF re-characterization, the Fund distributed an amount greater than its net investment income, which resulted in the Fund re-characterizing a portion of its regular quarterly distributions for each class of the Fund’s shares as capital gains or a return of capital, as presented in the table below.
The following table presents the regular, quarterly distributions for the Nuveen Intelligent Risk Moderate Allocation Fund for the fiscal year ended August 31, 2015. The final determination of the source and characteristics of all distributions will be made in early 2016 and reported to shareholders on Form 1099-DIV at that time.
Nuveen Intelligent Risk Moderate Allocation Fund
| | | | | | | | | | | | | | | | |
| For year ended August 31, 2015 | | Class A Shares | | | Class C Shares | | | Class R3 Shares | | | Class I Shares | |
Cumulative quarterly distribution, per share: | | | | | | | | | | | | | | | | |
From net investment income | | $ | 0.14 | | | $ | 0.02 | | | $ | 0.10 | | | $ | 0.18 | |
From net realized capital gains | | | 0.08 | | | | 0.08 | | | | 0.08 | | | | 0.08 | |
Return of capital | | | 0.04 | | | | 0.04 | | | | 0.04 | | | | 0.04 | |
Total | | $ | 0.26 | | | $ | 0.14 | | | $ | 0.22 | | | $ | 0.30 | |
For financial reporting purposes, the composition and per share amounts of the Fund’s dividends for the reporting period are presented in this report’s Statement of Changes in Net Assets and Financial Highlights, respectively. For income tax purposes, distribution information for each Fund as of its most recent tax year end is presented in Note 6—Income Tax Information within the Notes to Financial Statements of this report.
THIS PAGE INTENTIONALLY LEFT BLANK
Fund Performance
and Expense Ratios
The Fund Performance and Expense Ratios for each Fund are shown within this section of the report.
Returns quoted represent past performance, which is no guarantee of future results. Current performance may be higher or lower than the performance shown. Investment returns and principal value will fluctuate so that when shares are redeemed, they may be worth more or less than their original cost. Returns without sales charges would be lower if the sales charge were included. Returns do not reflect the deduction of taxes that a shareholder would pay on Fund distributions or the redemption of Fund shares.
Returns may reflect an agreement by the investment adviser to waive certain fees and/or reimburse expenses during the periods presented. If any such waivers and/or reimbursements had not been in place, returns would have been reduced. See Notes to Financial Statements, Note 7—Management Fees and Other Transactions with Affiliates for more information. For the most recent month-end performance visit www.nuveen.com or call (800) 257-8787.
Returns reflect differences in sales charges and expenses, which are primarily differences in distribution and service fees, and assume reinvestment of dividends and capital gains.
Comparative index and Lipper return information is provided for Class A Shares at net asset value (NAV) only.
The expense ratios shown reflect total operating expenses (before fee waivers and/or expense reimbursements, if any) as shown in the most recent prospectus. The expense ratios include management fees and other fees and expenses.
Fund Performance and Expense Ratios (continued)
Nuveen Intelligent Risk Conservative Allocation Fund
Refer to the first page of this Fund Performance and Expense Ratios section for further explanation of the information included within this section. Refer to the Glossary of Terms Used in this Report for definitions of terms used within this section.
Fund Performance
Average Annual Total Returns as of August 31, 2015
| | | | | | | | |
| | | Average Annual | |
| | | 1-Year | | | Since
Inception | |
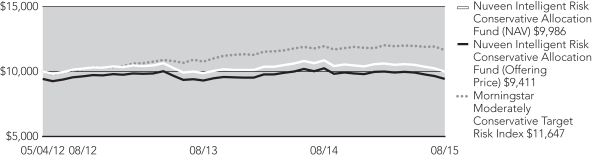
Class A Shares at NAV | | | (8.06)% | | | | (0.06)% | |
Class A Shares at maximum Offering Price | | | (13.33)% | | | | (1.82)% | |
Morningstar Moderately Conservative Target Risk Index | | | (2.48)% | | | | 4.72% | |
Lipper Mixed-Asset Target Allocation Conservative Funds Classification Average | | | (2.38)% | | | | 4.20% | |
| | |
Class C Shares | | | (8.75)% | | | | (0.81)% | |
Class R3 Shares | | | (8.32)% | | | | (0.33)% | |
Class I Shares | | | (7.84)% | | | | 0.18% | |
Average Annual Total Returns as of September 30, 2015 (Most Recent Calendar Quarter)
| | | | | | | | |
| | | Average Annual | |
| | | 1-Year | | | Since
Inception | |
Class A Shares at NAV | | | (5.19)% | | | | (0.37)% | |
Class A Shares at maximum Offering Price | | | (10.63)% | | | | (2.08)% | |
Class C Shares | | | (5.90)% | | | | (1.12)% | |
Class R3 Shares | | | (5.46)% | | | | (0.64)% | |
Class I Shares | | | (4.96)% | | | | (0.14)% | |
Since inception returns are from 5/04/12. Indexes and Lipper averages are not available for direct investment.
Class A Shares have a maximum 5.75% sales charge (Offering Price). Class A Share purchases of $1 million or more are sold at net asset value without an up-front sales charge but may be subject to a contingent deferred sales charge (CDSC), also known as a back-end sales charge, if redeemed within twelve months of purchase. Class C Shares have a 1% CDSC for redemptions within less than twelve months, which is not reflected in the one-year total return. Class R3 Shares have no sales charge and are only available for purchase by eligible retirement plans. Class I Shares have no sales charge and may be purchased under limited circumstances or by specified classes of investors.
Expense Ratios as of Most Recent Prospectus
| | | | | | | | | | | | | | | | |
| | | Share Class | |
| | | Class A | | | Class C | | | Class R3 | | | Class I | |
Gross Expense Ratios* | | | 4.43% | | | | 4.44% | | | | 4.61% | | | | 3.39% | |
Net Expense Ratios* | | | 1.25% | | | | 2.00% | | | | 1.50% | | | | 1.00% | |
The Fund’s investment adviser has agreed to waive fees and/or reimburse expenses through September 30, 2016 so that total annual Fund operating expenses (excluding 12b-1 distribution and/or service fees, interest expenses, taxes, fees incurred in acquiring and disposing of portfolio securities, acquired fund fees and expenses, and extraordinary expenses) do not exceed 0.71% of the average daily net assets of any class of Fund shares. The expense limitation expiring September 30, 2016 may be terminated or modified prior to that date only with the approval of the Board of Trustees of the Fund.
| * | The expense ratios include acquired fund fees and expenses of 0.32%, which reflect the fees and expenses of the exchange-traded funds in which the Fund invests. |
Growth of an Assumed $10,000 Investment as of August 31, 2015 – Class A Shares
The graphs do not reflect the deduction of taxes that a shareholder may pay on Fund distributions or the redemption of Fund shares.
Fund Performance and Expense Ratios (continued)
Nuveen Intelligent Risk Growth Allocation Fund
Refer to the first page of this Fund Performance and Expense Ratios section for further explanation of the information included within this section. Refer to the Glossary of Terms Used in this Report for definitions of terms used within this section.
Fund Performance
Average Annual Total Returns as of August 31, 2015
| | | | | | | | |
| | | Average Annual | |
| | | 1-Year | | | Since
Inception | |
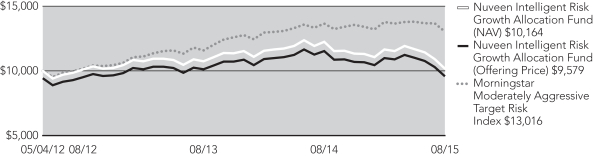
Class A Shares at NAV | | | (16.88)% | | | | 0.49% | |
Class A Shares at maximum Offering Price | | | (21.67)% | | | | (1.28)% | |
Morningstar Moderately Aggressive Target Risk Index | | | (4.68)% | | | | 8.26% | |
Lipper Mixed-Asset Target Allocation Growth Funds Classification Average | | | (3.51)% | | | | 9.45% | |
| | |
Class C Shares | | | (17.46)% | | | | (0.26)% | |
Class R3 Shares | | | (17.06)% | | | | 0.24% | |
Class I Shares | | | (16.63)% | | | | 0.74% | |
Average Annual Total Returns as of September 30, 2015 (Most Recent Calendar Quarter)
| | | | | | | | |
| | | Average Annual | |
| | | 1-Year | | | Since
Inception | |
Class A Shares at NAV | | | (15.33)% | | | | (0.71)% | |
Class A Shares at maximum Offering Price | | | (20.19)% | | | | (2.42)% | |
Class C Shares | | | (15.98)% | | | | (1.45)% | |
Class R3 Shares | | | (15.55)% | | | | (0.97)% | |
Class I Shares | | | (15.10)% | | | | (0.47)% | |
Since inception returns are from 5/04/12. Indexes and Lipper averages are not available for direct investment.
Class A Shares have a maximum 5.75% sales charge (Offering Price). Class A Share purchases of $1 million or more are sold at net asset value without an up-front sales charge but may be subject to a contingent deferred sales charge (CDSC), also known as a back-end sales charge, if redeemed within twelve months of purchase. Class C Shares have a 1% CDSC for redemptions within less than twelve months, which is not reflected in the one-year total return. Class R3 Shares have no sales charge and are only available for purchase by eligible retirement plans. Class I Shares have no sales charge and may be purchased under limited circumstances or by specified classes of investors.
Expense Ratios as of Most Recent Prospectus
| | | | | | | | | | | | | | | | |
| | | Share Class | |
| | | Class A | | | Class C | | | Class R3 | | | Class I | |
Gross Expense Ratios* | | | 3.77% | | | | 4.62% | | | | 4.16% | | | | 3.15% | |
Net Expense Ratios* | | | 1.18% | | | | 1.93% | | | | 1.43% | | | | 0.93% | |
The Fund’s investment adviser has agreed to waive fees and/or reimburse expenses through September 30, 2016 so that total annual Fund operating expenses (excluding 12b-1 distribution and/or service fees, interest expenses, taxes, fees incurred in acquiring and disposing of portfolio securities, acquired fund fees and expenses, and extraordinary expenses) do not exceed 0.71% of the average daily net assets of any class of Fund shares. The expense limitation expiring September 30, 2016 may be terminated or modified prior to that date only with the approval of the Board of Trustees of the Fund.
| * | The expense ratios include acquired fund fees and expenses of 0.25%, which reflect the fees and expenses of the exchange-traded funds in which the Fund invests. |
Growth of an Assumed $10,000 Investment as of August 31, 2015 – Class A Shares
The graphs do not reflect the deduction of taxes that a shareholder may pay on Fund distributions or the redemption of Fund shares.
Fund Performance and Expense Ratios (continued)
Nuveen Intelligent Risk Moderate Allocation Fund
Refer to the first page of this Fund Performance and Expense Ratios section for further explanation of the information included within this section. Refer to the Glossary of Terms Used in this Report for definitions of terms used within this section.
Fund Performance
Average Annual Total Returns as of August 31, 2015
| | | | | | | | |
| | | Average Annual | |
| | | 1-Year | | | Since
Inception | |
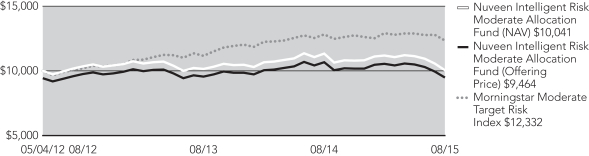
Class A Shares at NAV | | | (11.30)% | | | | 0.12% | |
Class A Shares at maximum Offering Price | | | (16.40)% | | | | (1.64)% | |
Morningstar Moderate Target Risk Index | | | (3.66)% | | | | 6.52% | |
Lipper Mixed-Asset Target Allocation Moderate Funds Classification Average | | | (3.25)% | | | | 6.33% | |
| | |
Class C Shares | | | (11.94)% | | | | (0.62)% | |
Class R3 Shares | | | (11.50)% | | | | (0.14)% | |
Class I Shares | | | (11.02)% | | | | 0.38% | |
Average Annual Total Returns as of September 30, 2015 (Most Recent Calendar Quarter)
| | | | | | | | |
| | | Average Annual | |
| | | 1-Year | | | Since
Inception | |
Class A Shares at NAV | | | (7.31)% | | | | (0.40)% | |
Class A Shares at maximum Offering Price | | | (12.63)% | | | | (2.12)% | |
Class C Shares | | | (8.01)% | | | | (1.15)% | |
Class R3 Shares | | | (7.50)% | | | | (0.66)% | |
Class I Shares | | | (7.09)% | | | | (0.17)% | |
Since inception returns are from 5/04/12. Indexes and Lipper averages are not available for direct investment.
Class A Shares have a maximum 5.75% sales charge (Offering Price). Class A Share purchases of $1 million or more are sold at net asset value without an up-front sales charge but may be subject to a contingent deferred sales charge (CDSC), also known as a back-end sales charge, if redeemed within twelve months of purchase. Class C Shares have a 1% CDSC for redemptions within less than twelve months, which is not reflected in the one-year total return. Class R3 Shares have no sales charge and are only available for purchase by eligible retirement plans. Class I Shares have no sales charge and may be purchased under limited circumstances or by specified classes of investors.
Expense Ratios as of Most Recent Prospectus
| | | | | | | | | | | | | | | | |
| | | Share Class | |
| | | Class A | | | Class C | | | Class R3 | | | Class I | |
Gross Expense Ratios* | | | 4.20% | | | | 4.72% | | | | 4.23% | | | | 3.21% | |
Net Expense Ratios* | | | 1.26% | | | | 2.01% | | | | 1.51% | | | | 1.01% | |
The Fund’s investment adviser has agreed to waive fees and/or reimburse expenses through September 30, 2016 so that total annual Fund operating expenses (excluding 12b-1 distribution and/or service fees, interest expenses, taxes, fees incurred in acquiring and disposing of portfolio securities, acquired fund fees and expenses, and extraordinary expenses) do not exceed 0.71% of the average daily net assets of any class of Fund shares. The expense limitation expiring September 30, 2016 may be terminated or modified prior to that date only with the approval of the Board of Trustees of the Fund.
| * | The expense ratios include acquired fund fees and expenses of 0.33%, which reflect the fees and expenses of the exchange-traded funds in which the Fund invests. |
Growth of an Assumed $10,000 Investment as of August 31, 2015 – Class A Shares
The graphs do not reflect the deduction of taxes that a shareholder may pay on Fund distributions or the redemption of Fund shares.
Holding
Summaries as of August 31, 2015
This data relates to the securities held in each Fund’s portfolio of investments as of the end of the reporting period. It should not be construed as a measure of performance for the Fund itself. Holdings are subject to change.
A copy of the most recent financial statements for the exchange-traded funds in which the Fund invests can be obtained directly from the Securities and Exchange Commission on its website at http://www.sec.gov.
Nuveen Intelligent Risk Conservative Allocation Fund
Fund Allocation
(% of net assets)
| | | | |
Exchange-Traded Commodity Funds | | | 14.7% | |
Exchange-Traded Equity Funds | | | 22.7% | |
Exchange-Traded Fixed Income Funds | | | 62.4% | |
Other Assets Less Liabilities | | | 0.2% | |
Net Assets | | | 100% | |
| | | | | | | | |
| Exchange-Traded Commodity Funds | | Weighting
(% of net assets) | | | 1-Year
Average Annual
Total Returns | |
PowerShares DB Commodity Index Tracking Fund | | | 7.4% | | | | (37.01)% | |
PowerShares DB Gold Fund | | | 7.3% | | | | (13.30)% | |
| | |
| Exchange-Traded Equity Funds | | | | | | | | |
iShares® Russell 1000® Index Fund | | | 6.9% | | | | 0.29% | |
iShares® Russell 2000® Index Fund | | | 5.8% | | | | 0.11% | |
Vanguard FTSE Developed Markets ETF | | | 5.2% | | | | (7.99)% | |
Vanguard REIT ETF | | | 4.8% | | | | (0.22)% | |
| | |
| Exchange-Traded Fixed Income Funds | | | | | | | | |
iShares® Barclays 1-3 Year Treasury Bond Fund | | | 8.0% | | | | 0.68% | |
iShares® Barclays 20+ Year Treasury Bond Fund | | | 10.6% | | | | 5.31% | |
iShares® National AMT-Free Municipal Bond Fund | | | 25.8% | | | | 1.88% | |
iShares® TIPS Bond ETF | | | 1.5% | | | | (2.88)% | |
SPDR® Barclays Capital High Yield Bond Fund | | | 16.5% | | | | (5.42)% | |
Nuveen Intelligent Risk Growth Allocation Fund
Fund Allocation
(% of net assets)
| | | | |
Exchanged-Traded Commodity Funds | | | 8.8% | |
Exchange-Traded Equity Funds | | | 83.9% | |
Exchange-Traded Fixed Income Funds | | | 7.7% | |
Money Market Funds | | | 0.0% | |
Other Assets Less Liabilities | | | (0.4)% | |
Net Assets | | | 100% | |
| | | | | | | | |
| Exchange-Traded Commodity Funds | | Weighting
(% of net assets) | | | 1-Year
Average Annual
Total Returns | |
PowerShares DB Gold Fund | | | 8.8% | | | | (13.30)% | |
| | |
| Exchange-Traded Equity Funds | | | | | | | | |
iShares® Russell 1000® Index Fund | | | 9.1% | | | | 0.29% | |
iShares® Russell 2000® Index Fund | | | 29.3% | | | | 0.11% | |
iShares® S&P North American Natural Resources Sector Index Fund | | | 20.5% | | | | (34.22)% | |
Vanguard FTSE Developed Markets ETF | | | 4.0% | | | | (7.99)% | |
Vanguard FTSE Emerging Markets ETF | | | 21.0% | | | | (21.52)% | |
| | |
| Exchange-Traded Fixed Income Funds | | | | | | | | |
iShares® Barclays 20+ Year Treasury Bond Fund | | | 7.7% | | | | 5.31% | |
Holding Summaries as of August 31, 2015 (continued)
Nuveen Intelligent Risk Moderate Allocation Fund
Fund Allocation
(% of net assets)
| | | | |
Exchange-Traded Commodity Funds | | | 22.0% | |
Exchange-Traded Equity Funds | | | 51.5% | |
Exchange-Traded Fixed Income Funds | | | 26.0% | |
Other Assets Less Liabilities | | | 0.5% | |
Net Assets | | | 100% | |
| | | | | | | | |
| Exchange-Traded Commodity Funds | | Weighting
(% of net assets) | | | 1-Year
Average Annual
Total Returns | |
PowerShares DB Commodity Index Tracking Fund | | | 8.5% | | | | (37.01)% | |
PowerShares DB Gold Fund | | | 13.5% | | | | (13.30)% | |
| | |
| Exchange-Traded Equity Funds | | | | | | | | |
iShares® Russell 1000® Index Fund | | | 13.4% | | | | 0.29% | |
iShares® Russell 2000® Index Fund | | | 12.0% | | | | 0.11% | |
iShares® S&P North American Natural Resources Sector Index Fund | | | 3.9% | | | | (34.22)% | |
Vanguard FTSE Developed Markets ETF | | | 10.6% | | | | (7.99)% | |
Vanguard FTSE Emerging Markets ETF | | | 6.7% | | | | (21.52)% | |
Vanguard REIT ETF | | | 4.9% | | | | (0.22)% | |
| | |
| Exchange-Traded Fixed Income Funds | | | | | | | | |
iShares® Barclays 20+ Year Treasury Bond Fund | | | 20.6% | | | | 5.31% | |
iShares® National AMT-Free Municipal Bond Fund | | | 4.0% | | | | 1.88% | |
iShares® TIPS Bond ETF | | | 1.4% | | | | (2.88)% | |
Expense
Examples
As a shareholder of one or more of the Funds, you incur two types of costs: (1) transaction costs, including up-front and back-end sales charges (loads) or redemption fees, where applicable; and (2) ongoing costs, including management fees; distribution and service (12b-1) fees, where applicable; and other Fund expenses. The Examples below are intended to help you understand your ongoing costs (in dollars) of investing in the Funds and to compare these costs with the ongoing costs of investing in other mutual funds.
The Examples below are based on an investment of $1,000 invested at the beginning of the period and held through the period ended August 31, 2015.
The beginning of the period is March 1, 2015.
The information under “Actual Performance,” together with the amount you invested, allows you to estimate actual expenses incurred over the reporting period. Simply divide your account value by $1,000 (for example, an $8,600 account value divided by $1,000 = 8.60) and multiply the result by the cost shown for your share class, in the row entitled “Expenses Incurred During Period” to estimate the expenses incurred on your account during this period.
The information under “Hypothetical Performance,” provides information about hypothetical account values and hypothetical expenses based on each Fund’s actual expense ratio and an assumed rate of return of 5% per year before expenses, which is not the Fund’s actual return. The hypothetical account values and expenses may not be used to estimate the actual ending account balance or expense you incurred for the period. You may use this information to compare the ongoing costs of investing in the Fund and other funds. To do so, compare this 5% hypothetical example with the 5% hypothetical examples that appear in the shareholder reports of the other funds.
Please note that the expenses shown in the tables are meant to highlight your ongoing costs only and do not reflect any transaction costs. Therefore, the hypothetical information is useful in comparing ongoing costs only, and will not help you determine the relative total costs of owning different funds or share classes. In addition, if these transaction costs were included, your costs would have been higher.
In addition to the fees and expenses which the Funds bear directly; the Funds indirectly bear a pro rata share of the fees and expenses of the exchange-traded funds in which the Funds invest. Because the exchange-traded funds have varied expenses and fee levels and the Funds may own different proportions at different times, the amount of fees and expenses incurred indirectly by the Funds will vary. These exchange-traded fund fees and expenses are not included in the expenses shown in the tables.
Nuveen Intelligent Risk Conservative Allocation Fund
| | | | | | | | | | | | | | | | |
| | | Share Class | |
| | | Class A | | | Class C | | | Class R3 | | | Class I | |
Actual Performance | | | | | | | | | | | | | | | | |
Beginning Account Value | | $ | 1,000.00 | | | $ | 1,000.00 | | | $ | 1,000.00 | | | $ | 1,000.00 | |
Ending Account Value | | $ | 941.40 | | | $ | 937.60 | | | $ | 940.10 | | | $ | 942.50 | |
Expenses Incurred During Period | | $ | 4.50 | | | $ | 8.16 | | | $ | 5.72 | | | $ | 3.28 | |
Hypothetical Performance (5% annualized return before expenses) | | | | | | | | | | | | | | | | |
Beginning Account Value | | $ | 1,000.00 | | | $ | 1,000.00 | | | $ | 1,000.00 | | | $ | 1,000.00 | |
Ending Account Value | | $ | 1,020.57 | | | $ | 1,016.79 | | | $ | 1,019.31 | | | $ | 1,021.83 | |
Expenses Incurred During Period | | $ | 4.69 | | | $ | 8.49 | | | $ | 5.96 | | | $ | 3.41 | |
For each class of the Fund, expenses are equal to the Fund’s annualized net expense ratio of 0.92%, 1.67%, 1.17% and 0.67% for Classes A, C, R3 and I, respectively, multiplied by the average account value over the period, multiplied by 184/365 (to reflect the one-half year period).
Expense Examples (continued)
Nuveen Intelligent Risk Growth Allocation Fund
| | | | | | | | | | | | | | | | |
| | | Share Class | |
| | | Class A | | | Class C | | | Class R3 | | | Class I | |
Actual Performance | | | | | | | | | | | | | | | | |
Beginning Account Value | | $ | 1,000.00 | | | $ | 1,000.00 | | | $ | 1,000.00 | | | $ | 1,000.00 | |
Ending Account Value | | $ | 872.80 | | | $ | 869.70 | | | $ | 871.70 | | | $ | 873.80 | |
Expenses Incurred During Period | | $ | 4.34 | | | $ | 7.87 | | | $ | 5.57 | | | $ | 3.16 | |
Hypothetical Performance (5% annualized return before expenses) | | | | | | | | | | | | | | | | |
Beginning Account Value | | $ | 1,000.00 | | | $ | 1,000.00 | | | $ | 1,000.00 | | | $ | 1,000.00 | |
Ending Account Value | | $ | 1,020.57 | | | $ | 1,016.79 | | | $ | 1,019.26 | | | $ | 1,021.83 | |
Expenses Incurred During Period | | $ | 4.69 | | | $ | 8.49 | | | $ | 6.01 | | | $ | 3.41 | |
For each class of the Fund, expenses are equal to the Fund’s annualized net expense ratio of 0.92%, 1.67%, 1.18% and 0.67% for Classes A, C, R3 and I, respectively, multiplied by the average account value over the period, multiplied by 184/365 (to reflect the one-half year period).
Nuveen Intelligent Risk Moderate Allocation Fund
| | | | | | | | | | | | | | | | |
| | | Share Class | |
| | | Class A | | | Class C | | | Class R3 | | | Class I | |
Actual Performance | | | | | | | | | | | | | | | | |
Beginning Account Value | | $ | 1,000.00 | | | $ | 1,000.00 | | | $ | 1,000.00 | | | $ | 1,000.00 | |
Ending Account Value | | $ | 899.20 | | | $ | 895.80 | | | $ | 898.00 | | | $ | 900.80 | |
Expenses Incurred During Period | | $ | 4.40 | | | $ | 7.98 | | | $ | 5.60 | | | $ | 3.21 | |
Hypothetical Performance (5% annualized return before expenses) | | | | | | | | | | | | | | | | |
Beginning Account Value | | $ | 1,000.00 | | | $ | 1,000.00 | | | $ | 1,000.00 | | | $ | 1,000.00 | |
Ending Account Value | | $ | 1,020.57 | | | $ | 1,016.79 | | | $ | 1,019.31 | | | $ | 1,021.83 | |
Expenses Incurred During Period | | $ | 4.69 | | | $ | 8.49 | | | $ | 5.96 | | | $ | 3.41 | |
For each class of the Fund, expenses are equal to the Fund’s annualized net expense ratio of 0.92%, 1.67%, 1.17% and 0.67% for Classes A, C, R3 and I, respectively, multiplied by the average account value over the period, multiplied by 184/365 (to reflect the one-half year period).
Report of
Independent Registered Public Accounting Firm
To the Board of Trustees and Shareholders of
Nuveen Investment Trust:
In our opinion, the accompanying statements of assets and liabilities, including the portfolios of investments, and the related statements of operations and of changes in net assets and the financial highlights present fairly, in all material respects, the financial position of Nuveen Intelligent Risk Conservative Allocation Fund, Nuveen Intelligent Risk Growth Allocation Fund and Nuveen Intelligent Risk Moderate Allocation Fund (each a series of the Nuveen Investment Trust, hereinafter referred to as the “Funds”) at August 31, 2015, the results of each of their operations for the year then ended, the changes in each of their net assets for each of the two years in the period then ended and the financial highlights for each of the periods presented, in conformity with accounting principles generally accepted in the United States of America. These financial statements and financial highlights (hereafter referred to as “financial statements”) are the responsibility of the Funds’ management. Our responsibility is to express an opinion on these financial statements based on our audits. We conducted our audits of these financial statements in accordance with the standards of the Public Company Accounting Oversight Board (United States). Those standards require that we plan and perform the audit to obtain reasonable assurance about whether the financial statements are free of material misstatement. An audit includes examining, on a test basis, evidence supporting the amounts and disclosures in the financial statements, assessing the accounting principles used and significant estimates made by management, and evaluating the overall financial statement presentation. We believe that our audits, which included confirmation of securities at August 31, 2015 by correspondence with the custodian and brokers, provide a reasonable basis for our opinion.
PricewaterhouseCoopers LLP
Chicago, IL
October 28, 2015
Nuveen Intelligent Risk Conservative Allocation Fund
| | |
| Portfolio of Investments | | August 31, 2015 |
| | | | | | | | |
| Shares | | | Description (1), (2) | | Value | |
| | |
| | | | LONG-TERM INVESTMENTS – 99.8% | | | | |
| | |
| | | | EXCHANGE-TRADED FUNDS – 99.8% | | | | |
| | |
| | | | Commodity Funds – 14.7% | | | |
| | |
| | 4,741 | | | PowerShares DB Commodity Index Tracking Fund, (3) | | $ | 74,386 | |
| | |
| | 1,973 | | | PowerShares DB Gold Fund, (3) | | | 73,494 | |
| | | | Total Commodity Funds | | | 147,880 | |
| | |
| | | | Equity Funds – 22.7% | | | |
| | |
| | 633 | | | iShares® Russell 1000® Index Fund | | | 70,035 | |
| | |
| | 506 | | | iShares® Russell 2000® Index Fund | | | 58,291 | |
| | |
| | 1,400 | | | Vanguard FTSE Developed Markets ETF | | | 52,248 | |
| | |
| | 660 | | | Vanguard REIT ETF | | | 48,860 | |
| | | | Total Equity Funds | | | 229,434 | |
| | |
| | | | Fixed Income Funds – 62.4% | | | |
| | |
| | 950 | | | iShares® Barclays 1-3 Year Treasury Bond Fund | | | 80,541 | |
| | |
| | 882 | | | iShares® Barclays 20+ Year Treasury Bond Fund | | | 107,092 | |
| | |
| | 2,394 | | | iShares® National AMT-Free Municipal Bond Fund | | | 260,564 | |
| | |
| | 133 | | | iShares® TIPS Bond ETF | | | 14,840 | |
| | |
| | 4,499 | | | SPDR Barclays Capital High Yield Bond Fund | | | 166,508 | |
| | | | Total Fixed Income Funds | | | 629,545 | |
| | | | Total Long-Term Investments (cost $995,501) | | | 1,006,859 | |
| | | | Other Assets Less Liabilities – 0.2% | | | 1,593 | |
| | | | Net Assets – 100% | | $ | 1,008,452 | |
| (1) | All percentages shown in the Portfolio of Investments are based on net assets. |
| (2) | A copy of the most recent financial statements for these exchange-traded funds can be obtained directly from the Securities and Exchange Commission on its website at http://www.sec.gov. |
| (3) | Non-income producing; fund has not declared a dividend within the past twelve months. |
| REIT | Real Estate Investment Trust. |
See accompanying notes to financial statements.
Nuveen Intelligent Risk Growth Allocation Fund
| | |
| Portfolio of Investments | | August 31, 2015 |
| | | | | | | | |
| Shares | | | Description (1), (2) | | Value | |
| | |
| | | | LONG-TERM INVESTMENTS – 100.4% | | | | |
| | |
| | | | EXCHANGE-TRADED FUNDS – 100.4% | | | | |
| | |
| | | | Commodity Funds – 8.8% | | | |
| | |
| | 3,344 | | | PowerShares DB Gold Fund, (3) | | $ | 124,564 | |
| | |
| | | | Equity Funds – 83.9% | | | |
| | |
| | 1,163 | | | iShares® Russell 1000® Index Fund | | | 128,674 | |
| | |
| | 3,606 | | | iShares® Russell 2000® Index Fund | | | 415,411 | |
| | |
| | 9,164 | | | iShares® S&P North American Natural Resources Sector Index Fund | | | 291,415 | |
| | |
| | 1,531 | | | Vanguard FTSE Developed Markets ETF | | | 57,137 | |
| | |
| | 8,604 | | | Vanguard FTSE Emerging Markets ETF | | | 297,182 | |
| | | | Total Equity Funds | | | 1,189,819 | |
| | |
| | | | Fixed Income Funds – 7.7% | | | |
| | |
| | 896 | | | iShares® Barclays 20+ Year Treasury Bond Fund | | | 108,793 | |
| | | | Total Long-Term Investments (cost $1,445,534) | | | 1,423,176 | |
| | |
| Shares | | | Description (1) | | Value | |
| | |
| | | | SHORT-TERM INVESTMENTS – 0.0% | | | | |
| | |
| | | | Money Market Funds – 0.0% | | | |
| | |
| | 431 | | | First American Treasury Obligations Fund, Class Z, 0.000%, (4) | | $ | 431 | |
| | | | Total Short-Term Investments (cost $431) | | | 431 | |
| | | | Total Investments (cost $1,445,965) – 100.4% | | | 1,423,607 | |
| | | | Other Assets Less Liabilities – (0.4)% | | | (5,645) | |
| | | | Net Assets – 100% | | $ | 1,417,962 | |
| (1) | All percentages shown in the Portfolio of Investments are based on net assets. |
| (2) | A copy of the most recent financial statements for these exchange-traded funds can be obtained directly from the Securities and Exchange Commission on its website at http://www.sec.gov. |
| (3) | Non-income producing; fund has not declared a dividend within the past twelve months. |
| (4) | The rate shown is the annualized seven-day effective yield as of the end of the reporting period. |
See accompanying notes to financial statements.
Nuveen Intelligent Risk Moderate Allocation Fund
| | |
| Portfolio of Investments | | August 31, 2015 |
| | | | | | | | |
| Shares | | | Description (1), (2) | | Value | |
| | |
| | | | LONG-TERM INVESTMENTS – 99.5% | | | | |
| | |
| | | | EXCHANGE-TRADED FUNDS – 99.5% | | | | |
| | |
| | | | Commodity Funds – 22.0% | | | |
| | |
| | 13,660 | | | PowerShares DB Commodity Index Tracking Fund, (3) | | $ | 214,325 | |
| | |
| | 9,130 | | | PowerShares DB Gold Fund, (3) | | | 340,093 | |
| | | | Total Commodity Funds | | | 554,418 | |
| | |
| | | | Equity Funds – 51.5% | | | |
| | |
| | 3,040 | | | iShares® Russell 1000® Index Fund | | | 336,346 | |
| | |
| | 2,628 | | | iShares® Russell 2000® Index Fund | | | 302,746 | |
| | |
| | 3,125 | | | iShares® S&P North American Natural Resources Sector Index Fund | | | 99,375 | |
| | |
| | 7,143 | | | Vanguard FTSE Developed Markets ETF | | | 266,577 | |
| | |
| | 4,918 | | | Vanguard FTSE Emerging Markets ETF | | | 169,868 | |
| | |
| | 1,649 | | | Vanguard REIT ETF | | | 122,075 | |
| | | | Total Equity Funds | | | 1,296,987 | |
| | |
| | | | Fixed Income Funds – 26.0% | | | |
| | |
| | 4,270 | | | iShares® Barclays 20+ Year Treasury Bond Fund | | | 518,462 | |
| | |
| | 930 | | | iShares® National AMT-Free Municipal Bond Fund | | | 101,221 | |
| | |
| | 301 | | | iShares® TIPS Bond ETF | | | 33,586 | |
| | | | Total Fixed Income Funds | | | 653,269 | |
| | | | Total Long-Term (cost $2,478,369) | | | 2,504,674 | |
| | | | Other Assets Less Liabilities – 0.5% | | | 11,560 | |
| | | | Net Assets – 100% | | $ | 2,516,234 | |
| (1) | All percentages shown in the Portfolio of Investments are based on net assets. |
| (2) | A copy of the most recent financial statements for the exchange-traded funds in which the Fund invests can be obtained directly from the Securities and Exchange Commission on its website at http://www.sec.gov. |
| (3) | Non-income producing; fund has not declared a dividend within the past twelve months. |
| REIT | Real Estate Investment Trust. |
See accompanying notes to financial statements.
Statement of
| | | | |
| | Assets and Liabilities | | August 31, 2015 |
| | | | | | | | | | | | |
| | | Intelligent Risk
Conservative Allocation | | | Intelligent Risk
Growth Allocation | | | Intelligent Risk
Moderate Allocation | |
Assets | | | | | | | | | | | | |
Long-term investments, at value (cost $995,501, $1,445,534 and $2,478,369, respectively) | | $ | 1,006,859 | | | $ | 1,423,176 | | | $ | 2,504,674 | |
Short-term investments, at value (cost approximates value) | | | — | | | | 431 | | | | — | |
Receivable for: | | | | | | | | | | | | |
Investments sold | | | 28,810 | | | | — | | | | 20,657 | |
Reimbursement from Adviser | | | 6,602 | | | | 6,885 | | | | 5,874 | |
Shares sold | | | 295 | | | | 497 | | | | 2,107 | |
Other assets | | | 19,837 | | | | 19,835 | | | | 19,833 | |
Total assets | | | 1,062,403 | | | | 1,450,824 | | | | 2,553,145 | |
Liabilities | | | | | | | | | | | | |
Cash overdraft | | | 23,946 | | | | — | | | | 7,031 | |
Payable for: | | | | | | | | | | | | |
Dividends | | | 1,085 | | | | — | | | | — | |
Shares redeemed | | | 35 | | | | — | | | | — | |
Accrued expenses: | | | | | | | | | | | | |
12b-1 distribution and service fees | | | 113 | | | | 200 | | | | 494 | |
Professional fees | | | 21,190 | | | | 21,205 | | | | 21,219 | |
Shareholder reporting expenses | | | 6,516 | | | | 10,443 | | | | 7,043 | |
Trustees fees | | | 4 | | | | 7 | | | | 10 | |
Other | | | 1,062 | | | | 1,007 | | | | 1,114 | |
Total liabilities | | | 53,951 | | | | 32,862 | | | | 36,911 | |
Net assets | | $ | 1,008,452 | | | $ | 1,417,962 | | | $ | 2,516,234 | |
Class A Shares | | | | | | | | | | | | |
Net assets | | $ | 155,980 | | | $ | 380,562 | | | $ | 881,814 | |
Shares outstanding | | | 9,188 | | | | 21,009 | | | | 47,424 | |
Net asset value (“NAV”) per share | | $ | 16.98 | | | $ | 18.11 | | | $ | 18.59 | |
Offering price per share (NAV per share plus maximum sales charge of 5.75% of offering price) | | $ | 18.02 | | | $ | 19.21 | | | $ | 19.72 | |
Class C Shares | | | | | | | | | | | | |
Net assets | | $ | 67,091 | | | $ | 109,101 | | | $ | 314,340 | |
Shares outstanding | | | 3,954 | | | | 6,054 | | | | 17,054 | |
NAV and offering price per share | | $ | 16.97 | | | $ | 18.02 | | | $ | 18.43 | |
Class R3 Shares | | | | | | | | | | | | |
Net assets | | $ | 42,428 | | | $ | 45,197 | | | $ | 46,361 | |
Shares outstanding | | | 2,500 | | | | 2,500 | | | | 2,500 | |
NAV and offering price per share | | $ | 16.97 | | | $ | 18.08 | | | $ | 18.54 | |
Class I Shares | | | | | | | | | | | | |
Net assets | | $ | 742,953 | | | $ | 883,102 | | | $ | 1,273,719 | |
Shares outstanding | | | 43,764 | | | | 48,677 | | | | 68,385 | |
NAV and offering price per share | | $ | 16.98 | | | $ | 18.14 | | | $ | 18.63 | |
Net assets consist of: | | | | | | | | | | | | |
Capital paid-in | | $ | 1,038,768 | | | $ | 1,519,727 | | | $ | 2,551,457 | |
Undistributed (Over-distribution of) net investment income | | | (1,272 | ) | | | 7,875 | | | | — | |
Accumulated net realized gain (loss) | | | (40,402 | ) | | | (87,282 | ) | | | (61,528 | ) |
Net unrealized appreciation (depreciation) | | | 11,358 | | | | (22,358 | ) | | | 26,305 | |
Net assets | | $ | 1,008,452 | | | $ | 1,417,962 | | | $ | 2,516,234 | |
Authorized shares – per class | | | Unlimited | | | | Unlimited | | | | Unlimited | |
Par value per share | | $ | 0.01 | | | $ | 0.01 | | | $ | 0.01 | |
See accompanying notes to financial statements.
Statement of
| | | | |
| | Operations | | Year Ended August 31, 2015 |
| | | | | | | | | | | | |
| | | Intelligent Risk
Conservative Allocation | | | Intelligent Risk
Growth Allocation | | | Intelligent Risk
Moderate Allocation | |
Investment Income | | $ | 27,312 | | | $ | 37,935 | | | $ | 39,895 | |
Expenses | | | | | | | | | | | | |
Management fees | | | 9,138 | | | | 14,952 | | | | 17,512 | |
12b-1 service fees – Class A Shares | | | 516 | | | | 1,348 | | | | 1,239 | |
12b-1 distribution and service fees – Class C Shares | | | 1,023 | | | | 1,315 | | | | 3,298 | |
12b-1 distribution and service fees – Class R3 Shares | | | 231 | | | | 261 | | | | 256 | |
Shareholder servicing agent fees | | | 929 | | | | 1,116 | | | | 1,053 | |
Custodian fees | | | 7,964 | | | | 7,789 | | | | 7,949 | |
Trustees fees | | | 278 | | | | 301 | | | | 311 | |
Professional fees | | | 26,691 | | | | 26,865 | | | | 26,889 | |
Shareholder reporting expenses | | | 13,227 | | | | 19,488 | | | | 6,459 | |
Federal and state registration fees | | | 58,771 | | | | 58,778 | | | | 58,779 | |
Other | | | 1,916 | | | | 1,918 | | | | 1,927 | |
Total expenses before fee waiver/expense reimbursement | | | 120,684 | | | | 134,131 | | | | 125,672 | |
Fee waiver/expense reimbursement | | | (110,853 | ) | | | (118,017 | ) | | | (105,432 | ) |
Net expenses | | | 9,831 | | | | 16,114 | | | | 20,240 | |
Net investment income (loss) | | | 17,481 | | | | 21,821 | | | | 19,655 | �� |
Realized and Unrealized Gain (Loss) | | | | | | | | | | | | |
Net realized gain (loss) from: | | | | | | | | | | | | |
Investments | | | 25,329 | | | | (38,943 | ) | | | (33,891 | ) |
Distributions from exchange-traded funds | | | 7 | | | | 246 | | | | — | |
Total net realized gain (loss) | | | 25,336 | | | | (38,697 | ) | | | (33,891 | ) |
Change in net unrealized appreciation (depreciation) of investments | | | (147,051 | ) | | | (379,444 | ) | | | (312,519 | ) |
Net realized and unrealized gain (loss) | | | (121,715 | ) | | | (418,141 | ) | | | (346,410 | ) |
Net increase (decrease) in net assets from operations | | $ | (104,234 | ) | | $ | (396,320 | ) | | $ | (326,755 | ) |
See accompanying notes to financial statements.
Statement of
| | | | | | | | | | | | | | | | | | |
| | | Intelligent Risk Conservative Allocation | | | | | Intelligent Risk Growth Allocation | |
| | | Year Ended
8/31/15 | | | Year Ended 8/31/14 | | | | | Year Ended
8/31/15 | | | Year Ended
8/31/14 | |
Operations | | | | | | | | | | | | | | | | | | |
Net investment income (loss) | | $ | 17,481 | | | $ | 53,103 | | | | | $ | 21,821 | | | $ | 56,824 | |
Total net realized gain (loss) | | | 25,336 | | | | 102,287 | | | | | | (38,697 | ) | | | 145,674 | |
Change in net unrealized appreciation (depreciation) of investments | | | (147,051 | ) | | | 186,352 | | | | | | (379,444 | ) | | | 278,771 | |
Net increase (decrease) in net assets from operations | | | (104,234 | ) | | | 341,742 | | | | | | (396,320 | ) | | | 481,269 | |
Distributions to Shareholders | | | | | | | | | | | | | | | | | | |
From net investment income: | | | | | | | | | | | | | | | | | | |
Class A Shares | | | (1,736 | ) | | | (4,054 | ) | | | | | (14,633 | ) | | | (2,885 | ) |
Class C Shares | | | (67 | ) | | | (616 | ) | | | | | (2,799 | ) | | | (363 | ) |
Class R3 Shares | | | (271 | ) | | | (542 | ) | | | | | (1,429 | ) | | | (378 | ) |
Class I Shares | | | (9,248 | ) | | | (48,098 | ) | | | | | (34,330 | ) | | | (20,312 | ) |
From accumulated net realized gains: | | | | | | | | | | | | | | | | | | |
Class A Shares | | | (29,804 | ) | | | — | | | | | | (39,547 | ) | | | — | |
Class C Shares | | | (11,989 | ) | | | — | | | | | | (8,055 | ) | | | — | |
Class R3 Shares | | | (5,313 | ) | | | — | | | | | | (3,398 | ) | | | — | |
Class I Shares | | | (97,262 | ) | | | — | | | | | | (106,180 | ) | | | — | |
Return of capital: | | | | | | | | | | | | | | | | | | |
Class A Shares | | | — | | | | — | | | | | | — | | | | — | |
Class C Shares | | | — | | | | — | | | | | | — | | | | — | |
Class R3 Shares | | | — | | | | — | | | | | | — | | | | — | |
Class I Shares | | | — | | | | — | | | | | | — | | | | — | |
Decrease in net assets from distributions to shareholders | | | (155,690 | ) | | | (53,310 | ) | | | | | (210,371 | ) | | | (23,938 | ) |
Fund Share Transactions | | | | | | | | | | | | | | | | | | |
Proceeds from sale of shares | | | 133,816 | | | | 3,562,195 | | | | | | 247,543 | | | | 3,757,395 | |
Proceeds from shares issued to shareholders due to reinvestment of distributions | | | 38,596 | | | | 4,652 | | | | | | 109,045 | | | | 11,885 | |
| | | 172,412 | | | | 3,566,847 | | | | | | 356,588 | | | | 3,769,280 | |
Cost of shares redeemed | | | (361,314 | ) | | | (3,697,970 | ) | | | | | (1,058,636 | ) | | | (3,780,184 | ) |
Net increase (decrease) in net assets from Fund share transactions | | | (188,902 | ) | | | (131,123 | ) | | | | | (702,048 | ) | | | (10,904 | ) |
Net increase (decrease) in net assets | | | (448,826 | ) | | | 157,309 | | | | | | (1,308,739 | ) | | | 446,427 | |
Net assets at the beginning of period | | | 1,457,278 | | | | 1,299,969 | | | | | | 2,726,701 | | | | 2,280,274 | |
Net assets at the end of period | | $ | 1,008,452 | | | $ | 1,457,278 | | | | | $ | 1,417,962 | | | $ | 2,726,701 | |
Undistributed (Over-distribution of) net investment income at the end of period | | $ | (1,272 | ) | | $ | (3,232 | ) | | | | $ | 7,875 | | | $ | 39,245 | |
See accompanying notes to financial statements.
Statement of Changes in Net Assets (continued)
| | | | | | | | |
| | | Intelligent Risk Moderate Allocation | |
| | | Year Ended
8/31/15 | | | Year Ended
8/31/14 | |
Operations | | | | | | | | |
Net investment income (loss) | | $ | 19,655 | | | $ | 43,380 | |
Total net realized gain (loss) | | | (33,891 | ) | | | 150,881 | |
Change in net unrealized appreciation (depreciation) of investments | | | (312,519 | ) | | | 318,602 | |
Net increase (decrease) in net assets from operations | | | (326,755 | ) | | | 512,863 | |
Distributions to Shareholders | | | | | | | | |
From net investment income: | | | | | | | | |
Class A Shares | | | (1,651 | ) | | | (6,020 | ) |
Class C Shares | | | (107 | ) | | | (1,633 | ) |
Class R3 Shares | | | (232 | ) | | | (529 | ) |
Class I Shares | | | (12,511 | ) | | | (42,922 | ) |
From accumulated net realized gains: | | | | | | | | |
Class A Shares | | | (15,794 | ) | | | — | |
Class C Shares | | | (12,129 | ) | | | — | |
Class R3 Shares | | | (2,270 | ) | | | — | |
Class I Shares | | | (57,200 | ) | | | — | |
Return of capital: | | | | | | | | |
Class A Shares | | | (1,028 | ) | | | — | |
Class C Shares | | | (677 | ) | | | — | |
Class R3 Shares | | | (104 | ) | | | — | |
Class I Shares | | | (2,874 | ) | | | — | |
Decrease in net assets from distributions to shareholders | | | (106,577 | ) | | | (51,104 | ) |
Fund Share Transactions | | | | | | | | |
Proceeds from sale of shares | | | 962,351 | | | | 3,644,121 | |
Proceeds from shares issued to shareholders due to reinvestment of distributions | | | 51,217 | | | | 18,350 | |
| | | 1,013,568 | | | | 3,662,471 | |
Cost of shares redeemed | | | (628,442 | ) | | | (4,110,875 | ) |
Net increase (decrease) in net assets from Fund share transactions | | | 385,126 | | | | (448,404 | ) |
Net increase (decrease) in net assets | | | (48,206 | ) | | | 13,355 | |
Net assets at the beginning of period | | | 2,564,440 | | | | 2,551,085 | |
Net assets at the end of period | | $ | 2,516,234 | | | $ | 2,564,440 | |
Undistributed (Over-distribution of) net investment income at the end of period | | $ | — | | | $ | — | |
See accompanying notes to financial statements.
THIS PAGE INTENTIONALLY LEFT BLANK
Financial
Highlights
Intelligent Risk Conservative Allocation
Selected data for a share outstanding throughout each period:
| | | | | | | | | | | | | | | | | | | | | | | | | | | | | | | | | | | | | | |
| | | | | |
| | | | | | Investment Operations | | | | | Less Distributions | | | | |
| | | | | | | | | | |
Class (Commencement Date) Year Ended August 31, | | Beginning
NAV | | | Net
Investment
Income
(Loss)(a) | | | Net
Realized/
Unrealized
Gain (Loss) | | | Total | | | | | From
Net
Invest
ment
Income | | | From
Accumulated
Net Realized
Gains | | | Return
of
Capital | | | Total | | | Ending
NAV | |
Class A (5/12) | | | | | | | | | | | | | | | | | | | | | | | | | | | | | | | | | | | | | | |
2015 | | $ | 20.89 | | | $ | 0.25 | | | $ | (1.88 | ) | | $ | (1.63 | ) | | | | $ | (0.16 | ) | | $ | (2.12 | ) | | $ | — | | | $ | (2.28 | ) | | $ | 16.98 | |
2014 | | | 19.24 | | | | 0.26 | | | | 1.66 | | | | 1.92 | | | | | | (0.27 | ) | | | — | | | | — | | | | (0.27 | ) | | | 20.89 | |
2013 | | | 20.33 | | | | 0.27 | | | | (0.95 | ) | | | (0.68 | ) | | | | | (0.37 | ) | | | — | | | | (0.04 | ) | | | (0.41 | ) | | | 19.24 | |
2012(d) | | | 20.00 | | | | 0.10 | | | | 0.33 | | | | 0.43 | | | | | | (0.10 | ) | | | — | | | | — | | | | (0.10 | ) | | | 20.33 | |
Class C (5/12) | | | | | | | | | | | | | | | | | | | | | | | | | | | | | | | | | | | | | | |
2015 | | | 20.87 | | | | 0.12 | | | | (1.89 | ) | | | (1.77 | ) | | | | | (0.01 | ) | | | (2.12 | ) | | | — | | | | (2.13 | ) | | | 16.97 | |
2014 | | | 19.22 | | | | 0.12 | | | | 1.65 | | | | 1.77 | | | | | | (0.12 | ) | | | — | | | | — | | | | (0.12 | ) | | | 20.87 | |
2013 | | | 20.32 | | | | 0.15 | | | | (0.99 | ) | | | (0.84 | ) | | | | | (0.23 | ) | | | — | | | | (0.03 | ) | | | (0.26 | ) | | | 19.22 | |
2012(d) | | | 20.00 | | | | 0.05 | | | | 0.34 | | | | 0.39 | | | | | | (0.07 | ) | | | — | | | | — | | | | (0.07 | ) | | | 20.32 | |
Class R3 (5/12) | | | | | | | | | | | | | | | | | | | | | | | | | | | | | | | | | | | | | | |
2015 | | | 20.88 | | | | 0.20 | | | | (1.88 | ) | | | (1.68 | ) | | | | | (0.11 | ) | | | (2.12 | ) | | | — | | | | (2.23 | ) | | | 16.97 | |
2014 | | | 19.22 | | | | 0.21 | | | | 1.67 | | | | 1.88 | | | | | | (0.22 | ) | | | — | | | | — | | | | (0.22 | ) | | | 20.88 | |
2013 | | | 20.33 | | | | 0.28 | | | | (1.03 | ) | | | (0.75 | ) | | | | | (0.32 | ) | | | — | | | | (0.04 | ) | | | (0.36 | ) | | | 19.22 | |
2012(d) | | | 20.00 | | | | 0.09 | | | | 0.33 | | | | 0.42 | | | | | | (0.09 | ) | | | — | | | | — | | | | (0.09 | ) | | | 20.33 | |
Class I (5/12) | | | | | | | | | | | | | | | | | | | | | | | | | | | | | | | | | | | | | | |
2015 | | | 20.89 | | | | 0.30 | | | | (1.88 | ) | | | (1.58 | ) | | | | | (0.21 | ) | | | (2.12 | ) | | | — | | | | (2.33 | ) | | | 16.98 | |
2014 | | | 19.24 | | | | 0.32 | | | | 1.65 | | | | 1.97 | | | | | | (0.32 | ) | | | — | | | | — | | | | (0.32 | ) | | | 20.89 | |
2013 | | | 20.34 | | | | 0.38 | | | | (1.03 | ) | | | (0.65 | ) | | | | | (0.40 | ) | | | — | | | | (0.05 | ) | | | (0.45 | ) | | | 19.24 | |
2012(d) | | | 20.00 | | | | 0.12 | | | | 0.33 | | | | 0.45 | | | | | | (0.11 | ) | | | — | | | | — | | | | (0.11 | ) | | | 20.34 | |
| | | | | | | | | | | | | | | | | | | | | | | | | | | | | | |
| | | | Ratios/Supplemental Data | |
| | | | | | | | | Ratios to Average
Net Assets Before
Waiver/Reimbursement | | | | | Ratios to Average
Net Assets After
Waiver/Reimbursement(c) | | | | |
| | | | | | | | |
Total
Return(b) | | | Ending
Net
Assets
(000) | | | | | Expenses(e) | | | Net
Investment
Income
(Loss) | | | | | Expenses(e) | | | Net
Investment
Income
(Loss) | | | Portfolio
Turnover
Rate(f) | |
| | | | | | | | | | | | | | | | | | | | | | | | | | | | | | |
| | (8.06 | )% | | $ | 156 | | | | | | 10.02 | % | | | (7.74 | )% | | | | | 0.92 | % | | | 1.36 | % | | | 110 | % |
| | 10.05 | | | | 310 | | | | | | 4.11 | | | | (1.89 | ) | | | | | 0.93 | | | | 1.30 | | | | 188 | |
| | (3.44 | ) | | | 290 | | | | | | 9.95 | | | | (7.66 | ) | | | | | 0.93 | | | | 1.36 | | | | 111 | |
| | 2.17 | | | | 71 | | | | | | 7.34 | * | | | (4.84 | )* | | | | | 0.93 | * | | | 1.57 | * | | | 25 | |
| | | | | | | | | | | | | | | | | | | | | | | | | | | | | | |
| | (8.75 | ) | | | 67 | | | | | | 11.11 | | | | (8.78 | ) | | | | | 1.67 | | | | 0.66 | | | | 110 | |
| | 9.23 | | | | 136 | | | | | | 4.12 | | | | (1.85 | ) | | | | | 1.68 | | | | 0.60 | | | | 188 | |
| | (4.22 | ) | | | 81 | | | | | | 10.04 | | | | (7.60 | ) | | | | | 1.68 | | | | 0.77 | | | | 111 | |
| | 1.94 | | | | 51 | | | | | | 7.95 | * | | | (5.45 | )* | | | | | 1.68 | * | | | 0.83 | * | | | 25 | |
| | | | | | | | | | | | | | | | | | | | | | | | | | | | | | |
| | (8.32 | ) | | | 42 | | | | | | 10.45 | | | | (8.17 | ) | | | | | 1.17 | | | | 1.11 | | | | 110 | |
| | 9.82 | | | | 52 | | | | | | 4.29 | | | | (2.06 | ) | | | | | 1.18 | | | | 1.05 | | | | 188 | |
| | (3.78 | ) | | | 48 | | | | | | 9.32 | | | | (6.74 | ) | | | | | 1.18 | | | | 1.40 | | | | 111 | |
| | 2.11 | | | | 51 | | | | | | 7.46 | * | | | (4.95 | )* | | | | | 1.18 | * | | | 1.33 | * | | | 25 | |
| | | | | | | | | | | | | | | | | | | | | | | | | | | | | | |
| | (7.84 | ) | | | 743 | | | | | | 9.96 | | | | (7.68 | ) | | | | | 0.67 | | | | 1.60 | | | | 110 | |
| | 10.31 | | | | 959 | | | | | | 3.07 | | | | (0.82 | ) | | | | | 0.68 | | | | 1.57 | | | | 188 | |
| | (3.26 | ) | | | 881 | | | | | | 8.87 | | | | (6.31 | ) | | | | | 0.68 | | | | 1.89 | | | | 111 | |
| | 2.27 | | | | 880 | | | | | | 6.97 | * | | | (4.47 | )* | | | | | 0.68 | * | | | 1.82 | * | | | 25 | |
| (a) | Per share Net Investment Income (Loss) is calculated using the average daily shares method. | |
| (b) | Total return is the combination of changes in NAV without any sales charge, reinvested dividend income at NAV and reinvested capital gains distributions at NAV, if any. Total returns are not annualized. | |
| (c) | After fee waiver and/or expense reimbursement from the Adviser, where applicable. | |
| (d) | For the period May 4, 2012 (commencement of operations) through August 31, 2012. | |
| (e) | In addition to the fees and expenses which the Fund bears directly; the Fund indirectly bears a pro rata share of the fees and expenses of the exchange-traded funds in which the Fund invests. These exchange-traded fund fees and expenses are not reflected in the expense ratios. Because the exchange-traded funds have varied expenses and fee levels and the Fund may own different proportions at different times, the amount of fees and expenses incurred indirectly by the Fund will vary. | |
| (f) | Portfolio Turnover Rate is calculated based on the lesser of long-term purchases or sales (as disclosed in Note 5 – Investment Transactions) divided by the average long-term market value during the period. | |
See accompanying notes to financial statements.
Financial Highlights (continued)
| | | | | | | | | | | | | | | | | | | | | | | | | | | | | | | | | | |
Intelligent Risk Growth Allocation Selected data for a share outstanding throughout each period: | |
| | | | | |
| | | | | | Investment Operations | | | | | Less Distributions | | | | |
| | | | | | | | | |
Class (Commencement Date) Year Ended August 31, | | Beginning
NAV | | | Net
Investment
Income
(Loss)(a) | | | Net
Realized/
Unrealized
Gain (Loss) | | | Total | | | | | From
Net
Investment
Income | | | From
Accumulated
Net Realized
Gains | | | Total | | | Ending
NAV | |
Class A (5/12) | | | | | | | | | | | | | | | | | | | | | | | | | | | | | | | | | | |
2015 | | $ | 24.03 | | | $ | 0.23 | | | $ | (4.16 | ) | | $ | (3.93 | ) | | | | $ | (0.63 | ) | | $ | (1.36 | ) | | $ | (1.99 | ) | | $ | 18.11 | |
2014 | | | 21.28 | | | | 0.24 | | | | 2.72 | | | | 2.96 | | | | | | (0.21 | ) | | | — | | | | (0.21 | ) | | | 24.03 | |
2013 | | | 20.16 | | | | 0.25 | | | | 1.04 | | | | 1.29 | | | | | | (0.17 | ) | | | — | | | | (0.17 | ) | | | 21.28 | |
2012(d) | | | 20.00 | | | | 0.05 | | | | 0.11 | | | | 0.16 | | | | | | — | | | | — | | | | — | | | | 20.16 | |
Class C (5/12) | | | | | | | | | | | | | | | | | | | | | | | | | | | | | | | | | | |
2015 | | | 23.89 | | | | 0.09 | | | | (4.14 | ) | | | (4.05 | ) | | | | | (0.46 | ) | | | (1.36 | ) | | | (1.82 | ) | | | 18.02 | |
2014 | | | 21.17 | | | | 0.10 | | | | 2.66 | | | | 2.76 | | | | | | (0.04 | ) | | | — | | | | (0.04 | ) | | | 23.89 | |
2013 | | | 20.11 | | | | 0.08 | | | | 1.06 | | | | 1.14 | | | | | | (0.08 | ) | | | — | | | | (0.08 | ) | | | 21.17 | |
2012(d) | | | 20.00 | | | | — | ** | | | 0.11 | | | | 0.11 | | | | | | — | | | | — | | | | — | | | | 20.11 | |
Class R3 (5/12) | | | | | | | | | | | | | | | | | | | | | | | | | | | | | | | | | | |
2015 | | | 23.98 | | | | 0.17 | | | | (4.14 | ) | | | (3.97 | ) | | | | | (0.57 | ) | | | (1.36 | ) | | | (1.93 | ) | | | 18.08 | |
2014 | | | 21.24 | | | | 0.21 | | | | 2.68 | | | | 2.89 | | | | | | (0.15 | ) | | | — | | | | (0.15 | ) | | | 23.98 | |
2013 | | | 20.14 | | | | 0.18 | | | | 1.06 | | | | 1.24 | | | | | | (0.14 | ) | | | — | | | | (0.14 | ) | | | 21.24 | |
2012(d) | | | 20.00 | | | | 0.04 | | | | 0.10 | | | | 0.14 | | | | | | — | | | | — | | | | — | | | | 20.14 | |
Class I (5/12) | | | | | | | | | | | | | | | | | | | | | | | | | | | | | | | | | | |
2015 | | | 24.06 | | | | 0.26 | | | | (4.13 | ) | | | (3.87 | ) | | | | | (0.69 | ) | | | (1.36 | ) | | | (2.05 | ) | | | 18.14 | |
2014 | | | 21.31 | | | | 0.30 | | | | 2.71 | | | | 3.01 | | | | | | (0.26 | ) | | | — | | | | (0.26 | ) | | | 24.06 | |
2013 | | | 20.18 | | | | 0.27 | | | | 1.07 | | | | 1.34 | | | | | | (0.21 | ) | | | — | | | | (0.21 | ) | | | 21.31 | |
2012(d) | | | 20.00 | | | | 0.07 | | | | 0.11 | | | | 0.18 | | | | | | — | | | | — | | | | — | | | | 20.18 | |
| | | | | | | | | | | | | | | | | | | | | | | | | | | | | | |
| | | | Ratios/Supplemental Data | |
| | | | | | | | | Ratios to Average
Net Assets Before
Waiver/Reimbursement | | | | | Ratios to Average
Net Assets After
Waiver/Reimbursement(c) | | | | |
| | | | | | | | |
Total
Return(b) | | | Ending
Net
Assets
(000) | | | | | Expenses(e) | | | Net
Investment
Income
(Loss) | | | | | Expenses(e) | | | Net
Investment
Income
(Loss) | | | Portfolio
Turnover
Rate(f) | |
| | | | | | | | | | | | | | | | | | | | | | | | | | | | | | |
| | (16.88 | )% | | $ | 381 | | | | | | 7.03 | % | | | (5.02 | )% | | | | | 0.92 | % | | | 1.08 | % | | | 103 | % |
| | 13.95 | | | | 603 | | | | | | 3.52 | | | | (1.56 | ) | | | | | 0.93 | | | | 1.03 | | | | 166 | |
| | 6.46 | | | | 399 | | | | | | 7.39 | | | | (5.26 | ) | | | | | 0.93 | | | | 1.21 | | | | 105 | |
| | 0.80 | | | | 50 | | | | | | 7.41 | * | | | (5.66 | )* | | | | | 0.93 | * | | | 0.82 | * | | | 25 | |
| | | | | | | | | | | | | | | | | | | | | | | | | | | | | | |
| | (17.46 | ) | | | 109 | | | | | | 7.89 | | | | (5.81 | ) | | | | | 1.67 | | | | 0.41 | | | | 103 | |
| | 13.06 | | | | 190 | | | | | | 4.37 | | | | (2.27 | ) | | | | | 1.68 | | | | 0.42 | | | | 166 | |
| | 5.66 | | | | 167 | | | | | | 8.20 | | | | (6.12 | ) | | | | | 1.68 | | | | 0.40 | | | | 105 | |
| | 0.55 | | | | 50 | | | | | | 8.16 | * | | | (6.41 | )* | | | | | 1.68 | * | | | 0.07 | * | | | 25 | |
| | | | | | | | | | | | | | | | | | | | | | | | | | | | | | |
| | (17.06 | ) | | | 45 | | | | | | 7.36 | | | | (5.37 | ) | | | | | 1.17 | | | | 0.82 | | | | 103 | |
| | 13.66 | | | | 60 | | | | | | 3.91 | | | | (1.83 | ) | | | | | 1.18 | | | | 0.90 | | | | 166 | |
| | 6.19 | | | | 53 | | | | | | 8.09 | | | | (6.05 | ) | | | | | 1.18 | | | | 0.86 | | | | 105 | |
| | 0.70 | | | | 50 | | | | | | 7.66 | * | | | (5.91 | )* | | | | | 1.18 | * | | | 0.57 | * | | | 25 | |
| | | | | | | | | | | | | | | | | | | | | | | | | | | | | | |
| | (16.63 | ) | | | 883 | | | | | | 6.64 | | | | (4.75 | ) | | | | | 0.67 | | | | 1.22 | | | | 103 | |
| | 14.21 | | | | 1,873 | | | | | | 2.90 | | | | (0.92 | ) | | | | | 0.68 | | | | 1.30 | | | | 166 | |
| | 6.68 | | | | 1,661 | | | | | | 7.45 | | | | (5.50 | ) | | | | | 0.68 | | | | 1.27 | | | | 105 | |
| | 0.90 | | | | 857 | | | | | | 7.16 | * | | | (5.42 | )* | | | | | 0.68 | * | | | 1.07 | * | | | 25 | |
| (a) | Per share Net Investment Income (Loss) is calculated using the average daily shares method. | |
| (b) | Total return is the combination of changes in NAV without any sales charge, reinvested dividend income at NAV and reinvested capital gains distributions at NAV, if any. Total returns are not annualized. | |
| (c) | After fee waiver and/or expense reimbursement from the Adviser, where applicable. | |
| (d) | For the period May 4, 2012 (commencement of operations) through August 31, 2012. | |
| (e) | In addition to the fees and expenses which the Fund bears directly; the Fund indirectly bears a pro rata share of the fees and expenses of the exchange-traded funds in which the Fund invests. These exchange-traded fund fees and expenses are not reflected in the expense ratios. Because the exchange-traded funds have varied expenses and fee levels and the Fund may own different proportions at different times, the amount of fees and expenses incurred indirectly by the Fund will vary. | |
| (f) | Portfolio Turnover Rate is calculated based on the lesser of long-term purchases or sales (as disclosed in Note 5 – Investment Transactions) divided by the average long-term market value during the period. | |
| ** | Rounds to less than $0.01 per share. | |
See accompanying notes to financial statements.
Financial Highlights (continued)
Intelligent Risk Moderate Allocation
Selected data for a share outstanding throughout each period:
| | | | | | | | | | | | | | | | | | | | | | | | | | | | | | | | | | | | | | |
| | | | | |
| | | | | | Investment Operations | | | | | Less Distributions | | | | |
| | | | | | | | | | |
Class (Commencement Date) Year Ended August 31, | | Beginning
NAV | | | Net
Investment
Income
(Loss)(a) | | | Net
Realized/
Unrealized
Gain (Loss) | | | Total | | | | | From
Net
Investment
Income | | | From
Accumulated
Net Realized
Gains | | | Return
of
Capital | | | Total | | | Ending
NAV | |
Class A (5/12) | | | | | | | | | | | | | | | | | | | | | | | | | | | | | | | | | | | | | | |
2015 | | $ | 22.12 | | | $ | 0.15 | | | $ | (2.59 | ) | | $ | (2.44 | ) | | | | $ | (0.14 | ) | | $ | (0.91 | ) | | $ | (0.04 | ) | | $ | (1.09 | ) | | $ | 18.59 | |
2014 | | | 20.06 | | | | 0.19 | | | | 2.13 | | | | 2.32 | | | | | | (0.26 | ) | | | — | | | | — | | | | (0.26 | ) | | | 22.12 | |
2013 | | | 20.66 | | | | 0.24 | | | | (0.62 | ) | | | (0.38 | ) | | | | | (0.22 | ) | | | — | | | | — | | | | (0.22 | ) | | | 20.06 | |
2012(d) | | | 20.00 | | | | 0.04 | | | | 0.62 | | | | 0.66 | | | | | | — | | | | — | | | | — | | | | — | | | | 20.66 | |
Class C (5/12) | | | | | | | | | | | | | | | | | | | | | | | | | | | | | | | | | | | | | | |
2015 | | | 21.97 | | | | (0.01 | ) | | | (2.56 | ) | | | (2.57 | ) | | | | | (0.02 | ) | | | (0.91 | ) | | | (0.04 | ) | | | (0.97 | ) | | | 18.43 | |
2014 | | | 19.94 | | | | 0.03 | | | | 2.12 | | | | 2.15 | | | | | | (0.12 | ) | | | — | | | | — | | | | (0.12 | ) | | | 21.97 | |
2013 | | | 20.61 | | | | 0.06 | | | | (0.60 | ) | | | (0.54 | ) | | | | | (0.13 | ) | | | — | | | | — | | | | (0.13 | ) | | | 19.94 | |
2012(d) | | | 20.00 | | | | — | ** | | | 0.61 | | | | 0.61 | | | | | | — | | | | — | | | | — | | | | — | | | | 20.61 | |
Class R3 (5/12) | | | | | | | | | | | | | | | | | | | | | | | | | | | | | | | | | | | | | | |
2015 | | | 22.07 | | | | 0.12 | | | | (2.60 | ) | | | (2.48 | ) | | | | | (0.10 | ) | | | (0.91 | ) | | | (0.04 | ) | | | (1.05 | ) | | | 18.54 | |
2014 | | | 20.02 | | | | 0.13 | | | | 2.13 | | | | 2.26 | | | | | | (0.21 | ) | | | — | | | | — | | | | (0.21 | ) | | | 22.07 | |
2013 | | | 20.64 | | | | 0.18 | | | | (0.61 | ) | | | (0.43 | ) | | | | | (0.19 | ) | | | — | | | | — | | | | (0.19 | ) | | | 20.02 | |
2012(d) | | | 20.00 | | | | 0.04 | | | | 0.60 | | | | 0.64 | | | | | | — | | | | — | | | | — | | | | — | | | | 20.64 | |
Class I (5/12) | | | | | | | | | | | | | | | | | | | | | | | | | | | | | | | | | | | | | | |
2015 | | | 22.14 | | | | 0.23 | | | | (2.61 | ) | | | (2.38 | ) | | | | | (0.18 | ) | | | (0.91 | ) | | | (0.04 | ) | | | (1.13 | ) | | | 18.63 | |
2014 | | | 20.08 | | | | 0.21 | | | | 2.17 | | | | 2.38 | | | | | | (0.32 | ) | | | — | | | | — | | | | (0.32 | ) | | | 22.14 | |
2013 | | | 20.68 | | | | 0.27 | | | | (0.61 | ) | | | (0.34 | ) | | | | | (0.26 | ) | | | — | | | | — | | | | (0.26 | ) | | | 20.08 | |
2012(d) | | | 20.00 | | | | 0.07 | | | | 0.61 | | | | 0.68 | | | | | | — | | | | — | | | | — | | | | — | | | | 20.68 | |
| | | | | | | | | | | | | | | | | | | | | | | | | | | | | | |
| | | | Ratios/Supplemental Data | |
| | | | | | | | | Ratios to Average
Net Assets Before
Waiver/Reimbursement | | | | | Ratios to Average
Net Assets After
Waiver/Reimbursement(c) | | | | |
| | | | | | | | |
Total
Return(b) | | | Ending
Net
Assets
(000) | | | | | Expenses(e) | | | Net
Investment
Income
(Loss) | | | | | Expenses(e) | | | Net
Investment
Income
(Loss) | | | Portfolio
Turnover
Rate(f) | |
| | | | | | | | | | | | | | | | | | | | | | | | | | | | | | |
| | (11.30 | )% | | $ | 882 | | | | | | 5.28 | % | | | (3.63 | )% | | | | | 0.92 | % | | | 0.72 | % | �� | | 133 | % |
| | 11.67 | | | | 367 | | | | | | 3.87 | | | | (2.03 | ) | | | | | 0.93 | | | | 0.91 | | | | 155 | |
| | (1.87 | ) | | | 631 | | | | | | 6.75 | | | | (4.62 | ) | | | | | 0.93 | | | | 1.21 | | | | 126 | |
| | 3.30 | | | | 98 | | | | | | 7.40 | * | | | (5.86 | )* | | | | | 0.93 | * | | | 0.60 | * | | | 21 | |
| | | | | | | | | | | | | | | | | | | | | | | | | | | | | | |
| | (11.94 | ) | | | 314 | | | | | | 6.27 | | | | (4.64 | ) | | | | | 1.67 | | | | (0.04 | ) | | | 133 | |
| | 10.84 | | | | 309 | | | | | | 4.39 | | | | (2.58 | ) | | | | | 1.68 | | | | 0.13 | | | | 155 | |
| | (2.62 | ) | | | 290 | | | | | | 7.78 | | | | (5.78 | ) | | | | | 1.68 | | | | 0.32 | | | | 126 | |
| | 3.05 | | | | 62 | | | | | | 7.90 | * | | | (6.18 | )* | | | | | 1.68 | * | | | 0.04 | * | | | 21 | |
| | | | | | | | | | | | | | | | | | | | | | | | | | | | | | |
| | (11.50 | ) | | | 46 | | | | | | 5.86 | | | | (4.10 | ) | | | | | 1.17 | | | | 0.59 | | | | 133 | |
| | 11.37 | | | | 55 | | | | | | 3.90 | | | | (2.09 | ) | | | | | 1.18 | | | | 0.63 | | | | 155 | |
| | (2.13 | ) | | | 50 | | | | | | 7.09 | | | | (5.06 | ) | | | | | 1.18 | | | | 0.85 | | | | 126 | |
| | 3.20 | | | | 52 | | | | | | 7.41 | * | | | (5.68 | )* | | | | | 1.18 | * | | | 0.54 | * | | | 21 | |
| | | | | | | | | | | | | | | | | | | | | | | | | | | | | | |
| | (11.02 | ) | | | 1,274 | | | | | | 5.36 | | | | (3.56 | ) | | | | | 0.67 | | | | 1.12 | | | | 133 | |
| | 11.94 | | | | 1,833 | | | | | | 2.88 | | | | (1.19 | ) | | | | | 0.68 | | | | 1.01 | | | | 155 | |
| | (1.68 | ) | | | 1,580 | | | | | | 6.73 | | | | (4.74 | ) | | | | | 0.68 | | | | 1.32 | | | | 126 | |
| | 3.40 | | | | 894 | | | | | | 6.91 | * | | | (5.20 | )* | | | | | 0.68 | * | | | 1.03 | * | | | 21 | |
| (a) | Per share Net Investment Income (Loss) is calculated using the average daily shares method. | |
| (b) | Total return is the combination of changes in NAV without any sales charge, reinvested dividend income at NAV and reinvested capital gains distributions at NAV, if any. Total returns are not annualized. | |
| (c) | After fee waiver and/or expense reimbursement from the Adviser, where applicable. | |
| (d) | For the period May 4, 2012 (commencement of operations) through August 31, 2012. | |
| (e) | In addition to the fees and expenses which the Fund bears directly; the Fund indirectly bears a pro rata share of the fees and expenses of the exchange-traded funds in which the Fund invests. These exchange-traded fund fees and expenses are not reflected in the expense ratios. Because the exchange-traded funds have varied expenses and fee levels and the Fund may own different proportions at different times, the amount of fees and expenses incurred indirectly by the Fund will vary. | |
| (f) | Portfolio Turnover Rate is calculated based on the lesser of long-term purchases or sales (as disclosed in Note 5 – Investment Transactions) divided by the average market long-term market value during the period. | |
| ** | Rounds to less than $0.01 per share. | |
See accompanying notes to financial statements.
Notes to
Financial Statements
1. General Information and Significant Accounting Policies
General Information
Trust and Fund Information
The Nuveen Investment Trust (the “Trust”), is an open-end management investment company registered under the Investment Company Act of 1940, as amended. The Trust is comprised of the Nuveen Intelligent Risk Conservative Allocation Fund (“Intelligent Risk Conservative Allocation”), Nuveen Intelligent Risk Growth Allocation Fund (“Intelligent Risk Growth Allocation”) and Nuveen Intelligent Risk Moderate Allocation Fund (“Intelligent Risk Moderate Allocation”), (each a “Fund” and collectively, the “Funds”), as diversified funds, among others. The Trust was organized as a Massachusetts business trust on May 6, 1996.
The end of the reporting period for the Funds is August 31, 2015, and the period covered by these Notes to Financial Statements is the fiscal year ended August 31, 2015 (the “current fiscal period”).
Investment Adviser
The Funds’ investment adviser is Nuveen Fund Advisors, LLC (“the Adviser”), a wholly-owned subsidiary of Nuveen Investments, Inc. (“Nuveen”). The Adviser is responsible for each Fund’s overall investment strategy and asset allocation decisions. The Adviser has entered into sub-advisory agreements with Nuveen Asset Management, LLC, (the “Sub-Adviser”), a subsidiary of the Adviser, under which the Sub-Adviser manages the investment portfolios of the Funds.
Investment Objectives and Principal Investment Strategies
Each Fund’s investment objective is to seek total return. Under normal market conditions, each Fund attempts to maintain a consistent risk level through changing market conditions by investing in financial instruments whose performance is expected to correspond to a variety of different asset classes. Intelligent Risk Conservative Allocation, Intelligent Risk Growth Allocation and Intelligent Risk Moderate Allocation seek to maintain a consistent risk level by attempting to keep their daily volatility range (i.e., fluctuations in value) within 3.5% to 7% (annualized), 12% to 18% (annualized) and 7% to 12% (annualized), respectively.
Each Fund may have exposure to any asset class, including: any commodity; any currency; U.S. and foreign (including emerging markets) equity securities; U.S. and foreign (including emerging markets) real estate; U.S. and foreign (including emerging markets) corporate bonds; U.S. and foreign (including emerging markets) government bonds; asset-backed securities; mortgage-backed securities; inflation-protected securities; and municipal bonds. The equity securities to which each Fund may have exposure may be of any market capitalization. The bonds to which each Fund may have exposure may be of any maturity and of any credit quality, including high yield or “junk” bonds. There is no maximum or minimum exposure that each Fund must have to any asset class, but the Funds generally have exposure to numerous asset classes at any given time.
Each Fund may gain exposure to different asset classes through investments in exchange-traded funds (“ETFs”) and the following derivatives: options; futures contracts, including futures on various market indices, interest rates, and currencies; options on futures contracts; swap agreements, including total return swaps; and forward contracts. Derivatives may be entered into on established exchanges, either in the U.S. or in foreign countries, or through privately negotiated transactions referred to as over-the-counter (“OTC”) derivatives. Each Fund will limit its direct investments in derivatives such that it will not be subject to regulation as a commodity pool. Each Fund may also invest in cash and cash equivalent instruments, some of which may serve as margin or collateral for each Fund’s obligations under derivative transactions.
The Funds’ most recent prospectus provides further descriptions of each Fund’s investment objective, principal investment strategies and principal risks.
Significant Accounting Policies
Each Fund is an investment company and follows accounting and reporting guidance under Financial Accounting Standards Board (FASB) Accounting Standards Codification (ASC) Topic 946 “Financial Services-Investment Companies.” The following is a summary of significant accounting policies followed by the Funds in the preparation of their financial statements in accordance with accounting principles generally accepted in the United States of America (“U.S. GAAP”).
Investment Transactions
Investment transactions are recorded on a trade date basis. Realized gains and losses from investment transactions are determined on the specific identification method, which is the same basis used for federal income tax purposes.
Investment Income
Dividend income, and realized gain distributions from the ETFs in which the Funds invest are recorded on the ex-dividend date. Interest income is recorded on an accrual basis. Realized gain distributions from the ETFs in which the Funds invest are recognized as a component of “Distributions from exchange-traded funds” on the Statement of Operations.
Professional Fees
Professional fees presented on the Statement of Operations consist of legal fees incurred in the normal course of operations, audit fees, tax consulting fees and, in some cases, workout expenditures. Workout expenditures are incurred in an attempt to protect or enhance an investment or to pursue other claims or legal actions on behalf of Fund shareholders. If a refund is received for workout expenditures paid in a prior reporting period, such amounts will be recognized as “Legal fee refund” on the Statement Operations.
Dividends and Distributions to Shareholders
Dividends from net investment income are declared daily and distributed to shareholders monthly for Intelligent Risk Conservative Allocation, and Fund shares begin to accrue dividends on the business day after the day when the monies used to purchase Fund shares are collected by the transfer agent. Dividends from net investment income are declared and distributed to shareholders annually for Intelligent Risk Growth Allocation and declared and distributed quarterly to shareholders for Intelligent Risk Moderate Allocation. Net realized capital gains from investment transactions, if any, are declared and distributed to shareholders at least annually. Furthermore, capital gains are distributed only to the extent they exceed available capital loss carryforwards.
Distributions to shareholders are recorded on the ex-dividend date. The amount and timing of distributions are determined in accordance with federal income tax regulations, which may differ from U.S. GAAP.
Share Classes and Sales Charges
Class A Shares are generally sold with an up-front sales charge and incur a 0.25% annual 12b-1 service fee. Class A Share purchases of $1 million or more are sold at net asset value (“NAV”) without an up-front sales charge but may be subject to a contingent deferred sales charge (“CDSC”) if redeemed within twelve months of purchase. Class C Shares are sold without an up-front sales charge but incur a 0.75% annual 12b-1 distribution fee and a 0.25% annual 12b-1 service fee. Class C Shares are subject to a CDSC of 1% if redeemed within twelve months of purchase. Class R3 Shares are sold without an up-front sales charge but incur a 0.25% annual 12b-1 distribution fee and a 0.25% annual 12b-1 service fee. Class I Shares are not subject to any sales charge or 12b-1 distribution or service fees.
Multiclass Operations and Allocations
Income and expenses of Intelligent Risk Conservative Allocation that are not directly attributable to a specific class of shares are prorated among the classes based on the relative settled shares of each class. Income and expenses of Intelligent Risk Growth Allocation and Intelligent Risk Moderate Allocation that are not directly attributable to a specific class of shares are prorated among the classes based on the relative net assets of each class. Expenses directly attributable to a class of shares are recorded to the specific class. Currently, the only expenses that are allocated on a class-specific basis are 12b-1 distribution and service fees.
Realized and unrealized capital gains and losses of the Funds are prorated among the classes based on the relative net assets of each class.
Indemnifications
Under the Trust’s organizational documents, its officers and trustees are indemnified against certain liabilities arising out of the performance of their duties to the Trust. In addition, in the normal course of business, the Trust enters into contracts that provide general indemnifications to other parties. The Trust’s maximum exposure under these arrangements is unknown as this would involve future claims that may be made against the Trust that have not yet occurred. However, the Trust has not had prior claims or losses pursuant to these contracts and expects the risk of loss to be remote.
Notes to Financial Statements (continued)
Netting Agreements
In the ordinary course of business, the Funds may enter into transactions subject to enforceable International Swaps and Derivative Association, Inc. (“ISDA”) master agreements or other similar arrangements (“netting agreements”). Generally, the right to offset in netting agreements allows each Fund to offset any exposure to a specific counterparty with any collateral received or delivered to that counterparty based on the terms of the agreements. Generally, each Fund manages its cash collateral and securities collateral on a counterparty basis.
The Funds’ investments subject to netting agreements as of the end of the reporting period, if any, are further described in Note 3 – Portfolio Securities and Investments in Derivatives.
Use of Estimates
The preparation of financial statements in conformity with U.S. GAAP requires management to make estimates and assumptions that affect the reported amounts of assets and liabilities at the date of the financial statements and the reported amounts of increases and decreases in net assets from operations during the reporting period. Actual results may differ from those estimates.
2. Investment Valuation and Fair Value Measurements
The fair valuation input levels as described below are for fair value measurement purposes.
Fair value is defined as the price that would be received upon selling an investment or transferring a liability in an orderly transaction to an independent buyer in the principal or most advantageous market for the investment. A three-tier hierarchy is used to maximize the use of observable market data and minimize the use of unobservable inputs and to establish classification of fair value measurements for disclosure purposes. Observable inputs reflect the assumptions market participants would use in pricing the asset or liability. Observable inputs are based on market data obtained from sources independent of the reporting entity. Unobservable inputs reflect the reporting entity’s own assumptions about the assumptions market participants would use in pricing the asset or liability. Unobservable inputs are based on the best information available in the circumstances. The following is a summary of the three-tiered hierarchy of valuation input levels.
| | |
| Level 1 – | | Inputs are unadjusted and prices are determined using quoted prices in active markets for identical securities. |
| Level 2 – | | Prices are determined using other significant observable inputs (including quoted prices for similar securities, interest rates, prepayment speeds, credit risk, etc.). |
| Level 3 – | | Prices are determined using significant unobservable inputs (including management’s assumptions in determining the fair value of investments). |
ETFs are valued at the last sales price on the securities exchange on which such securities are primarily traded and are generally classified as Level 1.
Investments in investment companies are valued at their respective NAVs on valuation date and are generally classified as Level 1.
Certain securities may not be able to be priced by the pre-established pricing methods as described above. Such securities may be valued by the Funds’ Board of Trustees (the “Board”) and/or its appointee at fair value. These securities generally include, but are not limited to, restricted securities (securities which may not be publicly sold without registration under the Securities Act of 1933, as amended) for which a pricing service is unable to provide a market price; securities whose trading has been formally suspended; debt securities that have gone into default and for which there is no current market quotation; a security whose market price is not available from a pre-established pricing source; a security with respect to which an event has occurred that is likely to materially affect the value of the security after the market has closed but before the calculation of a Fund’s NAV (as may be the case in non-U.S. markets on which the security is primarily traded) or make it difficult or impossible to obtain a reliable market quotation; and a security whose price, as provided by the pricing service, is not deemed to reflect the security’s fair value. As a general principle, the fair value of a security would appear to be the amount that the owner might reasonably expect to receive for it in a current sale. A variety of factors may be considered in determining the fair value of such securities, which may include consideration of the following: yields or prices of investments of comparable quality, type of issue, coupon, maturity and rating, market quotes or indications of value from security dealers, evaluations of anticipated cash flows or collateral, general market conditions and other information and analysis, including the obligor’s credit characteristics considered relevant. These securities are generally classified as Level 2 or Level 3 depending on the priority of the significant inputs. Regardless of the method employed to value a particular security, all valuations are subject to review by the Board and/or its appointee.
The inputs or methodologies used for valuing securities are not an indication of the risks associated with investing in those securities. The following is a summary of each Fund’s fair value measurements as of the end of the reporting period:
| | | | | | | | | | | | | | | | |
| Intelligent Risk Conservative Allocation | | Level 1 | | | Level 2 | | | Level 3 | | | Total | |
| Long-Term Investments*: | | | | | | | | | | | | | | | | |
Exchange-Traded Funds | | $ | 1,006,859 | | | $ | — | | | $ | — | | | $ | 1,006,859 | |
| | | | |
| Intelligent Risk Growth Allocation | | | | | | | | | | | | |
| Long-Term Investments*: | | | | | | | | | | | | | | | | |
Exchange-Traded Funds | | $ | 1,423,176 | | | $ | — | | | $ | — | | | $ | 1,423,176 | |
| Short-Term Investments: | | | | | | | | | | | | | | | | |
Money Market Funds | | | 431 | | | | — | | | | — | | | | 431 | |
| Total | | $ | 1,423,607 | | | $ | — | | | $ | — | | | $ | 1,423,607 | |
| | | | |
| Intelligent Risk Moderate Allocation | | | | | | | | | | | | |
| Long-Term Investments*: | | | | | | | | | | | | | | | | |
Exchange-Traded Funds | | $ | 2,504,674 | | | $ | — | | | $ | — | | | $ | 2,504,674 | |
| * | Refer to the Fund’s Portfolio of Investments for further information on the exchange-traded funds in which the Fund invests. |
The Board is responsible for the valuation process and has appointed the oversight of the daily valuation process to the Adviser’s Valuation Committee. The Valuation Committee, pursuant to the valuation policies and procedures adopted by the Board, is responsible for making fair value determinations, evaluating the effectiveness of the Funds’ pricing policies and reporting to the Board. The Valuation Committee is aided in its efforts by the Adviser’s dedicated Securities Valuation Team, which is responsible for administering the daily valuation process and applying fair value methodologies as approved by the Valuation Committee. When determining the reliability of independent pricing services for investments owned by the Funds, the Valuation Committee, among other things, conducts due diligence reviews of the pricing services and monitors the quality of security prices received through various testing reports conducted by the Securities Valuation Team.
The Valuation Committee will consider pricing methodologies it deems relevant and appropriate when making a fair value determination, based on the facts and circumstances specific to the portfolio instrument. Fair value determinations generally will be derived as follows, using public or private market information:
| | (i) | If available, fair value determinations shall be derived by extrapolating from recent transactions or quoted prices for identical or comparable securities. |
| | (ii) | If such information is not available, an analytical valuation methodology may be used based on other available information including, but not limited to: analyst appraisals, research reports, corporate action information, issuer financial statements and shelf registration statements. Such analytical valuation methodologies may include, but are not limited to: multiple of earnings, discount from market value of a similar freely-traded security, discounted cash flow analysis, book value or a multiple thereof, risk premium/yield analysis, yield to maturity and/or fundamental investment analysis. |
The purchase price of a portfolio instrument will be used to fair value the instrument only if no other valuation methodology is available or deemed appropriate, and it is determined that the purchase price fairly reflects the instrument’s current value.
For each portfolio security that has been fair valued pursuant to the policies adopted by the Board, the fair value price is compared against the last available and next available market quotations. The Valuation Committee reviews the results of such testing and fair valuation occurrences are reported to the Board.
3. Portfolio Securities and Investments in Derivatives
Each Fund is authorized to invest in certain derivative instruments. The Funds record derivative instruments at fair value, with changes in fair value recognized on the Statement of Operations, when applicable. Even though the Funds’ investments in derivatives may represent economic hedges, they are not considered to be hedge transactions for financial reporting purposes.
Although the Funds are authorized to invest in derivative instruments, and may do so in the future, they did not make any such investments during the current fiscal period.
Notes to Financial Statements (continued)
Market and Counterparty Credit Risk
In the normal course of business each Fund may invest in financial instruments and enter into financial transactions where risk of potential loss exists due to changes in the market (market risk) or failure of the other party to the transaction to perform (counterparty credit risk). The potential loss could exceed the value of the financial assets recorded on the financial statements. Financial assets, which potentially expose each Fund to counterparty credit risk, consist principally of cash due from counterparties on forward, option and swap transactions, when applicable. The extent of each Fund’s exposure to counterparty credit risk in respect to these financial assets approximates their carrying value as recorded on the Statement of Assets and Liabilities.
Each Fund helps manage counterparty credit risk by entering into agreements only with counterparties the Adviser believes have the financial resources to honor their obligations and by having the Adviser monitor the financial stability of the counterparties. Additionally, counterparties may be required to pledge collateral daily (based on the daily valuation of the financial asset) on behalf of each Fund with a value approximately equal to the amount of any unrealized gain above a pre-determined threshold. Reciprocally, when each Fund has an unrealized loss, the Funds have instructed the custodian to pledge assets of the Funds as collateral with a value approximately equal to the amount of the unrealized loss above a pre-determined threshold. Collateral pledges are monitored and subsequently adjusted if and when the valuations fluctuate, either up or down, by at least the pre-determined threshold amount.
4. Fund Shares
Transactions in Fund shares during the current and prior fiscal period were as follows:
| | | | | | | | | | | | | | | | |
| | | Year Ended
8/31/15 | | | Year Ended
8/31/14 | |
| Intelligent Risk Conservative Allocation | | Shares | | | Amount | | | Shares | | | Amount | |
| Shares sold: | |
Class A | | | 5,682 | | | $ | 103,939 | | | | 7,745 | | | $ | 155,060 | |
Class C | | | 783 | | | | 14,041 | | | | 3,229 | | | | 64,605 | |
Class R3 | | | — | | | | — | | | | — | | | | — | |
Class I | | | 881 | | | | 15,836 | | | | 170,433 | | | | 3,342,530 | |
| Shares issued to shareholders due to reinvestment of distributions: | | | | | | | | | | | | | | | | |
Class A | | | 1,381 | | | | 24,365 | | | | 168 | | | | 3,357 | |
Class C | | | 382 | | | | 6,712 | | | | 16 | | | | 318 | |
Class R3 | | | — | | | | — | | | | — | | | | — | |
Class I | | | 426 | | | | 7,519 | | | | 48 | | | | 977 | |
| | | | 9,535 | | | | 172,412 | | | | 181,639 | | | | 3,566,847 | |
| Shares redeemed: | | | | | | | | | | | | | | | | |
Class A | | | (12,736 | ) | | | (230,606 | ) | | | (8,102 | ) | | | (161,589 | ) |
Class C | | | (3,716 | ) | | | (69,168 | ) | | | (965 | ) | | | (19,222 | ) |
Class R3 | | | — | | | | — | | | | — | | | | — | |
Class I | | | (3,454 | ) | | | (61,540 | ) | | | (170,378 | ) | | | (3,517,159 | ) |
| | | | (19,906 | ) | | | (361,314 | ) | | | (179,445 | ) | | | (3,697,970 | ) |
| Net increase (decrease) | | | (10,371 | ) | | $ | (188,902 | ) | | | 2,194 | | | $ | (131,123 | ) |
| | | | | | | | | | | | | | | | |
| | | Year Ended
8/31/15 | | | Year Ended
8/31/14 | |
| Intelligent Risk Growth Allocation | | Shares | | | Amount | | | Shares | | | Amount | |
| Shares sold: | |
Class A | | | 8,032 | | | $ | 182,333 | | | | 15,046 | | | $ | 341,051 | |
Class C | | | 454 | | | | 9,041 | | | | 1,820 | | | | 40,512 | |
Class R3 | | | — | | | | — | | | | — | | | | — | |
Class I | | | 2,682 | | | | 56,169 | | | | 149,630 | | | | 3,375,832 | |
| Shares issued to shareholders due to reinvestment of distributions: | | | | | | | | | | | | | | | | |
Class A | | | 2,496 | | | | 49,208 | | | | 105 | | | | 2,371 | |
Class C | | | 322 | | | | 6,316 | | | | 11 | | | | 257 | |
Class R3 | | | — | | | | — | | | | — | | | | — | |
Class I | | | 2,726 | | | | 53,521 | | | | 411 | | | | 9,257 | |
| | | | 16,712 | | | | 356,588 | | | | 167,023 | | | | 3,769,280 | |
| Shares redeemed: | | | | | | | | | | | | | | | | |
Class A | | | (14,625 | ) | | | (299,932 | ) | | | (8,811 | ) | | | (196,930 | ) |
Class C | | | (2,679 | ) | | | (57,794 | ) | | | (1,758 | ) | | | (41,757 | ) |
Class R3 | | | — | | | | — | | | | — | | | | — | |
Class I | | | (34,590 | ) | | | (700,910 | ) | | | (150,113 | ) | | | (3,541,497 | ) |
| | | | (51,894 | ) | | | (1,058,636 | ) | | | (160,682 | ) | | | (3,780,184 | ) |
| Net increase (decrease) | | | (35,182 | ) | | $ | (702,048 | ) | | | 6,341 | | | $ | (10,904 | ) |
| | |
| | | Year Ended
8/31/15 | | | Year Ended
8/31/14 | |
| Intelligent Risk Moderate Allocation | | Shares | | | Amount | | | Shares | | | Amount | |
| Shares sold: | |
Class A | | | 32,865 | | | $ | 670,643 | | | | 2,603 | | | $ | 54,633 | |
Class C | | | 8,394 | | | | 171,726 | | | | 4,815 | | | | 103,061 | |
Class R3 | | | — | | | | — | | | | — | | | | — | |
Class I | | | 5,811 | | | | 119,982 | | | | 169,730 | | | | 3,486,427 | |
| Shares issued to shareholders due to reinvestment of distributions: | | | | | | | | | | | | | | | | |
Class A | | | 799 | | | | 15,770 | | | | 260 | | | | 5,360 | |
Class C | | | 538 | | | | 10,504 | | | | 65 | | | | 1,327 | |
Class R3 | | | — | | | | — | | | | — | | | | — | |
Class I | | | 1,256 | | | | 24,943 | | | | 558 | | | | 11,663 | |
| | | | 49,663 | | | | 1,013,568 | | | | 178,031 | | | | 3,662,471 | |
| Shares redeemed: | | | | | | | | | | | | | | | | |
Class A | | | (2,847 | ) | | | (56,751 | ) | | | (17,709 | ) | | | (364,839 | ) |
Class C | | | (5,958 | ) | | | (121,387 | ) | | | (5,338 | ) | | | (111,412 | ) |
Class R3 | | | — | | | | — | | | | — | | | | — | |
Class I | | | (21,468 | ) | | | (450,304 | ) | | | (166,175 | ) | | | (3,634,624 | ) |
| | | | (30,273 | ) | | | (628,442 | ) | | | (189,222 | ) | | | (4,110,875 | ) |
| Net increase (decrease) | | | 19,390 | | | $ | 385,126 | | | | (11,191 | ) | | $ | (448,404 | ) |
5. Investment Transactions
Long-term purchases and sales during the current fiscal period were as follows:
| | | | | | | | | | | | |
| | | Intelligent Risk
Conservative Allocation | | | Intelligent Risk
Growth Allocation | | | Intelligent Risk
Moderate Allocation | |
| Purchases | | $ | 1,304,825 | | | $ | 2,006,811 | | | $ | 3,324,722 | |
| Sales | | | 1,640,878 | | | | 2,914,466 | | | | 3,051,650 | |
6. Income Tax Information
Each Fund is a separate taxpayer for federal income tax purposes. Each Fund intends to distribute substantially all of its net investment income and net capital gains to shareholders and to otherwise comply with the requirements of Subchapter M of the Internal Revenue Code applicable to regulated investment companies. Therefore, no federal income tax provision is required.
Notes to Financial Statements (continued)
For all open tax years and all major taxing jurisdictions, management of the Funds has concluded that there are no significant uncertain tax positions that would require recognition in the financial statements. Open tax years are those that are open for examination by taxing authorities (i.e., generally the last four tax year ends and the interim tax period since then). Furthermore, management of the Funds is also not aware of any tax positions for which it is reasonably possible that the total amounts of unrecognized tax benefits will significantly change in the next twelve months.
The following information is presented on an income tax basis. Differences between amounts for financial statement and federal income tax purposes are primarily due to timing differences in recognizing certain gains and losses on investment transactions. To the extent that differences arise that are permanent in nature, such amounts are reclassified within the capital accounts as detailed below. Temporary differences do not require reclassification. Temporary and permanent differences do not impact the NAVs of the Funds.
As of August 31, 2015, the cost and unrealized appreciation (depreciation) of investments, as determined on a federal income tax basis, were as follows:
| | | | | | | | | | | | |
| | | Intelligent Risk
Conservative Allocation | | | Intelligent Risk
Growth Allocation | | | Intelligent Risk
Moderate Allocation | |
| Cost of investments | | $ | 1,026,367 | | | $ | 1,475,167 | | | $ | 2,515,920 | |
| Gross unrealized: | | | | | | | | | | | | |
Appreciation | | $ | 63,237 | | | $ | 93,815 | | | $ | 127,639 | |
Depreciation | | | (82,745 | ) | | | (145,375 | ) | | | (138,885 | ) |
| Net unrealized appreciation (depreciation) of investments | | $ | (19,508 | ) | | $ | (51,560 | ) | | $ | (11,246 | ) |
Permanent differences, primarily due to investments in partnerships and investments in ETFs, resulted in reclassifications among the Funds’ components of net assets as of August 31, 2015, the Funds’ tax year end, as follows:
| | | | | | | | | | | | |
| | | Intelligent Risk
Conservative Allocation | | | Intelligent Risk
Growth Allocation | | | Intelligent Risk
Moderate Allocation | |
| Capital paid-in | | $ | (30 | ) | | $ | — | | | $ | — | |
| Undistributed (Over-distribution of) net investment income | | | (4,199 | ) | | | — | | | | (5,154 | ) |
| Accumulated net realized gain (loss) | | | 4,229 | | | | — | | | | 5,154 | |
The tax components of undistributed net ordinary income and net long-term capital gains as of August 31, 2015, the Funds’ tax year end, were as follows:
| | | | | | | | | | | | |
| | | Intelligent Risk
Conservative Allocation | | | Intelligent Risk
Growth Allocation | | | Intelligent Risk
Moderate Allocation | |
| Undistributed net ordinary income1 | | $ | — | | | $ | 7,875 | | | $ | — | |
| Undistributed net long-term capital gains | | | — | | | | — | | | | — | |
| 1 | Undistributed net ordinary income (on a tax basis) for Intelligent Risk Conservative Allocation has not been reduced for the dividends declared during the period August 1, 2015 through August 31, 2015 and paid on September 1, 2015. Net ordinary income consists of net taxable income derived from dividends, interest, and net short-term capital gains, if any. |
The tax character of distributions paid during the Funds’ tax years ended August 31, 2015 and August 31, 2014 was designated for purposes of the dividends paid deduction as follows:
| | | | | | | | | | | | |
2015 | | Intelligent Risk
Conservative Allocation | | | Intelligent Risk
Growth Allocation | | | Intelligent Risk
Moderate Allocation | |
| Distributions from net ordinary income2 | | $ | 151,102 | | | $ | 150,834 | | | $ | 94,043 | |
| Distributions from net long-term capital gains3 | | | 7,425 | | | | 59,537 | | | | 7,851 | |
| Return of capital | | | — | | | | — | | | | 4,683 | |
| | | | | | | | | | | | |
2014 | | Intelligent Risk
Conservative Allocation | | | Intelligent Risk
Growth Allocation | | | Intelligent Risk
Moderate Allocation | |
| Distributions from net ordinary income2 | | $ | 51,053 | | | $ | 23,938 | | | $ | 51,104 | |
| Distributions from net long-term capital gains | | | — | | | | — | | | | — | |
| Return of capital | | | — | | | | — | | | | — | |
| 2 | Net ordinary income consists of net taxable income derived from dividends, interest, and net short-term capital gains, if any. |
| 3 | The Funds hereby designate as long-term capital gain dividends, pursuant to Internal Revenue Code Section 852(b)(3), the amount necessary to reduce earnings and profits of the Funds related to net capital gain to zero for the tax year ended August 31, 2015. |
The Funds have elected to defer late-year losses in accordance with federal income tax rules. These losses are treated as having arisen on the first day of the following fiscal year. The Funds have elected to defer losses as follows:
| | | | | | | | | | | | |
| | | Intelligent Risk
Conservative Allocation | | | Intelligent Risk
Growth Allocation | | | Intelligent Risk
Moderate Allocation | |
| Post-October capital losses4 | | $ | 9,536 | | | $ | 58,080 | | | $ | 23,977 | |
| Late-year ordinary losses5 | | | — | | | | — | | | | — | |
| 4 | Capital losses incurred from November 1, 2014 through August 31, 2015, the Funds’ tax year end. |
| 5 | Ordinary losses incurred from January 1, 2015 through August 31, 2015 and/or specified losses incurred from November 1, 2014 through August 31, 2015. |
7. Management Fees and Other Transactions with Affiliates
Each Fund’s management fee compensates the Adviser for overall investment advisory and administrative services and general office facilities. The Sub-Adviser is compensated for its services to the Funds from the management fees paid to the Adviser.
Each Fund’s management fee consists of two components – a fund-level fee, based only on the amount of assets within each individual Fund, and a complex-level fee, based on the aggregate amount of all eligible fund assets managed by the Adviser. This pricing structure enables each Fund’s shareholders to benefit from growth in the assets within their respective Fund as well as from growth in the amount of complex-wide assets managed by the Adviser.
The annual Fund-level fee, payable monthly, for each Fund is calculated according to the following schedule:
| | | | | | | | | | | | |
| Average Daily Net Assets | | Intelligent Risk Conservative Allocation | | | Intelligent Risk Growth Allocation | | | Intelligent Risk
Moderate Allocation | |
| For the first $125 million | | | 0.6000 | % | | | 0.6000 | % | | | 0.6000 | % |
| For the next $125 million | | | 0.5875 | | | | 0.5875 | | | | 0.5875 | |
| For the next $250 million | | | 0.5750 | | | | 0.5750 | | | | 0.5750 | |
| For the next $500 million | | | 0.5625 | | | | 0.5625 | | | | 0.5625 | |
| For the next $1 billion | | | 0.5500 | | | | 0.5500 | | | | 0.5500 | |
| For net assets over $2 billion | | | 0.5250 | | | | 0.5250 | | | | 0.5250 | |
The annual complex-level fee, payable monthly, for each Fund is calculated according to the following schedule:
| | | | |
| Complex-Level Asset Breakpoint Level* | | Effective Rate at Breakpoint Level | |
| $55 billion | | | 0.2000 | % |
| $56 billion | | | 0.1996 | |
| $57 billion | | | 0.1989 | |
| $60 billion | | | 0.1961 | |
| $63 billion | | | 0.1931 | |
| $66 billion | | | 0.1900 | |
| $71 billion | | | 0.1851 | |
| $76 billion | | | 0.1806 | |
| $80 billion | | | 0.1773 | |
| $91 billion | | | 0.1691 | |
| $125 billion | | | 0.1599 | |
| $200 billion | | | 0.1505 | |
| $250 billion | | | 0.1469 | |
| $300 billion | | | 0.1445 | |
| * | The complex-level fee is calculated based upon the aggregate daily “eligible assets” of all Nuveen funds. Eligible assets do not include assets attributable to investments in other Nuveen funds or assets in excess of $2 billion added to the Nuveen fund complex in connection with the Adviser’s assumption of the management of the former First American Funds effective January 1, 2011. Eligible assets include closed-end fund assets managed by the Adviser that are attributable to certain types of leverage. For these purposes, leverage includes the closed-end funds’ use of preferred stock and borrowings and investments in the residual interest certificates (also called inverse floating rate securities) in tender option bond (TOB) trusts, including the portion of assets held by a TOB trust that has been effectively financed by the trust’s issuance of floating rate securities, subject to an agreement by the Adviser as to certain funds to limit the amount of such assets for determining eligible assets in certain circumstances. As of August 31, 2015, the complex-level fee for each Fund was 0.1643%. |
The Adviser has agreed to waive fees and/or reimburse expenses of each Fund through September 30, 2016, so that total annual Fund operating expenses (excluding 12B-1 distribution and/or service fees, interest expenses, taxes, fees incurred in acquiring and disposing of portfolio securities, acquired fund fees and expenses and extraordinary expenses), for each Fund do not exceed 0.71% of the average daily net assets of any class of Fund shares.
The Trust pays no compensation directly to those of its trustees who are affiliated with the Adviser or to its officers, all of whom receive remuneration for their services to the Trust from the Adviser or its affiliates. The Board has adopted a deferred compensation plan for independent trustees that enables trustees to elect to defer receipt of all or a portion of the annual compensation they are entitled to receive from certain Nuveen-advised funds. Under the plan, deferred amounts are treated as though equal dollar amounts had been invested in shares of select Nuveen-advised funds.
During the current fiscal period, Nuveen Securities, LLC (the “Distributor”), a wholly-owned subsidiary of Nuveen, collected sales charges on purchases of Class A Shares, the majority of which were paid out as concessions to financial intermediaries as follows:
| | | | | | | | | | | | |
| | | Intelligent Risk Conservative Allocation | | | Intelligent Risk Growth Allocation | | | Intelligent Risk
Moderate Allocation | |
| Sales charges collected (Unaudited) | | $ | 46 | | | $ | 1,097 | | | $ | 2,270 | |
| Paid to financial intermediaries (Unaudited) | | | 40 | | | | 953 | | | | 2,055 | |
The Distributor also received 12b-1 service fees on Class A Shares, substantially all of which were paid to compensate financial intermediaries for providing services to shareholders relating to their investments.
Notes to Financial Statements (continued)
During the current fiscal period, the Distributor compensated financial intermediaries directly with commission advances at the time of purchase as follows:
| | | | | | | | | | | | |
| | | Intelligent Risk
Conservative Allocation | | | Intelligent Risk
Growth Allocation | | | Intelligent Risk
Moderate Allocation | |
| Commission advances (Unaudited) | | $ | 140 | | | $ | 60 | | | $ | 400 | |
To compensate for commissions advanced to financial intermediaries, all 12b-1 service and distribution fees collected on Class C Shares during the first year following a purchase were retained by the Distributor. During the current fiscal period, the Distributor retained such 12b-1 fees as follows:
| | | | | | | | | | | | |
| | | Intelligent Risk Conservative Allocation | | | Intelligent Risk
Growth Allocation | | | Intelligent Risk
Moderate Allocation | |
| 12b-1 fees retained (Unaudited) | | $ | 822 | | | $ | 600 | | | $ | 1,441 | |
The remaining 12b-1 fees charged to the Funds were paid to compensate financial intermediaries for providing services to shareholders relating to their investments.
The Distributor also collected and retained CDSC on share redemptions during the current fiscal period, as follows:
| | | | | | | | | | | | |
| | | Intelligent Risk
Conservative Allocation | | | Intelligent Risk
Growth Allocation | | | Intelligent Risk
Moderate Allocation | |
| CDSC retained (Unaudited) | | $ | 9,342 | | | $ | — | | | $ | — | |
As of the end of the reporting period, Nuveen owned shares of the Funds as follows:
| | | | | | | | | | | | |
| | | Intelligent Risk Conservative Allocation | | | Intelligent Risk
Growth Allocation | | | Intelligent Risk
Moderate Allocation | |
| Class A Shares | | $ | 2,500 | | | $ | 2,500 | | | $ | 2,500 | |
| Class C Shares | | | 2,500 | | | | 2,500 | | | | 2,500 | |
| Class R3 Shares | | | 2,500 | | | | 2,500 | | | | 2,500 | |
| Class I Shares | | | 42,500 | | | | 42,500 | | | | 42,500 | |
8. Borrowing Arrangements
The Funds, along with certain other funds managed by the Adviser (“Participating Funds”), established a 364-day, $2.53 billion standby credit facility with a group of lenders, under which the Participating Funds may borrow for various purposes other than leveraging for investment purposes. A large portion of this facility’s capacity (and its associated costs as described below) is currently dedicated for use by a small number of Participating Funds, which does not include any of the Funds covered by this shareholder report. The remaining capacity under the facility (and the corresponding portion of the facility’s annual costs) is separately dedicated to most of the other open-end funds in the Nuveen fund family, including all of the Funds covered by this shareholder report, along with a number of Nuveen closed-end funds. The credit facility expires in July 2016 unless extended or renewed.
The credit facility has the following terms: a fee of 0.15% per annum on unused commitment amounts, and interest at a rate equal to the higher of (a) one-month LIBOR (London Inter-Bank Offered Rate) plus 1.25% per annum or (b) the Fed Funds rate plus 1.25% per annum on amounts borrowed. Participating Funds paid administration, legal and arrangement fees, which are recognized as a component of “other expenses” on the Statement of Operations, and along with commitment fees, have been allocated among such participating Funds based upon the relative proportions of the facility’s aggregate capacity reserved for them and other factors deemed relevant by the Adviser and the Board of each Participating Fund.
During the current fiscal period, none of the Funds utilized this facility.
9. New Accounting Pronouncement
Financial Accounting Standards Board (“FASB”) Transfers and Servicing (Topic 860): Repurchase-to-Maturity Transactions, Repurchase Financings, and Disclosures
In June 2014, the FASB issued Accounting Standards Update (“ASU”) 2014-11, Transfers and Servicing (Topic 860): Repurchase-to-Maturity Transactions, Repurchase Financings, and Disclosures” (“ASU 2014-11”), that expanded secured borrowing accounting for certain reverse repurchase agreements. ASU 2014-11 also sets forth additional disclosure requirements for certain transactions accounted for as sales in order to provide financial statement users with information to compare to similar transactions accounted for as secured borrowings. ASU 2014-11 is effective prospectively for annual periods beginning after December 15, 2014, and interim periods beginning after March 15, 2015. Management is currently evaluating the impact, if any, of ASU 2014-11 on the Funds’ financial statement disclosures.
10. Subsequent Events
Change in Contingent Deferred Sales Charge (CDSC) Schedule
Effective November 1, 2015, shareholders purchasing $1 million or more of Class A Shares at NAV without an up-front sales charge will be assessed a CDSC of 1.00% on any shares redeemed within eighteen months of purchase, unless the redemption is eligible for a CDSC reduction or waiver as specified in the Funds’ statement of additional information.
Additional
Fund Information (Unaudited)
| | | | | | | | | | |
| | | | | |
| | Fund Manager Nuveen Fund Advisors, LLC
333 West Wacker Drive
Chicago, IL 60606
Sub-Adviser Nuveen Asset Management, LLC
333 West Wacker Drive
Chicago, IL 60606 | | Independent Registered
Public Accounting Firm PricewaterhouseCoopers LLP Chicago, IL 60606 Custodian U.S. Bank National
Association
Milwaukee, WI 53202 | | Legal Counsel Chapman and Cutler LLP Chicago, IL 60603 | | Transfer Agent and
Shareholder Services Boston Financial
Data Services, Inc.
Nuveen Investor Services
P.O. Box 8530
Boston, MA 02266-8530
(800) 257-8787 | | |
| | | | | | | | | | | | | | |
| | | | | |
| | | | | | | | | | |
| | |
| | Distribution Information: The Funds hereby designate their percentages of dividends paid from net ordinary income as dividends qualifying for the 70% dividends received deduction (“DRD”) for corporations and their percentages as qualified dividend income (“QDI”) for individuals under Section 1(h)(11) of the Internal Revenue Code as shown in the accompanying table. The actual qualified dividend income distributions will be reported to shareholders on Form 1099-DIV which will be sent to shareholders shortly after calendar year end. | | |
| | | | | | | |
| | | | | | | | | Intelligent Risk
Conservative Allocation | | Intelligent Risk
Growth Allocation | | Intelligent Risk
Moderate Allocation | | |
| | % QDI | | | | | | 7% | | 44% | | 51% | | |
| | % DRD | | | | | | 4% | | 18% | | 24% | | |
| | | |
| | | | | | |
| | |
| | Quarterly Form N-Q Portfolio of Investments Information: Each Fund is required to file its complete schedule of portfolio holdings with the Securities and Exchange Commission (SEC) for the first and third quarters of each fiscal year on Form N-Q. You may obtain this information directly from the SEC. Visit the SEC on-line at http://www.sec.gov or in person at the SEC’s Public Reference Room in Washington, D.C. Call the SEC toll-free at (800) SEC-0330 for room hours and operation. | | |
| | | |
| | | | | | |
| | |
| | Nuveen Funds’ Proxy Voting Information: You may obtain (i) information regarding how each fund voted proxies relating to portfolio securities held during the most recent twelve-month period ended June 30, without charge, upon request, by calling Nuveen Investments toll-free at (800) 257-8787 or on Nuveen’s website at www.nuveen.com and (ii) a description of the policies and procedures that each fund used to determine how to vote proxies relating to portfolio securities without charge, upon request, by calling Nuveen Investments toll-free at (800) 257-8787. You may also obtain this information directly from the SEC. Visit the SEC on-line at http://www.sec.gov. | | |
| | | |
| | | | | | |
| | |
| | FINRA BrokerCheck: The Financial Industry Regulatory Authority (FINRA) provides information regarding the disciplinary history of FINRA member firms and associated investment professionals. This information as well as an investor brochure describing FINRA BrokerCheck is available to the public by calling the FINRA BrokerCheck Hotline number at (800) 289-9999 or by visiting www.FINRA.org. | | |
Glossary of Terms
Used in this Report (Unaudited)
Average Annual Total Return: This is a commonly used method to express an investment’s performance over a particular, usually multi-year time period. It expresses the return that would have been necessary each year to equal the investment’s actual cumulative performance (including change in NAV or offer price and reinvested dividends and capital gains distributions, if any) over the time period being considered.
Barclays 20+ Year U.S. Treasury Bond Index: Measures the performance of public obligations of the U.S. Treasury that have a remaining maturity of 20 or more years. Index returns assume reinvestment of distributions, but do not reflect any applicable sales charges or management fees.
Barclays Aggregate Bond Index: The index covers the U.S. investment grade fixed rate bond market, with index components for government and corporate securities, mortgage pass through securities and asset-backed securities. These major sectors are subdivided into more specific indexes that are calculated and reported on a regular basis. Index returns assume reinvestment of distributions, but do not include the effects of any applicable sales charges or management fees.
Barclays Municipal Bond Index: A rules-based, market value weighted index engineered for the long-term tax-exempt bond market. The Index tracks general obligation bonds, revenue bonds, insured bonds and pre-refunded Baa3/BBB rated bonds or higher by at least two of the ratings agencies: Moody’s, S&P, Fitch. Index returns assume reinvestment of distributions, but do not include the effects of any applicable sales charges or management fees.
Bloomberg Commodity Index: An unmanaged index that seeks to provide broadly diversified representation of commodity markets as an asset class. The index is made up of exchange-traded futures on physical commodities and currently represents 20 commodities. Commodity weightings are based on production and liquidity, subject to weighting restrictions applied annually such that no related group of commodities constitutes more than 33% of the index and no single commodity constitutes more than 15% or less than 2% of the index.
FTSE Emerging Markets Index: A free-floating market-capitalization weighted index representing the performance of around 850 large and mid cap companies in 22 emerging markets. The index is derived from the FTSE Global Equity Index Series. Index returns assume reinvestment of distributions, but do not include the effects of any applicable sales charges or management fees.
Gross Domestic Product (GDP): The total market value of all final goods and services produced in a country/region in a given year, equal to total consumer, investment and government spending, plus the value of exports, minus the value of imports.
Lipper Mixed-Asset Target Allocation Conservative Funds Classification Average: Represents the average annualized total return for all reporting funds in the Lipper Mixed-Asset Target Allocation Conservative Funds Classification. Lipper returns account for the effects of management fees and assume reinvestment of distributions, but do not reflect any applicable sales charges.
Lipper Mixed-Asset Target Allocation Growth Funds Classification Average: Represents the average annualized total return for all reporting funds in the Lipper Mixed-Asset Target Allocation Growth Funds Classification. Lipper returns account for the effects of management fees and assume reinvestment of distributions, but do not reflect any applicable sales charges.
Lipper Mixed-Asset Target Allocation Moderate Funds Classification Average: Represents the average annualized total return for all reporting funds in the Lipper Mixed-Asset Target Allocation Moderate Funds Classification. Lipper returns account for the effects of management fees and assume reinvestment of distributions, but do not reflect any applicable sales charges.
Morningstar Moderate Target Risk Index: An index that represents a portfolio of global equities, bonds, and traditional inflation hedges, such as commodities and TIPS. This portfolio is held in a static allocation of 60% equities and 40% fixed income, which is appropriate for U.S. investors who seek average exposure to equity market risk and returns. Index returns assume reinvestment of distributions, but do not reflect any applicable sales charges or management fees.
Morningstar Moderately Aggressive Target Risk Index: An index that represents a portfolio of global equities, bonds and traditional inflation hedges such as commodities and TIPS. This portfolio is held in a static allocation appropriate for U.S. investors who seek a slightly above-average exposure to equity market risk and returns. Index returns assume reinvestment of distributions, but do not reflect any applicable sales charges or management fees.
Morningstar Moderately Conservative Target Risk Index: An index that represents a portfolio of global equities, bonds and traditional inflation hedges such as commodities and TIPS. This portfolio is held in a static allocation appropriate for U.S. investors who seek a slightly below-average exposure to equity market risk and returns. Index returns assume reinvestment of distributions, but do not reflect any applicable sales charges or management fees.
MSCI EAFE Index: The MSCI (Morgan Stanley Capital International) EAFE (Europe, Australasia, Far East) Index is a free float-adjusted market capitalization weighted index designed to measure developed market equity performance, excluding the U.S. and Canada. Index returns assume reinvestment of distributions, but do not reflect any applicable sales charges or management fees.
MSCI Emerging Markets Index: A free float-adjusted market capitalization index that is designed to measure equity market performance in the global emerging markets. Index returns assume reinvestment of distributions, but do not reflect any applicable sales charges or management fees.
Net Asset Value (NAV) Per Share: A fund’s Net Assets is equal to its total assets (securities, cash and accrued earnings) less its total liabilities. For funds with multiple classes, Net Assets are determined separately for each share class. NAV per share is equal to the fund’s (or share class’) Net Assets divided by its number of shares outstanding.
Russell 1000® Index: An unmanaged index, considered representative of large-cap stocks. Index returns assume reinvestment of distributions, but do not reflect any applicable sales charges or management fees.
Russell 2000® Index: An index that measures the performance of the small-cap segment of the U.S. equity universe. The Russell 2000® is a subset of the Russell 3000® Index representing approximately 10% of the total market capitalization of that index. It includes approximately 2000 of the smallest securities based on a combination of their market cap and current index membership. Index returns assume reinvestment of distributions, but do not reflect any applicable sales charges or management fees.
S&P 500® Index: An unmanaged index generally considered representative of the U.S. stock market. Index returns assume reinvestment of distributions, but do not include the effects of any applicable sales charges or management fees.
S&P North American Natural Resources Index: The index measures the performance of U.S.-traded natural resource related stocks. Index returns assume reinvestment of distributions, but do not reflect any applicable sales charges or management fees.
Annual Investment Management Agreement
Approval Process (Unaudited)
The Board of Trustees of each Fund (each, a “Board” and each Trustee, a “Board Member”), including the Board Members who are not parties to the Funds’ advisory or sub-advisory agreements or “interested persons” of any such parties (the “Independent Board Members”), is responsible for overseeing the performance of the investment adviser and sub-adviser to the respective Fund and determining whether to continue such Fund’s advisory agreement (the “Investment Management Agreement”) between the Fund and Nuveen Fund Advisors, LLC (the “Adviser”) and the sub-advisory agreement (the “Sub-Advisory Agreement” and, together with the Investment Management Agreement, the “Advisory Agreements”) between the Adviser and Nuveen Asset Management, LLC (the “Sub-Adviser”). Following an initial term with respect to each Fund upon its commencement of operations, the Board is required to consider the continuation of the Advisory Agreements on an annual basis pursuant to the requirements of the Investment Company Act of 1940, as amended (the “1940 Act”). Accordingly, at an in-person meeting held on May 11-13, 2015 (the “May Meeting”), the Board, including a majority of the Independent Board Members, considered and approved the existing Advisory Agreements for the Funds.
In preparation for its considerations at the May Meeting, the Board received in advance of the meeting extensive materials prepared in connection with the review of the Advisory Agreements. The materials provided a broad range of information regarding the Funds, including, among other things, the nature, extent and quality of services provided by the Adviser and Sub-Adviser (the Adviser and Sub-Adviser are collectively, the “Fund Advisers” and each, a “Fund Adviser”); Fund performance including performance assessments against peers and the appropriate benchmark(s); fee and expense information of the Funds compared to peers; a description and assessment of shareholder service levels for the Funds; a summary of the performance of certain service providers; a review of product initiatives and shareholder communications; and profitability information of the Fund Advisers as described in further detail below. As part of its annual review, the Board also held a separate meeting on April 14-15, 2015 to review the Funds’ investment performance and consider an analysis by the Adviser of the Sub-Adviser which generally evaluated the Sub-Adviser’s investment team, investment mandate, organizational structure and history, investment philosophy and process, and the performance of the Funds, and any significant changes to the foregoing. During the review, the Independent Board Members asked questions of and requested additional information from management.
The Board considered that the evaluation process with respect to the Fund Advisers is an ongoing process that encompassed the information and knowledge gained throughout the year. The Board, acting directly or through its committees, met regularly during the course of the year and received information and considered factors at each meeting that would be relevant to its annual consideration of the Advisory Agreements, including information relating to Fund performance; Fund expenses; investment team evaluations; and valuation, compliance, regulatory and risk matters. In addition to regular reports, the Adviser provided special reports to the Board to enhance the Board’s understanding on topics that impact some or all of the Nuveen funds and the Adviser (such as presentations on risk and stress testing; the new governance, risk and compliance system; cybersecurity developments; Nuveen fund accounting and reporting matters; regulatory developments impacting the investment company industry and the business plans or other matters impacting the Adviser). The Board also met with key investment personnel managing certain Nuveen fund portfolios during the year.
The Board had created several standing committees including the Open-End Funds Committee and the Closed-End Funds Committee to assist the full Board in monitoring and gaining a deeper insight into the distinctive business practices of closed-end and open-end funds. These Committees met prior to each quarterly Board meeting, and the Adviser provided presentations to these Committees permitting them to delve further into specific matters or initiatives impacting the respective product line.
The Board also continued its program of seeking to have the Board Members or a subset thereof visit each sub-adviser to the Nuveen funds at least once over a multiple year rotation, meeting with key investment and business personnel. In this regard, the Independent Board Members made site visits to multiple equity and fixed-income investment teams of the Sub-Adviser in June 2014.
The Board considered the information provided and knowledge gained at these meetings and visits during the year when performing its annual review of the Advisory Agreements. The Independent Board Members also were assisted throughout the process by independent legal counsel. During the course of the year and during their deliberations regarding the review of advisory contracts, the Independent Board Members met with independent legal counsel in executive sessions without management present. The Independent Board Members also received a memorandum from independent legal counsel outlining the legal standards for their consideration of the proposed continuation of the Advisory Agreements. In addition, it is important to recognize that the management arrangements for the Nuveen funds are the result of many years of review and discussion between the Independent Board Members and Fund management and that the Board Members’ conclusions may be based, in part, on their consideration of fee arrangements and other factors developed in previous years.
The Board took into account all factors it believed relevant with respect to each Fund, including, among other things: (a) the nature, extent and quality of the services provided by the Fund Advisers; (b) the investment performance of the Funds and Fund Advisers; (c) the advisory fees and costs of the
services to be provided to the Funds and the profitability of the Fund Advisers; (d) the extent of any economies of scale; (e) any benefits derived by the Fund Advisers from the relationship with the Funds; and (f) other factors. Each Board Member may have accorded different weight to the various factors in reaching his or her conclusions with respect to the Advisory Agreements for each Fund. The Independent Board Members did not identify any single factor as all-important or controlling. The Independent Board Members’ considerations were instead based on a comprehensive consideration of all the information presented. The principal factors considered by the Board and its conclusions are described below.
A. Nature, Extent and Quality of Services
In evaluating the renewal of the Advisory Agreements, the Independent Board Members received and considered information regarding the nature, extent and quality of the applicable Fund Adviser’s services provided to each respective Fund. The Board reviewed information regarding, among other things, each Fund Adviser’s organization and business, the types of services that each Fund Adviser or its affiliates provided to the Funds, the performance record of the Funds (as described in further detail below), and any initiatives that had been undertaken on behalf of the open-end product line. The Board recognized the high quality of services the Adviser had provided to the Funds over the years and the conscientiousness with which the Adviser provided these services. The Board also considered the improved capital structure of Nuveen Investments, Inc. (“Nuveen”) (the parent of the Adviser) following the acquisition of Nuveen by TIAA-CREF in 2014 (the “TIAA-CREF Transaction”).
With respect to the services, the Board noted the Funds were registered investment companies that operated in a regulated industry and considered the myriad of investment management, administrative, compliance, oversight and other services the Adviser provided to manage and operate the Funds. Such services included, among other things: (a) product management (such as analyzing ways to better position a Nuveen fund in the marketplace, setting dividends; maintaining relationships to gain access to distribution platforms; and providing shareholder communications); (b) fund administration (such as preparing tax returns and other tax compliance services, preparing regulatory filings and shareholder reports; managing fund budgets and expenses; overseeing a fund’s various service providers and supporting and analyzing new and existing funds); (c) Board administration (such as supporting the Board and its committees, in relevant part, by organizing and administering the Board and committee meetings and preparing the necessary reports to assist the Board in its duties); (d) compliance (such as monitoring adherence to a fund’s investment policies and procedures and applicable law; reviewing the compliance program periodically and developing new policies or updating existing compliance policies and procedures as considered necessary or appropriate; responding to regulatory requests; and overseeing compliance testing of the funds’ sub-advisers); (e) legal support (such as preparing or reviewing fund registration statements, proxy statements and other necessary materials; interpreting regulatory requirements and compliance thereof; and maintaining applicable registrations); and (f) investment services (such as overseeing and reviewing the funds’ sub-advisers and their investment teams; analyzing performance of the funds; overseeing investment and risk management; evaluating brokerage transactions and securities lending, overseeing the daily valuation process for portfolio securities and developing and recommending valuation policies and methodologies and changes thereto; reporting to the Board on various matters including performance, risk and valuation; and participating in fund development, leverage management, and the developing or interpreting of investment policies and parameters).
In its review, the Board considered information highlighting the various initiatives that the Adviser had implemented or continued during the last year to enhance its services to the Nuveen funds. The Board recognized that some of these initiatives are a result of a multi-year process. In reviewing the activities of 2014, the Board recognized the Adviser’s continued focus on fund rationalization for open-end funds through mergers, fund closures or repositioning the funds in seeking to enhance shareholder value, reduce costs, improve performance, eliminate fund overlap and better meet shareholder needs. The Board noted the Adviser’s investment in additional staffing to strengthen and improve its services to the Nuveen funds, including with respect to risk management and valuation. The Board recognized that expanding the depth and range of its risk oversight activities had been a major priority for the Adviser in recent years, and the Adviser continued to add to the risk management team, develop additional risk management programs and create committees or other teams designated to oversee or evaluate certain risks, such as liquidity risk, enterprise risk, investment risk and cybersecurity risk. The Adviser had also continued to add to the valuation team, launched its centralized securities valuation system which is intended to provide for uniform pricing and reporting across the complex as the system continues to develop, continued to refine its valuation analysis and updated related policies and procedures and evaluated and assessed pricing services. The Board considered the Adviser’s ongoing investment in information technology and operations and the various projects of the information technology team to support the continued growth and complexity of the Nuveen funds and increase efficiencies in their operations. The Board also recognized the Adviser’s strong commitment to compliance and reviewed information reflecting the compliance group’s ongoing activities to enhance its compliance system and refine its compliance procedures as well as the Chief Compliance Officer’s report regarding the compliance team, the initiatives the team had undertaken in 2014 and proposed for 2015, the compliance functions and reporting process, the record of compliance with the policies and procedures and its supervision activities of other service providers.
With respect to the open-end fund product line, the Adviser had also, among other things: developed new funds in seeking to enhance the product line; enhanced the reporting to the Board and its committees regarding payments to intermediaries; and continued to explore opportunities for potential funds.
As noted, the Adviser also oversees the Sub-Adviser who primarily provides the portfolio advisory services to the Funds. The Board recognized the skill and competency of the Adviser in monitoring and analyzing the performance of the Sub-Adviser and managing the sub-advisory relationship. In
Annual Investment Management Agreement Approval Process (Unaudited) (continued)
considering the Sub-Advisory Agreements and supplementing its prior knowledge, the Board considered a current report provided by the Adviser analyzing, among other things, the Sub-Adviser’s investment team and changes thereto, investment approach, organization and history, and assets under management, and the investment performance of each Fund.
Based on their review, the Independent Board Members found that, overall, the nature, extent and quality of services provided to the Funds under each respective Advisory Agreement were satisfactory.
B. The Investment Performance of the Funds and Fund Advisers
The Board, including the Independent Board Members, considered the performance history of each Fund over various time periods. The Board reviewed reports, including an analysis of the Funds’ performance and the applicable investment team. The Board reviewed, among other things, each Fund’s investment performance both on an absolute basis and in comparison to peer funds (the “Performance Peer Group”) and to recognized and/or customized benchmarks (i.e., generally benchmarks derived from multiple recognized benchmarks) for the quarter and one-year periods ending December 31, 2014, as well as performance information reflecting the first quarter of 2015. In its review, the Board noted that it also reviewed Fund performance results at each of its quarterly meetings.
In evaluating performance, the Board recognized several factors that may impact the performance data as well as the consideration given to particular performance data.
| | • | | The performance data reflected a snapshot in time, in this case as of the end of the most recent calendar year or quarter. A different performance period, however, could generate significantly different results. |
| | • | | Long-term performance can be adversely affected by even one period of significant underperformance so that a single investment decision or theme had the ability to disproportionately affect long-term performance. |
| | • | | The investment experience of a particular shareholder in a fund would vary depending on when such shareholder invested in the fund, the class held (if multiple classes are offered in the fund) and the performance of the fund (or respective class) during that shareholder’s investment period. |
| | • | | Open-end funds offer multiple classes and the performance data provided for open-end funds was based on Class A shares. The performance of the other classes of a fund, however, should be substantially similar on a relative basis because all of the classes would be invested in the same portfolio of securities and differences in performance among classes could be principally attributed to the variations in distribution and servicing expenses of each class. |
| | • | | The Board recognized that the funds in the Performance Peer Group may differ somewhat from the Nuveen fund with which it is being compared and due to these differences, performance comparisons between certain of the Nuveen funds and their Performance Peer Groups may be inexact and the relevancy limited. The Board considered that management had classified the Performance Peer Group as low, medium and high in relevancy. The Board took the analysis of the relevancy of the Performance Peer Group into account when considering the comparative performance data. The Board also considered comparative performance of an applicable benchmark. While the Board was cognizant of the relative performance of a Fund’s peer set and/or benchmark(s), the Board evaluated Fund performance in light of the Fund’s investment objectives, investment parameters and guidelines and considered that the variations between the objectives and investment parameters or guidelines of the Fund with its peers and/or benchmarks result in differences in performance results. |
With respect to any Nuveen funds for which the Board has identified performance concerns, the Board monitors such funds closely until performance improves, discusses with the Adviser the reasons for such results, considers those steps necessary or appropriate to address such issues, and reviews the results of any efforts undertaken. The Board is aware, however, that shareholders chose to invest or remain invested in a fund knowing that the Adviser manages the fund and knowing the fund’s fee structure.
In considering the performance data, the Independent Board Members noted that each Fund ranked in its Performance Peer Group in the fourth quartile and underperformed its benchmark in the one-year period. The Board, however, recognized some limitations with the usefulness of the comparative peer data as the peers in the peer set generally reflected a different investment strategy than the respective Fund. The Board noted that exposure to non-U.S. stocks and allocations to natural resource equities and commodities contributed to the Funds’ underperformance but helped each Fund achieve its volatility objective. For Nuveen Intelligent Risk Conservative Allocation Fund and Nuveen Intelligent Risk Moderate Allocation Fund, the Board considered each such Fund’s positive absolute performance for the one-year period. The Board further noted that each Fund was relatively new with a performance history that was too short to make a conclusive assessment of its limited performance record.
As described above, for Nuveen funds with challenged performance, the Board considered an analysis by the Adviser focusing on the factors impacting the respective fund’s performance results and discussed such factors and the efforts considered or undertaken to address any performance issues. The Board recognized that although the Funds have a limited performance history available given they are relatively new, the Funds have experienced
periods of challenged performance. However, as noted, the Board recognized that the Adviser had classified the Performance Peer Groups of the Funds as low in relevancy, limiting some of the usefulness of the comparative peer data. The Independent Board Members will continue to monitor closely the progress of the Funds in seeking to improve performance.
C. Fees, Expenses and Profitability
1. Fees and Expenses
The Board evaluated the management fees and other fees and expenses of each Fund (expressed as a percentage of average net assets) in absolute terms and in comparison to the fee and expense levels of a comparable universe of funds (the “Peer Universe”) and, with respect to open-end funds, to a more focused subset in the Peer Universe (the “Peer Group”), each selected by an independent third-party fund data provider. The Independent Board Members reviewed the methodology regarding the construction of the Peer Universe and Peer Group for each Fund. The Board reviewed, among other things, such Fund’s gross management fees, net management fees and net expense ratios in absolute terms as well as compared to the average and median fee and expense levels of the Peer Universe and/or Peer Group. The Board recognized that the Funds invested in other investment companies and therefore also will indirectly pay a portion of the expenses incurred by the underlying funds, including their advisory fees. Accordingly, the Board also reviewed, among other things, each Fund’s indirect expenses and the net total expense ratio (including indirect expenses). The Board noted that the net total expense ratios paid by investors in the Funds were the most representative of an investor’s net experience. The Board Members also considered any fee waivers and/or expense reimbursement arrangements currently in effect for the Funds.
In reviewing the comparative fee and expense information, the Independent Board Members recognized that various factors such as the limited size and particular composition of the Peer Universe or Peer Group (including the inclusion of other Nuveen funds in the peer set); expense anomalies; changes in the funds comprising the Peer Universe or Peer Group from year to year; levels of reimbursement or fee waivers; the timing of information used; and differences in services provided can impact the comparative data limiting the usefulness of the data to help make a conclusive assessment of the Funds’ fees and expenses.
In reviewing the fee schedule for a fund, the Independent Board Members also considered the fund-level and complex-wide breakpoint schedules (described in further detail below) and any fee waivers and reimbursements provided by Nuveen. In reviewing fees and expenses, the Board considered the expenses and fees to be higher if they were over 10 basis points higher, slightly higher if they were approximately 6 to 10 basis points higher, in line if they were within approximately 5 basis points higher than the peer average and below if they were below the peer average of the Peer Group. In reviewing the reports, the Board noted that the majority of the Nuveen funds had a net expense ratio near or below their peer average.
The Independent Board Members recognized that the Funds had a net management fee that was below the peer average (noting that there were no net management fees after fee waivers and expense reimbursements for the latest fiscal year), and a net expense ratio (including fee waivers and expense reimbursements) that was also below the peer average. Given that the Funds also invested in other funds, in considering the services provided by the Fund Advisers to the Funds and the fee arrangement, the Board also determined that the fees were for services in addition to, rather than duplicative of, the services provided under any underlying fund’s advisory contracts.
Based on their review of the fee and expense information provided, the Independent Board Members determined that each Fund’s management fees (as applicable) to a Fund Adviser were reasonable in light of the nature, extent and quality of services provided to the Fund.
2. Comparisons with the Fees of Other Clients
The Board considered information regarding the fees a Fund Adviser assessed to the Nuveen funds compared to that of other clients as described in further detail below. With respect to non-municipal funds, such other clients of the Adviser and/or its affiliated sub-advisers may include: separately managed accounts (such as retail, institutional or wrap accounts), hedge funds, other investment companies that are not offered by Nuveen but are sub-advised by one of Nuveen’s affiliated sub-advisers, foreign investment companies offered by Nuveen, and collective investment trusts.
The Board recognized that each Fund had an affiliated sub-adviser and therefore the overall Fund management fee can be divided into two components, the fee retained by the Adviser and the fee paid to the Sub-Adviser. In reviewing the nature of the services provided by the Adviser, including through its affiliated sub-advisers, the Board considered the range of advisory fee rates for retail and institutional managed accounts advised by Nuveen-affiliated sub-advisers. The Board also reviewed, among other things, the average fee the affiliated sub-advisers assessed such clients as well as the range of fee rates assessed to the different types of clients (such as retail, institutional and wrap accounts as well as non-Nuveen funds) applicable to such sub-advisers.
In reviewing the comparative information, the Board also reviewed information regarding the differences between the Funds and the other clients, including differences in services provided, investment policies, investor profiles, compliance and regulatory requirements and account sizes. The Board recognized the breadth of services necessary to operate a registered investment company (as described above) and that, in general terms, the Adviser provided the administrative and other support services to the Funds and, although the Sub-Adviser may provide some of these services,
Annual Investment Management Agreement Approval Process (Unaudited) (continued)
the Sub-Adviser essentially provided the portfolio management services. In general, the Board noted that higher fee levels reflected higher levels of service provided by the Fund Adviser, increased investment management complexity, greater product management requirements and higher levels of business risk or some combination of the foregoing. The Independent Board Members considered the differences in structure and operations of separately managed accounts and hedge funds from registered funds and noted that the range of day-to-day services was not generally of the breadth required for the registered funds. Many of the additional administrative services provided by the Adviser were not required for institutional clients or funds sub-advised by a Nuveen-affiliated sub-adviser that were offered by other fund groups. The Independent Board Members also recognized that the management fee rates of the foreign funds advised by the Adviser may vary due to, among other things, differences in the client base, governing bodies, operational complexities and services covered by the management fee. Given the inherent differences in the various products, particularly the extensive services provided to the Funds, the Independent Board Members believed such facts justify the different levels of fees.
3. Profitability of Fund Advisers
In conjunction with their review of fees, the Independent Board Members also considered the profitability of Nuveen for its advisory activities and its financial condition. The Independent Board Members reviewed, among other things, the adjusted operating margins for Nuveen for the last two calendar years, the revenues, expenses, net income (pre-tax and after-tax) and net revenue margins (pre-tax and after-tax) of Nuveen’s managed fund advisory activities for the last two calendar years, the allocation methodology used by Nuveen in preparing the profitability data and a history of the adjustments to the methodology due to changes in the business over time. The Independent Board Members also reviewed the revenues, expenses, net income (pre-tax and after-tax) and revenue margin (pre-tax and post-tax) of the Adviser and, as described in further detail below, each affiliated sub-adviser for the 2014 calendar year. In reviewing the profitability data, the Independent Board Members noted the subjective nature of cost allocation methodologies used to determine profitability as other reasonable methods could also have been employed but yield different results. The Independent Board Members reviewed an analysis of the key drivers behind the changes in revenues and expenses that impacted profitability in 2014. The Independent Board Members recognized that Nuveen’s net revenue margin from advisory activities for 2014 was consistent with 2013. The Independent Board Members also considered the profitability of Nuveen in comparison to the adjusted operating margins of other investment advisers with publicly available data and with comparable assets under management (based on asset size and asset composition) to Nuveen. The Independent Board Members noted that Nuveen’s adjusted operating margins appeared to be reasonable in relation to such other advisers. The Independent Board Members, however, recognized the difficulty of making comparisons of profitability from fund investment advisory contracts as the information is not generally publicly available, the information for the investment advisers that was publicly available may not be representative of the industry and various other factors would impact the profitability data such as differences in services offered, business mix, expense methodology and allocations, capital structure and costs, complex size, and types of funds and other accounts managed.
The Independent Board Members noted this information supplemented the profitability information requested and received during the year and noted that two Independent Board Members served as point persons to review the profitability analysis and methodologies employed, and any changes thereto, and to keep the Board apprised of such changes during the year.
The Independent Board Members determined that Nuveen appeared to be sufficiently profitable to operate as a viable investment management firm and to honor its obligations as a sponsor of the Nuveen funds. The Independent Board Members noted the Adviser’s continued expenditures to upgrade its investment technology and increase personnel and recognized the Adviser’s continued commitment to its business to enhance the Adviser’s capacity and capabilities in providing the services necessary to meet the needs of the Nuveen funds as they grow or change over time. The Independent Board Members also noted that the sub-advisory fees for the Nuveen funds are paid by the Adviser, however, the Board recognized that many of the sub-advisers, including the Sub-Adviser, are affiliated with Nuveen. The Independent Board Members also noted the increased resources and support available to Nuveen as well as an improved capital structure as a result of the TIAA-CREF Transaction.
With respect to the Sub-Adviser, the Independent Board Members reviewed the Sub-Adviser’s revenues, expenses and revenue margins (pre- and post-tax) for its advisory activities for the calendar year ended December 31, 2014. The Independent Board Members also reviewed profitability analysis reflecting the revenues, expenses and the revenue margin (pre- and post-tax) by asset type for the Sub-Adviser for the calendar year ended December 31, 2014.
In evaluating the reasonableness of the compensation, the Independent Board Members also considered other amounts paid to a Fund Adviser by the Funds as well as indirect benefits (such as soft dollar arrangements), if any, the Fund Adviser and its affiliates received or were expected to receive that were directly attributable to the management of a Fund. See Section E below for additional information on indirect benefits a Fund Adviser may receive as a result of its relationship with the Funds.
Based on their review, the Independent Board Members determined that the Adviser’s and the Sub-Adviser’s level of profitability was reasonable in light of the respective services provided.
D. Economies of Scale and Whether Fee Levels Reflect These Economies of Scale
The Independent Board Members recognized that, as the assets of a particular fund or the Nuveen complex in the aggregate increase over time, economies of scale may be realized, and the Independent Board Members considered the extent to which the funds benefit from such economies of scale. Although the Independent Board Members recognized that economies of scale are difficult to measure, the Board recognized that one method to help ensure the shareholders share in these benefits is to include breakpoints in the management fee schedule reducing fee rates as asset levels grow. The Independent Board Members noted that, subject to certain exceptions, the management fees of the funds in the Nuveen complex are generally comprised of a fund-level component and complex-level component. Each component of the management fee for each Fund included breakpoints to reduce management fee rates of the Fund as the Fund grows and, as described below, as the Nuveen complex grows.
In addition to fund-specific breakpoint schedules which reduce the fee rates of a particular fund as its assets increase, the Independent Board Members recognized that the Adviser also passed on the benefits of economies of scale through the complex-wide fee arrangement which reduced management fee rates as assets in the fund complex reached certain levels. The complex-wide fee arrangement seeks to provide the benefits of economies of scale to fund shareholders when total fund complex assets increase, even if assets of a particular fund are unchanged or have decreased. The approach reflected the notion that some of Nuveen’s costs were attributable to services provided to all its funds in the complex, and therefore all funds benefit if these costs were spread over a larger asset base. The Independent Board Members reviewed the breakpoint and complex-wide schedules and the fee reductions achieved as a result of such structures for the 2014 calendar year.
The Independent Board Members also noted that additional economies of scale were shared with shareholders of the Funds through the adoption of temporary expense caps. The Independent Board Members further considered that as part of the TIAA-CREF Transaction, Nuveen agreed, for a period of two years from the date of the closing of the TIAA-CREF Transaction, not to increase contractual management fees for any Nuveen fund and, with respect to funds with expense caps, not to raise expense cap levels for such funds from levels in effect at that time or scheduled to go into effect prior to the closing of the TIAA-CREF Transaction. The commitment would not limit or otherwise affect mergers or liquidations of any funds in the ordinary course.
Based on their review, the Independent Board Members concluded that the current fee structure was acceptable and reflected economies of scale to be shared with shareholders when assets under management increase.
E. Indirect Benefits
The Independent Board Members received and considered information regarding potential “fall out” or ancillary benefits the respective Fund Adviser or its affiliates may receive as a result of its relationship with the Funds. In this regard, the Independent Board Members recognized that an affiliate of the Adviser served as the Funds’ principal underwriter and may receive compensation therefore from, among other things, sales charges, distribution fees and shareholder services fees (which included fees received pursuant to any 12b-1 plan). The Independent Board Members therefore took into account, among other things, the 12b-1 fees retained by Nuveen during the last calendar year.
In addition to the above, the Independent Board Members considered whether the Fund Adviser received any benefits from soft dollar arrangements whereby a portion of the commissions paid by a Fund for brokerage may be used to acquire research that may be useful to the Fund Adviser in managing the assets of the Fund and other clients. The Funds’ portfolio transactions are allocated by the Sub-Adviser. Accordingly, the Independent Board Members considered that the Sub-Adviser may benefit from research provided by broker-dealers executing portfolio transactions on behalf of the Funds. With respect to any fixed income securities, however, the Board recognized that such securities generally trade on a principal basis that does not generate soft dollar credits. Similarly, the Board recognized that any research received pursuant to soft dollar arrangements by the Sub-Adviser may also benefit the Funds and shareholders to the extent the research enhanced the ability of the Sub-Adviser to manage the Funds. The Independent Board Members noted that the Sub-Adviser’s profitability may be somewhat lower if it had to acquire any such research services directly.
Based on their review, the Independent Board Members concluded that any indirect benefits received by a Fund Adviser as a result of its relationship with the Funds were reasonable and within acceptable parameters.
F. Other Considerations
The Independent Board Members did not identify any single factor discussed previously as all-important or controlling. The Board Members, including the Independent Board Members, concluded that the terms of each Advisory Agreement were fair and reasonable, that the respective Fund Adviser’s fees were reasonable in light of the services provided to each Fund and that the Advisory Agreements be renewed.
Trustees
and Officers (Unaudited)
The management of the Funds, including general supervision of the duties performed for the Funds by the Adviser, is the responsibility of the Board of trustees of the Funds. The number of directors of the Funds is currently set at eleven. None of the trustees who are not “interested” persons of the Funds (referred to herein as “independent trustees”) has ever been a director or employee of, or consultant to, Nuveen or its affiliates. The names and business addresses of the trustees and officers of the Funds, their principal occupations and other affiliations during the past five years, the number of portfolios each oversees and other directorships they hold are set forth below.
The Funds’ Statement of Additional Information (“SAI”) includes more information about the trustees. To request a free copy, call Nuveen Investments at (800) 257-8787 or visit the Funds’ website at www.nuveen.com.
| | | | | | | | |
Name, Year of Birth & Address | | Position(s) Held with the Funds | | Year First Elected or Appointed (1) | | Principal Occupation(s) Including other Directorships During Past 5 Years | | Number of Portfolios in Fund Complex Overseen by Trustee |
| | | |
| Independent Trustee: | | | | |
William J. Schneider 1944 333 W. Wacker Drive Chicago, IL 60606 | | Chairman of the Board and Trustee | | 1996 | | Chairman of Miller-Valentine Partners, a real estate investment company; formerly, Senior Partner and Chief Operating Officer (retired 2004) of Miller-Valentine Group; owner in several other Miller-Valentine entities; Board Member of Med-America Health System, and WDPR Public Radio Station; formerly, member, Business Advisory Council, Cleveland Federal Reserve Bank and University of Dayton Business School Advisory Council. | | 195 |
Jack B. Evans 1948 333 W. Wacker Drive Chicago, IL 60606 | | Trustee | | 1999 | | President, The Hall-Perrine Foundation, a private philanthropic corporation (since 1996); Director and Chairman, United Fire Group, a publicly held company; formerly, President Pro-Tem of the Board of Regents for the State of Iowa University System; Director, Source Media Group; Life Trustee of Coe College; formerly, Director, Alliant Energy; formerly, Director, Federal Reserve Bank of Chicago; formerly, President and Chief Operating Officer, SCI Financial Group, Inc., a regional financial services firm. | | 195 |
William C. Hunter 1948 333 W. Wacker Drive Chicago, IL 60606 | | Trustee | | 2004 | | Dean Emeritus, formerly, Dean, Tippie College of Business, University of Iowa (2006-2012); Director (since 2004) of Xerox Corporation; Director (since 2005), and President (since 2012) Beta Gamma Sigma, Inc., The International Business Honor Society; Director of Wellmark, Inc. (since 2009); formerly, Dean and Distinguished Professor of Finance, School of Business at the University of Connecticut (2003-2006); previously, Senior Vice President and Director of Research at the Federal Reserve Bank of Chicago (1995-2003); formerly, Director (1997-2007), Credit Research Center at Georgetown University. | | 195 |
David J. Kundert 1942 333 W. Wacker Drive Chicago, IL 60606 | | Trustee | | 2005 | | Formerly, Director, Northwestern Mutual Wealth Management Company (2006-2013); retired (since 2004) as Chairman, JPMorgan Fleming Asset Management, President and CEO, Banc One Investment Advisors Corporation, and President, One Group Mutual Funds; prior thereto, Executive Vice President, Banc One Corporation and Chairman and CEO, Banc One Investment Management Group; Regent Emeritus, Member of Investment Committee, Luther College; member of the Wisconsin Bar Association; member of Board of Directors and Chair of Investment Committee, Greater Milwaukee Foundation; member of the Board of Directors (Milwaukee), College Possible. | | 195 |
| | | | | | | | |
Name, Year of Birth & Address | | Position(s) Held with the Funds | | Year First Elected or Appointed (1) | | Principal Occupation(s) Including other Directorships During Past 5 Years | | Number of Portfolios in Fund Complex Overseen by Trustee |
John K. Nelson 1962 333 West Wacker Drive Chicago, IL 60606 | | Trustee | | 2013 | | Member of Board of Directors of Core12 LLC (since 2008), a private firm which develops branding, marketing and communications strategies for clients; Director of The Curran Center for Catholic American Studies (since 2009) and The President’s Council, Fordham University (since 2010); formerly senior external advisor to the financial services practice of Deloitte Consulting LLP (2012-2014); formerly, Chairman of the Board of Trustees of Marian University (2010 as trustee, 2011-2014 as Chairman); formerly, Chief Executive Officer of ABN AMRO N.V. North America, and Global Head of its Financial Markets Division (2007-2008); prior senior positions held at ABN AMRO include Corporate Executive Vice President and Head of Global Markets—the Americas (2006-2007), CEO of Wholesale Banking—North America and Global Head of Foreign Exchange and Futures Markets (2001-2006), and Regional Commercial Treasurer and Senior Vice President Trading—North America (1996-2001); formerly, Trustee at St. Edmund Preparatory School in New York City. | | 195 |
Judith M. Stockdale 1947 333 W. Wacker Drive Chicago, IL 60606 | | Trustee | | 1997 | | Board Member, Land Trust Alliance (since 2013) and U.S. Endowment for Forestry and Communities (since 2013); formerly, Executive Director (1994-2012), Gaylord and Dorothy Donnelley Foundation; prior thereto, Executive Director, Great Lakes Protection Fund (1990-1994). | | 195 |
Carole E. Stone 1947 333 W. Wacker Drive Chicago, IL 60606 | | Trustee | | 2007 | | Director, Chicago Board Options Exchange (since 2006), C2 Options Exchange, Incorporated (since 2009) Director, CBOE Holdings, Inc. (since 2010); formerly, Commissioner, New York State Commission on Public Authority Reform (2005-2010). | | 195 |
Virginia L. Stringer 1944 333 W. Wacker Drive Chicago, IL 60606 | | Trustee | | 2011 | | Board Member, Mutual Fund Directors Forum; non-profit board member; former governance consultant; former Owner and President, Strategic Management Resources, Inc., a management consulting firm; former Member, Governing Board, Investment Company Institute’s Independent Directors Council; previously, held several executive positions in general management, marketing and human resources at IBM and The Pillsbury Company; Independent Director, First American Fund Complex (1987-2010) and Chair (1997-2010). | | 195 |
Terence J. Toth 1959 333 W. Wacker Drive Chicago, IL 60606 | | Trustee | | 2008 | | Managing Partner, Promus Capital (since 2008); Director, Fulcrum IT Service LLC (since 2010), Quality Control Corporation (since 2012) and LogicMark LLC (since 2012); formerly, Director, Legal & General Investment Management America, Inc. (2008-2013); formerly, CEO and President, Northern Trust Global Investments (2004-2007); Executive Vice President, Quantitative Management & Securities Lending (2000-2004); prior thereto, various positions with Northern Trust Company (since 1994); member: Chicago Fellowship Board (since 2005), Catalyst Schools of Chicago Board (since 2008) and Mather Foundation Board (since 2012), and a member of its investment committee; formerly, Member, Northern Trust Mutual Funds Board (2005-2007), Northern Trust Global Investments Board (2004-2007), Northern Trust Japan Board (2004-2007), Northern Trust Securities Inc. Board (2003-2007) and Northern Trust Hong Kong Board (1997-2004). | | 195 |
Trustees and Officers (Unaudited) (continued)
| | | | | | | | |
Name, Year of Birth & Address | | Position(s) Held with the Funds | | Year First Elected or Appointed (1) | | Principal Occupation(s) Including other Directorships During Past 5 Years | | Number of Portfolios in Fund Complex Overseen by Trustee |
| | | |
| Interested Trustee: | | | | |
William Adams IV(2) 1955 333 W. Wacker Drive Chicago, IL 60606 | | Trustee | | 2013 | | Senior Executive Vice President, Global Structured Products (since 2010); Co-President of Nuveen Fund Advisors, LLC (since 2011); Executive Vice President of Nuveen Securities, LLC; President (since 2011), formerly, Managing Director (2010-2011) of Nuveen Commodities Asset Management, LLC; Board Member of the Chicago Symphony Orchestra and of Gilda’s Club Chicago; formerly, Executive Vice President, U.S. Structured Products, of Nuveen Investments, Inc. (1999-2010). | | 195 |
Thomas S. Schreier, Jr.(2) 1962 333 W. Wacker Drive Chicago, IL 60606 | | Trustee | | 2013 | | Vice Chairman, Wealth Management of Nuveen Investments, Inc. (since 2011); Co-President of Nuveen Fund Advisors, LLC; Chairman of Nuveen Asset Management, LLC (since 2011); Co-Chief Executive Officer of Nuveen Securities, LLC (since 2011); Member of Board of Governors and Chairman’s Council of the Investment Company Institute; Director of Allina Health and a Member of its Finance, Audit and Investment Committees, formerly, Chief Executive Officer (2000-2010) and Chief Investment Officer (2007-2010) of FAF Advisors, Inc.; formerly, President of First American Funds (2001-2010). | | 195 |
| | | | | | | | |
Name,
Year of Birth & Address | | Position(s) Held with the Funds | | Year First Elected or Appointed (3) | | Principal Occupation(s) During Past 5 Years | | Number of Portfolios in Fund Complex Overseen by
Officer |
| | | |
| Officers of the Funds: | | | | |
Gifford R. Zimmerman 1956 333 W. Wacker Drive Chicago, IL 60606 | | Chief Administrative Officer | | 1988 | | Managing Director (since 2002), and Assistant Secretary of Nuveen Securities, LLC; Managing Director (since 2004) and Assistant Secretary (since 1994) of Nuveen Investments, Inc.; Managing Director (since 2002), Assistant Secretary (since 1997) and Co-General Counsel (since 2011) of Nuveen Fund Advisors, LLC; Managing Director, Assistant Secretary and Associate General Counsel of Nuveen Asset Management, LLC (since 2011); Managing Director and Assistant Secretary of Symphony Asset Management LLC (since 2003); Vice President and Assistant Secretary of NWQ Investment Management Company, LLC (since 2002), Nuveen Investments Advisers Inc. (since 2002), Santa Barbara Asset Management, LLC (since 2006) and of Winslow Capital Management, LLC, (since 2010); Vice President and Assistant Secretary (since 2013), formerly, Chief Administrative Officer and Chief Compliance Officer (2006-2013) of Nuveen Commodities Asset Management, LLC; Chartered Financial Analyst. | | 196 |
Margo L. Cook 1964 333 W. Wacker Drive Chicago, IL 60606 | | Vice President | | 2009 | | Senior Executive Vice President of Nuveen Investments, Inc.; Executive Vice President, Investment Services of Nuveen Fund Advisors, LLC (since 2011); Managing Director – Investment Services of Nuveen Commodities Asset Management, LLC (since 2011); Co-Chief Executive Officer (since 2015); previously, Executive Vice President (2013-2015) of Nuveen Securities, LLC; Chartered Financial Analyst. | | 196 |
Lorna C. Ferguson 1945 333 W. Wacker Drive Chicago, IL 60606 | | Vice President | | 1998 | | Managing Director (since 2005) of Nuveen Fund Advisors, LLC and Nuveen Securities, LLC (since 2004). | | 196 |
| | | | | | | | |
Name,
Year of Birth & Address | | Position(s) Held with the Funds | | Year First Elected or Appointed (3) | | Principal Occupation(s) During Past 5 Years | | Number of Portfolios in Fund Complex Overseen by
Officer |
Stephen D. Foy 1954 333 W. Wacker Drive Chicago, IL 60606 | | Vice President and Controller | | 1998 | | Managing Director (since 2014), formerly, Senior Vice President (2013-2014) and Vice President (2005-2013) of Nuveen Fund Advisors, LLC; Chief Financial Officer of Nuveen Commodities Asset Management, LLC (since 2010); Certified Public Accountant. | | 196 |
Sherri A. Hlavacek 1962 333 W. Wacker Drive Chicago, IL 60606 | | Vice President and Treasurer | | 2015 | | Executive Vice President (since May 2015, formerly, Managing Director) and Controller of Nuveen Fund Advisors, LLC; Managing Director and Controller of Nuveen Commodities Asset Management, LLC; Executive Vice President (since May 2015, formerly, Managing Director), Treasurer and Controller of Nuveen Asset Management, LLC; Executive Vice President, Principal Financial Officer (since July 2015, formerly, Managing Director), Treasurer and Corporate Controller of Nuveen Investments, Inc.; Executive Vice President (since May 2015, formerly, Managing Director), Treasurer and Corporate Controller of Nuveen Investments Advisers Inc. and Nuveen Investments Holdings, Inc.; Managing Director, Chief Financial Officer and Corporate Controller of Nuveen Securities, LLC; Vice President, Controller and Treasurer of NWQ Investment Management Company, LLC; Vice President and Controller of Santa Barbara Asset Management, LLC, Tradewinds Global Investors, LLC, Symphony Asset Management LLC and Winslow Capital Management, LLC; Certified Public Accountant. | | 196 |
Walter M. Kelly 1970 333 W. Wacker Drive Chicago, IL 60606 | | Chief Compliance Officer and Vice President | | 2003 | | Senior Vice President (since 2008) of Nuveen Investments Holdings, Inc. | | 196 |
Tina M. Lazar 1961 333 W. Wacker Drive Chicago, IL 60606 | | Vice President | | 2002 | | Senior Vice President of Nuveen Investments Holdings, Inc. and Nuveen Securities, LLC | | 196 |
Kevin J. McCarthy 1966 333 W. Wacker Drive Chicago, IL 60606 | | Vice President and Secretary | | 2007 | | Managing Director and Assistant Secretary (since 2008), Nuveen Securities, LLC; Managing Director (since 2008), Assistant Secretary (since 2007) and Co-General Counsel (since 2011) of Nuveen Fund Advisors, LLC; Managing Director, Assistant Secretary and Associate General Counsel (since 2011) of Nuveen Asset Management, LLC; Managing Director and Assistant Secretary, Nuveen Investments, Inc.; Vice President (since 2007) and Assistant Secretary of Nuveen Investments Advisers Inc., NWQ Investment Management Company, LLC, Tradewinds Global Investors LLC, Symphony Asset Management LLC, Santa Barbara Asset Management, LLC, and of Winslow Capital Management, LLC. (since 2010); Vice President and Secretary (since 2010) of Nuveen Commodities Asset Management, LLC. | | 196 |
Kathleen L. Prudhomme 1953 901 Marquette Avenue Minneapolis, MN 55402 | | Vice President and Assistant Secretary | | 2011 | | Managing Director, Assistant Secretary and Co-General Counsel (since 2011) of Nuveen Fund Advisors, LLC; Managing Director, Assistant Secretary and Associate General Counsel (since 2011) of Nuveen Asset Management, LLC; Managing Director and Assistant Secretary (since 2011) of Nuveen Securities, LLC; formerly, Deputy General Counsel, FAF Advisors, Inc. (2004-2010). | | 196 |
Joel T. Slager 1978 333 West Wacker Drive Chicago, IL 60606 | | Vice President and Assistant Secretary | | 2013 | | Fund Tax Director for Nuveen Funds (since 2013); previously, Vice President of Morgan Stanley Investment Management, Inc., Assistant Treasurer of the Morgan Stanley Funds (from 2010 to 2013). | | 196 |
Trustees and Officers (Unaudited) (continued)
| | | | | | | | |
Name,
Year of Birth & Address | | Position(s) Held with the Funds | | Year First Elected or Appointed (3) | | Principal Occupation(s) During Past 5 Years | | Number of Portfolios in Fund Complex Overseen by
Officer |
Jeffery M. Wilson 1956 333 West Wacker Drive Chicago, IL 60606 | | Vice President | | 2011 | | Senior Vice President of Nuveen Securities, LLC (since 2011); formerly, Senior Vice President of FAF Advisors, Inc. (2000-2010). | | 108 |
| (1) | Trustees serve an indefinite term until his/her successor is elected or appointed. Ms. Stringer will retire from the Board as of December 31, 2015. The year first elected or appointed represents the year in which the trustee was first elected or appointed to any fund in the Nuveen Fund Complex. |
| (2) | “Interested persons” of the Trust, as defined in the 1940 Act, by reason of their positions with Nuveen and certain of its subsidiaries. |
| (3) | Officers serve one year terms through August of each year. The year first elected or appointed represents the year in which the officer was first elected or appointed to any fund in the Nuveen Fund Complex. |
Notes
| | | | | | | | | | | | | | |
| | | | | | | | |
| | | | |
| | | | | | | | |
| | | | | |
| | Nuveen Investments: | | | | | | | | |
| | | | Serving Investors for Generations | | |
| | |
| | | | |
| | | |
| | | | Since 1898, financial advisors and their clients have relied on Nuveen Investments to provide dependable investment solutions through continued adherence to proven, long-term investing principles. Today, we offer a range of high quality equity and fixed-income solutions designed to be integral components of a well-diversified core portfolio. | | |
| | | |
| | | | | | |
| | | | |
| | | | | | Focused on meeting investor needs. Nuveen Investments provides high-quality investment services designed to help secure the longterm goals of institutional and individual investors as well as the consultants and financial advisors who serve them. Nuveen Investments markets a wide range of specialized investment solutions which provide investors access to capabilities of its high-quality boutique investment affiliates-Nuveen Asset Management, Symphony Asset Management, NWQ Investment Management Company, Santa Barbara Asset Management, Tradewinds Global Investors, Winslow Capital Management, and Gresham Investment Management. In total, Nuveen Investments managed more than $220 billion as of September 30, 2015. | | |
| | | | | |
| | | | | | | | | | |
| | | | | | Find out how we can help you. To learn more about how the products and services of Nuveen Investments may be able to help you meet your financial goals, talk to your financial advisor, or call us at (800) 257-8787. Please read the information provided carefully before you invest. Investors should consider the investment objective and policies, risk considerations, charges and expenses of any investment carefully. Where applicable, be sure to obtain a prospectus, which contains this and other relevant information. To obtain a prospectus, please contact your securities representative or Nuveen Investments, 333 W. Wacker Dr., Chicago, IL 60606. Please read the prospectus carefully before you invest or send money. Learn more about Nuveen Funds at: www.nuveen.com/mf | | |
| | | | | | |
| | | | | | | | | | | | |
| | Distributed by Nuveen Securities, LLC | 333 West Wacker Drive Chicago, IL 60606 | www.nuveen.com | | | | | | |
MAN-INTELR-0815P 11042-INV-Y-10/16
| | |
| | |  |
| Mutual Funds | |
| | | | | | |
| | | | | | | Annual Report August 31, 2015 |
| | | | | | | | | | | | | | |
| | | | | | | Share Class / Ticker Symbol | | |
| | | Fund Name | | | | Class A | | Class C | | Class R3 | | Class I | | |
|
| | Nuveen Concentrated Core Fund | | | | NCADX | | NCAEX | | — | | NCAFX | | |
| | Nuveen Core Dividend Fund | | | | NCDAX | | NCCDX | | — | | NCDIX | | |
| | Nuveen Equity Long/Short Fund | | | | NELAX | | NELCX | | — | | NELIX | | |
| | Nuveen Equity Market Neutral Fund | | | | NMAEX | | NMECX | | — | | NIMEX | | |
| | Nuveen Growth Fund | | | | NSAGX | | NSRCX | | NBGRX | | NSRGX | | |
| | Nuveen Large Cap Core Fund | | | | NLACX | | NLCDX | | — | | NLCIX | | |
| | Nuveen Large Cap Core Plus Fund | | | | NLAPX | | NLPCX | | — | | NLPIX | | |
| | Nuveen Large Cap Growth Fund | | | | NLAGX | | NLCGX | | — | | NLIGX | | |
| | Nuveen Large Cap Value Fund | | | | NNGAX | | NNGCX | | NMMTX | | NNGRX | | |
| | | | | | | | | | | | |
| | | | | | |
| | | | |
| | | | | | | | |
| | |
| | Life is Complex. | | |
| | |
| | Nuveen makes things e-simple. | | |
| | |
| | It only takes a minute to sign up for e-Reports. Once enrolled, you’ll receive
an e-mail as soon as your Nuveen Fund information is ready. No more
waiting for delivery by regular mail. Just click on the link within the e-mail to
see the report and save it on your computer if you wish. | | |
| | | | |
| | | | | | Free e-Reports right to your e-mail! | | |
| | | |
| | | | | | www.investordelivery.com If you receive your Nuveen Fund distributions and statements from your
financial advisor or brokerage account. |
| | | | |
| | | | or | | www.nuveen.com/accountaccess If you receive your Nuveen Fund distributions and statements directly from Nuveen. Must be preceded by or accompanied by a prospectus. NOT FDIC INSURED MAY LOSE VALUE
NO BANK GUARANTEE | | |
| | | | | | | | | | |
| | | | | | | | | | | | | |

Table
of Contents
Chairman’s Letter
to Shareholders

Dear Shareholders,
For better or for worse, the financial markets have spent the past year waiting for the U.S. Federal Reserve (Fed) to end its accommodative monetary policy. The policy has propped up stock and bond markets since the Great Recession, but the question remains: how will markets behave without its influence? This uncertainty has been a considerable source of volatility for stock and bond prices lately, despite the Fed carefully conveying its intention to raise rates slowly and only when the economy shows evidence of readiness.
There may be at least one rate hike before the end of 2015. After all, the U.S. has reached “full employment” by the Fed’s standards and growth has resumed – albeit unevenly. But the picture remains somewhat uncertain. Inflation has remained stubbornly low, most recently weighed down by an unexpectedly sharp decline in commodity prices since mid-2014. With the Fed poised to tighten and foreign central banks easing, the U.S. dollar has surged against other currencies, which has weighed on corporate earnings and further contributed to commodity price weakness. U.S. consumers have benefited from an improved labor market and lower prices at the gas pump, but the overall pace of economic expansion has been lackluster.
Nevertheless, the global recovery continues to be led by the United States. Policy makers around the world are deploying their available tools to try to bolster Europe and Japan’s fragile growth, and manage China’s slowdown. Contagion fears ebb and flow with the headlines about Greece and China. Greece reluctantly agreed to a third bailout package from the European Union in July and China’s central bank and government intervened aggressively to try to stem the sell-off in stock prices. But persistent structural problems in these economies will continue to garner market attention.
Wall Street is fond of saying “markets don’t like uncertainty,” and asset prices are likely to continue to churn in the current macro environment. In times like these, you can look to a professional investment manager with the experience and discipline to maintain the proper perspective on short-term events. And if the daily headlines do concern you, I encourage you to reach out to your financial advisor. Your financial advisor can help you evaluate your investment strategies in light of current events, your time horizon and risk tolerance. On behalf of the other members of the Nuveen Fund Board, we look forward to continuing to earn your trust in the months and years ahead.
Sincerely,

William J. Schneider
Chairman of the Board
October 26, 2015
Portfolio Managers’
Comments
Nuveen Concentrated Core Fund
Nuveen Core Dividend Fund
Nuveen Equity Long/Short Fund
Nuveen Equity Market Neutral Fund
Nuveen Growth Fund
Nuveen Large Cap Core Fund
Nuveen Large Cap Core Plus Fund
Nuveen Large Cap Growth Fund
Nuveen Large Cap Value Fund
These Funds are part of the Nuveen Large Cap Equity Series and feature portfolio management by Nuveen Asset Management, LLC, an affiliate of Nuveen Investments, Inc. Robert C. Doll, CFA, a senior portfolio manager and chief equity strategist at Nuveen Asset Management, is portfolio manager for all of the Funds. For the Nuveen Equity Long/Short Fund, Anthony R. Burger, CFA, and Scott M. Tonneson, CFA, serve as portfolio managers along with Mr. Doll. Mr. Burger is the director of quantitative equity research and a portfolio manager and Mr. Tonneson is a co-portfolio manager and the lead fundamental research analyst for the Nuveen Large Cap Equity Series.
On the following pages, the management team discusses economic and equity market conditions, key investment strategies and the Funds’ performance for the twelve-month reporting period ended August 31, 2015.
What factors affected the U.S. economy and markets during the twelve-month reporting period ended August 31, 2015?
During this reporting period, the U.S. economy continued to expand at a moderate pace. The Federal Reserve (Fed) maintained efforts to bolster growth and promote progress toward its mandates of maximum employment and price stability by holding the benchmark fed funds rate at the record low level of zero to 0.25% that it established in December 2008. At its October 2014 meeting, the Fed announced that it would end its bond-buying stimulus program as of November 1, 2014, after tapering its monthly asset purchases of mortgage-backed and longer-term Treasury securities from the original $85 billion per month to $15 billion per month over the course of seven consecutive meetings (December 2013 through September 2014). In making the announcement, the Fed cited substantial improvement in the labor market as well as sufficient underlying strength in the broader economy to support ongoing progress toward maximum employment in a context of price stability. The Fed also reiterated that it would continue to look at a wide range of factors, including labor market conditions, indicators of inflationary pressures and readings on financial developments, in determining future actions. Additionally, the Fed stated that it would likely maintain the current target range for the fed funds rate for a considerable time, especially if projected inflation continued to run below the Fed’s 2% longer run goal. However, if economic data shows faster progress, the Fed indicated that it could raise the fed funds rate sooner than expected.
The Fed changed its language slightly in December, indicating it would be “patient” in normalizing monetary policy. This shift helped ease investors’ worries that the Fed might raise rates too soon. However, as employment data released early in 2015 continued to look strong, anticipation began building that the Fed could raise its main policy rate as soon as June. As widely expected, after its March meeting, the Fed eliminated “patient” from its statement, but also highlighted the policymakers’ less optimistic view of the economy’s overall health as well as downgraded their inflation projections. The Fed’s April meeting seemed to further signal
Certain statements in this report are forward-looking statements. Discussions of specific investments are for illustration only and are not intended as recommendations of individual investments. The forward-looking statements and other views expressed herein are those of the portfolio managers as of the date of this report. Actual future results or occurrences may differ significantly from those anticipated in any forward-looking statements and the views expressed herein are subject to change at any time, due to numerous market and other factors. The Funds disclaim any obligation to update publicly or revise any forward-looking statements or views expressed herein.
Refer to the Glossary of Terms Used in this Report for further definition of the terms used within this section.
Portfolio Managers’ Comments (continued)
that a June rate hike was off the table. While the Fed attributed the first quarter’s economic weakness to temporary factors, the meeting minutes from April revealed that many Committee members believed the economic data available in June would be insufficient to meet the Fed’s criteria for initiating a rate increase. The June meeting bore out that presumption and the Fed decided to keep the target rate near zero. But the Committee also continued to telegraph the likelihood of at least one rate increase in 2015, which many analysts forecasted for September. During the September 2015 meeting (subsequent to the close of this reporting period), the Fed decided to keep the federal funds rate near zero despite broad speculation that it would increase rates. The Committee said it will keep the rate near zero until the economy has seen further improvement toward reaching the Fed’s goals of maximum employment and inflation approaching 2%. This assessment will take into account a wide range of information, including measures of labor market conditions, indicators of inflation pressures and inflation expectations, and readings on financial and international developments.
The U.S. economy proved to be fairly resilient compared to other economies around the globe, boosted by an improving job market, declining gas prices and low mortgage rates. According to the government’s revised estimate, the U.S. economy increased at a 3.9% annualized rate in the second quarter of 2015, as measured by GDP, compared with a decrease of 0.6% in the first quarter of 2015 and increases of 5.0% in the third quarter 2014 and 2.2% in the fourth quarter 2014. The increase in real GDP in the second quarter reflected positive contributions from personal consumption expenditures, exports, state and local government spending and residential fixed investment that were partly offset by negative contributions from federal government spending, private inventory investment and nonresidential fixed investment. The Consumer Price Index (CPI) rose 0.2% year-over-year as of August 2015. The core CPI (which excludes food and energy) increased 1.8% during the same period, below the Fed’s unofficial longer term inflation objective of 2.0%. As of August 2015, the U.S. unemployment rate was 5.1%, a figure that is also considered “full employment” by some Fed officials. The housing market continued to post consistent gains as of its most recent reading for July 2015. The average home price in the S&P/Case-Shiller Index of 20 major metropolitan areas rose 5.0% for the twelve months ended July 2015 (most recent data available at the time this report was prepared).
Meanwhile, a number of issues weighed on economies across the globe including geopolitical turmoil, weak growth overseas and sharply falling oil prices, which were caused by the faltering global economy and the Organization of the Petroleum Exporting Countries (OPEC’s) refusal to cede market share. Falling oil prices propelled significant appreciation in the U.S. dollar, which hit a multi-year high versus a basket of other major currencies, supported by the confident Fed and weaker data coming out of Europe, Japan and China. In an effort to improve their economic growth, countries across the globe maintained extraordinarily accommodative monetary policies. The European Central Bank (ECB) launched a massive quantitative easing program via a government bond-buying program that pumped more than 1 trillion euros into the weak eurozone economy, while other central banks around the world enacted more than 30 policy easing actions during the first few months of 2015.
Later in the reporting period, political drama dominated the news including the escalating tensions over Greece’s debt issues and aggressive policy intervention by the Chinese government to deflate the country’s stock market bubble. Greece took front and center in world market headlines with defaults on its payments to the International Monetary Fund and threats of a potential exit from the European Monetary Union (EMU). By mid-July, Greece had agreed to austerity measures in return for more bailout funds. Meanwhile, after skyrocketing for nearly a year, China’s stock market suddenly shifted gears in June and embarked on a massive sell-off that quickly spilled over to the rest of the world. Investors pulled money out of Chinese stocks despite efforts by the country’s central bank to prop up the market by cutting interest rates to a record low. A number of factors helped fuel the sell-off, including weak Chinese economic data and falling commodity prices. By August 2015, oil prices had fallen to their lowest levels of the reporting period with prices for West Texas Intermediate (WTI) crude dipping below the $40/barrel level for a short time.
With this backdrop, global volatility spiked across all asset classes during the reporting period. Oil and gas shares, other energy-related stocks and petrocurrencies were hit hard around the world due to dramatically falling commodity prices. The U.S. stock market sold off in October 2014, then surged back before experiencing a 10% correction in August 2015, its first in four years. Earlier in the reporting period, news of the widespread monetary policy moves at the beginning of 2015 were well received; however, toward the end of the reporting period, renewed fears over China and uncertainty about the Fed’s next move hit global markets, spurring the massive global sell-off. At the end of the reporting period, the S&P 500® Index barely posted a positive return, ending the twelve-month reporting period up only 0.48%. International markets were much weaker and ended the reporting period with returns significantly in the red. The MSCI EAFE Index experienced a steep decline in August 2015 and ended with a -7.08% return for the twelve-month reporting period. Emerging market stocks experienced even greater headwinds from the strong U.S. dollar, weak
Chinese data and Fed uncertainty, significantly underperforming developed market peers. As measured by the MSCI Emerging Markets Index, this segment ended the reporting period with a -22.67% return.
How did the Funds perform during the twelve-month reporting period ended August 31, 2015?
The tables in the Fund Performance and Expense Ratios section of this report provide total return performance information for the Funds for the one-year, five-year, ten-year and/or since inception periods ended August 31, 2015. Each Funds’ Class A Share total returns at net asset value (NAV) are compared with the performance of their corresponding market index and Lipper classification average. A more detailed account of each Fund’s performance is provided later in this report.
What strategies were used to manage the Funds during the twelve-month reporting period ended August 31, 2015 and how did these strategies influence performance?
Nuveen Concentrated Core Fund
The Fund’s Class A Shares at NAV underperformed the Russell 1000® Index and outperformed the comparative Lipper classification average during the twelve-month reporting period ended August 31, 2015.
The Nuveen Concentrated Core Fund seeks long-term capital appreciation by investing in a highly concentrated portfolio of approximately 20 stocks of well-run companies that the investment team believes are attractive. The team selects securities using the same disciplined approach used with all of the Funds in the Large Cap Equity Series, which balances fundamental analysis with quantitative techniques. We start with the securities found in the Russell 1000® Index, which are primarily large-cap companies, and use a multifactor quantitative ranking process to identify potential holdings. We then apply a fundamental overlay from Nuveen Asset Management’s team of sector-specific analysts, using our unique industry perspectives to select holdings. Our goal is to invest primarily in companies that exhibit improving business fundamentals, strong management, identifiable catalysts and attractive valuations. We believe that buying such companies at reasonable prices can provide above-market returns over time.
The Fund outpaced its Lipper benchmark during the twelve-month reporting period, however, underperformed the Russell 1000® Index. On the positive side, the Fund particularly benefited from stock selection and a significant overweight in health care, the strongest performing sector in the index, which advanced more than 13% during the reporting period. A substantial underweight position in the energy sector and an overweight in consumer discretionary also proved beneficial. Energy was the worst performing sector in the Russell 1000® Index by a wide margin during the reporting period, falling more than 31%. At the same time, consumer discretionary was one of the strongest areas in the index, with the sector advancing more than 9% in the context of a virtually flat benchmark return. Finally, the Fund’s preference for higher momentum stocks (those that have recently performed well) also helped its return as these stocks tended to outperform during the reporting period.
As noted, the health care sector performed strongly during the reporting period due to merger and acquisition (M&A) activity aimed at cutting costs and expanding profits. The Fund’s top three performers were a trio of health insurers that each took part in this M&A activity and saw their shares hit all-time highs during the reporting period. In addition to industry consolidation, health insurance companies also benefited from the surge of new business from previously uninsured people brought into the market by the Affordable Care Act (ACA). The Fund’s top performer was Aetna Inc., which was approached by another Fund holding, UnitedHealth Group Incorporated, about a takeover deal midway through the reporting period. Aetna rejected the offer and subsequently announced plans to buy Humana Inc. for $37 billion in July. Our position in UnitedHealth Group, the largest of the U.S. health insurers, also contributed to outperformance. The company continued to post strong earnings growth and offered upbeat guidance for further acceleration due to additional revenue from its $12.8 billion acquisition of Catamaran Corp., a pharmacy benefit manager and prescription provider. UnitedHealth shares also benefited from the company’s contained cost trends, favorable medical loss ratios and increased strength in its OptumHealth division in the retail space. Finally, Anthem Inc. turned in strong results for the Fund. The company continued to perform well with solid growth from its commercial offerings, recording favorable medical loss ratios and earnings growth. As the industry sees more entrants due to the ACA, Anthem is leading the way with innovative consumer offerings that have helped it add hundreds of thousands of new members through government-run exchanges. We no longer hold a position in Anthem, Inc.
Several areas detracted from the Fund’s performance versus the Russell benchmark including stock selection within the consumer discretionary, information technology, telecommunications services and consumer staples sectors. The most significant laggard was a position in telecommunications provider CenturyLink Inc. Its shares underperformed as the company reported weaker-than-expected
Portfolio Managers’ Comments (continued)
data hosting revenue, while management offered cautious guidance related to higher employee expenses and a lack of revenue growth. Also, shares of hardware and services giant Hewlett-Packard Company were under pressure throughout the second half of the reporting period as the company continued to struggle with the technology shift toward mobile and cloud computing. After reporting strong results earlier in the reporting period, Hewlett-Packard posted a 13% decline in earnings in July. The company has suffered from falling personal computer (PC) sales, which are down nearly 10% year-over-year, particularly in emerging market countries. Hewlett-Packard shares were also weighed down by details surrounding the significant costs involved in the company’s massive restructuring to separate its printing and PC divisions from its hardware and services areas into two entities. In addition, shares of U.S. car manufacturer Ford Motor Company lagged during the reporting period. While Ford Motor reported strong North American results and improving prospects in both Europe and China, investors were skeptical that vehicle sales may be near their peak.
Nuveen Core Dividend Fund
The Fund’s Class A Shares at NAV underperformed the Russell 1000® Index and outperformed the comparative Lipper classification average during the twelve-month reporting period ended August 31, 2015.
The Nuveen Core Dividend Fund seeks to provide total return from dividend income and long-term capital appreciation by investing primarily in dividend-paying equity securities. The investment team selects securities using the same disciplined approach used with all of the Funds in the Large Cap Equity Series, which balances fundamental analysis with quantitative techniques. We start with the securities found in the Russell 1000® Index, which are primarily large-cap companies, and use a multi-factor quantitative ranking process to identify potential holdings. We then apply a fundamental overlay from Nuveen Asset Management’s team of sector-specific analysts, using our unique industry perspectives to select holdings. Our goal is to invest primarily in companies that pay dividends, have the potential to increase their dividends, and that exhibit improving business fundamentals, strong management, identifiable catalysts and attractive valuations. We believe that buying such companies at reasonable prices can provide above-market returns over time.
The Fund outpaced its Lipper benchmark during the twelve-month reporting period, however, underperformed the Russell 1000® Index. On the positive side, the Fund benefited from an underweight position in the energy sector and an overweight in consumer discretionary. Energy was the worst performing sector in the Russell 1000® Index by a wide margin during the reporting period, down more than 31%. At the same time, consumer discretionary was one of the strongest areas in the index with the sector advancing more than 9% in the context of a virtually flat benchmark return. Stock selection was also successful in health care and consumer staples. In addition, the Fund’s preference for smaller-cap stocks within the index boosted returns as the market favored these stocks.
In terms of individual contributors, the Fund benefited from not owning a position in Chevron Corp., the largest oilfield services company in the United States and a company that has a fairly significant weight in the index. The company and its subsidiaries, which are involved in a vast array of energy-related industries including oil, natural gas, geothermal energy, chemicals, mining, power and energy services, continued to be negatively impacted by the falling price of oil throughout the reporting period. Chevron’s stock hit a 52-week low toward the end of the reporting period as West Texas Intermediate (WTI) prices dipped below the $40 per barrel mark. With the price of oil so low, the company’s overall earnings have been hit hard in its most recent quarter. In terms of stocks held in the portfolio, the Fund benefited from its position in Cablevision Systems Corporation, a cable television provider serving the New York region. Shares of the company advanced strongly during the reporting period, hitting 52-week highs several times from late May to early August. Cablevision has executed well on its initiatives to offer more flexible bundling options, generate greater revenue per customer and develop new content relationships such as HBO Now. The company also benefited from increased speculation of further consolidation within the cable industry after an industry peer reaffirmed its decision to acquire a competitor, while the CEO of European cable company Altice Group mentioned Cablevision as a potential takeover target. After the reporting period ended, Altice formally announced the takeover, which will create the fourth-largest cable operator in the U.S. market. Also, the health care sector performed strongly during the reporting period due to a flurry of merger and acquisition activity aimed at cutting costs and expanding profits. In addition to industry consolidation, health insurance companies benefited from the surge of new business from previously uninsured people brought into the market by the Affordable Care Act. One of the Fund’s top performers was health insurer Aetna Inc., which saw its shares hit all-time highs during the reporting period. Aetna was approached by another Fund holding, UnitedHealth Group Incorporated, about a takeover deal midway through the period. After rejecting the offer, the company subsequently announced plans to buy Humana Inc. for $37 billion in July.
Several areas detracted from the Fund’s performance versus the Russell benchmark including stock selection within the financial, telecommunications services, industrial and information technology sectors. Our emphases on stocks with more volatility and higher dividend yields also hurt returns as investors favored more stable and defensive names and rotated away from higher-dividend payers. In addition, an underweight in higher momentum stocks (those that have recently performed well) detracted because these stocks tended to outperform during the reporting period.
The Fund’s most significant laggard was regional broadband and communications provider Windstream Holdings Inc. The company spun off select telecommunications network assets into a separate, publicly-traded real estate investment trust (REIT) in late April, along with undertaking a one-for-six reverse stock split of Windstream shares. In May, the company reported mixed first-quarter results with improving earnings, but revenues fell short of analysts’ estimates. After the REIT spin-off, Windstream was no longer included in the S&P 500® Index and its shares stayed in a slump for the remainder of the reporting period. A position in Lexmark International, Inc., a supplier of laser printers and enterprise software, also detracted during the reporting period. The company’s shares were down fairly significantly in July after reporting disappointing revenue and margin results for the second quarter. Management also guided investors to expect near-term struggles to persist in the coming quarter as Lexmark continues to restructure its business from its origins as a printer manufacturer into a business information company. In consumer discretionary, a position in global mass media company Viacom Inc., owner of a range of entertainment producers such as Paramount Pictures, MTV, VH1, Nickelodeon, Comedy Central and BET, continued to weigh on results. The company’s television divisions have been negatively affected by the changing habits of viewers, especially millennials, who are shifting toward alternative digital platforms. This has caused a decline in traditional television viewership, leading to significant ratings decreases for many networks. Viacom’s stock continued to decline after its recent quarter earnings were in line with estimates, but revenues were lower than expected due to declining advertising revenues.
Nuveen Equity Long/Short Fund
The Fund’s Class A Shares at NAV outperformed both the Russell 1000® Index and the comparative Lipper classification average during the twelve-month reporting period ended August 31, 2015.
The Nuveen Equity Long/Short Fund seeks long-term capital appreciation with moderate correlation to the U.S. equity market by investing in long and short positions primarily of large-capitalization stocks from U.S. companies. The team selects securities using the same disciplined approach used with all of the Funds in the Large Cap Equity Series, which balances fundamental analysis with quantitative techniques. We start with the securities found in the Russell 1000® Index, which are primarily large-cap companies and use a multi-factor quantitative ranking process to identify potential holdings. We then apply a fundamental overlay from Nuveen Asset Management’s team of sector-specific analysts, using our unique industry perspectives to select holdings. Our goal is to invest in long positions of companies that exhibit improving business fundamentals, strong management, identifiable catalysts and attractive valuations. We believe that buying such companies at reasonable prices can provide above-market returns over time. At the same time, the management team will typically take short positions in companies that it expects to underperform. The team expects the Fund to maintain a net long exposure to the equity market (long market value minus short market value) that is greater than the zero percent exposure of a “market neutral” fund, but less than the 100% exposure provided by a fund that invests only in long positions. The goal of this strategy is to allow the Fund to benefit from a rising market, although to a lesser extent than a “long-only” fund, while maintaining some protection in a falling market with the Fund’s short positions, which are selected based on the management team’s belief that they will trail the broader market.
During the twelve-month reporting period, the Fund outperformed as both short and long positions, in aggregate, added value. The primary positive contribution came from energy, including both a net short position in the sector and stock selection. Energy was the worst performing segment in the Russell 1000® Index by quite a margin, down more than 31% over the reporting period. A net short position in the materials sector and stock selection in industrials also proved beneficial. In addition, a preference for higher momentum stocks (those that have recently performed well) contributed favorably to results, while a tilt away from stocks with more currency sensitivity proved beneficial as well.
The Fund was rewarded for successful short positions in two energy-related companies: Seadrill Ltd. and CONSOL Energy Inc. Shares of offshore oil and gas exploration company Seadrill fell dramatically due to the combination of being closely tied to slumping crude oil prices and the company’s announcement to suspend its dividend to focus on debt reduction. Declining rig counts combined
Portfolio Managers’ Comments (continued)
with the company’s higher level of financial leverage caused a number of sell-side firms to downgrade Seadrill. Further signs of oversupply in the global oil market later in the reporting period continued to weigh on the stock. Likewise, a short position in coal and natural gas production company CONSOL Energy proved beneficial. The company’s shares were on a downward trajectory throughout the reporting period as the prices of both natural gas and coal declined and sell-side analysts started to take down earnings estimates to reflect the trend. We no longer hold a position in Seadrill.
The Fund’s top long position was video game developer and distributor Electronic Arts Inc. in the information technology sector. The company is benefiting from a new generation of gaming consoles and the increasing shift toward the digital delivery of games, which is meaningfully raising its gross margins and free cash flow. Electronic Arts’ CEO has also done an exceptional job of expanding the reach and profit margin of popular games such as Madden NFL and FIFA. All of these factors have led to several more quarters of strong results and a raise in full-year guidance. In addition, the Fund benefited from a long position in multi-line health care company Centene Corporation, which primarily provides services to government-sponsored health care programs focusing on the rising number of under-insured and uninsured individuals. Centene benefited from solid membership growth driven in part by an approved Medicaid expansion in Indiana. The company also announced the acquisition of Agate Resources with the expected immediate accretion to earnings per share, while raising its full-year forecasts for both earnings and revenue well beyond Wall Street expectations.
While the Fund experienced strong performance during the reporting period, it did have several areas that detracted, including stock selection in the consumer discretionary and information technology sectors. An underweight position in consumer staples was also a drag on results since that sector outpaced the virtually flat return of the Russell 1000® Index by more than 7%.
In terms of individual detractors, the Fund’s performance was hindered by a long position in Texas-based Denbury Resources Inc., an independent oil and gas exploration and production (E&P) company. Denbury’s performance is closely correlated to the price of West Texas Intermediate (WTI) crude since the company derives virtually all of its revenues from oil sales. After rising earlier in the year, the company’s stock price declined in late summer alongside the price of WTI crude oil as investors anticipated the resulting slowdown in production, revenue and therefore earnings. Also, a long position in Cabot Corporation, a global specialty chemicals and performance materials company, detracted during the reporting period. Among its many rubber and specialty products, Cabot provides key ingredients to the gas E&P industry. Company management guided toward lower volumes in 2015 as declining oil prices are causing Cabot’s customers to manage their inventories down. Later in the reporting period, the company reported revenue and earnings misses for the second quarter, putting further downward pressure on shares.
In the technology sector, a short position in analog semiconductor developer Avago Technologies Ltd. weighed on the Fund’s results. In February, Avago Technologies announced the acquisition of Emulex Corporation, which provided immediate synergies and the addition of a fiber channel that offered attractive margins for its enterprise storage portfolio of offerings. In May, the company announced that it would acquire rival wireless chip maker Broadcom Corp., which will blend two companies with complementary chips and broaden the markets Avago Technologies can serve. The company also reported a significant increase in revenue during the most recent quarter, led by the chip maker’s wireless communications and enterprise storage divisions. Also, a short position in Kraft Foods, which is now known as Kraft Heinz Company, proved to be detrimental. Kraft’s shares surged significantly in March after the company announced a merger agreement with H.J. Heinz to form the fifth largest food and beverage company in the world. The stable of brands under the new Kraft Heinz entity includes the well-known Heinz ketchup, Jell-O, Kraft, Ore-Ida and Oscar Meyer. We no longer hold our positions in Avago Technologies and Kraft Foods.
Nuveen Equity Market Neutral Fund
The Fund’s Class A Shares at NAV outperformed both the BofA/Merrill Lynch 3-Month Treasury Bill Index and the comparative Lipper classification average during the twelve-month reporting period ended August 31, 2015.
The Nuveen Equity Market Neutral Fund seeks long-term capital appreciation independent of the equity market’s direction by investing in long and short positions primarily of large-capitalization stocks from U.S. companies. The team selects securities using the same disciplined approach used with all of the Funds in the Large Cap Equity Series, which balances fundamental analysis with quantitative techniques. We start with the securities found in the Russell 1000® Index, which are primarily large-cap companies, and use a multi-factor quantitative ranking process to identify potential holdings. We then apply a fundamental overlay from Nuveen Asset Management’s team of sector-specific analysts, using our unique industry perspectives to select holdings. Our goal is to invest in
long positions of companies that exhibit improving business fundamentals, strong management, identifiable catalysts and attractive valuations. We believe that buying such companies at reasonable prices can provide above-market returns over time. At the same time, the management team will typically take short positions in companies that it expects to underperform. The goal of this strategy is that, over time, the stock market exposure of the combined long and short positions will be minimized, producing a net return due primarily to stock selection, rather than stock market movements. Over longer periods of time, the Fund’s net exposure could fluctuate between net long 40% and net short 20%; however, under somewhat normal conditions, the Fund will carry a net long exposure slightly above zero percent (long market value versus short market value).
During the twelve-month reporting period, the Fund outperformed as short positions, in aggregate, added the most value. The primary positive contribution came from energy, including both a net short position in the sector and stock selection. Energy was the worst performing segment of the Russell 1000® Index by quite a margin, down more than 31% over the reporting period. A net long position in the health care sector and a net short position in materials also proved beneficial. We also generally tilted away from stocks with more volatility in the Fund, which helped performance as investors favored more stable and defensive names. At the same time, we showed a preference for higher momentum stocks (those that have recently performed well), which contributed favorably to results because they generally outpaced lower momentum stocks.
The Fund held a successful short position in Stratasys Inc., a manufacturer of 3D printers and production systems for rapid prototyping and digital manufacturing solutions. The company has suffered as the market for 3D printing has not been as robust as initially predicted. In early February, Stratasys shares fell sharply after the company announced disappointing growth for its MakerBot division of 3D print offerings. April saw another significant decline after the company gave preliminary first-quarter results and full-year guidance that were far short of analysts’ estimates. Shares remained under pressure for the remainder of the reporting period due to plans for increased investment to support new product development and sales efforts as well as competition from new, larger players in the marketplace. The Fund was also rewarded for a successful short position in coal and natural gas production company Consol Energy Inc. The company’s shares were on a downward trajectory throughout the reporting period as the price of both natural gas and coal declined and sell-side analysts started to take down earnings estimates to reflect the trend.
The Fund’s top long position was video game developer and distributor Electronic Arts Inc. in the information technology sector. The company is benefiting from a new generation of gaming consoles and the increasing shift toward the digital delivery of games, which is meaningfully raising its gross margins and free cash flow. Electronic Arts’ CEO has also done an exceptional job of expanding the reach and profit margin of popular games such as Madden NFL and FIFA. All of these factors have led to several more quarters of strong results and a raise in full-year guidance. Also, the Fund benefited from a long position in Penn National Gaming Inc., a diversified owner and manager of gaming and racing properties with a focus on slot machine entertainment. The company’s stock has risen significantly over the past year due to its ambitious expansion into regional U.S. markets such as the Las Vegas Strip and Southern California and by avoiding properties in Macau, a move that has dragged down other major casino operators. Penn National also acquired video gaming terminal operator Prairie State Gaming, which could offer new growth opportunities while hedging its casino market exposure. The generally improving U.S. economy, lower gas prices and improving employment have also increased gambling activity. We sold our position in Penn National Gaming Inc. late in the reporting period.
While the Fund experienced strong performance during the reporting period, it did have several areas that detracted. Long positions, in aggregate, detracted as did stock selection in both the consumer staples and consumer discretionary sectors. A net long position in telecommunications services was a drag on results as that sector turned in negative absolute results and underperformed the overall return of the Russell 1000® Index. In addition, the Fund’s preference for larger-sized names within the index hurt returns since the market favored smaller-cap stocks during the reporting period.
In terms of individual detractors, the Fund’s performance was hindered by a long position in Texas-based Denbury Resources Inc., an independent oil and gas exploration and production (E&P) company. Denbury’s performance is closely correlated to the price of West Texas Intermediate (WTI) crude since the company derives virtually all of its revenues from oil sales. After rising earlier in the year, the company’s stock price declined in late summer alongside the price of WTI crude oil as investors anticipated the resulting slowdown in production, revenue and therefore earnings. The Fund also experienced underperformance from a long position in Apollo Group, Inc., the largest player in the for-profit education sector. Shares fell throughout the reporting period after the company released disappointing first and second fiscal quarter results, including significant drops in both revenue and enrollment from the
Portfolio Managers’ Comments (continued)
previous year. The entire for-profit education sector continues to be weighed down by the drop in post-secondary school enrollment over the past three years in the United States. Meanwhile, Apollo Education’s primary revenue stream, the University of Phoenix, is losing students and employees at an even greater pace due to stricter regulations surrounding financial aid at for-profit institutions.
The Fund’s greatest detractor among its short positions was U.S. based information technology company Palo Alto Networks, Incorporated. This leading provider of enterprise endpoint and network security products has seen its stock price advance as the company has increased market share significantly in a strongly growing market. Corporations often have an uncapped budget for network security spending as they try to protect critical information from cyber threats. Industry research organization Gartner Group forecasts that network security spending will grow 7% annually through 2018. Palo Alto’s stock has performed well as both market growth and superior execution have lifted earnings growth expectations. In the consumer area, the Fund’s short position in online retail giant Amazon.com Inc. proved detrimental to performance since its shares rose significantly. The company once again beat consensus estimates for revenue and earnings per share, while also reporting improved margins. Earlier in the reporting period, Amazon also benefited from strong online holiday sales, a 53% increase worldwide in Prime annual memberships and interest in its investments in new technology such as a drone delivery system and a 3D printed products store. As the reporting period progressed, the higher-than-expected profitability of Amazon’s cloud computing business boosted investor confidence in the company’s longer term story. We covered our short position in Amazon.com Inc.
Nuveen Growth Fund
The Fund’s Class A Shares at NAV underperformed both the Russell 1000® Growth Index and the comparative Lipper classification average during the twelve-month reporting period ended August 31, 2015.
The Nuveen Growth Fund seeks long-term capital appreciation by investing primarily in stocks of well-run companies that exhibit above-average growth potential combined with durable and stable earnings streams. The team selects securities using the same disciplined approach used with all of the Funds in the Large Cap Equity Series, which balances fundamental analysis with quantitative techniques. We begin with the securities found in the Russell 1000® Growth Index, which are primarily large-cap growth-oriented companies and use a multi-factor quantitative ranking process to identify potential holdings. We then apply a fundamental overlay from Nuveen Asset Management’s team of sector-specific analysts, using our unique industry perspectives to select growth-oriented holdings. Our goal is to invest primarily in companies that exhibit stable and consistent earnings growth, defendable competitive advantages, strong management and low dependence on capital markets. We believe that buying such companies at reasonable prices can provide above-market returns over time.
During the reporting period, the Fund underperformed mainly due to stock selection in the consumer discretionary and information technology sectors. Additionally, the Fund’s preference for larger-sized names within the index hurt returns since the market favored smaller-cap stocks.
A trio of consumer discretionary names weighed on the Fund’s results. Worldwide apparel retailer Gap, Inc., operating under store brands that include Gap, Banana Republic, Old Navy, Athleta and Intermix, saw its shares decline fairly significantly. Disappointing comparable store sales from Gap and Banana Republic could not overcome the positive trends experienced at Old Navy. In addition, elevated inventory levels caused investors to be cautious. Later in the reporting period, the retailer announced plans to close stores and streamline staffing as it attempted to rebuild and strengthen its brand in the face of increasing global competition. Also, the Fund’s lack of exposure to online retail giant Amazon.com Inc. proved detrimental to performance because its shares rose significantly. The company once again beat consensus estimates for revenue and earnings per share, while also reporting improved margins. Earlier in the reporting period, Amazon benefited from strong online holiday sales, a 53% increase worldwide in Prime annual memberships and interest in its investments in new technology such as a drone delivery system and a 3D printed products store. As the reporting period progressed, the higher-than-expected profitability of Amazon’s cloud computing business boosted investor confidence in the company’s longer-term story. Finally, a position in global mass media company Viacom Inc., owner of a range of entertainment producers such as Paramount Pictures, MTV, VH1, Nickelodeon, Comedy Central and BET, continued to weigh on results. The company’s television divisions have been negatively affected by the changing habits of viewers, especially millennials, who are shifting toward alternative digital platforms. This has caused a decline in traditional television viewership, leading to significant ratings decreases for many networks. Viacom’s stock continued to decline after its recent quarter earnings were in line with estimates, but revenues were lower than expected due to declining advertising revenues.
On the positive side, the Fund benefited from stock selection and an overweight position in health care, the strongest performing sector in the Russell 1000® Growth Index, which advanced more than 13% during the reporting period. An underweight position in energy also proved beneficial because the sector was the worst performing area in the index by a wide margin during the reporting period, down more than 33%. Finally, the Fund’s tilt away from stocks with higher volatility helped returns because investors favored more stable and defensive names.
Home improvement retailer Home Depot, Inc. was a top performer for the Fund during the reporting period. Its shares reached another all-time high in August 2015 after the company’s sales were boosted significantly by the recovery in the U.S. economy and housing market. Appreciating home prices and increasing housing turnover (total home sales) have been the direct drivers of increased home improvement spending by consumers. Also, as noted above, the health care sector performed strongly during the reporting period due to a flurry of merger and acquisition (M&A) activity aimed at cutting costs and expanding profits. In addition to industry consolidation, health insurance companies also benefited from the surge of new business from previously uninsured people brought into the market by the Affordable Care Act. One of the Fund’s top performers was health insurer Aetna Inc., which saw its shares hit all-time highs. Aetna was approached by another Fund holding, UnitedHealth Group Incorporated, about a takeover deal midway through the reporting period. After rejecting the offer, the company subsequently announced plans to buy Humana Inc. for $37 billion in July. Another health care holding that advanced due to M&A rumors and an eventual takeout bid was ophthalmic and specialty drug developer Allergan plc. The company benefited from a strong cash position and fundamentals, a lack of outstanding debt and the willingness to acquire strategic assets to go along with sustainable organic revenue growth. Early in the reporting period, Allergan’s shares rose as Valeant Pharmaceuticals International and activist investor William Ackman continued their hostile takeover bid of the company. In November 2014, Allergan skirted their advances by agreeing to a $66 billion deal with Actavis plc. The merger was completed in March of 2015 with Actavis changing its name to Allergan and shares reached an all-time high in July. We have sold our position in Allergan plc.
Nuveen Large Cap Core Fund
The Fund’s Class A Shares at NAV underperformed both the Russell 1000® Index and the comparative Lipper classification average during the twelve-month reporting period ended August 31, 2015.
The Nuveen Large Cap Core Fund seeks long-term capital appreciation by investing primarily in stocks of well-run companies. The investment team selects securities using the same disciplined approach used with all of the Funds in the Large Cap Equity Series, which balances fundamental analysis with quantitative techniques. We start with the securities found in the Russell 1000® Index, which are primarily large-cap companies, and use a multi-factor quantitative ranking process to identify potential holdings. We then apply a fundamental overlay from Nuveen Asset Management’s team of sector-specific analysts, using our unique industry perspectives to select holdings. Our goal is to invest primarily in companies that exhibit improving business fundamentals, strong management, identifiable catalysts and attractive valuations. We believe that buying such companies at reasonable prices can provide above-market returns over time.
During the reporting period, the Fund underperformed mainly due to stock selection in the information technology, consumer discretionary, industrial and telecommunications services sectors. Additionally, the Fund’s emphasis on stocks with higher volatility hurt returns as investors favored more stable and defensive names.
The most significant underperformer in the Fund continued to be a position in regional broadband and communications provider Windstream Holdings Inc. The company spun off select telecommunications network assets into a separate, publicly traded real estate investment trust (REIT) in late April, along with undertaking a one-for-six reverse stock split of Windstream shares. In May, the company then reported mixed first-quarter results, with improving earnings, but revenues that fell short of analysts’ estimates. After the REIT spin-off, Windstream was no longer included in the S&P 500® Index and its shares remained in a slump for the rest of the reporting period. A position in Lexmark International, Inc., a supplier of laser printers and enterprise software, also detracted during the reporting period. The company’s shares were down fairly significantly in July after reporting disappointing revenue and margin results for the second quarter. Management also guided investors to expect the near-term struggles to persist in the coming quarter as Lexmark continues to restructure its business from its origins as a printer manufacturer into a business information company. The Fund also experienced underperformance from a position in Apollo Group, Inc., the largest player in the for-profit education sector. Shares fell throughout the reporting period after the company released disappointing first and second fiscal quarter results, including sig-
Portfolio Managers’ Comments (continued)
nificant drops in both revenue and enrollment from one year ago. The entire for-profit education sector continues to be weighed down by the drop in post-secondary school enrollment over the past three years in the United States. Meanwhile, Apollo Education’s primary revenue stream, the University of Phoenix, is losing students and employees at an even greater pace due to stricter regulations surrounding financial aid at for-profit institutions.
On the positive side, the Fund benefited from an underweight position and stock selection in the energy sector and an overweight in consumer discretionary. Energy was the worst performing sector in the Russell 1000® Index by a wide margin during the reporting period down more than 31%, while consumer discretionary stocks as a whole advanced more than 9% in the context of the virtually flat benchmark return. Stock selection in health care also proved beneficial, which was the strongest performing sector in the index over the reporting period. Finally, the Fund’s preference for smaller-cap stocks within the index boosted returns as the market favored these stocks.
Regarding individual contributors, the Fund benefited from not owning a position in Chevron Corp., the largest oilfield services company in the United States and a fairly large weight in the index. The company and its subsidiaries, which are involved in a vast array of energy-related industries including oil, natural gas, geothermal energy, chemicals, mining, power and energy services, continued to be negatively impacted by the falling price of oil throughout the reporting period. Chevron’s stock hit a 52-week low toward the end of the reporting period as West Texas Intermediate (WTI) prices dipped below the $40 per barrel mark. With the price of oil so low, the company’s overall earnings have been hit hard in its most recent quarter. The Fund also benefited from an overweight position in oil and natural gas E&P company SandRidge Energy Inc. for part of the reporting period. After its shares fell significantly in the first half of the reporting period, we saw value in the company and added exposure to SandRidge Energy at an opportune time. Subsequently, SandRidge’s fourth-quarter results surprised investors positively due to stronger-than-expected production. The company also provided guidance on reduced capital spending for 2015, like many other energy companies did during the reporting period, which was applauded by investors. We sold our position in SandRidge Energy Inc. In terms of other contributors we owned in the portfolio, the Fund benefited from its position in Cablevision Systems Corporation., a cable television provider serving the New York region. Shares of the company advanced strongly during the reporting period, hitting 52-week highs in late May and early August. Cablevision has executed well on its initiatives to offer more flexible bundling options, generate greater revenue per customer and develop new content relationships such as HBO Now. The company also benefited from increased speculation of further consolidation within the cable industry after an industry peer reaffirmed its decision to acquire a competitor, while the CEO of European cable company Altice Group mentioned Cablevision as a potential takeover target. After the reporting period ended, Altice formally announced the takeover, which will create the fourth largest cable operator in the U.S. market.
Nuveen Large Cap Core Plus Fund
The Fund’s Class A Shares at NAV underperformed both the Russell 1000® Index and the comparative Lipper classification average during the twelve-month reporting period ended August 31, 2015.
The Nuveen Large Cap Core Plus Fund seeks long-term capital appreciation by investing in both long and short positions primarily of large-capitalization stocks from U.S. companies. The investment team selects securities using the same disciplined approach used with all of the Funds in the Large Cap Equity Series, which balances fundamental analysis with quantitative techniques. We start with the securities found in the Russell 1000® Index, which are primarily large-cap companies, and use a multi-factor quantitative ranking process to identify potential holdings. We then apply a fundamental overlay from Nuveen Asset Management’s team of sector specific analysts, using our unique industry perspectives to select holdings. Our goal is to invest in long positions of companies that exhibit improving business fundamentals, strong management, identifiable catalysts and attractive valuations. We believe that buying such companies at reasonable prices can provide above-market returns over time. At the same time, the management team will typically take short positions in companies that it expects to underperform. The team expects the Fund to maintain approximately 100% net long exposure to the equity market (long 130% market value versus short 30% market value); however, the long and short positions will vary in size as market conditions change.
During the reporting period, the Fund underperformed with its long positions, in aggregate, detracting. Stock selection was particularly weak in the consumer discretionary, information technology, telecommunications services and industrial sectors. Additionally, the Fund’s emphasis on stocks with higher volatility hurt returns as investors favored more stable and defensive names.
The Fund’s most significant underperformer in terms of long positions was regional broadband and communications provider Windstream Holdings Inc. The company spun off select telecommunications network assets into a separate, publicly traded real estate investment trust (REIT) in late April, along with undertaking a one-for-six reverse stock split of Windstream shares. In May, the company then reported mixed first-quarter results, with improving earnings, but revenues that fell short of analysts’ estimates. After the REIT spin-off, Windstream was no longer included in the S&P 500® Index and its shares stayed in a slump for the remainder of the reporting period. Also, the Fund experienced underperformance from a long position in Apollo Group, Inc., the largest player in the for-profit education sector. Shares fell throughout the reporting period after the company released disappointing first and second fiscal quarter results, including significant drops in both revenue and enrollment from one year ago. The entire for-profit sector continues to be weighed down by the drop in post-secondary school enrollment over the past three years in the United States. Meanwhile, Apollo Education’s primary revenue stream, the University of Phoenix, is losing students and employees at an even greater pace due to stricter regulations surrounding financial aid at for-profit institutions.
In the consumer sector, the Fund’s short position in online retail giant Amazon.com Inc. proved detrimental to performance because its shares rose significantly. The company once again beat consensus estimates for revenue and earnings per share, while also reporting improved margins. Earlier in the reporting period, Amazon benefited from strong online holiday sales, a 53% increase worldwide in Prime annual memberships and interest in its investments in new technology such as a drone delivery system and a 3D printed products store. As the reporting period progressed, the higher-than-expected profitability of Amazon’s cloud computing business boosted investor confidence in the company’s longer-term story. We covered our short position in Amazon.com Inc. Also, a short position in Netflix Inc. detracted again during this reporting period. The company engages in the delivery of television shows and movies directly to TVs, computers and mobile devices via the Internet. Netflix produced a strong first-quarter earnings report, adding 4.9 million subscribers, which was well above the number added in the same quarter a year ago. The company is benefiting from the shift by millennials and other viewers to watching content on Netflix versus traditional television. Nearly 40% of TV households in the United States now subscribe to its service. The company’s strong performance led it to announce a seven-for-one stock split.
On the positive side, the Fund particularly benefited from an underweight and net short position in energy. The sector was the worst performing area in the Russell 1000® Index by a wide margin during the reporting period, down more than 31%. Short positions, in aggregate, also benefited returns as did stock selection and an overweight position in health care, which was the strongest performing sector in the index over the reporting period. Additionally, the Fund’s overweights in smaller-cap stocks within the index and higher momentum stocks (those that have recently performed well) boosted returns as the market favored these stocks.
The Fund was rewarded for successful short positions in two energy-related companies: Chevron Corp. and Seadrill Ltd. Chevron is the largest oilfield services company in the United States and a fairly large weight in the index. The company and its subsidiaries, which are involved in a vast array of energy-related industries including oil, natural gas, geothermal energy, chemicals, mining, power and energy services, continued to be negatively impacted by the falling price of oil throughout the reporting period. Chevron’s stock hit a 52-week low toward the end of the reporting period as West Texas Intermediate (WTI) prices dipped below the $40 per barrel mark. With the price of oil so low, the company’s overall earnings have been hit hard in its most recent quarter. Shares of offshore oil and gas exploration company Seadrill fell dramatically due to the combination of being closely tied to slumping crude oil prices and the company’s announcement to suspend its dividend to focus on debt reduction. Declining rig counts combined with the company’s higher level of financial leverage caused a number of sell-side firms to downgrade Seadrill. Further signs of oversupply in the global oil market later in the reporting period continued to weigh this stock down. We sold our positions in both Chevron Corp. and Seadrill Ltd.
As noted, the health care sector performed strongly during the reporting period due to a flurry of merger and acquisition (M&A) activity aimed at cutting costs and expanding profits. Indeed, the Fund’s top long positions were two health insurers that took part in the M&A action and saw their shares hit all-time highs. In addition to industry consolidation, health insurance companies also benefited from the surge of new business from previously uninsured people brought into the market by the Affordable Care Act. The Fund’s top performer was Aetna Inc., which was approached by another Fund holding, UnitedHealth Group Incorporated, about a takeover deal midway through the reporting period. Aetna rejected the offer and subsequently announced plans to buy Humana Inc. for $37 billion in July. Meanwhile, UnitedHealth Group, the largest of the U.S. health insurers, was also a strong outperformer for the Fund. The company continued to post strong earnings growth and give upbeat guidance for further acceleration due to additional revenue from its $12.8 billion acquisition of Catamaran Corp., a pharmacy benefit manager and prescription provider. UnitedHealth shares also benefited from the company’s contained cost trends, favorable medical loss ratios and increased strength in its OptumHealth division in the retail space.
Portfolio Managers’ Comments (continued)
Nuveen Large Cap Growth Fund
The Fund’s Class A Shares at NAV underperformed both the Russell 1000® Growth Index and the comparative Lipper classification average during the twelve-month reporting period ended August 31, 2015.
The Nuveen Large Cap Growth Fund seeks long-term capital appreciation by investing primarily in stocks of well-run companies that exhibit above-average growth potential. The investment team selects securities using the same disciplined approach used with all of the Funds in the Large Cap Equity Series, which balances fundamental analysis with quantitative techniques. We start with the securities found in the Russell 1000® Growth Index, which are primarily large-cap growth-oriented companies, and use a multi-factor quantitative ranking process to identify potential holdings. We then apply a fundamental overlay from Nuveen Asset Management’s team of sector-specific analysts, using our unique industry perspectives to select holdings. Our goal is to invest primarily in companies that exhibit improving business fundamentals, strong management, identifiable catalysts and attractive valuations. We believe that buying such companies at reasonable prices can provide above-market returns over time.
During the reporting period, the Fund underperformed mainly due to stock selection and an underweight in consumer staples, which was one of the strongest performing sectors in the index. Stock selection in the telecommunications services, consumer discretionary and industrial sectors also weighed on results. Additionally, the Fund’s emphasis on stocks with higher volatility hurt returns because investors favored more stable and defensive names.
The Fund’s most significant underperformer was regional broadband and communications provider Windstream Holdings Inc. The company spun off select telecommunications network assets into a separate, publicly traded real estate investment trust (REIT) in late April, along with undertaking a one-for-six reverse stock split of Windstream shares. In May, the company reported mixed first-quarter results, with improving earnings, but revenues that fell short of analysts’ estimates. After the REIT spin-off, Windstream was no longer included in the S&P 500® Index and its shares stayed in a slump for the remainder of the reporting period. Also, the Fund’s lack of exposure to online retail giant Amazon.com Inc., a fairly large benchmark constituent, proved detrimental to performance as its shares rose significantly. The company once again beat consensus estimates for revenue and earnings per share, while also reporting improved margins. Earlier in the reporting period, Amazon benefited from strong online holiday sales, a 53% increase worldwide in Prime annual memberships and interest in its investments in new technology such as a drone delivery system and a 3D printed products store. As the reporting period progressed, the higher-than-expected profitability of Amazon’s cloud computing business boosted investor confidence in the company’s longer-term story. In addition, a position in beauty supply company Avon Products, Inc. lagged throughout the reporting period. Avon’s management has struggled for nearly three years to re-shape the company within the U.S. market to capture more millennials; however, new initiatives for both cost containment and revenue enhancements have been slow to progress. In March, this company was also removed from the S&P 500® Index.
On the positive side, the Fund benefited from an underweight position in the energy sector and an overweight in consumer discretionary. Energy was the worst performing sector in the Russell 1000® Growth Index by a wide margin during the reporting period down more than 33%, while discretionary stocks as a whole advanced more than 11%. Stock selection in the health care sector also proved beneficial, which was the strongest performing sector in the index over the reporting period. In addition, the Fund’s preference for smaller-cap stocks within the index boosted returns as the market favored these stocks. Finally, we generally tilted away from stocks with more currency sensitivity in the Fund, which helped performance as these stocks underperformed.
As noted, the health care sector performed strongly during the reporting period due to a flurry of merger and acquisition (M&A) activity aimed at cutting costs and expanding profits. The Fund’s top-performing stock was global health benefits and insurance company Cigna Corp., which provides a broad array of medical, dental, disability and life insurance. Cigna’s shares rose for much of the reporting period as the company benefited from the continuation of disciplined cost controls, revenues that grew faster than investors expected and upbeat guidance from company management for calendar year 2015. Then in June, Cigna’s stock surged after buyout rumors circulated and an eventual offer was announced from another Fund holding, Anthem Inc., which will leave only three major players in the insurance industry if the deal passes regulatory approval. We sold our postion in Cigna Corp. late in the reporting period. Also, the Fund’s lack of exposure to Schlumberger Ltd., one of the largest oilfield services companies in the United States, proved helpful. Shares of this fairly large index component fell significantly throughout the reporting period due to the backdrop of falling crude oil prices and declining capital expenditure budgets. Schlumberger supplies many companies in the oil and gas exploration segment that have cut their capital expenditure budgets. In addition, the Fund benefited from its position in Cablevision Systems Corporation, a cable television provider serving the New York region.
Shares of the company advanced strongly during the reporting period, hitting 52-week highs in late May and early August. Cablevision has executed well on its initiatives to offer more flexible bundling options, generate greater revenue per customer and develop new content relationships such as HBO Now. The company also benefited from increased speculation of further consolidation within the cable industry after an industry peer reaffirmed its decision to acquire a competitor, while the CEO of European cable company Altice Group mentioned Cablevision as a potential takeover target. After the reporting period ended, Altice formally announced the takeover, which will create the fourth largest cable operator in the U.S. market.
Nuveen Large Cap Value Fund
The Fund’s Class A Shares at NAV underperformed both the Russell 1000® Value Index and the comparative Lipper classification average during the twelve-month reporting period ended August 31, 2015.
The Nuveen Large Cap Value Fund seeks long-term capital appreciation by investing primarily in large-capitalization stocks of U.S. companies. The investment team selects securities using the same disciplined approach used with all of the Funds in the Large Cap Equity Series, which balances fundamental analysis with quantitative techniques. We start with the securities found in the Russell 1000® Value Index, which are primarily large-cap value companies, and use a multi-factor quantitative ranking process to identify potential holdings. We then apply a fundamental overlay from Nuveen Asset Management’s team of sector-specific analysts, using our unique industry perspectives to select holdings. Our goal is to invest primarily in companies that exhibit improving business fundamentals, strong management, identifiable catalysts and attractive valuations. We believe that buying such companies at reasonable prices can provide above-market returns over time.
During the reporting period, the Fund underperformed mainly due to stock selection in the industrial, consumer discretionary, telecommunications services and consumer staples sectors. An underweight position in the financial sector was also a drag on results. Additionally, the Fund’s emphasis on stocks with higher volatility hurt returns because investors favored more stable and defensive names.
In terms of individual detractors, the Fund’s performance was hindered by a position in Texas-based Denbury Resources Inc., an independent oil and gas exploration and production company. Denbury’s performance is closely correlated to the price of West Texas Intermediate (WTI) crude since the company derives virtually all of its revenues from oil sales. After rising earlier in the year, the company’s stock price declined in late summer alongside the price of WTI crude oil as investors anticipated the resulting slowdown in production, revenue and therefore earnings. The Fund also experienced underperformance from a position in Apollo Group, Inc., the largest player in the for-profit education sector. Shares fell throughout the reporting period after the company released disappointing first and second fiscal quarter results, including significant drops in both revenue and enrollment from one year ago. The entire for-profit education sector continues to be weighed down by the drop in post-secondary school enrollment over the past three years in the United States. Meanwhile, Apollo Education’s primary revenue stream, the University of Phoenix, is losing students and employees at an even greater pace due to stricter regulations surrounding financial aid at for-profit institutions. A position in Joy Global Inc., a manufacturer and servicer of heavy duty equipment used in the mining industry, also detracted. The company’s shares fell throughout the reporting period as weak demand for commodities continued to batter profits. Faced with increased pricing competition, rising inventory and headwinds from the mining sector slowdown, management turned to slowing the pace of stock buybacks and cost efficiencies to cushion the slowdown in revenues. We sold our position in Joy Global Inc.
On the positive side, the Fund benefited from stock selection in health care, which was the strongest performing sector in the index over the reporting period. An underweight position in the energy sector and an overweight in consumer discretionary were also helpful. Energy was the worst performing sector in the Russell 1000® Value Index by a wide margin during the reporting period down more than 31%, while discretionary stocks as a whole advanced more than 2% in the context of the negative benchmark return. In addition, the Fund’s preference for smaller-cap stocks within the index boosted returns as the market favored these stocks, while an underweight in stocks with higher dividend yields also helped performance since these stocks underperformed.
In terms of individual contributors, the Fund benefited from not owning a position in Chevron Corp., the largest oilfield services company in the United States and a fairly large weight in the index. The company and its subsidiaries, which are involved in a vast array of energy-related industries including oil, natural gas, geothermal energy, chemicals, mining, power and energy services, continued to be negatively impacted by the falling price of oil throughout the reporting period. Chevron’s stock hit a 52-week low
Portfolio Managers’ Comments (continued)
toward the end of the reporting period as West Texas Intermediate (WTI) prices dipped below the $40 per barrel mark. With the price of oil so low, the company’s overall earnings have been hit hard in its most recent quarter. Also, as noted above, the health care sector performed strongly during the reporting period due to a flurry of merger and acquisition activity aimed at cutting costs and expanding profits. In addition to industry consolidation, health insurance companies also benefited from the surge of new business from previously uninsured people brought into the market by the Affordable Care Act. One of the Fund’s top performers was health insurer Aetna Inc., which saw its shares hit all-time highs. Aetna was approached by another Fund holding, UnitedHealth Group Incorporated, about a takeover deal midway through the reporting period. After rejecting the offer, the company subsequently announced plans to buy Humana Inc. for $37 billion in July. In addition, the Fund benefited from a long position in Penn National Gaming Inc., a diversified owner and manager of gaming and racing properties with a focus on slot machine entertainment. The company’s stock has risen significantly due to its ambitious expansion into regional U.S. markets such as the Las Vegas Strip and Southern California and by avoiding properties in Macau, a move that has dragged down other major casino operators. Penn National also acquired video gaming terminal operator Prairie State Gaming, which could offer new growth opportunities while hedging its casino market exposure. The generally improving U.S. economy, lower gas prices and improving employment have also increased gambling activity. We have since sold our position in Penn National Gaming Incorporated.
Risk Considerations
Nuveen Concentrated Core Fund
Mutual fund investing involves risk; principal loss is possible. There is no guarantee the Fund’s investment objectives will be achieved. The value of equity securities may decline significantly over short or extended periods of time. The Fund is non-diversified, meaning it may invest a larger portion of its assets in the securities of a limited number of issuers and may be more sensitive to any single economic, business, political or regulatory occurrence than a diversified fund. More information on these risks considerations, as well as information on other risks to which the Fund is subject, such as futures contract and large cap stock risks, are included in the Fund’s prospectus.
Nuveen Core Dividend Fund
Mutual fund investing involves risk; principal loss is possible. There is no guarantee the Fund’s investment objectives will be achieved, including income from dividends. The value of equity securities may decline significantly over short or extended periods of time. More information on these risks considerations, as well as information on other risks to which the Fund is subject, such as futures contract and large cap stock risks, are included in the Fund’s prospectus.
Nuveen Equity Long/Short Fund
Mutual fund investing involves risk; principal loss is possible. There is no guarantee the Fund’s investment objectives will be achieved. Prices of equity securities may change significantly over short or extended periods of time. The Fund sells securities that it has borrowed but does not own (“short sales”), which is a speculative technique. The Fund will suffer a loss when the price of a security that it holds long decreases or the price of a security that it has sold short increases. Losses on short sales arise from increases in the value of the security sold short, and therefore are theoretically unlimited. Because the Fund invests in both long and short equity positions, the Fund has overall exposure to changes in value of equity securities that is far greater than its net asset value. This may magnify gains and losses and increase the volatility of the Fund’s returns. In addition, the use of short sales will increase the Fund’s expenses. More information on these risks considerations, as well as information on other risks to which the Fund is subject, such as frequent trading, futures contract, and large cap stock risks, are included in the Fund’s prospectus.
Nuveen Equity Market Neutral Fund
Mutual fund investing involves risk; principal loss is possible. There is no guarantee the Fund’s investment objectives will be achieved. Prices of equity securities may change significantly over short or extended periods of time. The Fund sells securities that it has borrowed but does not own (“short sales”), which is a speculative technique. The Fund will suffer a loss when the price of a security that it holds long decreases or the price of a security that it has sold short increases. Because the Fund attempts to generate returns that are primarily due to stock selection (long and short), rather than the returns of the stock market, performance will be more dependent on the portfolio manager acumen than is the case for other equity funds. Losses on short sales arise from increases in the value of the security sold short, and therefore are theoretically unlimited. Because the Fund invests in both long and short equity positions, the Fund has overall exposure to changes in value of equity securities that is far greater than its net asset value. This may magnify gains and losses and increase the volatility of the Fund’s returns. In addition, the use of short sales will increase the Fund’s expenses. More information on these risks considerations, as well as information on other risks to which the Fund is subject, such as frequent trading, futures contract and large cap stock risks, are included in the Fund’s prospectus.
Nuveen Growth Fund
Mutual fund investing involves risk; principal loss is possible. There is no guarantee that the Fund’s investment objectives will be achieved. Prices of equity securities may decline significantly over short or extended periods of time. These and other risk considerations, such as currency, growth stock, large cap stock, and non-U.S. investment risks, are described in detail in the Fund’s prospectus.
Risk Considerations (continued)
Nuveen Large Cap Core Fund
Mutual fund investing involves risk; principal loss is possible. There is no guarantee the Fund’s investment objectives will be achieved, including income from dividends. The value of equity securities may decline significantly over short or extended periods of time. More information on these risks considerations, as well as information on other risks to which the Fund is subject, such as futures contract and large cap stock risks, are included in the Fund’s prospectus.
Nuveen Large Cap Core Plus Fund
Mutual fund investing involves risk; principal loss is possible. There is no guarantee the Fund’s investment objectives will be achieved. Prices of equity securities may change significantly over short or extended periods of time. The Fund sells securities that it has borrowed but does not own (“short sales”), which is a speculative technique. The Fund will suffer a loss when the price of a security that it holds long decreases or the price of a security that it has sold short increases. Losses on short sales arise from increases in the value of the security sold short, and therefore are theoretically unlimited. Because the Fund invests in both long and short equity positions, the Fund has overall exposure to changes in value of equity securities that is far greater than its net asset value. This may magnify gains and losses and increase the volatility of the Fund’s returns. In addition, the use of short sales will increase the Fund’s expenses. More information on these risks considerations, as well as information on other risks to which the Fund is subject, such as frequent trading, futures contract and large cap stock risks, are included in the Fund’s prospectus.
Nuveen Large Cap Growth Fund
Mutual fund investing involves risk; principal loss is possible. There is no guarantee that the Fund’s investment objectives will be achieved. Prices of equity securities may decline significantly over short or extended periods of time. These and other risk considerations, such as futures contract, growth stock, and large cap stock risks, are described in detail in the Fund’s prospectus.
Nuveen Large Cap Value Fund
Mutual fund investing involves risk; principal loss is possible. There is no guarantee the Fund’s investment objectives will be achieved. Prices of equity securities may decline significantly over short or extended periods of time. These and other risk considerations, such as futures contract, large cap stock, and value stock risks, are described in detail in the Fund’s prospectus.
Fund Performance
and Expense Ratios
The Fund Performance and Expense Ratios for each Fund are shown within this section of the report.
Returns quoted represent past performance, which is no guarantee of future results. Current performance may be higher or lower than the performance shown. Investment returns and principal value will fluctuate so that when shares are redeemed, they may be worth more or less than their original cost. Returns without sales charges would be lower if the sales charge were included. Returns do not reflect the deduction of taxes that a shareholder would pay on Fund distributions or the redemption of Fund shares.
Returns may reflect an agreement by the investment adviser to waive certain fees and/or reimburse expenses during the periods presented. If any such waivers and/or reimbursements had not been in place, returns would have been reduced. See Notes to Financial Statements, Note 7—Management Fees and Other Transactions with Affiliates for more information. For the most recent month-end performance visit www.nuveen.com or call (800) 257-8787.
Returns reflect differences in sales charges and expenses, which are primarily differences in distribution and service fees, and assume reinvestment of dividends and capital gains.
Comparative index and Lipper return information is provided for Class A Shares at net asset value (NAV) only.
The expense ratios shown reflect total operating expenses (before fee waivers and/or expense reimbursements, if any) as shown in the most recent prospectus. The expense ratios include management fees and other fees and expenses.
Fund Performance and Expense Ratios (continued)
Nuveen Concentrated Core Fund
Refer to the first page of this Fund Performance and Expense Ratios section for further explanation of the information included within this section. Refer to Glossary of Terms Used in this Report for definitions of terms used within this section.
Fund Performance
Average Annual Total Returns as of August 31, 2015
| | | | | | | | |
| | | Average Annual | |
| | | 1-Year | | | Since
Inception | |
Class A Shares at NAV | | | 0.21% | | | | 15.09% | |
Class A Shares at maximum Offering Price | | | (5.56)% | | | | 12.04% | |
Russell 1000® Index | | | 0.40% | | | | 11.26% | |
Lipper Large-Cap Core Funds Classification Average | | | (0.93)% | | | | 9.64% | |
| | |
Class C Shares | | | (0.53)% | | | | 14.22% | |
Class I Shares | | | 0.47% | | | | 15.36% | |
Average Annual Total Returns as of September 30, 2015 (Most Recent Calendar Quarter)
| | | | | | | | |
| | | Average Annual | |
| | | 1-Year | | | Since
Inception | |
Class A Shares at NAV | | | (0.40)% | | | | 12.78% | |
Class A Shares at maximum Offering Price | | | (6.13)% | | | | 9.90% | |
Class C Shares | | | (1.12)% | | | | 11.94% | |
Class I Shares | | | (0.17)% | | | | 13.05% | |
Since inception returns are from 6/17/13. Indexes and Lipper averages are not available for direct investment.
Class A Shares have a maximum 5.75% sales charge (Offering Price). Class A Share purchases of $1 million or more are sold at net asset value without an up-front sales charge but may be subject to a contingent deferred sales charge (CDSC), also known as a back-end sales charge, if redeemed within twelve months of purchase. Class C Shares have a 1% CDSC for redemptions within less than twelve months, which is not reflected in the one-year total return. Class I Shares have no sales charge and may be purchased under limited circumstances or by specified classes of investors.
Expense Ratios as of Most Recent Prospectus
| | | | | | | | | | | | |
| | | Share Class | |
| | | Class A | | | Class C | | | Class I | |
Gross Expense Ratios | | | 1.85% | | | | 2.65% | | | | 1.71% | |
Net Expense Ratios | | | 1.22% | | | | 1.97% | | | | 0.97% | |
The Fund’s investment adviser has agreed to waive fees and/or reimburse expenses through December 31, 2016 so that total annual Fund operating expenses (excluding 12b-1 distribution and/or service fees, interest expenses, taxes, acquired fund fees and expenses, fees incurred in acquiring and disposing of portfolio securities and extraordinary expenses) do not exceed 1.00% of the average daily net assets of any class of Fund shares. The expense limitation expiring December 31, 2016 may be terminated or modified prior to that date only with the approval of the Board of Trustees of the Fund.
Growth of an Assumed $10,000 Investment as of August 31, 2015 – Class A Shares
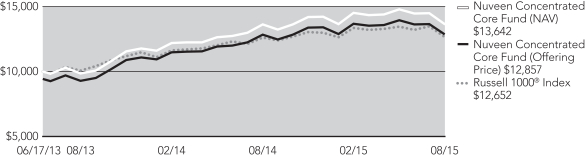
The graphs do not reflect the deduction of taxes that a shareholder may pay on Fund distributions or the redemption of Fund shares.
Fund Performance and Expense Ratios (continued)
Nuveen Core Dividend Fund
Refer to the first page of this Fund Performance and Expense Ratios section for further explanation of the information included within this section. Refer to Glossary of Terms Used in this Report for definitions of terms used within this section.
Fund Performance
Average Annual Total Returns as of August 31, 2015
| | | | | | | | |
| | | Average Annual | |
| | | 1-Year | | | Since
Inception | |
Class A Shares at NAV | | | (2.82)% | | | | 12.16% | |
Class A Shares at maximum Offering Price | | | (8.40)% | | | | 9.19% | |
Russell 1000® Index | | | 0.40% | | | | 11.26% | |
Lipper Equity Income Funds Classification Average | | | (4.24)% | | | | 6.64% | |
| | |
Class C Shares | | | (3.55)% | | | | 11.31% | |
Class I Shares | | | (2.57)% | | | | 12.43% | |
Average Annual Total Returns as of September 30, 2015 (Most Recent Calendar Quarter)
| | | | | | | | |
| | | Average Annual | |
| | | 1-Year | | | Since
Inception | |
Class A Shares at NAV | | | (3.51)% | | | | 9.94% | |
Class A Shares at maximum Offering Price | | | (9.05)% | | | | 7.13% | |
Class C Shares | | | (4.24)% | | | | 9.11% | |
Class I Shares | | | (3.26)% | | | | 10.19% | |
Since inception returns are from 6/17/13. Indexes and Lipper averages are not available for direct investment.
Class A Shares have a maximum 5.75% sales charge (Offering Price). Class A Share purchases of $1 million or more are sold at net asset value without an up-front sales charge but may be subject to a contingent deferred sales charge (CDSC), also known as a back-end sales charge, if redeemed within twelve months of purchase. Class C Shares have a 1% CDSC for redemptions within less than twelve months, which is not reflected in the one-year total return. Class I Shares have no sales charge and may be purchased under limited circumstances or by specified classes of investors.
Expense Ratios as of Most Recent Prospectus
| | | | | | | | | | | | |
| | | Share Class | |
| | | Class A | | | Class C | | | Class I | |
Gross Expense Ratios | | | 1.76% | | | | 2.54% | | | | 1.58% | |
Net Expense Ratios | | | 1.17% | | | | 1.92% | | | | 0.92% | |
The Fund’s investment adviser has agreed to waive fees and/or reimburse expenses through December 31, 2016 so that total annual Fund operating expenses (excluding 12b-1 distribution and/or service fees, interest expenses, taxes, acquired fund fees and expenses, fees incurred in acquiring and disposing of portfolio securities and extraordinary expenses) do not exceed 0.95% of the average daily net assets of any class of Fund shares. The expense limitation expiring December 31, 2016 may be terminated or modified prior to that date only with the approval of the Board of Trustees of the Fund.
Growth of an Assumed $10,000 Investment as of August 31, 2015 – Class A Shares
The graphs do not reflect the deduction of taxes that a shareholder may pay on Fund distributions or the redemption of Fund shares.
Fund Performance and Expense Ratios (continued)
Nuveen Equity Long/Short Fund
Refer to the first page of this Fund Performance and Expense Ratios section for further explanation of the information included within this section. Refer to Glossary of Terms Used in this Report for definitions of terms used within this section.
Fund Performance
Average Annual Total Returns as of August 31, 2015
| | | | | | | | | | | | |
| | | Average Annual | |
| | | 1-Year | | | 5-Year | | | Since
Inception | |
Class A Shares at NAV | | | 3.06% | | | | 12.00% | | | | 10.92% | |
Class A Shares at maximum Offering Price | | | (2.88)% | | | | 10.68% | | | | 9.94% | |
Russell 1000® Index | | | 0.40% | | | | 16.07% | | | | 15.59% | |
Lipper Long/Short Equity Funds Classification Average | | | (1.41)% | | | | 6.64% | | | | 7.47% | |
| | | |
Class C Shares | | | 2.28% | | | | 11.15% | | | | 10.09% | |
Class I Shares | | | 3.29% | | | | 12.28% | | | | 11.20% | |
Average Annual Total Returns as of September 30, 2015 (Most Recent Calendar Quarter)
| | | | | | | | | | | | |
| | | Average Annual | |
| | | 1-Year | | | 5-Year | | | Since
Inception | |
Class A Shares at NAV | | | 3.89% | | | | 10.02% | | | | 10.71% | |
Class A Shares at maximum Offering Price | | | (2.08)% | | | | 8.73% | | | | 9.74% | |
Class C Shares | | | 3.12% | | | | 9.20% | | | | 9.87% | |
Class I Shares | | | 4.15% | | | | 10.29% | | | | 10.98% | |
Since inception returns are from 12/30/08. Performance prior to March 1, 2013, reflects the Fund’s performance under the management of a sub-adviser using investment strategies that differed significantly from those currently in place. Indexes and Lipper averages are not available for direct investment.
Class A Shares have a maximum 5.75% sales charge (Offering Price). Class A Share purchases of $1 million or more are sold at net asset value without an up-front sales charge but may be subject to a contingent deferred sales charge (CDSC), also known as a back-end sales charge, if redeemed within twelve months of purchase. Class C Shares have a 1% CDSC for redemptions within less than twelve months, which is not reflected in the one-year total return. Class I Shares have no sales charge and may be purchased under limited circumstances or by specified classes of investors.
Expense Ratios as of Most Recent Prospectus
| | | | | | | | | | | | |
| | | Share Class | |
| | | Class A | | | Class C | | | Class I | |
Gross Expense Ratios | | | 4.24% | | | | 5.04% | | | | 4.20% | |
Net Expense Ratios | | | 3.46% | | | | 4.21% | | | | 3.27% | |
The Fund’s investment adviser has agreed to waive fees and/or reimburse expenses through December 31, 2016 so that total annual Fund operating expenses (excluding 12b-1 distribution and/or service fees, interest expenses, taxes, acquired fund fees and expenses, fees incurred in acquiring and disposing of portfolio securities (including prime broker fees and charges on short sales), dividend expense on securities sold short and extraordinary expenses) do not exceed 1.40% of the average daily net assets of any class of Fund shares. The expense limitation expiring December 31, 2016 may be terminated or modified prior to that date only with the approval of the Board of Trustees of the Fund.
Growth of an Assumed $10,000 Investment as of August 31, 2015 – Class A Shares
The graphs do not reflect the deduction of taxes that a shareholder may pay on Fund distributions or the redemption of Fund shares.
Fund Performance and Expense Ratios (continued)
Nuveen Equity Market Neutral Fund
Refer to the first page of this Fund Performance and Expense Ratios section for further explanation of the information included within this section. Refer to Glossary of Terms Used in this Report for definitions of terms used within this section.
Fund Performance
Average Annual Total Returns as of August 31, 2015
| | | | | | | | |
| | | Average Annual | |
| | | 1-Year | | | Since
Inception | |
Class A Shares at NAV | | | 0.86% | | | | 3.65% | |
Class A Shares at maximum Offering Price | | | (4.94)% | | | | 0.91% | |
BofA/Merrill Lynch 3-Month U.S. Treasury Bill Index | | | 0.03% | | | | 0.04% | |
Lipper Equity Market Neutral Funds Classification Average | | | (1.44)% | | | | 0.92% | |
| | |
Class C Shares | | | 0.10% | | | | 2.88% | |
Class I Shares | | | 1.09% | | | | 3.91% | |
Average Annual Total Returns as of September 30, 2015 (Most Recent Calendar Quarter)
| | | | | | | | |
| | | Average Annual | |
| | | 1-Year | | | Since
Inception | |
Class A Shares at NAV | | | 1.23% | | | | 3.90% | |
Class A Shares at maximum Offering Price | | | (4.59)% | | | | 1.25% | |
Class C Shares | | | 0.44% | | | | 3.12% | |
Class I Shares | | | 1.46% | | | | 4.15% | |
Since inception returns are from 6/17/13. Indexes and Lipper averages are not available for direct investment.
Class A Shares have a maximum 5.75% sales charge (Offering Price). Class A Share purchases of $1 million or more are sold at net asset value without an up-front sales charge but may be subject to a contingent deferred sales charge (CDSC), also known as a back-end sales charge, if redeemed within twelve months of purchase. Class C Shares have a 1% CDSC for redemptions within less than twelve months, which is not reflected in the one-year total return. Class I Shares have no sales charge and may be purchased under limited circumstances or by specified classes of investors.
Expense Ratios as of Most Recent Prospectus
| | | | | | | | | | | | |
| | | Share Class | |
| | | Class A | | | Class C | | | Class I | |
Gross Expense Ratios | | | 3.52% | | | | 4.28% | | | | 3.37% | |
Net Expense Ratios | | | 3.26% | | | | 4.02% | | | | 3.08% | |
The Fund’s investment adviser has agreed to waive fees and/or reimburse expenses through December 31, 2016 so that total annual Fund operating expenses (excluding 12b-1 distribution and/or service fees, interest expenses, taxes, acquired fund fees and expenses, fees incurred in acquiring and disposing of portfolio securities (including prime broker fees and charges on short sales), dividend expense on securities sold short and extraordinary expenses) do not exceed 1.40% of the average daily net assets of any class of Fund shares. The expense limitation expiring December 31, 2016 may be terminated or modified prior to that date only with the approval of the Board of Trustees of the Fund.
Growth of an Assumed $10,000 Investment as of August 31, 2015 – Class A Shares
The graphs do not reflect the deduction of taxes that a shareholder may pay on Fund distributions or the redemption of Fund shares.
Fund Performance and Expense Ratios (continued)
Nuveen Growth Fund
Refer to the first page of this Fund Performance and Expense Ratios section for further explanation of the information included within this section. Refer to Glossary of Terms Used in this Report for definitions of terms used within this section.
Fund Performance
Average Annual Total Returns as of August 31, 2015
| | | | | | | | | | | | |
| | | Average Annual | |
| | | 1-Year | | | 5-Year | | | Since
Inception | |
Class A Shares at NAV | | | 3.40% | | | | 14.52% | | | | 5.26% | |
Class A Shares at maximum Offering Price | | | (2.55)% | | | | 13.18% | | | | 4.60% | |
Russell 1000® Growth Index | | | 4.26% | | | | 17.40% | | | | 8.26% | |
Lipper Multi-Cap Growth Funds Classification Average | | | 3.63% | | | | 16.12% | | | | 7.28% | |
| | | |
Class C Shares | | | 2.62% | | | | 13.67% | | | | 4.47% | |
Class R3 Shares | | | 3.14% | | | | 14.22% | | | | 16.59% | |
Class I Shares | | | 3.67% | | | | 14.81% | | | | 5.53% | |
Average Annual Total Returns as of September 30, 2015 (Most Recent Calendar Quarter)
| | | | | | | | | | | | |
| | | Average Annual | |
| | | 1-Year | | | 5-Year | | | Since
Inception | |
Class A Shares at NAV | | | 2.55% | | | | 12.09% | | | | 4.98% | |
Class A Shares at maximum Offering Price | | | (3.36)% | | | | 10.77% | | | | 4.32% | |
Class C Shares | | | 1.81% | | | | 11.27% | | | | 4.19% | |
Class R3 Shares | | | 2.32% | | | | 11.80% | | | | 15.99% | |
Class I Shares | | | 2.84% | | | | 12.39% | | | | 5.25% | |
Since inception returns for Class A, C and I Shares, and for the comparative index and Lipper classification average, are from 3/28/06. Since inception returns for Class R3 Shares are from 3/03/09. Indexes and Lipper averages are not available for direct investment.
Class A Shares have a maximum 5.75% sales charge (Offering Price). Class A Share purchases of $1 million or more are sold at net asset value without an up-front sales charge but may be subject to a contingent deferred sales charge (CDSC), also known as a back-end sales charge, if redeemed within twelve months of purchase. Class C Shares have a 1% CDSC for redemptions within less than twelve months, which is not reflected in the one-year total return. Class R3 Shares have no sales charge and are available for purchase by eligible retirement plans. Class I Shares have no sales charge and may be purchased under limited circumstances or by specified classes of investors.
Expense Ratios as of Most Recent Prospectus
| | | | | | | | | | | | | | | | |
| | | Share Class | |
| | | Class A | | | Class C | | | Class R3 | | | Class I | |
Gross Expense Ratios | | | 1.45% | | | | 2.21% | | | | 1.70% | | | | 1.20% | |
Net Expense Ratios | | | 1.22% | | | | 1.97% | | | | 1.47% | | | | 0.97% | |
The Fund’s investment adviser has agreed to waive fees and/or reimburse expenses through September 30, 2016 so that total annual Fund operating expenses (excluding 12b-1 distribution and/or service fees, interest expenses, taxes, acquired fund fees and expenses, fees incurred in acquiring and disposing of portfolio securities and extraordinary expenses) do not exceed 1.00% (1.40% after September 30, 2016) of the average daily net assets of any class of Fund shares. The expense limitation expiring September 30, 2016 may be terminated or modified prior to that date only with the approval of the Board of Trustees of the Fund. The expense limitation in effect thereafter may be terminated or modified only with the approval of shareholders of the Fund.
Growth of an Assumed $10,000 Investment as of August 31, 2015 – Class A Shares
The graphs do not reflect the deduction of taxes that a shareholder may pay on Fund distributions or the redemption of Fund shares.
Fund Performance and Expense Ratios (continued)
Nuveen Large Cap Core Fund
Refer to the first page of this Fund Performance and Expense Ratios section for further explanation of the information included within this section. Refer to Glossary of Terms Used in this Report for definitions of terms used within this section.
Fund Performance
Average Annual Total Returns as of August 31, 2015
| | | | | | | | |
| | | Average Annual | |
| | | 1-Year | | | Since
Inception | |
Class A Shares at NAV | | | (1.76)% | | | | 13.97% | |
Class A Shares at maximum Offering Price | | | (7.41)% | | | | 10.96% | |
Russell 1000® Index | | | 0.40% | | | | 11.26% | |
Lipper Large-Cap Core Funds Classification Average | | | (0.93)% | | | | 9.64% | |
| | |
Class C Shares | | | (2.47)% | | | | 13.13% | |
Class I Shares | | | (1.49)% | | | | 14.25% | |
Average Annual Total Returns as of September 30, 2015 (Most Recent Calendar Quarter)
| | | | | | | | |
| | | Average Annual | |
| | | 1-Year | | | Since
Inception | |
Class A Shares at NAV | | | (3.07)% | | | | 11.58% | |
Class A Shares at maximum Offering Price | | | (8.65)% | | | | 8.74% | |
Class C Shares | | | (3.81)% | | | | 10.74% | |
Class I Shares | | | (2.81)% | | | | 11.85% | |
Since inception returns are from 6/17/13. Indexes and Lipper averages are not available for direct investment.
Class A Shares have a maximum 5.75% sales charge (Offering Price). Class A Share purchases of $1 million or more are sold at net asset value without an up-front sales charge but may be subject to a contingent deferred sales charge (CDSC), also known as a back-end sales charge, if redeemed within twelve months of purchase. Class C Shares have a 1% CDSC for redemptions within less than twelve months, which is not reflected in the one-year total return. Class I Shares have no sales charge and may be purchased under limited circumstances or by specified classes of investors.
Expense Ratios as of Most Recent Prospectus
| | | | | | | | | | | | |
| | | Share Class | |
| | | Class A | | | Class C | | | Class I | |
Gross Expense Ratios | | | 1.26% | | | | 1.99% | | | | 1.01% | |
Net Expense Ratios | | | 1.17% | | | | 1.92% | | | | 0.92% | |
The Fund’s investment adviser has agreed to waive fees and/or reimburse expenses through December 31, 2016 so that total annual Fund operating expenses (excluding 12b-1 distribution and/or service fees, interest expenses, taxes, acquired fund fees and expenses, fees incurred in acquiring and disposing of portfolio securities and extraordinary expenses) do not exceed 0.95% of the average daily net assets of any class of Fund shares. The expense limitation expiring December 31, 2016 may be terminated or modified prior to that date only with the approval of the Board of Trustees of the Fund.
Growth of an Assumed $10,000 Investment as of August 31, 2015 – Class A Shares
The graphs do not reflect the deduction of taxes that a shareholder may pay on Fund distributions or the redemption of Fund shares.
Fund Performance and Expense Ratios (continued)
Nuveen Large Cap Core Plus Fund
Refer to the first page of this Fund Performance and Expense Ratios section for further explanation of the information included within this section. Refer to Glossary of Terms Used in this Report for definitions of terms used within this section.
Fund Performance
Average Annual Total Returns as of August 31, 2015
| | | | | | | | |
| | | Average Annual | |
| | | 1-Year | | | Since
Inception | |
Class A Shares at NAV | | | (1.99)% | | | | 13.42% | |
Class A Shares at maximum Offering Price | | | (7.62)% | | | | 10.41% | |
Russell 1000® Index | | | 0.40% | | | | 11.26% | |
Lipper Large-Cap Core Funds Classification Average | | | (0.93)% | | | | 9.64% | |
| | |
Class C Shares | | | (2.70)% | | | | 12.61% | |
Class I Shares | | | (1.76)% | | | | 13.71% | |
Average Annual Total Returns as of September 30, 2015 (Most Recent Calendar Quarter)
| | | | | | | | |
| | | Average Annual | |
| | | 1-Year | | | Since
Inception | |
Class A Shares at NAV | | | (2.98)% | | | | 11.15% | |
Class A Shares at maximum Offering Price | | | (8.56)% | | | | 8.32% | |
Class C Shares | | | (3.69)% | | | | 10.36% | |
Class I Shares | | | (2.75)% | | | | 11.44% | |
Since inception returns are from 6/17/13. Indexes and Lipper averages are not available for direct investment.
Class A Shares have a maximum 5.75% sales charge (Offering Price). Class A Share purchases of $1 million or more are sold at net asset value without an up-front sales charge but may be subject to a contingent deferred sales charge (CDSC), also known as a back-end sales charge, if redeemed within twelve months of purchase. Class C Shares have a 1% CDSC for redemptions within less than twelve months, which is not reflected in the one-year total return. Class I Shares have no sales charge and may be purchased under limited circumstances or by specified classes of investors.
Expense Ratios as of Most Recent Prospectus
| | | | | | | | | | | | |
| | | Share Class | |
| | | Class A | | | Class C | | | Class I | |
Gross Expense Ratios | | | 2.55% | | | | 3.28% | | | | 2.33% | |
Net Expense Ratios | | | 2.28% | | | | 3.03% | | | | 2.06% | |
The Fund’s investment adviser has agreed to waive fees and/or reimburse expenses through December 31, 2016 so that total annual Fund operating expenses (excluding 12b-1 distribution and/or service fees, interest expenses, taxes, acquired fund fees and expenses, fees incurred in acquiring and disposing of portfolio securities (including prime broker fees and charges on short sales), dividend expense on securities sold short, and extraordinary expenses) do not exceed 1.25% of the average daily net assets of any class of Fund shares. The expense limitation expiring December 31, 2016 may be terminated or modified prior to that date only with the approval of the Board of Trustees of the Fund.
Growth of an Assumed $10,000 Investment as of August 31, 2015 – Class A Shares
The graphs do not reflect the deduction of taxes that a shareholder may pay on Fund distributions or the redemption of Fund shares.
Fund Performance and Expense Ratios (continued)
Nuveen Large Cap Growth Fund
Refer to the first page of this Fund Performance and Expense Ratios section for further explanation of the information included within this section. Refer to Glossary of Terms Used in this Report for definitions of terms used within this section.
Fund Performance
Average Annual Total Returns as of August 31, 2015
| | | | | | | | |
| | | Average Annual | |
| | | 1-Year | | | Since
Inception | |
Class A Shares at NAV | | | 0.00% | | | | 14.29% | |
Class A Shares at maximum Offering Price | | | (5.75)% | | | | 11.26% | |
Russell 1000® Growth Index | | | 4.26% | | | | 13.95% | |
Lipper Large-Cap Growth Funds Classification Average | | | 3.63% | | | | 13.94% | |
| | |
Class C Shares | | | (0.74)% | | | | 13.45% | |
Class I Shares | | | 0.28% | | | | 14.57% | |
Average Annual Total Returns as of September 30, 2015 (Most Recent Calendar Quarter)
| | | | | | | | |
| | | Average Annual | |
| | | 1-Year | | | Since
Inception | |
Class A Shares at NAV | | | (0.74)% | | | | 12.22% | |
Class A Shares at maximum Offering Price | | | (6.45)% | | | | 9.35% | |
Class C Shares | | | (1.43)% | | | | 11.40% | |
Class I Shares | | | (0.47)% | | | | 12.49% | |
Since inception returns are from 6/17/13. Indexes and Lipper averages are not available for direct investment.
Class A Shares have a maximum 5.75% sales charge (Offering Price). Class A Share purchases of $1 million or more are sold at net asset value without an up-front sales charge but may be subject to a contingent deferred sales charge (CDSC), also known as a back-end sales charge, if redeemed within twelve months of purchase. Class C Shares have a 1% CDSC for redemptions within less than twelve months, which is not reflected in the one-year total return. Class I Shares have no sales charge and may be purchased under limited circumstances or by specified classes of investors.
Expense Ratios as of Most Recent Prospectus
| | | | | | | | | | | | |
| | | Share Class | |
| | | Class A | | | Class C | | | Class I | |
Gross Expense Ratios | | | 1.35% | | | | 2.11% | | | | 1.10% | |
Net Expense Ratios | | | 1.17% | | | | 1.92% | | | | 0.92% | |
The Fund’s investment adviser has agreed to waive fees and/or reimburse expenses through December 31, 2016 so that total annual Fund operating expenses (excluding 12b-1 distribution and/or service fees, interest expenses, taxes, acquired fund fees and expenses, fees incurred in acquiring and disposing of portfolio securities and extraordinary expenses) do not exceed 0.95% of the average daily net assets of any class of Fund shares. The expense limitation expiring December 31, 2016 may be terminated or modified prior to that date only with the approval of the Board of Trustees of the Fund.
Growth of an Assumed $10,000 Investment as of August 31, 2015 – Class A Shares
The graphs do not reflect the deduction of taxes that a shareholder may pay on Fund distributions or the redemption of Fund shares.
Fund Performance and Expense Ratios (continued)
Nuveen Large Cap Value Fund
Refer to the first page of this Fund Performance and Expense Ratios section for further explanation of the information included within this section. Refer to Glossary of Terms Used in this Report for definitions of terms used within this section.
Fund Performance
Average Annual Total Returns as of August 31, 2015
| | | | | | | | | | | | |
| | | Average Annual | |
| | | 1-Year | | | 5-Year | | | 10-Year | |
Class A Shares at NAV | | | (5.75)% | | | | 14.12% | | | | 6.56% | |
Class A Shares at maximum Offering Price | | | (11.17)% | | | | 12.77% | | | | 5.93% | |
Russell 1000® Value Index | | | (3.48)% | | | | 14.68% | | | | 6.18% | |
Lipper Large-Cap Value Funds Classification Average | | | (4.07)% | | | | 13.61% | | | | 5.74% | |
| | | |
Class C Shares | | | (6.45)% | | | | 13.27% | | | | 5.76% | |
Class I Shares | | | (5.52)% | | | | 14.40% | | | | 6.82% | |
| | | | | | | | | | | | |
| | | Average Annual | |
| | | 1-Year | | | 5-Year | | | Since
Inception | |
Class R3 Shares | | | (5.99)% | | | | 13.83% | | | | 6.94% | |
Average Annual Total Returns as of September 30, 2015 (Most Recent Calendar Quarter)
| | | | | | | | | | | | |
| | | Average Annual | |
| | | 1-Year | | | 5-Year | | | 10-Year | |
Class A Shares at NAV | | | (7.23)% | | | | 11.24% | | | | 5.88% | |
Class A Shares at maximum Offering Price | | | (12.56)% | | | | 9.93% | | | | 5.25% | |
Class C Shares | | | (7.93)% | | | | 10.41% | | | | 5.09% | |
Class I Shares | | | (6.98)% | | | | 11.52% | | | | 6.14% | |
| | | | | | | | | | | | |
| | | Average Annual | |
| | | 1-Year | | | 5-Year | | | Since
Inception | |
Class R3 Shares | | | (7.46)% | | | | 10.96% | | | | 6.18% | |
Since inception returns for Class R3 Shares are from 8/04/08. Performance prior to June 24, 2013, reflects the Fund’s performance under the management of multiple sub-advisers using investment strategies that differed significantly from those currently in place. Indexes and Lipper averages are not available for direct investment.
Class A Shares have a maximum 5.75% sales charge (Offering Price). Class A Share purchases of $1 million or more are sold at net asset value without an up-front sales charge but may be subject to a contingent deferred sales charge (CDSC), also known as a back-end sales charge, if redeemed within twelve months of purchase. Class C Shares have a 1% CDSC for redemptions within less than twelve months, which is not reflected in the one-year total return. Class R3 Shares have no sales charge and are only available for purchase by eligible retirement plans. Class I Shares have no sales charge and may be purchased under limited circumstances or by specified classes of investors.
Expense Ratios as of Most Recent Prospectus
| | | | | | | | | | | | | | | | |
| | | Share Class | |
| | | Class A | | | Class C | | | Class R3 | | | Class I | |
Expense Ratios | | | 1.11% | | | | 1.86% | | | | 1.36% | | | | 0.86% | |
Growth of an Assumed $10,000 Investment as of August 31, 2015 – Class A Shares
The graphs do not reflect the deduction of taxes that a shareholder may pay on Fund distributions or the redemption of Fund shares.
Holding
Summaries as of August 31, 2015
This data relates to the securities held in each Fund’s portfolio of investments as of the end of the reporting period. It should not be construed as a measure of performance for the Fund itself. Holdings are subject to change.
Nuveen Concentrated Core Fund
Fund Allocation
(% of net assets)
| | | | |
Common Stocks | | | 100.2% | |
Other Assets Less Liabilities | | | (0.2)% | |
Net Assets | | | 100% | |
Portfolio Composition
(% of net assets)
| | | | |
Health Care Providers & Services | | | 20.3% | |
Technology Hardware, Storage & Peripherals | | | 10.6% | |
Biotechnology | | | 9.9% | |
Diversified Telecommunication Services | | | 9.1% | |
Auto Components | | | 5.2% | |
Machinery | | | 5.1% | |
Multiline Retail | | | 5.1% | |
Specialty Retail | | | 5.1% | |
Food Products | | | 5.1% | |
Banks | | | 5.0% | |
Other | | | 19.7% | |
Other Assets Less Liabilities | | | (0.2)% | |
Net Assets | | | 100% | |
Top Five Common Stock Holdings
(% of net assets)
| | | | |
Hewlett-Packard Company | | | 5.3% | |
Apple, Inc. | | | 5.3% | |
Delphi Automotive PLC | | | 5.2% | |
Cardinal Health, Inc. | | | 5.2% | |
UnitedHealth Group Incorporated | | | 5.2% | |
Nuveen Core Dividend Fund
Fund Allocation
(% of net assets)
| | | | |
Common Stocks | | | 99.5% | |
Other Assets Less Liabilities | | | 0.5% | |
Net Assets | | | 100% | |
Portfolio Composition
(% of net assets)
| | | | |
Health Care Providers & Services | | | 7.4% | |
Technology Hardware, Storage & Peripherals | | | 7.3% | |
Specialty Retail | | | 6.9% | |
Pharmaceuticals | | | 4.2% | |
IT Services | | | 4.0% | |
Aerospace & Defense | | | 3.9% | |
Energy Equipment & Services | | | 3.8% | |
Semiconductors & Semiconductor Equipment | | | 3.8% | |
Capital Markets | | | 3.8% | |
Media | | | 3.5% | |
Diversified Telecommunication Services | | | 3.5% | |
Multiline Retail | | | 3.3% | |
Software | | | 3.3% | |
Biotechnology | | | 3.3% | |
Communications Equipment | | | 2.6% | |
Beverages | | | 2.6% | |
Hotels, Restaurants & Leisure | | | 2.6% | |
Oil, Gas & Consumable Fuels | | | 2.5% | |
Machinery | | | 2.5% | |
Automobiles | | | 2.3% | |
Real Estate Investment Trust | | | 2.1% | |
Banks | | | 1.7% | |
Other | | | 18.6% | |
Other Assets Less Liabilities | | | 0.5% | |
Net Assets | | | 100% | |
Top Five Common Stock Holdings
(% of net assets)
| | | | |
Apple, Inc. | | | 4.2% | |
Microsoft Corporation | | | 2.7% | |
Pfizer Inc. | | | 1.8% | |
Merck & Company Inc. | | | 1.8% | |
Verizon Communications Inc. | | | 1.8% | |
Holding Summaries as of August 31, 2015 (continued)
Nuveen Equity Long/Short Fund
Fund Allocation
(% of net assets)
| | | | |
Long-Term Investments | | | | |
Common Stocks | | | 158.9% | |
Total Long Exposure | | | 158.9% | |
Repurchase Agreements | | | 4.4% | |
Total Investments | | | 163.3% | |
Securities Sold Short | | | | |
Common Stocks | | | (80.1)% | |
Total Short Exposure | | | (80.1)% | |
Other Assets Less Liabilities | | | 16.8% | |
Net Assets | | | 100% | |
Top Five Holdings
(Long Exposure)
(% of net assets)
| | | | |
Apple, Inc. | | | 3.6% | |
Microsoft Corporation | | | 2.3% | |
Johnson & Johnson | | | 2.0% | |
JPMorgan Chase & Co. | | | 1.9% | |
Home Depot, Inc. | | | 1.8% | |
Top Five Holdings
(Short Exposure)
(% of net assets)
| | | | |
JM Smucker Company | | | (0.9)% | |
Martin Marietta Materials | | | (0.9)% | |
Hanesbrands Inc. | | | (0.9)% | |
CONSOL Energy Inc. | | | (0.9)% | |
ONEOK, Inc. | | | (0.9)% | |
Portfolio Composition –
Long Exposure
(% of net assets)
| | | | |
Health Care Providers & Services | | | 10.5% | |
Software | | | 10.5% | |
Machinery | | | 8.1% | |
Media | | | 7.6% | |
Insurance | | | 7.1% | |
Specialty Retail | | | 6.7% | |
Technology Hardware, Storage & Peripherals | | | 6.4% | |
IT Services | | | 6.3% | |
Aerospace & Defense | | | 6.1% | |
Hotels, Restaurants & Leisure | | | 5.2% | |
Containers & Packaging | | | 4.7% | |
Banks | | | 4.6% | |
Biotechnology | | | 4.4% | |
Semiconductors & Semiconductor Equipment | | | 4.2% | |
Chemicals | | | 3.8% | |
Communications Equipment | | | 3.7% | |
Food Products | | | 3.7% | |
Metals & Mining | | | 3.6% | |
Multiline Retail | | | 3.6% | |
Oil, Gas & Consumable Fuels | | | 3.5% | |
Beverages | | | 2.9% | |
Textiles, Apparel & Luxury Goods | | | 2.6% | |
Internet Software & Services | | | 2.5% | |
Electric Utilities | | | 2.5% | |
Household Durables | | | 2.5% | |
Air Freight & Logistics | | | 2.5% | |
Professional Services | | | 2.4% | |
Diversified Financial Services | | | 2.3% | |
Construction & Engineering | | | 2.2% | |
Pharmaceuticals | | | 2.0% | |
Diversified Telecommunication Services | | | 2.0% | |
Other | | | 18.2% | |
Total | | | 158.9% | |
Portfolio Composition –
Short Exposure
(% of net assets)
| | | | |
Oil, Gas & Consumable Fuels | | | (7.5)% | |
Chemicals | | | (6.4)% | |
Software | | | (4.3)% | |
Food Products | | | (3.5)% | |
Household Durables | | | (3.4)% | |
Beverages | | | (3.2)% | |
Construction Materials | | | (2.6)% | |
Semiconductors & Semiconductor Equipment | | | (2.6)% | |
Textiles, Apparel & Luxury Goods | | | (2.6)% | |
Machinery | | | (2.5)% | |
Aerospace & Defense | | | (2.5)% | |
Road & Rail | | | (2.5)% | |
Specialty Retail | | | (2.4)% | |
Health Care Equipment & Supplies | | | (2.4)% | |
Metals & Mining | | | (1.8)% | |
Health Care Providers & Services | | | (1.7)% | |
Electric Utilities | | | (1.6)% | |
Trading Companies & Distributors | | | (1.6)% | |
Commercial Services & Supplies | | | (1.6)% | |
Electronic Equipment, Instruments & Components | | | (1.6)% | |
Multi-Utilities | | | (1.5)% | |
Hotels, Restaurants & Leisure | | | (1.5)% | |
Other | | | (18.8)% | |
Total | | | (80.1)% | |
Nuveen Equity Market Neutral Fund
Fund Allocation
(% of net assets)
| | | | |
Long-Term Investments | | | | |
Common Stocks | | | 93.8% | |
Total Long Exposure | | | 93.8% | |
Repurchase Agreements | | | 14.1% | |
Total Investments | | | 107.9% | |
Securities Sold Short | | | | |
Common Stocks | | | (77.5)% | |
Total Short Exposure | | | (77.5)% | |
Other Assets Less Liabilities | | | 69.6% | |
Net Assets | | | 100% | |
Top Five Holdings
(Long Exposure)
(% of net assets)
| | | | |
Best Buy Co | | | 1.1% | |
Apple, Inc. | | | 1.1% | |
Huntington Ingalls Industries Inc. | | | 1.1% | |
Lazard Limited | | | 1.1% | |
Jabil Circuit Inc. | | | 1.1% | |
Top Five Holdings
(Short Exposure)
(% of net assets)
| | | | |
Hertz Global Holdings Inc. | | | (0.9)% | |
Cypress Semiconductor Corporation | | | (0.9)% | |
Energen Corporation | | | (0.9)% | |
Southern Copper Corporation | | | (0.9)% | |
JM Smucker Company | | | (0.9)% | |
Portfolio Composition –
Long Exposure
(% of net assets)
| | | | |
Specialty Retail | | | 7.7% | |
Health Care Providers & Services | | | 7.3% | |
Aerospace & Defense | | | 5.1% | |
Machinery | | | 4.5% | |
Media | | | 4.3% | |
Software | | | 3.9% | |
IT Services | | | 3.8% | |
Multiline Retail | | | 3.5% | |
Technology Hardware, Storage & Peripherals | | | 3.5% | |
Oil, Gas & Consumable Fuels | | | 3.3% | |
Capital Markets | | | 3.0% | |
Insurance | | | 2.8% | |
Internet Software & Services | | | 2.8% | |
Semiconductors & Semiconductor Equipment | | | 2.7% | |
Electronic Equipment, Instruments & Components | | | 2.6% | |
Auto Components | | | 2.5% | |
Biotechnology | | | 2.5% | |
Communications Equipment | | | 2.3% | |
Banks | | | 1.9% | |
Diversified Telecommunication Services | | | 1.8% | |
Energy Equipment & Services | | | 1.8% | |
Food Products | | | 1.7% | |
Other | | | 18.5% | |
Total | | | 93.8% | |
Portfolio Composition –
Short Exposure
(% of net assets)
| | | | |
Oil, Gas & Consumable Fuels | | | (8.6)% | |
Chemicals | | | (5.9)% | |
Semiconductors & Semiconductor Equipment | | | (4.9)% | |
Household Durables | | | (3.8)% | |
Software | | | (3.6)% | |
Multi-Utilities | | | (3.2)% | |
Specialty Retail | | | (3.1)% | |
Aerospace & Defense | | | (3.1)% | |
Internet Software & Services | | | (3.0)% | |
Food Products | | | (2.7)% | |
Hotels, Restaurants & Leisure | | | (2.4)% | |
Health Care Providers & Services | | | (2.3)% | |
Machinery | | | (1.7)% | |
Construction Materials | | | (1.7)% | |
Electronic Equipment, Instruments & Components | | | (1.7)% | |
Metals & Mining | | | (1.6)% | |
Energy Equipment & Services | | | (1.6)% | |
Beverages | | | (1.6)% | |
Communications Equipment | | | (1.5)% | |
Other | | | (19.5)% | |
Total | | | (77.5)% | |
Holding Summaries as of August 31, 2015 (continued)
Nuveen Growth Fund
Fund Allocation
(% of net assets)
| | | | |
Common Stocks | | | 98.2% | |
Repurchases Agreements | | | 1.3% | |
Other Assets Less Liabilities | | | 0.5% | |
Net Assets | | | 100% | |
Portfolio Composition
(% of net assets)
| | | | |
Health Care Providers & Services | | | 13.0% | |
Software | | | 8.8% | |
IT Services | | | 8.2% | |
Beverages | | | 7.6% | |
Media | | | 7.3% | |
Technology Hardware, Storage & Peripherals | | | 7.1% | |
Specialty Retail | | | 6.5% | |
Biotechnology | | | 6.2% | |
Aerospace & Defense | | | 4.6% | |
Food & Staples Retailing | | | 4.1% | |
Diversified Telecommunication Services | | | 3.5% | |
Containers & Packaging | | | 3.3% | |
Other | | | 18.0% | |
Repurchase Agreements | | | 1.3% | |
Other Assets Less Liabilities | | | 0.5% | |
Net Assets | | | 100% | |
Top Five Common Stock Holdings
(% of net assets)
| | | | |
Apple, Inc. | | | 5.3% | |
Home Depot, Inc. | | | 5.1% | |
Microsoft Corporation | | | 4.1% | |
PepsiCo, Inc. | | | 3.7% | |
Amgen Inc. | | | 3.0% | |
Nuveen Large Cap Core Fund
Fund Allocation
(% of net assets)
| | | | |
Common Stocks | | | 100.0% | |
Other Assets Less Liabilities | | | 0.0% | |
Net Assets | | | 100% | |
Portfolio Composition
(% of net assets)
| | | | |
Health Care Providers & Services | | | 9.4% | |
Technology Hardware, Storage & Peripherals | | | 7.3% | |
Specialty Retail | | | 6.4% | |
Media | | | 6.4% | |
Aerospace & Defense | | | 4.9% | |
Software | | | 4.9% | |
Biotechnology | | | 4.7% | |
Banks | | | 4.3% | |
Multiline Retail | | | 3.8% | |
Machinery | | | 3.8% | |
IT Services | | | 3.1% | |
Semiconductors & Semiconductor Equipment | | | 3.1% | |
Oil, Gas & Consumable Fuels | | | 3.0% | |
Food Products | | | 3.0% | |
Capital Markets | | | 2.9% | |
Insurance | | | 2.9% | |
Pharmaceuticals | | | 2.2% | |
Internet Software & Services | | | 2.2% | |
Auto Components | | | 2.1% | |
Other | | | 19.6% | |
Other Assets Less Liabilities | | | 0.0% | |
Net Assets | | | 100% | |
Top Five Common Stock Holdings
(% of net assets)
| | | | |
Apple, Inc. | | | 4.3% | |
JPMorgan Chase & Co. | | | 2.1% | |
Pfizer Inc. | | | 1.9% | |
Bank of America Corporation | | | 1.9% | |
Gilead Sciences, Inc. | | | 1.8% | |
Holding Summaries as of August 31, 2015 (continued)
Nuveen Large Cap Core Plus Fund
Fund Allocation
(% of net assets)
| | | | |
Long-Term Investments | | | | |
Common Stocks | | | 129.7% | |
Total Long Exposure | | | 129.7% | |
Securities Sold Short | | | | |
Common Stocks | | | (29.9)% | |
Total Short Exposure | | | (29.9)% | |
Other Assets Less Liabilities | | | 0.2% | |
Net Assets | | | 100% | |
Top Five Holdings
(Long Exposure)
(% of net assets)
| | | | |
Apple, Inc. | | | 5.5% | |
JPMorgan Chase & Co. | | | 2.9% | |
Bank of America Corporation | | | 2.4% | |
Home Depot, Inc. | | | 2.4% | |
Gilead Sciences, Inc. | | | 2.2% | |
Top Five Holdings
(Short Exposure)
(% of net assets)
| | | | |
Energen Corporation | | | (0.3)% | |
Anadarko Petroleum Corporation | | | (0.3)% | |
Occidental Petroleum Corporation | | | (0.3)% | |
Air Products & Chemicals Inc. | | | (0.3)% | |
Raytheon Company | | | (0.3)% | |
Portfolio Composition –
Long Exposure
(% of net assets)
| | | | |
Health Care Providers & Services | | | 12.3% | |
Technology Hardware, Storage & Peripherals | | | 9.8% | |
Specialty Retail | | | 9.6% | |
Aerospace & Defense | | | 7.2% | |
Media | | | 7.0% | |
Software | | | 6.5% | |
Biotechnology | | | 6.0% | |
Multiline Retail | | | 5.8% | |
Banks | | | 5.7% | |
IT Services | | | 5.6% | |
Semiconductors & Semiconductor Equipment | | | 4.9% | |
Machinery | | | 4.8% | |
Insurance | | | 4.2% | |
Oil, Gas & Consumable Fuels | | | 3.4% | |
Capital Markets | | | 3.0% | |
Electronic Equipment, Instruments & Components | | | 2.8% | |
Food Products | | | 2.8% | |
Diversified Telecommunication Services | | | 2.7% | |
Pharmaceuticals | | | 2.6% | |
Internet Software & Services | | | 2.3% | |
Hotels, Restaurants & Leisure | | | 2.3% | |
Other | | | 18.4% | |
Total | | | 129.7% | |
Portfolio Composition –
Short Exposure
(% of net assets)
| | | | |
Oil, Gas & Consumable Fuels | | | (4.5)% | |
Chemicals | | | (2.4)% | |
Internet Software & Services | | | (1.8)% | |
Semiconductors & Semiconductor Equipment | | | (1.3)% | |
Beverages | | | (1.2)% | |
Software | | | (1.1)% | |
Specialty Retail | | | (1.0)% | |
Capital Markets | | | (1.0)% | |
Multi-Utilities | | | (1.0)% | |
Household Durables | | | (0.9)% | |
Electronic Equipment, Instruments & Components | | | (0.8)% | |
Biotechnology | | | (0.8)% | |
Food Products | | | (0.8)% | |
Pharmaceuticals | | | (0.7)% | |
Aerospace & Defense | | | (0.6)% | |
Other | | | (10.0)% | |
Total | | | (29.9)% | |
Nuveen Large Cap Growth Fund
Fund Allocation
(% of net assets)
| | | | |
Common Stocks | | | 99.8% | |
Repurchase Agreements | | | 0.2% | |
Other Assets Less Liabilities | | | 0.0% | |
Net Assets | | | 100% | |
Portfolio Composition
(% of net assets)
| | | | |
Health Care Providers & Services | | | 9.1% | |
Media | | | 8.5% | |
Technology Hardware, Storage & Peripherals | | | 8.0% | |
Specialty Retail | | | 7.6% | |
Software | | | 7.4% | |
Biotechnology | | | 6.0% | |
IT Services | | | 5.9% | |
Multiline Retail | | | 5.0% | |
Aerospace & Defense | | | 4.7% | |
Internet Software & Services | | | 3.4% | |
Diversified Telecommunication Services | | | 3.2% | |
Machinery | | | 2.8% | |
Auto Components | | | 2.2% | |
Hotels, Restaurants & Leisure | | | 2.1% | |
Oil, Gas & Consumable Fuels | | | 1.9% | |
Communications Equipment | | | 1.8% | |
Food Products | | | 1.6% | |
Other | | | 18.6% | |
Repurchase Agreements | | | 0.2% | |
Other Assets Less Liabilities | | | 0.0% | |
Net Assets | | | 100% | |
Top Five Common Stock Holdings
(% of net assets)
| | | | |
Apple, Inc. | | | 7.3% | |
Microsoft Corporation | | | 2.7% | |
Home Depot, Inc. | | | 2.5% | |
Gilead Sciences, Inc. | | | 2.5% | |
Amgen Inc. | | | 2.1% | |
Holding Summaries as of August 31, 2015 (continued)
Nuveen Large Cap Value Fund
Fund Allocation
(% of net assets)
| | | | |
Common Stocks | | | 99.7% | |
Other Assets Less Liabilities | | | 0.3% | |
Net Assets | | | 100% | |
Portfolio Composition
(% of net assets)
| | | | |
Banks | | | 9.3% | |
Insurance | | | 8.8% | |
Health Care Providers & Services | | | 5.8% | |
Multiline Retail | | | 5.2% | |
Aerospace & Defense | | | 4.8% | |
Technology Hardware, Storage & Peripherals | | | 4.6% | |
Pharmaceuticals | | | 4.5% | |
Oil, Gas & Consumable Fuels | | | 4.1% | |
Machinery | | | 4.0% | |
Diversified Telecommunication Services | | | 3.6% | |
Semiconductors & Semiconductor Equipment | | | 3.4% | |
IT Services | | | 3.4% | |
Specialty Retail | | | 2.8% | |
Energy Equipment & Services | | | 2.7% | |
Communications Equipment | | | 2.5% | |
Food Products | | | 2.4% | |
Media | | | 2.1% | |
Food & Staples Retailing | | | 2.1% | |
Commercial Services & Supplies | | | 2.1% | |
Hotels, Restaurants & Leisure | | | 1.9% | |
Other | | | 19.6% | |
Other Assets Less Liabilities | | | 0.3% | |
Net Assets | | | 100% | |
Top Five Common Stock Holdings
(% of net assets)
| | | | |
JPMorgan Chase & Co. | | | 3.4% | |
Pfizer Inc. | | | 3.0% | |
Bank of America Corporation | | | 2.7% | |
Cisco Systems, Inc. | | | 2.4% | |
Intel Corporation | | | 2.3% | |
Expense
Examples
As a shareholder of one or more of the Funds, you incur two types of costs: (1) transaction costs, including up-front and back-end sales charges (loads) or redemption fees, where applicable; and (2) ongoing costs, including management fees; distribution and service (12b-1) fees, where applicable; and other Fund expenses. The Examples below are intended to help you understand your ongoing costs (in dollars) of investing in the Funds and to compare these costs with the ongoing costs of investing in other mutual funds.
The Examples below are based on an investment of $1,000 invested at the beginning of the period and held through the period ended August 31, 2015.
The beginning of the period is March 1, 2015.
The information under “Actual Performance,” together with the amount you invested, allows you to estimate actual expenses incurred over the reporting period. Simply divide your account value by $1,000 (for example, an $8,600 account value divided by $1,000 = 8.60) and multiply the result by the cost shown for your share class, in the row entitled “Expenses Incurred During Period” to estimate the expenses incurred on your account during this period.
The information under “Hypothetical Performance,” provides information about hypothetical account values and hypothetical expenses based on each Fund’s actual expense ratios and an assumed rate of return of 5% per year before expenses, which is not the Fund’s actual return. The hypothetical account values and expenses may not be used to estimate the actual ending account balance or expense you incurred for the period. You may use this information to compare the ongoing costs of investing in the Fund and other funds. To do so, compare this 5% hypothetical example with the 5% hypothetical examples that appear in the shareholder reports of the other funds.
Please note that the expenses shown in the table are meant to highlight your ongoing costs only and do not reflect any transaction costs. Therefore, the hypothetical information is useful in comparing ongoing costs only, and will not help you determine the relative total costs of owning different funds or share classes. In addition, if these transaction costs were included, your costs would have been higher.
Nuveen Concentrated Core Fund
| | | | | | | | | | | | |
| | | Share Class | |
| | | Class A | | | Class C | | | Class I | |
Actual Performance | | | | | | | | | | | | |
Beginning Account Value | | $ | 1,000.00 | | | $ | 1,000.00 | | | $ | 1,000.00 | |
Ending Account Value | | $ | 940.90 | | | $ | 937.40 | | | $ | 942.30 | |
Expenses Incurred During the Period | | $ | 5.92 | | | $ | 9.57 | | | $ | 4.70 | |
Hypothetical Performance (5% annualized return before expenses) | | | | | | | | | | | | |
Beginning Account Value | | $ | 1,000.00 | | | $ | 1,000.00 | | | $ | 1,000.00 | |
Ending Account Value | | $ | 1,019.11 | | | $ | 1,015.32 | | | $ | 1,020.37 | |
Expenses Incurred During the Period | | $ | 6.16 | | | $ | 9.96 | | | $ | 4.89 | |
For each class of the Fund, expenses are equal to the Fund’s annualized net expense ratio of 1.21%, 1.96% and 0.96% for Classes A, C and I, respectively, multiplied by the average account value over the period, multiplied by 184/365 (to reflect the one-half year period).
Expense Examples (continued)
Nuveen Core Dividend Fund
| | | | | | | | | | | | |
| | | Share Class | |
| | | Class A | | | Class C | | | Class I | |
Actual Performance | | | | | | | | | | | | |
Beginning Account Value | | $ | 1,000.00 | | | $ | 1,000.00 | | | $ | 1,000.00 | |
Ending Account Value | | $ | 913.80 | | | $ | 910.40 | | | $ | 915.30 | |
Expenses Incurred During the Period | | $ | 5.60 | | | $ | 9.20 | | | $ | 4.39 | |
Hypothetical Performance (5% annualized return before expenses) | | | | | | | | | | | | |
Beginning Account Value | | $ | 1,000.00 | | | $ | 1,000.00 | | | $ | 1,000.00 | |
Ending Account Value | | $ | 1,019.36 | | | $ | 1,015.58 | | | $ | 1,020.62 | |
Expenses Incurred During the Period | | $ | 5.90 | | | $ | 9.70 | | | $ | 4.63 | |
For each class of the Fund, expenses are equal to the Fund’s annualized net expense ratio of 1.16%, 1.91% and 0.91% for Classes A, C and I, respectively, multiplied by the average account value over the period, multiplied by 184/365 (to reflect the one-half year period).
Nuveen Equity Long/Short Fund
| | | | | | | | | | | | |
| | | Share Class | |
| | | Class A | | | Class C | | | Class I | |
Actual Performance | | | | | | | | | | | | |
Beginning Account Value | | $ | 1,000.00 | | | $ | 1,000.00 | | | $ | 1,000.00 | |
Ending Account Value | | $ | 967.40 | | | $ | 964.00 | | | $ | 968.50 | |
Expenses Incurred During the Period | | $ | 17.70 | | | $ | 21.44 | | | $ | 16.47 | |
Hypothetical Performance (5% annualized return before expenses) | | | | | | | | | | | | |
Beginning Account Value | | $ | 1,000.00 | | | $ | 1,000.00 | | | $ | 1,000.00 | |
Ending Account Value | | $ | 1,007.21 | | | $ | 1,003.38 | | | $ | 1,008.47 | |
Expenses Incurred During the Period | | $ | 18.06 | | | $ | 21.86 | | | $ | 16.81 | |
For each class of the Fund, expenses are equal to the Fund’s annualized net expense ratio of 3.57%, 4.33% and 3.32% for Classes A, C and I, respectively, multiplied by the average account value over the period, multiplied by 184/365 (to reflect the one-half year period).
Nuveen Equity Market Neutral Fund
| | | | | | | | | | | | |
| | | Share Class | |
| | | Class A | | | Class C | | | Class I | |
Actual Performance | | | | | | | | | | | | |
Beginning Account Value | | $ | 1,000.00 | | | $ | 1,000.00 | | | $ | 1,000.00 | |
Ending Account Value | | $ | 983.40 | | | $ | 979.50 | | | $ | 984.40 | |
Expenses Incurred During the Period | | $ | 16.95 | | | $ | 20.61 | | | $ | 15.71 | |
Hypothetical Performance (5% annualized return before expenses) | | | | | | | | | | | | |
Beginning Account Value | | $ | 1,000.00 | | | $ | 1,000.00 | | | $ | 1,000.00 | |
Ending Account Value | | $ | 1,008.12 | | | $ | 1,004.39 | | | $ | 1,009.38 | |
Expenses Incurred During the Period | | $ | 17.16 | | | $ | 20.87 | | | $ | 15.90 | |
For each class of the Fund, expenses are equal to the Fund’s annualized net expense ratio of 3.39%, 4.13% and 3.14% for Classes A, C and I, respectively, multiplied by the average account value over the period, multiplied by 184/365 (to reflect the one-half year period).
Nuveen Growth Fund
| | | | | | | | | | | | | | | | |
| | | Share Class | |
| | | Class A | | | Class C | | | Class R3 | | | Class I | |
Actual Performance | | | | | | | | | | | | | | | | |
Beginning Account Value | | $ | 1,000.00 | | | $ | 1,000.00 | | | $ | 1,000.00 | | | $ | 1,000.00 | |
Ending Account Value | | $ | 949.50 | | | $ | 945.80 | | | $ | 948.20 | | | $ | 950.90 | |
Expenses Incurred During the Period | | $ | 5.95 | | | $ | 9.61 | | | $ | 7.17 | | | $ | 4.72 | |
Hypothetical Performance (5% annualized return before expenses) | | | | | | | | | | | | | | | | |
Beginning Account Value | | $ | 1,000.00 | | | $ | 1,000.00 | | | $ | 1,000.00 | | | $ | 1,000.00 | |
Ending Account Value | | $ | 1,019.11 | | | $ | 1,015.32 | | | $ | 1,017.85 | | | $ | 1,020.37 | |
Expenses Incurred During the Period | | $ | 6.16 | | | $ | 9.96 | | | $ | 7.43 | | | $ | 4.89 | |
For each class of the Fund, expenses are equal to the Fund’s annualized net expense ratio of 1.21%, 1.96%, 1.46% and 0.96% for Classes A, C, R3 and I, respectively, multiplied by the average account value over the period, multiplied by 184/365 (to reflect the one-half year period).
Nuveen Large Cap Core Fund
| | | | | | | | | | | | |
| | | Share Class | |
| | | Class A | | | Class C | | | Class I | |
Actual Performance | | | | | | | | | | | | |
Beginning Account Value | | $ | 1,000.00 | | | $ | 1,000.00 | | | $ | 1,000.00 | |
Ending Account Value | | $ | 923.30 | | | $ | 920.10 | | | $ | 924.80 | |
Expenses Incurred During the Period | | $ | 5.48 | | | $ | 9.10 | | | $ | 4.27 | |
Hypothetical Performance (5% annualized return before expenses) | | | | | | | | | | | | |
Beginning Account Value | | $ | 1,000.00 | | | $ | 1,000.00 | | | $ | 1,000.00 | |
Ending Account Value | | $ | 1,019.51 | | | $ | 1,015.73 | | | $ | 1,020.77 | |
Expenses Incurred During the Period | | $ | 5.75 | | | $ | 9.55 | | | $ | 4.48 | |
For each class of the Fund, expenses are equal to the Fund’s annualized net expense ratio of 1.13%, 1.88% and 0.88% for Classes A, C and I, respectively, multiplied by the average account value over the period, multiplied by 184/365 (to reflect the one-half year period).
Nuveen Large Cap Core Plus Fund
| | | | | | | | | | | | |
| | | Share Class | |
| | | Class A | | | Class C | | | Class I | |
Actual Performance | | | | | | | | | | | | |
Beginning Account Value | | $ | 1,000.00 | | | $ | 1,000.00 | | | $ | 1,000.00 | |
Ending Account Value | | $ | 921.50 | | | $ | 918.00 | | | $ | 922.50 | |
Expenses Incurred During the Period | | $ | 10.70 | | | $ | 14.36 | | | $ | 9.50 | |
Hypothetical Performance (5% annualized return before expenses) | | | | | | | | | | | | |
Beginning Account Value | | $ | 1,000.00 | | | $ | 1,000.00 | | | $ | 1,000.00 | |
Ending Account Value | | $ | 1,014.06 | | | $ | 1,010.23 | | | $ | 1,015.32 | |
Expenses Incurred During the Period | | $ | 11.22 | | | $ | 15.05 | | | $ | 9.96 | |
For each class of the Fund, expenses are equal to the Fund’s annualized net expense ratio of 2.21%, 2.97% and 1.96% for Classes A, C and I, respectively, multiplied by the average account value over the period, multiplied by 184/365 (to reflect the one-half year period).
Expense Examples (continued)
Nuveen Large Cap Growth Fund
| | | | | | | | | | | | |
| | | Share Class | |
| | | Class A | | | Class C | | | Class I | |
Actual Performance | | | | | | | | | | | | |
Beginning Account Value | | $ | 1,000.00 | | | $ | 1,000.00 | | | $ | 1,000.00 | |
Ending Account Value | | $ | 926.70 | | | $ | 923.40 | | | $ | 928.20 | |
Expenses Incurred During the Period | | $ | 5.63 | | | $ | 9.26 | | | $ | 4.42 | |
Hypothetical Performance (5% annualized return before expenses) | | | | | | | | | | | | |
Beginning Account Value | | $ | 1,000.00 | | | $ | 1,000.00 | | | $ | 1,000.00 | |
Ending Account Value | | $ | 1,019.36 | | | $ | 1,015.58 | | | $ | 1,020.62 | |
Expenses Incurred During the Period | | $ | 5.90 | | | $ | 9.70 | | | $ | 4.63 | |
For each class of the Fund, expenses are equal to the Fund’s annualized net expense ratio of 1.16%, 1.91% and 0.91% for Classes A, C and I, respectively, multiplied by the average account value over the period, multiplied by 184/365 (to reflect the one-half year period).
Nuveen Large Cap Value Fund
| | | | | | | | | | | | | | | | |
| | | Share Class | |
| | | Class A | | | Class C | | | Class R3 | | | Class I | |
Actual Performance | | | | | | | | | | | | | | | | |
Beginning Account Value | | $ | 1,000.00 | | | $ | 1,000.00 | | | $ | 1,000.00 | | | $ | 1,000.00 | |
Ending Account Value | | $ | 904.10 | | | $ | 900.80 | | | $ | 903.20 | | | $ | 905.40 | |
Expenses Incurred During the Period | | $ | 5.23 | | | $ | 8.82 | | | $ | 6.48 | | | $ | 4.03 | |
Hypothetical Performance (5% annualized return before expenses) | | | | | | | | | | | | | | | | |
Beginning Account Value | | $ | 1,000.00 | | | $ | 1,000.00 | | | $ | 1,000.00 | | | $ | 1,000.00 | |
Ending Account Value | | $ | 1,019.71 | | | $ | 1,015.93 | | | $ | 1,018.40 | | | $ | 1,020.97 | |
Expenses Incurred During the Period | | $ | 5.55 | | | $ | 9.35 | | | $ | 6.87 | | | $ | 4.28 | |
For each class of the Fund, expenses are equal to the Fund’s annualized net expense ratio of 1.09%, 1.84%, 1.35% and 0.84% for Classes A, C, R3 and I, respectively, multiplied by the average account value over the period, multiplied by 184/365 (to reflect the one-half year period).
Report of
Independent Registered Public Accounting Firm
To the Shareholders and Board of Trustees of
Nuveen Investment Trust
Nuveen Investment Trust II:
We have audited the accompanying statements of assets and liabilities, including the portfolios of investments, of Nuveen Concentrated Core Fund, Nuveen Core Dividend Fund, Nuveen Equity Market Neutral Fund, Nuveen Large Cap Core Fund, Nuveen Large Cap Core Plus Fund, Nuveen Large Cap Growth Fund, Nuveen Large Cap Value Fund (seven of the funds which comprise the Nuveen Investment Trust) and Nuveen Equity Long/Short Fund and Nuveen Growth Fund (two of the funds comprising the Nuveen Investment Trust II) (the “Funds”) as of August 31, 2015, and the related statements of operations for the year then ended and the statements of changes in net assets and the financial highlights for each of the years in the two-year period then ended. The financial highlights for the periods presented through August 31, 2013 were audited by other auditors whose reports dated October 28, 2013 expressed unqualified opinions on those financial highlights. These financial statements and financial highlights are the responsibility of the Funds’ management. Our responsibility is to express an opinion on these financial statements and financial highlights based on our audits.
We conducted our audits in accordance with the standards of the Public Company Accounting Oversight Board (United States). Those standards require that we plan and perform the audit to obtain reasonable assurance about whether the financial statements and financial highlights are free of material misstatement. An audit includes examining, on a test basis, evidence supporting the amounts and disclosures in the financial statements. Our procedures included confirmation of securities owned as of August 31, 2015, by correspondence with the custodian and brokers or other appropriate auditing procedures. An audit also includes assessing the accounting principles used and significant estimates made by management, as well as evaluating the overall financial statement presentation. We believe that our audits provide a reasonable basis for our opinion.
In our opinion, the financial statements and financial highlights referred to above present fairly, in all material respects, the financial position of the Funds as of August 31, 2015, the results of their operations for the year then ended, and the changes in their net assets and the financial highlights for each of the years in the two-year period then ended, in conformity with U.S. generally accepted accounting principles.
/s/ KPMG LLP
Chicago, Illinois
October 28, 2015
Nuveen Concentrated Core Fund
| | |
| Portfolio of Investments | | August 31, 2015 |
| | | | | | | | |
| Shares | | | Description (1) | | Value | |
| | |
| | | | LONG-TERM INVESTMENTS – 100.2% | | | | |
| | |
| | | | COMMON STOCKS – 100.2% | | | | |
| | |
| | | | Aerospace & Defense – 4.9% | | | |
| | |
| | 50,000 | | | Boeing Company | | $ | 6,534,000 | |
| | |
| | | | Auto Components – 5.2% | | | |
| | |
| | 91,000 | | | Delphi Automotive PLC | | | 6,872,320 | |
| | |
| | | | Automobiles – 4.9% | | | |
| | |
| | 467,000 | | | Ford Motor Company | | | 6,477,290 | |
| | |
| | | | Banks – 5.0% | | | |
| | |
| | 407,000 | | | Bank of America Corporation | | | 6,650,380 | |
| | |
| | | | Biotechnology – 9.9% | | | |
| | |
| | 43,000 | | | Amgen Inc. | | | 6,526,540 | |
| | |
| | 63,000 | | | Gilead Sciences, Inc. | | | 6,619,410 | |
| | | | Total Biotechnology | | | 13,145,950 | |
| | |
| | | | Diversified Telecommunication Services – 9.1% | | | |
| | |
| | 164,000 | | | AT&T Inc. | | | 5,444,800 | |
| | |
| | 244,000 | | | CenturyLink Inc. | | | 6,597,760 | |
| | | | Total Diversified Telecommunication Services | | | 12,042,560 | |
| | |
| | | | Electronic Equipment, Instruments & Components – 4.9% | | | |
| | |
| | 373,000 | | | Corning Incorporated | | | 6,419,330 | |
| | |
| | | | Food Products – 5.1% | | | |
| | |
| | 149,000 | | | Archer-Daniels-Midland Company | | | 6,703,510 | |
| | |
| | | | Health Care Providers & Services – 20.3% | | | |
| | |
| | 57,000 | | | Aetna Inc. | | | 6,527,640 | |
| | |
| | 67,000 | | | AmerisourceBergen Corporation | | | 6,702,680 | |
| | |
| | 83,000 | | | Cardinal Health, Inc. | | | 6,828,410 | |
| | |
| | 59,000 | | | UnitedHealth Group Incorporated | | | 6,826,300 | |
| | | | Total Health Care Providers & Services | | | 26,885,030 | |
| | |
| | | | Insurance – 5.0% | | | |
| | |
| | 66,000 | | | Travelers Companies, Inc. | | | 6,570,300 | |
| | |
| | | | Machinery – 5.1% | | | |
| | |
| | 63,000 | | | Parker Hannifin Corporation | | | 6,782,580 | |
| | |
| | | | Multiline Retail – 5.1% | | | |
| | |
| | 87,000 | | | Target Corporation | | | 6,760,770 | |
| | | | | | | | |
| Shares | | | Description (1) | | Value | |
| | |
| | | | Specialty Retail – 5.1% | | | |
| | |
| | 97,000 | | | Lowe’s Companies, Inc. | | $ | 6,709,490 | |
| | |
| | | | Technology Hardware, Storage & Peripherals – 10.6% | | | |
| | |
| | 62,000 | | | Apple, Inc. | | | 6,991,120 | |
| | |
| | 250,000 | | | Hewlett-Packard Company | | | 7,015,000 | |
| | | | Total Technology Hardware, Storage & Peripherals | | | 14,006,120 | |
| | | | Total Long-Term Investments (cost $139,676,761) | | | 132,559,630 | |
| | | | Other Assets Less Liabilities – (0.2)% | | | (216,502 | ) |
| | | | Net Assets – 100% | | $ | 132,343,128 | |
For Fund portfolio compliance purposes, the Fund’s industry classifications refer to any one or more of the industry sub-classifications used by one or more widely recognized market indexes or ratings group indexes, and/or as defined by Fund management. This definition may not apply for purposes of this report, which may combine industry sub-classifications into sectors for reporting ease.
| (1) | All percentages shown in the Portfolio of Investments are based on net assets. |
See accompanying notes to financial statements.
Nuveen Core Dividend Fund
| | |
| Portfolio of Investments | | August 31, 2015 |
| | | | | | | | |
| Shares | | | Description (1) | | Value | |
| | |
| | | | LONG-TERM INVESTMENTS – 99.5% | | | | |
| | |
| | | | COMMON STOCKS – 99.5% | | | | |
| | |
| | | | Aerospace & Defense – 3.9% | | | | |
| | |
| | 4,900 | | | Boeing Company | | $ | 640,332 | |
| | |
| | 4,100 | | | Huntington Ingalls Industries Inc. | | | 461,578 | |
| | |
| | 6,800 | | | United Technologies Corporation | | | 622,948 | |
| | | | Total Aerospace & Defense | | | 1,724,858 | |
| | |
| | | | Air Freight & Logistics – 1.2% | | | |
| | |
| | 5,400 | | | United Parcel Service, Inc., Class B | | | 527,310 | |
| | |
| | | | Airlines – 0.2% | | | |
| | |
| | 1,700 | | | Delta Air Lines, Inc. | | | 74,426 | |
| | |
| | | | Auto Components – 1.1% | | | |
| | |
| | 6,500 | | | Delphi Automotive PLC | | | 490,880 | |
| | |
| | | | Automobiles – 2.3% | | | |
| | |
| | 19,100 | | | General Motors Company | | | 562,304 | |
| | |
| | 8,800 | | | Thor Industries, Inc. | | | 480,304 | |
| | | | Total Automobiles | | | 1,042,608 | |
| | |
| | | | Banks – 1.7% | | | |
| | |
| | 20,000 | | | Bank of America Corporation | | | 326,800 | |
| | |
| | 1,500 | | | JPMorgan Chase & Co. | | | 96,150 | |
| | |
| | 5,000 | | | Pacwest Bancorp. | | | 213,200 | |
| | |
| | 2,300 | | | Wells Fargo & Company | | | 122,659 | |
| | | | Total Banks | | | 758,809 | |
| | |
| | | | Beverages – 2.6% | | | |
| | |
| | 5,900 | | | Dr. Pepper Snapple Group | | | 452,707 | |
| | |
| | 7,800 | | | PepsiCo, Inc. | | | 724,854 | |
| | | | Total Beverages | | | 1,177,561 | |
| | |
| | | | Biotechnology – 3.3% | | | |
| | |
| | 4,600 | | | Amgen Inc. | | | 698,188 | |
| | |
| | 7,400 | | | Gilead Sciences, Inc. | | | 777,518 | |
| | | | Total Biotechnology | | | 1,475,706 | |
| | |
| | | | Capital Markets – 3.8% | | | |
| | |
| | 300 | | | Bank New York Mellon | | | 11,940 | |
| | |
| | 12,200 | | | Eaton Vance Corporation | | | 422,974 | |
| | |
| | 9,500 | | | Lazard Limited | | | 472,435 | |
| | |
| | 16,600 | | | Morgan Stanley | | | 571,870 | |
| | |
| | 2,700 | | | T. Rowe Price Group Inc. | | | 194,076 | |
| | | | Total Capital Markets | | | 1,673,295 | |
| | | | | | | | |
| Shares | | | Description (1) | | Value | |
| | |
| | | | Chemicals – 0.3% | | | |
| | |
| | 4,000 | | | Cabot Corporation | | $ | 135,480 | |
| | |
| | | | Commercial Services & Supplies – 1.2% | | | |
| | |
| | 3,400 | | | Pitney Bowes Inc. | | | 67,354 | |
| | |
| | 30,100 | | | R.R. Donnelley & Sons Company | | | 472,570 | |
| | | | Total Commercial Services & Supplies | | | 539,924 | |
| | |
| | | | Communications Equipment – 2.6% | | | |
| | |
| | 28,300 | | | Cisco Systems, Inc. | | | 732,404 | |
| | |
| | 17,400 | | | Juniper Networks Inc. | | | 447,354 | |
| | | | Total Communications Equipment | | | 1,179,758 | |
| | |
| | | | Containers & Packaging – 0.3% | | | |
| | |
| | 2,900 | | | Sonoco Products Company | | | 114,028 | |
| | |
| | | | Diversified Telecommunication Services – 3.5% | | | |
| | |
| | 17,900 | | | CenturyLink Inc. | | | 484,016 | |
| | |
| | 17,000 | | | Verizon Communications Inc. | | | 782,170 | |
| | |
| | 37,900 | | | Windstream Holdings Inc. | | | 272,501 | |
| | | | Total Diversified Telecommunication Services | | | 1,538,687 | |
| | |
| | | | Electrical Equipment – 1.1% | | | |
| | |
| | 4,400 | | | Rockwell Automation, Inc. | | | 492,052 | |
| | |
| | | | Electronic Equipment, Instruments & Components – 1.3% | | | |
| | |
| | 12,700 | | | Corning Incorporated | | | 218,567 | |
| | |
| | 13,500 | | | Jabil Circuit Inc. | | | 261,225 | |
| | |
| | 10,600 | | | Vishay Intertechnology Inc. | | | 104,728 | |
| | | | Total Electronic Equipment, Instruments & Components | | | 584,520 | |
| | |
| | | | Energy Equipment & Services – 3.8% | | | |
| | |
| | 12,600 | | | Atwood Oceanics Inc. | | | 240,786 | |
| | |
| | 8,900 | | | Ensco PLC | | | 161,179 | |
| | |
| | 11,600 | | | National-Oilwell Varco Inc. | | | 491,028 | |
| | |
| | 35,300 | | | Noble Corporation PLC | | | 459,606 | |
| | |
| | 20,000 | | | Tidewater Inc. | | | 358,600 | |
| | | | Total Energy Equipment & Services | | | 1,711,199 | |
| | |
| | | | Food & Staples Retailing – 0.7% | | | |
| | |
| | 4,600 | | | Wal-Mart Stores, Inc. | | | 297,758 | |
| | |
| | | | Food Products – 1.2% | | | |
| | |
| | 2,900 | | | Archer-Daniels-Midland Company | | | 130,471 | |
| | |
| | 16,900 | | | Flowers Foods Inc. | | | 392,249 | |
| | | | Total Food Products | | | 522,720 | |
| | |
| | | | Health Care Providers & Services – 7.4% | | | |
| | |
| | 4,600 | | | Aetna Inc. | | | 526,792 | |
Nuveen Core Dividend Fund (continued)
| | |
| Portfolio of Investments | | August 31, 2015 |
| | | | | | | | |
| Shares | | | Description (1) | | Value | |
| | |
| | | | Health Care Providers & Services (continued) | | | |
| | |
| | 4,900 | | | AmerisourceBergen Corporation | | $ | 490,196 | |
| | |
| | 3,700 | | | Anthem Inc. | | | 521,885 | |
| | |
| | 6,400 | | | Cardinal Health, Inc. | | | 526,528 | |
| | |
| | 2,700 | | | McKesson HBOC Inc. | | | 533,466 | |
| | |
| | 6,000 | | | UnitedHealth Group Incorporated | | | 694,200 | |
| | | | Total Health Care Providers & Services | | | 3,293,067 | |
| | |
| | | | Hotels, Restaurants & Leisure – 2.6% | | | |
| | |
| | 4,200 | | | Brinker International Inc. | | | 223,146 | |
| | |
| | 6,900 | | | Darden Restaurants, Inc. | | | 469,269 | |
| | |
| | 10,100 | | | Six Flags Entertainment Corporation | | | 454,197 | |
| | | | Total Hotels, Restaurants & Leisure | | | 1,146,612 | |
| | |
| | | | Household Durables – 1.5% | | | |
| | |
| | 9,600 | | | Leggett and Platt Inc. | | | 426,432 | |
| | |
| | 4,800 | | | Tupperware Corporation | | | 245,904 | |
| | | | Total Household Durables | | | 672,336 | |
| | |
| | | | Independent Power & Renewable Electricity Producers – 0.5% | | | |
| | |
| | 8,600 | | | AES Corporation | | | 103,200 | |
| | |
| | 6,800 | | | NRG Energy Inc. | | | 135,456 | |
| | | | Total Independent Power & Renewable Electricity Producers | | | 238,656 | |
| | |
| | | | Industrial Conglomerates – 0.3% | | | |
| | |
| | 4,800 | | | General Electric Company | | | 119,136 | |
| | |
| | | | Insurance – 1.0% | | | |
| | |
| | 18,300 | | | Assured Guaranty Limited | | | 462,258 | |
| | |
| | | | Internet & Catalog Retail – 1.1% | | | |
| | |
| | 4,100 | | | Expedia, Inc. | | | 471,459 | |
| | |
| | | | Internet Software & Services – 1.0% | | | |
| | |
| | 6,500 | | | IAC/InterActiveCorp. | | | 453,700 | |
| | |
| | | | IT Services – 4.0% | | | |
| | |
| | 6,200 | | | Accenture Limited | | | 584,474 | |
| | |
| | 4,800 | | | Broadridge Financial Solutions, Inc. | | | 253,392 | |
| | |
| | 10,700 | | | Leidos Holdings Inc. | | | 450,256 | |
| | |
| | 3,600 | | | MasterCard, Inc. | | | 332,532 | |
| | |
| | 15,700 | | | Xerox Corporation | | | 159,669 | |
| | | | Total IT Services | | | 1,780,323 | |
| | |
| | | | Leisure Products – 1.0% | | | |
| | |
| | 6,200 | | | Hasbro, Inc. | | | 462,458 | |
| | |
| | | | Machinery – 2.5% | | | |
| | |
| | 2,400 | | | AGCO Corporation | | | 117,696 | |
| | | | | | | | |
| Shares | | | Description (1) | | Value | |
| | |
| | | | Machinery (continued) | | | |
| | |
| | 16,700 | | | Allison Transmission Holdings Inc. | | $ | 477,620 | |
| | |
| | 1,500 | | | Caterpillar Inc. | | | 114,660 | |
| | |
| | 2,700 | | | Cummins Inc. | | | 328,725 | |
| | |
| | 500 | | | Parker Hannifin Corporation | | | 53,830 | |
| | | | Total Machinery | | | 1,092,531 | |
| | |
| | | | Media – 3.5% | | | |
| | |
| | 18,400 | | | Cablevision Systems Corporation | | | 463,128 | |
| | |
| | 21,600 | | | Gannett Company, Inc. | | | 283,176 | |
| | |
| | 24,200 | | | Interpublic Group of Companies, Inc. | | | 456,896 | |
| | |
| | 9,100 | | | Viacom Inc., Class B | | | 371,007 | |
| | | | Total Media | | | 1,574,207 | |
| | |
| | | | Metals & Mining – 1.1% | | | |
| | |
| | 11,200 | | | Nucor Corporation | | | 484,848 | |
| | |
| | | | Multiline Retail – 3.3% | | | |
| | |
| | 9,100 | | | Big Lots, Inc. | | | 436,709 | |
| | |
| | 4,200 | | | Kohl’s Corporation | | | 214,326 | |
| | |
| | 6,500 | | | Macy’s, Inc. | | | 380,965 | |
| | |
| | 5,800 | | | Target Corporation | | | 450,718 | |
| | | | Total Multiline Retail | | | 1,482,718 | |
| | |
| | | | Oil, Gas & Consumable Fuels – 2.5% | | | |
| | |
| | 9,800 | | | CVTR Energy Inc. | | | 394,058 | |
| | |
| | 113,500 | | | Denbury Resources Inc. | | | 492,590 | |
| | |
| | 3,300 | | | Exxon Mobil Corporation | | | 248,292 | |
| | | | Total Oil, Gas & Consumable Fuels | | | 1,134,940 | |
| | |
| | | | Personal Products – 0.9% | | | |
| | |
| | 77,400 | | | Avon Products, Inc. | | | 401,706 | |
| | |
| | | | Pharmaceuticals – 4.2% | | | |
| | |
| | 3,000 | | | Johnson & Johnson | | | 281,940 | |
| | |
| | 14,600 | | | Merck & Company Inc. | | | 786,210 | |
| | |
| | 25,600 | | | Pfizer Inc. | | | 824,832 | |
| | | | Total Pharmaceuticals | | | 1,892,982 | |
| | |
| | | | Real Estate Investment Trust – 2.1% | | | |
| | |
| | 20,700 | | | Communications Sales & Leasing, Inc. | | | 416,070 | |
| | |
| | 3,000 | | | Iron Mountain Inc. | | | 85,020 | |
| | |
| | 63,300 | | | MFA Mortgage Investments, Inc. | | | 450,063 | |
| | | | Total Real Estate Investment Trust | | | 951,153 | |
| | |
| | | | Semiconductors & Semiconductor Equipment – 3.8% | | | |
| | |
| | 26,600 | | | Intel Corporation | | | 759,164 | |
| | |
| | 41,500 | | | Marvell Technology Group Ltd. | | | 467,705 | |
Nuveen Core Dividend Fund (continued)
| | |
| Portfolio of Investments | | August 31, 2015 |
| | | | | | | | |
| Shares | | | Description (1) | | Value | |
| | |
| | | | Semiconductors & Semiconductor Equipment (continued) | | | |
| | |
| | 20,800 | | | NVIDIA Corporation | | $ | 467,584 | |
| | | | Total Semiconductors & Semiconductor Equipment | | | 1,694,453 | |
| | |
| | | | Software – 3.3% | | | |
| | |
| | 10,200 | | | CA Technologies | | | 278,358 | |
| | |
| | 27,600 | | | Microsoft Corporation | | | 1,201,152 | |
| | | | Total Software | | | 1,479,510 | |
| | |
| | | | Specialty Retail – 6.9% | | | |
| | |
| | 12,000 | | | Aaron Rents Inc. | | | 451,800 | |
| | |
| | 12,400 | | | Abercrombie & Fitch Co., Class A | | | 246,264 | |
| | |
| | 13,400 | | | Best Buy Co., Inc. | | | 492,316 | |
| | |
| | 4,000 | | | GameStop Corporation | | | 169,920 | |
| | |
| | 6,700 | | | Home Depot, Inc. | | | 780,282 | |
| | |
| | 1,300 | | | L Brands Inc. | | | 109,070 | |
| | |
| | 4,800 | | | Lowe’s Companies, Inc. | | | 332,016 | |
| | |
| | 34,500 | | | Staples, Inc. | | | 490,245 | |
| | | | Total Specialty Retail | | | 3,071,913 | |
| | |
| | | | Technology Hardware, Storage & Peripherals – 7.3% | | | |
| | |
| | 16,800 | | | Apple, Inc. | | | 1,894,368 | |
| | |
| | 19,400 | | | EMC Corporation | | | 482,478 | |
| | |
| | 20,700 | | | Hewlett-Packard Company | | | 580,842 | |
| | |
| | 10,000 | | | Lexmark International, Inc., Class A | | | 299,800 | |
| | | | Total Technology Hardware, Storage & Peripherals | | | 3,257,488 | |
| | |
| | | | Tobacco – 1.6% | | | |
| | |
| | 12,900 | | | Altria Group, Inc. | | | 691,182 | |
| | | | Total Long-Term Investments (cost $46,089,212) | | | 44,371,215 | |
| | | | Other Assets Less Liabilities – 0.5% | | | 214,768 | |
| | | | Net Assets – 100% | | $ | 44,585,983 | |
For Fund portfolio compliance purposes, the Fund’s industry classifications refer to any one or more of the industry sub-classifications used by one or more widely recognized market indexes or ratings group indexes, and/or as defined by Fund management. This definition may not apply for purposes of this report, which may combine industry sub-classifications into sectors for reporting ease.
| (1) | All percentages shown in the Portfolio of Investments are based on net assets. |
See accompanying notes to financial statements.
Nuveen Equity Long/Short Fund
| | |
| Portfolio of Investments | | August 31, 2015 |
| | | | | | | | | | | | |
| Shares | | | Description (1) | | | | | | Value | |
| | | | |
| | | | LONG-TERM INVESTMENTS – 158.9% | | | | | | | | |
| | | | |
| | | | COMMON STOCKS – 158.9% | | | | | | | | |
| | | | |
| | | | Aerospace & Defense – 6.1% | | | | | | | |
| | | | |
| | 10,150 | | | Boeing Company | | | | | | $ | 1,326,402 | |
| | | | |
| | 9,320 | | | Huntington Ingalls Industries Inc. | | | | | | | 1,049,246 | |
| | | | |
| | 9,431 | | | L-3 Communications Holdings, Inc. | | | | | | | 994,688 | |
| | | | |
| | 20,337 | | | Spirit AeroSystems Holdings Inc., (2) | | | | | | | 1,039,424 | |
| | | | |
| | 17,950 | | | Triumph Group Inc. | | | | | | | 886,551 | |
| | | | Total Aerospace & Defense | | | | | | | 5,296,311 | |
| | | | |
| | | | Air Freight & Logistics – 2.5% | | | | | | | |
| | | | |
| | 15,697 | | | C.H. Robinson Worldwide, Inc. | | | | | | | 1,058,449 | |
| | | | |
| | 21,800 | | | Expeditors International of Washington, Inc. | | | | | | | 1,067,546 | |
| | | | Total Air Freight & Logistics | | | | | | | 2,125,995 | |
| | | | |
| | | | Airlines – 1.3% | | | | | | | |
| | | | |
| | 24,966 | | | Delta Air Lines, Inc. | | | | | | | 1,093,011 | |
| | | | |
| | | | Automobiles – 1.2% | | | | | | | |
| | | | |
| | 18,283 | | | Thor Industries, Inc. | | | | | | | 997,886 | |
| | | | |
| | | | Banks – 4.6% | | | | | | | |
| | | | |
| | 48,800 | | | Bank of America Corporation | | | | | | | 797,392 | |
| | | | |
| | 27,381 | | | Citigroup Inc. | | | | | | | 1,464,336 | |
| | | | |
| | 26,131 | | | JPMorgan Chase & Co. | | | | | | | 1,674,996 | |
| | | | Total Banks | | | | | | | 3,936,724 | |
| | | | |
| | | | Beverages – 2.9% | | | | | | | |
| | | | |
| | 21,248 | | | Coca-Cola Enterprises Inc. | | | | | | | 1,094,060 | |
| | | | |
| | 15,411 | | | PepsiCo, Inc. | | | | | | | 1,432,144 | |
| | | | Total Beverages | | | | | | | 2,526,204 | |
| | | | |
| | | | Biotechnology – 4.4% | | | | | | | |
| | | | |
| | 8,925 | | | Amgen Inc. | | | | | | | 1,354,637 | |
| | | | |
| | 3,500 | | | Biogen Inc., (2) | | | | | | | 1,040,550 | |
| | | | |
| | 13,704 | | | Gilead Sciences, Inc. | | | | | | | 1,439,879 | |
| | | | Total Biotechnology | | | | | | | 3,835,066 | |
| | | | |
| | | | Capital Markets – 1.4% | | | | | | | |
| | | | |
| | 35,900 | | | Morgan Stanley | | | | | | | 1,236,755 | |
| | | | |
| | | | Chemicals – 3.8% | | | | | | | |
| | | | |
| | 31,134 | | | Cabot Corporation | | | | | | | 1,054,509 | |
| | | | |
| | 14,125 | | | LyondellBasell Industries NV | | | | | | | 1,205,993 | |
| | | | |
| | 25,800 | | | Mosaic Company | | | | | | | 1,053,414 | |
| | | | Total Chemicals | | | | | | | 3,313,916 | |
Nuveen Equity Long/Short Fund (continued)
| | |
| Portfolio of Investments | | August 31, 2015 |
| | | | | | | | | | | | |
| Shares | | | Description (1) | | | | | | Value | |
| | | | |
| | | | Communications Equipment – 3.7% | | | | | | | |
| | | | |
| | 78,385 | | | Brocade Communications Systems Inc. | | | | | | $ | 834,800 | |
| | | | |
| | 53,028 | | | Cisco Systems, Inc. | | | | | | | 1,372,365 | |
| | | | |
| | 8,538 | | | F5 Networks, Inc., (2) | | | | | | | 1,036,599 | |
| | | | Total Communications Equipment | | | | | | | 3,243,764 | |
| | | | |
| | | | Construction & Engineering – 2.2% | | | | | | | |
| | | | |
| | 28,900 | | | AECOM, (2) | | | | | | | 794,750 | |
| | | | |
| | 28,000 | | | Jacobs Engineering Group, Inc., (2) | | | | | | | 1,131,480 | |
| | | | Total Construction & Engineering | | | | | | | 1,926,230 | |
| | | | |
| | | | Containers & Packaging – 4.7% | | | | | | | |
| | | | |
| | 17,752 | | | Avery Dennison Corporation | | | | | | | 1,031,036 | |
| | | | |
| | 19,715 | | | Crown Holdings Inc., (2) | | | | | | | 977,273 | |
| | | | |
| | 71,300 | | | Graphic Packaging Holding Company | | | | | | | 1,005,330 | |
| | | | |
| | 20,000 | | | Sealed Air Corporation | | | | | | | 1,029,000 | |
| | | | Total Containers & Packaging | | | | | | | 4,042,639 | |
| | | | |
| | | | Diversified Consumer Services – 1.2% | | | | | | | |
| | | | |
| | 36,300 | | | Service Corporation International | | | | | | | 1,076,295 | |
| | | | |
| | | | Diversified Financial Services – 2.3% | | | | | | | |
| | | | |
| | 10,120 | | | Moody’s Corporation | | | | | | | 1,035,377 | |
| | | | |
| | 21,594 | | | Voya Financial Inc. | | | | | | | 930,270 | |
| | | | Total Diversified Financial Services | | | | | | | 1,965,647 | |
| | | | |
| | | | Diversified Telecommunication Services – 2.0% | | | | | | | |
| | | | |
| | 36,720 | | | CenturyLink Inc. | | | | | | | 992,909 | |
| | | | |
| | 15,200 | | | Verizon Communications Inc. | | | | | | | 699,352 | |
| | | | Total Diversified Telecommunication Services | | | | | | | 1,692,261 | |
| | | | |
| | | | Electric Utilities – 2.5% | | | | | | | |
| | | | |
| | 18,700 | | | Edison International | | | | | | | 1,093,576 | |
| | | | |
| | 34,900 | | | Exelon Corporation | | | | | | | 1,073,524 | |
| | | | Total Electric Utilities | | | | | | | 2,167,100 | |
| | | | |
| | | | Electrical Equipment – 1.2% | | | | | | | |
| | | | |
| | 9,551 | | | Rockwell Automation, Inc. | | | | | | | 1,068,088 | |
| | | | |
| | | | Electronic Equipment, Instruments & Components – 1.3% | | | | | | | |
| | | | |
| | 41,500 | | | Ingram Micro, Inc., Class A | | | | | | | 1,122,990 | |
| | | | |
| | | | Energy Equipment & Services – 1.4% | | | | | | | |
| | | | |
| | 75,400 | | | Superior Energy Services, Inc. | | | | | | | 1,199,614 | |
| | | | |
| | | | Food Products – 3.7% | | | | | | | |
| | | | |
| | 24,479 | | | Archer-Daniels-Midland Company | | | | | | | 1,101,310 | |
| | | | |
| | 14,470 | | | Bunge Limited | | | | | | | 1,048,352 | |
| | | | |
| | 45,167 | | | Flowers Foods Inc. | | | | | | | 1,048,326 | |
| | | | Total Food Products | | | | | | | 3,197,988 | |
| | | | | | | | | | | | |
| Shares | | | Description (1) | | | | | | Value | |
| | | | |
| | | | Health Care Equipment & Supplies – 1.2% | | | | | | | |
| | | | |
| | 26,145 | | | Hologic Inc., (2) | | | | | | $ | 1,014,687 | |
| | | | |
| | | | Health Care Providers & Services – 10.5% | | | | | | | |
| | | | |
| | 10,483 | | | Aetna Inc. | | | | | | | 1,200,513 | |
| | | | |
| | 10,400 | | | AmerisourceBergen Corporation | | | | | | | 1,040,416 | |
| | | | |
| | 7,717 | | | Anthem Inc. | | | | | | | 1,088,483 | |
| | | | |
| | 13,084 | | | Cardinal Health, Inc. | | | | | | | 1,076,421 | |
| | | | |
| | 16,800 | | | Centene Corporation, (2) | | | | | | | 1,036,896 | |
| | | | |
| | 14,400 | | | Express Scripts, Holding Company, (2) | | | | | | | 1,203,840 | |
| | | | |
| | 5,677 | | | McKesson HBOC Inc. | | | | | | | 1,121,662 | |
| | | | |
| | 11,387 | | | UnitedHealth Group Incorporated | | | | | | | 1,317,476 | |
| | | | Total Health Care Providers & Services | | | | | | | 9,085,707 | |
| | | | |
| | | | Hotels, Restaurants & Leisure – 5.2% | | | | | | | |
| | | | |
| | 22,131 | | | Carnival Corporation | | | | | �� | | 1,089,509 | |
| | | | |
| | 15,094 | | | Darden Restaurants, Inc. | | | | | | | 1,026,543 | |
| | | | |
| | 15,650 | | | Marriott International, Inc., Class A | | | | | | | 1,105,829 | |
| | | | |
| | 24,000 | | | Starbucks Corporation | | | | | | | 1,313,040 | |
| | | | Total Hotels, Restaurants & Leisure | | | | | | | 4,534,921 | |
| | | | |
| | | | Household Durables – 2.5% | | | | | | | |
| | | | |
| | 21,725 | | | Leggett and Platt Inc. | | | | | | | 965,025 | |
| | | | |
| | 16,000 | | | Tempur Pedic International Inc., (2) | | | | | | | 1,168,320 | |
| | | | Total Household Durables | | | | | | | 2,133,345 | |
| | | | |
| | | | Independent Power & Renewable Electricity Producers – 1.1% | | | | | | | |
| | | | |
| | 79,529 | | | AES Corporation | | | | | | | 954,348 | |
| | | | |
| | | | Industrial Conglomerates – 1.2% | | | | | | | |
| | | | |
| | 6,280 | | | Roper Technologies, Inc. | | | | | | | 1,017,925 | |
| | | | |
| | | | Insurance – 7.1% | | | | | | | |
| | | | |
| | 16,700 | | | Amtrust Financial Services, Inc. | | | | | | | 971,105 | |
| | | | |
| | 5,499 | | | Everest Reinsurance Group Ltd | | | | | | | 966,779 | |
| | | | |
| | 23,300 | | | Hartford Financial Services Group, Inc. | | | | | | | 1,070,635 | |
| | | | |
| | 21,202 | | | MetLife, Inc. | | | | | | | 1,062,220 | |
| | | | |
| | 10,988 | | | Travelers Companies, Inc. | | | | | | | 1,093,855 | |
| | | | |
| | 21,852 | | | Valdius Holdings Limited | | | | | | | 967,607 | |
| | | | Total Insurance | | | | | | | 6,132,201 | |
| | | | |
| | | | Internet Software & Services – 2.5% | | | | | | | |
| | | | |
| | 41,325 | | | eBay Inc., (2) | | | | | | | 1,120,321 | |
| | | | |
| | 15,504 | | | VeriSign, Inc., (2) | | | | | | | 1,068,846 | |
| | | | Total Internet Software & Services | | | | | | | 2,189,167 | |
| | | | |
| | | | IT Services – 6.3% | | | | | | | |
| | | | |
| | 12,000 | | | Accenture Limited | | | | | | | 1,131,240 | |
Nuveen Equity Long/Short Fund (continued)
| | |
| Portfolio of Investments | | August 31, 2015 |
| | | | | | | | | | | | |
| Shares | | | Description (1) | | | | | | Value | |
| | | | |
| | | | IT Services (continued) | | | | | | | |
| | | | |
| | 26,573 | | | CoreLogic Inc. | | | | | | $ | 1,008,445 | |
| | | | |
| | 12,071 | | | Gartner Inc., (2) | | | | | | | 1,032,191 | |
| | | | |
| | 24,000 | | | Leidos Holdings Inc. | | | | | | | 1,009,920 | |
| | | | |
| | 13,991 | | | MasterCard, Inc. | | | | | | | 1,292,349 | |
| | | | Total IT Services | | | | | | | 5,474,145 | |
| | | | |
| | | | Life Sciences Tools & Services – 1.2% | | | | | | | |
| | | | |
| | 8,300 | | | Waters Corporation, (2) | | | | | | | 1,007,454 | |
| | | | |
| | | | Machinery – 8.1% | | | | | | | |
| | | | |
| | 19,500 | | | AGCO Corporation | | | | | | | 956,280 | |
| | | | |
| | 35,785 | | | Allison Transmission Holdings Inc. | | | | | | | 1,023,451 | |
| | | | |
| | 15,673 | | | Caterpillar Inc. | | | | | | | 1,198,044 | |
| | | | |
| | 18,652 | | | Crane Company | | | | | | | 979,976 | |
| | | | |
| | 18,049 | | | Lincoln Electric Holdings Inc. | | | | | | | 1,058,574 | |
| | | | |
| | 9,801 | | | Parker Hannifin Corporation | | | | | | | 1,055,176 | |
| | | | |
| | 25,612 | | | Trinity Industries Inc. | | | | | | | 691,268 | |
| | | | Total Machinery | | | | | | | 6,962,769 | |
| | | | |
| | | | Media – 7.6% | | | | | | | |
| | | | |
| | 15,000 | | | AMC Networks Inc., Class A Shares, (2) | | | | | | | 1,085,700 | |
| | | | |
| | 44,800 | | | Cablevision Systems Corporation | | | | | | | 1,127,616 | |
| | | | |
| | 22,918 | | | Comcast Corporation, Class A | | | | | | | 1,290,971 | |
| | | | |
| | 52,400 | | | Interpublic Group of Companies, Inc. | | | | | | | 989,312 | |
| | | | |
| | 287,681 | | | Sirius XM Holdings Inc., (2) | | | | | | | 1,097,503 | |
| | | | |
| | 26,519 | | | Starz, Class A, (2) | | | | | | | 997,380 | |
| | | | Total Media | | | | | | | 6,588,482 | |
| | | | |
| | | | Metals & Mining – 3.6% | | | | | | | |
| | | | |
| | 24,300 | | | Nucor Corporation | | | | | | | 1,051,947 | |
| | | | |
| | 17,600 | | | Reliance Steel & Aluminum Company | | | | | | | 1,022,912 | |
| | | | |
| | 54,580 | | | Steel Dynamics Inc. | | | | | | | 1,063,218 | |
| | | | Total Metals & Mining | | | | | | | 3,138,077 | |
| | | | |
| | | | Multiline Retail – 3.6% | | | | | | | |
| | | | |
| | 14,251 | | | Dollar General Corporation | | | | | | | 1,061,557 | |
| | | | |
| | 15,066 | | | Macy’s, Inc. | | | | | | | 883,018 | |
| | | | |
| | 15,154 | | | Target Corporation | | | | | | | 1,177,617 | |
| | | | Total Multiline Retail | | | | | | | 3,122,192 | |
| | | | |
| | | | Multi-Utilities – 1.2% | | | | | | | |
| | | | |
| | 26,000 | | | Public Service Enterprise Group Incorporated | | | | | | | 1,046,500 | |
| | | | |
| | | | Oil, Gas & Consumable Fuels – 3.5% | | | | | | | |
| | | | |
| | 25,572 | | | CVTR Energy Inc. | | | | | | | 1,028,250 | |
| | | | |
| | 189,918 | | | Denbury Resources Inc. | | | | | | | 824,244 | |
| | | | | | | | | | | | |
| Shares | | | Description (1) | | | | | | Value | |
| | | | |
| | | | Oil, Gas & Consumable Fuels (continued) | | | | | | | |
| | | | |
| | 19,200 | | | Valero Energy Corporation | | | | | | $ | 1,139,328 | |
| | | | Total Oil, Gas & Consumable Fuels | | | | | | | 2,991,822 | |
| | | | |
| | | | Personal Products – 1.2% | | | | | | | |
| | | | |
| | 18,700 | | | Herbalife, Limited | | | | | | | 1,076,559 | |
| | | | |
| | | | Pharmaceuticals – 2.0% | | | | | | | |
| | | | |
| | 18,624 | | | Johnson & Johnson | | | | | | | 1,750,283 | |
| | | | |
| | | | Professional Services – 2.4% | | | | | | | |
| | | | |
| | 10,800 | | | Equifax Inc. | | | | | | | 1,057,320 | |
| | | | |
| | 11,581 | | | Manpower Inc. | | | | | | | 1,006,389 | |
| | | | Total Professional Services | | | | | | | 2,063,709 | |
| | | | |
| | | | Road & Rail – 1.1% | | | | | | | |
| | | | |
| | 14,596 | | | Landstar System | | | | | | | 966,255 | |
| | | | |
| | | | Semiconductors & Semiconductor Equipment – 4.2% | | | | | | | |
| | | | |
| | 51,568 | | | Intel Corporation | | | | | | | 1,471,751 | |
| | | | |
| | 48,000 | | | NVIDIA Corporation | | | | | | | 1,079,040 | |
| | | | |
| | 113,135 | | | ON Semiconductor Corporation, (2) | | | | | | | 1,081,005 | |
| | | | Total Semiconductors & Semiconductor Equipment | | | | | | | 3,631,796 | |
| | | | |
| | | | Software – 10.5% | | | | | | | |
| | | | |
| | 36,200 | | | Activision Blizzard Inc. | | | | | | | 1,036,406 | |
| | | | |
| | 15,600 | | | Citrix Systems, (2) | | | | | | | 1,062,516 | |
| | | | |
| | 15,471 | | | Electronic Arts Inc., (2) | | | | | | | 1,023,407 | |
| | | | |
| | 10,944 | | | Intuit, Inc. | | | | | | | 938,448 | |
| | | | |
| | 45,000 | | | King Digital Entertainment PLC | | | | | | | 599,850 | |
| | | | |
| | 46,658 | | | Microsoft Corporation | | | | | | | 2,030,555 | |
| | | | |
| | 35,095 | | | Oracle Corporation | | | | | | | 1,301,674 | |
| | | | |
| | 15,050 | | | Red Hat, Inc., (2) | | | | | | | 1,086,761 | |
| | | | Total Software | | | | | | | 9,079,617 | |
| | | | |
| | | | Specialty Retail – 6.7% | | | | | | | |
| | | | |
| | 31,848 | | | Best Buy Co., Inc. | | | | | | | 1,170,096 | |
| | | | |
| | 12,191 | | | Foot Locker, Inc. | | | | | | | 863,001 | |
| | | | |
| | 23,199 | | | GameStop Corporation | | | | | | | 985,494 | |
| | | | |
| | 13,070 | | | Home Depot, Inc. | | | | | | | 1,522,131 | |
| | | | |
| | 17,793 | | | Lowe’s Companies, Inc. | | | | | | | 1,230,742 | |
| | | | Total Specialty Retail | | | | | | | 5,771,464 | |
| | | | |
| | | | Technology Hardware, Storage & Peripherals – 6.4% | | | | | | | |
| | | | |
| | 27,250 | | | Apple, Inc. | | | | | | | 3,072,707 | |
| | | | |
| | 48,900 | | | EMC Corporation | | | | | | | 1,216,143 | |
| | | | |
| | 43,185 | | | Hewlett-Packard Company | | | | | | | 1,211,771 | |
| | | | Total Technology Hardware, Storage & Peripherals | | | | | | | 5,500,621 | |
Nuveen Equity Long/Short Fund (continued)
| | |
| Portfolio of Investments | | August 31, 2015 |
| | | | | | | | | | | | | | | | |
| Shares | | | Description (1) | | | | | | | | Value | |
| | | | |
| | | | Textiles, Apparel & Luxury Goods – 2.6% | | | | | | | | | |
| | | | |
| | 9,821 | | | Carter’s Inc. | | | | | | | | | | $ | 965,503 | |
| | | | |
| | 11,226 | | | Nike, Inc., Class B | | | | | | | | | | | 1,254,506 | |
| | | | Total Textiles, Apparel & Luxury Goods | | | | | | | | | | | 2,220,009 | |
| | | | |
| | | | Trading Companies & Distributors – 1.0% | | | | | | | | | |
| | | | |
| | 15,990 | | | WESCO International Inc., (2) | | | | | | | | | | | 894,960 | |
| | | | Total Long-Term Investments (cost $139,821,033) | | | | | | | | | | | 137,413,499 | |
| | | | |
Principal
Amount (000) | | | Description (1) | | Coupon | | | Maturity | | | Value | |
| | | | |
| | | | SHORT-TERM INVESTMENTS – 4.4% | | | | | | | | | |
| | | | |
| | | | REPURCHASE AGREEMENTS – 4.4% | | | | | | | | | | | | |
| | | | |
| $ | 3,791 | | | Repurchase Agreement with Fixed Income Clearing Corporation, dated 8/31/15 repurchase price $3,790,915, collateralized by $3,795,000 U.S. Treasury Notes, 2.375%, due 8/15/24, value $3,870,900 | | | 0.000% | | | | 9/01/15 | | | $ | 3,790,915 | |
| | | | Total Short-Term Investments (cost $3,790,915) | | | | | | | | | | | 3,790,915 | |
| | | | Total Investments (cost $143,611,948) – 163.3% | | | | | | | | | | | 141,204,414 | |
| | | | |
| Shares | | | Description (1) | | | | | | | | Value | |
| | | | |
| | | | COMMON STOCKS SOLD SHORT – (80.1)% (3) | | | | | | | | | |
| | | | |
| | | | Aerospace & Defense – (2.5)% | | | | | | | | | |
| | | | |
| | (15,511 | ) | | BE Aerospace Inc. | | | | | | | | | | $ | (756,161 | ) |
| | | | |
| | (15,000 | ) | | Hexcel Corporation | | | | | | | | | | | (723,900 | ) |
| | | | |
| | (6,900 | ) | | Raytheon Company | | | | | | | | | | | (707,664 | ) |
| | | | Total Aerospace & Defense | | | | | | | | | | | (2,187,725 | ) |
| | | | |
| | | | Airlines – (0.8)% | | | | | | | | | |
| | | | |
| | (13,500 | ) | | Spirit Airline Holdings, (2) | | | | | | | | | | | (691,875 | ) |
| | | | |
| | | | Automobiles – (0.8)% | | | | | | | | | |
| | | | |
| | (2,854 | ) | | Tesla Motors Inc., (2) | | | | | | | | | | | (710,817 | ) |
| | | | |
| | | | Banks – (0.8)% | | | | | | | | | |
| | | | |
| | (5,850 | ) | | M&T Bank Corporation | | | | | | | | | | | (691,704 | ) |
| | | | |
| | | | Beverages – (3.2)% | | | | | | | | | |
| | | | |
| | (7,000 | ) | | Brown-Forman Corporation | | | | | | | | | | | (686,700 | ) |
| | | | |
| | (6,166 | ) | | Constellation Brands, Inc., Class A | | | | | | | | | | | (789,248 | ) |
| | | | |
| | (9,700 | ) | | Molson Coors Brewing Company, Class B | | | | | | | | | | | (660,473 | ) |
| | | | |
| | (4,850 | ) | | Monster Beverage Corporation, (2) | | | | | | | | | | | (671,531 | ) |
| | | | Total Beverages | | | | | | | | | | | (2,807,952 | ) |
| | | | |
| | | | Biotechnology – (0.4)% | | | | | | | | | |
| | | | |
| | (1,818 | ) | | Intercept Pharmaceuticals Incorporated, (2) | | | | | | | | | | | (344,984 | ) |
| | | | |
| | | | Building Products – (0.9)% | | | | | | | | | |
| | | | |
| | (6,551 | ) | | Lennox International Inc. | | | | | | | | | | | (773,280 | ) |
| | | | | | | | | | | | |
| Shares | | | Description (1) | | | | | | Value | |
| | | | |
| | | | Capital Markets – (0.8)% | | | | | | | |
| | | | |
| | (22,693 | ) | | Charles Schwab Corporation | | | | | | $ | (689,413 | ) |
| | | | |
| | | | Chemicals – (6.4)% | | | | | | | |
| | | | |
| | (5,480 | ) | | Air Products & Chemicals Inc. | | | | | | | (764,624 | ) |
| | | | |
| | (7,100 | ) | | Airgas, Inc. | | | | | | | (685,292 | ) |
| | | | |
| | (11,515 | ) | | CF Industries Holdings, Inc. | | | | | | | (660,731 | ) |
| | | | |
| | (13,800 | ) | | E.I. Du Pont de Nemours and Company | | | | | | | (710,700 | ) |
| | | | |
| | (15,673 | ) | | FMC Corporation | | | | | | | (663,125 | ) |
| | | | |
| | (31,642 | ) | | Platform Specialty Products Corporation, (2) | | | | | | | (605,628 | ) |
| | | | |
| | (6,674 | ) | | Praxair, Inc. | | | | | | | (705,776 | ) |
| | | | |
| | (7,246 | ) | | WR Grace & Company, (2) | | | | | | | (716,919 | ) |
| | | | Total Chemicals | | | | | | | (5,512,795 | ) |
| | | | |
| | | | Commercial Services & Supplies – (1.6)% | | | | | | | |
| | | | |
| | (33,000 | ) | | Covanta Holding Corporation | | | | | | | (653,400 | ) |
| | | | |
| | (19,800 | ) | | Tyco International PLC | | | | | | | (718,542 | ) |
| | | | Total Commercial Services & Supplies | | | | | | | (1,371,942 | ) |
| | | | |
| | | | Construction Materials – (2.6)% | | | | | | | |
| | | | |
| | (9,000 | ) | | Eagle Materials Inc. | | | | | | | (736,470 | ) |
| | | | |
| | (4,761 | ) | | Martin Marietta Materials | | | | | | | (798,896 | ) |
| | | | |
| | (7,900 | ) | | Vulcan Materials Company | | | | | | | (739,598 | ) |
| | | | Total Construction Materials | | | | | | | (2,274,964 | ) |
| | | | |
| | | | Electric Utilities – (1.6)% | | | | | | | |
| | | | |
| | (23,800 | ) | | Hawaiian Electric Industries | | | | | | | (672,826 | ) |
| | | | |
| | (22,600 | ) | | ITC Holdings Corporation | | | | | | | (739,020 | ) |
| | | | Total Electric Utilities | | | | | | | (1,411,846 | ) |
| | | | |
| | | | Electronic Equipment, Instruments & Components – (1.6)% | | | | | | | |
| | | | |
| | (13,600 | ) | | Amphenol Corporation, Class A | | | | | | | (712,096 | ) |
| | | | |
| | (22,500 | ) | | FLIR Systems Inc. | | | | | | | (644,175 | ) |
| | | | Total Electronic Equipment, Instruments & Components | | | | | | | (1,356,271 | ) |
| | | | |
| | | | Energy Equipment & Services – (1.5)% | | | | | | | |
| | | | |
| | (16,740 | ) | | Halliburton Company | | | | | | | (658,719 | ) |
| | | | |
| | (7,900 | ) | | Schlumberger Limited | | | | | | | (611,223 | ) |
| | | | Total Energy Equipment & Services | | | | | | | (1,269,942 | ) |
| | | | |
| | | | Food & Staples Retailing – (0.9)% | | | | | | | |
| | | | |
| | (36,300 | ) | | Sprouts Farmers Market Inc., (2) | | | | | | | (739,431 | ) |
| | | | |
| | | | Food Products – (3.5)% | | | | | | | |
| | | | |
| | (8,778 | ) | | Hershey Foods Corporation | | | | | | | (785,807 | ) |
| | | | |
| | (6,952 | ) | | JM Smucker Company | | | | | | | (818,389 | ) |
| | | | |
| | (12,800 | ) | | Keurig Green Mountain Inc. | | | | | | | (724,480 | ) |
Nuveen Equity Long/Short Fund (continued)
| | |
| Portfolio of Investments | | August 31, 2015 |
| | | | | | | | | | | | |
| Shares | | | Description (1) | | | | | | Value | |
| | | | |
| | | | Food Products (continued) | | | | | | | |
| | | | |
| | (15,615 | ) | | Mondelez International Inc. | | | | | | $ | (661,451 | ) |
| | | | Total Food Products | | | | | | | (2,990,127 | ) |
| | | | |
| | | | Health Care Equipment & Supplies – (2.4)% | | | | | | | |
| | | | |
| | (5,100 | ) | | Becton, Dickinson and Company | | | | | | | (719,202 | ) |
| | | | |
| | (4,283 | ) | | Cooper Companies, Inc. | | | | | | | (695,645 | ) |
| | | | |
| | (9,300 | ) | | Idexx Labs Inc., (2) | | | | | | | (664,671 | ) |
| | | | Total Health Care Equipment & Supplies | | | | | | | (2,079,518 | ) |
| | | | |
| | | | Health Care Providers & Services – (1.7)% | | | | | | | |
| | | | |
| | (25,209 | ) | | Brookdale Senior Living Inc., (2) | | | | | | | (691,231 | ) |
| | | | |
| | (6,277 | ) | | Laboratory Corporation of America Holdings, (2) | | | | | | | (739,493 | ) |
| | | | Total Health Care Providers & Services | | | | | | | (1,430,724 | ) |
| | | | |
| | | | Health Care Technology – (0.7)% | | | | | | | |
| | | | |
| | (4,610 | ) | | AthenaHealth Inc., (2) | | | | | | | (612,992 | ) |
| | | | |
| | | | Hotels, Restaurants & Leisure – (1.5)% | | | | | | | |
| | | | |
| | (74,000 | ) | | The Wendy’s Company | | | | | | | (674,140 | ) |
| | | | |
| | (8,537 | ) | | Wynn Resorts Ltd | | | | | | | (640,702 | ) |
| | | | Total Hotels, Restaurants & Leisure | | | | | | | (1,314,842 | ) |
| | | | |
| | | | Household Durables – (3.4)% | | | | | | | |
| | | | |
| | (18,600 | ) | | Garmin Limited | | | | | | | (699,546 | ) |
| | | | |
| | (14,864 | ) | | Lennar Corporation, Class A | | | | | | | (756,578 | ) |
| | | | |
| | (36,639 | ) | | Pulte Corporation | | | | | | | (758,061 | ) |
| | | | |
| | (19,500 | ) | | Toll Brothers Inc., (2) | | | | | | | (720,915 | ) |
| | | | Total Household Durables | | | | | | | (2,935,100 | ) |
| | | | |
| | | | Household Products – (0.8)% | | | | | | | |
| | | | |
| | (10,967 | ) | | Colgate-Palmolive Company | | | | | | | (688,837 | ) |
| | | | |
| | | | Insurance – (0.8)% | | | | | | | |
| | | | |
| | (15,278 | ) | | Arthur J. Gallagher & Co. | | | | | | | (667,954 | ) |
| | | | |
| | | | Internet Software & Services – (1.5)% | | | | | | | |
| | | | |
| | (37,850 | ) | | Pandora Media, Inc., (2) | | | | | | | (679,029 | ) |
| | | | |
| | (19,664 | ) | | Yahoo! Inc., (2) | | | | | | | (633,967 | ) |
| | | | Total Internet Software & Services | | | | | | | (1,312,996 | ) |
| | | | |
| | | | IT Services – (0.8)% | | | | | | | |
| | | | |
| | (23,176 | ) | | VeriFone Holdings Inc., (2) | | | | | | | (724,018 | ) |
| | | | |
| | | | Machinery – (2.5)% | | | | | | | |
| | | | |
| | (23,259 | ) | | Donaldson Company, Inc. | | | | | | | (728,239 | ) |
| | | | |
| | (10,658 | ) | | Toro Company | | | | | | | (759,915 | ) |
| | | | |
| | (6,167 | ) | | WABCO Holdings Inc. | | | | | | | (711,178 | ) |
| | | | Total Machinery | | | | | | | (2,199,332 | ) |
| | | | | | | | | | | | |
| Shares | | | Description (1) | | | | | | Value | |
| | | | |
| | | | Media – (0.8)% | | | | | | | |
| | | | |
| | (19,523 | ) | | Lions Gate Entertainment Corporation, Equity | | | | | | $ | (716,299 | ) |
| | | | |
| | | | Metals & Mining – (1.8)% | | | | | | | |
| | | | |
| | (9,500 | ) | | Compass Minerals International, Inc. | | | | | | | (769,500 | ) |
| | | | |
| | (27,856 | ) | | Southern Copper Corporation | | | | | | | (742,641 | ) |
| | | | Total Metals & Mining | | | | | | | (1,512,141 | ) |
| | | | |
| | | | Multi-Utilities – (1.5)% | | | | | | | |
| | | | |
| | (10,204 | ) | | Dominion Resources, Inc. | | | | | | | (711,729 | ) |
| | | | |
| | (34,516 | ) | | MDU Resources Group Inc. | | | | | | | (618,182 | ) |
| | | | Total Multi-Utilities | | | | | | | (1,329,911 | ) |
| | | | |
| | | | Oil, Gas & Consumable Fuels – (7.5)% | | | | | | | |
| | | | |
| | (6,662 | ) | | Cimarex Energy Company | | | | | | | (736,218 | ) |
| | | | |
| | (14,695 | ) | | ConocoPhillips | | | | | | | (722,259 | ) |
| | | | |
| | (52,346 | ) | | CONSOL Energy Inc. | | | | | | | (797,230 | ) |
| | | | |
| | (13,497 | ) | | Energen Corporation | | | | | | | (701,844 | ) |
| | | | |
| | (7,456 | ) | | EQT Corporation | | | | | | | (580,226 | ) |
| | | | |
| | (17,485 | ) | | Golar LNG, Limited | | | | | | | (680,866 | ) |
| | | | |
| | (21,900 | ) | | Kinder Morgan, Inc. | | | | | | | (709,779 | ) |
| | | | |
| | (21,989 | ) | | ONEOK, Inc. | | | | | | | (791,824 | ) |
| | | | |
| | (15,568 | ) | | Williams Companies, Inc. | | | | | | | (750,378 | ) |
| | | | Total Oil, Gas & Consumable Fuels | | | | | | | (6,470,624 | ) |
| | | | |
| | | | Pharmaceuticals – (0.8)% | | | | | | | |
| | | | |
| | (17,600 | ) | | Akorn, Inc., (2) | | | | | | | (700,304 | ) |
| | | | |
| | | | Professional Services – (1.4)% | | | | | | | |
| | | | |
| | (4,139 | ) | | IHS Inc., (2) | | | | | | | (480,207 | ) |
| | | | |
| | (16,735 | ) | | Nielsen Holdings PLC | | | | | | | (756,924 | ) |
| | | | Total Professional Services | | | | | | | (1,237,131 | ) |
| | | | |
| | | | Road & Rail – (2.5)% | | | | | | | |
| | | | |
| | (40,000 | ) | | Hertz Global Holdings Inc., (2) | | | | | | | (737,200 | ) |
| | | | |
| | (7,700 | ) | | Kansas City Southern Industries | | | | | | | (714,098 | ) |
| | | | |
| | (10,500 | ) | | Old Dominion Freight Line, (2) | | | | | | | (698,145 | ) |
| | | | Total Road & Rail | | | | | | | (2,149,443 | ) |
| | | | |
| | | | Semiconductors & Semiconductor Equipment – (2.6)% | | | | | | | |
| | | | |
| | (15,844 | ) | | Cree, Inc., (2) | | | | | | | (431,274 | ) |
| | | | |
| | (64,600 | ) | | Cypress Semiconductor Corporation | | | | | | | (646,000 | ) |
| | | | |
| | (18,200 | ) | | Linear Technology Corporation | | | | | | | (733,096 | ) |
| | | | |
| | (18,842 | ) | | SunPower Corporation, (2) | | | | | | | (457,107 | ) |
| | | | Total Semiconductors & Semiconductor Equipment | | | | | | | (2,267,477 | ) |
Nuveen Equity Long/Short Fund (continued)
| | |
| Portfolio of Investments | | August 31, 2015 |
| | | | | | | | | | | | |
| Shares | | | Description (1) | | | | | | Value | |
| | | | |
| | | | Software – (4.3)% | | | | | | | |
| | | | |
| | (9,226 | ) | | Adobe Systems Incorporated, (2) | | | | | | $ | (724,887 | ) |
| | | | |
| | (14,569 | ) | | Autodesk, Inc., (2) | | | | | | | (681,101 | ) |
| | | | |
| | (8,214 | ) | | NetSuite Inc., (2) | | | | | | | (729,814 | ) |
| | | | |
| | (3,950 | ) | | Ultimate Software Group, Inc., (2) | | | | | | | (695,950 | ) |
| | | | |
| | (7,644 | ) | | Workday Inc., Class A, (2) | | | | | | | (537,067 | ) |
| | | | |
| | (135,000 | ) | | Zynga Inc., (2) | | | | | | | (341,550 | ) |
| | | | Total Software | | | | | | | (3,710,369 | ) |
| | | | |
| | | | Specialty Retail – (2.4)% | | | | | | | |
| | | | |
| | (17,085 | ) | | Cabela’s Incorporated, (2) | | | | | | | (768,312 | ) |
| | | | |
| | (11,200 | ) | | CarMax, Inc., (2) | | | | | | | (683,200 | ) |
| | | | |
| | (7,900 | ) | | Tiffany & Co. | | | | | | | (649,775 | ) |
| | | | Total Specialty Retail | | | | | | | (2,101,287 | ) |
| | | | |
| | | | Technology Hardware, Storage & Peripherals – (0.9)% | | | | | | | |
| | | | |
| | (57,000 | ) | | 3D Systems Corporation, (2) | | | | | | | (782,610 | ) |
| | | | |
| | | | Textiles, Apparel & Luxury Goods – (2.6)% | | | | | | | |
| | | | |
| | (26,500 | ) | | Hanesbrands Inc. | | | | | | | (797,915 | ) |
| | | | |
| | (35,069 | ) | | Kate Spade & Company, (2) | | | | | | | (664,908 | ) |
| | | | |
| | (7,800 | ) | | Under Armour, Inc., (2) | | | | | | | (745,134 | ) |
| | | | Total Textiles, Apparel & Luxury Goods | | | | | | | (2,207,957 | ) |
| | | | |
| | | | Thrifts & Mortgage Finance – (0.9)% | | | | | | | |
| | | | |
| | (45,115 | ) | | TFS Financial Corporation | | | | | | | (774,625 | ) |
| | | | |
| | | | Tobacco – (0.9)% | | | | | | | |
| | | | |
| | (9,100 | ) | | Reynolds American Inc. | | | | | | | (762,125 | ) |
| | | | |
| | | | Trading Companies & Distributors – (1.6)% | | | | | | | |
| | | | |
| | (16,867 | ) | | Fastenal Company | | | | | | | (650,054 | ) |
| | | | |
| | (6,000 | ) | | Watsco Inc. | | | | | | | (734,760 | ) |
| | | | Total Trading Companies & Distributors | | | | | | | (1,384,814 | ) |
| | | | |
| | | | Transportation Infrastructure – (0.8)% | | | | | | | |
| | | | |
| | (9,100 | ) | | Macquarie Infrastructure Corporation | | | | | | | (716,352 | ) |
| | | | |
| | | | Water Utilities – (0.8)% | | | | | | | |
| | | | |
| | (12,825 | ) | | American Water Works Company | | | | | | | (666,130 | ) |
| | | | Total Common Stocks Sold Short (proceeds $74,813,804) | | | | | | | (69,280,980 | ) |
| | | | Other Assets Less Liabilities – 16.8% | | | | | | | 14,542,836 | |
| | | | Net Assets – 100% | | | | | | $ | 86,466,270 | |
For Fund portfolio compliance purposes, the Fund’s industry classifications refer to any one or more of the industry sub-classifications used by one or more widely recognized market indexes or ratings group indexes, and/or as defined by Fund management. This definition may not apply for purposes of this report, which may combine industry sub-classifications into sectors for reporting ease.
| (1) | All percentages shown in the Portfolio of Investments are based on net assets. |
| (2) | Non-income producing; issuer has not declared a dividend within the past twelve months. |
| (3) | The Fund may pledge up to 100% of its eligible long-term investments in the Portfolio of Investments as collateral for Common Stocks Sold Short. As of the end of the reporting period, long-term investments with a value of $76,580,934 have been pledged as collateral for Common Stocks Sold Short. |
See accompanying notes to financial statements.
Nuveen Equity Market Neutral Fund
| | |
| Portfolio of Investments | | August 31, 2015 |
| | | | | | | | |
| Shares | | | Description (1) | | Value | |
| | |
| | | | LONG-TERM INVESTMENTS – 93.8% | | | | |
| | |
| | | | COMMON STOCKS – 93.8% | | | | |
| | |
| | | | Aerospace & Defense – 5.1% | | | |
| | |
| | 3,600 | | | Boeing Company | | $ | 470,448 | |
| | |
| | 4,400 | | | Huntington Ingalls Industries Inc. | | | 495,352 | |
| | |
| | 900 | | | L-3 Communications Holdings, Inc. | | | 94,923 | |
| | |
| | 9,300 | | | Spirit AeroSystems Holdings Inc., (2) | | | 475,323 | |
| | |
| | 9,500 | | | Triumph Group Inc. | | | 469,205 | |
| | |
| | 3,700 | | | United Technologies Corporation | | | 338,957 | |
| | | | Total Aerospace & Defense | | | 2,344,208 | |
| | |
| | | | Airlines – 0.9% | | | |
| | |
| | 9,800 | | | Delta Air Lines, Inc. | | | 429,044 | |
| | |
| | | | Auto Components – 2.5% | | | |
| | |
| | 5,500 | | | Delphi Automotive PLC | | | 415,360 | |
| | |
| | 11,700 | | | Goodyear Tire & Rubber Company | | | 348,309 | |
| | |
| | 3,800 | | | Lear Corporation | | | 390,602 | |
| | | | Total Auto Components | | | 1,154,271 | |
| | |
| | | | Automobiles – 1.4% | | | |
| | |
| | 6,000 | | | General Motors Company | | | 176,640 | |
| | |
| | 8,800 | | | Thor Industries, Inc. | | | 480,304 | |
| | | | Total Automobiles | | | 656,944 | |
| | |
| | | | Banks – 1.9% | | | |
| | |
| | 29,100 | | | Bank of America Corporation | | | 475,494 | |
| | |
| | 6,000 | | | JPMorgan Chase & Co. | | | 384,600 | |
| | | | Total Banks | | | 860,094 | |
| | |
| | | | Beverages – 0.8% | | | |
| | |
| | 4,200 | | | PepsiCo, Inc. | | | 390,306 | |
| | |
| | | | Biotechnology – 2.5% | | | |
| | |
| | 3,100 | | | Amgen Inc. | | | 470,518 | |
| | |
| | 700 | | | Biogen Inc., (2) | | | 208,110 | |
| | |
| | 4,500 | | | Gilead Sciences, Inc. | | | 472,815 | |
| | | | Total Biotechnology | | | 1,151,443 | |
| | |
| | | | Capital Markets – 3.0% | | | |
| | |
| | 10,100 | | | Bank New York Mellon | | | 401,980 | |
| | |
| | 9,900 | | | Lazard Limited | | | 492,327 | |
| | |
| | 14,000 | | | Morgan Stanley | | | 482,300 | |
| | | | Total Capital Markets | | | 1,376,607 | |
Nuveen Equity Market Neutral Fund (continued)
| | |
| Portfolio of Investments | | August 31, 2015 |
| | | | | | | | |
| Shares | | | Description (1) | | Value | |
| | |
| | | | Chemicals – 0.9% | | | |
| | |
| | 12,500 | | | Cabot Corporation | | $ | 423,375 | |
| | |
| | | | Commercial Services & Supplies – 0.8% | | | |
| | |
| | 24,400 | | | R.R. Donnelley & Sons Company | | | 383,080 | |
| | |
| | | | Communications Equipment – 2.3% | | | |
| | |
| | 35,900 | | | Brocade Communications Systems Inc. | | | 382,335 | |
| | |
| | 2,500 | | | F5 Networks, Inc., (2) | | | 303,525 | |
| | |
| | 14,700 | | | Juniper Networks Inc. | | | 377,937 | |
| | | | Total Communications Equipment | | | 1,063,797 | |
| | |
| | | | Consumer Finance – 0.7% | | | |
| | |
| | 3,100 | | | American Express Company | | | 237,832 | |
| | |
| | 400 | | | Credit Acceptance Corporation, (2) | | | 81,524 | |
| | | | Total Consumer Finance | | | 319,356 | |
| | |
| | | | Containers & Packaging – 0.9% | | | |
| | |
| | 6,000 | | | AptarGroup Inc. | | | 404,160 | |
| | |
| | | | Diversified Consumer Services – 0.4% | | | |
| | |
| | 18,100 | | | Apollo Group, Inc., (2) | | | 201,091 | |
| | |
| | | | Diversified Telecommunication Services – 1.8% | | | |
| | |
| | 14,500 | | | CenturyLink Inc. | | | 392,080 | |
| | |
| | 21,500 | | | Intelsat SA, (2) | | | 207,905 | |
| | |
| | 32,300 | | | Windstream Holdings Inc. | | | 232,237 | |
| | | | Total Diversified Telecommunication Services | | | 832,222 | |
| | |
| | | | Electrical Equipment – 1.6% | | | |
| | |
| | 4,500 | | | Regal-Beloit Corporation | | | 300,015 | |
| | |
| | 3,800 | | | Rockwell Automation, Inc. | | | 424,954 | |
| | | | Total Electrical Equipment | | | 724,969 | |
| | |
| | | | Electronic Equipment, Instruments & Components – 2.6% | | | |
| | |
| | 20,800 | | | Corning Incorporated | | | 357,968 | |
| | |
| | 25,300 | | | Jabil Circuit Inc. | | | 489,555 | |
| | |
| | 36,400 | | | Vishay Intertechnology Inc. | | | 359,632 | |
| | | | Total Electronic Equipment, Instruments & Components | | | 1,207,155 | |
| | |
| | | | Energy Equipment & Services – 1.8% | | | |
| | |
| | 36,600 | | | Noble Corporation PLC | | | 476,532 | |
| | |
| | 18,300 | | | Tidewater Inc. | | | 328,119 | |
| | | | Total Energy Equipment & Services | | | 804,651 | |
| | |
| | | | Food & Staples Retailing – 0.7% | | | |
| | |
| | 10,200 | | | Whole Foods Market, Inc. | | | 334,152 | |
| | |
| | | | Food Products – 1.7% | | | |
| | |
| | 8,400 | | | Archer-Daniels-Midland Company | | | 377,916 | |
| | | | | | | | |
| Shares | | | Description (1) | | Value | |
| | |
| | | | Food Products (continued) | | | |
| | |
| | 18,300 | | | Pilgrim’s Pride Corporation | | $ | 383,843 | |
| | | | Total Food Products | | | 761,759 | |
| | |
| | | | Health Care Equipment & Supplies – 0.5% | | | |
| | |
| | 3,100 | | | Saint Jude Medical Inc. | | | 219,511 | |
| | |
| | | | Health Care Providers & Services – 7.3% | | | |
| | |
| | 4,100 | | | Aetna Inc. | | | 469,532 | |
| | |
| | 4,100 | | | AmerisourceBergen Corporation | | | 410,164 | |
| | |
| | 3,300 | | | Anthem Inc. | | | 465,465 | |
| | |
| | 4,900 | | | Cardinal Health, Inc. | | | 403,123 | |
| | |
| | 7,400 | | | Centene Corporation, (2) | | | 456,728 | |
| | |
| | 6,100 | | | Health Net Inc., (2) | | | 390,766 | |
| | |
| | 1,500 | | | McKesson HBOC Inc. | | | 296,370 | |
| | |
| | 4,100 | | | UnitedHealth Group Incorporated | | | 474,370 | |
| | | | Total Health Care Providers & Services | | | 3,366,518 | |
| | |
| | | | Hotels, Restaurants & Leisure – 1.7% | | | |
| | |
| | 6,900 | | | Brinker International Inc. | | | 366,597 | |
| | |
| | 5,700 | | | Darden Restaurants, Inc. | | | 387,657 | |
| | |
| | 700 | | | Marriott International, Inc., Class A | | | 49,462 | |
| | | | Total Hotels, Restaurants & Leisure | | | 803,716 | |
| | |
| | | | Household Durables – 0.4% | | | |
| | |
| | 3,700 | | | Leggett and Platt Inc. | | | 164,354 | |
| | |
| | | | Insurance – 2.8% | | | |
| | |
| | 3,000 | | | Aspen Insurance Holdings Limited | | | 137,730 | |
| | |
| | 19,300 | | | Assured Guaranty Limited | | | 487,518 | |
| | |
| | 1,400 | | | Everest Reinsurance Group Ltd | | | 246,134 | |
| | |
| | 4,100 | | | Travelers Companies, Inc. | | | 408,155 | |
| | | | Total Insurance | | | 1,279,537 | |
| | |
| | | | Internet & Catalog Retail – 1.1% | | | |
| | |
| | 4,200 | | | Expedia, Inc. | | | 482,958 | |
| | |
| | | | Internet Software & Services – 2.8% | | | |
| | |
| | 14,900 | | | eBay Inc., (2) | | | 403,939 | |
| | |
| | 6,700 | | | IAC/InterActiveCorp. | | | 467,660 | |
| | |
| | 5,800 | | | VeriSign, Inc., (2) | | | 399,852 | |
| | | | Total Internet Software & Services | | | 1,271,451 | |
| | |
| | | | IT Services – 3.8% | | | |
| | |
| | 6,300 | | | Computer Sciences Corporation | | | 390,537 | |
| | |
| | 7,400 | | | CoreLogic Inc. | | | 280,830 | |
| | |
| | 2,800 | | | Gartner Inc., (2) | | | 239,428 | |
Nuveen Equity Market Neutral Fund (continued)
| | |
| Portfolio of Investments | | August 31, 2015 |
| | | | | | | | |
| Shares | | | Description (1) | | Value | |
| | |
| | | | IT Services (continued) | | | |
| | |
| | 4,600 | | | MasterCard, Inc. | | $ | 424,902 | |
| | |
| | 39,200 | | | Xerox Corporation | | | 398,664 | |
| | | | Total IT Services | | | 1,734,361 | |
| | |
| | | | Machinery – 4.5% | | | |
| | |
| | 9,600 | | | AGCO Corporation | | | 470,784 | |
| | |
| | 14,400 | | | Allison Transmission Holdings Inc. | | | 411,840 | |
| | |
| | 1,300 | | | Lincoln Electric Holdings Inc. | | | 76,245 | |
| | |
| | 3,700 | | | Parker Hannifin Corporation | | | 398,342 | |
| | |
| | 15,900 | | | Terex Corporation | | | 370,947 | |
| | |
| | 13,400 | | | Trinity Industries Inc. | | | 361,666 | |
| | | | Total Machinery | | | 2,089,824 | |
| | |
| | | | Media – 4.3% | | | |
| | |
| | 14,700 | | | Cablevision Systems Corporation | | | 369,999 | |
| | |
| | 6,500 | | | Comcast Corporation, Class A | | | 366,145 | |
| | |
| | 7,400 | | | Interpublic Group of Companies, Inc. | | | 139,712 | |
| | |
| | 8,700 | | | Scripps Networks Interactive, Class A Shares | | | 461,883 | |
| | |
| | 109,200 | | | Sirius XM Holdings Inc., (2) | | | 416,598 | |
| | |
| | 5,700 | | | Viacom Inc., Class B | | | 232,389 | |
| | | | Total Media | | | 1,986,726 | |
| | |
| | | | Metals & Mining – 1.1% | | | |
| | |
| | 11,200 | | | Nucor Corporation | | | 484,848 | |
| | |
| | 500 | | | Reliance Steel & Aluminum Company | | | 29,060 | |
| | | | Total Metals & Mining | | | 513,908 | |
| | |
| | | | Multiline Retail – 3.5% | | | |
| | |
| | 9,300 | | | Big Lots, Inc. | | | 446,307 | |
| | |
| | 3,700 | | | Dillard’s, Inc., Class A | | | 342,287 | |
| | |
| | 6,500 | | | Kohl’s Corporation | | | 331,695 | |
| | |
| | 6,000 | | | Target Corporation | | | 466,260 | |
| | | | Total Multiline Retail | | | 1,586,549 | |
| | |
| | | | Oil, Gas & Consumable Fuels – 3.3% | | | |
| | |
| | 9,800 | | | CVTR Energy Inc. | | | 394,058 | |
| | |
| | 100,600 | | | Denbury Resources Inc. | | | 436,604 | |
| | |
| | 26,400 | | | Oasis Petroleum Inc., (2) | | | 294,624 | |
| | |
| | 6,400 | | | Valero Energy Corporation | | | 379,776 | |
| | | | Total Oil, Gas & Consumable Fuels | | | 1,505,062 | |
| | |
| | | | Personal Products – 1.2% | | | |
| | |
| | 10,100 | | | Avon Products, Inc. | | | 52,419 | |
| | |
| | 8,300 | | | Herbalife, Limited | | | 477,831 | |
| | | | Total Personal Products | | | 530,250 | |
| | | | | | | | |
| Shares | | | Description (1) | | Value | |
| | |
| | | | Pharmaceuticals – 0.2% | | | |
| | |
| | 1,700 | | | Merck & Company Inc. | | $ | 91,545 | |
| | |
| | | | Road & Rail – 0.9% | | | |
| | |
| | 9,100 | | | Avis Budget Group Inc., (2) | | | 401,583 | |
| | |
| | | | Semiconductors & Semiconductor Equipment – 2.7% | | | |
| | |
| | 14,900 | | | Intel Corporation | | | 425,246 | |
| | |
| | 37,500 | | | Marvell Technology Group Ltd. | | | 422,625 | |
| | |
| | 18,100 | | | NVIDIA Corporation | | | 406,888 | |
| | | | Total Semiconductors & Semiconductor Equipment | | | 1,254,759 | |
| | |
| | | | Software – 3.9% | | | |
| | |
| | 5,700 | | | CA Technologies | | | 155,553 | |
| | |
| | 6,800 | | | Citrix Systems, (2) | | | 463,148 | |
| | |
| | 5,800 | | | Electronic Arts Inc., (2) | | | 383,670 | |
| | |
| | 9,800 | | | Oracle Corporation | | | 363,482 | |
| | |
| | 5,600 | | | Red Hat, Inc., (2) | | | 404,376 | |
| | | | Total Software | | | 1,770,229 | |
| | |
| | | | Specialty Retail – 7.7% | | | |
| | |
| | 12,600 | | | Aaron Rents Inc. | | | 474,390 | |
| | |
| | 13,800 | | | Best Buy Co., Inc. | | | 507,012 | |
| | |
| | 26,400 | | | Chico’s FAS, Inc. | | | 393,624 | |
| | |
| | 10,500 | | | GameStop Corporation | | | 446,040 | |
| | |
| | 4,100 | | | Home Depot, Inc. | | | 477,486 | |
| | |
| | 6,200 | | | Lowe’s Companies, Inc. | | | 428,854 | |
| | |
| | 53,000 | | | Office Depot, Inc., (2) | | | 420,290 | |
| | |
| | 26,700 | | | Staples, Inc. | | | 379,407 | |
| | | | Total Specialty Retail | | | 3,527,103 | |
| | |
| | | | Technology Hardware, Storage & Peripherals – 3.5% | | | |
| | |
| | 4,400 | | | Apple, Inc. | | | 496,144 | |
| | |
| | 15,200 | | | EMC Corporation | | | 378,024 | |
| | |
| | 17,000 | | | Hewlett-Packard Company | | | 477,020 | |
| | |
| | 9,100 | | | Lexmark International, Inc., Class A | | | 272,818 | |
| | | | Total Technology Hardware, Storage & Peripherals | | | 1,624,006 | |
| | |
| | | | Textiles, Apparel & Luxury Goods – 0.2% | | | |
| | |
| | 1,000 | | | Carter’s Inc. | | | 98,310 | |
| | |
| | | | Trading Companies & Distributors – 1.1% | | | |
| | |
| | 8,700 | | | WESCO International Inc., (2) | | | 486,939 | |
| | |
| | | | Wireless Telecommunication Services – 1.0% | | | |
| | |
| | 12,000 | | | T-Mobile US Inc., (2) | | | 475,320 | |
| | | | Total Long-Term Investments (cost $44,527,910) | | | 43,087,203 | |
Nuveen Equity Market Neutral Fund (continued)
| | |
| Portfolio of Investments | | August 31, 2015 |
| | | | | | | | | | | | | | | | |
| | | | |
Principal Amount (000) | | | Description (1) | | Coupon | | | Maturity | | | Value | |
| | | | |
| | | | SHORT-TERM INVESTMENTS – 14.1% | | | | | | | | | | | | |
| | | | |
| | | | REPURCHASE AGREEMENTS – 14.1% | | | | | | | | | | | | |
| | | | |
| $ | 6,495 | | | Repurchase Agreement with Fixed Income Clearing Corporation, dated 8/31/15, repurchase price $6,495,033, collateralized by $6,540,000 U.S. Treasury Notes, 2.250%, due 11/15/24, value $6,629,925 | | | 0.000% | | | | 9/01/15 | | | $ | 6,495,033 | |
| | | | Total Short-Term Investments (cost $6,495,033) | | | | | | | | | | | 6,495,033 | |
| | | | Total Investments (cost $51,022,943) – 107.9% | | | | | | | | | | | 49,582,236 | |
| | | | | | | | |
| | |
| Shares | | | Description (1) | | Value | |
| | |
| | | | COMMON STOCKS SOLD SHORT – (77.5)% (3) | | | | |
| | |
| | | | Aerospace & Defense – (3.1)% | | | |
| | |
| | (7,000 | ) | | BE Aerospace Inc. | | $ | (341,250 | ) |
| | |
| | (1,700 | ) | | Lockheed Martin Corporation | | | (342,006 | ) |
| | |
| | (5,200 | ) | | Orbital ATK, Inc. | | | (393,692 | ) |
| | |
| | (3,300 | ) | | Raytheon Company | | | (338,448 | ) |
| | | | Total Aerospace & Defense | | | (1,415,396 | ) |
| | |
| | | | Airlines – (0.7)% | | | |
| | |
| | (6,400 | ) | | Spirit Airline Holdings, (2) | | | (328,000 | ) |
| | |
| | | | Automobiles – (0.9)% | | | |
| | |
| | (1,600 | ) | | Tesla Motors Inc., (2) | | | (398,496 | ) |
| | |
| | | | Banks – (0.7)% | | | |
| | |
| | (9,600 | ) | | BankUnited Inc. | | | (342,144 | ) |
| | |
| | | | Beverages – (1.6)% | | | |
| | |
| | (5,100 | ) | | Molson Coors Brewing Company, Class B | | | (347,259 | ) |
| | |
| | (2,800 | ) | | Monster Beverage Corporation, (2) | | | (387,688 | ) |
| | | | Total Beverages | | | (734,947 | ) |
| | |
| | | | Biotechnology – (0.5)% | | | |
| | |
| | (1,300 | ) | | Intercept Pharmaceuticals Incorporated, (2) | | | (246,688 | ) |
| | |
| | | | Building Products – (0.8)% | | | |
| | |
| | (7,400 | ) | | Fortune Brands Home & Security | | | (354,090 | ) |
| | |
| | | | Capital Markets – (0.7)% | | | |
| | |
| | (8,000 | ) | | Interactive Brokers Group, Inc. | | | (319,360 | ) |
| | |
| | | | Chemicals – (5.9)% | | | |
| | |
| | (2,700 | ) | | Air Products & Chemicals Inc. | | | (376,731 | ) |
| | |
| | (2,100 | ) | | Airgas, Inc. | | | (202,692 | ) |
| | |
| | (4,800 | ) | | Cytec Industries, Inc. | | | (356,160 | ) |
| | |
| | (7,000 | ) | | E.I. Du Pont de Nemours and Company | | | (360,500 | ) |
| | | | | | | | |
| Shares | | | Description (1) | | Value | |
| | |
| | | | Chemicals (continued) | | | |
| | |
| | (9,500 | ) | | FMC Corporation | | $ | (401,945 | ) |
| | |
| | (15,500 | ) | | Platform Specialty Products Corporation, (2) | | | (296,670 | ) |
| | |
| | (3,100 | ) | | Praxair, Inc. | | | (327,825 | ) |
| | |
| | (3,900 | ) | | WR Grace & Company, (2) | | | (385,866 | ) |
| | | | Total Chemicals | | | (2,708,389 | ) |
| | |
| | | | Commercial Services & Supplies – (0.9)% | | | |
| | |
| | (10,800 | ) | | Tyco International PLC | | | (391,932 | ) |
| | |
| | | | Communications Equipment – (1.5)% | | | |
| | |
| | (6,200 | ) | | Motorola Solutions Inc. | | | (401,884 | ) |
| | |
| | (1,800 | ) | | Palo Alto Networks, Incorporated, (2) | | | (295,596 | ) |
| | | | Total Communications Equipment | | | (697,480 | ) |
| | |
| | | | Construction & Engineering – (0.7)% | | | |
| | |
| | (19,000 | ) | | KBR Inc. | | | (331,360 | ) |
| | |
| | | | Construction Materials – (1.7)% | | | |
| | |
| | (4,900 | ) | | Eagle Materials Inc. | | | (400,967 | ) |
| | |
| | (900 | ) | | Martin Marietta Materials | | | (151,020 | ) |
| | |
| | (2,500 | ) | | Vulcan Materials Company | | | (234,050 | ) |
| | | | Total Construction Materials | | | (786,037 | ) |
| | |
| | | | Diversified Financial Services – (0.0)% | | | |
| | |
| | (1 | ) | | FNFV Group | | | (14 | ) |
| | |
| | | | Electric Utilities – (0.8)% | | | |
| | |
| | (11,800 | ) | | ITC Holdings Corporation | | | (385,860 | ) |
| | |
| | | | Electrical Equipment – (0.6)% | | | |
| | |
| | (6,000 | ) | | Solarcity Corporation, (2) | | | (289,680 | ) |
| | |
| | | | Electronic Equipment, Instruments & Components – (1.7)% | | | |
| | |
| | (12,100 | ) | | FLIR Systems Inc. | | | (346,423 | ) |
| | |
| | (5,500 | ) | | National Instruments Corporation | | | (160,655 | ) |
| | |
| | (3,300 | ) | | Zebra Technologies Corporation, Class A, (2) | | | (273,504 | ) |
| | | | Total Electronic Equipment, Instruments & Components | | | (780,582 | ) |
| | |
| | | | Energy Equipment & Services – (1.6)% | | | |
| | |
| | (8,400 | ) | | Halliburton Company | | | (330,540 | ) |
| | |
| | (13,900 | ) | | McDermott International Inc., (2) | | | (70,612 | ) |
| | |
| | (30,300 | ) | | RPC Inc. | | | (352,086 | ) |
| | | | Total Energy Equipment & Services | | | (753,238 | ) |
| | |
| | | | Food Products – (2.7)% | | | |
| | |
| | (3,500 | ) | | JM Smucker Company | | | (412,020 | ) |
| | |
| | (1,400 | ) | | Kellogg Company | | | (92,792 | ) |
| | |
| | (4,200 | ) | | McCormick & Company, Incorporated | | | (332,976 | ) |
Nuveen Equity Market Neutral Fund (continued)
| | |
| Portfolio of Investments | | August 31, 2015 |
| | | | | | | | |
| Shares | | | Description (1) | | Value | |
| | |
| | | | Food Products (continued) | | | |
| | |
| | (9,200 | ) | | Mondelez International Inc. | | $ | (389,712 | ) |
| | | | Total Food Products | | | (1,227,500 | ) |
| | |
| | | | Health Care Equipment & Supplies – (0.0)% | | | |
| | |
| | (200 | ) | | Idexx Labs Inc., (2) | | | (14,294 | ) |
| | |
| | | | Health Care Providers & Services – (2.3)% | | | |
| | |
| | (13,200 | ) | | Brookdale Senior Living Inc., (2) | | | (361,944 | ) |
| | |
| | (2,900 | ) | | Laboratory Corporation of America Holdings, (2) | | | (341,649 | ) |
| | |
| | (9,500 | ) | | Premier Inc., Class A, (2) | | | (338,675 | ) |
| | | | Total Health Care Providers & Services | | | (1,042,268 | ) |
| | |
| | | | Hotels, Restaurants & Leisure – (2.4)% | | | |
| | |
| | (5,800 | ) | | Norwegian Cruise Line Holdings Limited, (2) | | | (334,080 | ) |
| | |
| | (4,200 | ) | | Royal Caribbean Cruises Limited | | | (370,272 | ) |
| | |
| | (5,100 | ) | | Wynn Resorts Ltd | | | (382,755 | ) |
| | | | Total Hotels, Restaurants & Leisure | | | (1,087,107 | ) |
| | |
| | | | Household Durables – (3.8)% | | | |
| | |
| | (8,000 | ) | | Garmin Limited | | | (300,880 | ) |
| | |
| | (7,800 | ) | | Lennar Corporation, Class A | | | (397,020 | ) |
| | |
| | (17,900 | ) | | Pulte Corporation | | | (370,351 | ) |
| | |
| | (16,700 | ) | | Taylor Morrison, (2) | | | (333,165 | ) |
| | |
| | (9,500 | ) | | Toll Brothers Inc., (2) | | | (351,215 | ) |
| | | | Total Household Durables | | | (1,752,631 | ) |
| | |
| | | | Household Products – (0.9)% | | | |
| | |
| | (6,200 | ) | | Colgate-Palmolive Company | | | (389,422 | ) |
| | |
| | | | Insurance – (0.8)% | | | |
| | |
| | (7,900 | ) | | Arthur J. Gallagher & Co. | | | (345,388 | ) |
| | |
| | | | Internet Software & Services – (3.0)% | | | |
| | |
| | (1,600 | ) | | CoStar Group, Inc., (2) | | | (283,264 | ) |
| | |
| | (400 | ) | | LinkedIn Corporation, Class A Shares, (2) | | | (72,240 | ) |
| | |
| | (21,800 | ) | | Pandora Media, Inc., (2) | | | (391,092 | ) |
| | |
| | (8,000 | ) | | Twitter Inc., (2) | | | (222,320 | ) |
| | |
| | (11,900 | ) | | Yahoo! Inc., (2) | | | (383,656 | ) |
| | |
| | (1,800 | ) | | Yelp Incorporated, (2) | | | (43,704 | ) |
| | | | Total Internet Software & Services | | | (1,396,276 | ) |
| | |
| | | | IT Services – (0.8)% | | | |
| | |
| | (11,200 | ) | | VeriFone Holdings Inc., (2) | | | (349,888 | ) |
| | |
| | | | Machinery – (1.7)% | | | |
| | |
| | (12,500 | ) | | Donaldson Company, Inc. | | | (391,375 | ) |
| | |
| | (9,400 | ) | | Oshkosh Truck Corporation | | | (395,270 | ) |
| | | | Total Machinery | | | (786,645 | ) |
| | | | | | | | |
| Shares | | | Description (1) | | Value | |
| | |
| | | | Marine – (0.7)% | | | |
| | |
| | (4,500 | ) | | Kirby Corporation, (2) | | $ | (317,385 | ) |
| | |
| | | | Media – (1.4)% | | | |
| | |
| | (14,900 | ) | | Dreamworks Animation SKG Inc., (2) | | | (297,106 | ) |
| | |
| | (8,800 | ) | | Thomson Corporation | | | (341,616 | ) |
| | | | Total Media | | | (638,722 | ) |
| | |
| | | | Metals & Mining – (1.6)% | | | |
| | |
| | (4,200 | ) | | Compass Minerals International, Inc. | | | (340,200 | ) |
| | |
| | (15,600 | ) | | Southern Copper Corporation | | | (415,896 | ) |
| | | | Total Metals & Mining | | | (756,096 | ) |
| | |
| | | | Multi-Utilities – (3.2)% | | | |
| | |
| | (5,500 | ) | | Dominion Resources, Inc. | | | (383,625 | ) |
| | |
| | (21,900 | ) | | MDU Resources Group Inc. | | | (392,229 | ) |
| | |
| | (3,700 | ) | | Sempra Energy | | | (350,945 | ) |
| | |
| | (17,200 | ) | | TECO Energy, Inc. | | | (362,404 | ) |
| | | | Total Multi-Utilities | | | (1,489,203 | ) |
| | |
| | | | Oil, Gas & Consumable Fuels – (8.6)% | | | |
| | |
| | (5,300 | ) | | Anadarko Petroleum Corporation | | | (379,374 | ) |
| | |
| | (1,700 | ) | | Cabot Oil & Gas Corporation | | | (40,239 | ) |
| | |
| | (6,100 | ) | | Cheniere Energy Inc., (2) | | | (379,115 | ) |
| | |
| | (2,600 | ) | | Cimarex Energy Company | | | (287,326 | ) |
| | |
| | (41,100 | ) | | Cobalt International Energy, Inc., (2) | | | (329,211 | ) |
| | |
| | (12,400 | ) | | CONSOL Energy Inc. | | | (188,852 | ) |
| | |
| | (8,000 | ) | | Energen Corporation | | | (416,000 | ) |
| | |
| | (7,900 | ) | | Golar LNG, Limited | | | (307,626 | ) |
| | |
| | (10,100 | ) | | Kinder Morgan, Inc. | | | (327,341 | ) |
| | |
| | (2,000 | ) | | Occidental Petroleum Corporation | | | (146,020 | ) |
| | |
| | (9,400 | ) | | ONEOK, Inc. | | | (338,494 | ) |
| | |
| | (2,200 | ) | | Pioneer Natural Resources Company | | | (270,732 | ) |
| | |
| | (6,200 | ) | | Range Resources Corporation | | | (239,444 | ) |
| | |
| | (6,600 | ) | | Williams Companies, Inc. | | | (318,120 | ) |
| | | | Total Oil, Gas & Consumable Fuels | | | (3,967,894 | ) |
| | |
| | | | Pharmaceuticals – (1.1)% | | | |
| | |
| | (1,100 | ) | | Allergan PLC, (2) | | | (334,114 | ) |
| | |
| | (13,300 | ) | | Theravance Inc. | | | (185,003 | ) |
| | | | Total Pharmaceuticals | | | (519,117 | ) |
| | |
| | | | Road & Rail – (0.9)% | | | |
| | |
| | (22,700 | ) | | Hertz Global Holdings Inc., (2) | | | (418,361 | ) |
| | |
| | | | Semiconductors & Semiconductor Equipment – (4.9)% | | | |
| | |
| | (5,700 | ) | | Analog Devices, Inc. | | | (318,402 | ) |
Nuveen Equity Market Neutral Fund (continued)
| | |
| Portfolio of Investments | | August 31, 2015 |
| | | | | | | | |
| Shares | | | Description (1) | | Value | |
| | |
| | | | Semiconductors & Semiconductor Equipment (continued) | | | |
| | |
| | (12,100 | ) | | Cree, Inc., (2) | | $ | (329,362 | ) |
| | |
| | (41,800 | ) | | Cypress Semiconductor Corporation | | | (418,000 | ) |
| | |
| | (10,000 | ) | | Linear Technology Corporation | | | (402,800 | ) |
| | |
| | (8,200 | ) | | Microchip Technology Incorporated | | | (348,500 | ) |
| | |
| | (11,600 | ) | | SunEdison Inc., (2) | | | (120,640 | ) |
| | |
| | (12,500 | ) | | SunPower Corporation, (2) | | | (303,250 | ) |
| | | | Total Semiconductors & Semiconductor Equipment | | | (2,240,954 | ) |
| | |
| | | | Software – (3.6)% | | | |
| | |
| | (7,100 | ) | | FireEye Inc., (2) | | | (268,238 | ) |
| | |
| | (3,500 | ) | | NetSuite Inc., (2) | | | (310,975 | ) |
| | |
| | (4,800 | ) | | ServiceNow Inc., (2) | | | (340,608 | ) |
| | |
| | (1,700 | ) | | Splunk Inc., (2) | | | (105,349 | ) |
| | |
| | (4,300 | ) | | Workday Inc., Class A, (2) | | | (302,118 | ) |
| | |
| | (125,500 | ) | | Zynga Inc., (2) | | | (317,515 | ) |
| | | | Total Software | | | (1,644,803 | ) |
| | |
| | | | Specialty Retail – (3.1)% | | | |
| | |
| | (9,000 | ) | | Cabela’s Incorporated, (2) | | | (404,730 | ) |
| | |
| | (5,200 | ) | | CarMax, Inc., (2) | | | (317,200 | ) |
| | |
| | (2,800 | ) | | Signet Jewelers Limited | | | (386,400 | ) |
| | |
| | (3,800 | ) | | Tiffany & Co. | | | (312,550 | ) |
| | | | Total Specialty Retail | | | (1,420,880 | ) |
| | |
| | | | Technology Hardware, Storage & Peripherals – (0.7)% | | | |
| | |
| | (10,300 | ) | | Stratasys, Inc., (2) | | | (315,798 | ) |
| | |
| | | | Textiles, Apparel & Luxury Goods – (1.4)% | | | |
| | |
| | (14,900 | ) | | Kate Spade & Company, (2) | | | (282,504 | ) |
| | |
| | (3,600 | ) | | Under Armour, Inc., (2) | | | (343,908 | ) |
| | | | Total Textiles, Apparel & Luxury Goods | | | (626,412 | ) |
| | |
| | | | Thrifts & Mortgage Finance – (1.2)% | | | |
| | |
| | (17,700 | ) | | Nationstar Mortgage Holdings, Incorporated, (2) | | | (295,944 | ) |
| | |
| | (31,000 | ) | | Ocwen Financial Corporation, (2) | | | (230,640 | ) |
| | | | Total Thrifts & Mortgage Finance | | | (526,584 | ) |
| | |
| | | | Trading Companies & Distributors – (0.7)% | | | |
| | |
| | (8,800 | ) | | Fastenal Company | | | (339,152 | ) |
| | |
| | | | Transportation Infrastructure – (0.9)% | | | |
| | |
| | (5,100 | ) | | Macquarie Infrastructure Corporation | | | (401,472 | ) |
See accompanying notes to financial statements.
| | | | | | | | |
| Shares | | | Description (1) | | Value | |
| | |
| | | | Water Utilities – (0.7)% | | | |
| | |
| | (13,000 | ) | | Aqua America Inc. | | $ | (329,680 | ) |
| | | | Total Common Stocks Sold Short (proceeds $39,558,057) | | | (35,607,625 | ) |
| | | | Other Assets Less Liabilities – 69.6% | | | 31,994,818 | |
| | | | Net Assets – 100% | | $ | 45,969,429 | |
For Fund portfolio compliance purposes, the Fund’s industry classifications refer to any one or more of the industry sub-classifications used by one or more widely recognized market indexes or ratings group indexes, and/or as defined by Fund management. This definition may not apply for purposes of this report, which may combine industry sub-classifications into sectors for reporting ease.
| (1) | All percentages shown in the Portfolio of Investments are based on net assets. |
| (2) | Non-income producing; issuer has not declared a dividend within the past twelve months. |
| (3) | The Fund may pledge up to 100% of its eligible long-term investments in the Portfolio of Investments as collateral for Common Stocks Sold Short. As of the end of the reporting period, long-term investments with a value of $17,058,172 have been pledged as collateral for Common Stocks Sold Short. |
See accompanying notes to financial statements.
Nuveen Growth Fund
| | |
| Portfolio of Investments | | August 31, 2015 |
| | | | | | | | |
| Shares | | | Description (1) | | Value | |
| | |
| | | | LONG-TERM INVESTMENTS – 98.2% | | | | |
| | |
| | | | COMMON STOCKS – 98.2% | | | | |
| | |
| | | | Aerospace & Defense – 4.6% | | | |
| | |
| | 9,871 | | | Boeing Company | | $ | 1,289,942 | |
| | |
| | 9,565 | | | United Technologies Corporation | | | 876,250 | |
| | | | Total Aerospace & Defense | | | 2,166,192 | |
| | |
| | | | Automobiles – 0.5% | | | |
| | |
| | 4,047 | | | Thor Industries, Inc. | | | 220,885 | |
| | |
| | | | Banks – 1.3% | | | |
| | |
| | 11,592 | | | Wells Fargo & Company | | | 618,201 | |
| | |
| | | | Beverages – 7.6% | | | |
| | |
| | 15,021 | | | Coca-Cola Company | | | 590,626 | |
| | |
| | 16,684 | | | Dr. Pepper Snapple Group | | | 1,280,163 | |
| | |
| | 18,741 | | | PepsiCo, Inc. | | | 1,741,601 | |
| | | | Total Beverages | | | 3,612,390 | |
| | |
| | | | Biotechnology – 6.2% | | | |
| | |
| | 9,400 | | | Amgen Inc. | | | 1,426,732 | |
| | |
| | 4,862 | | | Celgene Corporation, (2) | | | 574,105 | |
| | |
| | 8,933 | | | Gilead Sciences, Inc. | | | 938,590 | |
| | | | Total Biotechnology | | | 2,939,427 | |
| | |
| | | | Containers & Packaging – 3.3% | | | |
| | |
| | 8,173 | | | AptarGroup Inc. | | | 550,533 | |
| | |
| | 7,910 | | | Ball Corporation | | | 521,348 | |
| | |
| | 10,058 | | | Crown Holdings Inc., (2) | | | 498,575 | |
| | | | Total Containers & Packaging | | | 1,570,456 | |
| | |
| | | | Diversified Telecommunication Services – 3.5% | | | |
| | |
| | 24,583 | | | AT&T Inc. | | | 816,156 | |
| | |
| | 17,785 | | | Verizon Communications Inc. | | | 818,288 | |
| | | | Total Diversified Telecommunication Services | | | 1,634,444 | |
| | |
| | | | Food & Staples Retailing – 4.1% | | | |
| | |
| | 6,781 | | | CVS Caremark Corporation | | | 694,374 | |
| | |
| | 23,883 | | | Kroger Co. | | | 823,964 | |
| | |
| | 12,653 | | | Whole Foods Market, Inc. | | | 414,512 | |
| | | | Total Food & Staples Retailing | | | 1,932,850 | |
| | |
| | | | Food Products – 1.7% | | | |
| | |
| | 18,053 | | | Archer-Daniels-Midland Company | | | 812,204 | |
| | | | | | | | |
| Shares | | | Description (1) | | Value | |
| | |
| | | | Health Care Providers & Services – 13.0% | | | |
| | |
| | 8,681 | | | Aetna Inc. | | $ | 994,148 | |
| | |
| | 10,215 | | | AmerisourceBergen Corporation | | | 1,021,909 | |
| | |
| | 6,345 | | | Anthem Inc. | | | 894,962 | |
| | |
| | 14,682 | | | Cardinal Health, Inc. | | | 1,207,888 | |
| | |
| | 10,492 | | | Express Scripts, Holding Company, (2) | | | 877,131 | |
| | |
| | 2,919 | | | McKesson HBOC Inc. | | | 576,736 | |
| | |
| | 5,113 | | | UnitedHealth Group Incorporated | | | 591,574 | |
| | | | Total Health Care Providers & Services | | | 6,164,348 | |
| | |
| | | | Hotels, Restaurants & Leisure – 1.8% | | | |
| | |
| | 12,320 | | | Marriott International, Inc., Class A | | | 870,531 | |
| | |
| | | | Industrial Conglomerates – 2.8% | | | |
| | |
| | 7,292 | | | Danaher Corporation | | | 634,550 | |
| | |
| | 4,154 | | | Roper Technologies, Inc. | | | 673,322 | |
| | | | Total Industrial Conglomerates | | | 1,307,872 | |
| | |
| | | | Insurance – 1.1% | | | |
| | |
| | 5,702 | | | Reinsurance Group of America Inc. | | | 518,198 | |
| | |
| | | | Internet Software & Services – 2.5% | | | |
| | |
| | 904 | | | Google Inc., Class A, (2) | | | 585,629 | |
| | |
| | 960 | | | Google Inc., Class C Shares, (2) | | | 593,520 | |
| | | | Total Internet Software & Services | | | 1,179,149 | |
| | |
| | | | IT Services – 8.2% | | | |
| | |
| | 12,734 | | | Accenture Limited | | | 1,200,434 | |
| | |
| | 8,895 | | | Gartner Inc., (2) | | | 760,611 | |
| | |
| | 14,847 | | | MasterCard, Inc. | | | 1,371,417 | |
| | |
| | 7,550 | | | Visa Inc. | | | 538,315 | |
| | | | Total IT Services | | | 3,870,777 | |
| | |
| | | | Leisure Equipment & Products – 1.2% | | | |
| | |
| | 4,466 | | | Polaris Industries Inc. | | | 579,999 | |
| | |
| | | | Machinery – 1.9% | | | |
| | |
| | 8,245 | | | Parker Hannifin Corporation | | | 887,657 | |
| | |
| | | | Media – 7.3% | | | |
| | |
| | 21,799 | | | Comcast Corporation, Class A | | | 1,227,938 | |
| | |
| | 9,468 | | | Discovery Communications Inc., Class A Shares, (2) | | | 251,849 | |
| | |
| | 7,659 | | | Scripps Networks Interactive, Class A Shares | | | 406,616 | |
| | |
| | 12,163 | | | Viacom Inc., Class B | | | 495,886 | |
| | |
| | 10,376 | | | Walt Disney Company | | | 1,057,107 | |
| | | | Total Media | | | 3,439,396 | |
Nuveen Growth Fund (continued)
| | |
| Portfolio of Investments | | August 31, 2015 |
| | | | | | | | |
| Shares | | | Description (1) | | Value | |
| | |
| | | | Multiline Retail – 2.2% | | | |
| | |
| | 13,116 | | | Target Corporation | | $ | 1,019,244 | |
| | |
| | | | Software – 8.8% | | | |
| | |
| | 12,673 | | | Intuit, Inc. | | | 1,086,710 | |
| | |
| | 44,134 | | | Microsoft Corporation | | | 1,920,712 | |
| | |
| | 31,193 | | | Oracle Corporation | | | 1,156,948 | |
| | | | Total Software | | | 4,164,370 | |
| | |
| | | | Specialty Retail – 6.5% | | | |
| | |
| | 20,186 | | | Gap, Inc. | | | 662,303 | |
| | |
| | 20,634 | | | Home Depot, Inc. | | | 2,403,036 | |
| | | | Total Specialty Retail | | | 3,065,339 | |
| | |
| | | | Technology Hardware, Storage & Peripherals – 7.1% | | | |
| | |
| | 22,039 | | | Apple, Inc. | | | 2,485,118 | |
| | |
| | 33,933 | | | EMC Corporation | | | 843,914 | |
| | | | Total Technology Hardware, Storage & Peripherals | | | 3,329,032 | |
| | |
| | | | Tobacco – 1.0% | | | |
| | |
| | 5,959 | | | Philip Morris International | | | 475,529 | |
| | | | Total Long-Term Investments (cost $39,433,448) | | | 46,378,490 | |
| | | | | | | | | | | | | | | | |
| | | | |
Principal
Amount (000) | | | Description (1) | | Coupon | | | Maturity | | | Value | |
| | | | |
| | | | SHORT-TERM INVESTMENTS – 1.3% | | | | | | | | | | | | |
| | | | |
| | | | REPURCHASE AGREEMENTS – 1.3% | | | | | | | | | | | | |
| | | | |
| $ | 617 | | | Repurchase Agreement with Fixed Income Clearing Corporation, dated 8/31/15, repurchase price $617,316, collateralized by $625,000 U.S. Treasury Notes, 2.250%, due 11/15/24, value $633,594 | | | 0.000% | | | | 9/01/15 | | | $ | 617,316 | |
| | | | Total Short-Term Investments (cost $617,316) | | | | | | | | | | | 617,316 | |
| | | | Total Investments (cost $40,050,764) – 99.5% | | | | | | | | | | | 46,995,806 | |
| | | | Other Assets Less Liabilities – 0.5% | | | | | | | | | | | 240,891 | |
| | | | Net Assets – 100% | | | | | | | | | | $ | 47,236,697 | |
For Fund portfolio compliance purposes, the Fund’s industry classifications refer to any one or more of the industry sub-classifications used by one or more widely recognized market indexes or ratings group indexes, and/or as defined by Fund management. This definition may not apply for purposes of this report, which may combine industry sub-classifications into sectors for reporting ease.
| (1) | All percentages shown in the Portfolio of Investments are based on net assets. |
| (2) | Non-income producing; issuer has not declared a dividend within the past twelve months. |
See accompanying notes to financial statements.
Nuveen Large Cap Core Fund
| | |
| Portfolio of Investments | | August 31, 2015 |
| | | | | | | | |
| Shares | | | Description (1) | | Value | |
| | |
| | | | LONG-TERM INVESTMENTS – 100.0% | | | | |
| | |
| | | | COMMON STOCKS – 100.0% | | | | |
| | |
| | | | Aerospace & Defense – 4.9% | | | |
| | |
| | 25,000 | | | Boeing Company | | $ | 3,267,000 | |
| | |
| | 22,000 | | | Huntington Ingalls Industries Inc. | | | 2,476,760 | |
| | |
| | 21,000 | | | L-3 Communications Holdings, Inc. | | | 2,214,870 | |
| | |
| | 48,000 | | | Spirit AeroSystems Holdings Inc., (2) | | | 2,453,280 | |
| | |
| | 19,000 | | | Triumph Group Inc. | | | 938,410 | |
| | | | Total Aerospace & Defense | | | 11,350,320 | |
| | |
| | | | Airlines – 1.1% | | | |
| | |
| | 60,000 | | | Delta Air Lines, Inc. | | | 2,626,800 | |
| | |
| | | | Auto Components – 2.1% | | | |
| | |
| | 34,000 | | | Delphi Automotive PLC | | | 2,567,680 | |
| | |
| | 1,000 | | | Goodyear Tire & Rubber Company | | | 29,770 | |
| | |
| | 21,000 | | | Lear Corporation | | | 2,158,590 | |
| | | | Total Auto Components | | | 4,756,040 | |
| | |
| | | | Automobiles – 1.5% | | | |
| | |
| | 34,000 | | | General Motors Company | | | 1,000,960 | |
| | |
| | 46,000 | | | Thor Industries, Inc. | | | 2,510,680 | |
| | | | Total Automobiles | | | 3,511,640 | |
| | |
| | | | Banks – 4.3% | | | |
| | |
| | 262,000 | | | Bank of America Corporation | | | 4,281,080 | |
| | |
| | 77,000 | | | JPMorgan Chase & Co. | | | 4,935,700 | |
| | |
| | 12,000 | | | Wells Fargo & Company | | | 639,960 | |
| | | | Total Banks | | | 9,856,740 | |
| | |
| | | | Beverages – 0.8% | | | |
| | |
| | 19,000 | | | PepsiCo, Inc. | | | 1,765,670 | |
| | |
| | | | Biotechnology – 4.7% | | | |
| | |
| | 24,000 | | | Amgen Inc. | | | 3,642,720 | |
| | |
| | 10,000 | | | Biogen Inc., (2) | | | 2,973,000 | |
| | |
| | 39,000 | | | Gilead Sciences, Inc. | | | 4,097,730 | |
| | | | Total Biotechnology | | | 10,713,450 | |
| | |
| | | | Capital Markets – 2.9% | | | |
| | |
| | 33,000 | | | Bank New York Mellon | | | 1,313,400 | |
| | |
| | 49,000 | | | Lazard Limited | | | 2,436,770 | |
| | |
| | 85,000 | | | Morgan Stanley | | | 2,928,250 | |
| | | | Total Capital Markets | | | 6,678,420 | |
Nuveen Large Cap Core Fund (continued)
| | |
| Portfolio of Investments | | August 31, 2015 |
| | | | | | | | |
| Shares | | | Description (1) | | Value | |
| | |
| | | | Chemicals – 1.0% | | | |
| | |
| | 71,000 | | | Cabot Corporation | | $ | 2,404,770 | |
| | |
| | | | Commercial Services & Supplies – 1.0% | | | |
| | |
| | 144,000 | | | R.R. Donnelley & Sons Company | | | 2,260,800 | |
| | |
| | | | Containers & Packaging – 0.2% | | | |
| | |
| | 7,000 | | | AptarGroup Inc. | | | 471,520 | |
| | |
| | | | Diversified Consumer Services – 0.3% | | | |
| | |
| | 70,000 | | | Apollo Group, Inc., (2) | | | 777,700 | |
| | |
| | | | Diversified Financial Services – 1.1% | | | |
| | |
| | 5,000 | | | Berkshire Hathaway Inc., Class B, (2) | | | 670,200 | |
| | |
| | 46,000 | | | Voya Financial Inc. | | | 1,981,680 | |
| | | | Total Diversified Financial Services | | | 2,651,880 | |
| | |
| | | | Diversified Telecommunication Services – 1.6% | | | |
| | |
| | 88,000 | | | CenturyLink Inc. | | | 2,379,520 | |
| | |
| | 194,000 | | | Windstream Holdings Inc. | | | 1,394,860 | |
| | | | Total Diversified Telecommunication Services | | | 3,774,380 | |
| | |
| | | | Electrical Equipment – 1.1% | | | |
| | |
| | 23,000 | | | Rockwell Automation, Inc. | | | 2,572,090 | |
| | |
| | | | Electronic Equipment, Instruments & Components – 1.9% | | | |
| | |
| | 61,000 | | | Corning Incorporated | | | 1,049,810 | |
| | |
| | 125,000 | | | Jabil Circuit Inc. | | | 2,418,750 | |
| | |
| | 88,000 | | | Vishay Intertechnology Inc. | | | 869,440 | |
| | | | Total Electronic Equipment, Instruments & Components | | | 4,338,000 | |
| | |
| | | | Energy Equipment & Services – 1.1% | | | |
| | |
| | 76,000 | | | Noble Corporation PLC | | | 989,520 | |
| | |
| | 82,000 | | | Tidewater Inc. | | | 1,470,260 | |
| | | | Total Energy Equipment & Services | | | 2,459,780 | |
| | |
| | | | Food Products – 3.0% | | | |
| | |
| | 57,000 | | | Archer-Daniels-Midland Company | | | 2,564,430 | |
| | |
| | 29,000 | | | Bunge Limited | | | 2,101,050 | |
| | |
| | 105,000 | | | Pilgrim's Pride Corporation | | | 2,202,375 | |
| | | | Total Food Products | | | 6,867,855 | |
| | |
| | | | Health Care Providers & Services – 9.4% | | | |
| | |
| | 24,000 | | | Aetna Inc. | | | 2,748,480 | |
| | |
| | 26,000 | | | AmerisourceBergen Corporation | | | 2,601,040 | |
| | |
| | 19,000 | | | Anthem Inc. | | | 2,679,950 | |
| | |
| | 31,000 | | | Cardinal Health, Inc. | | | 2,550,370 | |
| | |
| | 37,000 | | | Centene Corporation, (2) | | | 2,283,640 | |
| | |
| | 35,000 | | | Health Net Inc., (2) | | | 2,242,100 | |
| | | | | | | | |
| Shares | | | Description (1) | | Value | |
| | |
| | | | Health Care Providers & Services (continued) | | | |
| | |
| | 14,000 | | | McKesson HBOC Inc. | | $ | 2,766,120 | |
| | |
| | 32,000 | | | UnitedHealth Group Incorporated | | | 3,702,400 | |
| | | | Total Health Care Providers & Services | | | 21,574,100 | |
| | |
| | | | Hotels, Restaurants & Leisure – 1.7% | | | |
| | |
| | 6,100 | | | Brinker International Inc. | | | 324,093 | |
| | |
| | 36,000 | | | Darden Restaurants, Inc. | | | 2,448,360 | |
| | |
| | 15,000 | | | Marriott International, Inc., Class A | | | 1,059,900 | |
| | | | Total Hotels, Restaurants & Leisure | | | 3,832,353 | |
| | |
| | | | Industrial Conglomerates – 0.3% | | | |
| | |
| | 26,000 | | | General Electric Company | | | 645,320 | |
| | |
| | | | Insurance – 2.9% | | | |
| | |
| | 101,000 | | | Assured Guaranty Limited | | | 2,551,260 | |
| | |
| | 12,000 | | | Everest Reinsurance Group Ltd | | | 2,109,720 | |
| | |
| | 20,000 | | | Travelers Companies, Inc. | | | 1,991,000 | |
| | | | Total Insurance | | | 6,651,980 | |
| | |
| | | | Internet & Catalog Retail – 1.0% | | | |
| | |
| | 21,000 | | | Expedia, Inc. | | | 2,414,790 | |
| | |
| | | | Internet Software & Services – 2.2% | | | |
| | |
| | 99,000 | | | eBay Inc., (2) | | | 2,683,890 | |
| | |
| | 34,000 | | | VeriSign, Inc., (2) | | | 2,343,960 | |
| | | | Total Internet Software & Services | | | 5,027,850 | |
| | |
| | | | IT Services – 3.1% | | | |
| | |
| | 12,700 | | | Computer Sciences Corporation | | | 787,273 | |
| | |
| | 9,000 | | | CoreLogic Inc. | | | 341,550 | |
| | |
| | 9,000 | | | Leidos Holdings Inc. | | | 378,720 | |
| | |
| | 37,000 | | | MasterCard, Inc. | | | 3,417,690 | |
| | |
| | 209,000 | | | Xerox Corporation | | | 2,125,530 | |
| | | | Total IT Services | | | 7,050,763 | |
| | |
| | | | Machinery – 3.8% | | | |
| | |
| | 78,000 | | | Allison Transmission Holdings Inc. | | | 2,230,800 | |
| | |
| | 22,000 | | | Parker Hannifin Corporation | | | 2,368,520 | |
| | |
| | 92,000 | | | Terex Corporation | | | 2,146,360 | |
| | |
| | 70,000 | | | Trinity Industries Inc. | | | 1,889,300 | |
| | | | Total Machinery | | | 8,634,980 | |
| | |
| | | | Media – 6.4% | | | |
| | |
| | 94,000 | | | Cablevision Systems Corporation | | | 2,365,980 | |
| | |
| | 62,000 | | | Comcast Corporation, Class A | | | 3,492,460 | |
| | |
| | 121,000 | | | Interpublic Group of Companies, Inc. | | | 2,284,480 | |
| | |
| | 34,000 | | | Scripps Networks Interactive, Class A Shares | | | 1,805,060 | |
Nuveen Large Cap Core Fund (continued)
| | |
| Portfolio of Investments | | August 31, 2015 |
| | | | | | | | |
| Shares | | | Description (1) | | Value | |
| | |
| | | | Media (continued) | | | |
| | |
| | 632,000 | | | Sirius XM Holdings Inc., (2) | | $ | 2,411,080 | |
| | |
| | 71,000 | | | TEGNA Inc. | | | 1,689,090 | |
| | |
| | 17,000 | | | Viacom Inc., Class B | | | 693,090 | |
| | | | Total Media | | | 14,741,240 | |
| | |
| | | | Metals & Mining – 0.8% | | | |
| | |
| | 40,000 | | | Nucor Corporation | | | 1,731,600 | |
| | |
| | | | Multiline Retail – 3.8% | | | |
| | |
| | 47,000 | | | Big Lots, Inc. | | | 2,255,530 | |
| | |
| | 17,000 | | | Dillard’s, Inc., Class A | | | 1,572,670 | |
| | |
| | 17,300 | | | Kohl’s Corporation | | | 882,819 | |
| | |
| | 20,000 | | | Macy’s, Inc. | | | 1,172,200 | |
| | |
| | 36,000 | | | Target Corporation | | | 2,797,560 | |
| | | | Total Multiline Retail | | | 8,680,779 | |
| | |
| | | | Oil, Gas & Consumable Fuels – 3.0% | | | |
| | |
| | 422,000 | | | Denbury Resources Inc. | | | 1,831,480 | |
| | |
| | 17,000 | | | Exxon Mobil Corporation | | | 1,279,080 | |
| | |
| | 128,000 | | | Oasis Petroleum Inc., (2) | | | 1,428,480 | |
| | |
| | 40,000 | | | Valero Energy Corporation | | | 2,373,600 | |
| | | | Total Oil, Gas & Consumable Fuels | | | 6,912,640 | |
| | |
| | | | Pharmaceuticals – 2.2% | | | |
| | |
| | 8,000 | | | Johnson & Johnson | | | 751,840 | |
| | |
| | 133,000 | | | Pfizer Inc. | | | 4,285,260 | |
| | | | Total Pharmaceuticals | | | 5,037,100 | |
| | |
| | | | Road & Rail – 1.0% | | | |
| | |
| | 54,000 | | | Avis Budget Group Inc., (2) | | | 2,383,020 | |
| | |
| | | | Semiconductors & Semiconductor Equipment – 3.1% | | | |
| | |
| | 120,000 | | | Intel Corporation | | | 3,424,800 | |
| | |
| | 105,000 | | | Marvell Technology Group Ltd. | | | 1,183,350 | |
| | |
| | 108,000 | | | NVIDIA Corporation | | | 2,427,840 | |
| | | | Total Semiconductors & Semiconductor Equipment | | | 7,035,990 | |
| | |
| | | | Software – 4.9% | | | |
| | |
| | 33,000 | | | Citrix Systems, (2) | | | 2,247,630 | |
| | |
| | 36,000 | | | Electronic Arts Inc., (2) | | | 2,381,400 | |
| | |
| | 8,000 | | | Intuit, Inc. | | | 686,000 | |
| | |
| | 67,000 | | | Microsoft Corporation | | | 2,915,840 | |
| | |
| | 57,000 | | | Oracle Corporation | | | 2,114,130 | |
| | |
| | 12,000 | | | Red Hat, Inc., (2) | | | 866,520 | |
| | | | Total Software | | | 11,211,520 | |
| | | | | | | | |
| Shares | | | Description (1) | | Value | |
| | |
| | | | Specialty Retail – 6.4% | | | |
| | |
| | 61,000 | | | Aaron Rents Inc. | | $ | 2,296,650 | |
| | |
| | 69,000 | | | Best Buy Co., Inc. | | | 2,535,060 | |
| | |
| | 35,000 | | | Home Depot, Inc. | | | 4,076,100 | |
| | |
| | 45,000 | | | Lowe’s Companies, Inc. | | | 3,112,650 | |
| | |
| | 84,000 | | | Office Depot, Inc., (2) | | | 666,120 | |
| | |
| | 150,000 | | | Staples, Inc. | | | 2,131,500 | |
| | | | Total Specialty Retail | | | 14,818,080 | |
| | |
| | | | Technology Hardware, Storage & Peripherals – 7.3% | | | |
| | |
| | 88,000 | | | Apple, Inc. | | | 9,922,880 | |
| | |
| | 87,000 | | | EMC Corporation | | | 2,163,690 | |
| | |
| | 108,000 | | | Hewlett-Packard Company | | | 3,030,480 | |
| | |
| | 56,000 | | | Lexmark International, Inc., Class A | | | 1,678,880 | |
| | | | Total Technology Hardware, Storage & Peripherals | | | 16,795,930 | |
| | |
| | | | Trading Companies & Distributors – 1.0% | | | |
| | |
| | 41,000 | | | WESCO International Inc., (2) | | | 2,294,770 | |
| | |
| | | | Wireless Telecommunication Services – 1.1% | | | |
| | |
| | 63,000 | | | T-Mobile US Inc., (2) | | | 2,495,430 | |
| | | | Total Long-Term Investments (cost $239,224,303) | | | 229,808,090 | |
| | | | Other Assets Less Liabilities – 0.0% | | | 99,654 | |
| | | | Net Assets – 100% | | $ | 229,907,744 | |
For Fund portfolio compliance purposes, the Fund’s industry classifications refer to any one or more of the industry sub-classifications used by one or more widely recognized market indexes or ratings group indexes, and/or as defined by Fund management. This definition may not apply for purposes of this report, which may combine industry sub-classifications into sectors for reporting ease.
| (1) | All percentages shown in the Portfolio of Investments are based on net assets. |
| (2) | Non-income producing; issuer has not declared a dividend within the past twelve months. |
See accompanying notes to financial statements.
Nuveen Large Cap Core Plus Fund
| | |
| Portfolio of Investments | | August 31, 2015 |
| | | | | | | | |
| Shares | | | Description (1) | | Value | |
| | |
| | | | LONG-TERM INVESTMENTS – 129.7% | | | | |
| | |
| | | | COMMON STOCKS – 129.7% | | | | |
| | |
| | | | Aerospace & Defense – 7.2% | | | |
| | |
| | 16,000 | | | Boeing Company | | $ | 2,090,880 | |
| | |
| | 13,000 | | | Huntington Ingalls Industries Inc. | | | 1,463,540 | |
| | |
| | 13,000 | | | L-3 Communications Holdings, Inc. | | | 1,371,110 | |
| | |
| | 28,000 | | | Spirit AeroSystems Holdings Inc., (2) | | | 1,431,080 | |
| | |
| | 25,000 | | | Triumph Group Inc. | | | 1,234,750 | |
| | |
| | 2,000 | | | United Technologies Corporation | | | 183,220 | |
| | | | Total Aerospace & Defense | | | 7,774,580 | |
| | |
| | | | Airlines – 1.6% | | | |
| | |
| | 40,000 | | | Delta Air Lines, Inc. | | | 1,751,200 | |
| | |
| | | | Auto Components – 1.5% | | | |
| | |
| | 20,000 | | | Delphi Automotive PLC | | | 1,510,400 | |
| | |
| | 2,000 | | | Goodyear Tire & Rubber Company | | | 59,540 | |
| | | | Total Auto Components | | | 1,569,940 | |
| | |
| | | | Automobiles – 2.1% | | | |
| | |
| | 30,000 | | | General Motors Company | | | 883,200 | |
| | |
| | 26,000 | | | Thor Industries, Inc. | | | 1,419,080 | |
| | | | Total Automobiles | | | 2,302,280 | |
| | |
| | | | Banks – 5.7% | | | |
| | |
| | 159,000 | | | Bank of America Corporation | | | 2,598,060 | |
| | |
| | 48,000 | | | JPMorgan Chase & Co. | | | 3,076,800 | |
| | |
| | 8,000 | | | Wells Fargo & Company | | | 426,640 | |
| | | | Total Banks | | | 6,101,500 | |
| | |
| | | | Biotechnology – 6.0% | | | |
| | |
| | 15,000 | | | Amgen Inc. | | | 2,276,700 | |
| | |
| | 6,000 | | | Biogen Inc., (2) | | | 1,783,800 | |
| | |
| | 23,000 | | | Gilead Sciences, Inc. | | | 2,416,610 | |
| | | | Total Biotechnology | | | 6,477,110 | |
| | |
| | | | Capital Markets – 3.0% | | | |
| | |
| | 10,000 | | | Bank New York Mellon | | | 398,000 | |
| | |
| | 20,000 | | | Lazard Limited | | | 994,600 | |
| | |
| | 54,000 | | | Morgan Stanley | | | 1,860,300 | |
| | | | Total Capital Markets | | | 3,252,900 | |
| | |
| | | | Chemicals – 1.3% | | | |
| | |
| | 41,000 | | | Cabot Corporation | | | 1,388,670 | |
| | | | | | | | |
| Shares | | | Description (1) | | Value | |
| | |
| | | | Commercial Services & Supplies – 1.4% | | | |
| | |
| | 94,000 | | | R.R. Donnelley & Sons Company | | $ | 1,475,800 | |
| | |
| | | | Containers & Packaging – 0.3% | | | |
| | |
| | 5,000 | | | AptarGroup Inc. | | | 336,800 | |
| | |
| | | | Diversified Consumer Services – 0.7% | | | |
| | |
| | 64,000 | | | Apollo Group, Inc., (2) | | | 711,040 | |
| | |
| | | | Diversified Financial Services – 1.4% | | | |
| | |
| | 3,000 | | | Berkshire Hathaway Inc., Class B, (2) | | | 402,120 | |
| | |
| | 26,000 | | | Voya Financial Inc. | | | 1,120,080 | |
| | | | Total Diversified Financial Services | | | 1,522,200 | |
| | |
| | | | Diversified Telecommunication Services – 2.7% | | | |
| | |
| | 59,000 | | | CenturyLink Inc. | | | 1,595,360 | |
| | |
| | 30,600 | | | Intelsat SA, (2) | | | 295,902 | |
| | |
| | 144,000 | | | Windstream Holdings Inc. | | | 1,035,360 | |
| | | | Total Diversified Telecommunication Services | | | 2,926,622 | |
| | |
| | | | Electrical Equipment – 1.4% | | | |
| | |
| | 14,000 | | | Rockwell Automation, Inc. | | | 1,565,620 | |
| | |
| | | | Electronic Equipment, Instruments & Components – 2.8% | | | |
| | |
| | 46,000 | | | Corning Incorporated | | | 791,660 | |
| | |
| | 80,000 | | | Jabil Circuit Inc. | | | 1,548,000 | |
| | |
| | 72,000 | | | Vishay Intertechnology Inc. | | | 711,360 | |
| | | | Total Electronic Equipment, Instruments & Components | | | 3,051,020 | |
| | |
| | | | Energy Equipment & Services – 1.5% | | | |
| | |
| | 35,000 | | | Noble Corporation PLC | | | 455,700 | |
| | |
| | 67,700 | | | Tidewater Inc. | | | 1,213,861 | |
| | | | Total Energy Equipment & Services | | | 1,669,561 | |
| | |
| | | | Food & Staples Retailing – 0.2% | | | |
| | |
| | 3,000 | | | Wal-Mart Stores, Inc. | | | 194,190 | |
| | |
| | | | Food Products – 2.8% | | | |
| | |
| | 37,000 | | | Archer-Daniels-Midland Company | | | 1,664,630 | |
| | |
| | 65,000 | | | Pilgrim’s Pride Corporation | | | 1,363,375 | |
| | | | Total Food Products | | | 3,028,005 | |
| | |
| | | | Health Care Providers & Services – 12.3% | | | |
| | |
| | 15,000 | | | Aetna Inc. | | | 1,717,800 | |
| | |
| | 15,000 | | | AmerisourceBergen Corporation | | | 1,500,600 | |
| | |
| | 12,000 | | | Anthem Inc. | | | 1,692,600 | |
| | |
| | 19,000 | | | Cardinal Health, Inc. | | | 1,563,130 | |
| | |
| | 23,000 | | | Centene Corporation, (2) | | | 1,419,560 | |
| | |
| | 22,000 | | | Health Net Inc., (2) | | | 1,409,320 | |
Nuveen Large Cap Core Plus Fund (continued)
| | |
| Portfolio of Investments | | August 31, 2015 |
| | | | | | | | |
| Shares | | | Description (1) | | Value | |
| | |
| | | | Health Care Providers & Services (continued) | | | |
| | |
| | 9,000 | | | McKesson HBOC Inc. | | $ | 1,778,220 | |
| | |
| | 19,000 | | | UnitedHealth Group Incorporated | | | 2,198,300 | |
| | | | Total Health Care Providers & Services | | | 13,279,530 | |
| | |
| | | | Hotels, Restaurants & Leisure – 2.3% | | | |
| | |
| | 9,000 | | | Brinker International Inc. | | | 478,170 | |
| | |
| | 16,000 | | | Darden Restaurants, Inc. | | | 1,088,160 | |
| | |
| | 13,000 | | | Marriott International, Inc., Class A | | | 918,580 | |
| | | | Total Hotels, Restaurants & Leisure | | | 2,484,910 | |
| | |
| | | | Industrial Conglomerates – 0.4% | | | |
| | |
| | 18,000 | | | General Electric Company | | | 446,760 | |
| | |
| | | | Insurance – 4.2% | | | |
| | |
| | 58,000 | | | Assured Guaranty Limited | | | 1,465,080 | |
| | |
| | 8,000 | | | Everest Reinsurance Group Ltd | | | 1,406,480 | |
| | |
| | 17,000 | | | Travelers Companies, Inc. | | | 1,692,350 | |
| | | | Total Insurance | | | 4,563,910 | |
| | |
| | | | Internet & Catalog Retail – 1.5% | | | |
| | |
| | 14,000 | | | Expedia, Inc. | | | 1,609,860 | |
| | |
| | | | Internet Software & Services – 2.3% | | | |
| | |
| | 40,000 | | | eBay Inc., (2) | | | 1,084,400 | |
| | |
| | 21,000 | | | VeriSign, Inc., (2) | | | 1,447,740 | |
| | | | Total Internet Software & Services | | | 2,532,140 | |
| | |
| | | | IT Services – 5.6% | | | |
| | |
| | 12,300 | | | Computer Sciences Corporation | | | 762,477 | |
| | |
| | 35,000 | | | CoreLogic Inc. | | | 1,328,250 | |
| | |
| | 3,000 | | | Gartner Inc., (2) | | | 256,530 | |
| | |
| | 23,000 | | | MasterCard, Inc. | | | 2,124,510 | |
| | |
| | 156,000 | | | Xerox Corporation | | | 1,586,520 | |
| | | | Total IT Services | | | 6,058,287 | |
| | |
| | | | Machinery – 4.8% | | | |
| | |
| | 4,000 | | | AGCO Corporation | | | 196,160 | |
| | |
| | 48,000 | | | Allison Transmission Holdings Inc. | | | 1,372,800 | |
| | |
| | 14,000 | | | Parker Hannifin Corporation | | | 1,507,240 | |
| | |
| | 59,000 | | | Terex Corporation | | | 1,376,470 | |
| | |
| | 25,000 | | | Trinity Industries Inc. | | | 674,750 | |
| | | | Total Machinery | | | 5,127,420 | |
| | |
| | | | Media – 7.0% | | | |
| | |
| | 61,000 | | | Cablevision Systems Corporation | | | 1,535,370 | |
| | |
| | 39,000 | | | Comcast Corporation, Class A | | | 2,196,870 | |
| | | | | | | | |
| Shares | | | Description (1) | | Value | |
| | |
| | | | Media (continued) | | | |
| | |
| | 4,000 | | | Scripps Networks Interactive, Class A Shares | | $ | 212,360 | |
| | |
| | 384,000 | | | Sirius XM Holdings Inc., (2) | | | 1,464,960 | |
| | |
| | 52,000 | | | TEGNA Inc. | | | 1,237,080 | |
| | |
| | 21,000 | | | Viacom Inc., Class B | | | 856,170 | |
| | | | Total Media | | | 7,502,810 | |
| | |
| | | | Metals & Mining – 0.2% | | | |
| | |
| | 6,000 | | | Nucor Corporation | | | 259,740 | |
| | |
| | | | Multiline Retail – 5.8% | | | |
| | |
| | 29,000 | | | Big Lots, Inc. | | | 1,391,710 | |
| | |
| | 13,000 | | | Dillard’s, Inc., Class A | | | 1,202,630 | |
| | |
| | 23,000 | | | Kohl’s Corporation | | | 1,173,690 | |
| | |
| | 13,000 | | | Macy’s, Inc. | | | 761,930 | |
| | |
| | 22,000 | | | Target Corporation | | | 1,709,620 | |
| | | | Total Multiline Retail | | | 6,239,580 | |
| | |
| | | | Oil, Gas & Consumable Fuels – 3.4% | | | |
| | |
| | 8,000 | | | CVTR Energy Inc. | | | 321,680 | |
| | |
| | 277,000 | | | Denbury Resources Inc. | | | 1,202,180 | |
| | |
| | 11,000 | | | Exxon Mobil Corporation | | | 827,640 | |
| | |
| | 50,000 | | | Oasis Petroleum Inc., (2) | | | 558,000 | |
| | |
| | 12,000 | | | Valero Energy Corporation | | | 712,080 | |
| | | | Total Oil, Gas & Consumable Fuels | | | 3,621,580 | |
| | |
| | | | Pharmaceuticals – 2.6% | | | |
| | |
| | 6,000 | | | Johnson & Johnson | | | 563,880 | |
| | |
| | 68,000 | | | Pfizer Inc. | | | 2,190,960 | |
| | | | Total Pharmaceuticals | | | 2,754,840 | |
| | |
| | | | Semiconductors & Semiconductor Equipment – 4.9% | | | |
| | |
| | 83,000 | | | Intel Corporation | | | 2,368,820 | |
| | |
| | 128,000 | | | Marvell Technology Group Ltd. | | | 1,442,560 | |
| | |
| | 66,000 | | | NVIDIA Corporation | | | 1,483,680 | |
| | | | Total Semiconductors & Semiconductor Equipment | | | 5,295,060 | |
| | |
| | | | Software – 6.5% | | | |
| | |
| | 6,000 | | | CA Technologies | | | 163,740 | |
| | |
| | 22,000 | | | Citrix Systems, (2) | | | 1,498,420 | |
| | |
| | 23,000 | | | Electronic Arts Inc., (2) | | | 1,521,450 | |
| | |
| | 9,000 | | | Intuit, Inc. | | | 771,750 | |
| | |
| | 47,000 | | | Microsoft Corporation | | | 2,045,440 | |
| | |
| | 19,000 | | | Oracle Corporation | | | 704,710 | |
| | |
| | 4,000 | | | Red Hat, Inc., (2) | | | 288,840 | |
| | | | Total Software | | | 6,994,350 | |
Nuveen Large Cap Core Plus Fund (continued)
| | |
| Portfolio of Investments | | August 31, 2015 |
| | | | | | | | |
| Shares | | | Description (1) | | Value | |
| | |
| | | | Specialty Retail – 9.6% | | | |
| | |
| | 38,000 | | | Aaron Rents Inc. | | $ | 1,430,700 | |
| | |
| | 43,000 | | | Best Buy Co., Inc. | | | 1,579,820 | |
| | |
| | 22,000 | | | Home Depot, Inc. | | | 2,562,120 | |
| | |
| | 26,000 | | | Lowe’s Companies, Inc. | | | 1,798,420 | |
| | |
| | 180,000 | | | Office Depot, Inc., (2) | | | 1,427,400 | |
| | |
| | 112,000 | | | Staples, Inc. | | | 1,591,520 | |
| | | | Total Specialty Retail | | | 10,389,980 | |
| | |
| | | | Technology Hardware, Storage & Peripherals – 9.8% | | | |
| | |
| | 53,000 | | | Apple, Inc. | | | 5,976,280 | |
| | |
| | 69,000 | | | EMC Corporation | | | 1,716,030 | |
| | |
| | 65,000 | | | Hewlett-Packard Company | | | 1,823,900 | |
| | |
| | 34,000 | | | Lexmark International, Inc., Class A | | | 1,019,320 | |
| | | | Total Technology Hardware, Storage & Peripherals | | | 10,535,530 | |
| | |
| | | | Trading Companies & Distributors – 1.4% | | | |
| | |
| | 27,000 | | | WESCO International Inc., (2) | | | 1,511,190 | |
| | |
| | | | Wireless Telecommunication Services – 1.5% | | | |
| | |
| | 40,000 | | | T-Mobile US Inc., (2) | | | 1,584,400 | |
| | | | Total Long-Term Investments (cost $143,940,030) | | | 139,890,915 | |
| | |
| Shares | | | Description (1) | | Value | |
| | |
| | | | COMMON STOCKS SOLD SHORT – (29.9)% (3) | | | | |
| | |
| | | | Aerospace & Defense – (0.6)% | | | |
| | |
| | (1,700 | ) | | Lockheed Martin Corporation | | $ | (342,006 | ) |
| | |
| | (3,400 | ) | | Raytheon Company | | | (348,704 | ) |
| | | | Total Aerospace & Defense | | | (690,710 | ) |
| | |
| | | | Airlines – (0.3)% | | | |
| | |
| | (5,900 | ) | | Spirit Airline Holdings, (2) | | | (302,375 | ) |
| | |
| | | | Automobiles – (0.3)% | | | |
| | |
| | (1,300 | ) | | Tesla Motors Inc., (2) | | | (323,778 | ) |
| | |
| | | | Banks – (0.5)% | | | |
| | |
| | (2,900 | ) | | M&T Bank Corporation | | | (342,896 | ) |
| | |
| | (5,000 | ) | | U.S. Bancorp | | | (211,750 | ) |
| | | | Total Banks | | | (554,646 | ) |
| | |
| | | | Beverages – (1.2)% | | | |
| | |
| | (3,100 | ) | | Brown-Forman Corporation | | | (304,110 | ) |
| | |
| | (8,200 | ) | | Coca-Cola Company | | | (322,424 | ) |
| | |
| | (2,700 | ) | | Constellation Brands, Inc., Class A | | | (345,600 | ) |
| | |
| | (2,500 | ) | | Monster Beverage Corporation, (2) | | | (346,150 | ) |
| | | | Total Beverages | | | (1,318,284 | ) |
| | | | | | | | |
| | |
| Shares | | | Description (1) | | Value | |
| | |
| | | | Biotechnology – (0.8)% | | | |
| | |
| | (2,400 | ) | | BioMarin Pharmaceutical Inc., (2) | | $ | (310,176 | ) |
| | |
| | (1,300 | ) | | Intercept Pharmaceuticals Incorporated, (2) | | | (246,688 | ) |
| | |
| | (2,500 | ) | | Vertex Pharmaceuticals Inc., (2) | | | (318,800 | ) |
| | | | Total Biotechnology | | | (875,664 | ) |
| | |
| | | | Capital Markets – (1.0)% | | | |
| | |
| | (200 | ) | | BlackRock Inc. | | | (60,494 | ) |
| | |
| | (10,900 | ) | | Charles Schwab Corporation | | | (331,142 | ) |
| | |
| | (13,200 | ) | | E*Trade Group Inc., (2) | | | (347,028 | ) |
| | |
| | (10,300 | ) | | TD Ameritrade Holding Corporation | | | (344,638 | ) |
| | | | Total Capital Markets | | | (1,083,302 | ) |
| | |
| | | | Chemicals – (2.4)% | | | |
| | |
| | (2,500 | ) | | Air Products & Chemicals Inc. | | | (348,825 | ) |
| | |
| | (3,300 | ) | | Airgas, Inc. | | | (318,516 | ) |
| | |
| | (4,300 | ) | | Cytec Industries, Inc. | | | (319,060 | ) |
| | |
| | (6,700 | ) | | E.I. Du Pont de Nemours and Company | | | (345,050 | ) |
| | |
| | (7,600 | ) | | FMC Corporation | | | (321,556 | ) |
| | |
| | (16,200 | ) | | Platform Specialty Products Corporation, (2) | | | (310,068 | ) |
| | |
| | (3,100 | ) | | Praxair, Inc. | | | (327,825 | ) |
| | |
| | (3,300 | ) | | WR Grace & Company, (2) | | | (326,502 | ) |
| | | | Total Chemicals | | | (2,617,402 | ) |
| | |
| | | | Commercial Services & Supplies – (0.6)% | | | |
| | |
| | (8,900 | ) | | Tyco International PLC | | | (322,981 | ) |
| | |
| | (6,300 | ) | | Waste Management, Inc. | | | (315,378 | ) |
| | | | Total Commercial Services & Supplies | | | (638,359 | ) |
| | |
| | | | Communications Equipment – (0.3)% | | | |
| | |
| | (5,100 | ) | | Motorola Solutions Inc. | | | (330,582 | ) |
| | |
| | | | Construction Materials – (0.1)% | | | |
| | |
| | (900 | ) | | Martin Marietta Materials | | | (151,020 | ) |
| | |
| | | | Electric Utilities – (0.6)% | | | |
| | |
| | (9,700 | ) | | ITC Holdings Corporation | | | (317,190 | ) |
| | |
| | (7,700 | ) | | Southern Company | | | (334,257 | ) |
| | | | Total Electric Utilities | | | (651,447 | ) |
| | |
| | | | Electrical Equipment – (0.1)% | | | |
| | |
| | (2,800 | ) | | Solarcity Corporation, (2) | | | (135,184 | ) |
| | |
| | | | Electronic Equipment, Instruments & Components – (0.8)% | | | |
| | |
| | (6,600 | ) | | Amphenol Corporation, Class A | | | (345,576 | ) |
| | |
| | (11,300 | ) | | FLIR Systems Inc. | | | (323,519 | ) |
Nuveen Large Cap Core Plus Fund (continued)
| | |
| Portfolio of Investments | | August 31, 2015 |
| | | | | | | | |
| | |
| Shares | | | Description (1) | | Value | |
| | |
| | | | Electronic Equipment, Instruments & Components (continued) | | | |
| | |
| | (2,700 | ) | | Zebra Technologies Corporation, Class A, (2) | | $ | (223,776 | ) |
| | | | Total Electronic Equipment, Instruments & Components | | | (892,871 | ) |
| | |
| | | | Energy Equipment & Services – (0.6)% | | | |
| | |
| | (8,500 | ) | | Halliburton Company | | | (334,475 | ) |
| | |
| | (3,500 | ) | | Schlumberger Limited | | | (270,795 | ) |
| | | | Total Energy Equipment & Services | | | (605,270 | ) |
| | |
| | | | Food Products – (0.8)% | | | |
| | |
| | (4,800 | ) | | Kellogg Company | | | (318,144 | ) |
| | |
| | (1,500 | ) | | Keurig Green Mountain Inc. | | | (84,900 | ) |
| | |
| | (1,800 | ) | | Kraft Heinz Company | | | (130,788 | ) |
| | |
| | (7,900 | ) | | Mondelez International Inc. | | | (334,644 | ) |
| | | | Total Food Products | | | (868,476 | ) |
| | |
| | | | Health Care Equipment & Supplies – (0.4)% | | | |
| | |
| | (2,300 | ) | | Becton, Dickinson and Company | | | (324,346 | ) |
| | |
| | (1,600 | ) | | DexCom, Inc., (2) | | | (150,624 | ) |
| | | | Total Health Care Equipment & Supplies | | | (474,970 | ) |
| | |
| | | | Health Care Providers & Services – (0.5)% | | | |
| | |
| | (11,100 | ) | | Brookdale Senior Living Inc., (2) | | | (304,362 | ) |
| | |
| | (2,100 | ) | | Laboratory Corporation of America Holdings, (2) | | | (247,401 | ) |
| | | | Total Health Care Providers & Services | | | (551,763 | ) |
| | |
| | | | Hotels, Restaurants & Leisure – (0.3)% | | | |
| | |
| | (4,300 | ) | | Wynn Resorts Ltd | | | (322,715 | ) |
| | |
| | | | Household Durables – (0.9)% | | | |
| | |
| | (6,500 | ) | | Lennar Corporation, Class A | | | (330,850 | ) |
| | |
| | (15,800 | ) | | Pulte Corporation | | | (326,902 | ) |
| | |
| | (15,900 | ) | | Taylor Morrison, (2) | | | (317,205 | ) |
| | | | Total Household Durables | | | (974,957 | ) |
| | |
| | | | Household Products – (0.6)% | | | |
| | |
| | (5,400 | ) | | Colgate-Palmolive Company | | | (339,174 | ) |
| | |
| | (2,900 | ) | | Kimberly-Clark Corporation | | | (308,937 | ) |
| | | | Total Household Products | | | (648,111 | ) |
| | |
| | | | Industrial Conglomerates – (0.5)% | | | |
| | |
| | (1,100 | ) | | 3M Co. | | | (156,354 | ) |
| | |
| | (13,800 | ) | | General Electric Company | | | (342,516 | ) |
| | | | Total Industrial Conglomerates | | | (498,870 | ) |
| | |
| | | | Insurance – (0.5)% | | | |
| | |
| | (1,100 | ) | | AON PLC | | | (102,784 | ) |
| | | | | | | | |
| | |
| Shares | | | Description (1) | | Value | |
| | |
| | | | Insurance (continued) | | | |
| | |
| | (7,700 | ) | | Arthur J. Gallagher & Co. | | $ | (336,644 | ) |
| | |
| | (1,800 | ) | | Torchmark Corporation | | | (105,228 | ) |
| | | | Total Insurance | | | (544,656 | ) |
| | |
| | | | Internet & Catalog Retail – (0.3)% | | | |
| | |
| | (2,800 | ) | | Netflix.com Inc., (2) | | | (322,084 | ) |
| | |
| | | | Internet Software & Services – (1.8)% | | | |
| | |
| | (500 | ) | | Google Inc., Class A, (2) | | | (323,910 | ) |
| | |
| | (500 | ) | | Google Inc., Class C Shares, (2) | | | (309,125 | ) |
| | |
| | (1,800 | ) | | LinkedIn Corporation, Class A Shares, (2) | | | (325,080 | ) |
| | |
| | (18,200 | ) | | Pandora Media, Inc., (2) | | | (326,508 | ) |
| | |
| | (12,100 | ) | | Twitter Inc., (2) | | | (336,259 | ) |
| | |
| | (10,400 | ) | | Yahoo! Inc., (2) | | | (335,296 | ) |
| | | | Total Internet Software & Services | | | (1,956,178 | ) |
| | |
| | | | Machinery – (0.6)% | | | |
| | |
| | (10,300 | ) | | Donaldson Company, Inc. | | | (322,493 | ) |
| | |
| | (3,400 | ) | | Illinois Tool Works, Inc. | | | (287,402 | ) |
| | | | Total Machinery | | | (609,895 | ) |
| | |
| | | | Media – (0.3)% | | | |
| | |
| | (13,900 | ) | | Dreamworks Animation SKG Inc., (2) | | | (277,166 | ) |
| | |
| | | | Metals & Mining – (0.5)% | | | |
| | |
| | (24,500 | ) | | Freeport-McMoRan, Inc. | | | (260,680 | ) |
| | |
| | (12,000 | ) | | Southern Copper Corporation | | | (319,920 | ) |
| | | | Total Metals & Mining | | | (580,600 | ) |
| | |
| | | | Multi-Utilities – (1.0)% | | | |
| | |
| | (4,600 | ) | | Dominion Resources, Inc. | | | (320,850 | ) |
| | |
| | (7,000 | ) | | MDU Resources Group Inc. | | | (125,370 | ) |
| | |
| | (600 | ) | | PG&E Corporation | | | (29,748 | ) |
| | |
| | (3,300 | ) | | Sempra Energy | | | (313,005 | ) |
| | |
| | (11,500 | ) | | TECO Energy, Inc. | | | (242,305 | ) |
| | | | Total Multi-Utilities | | | (1,031,278 | ) |
| | |
| | | | Oil, Gas & Consumable Fuels – (4.5)% | | | |
| | |
| | (4,900 | ) | | Anadarko Petroleum Corporation | | | (350,742 | ) |
| | |
| | (2,300 | ) | | Cabot Oil & Gas Corporation | | | (54,441 | ) |
| | |
| | (5,100 | ) | | Cheniere Energy Inc., (2) | | | (316,965 | ) |
| | |
| | (3,000 | ) | | Cimarex Energy Company | | | (331,530 | ) |
| | |
| | (36,500 | ) | | Cobalt International Energy, Inc., (2) | | | (292,365 | ) |
| | |
| | (7,000 | ) | | ConocoPhillips | | | (344,050 | ) |
| | |
| | (7,000 | ) | | Energen Corporation | | | (364,000 | ) |
Nuveen Large Cap Core Plus Fund (continued)
| | |
| Portfolio of Investments | | August 31, 2015 |
| | | | | | | | |
| | |
| Shares | | | Description (1) | | Value | |
| | |
| | | | Oil, Gas & Consumable Fuels (continued) | | | |
| | |
| | (1,000 | ) | | EOG Resources, Inc. | | $ | (78,310 | ) |
| | |
| | (4,600 | ) | | Exxon Mobil Corporation | | | (346,104 | ) |
| | |
| | (8,700 | ) | | Golar LNG, Limited | | | (338,778 | ) |
| | |
| | (10,100 | ) | | Kinder Morgan, Inc. | | | (327,341 | ) |
| | |
| | (2,600 | ) | | Noble Energy, Inc. | | | (86,866 | ) |
| | |
| | (4,800 | ) | | Occidental Petroleum Corporation | | | (350,448 | ) |
| | |
| | (9,400 | ) | | ONEOK, Inc. | | | (338,494 | ) |
| | |
| | (1,400 | ) | | Phillips 66 | | | (110,698 | ) |
| | |
| | (2,700 | ) | | Pioneer Natural Resources Company | | | (332,262 | ) |
| | |
| | (5,100 | ) | | Range Resources Corporation | | | (196,962 | ) |
| | |
| | (7,000 | ) | | Williams Companies, Inc. | | | (337,400 | ) |
| | | | Total Oil, Gas & Consumable Fuels | | | (4,897,756 | ) |
| | |
| | | | Pharmaceuticals – (0.7)% | | | |
| | |
| | (1,100 | ) | | Allergan PLC, (2) | | | (334,114 | ) |
| | |
| | (2,200 | ) | | Mylan NV, (2) | | | (109,098 | ) |
| | |
| | (1,700 | ) | | Perrigo Company | | | (311,049 | ) |
| | | | Total Pharmaceuticals | | | (754,261 | ) |
| | |
| | | | Professional Services – (0.2)% | | | |
| | |
| | (3,800 | ) | | Nielsen Holdings PLC | | | (171,874 | ) |
| | |
| | | | Road & Rail – (0.3)% | | | |
| | |
| | (17,700 | ) | | Hertz Global Holdings Inc., (2) | | | (326,211 | ) |
| | |
| | | | Semiconductors & Semiconductor Equipment – (1.3)% | | | |
| | |
| | (5,500 | ) | | Analog Devices, Inc. | | | (307,230 | ) |
| | |
| | (32,700 | ) | | Cypress Semiconductor Corporation | | | (327,000 | ) |
| | |
| | (7,900 | ) | | Linear Technology Corporation | | | (318,212 | ) |
| | |
| | (12,300 | ) | | SunEdison Inc., (2) | | | (127,920 | ) |
| | |
| | (11,200 | ) | | SunPower Corporation, (2) | | | (271,712 | ) |
| | | | Total Semiconductors & Semiconductor Equipment | | | (1,352,074 | ) |
| | |
| | | | Software – (1.1)% | | | |
| | |
| | (4,100 | ) | | Adobe Systems Incorporated, (2) | | | (322,137 | ) |
| | |
| | (4,500 | ) | | FireEye Inc., (2) | | | (170,010 | ) |
| | |
| | (1,500 | ) | | NetSuite Inc., (2) | | | (133,275 | ) |
| | |
| | (2,200 | ) | | ServiceNow Inc., (2) | | | (156,112 | ) |
| | |
| | (4,300 | ) | | Workday Inc., Class A, (2) | | | (302,118 | ) |
| | |
| | (47,700 | ) | | Zynga Inc., (2) | | | (120,681 | ) |
| | | | Total Software | | | (1,204,333 | ) |
| | |
| | | | Specialty Retail – (1.0)% | | | |
| | |
| | (200 | ) | | AutoZone, Inc., (2) | | | (143,198 | ) |
| | | | | | | | |
| | |
| Shares | | | Description (1) | | Value | |
| | |
| | | | Specialty Retail (continued) | | | |
| | |
| | (7,200 | ) | | Cabela’s Incorporated, (2) | | $ | (323,784 | ) |
| | |
| | (2,300 | ) | | Signet Jewelers Limited | | | (317,400 | ) |
| | |
| | (4,000 | ) | | Tiffany & Co. | | | (329,000 | ) |
| | | | Total Specialty Retail | | | (1,113,382 | ) |
| | |
| | | | Technology Hardware, Storage & Peripherals – (0.3)% | | | |
| | |
| | (9,400 | ) | | Stratasys, Inc., (2) | | | (288,204 | ) |
| | |
| | | | Textiles, Apparel & Luxury Goods – (0.5)% | | | |
| | |
| | (9,000 | ) | | Kate Spade & Company, (2) | | | (170,640 | ) |
| | |
| | (3,400 | ) | | Under Armour, Inc., (2) | | | (324,802 | ) |
| | | | Total Textiles, Apparel & Luxury Goods | | | (495,442 | ) |
| | |
| | | | Thrifts & Mortgage Finance – (0.2)% | | | |
| | |
| | (4,600 | ) | | Nationstar Mortgage Holdings, Incorporated, (2) | | | (76,912 | ) |
| | |
| | (21,900 | ) | | Ocwen Financial Corporation, (2) | | | (162,936 | ) |
| | | | Total Thrifts & Mortgage Finance | | | (239,848 | ) |
| | |
| | | | Tobacco – (0.3)% | | | |
| | |
| | (3,800 | ) | | Reynolds American Inc. | | | (318,250 | ) |
| | |
| | | | Trading Companies & Distributors – (0.1)% | | | |
| | |
| | (2,400 | ) | | Fastenal Company | | | (92,496 | ) |
| | |
| | | | Water Utilities – (0.2)% | | | |
| | |
| | (6,800 | ) | | Aqua America Inc. | | | (172,448 | ) |
| | | | Total Common Stocks Sold Short (proceeds $35,411,478) | | | (32,259,192 | ) |
| | | | Other Assets Less Liabilities – 0.2% | | | 260,819 | |
| | | | Net Assets – 100% | | $ | 107,892,542 | |
For Fund portfolio compliance purposes, the Fund’s industry classifications refer to any one or more of the industry sub-classifications used by one or more widely recognized market indexes or ratings group indexes, and/or as defined by Fund management. This definition may not apply for purposes of this report, which may combine industry sub-classifications into sectors for reporting ease.
| (1) | All percentages shown in the Portfolio of Investments are based on net assets. |
| (2) | Non-income producing; issuer has not declared a dividend within the past twelve months. |
| (3) | The Fund may pledge up to 100% of its eligible long-term investments in the Portfolio of Investments as collateral for Common Stocks Sold Short. As of the end of the reporting period, long-term investments with a value of $46,878,982 have been pledged as collateral for Common Stocks Sold Short. |
See accompanying notes to financial statements.
Nuveen Large Cap Growth Fund
| | |
| Portfolio of Investments | | August 31, 2015 |
| | | | | | | | |
| Shares | | | Description (1) | | Value | |
| | |
| | | | LONG-TERM INVESTMENTS – 99.8% | | | | |
| | |
| | | | COMMON STOCKS – 99.8% | | | | |
| | |
| | | | Aerospace & Defense – 4.7% | | | |
| | |
| | 14,000 | | | Boeing Company | | $ | 1,829,520 | |
| | |
| | 9,300 | | | Huntington Ingalls Industries Inc. | | | 1,046,994 | |
| | |
| | 20,100 | | | Spirit AeroSystems Holdings Inc., (2) | | | 1,027,311 | |
| | |
| | 14,200 | | | Triumph Group Inc. | | | 701,338 | |
| | | | Total Aerospace & Defense | | | 4,605,163 | |
| | |
| | | | Air Freight & Logistics – 1.0% | | | |
| | |
| | 14,000 | | | C.H. Robinson Worldwide, Inc. | | | 944,020 | |
| | |
| | | | Airlines – 0.9% | | | |
| | |
| | 20,900 | | | Delta Air Lines, Inc. | | | 915,002 | |
| | |
| | | | Auto Components – 2.2% | | | |
| | |
| | 15,700 | | | Delphi Automotive PLC | | | 1,185,664 | |
| | |
| | 9,000 | | | Lear Corporation | | | 925,110 | |
| | | | Total Auto Components | | | 2,110,774 | |
| | |
| | | | Automobiles – 1.3% | | | |
| | |
| | 18,200 | | | Ford Motor Company | | | 252,434 | |
| | |
| | 19,000 | | | Thor Industries, Inc. | | | 1,037,020 | |
| | | | Total Automobiles | | | 1,289,454 | |
| | |
| | | | Beverages – 1.1% | | | |
| | |
| | 11,800 | | | PepsiCo, Inc. | | | 1,096,574 | |
| | |
| | | | Biotechnology – 6.0% | | | |
| | |
| | 13,500 | | | Amgen Inc. | | | 2,049,030 | |
| | |
| | 4,600 | | | Biogen Inc., (2) | | | 1,367,580 | |
| | |
| | 23,100 | | | Gilead Sciences, Inc. | | | 2,427,117 | |
| | | | Total Biotechnology | | | 5,843,727 | |
| | |
| | | | Capital Markets – 1.1% | | | |
| | |
| | 21,400 | | | Lazard Limited | | | 1,064,222 | |
| | |
| | | | Chemicals – 0.7% | | | |
| | |
| | 21,000 | | | Cabot Corporation | | | 711,270 | |
| | |
| | | | Commercial Services & Supplies – 1.0% | | | |
| | |
| | 61,000 | | | R.R. Donnelley & Sons Company | | | 957,700 | |
| | |
| | | | Communications Equipment – 1.8% | | | |
| | |
| | 8,000 | | | F5 Networks, Inc., (2) | | | 971,280 | |
| | |
| | 30,500 | | | Juniper Networks Inc. | | | 784,155 | |
| | | | Total Communications Equipment | | | 1,755,435 | |
| | | | | | | | |
| Shares | | | Description (1) | | Value | |
| | |
| | | | Consumer Finance – 0.2% | | | |
| | |
| | 900 | | | Credit Acceptance Corporation, (2) | | $ | 183,429 | |
| | |
| | | | Diversified Telecommunication Services – 3.2% | | | |
| | |
| | 28,758 | | | AT&T Inc. | | | 954,766 | |
| | |
| | 34,000 | | | CenturyLink Inc. | | | 919,360 | |
| | |
| | 16,900 | | | Intelsat SA, (2) | | | 163,423 | |
| | |
| | 15,000 | | | Verizon Communications Inc. | | | 690,150 | |
| | |
| | 56,100 | | | Windstream Holdings Inc. | | | 403,359 | |
| | | | Total Diversified Telecommunication Services | | | 3,131,058 | |
| | |
| | | | Electrical Equipment – 1.2% | | | |
| | |
| | 10,200 | | | Rockwell Automation, Inc. | | | 1,140,666 | |
| | |
| | | | Electronic Equipment, Instruments & Components – 1.5% | | | |
| | |
| | 27,500 | | | Corning Incorporated | | | 473,275 | |
| | |
| | 53,000 | | | Jabil Circuit Inc. | | | 1,025,550 | |
| | | | Total Electronic Equipment, Instruments & Components | | | 1,498,825 | |
| | |
| | | | Energy Equipment & Services – 0.7% | | | |
| | |
| | 35,000 | | | Atwood Oceanics Inc. | | | 668,850 | |
| | |
| | | | Food & Staples Retailing – 1.0% | | | |
| | |
| | 4,200 | | | Wal-Mart Stores, Inc. | | | 271,866 | |
| | |
| | 20,400 | | | Whole Foods Market, Inc. | | | 668,304 | |
| | | | Total Food & Staples Retailing | | | 940,170 | |
| | |
| | | | Food Products – 1.6% | | | |
| | |
| | 19,200 | | | Archer-Daniels-Midland Company | | | 863,808 | |
| | |
| | 33,000 | | | Pilgrim’s Pride Corporation | | | 692,175 | |
| | | | Total Food Products | | | 1,555,983 | |
| | |
| | | | Health Care Equipment & Supplies – 0.2% | | | |
| | |
| | 3,000 | | | Saint Jude Medical Inc. | | | 212,430 | |
| | |
| | | | Health Care Providers & Services – 9.1% | | | |
| | |
| | 9,200 | | | Aetna Inc. | | | 1,053,584 | |
| | |
| | 12,000 | | | AmerisourceBergen Corporation | | | 1,200,480 | |
| | |
| | 7,300 | | | Anthem Inc. | | | 1,029,665 | |
| | |
| | 14,500 | | | Cardinal Health, Inc. | | | 1,192,915 | |
| | |
| | 16,800 | | | Centene Corporation, (2) | | | 1,036,896 | |
| | |
| | 7,100 | | | McKesson HBOC Inc. | | | 1,402,818 | |
| | |
| | 17,000 | | | UnitedHealth Group Incorporated | | | 1,966,900 | |
| | | | Total Health Care Providers & Services | | | 8,883,258 | |
| | |
| | | | Hotels, Restaurants & Leisure – 2.1% | | | |
| | |
| | 16,700 | | | Brinker International Inc. | | | 887,271 | |
| | |
| | 16,100 | | | Marriott International, Inc., Class A | | | 1,137,626 | |
| | | | Total Hotels, Restaurants & Leisure | | | 2,024,897 | |
Nuveen Large Cap Growth Fund (continued)
| | |
| Portfolio of Investments | | August 31, 2015 |
| | | | | | | | |
| Shares | | | Description (1) | | Value | |
| | |
| | | | Internet & Catalog Retail – 1.1% | | | |
| | |
| | 9,500 | | | Expedia, Inc. | | $ | 1,092,405 | |
| | |
| | | | Internet Software & Services – 3.4% | | | |
| | |
| | 48,000 | | | eBay Inc., (2) | | | 1,301,280 | |
| | |
| | 14,600 | | | IAC/InterActiveCorp. | | | 1,019,080 | |
| | |
| | 14,900 | | | VeriSign, Inc., (2) | | | 1,027,206 | |
| | | | Total Internet Software & Services | | | 3,347,566 | |
| | |
| | | | IT Services – 5.9% | | | |
| | |
| | 16,000 | | | Accenture Limited | | | 1,508,320 | |
| | |
| | 6,800 | | | Computer Sciences Corporation | | | 421,532 | |
| | |
| | 11,800 | | | Gartner Inc., (2) | | | 1,009,018 | |
| | |
| | 22,300 | | | Leidos Holdings Inc. | | | 938,384 | |
| | |
| | 20,000 | | | MasterCard, Inc. | | | 1,847,400 | |
| | | | Total IT Services | | | 5,724,654 | |
| | |
| | | | Leisure Products – 0.5% | | | |
| | |
| | 3,600 | | | Polaris Industries Inc. | | | 467,532 | |
| | |
| | | | Machinery – 2.8% | | | |
| | |
| | 33,500 | | | Allison Transmission Holdings Inc. | | | 958,100 | |
| | |
| | 10,000 | | | Parker Hannifin Corporation | | | 1,076,600 | |
| | |
| | 24,000 | | | Trinity Industries Inc. | | | 647,760 | |
| | | | Total Machinery | | | 2,682,460 | |
| | |
| | | | Media – 8.5% | | | |
| | |
| | 39,000 | | | Cablevision Systems Corporation | | | 981,630 | |
| | |
| | 34,000 | | | Comcast Corporation, Class A | | | 1,915,220 | |
| | |
| | 46,300 | | | Interpublic Group of Companies, Inc. | | | 874,144 | |
| | |
| | 19,300 | | | Scripps Networks Interactive, Class A Shares | | | 1,024,637 | |
| | |
| | 292,700 | | | Sirius XM Holdings Inc., (2) | | | 1,116,651 | |
| | |
| | 38,000 | | | Twenty First Century Fox Inc., Class A Shares | | | 1,040,820 | |
| | |
| | 11,000 | | | Twenty First Century Fox Inc., Class B Shares | | | 304,260 | |
| | |
| | 25,900 | | | Viacom Inc., Class B | | | 1,055,943 | |
| | | | Total Media | | | 8,313,305 | |
| | |
| | | | Multiline Retail – 5.0% | | | |
| | |
| | 22,100 | | | Big Lots, Inc. | | | 1,060,579 | |
| | |
| | 6,700 | | | Dillard’s, Inc., Class A | | | 619,817 | |
| | |
| | 16,000 | | | Dollar General Corporation | | | 1,191,840 | |
| | |
| | 15,000 | | | Kohl’s Corporation | | | 765,450 | |
| | |
| | 4,200 | | | Macy’s, Inc. | | | 246,162 | |
| | |
| | 13,000 | | | Target Corporation | | | 1,010,230 | |
| | | | Total Multiline Retail | | | 4,894,078 | |
| | | | | | | | |
| Shares | | | Description (1) | | Value | |
| | |
| | | | Oil, Gas & Consumable Fuels – 1.9% | | | |
| | |
| | 8,500 | | | CVTR Energy Inc. | | $ | 341,785 | |
| | |
| | 54,300 | | | Oasis Petroleum Inc., (2) | | | 605,988 | |
| | |
| | 15,000 | | | Valero Energy Corporation | | | 890,100 | |
| | | | Total Oil, Gas & Consumable Fuels | | | 1,837,873 | |
| | |
| | | | Personal Products – 1.5% | | | |
| | |
| | 83,800 | | | Avon Products, Inc. | | | 434,922 | |
| | |
| | 18,500 | | | Herbalife, Limited | | | 1,065,045 | |
| | | | Total Personal Products | | | 1,499,967 | |
| | |
| | | | Road & Rail – 1.0% | | | |
| | |
| | 23,000 | | | Avis Budget Group Inc., (2) | | | 1,014,990 | |
| | |
| | | | Semiconductors & Semiconductor Equipment – 1.1% | | | |
| | |
| | 38,000 | | | Intel Corporation | | | 1,084,520 | |
| | |
| | | | Software – 7.4% | | | |
| | |
| | 15,800 | | | Citrix Systems, (2) | | | 1,076,138 | |
| | |
| | 16,700 | | | Electronic Arts Inc., (2) | | | 1,104,705 | |
| | |
| | 60,600 | | | Microsoft Corporation | | | 2,637,312 | |
| | |
| | 37,500 | | | Oracle Corporation | | | 1,390,875 | |
| | |
| | 14,300 | | | Red Hat, Inc., (2) | | | 1,032,603 | |
| | | | Total Software | | | 7,241,633 | |
| | |
| | | | Specialty Retail – 7.6% | | | |
| | |
| | 27,000 | | | Aaron Rents Inc. | | | 1,016,550 | |
| | |
| | 27,900 | | | Best Buy Co., Inc. | | | 1,025,046 | |
| | |
| | 22,500 | | | Chico’s FAS, Inc. | | | 335,475 | |
| | |
| | 21,000 | | | Home Depot, Inc. | | | 2,445,660 | |
| | |
| | 23,100 | | | Lowe’s Companies, Inc. | | | 1,597,827 | |
| | |
| | 121,900 | | | Office Depot, Inc., (2) | | | 966,667 | |
| | | | Total Specialty Retail | | | 7,387,225 | |
| | |
| | | | Technology Hardware, Storage & Peripherals – 8.0% | | | |
| | |
| | 63,300 | | | Apple, Inc. | | | 7,137,707 | |
| | |
| | 25,300 | | | EMC Corporation | | | 629,211 | |
| | | | Total Technology Hardware, Storage & Peripherals | | | 7,766,918 | |
| | |
| | | | Textiles, Apparel & Luxury Goods – 1.5% | | | |
| | |
| | 10,200 | | | Carter’s Inc. | | | 1,002,762 | |
| | |
| | 7,000 | | | Fossil Group Inc., (2) | | | 431,060 | |
| | | | Total Textiles, Apparel & Luxury Goods | | | 1,433,822 | |
| | | | Total Long-Term Investments (cost $98,970,137) | | | 97,321,855 | |
Nuveen Large Cap Growth Fund (continued)
| | |
| Portfolio of Investments | | August 31, 2015 |
| | | | | | | | | | | | | | | | |
Principal
Amount (000) | | | Description (1) | | Coupon | | | Maturity | | | Value | |
| | | | |
| | | | SHORT-TERM INVESTMENTS – 0.2% | | | | | | | | | | | | |
| | | | |
| | | | REPURCHASE AGREEMENTS – 0.2% | | | | | | | | | | | | |
| | | | |
| $ | 168 | | | Repurchase Agreement with Fixed Income Clearing Corporation, dated 8/31/15, repurchase price $167,795, collateralized by $170,000 U.S. Treasury Notes, 2.250%, due 11/15/24, value $172,338 | | | 0.000% | | | | 9/01/15 | | | $ | 167,795 | |
| | | | Total Short-Term Investments (cost $167,795) | | | | | | | | | | | 167,795 | |
| | | | Total Investments (cost $99,137,932) – 100.0% | | | | | | | | | | | 97,489,650 | |
| | | | Other Assets Less Liabilities – 0.0% | | | | | | | | | | | 51,578 | |
| | | | Net Assets – 100% | | | | | | | | | | $ | 97,541,228 | |
For Fund portfolio compliance purposes, the Fund’s industry classifications refer to any one or more of the industry sub-classifications used by one or more widely recognized market indexes or ratings group indexes, and/or as defined by Fund management. This definition may not apply for purposes of this report, which may combine industry sub-classifications into sectors for reporting ease.
| (1) | All percentages shown in the Portfolio of Investments are based on net assets. |
| (2) | Non-income producing; issuer has not declared a dividend within the past twelve months. |
See accompanying notes to financial statements.
Nuveen Large Cap Value Fund
| | |
| Portfolio of Investments | | August 31, 2015 |
| | | | | | | | |
| Shares | | | Description (1) | | Value | |
| | |
| | | | LONG-TERM INVESTMENTS – 99.7% | | | | |
| | |
| | | | COMMON STOCKS – 99.7% | | | | |
| | |
| | | | Aerospace & Defense – 4.8% | | | |
| | |
| | 36,000 | | | Huntington Ingalls Industries Inc. | | $ | 4,052,880 | |
| | |
| | 39,000 | | | L-3 Communications Holdings, Inc. | | | 4,113,330 | |
| | |
| | 85,000 | | | Spirit AeroSystems Holdings Inc., (2) | | | 4,344,350 | |
| | |
| | 87,000 | | | Triumph Group Inc. | | | 4,296,930 | |
| | |
| | 29,000 | | | United Technologies Corporation | | | 2,656,690 | |
| | | | Total Aerospace & Defense | | | 19,464,180 | |
| | |
| | | | Airlines – 1.1% | | | |
| | |
| | 99,000 | | | Delta Air Lines, Inc. | | | 4,334,220 | |
| | |
| | | | Auto Components – 0.8% | | | |
| | |
| | 30,000 | | | Lear Corporation | | | 3,083,700 | |
| | |
| | | | Automobiles – 1.6% | | | |
| | |
| | 216,000 | | | General Motors Company | | | 6,359,040 | |
| | |
| | | | Banks – 9.3% | | | |
| | |
| | 676,000 | | | Bank of America Corporation | | | 11,045,840 | |
| | |
| | 94,000 | | | Citigroup Inc. | | | 5,027,120 | |
| | |
| | 215,000 | | | JPMorgan Chase & Co. | | | 13,781,500 | |
| | |
| | 150,000 | | | Popular Inc. | | | 4,404,000 | |
| | |
| | 27,000 | | | SunTrust Banks, Inc. | | | 1,089,990 | |
| | |
| | 40,000 | | | Wells Fargo & Company | | | 2,133,200 | |
| | | | Total Banks | | | 37,481,650 | |
| | |
| | | | Biotechnology – 1.0% | | | |
| | |
| | 26,000 | | | Amgen Inc. | | | 3,946,280 | |
| | |
| | | | Capital Markets – 1.6% | | | |
| | |
| | 190,000 | | | Morgan Stanley | | | 6,545,500 | |
| | |
| | | | Chemicals – 1.1% | | | |
| | |
| | 130,000 | | | Cabot Corporation | | | 4,403,100 | |
| | |
| | | | Commercial Services & Supplies – 2.1% | | | |
| | |
| | 207,000 | | | Pitney Bowes Inc. | | | 4,100,670 | |
| | |
| | 272,000 | | | R.R. Donnelley & Sons Company | | | 4,270,400 | |
| | | | Total Commercial Services & Supplies | | | 8,371,070 | |
Nuveen Large Cap Value Fund (continued)
| | |
| Portfolio of Investments | | August 31, 2015 |
| | | | | | | | |
| Shares | | | Description (1) | | Value | |
| | |
| | | | Communications Equipment – 2.5% | | | |
| | |
| | 5,000 | | | Brocade Communications Systems Inc. | | $ | 53,250 | |
| | |
| | 379,000 | | | Cisco Systems, Inc. | | | 9,808,520 | |
| | | | Total Communications Equipment | | | 9,861,770 | |
| | |
| | | | Containers & Packaging – 0.9% | | | |
| | |
| | 94,000 | | | Sonoco Products Company | | | 3,696,080 | |
| | |
| | | | Diversified Consumer Services – 0.8% | | | |
| | |
| | 293,000 | | | Apollo Group, Inc., (2) | | | 3,255,230 | |
| | |
| | | | Diversified Financial Services – 1.6% | | | |
| | |
| | 13,000 | | | Berkshire Hathaway Inc., Class B, (2) | | | 1,742,520 | |
| | |
| | 6,000 | | | NASDAQ Stock Market, Inc. | | | 307,140 | |
| | |
| | 103,000 | | | Voya Financial Inc. | | | 4,437,240 | |
| | | | Total Diversified Financial Services | | | 6,486,900 | |
| | |
| | | | Diversified Telecommunication Services – 3.6% | | | |
| | |
| | 102,135 | | | AT&T Inc. | | | 3,390,882 | |
| | |
| | 180,000 | | | CenturyLink Inc. | | | 4,867,200 | |
| | |
| | 208,000 | | | Intelsat SA, (2) | | | 2,011,360 | |
| | |
| | 572,000 | | | Windstream Holdings Inc. | | | 4,112,680 | |
| | | | Total Diversified Telecommunication Services | | | 14,382,122 | |
| | |
| | | | Electric Utilities – 1.3% | | | |
| | |
| | 170,000 | | | Exelon Corporation | | | 5,229,200 | |
| | |
| | | | Electrical Equipment – 0.9% | | | |
| | |
| | 54,000 | | | Regal-Beloit Corporation | | | 3,600,180 | |
| | |
| | | | Electronic Components – 1.0% | | | |
| | |
| | 232,000 | | | Corning Incorporated | | | 3,992,720 | |
| | |
| | | | Electronic Equipment & Instruments – 1.0% | | | |
| | |
| | 213,000 | | | Jabil Circuit Inc. | | | 4,121,550 | |
| | |
| | | | Energy Equipment & Services – 2.7% | | | |
| | |
| | 174,000 | | | Atwood Oceanics Inc. | | | 3,325,140 | |
| | |
| | 324,000 | | | Noble Corporation PLC | | | 4,218,480 | |
| | |
| | 173,000 | | | Tidewater Inc. | | | 3,101,890 | |
| | | | Total Energy Equipment & Services | | | 10,645,510 | |
| | |
| | | | Food & Staples Retailing – 2.1% | | | |
| | |
| | 130,000 | | | Wal-Mart Stores, Inc. | | | 8,414,900 | |
| | |
| | | | Food Products – 2.4% | | | |
| | |
| | 124,000 | | | Archer-Daniels-Midland Company | | | 5,578,760 | |
| | |
| | 58,000 | | | Bunge Limited | | | 4,202,100 | |
| | | | Total Food Products | | | 9,780,860 | |
| | | | | | | | |
| Shares | | | Description (1) | | Value | |
| | |
| | | | Health Care Providers & Services – 5.8% | | | |
| | |
| | 48,000 | | | Aetna Inc. | | $ | 5,496,960 | |
| | |
| | 39,000 | | | Anthem Inc. | | | 5,500,950 | |
| | |
| | 51,000 | | | Cardinal Health, Inc. | | | 4,195,770 | |
| | |
| | 65,000 | | | Health Net Inc., (2) | | | 4,163,900 | |
| | |
| | 36,000 | | | UnitedHealth Group Incorporated | | | 4,165,200 | |
| | | | Total Health Care Providers & Services | | | 23,522,780 | |
| | |
| | | | Hotels, Restaurants & Leisure – 1.9% | | | |
| | |
| | 64,000 | | | Darden Restaurants, Inc. | | | 4,352,640 | |
| | |
| | 47,000 | | | Marriott International, Inc., Class A | | | 3,321,020 | |
| | | | Total Hotels, Restaurants & Leisure | | | 7,673,660 | |
| | |
| | | | Independent Power & Renewable Electricity Producers – 0.1% | | | |
| | |
| | 40,000 | | | AES Corporation | | | 480,000 | |
| | |
| | | | Industrial Conglomerates – 0.6% | | | |
| | |
| | 101,000 | | | General Electric Company | | | 2,506,820 | |
| | |
| | | | Insurance – 8.8% | | | |
| | |
| | 87,000 | | | AFLAC Incorporated | | | 5,098,200 | |
| | |
| | 127,000 | | | American International Group, Inc. | | | 7,663,180 | |
| | |
| | 51,000 | | | Aspen Insurance Holdings Limited | | | 2,341,410 | |
| | |
| | 170,000 | | | Assured Guaranty Limited | | | 4,294,200 | |
| | |
| | 25,000 | | | Everest Reinsurance Group Ltd | | | 4,395,250 | |
| | |
| | 118,000 | | | MetLife, Inc. | | | 5,911,800 | |
| | |
| | 57,000 | | | Travelers Companies, Inc. | | | 5,674,350 | |
| | | | Total Insurance | | | 35,378,390 | |
| | |
| | | | IT Services – 3.4% | | | |
| | |
| | 70,000 | | | Computer Sciences Corporation | | | 4,339,300 | |
| | |
| | 104,000 | | | Leidos Holdings Inc. | | | 4,376,320 | |
| | |
| | 471,000 | | | Xerox Corporation | | | 4,790,070 | |
| | | | Total IT Services | | | 13,505,690 | |
| | |
| | | | Machinery – 4.0% | | | |
| | |
| | 90,000 | | | AGCO Corporation | | | 4,413,600 | |
| | |
| | 141,000 | | | Allison Transmission Holdings Inc. | | | 4,032,600 | |
| | |
| | 24,000 | | | Deere & Company | | | 1,962,720 | |
| | |
| | 20,000 | | | Lincoln Electric Holdings Inc. | | | 1,173,000 | |
| | |
| | 41,000 | | | Parker Hannifin Corporation | | | 4,414,060 | |
| | | | Total Machinery | | | 15,995,980 | |
| | |
| | | | Media – 2.1% | | | |
| | |
| | 28,000 | | | Cablevision Systems Corporation | | | 704,760 | |
| | |
| | 66,000 | | | Comcast Corporation, Class A | | | 3,717,780 | |
Nuveen Large Cap Value Fund (continued)
| | |
| Portfolio of Investments | | August 31, 2015 |
| | | | | | | | |
| Shares | | | Description (1) | | Value | |
| | |
| | | | Media (continued) | | | |
| | |
| | 17,000 | | | John Wiley and Sons Inc., Class A | | $ | 876,520 | |
| | |
| | 138,000 | | | TEGNA Inc. | | | 3,283,020 | |
| | | | Total Media | | | 8,582,080 | |
| | |
| | | | Metals & Mining – 0.2% | | | |
| | |
| | 10,000 | | | Reliance Steel & Aluminum Company | | | 581,200 | |
| | |
| | | | Multiline Retail – 5.2% | | | |
| | |
| | 83,000 | | | Big Lots, Inc. | | | 3,983,170 | |
| | |
| | 36,000 | | | Dillard’s, Inc., Class A | | | 3,330,360 | |
| | |
| | 84,000 | | | Kohl’s Corporation | | | 4,286,520 | |
| | |
| | 62,000 | | | Macy’s, Inc. | | | 3,633,820 | |
| | |
| | 75,000 | | | Target Corporation | | | 5,828,250 | |
| | | | Total Multiline Retail | | | 21,062,120 | |
| | |
| | | | Oil, Gas & Consumable Fuels – 4.1% | | | |
| | |
| | 42,000 | | | CVTR Energy Inc. | | | 1,688,820 | |
| | |
| | 1,070,000 | | | Denbury Resources Inc. | | | 4,643,800 | |
| | |
| | 67,000 | | | Exxon Mobil Corporation | | | 5,041,080 | |
| | |
| | 89,000 | | | Valero Energy Corporation | | | 5,281,260 | |
| | | | Total Oil, Gas & Consumable Fuels | | | 16,654,960 | |
| | |
| | | | Personal Products – 1.1% | | | |
| | |
| | 77,000 | | | Herbalife, Limited | | | 4,432,890 | |
| | |
| | | | Pharmaceuticals – 4.5% | | | |
| | |
| | 18,000 | | | Johnson & Johnson | | | 1,691,640 | |
| | |
| | 80,000 | | | Merck & Company Inc. | | | 4,308,000 | |
| | |
| | 374,000 | | | Pfizer Inc. | | | 12,050,280 | |
| | | | Total Pharmaceuticals | | | 18,049,920 | |
| | |
| | | | Semiconductors & Semiconductor Equipment – 3.4% | | | |
| | |
| | 322,000 | | | Intel Corporation | | | 9,189,880 | |
| | |
| | 199,000 | | | NVIDIA Corporation | | | 4,473,520 | |
| | | | Total Semiconductors & Semiconductor Equipment | | | 13,663,400 | |
| | |
| | | | Software – 0.6% | | | |
| | |
| | 36,000 | | | Electronic Arts Inc., (2) | | | 2,381,400 | |
| | |
| | | | Specialty Retail – 2.8% | | | |
| | |
| | 133,000 | | | Best Buy Co., Inc. | | | 4,886,420 | |
| | |
| | 47,000 | | | GameStop Corporation | | | 1,996,560 | |
| | |
| | 321,000 | | | Staples, Inc. | | | 4,561,410 | |
| | | | Total Specialty Retail | | | 11,444,390 | |
| | |
| | | | Technology Hardware, Storage & Peripherals – 4.6% | | | |
| | |
| | 35,000 | | | Apple, Inc. | | | 3,946,600 | |
| | | | | | | | |
| Shares | | | Description (1) | | Value | |
| | |
| | | | Technology Hardware, Storage & Peripherals (continued) | | | |
| | |
| | 221,000 | | | EMC Corporation | | $ | 5,496,270 | |
| | |
| | 218,000 | | | Hewlett-Packard Company | | | 6,117,080 | |
| | |
| | 99,000 | | | Lexmark International, Inc., Class A | | | 2,968,020 | |
| | | | Total Technology Hardware, Storage & Peripherals | | | 18,527,970 | |
| | |
| | | | Trading Companies & Distributors – 1.1% | | | |
| | |
| | 81,000 | | | WESCO International Inc., (2) | | | 4,533,570 | |
| | |
| | | | Wireless Telecommunication Services – 1.2% | | | |
| | |
| | 122,000 | | | T-Mobile US Inc., (2) | | | 4,832,420 | |
| | | | Total Long-Term Investments (cost $410,715,647) | | | 401,265,402 | |
| | | | Other Assets Less Liabilities – 0.3% | | | 1,161,326 | |
| | | | Net Assets – 100% | | $ | 402,426,728 | |
For Fund portfolio compliance purposes, the Fund’s industry classifications refer to any one or more of the industry sub-classifications used by one or more widely recognized market indexes or ratings group indexes, and/or as defined by Fund management. This definition may not apply for purposes of this report, which may combine industry sub-classifications into sectors for reporting ease.
| (1) | All percentages shown in the Portfolio of Investments are based on net assets. |
| (2) | Non-income producing; issuer has not declared a dividend within the past twelve months. |
See accompanying notes to financial statements.
Statement of
| | | | |
| | Assets and Liabilities | | August 31, 2015 |
| | | | | | | | | | | | | | | | | | | | |
| | | Concentrated
Core | | | Core
Dividend | | | Equity Long/
Short | | | Equity Market
Neutral | | | Growth | |
Assets | | | | | | | | | | | | | | | | | | | | |
Long-term investments, at value ($139,676,761, $46,089,212, $139,821,033, $44,527,910 and $39,433,448, respectively) | | $ | 132,559,630 | | | $ | 44,371,215 | | | $ | 137,413,499 | | | $ | 43,087,203 | | | $ | 46,378,490 | |
Short-term investments, at value (cost approximates value) | | | — | | | | — | | | | 3,790,915 | | | | 6,495,033 | | | | 617,316 | |
Cash | | | — | | | | — | | | | 243,909 | | | | — | | | | — | |
Cash collateral at brokers(1) | | | — | | | | — | | | | 15,328,280 | | | | 30,540,944 | | | | — | |
Receivable for: | | | | | | | | | | | | | | | | | | | | |
Dividends | | | 341,020 | | | | 115,707 | | | | 225,418 | | | | 79,282 | | | | 80,853 | |
Investments sold | | | — | | | | 786,197 | | | | 2,410,247 | | | | 1,784,791 | | | | 491,095 | |
Shares sold | | | 1,044,530 | | | | 355,762 | | | | 329,299 | | | | 159,538 | | | | 98,757 | |
Other assets | | | 33,107 | | | | 19,879 | | | | 27,584 | | | | 18,944 | | | | 14,858 | |
Total assets | | | 133,978,287 | | | | 45,648,760 | | | | 159,769,151 | | | | 82,165,735 | | | | 47,681,369 | |
Liabilities | | | | | | | | | | | | | | | | | | | | |
Cash overdraft | | | 168,604 | | | | 182,257 | | | | — | | | | — | | | | — | |
Common stocks sold short, at value (proceeds $ —, $ —, $74,813,804, $39,558,057 and $ —, respectively) | | | — | | | | — | | | | 69,280,980 | | | | 35,607,625 | | | | — | |
Payable for: | | | | | | | | | | | | | | | | | | | | |
Dividends on common stocks sold short | | | — | | | | — | | | | 105,128 | | | | 32,782 | | | | — | |
Investments purchased | | | 680,302 | | | | 469,834 | | | | 3,189,178 | | | | 425,179 | | | | 221,368 | |
Shares redeemed | | | 589,480 | | | | 338,631 | | | | 524,176 | | | | 35,400 | | | | 144,121 | |
Accrued expenses: | | | | | | | | | | | | | | | | | | | | |
12b-1 distribution and service fees | | | 32,810 | | | | 9,611 | | | | 12,193 | | | | 3,419 | | | | 10,183 | |
Management fees | | | 83,752 | | | | 21,132 | | | | 78,507 | | | | 33,836 | | | | 26,288 | |
Trustees fees | | | 543 | | | | 180 | | | | 322 | | | | 163 | | | | 211 | |
Other | | | 79,668 | | | | 41,132 | | | | 112,397 | | | | 57,902 | | | | 42,501 | |
Total liabilities | | | 1,635,159 | | | | 1,062,777 | | | | 73,302,881 | | | | 36,196,306 | | | | 444,672 | |
Net assets | | $ | 132,343,128 | | | $ | 44,585,983 | | | $ | 86,466,270 | | | $ | 45,969,429 | | | $ | 47,236,697 | |
Class A Shares | | | | | | | | | | | | | | | | | | | | |
Net assets | | $ | 54,805,424 | | | $ | 20,601,015 | | | $ | 24,820,742 | | | $ | 8,972,426 | | | $ | 8,792,244 | |
Shares outstanding | | | 2,038,125 | | | | 853,691 | | | | 761,200 | | | | 419,536 | | | | 305,366 | |
Net asset value (“NAV”) per share | | $ | 26.89 | | | $ | 24.13 | | | $ | 32.61 | | | $ | 21.39 | | | $ | 28.79 | |
Offering price per share (NAV per share plus maximum sales charge of 5.75% of offering price) | | $ | 28.53 | | | $ | 25.60 | | | $ | 34.60 | | | $ | 22.69 | | | $ | 30.55 | |
Class C Shares | | | | | | | | | | | | | | | | | | | | |
Net assets | | $ | 24,582,839 | | | $ | 5,949,891 | | | $ | 8,086,841 | | | $ | 1,834,625 | | | $ | 9,149,522 | |
Shares outstanding | | | 927,595 | | | | 247,097 | | | | 262,595 | | | | 87,198 | | | | 342,406 | |
NAV and offering price per share | | $ | 26.50 | | | $ | 24.08 | | | $ | 30.80 | | | $ | 21.04 | | | $ | 26.72 | |
Class R3 Shares | | | | | | | | | | | | | | | | | | | | |
Net assets | | $ | — | | | $ | — | | | $ | — | | | $ | — | | | $ | 64,980 | |
Shares outstanding | | | — | | | | — | | | | — | | | | — | | | | 2,275 | |
NAV and offering price per share | | $ | — | | | $ | — | | | $ | — | | | $ | — | | | $ | 28.56 | |
Class I Shares | | | | | | | | | | | | | | | | | | | | |
Net assets | | $ | 52,954,865 | | | $ | 18,035,077 | | | $ | 53,558,687 | | | $ | 35,162,378 | | | $ | 29,229,951 | |
Shares outstanding | | | 1,965,722 | | | | 747,235 | | | | 1,613,974 | | | | 1,634,959 | | | | 999,329 | |
NAV and offering price per share | | $ | 26.94 | | | $ | 24.14 | | | $ | 33.18 | | | $ | 21.51 | | | $ | 29.25 | |
Net assets consist of: | | | | | | | | | | | | | | | | | | | | |
Capital paid-in | | $ | 134,753,152 | | | $ | 46,000,396 | | | $ | 84,180,985 | | | $ | 44,706,712 | | | $ | 34,901,786 | |
Undistributed (Over-distribution of) net investment income | | | 599,018 | | | | 57,802 | | | | (180,487 | ) | | | (304,747 | ) | | | 229,737 | |
Accumulated net realized gain (loss) | | | 4,108,089 | | | | 245,782 | | | | (659,518 | ) | | | (942,261 | ) | | | 5,160,132 | |
Net unrealized appreciation (depreciation) | | | (7,117,131 | ) | | | (1,717,997 | ) | | | 3,125,290 | | | | 2,509,725 | | | | 6,945,042 | |
Net assets | | $ | 132,343,128 | | | $ | 44,585,983 | | | $ | 86,466,270 | | | $ | 45,969,429 | | | $ | 47,236,697 | |
Authorized shares – per class | | | Unlimited | | | | Unlimited | | | | Unlimited | | | | Unlimited | | | | Unlimited | |
Par value per share | | $ | 0.01 | | | $ | 0.01 | | | $ | 0.01 | | | $ | 0.01 | | | $ | 0.01 | |
| (1) | Cash pledged as collateral for common stocks sold short is in addition to the Fund’s securities pledged as collateral as noted in the Portfolio of Investments. |
See accompanying notes to financial statements.
| | | | | | | | | | | | | | | | |
| | | Large Cap
Core | | | Large Cap
Core Plus | | | Large Cap
Growth | | | Large Cap
Value | |
Assets | | | | | | | | | | | | | | | | |
Long-term investments, at value (cost $239,224,303, $143,940,030, $98,970,137 and $410,715,647, respectively) | | $ | 229,808,090 | | | $ | 139,890,915 | | | $ | 97,321,855 | | | $ | 401,265,402 | |
Short-term investments, at value (cost approximates value) | | | — | | | | — | | | | 167,795 | | | | — | |
Cash | | | — | | | | — | | | | — | | | | — | |
Cash collateral at brokers(1) | | | — | | | | — | | | | — | | | | — | |
Receivable for: | | | | | | | | | | | | | | | | |
Dividends | | | 527,253 | | | | 310,520 | | | | 167,558 | | | | 1,314,368 | |
Investments sold | | | 905,816 | | | | 3,400,008 | | | | 989,926 | | | | 25,299,340 | |
Shares sold | | | 1,069,428 | | | | 114,993 | | | | 281,267 | | | | 898,472 | |
Other assets | | | 32,314 | | | | 23,433 | | | | 21,214 | | | | 146,409 | |
Total assets | | | 232,342,901 | | | | 143,739,869 | | | | 98,949,615 | | | | 428,923,991 | |
Liabilities | | | | | | | | | | | | | | | | |
Cash overdraft | | | 1,369 | | | | 21,513 | | | | — | | | | 20,484,498 | |
Common stocks sold short, at value (proceeds $ —, $35,411,478, $ — and
$ —, respectively) | | | — | | | | 32,259,192 | | | | — | | | | — | |
Payable for: | | | | | | | | | | | | | | | | |
Dividends on common stocks sold short | | | — | | | | 42,582 | | | | — | | | | — | |
Investments purchased | | | 1,157,589 | | | | 2,104,301 | | | | 1,219,416 | | | | 5,139,044 | |
Shares redeemed | | | 977,263 | | | | 1,199,414 | | | | 58,057 | | | | 270,459 | |
Accrued expenses: | | | | | | | | | | | | | | | | |
12b-1 distribution and service fees | | | 41,361 | | | | 17,701 | | | | 13,529 | | | | 86,367 | |
Management fees | | | 162,958 | | | | 96,035 | | | | 54,256 | | | | 262,391 | |
Trustees fees | | | 939 | | | | 508 | | | | 389 | | | | 103,468 | |
Other | | | 93,678 | | | | 106,081 | | | | 62,740 | | | | 151,036 | |
Total liabilities | | | 2,435,157 | | | | 35,847,327 | | | | 1,408,387 | | | | 26,497,263 | |
Net assets | | $ | 229,907,744 | | | $ | 107,892,542 | | | $ | 97,541,228 | | | $ | 402,426,728 | |
Class A Shares | | | | | | | | | | | | | | | | |
Net assets | | $ | 37,684,295 | | | $ | 17,190,810 | | | $ | 31,441,707 | | | $ | 267,336,586 | |
Shares outstanding | | | 1,469,509 | | | | 687,030 | | | | 1,243,666 | | | | 11,339,215 | |
Net asset value (“NAV”) per share | | $ | 25.64 | | | $ | 25.02 | | | $ | 25.28 | | | $ | 23.58 | |
Offering price per share (NAV per share plus maximum sales charge of 5.75% of
offering price) | | $ | 27.20 | | | $ | 26.55 | | | $ | 26.82 | | | $ | 25.02 | |
Class C Shares | | | | | | | | | | | | | | | | |
Net assets | | $ | 38,591,043 | | | $ | 15,961,537 | | | $ | 7,621,086 | | | $ | 31,515,913 | |
Shares outstanding | | | 1,524,060 | | | | 647,769 | | | | 305,344 | | | | 1,394,599 | |
NAV and offering price per share | | $ | 25.32 | | | $ | 24.64 | | | $ | 24.96 | | | $ | 22.60 | |
Class R3 Shares | | | | | | | | | | | | | | | | |
Net assets | | $ | — | | | $ | — | | | $ | — | | | $ | 232,119 | |
Shares outstanding | | | — | | | | — | | | | — | | | | 9,792 | |
NAV and offering price per share | | $ | — | | | $ | — | | | $ | — | | | $ | 23.71 | |
Class I Shares | | | | | | | | | | | | | | | | |
Net assets | | $ | 153,632,406 | | | $ | 74,740,195 | | | $ | 58,478,435 | | | $ | 103,342,110 | |
Shares outstanding | | | 5,980,291 | | | | 2,976,343 | | | | 2,309,089 | | | | 4,355,192 | |
NAV and offering price per share | | $ | 25.69 | | | $ | 25.11 | | | $ | 25.33 | | | $ | 23.73 | |
Net assets consist of: | | | | | | | | | | | | | | | | |
Capital paid-in | | $ | 234,620,790 | | | $ | 106,396,165 | | | $ | 95,736,273 | | | $ | 380,470,956 | |
Undistributed (Over-distribution of) net investment income | | | 1,489,713 | | | | 474,354 | | | | 475,127 | | | | 4,392,053 | |
Accumulated net realized gain (loss) | | | 3,213,454 | | | | 1,918,852 | | | | 2,978,110 | | | | 27,013,964 | |
Net unrealized appreciation (depreciation) | | | (9,416,213 | ) | | | (896,829 | ) | | | (1,648,282 | ) | | | (9,450,245 | ) |
Net assets | | $ | 229,907,744 | | | $ | 107,892,542 | | | $ | 97,541,228 | | | $ | 402,426,728 | |
Authorized shares – per class | | | Unlimited | | | | Unlimited | | | | Unlimited | | | | Unlimited | |
Par value per share | | $ | 0.01 | | | $ | 0.01 | | | $ | 0.01 | | | $ | 0.01 | |
| (1) | Cash pledged as collateral for common stocks sold short is in addition to the Fund’s securities pledged as collateral as noted in the Portfolio of Investments. |
See accompanying notes to financial statements.
Statement of
| | | | |
| | Operations | | Year Ended August 31, 2015 |
| | | | | | | | | | | | | | | | | | | | |
| | | Concentrated
Core | | | Core
Dividend | | | Equity
Long/Short | | | Equity Market
Neutral | | | Growth | |
Investment Income (net of foreign tax withheld of $ —, $134, $ —, $259 and $ —, respectively) | | $ | 1,885,359 | | | $ | 1,016,599 | | | $ | 1,788,988 | | | $ | 775,899 | | | $ | 846,797 | |
Expenses | | | | | | | | | | | | | | | | | | | | |
Management fees | | | 795,330 | | | | 249,180 | | | | 814,485 | | | | 571,088 | | | | 343,734 | |
12b-1 service fees – Class A Shares | | | 97,323 | | | | 40,895 | | | | 46,984 | | | | 23,497 | | | | 21,716 | |
12b-1 distribution and service fees – Class C Shares | | | 125,017 | | | | 45,822 | | | | 58,834 | | | | 19,337 | | | | 95,942 | |
12b-1 distribution and service fees – Class R3 Shares | | | — | | | | — | | | | — | | | | — | | | | 322 | |
Dividends expense on common stocks sold short | | | — | | | | — | | | | 754,984 | | | | 465,548 | | | | — | |
Prime broker expenses | | | — | | | | — | | | | 481,110 | | | | 260,346 | | | | — | |
Shareholder servicing agent fees | | | 91,576 | | | | 32,203 | | | | 61,451 | | | | 33,657 | | | | 47,024 | |
Custodian fees | | | 27,611 | | | | 25,788 | | | | 46,737 | | | | 36,021 | | | | 26,546 | |
Trustees fees | | | 3,077 | | | | 1,262 | | | | 2,084 | | | | 1,553 | | | | 1,796 | |
Professional fees | | | 27,106 | | | | 21,101 | | | | 26,298 | | | | 26,296 | | | | 23,236 | |
Shareholder reporting expenses | | | 29,645 | | | | 10,763 | | | | 21,053 | | | | 14,168 | | | | 8,316 | |
Federal and state registration fees | | | 69,303 | | | | 45,389 | | | | 51,742 | | | | 40,917 | | | | 58,269 | |
Other | | | 6,895 | | | | 5,024 | | | | 6,392 | | | | 5,431 | | | | 6,407 | |
Total expenses before fee waiver/expense reimbursement | | | 1,272,883 | | | | 477,427 | | | | 2,372,154 | | | | 1,497,859 | | | | 633,308 | |
Fee waiver/expense reimbursement | | | (107,890 | ) | | | (71,685 | ) | | | (151,258 | ) | | | (112,849 | ) | | | (16,248 | ) |
Net expenses | | | 1,164,993 | | | | 405,742 | | | | 2,220,896 | | | | 1,385,010 | | | | 617,060 | |
Net investment income (loss) | | | 720,366 | | | | 610,857 | | | | (431,908 | ) | | | (609,111 | ) | | | 229,737 | |
Realized and Unrealized Gain (Loss) | | | | | | | | | | | | | | | | | | | | |
Net realized gain (loss) from: | | | | | | | | | | | | | | | | | | | | |
Investments and foreign currency | | | 4,597,216 | | | | 396,705 | | | | 3,773,837 | | | | 2,576,777 | | | | 7,092,074 | |
Common stocks sold short | | | — | | | | — | | | | (3,904,504 | ) | | | (3,108,789 | ) | | | — | |
Change in net unrealized appreciation (depreciation) of: | | | | | | | | | | | | | | | | | | | | |
Investments and foreign currency | | | (8,766,932 | ) | | | (3,056,804 | ) | | | (6,167,765 | ) | | | (4,624,634 | ) | | | (5,681,549 | ) |
Common stocks sold short | | | — | | | | — | | | | 7,073,559 | | | | 6,228,428 | | | | — | |
Net realized and unrealized gain (loss) | | | (4,169,716 | ) | | | (2,660,099 | ) | | | 775,127 | | | | 1,071,782 | | | | 1,410,525 | |
Net increase (decrease) in net assets from operations | | $ | (3,449,350 | ) | | $ | (2,049,242 | ) | | $ | 343,219 | | | $ | 462,671 | | | $ | 1,640,262 | |
See accompanying notes to financial statements.
| | | | | | | | | | | | | | | | |
| | | Large Cap
Core | | | Large Cap
Core Plus | | | Large Cap
Growth | | | Large Cap
Value | |
Investment Income (net of foreign tax withheld of $259, $ —, $307 and $ —, respectively) | | $ | 3,415,591 | | | $ | 2,629,289 | | | $ | 1,269,958 | | | $ | 9,538,049 | |
Expenses | | | | | | | | | | | | | | | | |
Management fees | | | 1,214,868 | | | | 1,199,377 | | | | 529,578 | | | | 3,120,216 | |
12b-1 service fees – Class A Shares | | | 60,876 | | | | 42,215 | | | | 56,529 | | | | 730,125 | |
12b-1 distribution and service fees – Class C Shares | | | 246,033 | | | | 113,957 | | | | 54,737 | | | | 317,559 | |
12b-1 distribution and service fees – Class R3 Shares | | | — | | | | — | | | | — | | | | 760 | |
Dividends expense on common stocks sold short | | | — | | | | 458,700 | | | | — | | | | — | |
Prime broker expenses | | | — | | | | 322,049 | | | | — | | | | — | |
Shareholder servicing agent fees | | | 105,696 | | | | 86,053 | | | | 69,287 | | | | 327,046 | |
Custodian fees | | | 40,380 | | | | 45,122 | | | | 29,560 | | | | 72,846 | |
Trustees fees | | | 5,280 | | | | 3,287 | | | | 2,423 | | | | 13,810 | |
Professional fees | | | 35,325 | | | | 30,952 | | | | 25,661 | | | | 61,528 | |
Shareholder reporting expenses | | | 37,631 | | | | 31,025 | | | | 19,995 | | | | 175,488 | |
Federal and state registration fees | | | 71,109 | | | | 58,073 | | | | 49,418 | | | | 74,305 | |
Other | | | 10,101 | | | | 7,959 | | | | 6,385 | | | | 20,606 | |
Total expenses before fee waiver/expense reimbursement | | | 1,827,299 | | | | 2,398,769 | | | | 843,573 | | | | 4,914,289 | |
Fee waiver/expense reimbursement | | | — | | | | (210,676 | ) | | | (54,292 | ) | | | — | |
Net expenses | | | 1,827,299 | | | | 2,188,093 | | | | 789,281 | | | | 4,914,289 | |
Net investment income (loss) | | | 1,588,292 | | | | 441,196 | | | | 480,677 | | | | 4,623,760 | |
Realized and Unrealized Gain (Loss) | | | | | | | | | | | | | | | | |
Net realized gain (loss) from: | | | | | | | | | | | | | | | | |
Investments and foreign currency | | | 3,588,701 | | | | 4,352,493 | | | | 3,165,493 | | | | 34,141,370 | |
Common stocks sold short | | | — | | | | (2,088,315 | ) | | | — | | | | — | |
Change in net unrealized appreciation (depreciation) of: | | | | | | | | | | | | | | | | |
Investments and foreign currency | | | (14,707,283 | ) | | | (10,641,409 | ) | | | (5,886,068 | ) | | | (65,093,383 | ) |
Common stocks sold short | | | — | | | | 4,191,336 | | | | — | | | | — | |
Net realized and unrealized gain (loss) | | | (11,118,582 | ) | | | (4,185,895 | ) | | | (2,720,575 | ) | | | (30,952,013 | ) |
Net increase (decrease) in net assets from operations | | $ | (9,530,290 | ) | | $ | (3,744,699 | ) | | $ | (2,239,898 | ) | | $ | (26,328,253 | ) |
See accompanying notes to financial statements.
Statement of
Changes in Net Assets
| | | | | | | | | | | | | | | | | | |
| | | Concentrated Core | | | | | Core Dividend | |
| | | Year Ended
8/31/15 | | | Year Ended
8/31/14 | | | | | Year Ended
8/31/15 | | | Year Ended
8/31/14 | |
Operations | | | | | | | | | | | | | | | | | | |
Net investment income (loss) | | $ | 720,366 | | | $ | 59,077 | | | | | $ | 610,857 | | | $ | 176,675 | |
Net realized gain (loss) from: | | | | | | | | | | | | | | | | | | |
Investments and foreign currency | | | 4,597,216 | | | | 334,052 | | | | | | 396,705 | | | | 542,920 | |
Common stocks sold short | | | — | | | | — | | | | | | — | | | | — | |
Net change in unrealized appreciation (depreciation) of: | | | | | | | | | | | | | | | | | | |
Investments and foreign currency | | | (8,766,932 | ) | | | 1,678,497 | | | | | | (3,056,804 | ) | | | 1,339,158 | |
Common stocks sold short | | | — | | | | — | | | | | | — | | | | — | |
Net increase (decrease) in net assets from operations | | | (3,449,350 | ) | | | 2,071,626 | | | | | | (2,049,242 | ) | | | 2,058,753 | |
Distributions to Shareholders | | | | | | | | | | | | | | | | | | |
From net investment income: | | | | | | | | | | | | | | | | | | |
Class A Shares | | | (19,305 | ) | | | (4,242 | ) | | | | | (266,879 | ) | | | (89,256 | ) |
Class C Shares | | | — | | | | — | | | | | | (42,575 | ) | | | (13,175 | ) |
Class R3 Shares | | | — | | | | — | | | | | | — | | | | — | |
Class I Shares | | | (152,830 | ) | | | (6,688 | ) | | | | | (261,652 | ) | | | (55,556 | ) |
From accumulated net realized gains: | | | | | | | | | | | | | | | | | | |
Class A Shares | | | (307,323 | ) | | | (1,040 | ) | | | | | (324,290 | ) | | | (20,671 | ) |
Class C Shares | | | (56,400 | ) | | | (193 | ) | | | | | (92,361 | ) | | | (3,753 | ) |
Class R3 Shares | | | — | | | | — | | | | | | — | | | | — | |
Class I Shares | | | (457,404 | ) | | | (1,541 | ) | | | | | (261,701 | ) | | | (9,374 | ) |
Decrease in net assets from distributions to shareholders | | | (993,262 | ) | | | (13,704 | ) | | | | | (1,249,458 | ) | | | (191,785 | ) |
Fund Share Transactions | | | | | | | | | | | | | | | | | | |
Proceeds from sale of shares | | | 175,802,286 | | | | 16,997,632 | | | | | | 37,114,879 | | | | 17,023,837 | |
Proceeds from shares issued to shareholders due to reinvestment of distributions | | | 952,809 | | | | 9,480 | | | | | | 1,179,996 | | | | 154,579 | |
| | | 176,755,095 | | | | 17,007,112 | | | | | | 38,294,875 | | | | 17,178,416 | |
Cost of shares redeemed | | | (58,361,676 | ) | | | (2,047,421 | ) | | | | | (7,392,122 | ) | | | (3,777,365 | ) |
Net increase (decrease) in net assets from Fund share transactions | | | 118,393,419 | | | | 14,959,691 | | | | | | 30,902,753 | | | | 13,401,051 | |
Net increase (decrease) in net assets | | | 113,950,807 | | | | 17,017,613 | | | | | | 27,604,053 | | | | 15,268,019 | |
Net assets at the beginning of period | | | 18,392,321 | | | | 1,374,708 | | | | | | 16,981,930 | | | | 1,713,911 | |
Net assets at the end of period | | $ | 132,343,128 | | | $ | 18,392,321 | | | | | $ | 44,585,983 | | | $ | 16,981,930 | |
Undistributed (Over-distribution of) net investment income at the end of period | | $ | 599,018 | | | $ | 50,787 | | | | | $ | 57,802 | | | $ | 20,504 | |
See accompanying notes to financial statements.
| | | | | | | | | | | | | | | | | | |
| | | Equity Long/Short | | | | | Equity Market Neutral | |
| | | Year Ended
8/31/15 | | | Year Ended
8/31/14 | | | | | Year Ended
8/31/15 | | | Year Ended
8/31/14 | |
Operations | | | | | | | | | | | | | | | | | | |
Net investment income (loss) | | $ | (431,908 | ) | | $ | (137,853 | ) | | | | $ | (609,111 | ) | | $ | (610,617 | ) |
Net realized gain (loss) from: | | | | | | | | | | | | | | | | | | |
Investments and foreign currency | | | 3,773,837 | | | | 1,724,281 | | | | | | 2,576,777 | | | | 2,112,788 | |
Common stocks sold short | | | (3,904,504 | ) | | | (1,979,933 | ) | | | | | (3,108,789 | ) | | | (1,704,820 | ) |
Net change in unrealized appreciation (depreciation) of: | | | | | | | | | | | | | | | | | | |
Investments and foreign currency | | | (6,167,765 | ) | | | 3,741,672 | | | | | | (4,624,634 | ) | | | 3,058,336 | |
Common stocks sold short | | | 7,073,559 | | | | (1,555,673 | ) | | | | | 6,228,428 | | | | (2,265,655 | ) |
Net increase (decrease) in net assets from operations | | | 343,219 | | | | 1,792,494 | | | | | | 462,671 | | | | 590,032 | |
Distributions to Shareholders | | | | | | | | | | | | | | | | | | |
From net investment income: | | | | | | | | | | | | | | | | | | |
Class A Shares | | | — | | | | — | | | | | | — | | | | — | |
Class C Shares | | | — | | | | — | | | | | | — | | | | — | |
Class R3 Shares | | | — | | | | — | | | | | | — | | | | — | |
Class I Shares | | | — | | | | (4,818 | ) | | | | | — | | | | — | |
From accumulated net realized gains: | | | | | | | | | | | | | | | | | | |
Class A Shares | | | (35,372 | ) | | | (177,757 | ) | | | | | (29,023 | ) | | | (34,018 | ) |
Class C Shares | | | (13,356 | ) | | | (72,488 | ) | | | | | (6,179 | ) | | | (8,445 | ) |
Class R3 Shares | | | — | | | | — | | | | | | — | | | | — | |
Class I Shares | | | (74,376 | ) | | | (157,472 | ) | | | | | (111,998 | ) | | | (144,935 | ) |
Decrease in net assets from distributions to shareholders | | | (123,104 | ) | | | (412,535 | ) | | | | | (147,200 | ) | | | (187,398 | ) |
Fund Share Transactions | | | | | | | | | | | | | | | | | | |
Proceeds from sale of shares | | | 74,710,682 | | | | 45,447,301 | | | | | | 29,290,932 | | | | 44,698,210 | |
Proceeds from shares issued to shareholders due to reinvestment of distributions | | | 122,418 | | | | 407,048 | | | | | | 114,707 | | | | 78,016 | |
| | | 74,833,100 | | | | 45,854,349 | | | | | | 29,405,639 | | | | 44,776,226 | |
Cost of shares redeemed | | | (22,579,893 | ) | | | (18,526,973 | ) | | | | | (26,067,879 | ) | | | (17,002,345 | ) |
Net increase (decrease) in net assets from Fund share transactions | | | 52,253,207 | | | | 27,327,376 | | | | | | 3,337,760 | | | | 27,773,881 | |
Net increase (decrease) in net assets | | | 52,473,322 | | | | 28,707,335 | | | | | | 3,653,231 | | | | 28,176,515 | |
Net assets at the beginning of period | | | 33,992,948 | | | | 5,285,613 | | | | | | 42,316,198 | | | | 14,139,683 | |
Net assets at the end of period | | $ | 86,466,270 | | | $ | 33,992,948 | | | | | $ | 45,969,429 | | | $ | 42,316,198 | |
Undistributed (Over-distribution of) net investment income at the end of period | | $ | (180,487 | ) | | $ | (116,568 | ) | | | | $ | (304,747 | ) | | $ | — | |
See accompanying notes to financial statements.
Statement of Changes in Net Assets (continued)
| | | | | | | | | | | | | | | | | | |
| | | Growth | | | | | Large Cap Core | |
| | | Year Ended 8/31/15 | | | Year Ended 8/31/14 | | | | | Year Ended 8/31/15 | | | Year Ended
8/31/14 | |
Operations | | | | | | | | | | | | | | | | | | |
Net investment income (loss) | | $ | 229,737 | | | $ | (22,073 | ) | | | | $ | 1,588,292 | | | $ | 254,030 | |
Net realized gain (loss) from: | | | | | | | | | | | | | | | | | | |
Investments and foreign currency | | | 7,092,074 | | | | 4,417,081 | | | | | | 3,588,701 | | | | 2,181,185 | |
Common stocks sold short | | | — | | | | — | | | | | | — | | | | — | |
Net change in unrealized appreciation (depreciation) of: | | | | | | | | | | | | | | | | | | |
Investments and foreign currency | | | (5,681,549 | ) | | | 4,515,191 | | | | | | (14,707,283 | ) | | | 5,234,322 | |
Common stocks sold short | | | — | | | | — | | | | | | — | | | | — | |
Net increase (decrease) in net assets from operations | | | 1,640,262 | | | | 8,910,199 | | | | | | (9,530,290 | ) | | | 7,669,537 | |
Distributions to Shareholders | | | | | | | | | | | | | | | | | | |
From net investment income: | | | | | | | | | | | | | | | | | | |
Class A Shares | | | — | | | | — | | | | | | (17,407 | ) | | | (6,278 | ) |
Class C Shares | | | — | | | | — | | | | | | — | | | | — | |
Class R3 Shares | | | — | | | | — | | | | | | — | | | | — | |
Class I Shares | | | — | | | | (6,000 | ) | | | | | (272,162 | ) | | | (62,104 | ) |
From accumulated net realized gains: | | | | | | | | | | | | | | | | | | |
Class A Shares | | | (698,144 | ) | | | (336,403 | ) | | | | | (361,833 | ) | | | (26,424 | ) |
Class C Shares | | | (864,060 | ) | | | (152,846 | ) | | | | | (280,596 | ) | | | (14,881 | ) |
Class R3 Shares | | | (5,762 | ) | | | (1,292 | ) | | | | | — | | | | — | |
Class I Shares | | | (2,868,948 | ) | | | (387,526 | ) | | | | | (1,589,370 | ) | | | (206,400 | ) |
Decrease in net assets from distributions to shareholders | | | (4,436,914 | ) | | | (884,067 | ) | | | | | (2,521,368 | ) | | | (316,087 | ) |
Fund Share Transactions | | | | | | | | | | | | | | | | | | |
Proceeds from sale of shares | | | 25,955,934 | | | | 20,581,725 | | | | | | 216,649,260 | | | | 55,263,049 | |
Proceeds from shares issued to shareholders due to reinvestment of distributions | | | 3,724,976 | | | | 691,418 | | | | | | 1,697,209 | | | | 44,278 | |
| | | 29,680,910 | | | | 21,273,143 | | | | | | 218,346,469 | | | | 55,307,327 | |
Cost of shares redeemed | | | (28,811,652 | ) | | | (14,567,379 | ) | | | | | (45,410,183 | ) | | | (5,687,002 | ) |
Net increase (decrease) in net assets from Fund share transactions | | | 869,258 | | | | 6,705,764 | | | | | | 172,936,286 | | | | 49,620,325 | |
Net increase (decrease) in net assets | | | (1,927,394 | ) | | | 14,731,896 | | | | | | 160,884,628 | | | | 56,973,775 | |
Net assets at the beginning of period | | | 49,164,091 | | | | 34,432,195 | | | | | | 69,023,116 | | | | 12,049,341 | |
Net assets at the end of period | | $ | 47,236,697 | | | $ | 49,164,091 | | | | | $ | 229,907,744 | | | $ | 69,023,116 | |
Undistributed (Over-distribution of) net investment income at the end of period | | $ | 229,737 | | | $ | — | | | | | $ | 1,489,713 | | | $ | 195,341 | |
See accompanying notes to financial statements.
| | | | | | | | | | | | | | | | | | |
| | | Large Cap Core Plus | | | | | Large Cap Growth | |
| | | Year Ended
8/31/15 | | | Year Ended
8/31/14 | | | | | Year Ended
8/31/15 | | | Year Ended
8/31/14 | |
Operations | | | | | | | | | | | | | | | | | | |
Net investment income (loss) | | $ | 441,196 | | | $ | 118,815 | | | | | $ | 480,677 | | | $ | 212,254 | |
Net realized gain (loss) from: | | | | | | | | | | | | | | | | | | |
Investments and foreign currency | | | 4,352,493 | | | | 3,855,128 | | | | | | 3,165,493 | | | | 2,111,198 | |
Common stocks sold short | | | (2,088,315 | ) | | | (858,490 | ) | | | | | — | | | | — | |
Net change in unrealized appreciation (depreciation) of: | | | | | | | | | | | | | | | | | | |
Investments and foreign currency | | | (10,641,409 | ) | | | 6,531,183 | | | | | | (5,886,068 | ) | | | 4,079,444 | |
Common stocks sold short | | | 4,191,336 | | | | (1,015,563 | ) | | | | | — | | | | — | |
Net increase (decrease) in net assets from operations | | | (3,744,699 | ) | | | 8,631,073 | | | | | | (2,239,898 | ) | | | 6,402,896 | |
Distributions to Shareholders | | | | | | | | | | | | | | | | | | |
From net investment income: | | | | | | | | | | | | | | | | | | |
Class A Shares | | | — | | | | (3,433 | ) | | | | | (16,220 | ) | | | (23,630 | ) |
Class C Shares | | | — | | | | — | | | | | | — | | | | — | |
Class R3 Shares | | | — | | | | — | | | | | | — | | | | — | |
Class I Shares | | | (73,124 | ) | | | (49,932 | ) | | | | | (134,374 | ) | | | (57,393 | ) |
From accumulated net realized gains: | | | | | | | | | | | | | | | | | | |
Class A Shares | | | (659,729 | ) | | | (52,342 | ) | | | | | (548,226 | ) | | | (127,082 | ) |
Class C Shares | | | (271,761 | ) | | | (6,226 | ) | | | | | (138,909 | ) | | | (11,061 | ) |
Class R3 Shares | | | — | | | | — | | | | | | — | | | | — | |
Class I Shares | | | (2,273,426 | ) | | | (325,555 | ) | | | | | (1,397,584 | ) | | | (223,711 | ) |
Decrease in net assets from distributions to shareholders | | | (3,278,040 | ) | | | (437,488 | ) | | | | | (2,235,313 | ) | | | (442,877 | ) |
Fund Share Transactions | | | | | | | | | | | | | | | | | | |
Proceeds from sale of shares | | | 104,287,316 | | | | 37,045,305 | | | | | | 72,417,682 | | | | 27,399,166 | |
Proceeds from shares issued to shareholders due to reinvestment of distributions | | | 2,746,266 | | | | 185,491 | | | | | | 1,012,291 | | | | 155,399 | |
| | | 107,033,582 | | | | 37,230,796 | | | | | | 73,429,973 | | | | 27,554,565 | |
Cost of shares redeemed | | | (41,665,055 | ) | | | (14,474,732 | ) | | | | | (11,813,254 | ) | | | (5,686,644 | ) |
Net increase (decrease) in net assets from Fund share transactions | | | 65,368,527 | | | | 22,756,064 | | | | | | 61,616,719 | | | | 21,867,921 | |
Net increase (decrease) in net assets | | | 58,345,788 | | | | 30,949,649 | | | | | | 57,141,508 | | | | 27,827,940 | |
Net assets at the beginning of period | | | 49,546,754 | | | | 18,597,105 | | | | | | 40,399,720 | | | | 12,571,780 | |
Net assets at the end of period | | $ | 107,892,542 | | | $ | 49,546,754 | | | | | $ | 97,541,228 | | | $ | 40,399,720 | |
Undistributed (Over-distribution of) net investment income at the end of period | | $ | 474,354 | | | $ | 72,653 | | | | | $ | 475,127 | | | $ | 142,344 | |
See accompanying notes to financial statements.
Statement of Changes in Net Assets (continued)
| | | | | | | | |
| | | Large Cap Value | |
| | | Year Ended
8/31/15 | | | Year Ended
8/31/14 | |
Operations | | | | | | | | |
Net investment income (loss) | | $ | 4,623,760 | | | $ | 4,161,975 | |
Net realized gain (loss) from: | | | | | | | | |
Investments and foreign currency | | | 34,141,370 | | | | 55,318,352 | |
Common stocks sold short | | | — | | | | — | |
Net change in unrealized appreciation (depreciation) of: | | | | | | | | |
Investments and foreign currency | | | (65,093,383 | ) | | | 26,870,724 | |
Common stocks sold short | | | — | | | | — | |
Net increase (decrease) in net assets from operations | | | (26,328,253 | ) | | | 86,351,051 | |
Distributions to Shareholders | | | | | | | | |
From net investment income: | | | | | | | | |
Class A Shares | | | (2,455,704 | ) | | | (3,906,815 | ) |
Class C Shares | | | (15,633 | ) | | | (150,809 | ) |
Class R3 Shares | | | (694 | ) | | | (1,124 | ) |
Class I Shares | | | (1,254,815 | ) | | | (937,826 | ) |
From accumulated net realized gains: | | | | | | | | |
Class A Shares | | | (31,890,375 | ) | | | (27,804,434 | ) |
Class C Shares | | | (3,400,382 | ) | | | (2,187,275 | ) |
Class R3 Shares | | | (13,510 | ) | | | (9,947 | ) |
Class I Shares | | | (12,073,792 | ) | | | (5,567,417 | ) |
Decrease in net assets from distributions to shareholders | | | (51,104,905 | ) | | | (40,565,647 | ) |
Fund Share Transactions | | | | | | | | |
Proceeds from sale of shares | | | 107,631,449 | | | | 79,432,777 | |
Proceeds from shares issued to shareholders due to reinvestment of distributions | | | 42,183,256 | | | | 32,867,315 | |
| | | 149,814,705 | | | | 112,300,092 | |
Cost of shares redeemed | | | (96,509,905 | ) | | | (45,279,666 | ) |
Net increase (decrease) in net assets from Fund share transactions | | | 53,304,800 | | | | 67,020,426 | |
Net increase (decrease) in net assets | | | (24,128,358 | ) | | | 112,805,830 | |
Net assets at the beginning of period | | | 426,555,086 | | | | 313,749,256 | |
Net assets at the end of period | | $ | 402,426,728 | | | $ | 426,555,086 | |
Undistributed (Over-distribution of) net investment income at the end of period | | $ | 4,392,053 | | | $ | 3,389,824 | |
See accompanying notes to financial statements.
THIS PAGE INTENTIONALLY LEFT BLANK
Financial
Highlights
Concentrated Core
Selected data for a share outstanding throughout each period:
| | | | | | | | | | | | | | | | | | | | | | | | | | | | | | | | | | |
| | | | | |
| | | | | | Investment Operations | | | | | Less Distributions | | | | |
| | | | | | | | | |
Class (Commencement Date) Year Ended August 31, | | Beginning
NAV | | | Net
Investment
Income
(Loss)(a) | | | Net
Realized/ Unrealized
Gain (Loss) | | | Total | | | | | From
Net
Investment
Income | | | From
Accumulated
Net Realized
Gains | | | Total | | | Ending
NAV | |
Class A (6/13) | | | | | | | | | | | | | | | | | | | | | | | | | | | | | | | | | | |
2015 | | $ | 27.16 | | | $ | 0.20 | | | $ | (0.14 | ) | | $ | 0.06 | | | | | $ | (0.02 | ) | | $ | (0.31 | ) | | $ | (0.33 | ) | | $ | 26.89 | |
2014 | | | 19.66 | | | | 0.19 | | | | 7.37 | | | | 7.56 | | | | | | (0.04 | ) | | | (0.02 | ) | | | (0.06 | ) | | | 27.16 | |
2013(d) | | | 20.00 | | | | 0.05 | | | | (0.39 | ) | | | (0.34 | ) | | | | | — | | | | — | | | | — | | | | 19.66 | |
Class C (6/13) | | | | | | | | | | | | | | | | | | | | | | | | | | | | | | | | | | |
2015 | | | 26.95 | | | | — | * | | | (0.14 | ) | | | (0.14 | ) | | | | | — | | | | (0.31 | ) | | | (0.31 | ) | | | 26.50 | |
2014 | | | 19.63 | | | | 0.01 | | | | 7.33 | | | | 7.34 | | | | | | — | | | | (0.02 | ) | | | (0.02 | ) | | | 26.95 | |
2013(d) | | | 20.00 | | | | — | * | | | (0.37 | ) | | | (0.37 | ) | | | | | — | | | | — | | | | — | | | | 19.63 | |
Class I (6/13) | | | | | | | | | | | | | | | | | | | | | | | | | | | | | | | | | | |
2015 | | | 27.20 | | | | 0.27 | | | | (0.14 | ) | | | 0.13 | | | | | | (0.08 | ) | | | (0.31 | ) | | | (0.39 | ) | | | 26.94 | |
2014 | | | 19.68 | | | | 0.24 | | | | 7.36 | | | | 7.60 | | | | | | (0.06 | ) | | | (0.02 | ) | | | (0.08 | ) | | | 27.20 | |
2013(d) | | | 20.00 | | | | 0.04 | | | | (0.36 | ) | | | (0.32 | ) | | | | | — | | | | — | | | | — | | | | 19.68 | |
| | | | | | | | | | | | | | | | | | | | | | | | | | | | | | |
| | | | Ratios/Supplemental Data | |
| | | | | | | | | Ratios to Average
Net Assets Before
Waiver/Reimbursement | | | | | Ratios to Average
Net Assets After
Waiver/Reimbursement(c) | | | | |
| | | | | | | | |
Total
Return(b) | | | Ending
Net
Assets
(000) | | | | | Expenses | | | Net
Investment
Income
(Loss) | | | | | Expenses | | | Net
Investment
Income
(Loss) | | | Portfolio
Turnover
Rate(e) | |
| | | | | | | | | | | | | | | | | | | | | | | | | | | | | | |
| | 0.21 | % | | $ | 54,805 | | | | | | 1.33 | % | | | 0.61 | % | | | | | 1.21 | % | | | 0.72 | % | | | 98 | % |
| | 38.46 | | | | 8,315 | | | | | | 1.85 | | | | 0.15 | | | | | | 1.22 | | | | 0.77 | | | | 88 | |
| | (1.70 | ) | | | 239 | | | | | | 5.78 | ** | | | (3.28 | )** | | | | | 1.21 | ** | | | 1.29 | ** | | | 24 | |
| | | | | | | | | | | | | | | | | | | | | | | | | | | | | | |
| | (0.53 | ) | | | 24,583 | | | | | | 2.08 | | | | (0.10 | ) | | | | | 1.96 | | | | 0.01 | | | | 98 | |
| | 37.39 | | | | 1,508 | | | | | | 2.65 | | | | (0.63 | ) | | | | | 1.97 | | | | 0.05 | | | | 88 | |
| | (1.85 | ) | | | 117 | | | | | | 7.21 | ** | | | (5.13 | )** | | | | | 1.97 | ** | | | 0.11 | ** | | | 24 | |
| | | | | | | | | | | | | | | | | | | | | | | | | | | | | | |
| | 0.47 | | | | 52,955 | | | | | | 1.07 | | | | 0.84 | | | | | | 0.96 | | | | 0.95 | | | | 98 | |
| | 38.76 | | | | 8,569 | | | | | | 1.71 | | | | 0.26 | | | | | | 0.97 | | | | 1.00 | | | | 88 | |
| | (1.65) | | | | 1,018 | | | | | | 8.54 | ** | | | (6.56 | )** | | | | | 0.97 | ** | | | 1.01 | ** | | | 24 | |
| (a) | Per share Net Investment Income (Loss) is calculated using the average daily shares method. | |
| (b) | Total return is the combination of changes in NAV without any sales charge, reinvested dividend income at NAV and reinvested capital gains distributions at NAV, if any. Total returns are not annualized. | |
| (c) | After fee waiver and/or expense reimbursement from the Adviser. | |
| (d) | For the period June 17, 2013 (commencement of operations) through August 31, 2013. | |
| (e) | Portfolio Turnover Rate is calculated based on the lesser of long-term purchases or sales (as disclosed in Note 5 – Investment Transactions) divided by the average long-term market value during the period. | |
| * | Rounds to less than $0.01 per share. | |
See accompanying notes to financial statements.
Financial Highlights (continued)
Core Dividend
Selected data for a share outstanding throughout each period:
| | | | | | | | | | | | | | | | | | | | | | | | | | | | | | | | | | |
| | | | | |
| | | | | | Investment Operations | | | | | Less Distributions | | | | |
| | | | | | | | | |
Class (Commencement Date) Year Ended August 31, | | Beginning
NAV | | | Net
Investment
Income
(Loss)(a) | | | Net
Realized/
Unrealized
Gain (Loss) | | | Total | | | | | From
Net
Investment
Income | | | From
Accumulated
Net Realized
Gains | | | Total | | | Ending
NAV | |
Class A (6/13) | | | | | | | | | | | | | | | | | | | | | | | | | | | | | | | | | | |
2015 | | $ | 25.90 | | | $ | 0.45 | | | $ | (1.15 | ) | | $ | (0.70 | ) | | | | $ | (0.42 | ) | | $ | (0.65 | ) | | $ | (1.07 | ) | | $ | 24.13 | |
2014 | | | 20.32 | | | | 0.48 | | | | 5.65 | | | | 6.13 | | | | | | (0.42 | ) | | | (0.13 | ) | | | (0.55 | ) | | | 25.90 | |
2013(d) | | | 20.00 | | | | 0.08 | | | | 0.24 | | | | 0.32 | | | | | | — | | | | — | | | | — | | | | 20.32 | |
Class C (6/13) | | | | | | | | | | | | | | | | | | | | | | | | | | | | | | | | | | |
2015 | | | 25.85 | | | | 0.26 | | | | (1.15 | ) | | | (0.89 | ) | | | | | (0.23 | ) | | | (0.65 | ) | | | (0.88 | ) | | | 24.08 | |
2014 | | | 20.28 | | | | 0.29 | | | | 5.66 | | | | 5.95 | | | | | | (0.25 | ) | | | (0.13 | ) | | | (0.38 | ) | | | 25.85 | |
2013(d) | | | 20.00 | | | | 0.04 | | | | 0.24 | | | | 0.28 | | | | | | — | | | | — | | | | — | | | | 20.28 | |
Class I (6/13) | | | | | | | | | | | | | | | | | | | | | | | | | | | | | | | | | | |
2015 | | | 25.91 | | | | 0.51 | | | | (1.14 | ) | | | (0.63 | ) | | | | | (0.49 | ) | | | (0.65 | ) | | | (1.14 | ) | | | 24.14 | |
2014 | | | 20.32 | | | | 0.54 | | | | 5.65 | | | | 6.19 | | | | | | (0.47 | ) | | | (0.13 | ) | | | (0.60 | ) | | | 25.91 | |
2013(d) | | | 20.00 | | | | 0.07 | | | | 0.25 | | | | 0.32 | | | | | | — | | | | — | | | | — | | | | 20.32 | |
| | | | | | | | | | | | | | | | | | | | | | | | | | | | | | |
| | | | Ratios/Supplemental Data | |
| | | | | | | | | Ratios to Average
Net Assets Before
Waiver/Reimbursement | | | | | Ratios to Average
Net Assets After
Waiver/Reimbursement(c) | | | | |
| | | | | | | | |
Total
Return(b) | | | Ending
Net
Assets
(000) | | | | | Expenses | | | Net
Investment
Income
(Loss) | | | | | Expenses | | | Net
Investment
Income
(Loss) | | | Portfolio
Turnover
Rate(e) | |
| | | | | | | | | | | | | | | | | | | | | | | | | | | | | | |
| | (2.82 | )% | | $ | 20,601 | | | | | | 1.37 | % | | | 1.54 | % | | | | | 1.16 | % | | | 1.75 | % | | | 174 | % |
| | 30.48 | | | | 8,261 | | | | | | 1.76 | | | | 1.40 | | | | | | 1.17 | | | | 1.99 | | | | 117 | |
| | 1.60 | | | | 559 | | | | | | 5.29 | * | | | (2.26 | )* | | | | | 1.17 | * | | | 1.86 | * | | | 29 | |
| | | | | | | | | | | | | | | | | | | | | | | | | | | | | | |
| | (3.55 | ) | | | 5,950 | | | | | | 2.12 | | | | 0.80 | | | | | | 1.91 | | | | 1.01 | | | | 174 | |
| | 29.55 | | | | 2,151 | | | | | | 2.54 | | | | 0.59 | | | | | | 1.92 | | | | 1.21 | | | | 117 | |
| | 1.40 | | | | 111 | | | | | | 6.52 | * | | | (3.70 | )* | | | | | 1.92 | * | | | 0.90 | * | | | 29 | |
| | | | | | | | | | | | | | | | | | | | | | | | | | | | | | |
| | (2.57 | ) | | | 18,035 | | | | | | 1.12 | | | | 1.79 | | | | | | 0.91 | | | | 2.00 | | | | 174 | |
| | 30.85 | | | | 6,571 | | | | | | 1.58 | | | | 1.63 | | | | | | 0.92 | | | | 2.29 | | | | 117 | |
| | 1.60 | | | | 1,044 | | | | | | 7.50 | * | | | (4.86 | )* | | | | | 0.92 | * | | | 1.72 | * | | | 29 | |
| (a) | Per share Net Investment Income (Loss) is calculated using the average daily shares method. | |
| (b) | Total return is the combination of changes in NAV without any sales charge, reinvested dividend income at NAV and reinvested capital gains distributions at NAV, if any. Total returns are not annualized. | |
| (c) | After fee waiver and/or expense reimbursement from the Adviser. | |
| (d) | For the period June 17, 2013 (commencement of operations) through August 31, 2013. | |
| (e) | Portfolio Turnover Rate is calculated based on the lesser of long-term purchases or sales (as disclosed in Note 5 – Investment Transactions) divided by the average long-term market value during the period. | |
See accompanying notes to financial statements.
Financial Highlights (continued)
Equity Long/Short
Selected data for a share outstanding throughout each period:
| | | | | | | | | | | | | | | | | | | | | | | | | | | | | | | | | | |
| | | | | |
| | | | | | Investment Operations | | | | | Less Distributions | | | | |
| | | | | | | | | |
Class (Commencement Date) | | Beginning
NAV | | | Net
Investment
Income
(Loss)(a) | | | Net
Realized/ Unrealized Gain (Loss) | | | Total | | | | | From
Net Investment
Income | | | From
Accumulated
Net Realized
Gains | | | Total | | | Ending
NAV | |
Class A (12/08) | | | | | | | | | | | | | | | | | | | | | | | | | | | | | | | | | | |
Year Ended 8/31: | | | | | | | | | | | | | | | | | | | | | | | | | | | | | | | | | | |
2015 | | $ | 31.72 | | | $ | (0.26 | ) | | $ | 1.23 | | | $ | 0.97 | | | | | $ | — | | | $ | (0.08 | ) | | $ | (0.08 | ) | | $ | 32.61 | |
2014 | | | 28.72 | | | | (0.23 | ) | | | 4.78 | | | | 4.55 | | | | | | — | | | | (1.55 | ) | | | (1.55 | ) | | | 31.72 | |
2013(g) | | | 29.54 | | | | 0.02 | | | | (0.84 | ) | | | (0.82 | ) | | | | | — | | | | — | | | | — | | | | 28.72 | |
Year Ended 7/31: | | | | | | | | | | | | | | | | | | | | | | | | | | | | | | | | | | |
2013 | | | 26.81 | | | | (0.03 | ) | | | 5.02 | | | | 4.99 | | | | | | — | | | | (2.26 | ) | | | (2.26 | ) | | | 29.54 | |
2012 | | | 27.28 | | | | (0.08 | ) | | | 0.93 | | | | 0.85 | | | | | | — | | | | (1.32 | ) | | | (1.32 | ) | | | 26.81 | |
2011 | | | 23.61 | | | | (0.14 | ) | | | 4.02 | | | | 3.88 | | | | | | — | | | | (0.21 | ) | | | (0.21 | ) | | | 27.28 | |
Class C (12/08) | | | | | | | | | | | | | | | | | | | | | | | | | | | | | | | | | | |
Year Ended 8/31: | | | | | | | | | | | | | | | | | | | | | | | | | | | | | | | | | | |
2015 | | | 30.19 | | | | (0.48 | ) | | | 1.17 | | | | 0.69 | | | | | | — | | | | (0.08 | ) | | | (0.08 | ) | | | 30.80 | |
2014 | | | 27.60 | | | | (0.43 | ) | | | 4.57 | | | | 4.14 | | | | | | — | | | | (1.55 | ) | | | (1.55 | ) | | | 30.19 | |
2013(g) | | | 28.40 | | | | — | ** | | | (0.80 | ) | | | (0.80 | ) | | | | | — | | | | — | | | | — | | | | 27.60 | |
Year Ended 7/31: | | | | | | | | | | | | | | | | | | | | | | | | | | | | | | | | | | |
2013 | | | 26.04 | | | | (0.19 | ) | | | 4.81 | | | | 4.62 | | | | | | — | | | | (2.26 | ) | | | (2.26 | ) | | | 28.40 | |
2012 | | | 26.75 | | | | (0.27 | ) | | | 0.88 | | | | 0.61 | | | | | | — | | | | (1.32 | ) | | | (1.32 | ) | | | 26.04 | |
2011 | | | 23.33 | | | | (0.34 | ) | | | 3.97 | | | | 3.63 | | | | | | — | | | | (0.21 | ) | | | (0.21 | ) | | | 26.75 | |
Class I (12/08) | | | | | | | | | | | | | | | | | | | | | | | | | | | | | | | | | | |
Year Ended 8/31: | | | | | | | | | | | | | | | | | | | | | | | | | | | | | | | | | | |
2015 | | | 32.20 | | | | (0.16 | ) | | | 1.22 | | | | 1.06 | | | | | | — | | | | (0.08 | ) | | | (0.08 | ) | | | 33.18 | |
2014 | | | 29.10 | | | | (0.12 | ) | | | 4.81 | | | | 4.69 | | | | | | (0.04 | ) | | | (1.55 | ) | | | (1.59 | ) | | | 32.20 | |
2013(g) | | | 29.93 | | | | 0.03 | | | | (0.86 | ) | | | (0.83 | ) | | | | | — | | | | — | | | | — | | | | 29.10 | |
Year Ended 7/31: | | | | | | | | | | | | | | | | | | | | | | | | | | | | | | | | | | |
2013 | | | 27.06 | | | | 0.07 | | | | 5.06 | | | | 5.13 | | | | | | — | | | | (2.26 | ) | | | (2.26 | ) | | | 29.93 | |
2012 | | | 27.45 | | | | (0.04 | ) | | | 0.97 | | | | 0.93 | | | | | | — | | | | (1.32 | ) | | | (1.32 | ) | | | 27.06 | |
2011 | | | 23.71 | | | | (0.08 | ) | | | 4.03 | | | | 3.95 | | | | | | — | | | | (0.21 | ) | | | (0.21 | ) | | | 27.45 | |
| | | | | | | | | | | | | | | | | | | | | | | | | | | | | | |
| | | | Ratios/Supplemental Data | |
| | | | | | | | | Ratios to Average
Net Assets Before
Waiver/Reimbursement(d) | | | | | Ratios to Average
Net Assets After
Waiver/Reimbursement(c)(d) | | | | |
| | | | | | | | |
Total
Return(b) | | | Ending
Net
Assets
(000) | | | | | Expenses | | | Net
Investment
Income
(Loss) | | | | | Expenses | | | Net
Investment
Income
(Loss) | | | Portfolio
Turnover
Rate(e) | |
| | | | | | | | | | | | | | | | | | | | | | | | | | | | | | |
| | | | | | | | | | | | | | | | | | | | | | | | | | | | | | |
| | 3.06 | % | | $ | 24,821 | | | | | | 3.76 | % | | | (1.03 | )% | | | | | 3.53 | % | | | (0.79 | )% | | | 222 | % |
| | 16.06 | | | | 13,697 | �� | | | | | 4.24 | | | | (1.53 | ) | | | | | 3.46 | | | | (0.75 | ) | | | 232 | |
| | (2.78 | ) | | | 390 | | | | | | 5.42 | * | | | (1.73 | )* | | | | | 3.04 | * | | | 0.65 | * | | | 12 | |
| | | | | | | | | | | | | | | | | | | | | | | | | | | | | | |
| | 20.39 | | | | 326 | | | | | | 13.43 | | | | (10.94 | ) | | | | | 2.62 | | | | (0.13 | ) | | | 292 | |
| | 3.75 | | | | 54 | | | | | | 7.26 | | | | (5.26 | ) | | | | | 2.31 | | | | (0.31 | ) | | | 67 | |
| | 16.44 | | | | 341 | | | | | | 6.54 | | | | (4.97 | ) | | | | | 2.10 | | | | (0.54 | ) | | | 62 | |
| | | | | | | | | | | | | | | | | | | | | | | | | | | | | | |
| | | | | | | | | | | | | | | | | | | | | | | | | | | | | | |
| | 2.28 | | | | 8,087 | | | | | | 4.52 | | | | (1.76 | ) | | | | | 4.29 | | | | (1.53 | ) | | | 222 | |
| | 15.20 | | | | 4,080 | | | | | | 5.04 | | | | (2.30 | ) | | | | | 4.21 | | | | (1.47 | ) | | | 232 | |
| | (2.82 | ) | | | 138 | | | | | | 6.24 | * | | | (2.44 | )* | | | | | 3.81 | * | | | (0.01 | )* | | | 12 | |
| | | | | | | | | | | | | | | | | | | | | | | | | | | | | | |
| | 19.53 | | | | 64 | | | | | | 10.85 | | | | (8.13 | ) | | | | | 3.47 | | | | (0.74 | ) | | | 292 | |
| | 2.90 | | | | 54 | | | | | | 8.01 | | | | (6.01 | ) | | | | | 3.06 | | | | (1.06 | ) | | | 67 | |
| | 15.57 | | | | 334 | | | | | | 7.28 | | | | (5.72 | ) | | | | | 2.85 | | | | (1.28 | ) | | | 62 | |
| | | | | | | | | | | | | | | | | | | | | | | | | | | | | | |
| | | | | | | | | | | | | | | | | | | | | | | | | | | | | | |
| | 3.29 | | | | 53,559 | | | | | | 3.52 | | | | (0.72 | ) | | | | | 3.28 | | | | (0.48 | ) | | | 222 | |
| | 16.34 | | | | 16,216 | | | | | | 4.20 | | | | (1.33 | ) | | | | | 3.27 | | | | (0.40 | ) | | | 232 | |
| | (2.77 | ) | | | 4,758 | | | | | | 5.07 | * | | | (1.17 | )* | | | | | 2.78 | * | | | 1.11 | * | | | 12 | |
| | | | | | | | | | | | | | | | | | | | | | | | | | | | | | |
| | 20.74 | | | | 1,611 | | | | | | 9.92 | | | | (7.20 | ) | | | | | 2.46 | | | | 0.26 | | | | 292 | |
| | 4.03 | | | | 1,224 | | | | | | 7.69 | | | | (5.95 | ) | | | | | 1.92 | | | | (0.17 | ) | | | 67 | |
| | 16.67 | | | | 343 | | | | | | 6.29 | | | | (4.73 | ) | | | | | 1.85 | | | | (0.29 | ) | | | 62 | |
| (a) | Per share Net Investment Income (Loss) is calculated using the average daily shares method. | |
| (b) | Total return is the combination of changes in NAV without any sales charge, reinvested dividend income at NAV and reinvested capital gains distributions at NAV, if any. Total returns are not annualized. Performance prior to March 1, 2013, reflects the Fund’s performance under the management of a sub-adviser using investment strategies that differed significantly from those currently in place. | |
| (c) | After fee waiver and/or expense reimbursement from the Adviser, where applicable. | |
| (d) | Each ratio includes the effect of dividends expense on common stocks sold short, enhanced custody expense and/or prime broker expenses as follows: | |
| | | | | | | | | | | | | | | | | | | | | | | | | | |
| | | Ratios of Dividends Expense
on Common Stocks Sold Short
to Average Net Assets | | | | | Ratios of Enhanced Custody
and/or Prime Broker Expenses
to Average Net Assets(f) | |
| | | Class A | | | Class C | | | Class I | | | | | Class A | | | Class C | | | Class I | |
Year Ended 8/31: | | | | | | | | | | | | | | | | | | | | | | | | | | |
2015 | | | 1.17 | % | | | 1.19 | % | | | 1.17 | % | | | | | 0.74 | % | | | 0.74 | % | | | 0.75 | % |
2014 | | | 1.12 | | | | 1.11 | | | | 1.12 | | | | | | 0.72 | | | | 0.74 | | | | 0.78 | |
2013(g) | | | 1.42 | * | | | 1.46 | * | | | 1.42 | * | | | | | — | | | | — | | | | — | |
Year Ended 7/31: | | | | | | | | | | | | | | | | | | | | | | | | | | |
2013 | | | 0.84 | | | | 0.89 | | | | 0.89 | | | | | | 0.26 | | | | 0.32 | | | | 0.32 | |
2012 | | | 0.70 | | | | 0.70 | | | | 0.58 | | | | | | 0.13 | | | | 0.13 | | | | 0.13 | |
2011 | | | 0.47 | | | | 0.47 | | | | 0.47 | | | | | | 0.15 | | | | 0.15 | | | | 0.15 | |
| (e) | Portfolio Turnover Rate is calculated based on the lesser of long-term purchases or sales (as disclosed in Note 5 – Investment Transactions) divided by the average long-term market value during the period. | |
| (f) | Effective June 21, 2013 the Fund ended its enhanced custody program and began selling securities short through a prime broker. | |
| (g) | For the one month ended August 31, 2013. | |
| ** | Rounds to less than $0.01 per share. | |
See accompanying notes to financial statements.
Financial Highlights (continued)
Equity Market Neutral
Selected data for a share outstanding throughout each period:
| | | | | | | | | | | | | | | | | | | | | | | | | | | | | | | | | | |
| | | | | |
| | | | | | Investment Operations | | | | | Less Distributions | | | | |
| | | | | | | | | |
Class (Commencement Date) Year Ended August 31, | | Beginning
NAV | | | Net
Investment
Income
(Loss)(a) | | | Net
Realized/
Unrealized
Gain (Loss) | | | Total | | | | | From
Net
Investment
Income | | | From
Accumulated
Net Realized
Gains | | | Total | | | Ending
NAV | |
Class A (6/13) | | | | | | | | | | | | | | | | | | | | | | | | | | | | | | | | | | |
2015 | | $ | 21.27 | | | $ | (0.32 | ) | | $ | 0.50 | | | $ | 0.18 | | | | | $ | — | | | $ | (0.06 | ) | | $ | (0.06 | ) | | $ | 21.39 | |
2014 | | | 20.53 | | | | (0.44 | ) | | | 1.38 | | | | 0.94 | | | | | | — | | | | (0.20 | ) | | | (0.20 | ) | | | 21.27 | |
2013(e) | | | 20.00 | | | | (0.04 | ) | | | 0.57 | | | | 0.53 | | | | | | — | | | | — | | | | — | | | | 20.53 | |
Class C (6/13) | | | | | | | | | | | | | | | | | | | | | | | | | | | | | | | | | | |
2015 | | | 21.08 | | | | (0.47 | ) | | | 0.49 | | | | 0.02 | | | | | | — | | | | (0.06 | ) | | | (0.06 | ) | | | 21.04 | |
2014 | | | 20.50 | | | | (0.58 | ) | | | 1.36 | | | | 0.78 | | | | | | — | | | | (0.20 | ) | | | (0.20 | ) | | | 21.08 | |
2013(e) | | | 20.00 | | | | (0.08 | ) | | | 0.58 | | | | 0.50 | | | | | | — | | | | — | | | | — | | | | 20.50 | |
Class I (6/13) | | | | | | | | | | | | | | | | | | | | | | | | | | | | | | | | | | |
2015 | | | 21.34 | | | | (0.27 | ) | | | 0.50 | | | | 0.23 | | | | | | — | | | | (0.06 | ) | | | (0.06 | ) | | | 21.51 | |
2014 | | | 20.54 | | | | (0.38 | ) | | | 1.38 | | | | 1.00 | | | | | | — | | | | (0.20 | ) | | | (0.20 | ) | | | 21.34 | |
2013(e) | | | 20.00 | | | | (0.04 | ) | | | 0.58 | | | | 0.54 | | | | | | — | | | | — | | | | — | | | | 20.54 | |
| | | | | | | | | | | | | | | | | | | | | | | | | | | | | | |
| | | | Ratios/Supplemental Data | |
| | | | | | | | | Ratios to Average
Net Assets Before
Waiver/Reimbursement(d) | | | | | Ratios to Average
Net Assets After
Waiver/Reimbursement(c)(d) | | | | |
| | | | | | | | |
Total
Return(b) | | | Ending
Net
Assets
(000) | | | | | Expenses | | | Net
Investment
Income
(Loss) | | | | | Expenses | | | Net
Investment
Income
(Loss) | | | Portfolio
Turnover
Rate(f) | |
| | | | | | | | | | | | | | | | | | | | | | | | | | | | | | |
| | 0.86 | % | | $ | 8,972 | | | | | | 3.49 | % | | | (1.73 | )% | | | | | 3.24 | % | | | (1.48 | )% | | | 173 | % |
| | 4.55 | | | | 7,880 | | | | | | 3.52 | | | | (2.33 | ) | | | | | 3.26 | | | | (2.07 | ) | | | 187 | |
| | 2.65 | | | | 799 | | | | | | 3.00 | * | | | (1.10 | )* | | | | | 2.85 | * | | | (0.95 | )* | | | 112 | |
| | | | | | | | | | | | | | | | | | | | | | | | | | | | | | |
| | 0.10 | | | | 1,835 | | | | | | 4.22 | | | | (2.49 | ) | | | | | 3.97 | | | | (2.24 | ) | | | 173 | |
| | 3.77 | | | | 1,768 | | | | | | 4.28 | | | | (3.05 | ) | | | | | 4.02 | | | | (2.79 | ) | | | 187 | |
| | 2.50 | | | | 157 | | | | | | 3.90 | * | | | (2.45 | )* | | | | | 3.42 | * | | | (1.97 | )* | | | 112 | |
| | | | | | | | | | | | | | | | | | | | | | | | | | | | | | |
| | 1.09 | | | | 35,162 | | | | | | 3.21 | | | | (1.51 | ) | | | | | 2.97 | | | | (1.26 | ) | | | 173 | |
| | 4.84 | | | | 32,668 | | | | | | 3.37 | | | | (2.08 | ) | | | | | 3.08 | | | | (1.79 | ) | | | 187 | |
| | 2.70 | | | | 13,184 | | | | | | 3.04 | * | | | (1.77 | )* | | | | | 2.32 | * | | | (1.05 | )* | | | 112 | |
| (a) | Per share Net Investment Income (Loss) is calculated using the average daily shares method. | |
| (b) | Total return is the combination of changes in NAV without any sales charge, reinvested dividend income at NAV and reinvested capital gains distributions at NAV, if any. Total returns are not annualized. | |
| (c) | After fee waiver and/or expense reimbursement from the Adviser. | |
| (d) | Each ratio includes the effect of dividends expense on common stocks sold short and prime broker expenses as follows: | |
| | | | | | | | | | | | | | | | | | | | | | | | | | |
| | | Ratios of Dividends Expense
on Common Stocks Sold Short
to Average Net Assets | | | | | Ratios of Prime Broker Expenses
to Average Net Assets | |
| Year Ended August 31, | | Class A | | | Class C | | | Class I | | | | | Class A | | | Class C | | | Class I | |
2015 | | | 1.04 | % | | | 1.03 | % | | | 1.03 | % | | | | | 0.59 | % | | | 0.58 | % | | | 0.57 | % |
2014 | | | 1.09 | | | | 1.06 | | | | 1.02 | | | | | | 0.55 | | | | 0.59 | | | | 0.70 | |
2013(e) | | | 1.23 | * | | | 1.04 | * | | | 0.95 | * | | | | | — | | | | — | | | | — | |
| (e) | For the period June 17, 2013 (commencement of operations) through August 31, 2013. | |
| (f) | Portfolio Turnover Rate is calculated based on the lesser of long-term purchases or sales (as disclosed in Note 5 – Investment Transactions) divided by the average long-term market value during the period. | |
See accompanying notes to financial statements.
Financial Highlights (continued)
Growth
Selected data for a share outstanding throughout each period:
| | | | | | | | | | | | | | | | | | | | | | | | | | | | | | | | | | |
| | | | | |
| | | | | | Investment Operations | | | | | Less Distributions | | | | |
| | | | | | | | | |
Class (Commencement Date) | | Beginning
NAV | | | Net
Investment
Income
(Loss)(a) | | | Net
Realized/
Unrealized
Gain (Loss) | | | Total | | | | | From
Net
Investment
Income | | | From
Accumulated
Net Realized
Gains | | | Total | | | Ending
NAV | |
Class A (3/06) | | | | | | | | | | | | | | | | | | | | | | | | | | | | | | | | | | |
Year Ended 8/31: | | | | | | | | | | | | | | | | | | | | | | | | | | | | | | | | | | |
2015 | | $ | 30.49 | | | $ | 0.12 | | | $ | 0.89 | | | $ | 1.01 | | | | | $ | — | | | $ | (2.71 | ) | | $ | (2.71 | ) | | $ | 28.79 | |
2014 | | | 25.03 | | | | (0.01 | ) | | | 6.08 | | | | 6.07 | | | | | | — | | | | (0.61 | ) | | | (0.61 | ) | | | 30.49 | |
2013(e) | | | 25.68 | | | | — | ** | | | (0.65 | ) | | | (0.65 | ) | | | | | — | | | | — | | | | — | | | | 25.03 | |
Year Ended 7/31: | | | | | | | | | | | | | | | | | | | | | | | | | | | | | | | | | | |
2013 | | | 21.09 | | | | 0.01 | | | | 4.62 | | | | 4.63 | | | | | | (0.04 | ) | | | — | | | | (0.04 | ) | | | 25.68 | |
2012 | | | 20.23 | | | | (0.02 | ) | | | 0.88 | | | | 0.86 | | | | | | — | | | | — | | | | — | | | | 21.09 | |
2011 | | | 17.10 | | | | 0.01 | | | | 3.12 | | | | 3.13 | | | | | | — | | | | — | | | | — | | | | 20.23 | |
Class C (3/06) | | | | | | | | | | | | | | | | | | | | | | | | | | | | | | | | | | |
Year Ended 8/31: | | | | | | | | | | | | | | | | | | | | | | | | | | | | | | | | | | |
2015 | | | 28.69 | | | | (0.09 | ) | | | 0.83 | | | | 0.74 | | | | | | — | | | | (2.71 | ) | | | (2.71 | ) | | | 26.72 | |
2014 | | | 23.75 | | | | (0.21 | ) | | | 5.76 | | | | 5.55 | | | | | | — | | | | (0.61 | ) | | | (0.61 | ) | | | 28.69 | |
2013(e) | | | 24.38 | | | | (0.01 | ) | | | (0.62 | ) | | | (0.63 | ) | | | | | — | | | | — | | | | — | | | | 23.75 | |
Year Ended 7/31: | | | | | | | | | | | | | | | | | | | | | | | | | | | | | | | | | | |
2013 | | | 20.14 | | | | (0.18 | ) | | | 4.42 | | | | 4.24 | | | | | | — | | | | — | | | | — | | | | 24.38 | |
2012 | | | 19.46 | | | | (0.16 | ) | | | 0.84 | | | | 0.68 | | | | | | — | | | | — | | | | — | | | | 20.14 | |
2011 | | | 16.57 | | | | (0.13 | ) | | | 3.02 | | | | 2.89 | | | | | | — | | | | — | | | | — | | | | 19.46 | |
Class R3 (3/09) | | | | | | | | | | | | | | | | | | | | | | | | | | | | | | | | | | |
Year Ended 8/31: | | | | | | | | | | | | | | | | | | | | | | | | | | | | | | | | | | |
2015 | | | 30.34 | | | | 0.05 | | | | 0.88 | | | | 0.93 | | | | | | — | | | | (2.71 | ) | | | (2.71 | ) | | | 28.56 | |
2014 | | | 24.96 | | | | (0.08 | ) | | | 6.07 | | | | 5.99 | | | | | | — | | | | (0.61 | ) | | | (0.61 | ) | | | 30.34 | |
2013(e) | | | 25.62 | | | | — | ** | | | (0.66 | ) | | | (0.66 | ) | | | | | — | | | | — | | | | — | | | | 24.96 | |
Year Ended 7/31: | | | | | | | | | | | | | | | | | | | | | | | | | | | | | | | | | | |
2013 | | | 21.06 | | | | (0.03 | ) | | | 4.59 | | | | 4.56 | | | | | | — | | | | — | | | | — | | | | 25.62 | |
2012 | | | 20.24 | | | | (0.07 | ) | | | 0.89 | | | | 0.82 | | | | | | — | | | | — | | | | — | | | | 21.06 | |
2011 | | | 17.18 | | | | (0.03 | ) | | | 3.09 | | | | 3.06 | | | | | | — | | | | — | | | | — | | | | 20.24 | |
Class I (3/06) | | | | | | | | | | | | | | | | | | | | | | | | | | | | | | | | | | |
Year Ended 8/31: | | | | | | | | | | | | | | | | | | | | | | | | | | | | | | | | | | |
2015 | | | 30.86 | | | | 0.21 | | | | 0.89 | | | | 1.10 | | | | | | — | | | | (2.71 | ) | | | (2.71 | ) | | | 29.25 | |
2014 | | | 25.27 | | | | 0.06 | | | | 6.15 | | | | 6.21 | | | | | | (0.01 | ) | | | (0.61 | ) | | | (0.62 | ) | | | 30.86 | |
2013(e) | | | 25.92 | | | | 0.01 | | | | (0.66 | ) | | | (0.65 | ) | | | | | — | | | | — | | | | — | | | | 25.27 | |
Year Ended 7/31: | | | | | | | | | | | | | | | | | | | | | | | | | | | | | | | | | | |
2013 | | | 21.29 | | | | 0.05 | | | | 4.67 | | | | 4.72 | | | | | | (0.09 | ) | | | — | | | | (0.09 | ) | | | 25.92 | |
2012 | | | 20.40 | | | | 0.05 | | | | 0.88 | | | | 0.93 | | | | | | (0.04 | ) | | | — | | | | (0.04 | ) | | | 21.29 | |
2011 | | | 17.24 | | | | 0.06 | | | | 3.14 | | | | 3.20 | | | | | | (0.04 | ) | | | — | | | | (0.04 | ) | | | 20.40 | |
| | | | | | | | | | | | | | | | | | | | | | | | | | | | | | |
| | | | Ratios/Supplemental Data | |
| | | | | | | | | Ratios to Average
Net Assets Before
Waiver/Reimbursement | | | | | Ratios to Average
Net Assets After
Waiver/Reimbursement(c) | | | | |
| | | | | | | | |
Total
Return(b) | | | Ending
Net
Assets
(000) | | | | | Expenses | | | Net
Investment
Income
(Loss) | | | | | Expenses | | | Net
Investment
Income
(Loss) | | | Portfolio
Turnover
Rate(d) | |
| | | | | | | | | | | | | | | | | | | | | | | | | | | | | | |
| | | | | | | | | | | | | | | | | | | | | | | | | | | | | | |
| | 3.40 | % | | $ | 8,792 | | | | | | 1.24 | % | | | 0.38 | % | | | | | 1.21 | % | | | 0.41 | % | | | 65 | % |
| | 24.55 | | | | 15,558 | | | | | | 1.45 | | | | (0.27 | ) | | | | | 1.22 | | | | (0.05 | ) | | | 41 | |
| | (2.53 | ) | | | 13,956 | | | | | | 1.37 | * | | | (0.03 | )* | | | | | 1.22 | * | | | 0.13 | * | | | 2 | |
| | | | | | | | | | | | | | | | | | | | | | | | | | | | | | |
| | 21.97 | | | | 13,858 | | | | | | 1.40 | | | | (0.16 | ) | | | | | 1.22 | | | | 0.02 | | | | 67 | |
| | 4.25 | | | | 12,947 | | | | | | 1.31 | | | | (0.18 | ) | | | | | 1.23 | | | | (0.09 | ) | | | 72 | |
| | 18.30 | | | | 9,599 | | | | | | 1.19 | | | | 0.04 | | | | | | 1.19 | | | | 0.04 | | | | 43 | |
| | | | | | | | | | | | | | | | | | | | | | | | | | | | | | |
| | | | | | | | | | | | | | | | | | | | | | | | | | | | | | |
| | 2.62 | | | | 9,150 | | | | | | 2.00 | | | | (0.36 | ) | | | | | 1.96 | | | | (0.33 | ) | | | 65 | |
| | 23.67 | | | | 9,094 | | | | | | 2.21 | | | | (1.01 | ) | | | | | 1.97 | | | | (0.77 | ) | | | 41 | |
| | (2.58 | ) | | | 4,967 | | | | | | 2.13 | * | | | (0.80 | )* | | | | | 1.97 | * | | | (0.63 | )* | | | 2 | |
| | | | | | | | | | | | | | | | | | | | | | | | | | | | | | |
| | 21.05 | | | | 4,143 | | | | | | 2.18 | | | | (1.02 | ) | | | | | 1.97 | | | | (0.81 | ) | | | 67 | |
| | 3.49 | | | | 1,799 | | | | | | 2.07 | | | | (0.91 | ) | | | | | 1.98 | | | | (0.82 | ) | | | 72 | |
| | 17.44 | | | | 1,661 | | | | | | 1.94 | | | | (0.70 | ) | | | | | 1.94 | | | | (0.70 | ) | | | 43 | |
| | | | | | | | | | | | | | | | | | | | | | | | | | | | | | |
| | | | | | | | | | | | | | | | | | | | | | | | | | | | | | |
| | 3.14 | | | | 65 | | | | | | 1.49 | | | | 0.14 | | | | | | 1.46 | | | | 0.17 | | | | 65 | |
| | 24.29 | | | | 64 | | | | | | 1.70 | | | | (0.52 | ) | | | | | 1.47 | | | | (0.29 | ) | | | 41 | |
| | (2.58 | ) | | | 53 | | | | | | 1.63 | * | | | (0.28 | )* | | | | | 1.48 | * | | | (0.13 | )* | | | 2 | |
| | | | | | | | | | | | | | | | | | | | | | | | | | | | | | |
| | 21.65 | | | | 54 | | | | | | 1.63 | | | | (0.28 | ) | | | | | 1.47 | | | | (0.12 | ) | | | 67 | |
| | 4.05 | | | | 110 | | | | | | 1.53 | | | | (0.42 | ) | | | | | 1.48 | | | | (0.37 | ) | | | 72 | |
| | 17.81 | | | | 54 | | | | | | 1.44 | | | | (0.14 | ) | | | | | 1.44 | | | | (0.14 | ) | | | 43 | |
| | | | | | | | | | | | | | | | | | | | | | | | | | | | | | |
| | | | | | | | | | | | | | | | | | | | | | | | | | | | | | |
| | 3.67 | | | | 29,230 | | | | | | 1.00 | | | | 0.64 | | | | | | 0.96 | | | | 0.68 | | | | 65 | |
| | 24.87 | | | | 24,449 | | | | | | 1.20 | | | | (0.01 | ) | | | | | 0.97 | | | | 0.22 | | | | 41 | |
| | (2.51 | ) | | | 15,456 | | | | | | 1.12 | * | | | 0.23 | * | | | | | 0.97 | * | | | 0.38 | * | | | 2 | |
| | | | | | | | | | | | | | | | | | | | | | | | | | | | | | |
| | 22.26 | | | | 15,621 | | | | | | 1.16 | | | | 0.04 | | | | | | 0.97 | | | | 0.23 | | | | 67 | |
| | 4.59 | | | | 13,301 | | | | | | 1.07 | | | | 0.14 | | | | | | 0.98 | | | | 0.23 | | | | 72 | |
| | 18.55 | | | | 26,796 | | | | | | 0.94 | | | | 0.30 | | | | | | 0.94 | | | | 0.30 | | | | 43 | |
| (a) | Per share Net Investment Income (Loss) is calculated using the average daily shares method. | |
| (b) | Total return is the combination of changes in NAV without any sales charge, reinvested dividend income at NAV and reinvested capital gains distributions at NAV, if any. Total returns are not annualized. | |
| (c) | After fee waiver and/or expense reimbursement from the Adviser, where applicable. | |
| (d) | Portfolio Turnover Rate is calculated based on the lesser of long-term purchases or sales (as disclosed in Note 5 – Investment Transactions) divided by the average long-term market value during the period. | |
| (e) | For the one month ended August 31, 2013. | |
| ** | Rounds to less than $0.01 per share. | |
See accompanying notes to financial statements.
Financial Highlights (continued)
Large Cap Core
Selected data for a share outstanding throughout each period:
| | | | | | | | | | | | | | | | | | | | | | | | | | | | | | | | | | |
| | | | | |
| | | | | | Investment Operations | | | | | Less Distributions | | | | |
| | | | | | | | | |
Class (Commencement Date) Year Ended August 31, | | Beginning
NAV | | | Net
Investment
Income
(Loss)(a) | | | Net
Realized/ Unrealized
Gain (Loss) | | | Total | | | | | From
Net
Investment
Income | | | From
Accumulated
Net Realized
Gains | | | Total | | | Ending
NAV | |
Class A (6/13) | | | | | | | | | | | | | | | | | | | | | | | | | | | | | | | | | | |
2015 | | $ | 26.67 | | | $ | 0.23 | | | $ | (0.69 | ) | | $ | (0.46 | ) | | | | $ | (0.02 | ) | | $ | (0.55 | ) | | $ | (0.57 | ) | | $ | 25.64 | |
2014 | | | 20.49 | | | | 0.19 | | | | 6.42 | | | | 6.61 | | | | | | (0.08 | ) | | | (0.35 | ) | | | (0.43 | ) | | | 26.67 | |
2013(d) | | | 20.00 | | | | 0.04 | | | | 0.45 | | | | 0.49 | | | | | | — | | | | — | | | | — | | | | 20.49 | |
Class C (6/13) | | | | | | | | | | | | | | | | | | | | | | | | | | | | | | | | | | |
2015 | | | 26.51 | | | | 0.02 | | | | (0.66 | ) | | | (0.64 | ) | | | | | — | | | | (0.55 | ) | | | (0.55 | ) | | | 25.32 | |
2014 | | | 20.46 | | | | 0.01 | | | | 6.39 | | | | 6.40 | | | | | | — | | | | (0.35 | ) | | | (0.35 | ) | | | 26.51 | |
2013(d) | | | 20.00 | | | | 0.01 | | | | 0.45 | | | | 0.46 | | | | | | — | | | | — | | | | — | | | | 20.46 | |
Class I (6/13) | | | | | | | | | | | | | | | | | | | | | | | | | | | | | | | | | | |
2015 | | | 26.71 | | | | 0.30 | | | | (0.68 | ) | | | (0.38 | ) | | | | | (0.09 | ) | | | (0.55 | ) | | | (0.64 | ) | | | 25.69 | |
2014 | | | 20.50 | | | | 0.25 | | | | 6.41 | | | | 6.66 | | | | | | (0.10 | ) | | | (0.35 | ) | | | (0.45 | ) | | | 26.71 | |
2013(d) | | | 20.00 | | | | 0.03 | | | | 0.47 | | | | 0.50 | | | | | | — | | | | — | | | | — | | | | 20.50 | |
| | | | | | | | | | | | | | | | | | | | | | | | | | | | | | |
| | | | Ratios/Supplemental Data | |
| | | | | | | | | Ratios to Average
Net Assets Before
Waiver/Reimbursement | | | | | Ratios to Average
Net Assets After
Waiver/Reimbursement(c) | | | | |
| | | | | | | | |
Total
Return(b) | | | Ending
Net
Assets
(000) | | | | | Expenses
| | | Net
Investment
Income
(Loss) | | | | | Expenses
| | | Net
Investment
Income
(Loss) | | | Portfolio
Turnover
Rate(e) | |
| | | | | | | | | | | | | | | | | | | | | | | | | | | | | | |
| | (1.76 | )% | | $ | 37,684 | | | | | | 1.14 | % | | | 0.84 | % | | | | | 1.14 | % | | | 0.84 | % | | | 110 | % |
| | 32.63 | | | | 6,726 | | | | | | 1.26 | | | | 0.69 | | | | | | 1.17 | | | | 0.78 | | | | 122 | |
| | 2.45 | | | | 457 | | | | | | 1.54 | * | | | 0.53 | * | | | | | 1.17 | * | | | 0.90 | * | | | 34 | |
| | | | | | | | | | | | | | | | | | | | | | | | | | | | | | |
| | (2.47 | ) | | | 38,591 | | | | | | 1.89 | | | | 0.09 | | | | | | 1.89 | | | | 0.09 | | | | 110 | |
| | 31.61 | | | | 4,937 | | | | | | 1.99 | | | | (0.02 | ) | | | | | 1.92 | | | | 0.06 | | | | 122 | |
| | 2.30 | | | | 143 | | | | | | 2.31 | * | | | (0.18 | )* | | | | | 1.92 | * | | | 0.21 | * | | | 34 | |
| | | | | | | | | | | | | | | | | | | | | | | | | | | | | | |
| | (1.49 | ) | | | 153,632 | | | | | | 0.89 | | | | 1.11 | | | | | | 0.89 | | | | 1.11 | | | | 110 | |
| | 32.92 | | | | 57,360 | | | | | | 1.01 | | | | 0.93 | | | | | | 0.92 | | | | 1.02 | | | | 122 | |
| | 2.50 | | | | 11,449 | | | | | | 1.55 | * | | | 0.07 | * | | | | | 0.92 | * | | | 0.69 | * | | | 34 | |
| (a) | Per share Net Investment Income (Loss) is calculated using the average daily shares method. | |
| (b) | Total return is the combination of changes in NAV without any sales charge, reinvested dividend income at NAV and reinvested capital gains distributions at NAV, if any. Total returns are not annualized. | |
| (c) | After fee waiver and/or expense reimbursement from the Adviser, where applicable. | |
| (d) | For the period June 17, 2013 (commencement of operations) through August 31, 2013. | |
| (e) | Portfolio Turnover Rate is calculated based on the lesser of long-term purchases or sales (as disclosed in Note 5 – Investment Transactions) divided by the average long-term market value during the period. | |
See accompanying notes to financial statements.
Financial Highlights (continued)
Large Cap Core Plus
Selected data for a share outstanding throughout each period:
| | | | | | | | | | | | | | | | | | | | | | | | | | | | | | | | | | |
| | | | | |
| | | | | | Investment Operations | | | | | Less Distributions | | | | |
| | | | | | | | | |
Class (Commencement Date) Year Ended August 31, | | Beginning
NAV | | | Net
Investment
Income
(Loss)(a) | | | Net
Realized/
Unrealized
Gain (Loss) | | | Total | | | | | From
Net
Investment
Income | | | From
Accumulated
Net Realized
Gains | | | Total | | | Ending
NAV | |
Class A (6/13) | | | | | | | | | | | | | | | | | | | | | | | | | | | | | | | | | | |
2015 | | $ | 26.53 | | | $ | 0.09 | | | $ | (0.59 | ) | | $ | (0.50 | ) | | | | $ | — | | | $ | (1.01 | ) | | $ | (1.01 | ) | | $ | 25.02 | |
2014 | | | 20.53 | | | | 0.04 | | | | 6.32 | | | | 6.36 | | | | | | (0.02 | ) | | | (0.34 | ) | | | (0.36 | ) | | | 26.53 | |
2013(e) | | | 20.00 | | | | 0.03 | | | | 0.50 | | | | 0.53 | | | | | | — | | | | — | | | | — | | | | 20.53 | |
Class C (6/13) | | | | | | | | | | | | | | | | | | | | | | | | | | | | | | | | | | |
2015 | | | 26.33 | | | | (0.12 | ) | | | (0.56 | ) | | | (0.68 | ) | | | | | — | | | | (1.01 | ) | | | (1.01 | ) | | | 24.64 | |
2014 | | | 20.51 | | | | (0.13 | ) | | | 6.29 | | | | 6.16 | | | | | | — | | | | (0.34 | ) | | | (0.34 | ) | | | 26.33 | |
2013(e) | | | 20.00 | | | | (0.03 | ) | | | 0.54 | | | | 0.51 | | | | | | — | | | | — | | | | — | | | | 20.51 | |
Class I (6/13) | | | | | | | | | | | | | | | | | | | | | | | | | | | | | | | | | | |
2015 | | | 26.59 | | | | 0.16 | | | | (0.60 | ) | | | (0.44 | ) | | | | | (0.03 | ) | | | (1.01 | ) | | | (1.04 | ) | | | 25.11 | |
2014 | | | 20.55 | | | | 0.11 | | | | 6.32 | | | | 6.43 | | | | | | (0.05 | ) | | | (0.34 | ) | | | (0.39 | ) | | | 26.59 | |
2013(e) | | | 20.00 | | | | 0.02 | | | | 0.53 | | | | 0.55 | | | | | | — | | | | — | | | | — | | | | 20.55 | |
| | | | | | | | | | | | | | | | | | | | | | | | | | | | | | |
| | | | Ratios/Supplemental Data | |
| | | | | | | | | Ratios to Average
Net Assets Before
Waiver/Reimbursement(d) | | | | | Ratios to Average
Net Assets After
Waiver/Reimbursement(c)(d) | | | | |
| | | | | | | | |
Total
Return(b) | | | Ending
Net
Assets
(000) | | | | | Expenses | | | Net
Investment
Income
(Loss) | | | | | Expenses | | | Net
Investment
Income
(Loss) | | | Portfolio
Turnover
Rate(f) | |
| | | | | | | | | | | | | | | | | | | | | | | | | | | | | | |
| | (1.99 | )% | | $ | 17,191 | | | | | | 2.42 | % | | | 0.12 | % | | | | | 2.22 | % | | | 0.33 | % | | | 153 | % |
| | 31.18 | | | | 7,108 | | | | | | 2.55 | | | | (0.10 | ) | | | | | 2.28 | | | | 0.17 | | | | 152 | |
| | 2.70 | | | | 456 | | | | | | 2.38 | * | | | 0.26 | * | | | | | 1.99 | * | | | 0.65 | * | | | 41 | |
| | | | | | | | | | | | | | | | | | | | | | | | | | | | | | |
| | (2.70 | ) | | | 15,962 | | | | | | 3.18 | | | | (0.67 | ) | | | | | 2.97 | | | | (0.46 | ) | | | 153 | |
| | 30.21 | | | | 3,182 | | | | | | 3.28 | | | | (0.77 | ) | | | | | 3.03 | | | | (0.52 | ) | | | 152 | |
| | 2.60 | | | | 51 | | | | | | 3.31 | * | | | (1.33 | )* | | | | | 2.66 | * | | | (0.67 | )* | | | 41 | |
| | | | | | | | | | | | | | | | | | | | | | | | | | | | | | |
| | (1.76 | ) | | | 74,740 | | | | | | 2.18 | | | | 0.38 | | | | | | 1.97 | | | | 0.59 | | | | 153 | |
| | 31.51 | | | | 39,257 | | | | | | 2.33 | | | | 0.17 | | | | | | 2.06 | | | | 0.44 | | | | 152 | |
| | 2.80 | | | | 18,090 | | | | | | 2.33 | * | | | (0.30 | )* | | | | | 1.66 | * | | | 0.37 | * | | | 41 | |
| (a) | Per share Net Investment Income (Loss) is calculated using the average daily shares method. | |
| (b) | Total return is the combination of changes in NAV without any sales charge, reinvested dividend income at NAV and reinvested capital gains distributions at NAV, if any. Total returns are not annualized. | |
| (c) | After fee waiver and/or expense reimbursement from the Adviser. | |
| (d) | Each ratio includes the effect of dividends expense on common stocks sold short and prime broker expenses as follows: | |
| | | | | | | | | | | | | | | | | | | | | | | | | | |
| | | Ratios of Dividend Expense
on Common Stocks Sold Short
to Average Net Assets | | | | | Ratios of Prime Broker Expenses to Average Net Assets | |
| Year Ended August 31, | | Class A | | | Class C | | | Class I | | | | | Class A | | | Class C | | | Class I | |
2015 | | | 0.44 | % | | | 0.44 | % | | | 0.45 | % | | | | | 0.31 | % | | | 0.31 | % | | | 0.31 | % |
2014 | | | 0.48 | | | | 0.47 | | | | 0.48 | | | | | | 0.34 | | | | 0.34 | | | | 0.36 | |
2013(e) | | | 0.52 | * | | | 0.44 | * | | | 0.44 | * | | | | | — | | | | — | | | | — | |
| (e) | For the period June 17, 2013 (commencement of operations) through August 31, 2013. | |
| (f) | Portfolio Turnover Rate is calculated based on the lesser of long-term purchases or sales (as disclosed in Note 5 – Investment Transactions) divided by the average long-term market value during the period. | |
See accompanying notes to financial statements.
Financial Highlights (continued)
Large Cap Growth
Selected data for a share outstanding throughout each period:
| | | | | | | | | | | | | | | | | | | | | | | | | | | | | | | | | | |
| | | | | |
| | | | | | Investment Operations | | | | | Less Distributions | | | | |
| | | | | | | | | |
Class (Commencement Date) Year Ended August 31, | | Beginning
NAV | | | Net
Investment
Income
(Loss)(a) | | | Net
Realized/
Unrealized
Gain (Loss) | | | Total | | | | | From
Net
Investment
Income | | | From
Accumulated
Net Realized
Gains | | | Total | | | Ending
NAV | |
Class A (6/13) | | | | | | | | | | | | | | | | | | | | | | | | | | | | | | | | | | |
2015 | | $ | 26.34 | | | $ | 0.15 | | | $ | (0.15 | ) | | $ | (0.00 | ) | | | | $ | (0.03 | ) | | $ | (1.03 | ) | | $ | (1.06 | ) | | $ | 25.28 | |
2014 | | | 20.59 | | | | 0.17 | | | | 6.03 | | | | 6.20 | | | | | | (0.07 | ) | | | (0.38 | ) | | | (0.45 | ) | | | 26.34 | |
2013(d) | | | 20.00 | | | | 0.05 | | | | 0.54 | | | | 0.59 | | | | | | — | | | | — | | | | — | | | | 20.59 | |
Class C (6/13) | | | | | | | | | | | | | | | | | | | | | | | | | | | | | | | | | | |
2015 | | | 26.18 | | | | (0.06 | ) | | | (0.13 | ) | | | (0.19 | ) | | | | | — | | | | (1.03 | ) | | | (1.03 | ) | | | 24.96 | |
2014 | | | 20.56 | | | | (0.01 | ) | | | 6.01 | | | | 6.00 | | | | | | — | | | | (0.38 | ) | | | (0.38 | ) | | | 26.18 | |
2013(d) | | | 20.00 | | | | — | * | | | 0.56 | | | | 0.56 | | | | | | — | | | | — | | | | — | | | | 20.56 | |
Class I (6/13) | | | | | | | | | | | | | | | | | | | | | | | | | | | | | | | | | | |
2015 | | | 26.38 | | | | 0.21 | | | | (0.14 | ) | | | 0.07 | | | | | | (0.09 | ) | | | (1.03 | ) | | | (1.12 | ) | | | 25.33 | |
2014 | | | 20.60 | | | | 0.24 | | | | 6.02 | | | | 6.26 | | | | | | (0.10 | ) | | | (0.38 | ) | | | (0.48 | ) | | | 26.38 | |
2013(d) | | | 20.00 | | | | 0.04 | | | | 0.56 | | | | 0.60 | | | | | | — | | | | — | | | | — | | | | 20.60 | |
| | | | | | | | | | | | | | | | | | | | | | | | | | | | | | |
| | | | Ratios/Supplemental Data | |
| | | | | | | | | Ratios to Average
Net Assets Before
Waiver/Reimbursement | | | | | Ratios to Average
Net Assets After
Waiver/Reimbursement(c) | | | | |
| | | | | | | | |
Total
Return(b) | | | Ending
Net
Assets
(000) | | | | | Expenses | | | Net
Investment
Income
(Loss) | | | | | Expenses | | | Net
Investment
Income
(Loss) | | | Portfolio
Turnover
Rate(e) | |
| | | | | | | | | | | | | | | | | | | | | | | | | | | | | | |
| | 0.00 | % | | $ | 31,442 | | | | | | 1.24 | % | | | 0.49 | % | | | | | 1.16 | % | | | 0.56 | % | | | 118 | % |
| | 30.45 | | | | 10,734 | | | | | | 1.35 | | | | 0.53 | | | | | | 1.17 | | | | 0.72 | | | | 145 | |
| | 2.95 | | | | 1,017 | | | | | | 1.49 | ** | | | 0.92 | ** | | | | | 1.15 | ** | | | 1.25 | ** | | | 48 | |
| | | | | | | | | | | | | | | | | | | | | | | | | | | | | | |
| | (0.74 | ) | | | 7,621 | | | | | | 1.99 | | | | (0.29 | ) | | | | | 1.91 | | | | (0.22 | ) | | | 118 | |
| | 29.49 | | | | 2,187 | | | | | | 2.11 | | | | (0.22 | ) | | | | | 1.92 | | | | (0.03 | ) | | | 145 | |
| | 2.80 | | | | 83 | | | | | | 2.50 | ** | | | (0.60 | )** | | | | | 1.91 | ** | | | (0.02 | )** | | | 48 | |
| | | | | | | | | | | | | | | | | | | | | | | | | | | | | | |
| | 0.28 | | | | 58,478 | | | | | | 0.99 | | | | 0.72 | | | | | | 0.91 | | | | 0.79 | | | | 118 | |
| | 30.74 | | | | 27,478 | | | | | | 1.10 | | | | 0.81 | | | | | | 0.92 | | | | 0.99 | | | | 145 | |
| | 3.00 | | | | 11,472 | | | | | | 1.55 | ** | | | 0.22 | ** | | | | | 0.92 | ** | | | 0.86 | ** | | | 48 | |
| (a) | Per share Net Investment Income (Loss) is calculated using the average daily shares method. | |
| (b) | Total return is the combination of changes in NAV without any sales charge, reinvested dividend income at NAV and reinvested capital gains distributions at NAV, if any. Total returns are not annualized. | |
| (c) | After fee waiver and/or expense reimbursement from the Adviser. | |
| (d) | For the period June 17, 2013 (commencement of operations) through August 31, 2013. | |
| (e) | Portfolio Turnover Rate is calculated based on the lesser of long-term purchases or sales (as disclosed in Note 5 – Investment Transactions) divided by the average long-term market value during the period. | |
| * | Rounds to less than $0.01 per share. | |
See accompanying notes to financial statements.
Financial Highlights (continued)
Large Cap Value
Selected data for a share outstanding throughout each period:
| | | | | | | | | | | | | | | | | | | | | | | | | | | | | | | | | | |
| | | | | |
| | | | | | Investment Operations | | | | | Less Distributions | | | | |
| | | | | | | | | |
Class (Commencement Date) | | Beginning
NAV | | | Net
Investment
Income
(Loss)(a) | | | Net
Realized/
Unrealized
Gain (Loss) | | | Total | | | | | From
Net
Investment
Income | | | From
Accumulated
Net Realized
Gains | | | Total | | | Ending
NAV | |
Class A (8/96) | | | | | | | | | | | | | | | | | | | | | | | | | | | | | | | | | | |
Year Ended 8/31: | | | | | | | | | | | | | | | | | | | | | | | | | | | | | | | | | | |
2015 | | $ | 28.36 | | | $ | 0.27 | | | $ | (1.77 | ) | | $ | (1.50 | ) | | | | $ | (0.21 | ) | | $ | (3.07 | ) | | $ | (3.28 | ) | | $ | 23.58 | |
2014 | | | 25.15 | | | | 0.31 | | | | 6.09 | | | | 6.40 | | | | | | (0.36 | ) | | | (2.83 | ) | | | (3.19 | ) | | | 28.36 | |
2013(e) | | | 24.31 | | | | 0.03 | | | | 0.81 | | | | 0.84 | | | | | | — | | | | — | | | | — | | | | 25.15 | |
Year Ended 6/30: | | | | | | | | | | | | | | | | | | | | | | | | | | | | | | | | | | |
2013 | | | 20.03 | | | | 0.29 | | | | 4.29 | | | | 4.58 | | | | | | (0.30 | ) | | | — | | | | (0.30 | ) | | | 24.31 | |
2012 | | | 20.25 | | | | 0.26 | | | | (0.24 | ) | | | 0.02 | | | | | | (0.24 | ) | | | — | | | | (0.24 | ) | | | 20.03 | |
2011 | | | 16.11 | | | | 0.21 | | | | 4.15 | | | | 4.36 | | | | | | (0.22 | ) | | | — | | | | (0.22 | ) | | | 20.25 | |
Class C (8/96) | | | | | | | | | | | | | | | | | | | | | | | | | | | | | | | | | | |
Year Ended 8/31: | | | | | | | | | | | | | | | | | | | | | | | | | | | | | | | | | | |
2015 | | | 27.31 | | | | 0.07 | | | | (1.70 | ) | | | (1.63 | ) | | | | | (0.01 | ) | | | (3.07 | ) | | | (3.08 | ) | | | 22.60 | |
2014 | | | 24.33 | | | | 0.10 | | | | 5.88 | | | | 5.98 | | | | | | (0.17 | ) | | | (2.83 | ) | | | (3.00 | ) | | | 27.31 | |
2013(e) | | | 23.54 | | | | — | ** | | | 0.79 | | | | 0.79 | | | | | | — | | | | — | | | | — | | | | 24.33 | |
Year Ended 6/30: | | | | | | | | | | | | | | | | | | | | | | | | | | | | | | | | | | |
2013 | | | 19.41 | | | | 0.12 | | | | 4.15 | | | | 4.27 | | | | | | (0.14 | ) | | | — | | | | (0.14 | ) | | | 23.54 | |
2012 | | | 19.61 | | | | 0.11 | | | | (0.22 | ) | | | (0.11 | ) | | | | | (0.09 | ) | | | — | | | | (0.09 | ) | | | 19.41 | |
2011 | | | 15.61 | | | | 0.06 | | | | 4.03 | | | | 4.09 | | | | | | (0.09 | ) | | | — | | | | (0.09 | ) | | | 19.61 | |
Class R3 (8/08) | | | | | | | | | | | | | | | | | | | | | | | | | | | | | | | | | | |
Year Ended 8/31: | | | | | | | | | | | | | | | | | | | | | | | | | | | | | | | | | | |
2015 | | | 28.50 | | | | 0.19 | | | | (1.76 | ) | | | (1.57 | ) | | | | | (0.15 | ) | | | (3.07 | ) | | | (3.22 | ) | | | 23.71 | |
2014 | | | 25.27 | | | | 0.24 | | | | 6.12 | | | | 6.36 | | | | | | (0.30 | ) | | | (2.83 | ) | | | (3.13 | ) | | | 28.50 | |
2013(e) | | | 24.43 | | | | 0.02 | | | | 0.82 | | | | 0.84 | | | | | | — | | | | — | | | | — | | | | 25.27 | |
Year Ended 6/30: | | | | | | | | | | | | | | | | | | | | | | | | | | | | | | | | | | |
2013 | | | 20.14 | | | | 0.24 | | | | 4.30 | | | | 4.54 | | | | | | (0.25 | ) | | | — | | | | (0.25 | ) | | | 24.43 | |
2012 | | | 20.34 | | | | 0.22 | | | | (0.23 | ) | | | (0.01 | ) | | | | | (0.19 | ) | | | — | | | | (0.19 | ) | | | 20.14 | |
2011 | | | 16.19 | | | | 0.18 | | | | 4.15 | | | | 4.33 | | | | | | (0.18 | ) | | | — | | | | (0.18 | ) | | | 20.34 | |
Class I (8/96) | | | | | | | | | | | | | | | | | | | | | | | | | | | | | | | | | | |
Year Ended 8/31: | | | | | | | | | | | | | | | | | | | | | | | | | | | | | | | | | | |
2015 | | | 28.52 | | | | 0.34 | | | | (1.78 | ) | | | (1.44 | ) | | | | | (0.28 | ) | | | (3.07 | ) | | | (3.35 | ) | | | 23.73 | |
2014 | | | 25.28 | | | | 0.37 | | | | 6.13 | | | | 6.50 | | | | | | (0.43 | ) | | | (2.83 | ) | | | (3.26 | ) | | | 28.52 | |
2013(e) | | | 24.42 | | | | 0.04 | | | | 0.82 | | | | 0.86 | | | | | | — | | | | — | | | | — | | | | 25.28 | |
Year Ended 6/30: | | | | | | | | | | | | | | | | | | | | | | | | | | | | | | | | | | |
2013 | | | 20.12 | | | | 0.34 | | | | 4.31 | | | | 4.65 | | | | | | (0.35 | ) | | | — | | | | (0.35 | ) | | | 24.42 | |
2012 | | | 20.34 | | | | 0.31 | | | | (0.24 | ) | | | 0.07 | | | | | | (0.29 | ) | | | — | | | | (0.29 | ) | | | 20.12 | |
2011 | | | 16.18 | | | | 0.26 | | | | 4.17 | | | | 4.43 | | | | | | (0.27 | ) | | | — | | | | (0.27 | ) | | | 20.34 | |
| | | | | | | | | | | | | | | | | | | | | | | | | | | | | | |
| | | | Ratios/Supplemental Data | |
| | | | | | | | | Ratios to Average
Net Assets Before
Waiver/Reimbursement | | | | | Ratios to Average
Net Assets After
Waiver/Reimbursement(c) | | | | |
| | | | | | | | |
Total
Return(b) | | | Ending
Net
Assets
(000) | | | | | Expenses | | | Net
Investment
Income
(Loss) | | | | | Expenses | | | Net
Investment
Income
(Loss) | | | Portfolio
Turnover
Rate(d) | |
| | | | | | | | | | | | | | | | | | | | | | | | | | | | | | |
| | | | | | | | | | | | | | | | | | | | | | | | | | | | | | |
| | (5.75 | )% | | $ | 267,337 | | | | | | 1.12 | % | | | 1.01 | % | | | | | 1.12 | % | | | 1.01 | % | | | 158 | % |
| | 27.40 | | | | 294,917 | | | | | | 1.11 | | | | 1.16 | | | | | | 1.11 | | | | 1.16 | | | | 153 | |
| | 3.50 | | | | 250,052 | | | | | | 1.25 | * | | | 0.70 | * | | | | | 1.25 | * | | | 0.70 | * | | | 42 | |
| | | | | | | | | | | | | | | | | | | | | | | | | | | | | | |
| | 23.09 | | | | 282,993 | | | | | | 1.16 | | | | 1.30 | | | | | | 1.15 | | | | 1.31 | | | | 153 | |
| | 0.19 | | | | 258,324 | | | | | | 1.16 | | | | 1.33 | | | | | | 1.16 | | | | 1.33 | | | | 99 | |
| | 27.15 | | | | 295,093 | | | | | | 1.22 | | | | 1.07 | | | | | | 1.18 | | | | 1.11 | | | | 78 | |
| | | | | | | | | | | | | | | | | | | | | | | | | | | | | | |
| | | | | | | | | | | | | | | | | | | | | | | | | | | | | | |
| | (6.45 | ) | | | 31,516 | | | | | | 1.87 | | | | 0.26 | | | | | | 1.87 | | | | 0.26 | | | | 158 | |
| | 26.47 | | | | 26,628 | | | | | | 1.86 | | | | 0.41 | | | | | | 1.86 | | | | 0.41 | | | | 153 | |
| | 3.36 | | | | 17,780 | | | | | | 2.00 | * | | | (0.02 | )* | | | | | 2.00 | * | | | (0.02 | )* | | | 42 | |
| | | | | | | | | | | | | | | | | | | | | | | | | | | | | | |
| | 22.10 | | | | 17,174 | | | | | | 1.91 | | | | 0.54 | | | | | | 1.90 | | | | 0.55 | | | | 153 | |
| | (0.51 | ) | | | 16,644 | | | | | | 1.91 | | | | 0.58 | | | | | | 1.91 | | | | 0.58 | | | | 99 | |
| | 26.21 | | | | 17,518 | | | | | | 1.97 | | | | 0.32 | | | | | | 1.93 | | | | 0.36 | | | | 78 | |
| | | | | | | | | | | | | | | | | | | | | | | | | | | | | | |
| | | | | | | | | | | | | | | | | | | | | | | | | | | | | | |
| | (5.99 | ) | | | 232 | | | | | | 1.37 | | | | 0.73 | | | | | | 1.37 | | | | 0.73 | | | | 158 | |
| | 27.11 | | | | 135 | | | | | | 1.36 | | | | 0.92 | | | | | | 1.36 | | | | 0.92 | | | | 153 | |
| | 3.44 | | | | 87 | | | | | | 1.50 | * | | | 0.43 | * | | | | | 1.50 | * | | | 0.43 | * | | | 42 | |
| | | | | | | | | | | | | | | | | | | | | | | | | | | | | | |
| | 22.72 | | | | 91 | | | | | | 1.41 | | | | 1.07 | | | | | | 1.39 | | | | 1.08 | | | | 153 | |
| | 0.04 | | | | 76 | | | | | | 1.41 | | | | 1.14 | | | | | | 1.41 | | | | 1.14 | | | | 99 | |
| | 26.80 | | | | 164 | | | | | | 1.49 | | | | 0.91 | | | | | | 1.43 | | | | 0.97 | | | | 78 | |
| | | | | | | | | | | | | | | | | | | | | | | | | | | | | | |
| | | | | | | | | | | | | | | | | | | | | | | | | | | | | | |
| | (5.52 | ) | | | 103,342 | | | | | | 0.86 | | | | 1.29 | | | | | | 0.86 | | | | 1.29 | | | | 158 | |
| | 27.74 | | | | 104,875 | | | | | | 0.86 | | | | 1.40 | | | | | | 0.86 | | | | 1.40 | | | | 153 | |
| | 3.52 | | | | 45,148 | | | | | | 1.00 | * | | | 0.97 | * | | | | | 1.00 | * | | | 0.97 | * | | | 42 | |
| | | | | | | | | | | | | | | | | | | | | | | | | | | | | | |
| | 23.39 | | | | 42,285 | | | | | | 0.91 | | | | 1.53 | | | | | | 0.90 | | | | 1.55 | | | | 153 | |
| | 0.45 | | | | 24,546 | | | | | | 0.91 | | | | 1.59 | | | | | | 0.91 | | | | 1.59 | | | | 99 | |
| | 27.46 | | | | 30,150 | | | | | | 0.97 | | | | 1.32 | | | | | | 0.93 | | | | 1.36 | | | | 78 | |
| (a) | Per share Net Investment Income (Loss) is calculated using the average daily shares method. | |
| (b) | Total return is the combination of changes in NAV without any sales charge, reinvested dividend income at NAV and reinvested capital gains distributions at NAV, if any. Total returns are not annualized. Performance prior to June 24, 2013, reflects the Fund’s performance under the management of multiple sub-advisers using investment strategies that differed significantly from those currently in place. | |
| (c) | After fee waiver and/or expense reimbursement from the Adviser, where applicable. | |
| (d) | Portfolio Turnover Rate is calculated based on the lesser of long-term purchases or sales (as disclosed in Note 5 – Investment Transactions) divided by the average long-term market value during the period. | |
| (e) | For the two months ended August 31, 2013. | |
| ** | Rounds to less than $0.01 per share. | |
See accompanying notes to financial statements.
Notes to
Financial Statements
1. General Information and Significant Accounting Policies
General Information
Trust and Fund Information
The Nuveen Investment Trust and the Nuveen Investment Trust II (each a “Trust” and collectively, the “Trusts”), are open-end management investment companies registered under the Investment Company Act of 1940, as amended. The Nuveen Investment Trust is comprised of Nuveen Concentrated Core Fund (“Concentrated Core”), Nuveen Core Dividend Fund (“Core Dividend”), Nuveen Equity Market Neutral Fund (“Equity Market Neutral”), Nuveen Large Cap Core Fund (“Large Cap Core”), Nuveen Large Cap Core Plus Fund (“Large Cap Core Plus”), Nuveen Large Cap Growth Fund (“Large Cap Growth”) and Nuveen Large Cap Value Fund (“Large Cap Value”), among others, and the Nuveen Investment Trust II is comprised of Nuveen Equity Long/Short Fund (“Equity Long/Short”) and Nuveen Growth Fund (“Growth”) (each a “Fund” and collectively, the “Funds”), as diversified funds, among others. The Nuveen Investment Trust and Nuveen Investment Trust II were each organized as Massachusetts business trusts on May 6, 1996 and June 27, 1997, respectively.
The end of the reporting period for the Funds is August 31, 2015, and the period covered by these Notes to Financial Statements is the fiscal year ended August 31, 2015 (the “current fiscal period”).
Investment Adviser
The Funds’ investment adviser is Nuveen Fund Advisors, LLC (the “Adviser”), a wholly-owned subsidiary of Nuveen Investments, Inc. (“Nuveen”). The Adviser is responsible for each Fund’s overall investment strategy and asset allocation decisions. The Adviser has entered into sub-advisory agreements with Nuveen Asset Management, LLC (the “Sub-Adviser”), a subsidiary of the Adviser, under which the Sub-Adviser manages the investment portfolios of the Funds.
Investment Objectives and Principal Investment Strategies
Concentrated Core
Concentrated Core’s investment objective is long-term capital appreciation. The Fund pursues its objective by investing in a portfolio of 15-30 equity securities. Substantially all of the equity securities in which the Fund invests will be included in the Fund’s benchmark index, the Russell 1000® Index, at the time of purchase. Under normal market conditions, the Fund invests at least 80% of the sum of its net assets and the amount of any borrowings for investment purposes in equity securities. The Sub-Adviser will focus on larger capitalization companies in the Russell 1000® Index.
Core Dividend
Core Dividend’s investment objective is total return comprised of income from dividends and long-term capital appreciation. Under normal market conditions, the Fund invests at least 80% of the sum of its net assets and the amount of any borrowings for investment purposes in dividend paying equity securities. Substantially all of the equity securities in which the Fund invests will be, at the time of purchase, dividend paying securities included in the Fund’s benchmark index, the Russell 1000® Index. The Sub-Adviser generally will sell a security that discontinues dividend payments, although it is not required to do so.
Equity Long/Short
Equity Long/Short’s investment objective is to seek long-term capital appreciation with low correlation to the U.S. equity market. The Fund pursues its investment objective by establishing long and short positions in a diversified portfolio of equity securities. Substantially all of the equity securities in which the Fund takes long and short positions will be included in the Fund’s benchmark index, the Russell 1000® Index, at the time the position is taken. As a result, the Fund will invest significantly in large capitalization companies. The Fund may use all or a portion of the proceeds of its short sales to purchase additional long positions. The Fund intends to generally maintain a net long exposure to the equity market (long market value minus short market value) that is greater than the 0% exposure which a “market neutral” fund is designed to provide, but less than 100% exposure provided by a fund that invests only in long positions. This net long exposure is expected to be at least 40% under normal market conditions. The goal is to allow the Fund to benefit from a rising market, although to a lesser extent than a “long-only” fund, while still affording some protection from a falling market because of the Fund’s short positions, which are designed to perform inversely to the market.
Equity Market Neutral
Equity Market Neutral’s investment objective is to provide investors with long-term capital appreciation independent of the U.S. equity market. The Fund pursues its investment objective utilizing a market neutral strategy, the goal of which is to generate absolute returns that are due primarily to stock selection, rather than the returns and direction of the stock market. The Fund implements its market neutral strategy by establishing long and
short positions in a diversified portfolio of equity securities. Substantially all of the equity securities in which the Fund takes long and short positions will be included in the Russell 1000® Index at the time of purchase. The Fund may use all or a portion of the proceeds of its short sales to purchase additional long positions. At any time, the Fund’s net long exposure to the stock market (long market value minus short market value) could range between -20% and 40%.
Growth
Growth’s investment objective is to seek long-term capital appreciation. Under normal market conditions, the Fund invests at least 80% of its net assets in equity securities of companies with market capitalizations at the time of investment comparable to companies in the Russell 1000® Index. The Fund will not be forced to sell a stock because it has exceeded or fallen below the current market capitalization range. The Fund may invest up to 25% of its net assets in non-U.S. equity securities that are U.S. dollar-denominated.
Large Cap Core
Large Cap Core’s investment objective is long-term capital appreciation. Under normal market conditions, the Fund invests at least 80% of the sum of its net assets and the amount of any borrowings for investment purposes in equity securities of large-capitalization companies. Large capitalization companies are defined as companies that have market capitalizations at the time of purchase within the market capitalization range of the companies in the Russell 1000® Index immediately after its most recent reconstitution prior to such purchase. It is expected that the market capitalization range will be published each year at the end of May for the reconstitution of the index that will occur each year at the end of June. The range for the 2014 reconstitution was $2.2 billion to $545 billion. Substantially all of the equity securities in which the Fund invests will be included in the Fund’s benchmark index, the Russell 1000® Index, at the time of purchase.
Large Cap Core Plus
Large Cap Core Plus’ investment objective is long-term capital appreciation. The Fund pursues its investment objective by establishing long and short positions in a diversified portfolio of equity securities. Under normal market conditions, the Fund invests at least 80% of the sum of its net assets and the amount of any borrowings for investment purposes (including assets acquired through the Fund’s short sales) in equity securities of large-capitalization companies. Large capitalization companies are defined as companies that have market capitalizations at the time of purchase within the market capitalization range of the companies in the Russell 1000® Index immediately after its most recent reconstitution prior to such purchase. It is expected that the market capitalization range will be published each year at the end of May for the reconstitution of the index that will occur each year at the end of June. The range for the 2014 reconstitution was $2.2 billion to $545 billion. Substantially all of the equity securities in which the Fund takes long and short positions will be included in the Fund’s benchmark index, the Russell 1000® Index, at the time the position is taken. The Fund may use all or a portion of the proceeds of its short sales to purchase additional long positions. The Fund intends to maintain an approximate 100% net long exposure to the equity market (long market value minus short market value). However, the Fund’s long and short positions will vary in size as market opportunities change. The Fund’s long positions normally will range between 90% and 150% of the Fund’s net assets and the Fund’s short positions normally will range between 0% and 50% of the Fund’s net assets. However, in times of unusual or adverse market, economic, regulatory or political conditions, the Fund’s long and/or short positions may be outside of these ranges. Periods of unusual or adverse market, economic, regulatory or political conditions may exist for as long as six months and, in some cases, longer.
Large Cap Growth
Large Cap Growth’s investment objective is long-term capital appreciation. Under normal market conditions, the Fund invests at least 80% of the sum of its net assets and the amount of any borrowings for investment purposes in equity securities of large-capitalization companies. Large capitalization companies are defined as companies that have market capitalizations at the time of purchase within the market capitalization range of the companies in the Russell 1000® Index immediately after its most recent reconstitution prior to such purchase. It is expected that the market capitalization range will be published each year at the end of May for the reconstitution of the index that will occur each year at the end of June. The range for the 2014 reconstitution was $2.2 billion to $545 billion. Substantially all of the equity securities in which the Fund invests will be included in the Fund’s benchmark index, the Russell 1000® Growth Index, at the time of purchase.
Large Cap Value
Large Cap Value’s investment objective is to provide investors with long-term capital appreciation. Under normal market conditions, the Fund invests at least 80% of the sum of its net assets and the amount of any borrowings for investment purposes in equity securities of large-capitalization companies. Large capitalization companies are defined as companies that have market capitalizations at the time of purchase within the market capitalization range of the companies in the Russell 1000® Index immediately after its most recent reconstitution prior to such purchase. It is expected that the market capitalization range will be published each year at the end of May for the reconstitution of the index that will occur each year at the end of June. The range for the 2014 reconstitution was $2.2 billion to $545 billion. Substantially all of the equity securities in which the Fund invests will be included in the Fund’s benchmark index, the Russell 1000® Value Index, at the time of purchase.
Each Fund, with the exception of Growth, may also enter into stock index futures contracts to manage cash flows into and out of the Funds.
The Funds’ most recent prospectus provides further descriptions of each Fund’s investment objective, principal investment strategies and principal risks.
Notes to Financial Statements (continued)
Significant Accounting Policies
Each Fund is an investment company and follows accounting and reporting guidance under Financial Accounting Standards Board (FASB) Accounting Standards Codification (ASC) Topic 946 “Financial Services – Investment Companies.” The following is a summary of significant accounting policies followed by the Funds in the preparation of their financial statements in accordance with U.S. generally accepted accounting principles (“U.S. GAAP”).
Investment Transactions
Investment transactions are recorded on a trade date basis. Realized gains and losses from investment transactions are determined on the specific identification method, which is the same basis used for federal income tax purposes. Investments purchased on a when-issued/delayed delivery basis may have extended settlement periods. Any investments so purchased are subject to market fluctuation during this period. The Funds have earmarked securities in their portfolios with a current value at least equal to the amount of the when-issued/delayed delivery purchase commitments.
As of the end of the reporting period, the Funds did not have any outstanding when-issued/delayed delivery purchase commitments.
Investment Income
Dividend income on investments purchased and dividends expense on common stocks sold short are recorded on the ex-dividend date or, for foreign securities, when information is available. Interest income is recorded on an accrual basis.
Professional Fees
Professional fees presented on the Statement of Operations consist of legal fees incurred in the normal course of operations, audit fees, tax consulting fees and, in some cases, workout expenditures. Workout expenditures are incurred in an attempt to protect or enhance an investment or to pursue other claims or legal actions on behalf of Fund shareholders. If a refund is received for workout expenditures paid in a prior reporting period, such amounts will be recognized as “Legal fee refund” on the Statement Operations.
Dividends and Distributions to Shareholders
Dividends from net investment income are declared and distributed to shareholders annually, except Core Dividend will pay income dividends quarterly. Net realized capital gains from investment transactions, if any, are declared and distributed to shareholders at least annually. Furthermore, capital gains are distributed only to the extent they exceed available capital loss carryforwards.
Distributions to shareholders are recorded on the ex-dividend date. The amount and timing of distributions are determined in accordance with federal income tax regulations, which may differ from U.S. GAAP.
Share Classes and Sales Charges
Class A Shares are generally sold with an up-front sales charge and incur a 0.25% annual 12b-1 service fee. Class A Share purchases of $1 million or more are sold at net asset value (“NAV”) without an up-front sales charge but may be subject to a contingent deferred sales charge (“CDSC”) if redeemed within twelve months of purchase. Class C Shares are sold without an up-front sales charge but incur a 0.75% annual 12b-1 distribution fee and a 0.25% annual 12b-1 service fee. Class C Shares are subject to a CDSC of 1% if redeemed within twelve months of purchase. Class R3 Shares are sold without an up-front sales charge but incur a 0.25% annual 12b-1 distribution fee and a 0.25% annual 12b-1 service fee. Class I Shares are not subject to any sales charge or 12b-1 distribution or service fees.
Multiclass Operations and Allocations
Income and expenses of the Funds that are not directly attributable to a specific class of shares are prorated among the classes based on the relative net assets of each class. Expenses directly attributable to a class of shares are recorded to the specific class. Currently, the only expenses that are allocated on a class-specific basis are 12b-1 distribution and service fees.
Realized and unrealized capital gains and losses of the Funds are prorated among the classes based on the relative net assets of each class.
Indemnifications
Under each Trust’s organizational documents, its officers and trustees are indemnified against certain liabilities arising out of the performance of their duties to each Trust. In addition, in the normal course of business, each Trust enters into contracts that provide general indemnifications to other parties. Each Trust’s maximum exposure under these arrangements is unknown as this would involve future claims that may be made against each Trust that have not yet occurred. However, each Trust has not had prior claims or losses pursuant to these contracts and expects the risk of loss to be remote.
Netting Agreements
In the ordinary course of business, the Funds may enter into transactions subject to enforceable master repurchase agreements, International Swaps and Derivative Association, Inc. (“ISDA”) master agreements or other similar arrangements (“netting agreements”). Generally, the right to offset in
netting agreements allows each Fund to offset any exposure to a specific counterparty with any collateral received or delivered to that counterparty based on the terms of the agreements. Generally, a Fund manages its cash collateral and securities collateral on a counterparty basis.
The Funds’ investments subject to netting agreements as of the end of the reporting period, if any, are further described in Note 3 – Portfolio Securities and Investments in Derivatives.
Use of Estimates
The preparation of financial statements in conformity with U.S. GAAP requires management to make estimates and assumptions that affect the reported amounts of assets and liabilities at the date of the financial statements and the reported amounts of increases and decreases in net assets from operations during the reporting period. Actual results may differ from those estimates.
2. Investment Valuation and Fair Value Measurements
The fair valuation input levels as described below are for fair value measurement purposes.
Fair value is defined as the price that would be received upon selling an investment or transferring a liability in an orderly transaction to an independent buyer in the principal or most advantageous market for the investment. A three-tier hierarchy is used to maximize the use of observable market data and minimize the use of unobservable inputs and to establish classification of fair value measurements for disclosure purposes. Observable inputs reflect the assumptions market participants would use in pricing the asset or liability. Observable inputs are based on market data obtained from sources independent of the reporting entity. Unobservable inputs reflect the reporting entity’s own assumptions about the assumptions market participants would use in pricing the asset or liability. Unobservable inputs are based on the best information available in the circumstances. The following is a summary of the three-tiered hierarchy of valuation input levels.
| | |
| Level 1 – | | Inputs are unadjusted and prices are determined using quoted prices in active markets for identical securities. |
| Level 2 – | | Prices are determined using other significant observable inputs (including quoted prices for similar securities, interest rates, prepayment speeds, credit risk, etc.). |
| Level 3 – | | Prices are determined using significant unobservable inputs (including management’s assumptions in determining the fair value of investments). |
Common stocks and other equity-type securities are valued at the last sales price on the securities exchange on which such securities are primarily traded and are generally classified as Level 1. Securities primarily traded on the NASDAQ National Market (“NASDAQ”) are valued at the NASDAQ Official Closing Price and are generally classified as Level 1. However, securities traded on a securities exchange or NASDAQ for which there were no transactions on a given day or securities not listed on a securities exchange or NASDAQ are valued at the quoted bid price and are generally classified as Level 2.
Repurchase agreements are valued at contract amount plus accrued interest, which approximates market value. These securities are generally classified as Level 2.
Certain securities may not be able to be priced by the pre-established pricing methods as described above. Such securities may be valued by the Funds’ Board of Trustees (the “Board”) and/or its appointee at fair value. These securities generally include, but are not limited to, restricted securities (securities which may not be publicly sold without registration under the Securities Act of 1933, as amended) for which a pricing service is unable to provide a market price; securities whose trading has been formally suspended; debt securities that have gone into default and for which there is no current market quotation; a security whose market price is not available from a pre-established pricing source; a security with respect to which an event has occurred that is likely to materially affect the value of the security after the market has closed but before the calculation of a Fund’s NAV (as may be the case in non-U.S. markets on which the security is primarily traded) or make it difficult or impossible to obtain a reliable market quotation; and a security whose price, as provided by the pricing service, is not deemed to reflect the security’s fair value. As a general principle, the fair value of a security would appear to be the amount that the owner might reasonably expect to receive for it in a current sale. A variety of factors may be considered in determining the fair value of such securities, which may include consideration of the following: yields or prices of investments of comparable quality, type of issue, coupon, maturity and rating, market quotes or indications of value from security dealers, evaluations of anticipated cash flows or collateral, general market conditions and other information and analysis, including the obligor’s credit characteristics considered relevant. These securities are generally classified as Level 2 or Level 3 depending on the priority of the significant inputs. Regardless of the method employed to value a particular security, all valuations are subject to review by the Board and/or its appointee.
Notes to Financial Statements (continued)
The inputs or methodologies used for valuing securities are not an indication of the risks associated with investing in those securities. The following is a summary of each Fund’s fair value measurements as of the end of the reporting period:
| | | | | | | | | | | | | | | | |
| Concentrated Core | | Level 1 | | | Level 2 | | | Level 3 | | | Total | |
| Long-Term Investments*: | | | | | | | | | | | | | | | | |
Common Stocks | | $ | 132,559,630 | | | $ | — | | | $ | — | | | $ | 132,559,630 | |
| | | | |
| Core Dividend | | | | | | | | | | | | |
| Long-Term Investments*: | | | | | | | | | | | | | | | | |
Common Stocks | | $ | 44,371,215 | | | $ | — | | | $ | — | | | $ | 44,371,215 | |
| | | | |
| Equity Long/Short | | | | | | | | | | | | |
| Long-Term Investments*: | | | | | | | | | | | | | | | | |
Common Stocks | | $ | 137,413,499 | | | $ | — | | | $ | — | | | $ | 137,413,499 | |
| Short-Term Investments: | | | | | | | | | | | | | | | | |
Repurchase Agreements | | | — | | | | 3,790,915 | | | | — | | | | 3,790,915 | |
| Common Stocks Sold Short* | | | (69,280,980 | ) | | | — | | | | — | | | | (69,280,980 | ) |
| Total | | $ | 68,132,519 | | | $ | 3,790,915 | | | $ | — | | | $ | 71,923,434 | |
| | | | |
| Equity Market Neutral | | | | | | | | | | | | |
| Long-Term Investments*: | | | | | | | | | | | | | | | | |
Common Stocks | | $ | 43,087,203 | | | $ | — | | | $ | — | | | $ | 43,087,203 | |
| Short-Term Investments: | | | | | | | | | | | | | | | | |
Repurchase Agreements | | | — | | | | 6,495,033 | | | | — | | | | 6,495,033 | |
| Common Stocks Sold Short* | | | (35,607,625 | ) | | | — | | | | — | | | | (35,607,625 | ) |
| Total | | $ | 7,479,578 | | | $ | 6,495,033 | | | $ | — | | | $ | 13,974,611 | |
| | | | |
| Growth | | | | | | | | | | | | |
| Long-Term Investments*: | | | | | | | | | | | | | | | | |
Common Stocks | | $ | 46,378,490 | | | $ | — | | | $ | — | | | $ | 46,378,490 | |
| Short-Term Investments: | | | | | | | | | | | | | | | | |
Repurchase Agreements | | | — | | | | 617,316 | | | | — | | | | 617,316 | |
| Total | | $ | 46,378,490 | | | $ | 617,316 | | | $ | — | | | $ | 46,995,806 | |
| | | | |
| Large Cap Core | | | | | | | | | | | | |
| Long-Term Investments*: | | | | | | | | | | | | | | | | |
Common Stocks | | $ | 229,808,090 | | | $ | — | | | $ | — | | | $ | 229,808,090 | |
| | | | |
| Large Cap Core Plus | | | | | | | | | | | | |
| Long-Term Investments*: | | | | | | | | | | | | | | | | |
Common Stocks | | $ | 139,890,915 | | | $ | — | | | $ | — | | | $ | 139,890,915 | |
| Common Stocks Sold Short* | | | (32,259,192 | ) | | | — | | | | — | | | | (32,259,192 | ) |
| Total | | $ | 107,631,723 | | | $ | — | | | $ | — | | | $ | 107,631,723 | |
| | | | |
| Large Cap Growth | | | | | | | | | | | | |
| Long-Term Investments*: | | | | | | | | | | | | | | | | |
Common Stocks | | $ | 97,321,855 | | | $ | — | | | $ | — | | | $ | 97,321,855 | |
| Short-Term Investments: | | | | | | | | | | | | | | | | |
Repurchase Agreements | | | — | | | | 167,795 | | | | — | | | | 167,795 | |
| Total | | $ | 97,321,855 | | | $ | 167,795 | | | $ | — | | | $ | 97,489,650 | |
| | | | |
| Large Cap Value | | | | | | | | | | | | |
| Long-Term Investments*: | | | | | | | | | | | | | | | | |
Common Stocks | | $ | 401,265,402 | | | $ | — | | | $ | — | | | $ | 401,265,402 | |
| * | Refer to the Fund’s Portfolio of Investments for industry classifications. |
The Board is responsible for the valuation process and has appointed the oversight of the daily valuation process to the Adviser’s Valuation Committee. The Valuation Committee, pursuant to the valuation policies and procedures adopted by the Board, is responsible for making fair value determinations, evaluating the effectiveness of the Funds’ pricing policies and reporting to the Board. The Valuation Committee is aided in its efforts by the Adviser’s dedicated Securities Valuation Team, which is responsible for administering the daily valuation process and applying fair value methodologies as
approved by the Valuation Committee. When determining the reliability of independent pricing services for investments owned by the Funds, the Valuation Committee, among other things, conducts due diligence reviews of the pricing services and monitors the quality of security prices received through various testing reports conducted by the Securities Valuation Team.
The Valuation Committee will consider pricing methodologies it deems relevant and appropriate when making a fair value determination, based on the facts and circumstances specific to the portfolio instrument. Fair value determinations generally will be derived as follows, using public or private market information:
| | (i) | If available, fair value determinations shall be derived by extrapolating from recent transactions or quoted prices for identical or comparable securities. |
| | (ii) | If such information is not available, an analytical valuation methodology may be used based on other available information including, but not limited to: analyst appraisals, research reports, corporate action information, issuer financial statements and shelf registration statements. Such analytical valuation methodologies may include, but are not limited to: multiple of earnings, discount from market value of a similar freely-traded security, discounted cash flow analysis, book value or a multiple thereof, risk premium/yield analysis, yield to maturity and/or fundamental investment analysis. |
The purchase price of a portfolio instrument will be used to fair value the instrument only if no other valuation methodology is available or deemed appropriate, and it is determined that the purchase price fairly reflects the instrument’s current value.
For each portfolio security that has been fair valued pursuant to the policies adopted by the Board, the fair value price is compared against the last available and next available market quotations. The Valuation Committee reviews the results of such testing and fair valuation occurrences are reported to the Board.
3. Portfolio Securities and Investments in Derivatives
Portfolio Securities
Foreign Currency Transactions
To the extent that a Fund may invest in securities and/or contracts that are denominated in a currency other than U.S. dollars, the Funds will be subject to currency risk, which is the risk that an increase in the U.S. dollar relative to the foreign currency will reduce returns or portfolio value. Generally, when the U.S. dollar rises in value against a foreign currency, the Funds’ investments denominated in that currency will lose value because its currency is worth fewer U.S. dollars; the opposite effect occurs if the U.S. dollar falls in relative value. Investments and other assets and liabilities denominated in foreign currencies are converted into U.S. dollars on a spot (i.e. cash) basis at the spot rate prevailing in the foreign currency exchange market at the time of valuation. Purchases and sales of investments and income denominated in foreign currencies are translated into U.S. dollars on the respective dates of such transactions.
The books and records of the Funds are maintained in U.S. dollars. Foreign currencies, assets and liabilities are translated into U.S. dollars at 4:00 p.m. Eastern Time. Investment transactions, income and expenses are translated on the respective dates of such transactions. Net realized foreign currency gains and losses resulting from changes in exchange rates include foreign currency gains and losses between trade date and settlement date of the transactions, foreign currency transactions and the difference between the amounts of interest and dividends recorded on the books of the Funds and the amounts actually received.
The realized gains and losses resulting from changes in foreign currency exchange rates and changes in foreign exchange rates associated with (i) investments, (ii) investments in derivatives and (iii) other assets and liabilities are recognized as a component of “Net realized gain (loss) from investments and foreign currency” on the Statement of Operations, when applicable.
The unrealized gains and losses resulting from changes in foreign currency exchange rates and changes in foreign exchange rates associated with (i) investments and (ii) other assets and liabilities are recognized as a component of “Change in net unrealized appreciation (depreciation) of investments and foreign currency” on the Statement of Operations, when applicable. The unrealized gains and losses resulting from changes in foreign exchange rates associated with investments in derivatives are recognized as a component of the respective derivative’s related “Change in net unrealized appreciation (depreciation)” on the Statement of Operations, when applicable.
Repurchase Agreements
In connection with transactions in repurchase agreements, it is each Fund’s policy that its custodian take possession of the underlying collateral securities, the fair value of which exceeds the principal amount of the repurchase transaction, including accrued interest, at all times. If the counterparty defaults, and the fair value of the collateral declines, realization of the collateral may be delayed or limited.
Notes to Financial Statements (continued)
The following table presents the repurchase agreements for the Funds that are subject to netting agreements as of the end of the reporting period, and the collateral delivered related to those repurchase agreements.
| | | | | | | | | | | | | | |
| Fund | | Counterparty | | Short-Term
Investments, at Value | | | Collateral
Pledged (From)
Counterparty* | | | Net
Exposure | |
| Equity Long/Short | | Fixed Income Clearing Corporation | | $ | 3,790,915 | | | $ | (3,790,915 | ) | | $ | — | |
| Equity Market Neutral | | Fixed Income Clearing Corporation | | | 6,495,033 | | | | (6,495,033 | ) | | | — | |
| Growth | | Fixed Income Clearing Corporation | | | 617,316 | | | | (617,316 | ) | | | — | |
| Large Cap Growth | | Fixed Income Clearing Corporation | | | 167,795 | | | | (167,795 | ) | | | — | |
| * | As of the end of the reporting period, the value of the collateral pledged from the counterparty exceeded the value of the repurchase agreements. Refer to the Fund’s Portfolio of Investments for details on the repurchase agreements. |
Short Sale Transactions
Equity Long/Short, Equity Market Neutral and Large Cap Core Plus each pursue a “long/short” investment strategy, pursuant to which they sell securities short and may purchase additional long investments with some or all of the proceeds of the short sale transactions.
When the Funds sell a security short, they borrow the security from a third party and segregate assets as collateral to secure their obligation to return the security to the lender either upon closing out the short position or upon demand from the lender. Proceeds from short selling may be used to finance the purchase of additional securities for each Fund’s long portfolio. The amount of collateral required to be pledged to borrow a security is determined by reference to the market value of the security borrowed. The value of the collateral required to be pledged as of the end of the reporting period is disclosed in the Funds’ Portfolio of Investments. The Funds are obligated to pay the party from whom the securities were borrowed dividends declared on the stock by the issuer and such amounts are recognized as “Dividends expense on common stocks sold short” on the Statement of Operations. Short sales are valued daily, and the corresponding unrealized gains and losses are recognized as “Change in net unrealized appreciation (depreciation) of common stocks sold short” on the Statement of Operations. Liabilities for securities sold short are reported at market value on the Statement of Assets and Liabilities. Short sale transactions result in off-balance sheet risk because the ultimate obligation may exceed the related amounts shown on the Statement of Assets and Liabilities. The Funds will incur a loss if the price of the security increases between the date of the short sale and the date on which the Funds replace the borrowed security. The Funds’ losses on short sales are potentially unlimited because there is no upward limit on the price a borrowed security could attain. The Funds will realize a gain if the price of the security declines between those dates. Gains and losses from securities sold short are recognized as “Net realized gain (loss) from common stocks sold short” on the Statement of Operations.
Bank of America Merrill Lynch (“BAML”) facilitates the short sales transactions for the Funds. The Funds currently pay prime brokerage fees to BAML for its services for the Funds, which are recognized as “Prime broker expenses” on the Statement of Operations, when applicable.
Investments in Derivatives
Each Fund is authorized to invest in certain derivative instruments. The Funds record derivative instruments at fair value, with changes in fair value recognized on the Statement of Operations, when applicable. Even though the Funds’ investments in derivatives may represent economic hedges, they are not considered to be hedge transactions for financial reporting purposes.
Although the Funds are authorized to invest in derivative instruments, and may do so in the future, they did not make any such investments during the current fiscal period.
Market and Counterparty Credit Risk
In the normal course of business each Fund may invest in financial instruments and enter into financial transactions where risk of potential loss exists due to changes in the market (market risk) or failure of the other party to the transaction to perform (counterparty credit risk). The potential loss could exceed the value of the financial assets recorded on the financial statements. Financial assets, which potentially expose each Fund to counterparty credit risk, consist principally of cash due from counterparties on forward, option and swap transactions, when applicable. The extent of each Fund’s exposure to counterparty credit risk in respect to these financial assets approximates their carrying value as recorded on the Statement of Assets and Liabilities.
Each Fund helps manage counterparty credit risk by entering into agreements only with counterparties the Adviser believes have the financial resources to honor their obligations and by having the Adviser monitor the financial stability of the counterparties. Additionally, counterparties may be required to pledge collateral daily (based on the daily valuation of the financial asset) on behalf of each Fund with a value approximately equal to the amount of any unrealized gain above a pre-determined threshold. Reciprocally, when each Fund has an unrealized loss, the Funds have instructed the custodian to pledge assets of the Funds as collateral with a value approximately equal to the amount of the unrealized loss above a pre-determined threshold. Collateral pledges are monitored and subsequently adjusted if and when the valuations fluctuate, either up or down, by at least the pre-determined threshold amount.
4. Fund Shares
Transactions in Fund shares during the current and prior fiscal period were as follows:
| | | | | | | | | | | | | | | | |
| | | Year Ended
8/31/15 | | | Year Ended
8/31/14 | |
| Concentrated Core | | Shares | | | Amount | | | Shares | | | Amount | |
| Shares sold: | | | | | | | | | | | | | | | | |
Class A | | | 2,372,515 | | | $ | 66,296,117 | | | | 336,270 | | | $ | 8,238,842 | |
Class C | | | 904,844 | | | | 25,204,557 | | | | 54,938 | | | | 1,357,071 | |
Class I | | | 3,011,031 | | | | 84,301,612 | | | | 296,619 | | | | 7,401,719 | |
| Shares issued to shareholders due to reinvestment of distributions: | | | | | | | | | | | | | | | | |
Class A | | | 11,900 | | | | 322,682 | | | | 221 | | | | 5,148 | |
Class C | | | 2,005 | | | | 53,670 | | | | 7 | | | | 153 | |
Class I | | | 21,028 | | | | 576,457 | | | | 180 | | | | 4,179 | |
| | | | 6,323,323 | | | | 176,755,095 | | | | 688,235 | | | | 17,007,112 | |
| Shares redeemed: | | | | | | | | | | | | | | | | |
Class A | | | (652,505 | ) | | | (18,271,599 | ) | | | (42,443 | ) | | | (1,069,629 | ) |
Class C | | | (35,199 | ) | | | (993,597 | ) | | | (4,964 | ) | | | (124,805 | ) |
Class I | | | (1,381,414 | ) | | | (39,096,480 | ) | | | (33,480 | ) | | | (852,987 | ) |
| | | | (2,069,118 | ) | | | (58,361,676 | ) | | | (80,887 | ) | | | (2,047,421 | ) |
| Net increase (decrease) | | | 4,254,205 | | | $ | 118,393,419 | | | | 607,348 | | | $ | 14,959,691 | |
| | |
| | | Year Ended
8/31/15 | | | Year Ended
8/31/14 | |
| Core Dividend | | Shares | | | Amount | | | Shares | | | Amount | |
| Shares sold: | | | | | | | | | | | | | | | | |
Class A | | | 677,046 | | | $ | 17,471,941 | | | | 416,876 | | | $ | 9,764,323 | |
Class C | | | 181,535 | | | | 4,712,492 | | | | 81,299 | | | | 1,891,540 | |
Class I | | | 577,577 | | | | 14,930,446 | | | | 220,056 | | | | 5,367,974 | |
| Shares issued to shareholders due to reinvestment of distributions: | | | | | | | | | | | | | | | | |
Class A | | | 23,140 | | | | 583,565 | | | | 4,467 | | | | 106,813 | |
Class C | | | 4,942 | | | | 123,819 | | | | 557 | | | | 13,370 | |
Class I | | | 18,711 | | | | 472,612 | | | | 1,410 | | | | 34,396 | |
| | | | 1,482,951 | | | | 38,294,875 | | | | 724,665 | | | | 17,178,416 | |
| Shares redeemed: | | | | | | | | | | | | | | | | |
Class A | | | (165,390 | ) | | | (4,215,173 | ) | | | (129,948 | ) | | | (3,203,272 | ) |
Class C | | | (22,582 | ) | | | (573,886 | ) | | | (4,132 | ) | | | (102,457 | ) |
Class I | | | (102,674 | ) | | | (2,603,063 | ) | | | (19,235 | ) | | | (471,636 | ) |
| | | | (290,646 | ) | | | (7,392,122 | ) | | | (153,315 | ) | | | (3,777,365 | ) |
| Net increase (decrease) | | | 1,192,305 | | | $ | 30,902,753 | | | | 571,350 | | | $ | 13,401,051 | |
| | |
| | | Year Ended
8/31/15 | | | Year Ended
8/31/14 | |
| Equity Long/Short | | Shares | | | Amount | | | Shares | | | Amount | |
| Shares sold: | | | | | | | | | | | | | | | | |
Class A | | | 593,954 | | | $ | 19,697,958 | | | | 811,295 | | | $ | 24,840,498 | |
Class C | | | 154,640 | | | | 4,862,175 | | | | 149,104 | | | | 4,385,988 | |
Class I | | | 1,493,850 | | | | 50,150,549 | | | | 513,818 | | | | 16,220,815 | |
| Shares issued to shareholders due to reinvestment of distributions: | | | | | | | | | | | | | | | | |
Class A | | | 1,069 | | | | 35,095 | | | | 5,838 | | | | 177,757 | |
Class C | | | 428 | | | | 13,356 | | | | 2,488 | | | | 72,488 | |
Class I | | | 2,217 | | | | 73,967 | | | | 5,074 | | | | 156,803 | |
| | | | 2,246,158 | | | | 74,833,100 | | | | 1,487,617 | | | | 45,854,349 | |
| Shares redeemed: | | | | | | | | | | | | | | | | |
Class A | | | (265,615 | ) | | | (8,676,903 | ) | | | (398,923 | ) | | | (12,433,930 | ) |
Class C | | | (27,632 | ) | | | (861,007 | ) | | | (21,431 | ) | | | (631,302 | ) |
Class I | | | (385,716 | ) | | | (13,041,983 | ) | | | (178,739 | ) | | | (5,461,741 | ) |
| | | | (678,963 | ) | | | (22,579,893 | ) | | | (599,093 | ) | | | (18,526,973 | ) |
| Net increase (decrease) | | | 1,567,195 | | | $ | 52,253,207 | | | | 888,524 | | | $ | 27,327,376 | |
Notes to Financial Statements (continued)
| | | | | | | | | | | | | | | | |
| | | Year Ended
8/31/15 | | | Year Ended
8/31/14 | |
| Equity Market Neutral | | Shares | | | Amount | | | Shares | | | Amount | |
| Shares sold: | | | | | | | | | | | | | | | | |
Class A | | | 290,690 | | | $ | 6,267,867 | | | | 860,291 | | | $ | 18,329,244 | |
Class C | | | 31,840 | | | | 679,574 | | | | 90,246 | | | | 1,918,904 | |
Class I | | | 1,037,896 | | | | 22,343,491 | | | | 1,145,579 | | | | 24,450,062 | |
| Shares issued to shareholders due to reinvestment of distributions: | | | | | | | | | | | | | | | | |
Class A | | | 1,323 | | | | 29,023 | | | | 1,559 | | | | 33,527 | |
Class C | | | 285 | | | | 6,179 | | | | 371 | | | | 7,954 | |
Class I | | | 3,611 | | | | 79,505 | | | | 1,698 | | | | 36,535 | |
| | | | 1,365,645 | | | | 29,405,639 | | | | 2,099,744 | | | | 44,776,226 | |
| Shares redeemed: | | | | | | | | | | | | | | | | |
Class A | | | (242,965 | ) | | | (5,189,127 | ) | | | (530,276 | ) | | | (11,217,497 | ) |
Class C | | | (28,783 | ) | | | (613,845 | ) | | | (14,436 | ) | | | (304,501 | ) |
Class I | | | (937,711 | ) | | | (20,264,907 | ) | | | (257,987 | ) | | | (5,480,347 | ) |
| | | | (1,209,459 | ) | | | (26,067,879 | ) | | | (802,699 | ) | | | (17,002,345 | ) |
| Net increase (decrease) | | | 156,186 | | | $ | 3,337,760 | | | | 1,297,045 | | | $ | 27,773,881 | |
| | |
| | | Year Ended
8/31/15 | | | Year Ended
8/31/14 | |
| Growth | | Shares | | | Amount | | | Shares | | | Amount | |
| Shares sold: | | | | | | | | | | | | | | | | |
Class A | | | 88,331 | | | $ | 2,648,878 | | | | 179,196 | | | $ | 4,987,194 | |
Class C | | | 60,647 | | | | 1,685,644 | | | | 152,552 | | | | 4,022,432 | |
Class R3 | | | 202 | | | | 6,079 | | | | — | | | | — | |
Class I | | | 702,991 | | | | 21,615,333 | | | | 401,076 | | | | 11,572,099 | |
| Shares issued to shareholders due to reinvestment of distributions: | | | | | | | | | | | | | | | | |
Class A | | | 19,192 | | | | 547,540 | | | | 10,821 | | | | 293,357 | |
Class C | | | 21,812 | | | | 580,653 | | | | 3,318 | | | | 85,086 | |
Class R3 | | | — | | | | — | | | | — | | | | — | |
Class I | | | 89,761 | | | | 2,596,783 | | | | 11,420 | | | | 312,975 | |
| | | | 982,936 | | | | 29,680,910 | | | | 758,383 | | | | 21,273,143 | |
| Shares redeemed: | | | | | | | | | | | | | | | | |
Class A | | | (312,365 | ) | | | (9,489,916 | ) | | | (237,482 | ) | | | (6,713,265 | ) |
Class C | | | (57,044 | ) | | | (1,590,577 | ) | | | (48,016 | ) | | | (1,279,831 | ) |
Class R3 | | | (52 | ) | | | (1,559 | ) | | | — | | | | — | |
Class I | | | (585,673 | ) | | | (17,729,600 | ) | | | (231,962 | ) | | | (6,574,283 | ) |
| | | | (955,134 | ) | | | (28,811,652 | ) | | | (517,460 | ) | | | (14,567,379 | ) |
| Net increase (decrease) | | | 27,802 | | | $ | 869,258 | | | | 240,923 | | | $ | 6,705,764 | |
| | |
| | | Year Ended
8/31/15 | | | Year Ended
8/31/14 | |
| Large Cap Core | | Shares | | | Amount | | | Shares | | | Amount | |
| Shares sold: | | | | | | | | | | | | | | | | |
Class A | | | 1,442,539 | | | $ | 38,956,437 | | | | 340,195 | | | $ | 8,223,349 | |
Class C | | | 1,448,568 | | | | 38,899,575 | | | | 183,096 | | | | 4,436,235 | |
Class I | | | 5,124,457 | | | | 138,793,248 | | | | 1,697,984 | | | | 42,603,465 | |
| Shares issued to shareholders due to reinvestment of distributions: | | | | | | | | | | | | | | | | |
Class A | | | 10,276 | | | | 268,128 | | | | 1,066 | | | | 24,114 | |
Class C | | | 7,729 | | | | 199,577 | | | | 457 | | | | 10,208 | |
Class I | | | 46,821 | | | | 1,229,504 | | | | 439 | | | | 9,956 | |
| | | | 8,080,390 | | | | 218,346,469 | | | | 2,223,237 | | | | 55,307,327 | |
| Shares redeemed: | | | | | | | | | | | | | | | | |
Class A | | | (235,480 | ) | | | (6,350,713 | ) | | | (111,403 | ) | | | (2,794,661 | ) |
Class C | | | (118,466 | ) | | | (3,164,057 | ) | | | (4,320 | ) | | | (107,347 | ) |
Class I | | | (1,338,334 | ) | | | (35,895,413 | ) | | | (109,580 | ) | | | (2,784,994 | ) |
| | | | (1,692,280 | ) | | | (45,410,183 | ) | | | (225,303 | ) | | | (5,687,002 | ) |
| Net increase (decrease) | | | 6,388,110 | | | $ | 172,936,286 | | | | 1,997,934 | | | $ | 49,620,325 | |
| | | | | | | | | | | | | | | | |
| | | Year Ended
8/31/15 | | | Year Ended
8/31/14 | |
| Large Cap Core Plus | | Shares | | | Amount | | | Shares | | | Amount | |
| Shares sold: | | | | | | | | | | | | | | | | |
Class A | | | 874,874 | | | $ | 23,363,281 | | | | 596,669 | | | $ | 14,040,983 | |
Class C | | | 542,240 | | | | 14,308,551 | | | | 126,022 | | | | 3,036,506 | |
Class I | | | 2,509,047 | | | | 66,615,484 | | | | 805,840 | | | | 19,967,816 | |
| Shares issued to shareholders due to reinvestment of distributions: | | | | | | | | | | | | | | | | |
Class A | | | 25,523 | | | | 658,502 | | | | 2,380 | | | | 54,474 | |
Class C | | | 10,641 | | | | 271,761 | | | | 236 | | | | 5,384 | |
Class I | | | 70,105 | | | | 1,816,003 | | | | 5,464 | | | | 125,633 | |
| | | | 4,032,430 | | | | 107,033,582 | | | | 1,536,611 | | | | 37,230,796 | |
| Shares redeemed: | | | | | | | | | | | | | | | | |
Class A | | | (481,277 | ) | | | (12,670,678 | ) | | | (353,364 | ) | | | (8,811,627 | ) |
Class C | | | (25,955 | ) | | | (670,827 | ) | | | (7,915 | ) | | | (198,314 | ) |
Class I | | | (1,079,281 | ) | | | (28,323,550 | ) | | | (215,146 | ) | | | (5,464,791 | ) |
| | | | (1,586,513 | ) | | | (41,665,055 | ) | | | (576,425 | ) | | | (14,474,732 | ) |
| Net increase (decrease) | | | 2,445,917 | | | $ | 65,368,527 | | | | 960,186 | | | $ | 22,756,064 | |
| | |
| | | Year Ended
8/31/15 | | | Year Ended
8/31/14 | |
| Large Cap Growth | | Shares | | | Amount | | | Shares | | | Amount | |
| Shares sold: | | | | | | | | | | | | | | | | |
Class A | | | 959,396 | | | $ | 25,308,076 | | | | 556,355 | | | $ | 12,871,241 | |
Class C | | | 261,754 | | | | 6,906,543 | | | | 83,787 | | | | 1,954,686 | |
Class I | | | 1,508,405 | | | | 40,203,063 | | | | 503,164 | | | | 12,573,239 | |
| Shares issued to shareholders due to reinvestment of distributions: | | | | | | | | | | | | | | | | |
Class A | | | 19,074 | | | | 481,971 | | | | 6,320 | | | | 143,696 | |
Class C | | | 2,262 | | | | 56,594 | | | | 241 | | | | 5,437 | |
Class I | | | 18,658 | | | | 473,726 | | | | 275 | | | | 6,266 | |
| | | | 2,769,549 | | | | 73,429,973 | | | | 1,150,142 | | | | 27,554,565 | |
| Shares redeemed: | | | | | | | | | | | | | | | | |
Class A | | | (142,352 | ) | | | (3,752,445 | ) | | | (204,534 | ) | | | (5,108,915 | ) |
Class C | | | (42,218 | ) | | | (1,102,348 | ) | | | (4,495 | ) | | | (108,734 | ) |
Class I | | | (259,650 | ) | | | (6,958,461 | ) | | | (18,670 | ) | | | (468,995 | ) |
| | | | (444,220 | ) | | | (11,813,254 | ) | | | (227,699 | ) | | | (5,686,644 | ) |
| Net increase (decrease) | | | 2,325,329 | | | $ | 61,616,719 | | | | 922,443 | | | $ | 21,867,921 | |
Notes to Financial Statements (continued)
| | | | | | | | | | | | | | | | |
| | | Year Ended
8/31/15 | | | Year Ended
8/31/14 | |
| Large Cap Value | | Shares | | | Amount | | | Shares | | | Amount | |
| Shares sold: | | | | | | | | | | | | | | | | |
Class A | | | 1,172,532 | | | $ | 30,517,179 | | | | 538,283 | | | $ | 13,947,182 | |
Class A – automatic conversion of Class B shares | | | — | | | | — | | | | 11,382 | | | | 284,664 | |
Class B – exchanges | | | — | | | | — | | | | 365 | | | | 8,721 | |
Class C | | | 554,774 | | | | 14,010,964 | | | | 315,220 | | | | 7,989,393 | |
Class R3 | | | 6,826 | | | | 170,216 | | | �� | 1,375 | | | | 36,418 | |
Class I | | | 2,408,463 | | | | 62,933,090 | | | | 2,108,965 | | | | 57,166,399 | |
| Shares issued to shareholders due to reinvestment of distributions: | | | | | | | | | | | | | | | | |
Class A | | | 1,149,064 | | | | 28,468,365 | | | | 1,052,056 | | | | 26,162,746 | |
Class B | | | — | | | | — | | | | 599 | | | | 14,310 | |
Class C | | | 109,023 | | | | 2,575,721 | | | | 78,409 | | | | 1,872,804 | |
Class I | | | 446,008 | | | | 11,139,170 | | | | 192,451 | | | | 4,817,455 | |
| | | | 5,846,690 | | | | 149,814,705 | | | | 4,299,105 | | | | 112,300,092 | |
| Shares redeemed: | | | | | | | | | | | | | | | | |
Class A | | | (1,382,590 | ) | | | (35,629,587 | ) | | | (1,142,606 | ) | | | (30,000,384 | ) |
Class B | | | — | | | | — | | | | (17,155 | ) | | | (444,092 | ) |
Class B – automatic conversion to Class A shares | | | — | | | | — | | | | (11,816 | ) | | | (284,664 | ) |
Class C | | | (244,176 | ) | | | (6,062,351 | ) | | | (149,422 | ) | | | (3,807,070 | ) |
Class R3 | | | (1,784 | ) | | | (46,538 | ) | | | (59 | ) | | | (1,554 | ) |
Class I | | | (2,176,486 | ) | | | (54,771,429 | ) | | | (410,142 | ) | | | (10,741,902 | ) |
| | | | (3,805,036 | ) | | | (96,509,905 | ) | | | (1,731,200 | ) | | | (45,279,666 | ) |
| Net increase (decrease) | | | 2,041,654 | | | $ | 53,304,800 | | | | 2,567,905 | | | $ | 67,020,426 | |
5. Investment Transactions
Long-term purchases and sales (including transactions for common stocks sold short, where applicable) during the current fiscal period, were as follows:
| | | | | | | | | | | | | | | | | | | | |
| | | Concentrated
Core | | | Core
Dividend | | | Equity Long/
Short | | | Equity Market
Neutral | | | Growth | |
| Purchases | | $ | 214,294,545 | | | $ | 90,474,671 | | | $ | 397,560,943 | | | $ | 154,073,294 | | | $ | 32,783,146 | |
| Sales | | | 93,539,976 | | | | 59,999,531 | | | | 351,614,342 | | | | 146,883,219 | | | | 33,462,924 | |
| | | | | | | | | | | | | | | | |
| | | Large Cap
Core | | | Large Cap
Core Plus | | | Large Cap
Growth | | | Large Cap
Value | |
| Purchases | | $ | 361,339,816 | | | $ | 311,972,685 | | | $ | 147,728,178 | | | $ | 706,615,600 | |
| Sales | | | 186,102,858 | | | | 247,554,089 | | | | 86,582,046 | | | | 699,558,188 | |
6. Income Tax Information
Each Fund is a separate taxpayer for federal income tax purposes. Each Fund intends to distribute substantially all of its net investment income and net capital gains to shareholders and to otherwise comply with the requirements of Subchapter M of the Internal Revenue Code applicable to regulated investment companies. Therefore, no federal income tax provision is required.
For all open tax years and all major taxing jurisdictions, management of the Funds has concluded that there are no significant uncertain tax positions that would require recognition in the financial statements. Open tax years are those that are open for examination by taxing authorities (i.e., generally the last four tax year ends and the interim tax period since then). Furthermore, management of the Funds is also not aware of any tax positions for which it is reasonably possible that the total amounts of unrecognized tax benefits will significantly change in the next twelve months.
The following information is presented on an income tax basis. Differences between amounts for financial statement and federal income tax purposes are primarily due to timing differences in recognizing certain gains and losses on investment transactions. To the extent that differences arise that are permanent in nature, such amounts are reclassified within the capital accounts as detailed below. Temporary differences do not require reclassification. Temporary and permanent differences do not impact the NAVs of the Funds.
As of August 31, 2015, the cost and unrealized appreciation (depreciation) of investments (excluding common stocks sold short), as determined on a federal income tax basis, were as follows:
| | | | | | | | | | | | | | | | | | | | |
| | | Concentrated
Core | | | Core
Dividend | | | Equity
Long/Short | | | Equity Market
Neutral | | | Growth | |
| Cost of investments | | $ | 140,314,369 | | | $ | 46,511,573 | | | $ | 143,699,971 | | | $ | 51,662,953 | | | $ | 40,211,761 | |
| Gross unrealized: | | | | | | | | | | | | | | | | | | | | |
Appreciation | | $ | 3,452,202 | | | $ | 1,674,672 | | | $ | 5,531,267 | | | $ | 2,409,881 | | | $ | 8,574,467 | |
Depreciation | | | (11,206,941 | ) | | | (3,815,030 | ) | | | (8,026,824 | ) | | | (4,490,598 | ) | | | (1,790,422 | ) |
| Net unrealized appreciation (depreciation) of investments | | $ | (7,754,739 | ) | | $ | (2,140,358 | ) | | $ | (2,495,557 | ) | | $ | (2,080,717 | ) | | $ | 6,784,045 | |
| | | | | | | | | | | | | | | | |
| | | Large Cap
Core | | | Large Cap
Core Plus | | | Large Cap
Growth | | | Large Cap
Value | |
| Cost of investments | | $ | 239,654,439 | | | $ | 144,694,231 | | | $ | 99,530,007 | | | $ | 416,339,633 | |
| Gross unrealized: | | | | | | | | | | | | | | | | |
Appreciation | | $ | 9,277,272 | | | $ | 8,003,342 | | | $ | 4,716,119 | | | $ | 24,766,999 | |
Depreciation | | | (19,123,621 | ) | | | (12,806,658 | ) | | | (6,756,476 | ) | | | (39,841,230 | ) |
| Net unrealized appreciation (depreciation) of investments | | $ | (9,846,349 | ) | | $ | (4,803,316 | ) | | $ | (2,040,357 | ) | | $ | (15,074,231 | ) |
Permanent differences, primarily due to investments in short sales, real estate investment trust adjustments, investments in partnerships and tax equalization resulted in reclassifications among the Funds’ components of net assets as of August 31, 2015, the Funds’ tax year end, as follows:
| | | | | | | | | | | | | | | | | | | | |
| | | Concentrated
Core | | | Core
Dividend | | | Equity
Long/Short | | | Equity Market
Neutral | | | Growth | |
| Capital paid-in | | $ | — | | | $ | 1 | | | $ | (291,765 | ) | | $ | (271,672 | ) | | $ | 1,128,263 | |
| Undistributed (Over-distribution of) net investment income | | | — | | | | (2,453 | ) | | | 367,989 | | | | 304,364 | | | | — | |
| Accumulated net realized gain (loss) | | | — | | | | 2,452 | | | | (76,224 | ) | | | (32,692 | ) | | | (1,128,263 | ) |
| | | | | | | | | | | | | | | | |
| | | Large Cap
Core | | | Large Cap
Core Plus | | | Large Cap
Growth | | | Large Cap
Value | |
| Capital paid-in | | $ | 282,654 | | | $ | — | | | $ | — | | | $ | 3,067,906 | |
| Undistributed (Over-distribution of) net investment income | | | (4,351 | ) | | | 33,629 | | | | 2,700 | | | | 105,315 | |
| Accumulated net realized gain (loss) | | | (278,303 | ) | | | (33,629 | ) | | | (2,700 | ) | | | (3,173,221 | ) |
The tax components of undistributed net ordinary income and net long-term capital gains as of August 31, 2015, the Funds’ tax year end, were as follows:
| | | | | | | | | | | | | | | | | | | | |
| | | Concentrated
Core | | | Core
Dividend | | | Equity
Long/Short | | | Equity Market
Neutral | | | Growth | |
| Undistributed net ordinary income1 | | $ | 4,509,573 | | | $ | 585,303 | | | $ | — | | | $ | — | | | $ | 840,946 | |
| Undistributed net long-term capital gains | | | 835,142 | | | | 140,642 | | | | — | | | | 369,761 | | | | 4,709,920 | |
| | | | | | | | | | | | | | | | |
| | | Large Cap
Core | | | Large Cap
Core Plus | | | Large Cap
Growth | | | Large Cap
Value | |
| Undistributed net ordinary income1 | | $ | 3,893,593 | | | $ | 1,480,675 | | | $ | 2,090,022 | | | $ | 13,676,336 | |
| Undistributed net long-term capital gains | | | 1,239,710 | | | | 2,393,002 | | | | 1,755,290 | | | | 23,353,667 | |
| 1 | Net ordinary income consists of net taxable income derived from dividends, interest, and net short-term capital gains, if any. |
The tax character of distributions paid during the Funds’ tax years ended August 31, 2015 and August 31, 2014, was designated for purposes of the dividends paid deduction as follows:
| | | | | | | | | | | | | | | | | | | | |
| 2015 | | Concentrated Core | | | Core Dividend | | | Equity
Long/Short | | | Equity Market Neutral | | | Growth | |
| Distributions from net ordinary income1 | | $ | 923,688 | | | $ | 1,211,713 | | | $ | — | | | $ | 47,365 | | | $ | 68,225 | |
| Distributions from net long-term capital gains | | | 69,574 | | | | 37,745 | | | | 123,104 | | | | 99,835 | | | | 4,368,689 | |
| | | | | | | | | | | | | | | | |
| 2015 | | Large Cap
Core | | | Large Cap
Core Plus | | | Large Cap
Growth | | | Large Cap
Value | |
| Distributions from net ordinary income1 | | $ | 2,448,979 | | | $ | 3,149,388 | | | $ | 2,228,618 | | | $ | 35,484,644 | |
| Distributions from net long-term capital gains | | | 72,389 | | | | 128,652 | | | | 6,695 | | | | 15,620,261 | |
Notes to Financial Statements (continued)
| | | | | | | | | | | | | | | | | | | | |
| | | | | |
2014 | | Concentrated
Core | | | Core
Dividend | | | Equity
Long/Short | | | Equity Market
Neutral | | | Growth | |
| Distributions from net ordinary income1 | | $ | 13,704 | | | $ | 191,604 | | | $ | 4,470 | | | $ | 187,398 | | | $ | 139,544 | |
| Distributions from net long-term capital gains | | | — | | | | 181 | | | | 408,065 | | | | — | | | | 744,523 | |
| | | | | |
2014 | | | | | Large Cap
Core | | | Large Cap
Core Plus | | | Large Cap
Growth | | | Large Cap
Value | |
| Distributions from net ordinary income1 | | | | | | $ | 316,087 | | | $ | 437,488 | | | $ | 442,877 | | | $ | 20,131,762 | |
| Distributions from net long-term capital gains | | | | | | | — | | | | — | | | | — | | | | 20,433,885 | |
| 1 | Net ordinary income consists of net taxable income derived from dividends, interest, and net short-term capital gains, if any. |
As of August 31, 2015, the Funds’ tax year end, the Funds did not have any unused capital loss carryforwards available for federal income tax purposes to be applied against future capital gains.
The following Funds have elected to defer late-year losses in accordance with federal income tax rules. These losses are treated as having arisen on the first day of the following fiscal year. The following Funds have elected to defer losses as follows:
| | | | | | | | |
| | | Equity
Long/Short | | | Equity Market
Neutral | |
| Post-October capital losses2 | | $ | 417,869 | | | $ | — | |
| Late-year ordinary losses3 | | | 180,487 | | | | 304,747 | |
| 2 | Capital losses incurred from November 1, 2014 through August 31, 2015, the Funds’ tax year end. |
| 3 | Ordinary losses incurred from January 1, 2015 through August 31, 2015, and/or specified losses incurred from November 1, 2014 through August 31, 2015. |
7. Management Fees and Other Transactions with Affiliates
Each Fund’s management fee compensates the Adviser for overall investment advisory and administrative services and general office facilities. The Sub-Adviser is compensated for its services to the Funds from the management fees paid to the Adviser.
Each Fund’s management fee consists of two components – a fund-level fee, based only on the amount of assets within each individual Fund, and a complex-level fee, based on the aggregate amount of all eligible fund assets managed by the Adviser. This pricing structure enables each Fund’s shareholders to benefit from growth in the assets within their respective Fund as well as from growth in the amount of complex-wide assets managed by the Adviser.
The annual Fund-level fee, payable monthly, for each Fund is calculated according to the following schedule:
| | | | | | | | | | | | | | | | | | | | | | | | | | | | | | | | | | | | |
| Average Daily Net Assets | | Concentrated
Core | | | Core
Dividend | | | Equity
Long/Short | | | Equity Market
Neutral | | | Growth | | | Large Cap
Core | | | Large Cap
Core Plus | | | Large Cap
Growth | | | Large Cap
Value | |
| For the first $125 million | | | 0.6500 | % | | | 0.5500 | % | | | 1.1000 | % | | | 1.1000 | % | | | 0.5000 | % | | | 0.5500 | % | | | 1.0000 | % | | | 0.5500 | % | | | 0.5500 | % |
| For the next $125 million | | | 0.6375 | | | | 0.5375 | | | | 1.0875 | | | | 1.0875 | | | | 0.4875 | | | | 0.5375 | | | | 0.9875 | | | | 0.5375 | | | | 0.5375 | |
| For the next $250 million | | | 0.6250 | | | | 0.5250 | | | | 1.0750 | | | | 1.0750 | | | | 0.4750 | | | | 0.5250 | | | | 0.9750 | | | | 0.5250 | | | | 0.5250 | |
| For the next $500 million | | | 0.6125 | | | | 0.5125 | | | | 1.0625 | | | | 1.0625 | | | | 0.4625 | | | | 0.5125 | | | | 0.9625 | | | | 0.5125 | | | | 0.5125 | |
| For the next $1 billion | | | 0.6000 | | | | 0.5000 | | | | 1.0500 | | | | 1.0500 | | | | 0.4500 | | | | 0.5000 | | | | 0.9500 | | | | 0.5000 | | | | 0.5000 | |
| For net assets over $2 billion | | | 0.5750 | | | | 0.4750 | | | | 1.0250 | | | | 1.0250 | | | | 0.4250 | | | | 0.4750 | | | | 0.9250 | | | | 0.4750 | | | | 0.4750 | |
The annual complex-level fee, payable monthly, for each Fund is calculated according to the following schedule:
| | | | |
| Complex-Level Asset Breakpoint Level* | | Effective Rate at Breakpoint Level | |
| $55 billion | | | 0.2000 | % |
| $56 billion | | | 0.1996 | |
| $57 billion | | | 0.1989 | |
| $60 billion | | | 0.1961 | |
| $63 billion | | | 0.1931 | |
| $66 billion | | | 0.1900 | |
| $71 billion | | | 0.1851 | |
| $76 billion | | | 0.1806 | |
| $80 billion | | | 0.1773 | |
| $91 billion | | | 0.1691 | |
| $125 billion | | | 0.1599 | |
| $200 billion | | | 0.1505 | |
| $250 billion | | | 0.1469 | |
| $300 billion | | | 0.1445 | |
| * | The complex-level fee is calculated based upon the aggregate daily “eligible assets” of all Nuveen funds. Eligible assets do not include assets attributable to investments in other Nuveen funds or assets in excess of $2 billion added to the Nuveen fund complex in connection with the Adviser’s assumption of the management of the former First American Funds effective January 1, 2011. Eligible assets include closed-end fund assets managed by the Adviser that are attributable to certain types of leverage. For these purposes, leverage includes the closed-end funds’ use of preferred stock and borrowings and certain investments in the residual interest certificates (also called inverse floating rate securities) in tender option bond (TOB) trusts, including the portion of assets held by a TOB trust that has been effectively financed by the trust’s issuance of floating rate securities, subject to an agreement by the Adviser as to certain funds to limit the amount of such assets for determining eligible assets in certain circumstances. As of August 31, 2015, the complex-level fee for each Fund was 0.1643%. |
The Adviser has agreed to waive fees and/or reimburse expenses (“Expense Cap”) of each Fund so that total annual Fund operating expenses (excluding 12b-1 distribution and/or service fees, interest expenses, taxes, acquired fund fees and expenses, fees incurred in acquiring and disposing of portfolio securities (including prime broker fees and charges on short sales), dividends expense on securities sold short and extraordinary expenses) do not exceed the average daily net assets of any class of Fund shares in the amounts and for the time periods stated in the following table:
| | | | | | | | | | | | |
| Fund | | Temporary
Expense Cap | | | Temporary
Expense Cap
Expiration Date | | | Permanent
Expense Cap | |
| Concentrated Core | | | 1.00 | % | | | December 31, 2016 | | | | N/A | |
| Core Dividend | | | 0.95 | | | | December 31, 2016 | | | | N/A | |
| Equity Long/Short | | | 1.40 | | | | December 31, 2016 | | | | N/A | |
| Equity Market Neutral | | | 1.40 | | | | December 31, 2016 | | | | N/A | |
| Growth | | | 1.00 | | | | September 30, 2016 | | | | 1.40 | % |
| Large Cap Core | | | 0.95 | | | | December 31, 2016 | | | | N/A | |
| Large Cap Core Plus | | | 1.25 | | | | December 31, 2016 | | | | N/A | |
| Large Cap Growth | | | 0.95 | | | | December 31, 2016 | | | | N/A | |
| Large Cap Value | | | N/A | | | | N/A | | | | 1.20 | |
N/A – Not applicable.
Neither Trust pays compensation directly to those of its trustees who are affiliated with the Adviser or to its officers, all of whom receive remuneration for their services to each Trust from the Adviser or its affiliates. The Board has adopted a deferred compensation plan for independent trustees that enables trustees to elect to defer receipt of all or a portion of the annual compensation they are entitled to receive from certain Nuveen-advised funds. Under the plan, deferred amounts are treated as though equal dollar amounts had been invested in shares of select Nuveen-advised funds.
During the current fiscal period, Nuveen Securities, LLC (the “Distributor”), a wholly-owned subsidiary of Nuveen, collected sales charges on purchases of Class A Shares, the majority of which were paid out as concessions to financial intermediaries as follows:
| | | | | | | | | | | | | | | | | | | | |
| | | Concentrated
Core | | | Core
Dividend | | | Equity
Long/Short | | | Equity Market
Neutral | | | Growth | |
| Sales charges collected (Unaudited) | | $ | 353,115 | | | $ | 207,599 | | | $ | 192,715 | | | $ | 57,516 | | | $ | 35,290 | |
| Paid to financial intermediaries (Unaudited) | | | 309,926 | | | | 181,646 | | | | 174,027 | | | | 52,273 | | | | 30,872 | |
| | | | | |
| | | | | | Large Cap
Core | | | Large Cap
Core Plus | | | Large Cap
Growth | | | Large Cap
Value | |
| Sales charges collected (Unaudited) | | | | | | $ | 446,709 | | | $ | 147,389 | | | $ | 187,159 | | | $ | 258,812 | |
| Paid to financial intermediaries (Unaudited) | | | | | | | 394,211 | | | | 129,960 | | | | 169,645 | | | | 229,406 | |
The Distributor also received 12b-1 service fees on Class A Shares, substantially all of which were paid to compensate financial intermediaries for providing services to shareholders relating to their investments.
Notes to Financial Statements (continued)
During the current fiscal period, the Distributor compensated financial intermediaries directly with commission advances at the time of purchase as follows:
| | | | | | | | | | | | | | | | | | | | |
| | | Concentrated
Core | | | Core
Dividend | | | Equity
Long/Short | | | Equity Market
Neutral | | | Growth | |
| Commission advances (Unaudited) | | $ | 241,599 | | | $ | 43,022 | | | $ | 89,008 | | | $ | 22,600 | | | $ | 11,000 | |
| | | | | |
| | | | | | Large Cap
Core | | | Large Cap
Core Plus | | | Large Cap
Growth | | | Large Cap
Value | |
| Commission advances (Unaudited) | | | | | | $ | 395,548 | | | $ | 134,206 | | | $ | 109,021 | | | $ | 131,281 | |
To compensate for commissions advanced to financial intermediaries all 12b-1 service and distribution fees collected on Class C Shares during the first year following a purchase are retained by the Distributor. During the current fiscal period, the Distributor retained such 12b-1 fees as follows:
| | | | | | | | | | | | | | | | | | | | |
| | | Concentrated
Core | | | Core
Dividend | | | Equity
Long/Short | | | Equity Market
Neutral | | | Growth | |
| 12b-1 fees retained (Unaudited) | | $ | 110,074 | | | $ | 30,691 | | | $ | 36,690 | | | $ | 10,296 | | | $ | 21,856 | |
| | | | | |
| | | | | | Large Cap
Core | | | Large Cap
Core Plus | | | Large Cap
Growth | | | Large Cap
Value | |
| 12b-1 fees retained (Unaudited) | | | | | | $ | 211,596 | | | $ | 93,630 | | | $ | 40,408 | | | $ | 96,698 | |
The remaining 12b-1 fees charged to the Funds were paid to compensate financial intermediaries for providing services to shareholders relating to their investments.
The Distributor also collected and retained CDSC on share redemptions during the current fiscal period, as follows:
| | | | | | | | | | | | | | | | | | | | |
| | | Concentrated
Core | | | Core
Dividend | | | Equity
Long/Short | | | Equity Market
Neutral | | | Growth | |
| CDSC retained (Unaudited) | | $ | 1,727 | | | $ | 661 | | | $ | 1,939 | | | $ | 986 | | | $ | 918 | |
| | | | | |
| | | | | | Large Cap
Core | | | Large Cap
Core Plus | | | Large Cap
Growth | | | Large Cap
Value | |
| CDSC retained (Unaudited) | | | | | | $ | 9,450 | | | $ | 2,221 | | | $ | 2,025 | | | $ | 7,056 | |
As of the end of the reporting period, Nuveen owned shares of the following Funds, as follows:
| | | | | | | | | | | | |
| | | Core
Dividend | | | Growth | | | Large Cap
Value | |
| Class A Shares | | | 2,013 | | | | — | | | | — | |
| Class C Shares | | | 2,015 | | | | — | | | | — | |
| Class R3 Shares | | | N/A | | | | 2,125 | | | | 2,126 | |
| Class I Shares | | | 36,228 | | | | — | | | | — | |
N/A – Fund does not offer share class.
8. Borrowing Arrangements
During the current fiscal period, the Funds participated in an unsecured bank line of credit (“Unsecured Credit Line”) under which outstanding balances would bear interest at a variable rate. On December 31, 2014, Large Cap Core and Large Cap Value utilized $781,666 and $1,014,667, respectively, of the Unsecured Credit Line at an annualized interest rate of 1.34% on its respective outstanding balance. The remaining Funds in this report did not draw on this Unsecured Credit Line during the current fiscal period.
During July 2015, the Funds, along with certain other funds managed by the Adviser (“Participating Funds”), established a 364-day, $2.53 billion standby credit facility with a group of lenders, under which the Participating Funds may borrow for various purposes other than leveraging for investment purposes. This credit agreement replaces the Unsecured Credit Line described above. A large portion of this facility’s capacity (and its associated costs as described below) is currently dedicated for use by a small number of Participating Funds, which does not include any of the Funds covered by this shareholder report. The remaining capacity under the facility (and the corresponding portion of the facility’s annual costs) is separately dedicated to most of the other open-end funds in the Nuveen fund family, including all of the Funds covered by this shareholder report, along with a number of Nuveen closed-end funds. The credit facility expires in July 2016 unless extended or renewed.
The credit facility has the following terms: a fee of 0.15% per annum on unused commitment amounts, and interest at a rate equal to the higher of (a) one-month LIBOR (London Inter-Bank Offered Rate) plus 1.25% per annum or (b) the Fed Funds rate plus 1.25% per annum on amounts borrowed.
Participating Funds paid administration, legal and arrangement fees, which are recognized as a component of “other expenses” on the Statement of Operations, and along with commitment fees, have been allocated among such participating Funds based upon the relative proportions of the facility’s aggregate capacity reserved for them and other factors deemed relevant by the Adviser and the Board of each Participating Fund.
9. New Accounting Pronouncement
Financial Accounting Standards Board (“FASB”) Transfers and Servicing (Topic 860): Repurchase-to-Maturity Transactions, Repurchase Financings, and Disclosures
In June 2014, the FASB issued Accounting Standards Update (“ASU”) 2014-11, Transfers and Servicing (Topic 860): Repurchase-to-Maturity Transactions, Repurchase Financings, and Disclosures” (“ASU 2014-11”), that expanded secured borrowing accounting for certain reverse repurchase agreements. ASU 2014-11 also sets forth additional disclosure requirements for certain transactions accounted for as sales in order to provide financial statement users with information to compare to similar transactions accounted for as secured borrowings. ASU 2014-11 is effective prospectively for annual periods beginning after December 15, 2014, and interim periods beginning after March 15, 2015. Management is currently evaluating the impact, if any, of ASU 2014-11 on the Funds’ financial statement disclosures.
10. Subsequent Events
Change in Contingent Deferred Sales Charge (CDSC) Schedule
Effective November 1, 2015, shareholders purchasing $1 million or more of Class A Shares at NAV without an up-front sales charge will be assessed a CDSC of 1.00% on any shares redeemed within eighteen months of purchase, unless the redemption is eligible for a CDSC reduction or waiver as specified in the Funds’ statement of additional information.
Additional
Fund Information (Unaudited)
| | | | | | | | | | |
| | | | | |
| | Fund Manager Nuveen Fund Advisors, LLC 333 West Wacker Drive Chicago, IL 60606 Sub-Adviser Nuveen Asset Management, LLC 333 West Wacker Drive Chicago, IL 60606 | | Independent Registered
Public Accounting Firm KPMG LLP Chicago, IL 60601 Custodian State Street Bank & Trust Company Boston, MA 02111 | | Legal Counsel Chapman and Cutler LLP Chicago, IL 60603 | | Transfer Agent and
Shareholder Services Boston Financial Data Services Nuveen Investor Services P.O. Box 8530 Boston, MA 02266-8530 (800) 257-8787 | | |
| | | | | | | | | | | | | | | | | | | | | | |
| | | | | | | | | |
| | | | | | | | | | | | | | | | | | |
| |
| | Long-Term Capital Gain Distributions: The Funds hereby designate as long-term capital gain dividends, pursuant to Internal Revenue Code Section 852(b)(3), the amount shown in the accompanying table or, if greater, the amount necessary to reduce earnings and profits of the Funds related to net capital gain to zero for the tax year ended August 31, 2015. |
| | | | | | | | | | | |
| | | | | Concentrated
Core | | Core
Dividend | | Equity
Long/Short | | Equity
Market Neutral | | Growth | | Large Cap
Core | | Large Cap
Core Plus | | Large Cap
Growth | | Large Cap
Value | | |
| | Long-Term Capital Gain Distributions | | $69,574 | | $37,745 | | $123,104 | | $99,835 | | $5,496,951 | | $355,043 | | $128,652 | | $6,695 | | $18,688,168 | | |
| |
| | Distribution Information: The following Funds hereby designate their percentages of dividends paid from net ordinary income as dividends qualifying for the 70% dividends received deduction (“DRD”) for corporations and their percentages as qualified dividend income (“QDI”) for individuals under Section 1(h)(11) of the Internal Revenue Code as shown in the accompanying table. The actual qualified dividend income distributions will be reported to shareholders on Form 1099-DIV which will be sent to shareholders shortly after calendar year end. |
| | | | | | | | | | | | | | | | | | | | |
| | | | | | | | | | |
| | | | | Concentrated
Core | | Core
Dividend | | Equity
Market Neutral | | Growth | | Large Cap
Core | | Large Cap
Core Plus | | Large Cap
Growth | | Large Cap
Value | | |
| | % QDI | | 38% | | 40% | | 100% | | 100% | | 34% | | 33% | | 24% | | 21% | | |
| | % DRD | | 39% | | 40% | | 100% | | 100% | | 34% | | 33% | | 24% | | 21% | | |
| | | | | | | | | | | | | | |
| | | |
| | | | | | |
| | |
| | Quarterly Form N-Q Portfolio of Investments Information: Each Fund is required to file its complete schedule of portfolio holdings with the Securities and Exchange Commission (SEC) for the first and third quarters of each fiscal year on Form N-Q. You may obtain this information directly from the SEC. Visit the SEC on-line at http://www.sec.gov or in person at the SEC’s Public Reference Room in Washington, D.C. Call the SEC toll-free at (800) SEC-0330 for room hours and operation. | | |
| | | |
| | | | | | |
| | |
| | Nuveen Funds’ Proxy Voting Information: You may obtain (i) information regarding how each fund voted proxies relating to portfolio securities held during the most recent twelve-month period ended June 30, without charge, upon request, by calling Nuveen Investments toll-free at (800) 257-8787 or on Nuveen’s website at www.nuveen.com and (ii) a description of the policies and procedures that each fund used to determine how to vote proxies relating to portfolio securities without charge, upon request, by calling Nuveen Investments toll-free at (800) 257-8787. You may also obtain this information directly from the SEC. Visit the SEC on-line at http://www.sec.gov. | | |
| | | |
| | | | | | |
| | |
| | FINRA BrokerCheck: The Financial Industry Regulatory Authority (FINRA) provides information regarding the disciplinary history of FINRA member firms and associated investment professionals. This information as well as an investor brochure describing FINRA BrokerCheck is available to the public by calling the FINRA BrokerCheck Hotline number at (800) 289-9999 or by visiting www.FINRA.org. | | |
Glossary of Terms
Used in this Report (Unaudited)
Average Annual Total Return: This is a commonly used method to express an investment’s performance over a particular, usually multi-year time period. It expresses the return that would have been necessary each year to equal the investment’s actual cumulative performance (including change in NAV or offer price and reinvested dividends and capital gains distributions, if any) over the time period being considered.
BofA/Merrill Lynch 3-Month U.S. Treasury Bill Index: The BofA/Merrill Lynch 3-Month U.S. Treasury Bill Index is an unmanaged index that is comprised of a single U.S. Treasury issue with approximately three months to final maturity, purchased at the beginning of each month and held for one full month. The index returns assume reinvestment of distributions, but do not reflect any applicable sales charges or management fees.
Gross Domestic Product (GDP): The total market value of all final goods and services produced in a country/region in a given year, equal to total consumer, investment and government spending, plus the value of exports, minus the value of imports.
Lipper Equity Income Funds Classification Average: Represents the average annualized returns for all reporting funds in the Lipper Equity Income Funds Classification. Lipper returns account for the effects of management fees and assume reinvestment of dividends, but do not reflect any applicable sales charges.
Lipper Equity Market Neutral Funds Classification Average: Represents the average annualized returns for all reporting funds in the Lipper Equity Market Neutral Funds Classification. Lipper returns account for the effects of management fees and assume reinvestment of dividends, but do not reflect any applicable sales charges.
Lipper Large-Cap Core Funds Classification Average: Represents the average annualized returns for all reporting funds in the Lipper Large-Cap Core Funds Classification. Lipper returns account for the effects of management fees and assume reinvestment of dividends, but do not reflect any applicable sales charges.
Lipper Large-Cap Growth Funds Classification Average: Represents the average annualized returns for all reporting funds in the Lipper Large-Cap Growth Funds Classification. Lipper returns account for the effects of management fees and assume reinvestment of dividends, but do not reflect any applicable sales charges.
Lipper Large-Cap Value Funds Classification Average: Represents the average annualized returns for all reporting funds in the Lipper Large-Cap Value Funds Classification. The Lipper returns account for the effects of management fees and assume reinvestment of dividends, but do not reflect any applicable sales charges.
Lipper Long/Short Equity Funds Classification Average: Represents the average annualized returns for all reporting funds in the Lipper Long/Short Equity Funds Classification. Lipper returns account for the effects of management fees and assume reinvestment of dividends, but do not reflect any applicable sales charges.
Lipper Multi-Cap Growth Funds Classification Average: Represents the average annualized returns for all reporting funds in the Lipper Multi-Cap Growth Funds Classification. Lipper returns account for the effects of management fees and assume reinvestment of dividends, but do not reflect any applicable sales charges.
Long Position: A security the fund owns in its portfolio.
MSCI EAFE (Europe, Australasia, Far East) Index: A free-float-adjusted market capitalization weighted index designed to measure developed market equity performance, excluding the U.S. and Canada. The index returns assume reinvestment of distributions, but do not reflect any applicable sales charges or management fees.
Glossary of Terms Used in this Report (Unaudited) (continued)
MSCI Emerging Markets Index: A free-float-adjusted market capitalization index that is designed to measure equity market performance in the global emerging markets. Index returns assume reinvestment of distributions, but do not reflect any applicable sales charges or management fees.
Net Asset Value (NAV) Per Share: A fund’s Net Assets is equal to its total assets (securities, cash and accrued earnings) less its total liabilities. For funds with multiple classes, Net Assets are determined separately for each share class. NAV per share is equal to the fund’s (or share class’) Net Assets divided by its number of shares outstanding.
Russell 1000® Growth Index: An index that measures the performance of those Russell 1000® companies with higher price-to-book ratios and higher forecasted growth values. Index returns assume reinvestment of dividends, but do not reflect any applicable sales charges or management fees.
Russell 1000® Index: An unmanaged index, considered representative of large-cap stocks. The index returns assume reinvestment of dividends, but do not reflect any applicable sales charges or management fees.
Russell 1000® Value Index: An index that measures the performance of those Russell 1000® companies with lower price-to-book ratios and lower forecasted growth values. Index returns assume reinvestment of dividends, but do not include the effects of any applicable sales charges or management fees.
S&P 500® Index: An unmanaged index generally considered representative of the U.S. stock market. Index returns assume reinvestment of distributions, but do not include the effects of any applicable sales charges or management fees.
Short Position: A security the fund does not own but has sold through the delivery of a borrowed security.
Tax Equalization: The practice of treating a portion of the distribution made to a redeeming shareholder, which represents his proportionate part of undistributed net investment income and capital gain as a distribution for tax purposes. Such amounts are referred to as the equalization debits (or payments) and will be considered a distribution to the shareholder of net investment income and capital gain for calculation of the fund’s dividends paid deduction.
Annual Investment Management Agreement
Approval Process (Unaudited)
The Board of Trustees of each Fund (each, a “Board” and each Trustee, a “Board Member”), including the Board Members who are not parties to the Funds’ advisory or sub-advisory agreements or “interested persons” of any such parties (the “Independent Board Members”), is responsible for overseeing the performance of the investment adviser and sub-adviser to the respective Fund and determining whether to continue such Fund’s advisory agreement (the “Investment Management Agreement”) between the Fund and Nuveen Fund Advisors, LLC (the “Adviser”) and the sub-advisory agreement (the “Sub-Advisory Agreement” and, together with the Investment Management Agreement, the “Advisory Agreements”) between the Adviser and Nuveen Asset Management, LLC (the “Sub-Adviser”). Following an initial term with respect to each Fund upon its commencement of operations, the Board is required to consider the continuation of the Advisory Agreements on an annual basis pursuant to the requirements of the Investment Company Act of 1940, as amended (the “1940 Act”). Accordingly, at an in-person meeting held on May 11-13, 2015 (the “May Meeting”), the Board, including a majority of the Independent Board Members, considered and approved the existing Advisory Agreements for the Funds.
In preparation for its considerations at the May Meeting, the Board received in advance of the meeting extensive materials prepared in connection with the review of the Advisory Agreements. The materials provided a broad range of information regarding the Funds, including, among other things, the nature, extent and quality of services provided by the Adviser and Sub-Adviser (the Adviser and Sub-Adviser are collectively, the “Fund Advisers” and each, a “Fund Adviser”); Fund performance including performance assessments against peers and the appropriate benchmark(s); fee and expense information of the Funds compared to peers; a description and assessment of shareholder service levels for the Funds; a summary of the performance of certain service providers; a review of product initiatives and shareholder communications; and profitability information of the Fund Advisers as described in further detail below. As part of its annual review, the Board also held a separate meeting on April 14-15, 2015 to review the Funds’ investment performance and consider an analysis by the Adviser of the Sub-Adviser which generally evaluated the Sub-Adviser’s investment team, investment mandate, organizational structure and history, investment philosophy and process, and the performance of the Funds, and any significant changes to the foregoing. During the review, the Independent Board Members asked questions of and requested additional information from management.
The Board considered that the evaluation process with respect to the Fund Advisers is an ongoing process that encompassed the information and knowledge gained throughout the year. The Board, acting directly or through its committees, met regularly during the course of the year and received information and considered factors at each meeting that would be relevant to its annual consideration of the Advisory Agreements, including information relating to Fund performance; Fund expenses; investment team evaluations; and valuation, compliance, regulatory and risk matters. In addition to regular reports, the Adviser provided special reports to the Board to enhance the Board’s understanding on topics that impact some or all of the Nuveen funds and the Adviser (such as presentations on risk and stress testing; the new governance, risk and compliance system; cybersecurity developments; Nuveen fund accounting and reporting matters; regulatory developments impacting the investment company industry and the business plans or other matters impacting the Adviser). The Board also met with key investment personnel managing certain Nuveen fund portfolios during the year.
The Board had created several standing committees including the Open-End Funds Committee and the Closed-End Funds Committee to assist the full Board in monitoring and gaining a deeper insight into the distinctive business practices of closed-end and open-end funds. These Committees met prior to each quarterly Board meeting, and the Adviser provided presentations to these Committees permitting them to delve further into specific matters or initiatives impacting the respective product line.
The Board also continued its program of seeking to have the Board Members or a subset thereof visit each sub-adviser to the Nuveen funds at least once over a multiple year rotation, meeting with key investment and business personnel. In this regard, the Independent Board Members made site visits to multiple equity and fixed-income investment teams of the Sub-Adviser in June 2014.
The Board considered the information provided and knowledge gained at these meetings and visits during the year when performing its annual review of the Advisory Agreements. The Independent Board Members also were assisted throughout the process by independent legal counsel. During the course of the year and during their deliberations regarding the review of advisory contracts, the Independent Board Members met with independent legal counsel in executive sessions without management present. The Independent Board Members also received a memorandum from independent legal counsel outlining the legal standards for their consideration of the proposed continuation of the Advisory Agreements. In addition, it is important to recognize that the management arrangements for the Nuveen funds are the result of many years of review and discussion between the Independent Board Members and Fund management and that the Board Members’ conclusions may be based, in part, on their consideration of fee arrangements and other factors developed in previous years.
The Board took into account all factors it believed relevant with respect to each Fund, including, among other things: (a) the nature, extent and quality of the services provided by the Fund Advisers; (b) the investment performance of the Funds and Fund Advisers; (c) the advisory fees and costs of the
Annual Investment Management Agreement Approval Process (Unaudited) (continued)
services to be provided to the Funds and the profitability of the Fund Advisers; (d) the extent of any economies of scale; (e) any benefits derived by the Fund Advisers from the relationship with the Funds; and (f) other factors. Each Board Member may have accorded different weight to the various factors in reaching his or her conclusions with respect to the Advisory Agreements for each Fund. The Independent Board Members did not identify any single factor as all-important or controlling. The Independent Board Members’ considerations were instead based on a comprehensive consideration of all the information presented. The principal factors considered by the Board and its conclusions are described below.
A. Nature, Extent and Quality of Services
In evaluating the renewal of the Advisory Agreements, the Independent Board Members received and considered information regarding the nature, extent and quality of the applicable Fund Adviser’s services provided to each respective Fund. The Board reviewed information regarding, among other things, each Fund Adviser’s organization and business, the types of services that each Fund Adviser or its affiliates provided to the Funds, the performance record of the Funds (as described in further detail below), and any initiatives that had been undertaken on behalf of the open-end product line. The Board recognized the high quality of services the Adviser had provided to the Funds over the years and the conscientiousness with which the Adviser provided these services. The Board also considered the improved capital structure of Nuveen Investments, Inc. (“Nuveen”) (the parent of the Adviser) following the acquisition of Nuveen by TIAA-CREF in 2014 (the “TIAA-CREF Transaction”).
With respect to the services, the Board noted the Funds were registered investment companies that operated in a regulated industry and considered the myriad of investment management, administrative, compliance, oversight and other services the Adviser provided to manage and operate the Funds. Such services included, among other things: (a) product management (such as analyzing ways to better position a Nuveen fund in the marketplace, setting dividends; maintaining relationships to gain access to distribution platforms; and providing shareholder communications); (b) fund administration (such as preparing tax returns and other tax compliance services, preparing regulatory filings and shareholder reports; managing fund budgets and expenses; overseeing a fund’s various service providers and supporting and analyzing new and existing funds); (c) Board administration (such as supporting the Board and its committees, in relevant part, by organizing and administering the Board and committee meetings and preparing the necessary reports to assist the Board in its duties); (d) compliance (such as monitoring adherence to a fund’s investment policies and procedures and applicable law; reviewing the compliance program periodically and developing new policies or updating existing compliance policies and procedures as considered necessary or appropriate; responding to regulatory requests; and overseeing compliance testing of the funds’ sub-advisers); (e) legal support (such as preparing or reviewing fund registration statements, proxy statements and other necessary materials; interpreting regulatory requirements and compliance thereof; and maintaining applicable registrations); and (f) investment services (such as overseeing and reviewing the funds’ sub-advisers and their investment teams; analyzing performance of the funds; overseeing investment and risk management; evaluating brokerage transactions and securities lending, overseeing the daily valuation process for portfolio securities and developing and recommending valuation policies and methodologies and changes thereto; reporting to the Board on various matters including performance, risk and valuation; and participating in fund development, leverage management, and the developing or interpreting of investment policies and parameters).
In its review, the Board considered information highlighting the various initiatives that the Adviser had implemented or continued during the last year to enhance its services to the Nuveen funds. The Board recognized that some of these initiatives are a result of a multi-year process. In reviewing the activities of 2014, the Board recognized the Adviser’s continued focus on fund rationalization for open-end funds through mergers, fund closures or repositioning the funds in seeking to enhance shareholder value, reduce costs, improve performance, eliminate fund overlap and better meet shareholder needs. The Board noted the Adviser’s investment in additional staffing to strengthen and improve its services to the Nuveen funds, including with respect to risk management and valuation. The Board recognized that expanding the depth and range of its risk oversight activities had been a major priority for the Adviser in recent years, and the Adviser continued to add to the risk management team, develop additional risk management programs and create committees or other teams designated to oversee or evaluate certain risks, such as liquidity risk, enterprise risk, investment risk and cybersecurity risk. The Adviser had also continued to add to the valuation team, launched its centralized securities valuation system which is intended to provide for uniform pricing and reporting across the complex as the system continues to develop, continued to refine its valuation analysis and updated related policies and procedures and evaluated and assessed pricing services. The Board considered the Adviser’s ongoing investment in information technology and operations and the various projects of the information technology team to support the continued growth and complexity of the Nuveen funds and increase efficiencies in their operations. The Board also recognized the Adviser’s strong commitment to compliance and reviewed information reflecting the compliance group’s ongoing activities to enhance its compliance system and refine its compliance procedures as well as the Chief Compliance Officer’s report regarding the compliance team, the initiatives the team had undertaken in 2014 and proposed for 2015, the compliance functions and reporting process, the record of compliance with the policies and procedures and its supervision activities of other service providers.
With respect to the open-end fund product line, the Adviser had also, among other things: developed new funds in seeking to enhance the product line; enhanced the reporting to the Board and its committees regarding payments to intermediaries; and continued to explore opportunities for potential funds.
As noted, the Adviser also oversees the Sub-Adviser who primarily provides the portfolio advisory services to the Funds. The Board recognized the skill and competency of the Adviser in monitoring and analyzing the performance of the Sub-Adviser and managing the sub-advisory relationship. In
considering the Sub-Advisory Agreements and supplementing its prior knowledge, the Board considered a current report provided by the Adviser analyzing, among other things, the Sub-Adviser’s investment team and changes thereto, investment approach, organization and history, and assets under management, and the investment performance of each Fund.
Based on their review, the Independent Board Members found that, overall, the nature, extent and quality of services provided to the Funds under each respective Advisory Agreement were satisfactory.
B. The Investment Performance of the Funds and Fund Advisers
The Board, including the Independent Board Members, considered the performance history of each Fund over various time periods. The Board reviewed reports, including an analysis of the Funds’ performance and the applicable investment team. The Board reviewed, among other things, each Fund’s investment performance both on an absolute basis and in comparison to peer funds (the “Performance Peer Group”) and to recognized and/or customized benchmarks (i.e., generally benchmarks derived from multiple recognized benchmarks) for the quarter, one-, three- and five-year periods ending December 31, 2014, as well as performance information reflecting the first quarter of 2015 (or for such shorter periods available for Nuveen Concentrated Core Fund (the “Concentrated Core Fund”), Nuveen Core Dividend Fund (the “Core Dividend Fund”), Nuveen Equity Market Neutral Fund (the “Market Neutral Fund”), Nuveen Large Cap Core Fund (the “Large Cap Core Fund”), Nuveen Large Cap Core Plus Fund (the “Large Cap Core Plus Fund”) and Nuveen Large Cap Growth Fund (the “Large Cap Growth Fund”), which did not exist for part of the foregoing time frame). In its review, the Board noted that it also reviewed Fund performance results at each of its quarterly meetings.
In evaluating performance, the Board recognized several factors that may impact the performance data as well as the consideration given to particular performance data.
| | • | | The performance data reflected a snapshot in time, in this case as of the end of the most recent calendar year or quarter. A different performance period, however, could generate significantly different results. |
| | • | | Long-term performance can be adversely affected by even one period of significant underperformance so that a single investment decision or theme had the ability to disproportionately affect long-term performance. |
| | • | | The investment experience of a particular shareholder in a fund would vary depending on when such shareholder invested in the fund, the class held (if multiple classes are offered in the fund) and the performance of the fund (or respective class) during that shareholder’s investment period. |
| | • | | Open-end funds offer multiple classes and the performance data provided for open-end funds was based on Class A shares. The performance of the other classes of a fund, however, should be substantially similar on a relative basis because all of the classes would be invested in the same portfolio of securities and differences in performance among classes could be principally attributed to the variations in distribution and servicing expenses of each class. |
| | • | | The Board recognized that the funds in the Performance Peer Group may differ somewhat from the Nuveen fund with which it is being compared and due to these differences, performance comparisons between certain of the Nuveen funds and their Performance Peer Groups may be inexact and the relevancy limited. The Board considered that management had classified the Performance Peer Group as low, medium and high in relevancy. The Board took the analysis of the relevancy of the Performance Peer Group into account when considering the comparative performance data. The Board also considered comparative performance of an applicable benchmark. While the Board was cognizant of the relative performance of a Fund’s peer set and/or benchmark(s), the Board evaluated Fund performance in light of the respective Fund’s investment objectives, investment parameters and guidelines and considered that the variations between the objectives and investment parameters or guidelines of the Fund with its peers and/or benchmarks result in differences in performance results. |
With respect to any Nuveen funds for which the Board has identified performance concerns, the Board monitors such funds closely until performance improves, discusses with the Adviser the reasons for such results, considers those steps necessary or appropriate to address such issues, and reviews the results of any efforts undertaken. The Board is aware, however, that shareholders chose to invest or remain invested in a fund knowing that the Adviser manages the fund and knowing the fund’s fee structure.
In considering the performance data, the Independent Board Members noted the following with respect to the Funds:
For the Large Cap Growth Fund, the Board noted that the Fund ranked in its Performance Peer Group in the first quartile and outperformed its benchmark in the one-year period. The Board also noted, however, that the Fund was relatively new with a performance history that was too short to make a conclusive assessment of its limited performance record.
For Nuveen Growth Fund (the “Growth Fund”), the Board noted that the Fund ranked in its Performance Peer Group in the first quartile in the one-year period and the third quartile in the three- and five-year periods. Although the Fund underperformed its benchmark in the three- and five-year periods, it outperformed its benchmark in the one-year period.
Annual Investment Management Agreement Approval Process (Unaudited) (continued)
For Nuveen Large Cap Value Fund (the “Large Cap Value Fund”), the Board noted that the Fund ranked in its Performance Peer Group in the first quartile in the one- and three-year periods and the second quartile in the five-year period and, although the Fund underperformed its benchmark in the five-year period, it outperformed its benchmark in the one- and three-year periods.
For the Core Dividend Fund, the Board noted that the Fund ranked in its Performance Peer Group in the first quartile and outperformed its benchmark in the one-year period. The Board also noted, however, that the Fund was relatively new with a performance history that was too short to make a conclusive assessment of its limited performance record.
For the Large Cap Core Fund, the Board noted that the Fund ranked in its Performance Peer Group in the first quartile and outperformed its benchmark in the one-year period. The Board also noted, however, that the Fund was relatively new with a performance history that was too short to make a conclusive assessment of its limited performance record.
For the Large Cap Core Plus Fund, the Board noted that the Fund ranked in its Performance Peer Group in the first quartile and outperformed its benchmark in the one-year period. The Board also noted, however, that the Fund was relatively new with a performance history that was too short to make a conclusive assessment of its limited performance record.
For the Market Neutral Fund, the Board noted that the Fund ranked in its Performance Peer Group in the second quartile and outperformed its benchmark in the one-year period. The Board also noted, however, that the Fund was relatively new with a performance history that was too short to make a conclusive assessment of its limited performance record.
For Nuveen Equity Long/Short Fund (the “Equity Long/Short Fund”), the Board noted that, although the Fund underperformed its benchmark in the one-, three- and five-year periods, it ranked in the first quartile in each of such periods.
For the Concentrated Core Fund, the Board noted that the Fund ranked in its Performance Peer Group in the first quartile and outperformed its benchmark in the one-year period. The Board also noted, however, that the Fund was relatively new with a performance history that was too short to make a conclusive assessment of its limited performance record.
Except as otherwise noted above, based on their review, the Independent Board Members determined that each Fund’s investment performance had been satisfactory.
C. Fees, Expenses and Profitability
1. Fees and Expenses
The Board evaluated the management fees and other fees and expenses of each Fund (expressed as a percentage of average net assets) in absolute terms and in comparison to the fee and expense levels of a comparable universe of funds (the “Peer Universe”) and, with respect to open-end funds, to a more focused subset in the Peer Universe (the “Peer Group”), each selected by an independent third-party fund data provider. The Independent Board Members reviewed the methodology regarding the construction of the Peer Universe and Peer Group for each Fund. The Board reviewed, among other things, such Fund’s gross management fees, net management fees and net expense ratios in absolute terms as well as compared to the average and median fee and expense levels of the Peer Universe and/or Peer Group. The Board noted that the net total expense ratios paid by investors in the Funds were the most representative of an investor’s net experience. The Board Members also considered any fee waivers and/or expense reimbursement arrangements currently in effect for the Funds.
In reviewing the comparative fee and expense information, the Independent Board Members recognized that various factors such as the limited size and particular composition of the Peer Universe or Peer Group (including the inclusion of other Nuveen funds in the peer set); expense anomalies; changes in the funds comprising the Peer Universe or Peer Group from year to year; levels of reimbursement or fee waivers; the timing of information used; and differences in services provided can impact the comparative data limiting the usefulness of the data to help make a conclusive assessment of the Funds’ fees and expenses.
In reviewing the fee schedule for a fund, the Independent Board Members also considered the fund-level and complex-wide breakpoint schedules (described in further detail below) and any fee waivers and reimbursements provided by Nuveen. In reviewing fees and expenses, the Board considered the expenses and fees to be higher if they were over 10 basis points higher, slightly higher if they were approximately 6 to 10 basis points higher, in line if they were within approximately 5 basis points higher than the peer average and below if they were below the peer average of the Peer Group. In reviewing the reports, the Board noted that the majority of the Nuveen funds had a net expense ratio near or below their peer average.
The Independent Board Members recognized that the Large Cap Core Plus Fund had a higher net management fee than the peer average but a net expense ratio below the peer average, and the Concentrated Core Fund, the Core Dividend Fund, the Equity Long/Short Fund, the Market Neutral Fund, the Growth Fund, the Large Cap Core Fund, the Large Cap Growth Fund and the Large Cap Value Fund each had a net management fee and a net expense ratio below or in line with its peer averages.
Based on their review of the fee and expense information provided, the Independent Board Members determined that each Fund’s management fees (as applicable) to a Fund Adviser were reasonable in light of the nature, extent and quality of services provided to the Fund.
2. Comparisons with the Fees of Other Clients
The Board considered information regarding the fees a Fund Adviser assessed to the Nuveen funds compared to that of other clients as described in further detail below. With respect to non-municipal funds, such other clients of the Adviser and/or its affiliated sub-advisers may include: separately managed accounts (such as retail, institutional or wrap accounts), hedge funds, other investment companies that are not offered by Nuveen but are sub-advised by one of Nuveen’s affiliated sub-advisers, foreign investment companies offered by Nuveen, and collective investment trusts.
The Board recognized that each Fund had an affiliated sub-adviser and therefore the overall Fund management fee can be divided into two components, the fee retained by the Adviser and the fee paid to the Sub-Adviser. In reviewing the nature of the services provided by the Adviser, including through its affiliated sub-advisers, the Board considered the range of advisory fee rates for retail and institutional managed accounts advised by Nuveen-affiliated sub-advisers. The Board also reviewed, among other things, the average fee the affiliated sub-advisers assessed such clients as well as the range of fee rates assessed to the different types of clients (such as retail, institutional and wrap accounts as well as non-Nuveen funds) applicable to such sub-advisers.
In reviewing the comparative information, the Board also reviewed information regarding the differences between the Funds and the other clients, including differences in services provided, investment policies, investor profiles, compliance and regulatory requirements and account sizes. The Board recognized the breadth of services necessary to operate a registered investment company (as described above) and that, in general terms, the Adviser provided the administrative and other support services to the Funds and, although the Sub-Adviser may provide some of these services, the Sub-Adviser essentially provided the portfolio management services. In general, the Board noted that higher fee levels reflected higher levels of service provided by the Fund Adviser, increased investment management complexity, greater product management requirements and higher levels of business risk or some combination of the foregoing. The Independent Board Members considered the differences in structure and operations of separately managed accounts and hedge funds from registered funds and noted that the range of day-to-day services was not generally of the breadth required for the registered funds. Many of the additional administrative services provided by the Adviser were not required for institutional clients or funds sub-advised by a Nuveen-affiliated sub-adviser that were offered by other fund groups. The Independent Board Members also recognized that the management fee rates of the foreign funds advised by the Adviser may vary due to, among other things, differences in the client base, governing bodies, operational complexities and services covered by the management fee. Given the inherent differences in the various products, particularly the extensive services provided to the Funds, the Independent Board Members believed such facts justify the different levels of fees.
3. Profitability of Fund Advisers
In conjunction with their review of fees, the Independent Board Members also considered the profitability of Nuveen for its advisory activities and its financial condition. The Independent Board Members reviewed, among other things, the adjusted operating margins for Nuveen for the last two calendar years, the revenues, expenses, net income (pre-tax and after-tax) and net revenue margins (pre-tax and after-tax) of Nuveen’s managed fund advisory activities for the last two calendar years, the allocation methodology used by Nuveen in preparing the profitability data and a history of the adjustments to the methodology due to changes in the business over time. The Independent Board Members also reviewed the revenues, expenses, net income (pre-tax and after-tax) and revenue margin (pre-tax and post-tax) of the Adviser and, as described in further detail below, each affiliated sub-adviser for the 2014 calendar year. In reviewing the profitability data, the Independent Board Members noted the subjective nature of cost allocation methodologies used to determine profitability as other reasonable methods could also have been employed but yield different results. The Independent Board Members reviewed an analysis of the key drivers behind the changes in revenues and expenses that impacted profitability in 2014. The Independent Board Members recognized that Nuveen’s net revenue margin from advisory activities for 2014 was consistent with 2013. The Independent Board Members also considered the profitability of Nuveen in comparison to the adjusted operating margins of other investment advisers with publicly available data and with comparable assets under management (based on asset size and asset composition) to Nuveen. The Independent Board Members noted that Nuveen’s adjusted operating margins appeared to be reasonable in relation to such other advisers. The Independent Board Members, however, recognized the difficulty of making comparisons of profitability from fund investment advisory contracts as the information is not generally publicly available, the information for the investment advisers that was publicly available may not be representative of the industry and various other factors would impact the profitability data such as differences in services offered, business mix, expense methodology and allocations, capital structure and costs, complex size, and types of funds and other accounts managed.
The Independent Board Members noted this information supplemented the profitability information requested and received during the year and noted that two Independent Board Members served as point persons to review the profitability analysis and methodologies employed, and any changes thereto, and to keep the Board apprised of such changes during the year.
The Independent Board Members determined that Nuveen appeared to be sufficiently profitable to operate as a viable investment management firm and to honor its obligations as a sponsor of the Nuveen funds. The Independent Board Members noted the Adviser’s continued expenditures to
Annual Investment Management Agreement Approval Process (Unaudited) (continued)
upgrade its investment technology and increase personnel and recognized the Adviser’s continued commitment to its business to enhance the Adviser’s capacity and capabilities in providing the services necessary to meet the needs of the Nuveen funds as they grow or change over time. The Independent Board Members also noted that the sub-advisory fees for the Nuveen funds are paid by the Adviser, however, the Board recognized that many of the sub-advisers, including the Sub-Adviser, are affiliated with Nuveen. The Independent Board Members also noted the increased resources and support available to Nuveen as well as an improved capital structure as a result of the TIAA-CREF Transaction.
With respect to the Sub-Adviser, the Independent Board Members reviewed the Sub-Adviser’s revenues, expenses and revenue margins (pre- and post-tax) for its advisory activities for the calendar year ended December 31, 2014. The Independent Board Members also reviewed profitability analysis reflecting the revenues, expenses and the revenue margin (pre- and post-tax) by asset type for the Sub-Adviser for the calendar year ended December 31, 2014.
In evaluating the reasonableness of the compensation, the Independent Board Members also considered other amounts paid to a Fund Adviser by the Funds as well as indirect benefits (such as soft dollar arrangements), if any, the Fund Adviser and its affiliates received or were expected to receive that were directly attributable to the management of a Fund. See Section E below for additional information on indirect benefits a Fund Adviser may receive as a result of its relationship with the Funds.
Based on their review, the Independent Board Members determined that the Adviser’s and the Sub-Adviser’s level of profitability was reasonable in light of the respective services provided.
D. Economies of Scale and Whether Fee Levels Reflect These Economies of Scale
The Independent Board Members recognized that, as the assets of a particular fund or the Nuveen complex in the aggregate increase over time, economies of scale may be realized, and the Independent Board Members considered the extent to which the funds benefit from such economies of scale. Although the Independent Board Members recognized that economies of scale are difficult to measure, the Board recognized that one method to help ensure the shareholders share in these benefits is to include breakpoints in the management fee schedule reducing fee rates as asset levels grow. The Independent Board Members noted that, subject to certain exceptions, the management fees of the funds in the Nuveen complex are generally comprised of a fund-level component and complex-level component. Each component of the management fee for each Fund included breakpoints to reduce management fee rates of the Fund as the Fund grows and, as described below, as the Nuveen complex grows. In addition to fund-specific breakpoint schedules which reduce the fee rates of a particular fund as its assets increase, the Independent Board Members recognized that the Adviser also passed on the benefits of economies of scale through the complex-wide fee arrangement which reduced management fee rates as assets in the fund complex reached certain levels. The complex-wide fee arrangement seeks to provide the benefits of economies of scale to fund shareholders when total fund complex assets increase, even if assets of a particular fund are unchanged or have decreased. The approach reflected the notion that some of Nuveen’s costs were attributable to services provided to all its funds in the complex, and therefore all funds benefit if these costs were spread over a larger asset base. The Independent Board Members reviewed the breakpoint and complex-wide schedules and the fee reductions achieved as a result of such structures for the 2014 calendar year.
The Independent Board Members also noted that additional economies of scale were shared with shareholders of the Funds through the adoption of temporary and/or permanent expense caps. The Independent Board Members further considered that as part of the TIAA-CREF Transaction, Nuveen agreed, for a period of two years from the date of the closing of the TIAA-CREF Transaction, not to increase contractual management fees for any Nuveen fund and, with respect to funds with expense caps, not to raise expense cap levels for such funds from levels in effect at that time or scheduled to go into effect prior to the closing of the TIAA-CREF Transaction. The commitment would not limit or otherwise affect mergers or liquidations of any funds in the ordinary course.
Based on their review, the Independent Board Members concluded that the current fee structure was acceptable and reflected economies of scale to be shared with shareholders when assets under management increase.
E. Indirect Benefits
The Independent Board Members received and considered information regarding potential “fall out” or ancillary benefits the respective Fund Adviser or its affiliates may receive as a result of its relationship with the Funds. In this regard, the Independent Board Members recognized that an affiliate of the Adviser served as the Funds’ principal underwriter and may receive compensation therefore from, among other things, sales charges, distribution fees and shareholder services fees (which included fees received pursuant to any 12b-1 plan). The Independent Board Members therefore took into account, among other things, the 12b-1 fees retained by Nuveen during the last calendar year.
In addition to the above, the Independent Board Members considered whether the Fund Adviser received any benefits from soft dollar arrangements whereby a portion of the commissions paid by a Fund for brokerage may be used to acquire research that may be useful to the Fund Adviser in managing the assets of the Fund and other clients. The Funds’ portfolio transactions are allocated by the Sub-Adviser. Accordingly, the Independent Board Members considered that the Sub-Adviser may benefit from research provided by broker-dealers executing portfolio transactions on behalf of the Funds. With respect to any fixed income securities, however, the Board recognized that such securities generally trade on a principal basis that does not generate soft dollar credits. Similarly, the Board recognized that any research received pursuant to soft dollar arrangements by the
Sub-Adviser may also benefit the Funds and shareholders to the extent the research enhanced the ability of the Sub-Adviser to manage the Funds. The Independent Board Members noted that the Sub-Adviser’s profitability may be somewhat lower if it had to acquire any such research services directly.
Based on their review, the Independent Board Members concluded that any indirect benefits received by a Fund Adviser as a result of its relationship with the Funds were reasonable and within acceptable parameters.
F. Other Considerations
The Independent Board Members did not identify any single factor discussed previously as all-important or controlling. The Board Members, including the Independent Board Members, concluded that the terms of each Advisory Agreement were fair and reasonable, that the respective Fund Adviser’s fees were reasonable in light of the services provided to each Fund and that the Advisory Agreements be renewed.
Trustees
and Officers (Unaudited)
The management of the Funds, including general supervision of the duties performed for the Funds by the Adviser, is the responsibility of the Board of trustees of the Funds. The number of directors of the Funds is currently set at eleven. None of the trustees who are not “interested” persons of the Funds (referred to herein as “independent trustees”) has ever been a director or employee of, or consultant to, Nuveen or its affiliates. The names and business addresses of the trustees and officers of the Funds, their principal occupations and other affiliations during the past five years, the number of portfolios each oversees and other directorships they hold are set forth below.
The Funds’ Statement of Additional Information (“SAI”) includes more information about the trustees. To request a free copy, call Nuveen Investments at (800) 257-8787 or visit the Funds’ website at www.nuveen.com.
| | | | | | | | |
Name, Year of Birth & Address | | Position(s) Held with the Funds | | Year First Elected or Appointed (1) | | Principal Occupation(s) Including other Directorships During Past 5 Years | | Number of Portfolios in Fund Complex Overseen by Trustee |
| | | |
| Independent Trustee: | | | | |
William J. Schneider 1944 333 W. Wacker Drive Chicago, IL 60606 | | Chairman of the Board and Trustee | | 1996 | | Chairman of Miller-Valentine Partners, a real estate investment company; formerly, Senior Partner and Chief Operating Officer (retired 2004) of Miller-Valentine Group; owner in several other Miller-Valentine entities; Board Member of Med-America Health System, and WDPR Public Radio Station; formerly, member, Business Advisory Council, Cleveland Federal Reserve Bank and University of Dayton Business School Advisory Council. | | 195 |
Jack B. Evans 1948 333 W. Wacker Drive Chicago, IL 60606 | | Trustee | | 1999 | | President, The Hall-Perrine Foundation, a private philanthropic corporation (since 1996); Director and Chairman, United Fire Group, a publicly held company; formerly, President Pro-Tem of the Board of Regents for the State of Iowa University System; Director, Source Media Group; Life Trustee of Coe College; formerly, Director, Alliant Energy; formerly, Director, Federal Reserve Bank of Chicago; formerly, President and Chief Operating Officer, SCI Financial Group, Inc., a regional financial services firm. | | 195 |
William C. Hunter 1948 333 W. Wacker Drive Chicago, IL 60606 | | Trustee | | 2004 | | Dean Emeritus, formerly, Dean, Tippie College of Business, University of Iowa (2006-2012); Director (since 2004) of Xerox Corporation; Director (since 2005), and President (since 2012) Beta Gamma Sigma, Inc., The International Business Honor Society; Director of Wellmark, Inc. (since 2009); formerly, Dean and Distinguished Professor of Finance, School of Business at the University of Connecticut (2003-2006); previously, Senior Vice President and Director of Research at the Federal Reserve Bank of Chicago (1995-2003); formerly, Director (1997-2007), Credit Research Center at Georgetown University. | | 195 |
David J. Kundert 1942 333 W. Wacker Drive Chicago, IL 60606 | | Trustee | | 2005 | | Formerly, Director, Northwestern Mutual Wealth Management Company (2006-2013); retired (since 2004) as Chairman, JPMorgan Fleming Asset Management, President and CEO, Banc One Investment Advisors Corporation, and President, One Group Mutual Funds; prior thereto, Executive Vice President, Banc One Corporation and Chairman and CEO, Banc One Investment Management Group; Regent Emeritus, Member of Investment Committee, Luther College; member of the Wisconsin Bar Association; member of Board of Directors and Chair of Investment Committee, Greater Milwaukee Foundation; member of the Board of Directors (Milwaukee), College Possible. | | 195 |
| | | | | | | | |
Name, Year of Birth & Address | | Position(s) Held with the Funds | | Year First Elected or Appointed (1) | | Principal Occupation(s) Including other Directorships During Past 5 Years | | Number of Portfolios in Fund Complex Overseen by Trustee |
John K. Nelson 1962 333 West Wacker Drive Chicago, IL 60606 | | Trustee | | 2013 | | Member of Board of Directors of Core12 LLC (since 2008), a private firm which develops branding, marketing and communications strategies for clients; Director of The Curran Center for Catholic American Studies (since 2009) and The President’s Council, Fordham University (since 2010); formerly senior external advisor to the financial services practice of Deloitte Consulting LLP (2012-2014); formerly, Chairman of the Board of Trustees of Marian University (2010 as trustee, 2011-2014 as Chairman); formerly, Chief Executive Officer of ABN AMRO N.V. North America, and Global Head of its Financial Markets Division (2007-2008); prior senior positions held at ABN AMRO include Corporate Executive Vice President and Head of Global Markets—the Americas (2006-2007), CEO of Wholesale Banking—North America and Global Head of Foreign Exchange and Futures Markets (2001-2006), and Regional Commercial Treasurer and Senior Vice President Trading—North America (1996-2001); formerly, Trustee at St. Edmund Preparatory School in New York City. | | 195 |
Judith M. Stockdale 1947 333 W. Wacker Drive Chicago, IL 60606 | | Trustee | | 1997 | | Board Member, Land Trust Alliance (since 2013) and U.S. Endowment for Forestry and Communities (since 2013); formerly, Executive Director (1994-2012), Gaylord and Dorothy Donnelley Foundation; prior thereto, Executive Director, Great Lakes Protection Fund (1990-1994). | | 195 |
Carole E. Stone 1947 333 W. Wacker Drive Chicago, IL 60606 | | Trustee | | 2007 | | Director, Chicago Board Options Exchange (since 2006), C2 Options Exchange, Incorporated (since 2009) Director, CBOE Holdings, Inc. (since 2010); formerly, Commissioner, New York State Commission on Public Authority Reform (2005-2010). | | 195 |
Virginia L. Stringer 1944 333 W. Wacker Drive Chicago, IL 60606 | | Trustee | | 2011 | | Board Member, Mutual Fund Directors Forum; non-profit board member; former governance consultant; former Owner and President, Strategic Management Resources, Inc., a management consulting firm; former Member, Governing Board, Investment Company Institute’s Independent Directors Council; previously, held several executive positions in general management, marketing and human resources at IBM and The Pillsbury Company; Independent Director, First American Fund Complex (1987-2010) and Chair (1997-2010). | | 195 |
Terence J. Toth 1959 333 W. Wacker Drive Chicago, IL 60606 | | Trustee | | 2008 | | Managing Partner, Promus Capital (since 2008); Director, Fulcrum IT Service LLC (since 2010), Quality Control Corporation (since 2012) and LogicMark LLC (since 2012); formerly, Director, Legal & General Investment Management America, Inc. (2008-2013); formerly, CEO and President, Northern Trust Global Investments (2004-2007); Executive Vice President, Quantitative Management & Securities Lending (2000-2004); prior thereto, various positions with Northern Trust Company (since 1994); member: Chicago Fellowship Board (since 2005), Catalyst Schools of Chicago Board (since 2008) and Mather Foundation Board (since 2012), and a member of its investment committee; formerly, Member, Northern Trust Mutual Funds Board (2005-2007), Northern Trust Global Investments Board (2004-2007), Northern Trust Japan Board (2004-2007), Northern Trust Securities Inc. Board (2003-2007) and Northern Trust Hong Kong Board (1997-2004). | | 195 |
Trustees and Officers (Unaudited) (continued)
| | | | | | | | |
Name, Year of Birth & Address | | Position(s) Held with the Funds | | Year First Elected or Appointed (1) | | Principal Occupation(s) Including other Directorships During Past 5 Years | | Number of Portfolios in Fund Complex Overseen by Trustee |
| | | |
| Interested Trustee: | | | | |
William Adams IV(2) 1955 333 W. Wacker Drive Chicago, IL 60606 | | Trustee | | 2013 | | Senior Executive Vice President, Global Structured Products (since 2010); Co-President of Nuveen Fund Advisors, LLC (since 2011); Executive Vice President of Nuveen Securities, LLC; President (since 2011), formerly, Managing Director (2010-2011) of Nuveen Commodities Asset Management, LLC; Board Member of the Chicago Symphony Orchestra and of Gilda’s Club Chicago; formerly, Executive Vice President, U.S. Structured Products, of Nuveen Investments, Inc. (1999-2010). | | 195 |
Thomas S. Schreier, Jr.(2) 1962 333 W. Wacker Drive Chicago, IL 60606 | | Trustee | | 2013 | | Vice Chairman, Wealth Management of Nuveen Investments, Inc. (since 2011); Co-President of Nuveen Fund Advisors, LLC; Chairman of Nuveen Asset Management, LLC (since 2011); Co-Chief Executive Officer of Nuveen Securities, LLC (since 2011); Member of Board of Governors and Chairman’s Council of the Investment Company Institute; Director of Allina Health and a Member of its Finance, Audit and Investment Committees, formerly, Chief Executive Officer (2000-2010) and Chief Investment Officer (2007-2010) of FAF Advisors, Inc.; formerly, President of First American Funds (2001-2010). | | 195 |
| | | | | | | | |
Name,
Year of Birth & Address | | Position(s) Held with the Funds | | Year First Elected or Appointed (3) | | Principal Occupation(s) During Past 5 Years | | Number of Portfolios in Fund Complex Overseen by
Officer |
| | | |
| Officers of the Funds: | | | | |
Gifford R. Zimmerman 1956 333 W. Wacker Drive Chicago, IL 60606 | | Chief Administrative Officer | | 1988 | | Managing Director (since 2002), and Assistant Secretary of Nuveen Securities, LLC; Managing Director (since 2004) and Assistant Secretary (since 1994) of Nuveen Investments, Inc.; Managing Director (since 2002), Assistant Secretary (since 1997) and Co-General Counsel (since 2011) of Nuveen Fund Advisors, LLC; Managing Director, Assistant Secretary and Associate General Counsel of Nuveen Asset Management, LLC (since 2011); Managing Director and Assistant Secretary of Symphony Asset Management LLC (since 2003); Vice President and Assistant Secretary of NWQ Investment Management Company, LLC (since 2002), Nuveen Investments Advisers Inc. (since 2002), Santa Barbara Asset Management, LLC (since 2006) and of Winslow Capital Management, LLC, (since 2010); Vice President and Assistant Secretary (since 2013), formerly, Chief Administrative Officer and Chief Compliance Officer (2006-2013) of Nuveen Commodities Asset Management, LLC; Chartered Financial Analyst. | | 196 |
Margo L. Cook 1964 333 W. Wacker Drive Chicago, IL 60606 | | Vice President | | 2009 | | Senior Executive Vice President of Nuveen Investments, Inc.; Executive Vice President, Investment Services of Nuveen Fund Advisors, LLC (since 2011); Managing Director – Investment Services of Nuveen Commodities Asset Management, LLC (since 2011); Co-Chief Executive Officer (since 2015); previously, Executive Vice President (2013-2015) of Nuveen Securities, LLC; Chartered Financial Analyst. | | 196 |
Lorna C. Ferguson 1945 333 W. Wacker Drive Chicago, IL 60606 | | Vice President | | 1998 | | Managing Director (since 2005) of Nuveen Fund Advisors, LLC and Nuveen Securities, LLC (since 2004). | | 196 |
| | | | | | | | |
Name,
Year of Birth & Address | | Position(s) Held with the Funds | | Year First Elected or Appointed (3) | | Principal Occupation(s) During Past 5 Years | | Number of Portfolios in Fund Complex Overseen by
Officer |
Stephen D. Foy 1954 333 W. Wacker Drive Chicago, IL 60606 | | Vice President and Controller | | 1998 | | Managing Director (since 2014), formerly, Senior Vice President (2013-2014) and Vice President (2005-2013) of Nuveen Fund Advisors, LLC; Chief Financial Officer of Nuveen Commodities Asset Management, LLC (since 2010); Certified Public Accountant. | | 196 |
Sherri A. Hlavacek 1962 333 W. Wacker Drive Chicago, IL 60606 | | Vice President and Treasurer | | 2015 | | Executive Vice President (since May 2015, formerly, Managing Director) and Controller of Nuveen Fund Advisors, LLC; Managing Director and Controller of Nuveen Commodities Asset Management, LLC; Executive Vice President (since May 2015, formerly, Managing Director), Treasurer and Controller of Nuveen Asset Management, LLC; Executive Vice President, Principal Financial Officer (since July 2015, formerly, Managing Director), Treasurer and Corporate Controller of Nuveen Investments, Inc.; Executive Vice President (since May 2015, formerly, Managing Director), Treasurer and Corporate Controller of Nuveen Investments Advisers Inc. and Nuveen Investments Holdings, Inc.; Managing Director, Chief Financial Officer and Corporate Controller of Nuveen Securities, LLC; Vice President, Controller and Treasurer of NWQ Investment Management Company, LLC; Vice President and Controller of Santa Barbara Asset Management, LLC, Tradewinds Global Investors, LLC, Symphony Asset Management LLC and Winslow Capital Management, LLC; Certified Public Accountant. | | 196 |
Walter M. Kelly 1970 333 W. Wacker Drive Chicago, IL 60606 | | Chief Compliance Officer and Vice President | | 2003 | | Senior Vice President (since 2008) of Nuveen Investments Holdings, Inc. | | 196 |
Tina M. Lazar 1961 333 W. Wacker Drive Chicago, IL 60606 | | Vice President | | 2002 | | Senior Vice President of Nuveen Investments Holdings, Inc. and Nuveen Securities, LLC | | 196 |
Kevin J. McCarthy 1966 333 W. Wacker Drive Chicago, IL 60606 | | Vice President and Secretary | | 2007 | | Managing Director and Assistant Secretary (since 2008), Nuveen Securities, LLC; Managing Director (since 2008), Assistant Secretary (since 2007) and Co-General Counsel (since 2011) of Nuveen Fund Advisors, LLC; Managing Director, Assistant Secretary and Associate General Counsel (since 2011) of Nuveen Asset Management, LLC; Managing Director and Assistant Secretary, Nuveen Investments, Inc.; Vice President (since 2007) and Assistant Secretary of Nuveen Investments Advisers Inc., NWQ Investment Management Company, LLC, Tradewinds Global Investors LLC, Symphony Asset Management LLC, Santa Barbara Asset Management, LLC, and of Winslow Capital Management, LLC. (since 2010); Vice President and Secretary (since 2010) of Nuveen Commodities Asset Management, LLC. | | 196 |
Kathleen L. Prudhomme 1953 901 Marquette Avenue Minneapolis, MN 55402 | | Vice President and Assistant Secretary | | 2011 | | Managing Director, Assistant Secretary and Co-General Counsel (since 2011) of Nuveen Fund Advisors, LLC; Managing Director, Assistant Secretary and Associate General Counsel (since 2011) of Nuveen Asset Management, LLC; Managing Director and Assistant Secretary (since 2011) of Nuveen Securities, LLC; formerly, Deputy General Counsel, FAF Advisors, Inc. (2004-2010). | | 196 |
Joel T. Slager 1978 333 West Wacker Drive Chicago, IL 60606 | | Vice President and Assistant Secretary | | 2013 | | Fund Tax Director for Nuveen Funds (since 2013); previously, Vice President of Morgan Stanley Investment Management, Inc., Assistant Treasurer of the Morgan Stanley Funds (from 2010 to 2013). | | 196 |
Trustees and Officers (Unaudited) (continued)
| | | | | | | | |
Name,
Year of Birth & Address | | Position(s) Held with the Funds | | Year First Elected or Appointed (3) | | Principal Occupation(s) During Past 5 Years | | Number of Portfolios in Fund Complex Overseen by
Officer |
Jeffery M. Wilson 1956 333 West Wacker Drive Chicago, IL 60606 | | Vice President | | 2011 | | Senior Vice President of Nuveen Securities, LLC (since 2011); formerly, Senior Vice President of FAF Advisors, Inc. (2000-2010). | | 108 |
| (1) | Trustees serve an indefinite term until his/her successor is elected or appointed. Ms. Stringer will retire from the Board as of December 31, 2015. The year first elected or appointed represents the year in which the trustee was first elected or appointed to any fund in the Nuveen Fund Complex. |
| (2) | “Interested persons” of the Trust, as defined in the 1940 Act, by reason of their positions with Nuveen and certain of its subsidiaries. |
| (3) | Officers serve one year terms through August of each year. The year first elected or appointed represents the year in which the officer was first elected or appointed to any fund in the Nuveen Fund Complex. |
Notes
Notes
Notes
| | | | | | | | | | | | | | |
| | | | | | | | |
| | | | |
| | | | | | | | |
| | |
| | Nuveen Investments: | | |
| | | | Serving Investors for Generations | | |
| | |
| | | | |
| | | |
| | | | Since 1898, financial advisors and their clients have relied on Nuveen Investments to provide dependable investment solutions through continued adherence to proven, long-term investing principles. Today, we offer a range of high quality equity and fixed-income solutions designed to be integral components of a well-diversified core portfolio. | | |
| | | |
| | | | | | |
| | | | |
| | | | | | Focused on meeting investor needs. Nuveen Investments provides high-quality investment services designed to help secure the longterm goals of institutional and individual investors as well as the consultants and financial advisors who serve them. Nuveen Investments markets a wide range of specialized investment solutions which provide investors access to capabilities of its high-quality boutique investment affiliates-Nuveen Asset Management, Symphony Asset Management, NWQ Investment Management Company, Santa Barbara Asset Management, Tradewinds Global Investors, Winslow Capital Management, and Gresham Investment Management. In total, Nuveen Investments managed more than $220 billion as of September 30, 2015. | | |
| | | | | |
| | | | | | | | | | |
| | | | | | Find out how we can help you. To learn more about how the products and services of Nuveen Investments may be able to help you meet your financial goals, talk to your financial advisor, or call us at (800) 257-8787. Please read the information provided carefully before you invest. Investors should consider the investment objective and policies, risk considerations, charges and expenses of any investment carefully. Where applicable, be sure to obtain a prospectus, which contains this and other relevant information. To obtain a prospectus, please contact your securities representative or Nuveen Investments, 333 W. Wacker Dr., Chicago, IL 60606. Please read the prospectus carefully before you invest or send money. Learn more about Nuveen Funds at: www.nuveen.com/mf | | |
| | | | | | |
| | | | | | | | | | | | |
| | Distributed by Nuveen Securities, LLC | 333 West Wacker Drive Chicago, IL 60606 | www.nuveen.com | | |
MAN-NLCES-0815D 11044-INV-Y-10/16
ITEM 2. CODE OF ETHICS.
As of the end of the period covered by this report, the registrant has adopted a code of ethics that applies to the registrant’s principal executive officer, principal financial officer, principal accounting officer or controller, or persons performing similar functions. There were no amendments to or waivers from the code during the period covered by this report. The registrant has posted the code of ethics on its website at www.nuveen.com/MutualFunds/ShareholderResources/FundGovernance.aspx. (To view the code, click on Code of Conduct.)
ITEM 3. AUDIT COMMITTEE FINANCIAL EXPERT.
The registrant’s Board of Directors or Trustees (“Board”) determined that the registrant has at least one “audit committee financial expert” (as defined in Item 3 of Form N-CSR) serving on its Audit Committee. The registrant’s audit committee financial experts are Carole E. Stone and Jack B. Evans, who are “independent” for purposes of Item 3 of Form N-CSR.
Ms. Stone served for five years as Director of the New York State Division of the Budget. As part of her role as Director, Ms. Stone was actively involved in overseeing the development of the State’s operating, local assistance and capital budgets, its financial plan and related documents; overseeing the development of the State’s bond-related disclosure documents and certifying that they fairly presented the State’s financial position; reviewing audits of various State and local agencies and programs; and coordinating the State’s system of internal audit and control. Prior to serving as Director, Ms. Stone worked as a budget analyst/examiner with increasing levels of responsibility over a 30 year period, including approximately five years as Deputy Budget Director. Ms. Stone has also served as Chair of the New York State Racing Association Oversight Board, as Chair of the Public Authorities Control Board, as a Commissioner on the New York State Commission on Public Authority Reform and as a member of the Boards of Directors of several New York State public authorities. These positions have involved overseeing operations and finances of certain entities and assessing the adequacy of project/entity financing and financial reporting. Currently, Ms. Stone is on the Board of Directors of CBOE Holdings, Inc., of the Chicago Board Options Exchange, and of C2 Options Exchange. Ms. Stone’s position on the boards of these entities and as a member of both CBOE Holdings’ Audit Committee and its Finance Committee has involved, among other things, the oversight of audits, audit plans and preparation of financial statements.
Mr. Evans was formerly President and Chief Operating Officer of SCI Financial Group, Inc., a full service registered broker-dealer and registered investment adviser (“SCI”). As part of his role as President and Chief Operating Officer, Mr. Evans actively supervised the Chief Financial Officer (the “CFO”) and actively supervised the CFO’s preparation of financial statements and other filings with various regulatory authorities. In such capacity, Mr. Evans was actively involved in the preparation of SCI’s financial statements and the resolution of issues raised in connection therewith. Mr. Evans has also served on the audit committee of various reporting companies. At such companies, Mr. Evans was involved in the oversight of audits, audit plans, and the preparation of financial statements. Mr. Evans also formerly chaired the audit committee of the Federal Reserve Bank of Chicago.
ITEM 4. PRINCIPAL ACCOUNTANT FEES AND SERVICES.
The following tables show the amount of fees that PricewaterhouseCoopers LLP & KPMG LLP, the Funds’ auditors, billed to the Funds’ during the Funds’ last two full fiscal years. The Audit Committee approved in advance all audit services and non-audit services that PricewaterhouseCoopers LLP & KPMG LLP provided to the Funds, except for those non-audit services that were subject to the pre-approval exception under Rule 2-01 of Regulation S-X (the “pre-approval exception”). The preapproval exception for services provided directly to the Funds waives the pre-approval requirement for services other than audit, review or attest services if: (A) the aggregate amount of all such services provided constitutes no more than 5% of the total amount of revenues paid by the Funds during the fiscal year in which the services are provided; (B) the Funds did not recognize the services as non-audit services at the time of the engagement; and (C) the services are promptly brought to the Audit Committee’s attention, and the Committee (or its delegate) approves the services before the audit is completed.
The Audit Committee has delegated certain pre-approval responsibilities to its Chairman (or, in his absence, any other member of the Audit Committee).
SERVICES THAT THE AUDITOR BILLED TO THE FUNDS
| | | | | | | | | | | | | | | | |
Fiscal Year Ended August 31, 2015 | | Audit Fees Billed
to Funds 1 | | | Audit-Related Fees
Billed to Funds 2 | | | Tax Fees
Billed to Funds 3 | | | All Other Fees
Billed to Funds 4 | |
Fund Name | | | | | | | | | | | | | | | | |
Nuveen Concentrated Core Fund | | | 15,500 | | | | 0 | | | | 0 | | | | 0 | |
Nuveen Core Dividend Fund | | | 15,500 | | | | 0 | | | | 0 | | | | 0 | |
Nuveen Equity Market Neutral Fund | | | 15,500 | | | | 0 | | | | 0 | | | | 0 | |
Nuveen Large Cap Value Fund | | | 15,500 | | | | 0 | | | | 0 | | | | 0 | |
Nuveen Intelligent Risk Conservative Allocation Fund | | | 21,155 | | | | 0 | | | | 2,681 | | | | 0 | |
Nuveen Intelligent Risk Growth Allocation Fund | | | 21,157 | | | | 0 | | | | 2,681 | | | | 0 | |
Nuveen Intelligent Risk Moderate Allocation Fund | | | 21,159 | | | | 0 | | | | 2,681 | | | | 0 | |
Nuveen Large Cap Core Fund | | | 15,500 | | | | 0 | | | | 0 | | | | 0 | |
Nuveen Large Cap Growth Fund | | | 15,500 | | | | 0 | | | | 0 | | | | 0 | |
Nuveen Large Cap Core Plus Fund | | | 15,500 | | | | 0 | | | | 0 | | | | 0 | |
| | | | | | | | | | | | | | | | |
Total | | $ | 171,971 | | | $ | 0 | | | $ | 8,042 | | | $ | 0 | |
| 1 | | “Audit Fees” are the aggregate fees billed for professional services for the audit of the Fund’s annual financial statements and services provided in connection with statutory and regulatory filings or engagements. |
| 2 | | “Audit-Related Fees” are the aggregate fees billed for assurance and related services reasonably related to the performance of the audit or review of financial statements that are not reported under “Audit Fees”. These fees include offerings related to the Fund’s common shares and leverage. |
| 3 | | “Tax Fees” are the aggregate fees billed for professional services for tax advice, tax compliance, and tax planning. These fees include: all global withholding tax services; excise and state tax reviews; capital gain, tax equalization and taxable basis calculations performed by the principal accountant. |
| 4 | | “All Other Fees” are the aggregate fees billed for products and services other than “Audit Fees”, “Audit-Related Fees” and “Tax Fees”. These fees represent all “Agreed-Upon Procedures” engagements pertaining to the Fund’s use of leverage. |
| | | | | | | | | | | | | | | | |
| | | Percentage Approved Pursuant to Pre-approval Exception | |
| | | Audit Fees Billed
to Funds | | | Audit-Related Fees
Billed to Funds | | | Tax Fees
Billed to Funds | | | All Other Fees
Billed to Funds | |
Fund Name | | | | | | | | | | | | | | | | |
Nuveen Concentrated Core Fund | | | 0 | % | | | 0 | % | | | 0 | % | | | 0 | % |
Nuveen Core Dividend Fund | | | 0 | % | | | 0 | % | | | 0 | % | | | 0 | % |
Nuveen Equity Market Neutral Fund | | | 0 | % | | | 0 | % | | | 0 | % | | | 0 | % |
Nuveen Large Cap Value Fund | | | 0 | % | | | 0 | % | | | 0 | % | | | 0 | % |
Nuveen Intelligent Risk Conservative Allocation Fund | | | 0 | % | | | 0 | % | | | 0 | % | | | 0 | % |
Nuveen Intelligent Risk Growth Allocation Fund | | | 0 | % | | | 0 | % | | | 0 | % | | | 0 | % |
Nuveen Intelligent Risk Moderate Allocation Fund | | | 0 | % | | | 0 | % | | | 0 | % | | | 0 | % |
Nuveen Large Cap Core Fund | | | 0 | % | | | 0 | % | | | 0 | % | | | 0 | % |
Nuveen Large Cap Growth Fund | | | 0 | % | | | 0 | % | | | 0 | % | | | 0 | % |
Nuveen Large Cap Core Plus Fund | | | 0 | % | | | 0 | % | | | 0 | % | | | 0 | % |
| | | | |
Fiscal Year Ended August 31, 2014 | | Audit Fees Billed
to Funds 1 | | | Audit-Related Fees
Billed to Funds 2 | | | Tax Fees
Billed to Funds 3 | | | All Other Fees
Billed to Funds 4 | |
Fund Name | | | | | | | | | | | | | | | | |
Nuveen Concentrated Core Fund | | | 15,500 | 5 | | | 0 | | | | 0 | | | | 0 | |
Nuveen Core Dividend Fund | | | 15,500 | 5 | | | 0 | | | | 0 | | | | 0 | |
Nuveen Equity Market Neutral Fund | | | 15,500 | 5 | | | 0 | | | | 0 | | | | 0 | |
Nuveen Large Cap Value Fund | | | 15,500 | 5 | | | 0 | | | | 0 | | | | 0 | |
Nuveen Intelligent Risk Conservative Allocation Fund | | | 20,496 | | | | 0 | | | | 2,795 | | | | 0 | |
Nuveen Intelligent Risk Growth Allocation Fund | | | 20,501 | | | | 0 | | | | 2,961 | | | | 0 | |
Nuveen Intelligent Risk Moderate Allocation Fund | | | 20,500 | | | | 0 | | | | 3,007 | | | | 0 | |
Nuveen Large Cap Core Fund | | | 15,500 | 5 | | | 0 | | | | 0 | | | | 0 | |
Nuveen Large Cap Growth Fund | | | 15,500 | 5 | | | 0 | | | | 0 | | | | 0 | |
Nuveen Large Cap Core Plus Fund | | | 15,500 | 5 | | | 0 | | | | 0 | | | | 0 | |
| | | | | | | | | | | | | | | | |
Total | | $ | 169,997 | | | $ | 0 | | | $ | 8,763 | | | $ | 0 | |
| 1 | | “Audit Fees” are the aggregate fees billed for professional services for the audit of the Fund’s annual financial statements and services provided in connection with statutory and regulatory filings or engagements. |
| 2 | | “Audit-Related Fees” are the aggregate fees billed for assurance and related services reasonably related to the performance of the audit or review of financial statements that are not reported under “Audit Fees”. These fees include offerings related to the Fund’s common shares and leverage. |
| 3 | | “Tax Fees” are the aggregate fees billed for professional services for tax advice, tax compliance, and tax planning. These fees include: all global withholding tax services; excise and state tax reviews; capital gain, tax equalization and taxable basis calculations performed by the principal accountant. |
| 4 | | “All Other Fees” are the aggregate fees billed for products and services other than “Audit Fees”, “Audit-Related Fees” and “Tax Fees”. These fees represent all “Agreed-Upon Procedures” engagements pertaining to the Fund’s use of leverage. |
| 5 | | 2014 “Audit Fees” are restated to include an additional $500 in fees not previously included. |
| | | | | | | | | | | | | | | | |
| | | Percentage Approved Pursuant to Pre-approval Exception | |
| | | Audit Fees Billed
to Funds | | | Audit-Related Fees
Billed to Funds | | | Tax Fees
Billed to Funds | | | All Other Fees
Billed to Funds | |
Fund Name | | | | | | | | | | | | | | | | |
Nuveen Concentrated Core Fund | | | 0 | % | | | 0 | % | | | 0 | % | | | 0 | % |
Nuveen Core Dividend Fund | | | 0 | % | | | 0 | % | | | 0 | % | | | 0 | % |
Nuveen Equity Market Neutral Fund | | | 0 | % | | | 0 | % | | | 0 | % | | | 0 | % |
Nuveen Large Cap Value Fund | | | 0 | % | | | 0 | % | | | 0 | % | | | 0 | % |
Nuveen Intelligent Risk Conservative Allocation Fund | | | 0 | % | | | 0 | % | | | 0 | % | | | 0 | % |
Nuveen Intelligent Risk Growth Allocation Fund | | | 0 | % | | | 0 | % | | | 0 | % | | | 0 | % |
Nuveen Intelligent Risk Moderate Allocation Fund | | | 0 | % | | | 0 | % | | | 0 | % | | | 0 | % |
Nuveen Large Cap Core Fund | | | 0 | % | | | 0 | % | | | 0 | % | | | 0 | % |
Nuveen Large Cap Growth Fund | | | 0 | % | | | 0 | % | | | 0 | % | | | 0 | % |
Nuveen Large Cap Core Plus Fund | | | 0 | % | | | 0 | % | | | 0 | % | | | 0 | % |
| | | | | | | | | | | | |
Fiscal Year Ended August 31, 2015 | | Audit-Related Fees
Billed to Adviser and
Affiliated Fund
Service Providers | | | Tax Fees Billed to
Adviser and
Affiliated Fund
Service Providers | | | All Other Fees
Billed to Adviser
and Affiliated Fund
Service Providers | |
Nuveen Investment Trust | | $ | 0 | | | $ | 0 | | | $ | 0 | |
| |
| | | Percentage Approved Pursuant to Pre-approval Exception | |
| | | Audit-Related Fees
Billed to Adviser and
Affiliated Fund
Service Providers | | | Tax Fees Billed to
Adviser and
Affiliated Fund
Service Providers | | | All Other Fees
Billed to Adviser
and Affiliated Fund
Service Providers | |
| | | 0 | % | | | 0 | % | | | 0 | % |
| | | |
Fiscal Year Ended August 31, 2014 | | Audit-Related Fees
Billed to Adviser and
Affiliated Fund
Service Providers | | | Tax Fees Billed to
Adviser and
Affiliated Fund
Service Providers | | | All Other Fees
Billed to Adviser
and Affiliated Fund
Service Providers | |
Nuveen Investment Trust | | $ | 0 | | | $ | 0 | | | $ | 0 | |
| |
| | | Percentage Approved Pursuant to Pre-approval Exception | |
| | | Audit-Related Fees
Billed to Adviser and
Affiliated Fund
Service Providers | | | Tax Fees Billed to
Adviser and
Affiliated Fund
Service Providers | | | All Other Fees
Billed to Adviser
and Affiliated Fund
Service Providers | |
| | | 0 | % | | | 0 | % | | | 0 | % |
| | | | | | | | | | | | | | | | |
Fiscal Year Ended August 31, 2015 | | Total Non-Audit Fees
Billed to Trust | | | Total Non-Audit Fees
billed to Adviser and
Affiliated Fund Service
Providers (engagements
related directly to the
operations and financial
reporting of the Trust) | | | Total Non-Audit Fees
billed to Adviser and
Affiliated Fund Service
Providers (all other
engagements) | | | Total | |
Fund Name | | | | | | | | | | | | | | | | |
Nuveen Concentrated Core Fund | | | 0 | | | | 0 | | | | 0 | | | | 0 | |
Nuveen Core Dividend Fund | | | 0 | | | | 0 | | | | 0 | | | | 0 | |
Nuveen Equity Market Neutral Fund | | | 0 | | | | 0 | | | | 0 | | | | 0 | |
Nuveen Large Cap Value Fund | | | 0 | | | | 0 | | | | 0 | | | | 0 | |
Nuveen Intelligent Risk Conservative Allocation Fund | | | 2,681 | | | | 0 | | | | 0 | | | | 2,681 | |
Nuveen Intelligent Risk Growth Allocation Fund | | | 2,681 | | | | 0 | | | | 0 | | | | 2,681 | |
Nuveen Intelligent Risk Moderate Allocation Fund | | | 2,681 | | | | 0 | | | | 0 | | | | 2,681 | |
Nuveen Large Cap Core Fund | | | 0 | | | | 0 | | | | 0 | | | | 0 | |
Nuveen Large Cap Growth Fund | | | 0 | | | | 0 | | | | 0 | | | | 0 | |
Nuveen Large Cap Core Plus Fund | | | 0 | | | | 0 | | | | 0 | | | | 0 | |
| | | | | | | | | | | | | | | | |
Total | | $ | 8,042 | | | $ | 0 | | | $ | 0 | | | $ | 8,043 | |
“Non-Audit Fees billed to Fund” for both fiscal year ends represent “Tax Fees” and “All Other Fees” billed to Fund in their respective amounts from the previous table.
Less than 50 percent of the hours expended on the principal accountant’s engagement to audit the registrant’s financial statements for the most recent fiscal year were attributed to work performed by persons other than the principal accountant’s full-time, permanent employees.
| | | | | | | | | | | | | | | | |
Fiscal Year Ended August 31, 2014 | | Total Non-Audit Fees
Billed to Trust | | | Total Non-Audit Fees
billed to Adviser and
Affiliated Fund Service
Providers (engagements
related directly to the
operations and financial
reporting of the Trust) | | | Total Non-Audit Fees
billed to Adviser and
Affiliated Fund Service
Providers (all other
engagements) | | | Total | |
Fund Name | | | | | | | | | | | | | | | | |
Nuveen Concentrated Core Fund | | | 0 | | | | 0 | | | | 0 | | | | 0 | |
Nuveen Core Dividend Fund | | | 0 | | | | 0 | | | | 0 | | | | 0 | |
Nuveen Equity Market Neutral Fund | | | 0 | | | | 0 | | | | 0 | | | | 0 | |
Nuveen Large Cap Value Fund | | | 0 | | | | 0 | | | | 0 | | | | 0 | |
Nuveen Intelligent Risk Conservative Allocation Fund | | | 2,795 | | | | 0 | | | | 0 | | | | 2,795 | |
Nuveen Intelligent Risk Growth Allocation Fund | | | 2,961 | | | | 0 | | | | 0 | | | | 2,961 | |
Nuveen Intelligent Risk Moderate Allocation Fund | | | 3,007 | | | | 0 | | | | 0 | | | | 3,007 | |
Nuveen Large Cap Core Fund | | | 0 | | | | 0 | | | | 0 | | | | 0 | |
Nuveen Large Cap Growth Fund | | | 0 | | | | 0 | | | | 0 | | | | 0 | |
Nuveen Large Cap Core Plus Fund | | | 0 | | | | 0 | | | | 0 | | | | 0 | |
| | | | | | | | | | | | | | | | |
Total | | $ | 8,763 | | | $ | 0 | | | $ | 0 | | | $ | 8,763 | |
“Non-Audit Fees billed to Fund” for both fiscal year ends represent “Tax Fees” and “All Other Fees” billed to Fund in their respective amounts from the previous table.
Audit Committee Pre-Approval Policies and Procedures. Generally, the Audit Committee must approve (i) all non-audit services to be performed for the Funds by the Funds’ independent accountant and (ii) all audit and non-audit services to be performed by the Funds’ independent accountant for the Affiliated Fund Service Providers with respect to the operations and financial reporting of the Funds. Regarding tax and research projects conducted by the independent accountant for the Funds and Affiliated Fund Service Providers (with respect to operations and financial reports of the Trust), such engagements will be (i) pre-approved by the Audit Committee if they are expected to be for amounts greater than $10,000; (ii) reported to the Audit Committee Chairman for his verbal approval prior to engagement if they are expected to be for amounts under $10,000 but greater than $5,000; and (iii) reported to the Audit Committee at the next Audit Committee meeting if they are expected to be for an amount under $5,000.
ITEM 5. AUDIT COMMITTEE OF LISTED REGISTRANTS.
Not applicable to this registrant.
ITEM 6. SCHEDULE OF INVESTMENTS.
| a) | | See Portfolio of Investments in Item 1. |
ITEM 7. DISCLOSURE OF PROXY VOTING POLICIES AND PROCEDURES FOR CLOSED-END
MANAGEMENT INVESTMENT COMPANIES.
Not applicable to this registrant.
ITEM 8. PORTFOLIO MANAGERS OF CLOSED-END MANAGEMENT INVESTMENT COMPANIES.
Not applicable to this registrant.
ITEM 9. PURCHASES OF EQUITY SECURITIES BY CLOSED-END MANAGEMENT INVESTMENT COMPANY AND AFFILIATED PURCHASERS.
Not applicable to this registrant.
ITEM 10. SUBMISSION OF MATTERS TO A VOTE OF SECURITY HOLDERS.
There have been no material changes to the procedures by which shareholders may recommend nominees to the registrant’s Board of Trustees implemented after the registrant last provided disclosure in response to this Item.
ITEM 11. CONTROLS AND PROCEDURES.
| | (a) | | The registrant’s principal executive and principal financial officers, or persons performing similar functions, have concluded that the registrant’s disclosure controls and procedures (as defined in Rule 30a-3(c) under the Investment Company Act of 1940, as amended (the “1940 Act”) (17 CFR 270.30a-3(c))) are effective, as of a date within 90 days of the filing date of this report that includes the disclosure required by this paragraph, based on their evaluation of the controls and procedures required by Rule 30a-3(b) under the 1940 Act (17 CFR 270.30a-3(b)) and Rules 13a-15(b) or 15d-15(b) under the Securities Exchange Act of 1934, as amended (the “Exchange Act”) (17 CFR 240.13a-15(b) or 240.15d-15(b)). |
| | (b) | | There were no changes in the registrant’s internal control over financial reporting (as defined in Rule 30a-3(d) under the 1940 Act (17 CFR 270.30a-3(d)) that occurred during the second fiscal quarter of the period covered by this report that has materially affected, or is reasonably likely to materially affect, the registrant’s internal control over financial reporting. |
ITEM 12. EXHIBITS.
File the exhibits listed below as part of this Form.
| | |
| (a)(1) | | Any code of ethics, or amendment thereto, that is the subject of the disclosure required by Item 2, to the extent that the registrant intends to satisfy the Item 2 requirements through filing of an exhibit: Not applicable because the code is posted on registrant’s website at www.nuveen.com/MutualFunds/ShareholderResources/FundGovernance.aspx and there were no amendments during the period covered by this report. (To view the code, click on Code of Conduct.) |
| |
| (a)(2) | | A separate certification for each principal executive officer and principal financial officer of the registrant as required by Rule 30a-2(a) under the 1940 Act (17 CFR 270.30a-2(a)) in the exact form set forth below: See EX-99.CERT attached hereto. |
| |
| (a)(3) | | Any written solicitation to purchase securities under Rule 23c-1 under the 1940 Act (17 CFR 270.23c-1) sent or given during the period covered by the report by or on behalf of the registrant to 10 or more persons: Not applicable to this registrant. |
| |
| (b) | | If the report is filed under Section 13(a) or 15(d) of the Exchange Act, provide the certifications required by Rule 30a-2(b) under the 1940 Act (17 CFR 270.30a-2(b)), Rule 13a-14(b) or Rule 15d-14(b) under the Exchange Act (17 CFR 240.13a-14(b) or 240.15d-14(b)), and Section 1350 of Chapter 63 of Title 18 of the United States Code (18 U.S.C. 1350) as an Exhibit. A certification furnished pursuant to this paragraph will not be deemed “filed” for purposes of Section 18 of the Exchange Act (15 U.S.C. 78r), or otherwise subject to the liability of that section. Such certification will not be deemed to be incorporated by reference into any filing under the Securities Act of 1933 or the Exchange Act, except to the extent that the registration specifically incorporates it by reference: See EX-99.906 CERT attached hereto. |
SIGNATURES
Pursuant to the requirements of the Securities Exchange Act of 1934 and the Investment Company Act of 1940, the registrant has duly caused this report to be signed on its behalf by the undersigned, thereunto duly authorized.
(Registrant) Nuveen Investment Trust
| | |
| |
| By (Signature and Title) | | /s/ Kevin J. McCarthy |
| | Kevin J. McCarthy |
| | Vice President and Secretary |
Date: November 5, 2015
Pursuant to the requirements of the Securities Exchange Act of 1934 and the Investment Company Act of 1940, this report has been signed below by the following persons on behalf of the registrant and in the capacities and on the dates indicated.
| | |
| |
| By (Signature and Title) | | /s/ Gifford R. Zimmerman |
| | Gifford R. Zimmerman |
| | Chief Administrative Officer |
| | (principal executive officer) |
Date: November 5, 2015
| | |
| |
| By (Signature and Title) | | /s/ Stephen D. Foy |
| | Stephen D. Foy |
| | Vice President and Controller |
| | (principal financial officer) |
Date: November 5, 2015