UNITED STATES
SECURITIES AND EXCHANGE COMMISSION
Washington, D.C. 20549
FORM N-CSR
CERTIFIED SHAREHOLDER REPORT OF REGISTERED MANAGEMENT
INVESTMENT COMPANIES
Investment Company Act file number 811-07619
Nuveen Investment Trust
(Exact name of registrant as specified in charter)
Nuveen Investments
333 West Wacker Drive, Chicago, IL 60606
(Address of principal executive offices) (Zip code)
Kevin J. McCarthy
Nuveen Investments
333 West Wacker Drive
Chicago, IL 60606
(Name and address of agent for service)
Registrant’s telephone number, including area code: (312) 917-7700
Date of fiscal year end: August 31
Date of reporting period: August 31, 2016
Form N-CSR is to be used by management investment companies to file reports with the Commission not later than 10 days after the transmission to stockholders of any report that is required to be transmitted to stockholders under Rule 30e-1 under the Investment Company Act of 1940 (17 CFR 270.30e-1). The Commission may use the information provided on Form N-CSR in its regulatory, disclosure review, inspection, and policy making roles.
A registrant is required to disclose the information specified by Form N-CSR, and the Commission will make this information public. A registrant is not required to respond to the collection of information contained in Form N-CSR unless the Form displays a currently valid Office of Management and Budget (“OMB”) control number. Please direct comments concerning the accuracy of the information collection burden estimate and any suggestions for reducing the burden to Secretary, Securities and Exchange Commission, 450 Fifth Street, NW, Washington, DC 20549-0609. The OMB has reviewed this collection of information under the clearance requirements of 44 U.S.C. ss.3507.
ITEM 1. REPORTS TO STOCKHOLDERS.
 | ||
| Mutual Funds |
| Nuveen Equity Funds |
| Annual Report August 31, 2016 |
| Share Class / Ticker Symbol | ||||||||||||||||
| Fund Name | Class A | Class C | Class R3 | Class R6 | Class I | |||||||||||
| ||||||||||||||||
Nuveen Large Cap Value Fund | NNGAX | NNGCX | NMMTX | NNGFX | NNGRX | |||||||||||
Nuveen Large Cap Core Fund | NLACX | NLCDX | — | NLCFX | NLCIX | |||||||||||
Nuveen Large Cap Growth Fund | NLAGX | NLCGX | — | NLAFX | NLIGX | |||||||||||
Nuveen Concentrated Core Fund | NCADX | NCAEX | — | NCARX | NCAFX | |||||||||||
Nuveen Core Dividend Fund | NCDAX | NCCDX | — | — | NCDIX | |||||||||||
Nuveen Growth Fund | NSAGX | NSRCX | NBGRX | — | NSRGX | |||||||||||
Nuveen Large Cap Core Plus Fund | NLAPX | NLPCX | — | — | NLPIX | |||||||||||
Nuveen Equity Long/Short Fund | NELAX | NELCX | — | — | NELIX | |||||||||||
Nuveen Equity Market Neutral Fund | NMAEX | NMECX | — | — | NIMEX | |||||||||||
| ||||||||||||
| ||||||||||||
| Life is Complex. | ||||||||||||
| Nuveen makes things e-simple. | ||||||||||||
| It only takes a minute to sign up for e-Reports. Once enrolled, you’ll receive an e-mail as soon as your Nuveen Fund information is ready. No more waiting for delivery by regular mail. Just click on the link within the e-mail to see the report and save it on your computer if you wish. | ||||||||||||
| Free e-Reports right to your e-mail! | ||||||||||||
www.investordelivery.com If you receive your Nuveen Fund distributions and statements from your financial advisor or brokerage account. | ||||||||||||
| or | www.nuveen.com/accountaccess If you receive your Nuveen Fund distributions and statements directly from Nuveen.
Must be preceded by or accompanied by a prospectus.
NOT FDIC INSURED MAY LOSE VALUE | |||||||||||
| ||||||||||||
of Contents
| 4 | ||||
| 5 | ||||
| 18 | ||||
| 21 | ||||
| 40 | ||||
| 49 | ||||
| 53 | ||||
| 54 | ||||
| 110 | ||||
| 112 | ||||
| 114 | ||||
| 119 | ||||
| 120 | ||||
| 138 | ||||
| 152 | ||||
| 153 | ||||
| 155 | ||||
| 162 | ||||
| NUVEEN | 3 |
to Shareholders

Dear Shareholders,
The U.S. economy is now seven years into the recovery, but its pace remains stubbornly subpar compared to past recoveries. Economic data continues to be a mixed bag, as it has been throughout this expansion period. While the unemployment rate fell below its pre-recession level and wages have grown, a surprisingly weak jobs growth report in May cast doubt over the future strength of the labor market. Subsequent employment reports have been stronger, however, easing fears that a significant downtrend was emerging. The housing market has improved markedly but its contribution to the recovery has been lackluster. Deflationary pressures, including weaker commodity prices, have kept inflation much lower for longer than many expected.
The U.S.’s modest expansion and positive employment trends led the U.S. Federal Reserve (Fed) to begin its path toward policy “normalization” by raising its benchmark interest rate at its December 2015 meeting. However, since then, the Fed has remained on hold for reasons ranging from domestic to international, which helped continue to prop up asset prices despite bouts of short-term volatility.
Outside the U.S., optimism has been harder to come by. Investors continue to adjust to the idea of a slower Chinese economy. The U.K.’s June 23rd “Brexit” vote to leave the European Union introduced a new set of economic and political uncertainties to the already fragile conditions across Europe. Moreover, there are growing concerns that global central banks’ unprecedented efforts to revive growth may be showing signs of fatigue. Interest rates are currently negative in Europe and Japan and near or at zero in the U.S., U.K. and elsewhere; nonetheless, growth has remained subdued.
Given muted global growth, the risk of policy errors by central banks around the world, the unfolding Brexit process and an uncertain political outlook with the November presidential election in the U.S. followed by key elections across Europe next year, we anticipate that turbulence remains on the horizon for the time being. In this environment, Nuveen remains committed to both managing downside risks and seeking upside potential. If you’re concerned about how resilient your investment portfolio might be, we encourage you to talk to your financial advisor.
On behalf of the other members of the Nuveen Fund Board, we look forward to continuing to earn your trust in the months and years ahead.
Sincerely,

William J. Schneider
Chairman of the Board
October 24, 2016
| 4 | NUVEEN |
Comments
Nuveen Large Cap Value Fund
Nuveen Large Cap Core Fund
Nuveen Large Cap Growth Fund
Nuveen Concentrated Core Fund
Nuveen Core Dividend Fund
Nuveen Growth Fund
Nuveen Large Cap Core Plus Fund
Nuveen Equity Long/Short Fund
Nuveen Equity Market Neutral Fund
These Funds are part of the Nuveen Large Cap Equity Series and feature portfolio management by Nuveen Asset Management, LLC, an affiliate of Nuveen Investments, Inc. Robert C. Doll, CFA, a senior portfolio manager and chief equity strategist at Nuveen Asset Management, is portfolio manager for all of the Funds. Effective December 31, 2015, Scott M. Tonneson, CFA, who was previously a portfolio manager for the Nuveen Equity Long/Short Fund, was added as a portfolio manager for the rest of the Nuveen Large Cap Equity Series. Anthony R. Burger, CFA, director of quantitative equity research, also serves as a portfolio manager for the Nuveen Equity Long/Short Fund.
On the following pages, the management team discusses economic and equity market conditions, key investment strategies and the Funds’ performance for the twelve-month reporting period ended August 31, 2016.
What factors affected the U.S. economy and financial markets during the twelve-month reporting period ended August 31, 2016?
Over the twelve-month reporting period, U.S. economic data continued to point to subdued growth, rising employment and tame inflation. Economic activity has continued to hover around a 2% annualized growth rate since the end of the Great Recession in 2009, as measured by real gross domestic product (GDP), which is the value of the goods and services produced by the nation’s economy less the value of the goods and services used up in production, adjusted for price changes. For the second quarter of 2016, real GDP increased at an annual rate of 1.1%, as reported by the “second” estimate of the Bureau of Economic Analysis, up from 0.8% in the first quarter of 2016.
The labor and housing markets improved over the reporting period, although the momentum appeared to slow toward the end of the reporting period. As reported by the Bureau of Labor Statistics, the unemployment rate fell to 4.9% in August 2016 from 5.1% in August 2015, and job gains averaged slightly above 200,000 per month for the past twelve months. The S&P CoreLogic Case-Shiller U.S. National Home Price Index, which covers all nine U.S. census divisions, recorded a 5.1% annual gain in July 2016 (most recent data available at the time this report was prepared) (effective July 26, 2016, the S&P/Case-Shiller U.S. National Home Price Index was renamed the S&P CoreLogic Case-Shiller U.S. National Home Price Index). The 10-City and 20-City Composites reported year-over-year increases of 4.2% and 5.0%, respectively.
Consumers, whose purchases comprise the largest component of the U.S. economy, benefited from employment growth and firming wages over the twelve-month reporting period. Although consumer spending gains were rather muted in the latter half of 2015, a spending surge in the second quarter of 2016 helped offset weaker business investment. A backdrop of low inflation also con-
Certain statements in this report are forward-looking statements. Discussions of specific investments are for illustration only and are not intended as recommendations of individual investments. The forward-looking statements and other views expressed herein are those of the portfolio managers as of the date of this report. Actual future results or occurrences may differ significantly from those anticipated in any forward-looking statements and the views expressed herein are subject to change at any time, due to numerous market and other factors. The Funds disclaim any obligation to update publicly or revise any forward-looking statements or views expressed herein.
Refer to the Glossary of Terms Used in this Report for further definition of the terms used within this section.
| NUVEEN | 5 |
Portfolio Managers’ Comments (continued)
tributed to consumers’ willingness to buy. The Consumer Price Index (CPI) rose 1.1% over the twelve-month reporting period ended August 2016 on a seasonally adjusted basis, as reported by the U.S. Bureau of Labor Statistics. The core CPI (which excludes food and energy) increased 2.3% during the same period, slightly above the Fed’s unofficial longer term inflation objective of 2.0%.
Business investment remained weak over the reporting period. Corporate earnings growth slowed during 2015, reflecting an array of factors ranging from weakening demand amid sluggish U.S. and global growth to the impact of falling commodity prices and a strong U.S. dollar. Although energy prices rebounded off their lows and the dollar pared some of its gains in the first half of 2016, caution prevailed. Financial market turbulence in early 2016 and political uncertainties surrounding the U.K.’s “Brexit” vote to leave the European Union (EU) and the upcoming U.S. presidential election dampened capital spending.
With the current expansion considered to be on solid footing, the U.S. Federal Reserve (Fed) prepared to raise one of its main interest rates, which had been held near zero since December 2008 to help stimulate the economy. After delaying the rate change for most of 2015 because of a weak global economic growth outlook, the Fed announced in December 2015 that it would raise the fed funds target rate by 0.25%. The news was widely expected and therefore had a relatively muted impact on the financial markets.
Although the Fed continued to emphasize future rate increases would be gradual, investors worried about the pace. This, along with uncertainties about the global macroeconomic backdrop, another downdraft in oil prices and a spike in stock market volatility triggered significant losses across assets that carry more risk and fueled demand for “safe haven” assets such as Treasury bonds and gold from January through mid-February. However, fear began to subside in March 2016, supporting assets that carry more risk. The Fed held the rate steady at both the January and March policy meetings, as well as lowered its expectations to two rate increases in 2016 from four. Also boosting investor confidence were reassuring statements from the European Central Bank, some positive economic data in the U.S. and abroad, a retreat in the U.S. dollar and an oil price rally. At its April 2016 meeting, the Fed indicated its readiness to raise its benchmark rate at the next policy meeting in June. However, a very disappointing jobs growth report in May and the significant uncertainty surrounding the U.K.’s Brexit vote led the Fed to again hold rates steady at its June and July meetings. At the September meeting, the Fed indicated the case for increasing rates had strengthened but left the rate unchanged in anticipation of further progress toward its objectives.
The U.K.’s vote on June 23, 2016 to leave the EU caught investors off guard. In response, U.K. sterling fell precipitously, global equities were turbulent and safe-haven assets such as gold, the U.S. dollar and U.S. Treasuries saw notable inflows. However, the markets stabilized fairly quickly, buoyed by reassurances from global central banks and a perception that the temporary price rout presented an attractive buying opportunity. Although many political and economic uncertainties for the U.K. and the EU remain, market volatility was relatively subdued throughout July and August, as concerns of a Brexit-induced financial crisis abated.
The U.S. equity market was one of the few bright spots among developed markets around the globe, gaining more than 12% over the reporting period as measured by the S&P 500® Index. Across the capitalization spectrum in the U.S., investors favored the relatively safer, more defensive areas of the market, leading value stocks to strongly outperform growth stocks during this time frame. Emerging markets also significantly outpaced other developed markets overseas, particularly Europe, as investors returned to this asset class in the second half of the reporting period, largely due to commodity price stability and the ongoing search for yield and returns. The MSCI Emerging Markets Index also advanced slightly more than 12%, while European markets were in negative territory for the period. The Japanese stock market continued to be haunted by yen appreciation and the Bank of Japan’s decision to provide only modest additional stimulus, ending the period with positive, but lackluster returns.
How did the Funds perform during the twelve-month reporting period ended August 31, 2016?
The tables in the Fund Performance and Expense Ratios section of this report provide total return performance information for the Funds for the one-year, five-year, ten-year and/or since inception periods ended August 31, 2016. Each Fund’s Class A Share total returns at net asset value (NAV) are compared with the performance of their corresponding market index and Lipper classification average. A more detailed account of each Fund’s performance is provided later in this report.
What strategies were used to manage the Funds during the twelve-month reporting period ended August 31, 2016 and how did these strategies influence performance?
| 6 | NUVEEN |
Nuveen Large Cap Value Fund
The Fund’s Class A Shares at NAV underperformed both the Russell 1000® Value Index and the comparative Lipper classification average during the twelve-month reporting period ended August 31, 2016.
The Nuveen Large Cap Value Fund seeks long-term capital appreciation by investing primarily in large-capitalization stocks of U.S. companies. The investment team selects securities using the same disciplined approach used with all of the Funds in the Large Cap Equity Series, balancing fundamental analysis with quantitative techniques. We start with the securities found in the Russell 1000® Value Index, which are primarily large-cap value companies and use a multi-factor quantitative ranking process to identify potential holdings. We then apply a fundamental overlay from Nuveen Asset Management’s team of sector-specific analysts, using our industry perspectives to select holdings. Our goal is to invest primarily in companies that exhibit improving business fundamentals, strong management, identifiable catalysts and attractive valuations. We believe that buying such companies at reasonable prices can provide above-market returns over time.
During the reporting period, the Fund underperformed mainly due to broad-based stock selection issues, particularly in the energy, industrials, consumer discretionary and health care sectors. An overweight position in consumer discretionary (the worst performing sector in the index) and no exposure to the REITs sector (one of the top performing areas in the index) were also drags on results. In addition, the Fund was hindered by its emphasis on stocks with lower price/earnings (P/E) ratios, greater volatility, more variation in earnings and higher degrees of leverage.
The Fund’s three most significant detractors during the reporting period were energy related, including Louisiana-based Tidewater Inc., the leading provider of larger offshore support vessels (OSVs) for drill rig support and maintenance to the global energy industry. The company significantly underperformed the energy equipment and services industry throughout the year as the drop in crude oil prices resulted in stalling demand for OSVs and deteriorating earnings per share. In August 2016, Tidewater’s shares slumped further after the company reported a greater-than-expected loss for the fiscal quarter ended June 30, 2016 and a potential Chapter 11 bankruptcy filing. Also, the Fund’s performance was hindered by a position in the U.K.-based Ensco Plc. The company’s shares were on a downward trajectory throughout much of the reporting period in tandem with the price of oil as investors anticipated the resulting slowdown in production, revenue and earnings. Although oil prices rallied to around the $50-per-barrel mark for West Texas Intermediate (WTI) crude in June, they moved lower throughout the remainder of the reporting period after China reported a significant increase in diesel and gasoline exports and Organization of the Petroleum Exporting Countries (OPEC) countries failed to reach an agreement to freeze output. Likewise, shares of Atwood Oceanics Inc., another offshore driller that specializes in exploratory and developmental oil and gas wells, have fallen even further than the industry as a whole during the reporting period. The company’s successful cost-cutting initiatives and recent operating results that exceeded Wall Street analysts’ expectations have helped shares rally back slightly from the 16-year low hit in early February 2016. However, investors remain concerned about Atwood Oceanics’ lack of near-term contract coverage, with several of its dozen rigs standing idle and three more rolling off their contracts by year-end. The company also has two ultra-deepwater drillships under construction in Korea that remain uncontracted. That being said, we continue to maintain our holding in Atwood Oceanics because we believe the sentiment is overly negative, which in turn makes the risk and reward attractive as we look forward over the coming quarters.
On the positive side, the Fund benefited from an underweight position in higher momentum stocks (those that have recently performed well) as they tended to underperform during the reporting period. Also, stock selection was favorable in the materials, financials and consumer staples sectors. The Fund was also rewarded for overweight positions in industrials, telecommunication services and information technology, three sectors that produced returns in excess of 20% during the reporting period. In addition, an underweight in financials, one of the worst performing sectors in the benchmark, boosted the Fund’s results.
The top performer for the Fund was industrials firm Joy Global Inc., a major manufacturer and servicer of heavy equipment used in the mining industry. After a rough start earlier in the reporting period due to steady declines for its products and services, Joy Global more recently reported earnings results that showed management was able to successfully control operating costs. The company also benefited from some encouraging signs that orders may increase for the second sequential quarter. Then in late July 2016, Joy Global announced an agreement to be acquired by Japanese firm Komatsu Ltd. in a $3.7 billion all-cash transaction. The deal will make Komatsu one of the two largest players in the mining equipment industry alongside Caterpillar. We continue to maintain our holding in Joy Global. Also, the Fund saw strength from its position in anti-aging company Nu Skin Enterprises Inc., which develops
| NUVEEN | 7 |
Portfolio Managers’ Comments (continued)
and sells skincare products and nutrition products. Investors cheered the turnaround results evident in Nu Skin’s first-quarter earnings as revenues regained some strength and cost controls helped earnings rise more than expected. Also, management revealed in mid-June that a Chinese consortium made a $210 million strategic investment in the company, further boosting confidence in its business model. In the materials sector, Indiana-based steel producer Steel Dynamics Inc. was a standout performer for the Fund. The company reported stronger-than-expected second quarter earnings driven by strength in flat-rolled steel pricing and steady demand from the automotive and construction industries. Pricing in the steel industry has improved as imports have fallen 30% year-over-year, easing the supply glut from recent years. Steel Dynamics also acquired Vulcan Threaded Products Inc., which utilizes steel products in its manufacturing, with the hopes of reducing volatility during both strong and weak market cycles.
Nuveen Large Cap Core Fund
The Fund’s Class A Shares at NAV outperformed the comparative Lipper classification average, but underperformed the Russell 1000® Index during the twelve-month reporting period ended August 31, 2016.
The Nuveen Large Cap Core Fund seeks long-term capital appreciation by investing primarily in stocks of well-run companies. The investment team selects securities using the same disciplined approach used with all of the Funds in the Large Cap Equity Series, balancing fundamental analysis with quantitative techniques. We start with the securities found in the Russell 1000® Index, which are primarily large-cap companies, and use a multi-factor quantitative ranking process to identify potential holdings. We then apply a fundamental overlay from Nuveen Asset Management’s team of sector-specific analysts, using our industry perspectives to select holdings. Our goal is to invest primarily in companies that exhibit improving business fundamentals, strong management, identifiable catalysts and attractive valuations. We believe that buying such companies at reasonable prices can provide above-market returns over time.
During the reporting period, the Fund benefited from an underweight position in higher momentum stocks as they tended to underperform. Also, stock selection was favorable in the consumer staples, materials and consumer discretionary sectors.
In terms of stock specific factors, the Fund saw strong results from global e-commerce marketplace provider Groupon Inc., which connects millions of worldwide subscribers with area merchants offering deals for activities, travel, goods and services. In mid-February 2016, China’s e-commerce giant Alibaba Group disclosed that it had taken a small minority stake in the company, which gave investors hope for future growth prospects. Then in August 2016, shares of Groupon surged after the company reported revenues that beat expectations and, more importantly, offered an upbeat full-year sales forecast. These results reassured investors that management’s efforts to focus on sales in the more profitable North American marketplace are being rewarded. Another top performer for the Fund was industrials firm Joy Global Inc., a major manufacturer and servicer of heavy equipment used in the mining industry. After a rough start earlier during the reporting period due to steady declines for its products and services, Joy Global more recently reported earnings results that showed management was able to successfully control operating costs. The company also benefited from some encouraging signs that orders may increase for the second sequential quarter. Then in late July 2016, Joy Global announced an agreement to be acquired by Japanese firm Komatsu Ltd. in a $3.7 billion all-cash transaction. The deal will make Komatsu one of the two largest players in the mining equipment industry alongside Caterpillar. We continue to maintain our holding in Joy Global. Also, the Fund saw strength from its position in anti-aging company Nu Skin Enterprises Inc., which develops and sells skincare products and nutrition products. Investors cheered the turnaround results evident in Nu Skin’s first-quarter earnings as revenues regained some strength and cost controls helped earnings rise more than expected. Also, management revealed in mid-June that a Chinese consortium made a $210 million strategic investment in the company, further boosting confidence in its business model.
During the reporting period, the Fund underperformed its Russell benchmark mainly due to stock selection in the industrials, energy and information technology sectors. The Fund was also hindered by its emphasis on stocks with lower price/earnings (P/E) ratios, greater volatility, more variation in earnings and higher degrees of leverage. In addition, an underweight position in consumer staples and no exposure to the REITs sector, which was the top performing area in the index, were also drags on results.
The Fund’s two most significant detractors during the reporting period were energy related, including Denbury Resources Inc., an independent oil and gas exploration and production (E&P) company focused in the Gulf Coast and Rocky Mountain regions of the United States. As with all E&P companies, Denbury’s performance is closely correlated to the price of crude oil since the company
| 8 | NUVEEN |
derives virtually all of its revenues from oil sales. Although the company’s shares remained under pressure for much of the reporting period, Denbury’s management team did make progress to improve the company’s liquidity position and overall balance sheet through negotiated debt exchanges. The company reported first- and second-quarter earnings that showed management’s ability to implement solid cost reductions. Also, the Fund’s results were hampered by a position in Louisiana-based Tidewater Inc., the leading provider of larger offshore support vessels (OSVs) for drill rig support and maintenance to the global energy industry. The company significantly underperformed the energy equipment and services industry throughout the year as the drop in crude oil prices resulted in stalling demand for OSVs and deteriorating earnings per share. In August 2016, Tidewater’s shares slumped further after the company reported a greater-than-expected loss for the fiscal quarter ended June 30, 2016 and a potential Chapter 11 bankruptcy filing. Finally, in the consumer discretionary sector, we saw weak results from a position in Aaron’s Inc., a retailer that offers big-ticket household items such as furniture and electronics to customers on a rent-to-own basis. Aaron’s shares fell sharply in October 2015 and never recovered after the company reported quarterly results that missed Wall Street expectations, while also providing downbeat full-year guidance. Concerns over significantly higher bad debt expense from the company’s rental segment and declining same-store sales suggested a broader downturn in the rent-to-own industry.
Nuveen Large Cap Growth Fund
The Fund’s Class A Shares at NAV underperformed both the Russell 1000® Growth Index and the comparative Lipper classification average during the twelve-month reporting period ended August 31, 2016.
The Nuveen Large Cap Growth Fund seeks long-term capital appreciation by investing primarily in stocks of well-run companies that exhibit above-average growth potential. The investment team selects securities using the same disciplined approach used with all of the Funds in the Large Cap Equity Series, balancing fundamental analysis with quantitative techniques. We start with the securities found in the Russell 1000® Growth Index, which are primarily large-cap growth-oriented companies, and use a multi-factor quantitative ranking process to identify potential holdings. We then apply a fundamental overlay from Nuveen Asset Management’s team of sector-specific analysts, using our industry perspectives to select holdings. Our goal is to invest primarily in companies that exhibit improving business fundamentals, strong management, identifiable catalysts and attractive valuations. We believe that buying such companies at reasonable prices can provide above-market returns over time.
During the reporting period, the Fund underperformed due to a combination of sector positioning and stock selection. In terms of sector exposures, our overweight position in energy and underweight in consumer staples were both drags on results, while stock selection in industrials detracted significantly. Additionally, the Fund was hindered by its emphasis on stocks with lower price/earnings (P/E) ratios, greater volatility, higher degrees of leverage and more variation in earnings.
Two of the three most significant detractors for the Fund were found in the consumer discretionary sector. Performance was hindered by an underweight position in online retail giant Amazon.com, Inc., a fairly large benchmark constituent. After its shares sold off sharply in January and February 2016, they subsequently rebounded strongly over the remainder of the period as the company reported first-quarter profits and revenues in April that topped Wall Street estimates. Amazon’s big tailwind continued to be strong growth and profitability from its Amazon Web Services cloud-hosting business. The company also showed greater adoption of its Amazon Prime service internationally as well as significant gains in its e-commerce business versus the overall weakness seen in brick-and-mortar retail. Also, a position in American variety store chain Dollar General Corporation was a source of underperformance for the Fund. Toward the end of the reporting period, the company reported on its fiscal second quarter, surprising investors by revealing that slowing traffic trends and falling food prices had a negative impact on earnings, as well as the outlook for the coming quarters. As a result, Dollar General’s shares dropped sharply in late August 2016. In the information technology space, the Fund was hindered by an underweight position in Facebook Inc., which also represents a large weight in the Russell 1000® Growth Index. Investors’ expectations for earnings improved due to evidence of the company’s success in growing its user base and mobile business, where users are spending more time and money, which is leading to increased overall advertising revenues. Facebook comes in second only to Alphabet’s Google in the U.S. mobile advertising market, but is gaining ground on the search giant. The company is particularly well positioned as video viewing accelerates and advertisers are increasing the portion of their budgets allocated to highly-targeted online video campaigns.
On the positive side, the Fund benefited from an underweight position in higher momentum stocks (those that have recently performed well) as they tended to underperform during the reporting period. Also, stock selection was favorable in the energy and materials sectors.
| NUVEEN | 9 |
Portfolio Managers’ Comments (continued)
In terms of stock-specific factors, the Fund saw strong results from global e-commerce marketplace provider Groupon Inc., which connects millions of worldwide subscribers with area merchants offering deals for activities, travel, goods and services. In mid-February 2016, China’s e-commerce giant Alibaba Group disclosed that it had taken a small minority stake in the company, which gave investors hope for future growth prospects. Then in August 2016, shares of Groupon surged after the company reported revenues that beat expectations and, more importantly, offered an upbeat full-year sales forecast. These results reassured investors that management’s efforts to focus on sales in the more profitable North American marketplace are being rewarded. Also, the Fund saw strength from its position in anti-aging company Nu Skin Enterprises Inc., which develops and sells skincare products and nutrition products. Investors cheered the turnaround results evident in Nu Skin’s first-quarter earnings as revenues regained some strength and cost controls helped earnings rise more than expected. Also, management revealed in mid-June that a Chinese consortium made a $210 million strategic investment in the company, further boosting confidence in its business model. In addition, the Fund benefited from a position in industrials firm Huntington Ingalls Industries Inc., the largest military ship designer, builder and repairer in the United States. The company’s shares rose significantly during the reporting period and reached all-time highs in August. Despite some challenges from its Newport shipbuilding segment, the company’s other Ingalls shipbuilding segment surpassed investor’s expectations with better revenues and margins. Huntington Ingalls is also benefiting from the recent five-year budget released by the U.S. Navy that allocates more than $81 billion toward the purchase of warships, submarines and other vessels.
Nuveen Concentrated Core Fund
The Fund’s Class A Shares at NAV underperformed both the Russell 1000® Index and the comparative Lipper classification average during the twelve-month reporting period ended August 31, 2016.
The Nuveen Concentrated Core Fund seeks long-term capital appreciation by investing in a highly concentrated portfolio of approximately 20 stocks of well-run companies that the investment team believes are attractive. The team selects securities using the same disciplined approach used with all of the Funds in the Large Cap Equity Series, balancing fundamental analysis with quantitative techniques. We start with the securities found in the Russell 1000® Index, which are primarily large-cap companies, and use a multifactor quantitative ranking process to identify potential holdings. We then apply a fundamental overlay from Nuveen Asset Management’s team of sector-specific analysts, using our industry perspectives to select holdings. Our goal is to invest primarily in companies that exhibit improving business fundamentals, strong management, identifiable catalysts and attractive valuations. We believe that buying such companies at reasonable prices can provide above-market returns over time.
During the reporting period, the Fund underperformed mainly due to broad-based stock selection issues, particularly in the industrials sector, as well as in information technology and health care. The Fund’s overweight position in health care, which was close to double the index weight, was also a drag on results as the sector was the weakest performer within the Russell 1000® during the reporting period. In addition, we emphasized stocks with lower price/earnings (P/E) ratios and stocks that showed more variation in earnings, which hampered returns during the reporting period.
The leading detractor from the industrials sector was a position in Delta Air Lines Inc. Following Delta’s strong advance from 2013-2015, its shares were on a downward trajectory in 2016 along with the rest of the airline industry. Several significant events raised concerns that travel demand would slacken including the Florida nightclub shootings, the U.K.’s unexpected Brexit vote to leave the EU, the spread of the Zika virus and heightened terrorist activity in Europe. Investors were also focused on declining PRASM (passenger revenue per available seat mile) figures, which were the result of airlines adding too much capacity when oil prices were falling. Analysts’ downgrades of airline stocks also likely exacerbated the negative sentiment surrounding this industry. Two of the Fund’s other significant detractors were found in the health care sector: Gilead Sciences Inc. and AmerisourceBergen Corporation. American biopharmaceutical firm Gilead Sciences develops and commercializes primarily antiviral drugs used to treat disorders such as HIV, Hepatitis B, Hepatitis C and influenza. The company’s shares have fallen significantly since hitting an all-time high in mid-2015. Investors have become increasingly frustrated with slower patient growth and stabilizing pricing trends for the company’s signature Hepatitis C franchise, as well as its future growth prospects for drugs in the pipeline. In addition, shares of pharmaceutical sourcing and distribution company AmerisourceBergen fell during the period after the company lowered its 2016 earnings guidance. Broad industry concerns surrounding drug distributors came into focus during the first part of 2016 as Wall Street analysts cited the slowdown in new generics coming to the market. AmerisourceBergen shares were also weighed down by the generally weak flu season and growing concern that competition among major players could also erode the company’s future earnings growth.
| 10 | NUVEEN |
On the positive side, the Fund’s underweight in higher momentum stocks and overweight in higher dividend yielding stocks helped its return during the reporting period. Also, the Fund benefited from stock selection and an overweight in telecommunication services and stock selection in financials.
The Fund’s top performer was CenturyLink Inc., the third largest telecommunications company in the U.S., which saw its shares rebound after underperforming during the previous reporting period. CenturyLink’s announcement regarding a strategic review of its datacenter business caught the attention of investors in late 2015. When the company reported its fourth-quarter results, investors were pleasantly surprised by revenues and earnings that were much better than some expected. Our position in UnitedHealth Group Incorporated, the largest of the U.S. health insurers, also contributed to performance again during this reporting period. After experiencing some uncertainty in mid-2015, company management showed much more confidence after reporting fourth-quarter results. Medical cost trends were better than the company expected, while management’s outlook heading into 2016 was also more promising. In 2016, UnitedHealth announced strong first- and second-quarter earnings, propelled in part by its powerhouse OptumRX and OptumHealth divisions, and raised its quarterly dividend by 25% in mid-summer. These factors helped UnitedHealth Group’s shares to outperform many of its sector peers. In addition, the Fund benefited from a position in The Travelers Companies, Inc., one of the nation’s leading providers of auto, homeowners and commercial property/casualty insurance. Its shares appreciated strongly early in the reporting period after the company reported it had beaten estimates for revenue and earnings for the third time in the past four fiscal quarters due to solid underwriting results. The company’s focus on reducing expenses and acquisition costs has also led to improving margins. Travelers Companies continues to manage well across its diverse insurance lineup and remains committed to return capital to shareholders via buybacks and dividends.
Nuveen Core Dividend Fund
The Fund’s Class A Shares at NAV underperformed both the Russell 1000® Index and the comparative Lipper classification average during the twelve-month reporting period ended August 31, 2016.
The Nuveen Core Dividend Fund seeks to provide total return from dividend income and long-term capital appreciation by investing primarily in dividend-paying equity securities. The investment team selects securities using the same disciplined approach used with all of the Funds in the Large Cap Equity Series, balancing fundamental analysis with quantitative techniques. We start with the securities found in the Russell 1000® Index, which are primarily large-cap companies and use a multi-factor quantitative ranking process to identify potential holdings. We then apply a fundamental overlay from Nuveen Asset Management’s team of sector-specific analysts, using our industry perspectives to select holdings. Our goal is to invest primarily in companies that pay dividends, have the potential to increase their dividends, and that exhibit improving business fundamentals, strong management, identifiable catalysts and attractive valuations. We believe that buying such companies at reasonable prices can provide above-market returns over time.
During the reporting period, the Fund underperformed mainly due to stock selection, particularly in the energy, consumer discretionary, financials and utilities sectors. The Fund’s underweight position in consumer staples and overweight in consumer discretionary also detracted. Finally, we emphasized stocks that showed more volatility, lower price/earnings (P/E) ratios and more variation in earnings, strategies that all hampered returns during the period.
The Fund’s three most significant detractors during the reporting period were energy related, including Louisiana-based Tidewater Inc., the leading provider of larger offshore support vessels (OSVs) for drill rig support and maintenance to the global energy industry. The company significantly underperformed the energy equipment and services industry throughout the year as the drop in crude oil prices resulted in stalling demand for OSVs and deteriorating earnings per share. In August 2016, Tidewater’s shares slumped further after the company reported a greater-than-expected loss for the fiscal quarter ended June 30, 2016 and a potential Chapter 11 bankruptcy filing. Another laggard was Denbury Resources Inc., an independent oil and gas exploration and production (E&P) company focused in the Gulf Coast and Rocky Mountain regions of the United States. As with all E&P companies, Denbury’s performance is closely correlated to the price of crude oil since the company derives virtually all of its revenues from oil sales. Although the company’s shares remained under pressure for much of the period, Denbury’s management team did make progress to improve the company’s liquidity position and overall balance sheet through negotiated debt exchanges. The company reported first- and second-quarter earnings that showed management’s ability to implement solid cost reductions. The Fund also saw weakness from a position in CVR Energy Inc., a holding company with majority stakes in both petroleum refining and nitrogen fertilizer manufacturing. Both of these businesses should be benefiting from low oil and gas prices because they use those commodities as feed-
| NUVEEN | 11 |
Portfolio Managers’ Comments (continued)
stocks. However, CVR Energy’s refining business experienced lower realized margins during the reporting period, while the fertilizer segment also reported a difficult quarter caused by lower pricing and sales volume. Given CVR Energy’s large stakes in these two businesses, its shares suffered; although they did see a modest jump in the final month of the reporting period after rumors circulated about a potential buyout of a smaller refining peer, Delek US Holdings Inc.
On the positive side, the Fund’s underweights in both momentum stocks and growth-oriented stocks within the index boosted returns as the market shifted away from these segments. An overweight in higher dividend yielding stocks also proved beneficial. At the same time, the Fund benefited from an underweight position in financials, a sector that underperformed the overall benchmark return by nearly 7%. In addition, stock selection was favorable in the consumer staples sector.
One of the top performers for the Fund during this reporting period was industrials firm Joy Global Inc., a major manufacturer and servicer of heavy equipment used in the mining industry. After a rough start earlier during the reporting period due to steady declines for its products and services, Joy Global more recently reported earnings results that showed management was able to successfully control operating costs. The company also benefited from some encouraging signs that orders may increase for the second sequential quarter. Then in late July 2016, Joy Global announced an agreement to be acquired by Japanese firm Komatsu Ltd. in a $3.7 billion all-cash transaction. The deal will make Komatsu one of the two largest players in the mining equipment industry alongside Caterpillar. We continue to maintain our holding in Joy Global. In consumer discretionary, the Fund benefited from its holding in Cablevision Systems Corporation, the leading communications service provider for the New York metropolitan area. Shares of the company advanced strongly early in the reporting period after European cable company Altice Group formally announced its takeover bid. The acquisition, which was completed in June 2016, created the fourth largest cable operator in the U.S. market serving customers across 20 states. In the financial sector, the Fund also saw favorable results from Communications Sales & Leasing Inc., a REIT. The company acquires and constructs mission critical communications infrastructure including wireless infrastructure solutions for the communications industry. Shares advanced strongly after the company reported better-than-expected first-quarter results. Communications Sales & Leasing is benefiting from increased demand for data services and its prudent development of new tower-related assets to support the company’s data transport business segment.
Nuveen Growth Fund
The Fund’s Class A Shares at NAV outperformed the comparative Lipper classification average, but underperformed the Russell 1000® Growth Index during the twelve-month reporting period ended August 31, 2016.
The Nuveen Growth Fund seeks long-term capital appreciation by investing primarily in stocks of well-run companies that exhibit above-average growth potential combined with durable and stable earnings streams. The team selects securities using the same disciplined approach used with all of the Funds in the Large Cap Equity Series, balancing fundamental analysis with quantitative techniques. We begin with the securities found in the Russell 1000® Growth Index, which are primarily large-cap growth-oriented companies and use a multi-factor quantitative ranking process to identify potential holdings. We then apply a fundamental overlay from Nuveen Asset Management’s team of sector-specific analysts, using our industry perspectives to select growth-oriented holdings. Our goal is to invest primarily in companies that exhibit stable and consistent earnings growth, defendable competitive advantages, strong management and low dependence on capital markets. We believe that buying such companies at reasonable prices can provide above-market returns over time.
During the reporting period, the Fund benefited from stock selection. Individual stock selection in the health care sector contributed to performance. Also, underweight positions in stocks with the highest projected growth rates and stocks that exhibited more volatility and more variation in earnings were successful strategies during the reporting period. An overweight position in higher dividend yielding stocks was also beneficial.
Two of the Fund’s top contributors were found in the health care sector. In the case of biotechnology firm Biogen Inc., the Fund was rewarded for our well-timed sale and subsequent repurchase of the stock. The company focuses on developing and manufacturing therapies for serious neurological, autoimmune and rare diseases. With the political cloud and controversy surrounding drug pricing, we exited our Biogen position in mid-April to look for other opportunities that offered better risk/reward profiles. However, we decided to repurchase Biogen in mid-July right before the company’s second quarter earnings, which showed higher-than-expected revenues from its hemophilia and biosimilar drugs, as well as disciplined expense controls. Our position in UnitedHealth Group Incorporated, the largest of the U.S. health insurers, also contributed to performance again during this reporting period. After
| 12 | NUVEEN |
experiencing some uncertainty in mid-2015, company management showed much more confidence after reporting fourth-quarter results. Medical cost trends were better than the company expected, while management’s outlook heading into 2016 was also more promising. In 2016, UnitedHealth announced strong first- and second-quarter earnings, propelled in part by its powerhouse OptumRX and OptumHealth divisions, and raised its quarterly dividend by 25% in mid-summer. These factors helped UnitedHealth Group’s shares to outperform many of its sector peers. In the consumer staples sector, the Fund benefited from a position in soft drink maker and distributor Dr. Pepper Snapple Group, Inc. Throughout the reporting period, the company reported strong sales trends and solid quarterly earnings that beat consensus driven by solid execution, pricing gains, product and packaging innovations, aggressive marketing programs and productivity improvements. Company management also provided upbeat guidance several times, which gave more support to the already significant advance in Dr. Pepper Snapple’s share price.
The Fund underperformed the Russell benchmark mainly due to sector positioning, including an overweight to the negatively performing health care sector and an underweight to the top performing REITs sector. An overweight to stocks with lower price/earnings (P/E) ratios also did not benefit returns. In addition, stock selection was unfavorable in the consumer discretionary sector.
In the discretionary sector, the Fund was hindered by an underweight position in online retail giant Amazon.com, Inc., a fairly large benchmark constituent. After its shares sold off sharply in January and February 2016, they subsequently rebounded strongly over the remainder of the reporting period as the company reported first-quarter profits and revenues in April that topped Wall Street estimates. Amazon’s big tailwind continued to be strong growth and profitability from its Amazon Web Services cloud-hosting business. The company also showed greater adoption of its Amazon Prime service internationally as well as significant gains in its e-commerce business versus the overall weakness seen in brick-and-mortar retail. In information technology, the Fund’s results were hurt by an underweight position in Facebook Inc., which also represents a large weight in the Russell 1000® Growth Index. Investors’ expectations for earnings improved due to evidence of the company’s success in growing its user base and mobile business, where users are spending more time and money, which is leading to increased overall advertising revenues. Facebook comes in second only to Alphabet’s Google in the U.S. mobile advertising market, but is gaining ground on the search giant. The company is particularly well positioned as video viewing accelerates and advertisers are increasing the portion of their budgets allocated to highly targeted online video campaigns. In addition, shares of pharmaceutical sourcing and distribution company AmerisourceBergen Corporation fell significantly during the reporting period after the company lowered its 2016 earnings guidance. Broad industry concerns surrounding drug distributors came into focus during the first part of 2016 as Wall Street analysts cited the slowdown in new generics coming to the market. AmerisourceBergen shares were also weighed down by a generally weak flu season and growing concern that competition among major players could also erode the company’s future earnings growth.
Nuveen Large Cap Core Plus Fund
The Fund’s Class A Shares at NAV underperformed the Russell 1000® Index and the comparative Lipper classification average during the twelve-month reporting period ended August 31, 2016.
The Nuveen Large Cap Core Plus Fund seeks long-term capital appreciation by investing in both long and short positions primarily of large-capitalization stocks from U.S. companies. The investment team selects securities using the same disciplined approach used with all of the Funds in the Large Cap Equity Series, balancing fundamental analysis with quantitative techniques. We start with the securities found in the Russell 1000® Index, which are primarily large-cap companies, and use a multi-factor quantitative ranking process to identify potential holdings. We then apply a fundamental overlay from Nuveen Asset Management’s team of sector-specific analysts, using our industry perspectives to select holdings. Our goal is to invest in long positions of companies that exhibit improving business fundamentals, strong management, identifiable catalysts and attractive valuations. We believe that buying such companies at reasonable prices can provide above-market returns over time. At the same time, the management team will typically take short positions in companies that it expects to underperform. The team expects the Fund to maintain approximately 100% net long exposure to the equity market (long 130% market value versus short 30% market value); however, the long and short positions will vary in size as market conditions change.
The Fund underperformed the index mainly due to stock selection in the long portion of the portfolio, particularly in the consumer discretionary, energy, industrials and information technology sectors. Sector allocations were also somewhat of a drag on results, including an underweight in the consumer staples sector, net short exposure in the REITs sector and an overweight in the worst performing consumer discretionary sector. Finally, we emphasized stocks with lower price/earnings (P/E) ratios and stocks that exhibited more volatility and more variation in earnings, strategies that all hampered returns during the reporting period.
| NUVEEN | 13 |
Portfolio Managers’ Comments (continued)
The two most significant detractors among the Fund’s long positions were energy related, including Louisiana-based Tidewater Inc., the leading provider of larger offshore support vessels (OSVs) for drill rig support and maintenance to the global energy industry. The company significantly underperformed the energy equipment and services industry as the drop in crude oil prices resulted in stalling demand for OSVs and deteriorating earnings per share. In August 2016, Tidewater’s shares slumped further after the company reported a greater-than-expected loss for the fiscal quarter ended June 30, 2016 and a potential Chapter 11 bankruptcy filing. Another energy-related laggard was a long position in Denbury Resources Inc., an independent oil and gas exploration and production (E&P) company focused in the Gulf Coast and Rocky Mountain regions of the United States. As with all E&P companies, Denbury’s performance is closely correlated to the price of crude oil since the company derives virtually all of its revenues from oil sales. Although the company’s shares remained under pressure for much of the reporting period, Denbury’s management team did make progress to improve the company’s liquidity position and overall balance sheet through negotiated debt exchanges. The company reported first- and second-quarter earnings that showed management’s ability to implement solid cost reductions.
The Fund’s short position in DreamWorks Animation SKG Inc. hindered results during the reporting period. The company is best known for its blockbuster animated film franchises such as “Shrek,” “Madagascar” and “Kung Fu Panda.” In late April 2016, cable provider Comcast announced plans for its NBCUniversal division to acquire DreamWorks in another all-cash transaction that represented a roughly 50% premium to where the stock traded before the announcement. Also, a short position in medical equipment company Edwards Lifesciences Corp. detracted. The company focuses on the development of tissue heart valves and related valve repair products. Edwards LifeSciences shares surged to all-time highs during the reporting period on the back of a series of positive developments. The company reported favorable clinical trial data surrounding its heart valve device Sapien 3 in April 2016, while also benefiting from a reacceleration in European sales of its TAVR heart valve and greater-than-expected FDA approvals for TAVR in the United States.
On the positive side, short positions, in aggregate, added value. Stock selection was particularly beneficial in the materials and consumer staples sectors. Also, the Fund’s results were aided by an overweight position in the industrials sector. In addition, the Fund benefited from underweight positions in higher momentum stocks and more growth-oriented stocks as they tended to underperform during the reporting period.
As mentioned, the Fund benefited overall from its short positions, including offshore oil exploration and production company Cobalt International Energy Inc. As the price of crude oil declined during the reporting period, many energy companies came under increasing pressure. Investors further punished Cobalt’s stock price and questioned the company’s viability after its deal to sell some of its offshore exploration assets in Angola to oil and gas producer Sonangol fell apart because the company couldn’t obtain funding. With the deal breakdown, Cobalt International will now be forced to remarket the Angolan assets when offshore asset values are very depressed. The Fund also benefited from a short position SunPower Corporation, a manufacturer and provider of solar power technology to residential, commercial and utility-scale power plant customers worldwide. The company’s shares initially rose early in the period following the signing of an international climate change pact in Paris and an agreement by Congress to extend a key federal tax credit for the industry. However, the solar industry has had a much rougher road in 2016 amid oversupply concerns, a slowdown in Chinese demand and financial troubles at several high profile companies. The uncertainty surrounding the U.S. presidential election also weighs on the sector because the results could alter the renewable energy policy landscape.
In terms of successful long positions, the top performer for the Fund during this reporting period was industrials firm Joy Global Inc., a major manufacturer and servicer of heavy equipment used in the mining industry. After a rough start earlier during the reporting period due to steady declines for its products and services, Joy Global more recently reported earnings results that showed management was able to successfully control operating costs. The company also benefited from some encouraging signs that orders may increase for the second sequential quarter. Then in late July 2016, Joy Global announced an agreement to be acquired by Japanese firm Komatsu Ltd. in a $3.7 billion all-cash transaction. The deal will make Komatsu one of the two largest players in the mining equipment industry alongside Caterpillar. We continue to maintain our holding in Joy Global. Also, the Fund saw strength from its position in anti-aging company Nu Skin Enterprises Inc., which develops and sells skincare products and nutrition products. Investors cheered the turnaround results evident in Nu Skin’s first-quarter earnings as revenues regained some strength and cost controls helped earnings rise more than expected. Also, management revealed in mid-June that a Chinese consortium made a $210 million strategic investment in the company, further boosting confidence in its business model.
| 14 | NUVEEN |
Nuveen Equity Long/Short Fund
The Fund’s Class A Shares at NAV underperformed both the Russell 1000® Index and the comparative Lipper classification average during the twelve-month reporting period ended August 31, 2016.
The Nuveen Equity Long/Short Fund seeks long-term capital appreciation with moderate correlation to the U.S. equity market by investing in long and short positions primarily of large-capitalization stocks from U.S. companies. The team selects securities using the same disciplined approach used with all of the Funds in the Large Cap Equity Series, balancing fundamental analysis with quantitative techniques. We start with the securities found in the Russell 1000® Index, which are primarily large-cap companies and use a multi-factor quantitative ranking process to identify potential holdings. We then apply a fundamental overlay from Nuveen Asset Management’s team of sector-specific analysts, using our industry perspectives to select holdings. Our goal is to invest in long positions of companies that exhibit improving business fundamentals, strong management, identifiable catalysts and attractive valuations. We believe that buying such companies at reasonable prices can provide above-market returns over time. At the same time, the management team will typically take short positions in companies that it expects to underperform. The team expects the Fund to maintain a net long exposure to the equity market (long market value minus short market value) that is greater than the zero percent exposure of a “market neutral” fund, but less than the 100% exposure provided by a fund that invests only in long positions. The goal of this strategy is to allow the Fund to benefit from a rising market, although to a lesser extent than a “long-only” fund, while maintaining some protection in a falling market with the Fund’s short positions, which are selected based on the management team’s belief that they will trail the broader market.
During the reporting period, the Fund underperformed due to stock selection in the long portion of the portfolio and sector allocations. Stock selection was particularly weak in the consumer discretionary, health care, industrials and energy sectors. In terms of sector allocations, the Fund was hurt by an underweight in the consumer staples sector, net short exposure in the strongly performing REITs sector and cash holdings in a strong up market. Finally, we emphasized stocks with lower price/earnings (P/E) ratios, which hampered returns during the reporting period.
The Fund’s most significant detractors were two long positions in the energy sector. Southwestern Energy Company, which focuses on North American onshore natural gas exploration and production, and to a lesser extent oil, was the biggest laggard during the reporting period. While stocks across the energy sector continued to be hard hit as the outlook for oil and gas prices appeared to be weaker than expected, companies more closely tied to natural gas suffered the most. Natural gas prices plunged to multi-year lows of less than $2.00 per thousand cubic feet by early March 2016. The Fund also saw weakness from a long position in CVR Energy Inc., a holding company with majority stakes in both petroleum refining and nitrogen fertilizer manufacturing. Both of these businesses should be benefiting from low oil and gas prices because they use those commodities as feedstocks. However, CVR Energy’s refining business experienced lower realized margins during the period, while the fertilizer segment also reported a difficult quarter caused by lower pricing and sales volume. Given CVR Energy’s large stakes in these two businesses, its shares suffered; although they did see a modest jump in the final month of the reporting period after rumors circulated about a potential buyout of a smaller refining peer, Delek US Holdings Inc.
The Fund’s top detractors in its short portfolio were both found in the information technology sector, including LinkedIn Corp., the world’s largest online networking and job search site for workplace professionals with more than 433 million users. In mid-June 2016, software giant Microsoft announced an agreement to acquire LinkedIn in an all-cash transaction for a significant premium, causing its stock price to soar. A short position in Yelp Inc., the local-business online review company, also detracted during the reporting period. Shares surged in early May 2016, after the company reported first-quarter earnings that were significantly above Wall Street’s expectations, while also raising sales forecasts for the rest of the year. The company, which runs Yelp.com, added more than 120,000 new advertising accounts, while users also increased their usage, pushing the total number of business reviews on the site to more than 100 million.
On the positive side, short positions, in aggregate, added value. Stock selection was also beneficial in the information technology, financials and materials sectors. Additionally, the Fund’s results were aided by a net short position in energy, one of the worst performing sectors in the Russell 1000® Index during the reporting period.
| NUVEEN | 15 |
Portfolio Managers’ Comments (continued)
For example, a short positon in CF Industries Holdings Inc., a manufacturer and distributor of agricultural fertilizers, provided a boost to the Fund. The company faced several challenges during the reporting period as the declining price of nitrogen fertilizer due to a global supply glut hurt its revenues, and the rising price of coal increased its expenses. This combination caused downward pressure on the stock price over much of the past year. The Fund also benefited from a short position SunPower Corporation, a manufacturer and provider of solar power technology to residential, commercial and utility-scale power plant customers worldwide. The company’s shares initially shot up in value early in the reporting period following the signing of an international climate change pact in Paris and an agreement by Congress to extend a key federal tax credit for the industry. However, the solar industry has had a much rougher road in 2016 amid oversupply concerns, a slowdown in Chinese demand and financial troubles at some high profile companies. Additionally, the uncertainty surrounding the U.S. presidential election weighs on the sector because the results could alter the renewable energy policy landscape.
Performance was aided by a long position in Nvidia Corporation, an American manufacturer of graphics processing units (GPUs) and system-on-a-chip units for the mobile computing market. The company saw its shares hit a new all-time high during reporting period. Nvidia is seeing strong growth in revenues from its core gaming GPU segment, thanks to its popular line of Pascal-powered graphics cards which are beating out the competition. Investors are also excited about promising new channels of growth for the company in areas such as artificial intelligence and driverless cars. Another top performer for the Fund during this reporting period was a long position in industrials firm Joy Global Inc., a major manufacturer and servicer of heavy equipment used in the mining industry. After a rough start earlier during the reporting period due to steady declines for its products and services, Joy Global more recently reported earnings results that showed management was able to successfully control operating costs. The company also benefited from some encouraging signs that orders may increase for the second sequential quarter. Then in late July 2016, Joy Global announced an agreement to be acquired by Japanese firm Komatsu Ltd. in a $3.7 billion all-cash transaction. The deal will make Komatsu one of the two largest players in the mining equipment industry alongside Caterpillar. We continue to maintain our holding in Joy Global.
Nuveen Equity Market Neutral Fund
The Fund’s Class A Shares at NAV outperformed both the BofA/Merrill Lynch 3-Month U.S. Treasury Bill Index and the comparative Lipper classification average during the twelve-month reporting period ended August 31, 2016.
The Nuveen Equity Market Neutral Fund seeks long-term capital appreciation independent of the equity market’s direction by investing in long and short positions primarily of large-capitalization stocks from U.S. companies. The team selects securities using the same disciplined approach used with all of the Funds in the Large Cap Equity Series, balancing fundamental analysis with quantitative techniques. We start with the securities found in the Russell 1000® Index, which are primarily large-cap companies, and use a multi-factor quantitative ranking process to identify potential holdings. We then apply a fundamental overlay from Nuveen Asset Management’s team of sector-specific analysts, using our industry perspectives to select holdings. Our goal is to invest in long positions of companies that exhibit improving business fundamentals, strong management, identifiable catalysts and attractive valuations. We believe that buying such companies at reasonable prices can provide above-market returns over time. At the same time, the management team will typically take short positions in companies that it expects to underperform. The goal of this strategy is that, over time, the stock market exposure of the combined long and short positions will be minimized, producing a net return due primarily to stock selection, rather than stock market movements. Over longer periods of time, the Fund’s net exposure could fluctuate between net long 40% and net short 20%; however, under somewhat normal conditions, the Fund will carry a net long exposure slightly above zero percent (long market value versus short market value).
During the reporting period, the Fund outperformed its benchmark as long positions, in aggregate, added value. Stock selection was generally strong in the information technology, materials, industrials, consumer discretionary and health care sectors. In addition, we tilted away from more growth-oriented stocks and stocks that exhibited more volatility, while at the same time showing a preference for higher dividend yielding stocks, which contributed favorably to results.
In terms of standouts, the Fund saw strong results from a long position in industrials firm Joy Global Inc., a major manufacturer and servicer of heavy equipment used in the mining industry. After a rough start earlier in the reporting period due to steady declines for its products and services, Joy Global more recently reported earnings results that showed management was able to successfully control operating costs. The company also benefited from some encouraging signs that orders may increase for the second
| 16 | NUVEEN |
sequential quarter. Then in late July 2016, Joy Global announced an agreement to be acquired by Japanese firm Komatsu Ltd. in a $3.7 billion all-cash transaction. The deal will make Komatsu one of the two largest players in the mining equipment industry alongside Caterpillar. Another top performer for the Fund during this reporting period was global e-commerce marketplace provider Groupon Inc., which connects millions of worldwide subscribers with area merchants offering deals for activities, travel, goods and services. In mid-February, China’s e-commerce giant Alibaba Group disclosed that it had taken a small minority stake in the company, which gave investors hope for future growth prospects. Then in August 2016, shares of Groupon surged after the company reported revenues that beat expectations and, more importantly, offered an upbeat full-year sales forecast. These results reassured investors that management’s efforts to focus on sales in the more profitable North American marketplace are being rewarded.
In terms of successful short positions, the Fund benefited from offshore oil exploration and production company Cobalt International Energy Inc. As the price of crude oil declined during the reporting period, many energy companies came under increasing pressure. Investors further punished Cobalt’s stock price and questioned the company’s viability after its deal to sell some of its offshore exploration assets in Angola to oil and gas producer Sonangol fell apart because the company couldn’t obtain funding. With the deal breakdown, Cobalt International will now be forced to remarket the Angolan assets when offshore asset values are very depressed. A short position in SunEdison Inc., a renewable energy company focused on wind energy and solar power, also proved beneficial. The company’s shares plunged during the reporting period as investors became more concerned over the integration of recent acquisitions as well as the company’s ability to continue to fund its projected capital needs through the equity and debt markets. In April 2016, the company filed for Chapter 11 bankruptcy protection and began selling off some of its assets. SunEdison is also facing lawsuits and its financial activities are under investigation by the Securities and Exchange Commission and the Department of Justice.
While the Fund experienced favorable results during the reporting period, it did have several areas that lagged. Stock selection was generally weak in the utilities, financials and consumer staples sectors. Also, the Fund’s emphases on stocks with lower price/earnings (P/E) ratios and more value-oriented stocks hindered returns.
The two most significant detractors among the Fund’s long positions were energy related, including the world’s second largest offshore oil and gas well drilling company, U.K.-based Ensco Plc. The company’s shares were on a downward trajectory throughout much of the reporting period in tandem with the price of oil as investors anticipated the resulting slowdown in production, revenue and earnings. Although oil prices rallied to around the $50-per-barrel mark for WTI crude in June 2016, they moved lower throughout the remainder of the period after China reported a significant increase in diesel and gasoline exports and OPEC countries failed to reach an agreement to freeze output. Louisiana-based Tidewater Inc., the leading provider of larger offshore support vessels (OSVs) for drill rig support and maintenance to the global energy industry, also detracted from results. The company significantly underperformed the energy equipment and services industry throughout the year as the drop in crude oil prices resulted in stalling demand for OSVs and deteriorating earnings per share. In August 2016, Tidewater’s shares slumped further after the company reported a greater-than-expected loss for the fiscal quarter ended June 30, 2016 and a potential Chapter 11 bankruptcy filing.
The Fund’s top detractor in its short portfolio was LinkedIn Corp., the world’s largest online networking and job search site for workplace professionals with more than 433 million users. In mid-June 2016, software giant Microsoft announced an agreement to acquire LinkedIn in an all-cash transaction for a significant premium, causing its stock price to soar. Also, the Fund’s short position in DreamWorks Animation SKG Inc. hindered results during the reporting period. The company is best known for its blockbuster animated film franchises such as “Shrek,” “Madagascar” and “Kung Fu Panda.” In late April 2016, cable provider Comcast announced plans for its NBCUniversal division to acquire DreamWorks in another all-cash transaction that represented a roughly 50% premium to where the stock traded before the announcement.
| NUVEEN | 17 |
Nuveen Large Cap Value Fund
Mutual fund investing involves risk; principal loss is possible. There is no guarantee the Fund’s investment objectives will be achieved. Prices of equity securities may decline significantly over short or extended periods of time. These and other risk considerations, such as futures contract, large cap stock, and value stock risks, are described in detail in the Fund’s prospectus.
Nuveen Large Cap Core Fund
Mutual fund investing involves risk; principal loss is possible. There is no guarantee the Fund’s investment objectives will be achieved, including income from dividends. The value of equity securities may decline significantly over short or extended periods of time. More information on these risks considerations, as well as information on other risks to which the Fund is subject, such as futures contract and large cap stock risks, are included in the Fund’s prospectus.
Nuveen Large Cap Growth Fund
Mutual fund investing involves risk; principal loss is possible. There is no guarantee that the Fund’s investment objectives will be achieved. Prices of equity securities may decline significantly over short or extended periods of time. These and other risk considerations, such as futures contract, growth stock, and large cap stock risks, are described in detail in the Fund’s prospectus.
Nuveen Concentrated Core Fund
Mutual fund investing involves risk; principal loss is possible. There is no guarantee the Fund’s investment objectives will be achieved. The value of equity securities may decline significantly over short or extended periods of time. The Fund is non-diversified, meaning it may invest a larger portion of its assets in the securities of a limited number of issuers and may be more sensitive to any single economic, business, political or regulatory occurrence than a diversified fund. More information on these risks considerations, as well as information on other risks to which the Fund is subject, such as futures contract and large cap stock risks, are included in the Fund’s prospectus.
Nuveen Core Dividend Fund
Mutual fund investing involves risk; principal loss is possible. There is no guarantee the Fund’s investment objectives will be achieved, including income from dividends. The value of equity securities may decline significantly over short or extended periods of time. More information on these risks considerations, as well as information on other risks to which the Fund is subject, such as futures contract and large cap stock risks, are included in the Fund’s prospectus.
Nuveen Growth Fund
Mutual fund investing involves risk; principal loss is possible. There is no guarantee that the Fund’s investment objectives will be achieved. Prices of equity securities may decline significantly over short or extended periods of time. These and other risk considerations, such as currency, growth stock, large cap stock, and non-U.S. investment risks, are described in detail in the Fund’s prospectus.
| 18 | NUVEEN |
Nuveen Large Cap Core Plus Fund
Mutual fund investing involves risk; principal loss is possible. There is no guarantee the Fund’s investment objectives will be achieved. Prices of equity securities may change significantly over short or extended periods of time. The Fund sells securities that it has borrowed but does not own (“short sales”), which is a speculative technique. The Fund will suffer a loss when the price of a security that it holds long decreases or the price of a security that it has sold short increases. Losses on short sales arise from increases in the value of the security sold short, and therefore are theoretically unlimited. Because the Fund invests in both long and short equity positions, the Fund has overall exposure to changes in value of equity securities that is far greater than its net asset value. This may magnify gains and losses and increase the volatility of the Fund’s returns. In addition, the use of short sales will increase the Fund’s expenses. More information on these risks considerations, as well as information on other risks to which the Fund is subject, such as frequent trading, futures contract and large cap stock risks, are included in the Fund’s prospectus.
Nuveen Equity Long/Short Fund
Mutual fund investing involves risk; principal loss is possible. There is no guarantee the Fund’s investment objectives will be achieved. Prices of equity securities may change significantly over short or extended periods of time. The Fund sells securities that it has borrowed but does not own (“short sales”), which is a speculative technique. The Fund will suffer a loss when the price of a security that it holds long decreases or the price of a security that it has sold short increases. Losses on short sales arise from increases in the value of the security sold short, and therefore are theoretically unlimited. Because the Fund invests in both long and short equity positions, the Fund has overall exposure to changes in value of equity securities that is far greater than its net asset value. This may magnify gains and losses and increase the volatility of the Fund’s returns. In addition, the use of short sales will increase the Fund’s expenses. More information on these risks considerations, as well as information on other risks to which the Fund is subject, such as frequent trading, futures contract, and large cap stock risks, are included in the Fund’s prospectus.
Nuveen Equity Market Neutral Fund
Mutual fund investing involves risk; principal loss is possible. There is no guarantee the Fund’s investment objectives will be achieved. Prices of equity securities may change significantly over short or extended periods of time. The Fund sells securities that it has borrowed but does not own (“short sales”), which is a speculative technique. The Fund will suffer a loss when the price of a security that it holds long decreases or the price of a security that it has sold short increases. Because the Fund attempts to generate returns that are primarily due to stock selection (long and short), rather than the returns of the stock market, performance will be more dependent on the portfolio manager acumen than is the case for other equity funds. Losses on short sales arise from increases in the value of the security sold short, and therefore are theoretically unlimited. Because the Fund invests in both long and short equity positions, the Fund has overall exposure to changes in value of equity securities that is far greater than its net asset value. This may magnify gains and losses and increase the volatility of the Fund’s returns. In addition, the use of short sales will increase the Fund’s expenses. More information on these risks considerations, as well as information on other risks to which the Fund is subject, such as frequent trading, futures contract and large cap stock risks, are included in the Fund’s prospectus.
| NUVEEN | 19 |
THIS PAGE INTENTIONALLY LEFT BLANK
| 20 | NUVEEN |
and Expense Ratios
The Fund Performance and Expense Ratios for each Fund are shown within this section of the report.
Returns quoted represent past performance, which is no guarantee of future results. Current performance may be higher or lower than the performance shown. Investment returns and principal value will fluctuate so that when shares are redeemed, they may be worth more or less than their original cost. Returns without sales charges would be lower if the sales charge were included. Returns do not reflect the deduction of taxes that a shareholder would pay on Fund distributions or the redemption of Fund shares.
Returns may reflect fee waivers and/or expense reimbursements by the investment adviser during the periods presented. If any such waivers and/or reimbursements had not been in place, returns would have been reduced. See Notes to Financial Statements, Note 7—Management Fees and Other Transactions with Affiliates for more information. For the most recent month-end performance visit www.nuveen.com or call (800) 257-8787.
Returns reflect differences in sales charges and expenses, which are primarily differences in distribution and service fees, and assume reinvestment of dividends and capital gains.
Comparative index and Lipper return information is provided for Class A Shares at net asset value (NAV) only.
The expense ratios shown reflect total operating expenses (before fee waivers and/or expense reimbursements, if any) as shown in the most recent prospectus. The expense ratios include management fees and other fees and expenses.
| NUVEEN | 21 |
Fund Performance and Expense Ratios (continued)
Nuveen Large Cap Value Fund
Refer to the first page of this Fund Performance and Expense Ratios section for further explanation of the information included within this section. Refer to Glossary of Terms Used in this Report for definitions of terms used within this section.
Fund Performance
Average Annual Total Returns as of August 31, 2016
| Average Annual | ||||||||||||
| 1-Year | 5-Year | 10-Year | ||||||||||
Class A Shares at NAV | 6.26% | 12.47% | 5.97% | |||||||||
Class A Shares at maximum Offering Price | 0.14% | 11.15% | 5.35% | |||||||||
Russell 1000® Value Index | 12.92% | 14.39% | 6.08% | |||||||||
Lipper Multi-Cap Value Funds Classification Average | 7.84% | 12.23% | 5.74% | |||||||||
Class C Shares | 5.46% | 11.63% | 5.18% | |||||||||
Class I Shares | 6.53% | 12.75% | 6.23% | |||||||||
| Average Annual | ||||||||||||
| 1-Year | 5-Year | Since Inception | ||||||||||
Class R3 Shares | 5.97% | 12.19% | 6.82% | |||||||||
| Cumulative | ||||
| Since Inception | ||||
Class R6 Shares | 5.63% | |||
Average Annual Total Returns as of September 30, 2016 (Most Recent Calendar Quarter)
| Average Annual | ||||||||||||
| 1-Year | 5-Year | 10-Year | ||||||||||
Class A Shares at NAV | 11.55% | 14.49% | 5.82% | |||||||||
Class A Shares at maximum Offering Price | 5.12% | 13.14% | 5.20% | |||||||||
Class C Shares | 10.74% | 13.64% | 5.03% | |||||||||
Class I Shares | 11.80% | 14.78% | 6.08% | |||||||||
| Average Annual | ||||||||||||
| 1-Year | 5-Year | Since Inception | ||||||||||
Class R3 Shares | 11.27% | 14.21% | 6.79% | |||||||||
| Cumulative | ||||
| Since Inception | ||||
Class R6 Shares | 6.05% | |||
Since inception returns for Class R3 Shares and Class R6 Shares are from 8/04/08 and 6/30/16, respectively. Performance prior to June 24, 2013, reflects the Fund’s performance under the management of multiple sub-advisers using investment strategies that differed significantly from those currently in place. Indexes and Lipper averages are not available for direct investment.
Class A Shares have a maximum 5.75% sales charge (Offering Price). Class A Share purchases of $1 million or more are sold at net asset value without an up-front sales charge but may be subject to a contingent deferred sales charge (CDSC), also known as a back-end sales charge, if redeemed within eighteen months (twelve months prior to November 1, 2015) of purchase. Such CDSC will be equal to 1% for any shares purchased on or after November 1, 2015 if redeemed within eighteen months of purchase. Class C Shares have a 1% CDSC for redemptions within less than twelve months, which is not reflected in the one-year total return. Class R3 Shares have no sales charge and are only available for purchase by eligible retirement plans. Class R6 Shares have no sales charge and are available only to certain limited categories as described in the prospectus. Class I Shares have no sales charge and may be purchased under limited circumstances or by specified classes of investors.
| 22 | NUVEEN |
Expense Ratios as of Most Recent Prospectus
| Share Class | ||||||||||||||||||||
| Class A | Class C | Class R3 | Class R6 | Class I | ||||||||||||||||
Expense Ratios | 1.07% | 1.82% | 1.32% | 0.75% | 0.81% | |||||||||||||||
Class R6 Shares were established on June 30, 2016. Accordingly, other expenses are estimated for the current fiscal year.
Growth of an Assumed $10,000 Investment as of August 31, 2016 – Class A Shares
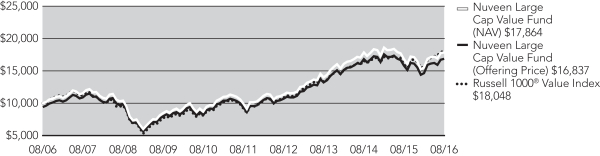
The graphs do not reflect the deduction of taxes that a shareholder may pay on Fund distributions or the redemption of Fund shares.
| NUVEEN | 23 |
Fund Performance and Expense Ratios (continued)
Nuveen Large Cap Core Fund
Refer to the first page of this Fund Performance and Expense Ratios section for further explanation of the information included within this section. Refer to Glossary of Terms Used in this Report for definitions of terms used within this section.
Fund Performance
Average Annual Total Returns as of August 31, 2016
| Average Annual | ||||||||
| 1-Year | Since Inception | |||||||
Class A Shares at NAV | 7.66% | 11.97% | ||||||
Class A Shares at maximum Offering Price | 1.47% | 9.92% | ||||||
Russell 1000® Index | 11.69% | 11.39% | ||||||
Lipper Multi-Cap Core Funds Classification Average | 7.21% | 9.14% | ||||||
Class C Shares | 6.86% | 11.14% | ||||||
Class I Shares | 7.93% | 12.25% | ||||||
| Cumulative | ||||
| Since Inception | ||||
Class R6 Shares | 6.36% | |||
Average Annual Total Returns as of September 30, 2016 (Most Recent Calendar Quarter)
| Average Annual | ||||||||
| 1-Year | Since Inception | |||||||
Class A Shares at NAV | 12.05% | 11.73% | ||||||
Class A Shares at maximum Offering Price | 5.61% | 9.74% | ||||||
Class C Shares | 11.23% | 10.90% | ||||||
Class I Shares | 12.32% | 12.00% | ||||||
| Cumulative | ||||
| Since Inception | ||||
Class R6 Shares | 6.64% | |||
Since inception returns for Class A, Class C and Class I Shares are from 6/17/13. Since inception returns for Class R6 Shares are from 6/30/16. Indexes and Lipper averages are not available for direct investment.
Class A Shares have a maximum 5.75% sales charge (Offering Price). Class A Share purchases of $1 million or more are sold at net asset value without an up-front sales charge but may be subject to a contingent deferred sales charge (CDSC), also known as a back-end sales charge, if redeemed within eighteen months (twelve months prior to November 1, 2015) of purchase. Such CDSC will be equal to 1% for any shares purchased on or after November 1, 2015 if redeemed within eighteen months of purchase. Class C Shares have a 1% CDSC for redemptions within less than twelve months, which is not reflected in the one-year total return. Class R6 Shares have no sales charge and are available only to certain limited categories as described in the prospectus. Class I Shares have no sales charge and may be purchased under limited circumstances or by specified classes of investors.
| 24 | NUVEEN |
Expense Ratios as of Most Recent Prospectus
| Share Class | ||||||||||||||||
| Class A | Class C | Class R6 | Class I | |||||||||||||
Gross Expense Ratios | 1.09% | 1.84% | 0.78% | 0.84% | ||||||||||||
Net Expense Ratios | 1.01% | 1.76% | 0.70% | 0.76% | ||||||||||||
The Fund’s investment adviser has contractually agreed to waive fees and/or reimburse other Fund expenses through December 31, 2017, so that total annual Fund operating expenses (excluding 12b-1 distribution and/or service fees, interest expenses, taxes, acquired fund fees and expenses, fees incurred in acquiring and disposing of portfolio securities and extraordinary expenses) do not exceed 0.80% of the average daily net assets of any class of Fund shares. The expense limitation may be terminated or modified prior to that date only with the approval of the Board of Trustees of the Fund. Class R6 Shares were established on June 30, 2016. Accordingly, other expenses are estimated for the current fiscal year.
Growth of an Assumed $10,000 Investment as of August 31, 2016 – Class A Shares
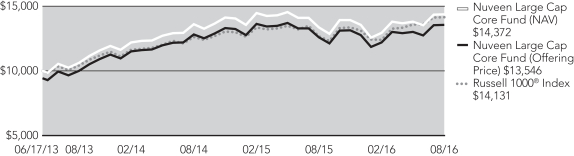
The graphs do not reflect the deduction of taxes that a shareholder may pay on Fund distributions or the redemption of Fund shares.
| NUVEEN | 25 |
Fund Performance and Expense Ratios (continued)
Nuveen Large Cap Growth Fund
Refer to the first page of this Fund Performance and Expense Ratios section for further explanation of the information included within this section. Refer to Glossary of Terms Used in this Report for definitions of terms used within this section.
Fund Performance
Average Annual Total Returns as of August 31, 2016
| Average Annual | ||||||||
| 1-Year | Since Inception | |||||||
Class A Shares at NAV | 5.57% | 11.50% | ||||||
Class A Shares at maximum Offering Price | (0.50)% | 9.46% | ||||||
Russell 1000® Growth Index | 10.54% | 12.87% | ||||||
Lipper Multi-Cap Core Funds Classification Average | 7.21% | 9.14% | ||||||
Class C Shares | 4.77% | 10.67% | ||||||
Class I Shares | 5.80% | 11.76% | ||||||
| Cumulative | ||||
| Since Inception | ||||
Class R6 Shares | 6.02% | |||
Average Annual Total Returns as of September 30, 2016 (Most Recent Calendar Quarter)
| Average Annual | ||||||||
| 1-Year | Since Inception | |||||||
Class A Shares at NAV | 9.35% | 11.34% | ||||||
Class A Shares at maximum Offering Price | 3.06% | 9.35% | ||||||
Class C Shares | 8.49% | 10.51% | ||||||
Class I Shares | 9.58% | 11.60% | ||||||
| Cumulative | ||||
| Since Inception | ||||
Class R6 Shares | 6.47% | |||
Since inception returns for Class A, Class C and Class I Shares are from 6/17/13. Since inception returns for Class R6 Shares are from 6/30/16. Indexes and Lipper averages are not available for direct investment.
Class A Shares have a maximum 5.75% sales charge (Offering Price). Class A Share purchases of $1 million or more are sold at net asset value without an up-front sales charge but may be subject to a contingent deferred sales charge (CDSC), also known as a back-end sales charge, if redeemed within eighteen months (twelve months prior to November 1, 2015) of purchase. Such CDSC will be equal to 1% for any shares purchased on or after November 1, 2015 if redeemed within eighteen months of purchase. Class C Shares have a 1% CDSC for redemptions within less than twelve months, which is not reflected in the one-year total return. Class R6 Shares have no sales charge and are available only to certain limited categories as described in the prospectus. Class I Shares have no sales charge and may be purchased under limited circumstances or by specified classes of investors.
| 26 | NUVEEN |
Expense Ratios as of Most Recent Prospectus
| Share Class | ||||||||||||||||
| Class A | Class C | Class R6 | Class I | |||||||||||||
Gross Expense Ratios | 1.20% | 1.95% | 0.85% | 0.95% | ||||||||||||
Net Expense Ratios | 1.02% | 1.77% | 0.67% | 0.77% | ||||||||||||
The Fund’s investment adviser has contractually agreed to waive fees and/or reimburse expenses through December 31, 2017 so that total annual Fund operating expenses (excluding 12b-1 distribution and/or service fees, interest expenses, taxes, acquired fund fees and expenses, fees incurred in acquiring and disposing of portfolio securities and extraordinary expenses) do not exceed 0.81% of the average daily net assets of any class of Fund shares. The expense limitation may be terminated or modified prior to that date only with the approval of the Board of Trustees of the Fund. Class R6 Shares were established on June 30, 2016. Accordingly, other expenses are estimated for the current fiscal year.
Growth of an Assumed $10,000 Investment as of August 31, 2016 – Class A Shares
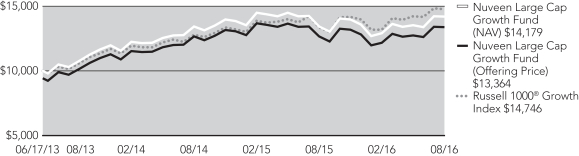
The graphs do not reflect the deduction of taxes that a shareholder may pay on Fund distributions or the redemption of Fund shares.
| NUVEEN | 27 |
Fund Performance and Expense Ratios (continued)
Nuveen Concentrated Core Fund
Refer to the first page of this Fund Performance and Expense Ratios section for further explanation of the information included within this section. Refer to Glossary of Terms Used in this Report for definitions of terms used within this section.
Fund Performance
Average Annual Total Returns as of August 31, 2016
| Average Annual | ||||||||
| 1-Year | Since Inception | |||||||
Class A Shares at NAV | 0.62% | 10.37% | ||||||
Class A Shares at maximum Offering Price | (5.17)% | 8.35% | ||||||
Russell 1000® Index | 11.69% | 11.39% | ||||||
Lipper Large-Cap Core Funds Classification Average | 9.34% | 9.54% | ||||||
Class C Shares | (0.13)% | 9.54% | ||||||
Class I Shares | 0.88% | 10.64% | ||||||
| Cumulative | ||||
| Since Inception | ||||
Class R6 Shares | 3.17% | |||
Average Annual Total Returns as of September 30, 2016 (Most Recent Calendar Quarter)
| Average Annual | ||||||||
| 1-Year | Since Inception | |||||||
Class A Shares at NAV | 3.62% | 9.92% | ||||||
Class A Shares at maximum Offering Price | (2.34)% | 7.96% | ||||||
Class C Shares | 2.85% | 9.10% | ||||||
Class I Shares | 3.89% | 10.18% | ||||||
| Cumulative | ||||
| Since Inception | ||||
Class R6 Shares | 2.66% | |||
Since inception returns for Class A, Class C and Class I Shares are from 6/17/13. Since inception returns for Class R6 Shares are from 6/30/16. Indexes and Lipper averages are not available for direct investment.
Class A Shares have a maximum 5.75% sales charge (Offering Price). Class A Share purchases of $1 million or more are sold at net asset value without an up-front sales charge but may be subject to a contingent deferred sales charge (CDSC), also known as a back-end sales charge, if redeemed within eighteen months (twelve months prior to November 1, 2015) of purchase. Such CDSC will be equal to 1% for any shares purchased on or after November 1, 2015 if redeemed within eighteen months of purchase. Class C Shares have a 1% CDSC for redemptions within less than twelve months, which is not reflected in the one-year total return. Class R6 Shares have no sales charge and are available only to certain limited categories as described in the prospectus. Class I Shares have no sales charge and may be purchased under limited circumstances or by specified classes of investors.
| 28 | NUVEEN |
Expense Ratios as of Most Recent Prospectus
| Share Class | ||||||||||||||||
| Class A | Class C | Class R6 | Class I | |||||||||||||
Gross Expense Ratios | 1.23% | 1.98% | 0.86% | 0.97% | ||||||||||||
Net Expense Ratios | 1.07% | 1.82% | 0.71% | 0.82% | ||||||||||||
The Fund’s investment adviser has contractually agreed to waive fees and/or reimburse expenses through December 31, 2017 so that total annual Fund operating expenses (excluding 12b-1 distribution and/or service fees, interest expenses, taxes, acquired fund fees and expenses, fees incurred in acquiring and disposing of portfolio securities and extraordinary expenses) do not exceed 0.86% of the average daily net assets of any class of Fund shares. The expense limitation may be terminated or modified prior to that date only with the approval of the Board of Trustees of the Fund. Class R6 Shares were established on June 30, 2016. Accordingly, other expenses are estimated for the current fiscal year.
Growth of an Assumed $10,000 Investment as of August 31, 2016 – Class A Shares

The graphs do not reflect the deduction of taxes that a shareholder may pay on Fund distributions or the redemption of Fund shares.
| NUVEEN | 29 |
Fund Performance and Expense Ratios (continued)
Nuveen Core Dividend Fund
Refer to the first page of this Fund Performance and Expense Ratios section for further explanation of the information included within this section. Refer to Glossary of Terms Used in this Report for definitions of terms used within this section.
Fund Performance
Average Annual Total Returns as of August 31, 2016
| Average Annual | ||||||||
| 1-Year | Since Inception | |||||||
Class A Shares at NAV | 5.68% | 10.10% | ||||||
Class A Shares at maximum Offering Price | (0.39)% | 8.09% | ||||||
Russell 1000® Index | 11.69% | 11.39% | ||||||
Lipper Equity Income Funds Classification Average | 11.55% | 8.14% | ||||||
Class C Shares | 4.86% | 9.26% | ||||||
Class I Shares | 5.91% | 10.35% | ||||||
Average Annual Total Returns as of September 30, 2016 (Most Recent Calendar Quarter)
| Average Annual | ||||||||
| 1-Year | Since Inception | |||||||
Class A Shares at NAV | 9.77% | 9.89% | ||||||
Class A Shares at maximum Offering Price | 3.46% | 7.93% | ||||||
Class C Shares | 8.96% | 9.06% | ||||||
Class I Shares | 10.04% | 10.15% | ||||||
Since inception returns are from 6/17/13. Indexes and Lipper averages are not available for direct investment.
Class A Shares have a maximum 5.75% sales charge (Offering Price). Class A Share purchases of $1 million or more are sold at net asset value without an up-front sales charge but may be subject to a contingent deferred sales charge (CDSC), also known as a back-end sales charge, if redeemed within eighteen months (twelve months prior to November 1, 2015) of purchase. Such CDSC will be equal to 1% for any shares purchased on or after November 1, 2015 if redeemed within eighteen months of purchase. Class C Shares have a 1% CDSC for redemptions within less than twelve months, which is not reflected in the one-year total return. Class I Shares have no sales charge and may be purchased under limited circumstances or by specified classes of investors.
Expense Ratios as of Most Recent Prospectus
| Share Class | ||||||||||||
| Class A | Class C | Class I | ||||||||||
Gross Expense Ratios | 1.39% | 2.14% | 1.14% | |||||||||
Net Expense Ratios | 1.16% | 1.91% | 0.91% | |||||||||
The Fund’s investment adviser has contractually agreed to waive fees and/or reimburse expenses through December 31, 2016 so that total annual Fund operating expenses (excluding 12b-1 distribution and/or service fees, interest expenses, taxes, acquired fund fees and expenses, fees incurred in acquiring and disposing of portfolio securities and extraordinary expenses) do not exceed 0.95% of the average daily net assets of any class of Fund shares. The expense limitation may be terminated or modified prior to that date only with the approval of the Board of Trustees of the Fund.
| 30 | NUVEEN |
Growth of an Assumed $10,000 Investment as of August 31, 2016 – Class A Shares
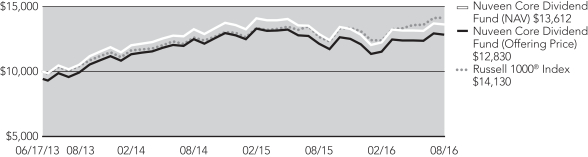
The graphs do not reflect the deduction of taxes that a shareholder may pay on Fund distributions or the redemption of Fund shares.
| NUVEEN | 31 |
Fund Performance and Expense Ratios (continued)
Nuveen Growth Fund
Refer to the first page of this Fund Performance and Expense Ratios section for further explanation of the information included within this section. Refer to Glossary of Terms Used in this Report for definitions of terms used within this section.
Fund Performance
Average Annual Total Returns as of August 31, 2016
| Average Annual | ||||||||||||
| 1-Year | 5-Year | 10-Year | ||||||||||
Class A Shares at NAV | 8.78% | 12.91% | 6.22% | |||||||||
Class A Shares at maximum Offering Price | 2.52% | 11.58% | 5.59% | |||||||||
Russell 1000® Growth Index | 10.54% | 14.74% | 9.11% | |||||||||
Lipper Large-Cap Growth Funds Classification Average | 6.63% | 13.14% | 7.92% | |||||||||
Class C Shares | 7.95% | 12.08% | 5.42% | |||||||||
Class I Shares | 9.05% | 13.20% | 6.49% | |||||||||
| Average Annual | ||||||||||||
| 1-Year | 5-Year | Since Inception | ||||||||||
Class R3 Shares | 8.48% | 12.63% | 15.48% | |||||||||
Average Annual Total Returns as of September 30, 2016 (Most Recent Calendar Quarter)
| Average Annual | ||||||||||||
| 1-Year | 5-Year | 10-Year | ||||||||||
Class A Shares at NAV | 10.90% | 14.68% | 5.96% | |||||||||
Class A Shares at maximum Offering Price | 4.52% | 13.33% | 5.34% | |||||||||
Class C Shares | 10.04% | 13.84% | 5.16% | |||||||||
Class I Shares | 11.13% | 14.97% | 6.23% | |||||||||
| Average Annual | ||||||||||||
| 1-Year | 5-Year | Since Inception | ||||||||||
Class R3 Shares | 10.61% | 14.41% | 15.27% | |||||||||
Since inception returns for Class R3 Shares are from 3/03/09. Indexes and Lipper averages are not available for direct investment.
Class A Shares have a maximum 5.75% sales charge (Offering Price). Class A Share purchases of $1 million or more are sold at net asset value without an up-front sales charge but may be subject to a contingent deferred sales charge (CDSC), also known as a back-end sales charge, if redeemed within eighteen months (twelve months prior to November 1, 2015) of purchase. Such CDSC will be equal to 1% for any shares purchased on or after November 1, 2015 if redeemed within eighteen months of purchase. Class C Shares have a 1% CDSC for redemptions within less than twelve months, which is not reflected in the one-year total return. Class R3 Shares have no sales charge and are only available for purchase by eligible retirement plans. Class I Shares have no sales charge and may be purchased under limited circumstances or by specified classes of investors.
| 32 | NUVEEN |
Expense Ratios as of Most Recent Prospectus
| Share Class | ||||||||||||||||
| Class A | Class C | Class R3 | Class I | |||||||||||||
Gross Expense Ratios | 1.25% | 2.01% | 1.50% | 1.01% | ||||||||||||
Net Expense Ratios | 1.21% | 1.96% | 1.46% | 0.96% | ||||||||||||
The Fund’s investment adviser has contractually agreed to waive fees and/or reimburse expenses through December 31, 2016 so that total annual Fund operating expenses (excluding 12b-1 distribution and/or service fees, interest expenses, taxes, acquired fund fees and expenses, fees incurred in acquiring and disposing of portfolio securities and extraordinary expenses) do not exceed 1.00% (1.40% after December 31, 2016) of the average daily net assets of any class of Fund shares. The expense limitation expiring December 31, 2016 may be terminated or modified prior to that date only with the approval of the Board of Trustees of the Fund. The expense limitation in effect thereafter may be terminated or modified only with the approval of shareholders of the Fund.
Growth of an Assumed $10,000 Investment as of August 31, 2016 – Class A Shares
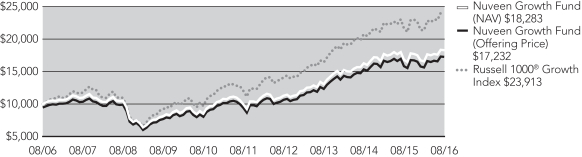
The graphs do not reflect the deduction of taxes that a shareholder may pay on Fund distributions or the redemption of Fund shares.
| NUVEEN | 33 |
Fund Performance and Expense Ratios (continued)
Nuveen Large Cap Core Plus Fund
Refer to the first page of this Fund Performance and Expense Ratios section for further explanation of the information included within this section. Refer to Glossary of Terms Used in this Report for definitions of terms used within this section.
Fund Performance
Average Annual Total Returns as of August 31, 2016
| Average Annual | ||||||||
| 1-Year | Since Inception | |||||||
Class A Shares at NAV | 6.00% | 11.05% | ||||||
Class A Shares at maximum Offering Price | (0.10)% | 9.02% | ||||||
Russell 1000® Index | 11.69% | 11.39% | ||||||
Lipper Alternative Active Extension Funds Classification Average | 6.65% | 10.42% | ||||||
Class C Shares | 5.18% | 10.24% | ||||||
Class I Shares | 6.25% | 11.34% | ||||||
Average Annual Total Returns as of September 30, 2016 (Most Recent Calendar Quarter)
| Average Annual | ||||||||
| 1-Year | Since Inception | |||||||
Class A Shares at NAV | 10.12% | 10.84% | ||||||
Class A Shares at maximum Offering Price | 3.79% | 8.86% | ||||||
Class C Shares | 9.25% | 10.03% | ||||||
Class I Shares | 10.37% | 11.12% | ||||||
Since inception returns are from 6/17/13. Indexes and Lipper averages are not available for direct investment.
Class A Shares have a maximum 5.75% sales charge (Offering Price). Class A Share purchases of $1 million or more are sold at net asset value without an up-front sales charge but may be subject to a contingent deferred sales charge (CDSC), also known as a back-end sales charge, if redeemed within eighteen months (twelve months prior to November 1, 2015) of purchase. Such CDSC will be equal to 1% for any shares purchased on or after November 1, 2015 if redeemed within eighteen months of purchase. Class C Shares have a 1% CDSC for redemptions within less than twelve months, which is not reflected in the one-year total return. Class I Shares have no sales charge and may be purchased under limited circumstances or by specified classes of investors.
Expense Ratios as of Most Recent Prospectus
| Share Class | ||||||||||||
| Class A | Class C | Class I | ||||||||||
Gross Expense Ratios | 2.43% | 3.19% | 2.19% | |||||||||
Net Expense Ratios | 2.22% | 2.97% | 1.97% | |||||||||
The Fund’s investment adviser has contractually agreed to waive fees and/or reimburse expenses through December 31, 2016 so that total annual Fund operating expenses (excluding 12b-1 distribution and/or service fees, interest expenses, taxes, acquired fund fees and expenses, fees incurred in acquiring and disposing of portfolio securities (including prime broker fees and charges on short sales), dividend expense on securities sold short, and extraordinary expenses) do not exceed 1.25% of the average daily net assets of any class of Fund shares. The expense limitation may be terminated or modified prior to that date only with the approval of the Board of Trustees of the Fund.
| 34 | NUVEEN |
Growth of an Assumed $10,000 Investment as of August 31, 2016 – Class A Shares
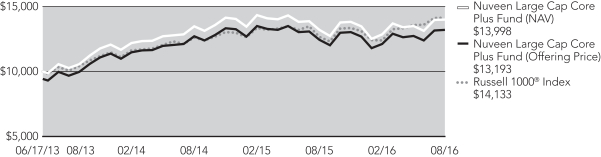
The graphs do not reflect the deduction of taxes that a shareholder may pay on Fund distributions or the redemption of Fund shares.
| NUVEEN | 35 |
Fund Performance and Expense Ratios (continued)
Nuveen Equity Long/Short Fund
Refer to the first page of this Fund Performance and Expense Ratios section for further explanation of the information included within this section. Refer to Glossary of Terms Used in this Report for definitions of terms used within this section.
Fund Performance
Average Annual Total Returns as of August 31, 2016
| Average Annual | ||||||||||||
| 1-Year | 5-Year | Since Inception | ||||||||||
Class A Shares at NAV | 0.00% | 8.98% | 9.43% | |||||||||
Class A Shares at maximum Offering Price | (5.75)% | 7.70% | 8.59% | |||||||||
Russell 1000® Index | 11.69% | 14.60% | 15.07% | |||||||||
Lipper Alternative Long/Short Equity Funds Classification Average | 0.55% | 5.01% | 6.59% | |||||||||
Class C Shares | (0.75)% | 8.15% | 8.61% | |||||||||
Class I Shares | 0.27% | 9.25% | 9.71% | |||||||||
Average Annual Total Returns as of September 30, 2016 (Most Recent Calendar Quarter)
| Average Annual | ||||||||||||
| 1-Year | 5-Year | Since Inception | ||||||||||
Class A Shares at NAV | 0.86% | 11.18% | 9.38% | |||||||||
Class A Shares at maximum Offering Price | (4.94)% | 9.87% | 8.55% | |||||||||
Class C Shares | 0.10% | 10.34% | 8.56% | |||||||||
Class I Shares | 1.12% | 11.46% | 9.66% | |||||||||
Since inception returns are from 12/30/08. Performance prior to March 1, 2013, reflects the Fund’s performance under the management of a sub-adviser using investment strategies that differed significantly from those currently in place. Indexes and Lipper averages are not available for direct investment.
Class A Shares have a maximum 5.75% sales charge (Offering Price). Class A Share purchases of $1 million or more are sold at net asset value without an up-front sales charge but may be subject to a contingent deferred sales charge (CDSC), also known as a back-end sales charge, if redeemed within eighteen months (twelve months prior to November 1, 2015) of purchase. Such CDSC will be equal to 1% for any shares purchased on or after November 1, 2015 if redeemed within eighteen months of purchase. Class C Shares have a 1% CDSC for redemptions within less than twelve months, which is not reflected in the one-year total return. Class I Shares have no sales charge and may be purchased under limited circumstances or by specified classes of investors.
Expense Ratios as of Most Recent Prospectus
| Share Class | ||||||||||||
| Class A | Class C | Class I | ||||||||||
Gross Expense Ratios | 3.77% | 4.53% | 3.53% | |||||||||
Net Expense Ratios | 3.53% | 4.29% | 3.28% | |||||||||
The Fund’s investment adviser has contractually agreed to waive fees and/or reimburse expenses through December 31, 2016 so that total annual Fund operating expenses (excluding 12b-1 distribution and/or service fees, interest expenses, taxes, acquired fund fees and expenses, fees incurred in acquiring and disposing of portfolio securities (including prime broker fees and charges on short sales), dividend expense on securities sold short and extraordinary expenses) do not exceed 1.40% of the average daily net assets of any class of Fund shares. The expense limitation may be terminated or modified prior to that date only with the approval of the Board of Trustees of the Fund.
| 36 | NUVEEN |
Growth of an Assumed $10,000 Investment as of August 31, 2016 – Class A Shares
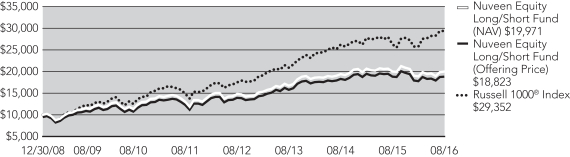
The graphs do not reflect the deduction of taxes that a shareholder may pay on Fund distributions or the redemption of Fund shares.
| NUVEEN | 37 |
Fund Performance and Expense Ratios (continued)
Nuveen Equity Market Neutral Fund
Refer to the first page of this Fund Performance and Expense Ratios section for further explanation of the information included within this section. Refer to Glossary of Terms Used in this Report for definitions of terms used within this section.
Fund Performance
Average Annual Total Returns as of August 31, 2016
| Average Annual | ||||||||
| 1-Year | Since Inception | |||||||
Class A Shares at NAV | 2.86% | 3.40% | ||||||
Class A Shares at maximum Offering Price | (3.06)% | 1.51% | ||||||
BofA/Merrill Lynch 3-Month U.S. Treasury Bill Index | 0.23% | 0.10% | ||||||
Lipper Alternative Equity Market Neutral Funds Classification Average | (0.51)% | 0.84% | ||||||
Class C Shares | 2.14% | 2.65% | ||||||
Class I Shares | 3.12% | 3.67% | ||||||
Average Annual Total Returns as of September 30, 2016 (Most Recent Calendar Quarter)
| Average Annual | ||||||||
| 1-Year | Since Inception | |||||||
Class A Shares at NAV | 1.58% | 3.19% | ||||||
Class A Shares at maximum Offering Price | (4.27)% | 1.35% | ||||||
Class C Shares | 0.89% | 2.44% | ||||||
Class I Shares | 1.89% | 3.46% | ||||||
Since inception returns are from 6/17/13. Indexes and Lipper averages are not available for direct investment.
Class A Shares have a maximum 5.75% sales charge (Offering Price). Class A Share purchases of $1 million or more are sold at net asset value without an up-front sales charge but may be subject to a contingent deferred sales charge (CDSC), also known as a back-end sales charge, if redeemed within eighteen months (twelve months prior to November 1, 2015) of purchase. Such CDSC will be equal to 1% for any shares purchased on or after November 1, 2015 if redeemed within eighteen months of purchase. Class C Shares have a 1% CDSC for redemptions within less than twelve months, which is not reflected in the one-year total return. Class I Shares have no sales charge and may be purchased under limited circumstances or by specified classes of investors.
Expense Ratios as of Most Recent Prospectus
| Share Class | ||||||||||||
| Class A | Class C | Class I | ||||||||||
Gross Expense Ratios | 3.50% | 4.23% | 3.22% | |||||||||
Net Expense Ratios | 3.24% | 3.97% | 2.97% | |||||||||
The Fund’s investment adviser has contractually agreed to waive fees and/or reimburse expenses through December 31, 2016 so that total annual Fund operating expenses (excluding 12b-1 distribution and/or service fees, interest expenses, taxes, acquired fund fees and expenses, fees incurred in acquiring and disposing of portfolio securities (including prime broker fees and charges on short sales), dividend expense on securities sold short and extraordinary expenses) do not exceed 1.40% of the average daily net assets of any class of Fund shares. The expense limitation may be terminated or modified prior to that date only with the approval of the Board of Trustees of the Fund.
| 38 | NUVEEN |
Growth of an Assumed $10,000 Investment as of August 31, 2016 – Class A Shares
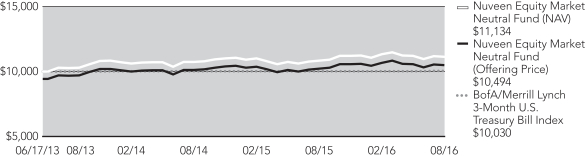
The graphs do not reflect the deduction of taxes that a shareholder may pay on Fund distributions or the redemption of Fund shares.
| NUVEEN | 39 |
Summaries as of August 31, 2016
This data relates to the securities held in each Fund’s portfolio of investments as of the end of the reporting period. It should not be construed as a measure of performance for the Fund itself. Holdings are subject to change.
Nuveen Large Cap Value Fund
Fund Allocation
(% of net assets)
Common Stocks | 99.7% | |||
Repurchase Agreements | 0.1% | |||
Other Assets Less Liabilities | 0.2% | |||
Net Assets | 100% |
Portfolio Composition
(% of net assets)
Banks | 12.5% | |||
Health Care Providers & Services | 5.6% | |||
Construction & Engineering | 5.1% | |||
Food & Staples Retailing | 4.6% | |||
Semiconductors & Semiconductor Equipment | 4.3% | |||
Machinery | 4.1% | |||
Technology Hardware, Storage & Peripherals | 3.8% | |||
Electronic Equipment & Instruments | 3.8% | |||
Insurance | 3.6% | |||
Communication Equipment | 3.5% | |||
Airlines | 3.3% | |||
Capital Markets | 3.2% | |||
Multiline Retail | 3.1% | |||
Metals & Mining | 3.0% | |||
Automobiles | 3.0% | |||
Media | 3.0% | |||
Consumer Finance | 2.8% | |||
Diversified Telecommunication Services | 2.6% | |||
Energy Equipment & Services | 2.2% | |||
Diversified Financial Services | 2.1% | |||
Specialty Retail | 2.1% | |||
Other | 18.4% | |||
Repurchase Agreements | 0.1% | |||
Other Assets Less Liabilities | 0.2% | |||
Net Assets | 100% |
Top Five Common Stock Holdings
(% of net assets)
JPMorgan Chase & Co. | 3.4% | |||
Bank of America Corporation | 2.6% | |||
Cisco Systems, Inc. | 2.6% | |||
Citigroup Inc. | 2.3% | |||
Wal-Mart Stores, Inc. | 2.0% |
| 40 | NUVEEN |
Nuveen Large Cap Core Fund
Fund Allocation
(% of net assets)
Common Stocks | 99.9% | |||
Other Assets Less Liabilities | 0.1% | |||
Net Assets | 100% |
Portfolio Composition
(% of net assets)
Health Care Providers & Services | 8.1% | |||
Technology Hardware, Storage & Peripherals | 5.9% | |||
Specialty Retail | 5.4% | |||
Construction & Engineering | 5.1% | |||
Hotels, Restaurants & Leisure | 5.0% | |||
Media | 4.6% | |||
Biotechnology | 4.3% | |||
Food & Staples Retailing | 3.5% | |||
Software | 3.4% | |||
Electronic Equipment, Instruments & Components | 3.3% | |||
Airlines | 3.1% | |||
Semiconductors & Semiconductor Equipment | 3.1% | |||
Capital Markets | 2.8% | |||
Communications Equipment | 2.6% | |||
Automobiles | 2.6% | |||
Metals & Mining | 2.4% | |||
Multiline Retail | 2.4% | |||
IT Services | 2.3% | |||
Aerospace & Defense | 2.3% | |||
Food Products | 2.1% | |||
Trading Companies & Distributors | 2.1% | |||
Building Products | 2.0% | |||
Diversified Telecommunication Services | 2.0% | |||
Other | 19.5% | |||
Other Assets Less Liabilities | 0.1% | |||
Net Assets | 100% |
Top Five Common Stock Holdings
(% of net assets)
Apple, Inc. | 3.7% | |||
Cisco Systems, Inc. | 1.8% | |||
Home Depot, Inc. | 1.8% | |||
Amgen Inc. | 1.6% | |||
MasterCard, Inc., Class A | 1.5% |
| NUVEEN | 41 |
Holding Summaries as of August 31, 2016 (continued)
Nuveen Large Cap Growth Fund
Fund Allocation
(% of net assets)
Common Stocks | 99.7% | |||
Other Assets Less Liabilities | 0.3% | |||
Net Assets | 100% |
Portfolio Composition
(% of net assets)
Hotels, Restaurants & Leisure | 10.5% | |||
Health Care Providers & Services | 9.9% | |||
Specialty Retail | 7.4% | |||
Biotechnology | 6.1% | |||
Technology Hardware, Storage & Peripherals | 6.1% | |||
Software | 4.9% | |||
Airlines | 4.1% | |||
Multiline Retail | 4.1% | |||
Media | 3.8% | |||
IT Services | 3.5% | |||
Aerospace & Defense | 3.3% | |||
Internet Software & Services | 3.1% | |||
Food & Staples Retailing | 3.0% | |||
Food Products | 2.2% | |||
Semiconductors & Semiconductor Equipment | 2.2% | |||
Electronic Equipment, Instruments & Components | 2.2% | |||
Construction & Engineering | 2.2% | |||
Personal Products | 2.0% | |||
Other | 19.1% | |||
Other Assets Less Liabilities | 0.3% | |||
Net Assets | 100% |
Top Five Common Stock Holdings
(% of net assets)
Apple, Inc. | 6.1% | |||
Home Depot, Inc. | 2.6% | |||
Alphabet Inc., Class A | 2.4% | |||
Amgen Inc. | 2.3% | |||
Microsoft Corporation | 2.2% |
| 42 | NUVEEN |
Nuveen Concentrated Core Fund
Fund Allocation
(% of net assets)
Common Stocks | 100.1% | |||
Repurchase Agreements | 0.1% | |||
Other Assets Less Liabilities | (0.2)% | |||
Net Assets | 100% |
Portfolio Composition
(% of net assets)
Health Care Providers & Services | 15.4% | |||
Airlines | 10.7% | |||
Media | 10.3% | |||
Biotechnology | 10.2% | |||
Technology Hardware, Storage & Peripherals | 10.0% | |||
Banks | 5.5% | |||
Wireless Telecommunication Services | 5.5% | |||
Specialty Retail | 5.3% | |||
Automobiles | 5.3% | |||
Consumer Finance | 5.2% | |||
Multiline Retail | 5.2% | |||
Food & Staples Retailing | 5.1% | |||
Other | 6.4% | |||
Repurchase Agreements | 0.1% | |||
Other Assets Less Liabilities | (0.2)% | |||
Net Assets | 100% |
Top Five Common Stock Holdings
(% of net assets)
JPMorgan Chase & Co. | 5.5% | |||
T-Mobile US Inc. | 5.5% | |||
Delta Air Lines, Inc. | 5.4% | |||
Lowe’s Companies, Inc. | 5.3% | |||
Southwest Airlines Co. | 5.3% |
| NUVEEN | 43 |
Holding Summaries as of August 31, 2016 (continued)
Nuveen Core Dividend Fund
Fund Allocation
(% of net assets)
Common Stocks | 100.0% | |||
Other Assets Less Liabilities | 0.0% | |||
Net Assets | 100% |
Portfolio Composition
(% of net assets)
Capital Markets | 7.0% | |||
Media | 6.6% | |||
Hotels, Restaurants & Leisure | 6.4% | |||
Health Care Providers & Services | 5.7% | |||
Technology Hardware, Storage & Peripherals | 4.9% | |||
Specialty Retail | 4.9% | |||
Biotechnology | 4.6% | |||
Equity Real Estate Investment Trusts | 4.1% | |||
Diversified Telecommunication Services | 4.0% | |||
Food Products | 3.3% | |||
Food & Staples Retailing | 3.3% | |||
Airlines | 3.1% | |||
IT Services | 2.9% | |||
Automobiles | 2.5% | |||
Multiline Retail | 2.4% | |||
Air Freight & Logistics | 2.4% | |||
Aerospace & Defense | 2.4% | |||
Commercial Services & Supplies | 2.3% | |||
Machinery | 2.0% | |||
Oil, Gas & Consumable Fuels | 2.0% | |||
Beverages | 1.9% | |||
Communications Equipment | 1.8% | |||
Other | 19.5% | |||
Other Assets Less Liabilities | 0.0% | |||
Net Assets | 100% |
Top Five Common Stock Holdings
(% of net assets)
Apple, Inc. | 3.8% | |||
Verizon Communications Inc. | 1.9% | |||
Cisco Systems, Inc. | 1.8% | |||
Home Depot, Inc. | 1.8% | |||
Amgen Inc. | 1.6% |
| 44 | NUVEEN |
Nuveen Growth Fund
Fund Allocation
(% of net assets)
Common Stocks | 99.7% | |||
Other Assets Less Liabilities | 0.3% | |||
Net Assets | 100% |
Portfolio Composition
(% of net assets)
Health Care Providers & Services | 12.3% | |||
IT Services | 10.6% | |||
Hotels, Restaurants & Leisure | 9.3% | |||
Media | 8.9% | |||
Specialty Retail | 7.9% | |||
Beverages | 7.5% | |||
Biotechnology | 6.7% | |||
Technology Hardware, Storage & Peripherals | 4.2% | |||
Internet Software & Services | 3.8% | |||
Software | 3.6% | |||
Diversified Telecommunication Services | 3.3% | |||
Multiline Retail | 2.9% | |||
Other | 18.7% | |||
Other Assets Less Liabilities | 0.3% | |||
Net Assets | 100% |
Top Five Common Stock Holdings
(% of net assets)
Home Depot, Inc. | 4.7% | |||
Apple, Inc. | 4.2% | |||
PepsiCo, Inc. | 3.8% | |||
MasterCard, Inc., Class A | 3.8% | |||
Alphabet Inc., Class A | 3.8% |
| NUVEEN | 45 |
Holding Summaries as of August 31, 2016 (continued)
Nuveen Large Cap Core Plus Fund
Fund Allocation
(% of net assets)
Long-Term Investments | ||||
Common Stocks | 129.7% | |||
Total Long Exposure | 129.7% | |||
Repurchase Agreements | 0.5% | |||
Total Investments | 130.2% | |||
Securities Sold Short | ||||
Common Stocks | (29.9)% | |||
Total Short Exposure | (29.9)% | |||
Other Assets Less Liabilities | (0.3)% | |||
Net Assets | 100% |
Top Five Holdings
(Long Exposure)
(% of net assets)
Apple, Inc. | 5.0% | |||
Home Depot, Inc. | 2.3% | |||
Cisco Systems, Inc. | 2.3% | |||
Amgen Inc. | 2.1% | |||
JPMorgan Chase & Co. | 2.0% |
Top Five Holdings
(Short Exposure)
(% of net assets)
OneMain Holdings Inc. | (0.3)% | |||
New York Community Bancorp Inc. | (0.3)% | |||
SS&C Technologies Holdings Inc. | (0.3)% | |||
Pioneer Natural Resources Company | (0.3)% | |||
Charter Communications, Inc., Class A | (0.3)% |
Portfolio Composition –
Long Exposure
(% of net assets)
Health Care Providers & Services | 10.6% | |||
Technology Hardware, Storage & Peripherals | 7.8% | |||
Hotels, Restaurants & Leisure | 7.5% | |||
Specialty Retail | 6.7% | |||
Construction & Engineering | 6.3% | |||
Biotechnology | 5.7% | |||
Media | 5.7% | |||
Electronic Equipment, Instruments & Components | 5.5% | |||
Food & Staples Retailing | 5.1% | |||
Multiline Retail | 4.8% | |||
Software | 4.1% | |||
Banks | 3.7% | |||
Airlines | 3.6% | |||
Trading Companies & Distributors | 3.4% | |||
IT Services | 3.4% | |||
Automobiles | 3.3% | |||
Semiconductors & Semiconductor Equipment | 3.0% | |||
Diversified Telecommunication Services | 2.9% | |||
Building Products | 2.7% | |||
Metals & Mining | 2.6% | |||
Food Products | 2.6% | |||
Aerospace & Defense | 2.5% | |||
Personal Products | 2.5% | |||
Communications Equipment | 2.3% | |||
Internet Software & Services | 2.0% | |||
Other | 19.4% | |||
Total | 129.7% |
Portfolio Composition –
Short Exposure
(% of net assets)
Oil, Gas & Consumable Fuels | (4.1)% | |||
Electric Utilities | (1.9)% | |||
Health Care Equipment & Supplies | (1.7)% | |||
Beverages | (1.5)% | |||
Software | (1.3)% | |||
Household Durables | (1.2)% | |||
Multi-Utilities | (1.2)% | |||
Internet Software & Services | (1.2)% | |||
Internet & Catalog Retail | (1.0)% | |||
Chemicals | (0.9)% | |||
Energy Equipment & Services | (0.9)% | |||
Specialty Retail | (0.9)% | |||
Textiles, Apparel & Luxury Goods | (0.9)% | |||
Electronic Equipment, Instruments & Components | (0.7)% | |||
Insurance | (0.7)% | |||
Other | (9.8)% | |||
Total | (29.9)% |
| 46 | NUVEEN |
Nuveen Equity Long/Short Fund
Fund Allocation
(% of net assets)
Long-Term Investments | ||||
Common Stocks | 155.9% | |||
Total Long Exposure | 155.9% | |||
Repurchase Agreements | 3.3% | |||
Total Investments | 159.2% | |||
Securities Sold Short | ||||
Common Stocks | (75.1)% | |||
Total Short Exposure | (75.1)% | |||
Other Assets Less Liabilities | 15.9% | |||
Net Assets | 100% |
Top Five Holdings
(Long Exposure)
(% of net assets)
Apple, Inc. | 3.2% | |||
Microsoft Corporation | 2.7% | |||
JPMorgan Chase & Co. | 2.1% | |||
Verizon Communications Inc. | 2.0% | |||
Cisco Systems, Inc. | 1.8% |
Top Five Holdings
(Short Exposure)
(% of net assets)
Mercury General Corporation | (0.9)% | |||
OneMain Holdings Inc. | (0.9)% | |||
Pinnacle Foods Inc. | (0.9)% | |||
Compass Minerals | (0.9)% | |||
Lennar Corporation, Class A | (0.9)% |
Portfolio Composition –
Long Exposure
(% of net assets)
Biotechnology | 8.2% | |||
Specialty Retail | 7.8% | |||
Software | 7.8% | |||
Health Care Providers & Services | 7.7% | |||
Hotels, Restaurants & Leisure | 7.6% | |||
Semiconductors & Semiconductor Equipment | 7.0% | |||
Media | 6.3% | |||
Food & Staples Retailing | 6.0% | |||
Technology Hardware, Storage & Peripherals | 5.8% | |||
Insurance | 5.4% | |||
Chemicals | 4.9% | |||
Banks | 4.8% | |||
Oil, Gas & Consumable Fuels | 4.8% | |||
Machinery | 4.6% | |||
Communications Equipment | 4.2% | |||
Construction & Engineering | 4.1% | |||
Household Products | 3.7% | |||
Trading Companies & Distributors | 3.6% | |||
IT Services | 3.4% | |||
Diversified Telecommunication Services | 3.2% | |||
Airlines | 2.8% | |||
Professional Services | 2.6% | |||
Food Products | 2.5% | |||
Auto Components | 2.5% | |||
Air Freight & Logistics | 2.5% | |||
Containers & Packaging | 2.4% | |||
Health Care Technology | 2.4% | |||
Metals & Mining | 2.3% | |||
Household Durables | 2.2% | |||
Personal Products | 2.2% | |||
Consumer Finance | 2.1% | |||
Other | 18.5% | |||
Total | 155.9% |
Portfolio Composition –
Short Exposure
(% of net assets)
Oil, Gas & Consumable Fuels | (6.6)% | |||
Software | (4.3)% | |||
Electric Utilities | (3.9)% | |||
Chemicals | (3.3)% | |||
Household Durables | (3.3)% | |||
Electronic Equipment, Instruments & Components | (2.5)% | |||
Containers & Packaging | (2.5)% | |||
Specialty Retail | (2.4)% | |||
Hotels, Restaurants & Leisure | (2.4)% | |||
Health Care Equipment & Supplies | (2.4)% | |||
Beverages | (2.4)% | |||
Internet Software & Services | (2.3)% | |||
Insurance | (2.3)% | |||
Semiconductors & Semiconductor Equipment | (2.3)% | |||
Food Products | (2.2)% | |||
Internet & Catalog Retail | (2.0)% | |||
Energy Equipment & Services | (2.0)% | |||
Aerospace & Defense | (1.7)% | |||
Metals & Mining | (1.7)% | |||
Multi-Utilities | (1.7)% | |||
Commercial Services & Supplies | (1.6)% | |||
Other | (19.3)% | |||
Total | (75.1)% |
| NUVEEN | 47 |
Holding Summaries as of August 31, 2016 (continued)
Nuveen Equity Market Neutral Fund
Fund Allocation
(% of net assets)
Long-Term Investments | ||||
Common Stocks | 112.8% | |||
Total Long Exposure | 112.8% | |||
Repurchase Agreements | 4.8% | |||
Total Investments | 117.6% | |||
Securities Sold Short | ||||
Common Stocks | (92.6)% | |||
Total Short Exposure | (92.6)% | |||
Other Assets Less Liabilities | 75.0% | |||
Net Assets | 100% |
Top Five Holdings
(Long Exposure)
(% of net assets)
Telephone and Data Systems Inc. | 1.2% | |||
WESCO International Inc. | 1.2% | |||
SM Energy Company | 1.2% | |||
Ingram Micro, Inc., Class A | 1.2% | |||
Jabil Circuit Inc. | 1.2% |
Top Five Holdings
(Short Exposure)
(% of net assets)
Westar Energy Inc. | (1.0)% | |||
Eversource Energy | (1.0)% | |||
Chipotle Mexican Grill | (1.0)% | |||
New York Community Bancorp Inc. | (1.0)% | |||
OneMain Holdings Inc. | (1.0)% |
Portfolio Composition –
Long Exposure
(% of net assets)
Hotels, Restaurants & Leisure | 7.2% | |||
Health Care Providers & Services | 6.9% | |||
Media | 6.1% | |||
Oil, Gas & Consumable Fuels | 5.8% | |||
Specialty Retail | 5.6% | |||
Food Products | 4.4% | |||
Electronic Equipment, Instruments & Components | 4.4% | |||
Biotechnology | 4.2% | |||
Construction & Engineering | 3.9% | |||
Multiline Retail | 3.4% | |||
Technology Hardware, Storage & Peripherals | 3.4% | |||
Semiconductors & Semiconductor Equipment | 3.4% | |||
Food & Staples Retailing | 3.4% | |||
Metals & Mining | 3.3% | |||
Communications Equipment | 3.3% | |||
Airlines | 3.2% | |||
Capital Markets | 2.6% | |||
Machinery | 2.6% | |||
Wireless Telecommunication Services | 2.3% | |||
Automobiles | 2.3% | |||
Software | 2.3% | |||
Building Products | 2.3% | |||
Aerospace & Defense | 2.2% | |||
Personal Products | 2.2% | |||
Auto Components | 2.1% | |||
Consumer Finance | 1.9% | |||
Other | 18.1% | |||
Total | 112.8% |
Portfolio Composition –
Short Exposure
(% of net assets)
Oil, Gas & Consumable Fuels | (10.7)% | |||
Software | (5.7)% | |||
Electric Utilities | (5.3)% | |||
Household Durables | (4.5)% | |||
Internet Software & Services | (3.8)% | |||
Chemicals | (3.8)% | |||
Hotels, Restaurants & Leisure | (2.9)% | |||
Specialty Retail | (2.9)% | |||
Health Care Equipment & Supplies | (2.9)% | |||
Containers & Packaging | (2.8)% | |||
Energy Equipment & Services | (2.8)% | |||
Semiconductors & Semiconductor Equipment | (2.6)% | |||
Insurance | (2.5)% | |||
Electronic Equipment, Instruments & Components | (2.4)% | |||
Internet & Catalog Retail | (2.4)% | |||
Beverages | (1.9)% | |||
Metals & Mining | (1.9)% | |||
Media | (1.9)% | |||
Aerospace & Defense | (1.9)% | |||
Health Care Providers & Services | (1.9)% | |||
Multi-Utilities | (1.8)% | |||
Food Products | (1.8)% | |||
Commercial Services & Supplies | (1.8)% | |||
Other | (19.7)% | |||
Total | (92.6)% |
| 48 | NUVEEN |
Examples
As a shareholder of one or more of the Funds, you incur two types of costs: (1) transaction costs, including up-front and back-end sales charges (loads) or redemption fees, where applicable; and (2) ongoing costs, including management fees; distribution and service (12b-1) fees, where applicable; and other Fund expenses. The Examples below are intended to help you understand your ongoing costs (in dollars) of investing in the Funds and to compare these costs with the ongoing costs of investing in other mutual funds. Since the expense examples for Class R6 Shares reflect only the first 62 days of the Class’s operation, they may not provide a meaningful understanding of the Class’s ongoing expenses.
The Examples below are based on an investment of $1,000 invested at the beginning of the period and held through the period ended August 31, 2016.
The beginning of the period is March 1, 2016.
The information under “Actual Performance,” together with the amount you invested, allows you to estimate actual expenses incurred over the reporting period. Simply divide your account value by $1,000 (for example, an $8,600 account value divided by $1,000 = 8.60) and multiply the result by the cost shown for your share class, in the row entitled “Expenses Incurred During Period” to estimate the expenses incurred on your account during this period.
The information under “Hypothetical Performance,” provides information about hypothetical account values and hypothetical expenses based on each Fund’s actual expense ratios and an assumed rate of return of 5% per year before expenses, which is not the Fund’s actual return. The hypothetical account values and expenses may not be used to estimate the actual ending account balance or expense you incurred for the period. You may use this information to compare the ongoing costs of investing in the Fund and other funds. To do so, compare this 5% hypothetical example with the 5% hypothetical examples that appear in the shareholder reports of the other funds.
Please note that the expenses shown in the table are meant to highlight your ongoing costs only and do not reflect any transaction costs. Therefore, the hypothetical information is useful in comparing ongoing costs only, and will not help you determine the relative total costs of owning different funds or share classes. In addition, if these transaction costs were included, your costs would have been higher.
Nuveen Large Cap Value Fund
| Share Class | ||||||||||||||||||||
| Class A | Class C | Class R3 | Class R6 | Class I | ||||||||||||||||
Actual Performance | ||||||||||||||||||||
Beginning Account Value | $ | 1,000.00 | $ | 1,000.00 | $ | 1,000.00 | $ | 1,000.00 | $ | 1,000.00 | ||||||||||
Ending Account Value | $ | 1,152.10 | $ | 1,147.40 | $ | 1,150.40 | $ | 1,056.30 | $ | 1,153.20 | ||||||||||
Expenses Incurred During Period | $ | 5.84 | $ | 9.88 | $ | 7.19 | $ | 1.27 | $ | 4.49 | ||||||||||
| Hypothetical Performance (5% annualized return before expenses) | ||||||||||||||||||||
Beginning Account Value | $ | 1,000.00 | $ | 1,000.00 | $ | 1,000.00 | $ | 1,000.00 | $ | 1,000.00 | ||||||||||
Ending Account Value | $ | 1,019.71 | $ | 1,015.94 | $ | 1,018.45 | $ | 1,007.23 | $ | 1,020.96 | ||||||||||
Expenses Incurred During Period | $ | 5.48 | $ | 9.27 | $ | 6.75 | $ | 1.24 | $ | 4.22 | ||||||||||
For each class of the Fund, expenses are equal to the Fund’s annualized net expense ratio of 1.08%, 1.83%, 1.33% and 0.83% for Classes A, C, R3 and I, respectively, multiplied by the average account value over the period, multiplied by 184/366 (to reflect the one-half year period). For Class R6, expenses are equal to the Fund’s annualized net expense ratio of 0.73% multiplied by the average account value over the period, multiplied by 62/366 (to reflect the 62 days in the period since class commencement of operations).
| NUVEEN | 49 |
Expense Examples (continued)
Nuveen Large Cap Core Fund
| Share Class | ||||||||||||||||
| Class A | Class C | Class R6 | Class I | |||||||||||||
Actual Performance | ||||||||||||||||
Beginning Account Value | $ | 1,000.00 | $ | 1,000.00 | $ | 1,000.00 | $ | 1,000.00 | ||||||||
Ending Account Value | $ | 1,111.00 | $ | 1,107.20 | $ | 1,063.60 | $ | 1,112.60 | ||||||||
Expenses Incurred During Period | $ | 5.78 | $ | 9.75 | $ | 1.21 | $ | 4.46 | ||||||||
Hypothetical Performance (5% annualized return before expenses) | ||||||||||||||||
Beginning Account Value | $ | 1,000.00 | $ | 1,000.00 | $ | 1,000.00 | $ | 1,000.00 | ||||||||
Ending Account Value | $ | 1,019.66 | $ | 1,015.89 | $ | 1,007.30 | $ | 1,020.91 | ||||||||
Expenses Incurred During Period | $ | 5.53 | $ | 9.32 | $ | 1.17 | $ | 4.27 | ||||||||
For each class of the Fund, expenses are equal to the Fund’s annualized net expense ratio of 1.09%, 1.84% and 0.84% for Classes A, C and I, respectively, multiplied by the average account value over the period, multiplied by 184/366 (to reflect the one-half year period). For Class R6, expenses are equal to the Fund’s annualized net expense ratio of 0.69% multiplied by the average account value over the period, multiplied by 62/366 (to reflect the 62 days in the period since class commencement of operations).
Nuveen Large Cap Growth Fund
| Share Class | ||||||||||||||||
| Class A | Class C | Class R6 | Class I | |||||||||||||
Actual Performance | ||||||||||||||||
Beginning Account Value | $ | 1,000.00 | $ | 1,000.00 | $ | 1,000.00 | $ | 1,000.00 | ||||||||
Ending Account Value | $ | 1,099.30 | $ | 1,095.00 | $ | 1,060.20 | $ | 1,100.50 | ||||||||
Expenses Incurred During Period | $ | 5.96 | $ | 9.85 | $ | 1.22 | $ | 4.59 | ||||||||
Hypothetical Performance (5% annualized return before expenses) | ||||||||||||||||
Beginning Account Value | $ | 1,000.00 | $ | 1,000.00 | $ | 1,000.00 | $ | 1,000.00 | ||||||||
Ending Account Value | $ | 1,019.46 | $ | 1,015.74 | $ | 1,007.33 | $ | 1,020.76 | ||||||||
Expenses Incurred During Period | $ | 5.74 | $ | 9.48 | $ | 1.19 | $ | 4.42 | ||||||||
For each class of the Fund, expenses are equal to the Fund’s annualized net expense ratio of 1.13%, 1.87% and 0.87% for Classes A, C and I, respectively, multiplied by the average account value over the period, multiplied by 184/366 (to reflect the one-half year period). For Class R6, expenses are equal to the Fund’s annualized net expense ratio of 0.70% multiplied by the average account value over the period, multiplied by 62/366 (to reflect the 62 days in the period since class commencement of operations).
Nuveen Concentrated Core Fund
| Share Class | ||||||||||||||||
| Class A | Class C | Class R6 | Class I | |||||||||||||
Actual Performance | ||||||||||||||||
Beginning Account Value | $ | 1,000.00 | $ | 1,000.00 | $ | 1,000.00 | $ | 1,000.00 | ||||||||
Ending Account Value | $ | 1,082.10 | $ | 1,078.20 | $ | 1,031.70 | $ | 1,083.70 | ||||||||
Expenses Incurred During Period | $ | 6.12 | $ | 10.03 | $ | 1.26 | $ | 4.82 | ||||||||
Hypothetical Performance (5% annualized return before expenses) | ||||||||||||||||
Beginning Account Value | $ | 1,000.00 | $ | 1,000.00 | $ | 1,000.00 | $ | 1,000.00 | ||||||||
Ending Account Value | $ | 1,019.25 | $ | 1,015.48 | $ | 1,007.27 | $ | 1,020.51 | ||||||||
Expenses Incurred During Period | $ | 5.94 | $ | 9.73 | $ | 1.24 | $ | 4.67 | ||||||||
For each class of the Fund, expenses are equal to the Fund’s annualized net expense ratio of 1.17%, 1.92% and 0.92% for Classes A, C and I, respectively, multiplied by the average account value over the period, multiplied by 184/366 (to reflect the one-half year period). For Class R6, expenses are equal to the Fund’s annualized net expense ratio of 0.73% multiplied by the average account value over the period, multiplied by 62/366 (to reflect the 62 days in the period since class commencement of operations).
| 50 | NUVEEN |
Nuveen Core Dividend Fund
| Share Class | ||||||||||||
| Class A | Class C | Class I | ||||||||||
Actual Performance | ||||||||||||
Beginning Account Value | $ | 1,000.00 | $ | 1,000.00 | $ | 1,000.00 | ||||||
Ending Account Value | $ | 1,112.90 | $ | 1,108.10 | $ | 1,113.70 | ||||||
Expenses Incurred During the Period | $ | 5.95 | $ | 9.91 | $ | 4.62 | ||||||
Hypothetical Performance (5% annualized return before expenses) | ||||||||||||
Beginning Account Value | $ | 1,000.00 | $ | 1,000.00 | $ | 1,000.00 | ||||||
Ending Account Value | $ | 1,019.51 | $ | 1,015.74 | $ | 1,020.76 | ||||||
Expenses Incurred During the Period | $ | 5.69 | $ | 9.48 | $ | 4.42 | ||||||
For each class of the Fund, expenses are equal to the Fund’s annualized net expense ratio of 1.12%, 1.87% and 0.87% for Classes A, C and I, respectively, multiplied by the average account value over the period, multiplied by 184/366 (to reflect the one-half year period).
Nuveen Growth Fund
| Share Class | ||||||||||||||||
| Class A | Class C | Class R3 | Class I | |||||||||||||
Actual Performance | ||||||||||||||||
Beginning Account Value | $ | 1,000.00 | $ | 1,000.00 | $ | 1,000.00 | $ | 1,000.00 | ||||||||
Ending Account Value | $ | 1,103.40 | $ | 1,099.30 | $ | 1,101.80 | $ | 1,104.90 | ||||||||
Expenses Incurred During the Period | $ | 6.08 | $ | 10.03 | $ | 7.34 | $ | 4.71 | ||||||||
Hypothetical Performance (5% annualized return before expenses) | ||||||||||||||||
Beginning Account Value | $ | 1,000.00 | $ | 1,000.00 | $ | 1,000.00 | $ | 1,000.00 | ||||||||
Ending Account Value | $ | 1,019.36 | $ | 1,015.58 | $ | 1,018.15 | $ | 1,020.66 | ||||||||
Expenses Incurred During the Period | $ | 5.84 | $ | 9.63 | $ | 7.05 | $ | 4.52 | ||||||||
For each class of the Fund, expenses are equal to the Fund’s annualized net expense ratio of 1.15%, 1.90%, 1.39% and 0.89% for Classes A, C, R3 and I, respectively, multiplied by the average account value over the period, multiplied by 184/366 (to reflect the one-half year period).
Nuveen Large Cap Core Plus Fund
| Share Class | ||||||||||||
| Class A | Class C | Class I | ||||||||||
Actual Performance | ||||||||||||
Beginning Account Value | $ | 1,000.00 | $ | 1,000.00 | $ | 1,000.00 | ||||||
Ending Account Value | $ | 1,088.60 | $ | 1,084.40 | $ | 1,090.10 | ||||||
Expenses Incurred During the Period | $ | 12.18 | $ | 16.09 | $ | 10.88 | ||||||
Hypothetical Performance (5% annualized return before expenses) | ||||||||||||
Beginning Account Value | $ | 1,000.00 | $ | 1,000.00 | $ | 1,000.00 | ||||||
Ending Account Value | $ | 1,013.47 | $ | 1,009.70 | $ | 1,014.73 | ||||||
Expenses Incurred During the Period | $ | 11.74 | $ | 15.51 | $ | 10.48 | ||||||
For each class of the Fund, expenses are equal to the Fund’s annualized net expense ratio of 2.32%, 3.07% and 2.07% for Classes A, C and I, respectively, multiplied by the average account value over the period, multiplied by 184/366 (to reflect the one-half year period).
| NUVEEN | 51 |
Expense Examples (continued)
Nuveen Equity Long/Short Fund
| Share Class | ||||||||||||
| Class A | Class C | Class I | ||||||||||
Actual Performance | ||||||||||||
Beginning Account Value | $ | 1,000.00 | $ | 1,000.00 | $ | 1,000.00 | ||||||
Ending Account Value | $ | 1,059.50 | $ | 1,055.60 | $ | 1,060.90 | ||||||
Expenses Incurred During the Period | $ | 18.12 | $ | 21.96 | $ | 16.73 | ||||||
Hypothetical Performance (5% annualized return before expenses) | ||||||||||||
Beginning Account Value | $ | 1,000.00 | $ | 1,000.00 | $ | 1,000.00 | ||||||
Ending Account Value | $ | 1,007.54 | $ | 1,003.77 | $ | 1,008.90 | ||||||
Expenses Incurred During the Period | $ | 17.66 | $ | 21.41 | $ | 16.31 | ||||||
For each class of the Fund, expenses are equal to the Fund’s annualized net expense ratio of 3.50%, 4.25% and 3.23% for Classes A, C and I, respectively, multiplied by the average account value over the period, multiplied by 184/366 (to reflect the one-half year period).
Nuveen Equity Market Neutral Fund
| Share Class | ||||||||||||
| Class A | Class C | Class I | ||||||||||
Actual Performance | ||||||||||||
Beginning Account Value | $ | 1,000.00 | $ | 1,000.00 | $ | 1,000.00 | ||||||
Ending Account Value | $ | 983.60 | $ | 980.10 | $ | 985.10 | ||||||
Expenses Incurred During the Period | $ | 15.81 | $ | 19.61 | $ | 14.67 | ||||||
Hypothetical Performance (5% annualized return before expenses) | ||||||||||||
Beginning Account Value | $ | 1,000.00 | $ | 1,000.00 | $ | 1,000.00 | ||||||
Ending Account Value | $ | 1,009.20 | $ | 1,005.33 | $ | 1,010.36 | ||||||
Expenses Incurred During the Period | $ | 16.01 | $ | 19.86 | $ | 14.86 | ||||||
For each class of the Fund, expenses are equal to the Fund’s annualized net expense ratio of 3.17%, 3.94% and 2.94% for Classes A, C and I, respectively, multiplied by the average account value over the period, multiplied by 184/366 (to reflect the one-half year period).
| 52 | NUVEEN |
Independent Registered Public Accounting Firm
To the Board of Trustees and Shareholders of
Nuveen Investment Trust
Nuveen Investment Trust II:
We have audited the accompanying statements of assets and liabilities, including the portfolios of investments, of Nuveen Large Cap Value Fund, Nuveen Large Cap Core Fund, Nuveen Large Cap Growth Fund, Nuveen Concentrated Core Fund, Nuveen Core Dividend Fund, Nuveen Large Cap Core Plus Fund, Nuveen Equity Market Neutral Fund (seven of the funds comprising the Nuveen Investment Trust), Nuveen Growth Fund and Nuveen Equity Long/Short Fund (two of the funds comprising the Nuveen Investment Trust II) (the “Funds”) as of August 31, 2016, and the related statements of operations for the year then ended, statements of cash flows (Nuveen Large Cap Core Plus Fund, Nuveen Equity Long/Short Fund, and Nuveen Equity Market Neutral Fund) for the year then ended, statements of changes in net assets for each of the years in the two-year period then ended, and the financial highlights for each of the periods in the three-year period then ended. The financial highlights for the periods presented through August 31, 2013, were audited by other auditors whose report dated October 28, 2013, expressed an unqualified opinion on those financial highlights. These financial statements and financial highlights are the responsibility of the Funds’ management. Our responsibility is to express an opinion on these financial statements and financial highlights based on our audits.
We conducted our audits in accordance with the standards of the Public Company Accounting Oversight Board (United States). Those standards require that we plan and perform the audit to obtain reasonable assurance about whether the financial statements and financial highlights are free of material misstatement. An audit includes examining, on a test basis, evidence supporting the amounts and disclosures in the financial statements. Our procedures included confirmation of securities owned as of August 31, 2016, by correspondence with the custodian and brokers or other appropriate auditing procedures. An audit also includes assessing the accounting principles used and significant estimates made by management, as well as evaluating the overall financial statement presentation. We believe that our audits provide a reasonable basis for our opinion.
In our opinion, the financial statements and financial highlights referred to above present fairly, in all material respects, the financial position of the Funds as of August 31, 2016, the results of their operations for the year then ended, their cash flows (Nuveen Large Cap Core Plus Fund, Nuveen Equity Long/Short Fund, and Nuveen Equity Market Neutral Fund) for the year then ended, the changes in their net assets for each of the years in the two-year period then ended, and the financial highlights for each of the periods in the three-year period then ended, in conformity with U.S. generally accepted accounting principles.
/s/ KPMG LLP
Chicago, Illinois
October 26, 2016
| NUVEEN | 53 |
Nuveen Large Cap Value Fund
| Portfolio of Investments | August 31, 2016 |
| Shares | Description (1) | Value | ||||||||||||||
LONG-TERM INVESTMENTS – 99.7% | ||||||||||||||||
COMMON STOCKS – 99.7% | ||||||||||||||||
| Aerospace & Defense – 0.9% | ||||||||||||||||
| 22,000 | Huntington Ingalls Industries Inc. | $ | 3,633,740 | |||||||||||||
| Airlines – 3.3% | ||||||||||||||||
| 58,000 | Alaska Air Group, Inc. | 3,916,740 | ||||||||||||||
| 32,000 | Copa Holdings SA, Class A | 2,445,760 | ||||||||||||||
| 113,000 | Delta Air Lines, Inc. | 4,152,750 | ||||||||||||||
| 42,000 | United Continental Holdings Inc., (2) | 2,117,220 | ||||||||||||||
Total Airlines | 12,632,470 | |||||||||||||||
| Auto Components – 1.0% | ||||||||||||||||
| 34,000 | Lear Corporation | 3,953,860 | ||||||||||||||
| Automobiles – 3.0% | ||||||||||||||||
| 465,000 | Ford Motor Company | 5,859,000 | ||||||||||||||
| 176,000 | General Motors Company | 5,617,920 | ||||||||||||||
Total Automobiles | 11,476,920 | |||||||||||||||
| Banks – 12.5% | ||||||||||||||||
| 623,000 | Bank of America Corporation | 10,055,220 | ||||||||||||||
| 189,000 | Citigroup Inc. | 9,022,860 | ||||||||||||||
| 197,000 | JPMorgan Chase & Co. | 13,297,500 | ||||||||||||||
| 66,000 | PNC Financial Services Group, Inc. | 5,946,600 | ||||||||||||||
| 107,000 | Popular Inc. | 4,206,170 | ||||||||||||||
| 32,000 | Regions Financial Corporation | 319,040 | ||||||||||||||
| 113,000 | SunTrust Banks, Inc. | 4,979,910 | ||||||||||||||
| 15,000 | Wells Fargo & Company | 762,000 | ||||||||||||||
Total Banks | 48,589,300 | |||||||||||||||
| Biotechnology – 1.0% | ||||||||||||||||
| 23,000 | Amgen Inc. | 3,911,380 | ||||||||||||||
| Building Products – 1.4% | ||||||||||||||||
| 31,000 | Owens Corning | 1,702,520 | ||||||||||||||
| 143,000 | USG Corporation, (2) | 3,922,490 | ||||||||||||||
Total Building Products | 5,625,010 | |||||||||||||||
| Capital Markets – 3.2% | ||||||||||||||||
| 110,000 | Bank New York Mellon | 4,583,700 | ||||||||||||||
| 61,000 | Franklin Resources, Inc. | 2,226,500 | ||||||||||||||
| 173,000 | Morgan Stanley | 5,546,380 | ||||||||||||||
Total Capital Markets | 12,356,580 | |||||||||||||||
| 54 | NUVEEN |
| Shares | Description (1) | Value | ||||||||||||||
| Chemicals – 1.1% | ||||||||||||||||
| 83,000 | Cabot Corporation | $ | 4,138,380 | |||||||||||||
| Commercial Services & Supplies – 1.1% | ||||||||||||||||
| 197,000 | Pitney Bowes Inc. | 3,695,720 | ||||||||||||||
| 40,000 | R.R. Donnelley & Sons Company | 684,000 | ||||||||||||||
Total Commercial Services & Supplies | 4,379,720 | |||||||||||||||
| Communication Equipment – 3.5% | ||||||||||||||||
| 418,000 | Brocade Communications Systems Inc. | 3,753,640 | ||||||||||||||
| 317,000 | Cisco Systems, Inc. | 9,966,480 | ||||||||||||||
Total Communication Equipment | 13,720,120 | |||||||||||||||
| Construction & Engineering – 5.1% | ||||||||||||||||
| 128,000 | AECOM, (2) | 3,946,240 | ||||||||||||||
| 131,000 | Chicago Bridge & Iron Company N.V. | 3,901,180 | ||||||||||||||
| 80,000 | Jacobs Engineering Group, Inc., (2) | 4,215,200 | ||||||||||||||
| 154,000 | Quanta Services Incorporated, (2) | 3,962,420 | ||||||||||||||
| 30,000 | Valmont Industries, Inc. | 3,914,100 | ||||||||||||||
Total Construction & Engineering | 19,939,140 | |||||||||||||||
| Consumer Finance – 2.8% | ||||||||||||||||
| 89,000 | American Express Company | 5,836,620 | ||||||||||||||
| 81,000 | Discover Financial Services | 4,860,000 | ||||||||||||||
Total Consumer Finance | 10,696,620 | |||||||||||||||
| Diversified Financial Services – 2.1% | ||||||||||||||||
| 18,000 | Berkshire Hathaway Inc., Class B, (2) | 2,708,820 | ||||||||||||||
| 50,000 | CME Group, Inc. | 5,417,500 | ||||||||||||||
Total Diversified Financial Services | 8,126,320 | |||||||||||||||
| Diversified Telecommunication Services – 2.6% | ||||||||||||||||
| 43,000 | AT&T Inc. | 1,757,840 | ||||||||||||||
| 156,000 | CenturyLink Inc. | 4,336,800 | ||||||||||||||
| 208,000 | Intelsat SA, (2) | 561,600 | ||||||||||||||
| 404,000 | Windstream Holdings Inc. | 3,438,040 | ||||||||||||||
Total Diversified Telecommunication Services | 10,094,280 | |||||||||||||||
| Electrical Equipment – 1.0% | ||||||||||||||||
| 64,000 | Regal-Beloit Corporation | 3,925,120 | ||||||||||||||
| Electronic Equipment & Instruments – 3.8% | ||||||||||||||||
| 64,000 | Arrow Electronics, Inc., (2) | 4,213,120 | ||||||||||||||
| 69,000 | Avnet Inc. | 2,875,920 | ||||||||||||||
| 102,000 | Ingram Micro, Inc., Class A | 3,565,920 | ||||||||||||||
| 187,000 | Jabil Circuit Inc. | 3,962,530 | ||||||||||||||
Total Electronic Equipment & Instruments | 14,617,490 | |||||||||||||||
| NUVEEN | 55 |
Nuveen Large Cap Value Fund (continued)
| Portfolio of Investments | August 31, 2016 |
| Shares | Description (1) | Value | ||||||||||||||
| Energy Equipment & Services – 2.2% | ||||||||||||||||
| 174,000 | Atwood Oceanics Inc. | $ | 1,374,600 | |||||||||||||
| 237,000 | Ensco PLC, Class A | 1,798,830 | ||||||||||||||
| 522,000 | Seadrill Limited | 1,258,020 | ||||||||||||||
| 173,000 | Tidewater Inc. | 565,710 | ||||||||||||||
| 366,000 | Transocean Inc. | 3,550,200 | ||||||||||||||
Total Energy Equipment & Services | 8,547,360 | |||||||||||||||
| Food & Staples Retailing – 4.6% | ||||||||||||||||
| 73,000 | Sysco Corporation | 3,785,780 | ||||||||||||||
| 74,000 | Walgreens Boots Alliance Inc. | 5,972,540 | ||||||||||||||
| 110,000 | Wal-Mart Stores, Inc. | 7,858,400 | ||||||||||||||
Total Food & Staples Retailing | 17,616,720 | |||||||||||||||
| Food Products – 1.1% | ||||||||||||||||
| 58,000 | Tyson Foods, Inc., Class A | 4,383,060 | ||||||||||||||
| Health Care Providers & Services – 5.6% | ||||||||||||||||
| 42,000 | Aetna Inc. | 4,919,040 | ||||||||||||||
| 37,000 | Anthem Inc. | 4,627,960 | ||||||||||||||
| 48,000 | Cardinal Health, Inc. | 3,824,160 | ||||||||||||||
| 54,000 | Express Scripts, Holding Company, (2) | 3,925,800 | ||||||||||||||
| 56,000 | HCA Holdings Inc., (2) | 4,230,800 | ||||||||||||||
Total Health Care Providers & Services | 21,527,760 | |||||||||||||||
| Hotels, Restaurants & Leisure – 0.5% | ||||||||||||||||
| 80,000 | International Game Technology PLC | 1,826,400 | ||||||||||||||
| Household Products – 0.2% | ||||||||||||||||
| 10,000 | Procter & Gamble Company | 873,100 | ||||||||||||||
| Independent Power & Renewable Electricity Producers – 0.1% | ||||||||||||||||
| 40,000 | AES Corporation | 482,800 | ||||||||||||||
| Industrial Conglomerates – 0.2% | ||||||||||||||||
| 28,000 | General Electric Company | 874,720 | ||||||||||||||
| Insurance – 3.6% | ||||||||||||||||
| 69,000 | AFLAC Incorporated | 5,118,420 | ||||||||||||||
| 131,000 | Assured Guaranty Limited | 3,637,870 | ||||||||||||||
| 44,000 | Travelers Companies, Inc. | 5,223,240 | ||||||||||||||
Total Insurance | 13,979,530 | |||||||||||||||
| IT Services – 1.0% | ||||||||||||||||
| 399,000 | Xerox Corporation | 3,930,150 | ||||||||||||||
| Machinery – 4.1% | ||||||||||||||||
| 129,000 | Allision Transmission Holdings Inc. | 3,578,460 | ||||||||||||||
| 56 | NUVEEN |
| Shares | Description (1) | Value | ||||||||||||||
| Machinery (continued) | ||||||||||||||||
| 36,000 | Cummins Inc. | $ | 4,521,960 | |||||||||||||
| 138,000 | Joy Global Inc. | 3,764,640 | ||||||||||||||
| 116,000 | Timken Company | 3,928,920 | ||||||||||||||
Total Machinery | 15,793,980 | |||||||||||||||
| Media – 3.0% | ||||||||||||||||
| 148,000 | Discovery Communications Inc., Class A, (2) | 3,775,480 | ||||||||||||||
| 252,000 | Gannett Company, Inc. | 3,006,360 | ||||||||||||||
| 59,000 | Time Warner Inc. | 4,626,190 | ||||||||||||||
Total Media | 11,408,030 | |||||||||||||||
| Metals & Mining – 3.0% | ||||||||||||||||
| 80,000 | Nucor Corporation | 3,880,800 | ||||||||||||||
| 55,000 | Reliance Steel & Aluminum Company | 3,964,400 | ||||||||||||||
| 160,000 | Steel Dynamics Inc. | 3,939,200 | ||||||||||||||
Total Metals & Mining | 11,784,400 | |||||||||||||||
| Multiline Retail – 3.1% | ||||||||||||||||
| 70,000 | Big Lots, Inc. | 3,452,400 | ||||||||||||||
| 75,000 | Kohl’s Corporation | 3,328,500 | ||||||||||||||
| 75,000 | Target Corporation | 5,264,250 | ||||||||||||||
Total Multiline Retail | 12,045,150 | |||||||||||||||
| Oil, Gas & Consumable Fuels – 2.0% | ||||||||||||||||
| 66,000 | Exxon Mobil Corporation | 5,751,240 | ||||||||||||||
| 37,000 | Valero Energy Corporation | 2,047,950 | ||||||||||||||
Total Oil, Gas & Consumable Fuels | 7,799,190 | |||||||||||||||
| Personal Products – 1.9% | ||||||||||||||||
| 57,000 | Herbalife, Limited | 3,462,750 | ||||||||||||||
| 68,000 | Nu Skin Enterprises Inc., Class A | 3,935,840 | ||||||||||||||
Total Personal Products | 7,398,590 | |||||||||||||||
| Pharmaceuticals – 0.6% | ||||||||||||||||
| 19,000 | Johnson & Johnson | 2,267,460 | ||||||||||||||
| Professional Services – 1.0% | ||||||||||||||||
| 57,000 | Manpower Inc. | 4,073,220 | ||||||||||||||
| Semiconductors & Semiconductor Equipment – 4.3% | ||||||||||||||||
| 50,000 | Intel Corporation | 1,794,500 | ||||||||||||||
| 364,000 | ON Semiconductor Corporation, (2) | 3,931,200 | ||||||||||||||
| 107,000 | QUALCOMM, Inc. | 6,748,490 | ||||||||||||||
| 199,000 | Teradyne Inc. | 4,190,940 | ||||||||||||||
Total Semiconductors & Semiconductor Equipment | 16,665,130 | |||||||||||||||
| NUVEEN | 57 |
Nuveen Large Cap Value Fund (continued)
| Portfolio of Investments | August 31, 2016 |
| Shares | Description (1) | Value | ||||||||||||||
| Specialty Retail – 2.1% | ||||||||||||||||
| 110,000 | Best Buy Co., Inc. | $ | 4,232,800 | |||||||||||||
| 108,000 | Urban Outfitters, Inc., (2) | 3,871,800 | ||||||||||||||
Total Specialty Retail | 8,104,600 | |||||||||||||||
| Technology Hardware, Storage & Peripherals – 3.8% | ||||||||||||||||
| 54,000 | Apple, Inc. | 5,729,400 | ||||||||||||||
| 344,000 | HP Inc. | 4,943,280 | ||||||||||||||
| 118,000 | NCR Corporation, (2) | 3,994,300 | ||||||||||||||
Total Technology Hardware, Storage & Peripherals | 14,666,980 | |||||||||||||||
| Trading Companies & Distributors – 1.1% | ||||||||||||||||
| 68,000 | WESCO International Inc., (2) | 4,226,880 | ||||||||||||||
| Wireless Telecommunication Services – 1.2% | ||||||||||||||||
| 17,000 | Telephone and Data Systems Inc. | 473,790 | ||||||||||||||
| 93,000 | T-Mobile US Inc., (2) | 4,309,620 | ||||||||||||||
Total Wireless Telecommunication Services | 4,783,410 | |||||||||||||||
Total Long-Term Investments (cost $362,220,024) | 386,875,070 | |||||||||||||||
| Principal Amount (000) | Description (1) | Coupon | Maturity | Value | ||||||||||||
SHORT-TERM INVESTMENTS – 0.1% | ||||||||||||||||
REPURCHASE AGREEMENTS – 0.1% | ||||||||||||||||
| $ | 237 | Repurchase Agreement with Fixed Income Clearing Corporation, dated 8/31/16 repurchase price $236,805, collateralized by $230,000 U.S. Treasury Notes, 2.125%, due 5/15/25, value $242,075 | 0.030% | 9/01/16 | $ | 236,805 | ||||||||||
Total Short-Term Investments (cost $236,805) | 236,805 | |||||||||||||||
Total Investments (cost $362,456,829) – 99.8% | 387,111,875 | |||||||||||||||
Other Assets Less Liabilities – 0.2% | 934,800 | |||||||||||||||
Net Assets – 100% | $ | 388,046,675 | ||||||||||||||
For Fund portfolio compliance purposes, the Fund’s industry classifications refer to any one or more of the industry sub-classifications used by one or more widely recognized market indexes or ratings group indexes, and/or as defined by Fund management. This definition may not apply for purposes of this report, which may combine industry sub-classifications into sectors for reporting ease.
| (1) | All percentages shown in the Portfolio of Investments are based on net assets. |
| (2) | Non-income producing; issuer has not declared a dividend within the past twelve months. |
See accompanying notes to financial statements.
| 58 | NUVEEN |
Nuveen Large Cap Core Fund
| Portfolio of Investments | August 31, 2016 |
| Shares | Description (1) | Value | ||||||
LONG-TERM INVESTMENTS – 99.9% | ||||||||
COMMON STOCKS – 99.9% | ||||||||
| Aerospace & Defense – 2.3% | ||||||||
| 26,000 | Boeing Company | $ | 3,365,700 | |||||
| 15,000 | Huntington Ingalls Industries Inc. | 2,477,550 | ||||||
Total Aerospace & Defense | 5,843,250 | |||||||
| Airlines – 3.1% | ||||||||
| 37,000 | Alaska Air Group, Inc. | 2,498,610 | ||||||
| 78,000 | Delta Air Lines, Inc. | 2,866,500 | ||||||
| 67,000 | Southwest Airlines Co. | 2,470,960 | ||||||
| 2,000 | United Continental Holdings Inc., (2) | 100,820 | ||||||
Total Airlines | 7,936,890 | |||||||
| Auto Components – 0.8% | ||||||||
| 18,000 | Lear Corporation | 2,093,220 | ||||||
| Automobiles – 2.6% | ||||||||
| 263,000 | Ford Motor Company | 3,313,800 | ||||||
| 103,000 | General Motors Company | 3,287,760 | ||||||
Total Automobiles | 6,601,560 | |||||||
| Banks – 0.9% | ||||||||
| 2,000 | Citigroup Inc. | 95,480 | ||||||
| 19,000 | JPMorgan Chase & Co. | 1,282,500 | ||||||
| 17,000 | Popular Inc. | 668,270 | ||||||
| 7,000 | Wells Fargo & Company | 355,600 | ||||||
Total Banks | 2,401,850 | |||||||
| Biotechnology – 4.3% | ||||||||
| 24,000 | Amgen Inc. | 4,081,440 | ||||||
| 10,000 | Biogen Inc., (2) | 3,056,300 | ||||||
| 49,000 | Gilead Sciences Inc. | 3,840,620 | ||||||
Total Biotechnology | 10,978,360 | |||||||
| Building Products – 2.0% | ||||||||
| 47,000 | Owens Corning | 2,581,240 | ||||||
| 95,000 | USG Corporation, (2) | 2,605,850 | ||||||
Total Building Products | 5,187,090 | |||||||
| Capital Markets – 2.8% | ||||||||
| 74,000 | Bank New York Mellon | 3,083,580 | ||||||
| 50,000 | Franklin Resources, Inc. | 1,825,000 | ||||||
| 23,000 | NASDAQ Stock Market, Inc. | 1,637,830 | ||||||
| NUVEEN | 59 |
Nuveen Large Cap Core Fund (continued)
| Portfolio of Investments | August 31, 2016 |
| Shares | Description (1) | Value | ||||||
| Capital Markets (continued) | ||||||||
| 10,000 | Raymond James Financial Inc. | $ | 581,700 | |||||
Total Capital Markets | 7,128,110 | |||||||
| Chemicals – 1.1% | ||||||||
| 55,000 | Cabot Corporation | 2,742,300 | ||||||
| Commercial Services & Supplies – 0.8% | ||||||||
| 116,000 | R.R. Donnelley & Sons Company | 1,983,600 | ||||||
| Communications Equipment – 2.6% | ||||||||
| 228,000 | Brocade Communications Systems Inc. | 2,047,440 | ||||||
| 147,000 | Cisco Systems, Inc. | 4,621,680 | ||||||
Total Communications Equipment | 6,669,120 | |||||||
| Construction & Engineering – 5.1% | ||||||||
| 82,000 | AECOM, (2) | 2,528,060 | ||||||
| 83,000 | Chicago Bridge & Iron Company N.V. | 2,471,740 | ||||||
| 51,000 | Jacobs Engineering Group, Inc., (2) | 2,687,190 | ||||||
| 107,000 | Quanta Services Incorporated, (2) | 2,753,110 | ||||||
| 19,000 | Valmont Industries, Inc. | 2,478,930 | ||||||
Total Construction & Engineering | 12,919,030 | |||||||
| Consumer Finance – 1.2% | ||||||||
| 51,000 | Discover Financial Services | 3,060,000 | ||||||
| Diversified Financial Services – 0.3% | ||||||||
| 6,000 | Berkshire Hathaway Inc., Class B, (2) | 902,940 | ||||||
| Diversified Telecommunication Services – 2.0% | ||||||||
| 13,000 | AT&T Inc. | 531,440 | ||||||
| 96,000 | CenturyLink Inc. | 2,668,800 | ||||||
| 5,000 | Verizon Communications Inc. | 261,650 | ||||||
| 194,000 | Windstream Holdings Inc. | 1,650,940 | ||||||
Total Diversified Telecommunication Services | 5,112,830 | |||||||
| Electrical Equipment – 1.9% | ||||||||
| 34,000 | Regal-Beloit Corporation | 2,085,220 | ||||||
| 23,000 | Rockwell Automation, Inc. | 2,666,390 | ||||||
Total Electrical Equipment | 4,751,610 | |||||||
| Electronic Equipment, Instruments & Components – 3.3% | ||||||||
| 41,000 | Arrow Electronics, Inc., (2) | 2,699,030 | ||||||
| 65,000 | Ingram Micro, Inc., Class A | 2,272,400 | ||||||
| 99,000 | Jabil Circuit Inc. | 2,097,810 | ||||||
| 88,000 | Vishay Intertechnology Inc. | 1,246,080 | ||||||
Total Electronic Equipment, Instruments & Components | 8,315,320 | |||||||
| 60 | NUVEEN |
| Shares | Description (1) | Value | ||||||
| Food & Staples Retailing – 3.5% | ||||||||
| 64,000 | Kroger Co. | $ | 2,047,360 | |||||
| 57,000 | Sysco Corporation | 2,956,020 | ||||||
| 42,000 | Walgreens Boots Alliance Inc. | 3,389,820 | ||||||
| 8,000 | Wal-Mart Stores, Inc. | 571,520 | ||||||
Total Food & Staples Retailing | 8,964,720 | |||||||
| Food Products – 2.1% | ||||||||
| 104,000 | Pilgrim’s Pride Corporation, (2) | 2,400,320 | ||||||
| 38,000 | Tyson Foods, Inc., Class A | 2,871,660 | ||||||
Total Food Products | 5,271,980 | |||||||
| Health Care Providers & Services – 8.1% | ||||||||
| 27,000 | Aetna Inc. | 3,162,240 | ||||||
| 32,000 | AmerisourceBergen Corporation | 2,783,040 | ||||||
| 21,000 | Anthem Inc. | 2,626,680 | ||||||
| 37,000 | Cardinal Health, Inc. | 2,947,790 | ||||||
| 42,000 | Express Scripts, Holding Company, (2) | 3,053,400 | ||||||
| 38,000 | HCA Holdings Inc., (2) | 2,870,900 | ||||||
| 17,000 | McKesson HBOC Inc. | 3,138,540 | ||||||
Total Health Care Providers & Services | 20,582,590 | |||||||
| Hotels, Restaurants & Leisure – 5.0% | ||||||||
| 50,000 | Brinker International Inc. | 2,685,500 | ||||||
| 47,000 | Dunkin Brands Group Inc. | 2,300,650 | ||||||
| 32,000 | McDonald’s Corporation | 3,701,120 | ||||||
| 5,000 | Panera Bread Company, Class A, (2) | 1,085,750 | ||||||
| 33,000 | YUM! Brands, Inc. | 2,993,430 | ||||||
Total Hotels, Restaurants & Leisure | 12,766,450 | |||||||
| Household Products – 0.1% | ||||||||
| 3,000 | Procter & Gamble Company | 261,930 | ||||||
| Industrial Conglomerates – 0.7% | ||||||||
| 6,000 | Carlisle Companies Inc. | 629,160 | ||||||
| 37,000 | General Electric Company | 1,155,880 | ||||||
Total Industrial Conglomerates | 1,785,040 | |||||||
| Insurance – 1.9% | ||||||||
| 4,000 | AFLAC Incorporated | 296,720 | ||||||
| 96,000 | Assured Guaranty Limited | 2,665,920 | ||||||
| 15,000 | Travelers Companies, Inc. | 1,780,650 | ||||||
Total Insurance | 4,743,290 | |||||||
| Internet & Catalog Retail – 0.3% | ||||||||
| 1,000 | Amazon.com, Inc., (2) | 769,160 | ||||||
| NUVEEN | 61 |
Nuveen Large Cap Core Fund (continued)
| Portfolio of Investments | August 31, 2016 |
| Shares | Description (1) | Value | ||||||
| Internet Software & Services – 1.6% | ||||||||
| 4,000 | Alphabet Inc., Class A, (2) | $ | 3,159,400 | |||||
| 7,000 | Facebook Inc., Class A, (2) | 882,840 | ||||||
Total Internet Software & Services | 4,042,240 | |||||||
| IT Services – 2.3% | ||||||||
| 40,000 | MasterCard, Inc., Class A | 3,865,200 | ||||||
| 209,000 | Xerox Corporation | 2,058,650 | ||||||
Total IT Services | 5,923,850 | |||||||
| Life Sciences Tools & Services – 1.0% | ||||||||
| 34,000 | Quintiles Transnational Corporation, (2) | 2,628,200 | ||||||
| Machinery – 0.9% | ||||||||
| 83,000 | Allision Transmission Holdings Inc. | 2,302,420 | ||||||
| Media – 4.6% | ||||||||
| 54,000 | CBS Corporation, Class B | 2,755,620 | ||||||
| 107,000 | Discovery Communications Inc., Class A, (2) | 2,729,570 | ||||||
| 159,000 | Gannett Company, Inc. | 1,896,870 | ||||||
| 17,000 | Omnicom Group, Inc. | 1,464,210 | ||||||
| 40,000 | Scripps Networks Interactive, Class A | 2,534,800 | ||||||
| 76,000 | Sirius XM Holdings Inc., (2) | 314,640 | ||||||
Total Media | 11,695,710 | |||||||
| Metals & Mining – 2.4% | ||||||||
| 49,000 | Nucor Corporation | 2,376,990 | ||||||
| 36,000 | Reliance Steel & Aluminum Company | 2,594,880 | ||||||
| 52,000 | Steel Dynamics Inc. | 1,280,240 | ||||||
Total Metals & Mining | 6,252,110 | |||||||
| Multiline Retail – 2.4% | ||||||||
| 44,000 | Big Lots, Inc. | 2,170,080 | ||||||
| 10,000 | Dollar General Corporation | 734,100 | ||||||
| 12,000 | Kohl’s Corporation | 532,560 | ||||||
| 39,000 | Target Corporation | 2,737,410 | ||||||
Total Multiline Retail | 6,174,150 | |||||||
| Oil, Gas & Consumable Fuels – 0.8% | ||||||||
| 24,000 | Exxon Mobil Corporation | 2,091,360 | ||||||
| Personal Products – 1.9% | ||||||||
| 39,000 | Herbalife, Limited | 2,369,250 | ||||||
| 44,000 | Nu Skin Enterprises Inc., Class A | 2,546,720 | ||||||
Total Personal Products | 4,915,970 | |||||||
| Pharmaceuticals – 0.6% | ||||||||
| 13,000 | Johnson & Johnson | 1,551,420 | ||||||
| 62 | NUVEEN |
| Shares | Description (1) | Value | ||||||
| Professional Services – 1.0% | ||||||||
| 36,000 | Manpower Inc. | $ | 2,572,560 | |||||
| Semiconductors & Semiconductor Equipment – 3.1% | ||||||||
| 119,000 | ON Semiconductor Corporation, (2) | 1,285,200 | ||||||
| 60,000 | QUALCOMM, Inc. | 3,784,200 | ||||||
| 133,000 | Teradyne Inc. | 2,800,980 | ||||||
Total Semiconductors & Semiconductor Equipment | 7,870,380 | |||||||
| Software – 3.4% | ||||||||
| 33,000 | Citrix Systems, (2) | 2,877,600 | ||||||
| 26,000 | Intuit, Inc. | 2,897,700 | ||||||
| 49,000 | Microsoft Corporation | 2,815,540 | ||||||
Total Software | 8,590,840 | |||||||
| Specialty Retail – 5.4% | ||||||||
| 21,000 | Aaron Rents Inc. | 511,560 | ||||||
| 69,000 | Best Buy Co., Inc. | 2,655,120 | ||||||
| 34,000 | Home Depot, Inc. | 4,560,080 | ||||||
| 44,000 | Lowe’s Companies, Inc. | 3,368,640 | ||||||
| 72,000 | Urban Outfitters, Inc., (2) | 2,581,200 | ||||||
Total Specialty Retail | 13,676,600 | |||||||
| Technology Hardware, Storage & Peripherals – 5.9% | ||||||||
| 90,000 | Apple, Inc. | 9,549,000 | ||||||
| 206,000 | HP Inc. | 2,960,220 | ||||||
| 76,000 | NCR Corporation, (2) | 2,572,600 | ||||||
Total Technology Hardware, Storage & Peripherals | 15,081,820 | |||||||
| Trading Companies & Distributors – 2.1% | ||||||||
| 32,000 | United Rentals Inc., (2) | 2,633,920 | ||||||
| 42,000 | WESCO International Inc., (2) | 2,610,720 | ||||||
Total Trading Companies & Distributors | 5,244,640 | |||||||
| Wireless Telecommunication Services – 1.7% | ||||||||
| 47,000 | Telephone and Data Systems Inc. | 1,309,890 | ||||||
| 63,000 | T-Mobile US Inc., (2) | 2,919,420 | ||||||
Total Wireless Telecommunication Services | 4,229,310 | |||||||
Total Long-Term Investments (cost $239,135,703) | 254,615,820 | |||||||
Other Assets Less Liabilities – 0.1% | 172,248 | |||||||
Net Assets – 100% | $ | 254,788,068 | ||||||
For Fund portfolio compliance purposes, the Fund’s industry classifications refer to any one or more of the industry sub-classifications used by one or more widely recognized market indexes or ratings group indexes, and/or as defined by Fund management. This definition may not apply for purposes of this report, which may combine industry sub-classifications into sectors for reporting ease.
| (1) | All percentages shown in the Portfolio of Investments are based on net assets. |
| (2) | Non-income producing; issuer has not declared a dividend within the past twelve months. |
See accompanying notes to financial statements.
| NUVEEN | 63 |
Nuveen Large Cap Growth Fund
| Portfolio of Investments | August 31, 2016 |
| Shares | Description (1) | Value | ||||||
LONG-TERM INVESTMENTS – 99.7% | ||||||||
COMMON STOCKS – 99.7% | ||||||||
| Aerospace & Defense – 3.3% | ||||||||
| 9,400 | Boeing Company | $ | 1,216,830 | |||||
| 4,700 | Huntington Ingalls Industries Inc. | 776,299 | ||||||
| 8,200 | Spirit AeroSystems Holdings Inc., Class A, (2) | 375,724 | ||||||
Total Aerospace & Defense | 2,368,853 | |||||||
| Air Freight & Logistics – 1.1% | ||||||||
| 15,900 | Expeditors International of Washington, Inc. | 805,335 | ||||||
| Airlines – 4.1% | ||||||||
| 11,700 | Alaska Air Group, Inc. | 790,101 | ||||||
| 22,600 | Delta Air Lines, Inc. | 830,550 | ||||||
| 16,600 | Southwest Airlines Co. | 612,208 | ||||||
| 13,900 | United Continental Holdings Inc., (2) | 700,699 | ||||||
Total Airlines | 2,933,558 | |||||||
| Auto Components – 1.1% | ||||||||
| 6,900 | Lear Corporation | 802,401 | ||||||
| Automobiles – 0.3% | ||||||||
| 18,200 | Ford Motor Company | 229,320 | ||||||
| Biotechnology – 6.1% | ||||||||
| 1,600 | AbbVie Inc. | 102,560 | ||||||
| 9,500 | Amgen Inc. | 1,615,570 | ||||||
| 3,800 | Biogen Inc., (2) | 1,161,394 | ||||||
| 18,700 | Gilead Sciences Inc. | 1,465,706 | ||||||
Total Biotechnology | 4,345,230 | |||||||
| Building Products – 1.0% | ||||||||
| 24,700 | USG Corporation, (2) | 677,521 | ||||||
| Chemicals – 1.1% | ||||||||
| 15,100 | Cabot Corporation | 752,886 | ||||||
| Communications Equipment – 1.1% | ||||||||
| 6,600 | F5 Networks, Inc., (2) | 810,018 | ||||||
| Construction & Engineering – 2.2% | ||||||||
| 21,300 | AECOM, (2) | 656,679 | ||||||
| 30,000 | Quanta Services Incorporated, (2) | 771,900 | ||||||
| 800 | Valmont Industries, Inc. | 104,376 | ||||||
Total Construction & Engineering | 1,532,955 | |||||||
| 64 | NUVEEN |
| Shares | Description (1) | Value | ||||||
| Containers & Packaging – 1.1% | ||||||||
| 16,600 | Berry Plastics Corporation, (2) | $ | 753,474 | |||||
| Diversified Telecommunication Services – 1.7% | ||||||||
| 24,600 | CenturyLink Inc. | 683,880 | ||||||
| 16,900 | Intelsat SA, (2) | 45,630 | ||||||
| 56,100 | Windstream Holdings Inc. | 477,411 | ||||||
Total Diversified Telecommunication Services | 1,206,921 | |||||||
| Electronic Equipment, Instruments & Components – 2.2% | ||||||||
| 22,300 | Ingram Micro, Inc., Class A | 779,608 | ||||||
| 35,600 | Jabil Circuit Inc. | 754,364 | ||||||
Total Electronic Equipment, Instruments & Components | 1,533,972 | |||||||
| Energy Equipment & Services – 0.4% | ||||||||
| 35,000 | Atwood Oceanics Inc. | 276,500 | ||||||
| Food & Staples Retailing – 3.0% | ||||||||
| 18,300 | Sysco Corporation | 949,038 | ||||||
| 10,600 | Walgreens Boots Alliance Inc. | 855,526 | ||||||
| 4,200 | Wal-Mart Stores, Inc. | 300,048 | ||||||
Total Food & Staples Retailing | 2,104,612 | |||||||
| Food Products – 2.2% | ||||||||
| 7,500 | Hershey Foods Corporation | 749,175 | ||||||
| 10,800 | Tyson Foods, Inc., Class A | 816,156 | ||||||
Total Food Products | 1,565,331 | |||||||
| Health Care Providers & Services – 9.9% | ||||||||
| 7,400 | Aetna Inc. | 866,688 | ||||||
| 9,400 | AmerisourceBergen Corporation | 817,518 | ||||||
| 5,900 | Anthem Inc. | 737,972 | ||||||
| 11,100 | Cardinal Health, Inc. | 884,337 | ||||||
| 14,100 | Express Scripts, Holding Company, (2) | 1,025,070 | ||||||
| 9,500 | HCA Holdings Inc., (2) | 717,725 | ||||||
| 5,500 | McKesson HBOC Inc. | 1,015,410 | ||||||
| 1,500 | UnitedHealth Group Incorporated | 204,075 | ||||||
| 6,800 | Wellcare Health Plans Inc., (2) | 766,360 | ||||||
Total Health Care Providers & Services | 7,035,155 | |||||||
| Hotels, Restaurants & Leisure – 10.5% | ||||||||
| 8,300 | Aramark Holdings Corporation | 314,819 | ||||||
| 14,300 | Brinker International Inc. | 768,053 | ||||||
| 5,400 | Dominos Pizza Inc. | 807,678 | ||||||
| 16,500 | Dunkin Brands Group Inc. | 807,675 | ||||||
| 13,300 | Hyatt Hotels Corporation, Class A, (2) | 711,284 | ||||||
| NUVEEN | 65 |
Nuveen Large Cap Growth Fund (continued)
| Portfolio of Investments | August 31, 2016 |
| Shares | Description (1) | Value | ||||||
| Hotels, Restaurants & Leisure (continued) | ||||||||
| 7,400 | McDonald’s Corporation | $ | 855,884 | |||||
| 3,400 | Panera Bread Company, Class A, (2) | 738,310 | ||||||
| 14,200 | Six Flags Entertainment Corporation | 692,534 | ||||||
| 5,100 | Vail Resorts, Inc. | 807,993 | ||||||
| 10,600 | YUM! Brands, Inc. | 961,526 | ||||||
Total Hotels, Restaurants & Leisure | 7,465,756 | |||||||
| Household Durables – 0.6% | ||||||||
| 5,800 | Tempur Sealy International, Inc., (2) | 454,836 | ||||||
| Industrial Conglomerates – 1.1% | ||||||||
| 7,400 | Carlisle Companies Inc. | 775,964 | ||||||
| Internet & Catalog Retail – 0.9% | ||||||||
| 800 | Amazon.com, Inc., (2) | 615,328 | ||||||
| Internet Software & Services – 3.1% | ||||||||
| 2,200 | Alphabet Inc., Class A, (2) | 1,737,670 | ||||||
| 3,900 | Facebook Inc., Class A, (2) | 491,868 | ||||||
Total Internet Software & Services | �� | 2,229,538 | ||||||
| IT Services – 3.5% | ||||||||
| 8,000 | Fiserv, Inc., (2) | 824,400 | ||||||
| 13,800 | MasterCard, Inc., Class A | 1,333,494 | ||||||
| 4,100 | Visa Inc. | 331,690 | ||||||
Total IT Services | 2,489,584 | |||||||
| Life Sciences Tools & Services – 1.1% | ||||||||
| 9,600 | Quintiles Transnational Corporation, (2) | 742,080 | ||||||
| Machinery – 1.1% | ||||||||
| 10,400 | Wabtec Corporation | 796,744 | ||||||
| Media – 3.8% | ||||||||
| 17,100 | CBS Corporation, Class B | 872,613 | ||||||
| 8,900 | Omnicom Group, Inc. | 766,557 | ||||||
| 12,500 | Scripps Networks Interactive, Class A | 792,125 | ||||||
| 6,600 | Viacom Inc., Class B | 266,244 | ||||||
Total Media | 2,697,539 | |||||||
| Metals & Mining – 0.8% | ||||||||
| 23,300 | Steel Dynamics Inc. | 573,646 | ||||||
| Multiline Retail – 4.1% | ||||||||
| 13,500 | Big Lots, Inc. | 665,820 | ||||||
| 11,400 | Dollar General Corporation | 836,874 | ||||||
| 15,000 | Kohl’s Corporation | 665,700 | ||||||
| 10,100 | Target Corporation | 708,919 | ||||||
Total Multiline Retail | 2,877,313 | |||||||
| 66 | NUVEEN |
| Shares | Description (1) | Value | ||||||
| Personal Products – 2.0% | ||||||||
| 11,700 | Herbalife, Limited | $ | 710,775 | |||||
| 12,500 | Nu Skin Enterprises Inc., Class A | 723,500 | ||||||
Total Personal Products | 1,434,275 | |||||||
| Pharmaceuticals – 0.9% | ||||||||
| 24,700 | Akorn, Inc., (2) | 664,924 | ||||||
| Road & Rail – 1.1% | ||||||||
| 11,400 | Landstar System | 789,222 | ||||||
| Semiconductors & Semiconductor Equipment – 2.2% | ||||||||
| 65,000 | ON Semiconductor Corporation, (2) | 702,000 | ||||||
| 13,300 | QUALCOMM, Inc. | 838,831 | ||||||
Total Semiconductors & Semiconductor Equipment | 1,540,831 | |||||||
| Software – 4.9% | ||||||||
| 9,800 | Citrix Systems, (2) | 854,560 | ||||||
| 2,800 | Intuit, Inc. | 312,060 | ||||||
| 27,500 | Microsoft Corporation | 1,580,150 | ||||||
| 12,300 | Synopsys Inc., (2) | 729,267 | ||||||
Total Software | 3,476,037 | |||||||
| Specialty Retail – 7.4% | ||||||||
| 18,700 | Best Buy Co., Inc. | 719,576 | ||||||
| 9,200 | Burlington Store Inc., (2) | 747,224 | ||||||
| 13,700 | Home Depot, Inc. | 1,837,444 | ||||||
| 15,700 | Lowe’s Companies, Inc. | 1,201,992 | ||||||
| 20,700 | Urban Outfitters, Inc., (2) | 742,095 | ||||||
Total Specialty Retail | 5,248,331 | |||||||
| Technology Hardware, Storage & Peripherals – 6.1% | ||||||||
| 40,800 | Apple, Inc. | 4,328,880 | ||||||
| Trading Companies & Distributors – 1.5% | ||||||||
| 21,000 | HD Suplly Holdings Inc., (2) | 758,310 | ||||||
| 3,900 | MSC Industrial Direct Inc., Class A | 284,856 | ||||||
Total Trading Companies & Distributors | 1,043,166 | |||||||
| Wireless Telecommunication Services – 1.1% | ||||||||
| 17,000 | T-Mobile US Inc., (2) | 787,780 | ||||||
Total Long-Term Investments (cost $67,021,397) | 70,765,816 | |||||||
Other Assets Less Liabilities – 0.3% | 204,335 | |||||||
Net Assets – 100% | $ | 70,970,151 | ||||||
For Fund portfolio compliance purposes, the Fund’s industry classifications refer to any one or more of the industry sub-classifications used by one or more widely recognized market indexes or ratings group indexes, and/or as defined by Fund management. This definition may not apply for purposes of this report, which may combine industry sub-classifications into sectors for reporting ease.
| (1) | All percentages shown in the Portfolio of Investments are based on net assets. |
| (2) | Non-income producing; issuer has not declared a dividend within the past twelve months. |
See accompanying notes to financial statements.
| NUVEEN | 67 |
Nuveen Concentrated Core Fund
| Portfolio of Investments | August 31, 2016 |
| Shares | Description (1) | Value | ||||||||||||||
LONG-TERM INVESTMENTS – 100.1% | ||||||||||||||||
COMMON STOCKS – 100.1% | ||||||||||||||||
| Aerospace & Defense – 4.9% | ||||||||||||||||
| 37,300 | Boeing Company | $ | 4,828,485 | |||||||||||||
| Airlines – 10.7% | ||||||||||||||||
| 143,000 | Delta Air Lines, Inc. | 5,255,250 | ||||||||||||||
| 141,000 | Southwest Airlines Co. | 5,200,080 | ||||||||||||||
Total Airlines | 10,455,330 | |||||||||||||||
| Automobiles – 5.3% | ||||||||||||||||
| 409,000 | Ford Motor Company | 5,153,400 | ||||||||||||||
| Banks – 5.5% | ||||||||||||||||
| 80,000 | JPMorgan Chase & Co. | 5,400,000 | ||||||||||||||
| Biotechnology – 10.2% | ||||||||||||||||
| 29,000 | Amgen Inc. | 4,931,740 | ||||||||||||||
| 64,000 | Gilead Sciences Inc. | 5,016,320 | ||||||||||||||
Total Biotechnology | 9,948,060 | |||||||||||||||
| Consumer Finance – 5.2% | ||||||||||||||||
| 84,900 | Discover Financial Services | 5,094,000 | ||||||||||||||
| Diversified Telecommunication Services – 1.5% | ||||||||||||||||
| 51,500 | CenturyLink Inc. | 1,431,700 | ||||||||||||||
| Food & Staples Retailing – 5.1% | ||||||||||||||||
| 97,000 | Sysco Corporation | 5,030,420 | ||||||||||||||
| Health Care Providers & Services – 15.4% | ||||||||||||||||
| 42,000 | Aetna Inc. | 4,919,040 | ||||||||||||||
| 57,600 | AmerisourceBergen Corporation | 5,009,472 | ||||||||||||||
| 28,000 | McKesson HBOC Inc. | 5,169,360 | ||||||||||||||
Total Health Care Providers & Services | 15,097,872 | |||||||||||||||
| Media – 10.3% | ||||||||||||||||
| 98,000 | CBS Corporation | 5,000,940 | ||||||||||||||
| 59,000 | Omnicom Group, Inc. | 5,081,670 | ||||||||||||||
Total Media | 10,082,610 | |||||||||||||||
| Multiline Retail – 5.2% | ||||||||||||||||
| 72,000 | Target Corporation | 5,053,680 | ||||||||||||||
| Specialty Retail – 5.3% | ||||||||||||||||
| 68,000 | Lowe’s Companies, Inc. | 5,206,080 | ||||||||||||||
| 68 | NUVEEN |
| Shares | Description (1) | Value | ||||||||||||||
| Technology Hardware, Storage & Peripherals – 10.0% | ||||||||||||||||
| 45,000 | Apple, Inc. | $ | 4,774,500 | |||||||||||||
| 353,000 | HP Inc. | 5,072,610 | ||||||||||||||
Total Technology Hardware, Storage & Peripherals | 9,847,110 | |||||||||||||||
| Wireless Telecommunication Services – 5.5% | ||||||||||||||||
| 116,000 | T-Mobile US Inc., (2) | 5,375,440 | ||||||||||||||
Total Long-Term Investments (cost $97,604,579) | 98,004,187 | |||||||||||||||
| Principal Amount (000) | Description (1) | Coupon | Maturity | Value | ||||||||||||
SHORT-TERM INVESTMENTS – 0.1% | ||||||||||||||||
REPURCHASE AGREEMENTS – 0.1% | ||||||||||||||||
| $ | 100 | Repurchase Agreement with Fixed Income Clearing Corporation, dated 8/31/16 repurchase price $100,206, collateralized by $90,000 U.S. Treasury Bonds, 3.125%, due 11/15/41, value $107,438 | 0.030% | 9/01/16 | $ | 100,206 | ||||||||||
Total Short-Term Investments (cost $100,206) | 100,206 | |||||||||||||||
Total Investments (cost $97,704,785) – 100.2% | 98,104,393 | |||||||||||||||
Other Assets Less Liabilities – (0.2)% | (204,013 | ) | ||||||||||||||
Net Assets – 100% | $ | 97,900,380 | ||||||||||||||
For Fund portfolio compliance purposes, the Fund’s industry classifications refer to any one or more of the industry sub-classifications used by one or more widely recognized market indexes or ratings group indexes, and/or as defined by Fund management. This definition may not apply for purposes of this report, which may combine industry sub-classifications into sectors for reporting ease.
| (1) | All percentages shown in the Portfolio of Investments are based on net assets. |
| (2) | Non-income producing; issuer has not declared a dividend within the past twelve months. |
See accompanying notes to financial statements.
| NUVEEN | 69 |
Nuveen Core Dividend Fund
| Portfolio of Investments | August 31, 2016 |
| Shares | Description (1) | Value | ||||||
LONG-TERM INVESTMENTS – 100.0% | ||||||||
COMMON STOCKS – 100.0% | ||||||||
| Aerospace & Defense – 2.4% | ||||||||
| 4,500 | Boeing Company | $ | 582,525 | |||||
| 2,600 | Huntington Ingalls Industries Inc. | 429,442 | ||||||
Total Aerospace & Defense | 1,011,967 | |||||||
| Air Freight & Logistics – 2.4% | ||||||||
| 6,400 | C.H. Robinson Worldwide, Inc. | 444,288 | ||||||
| 5,400 | United Parcel Service, Inc., Class B | 589,788 | ||||||
Total Air Freight & Logistics | 1,034,076 | |||||||
| Airlines – 3.1% | ||||||||
| 6,300 | Alaska Air Group, Inc. | 425,439 | ||||||
| 12,500 | Delta Air Lines, Inc. | 459,375 | ||||||
| 11,500 | Southwest Airlines Co. | 424,120 | ||||||
Total Airlines | 1,308,934 | |||||||
| Automobiles – 2.5% | ||||||||
| 42,800 | Ford Motor Company | 539,280 | ||||||
| 16,500 | General Motors Company | 526,680 | ||||||
Total Automobiles | 1,065,960 | |||||||
| Banks – 0.4% | ||||||||
| 1,500 | JPMorgan Chase & Co. | 101,250 | ||||||
| 1,300 | Wells Fargo & Company | 66,040 | ||||||
Total Banks | 167,290 | |||||||
| Beverages – 1.9% | ||||||||
| 3,600 | Dr. Pepper Snapple Group, Inc. | 337,320 | ||||||
| 4,300 | PepsiCo, Inc. | 459,025 | ||||||
Total Beverages | 796,345 | |||||||
| Biotechnology – 4.6% | ||||||||
| 9,900 | AbbVie Inc. | 634,590 | ||||||
| 4,100 | Amgen Inc. | 697,246 | ||||||
| 8,200 | Gilead Sciences Inc. | 642,716 | ||||||
Total Biotechnology | 1,974,552 | |||||||
| Building Products – 0.7% | ||||||||
| 5,600 | Owens Corning | 307,552 | ||||||
| Capital Markets – 7.0% | ||||||||
| 12,300 | Bank New York Mellon | 512,541 | ||||||
| 4,500 | CME Group, Inc. | 487,575 | ||||||
| 70 | NUVEEN |
| Shares | Description (1) | Value | ||||||
| Capital Markets (continued) | ||||||||
| 13,500 | Federated Investors Inc., Class B | $ | 436,050 | |||||
| 11,700 | Lazard Limited, Class A | 433,251 | ||||||
| 6,000 | NASDAQ Stock Market, Inc. | 427,260 | ||||||
| 4,600 | Raymond James Financial Inc. | 267,582 | ||||||
| 6,000 | T. Rowe Price Group Inc. | 417,240 | ||||||
Total Capital Markets | 2,981,499 | |||||||
| Chemicals – 1.1% | ||||||||
| 9,200 | Cabot Corporation | 458,712 | ||||||
| Commercial Services & Supplies – 2.3% | ||||||||
| 3,400 | Pitney Bowes Inc. | 63,784 | ||||||
| 25,900 | R.R. Donnelley & Sons Company | 442,890 | ||||||
| 9,100 | Republic Services, Inc. | 459,732 | ||||||
Total Commercial Services & Supplies | 966,406 | |||||||
| Communications Equipment – 1.8% | ||||||||
| 24,400 | Cisco Systems, Inc. | 767,136 | ||||||
| Diversified Telecommunication Services – 4.0% | ||||||||
| 3,300 | AT&T Inc. | 134,904 | ||||||
| 16,000 | CenturyLink Inc. | 444,800 | ||||||
| 15,500 | Verizon Communications Inc. | 811,115 | ||||||
| 37,900 | Windstream Holdings Inc. | 322,529 | ||||||
Total Diversified Telecommunication Services | 1,713,348 | |||||||
| Electric Utilities – 1.1% | ||||||||
| 5,800 | Entergy Corporation | 453,560 | ||||||
| Electrical Equipment – 1.1% | ||||||||
| 4,100 | Rockwell Automation, Inc. | 475,313 | ||||||
| Electronic Equipment, Instruments & Components – 1.6% | ||||||||
| 7,600 | Ingram Micro, Inc., Class A | 265,696 | ||||||
| 13,500 | Jabil Circuit Inc. | 286,065 | ||||||
| 10,600 | Vishay Intertechnology Inc. | 150,096 | ||||||
Total Electronic Equipment, Instruments & Components | 701,857 | |||||||
| Energy Equipment & Services – 0.4% | ||||||||
| 12,600 | Atwood Oceanics Inc. | 99,540 | ||||||
| 9,000 | Ensco PLC, Class A | 68,310 | ||||||
Total Energy Equipment & Services | 167,850 | |||||||
| Equity Real Estate Investment Trusts – 4.1% | ||||||||
| 3,600 | American Capital Agency Corporation | 69,516 | ||||||
| 20,700 | Apple Hospitality REIT, Inc. | 406,134 | ||||||
| 15,100 | Care Capital Properties, Inc. | 452,849 | ||||||
| NUVEEN | 71 |
Nuveen Core Dividend Fund (continued)
| Portfolio of Investments | August 31, 2016 |
| Shares | Description (1) | Value | ||||||
| Equity Real Estate Investment Trusts (continued) | ||||||||
| 700 | Chimera Investments Corporation | $ | 11,543 | |||||
| 3,900 | Communications Sales & Leasing, Inc. | 121,680 | ||||||
| 11,800 | Corrections Corporation of America | 187,974 | ||||||
| 1,900 | Public Storage, Inc. | 425,486 | ||||||
| 3,900 | Washington Prime Group, Inc. | 53,586 | ||||||
Total Equity Real Estate Investment Trusts | 1,728,768 | |||||||
| Food & Staples Retailing – 3.3% | ||||||||
| 9,700 | Sysco Corporation | 503,042 | ||||||
| 6,900 | Walgreens Boots Alliance Inc. | 556,899 | ||||||
| 4,600 | Wal-Mart Stores, Inc. | 328,624 | ||||||
Total Food & Staples Retailing | 1,388,565 | |||||||
| Food Products – 3.3% | ||||||||
| 29,400 | Flowers Foods Inc. | 438,354 | ||||||
| 1,000 | Hershey Foods Corporation | 99,890 | ||||||
| 2,600 | JM Smucker Company | 368,654 | ||||||
| 6,400 | Tyson Foods, Inc., Class A | 483,648 | ||||||
Total Food Products | 1,390,546 | |||||||
| Health Care Providers & Services – 5.7% | ||||||||
| 4,300 | Aetna Inc. | 503,616 | ||||||
| 5,500 | AmerisourceBergen Corporation | 478,335 | ||||||
| 3,500 | Anthem Inc. | 437,780 | ||||||
| 5,900 | Cardinal Health, Inc. | 470,053 | ||||||
| 2,900 | McKesson HBOC Inc. | 535,398 | ||||||
Total Health Care Providers & Services | 2,425,182 | |||||||
| Hotels, Restaurants & Leisure – 6.4% | ||||||||
| 8,200 | Brinker International Inc. | 440,422 | ||||||
| 9,100 | Dunkin Brands Group Inc. | 445,445 | ||||||
| 1,600 | International Game Technology PLC | 36,528 | ||||||
| 4,300 | Las Vegas Sands | 215,903 | ||||||
| 5,500 | McDonald’s Corporation | 636,130 | ||||||
| 7,800 | Six Flags Entertainment Corporation | 380,406 | ||||||
| 300 | Vail Resorts, Inc. | 47,529 | ||||||
| 5,600 | YUM! Brands, Inc. | 507,976 | ||||||
Total Hotels, Restaurants & Leisure | 2,710,339 | |||||||
| Household Products – 0.1% | ||||||||
| 600 | Procter & Gamble Company | 52,386 | ||||||
| Independent Power & Renewable Electricity Producers – 1.1% | ||||||||
| 38,100 | AES Corporation | 459,867 | ||||||
| 72 | NUVEEN |
| Shares | Description (1) | Value | ||||||
| Industrial Conglomerates – 0.9% | ||||||||
| 1,700 | Carlisle Companies Inc. | $ | 178,262 | |||||
| 6,500 | General Electric Company | 203,060 | ||||||
Total Industrial Conglomerates | 381,322 | |||||||
| Insurance – 1.0% | ||||||||
| 16,000 | Assured Guaranty Limited | 444,320 | ||||||
| IT Services – 2.9% | ||||||||
| 6,300 | MasterCard, Inc., Class A | 608,769 | ||||||
| 8,000 | Paychex, Inc. | 485,360 | ||||||
| 15,700 | Xerox Corporation | 154,645 | ||||||
Total IT Services | 1,248,774 | |||||||
| Machinery – 2.0% | ||||||||
| 15,800 | Allision Transmission Holdings Inc. | 438,292 | ||||||
| 15,500 | Joy Global Inc. | 422,840 | ||||||
Total Machinery | 861,132 | |||||||
| Media – 6.6% | ||||||||
| 8,200 | CBS Corporation | 418,446 | ||||||
| 11,700 | Cinemark Holdings Inc. | 452,205 | ||||||
| 24,900 | Gannett Company, Inc. | 297,057 | ||||||
| 19,300 | Interpublic Group of Companies, Inc. | 446,602 | ||||||
| 20,300 | Regal Entertainment Group, Class A | 434,014 | ||||||
| 7,200 | Scripps Networks Interactive, Class A | 456,264 | ||||||
| 7,200 | Viacom Inc., Class B | 290,448 | ||||||
Total Media | 2,795,036 | |||||||
| Metals & Mining – 1.3% | ||||||||
| 8,400 | Nucor Corporation | 407,484 | ||||||
| 2,300 | Reliance Steel & Aluminum Company | 165,784 | ||||||
Total Metals & Mining | 573,268 | |||||||
| Multiline Retail – 2.4% | ||||||||
| 7,800 | Big Lots, Inc. | 384,696 | ||||||
| 4,200 | Kohl’s Corporation | 186,396 | ||||||
| 6,700 | Target Corporation | 470,273 | ||||||
Total Multiline Retail | 1,041,365 | |||||||
| Oil, Gas & Consumable Fuels – 2.0% | ||||||||
| 8,100 | CVTR Energy Inc. | 118,179 | ||||||
| 3,600 | Exxon Mobil Corporation | 313,704 | ||||||
| 57,500 | Teekay Shipping Corporation | 415,725 | ||||||
Total Oil, Gas & Consumable Fuels | 847,608 | |||||||
| NUVEEN | 73 |
Nuveen Core Dividend Fund (continued)
| Portfolio of Investments | August 31, 2016 |
| Shares | Description (1) | Value | ||||||
| Personal Products – 1.0% | ||||||||
| 7,400 | Nu Skin Enterprises Inc., Class A | $ | 428,312 | |||||
| Pharmaceuticals – 0.6% | ||||||||
| 2,300 | Johnson & Johnson | 274,482 | ||||||
| Professional Services – 1.1% | ||||||||
| 2,400 | Manpower Inc. | 171,504 | ||||||
| 5,500 | Nielsen Holdings PLC | 293,040 | ||||||
Total Professional Services | 464,544 | |||||||
| Semiconductors & Semiconductor Equipment – 1.5% | ||||||||
| 10,300 | QUALCOMM, Inc. | 649,621 | ||||||
| Software – 1.2% | ||||||||
| 8,600 | Microsoft Corporation | 494,156 | ||||||
| Specialty Retail – 4.9% | ||||||||
| 12,400 | Abercrombie & Fitch Co., Class A | 219,976 | ||||||
| 12,100 | Best Buy Co., Inc. | 465,608 | ||||||
| 2,000 | GameStop Corporation, Class A | 56,780 | ||||||
| 5,700 | Home Depot, Inc. | 764,484 | ||||||
| 7,400 | Lowe’s Companies, Inc. | 566,544 | ||||||
Total Specialty Retail | 2,073,392 | |||||||
| Technology Hardware, Storage & Peripherals – 4.9% | ||||||||
| 15,100 | Apple, Inc. | 1,602,110 | ||||||
| 34,800 | HP Inc. | 500,076 | ||||||
Total Technology Hardware, Storage & Peripherals | 2,102,186 | |||||||
| Tobacco – 1.6% | ||||||||
| 10,100 | Altria Group, Inc. | 667,509 | ||||||
| Trading Companies & Distributors – 1.0% | ||||||||
| 5,700 | MSC Industrial Direct Inc., Class A | 416,328 | ||||||
| Transportation Infrastructure – 0.7% | ||||||||
| 3,500 | Macquarie Infrastructure Corporation | 279,790 | ||||||
Total Long-Term Investments (cost $41,286,244) | 42,551,155 | |||||||
Other Assets Less Liabilities – 0.0% | 9,863 | |||||||
Net Assets – 100% | $ | 42,561,018 | ||||||
For Fund portfolio compliance purposes, the Fund’s industry classifications refer to any one or more of the industry sub-classifications used by one or more widely recognized market indexes or ratings group indexes, and/or as defined by Fund management. This definition may not apply for purposes of this report, which may combine industry sub-classifications into sectors for reporting ease.
| (1) | All percentages shown in the Portfolio of Investments are based on net assets. |
| REIT | Real Estate Investment Trust |
See accompanying notes to financial statements.
| 74 | NUVEEN |
Nuveen Growth Fund
| Portfolio of Investments | August 31, 2016 |
| Shares | Description (1) | Value | ||||||
LONG-TERM INVESTMENTS – 99.7% | ||||||||
COMMON STOCKS – 99.7% | ||||||||
| Aerospace & Defense – 2.4% | ||||||||
| 9,317 | Boeing Company | $ | 1,206,086 | |||||
| Air Freight & Logistics – 2.1% | ||||||||
| 7,653 | C.H. Robinson Worldwide, Inc. | 531,271 | ||||||
| 9,781 | Expeditors International of Washington, Inc. | 495,408 | ||||||
Total Air Freight & Logistics | 1,026,679 | |||||||
| Banks – 0.8% | ||||||||
| 6,135 | JPMorgan Chase & Co. | 414,113 | ||||||
| Beverages – 7.5% | ||||||||
| 14,208 | Coca-Cola Company | 617,053 | ||||||
| 12,905 | Dr. Pepper Snapple Group, Inc. | 1,209,199 | ||||||
| 17,767 | PepsiCo, Inc. | 1,896,627 | ||||||
Total Beverages | 3,722,879 | |||||||
| Biotechnology – 6.7% | ||||||||
| 8,838 | Amgen Inc. | 1,502,990 | ||||||
| 3,906 | Biogen Inc., (2) | 1,193,791 | ||||||
| 8,421 | Gilead Sciences Inc. | 660,038 | ||||||
Total Biotechnology | 3,356,819 | |||||||
| Communication Equipment – 1.0% | ||||||||
| 3,945 | F5 Networks, Inc., (2) | 484,170 | ||||||
| Construction & Engineering – 0.9% | ||||||||
| 3,586 | Valmont Industries, Inc. | 467,865 | ||||||
| Consumer Finance – 0.5% | ||||||||
| 3,826 | Capital One Financial Corporation | 273,942 | ||||||
| Containers & Packaging – 1.0% | ||||||||
| 9,497 | Crown Holdings Inc., (2) | 515,022 | ||||||
| Diversified Telecommunication Services – 3.3% | ||||||||
| 14,085 | AT&T Inc. | 575,795 | ||||||
| 20,061 | Verizon Communications Inc. | 1,049,792 | ||||||
Total Diversified Telecommunication Services | 1,625,587 | |||||||
| Food & Staples Retailing – 2.4% | ||||||||
| 22,641 | Sysco Corporation | 1,174,162 | ||||||
| Health Care Providers & Services – 12.3% | ||||||||
| 8,155 | Aetna Inc. | 955,114 | ||||||
| NUVEEN | 75 |
Nuveen Growth Fund (continued)
| Portfolio of Investments | August 31, 2016 |
| Shares | Description (1) | Value | ||||||
| Health Care Providers & Services (continued) | ||||||||
| 9,637 | AmerisourceBergen Corporation | $ | 838,130 | |||||
| 6,020 | Anthem Inc. | 752,982 | ||||||
| 13,862 | Cardinal Health, Inc. | 1,104,386 | ||||||
| 12,987 | Express Scripts, Holding Company, (2) | 944,155 | ||||||
| 5,060 | McKesson HBOC Inc. | 934,177 | ||||||
| 4,393 | UnitedHealth Group Incorporated | 597,668 | ||||||
Total Health Care Providers & Services | 6,126,612 | |||||||
| Hotels, Restaurants & Leisure – 9.3% | ||||||||
| 9,479 | Brinker International Inc. | 509,117 | ||||||
| 3,518 | Dominos Pizza Inc. | 526,187 | ||||||
| 7,419 | Marriott International, Inc., Class A | 529,197 | ||||||
| 14,399 | McDonald’s Corporation | 1,665,388 | ||||||
| 2,403 | Panera Bread Company, Class A, (2) | 521,811 | ||||||
| 9,463 | YUM! Brands, Inc. | 858,389 | ||||||
Total Hotels, Restaurants & Leisure | 4,610,089 | |||||||
| Industrial Conglomerates – 1.0% | ||||||||
| 5,004 | Carlisle Companies Inc. | 524,719 | ||||||
| Insurance – 1.2% | ||||||||
| 5,422 | Reinsurance Group of America Inc. | 581,889 | ||||||
| Internet Software & Services – 3.8% | ||||||||
| 2,371 | Alphabet Inc., Class A, (2) | 1,872,734 | ||||||
| IT Services – 10.6% | ||||||||
| 4,315 | Accenture Limited, Class A | 496,225 | ||||||
| 6,493 | Henry Jack and Associates Inc. | 566,644 | ||||||
| 19,573 | MasterCard, Inc., Class A | 1,891,339 | ||||||
| 10,469 | Total System Services Inc. | 515,598 | ||||||
| 22,294 | Visa Inc., Class A | 1,803,585 | ||||||
Total IT Services | 5,273,391 | |||||||
| Machinery – 2.1% | ||||||||
| 4,045 | Parker Hannifin Corporation | 495,634 | ||||||
| 6,919 | Wabtec Corporation | 530,065 | ||||||
Total Machinery | 1,025,699 | |||||||
| Media – 8.9% | ||||||||
| 20,629 | Comcast Corporation, Class A | 1,346,249 | ||||||
| 9,004 | Discovery Communications Inc., Class A, (2) | 229,692 | ||||||
| 13,420 | Omnicom Group, Inc. | 1,155,865 | ||||||
| 7,283 | Scripps Networks Interactive, Class A | 461,524 | ||||||
| 20,013 | Viacom Inc., Class B | 807,324 | ||||||
| 76 | NUVEEN |
| Shares | Description (1) | Value | ||||||
| Media (continued) | ||||||||
| 4,597 | Walt Disney Company | $ | 434,233 | |||||
Total Media | 4,434,887 | |||||||
| Multiline Retail – 2.9% | ||||||||
| 7,769 | Dollar General Corporation | 570,322 | ||||||
| 12,412 | Target Corporation | 871,198 | ||||||
Total Multiline Retail | 1,441,520 | |||||||
| Semiconductors & Semiconductor Equipment – 2.4% | ||||||||
| 19,255 | QUALCOMM, Inc. | 1,214,413 | ||||||
| Software – 3.6% | ||||||||
| 4,994 | Intuit, Inc. | 556,581 | ||||||
| 21,629 | Microsoft Corporation | 1,242,802 | ||||||
Total Software | 1,799,383 | |||||||
| Specialty Retail – 7.9% | ||||||||
| 17,625 | Home Depot, Inc. | 2,363,865 | ||||||
| 12,875 | Lowe’s Companies, Inc. | 985,710 | ||||||
| 15,718 | Urban Outfitters, Inc., (2) | 563,490 | ||||||
Total Specialty Retail | 3,913,065 | |||||||
| Technology Hardware, Storage & Peripherals – 4.2% | ||||||||
| 19,873 | Apple, Inc. | 2,108,525 | ||||||
| Tobacco – 0.9% | ||||||||
| 6,735 | Altria Group, Inc. | 445,116 | ||||||
Total Long-Term Investments (cost $42,471,605) | 49,639,366 | |||||||
Other Assets Less Liabilities – 0.3% | 129,239 | |||||||
Net Assets – 100% | $ | 49,768,605 | ||||||
For Fund portfolio compliance purposes, the Fund’s industry classifications refer to any one or more of the industry sub-classifications used by one or more widely recognized market indexes or ratings group indexes, and/or as defined by Fund management. This definition may not apply for purposes of this report, which may combine industry sub-classifications into sectors for reporting ease.
| (1) | All percentages shown in the Portfolio of Investments are based on net assets. |
| (2) | Non-income producing; issuer has not declared a dividend within the past twelve months. |
See accompanying notes to financial statements.
| NUVEEN | 77 |
Nuveen Large Cap Core Plus Fund
| Portfolio of Investments | August 31, 2016 |
| Shares | Description (1) | Value | ||||||||||||||
LONG-TERM INVESTMENTS – 129.7% | ||||||||||||||||
COMMON STOCKS – 129.7% | ||||||||||||||||
| Aerospace & Defense – 2.5% | ||||||||||||||||
| 6,700 | Boeing Company | $ | 867,315 | |||||||||||||
| 5,600 | Huntington Ingalls Industries Inc. | 924,952 | ||||||||||||||
Total Aerospace & Defense | 1,792,267 | |||||||||||||||
| Air Freight & Logistics – 0.2% | ||||||||||||||||
| 2,800 | Expeditors International of Washington, Inc. | 141,820 | ||||||||||||||
| Airlines – 3.6% | ||||||||||||||||
| 8,000 | Alaska Air Group, Inc. | 540,240 | ||||||||||||||
| 29,400 | Delta Air Lines, Inc. | 1,080,450 | ||||||||||||||
| 26,200 | Southwest Airlines Co. | 966,256 | ||||||||||||||
Total Airlines | 2,586,946 | |||||||||||||||
| Automobiles – 3.3% | ||||||||||||||||
| 95,600 | Ford Motor Company | 1,204,560 | ||||||||||||||
| 36,600 | General Motors Company | 1,168,272 | ||||||||||||||
Total Automobiles | 2,372,832 | |||||||||||||||
| Banks – 3.7% | ||||||||||||||||
| 4,200 | Citigroup Inc. | 200,508 | ||||||||||||||
| 21,100 | JPMorgan Chase & Co. | 1,424,250 | ||||||||||||||
| 23,600 | Popular Inc. | 927,716 | ||||||||||||||
| 2,300 | Wells Fargo & Company | 116,840 | ||||||||||||||
Total Banks | 2,669,314 | |||||||||||||||
| Biotechnology – 5.7% | ||||||||||||||||
| 8,900 | Amgen Inc. | 1,513,534 | ||||||||||||||
| 3,800 | Biogen Inc., (2) | 1,161,394 | ||||||||||||||
| 18,000 | Gilead Sciences Inc. | 1,410,840 | ||||||||||||||
Total Biotechnology | 4,085,768 | |||||||||||||||
| Building Products – 2.7% | ||||||||||||||||
| 17,500 | Owens Corning | 961,100 | ||||||||||||||
| 34,600 | USG Corporation, (2) | 949,078 | ||||||||||||||
Total Building Products | 1,910,178 | |||||||||||||||
| Capital Markets – 1.9% | ||||||||||||||||
| 26,800 | Bank New York Mellon | 1,116,756 | ||||||||||||||
| 800 | Franklin Resources, Inc. | 29,200 | ||||||||||||||
| 2,000 | NASDAQ Stock Market, Inc. | 142,420 | ||||||||||||||
| 700 | Raymond James Financial Inc. | 40,719 | ||||||||||||||
Total Capital Markets | 1,329,095 | |||||||||||||||
| 78 | NUVEEN |
| Shares | Description (1) | Value | ||||||||||||||
| Chemicals – 1.4% | ||||||||||||||||
| 20,100 | Cabot Corporation | $ | 1,002,186 | |||||||||||||
| Commercial Services & Supplies – 0.5% | ||||||||||||||||
| 22,400 | R.R. Donnelley & Sons Company | 383,040 | ||||||||||||||
| Communications Equipment – 2.3% | ||||||||||||||||
| 52,000 | Cisco Systems, Inc. | 1,634,880 | ||||||||||||||
| Construction & Engineering – 6.3% | ||||||||||||||||
| 30,200 | AECOM, (2) | 931,066 | ||||||||||||||
| 30,200 | Chicago Bridge & Iron Company N.V. | 899,356 | ||||||||||||||
| 14,300 | Jacobs Engineering Group, Inc., (2) | 753,467 | ||||||||||||||
| 38,800 | Quanta Services Incorporated, (2) | 998,324 | ||||||||||||||
| 7,100 | Valmont Industries, Inc. | 926,337 | ||||||||||||||
Total Construction & Engineering | 4,508,550 | |||||||||||||||
| Consumer Finance – 1.5% | ||||||||||||||||
| 18,300 | Discover Financial Services | 1,098,000 | ||||||||||||||
| Diversified Financial Services – 0.5% | ||||||||||||||||
| 2,200 | Berkshire Hathaway Inc., Class B, (2) | 331,078 | ||||||||||||||
| Diversified Telecommunication Services – 2.9% | ||||||||||||||||
| 4,700 | AT&T Inc. | 192,136 | ||||||||||||||
| 35,300 | CenturyLink Inc. | 981,340 | ||||||||||||||
| 200 | Verizon Communications Inc. | 10,466 | ||||||||||||||
| 105,200 | Windstream Holdings Inc. | 895,252 | ||||||||||||||
Total Diversified Telecommunication Services | 2,079,194 | |||||||||||||||
| Electrical Equipment – 1.4% | ||||||||||||||||
| 8,400 | Rockwell Automation, Inc. | 973,812 | ||||||||||||||
| Electronic Equipment, Instruments & Components – 5.5% | ||||||||||||||||
| 15,000 | Arrow Electronics, Inc., (2) | 987,450 | ||||||||||||||
| 29,000 | Ingram Micro, Inc., Class A | 1,013,840 | ||||||||||||||
| 46,300 | Jabil Circuit Inc. | 981,097 | ||||||||||||||
| 65,400 | Vishay Intertechnology Inc. | 926,064 | ||||||||||||||
Total Electronic Equipment, Instruments & Components | 3,908,451 | |||||||||||||||
| Food & Staples Retailing – 5.1% | ||||||||||||||||
| 29,800 | Kroger Co. | 953,302 | ||||||||||||||
| 21,500 | Sysco Corporation | 1,114,990 | ||||||||||||||
| 15,400 | Walgreens Boots Alliance Inc. | 1,242,934 | ||||||||||||||
| 4,000 | Wal-Mart Stores, Inc. | 285,760 | ||||||||||||||
Total Food & Staples Retailing | 3,596,986 | |||||||||||||||
| NUVEEN | 79 |
Nuveen Large Cap Core Plus Fund (continued)
| Portfolio of Investments | August 31, 2016 |
| Shares | Description (1) | Value | ||||||||||||||
| Food Products – 2.6% | ||||||||||||||||
| 38,700 | Pilgrim’s Pride Corporation, (2) | $ | 893,196 | |||||||||||||
| 12,600 | Tyson Foods, Inc., Class A | 952,182 | ||||||||||||||
Total Food Products | 1,845,378 | |||||||||||||||
| Health Care Providers & Services – 10.6% | ||||||||||||||||
| 9,900 | Aetna Inc. | 1,159,488 | ||||||||||||||
| 11,700 | AmerisourceBergen Corporation | 1,017,549 | ||||||||||||||
| 8,000 | Anthem Inc. | 1,000,640 | ||||||||||||||
| 13,200 | Cardinal Health, Inc. | 1,051,644 | ||||||||||||||
| 15,800 | Express Scripts, Holding Company, (2) | 1,148,660 | ||||||||||||||
| 13,900 | HCA Holdings Inc., (2) | 1,050,145 | ||||||||||||||
| 6,100 | McKesson HBOC Inc. | 1,126,182 | ||||||||||||||
Total Health Care Providers & Services | 7,554,308 | |||||||||||||||
| Hotels, Restaurants & Leisure – 7.5% | ||||||||||||||||
| 18,300 | Brinker International Inc. | 982,893 | ||||||||||||||
| 20,800 | Dunkin Brands Group Inc. | 1,018,160 | ||||||||||||||
| 11,500 | McDonald’s Corporation | 1,330,090 | ||||||||||||||
| 4,300 | Panera Bread Company, Class A, (2) | 933,745 | ||||||||||||||
| 12,000 | YUM! Brands, Inc. | 1,088,520 | ||||||||||||||
Total Hotels, Restaurants & Leisure | 5,353,408 | |||||||||||||||
| Household Products – 0.2% | ||||||||||||||||
| 1,200 | Procter & Gamble Company | 104,772 | ||||||||||||||
| Industrial Conglomerates – 1.9% | ||||||||||||||||
| 9,100 | Carlisle Companies Inc. | 954,226 | ||||||||||||||
| 13,100 | General Electric Company | 409,244 | ||||||||||||||
Total Industrial Conglomerates | 1,363,470 | |||||||||||||||
| Insurance – 1.8% | ||||||||||||||||
| 4,200 | AFLAC Incorporated | 311,556 | ||||||||||||||
| 35,000 | Assured Guaranty Limited | 971,950 | ||||||||||||||
Total Insurance | 1,283,506 | |||||||||||||||
| Internet & Catalog Retail – 0.5% | ||||||||||||||||
| 500 | Amazon.com, Inc., (2) | 384,580 | ||||||||||||||
| Internet Software & Services – 2.0% | ||||||||||||||||
| 1,400 | Alphabet Inc., Class A, (2) | 1,105,790 | ||||||||||||||
| 2,600 | Facebook Inc., Class A, (2) | 327,912 | ||||||||||||||
Total Internet Software & Services | 1,433,702 | |||||||||||||||
| IT Services – 3.4% | ||||||||||||||||
| 14,200 | MasterCard, Inc., Class A | 1,372,146 | ||||||||||||||
| 105,000 | Xerox Corporation | 1,034,250 | ||||||||||||||
Total IT Services | 2,406,396 | |||||||||||||||
| 80 | NUVEEN |
| Shares | Description (1) | Value | ||||||||||||||
| Life Sciences Tools & Services – 1.4% | ||||||||||||||||
| 12,400 | Quintiles Transnational Corporation, (2) | $ | 958,520 | |||||||||||||
| Machinery – 1.7% | ||||||||||||||||
| 32,400 | Allision Transmission Holdings Inc. | 898,776 | ||||||||||||||
| 3,700 | Wabtec Corporation | 283,457 | ||||||||||||||
Total Machinery | 1,182,233 | |||||||||||||||
| Media – 5.7% | ||||||||||||||||
| 19,800 | CBS Corporation, Class B | 1,010,394 | ||||||||||||||
| 40,100 | Discovery Communications Inc., Class A, (2) | 1,022,951 | ||||||||||||||
| 59,000 | Gannett Company, Inc. | 703,870 | ||||||||||||||
| 4,100 | Omnicom Group, Inc. | 353,133 | ||||||||||||||
| 15,700 | Scripps Networks Interactive, Class A | 994,909 | ||||||||||||||
Total Media | 4,085,257 | |||||||||||||||
| Metals & Mining – 2.6% | ||||||||||||||||
| 18,400 | Nucor Corporation | 892,584 | ||||||||||||||
| 13,300 | Reliance Steel & Aluminum Company | 958,664 | ||||||||||||||
Total Metals & Mining | 1,851,248 | |||||||||||||||
| Multiline Retail – 4.8% | ||||||||||||||||
| 17,500 | Big Lots, Inc. | 863,100 | ||||||||||||||
| 6,500 | Dollar General Corporation | 477,165 | ||||||||||||||
| 21,000 | Kohl’s Corporation | 931,980 | ||||||||||||||
| 16,200 | Target Corporation | 1,137,078 | ||||||||||||||
Total Multiline Retail | 3,409,323 | |||||||||||||||
| Oil, Gas & Consumable Fuels – 1.0% | ||||||||||||||||
| 8,000 | Exxon Mobil Corporation | 697,120 | ||||||||||||||
| Personal Products – 2.5% | ||||||||||||||||
| 13,200 | Herbalife, Limited | 801,900 | ||||||||||||||
| 16,400 | Nu Skin Enterprises Inc., Class A | 949,232 | ||||||||||||||
Total Personal Products | 1,751,132 | |||||||||||||||
| Pharmaceuticals – 0.8% | ||||||||||||||||
| 5,000 | Johnson & Johnson | 596,700 | ||||||||||||||
| Professional Services – 1.3% | ||||||||||||||||
| 12,700 | Manpower Inc. | 907,542 | ||||||||||||||
| Semiconductors & Semiconductor Equipment – 3.0% | ||||||||||||||||
| 62,100 | ON Semiconductor Corporation, (2) | 670,680 | ||||||||||||||
| 21,400 | QUALCOMM, Inc. | 1,349,698 | ||||||||||||||
| 6,800 | Teradyne Inc. | 143,208 | ||||||||||||||
Total Semiconductors & Semiconductor Equipment | 2,163,586 | |||||||||||||||
| NUVEEN | 81 |
Nuveen Large Cap Core Plus Fund (continued)
| Portfolio of Investments | August 31, 2016 |
| Shares | Description (1) | Value | ||||||||||||||
| Software – 4.1% | ||||||||||||||||
| 11,700 | Citrix Systems, (2) | $ | 1,020,240 | |||||||||||||
| 8,000 | Intuit, Inc. | 891,600 | ||||||||||||||
| 17,900 | Microsoft Corporation | 1,028,534 | ||||||||||||||
Total Software | 2,940,374 | |||||||||||||||
| Specialty Retail – 6.7% | ||||||||||||||||
| 25,200 | Best Buy Co., Inc. | 969,696 | ||||||||||||||
| 12,400 | Home Depot, Inc. | 1,663,088 | ||||||||||||||
| 15,400 | Lowe’s Companies, Inc. | 1,179,024 | ||||||||||||||
| 26,800 | Urban Outfitters, Inc., (2) | 960,780 | ||||||||||||||
Total Specialty Retail | 4,772,588 | |||||||||||||||
| Technology Hardware, Storage & Peripherals – 7.8% | ||||||||||||||||
| 33,300 | Apple, Inc. | 3,533,130 | ||||||||||||||
| 76,300 | HP Inc. | 1,096,431 | ||||||||||||||
| 28,100 | NCR Corporation, (2) | 951,185 | ||||||||||||||
Total Technology Hardware, Storage & Peripherals | 5,580,746 | |||||||||||||||
| Trading Companies & Distributors – 3.4% | ||||||||||||||||
| 7,000 | MSC Industrial Direct Inc., Class A | 511,280 | ||||||||||||||
| 11,600 | United Rentals Inc., (2) | 954,796 | ||||||||||||||
| 15,400 | WESCO International Inc., (2) | 957,264 | ||||||||||||||
Total Trading Companies & Distributors | 2,423,340 | |||||||||||||||
| Wireless Telecommunication Services – 1.4% | ||||||||||||||||
| 21,900 | T-Mobile US Inc., (2) | 1,014,846 | ||||||||||||||
Total Long-Term Investments (cost $85,396,629) | 92,468,472 | |||||||||||||||
| Principal Amount (000) | Description (1) | Coupon | Maturity | Value | ||||||||||||
| SHORT-TERM INVESTMENTS – 0.5% | ||||||||||||||||
| REPURCHASE AGREEMENTS – 0.5% | ||||||||||||||||
| $ | 362 | Repurchase Agreement with Fixed Income Clearing Corporation, dated 8/31/16 repurchase price $361,540, collateralized by $310,000 U.S. Treasury Bonds, 3.125%, due 11/15/41, value $370,063 | 0.030% | 9/01/16 | $ | 361,540 | ||||||||||
Total Short-Term Investments (cost $361,540) | 361,540 | |||||||||||||||
Total Investments (cost $85,758,169) – 130.2% | 92,830,012 | |||||||||||||||
| Shares | Description (1) | Value | ||||||||||||||
COMMON STOCKS SOLD SHORT – (29.9)% (3) | ||||||||||||||||
| Aerospace & Defense – (0.4)% | ||||||||||||||||
| (1,500 | ) | General Dynamics Corporation | $ | (228,330 | ) | |||||||||||
| (300 | ) | Northrop Grumman Corporation | (63,621 | ) | ||||||||||||
Total Aerospace & Defense | (291,951 | ) | ||||||||||||||
| 82 | NUVEEN |
| Shares | Description (1) | Value | ||||||||||||||
| Automobiles – (0.3)% | ||||||||||||||||
| (1,000 | ) | Tesla Motors Inc., (2) | $ | (212,010 | ) | |||||||||||
| Banks – (0.1)% | ||||||||||||||||
| (700 | ) | M&T Bank Corporation | (82,831 | ) | ||||||||||||
| Beverages – (1.5)% | ||||||||||||||||
| (3,800 | ) | Brown-Forman Corporation, Class B | (184,490 | ) | ||||||||||||
| (4,500 | ) | Coca-Cola Company | (195,435 | ) | ||||||||||||
| (1,300 | ) | Constellation Brands, Inc., Class A | (213,265 | ) | ||||||||||||
| (2,200 | ) | Molson Coors Brewing Company, Class B | (225,104 | ) | ||||||||||||
| (1,400 | ) | Monster Beverage Corporation, (2) | (215,446 | ) | ||||||||||||
Total Beverages | (1,033,740 | ) | ||||||||||||||
| Biotechnology – (0.3)% | ||||||||||||||||
| (1,300 | ) | Intercept Pharmaceuticals Incorporated, (2) | (192,803 | ) | ||||||||||||
| Building Products – (0.3)% | ||||||||||||||||
| (5,000 | ) | Armstrong World Industries Inc., (2) | (217,350 | ) | ||||||||||||
| Capital Markets – (0.3)% | ||||||||||||||||
| (200 | ) | Affiliated Managers Group Inc., (2) | (28,410 | ) | ||||||||||||
| (8,300 | ) | Artisan Partners Asset Management Inc., Class A | (217,045 | ) | ||||||||||||
Total Capital Markets | (245,455 | ) | ||||||||||||||
| Chemicals – (0.9)% | ||||||||||||||||
| (3,300 | ) | E.I. Du Pont de Nemours and Company | (229,680 | ) | ||||||||||||
| (1,800 | ) | Praxair, Inc. | (219,672 | ) | ||||||||||||
| (2,700 | ) | Scotts Miracle Gro Company, Class A | (223,560 | ) | ||||||||||||
Total Chemicals | (672,912 | ) | ||||||||||||||
| Commercial Services & Supplies – (0.6)% | ||||||||||||||||
| (4,800 | ) | Johnson Controls International PLC | (209,664 | ) | ||||||||||||
| (8,000 | ) | Rollins Inc. | (228,000 | ) | ||||||||||||
Total Commercial Services & Supplies | (437,664 | ) | ||||||||||||||
| Consumer Finance – (0.3)% | ||||||||||||||||
| (7,800 | ) | OneMain Holdings Inc., (2) | (241,878 | ) | ||||||||||||
| Containers & Packaging – (0.3)% | ||||||||||||||||
| (2,700 | ) | Ball Corporation | (213,813 | ) | ||||||||||||
| Electric Utilities – (1.9)% | ||||||||||||||||
| (2,600 | ) | Alliant Energy Corporation | (98,670 | ) | ||||||||||||
| (800 | ) | Duke Energy Corporation | (63,728 | ) | ||||||||||||
| (4,000 | ) | Eversource Energy | (215,880 | ) | ||||||||||||
| (800 | ) | NextEra Energy Inc. | (96,752 | ) | ||||||||||||
| (3,500 | ) | PG&E Corporation | (216,790 | ) | ||||||||||||
| (6,300 | ) | PPL Corporation | (219,114 | ) | ||||||||||||
| NUVEEN | 83 |
Nuveen Large Cap Core Plus Fund (continued)
| Portfolio of Investments | August 31, 2016 |
| Shares | Description (1) | Value | ||||||||||||||
| Electric Utilities (continued) | ||||||||||||||||
| (4,200 | ) | Southern Company | $ | (215,586 | ) | |||||||||||
| (5,300 | ) | Xcel Energy, Inc. | (219,208 | ) | ||||||||||||
Total Electric Utilities | (1,345,728 | ) | ||||||||||||||
| Electrical Equipment – (0.2)% | ||||||||||||||||
| (200 | ) | Acuity Brands Inc. | (55,024 | ) | ||||||||||||
| (2,800 | ) | Solarcity Corporation, (2) | (57,848 | ) | ||||||||||||
Total Electrical Equipment | (112,872 | ) | ||||||||||||||
| Electronic Equipment, Instruments & Components – (0.7)% | ||||||||||||||||
| (3,400 | ) | Amphenol Corporation, Class A | (211,854 | ) | ||||||||||||
| (5,500 | ) | VeriFone Holdings Inc., (2) | (109,230 | ) | ||||||||||||
| (3,000 | ) | Zebra Technologies Corporation, Class A, (2) | (209,880 | ) | ||||||||||||
Total Electronic Equipment, Instruments & Components | (530,964 | ) | ||||||||||||||
| Energy Equipment & Services – (0.9)% | ||||||||||||||||
| (4,900 | ) | Halliburton Company | (210,749 | ) | ||||||||||||
| (2,800 | ) | Schlumberger Limited | (221,200 | ) | ||||||||||||
| (40,700 | ) | Weatherford International PLC, (2) | (222,629 | ) | ||||||||||||
Total Energy Equipment & Services | (654,578 | ) | ||||||||||||||
| Food Products – (0.4)% | ||||||||||||||||
| (3,700 | ) | ConAgra Foods, Inc. | (172,457 | ) | ||||||||||||
| (700 | ) | Kellogg Company | (57,547 | ) | ||||||||||||
| (1,100 | ) | Mondelez International Inc., Class A | (49,522 | ) | ||||||||||||
Total Food Products | (279,526 | ) | ||||||||||||||
| Health Care Equipment & Supplies – (1.7)% | ||||||||||||||||
| (2,100 | ) | Abbott Laboratories | (88,242 | ) | ||||||||||||
| (3,700 | ) | DENTSPLY SIRONA Inc. | (227,402 | ) | ||||||||||||
| (2,500 | ) | DexCom, Inc., (2) | (227,725 | ) | ||||||||||||
| (1,900 | ) | Edwards Lifesciences Corp., (2) | (218,804 | ) | ||||||||||||
| (300 | ) | Intuitive Surgical, Inc., (2) | (205,926 | ) | ||||||||||||
| (300 | ) | Medtronic, PLC | (26,109 | ) | ||||||||||||
| (1,900 | ) | Stryker Corporation | (219,754 | ) | ||||||||||||
Total Health Care Equipment & Supplies | (1,213,962 | ) | ||||||||||||||
| Health Care Providers & Services – (0.6)% | ||||||||||||||||
| (4,200 | ) | Acadia Healthcare Company Inc., (2) | (214,998 | ) | ||||||||||||
| (12,200 | ) | Brookdale Senior Living Inc., (2) | (209,962 | ) | ||||||||||||
Total Health Care Providers & Services | (424,960 | ) | ||||||||||||||
| Hotels, Restaurants & Leisure – (0.2)% | ||||||||||||||||
| (300 | ) | Chipotle Mexican Grill, (2) | (124,119 | ) | ||||||||||||
| 84 | NUVEEN |
| Shares | Description (1) | Value | ||||||||||||||
| Household Durables – (1.2)% | ||||||||||||||||
| (6,100 | ) | CalAtlantic Group Inc. | $ | (222,589 | ) | |||||||||||
| (4,600 | ) | Lennar Corporation, Class A | (217,580 | ) | ||||||||||||
| (1,000 | ) | Mohawk Industries Inc., (2) | (212,780 | ) | ||||||||||||
| (4,100 | ) | Newell Brands Inc. | (217,628 | ) | ||||||||||||
Total Household Durables | (870,577 | ) | ||||||||||||||
| Household Products – (0.3)% | ||||||||||||||||
| (2,900 | ) | Colgate-Palmolive Company | (215,586 | ) | ||||||||||||
| Industrial Conglomerates – (0.6)% | ||||||||||||||||
| (1,200 | ) | 3M Co. | (215,088 | ) | ||||||||||||
| (1,900 | ) | Honeywell International Inc. | (221,749 | ) | ||||||||||||
Total Industrial Conglomerates | (436,837 | ) | ||||||||||||||
| Insurance – (0.7)% | ||||||||||||||||
| (1,800 | ) | Ace Limited | (228,474 | ) | ||||||||||||
| (500 | ) | Arch Capital Group Limited, (2) | (40,470 | ) | ||||||||||||
| (4,200 | ) | Mercury General Corporation | (228,060 | ) | ||||||||||||
| (700 | ) | Progressive Corporation | (22,792 | ) | ||||||||||||
Total Insurance | (519,796 | ) | ||||||||||||||
| Internet & Catalog Retail – (1.0)% | ||||||||||||||||
| (100 | ) | Alphabet Inc., Class A, (2) | (78,985 | ) | ||||||||||||
| (7,400 | ) | Liberty Interactive Corporation, Class A, (2) | (156,362 | ) | ||||||||||||
| (5,900 | ) | Liberty Ventures, Series A, (2) | (227,386 | ) | ||||||||||||
| (2,300 | ) | NetFlix.com Inc., (2) | (224,135 | ) | ||||||||||||
Total Internet & Catalog Retail | (686,868 | ) | ||||||||||||||
| Internet Software & Services – (1.2)% | ||||||||||||||||
| (1,100 | ) | LinkedIn Corporation, Class A, (2) | (212,025 | ) | ||||||||||||
| (15,500 | ) | Pandora Media, Inc., (2) | (217,000 | ) | ||||||||||||
| (10,500 | ) | Twitter Inc., (2) | (201,705 | ) | ||||||||||||
| (5,100 | ) | Yahoo! Inc., (2) | (218,025 | ) | ||||||||||||
Total Internet Software & Services | (848,755 | ) | ||||||||||||||
| Leisure Products – (0.3)% | ||||||||||||||||
| (6,500 | ) | Mattel, Inc. | (215,345 | ) | ||||||||||||
| Life Sciences Tools & Services – (0.2)% | ||||||||||||||||
| (700 | ) | Bio-Rad Laboratories Inc., Class A, (2) | (104,167 | ) | ||||||||||||
| Machinery – (0.3)% | ||||||||||||||||
| (4,100 | ) | Xylem Inc. | (208,526 | ) | ||||||||||||
| Media – (0.6)% | ||||||||||||||||
| (900 | ) | Charter Communications, Inc., Class A, (2) | (231,489 | ) | ||||||||||||
| (10,000 | ) | Lions Gate Entertainment Corporation | (209,600 | ) | ||||||||||||
Total Media | (441,089 | ) | ||||||||||||||
| NUVEEN | 85 |
Nuveen Large Cap Core Plus Fund (continued)
| Portfolio of Investments | August 31, 2016 |
| Shares | Description (1) | Value | ||||||||||||||
| Metals & Mining – (0.6)% | ||||||||||||||||
| (2,800 | ) | Compass Minerals International, Inc. | $ | (208,684 | ) | |||||||||||
| (8,600 | ) | Southern Copper Corporation | (222,052 | ) | ||||||||||||
Total Metals & Mining | (430,736 | ) | ||||||||||||||
| Multi-Utilities – (1.2)% | ||||||||||||||||
| (2,900 | ) | Consolidated Edison, Inc. | (218,225 | ) | ||||||||||||
| (2,900 | ) | Dominion Resources, Inc. | (215,064 | ) | ||||||||||||
| (2,000 | ) | Sempra Energy | (209,260 | ) | ||||||||||||
| (3,700 | ) | WEC Energy Group, Inc. | (221,556 | ) | ||||||||||||
Total Multi-Utilities | (864,105 | ) | ||||||||||||||
| Oil, Gas & Consumable Fuels – (4.1)% | ||||||||||||||||
| (4,200 | ) | Anadarko Petroleum Corporation | (224,574 | ) | ||||||||||||
| (4,400 | ) | Apache Corporation | (218,680 | ) | ||||||||||||
| (5,700 | ) | Cabot Oil & Gas Corporation | (140,391 | ) | ||||||||||||
| (4,600 | ) | Cheniere Energy Inc., (2) | (197,340 | ) | ||||||||||||
| (1,500 | ) | Chevron Corporation | (150,870 | ) | ||||||||||||
| (1,700 | ) | Cimarex Energy Company | (224,706 | ) | ||||||||||||
| (5,500 | ) | ConocoPhillips | (225,775 | ) | ||||||||||||
| (4,500 | ) | Devon Energy Corporation | (194,985 | ) | ||||||||||||
| (2,000 | ) | Exxon Mobil Corporation | (174,280 | ) | ||||||||||||
| (3,900 | ) | Energen Corporation | (224,250 | ) | ||||||||||||
| (2,400 | ) | EOG Resources, Inc. | (212,376 | ) | ||||||||||||
| (8,400 | ) | Golar LNG, Limited | (174,972 | ) | ||||||||||||
| (3,800 | ) | Kinder Morgan, Inc. | (83,030 | ) | ||||||||||||
| (3,000 | ) | Occidental Petroleum Corporation | (230,550 | ) | ||||||||||||
| (1,300 | ) | Pioneer Natural Resources Company | (232,765 | ) | ||||||||||||
Total Oil, Gas & Consumable Fuels | (2,909,544 | ) | ||||||||||||||
| Pharmaceuticals – (0.4)% | ||||||||||||||||
| (900 | ) | Allergan PLC, (2) | (211,086 | ) | ||||||||||||
| (1,600 | ) | Zoetis Incorporated | (81,760 | ) | ||||||||||||
Total Pharmaceuticals | (292,846 | ) | ||||||||||||||
| Real Estate Investment Trust – (0.3)% | ||||||||||||||||
| (7,000 | ) | Weyerhaeuser Company | (222,950 | ) | ||||||||||||
| Road & Rail – (0.1)% | ||||||||||||||||
| (800 | ) | Union Pacific Corporation | (76,424 | ) | ||||||||||||
| Semiconductors & Semiconductor Equipment – (0.6)% | ||||||||||||||||
| (1,300 | ) | Broadcom Limited | (229,346 | ) | ||||||||||||
| (700 | ) | Linear Technology Corporation | (40,768 | ) | ||||||||||||
| (15,100 | ) | SunPower Corporation, (2) | (150,396 | ) | ||||||||||||
Total Semiconductors & Semiconductor Equipment | (420,510 | ) | ||||||||||||||
| 86 | NUVEEN |
| Shares | Description (1) | Value | ||||||||||||||
| Software – (1.3)% | ||||||||||||||||
| (14,800 | ) | FireEye Inc., (2) | $ | (212,528 | ) | |||||||||||
| (2,000 | ) | NetSuite Inc., (2) | (217,800 | ) | ||||||||||||
| (3,100 | ) | ServiceNow Inc., (2) | (225,277 | ) | ||||||||||||
| (7,100 | ) | SS&C Technologies Holdings Inc. | (233,945 | ) | ||||||||||||
| (200 | ) | Tyler Technologies Inc., (2) | (32,790 | ) | ||||||||||||
Total Software | (922,340 | ) | ||||||||||||||
| Specialty Retail – (0.9)% | ||||||||||||||||
| (3,700 | ) | CarMax, Inc., (2) | (218,115 | ) | ||||||||||||
| (2,300 | ) | Signet Jewelers Limited | (188,554 | ) | ||||||||||||
| (3,100 | ) | Tiffany & Co. | (221,247 | ) | ||||||||||||
Total Specialty Retail | (627,916 | ) | ||||||||||||||
| Technology Hardware, Storage & Peripherals – (0.3)% | ||||||||||||||||
| (8,300 | ) | Stratasys, Inc., (2) | (177,122 | ) | ||||||||||||
| Textiles, Apparel & Luxury Goods – (0.9)% | ||||||||||||||||
| (3,600 | ) | Nike, Inc., Class B | (207,504 | ) | ||||||||||||
| (400 | ) | Skechers USA Inc., Class A, (2) | (9,724 | ) | ||||||||||||
| (5,100 | ) | Under Armour, Inc., Class A, (2) | (202,113 | ) | ||||||||||||
| (3,300 | ) | VF Corporation | (204,765 | ) | ||||||||||||
Total Textiles, Apparel & Luxury Goods | (624,106 | ) | ||||||||||||||
| Thrifts & Mortgage Finance – (0.3)% | ||||||||||||||||
| (15,600 | ) | New York Community Bancorp Inc. | (235,716 | ) | ||||||||||||
| Tobacco – (0.3)% | ||||||||||||||||
| (4,500 | ) | Reynolds American Inc. | (223,065 | ) | ||||||||||||
| Water Utilities – (0.3)% | ||||||||||||||||
| (7,000 | ) | Aqua America Inc. | (212,870 | ) | ||||||||||||
Total Common Stocks Sold Short (proceeds $22,967,595) | (21,316,912 | ) | ||||||||||||||
Other Assets Less Liabilities – (0.3)% | (195,264 | ) | ||||||||||||||
Net Assets – 100% | $ | 71,317,836 | ||||||||||||||
For Fund portfolio compliance purposes, the Fund’s industry classifications refer to any one or more of the industry sub-classifications used by one or more widely recognized market indexes or ratings group indexes, and/or as defined by Fund management. This definition may not apply for purposes of this report, which may combine industry sub-classifications into sectors for reporting ease.
| (1) | All percentages shown in the Portfolio of Investments are based on net assets. |
| (2) | Non-income producing; issuer has not declared a dividend within the past twelve months. |
| (3) | The Fund may pledge up to 100% of its eligible long-term investments in the Portfolio of Investments as collateral for Common Stocks Sold Short. As of the end of the reporting period, long-term investments with a value of $31,050,540 have been pledged as collateral for Common Stocks Sold Short. |
See accompanying notes to financial statements.
| NUVEEN | 87 |
Nuveen Equity Long/Short Fund
| Portfolio of Investments | August 31, 2016 |
| Shares | Description (1) | Value | ||||||||||||||
LONG-TERM INVESTMENTS – 155.9% | ||||||||||||||||
COMMON STOCKS – 155.9% | ||||||||||||||||
| Aerospace & Defense – 1.2% | ||||||||||||||||
| 6,100 | Huntington Ingalls Industries Inc. | $ | 1,007,537 | |||||||||||||
| Air Freight & Logistics – 2.5% | ||||||||||||||||
| 15,400 | C.H. Robinson Worldwide, Inc. | 1,069,068 | ||||||||||||||
| 20,100 | Expeditors International of Washington, Inc. | 1,018,065 | ||||||||||||||
Total Air Freight & Logistics | 2,087,133 | |||||||||||||||
| Airlines – 2.8% | ||||||||||||||||
| 16,000 | Alaska Air Group, Inc. | 1,080,480 | ||||||||||||||
| 8,000 | Copa Holdings SA, Class A | 611,440 | ||||||||||||||
| 18,000 | Delta Air Lines, Inc. | 661,500 | ||||||||||||||
Total Airlines | 2,353,420 | |||||||||||||||
| Auto Components – 2.5% | ||||||||||||||||
| 9,300 | Lear Corporation | 1,081,497 | ||||||||||||||
| 14,300 | Visteon Corporation, (2) | 1,011,010 | ||||||||||||||
Total Auto Components | 2,092,507 | |||||||||||||||
| Automobiles – 0.7% | ||||||||||||||||
| 45,000 | Ford Motor Company | 567,000 | ||||||||||||||
| Banks – 4.8% | ||||||||||||||||
| 70,000 | Bank of America Corporation | 1,129,800 | ||||||||||||||
| 26,200 | JPMorgan Chase & Co. | 1,768,500 | ||||||||||||||
| 110,700 | Regions Financial Corporation | 1,103,679 | ||||||||||||||
Total Banks | 4,001,979 | |||||||||||||||
| Biotechnology – 8.2% | ||||||||||||||||
| 20,000 | AbbVie Inc. | 1,282,000 | ||||||||||||||
| 8,200 | Amgen Inc. | 1,394,492 | ||||||||||||||
| 11,300 | Celgene Corporation, (2) | 1,206,162 | ||||||||||||||
| 16,300 | Gilead Sciences Inc. | 1,277,594 | ||||||||||||||
| 12,600 | Incyte Pharmaceuticals Inc., (2) | 1,021,860 | ||||||||||||||
| 5,300 | United Therapeutics Corporation, (2) | 648,084 | ||||||||||||||
Total Biotechnology | 6,830,192 | |||||||||||||||
| Building Products – 1.3% | ||||||||||||||||
| 18,900 | Owens Corning | 1,037,988 | ||||||||||||||
| Capital Markets – 2.0% | ||||||||||||||||
| 5,300 | CME Group, Inc. | 574,255 | ||||||||||||||
| 88 | NUVEEN |
| Shares | Description (1) | Value | ||||||||||||||
| Capital Markets (continued) | ||||||||||||||||
| 3,900 | Intercontinental Exchange Group, Inc. | $ | 1,099,878 | |||||||||||||
Total Capital Markets | 1,674,133 | |||||||||||||||
| Chemicals – 4.9% | ||||||||||||||||
| 20,200 | Cabot Corporation | 1,007,172 | ||||||||||||||
| 15,800 | Celanese Corporation, Series A | 1,017,994 | ||||||||||||||
| 19,400 | RPM International, Inc. | 1,057,882 | ||||||||||||||
| 19,400 | Westlake Chemical Corporation | 1,005,308 | ||||||||||||||
Total Chemicals | 4,088,356 | |||||||||||||||
| Communications Equipment – 4.2% | ||||||||||||||||
| 102,000 | Brocade Communications Systems Inc. | 915,960 | ||||||||||||||
| 47,700 | Cisco Systems, Inc. | 1,499,688 | ||||||||||||||
| 8,600 | F5 Networks, Inc., (2) | 1,055,478 | ||||||||||||||
Total Communications Equipment | 3,471,126 | |||||||||||||||
| Construction & Engineering – 4.1% | ||||||||||||||||
| 29,100 | AECOM, (2) | 897,153 | ||||||||||||||
| 20,300 | Chicago Bridge & Iron Company N.V. | 604,534 | ||||||||||||||
| 18,500 | Jacobs Engineering Group, Inc., (2) | 974,765 | ||||||||||||||
| 63,900 | KBR Inc. | 938,052 | ||||||||||||||
Total Construction & Engineering | 3,414,504 | |||||||||||||||
| Consumer Finance – 2.1% | ||||||||||||||||
| 18,600 | Discover Financial Services | 1,116,000 | ||||||||||||||
| 89,000 | SLM Corporation | 659,935 | ||||||||||||||
Total Consumer Finance | 1,775,935 | |||||||||||||||
| Containers & Packaging – 2.4% | ||||||||||||||||
| 70,400 | Graphic Packaging Holding Company | 1,009,536 | ||||||||||||||
| 21,100 | WestRock Company | 1,010,690 | ||||||||||||||
Total Containers & Packaging | 2,020,226 | |||||||||||||||
| Distributors – 1.3% | ||||||||||||||||
| 10,100 | Genuine Parts Company | 1,038,482 | ||||||||||||||
| Diversified Telecommunication Services – 3.2% | ||||||||||||||||
| 36,400 | CenturyLink Inc. | 1,011,920 | ||||||||||||||
| 31,100 | Verizon Communications Inc. | 1,627,463 | ||||||||||||||
Total Diversified Telecommunication Services | 2,639,383 | |||||||||||||||
| Electric Utilities – 1.1% | ||||||||||||||||
| 6,500 | Edison International | 472,680 | ||||||||||||||
| 17,000 | Great Plains Energy Incorporated | 461,720 | ||||||||||||||
Total Electric Utilities | 934,400 | |||||||||||||||
| NUVEEN | 89 |
Nuveen Equity Long/Short Fund (continued)
| Portfolio of Investments | August 31, 2016 |
| Shares | Description (1) | Value | ||||||||||||||
| Electrical Equipment – 0.8% | ||||||||||||||||
| 9,300 | Eaton PLC | $ | 618,822 | |||||||||||||
| Energy Equipment & Services – 1.4% | ||||||||||||||||
| 49,300 | Rowan Companies Inc., Class A | 614,278 | ||||||||||||||
| 60,000 | Transocean Inc. | 582,000 | ||||||||||||||
Total Energy Equipment & Services | 1,196,278 | |||||||||||||||
| Food & Staples Retailing – 6.0% | ||||||||||||||||
| 7,300 | Costco Wholesale Corporation | 1,183,257 | ||||||||||||||
| 17,000 | Kroger Co. | 543,830 | ||||||||||||||
| 45,100 | Sprouts Farmers Market Inc., (2) | 1,016,103 | ||||||||||||||
| 20,900 | Sysco Corporation | 1,083,874 | ||||||||||||||
| 14,500 | Walgreens Boots Alliance Inc. | 1,170,295 | ||||||||||||||
Total Food & Staples Retailing | 4,997,359 | |||||||||||||||
| Food Products – 2.5% | ||||||||||||||||
| 41,800 | Pilgrim’s Pride Corporation, (2) | 964,744 | ||||||||||||||
| 15,000 | Tyson Foods, Inc., Class A | 1,133,550 | ||||||||||||||
Total Food Products | 2,098,294 | |||||||||||||||
| Health Care Providers & Services – 7.7% | ||||||||||||||||
| 9,200 | Aetna Inc. | 1,077,504 | ||||||||||||||
| 11,800 | AmerisourceBergen Corporation | 1,026,246 | ||||||||||||||
| 8,900 | Anthem Inc. | 1,113,212 | ||||||||||||||
| 15,600 | Express Scripts, Holding Company, (2) | 1,134,120 | ||||||||||||||
| 5,775 | McKesson HBOC Inc. | 1,066,181 | ||||||||||||||
| 8,900 | Wellcare Health Plans Inc., (2) | 1,003,030 | ||||||||||||||
Total Health Care Providers & Services | 6,420,293 | |||||||||||||||
| Health Care Technology – 2.4% | ||||||||||||||||
| 70,800 | Allscripts Healthcare Solutions Inc., (2) | 914,028 | ||||||||||||||
| 26,100 | Veeva Systems Inc., Class A, (2) | 1,068,012 | ||||||||||||||
Total Health Care Technology | 1,982,040 | |||||||||||||||
| Hotels, Restaurants & Leisure – 7.6% | ||||||||||||||||
| 27,700 | Aramark Holdings Corporation | 1,050,661 | ||||||||||||||
| 19,000 | Brinker International Inc. | 1,020,490 | ||||||||||||||
| 17,000 | Darden Restaurants, Inc. | 1,047,880 | ||||||||||||||
| 6,900 | Dominos Pizza Inc. | 1,032,033 | ||||||||||||||
| 15,100 | Marriott International, Inc., Class A | 1,077,083 | ||||||||||||||
| 6,600 | Vail Resorts, Inc. | 1,045,638 | ||||||||||||||
Total Hotels, Restaurants & Leisure | 6,273,785 | |||||||||||||||
| Household Durables – 2.2% | ||||||||||||||||
| 26,000 | D.R. Horton, Inc. | 833,560 | ||||||||||||||
| 90 | NUVEEN |
| Shares | Description (1) | Value | ||||||||||||||
| Household Durables (continued) | ||||||||||||||||
| 5,700 | Whirlpool Corporation | $ | 1,018,248 | |||||||||||||
Total Household Durables | 1,851,808 | |||||||||||||||
| Household Products – 3.7% | ||||||||||||||||
| 10,200 | Church & Dwight Company Inc. | 1,014,084 | ||||||||||||||
| 20,800 | Energizer Holdings, Inc. | 1,027,936 | ||||||||||||||
| 7,700 | Spectrum Brands Inc. | 1,033,340 | ||||||||||||||
Total Household Products | 3,075,360 | |||||||||||||||
| Independent Power & Renewable Electricity Producers – 1.2% | ||||||||||||||||
| 81,000 | AES Corporation | 977,670 | ||||||||||||||
| Insurance – 5.4% | ||||||||||||||||
| 15,800 | AFLAC Incorporated | 1,172,044 | ||||||||||||||
| 25,900 | MetLife, Inc. | 1,124,060 | ||||||||||||||
| 14,000 | Prudential Financial, Inc. | 1,111,320 | ||||||||||||||
| 31,400 | Unum Group | 1,118,154 | ||||||||||||||
Total Insurance | 4,525,578 | |||||||||||||||
| IT Services – 3.4% | ||||||||||||||||
| 12,100 | Henry Jack and Associates Inc. | 1,055,967 | ||||||||||||||
| 19,600 | Leidos Holdings Inc. | 793,996 | ||||||||||||||
| 17,600 | Vantiv Inc., Class A, (2) | 945,824 | ||||||||||||||
Total IT Services | 2,795,787 | |||||||||||||||
| Leisure Products – 1.8% | ||||||||||||||||
| 22,100 | Brunswick Corporation | 1,016,379 | ||||||||||||||
| 5,500 | Polaris Industries Inc. | 476,520 | ||||||||||||||
Total Leisure Products | 1,492,899 | |||||||||||||||
| Life Sciences Tools & Services – 1.3% | ||||||||||||||||
| 14,100 | Quintiles Transnational Corporation, (2) | 1,089,930 | ||||||||||||||
| Machinery – 4.6% | ||||||||||||||||
| 37,400 | Allision Transmission Holdings Inc. | 1,037,476 | ||||||||||||||
| 8,400 | Deere & Company | 710,220 | ||||||||||||||
| 10,700 | IDEX Corporation | 999,808 | ||||||||||||||
| 30,500 | Timken Company | 1,033,035 | ||||||||||||||
Total Machinery | 3,780,539 | |||||||||||||||
| Media – 6.3% | ||||||||||||||||
| 21,000 | CBS Corporation, Class B | 1,071,630 | ||||||||||||||
| 38,500 | Discovery Communications Inc., Class A, (2) | 982,135 | ||||||||||||||
| 40,300 | Live Nation Inc., (2) | 1,076,816 | ||||||||||||||
| 12,200 | Omnicom Group, Inc. | 1,050,786 | ||||||||||||||
| NUVEEN | 91 |
Nuveen Equity Long/Short Fund (continued)
| Portfolio of Investments | August 31, 2016 |
| Shares | Description (1) | Value | ||||||||||||||
| Media (continued) | ||||||||||||||||
| 245,400 | Sirius XM Holdings Inc., (2) | $ | 1,015,956 | |||||||||||||
Total Media | 5,197,323 | |||||||||||||||
| Metals & Mining – 2.3% | ||||||||||||||||
| 20,000 | Nucor Corporation | 970,200 | ||||||||||||||
| 39,700 | Steel Dynamics Inc. | 977,414 | ||||||||||||||
Total Metals & Mining | 1,947,614 | |||||||||||||||
| Multiline Retail – 2.0% | ||||||||||||||||
| 14,300 | Kohl’s Corporation | 634,634 | ||||||||||||||
| 15,100 | Target Corporation | 1,059,869 | ||||||||||||||
Total Multiline Retail | 1,694,503 | |||||||||||||||
| Oil, Gas & Consumable Fuels – 4.8% | ||||||||||||||||
| 200,000 | Denbury Resources Inc. | 616,000 | ||||||||||||||
| 20,500 | SM Energy Company | 776,540 | ||||||||||||||
| 6,200 | Tesoro Corporation | 467,604 | ||||||||||||||
| 10,700 | Valero Energy Corporation | 592,245 | ||||||||||||||
| 73,000 | Whiting Petroleum Corporation, (2) | 532,170 | ||||||||||||||
| 22,500 | World Fuel Services Corporation | 1,003,050 | ||||||||||||||
Total Oil, Gas & Consumable Fuels | 3,987,609 | |||||||||||||||
| Personal Products – 2.2% | ||||||||||||||||
| 15,500 | Herbalife, Limited | 941,625 | ||||||||||||||
| 15,700 | Nu Skin Enterprises Inc., Class A | 908,716 | ||||||||||||||
Total Personal Products | 1,850,341 | |||||||||||||||
| Professional Services – 2.6% | ||||||||||||||||
| 14,600 | Manpower Inc. | 1,043,316 | ||||||||||||||
| 20,600 | Nielsen Holdings PLC | 1,097,568 | ||||||||||||||
Total Professional Services | 2,140,884 | |||||||||||||||
| Semiconductors & Semiconductor Equipment – 7.0% | ||||||||||||||||
| 21,000 | Applied Materials, Inc. | 626,640 | ||||||||||||||
| 36,300 | Cree, Inc., (2) | 871,563 | ||||||||||||||
| 11,500 | Lam Research Corporation | 1,073,180 | ||||||||||||||
| 76,000 | ON Semiconductor Corporation, (2) | 820,800 | ||||||||||||||
| 20,800 | QUALCOMM, Inc. | 1,311,856 | ||||||||||||||
| 51,500 | Teradyne Inc. | 1,084,590 | ||||||||||||||
Total Semiconductors & Semiconductor Equipment | 5,788,629 | |||||||||||||||
| Software – 7.8% | ||||||||||||||||
| 12,000 | Citrix Systems, (2) | 1,046,400 | ||||||||||||||
| 9,900 | Intuit, Inc. | 1,103,355 | ||||||||||||||
| 38,500 | Microsoft Corporation | 2,212,210 | ||||||||||||||
| 92 | NUVEEN |
| Shares | Description (1) | Value | ||||||||||||||
| Software (continued) | ||||||||||||||||
| 13,900 | Red Hat, Inc., (2) | $ | 1,014,422 | |||||||||||||
| 18,300 | Synopsys Inc., (2) | 1,085,007 | ||||||||||||||
Total Software | 6,461,394 | |||||||||||||||
| Specialty Retail – 7.8% | ||||||||||||||||
| 19,500 | Best Buy Co., Inc. | 750,360 | ||||||||||||||
| 12,600 | Burlington Store Inc., (2) | 1,023,372 | ||||||||||||||
| 11,000 | Home Depot, Inc. | 1,475,320 | ||||||||||||||
| 15,600 | Lowe’s Companies, Inc. | 1,194,336 | ||||||||||||||
| 16,500 | Ross Stores, Inc. | 1,026,960 | ||||||||||||||
| 28,000 | Urban Outfitters, Inc., (2) | 1,003,800 | ||||||||||||||
Total Specialty Retail | 6,474,148 | |||||||||||||||
| Technology Hardware, Storage & Peripherals – 5.8% | ||||||||||||||||
| 24,800 | Apple, Inc. | 2,631,280 | ||||||||||||||
| 77,800 | HP Inc. | 1,117,986 | ||||||||||||||
| 31,600 | NCR Corporation, (2) | 1,069,660 | ||||||||||||||
Total Technology Hardware, Storage & Peripherals | 4,818,926 | |||||||||||||||
| Textiles, Apparel & Luxury Goods – 1.2% | ||||||||||||||||
| 21,100 | Michael Kors Holdings Limited, (2) | 1,032,845 | ||||||||||||||
| Trading Companies & Distributors – 3.6% | ||||||||||||||||
| 28,200 | HD Suplly Holdings Inc., (2) | 1,018,302 | ||||||||||||||
| 13,700 | MSC Industrial Direct Inc., Class A | 1,000,648 | ||||||||||||||
| 11,900 | United Rentals Inc., (2) | 979,489 | ||||||||||||||
Total Trading Companies & Distributors | 2,998,439 | |||||||||||||||
| Wireless Telecommunication Services – 1.2% | ||||||||||||||||
| 22,000 | T-Mobile US Inc., (2) | 1,019,480 | ||||||||||||||
Total Long-Term Investments (cost $120,891,267) | 129,622,878 | |||||||||||||||
| Principal Amount (000) | Description (1) | Coupon | Maturity | Value | ||||||||||||
SHORT-TERM INVESTMENTS – 3.3% | ||||||||||||||||
REPURCHASE AGREEMENTS – 3.3% | ||||||||||||||||
| $ | 2,755 | Repurchase Agreement with Fixed Income Clearing Corporation, dated 8/31/16 repurchase price $2,754,607, collateralized by $2,670,000 U.S. Treasury Notes, 2.125%, due 5/15/25, value $2,810,175 | 0.030% | 9/01/16 | $ | 2,754,605 | ||||||||||
Total Short-Term Investments (cost $2,754,605) | 2,754,605 | |||||||||||||||
Total Investments (cost $123,645,872) – 159.2% | 132,377,483 | |||||||||||||||
| NUVEEN | 93 |
Nuveen Equity Long/Short Fund (continued)
| Portfolio of Investments | August 31, 2016 |
| Shares | Description (1) | Value | ||||||||||||||
COMMON STOCKS SOLD SHORT – (75.1)% (3) | ||||||||||||||||
| Aerospace & Defense – (1.7)% | ||||||||||||||||
| (4,600 | ) | General Dynamics Corporation | $ | (700,212 | ) | |||||||||||
| (15,700 | ) | Hexcel Corporation | (704,145 | ) | ||||||||||||
Total Aerospace & Defense | (1,404,357 | ) | ||||||||||||||
| Automobiles – (0.8)% | ||||||||||||||||
| (3,200 | ) | Tesla Motors Inc., (2) | (678,432 | ) | ||||||||||||
| Banks – (0.5)% | ||||||||||||||||
| (3,200 | ) | M&T Bank Corporation | (378,656 | ) | ||||||||||||
| Beverages – (2.4)% | ||||||||||||||||
| (13,328 | ) | Brown-Forman Corporation, Class B | (647,074 | ) | ||||||||||||
| (6,700 | ) | Molson Coors Brewing Company, Class B | (685,544 | ) | ||||||||||||
| (4,400 | ) | Monster Beverage Corporation, (2) | (677,116 | ) | ||||||||||||
Total Beverages | (2,009,734 | ) | ||||||||||||||
| Biotechnology – (1.5)% | ||||||||||||||||
| (4,200 | ) | Intercept Pharmaceuticals Incorporated, (2) | (622,902 | ) | ||||||||||||
| (68,500 | ) | Opko Health Inc., (2) | (623,350 | ) | ||||||||||||
Total Biotechnology | (1,246,252 | ) | ||||||||||||||
| Building Products – (0.8)% | ||||||||||||||||
| (15,200 | ) | Armstrong World Industries Inc., (2) | (660,744 | ) | ||||||||||||
| Capital Markets – (0.8)% | ||||||||||||||||
| (24,300 | ) | Artisan Partners Asset Management Inc., Class A | (635,445 | ) | ||||||||||||
| Chemicals – (3.3)% | ||||||||||||||||
| (10,000 | ) | E.I. Du Pont de Nemours and Company | (696,000 | ) | ||||||||||||
| (1,600 | ) | NewMarket Corporation | (694,320 | ) | ||||||||||||
| (5,700 | ) | Praxair, Inc. | (695,628 | ) | ||||||||||||
| (8,200 | ) | Scotts Miracle Gro Company, Class A | (678,960 | ) | ||||||||||||
Total Chemicals | (2,764,908 | ) | ||||||||||||||
| Commercial Services & Supplies – (1.6)% | ||||||||||||||||
| (15,200 | ) | Johnson Controls International PLC | (663,936 | ) | ||||||||||||
| (23,900 | ) | Rollins Inc. | (681,150 | ) | ||||||||||||
Total Commercial Services & Supplies | (1,345,086 | ) | ||||||||||||||
| Consumer Finance – (0.9)% | ||||||||||||||||
| (23,700 | ) | OneMain Holdings Inc., (2) | (734,937 | ) | ||||||||||||
| Containers & Packaging – (2.5)% | ||||||||||||||||
| (9,000 | ) | AptarGroup Inc. | (701,820 | ) | ||||||||||||
| (8,300 | ) | Ball Corporation | (657,277 | ) | ||||||||||||
| (15,200 | ) | Sealed Air Corporation | (716,376 | ) | ||||||||||||
Total Containers & Packaging | (2,075,473 | ) | ||||||||||||||
| 94 | NUVEEN |
| Shares | Description (1) | Value | ||||||||||||||
| Electric Utilities – (3.9)% | ||||||||||||||||
| (16,700 | ) | Alliant Energy Corporation | $ | (633,765 | ) | |||||||||||
| (11,900 | ) | Eversource Energy | (642,243 | ) | ||||||||||||
| (10,800 | ) | PG&E Corporation | (668,952 | ) | ||||||||||||
| (18,600 | ) | PPL Corporation | (646,908 | ) | ||||||||||||
| (12,100 | ) | Westar Energy Inc. | (664,774 | ) | ||||||||||||
Total Electric Utilities | (3,256,642 | ) | ||||||||||||||
| Electrical Equipment – (0.8)% | ||||||||||||||||
| (2,400 | ) | Acuity Brands Inc. | (660,288 | ) | ||||||||||||
| Electronic Equipment, Instruments & Components – (2.5)% | ||||||||||||||||
| (23,500 | ) | National Instruments Corporation | (656,590 | ) | ||||||||||||
| (36,100 | ) | VeriFone Holdings Inc., (2) | (716,946 | ) | ||||||||||||
| (10,100 | ) | Zebra Technologies Corporation, Class A, (2) | (706,596 | ) | ||||||||||||
Total Electronic Equipment, Instruments & Components | (2,080,132 | ) | ||||||||||||||
| Energy Equipment & Services – (2.0)% | ||||||||||||||||
| (15,300 | ) | Halliburton Company | (658,053 | ) | ||||||||||||
| (7,500 | ) | Schlumberger Limited | (592,500 | ) | ||||||||||||
| (70,000 | ) | Weatherford International PLC, (2) | (382,900 | ) | ||||||||||||
Total Energy Equipment & Services | (1,633,453 | ) | ||||||||||||||
| Food Products – (2.2)% | ||||||||||||||||
| (14,931 | ) | ConAgra Foods, Inc. | (695,934 | ) | ||||||||||||
| (14,400 | ) | Pinnacle Foods Inc. | (729,360 | ) | ||||||||||||
| (4,300 | ) | Treehouse Foods Inc., (2) | (407,339 | ) | ||||||||||||
Total Food Products | (1,832,633 | ) | ||||||||||||||
| Gas Utilities – (0.8)% | ||||||||||||||||
| (8,700 | ) | Atmos Energy Corporation | (641,190 | ) | ||||||||||||
| Health Care Equipment & Supplies – (2.4)% | ||||||||||||||||
| (11,000 | ) | DENTSPLY SIRONA Inc. | (676,060 | ) | ||||||||||||
| (7,500 | ) | DexCom, Inc., (2) | (683,175 | ) | ||||||||||||
| (5,700 | ) | Edwards Lifesciences Corp., (2) | (656,412 | ) | ||||||||||||
Total Health Care Equipment & Supplies | (2,015,647 | ) | ||||||||||||||
| Health Care Providers & Services – (1.6)% | ||||||||||||||||
| (12,900 | ) | Acadia Healthcare Company Inc., (2) | (660,351 | ) | ||||||||||||
| (36,700 | ) | Brookdale Senior Living Inc., (2) | (631,607 | ) | ||||||||||||
Total Health Care Providers & Services | (1,291,958 | ) | ||||||||||||||
| Hotels, Restaurants & Leisure – (2.4)% | ||||||||||||||||
| (1,625 | ) | Chipotle Mexican Grill, (2) | (672,311 | ) | ||||||||||||
| (13,800 | ) | Choice Hotels International, Inc. | (669,162 | ) | ||||||||||||
| NUVEEN | 95 |
Nuveen Equity Long/Short Fund (continued)
| Portfolio of Investments | August 31, 2016 |
| Shares | Description (1) | Value | ||||||||||||||
| Hotels, Restaurants & Leisure (continued) | ||||||||||||||||
| (9,500 | ) | Royal Caribbean Cruises Limited | $ | (675,545 | ) | |||||||||||
Total Hotels, Restaurants & Leisure | (2,017,018 | ) | ||||||||||||||
| Household Durables – (3.3)% | ||||||||||||||||
| (18,000 | ) | CalAtlantic Group Inc. | (656,820 | ) | ||||||||||||
| (8,400 | ) | Harman International Industries Inc. | (711,396 | ) | ||||||||||||
| (15,200 | ) | Lennar Corporation, Class A | (718,960 | ) | ||||||||||||
| (12,300 | ) | Newell Brands Inc. | (652,884 | ) | ||||||||||||
Total Household Durables | (2,740,060 | ) | ||||||||||||||
| Insurance – (2.3)% | ||||||||||||||||
| (5,400 | ) | Ace Limited | (685,422 | ) | ||||||||||||
| (6,300 | ) | Arch Capital Group Limited, (2) | (509,922 | ) | ||||||||||||
| (13,800 | ) | Mercury General Corporation | (749,340 | ) | ||||||||||||
Total Insurance | (1,944,684 | ) | ||||||||||||||
| Internet & Catalog Retail – (2.0)% | ||||||||||||||||
| (4,500 | ) | Expedia, Inc. | (491,040 | ) | ||||||||||||
| (31,400 | ) | Liberty Interactive Corporation, Class A, (2) | (663,482 | ) | ||||||||||||
| (5,100 | ) | NetFlix.com Inc., (2) | (496,995 | ) | ||||||||||||
Total Internet & Catalog Retail | (1,651,517 | ) | ||||||||||||||
| Internet Software & Services – (2.3)% | ||||||||||||||||
| (47,500 | ) | Pandora Media, Inc., (2) | (665,000 | ) | ||||||||||||
| (32,900 | ) | Twitter Inc., (2) | (632,009 | ) | ||||||||||||
| (15,200 | ) | Yahoo! Inc., (2) | (649,800 | ) | ||||||||||||
Total Internet Software & Services | (1,946,809 | ) | ||||||||||||||
| Leisure Products – (0.8)% | ||||||||||||||||
| (20,400 | ) | Mattel, Inc. | (675,852 | ) | ||||||||||||
| Machinery – (1.6)% | ||||||||||||||||
| (5,200 | ) | Middleby Corporation, (2) | (666,380 | ) | ||||||||||||
| (13,200 | ) | Xylem Inc. | (671,352 | ) | ||||||||||||
Total Machinery | (1,337,732 | ) | ||||||||||||||
| Media – (1.5)% | ||||||||||||||||
| (2,200 | ) | Charter Communications, Inc., Class A, (2) | (565,862 | ) | ||||||||||||
| (32,300 | ) | Lions Gate Entertainment Corporation, Equity | (677,008 | ) | ||||||||||||
Total Media | (1,242,870 | ) | ||||||||||||||
| Metals & Mining – (1.7)% | ||||||||||||||||
| (9,700 | ) | Compass Minerals International, Inc. | (722,941 | ) | ||||||||||||
| (25,700 | ) | Southern Copper Corporation | (663,574 | ) | ||||||||||||
Total Metals & Mining | (1,386,515 | ) | ||||||||||||||
| 96 | NUVEEN |
| Shares | Description (1) | Value | ||||||||||||||
| Multi-Utilities – (1.7)% | ||||||||||||||||
| (9,600 | ) | Dominion Resources, Inc. | $ | (711,936 | ) | |||||||||||
| (11,100 | ) | WEC Energy Group, Inc. | (664,668 | ) | ||||||||||||
Total Multi-Utilities | (1,376,604 | ) | ||||||||||||||
| Oil, Gas & Consumable Fuels – (6.6)% | ||||||||||||||||
| (12,100 | ) | Anadarko Petroleum Corporation | (646,987 | ) | ||||||||||||
| (11,400 | ) | Cheniere Energy Inc., (2) | (489,060 | ) | ||||||||||||
| (4,800 | ) | Cimarex Energy Company | (634,464 | ) | ||||||||||||
| (11,200 | ) | Energen Corporation | (644,000 | ) | ||||||||||||
| (4,800 | ) | EOG Resources, Inc. | (424,752 | ) | ||||||||||||
| (6,300 | ) | Exxon Mobil Corporation | (548,982 | ) | ||||||||||||
| (19,000 | ) | Golar LNG, Limited | (395,770 | ) | ||||||||||||
| (29,000 | ) | Kinder Morgan, Inc. | (633,650 | ) | ||||||||||||
| (5,000 | ) | Phillips 66 | (392,250 | ) | ||||||||||||
| (16,800 | ) | Range Resources Corporation | (647,976 | ) | ||||||||||||
Total Oil, Gas & Consumable Fuels | (5,457,891 | ) | ||||||||||||||
| Pharmaceuticals – (0.8)% | ||||||||||||||||
| (2,700 | ) | Allergan PLC, (2) | (633,258 | ) | ||||||||||||
| Real Estate Investment Trust – (0.8)% | ||||||||||||||||
| (20,600 | ) | Weyerhaeuser Company | (656,110 | ) | ||||||||||||
| Road & Rail – (0.8)% | ||||||||||||||||
| (6,700 | ) | Kansas City Southern Industries | (648,024 | ) | ||||||||||||
| Semiconductors & Semiconductor Equipment – (2.3)% | ||||||||||||||||
| (3,800 | ) | Broadcom Limited | (670,396 | ) | ||||||||||||
| (10,400 | ) | Microchip Technology Incorporated | (643,864 | ) | ||||||||||||
| (59,000 | ) | SunPower Corporation, (2) | (587,640 | ) | ||||||||||||
Total Semiconductors & Semiconductor Equipment | (1,901,900 | ) | ||||||||||||||
| Software – (4.3)% | ||||||||||||||||
| (48,000 | ) | FireEye Inc., (2) | (689,280 | ) | ||||||||||||
| (5,800 | ) | Manhattan Associates Inc., (2) | (351,016 | ) | ||||||||||||
| (4,800 | ) | ServiceNow Inc., (2) | (348,816 | ) | ||||||||||||
| (5,400 | ) | Splunk Inc., (2) | (314,496 | ) | ||||||||||||
| (20,500 | ) | SS&C Technologies Holdings Inc. | (675,475 | ) | ||||||||||||
| (2,800 | ) | Ultimate Software Group, Inc., (2) | (585,032 | ) | ||||||||||||
| (215,000 | ) | Zynga Inc., Class A, (2) | (586,950 | ) | ||||||||||||
Total Software | (3,551,065 | ) | ||||||||||||||
| Specialty Retail – (2.4)% | ||||||||||||||||
| (11,900 | ) | CarMax, Inc., (2) | (701,505 | ) | ||||||||||||
| (7,700 | ) | Signet Jewelers Limited | (631,246 | ) | ||||||||||||
| NUVEEN | 97 |
Nuveen Equity Long/Short Fund (continued)
| Portfolio of Investments | August 31, 2016 |
| Shares | Description (1) | Value | ||||||||||||||
| Specialty Retail (continued) | ||||||||||||||||
| (9,800 | ) | Tiffany & Co. | $ | (699,426 | ) | |||||||||||
Total Specialty Retail | (2,032,177 | ) | ||||||||||||||
| Textiles, Apparel & Luxury Goods – (1.5)% | ||||||||||||||||
| (26,900 | ) | Skechers USA Inc., Class A, (2) | (653,939 | ) | ||||||||||||
| (15,800 | ) | Under Armour, Inc., Class A, (2) | (626,154 | ) | ||||||||||||
Total Textiles, Apparel & Luxury Goods | (1,280,093 | ) | ||||||||||||||
| Thrifts & Mortgage Finance – (0.8)% | ||||||||||||||||
| (45,500 | ) | New York Community Bancorp Inc. | (687,505 | ) | ||||||||||||
| Tobacco – (0.8)% | ||||||||||||||||
| (13,400 | ) | Reynolds American Inc. | (664,238 | ) | ||||||||||||
| Trading Companies & Distributors – (0.7)% | ||||||||||||||||
| (14,500 | ) | Fastenal Company | (625,095 | ) | ||||||||||||
| Water Utilities – (0.7)% | ||||||||||||||||
| (19,900 | ) | Aqua America Inc. | (605,159 | ) | ||||||||||||
Total Common Stocks Sold Short (proceeds $61,138,997) | (62,408,143 | ) | ||||||||||||||
Other Assets Less Liabilities – 15.9% | 13,182,317 | |||||||||||||||
Net Assets – 100% | $ | 83,151,657 | ||||||||||||||
For Fund portfolio compliance purposes, the Fund’s industry classifications refer to any one or more of the industry sub-classifications used by one or more widely recognized market indexes or ratings group indexes, and/or as defined by Fund management. This definition may not apply for purposes of this report, which may combine industry sub-classifications into sectors for reporting ease.
| (1) | All percentages shown in the Portfolio of Investments are based on net assets. |
| (2) | Non-income producing; issuer has not declared a dividend within the past twelve months. |
| (3) | The Fund may pledge up to 100% of its eligible long-term investments in the Portfolio of Investments as collateral for Common Stocks Sold Short. As of the end of the reporting period, long-term investments with a value of $79,761,790 have been pledged as collateral for Common Stocks Sold Short. |
See accompanying notes to financial statements.
| 98 | NUVEEN |
Nuveen Equity Market Neutral Fund
| Portfolio of Investments | August 31, 2016 |
| Shares | Description (1) | Value | ||||||||||||||
LONG-TERM INVESTMENTS – 112.8% | ||||||||||||||||
COMMON STOCKS – 112.8% | ||||||||||||||||
| Aerospace & Defense – 2.2% | ||||||||||||||||
| 5,200 | Boeing Company | $ | 673,140 | |||||||||||||
| 4,200 | Huntington Ingalls Industries Inc. | 693,714 | ||||||||||||||
Total Aerospace & Defense | 1,366,854 | |||||||||||||||
| Air Freight & Logistics – 0.9% | ||||||||||||||||
| 11,500 | Expeditors International of Washington, Inc. | 582,475 | ||||||||||||||
| Airlines – 3.2% | ||||||||||||||||
| 10,100 | Alaska Air Group, Inc. | 682,053 | ||||||||||||||
| 19,100 | Delta Air Lines, Inc. | 701,925 | ||||||||||||||
| 16,100 | Southwest Airlines Co. | 593,768 | ||||||||||||||
Total Airlines | 1,977,746 | |||||||||||||||
| Auto Components – 2.1% | ||||||||||||||||
| 5,000 | Lear Corporation | 581,450 | ||||||||||||||
| 9,900 | Visteon Corporation, (2) | 699,930 | ||||||||||||||
Total Auto Components | 1,281,380 | |||||||||||||||
| Automobiles – 2.3% | ||||||||||||||||
| 56,700 | Ford Motor Company | 714,420 | ||||||||||||||
| 22,000 | General Motors Company | 702,240 | ||||||||||||||
Total Automobiles | 1,416,660 | |||||||||||||||
| Banks – 1.3% | ||||||||||||||||
| 1,200 | JPMorgan Chase & Co. | 81,000 | ||||||||||||||
| 18,500 | Popular Inc. | 727,235 | ||||||||||||||
Total Banks | 808,235 | |||||||||||||||
| Biotechnology – 4.2% | ||||||||||||||||
| 8,300 | AbbVie Inc. | 532,030 | ||||||||||||||
| 4,000 | Amgen Inc. | 680,240 | ||||||||||||||
| 2,200 | Biogen Inc., (2) | 672,386 | ||||||||||||||
| 9,000 | Gilead Sciences Inc. | 705,420 | ||||||||||||||
Total Biotechnology | 2,590,076 | |||||||||||||||
| Building Products – 2.3% | ||||||||||||||||
| 12,700 | Owens Corning | 697,484 | ||||||||||||||
| 25,100 | USG Corporation, (2) | 688,493 | ||||||||||||||
Total Building Products | 1,385,977 | |||||||||||||||
Capital Markets – 2.6% | ||||||||||||||||
| 500 | Bank New York Mellon | 20,835 | ||||||||||||||
| NUVEEN | 99 |
Nuveen Equity Market Neutral Fund (continued)
| Portfolio of Investments | August 31, 2016 |
| Shares | Description (1) | Value | ||||||||||||||
| Capital Markets (continued) | ||||||||||||||||
| 1,600 | CME Group, Inc. | $ | 173,360 | |||||||||||||
| 9,800 | NASDAQ Stock Market, Inc. | 697,858 | ||||||||||||||
| 12,500 | Raymond James Financial Inc. | 727,125 | ||||||||||||||
Total Capital Markets | 1,619,178 | |||||||||||||||
| Chemicals – 1.1% | ||||||||||||||||
| 14,100 | Cabot Corporation | 703,026 | ||||||||||||||
| Communications Equipment – 3.3% | ||||||||||||||||
| 68,800 | Brocade Communications Systems Inc. | 617,824 | ||||||||||||||
| 22,100 | Cisco Systems, Inc. | 694,824 | ||||||||||||||
| 5,700 | F5 Networks, Inc., (2) | 699,561 | ||||||||||||||
Total Communications Equipment | 2,012,209 | |||||||||||||||
| Construction & Engineering – 3.9% | ||||||||||||||||
| 21,700 | AECOM, (2) | 669,011 | ||||||||||||||
| 11,600 | Chicago Bridge & Iron Company N.V. | 345,448 | ||||||||||||||
| 13,000 | Jacobs Engineering Group, Inc., (2) | 684,970 | ||||||||||||||
| 5,200 | Valmont Industries, Inc. | 678,444 | ||||||||||||||
Total Construction & Engineering | 2,377,873 | |||||||||||||||
| Consumer Finance – 1.9% | ||||||||||||||||
| 12,100 | Discover Financial Services | 726,000 | ||||||||||||||
| 56,600 | SLM Corporation | 419,689 | ||||||||||||||
Total Consumer Finance | 1,145,689 | |||||||||||||||
| Containers & Packaging – 1.1% | ||||||||||||||||
| 15,200 | Berry Plastics Corporation, (2) | 689,928 | ||||||||||||||
| Diversified Telecommunication Services – 1.6% | ||||||||||||||||
| 24,400 | CenturyLink Inc. | 678,320 | ||||||||||||||
| 32,300 | Windstream Holdings Inc. | 274,873 | ||||||||||||||
Total Diversified Telecommunication Services | 953,193 | |||||||||||||||
| Electrical Equipment – 1.2% | ||||||||||||||||
| 4,500 | Regal-Beloit Corporation | 275,985 | ||||||||||||||
| 3,800 | Rockwell Automation, Inc. | 440,534 | ||||||||||||||
Total Electrical Equipment | 716,519 | |||||||||||||||
| Electronic Equipment, Instruments & Components – 4.4% | ||||||||||||||||
| 10,600 | Arrow Electronics, Inc., (2) | 697,798 | ||||||||||||||
| 20,900 | Ingram Micro, Inc., Class A | 730,664 | ||||||||||||||
| 34,400 | Jabil Circuit Inc. | 728,936 | ||||||||||||||
| 36,400 | Vishay Intertechnology Inc. | 515,424 | ||||||||||||||
Total Electronic Equipment, Instruments & Components | 2,672,822 | |||||||||||||||
| 100 | NUVEEN |
| Shares | Description (1) | Value | ||||||||||||||
| Energy Equipment & Services – 1.2% | ||||||||||||||||
| 10,100 | Ensco PLC | $ | 76,659 | |||||||||||||
| 69,400 | Transocean Inc. | 673,180 | ||||||||||||||
Total Energy Equipment & Services | 749,839 | |||||||||||||||
| Food & Staples Retailing – 3.4% | ||||||||||||||||
| 13,400 | Sysco Corporation | 694,924 | ||||||||||||||
| 8,500 | Walgreens Boots Alliance Inc. | 686,035 | ||||||||||||||
| 9,800 | Wal-Mart Stores, Inc. | 700,112 | ||||||||||||||
Total Food & Staples Retailing | 2,081,071 | |||||||||||||||
| Food Products – 4.4% | ||||||||||||||||
| 6,200 | Hershey Foods Corporation | 619,318 | ||||||||||||||
| 5,000 | JM Smucker Company | 708,950 | ||||||||||||||
| 29,300 | Pilgrim’s Pride Corporation, (2) | 676,244 | ||||||||||||||
| 9,300 | Tyson Foods, Inc., Class A | 702,801 | ||||||||||||||
Total Food Products | 2,707,313 | |||||||||||||||
| Health Care Providers & Services – 6.9% | ||||||||||||||||
| 5,800 | Aetna Inc. | 679,296 | ||||||||||||||
| 8,100 | AmerisourceBergen Corporation | 704,457 | ||||||||||||||
| 3,000 | Anthem Inc. | 375,240 | ||||||||||||||
| 5,000 | Cardinal Health, Inc. | 398,350 | ||||||||||||||
| 9,600 | Express Scripts, Holding Company, (2) | 697,920 | ||||||||||||||
| 3,800 | McKesson HBOC Inc. | 701,556 | ||||||||||||||
| 5,800 | Wellcare Health Plans Inc., (2) | 653,660 | ||||||||||||||
Total Health Care Providers & Services | 4,210,479 | |||||||||||||||
| Health Care Technology – 1.1% | ||||||||||||||||
| 53,800 | Allscripts Healthcare Solutions Inc., (2) | 694,558 | ||||||||||||||
| Hotels, Restaurants & Leisure – 7.2% | ||||||||||||||||
| 13,100 | Brinker International Inc. | 703,601 | ||||||||||||||
| 4,700 | Dominos Pizza Inc. | 702,979 | ||||||||||||||
| 14,400 | Dunkin Brands Group Inc. | 704,880 | ||||||||||||||
| 3,700 | Hyatt Hotels Corporation, Class A, (2) | 197,876 | ||||||||||||||
| 6,000 | McDonald’s Corporation | 693,960 | ||||||||||||||
| 3,200 | Panera Bread Company, (2) | 694,880 | ||||||||||||||
| 7,800 | YUM! Brands, Inc. | 707,538 | ||||||||||||||
Total Hotels, Restaurants & Leisure | 4,405,714 | |||||||||||||||
| Household Durables – 1.1% | ||||||||||||||||
| 3,900 | Whirlpool Corporation | 696,696 | ||||||||||||||
| Industrial Conglomerates – 0.3% | ||||||||||||||||
| 1,700 | Carlisle Companies Inc. | 178,262 | ||||||||||||||
| NUVEEN | 101 |
Nuveen Equity Market Neutral Fund (continued)
| Portfolio of Investments | August 31, 2016 |
| Shares | Description (1) | Value | ||||||||||||||
| Insurance – 1.5% | ||||||||||||||||
| 3,100 | AFLAC Incorporated | $ | 229,958 | |||||||||||||
| 25,700 | Assured Guaranty Limited | 713,689 | ||||||||||||||
Total Insurance | 943,647 | |||||||||||||||
| IT Services – 1.8% | ||||||||||||||||
| 7,300 | MasterCard, Inc. | 705,399 | ||||||||||||||
| 39,200 | Xerox Corporation | 386,120 | ||||||||||||||
Total IT Services | 1,091,519 | |||||||||||||||
| Life Sciences Tools & Services – 1.1% | ||||||||||||||||
| 9,000 | Quintiles Transnational Corporation, (2) | 695,700 | ||||||||||||||
| Machinery – 2.6% | ||||||||||||||||
| 25,100 | Allision Transmission Holdings Inc. | 696,274 | ||||||||||||||
| 25,500 | Joy Global Inc. | 695,640 | ||||||||||||||
| 2,700 | Wabtec Corporation | 206,847 | ||||||||||||||
Total Machinery | 1,598,761 | |||||||||||||||
| Media – 6.1% | ||||||||||||||||
| 13,300 | CBS Corporation, Class B | 678,699 | ||||||||||||||
| 27,100 | Discovery Communications Inc., Class A, (2) | 691,321 | ||||||||||||||
| 55,100 | Gannett Company, Inc. | 657,343 | ||||||||||||||
| 14,000 | Interpublic Group of Companies, Inc. | 323,960 | ||||||||||||||
| 32,100 | Regal Entertainment Group, Class A | 686,298 | ||||||||||||||
| 10,900 | Scripps Networks Interactive, Class A | 690,733 | ||||||||||||||
Total Media | 3,728,354 | |||||||||||||||
| Metals & Mining – 3.3% | ||||||||||||||||
| 13,900 | Nucor Corporation | 674,289 | ||||||||||||||
| 9,500 | Reliance Steel & Aluminum Company | 684,760 | ||||||||||||||
| 28,000 | Steel Dynamics Inc. | 689,360 | ||||||||||||||
Total Metals & Mining | 2,048,409 | |||||||||||||||
| Multiline Retail – 3.4% | ||||||||||||||||
| 9,300 | Big Lots, Inc. | 458,676 | ||||||||||||||
| 9,200 | Dollar General Corporation | 675,372 | ||||||||||||||
| 6,500 | Kohl’s Corporation | 288,470 | ||||||||||||||
| 9,700 | Target Corporation | 680,843 | ||||||||||||||
Total Multiline Retail | 2,103,361 | |||||||||||||||
| Oil, Gas & Consumable Fuels – 5.8% | ||||||||||||||||
| 9,500 | Antero Resources Corporation, (2) | 242,820 | ||||||||||||||
| 19,300 | SM Energy Company | 731,084 | ||||||||||||||
| 72,400 | Teekay Shipping Corporation | 523,452 | ||||||||||||||
| 9,500 | Tesoro Corporation | 716,490 | ||||||||||||||
| 102 | NUVEEN |
| Shares | Description (1) | Value | ||||||||||||||
| Oil, Gas & Consumable Fuels (continued) | ||||||||||||||||
| 85,300 | Whiting Petroleum Corporation, (2) | $ | 621,837 | |||||||||||||
| 15,600 | World Fuel Services Corporation | 695,448 | ||||||||||||||
Total Oil, Gas & Consumable Fuels | 3,531,131 | |||||||||||||||
| Personal Products – 2.2% | ||||||||||||||||
| 11,000 | Herbalife, Limited | 668,250 | ||||||||||||||
| 12,000 | Nu Skin Enterprises Inc., Class A | 694,560 | ||||||||||||||
Total Personal Products | 1,362,810 | |||||||||||||||
| Professional Services – 1.2% | ||||||||||||||||
| 10,000 | Manpower Inc. | 714,600 | ||||||||||||||
| Semiconductors & Semiconductor Equipment – 3.4% | ||||||||||||||||
| 62,800 | ON Semiconductor Corporation, (2) | 678,240 | ||||||||||||||
| 11,200 | QUALCOMM, Inc. | 706,384 | ||||||||||||||
| 33,600 | Teradyne Inc. | 707,616 | ||||||||||||||
Total Semiconductors & Semiconductor Equipment | 2,092,240 | |||||||||||||||
| Software – 2.3% | ||||||||||||||||
| 8,000 | Citrix Systems, (2) | 697,600 | ||||||||||||||
| 12,000 | Synopsys Inc., (2) | 711,480 | ||||||||||||||
Total Software | 1,409,080 | |||||||||||||||
| Specialty Retail – 5.6% | ||||||||||||||||
| 18,000 | Best Buy Co., Inc. | 692,640 | ||||||||||||||
| 26,100 | Gap, Inc. | 649,107 | ||||||||||||||
| 5,100 | Home Depot, Inc. | 684,012 | ||||||||||||||
| 9,100 | Lowe’s Companies, Inc. | 696,696 | ||||||||||||||
| 19,200 | Urban Outfitters, Inc., (2) | 688,320 | ||||||||||||||
Total Specialty Retail | 3,410,775 | |||||||||||||||
| Technology Hardware, Storage & Peripherals – 3.4% | ||||||||||||||||
| 6,500 | Apple, Inc. | 689,650 | ||||||||||||||
| 48,800 | HP Inc. | 701,256 | ||||||||||||||
| 20,900 | NCR Corporation, (2) | 707,465 | ||||||||||||||
Total Technology Hardware, Storage & Peripherals | 2,098,371 | |||||||||||||||
| Trading Companies & Distributors – 1.6% | ||||||||||||||||
| 3,600 | MSC Industrial Direct Inc., Class A | 262,944 | ||||||||||||||
| 11,800 | WESCO International Inc., (2) | 733,488 | ||||||||||||||
Total Trading Companies & Distributors | 996,432 | |||||||||||||||
| Wireless Telecommunication Services – 2.3% | ||||||||||||||||
| 26,500 | Telephone and Data Systems Inc. | 738,555 | ||||||||||||||
| 15,200 | T-Mobile US Inc., (2) | 704,368 | ||||||||||||||
Total Wireless Telecommunication Services | 1,442,923 | |||||||||||||||
Total Long-Term Investments (cost $64,074,085) | 69,291,885 | |||||||||||||||
| NUVEEN | 103 |
Nuveen Equity Market Neutral Fund (continued)
| Portfolio of Investments | August 31, 2016 |
| Principal Amount (000) | Description (1) | Coupon | Maturity | Value | ||||||||||||
SHORT-TERM INVESTMENTS – 4.8% | ||||||||||||||||
REPURCHASE AGREEMENTS – 4.8% | ||||||||||||||||
| $ | 2,919 | Repurchase Agreement with Fixed Income Clearing Corporation, dated 8/31/16 repurchase price $2,918,658, collateralized by $2,805,000 U.S. Treasury Notes, 2.250%, due 11/15/25, value $2,980,313 | 0.030% | 9/01/16 | $ | 2,918,656 | ||||||||||
Total Short-Term Investments (cost $2,918,656) | 2,918,656 | |||||||||||||||
Total Investments (cost $66,992,741) – 117.6% | 72,210,541 | |||||||||||||||
| Shares | Description (1) | Value | ||||||||||||||
COMMON STOCKS SOLD SHORT – (92.6)% (3) | ||||||||||||||||
| Aerospace & Defense – (1.9)% | ||||||||||||||||
| (3,800 | ) | General Dynamics Corporation | $ | (578,436 | ) | |||||||||||
| (12,900 | ) | Hexcel Corporation | (578,565 | ) | ||||||||||||
Total Aerospace & Defense | (1,157,001 | ) | ||||||||||||||
| Automobiles – (0.9)% | ||||||||||||||||
| (2,600 | ) | Tesla Motors Inc., (2) | (551,226 | ) | ||||||||||||
| Beverages – (1.9)% | ||||||||||||||||
| (5,800 | ) | Molson Coors Brewing Company, Class B | (593,456 | ) | ||||||||||||
| (3,800 | ) | Monster Beverage Corporation, (2) | (584,782 | ) | ||||||||||||
Total Beverages | (1,178,238 | ) | ||||||||||||||
| Biotechnology – (1.5)% | ||||||||||||||||
| (3,500 | ) | Intercept Pharmaceuticals Incorporated, (2) | (519,085 | ) | ||||||||||||
| (45,100 | ) | Opko Health Inc., (2) | (410,410 | ) | ||||||||||||
Total Biotechnology | (929,495 | ) | ||||||||||||||
| Building Products – (0.9)% | ||||||||||||||||
| (13,200 | ) | Armstrong World Industries Inc., (2) | (573,804 | ) | ||||||||||||
| Capital Markets – (0.9)% | ||||||||||||||||
| (21,800 | ) | Artisan Partners Asset Management Inc. | (570,070 | ) | ||||||||||||
| Chemicals – (3.8)% | ||||||||||||||||
| (8,300 | ) | E.I. Du Pont de Nemours and Company | (577,680 | ) | ||||||||||||
| (1,300 | ) | NewMarket Corporation | (564,135 | ) | ||||||||||||
| (4,800 | ) | Praxair, Inc. | (585,792 | ) | ||||||||||||
| (7,100 | ) | Scotts Miracle Gro Company | (587,880 | ) | ||||||||||||
Total Chemicals | (2,315,487 | ) | ||||||||||||||
| Commercial Services & Supplies – (1.8)% | ||||||||||||||||
| (11,500 | ) | Johnson Controls International PLC | (502,320 | ) | ||||||||||||
| (20,400 | ) | Rollins Inc. | (581,400 | ) | ||||||||||||
Total Commercial Services & Supplies | (1,083,720 | ) | ||||||||||||||
| 104 | NUVEEN |
| Shares | Description (1) | Value | ||||||||||||||
| Communications Equipment – (1.0)% | ||||||||||||||||
| (6,400 | ) | Harris Corporation | $ | (595,072 | ) | |||||||||||
| Consumer Finance – (1.0)% | ||||||||||||||||
| (19,800 | ) | OneMain Holdings Inc., (2) | (613,998 | ) | ||||||||||||
| Containers & Packaging – (2.8)% | ||||||||||||||||
| (7,300 | ) | AptarGroup Inc. | (569,254 | ) | ||||||||||||
| (7,200 | ) | Ball Corporation | (570,168 | ) | ||||||||||||
| (12,100 | ) | Sealed Air Corporation | (570,273 | ) | ||||||||||||
Total Containers & Packaging | (1,709,695 | ) | ||||||||||||||
| Electric Utilities – (5.3)% | ||||||||||||||||
| (14,900 | ) | Alliant Energy Corporation | (565,455 | ) | ||||||||||||
| (11,500 | ) | Eversource Energy | (620,655 | ) | ||||||||||||
| (9,000 | ) | PG&E Corporation | (557,460 | ) | ||||||||||||
| (9,000 | ) | PPL Corporation | (313,020 | ) | ||||||||||||
| (11,100 | ) | Southern Company | (569,763 | ) | ||||||||||||
| (11,300 | ) | Westar Energy Inc. | (620,822 | ) | ||||||||||||
Total Electric Utilities | (3,247,175 | ) | ||||||||||||||
| Electrical Equipment – (1.1)% | ||||||||||||||||
| (2,100 | ) | Acuity Brands Inc. | (577,752 | ) | ||||||||||||
| (6,000 | ) | Solarcity Corporation, (2) | (123,960 | ) | ||||||||||||
Total Electrical Equipment | (701,712 | ) | ||||||||||||||
| Electronic Equipment, Instruments & Components – (2.4)% | ||||||||||||||||
| (20,500 | ) | National Instruments Corporation | (572,770 | ) | ||||||||||||
| (15,600 | ) | VeriFone Holdings Inc., (2) | (309,816 | ) | ||||||||||||
| (8,500 | ) | Zebra Technologies Corporation, Class A, (2) | (594,660 | ) | ||||||||||||
Total Electronic Equipment, Instruments & Components | (1,477,246 | ) | ||||||||||||||
| Energy Equipment & Services – (2.8)% | ||||||||||||||||
| (13,000 | ) | Halliburton Company | (559,130 | ) | ||||||||||||
| (7,100 | ) | Schlumberger Limited | (560,900 | ) | ||||||||||||
| (104,700 | ) | Weatherford International PLC, (2) | (572,709 | ) | ||||||||||||
Total Energy Equipment & Services | (1,692,739 | ) | ||||||||||||||
| Food Products – (1.8)% | ||||||||||||||||
| (11,300 | ) | ConAgra Foods, Inc. | (526,693 | ) | ||||||||||||
| (11,300 | ) | Pinnacle Foods Inc. | (572,345 | ) | ||||||||||||
Total Food Products | (1,099,038 | ) | ||||||||||||||
| Gas Utilities – (0.9)% | ||||||||||||||||
| (7,700 | ) | Atmos Energy Corporation | (567,490 | ) | ||||||||||||
| Health Care Equipment & Supplies – (2.9)% | ||||||||||||||||
| (9,700 | ) | DENTSPLY SIRONA Inc. | (596,162 | ) | ||||||||||||
| NUVEEN | 105 |
Nuveen Equity Market Neutral Fund (continued)
| Portfolio of Investments | August 31, 2016 |
| Shares | Description (1) | Value | ||||||||||||||
| Health Care Equipment & Supplies (continued) | ||||||||||||||||
| (6,400 | ) | DexCom, Inc., (2) | $ | (582,976 | ) | |||||||||||
| (5,000 | ) | Edwards Lifesciences Corp., (2) | (575,800 | ) | ||||||||||||
Total Health Care Equipment & Supplies | (1,754,938 | ) | ||||||||||||||
| Health Care Providers & Services – (1.9)% | ||||||||||||||||
| (11,300 | ) | Acadia Healthcare Company Inc., (2) | (578,447 | ) | ||||||||||||
| (33,300 | ) | Brookdale Senior Living Inc., (2) | (573,093 | ) | ||||||||||||
Total Health Care Providers & Services | (1,151,540 | ) | ||||||||||||||
| Hotels, Restaurants & Leisure – (2.9)% | ||||||||||||||||
| (1,500 | ) | Chipotle Mexican Grill, (2) | (620,595 | ) | ||||||||||||
| (11,800 | ) | Choice Hotels International, Inc. | (572,182 | ) | ||||||||||||
| (8,300 | ) | Royal Caribbean Cruises Limited | (590,213 | ) | ||||||||||||
Total Hotels, Restaurants & Leisure | (1,782,990 | ) | ||||||||||||||
| Household Durables – (4.5)% | ||||||||||||||||
| (16,200 | ) | CalAtlantic Group Inc. | (591,138 | ) | ||||||||||||
| (4,600 | ) | Harman International Industries Inc. | (389,574 | ) | ||||||||||||
| (12,500 | ) | Lennar Corporation, Class A | (591,250 | ) | ||||||||||||
| (2,800 | ) | Mohawk Industries Inc., (2) | (595,784 | ) | ||||||||||||
| (10,800 | ) | Newell Brands Inc. | (573,264 | ) | ||||||||||||
Total Household Durables | (2,741,010 | ) | ||||||||||||||
| Insurance – (2.5)% | ||||||||||||||||
| (4,500 | ) | Ace Limited | (571,185 | ) | ||||||||||||
| (4,500 | ) | Arch Capital Group Limited, (2) | (364,230 | ) | ||||||||||||
| (11,100 | ) | Mercury General Corporation | (602,730 | ) | ||||||||||||
Total Insurance | (1,538,145 | ) | ||||||||||||||
| Internet & Catalog Retail – (2.4)% | ||||||||||||||||
| (19,800 | ) | Liberty Interactive Corporation, Class A, (2) | (418,374 | ) | ||||||||||||
| (15,100 | ) | Liberty Ventures, (2) | (581,954 | ) | ||||||||||||
| (4,700 | ) | NetFlix.com Inc., (2) | (458,015 | ) | ||||||||||||
Total Internet & Catalog Retail | (1,458,343 | ) | ||||||||||||||
| Internet Software & Services – (3.8)% | ||||||||||||||||
| (3,000 | ) | LinkedIn Corporation, Class A, (2) | (578,250 | ) | ||||||||||||
| (42,600 | ) | Pandora Media, Inc., (2) | (596,400 | ) | ||||||||||||
| (31,400 | ) | Twitter Inc., (2) | (603,194 | ) | ||||||||||||
| (13,400 | ) | Yahoo! Inc., (2) | (572,850 | ) | ||||||||||||
Total Internet Software & Services | (2,350,694 | ) | ||||||||||||||
| Leisure Products – (0.9)% | ||||||||||||||||
| (17,400 | ) | Mattel, Inc. | (576,462 | ) | ||||||||||||
| 106 | NUVEEN |
| Shares | Description (1) | Value | ||||||||||||||
| Machinery – (1.4)% | ||||||||||||||||
| (2,200 | ) | Middleby Corporation, (2) | $ | (281,930 | ) | |||||||||||
| (11,500 | ) | Xylem Inc. | (584,890 | ) | ||||||||||||
Total Machinery | (866,820 | ) | ||||||||||||||
| Media – (1.9)% | ||||||||||||||||
| (2,300 | ) | Charter Communications, Inc., Class A, (2) | (591,583 | ) | ||||||||||||
| (27,100 | ) | Lions Gate Entertainment Corporation, Equity | (568,016 | ) | ||||||||||||
Total Media | (1,159,599 | ) | ||||||||||||||
| Metals & Mining – (1.9)% | ||||||||||||||||
| (7,900 | ) | Compass Minerals International, Inc. | (588,787 | ) | ||||||||||||
| (22,200 | ) | Southern Copper Corporation | (573,204 | ) | ||||||||||||
Total Metals & Mining | (1,161,991 | ) | ||||||||||||||
| Multi-Utilities – (1.8)% | ||||||||||||||||
| (7,600 | ) | Dominion Resources, Inc. | (563,616 | ) | ||||||||||||
| (9,400 | ) | WEC Energy Group, Inc. | (562,872 | ) | ||||||||||||
Total Multi-Utilities | (1,126,488 | ) | ||||||||||||||
| Oil, Gas & Consumable Fuels – (10.7)% | ||||||||||||||||
| (10,700 | ) | Anadarko Petroleum Corporation | (572,129 | ) | ||||||||||||
| (5,000 | ) | Apache Corporation | (248,500 | ) | ||||||||||||
| (13,200 | ) | Cheniere Energy Inc., (2) | (566,280 | ) | ||||||||||||
| (4,400 | ) | Cimarex Energy Company | (581,592 | ) | ||||||||||||
| (7,000 | ) | ConocoPhillips | (287,350 | ) | ||||||||||||
| (13,200 | ) | Devon Energy Corporation | (571,956 | ) | ||||||||||||
| (10,600 | ) | Energen Corporation | (609,500 | ) | ||||||||||||
| (6,400 | ) | EOG Resources, Inc. | (566,336 | ) | ||||||||||||
| (5,500 | ) | Exxon Mobil Corporation | (479,270 | ) | ||||||||||||
| (7,900 | ) | Golar LNG, Limited | (164,557 | ) | ||||||||||||
| (15,400 | ) | Kinder Morgan, Inc. | (336,490 | ) | ||||||||||||
| (7,600 | ) | Occidental Petroleum Corporation | (584,060 | ) | ||||||||||||
| (2,400 | ) | Pioneer Natural Resources Company | (429,720 | ) | ||||||||||||
| (14,100 | ) | Range Resources Corporation | (543,837 | ) | ||||||||||||
Total Oil, Gas & Consumable Fuels | (6,541,577 | ) | ||||||||||||||
| Pharmaceuticals – (0.6)% | ||||||||||||||||
| (1,500 | ) | Allergan PLC, (2) | (351,810 | ) | ||||||||||||
| Real Estate Investment Trust – (1.0)% | ||||||||||||||||
| (18,700 | ) | Weyerhaeuser Company | (595,595 | ) | ||||||||||||
| Real Estate Management & Development – (0.9)% | ||||||||||||||||
| (4,800 | ) | Jones Lang LaSalle Inc. | (560,400 | ) | ||||||||||||
| NUVEEN | 107 |
Nuveen Equity Market Neutral Fund (continued)
| Portfolio of Investments | August 31, 2016 |
| Shares | Description (1) | Value | ||||||||||||||
| Road & Rail – (1.5)% | ||||||||||||||||
| (3,800 | ) | Kansas City Southern Industries | $ | (367,536 | ) | |||||||||||
| (6,000 | ) | Union Pacific Corporation | (573,180 | ) | ||||||||||||
Total Road & Rail | (940,716 | ) | ||||||||||||||
| Semiconductors & Semiconductor Equipment – (2.6)% | ||||||||||||||||
| (3,300 | ) | Broadcom Limited | (582,186 | ) | ||||||||||||
| (9,300 | ) | Microchip Technology Incorporated | (575,763 | ) | ||||||||||||
| (46,100 | ) | SunPower Corporation, (2) | (459,156 | ) | ||||||||||||
Total Semiconductors & Semiconductor Equipment | (1,617,105 | ) | ||||||||||||||
| Software – (5.7)% | ||||||||||||||||
| (38,200 | ) | FireEye Inc., (2) | (548,552 | ) | ||||||||||||
| (5,200 | ) | NetSuite Inc., (2) | (566,280 | ) | ||||||||||||
| (8,200 | ) | ServiceNow Inc., (2) | (595,894 | ) | ||||||||||||
| (8,200 | ) | Splunk Inc., (2) | (477,568 | ) | ||||||||||||
| (18,400 | ) | SS&C Technologies Holdings Inc. | (606,280 | ) | ||||||||||||
| (6,300 | ) | Tableau Software Inc., Class A, (2) | (365,589 | ) | ||||||||||||
| (125,500 | ) | Zynga Inc., (2) | (342,615 | ) | ||||||||||||
Total Software | (3,502,778 | ) | ||||||||||||||
| Specialty Retail – (2.9)% | ||||||||||||||||
| (9,900 | ) | CarMax, Inc., (2) | (583,605 | ) | ||||||||||||
| (7,100 | ) | Signet Jewelers Limited | (582,058 | ) | ||||||||||||
| (8,600 | ) | Tiffany & Co. | (613,782 | ) | ||||||||||||
Total Specialty Retail | (1,779,445 | ) | ||||||||||||||
| Technology Hardware, Storage & Peripherals – (0.4)% | ||||||||||||||||
| (10,300 | ) | Stratasys, Inc., (2) | (219,802 | ) | ||||||||||||
| Textiles, Apparel & Luxury Goods – (1.4)% | ||||||||||||||||
| (13,800 | ) | Skechers USA Inc., (2) | (335,478 | ) | ||||||||||||
| (13,600 | ) | Under Armour, Inc., (2) | (538,968 | ) | ||||||||||||
Total Textiles, Apparel & Luxury Goods | (874,446 | ) | ||||||||||||||
| Thrifts & Mortgage Finance – (1.0)% | ||||||||||||||||
| (40,700 | ) | New York Community Bancorp Inc. | (614,977 | ) | ||||||||||||
| Tobacco – (0.9)% | ||||||||||||||||
| (11,500 | ) | Reynolds American Inc. | (570,055 | ) | ||||||||||||
| Trading Companies & Distributors – (0.6)% | ||||||||||||||||
| (8,800 | ) | Fastenal Company | (379,368 | ) | ||||||||||||
| 108 | NUVEEN |
| Shares | Description (1) | Value | ||||||||||||||
| Water Utilities – (0.9)% | ||||||||||||||||
| (18,700 | ) | Aqua America Inc. | $ | (568,667 | ) | |||||||||||
Total Common Stocks Sold Short (proceeds $58,907,658) | (56,848,967 | ) | ||||||||||||||
Other Assets Less Liabilities – 75.0% | 46,027,219 | |||||||||||||||
Net Assets – 100% | $ | 61,388,793 | ||||||||||||||
For Fund portfolio compliance purposes, the Fund’s industry classifications refer to any one or more of the industry sub-classifications used by one or more widely recognized market indexes or ratings group indexes, and/or as defined by Fund management. This definition may not apply for purposes of this report, which may combine industry sub-classifications into sectors for reporting ease.
| (1) | All percentages shown in the Portfolio of Investments are based on net assets. |
| (2) | Non-income producing; issuer has not declared a dividend within the past twelve months. |
| (3) | The Fund may pledge up to 100% of its eligible long-term investments in the Portfolio of Investments as collateral for Common Stocks Sold Short. As of the end of the reporting period, long-term investments with a value of $35,100,654 have been pledged as collateral for Common Stocks Sold Short. |
See accompanying notes to financial statements.
| NUVEEN | 109 |
| Assets and Liabilities | August 31, 2016 |
| Large Cap Value | �� | Large Cap Core | Large Cap Growth | Concentrated Core | Core Dividend | |||||||||||||||
Assets | ||||||||||||||||||||
Long-term investments, at value ($362,220,024, $239,135,703, $67,021,397, $97,604,579 and $41,286,244, respectively) | $ | 386,875,070 | $ | 254,615,820 | $ | 70,765,816 | $ | 98,004,187 | $ | 42,551,155 | ||||||||||
Short-term investments, at value (cost approximates value) | 236,805 | — | — | 100,206 | — | |||||||||||||||
Cash | — | — | — | — | — | |||||||||||||||
Cash collateral at brokers(1) | — | — | — | — | — | |||||||||||||||
Receivable for: | ||||||||||||||||||||
Dividends | 926,888 | 513,473 | 132,152 | 277,378 | 111,319 | |||||||||||||||
Investments sold | 1,770,063 | 2,981,192 | 879,200 | — | 419,632 | |||||||||||||||
Shares sold | 496,302 | 405,455 | 22,714 | 94,533 | 30,371 | |||||||||||||||
Other assets | 134,272 | 27,889 | 25,361 | 27,112 | 22,969 | |||||||||||||||
Total assets | 390,439,400 | 258,543,829 | 71,825,243 | 98,503,416 | 43,135,446 | |||||||||||||||
Liabilities | ||||||||||||||||||||
Cash overdraft | — | 185,769 | 230,758 | — | 123,319 | |||||||||||||||
Cash collateral due to brokers | — | — | — | — | — | |||||||||||||||
Common stocks sold short, at value (proceeds $ —, $ —, $ —, $ — and $ —, respectively) | — | — | — | — | — | |||||||||||||||
Payable for: | ||||||||||||||||||||
Dividends on common stocks sold short | — | — | — | — | — | |||||||||||||||
Investments purchased | 1,577,919 | 2,940,078 | 364,263 | — | 272,157 | |||||||||||||||
Shares redeemed | 281,752 | 344,805 | 154,843 | 444,604 | 109,334 | |||||||||||||||
Accrued expenses: | ||||||||||||||||||||
Management fees | 213,119 | 130,698 | 34,464 | 49,241 | 15,988 | |||||||||||||||
Trustees fees | 98,322 | 963 | 296 | 428 | 163 | |||||||||||||||
12b-1 distribution and service fees | 74,606 | 51,204 | 10,916 | 30,132 | 10,282 | |||||||||||||||
Other | 147,007 | 102,244 | 59,552 | 78,631 | 43,185 | |||||||||||||||
Total liabilities | 2,392,725 | 3,755,761 | 855,092 | 603,036 | 574,428 | |||||||||||||||
Net assets | $ | 388,046,675 | $ | 254,788,068 | $ | 70,970,151 | $ | 97,900,380 | $ | 42,561,018 | ||||||||||
Class A Shares | ||||||||||||||||||||
Net assets | $ | 240,572,405 | $ | 47,518,110 | $ | 13,654,353 | $ | 41,052,726 | $ | 23,978,484 | ||||||||||
Shares outstanding | 10,585,760 | 1,757,956 | 531,547 | 1,580,711 | 970,564 | |||||||||||||||
Net asset value (“NAV”) per share | $ | 22.73 | $ | 27.03 | $ | 25.69 | $ | 25.97 | $ | 24.71 | ||||||||||
Offering price per share (NAV per share plus maximum sales charge of 5.75% of offering price) | $ | 24.12 | $ | 28.68 | $ | 27.26 | $ | 27.55 | $ | 26.22 | ||||||||||
Class C Shares | ||||||||||||||||||||
Net assets | $ | 27,588,001 | $ | 47,804,709 | $ | 9,344,493 | $ | 24,531,112 | $ | 5,977,637 | ||||||||||
Shares outstanding | 1,270,185 | 1,794,598 | 370,136 | 961,529 | 242,479 | |||||||||||||||
NAV and offering price per share | $ | 21.72 | $ | 26.64 | $ | 25.25 | $ | 25.51 | $ | 24.65 | ||||||||||
Class R3 Shares | ||||||||||||||||||||
Net assets | $ | 185,982 | $ | — | $ | — | $ | — | $ | — | ||||||||||
Shares outstanding | 8,131 | — | — | — | — | |||||||||||||||
NAV and offering price per share | $ | 22.87 | $ | — | $ | — | $ | — | $ | — | ||||||||||
Class R6 Shares | ||||||||||||||||||||
Net assets | $ | 19,773,280 | $ | 18,488,990 | $ | 26,502 | $ | 25,790 | $ | — | ||||||||||
Shares outstanding | 864,051 | 682,645 | 1,030 | 991 | — | |||||||||||||||
NAV and offering price per share | $ | 22.88 | $ | 27.08 | $ | 25.73 | $ | 26.02 | $ | — | ||||||||||
Class I Shares | ||||||||||||||||||||
Net assets | $ | 99,927,007 | $ | 140,976,259 | $ | 47,944,803 | $ | 32,290,752 | $ | 12,604,897 | ||||||||||
Shares outstanding | 4,368,243 | 5,206,731 | 1,863,604 | 1,241,174 | 510,123 | |||||||||||||||
NAV and offering price per share | $ | 22.88 | $ | 27.08 | $ | 25.73 | $ | 26.02 | $ | 24.71 | ||||||||||
Net assets consist of: | ||||||||||||||||||||
Capital paid-in | $ | 379,940,229 | $ | 245,446,011 | $ | 69,301,060 | $ | 105,959,927 | $ | 43,105,852 | ||||||||||
Undistributed (Over-distribution of) net investment income | 5,671,153 | 2,040,748 | 526,693 | 1,680,900 | 262,465 | |||||||||||||||
Accumulated net realized gain (loss) | (22,219,753 | ) | (8,178,808 | ) | (2,602,021 | ) | (10,140,055 | ) | (2,072,210 | ) | ||||||||||
Net unrealized appreciation (depreciation) | 24,655,046 | 15,480,117 | 3,744,419 | 399,608 | 1,264,911 | |||||||||||||||
Net assets | $ | 388,046,675 | $ | 254,788,068 | $ | 70,970,151 | $ | 97,900,380 | $ | 42,561,018 | ||||||||||
Authorized shares – per class | Unlimited | Unlimited | Unlimited | Unlimited | Unlimited | |||||||||||||||
Par value per share | $ | 0.01 | $ | 0.01 | $ | 0.01 | $ | 0.01 | $ | 0.01 | ||||||||||
See accompanying notes to financial statements.
| 110 | NUVEEN |
| Growth | Large Cap Core Plus | Equity Long/ Short | Equity Market Neutral | |||||||||||||
Assets | ||||||||||||||||
Long-term investments, at value (cost $42,471,605, $85,396,629, $120,891,267 and $64,074,085, respectively) | $ | 49,639,366 | $ | 92,468,472 | $ | 129,622,878 | $ | 69,291,885 | ||||||||
Short-term investments, at value (cost approximates value) | — | 361,540 | 2,754,605 | 2,918,656 | ||||||||||||
Cash | 3,428 | — | — | — | ||||||||||||
Cash collateral at brokers(1) | — | — | 14,863,239 | 46,932,527 | ||||||||||||
Receivable for: | ||||||||||||||||
Dividends | 100,243 | 176,699 | 233,292 | 134,247 | ||||||||||||
Investments sold | 635,105 | 529,401 | 2,477,568 | 583,048 | ||||||||||||
Shares sold | 123,922 | 22,535 | 214,994 | 32,892 | ||||||||||||
Other assets | 33,547 | 23,340 | 28,224 | 26,060 | ||||||||||||
Total assets | 50,535,611 | 93,581,987 | 150,194,800 | 119,919,315 | ||||||||||||
Liabilities | ||||||||||||||||
Cash overdraft | — | 29,261 | — | — | ||||||||||||
Cash collateral due to brokers | — | 225,618 | — | — | ||||||||||||
Common stocks sold short, at value (proceeds $ —, $22,967,595, $61,138,997 and $58,907,658, respectively) | — | 21,316,912 | 62,408,143 | 56,848,967 | ||||||||||||
Payable for: | ||||||||||||||||
Dividends on common stocks sold short | — | 30,711 | 80,912 | 78,739 | ||||||||||||
Investments purchased | 599,353 | 343,657 | 3,777,897 | 1,450,803 | ||||||||||||
Shares redeemed | 91,721 | 184,565 | 600,065 | 31,855 | ||||||||||||
Accrued expenses: | ||||||||||||||||
Management fees | 15,855 | 56,226 | 78,995 | 62,889 | ||||||||||||
Trustees fees | 185 | 286 | 383 | 288 | ||||||||||||
12b-1 distribution and service fees | 9,158 | 14,747 | 12,618 | 3,830 | ||||||||||||
Other | 50,734 | 62,168 | 84,130 | 53,151 | ||||||||||||
Total liabilities | 767,006 | 22,264,151 | 67,043,143 | 58,530,522 | ||||||||||||
Net assets | $ | 49,768,605 | $ | 71,317,836 | $ | 83,151,657 | $ | 61,388,793 | ||||||||
Class A Shares | ||||||||||||||||
Net assets | $ | 9,757,914 | $ | 15,053,438 | $ | 26,011,556 | $ | 9,289,231 | ||||||||
Shares outstanding | 354,608 | 589,007 | 797,725 | 429,224 | ||||||||||||
Net asset value (“NAV”) per share | $ | 27.52 | $ | 25.56 | $ | 32.61 | $ | 21.64 | ||||||||
Offering price per share (NAV per share plus maximum sales charge of 5.75% of offering price) | $ | 29.20 | $ | 27.12 | $ | 34.60 | $ | 22.96 | ||||||||
Class C Shares | ||||||||||||||||
Net assets | $ | 7,987,363 | $ | 13,345,490 | $ | 8,235,563 | $ | 2,109,275 | ||||||||
Shares outstanding | 316,335 | 532,707 | 269,440 | 99,842 | ||||||||||||
NAV and offering price per share | $ | 25.25 | $ | 25.05 | $ | 30.57 | $ | 21.13 | ||||||||
Class R3 Shares | ||||||||||||||||
Net assets | $ | 193,396 | $ | — | $ | — | $ | — | ||||||||
Shares outstanding | 7,091 | — | — | — | ||||||||||||
NAV and offering price per share | $ | 27.27 | $ | — | $ | — | $ | — | ||||||||
Class R6 Shares | ||||||||||||||||
Net assets | $ | — | $ | — | $ | — | $ | — | ||||||||
Shares outstanding | — | — | — | — | ||||||||||||
NAV and offering price per share | $ | — | $ | — | $ | — | $ | — | ||||||||
Class I Shares | ||||||||||||||||
Net assets | $ | 31,829,932 | $ | 42,918,908 | $ | 48,904,538 | $ | 49,990,287 | ||||||||
Shares outstanding | 1,136,542 | 1,673,287 | 1,470,046 | 2,290,866 | ||||||||||||
NAV and offering price per share | $ | 28.01 | $ | 25.65 | $ | 33.27 | $ | 21.82 | ||||||||
Net assets consist of: | ||||||||||||||||
Capital paid-in | $ | 39,877,008 | $ | 69,851,197 | $ | 83,465,275 | $ | 59,008,325 | ||||||||
Undistributed (Over-distribution of) net investment income | 249,003 | 362,313 | — | (487,116 | ) | |||||||||||
Accumulated net realized gain (loss) | 2,474,833 | (7,618,200 | ) | (7,776,083 | ) | (4,408,907 | ) | |||||||||
Net unrealized appreciation (depreciation) | 7,167,761 | 8,722,526 | 7,462,465 | 7,276,491 | ||||||||||||
Net assets | $ | 49,768,605 | $ | 71,317,836 | $ | 83,151,657 | $ | 61,388,793 | ||||||||
Authorized shares – per class | Unlimited | Unlimited | Unlimited | Unlimited | ||||||||||||
Par value per share | $ | 0.01 | $ | 0.01 | $ | 0.01 | $ | 0.01 | ||||||||
| (1) | Cash pledged as collateral for common stocks sold short is in addition to the Fund’s securities pledged as collateral as noted in the Portfolio of Investments. |
See accompanying notes to financial statements.
| NUVEEN | 111 |
| Operations | Year Ended August 31, 2016 |
| Large Cap Value | Large Cap Core | Large Cap Growth | Concentrated Core | Core Dividend | ||||||||||||||||
Investment Income (net of foreign tax withheld of $7,893, $462, $ —, $ — and $657, respectively) | $ | 9,775,532 | $ | 4,702,746 | $ | 1,505,970 | $ | 3,196,983 | $ | 1,373,847 | ||||||||||
Expenses | ||||||||||||||||||||
Management fees | 2,668,620 | 1,683,112 | 632,989 | 946,776 | 301,140 | |||||||||||||||
12b-1 service fees – Class A Shares | 607,825 | 111,391 | 65,716 | 127,694 | 55,703 | |||||||||||||||
12b-1 distribution and service fees – Class C Shares | 283,760 | 446,798 | 90,291 | 264,217 | 60,562 | |||||||||||||||
12b-1 distribution and service fees – Class R3 Shares | 907 | — | — | — | — | |||||||||||||||
Dividends expense on common stocks sold short | — | — | — | — | — | |||||||||||||||
Prime broker expenses | — | — | — | — | — | |||||||||||||||
Shareholder servicing agent fees | 313,660 | 183,903 | 96,306 | 139,990 | 43,043 | |||||||||||||||
Custodian fees | 63,786 | 44,903 | 32,171 | 30,534 | 30,633 | |||||||||||||||
Trustees fees | 7,198 | 6,224 | 2,340 | 3,102 | 1,145 | |||||||||||||||
Professional fees | 41,107 | 35,305 | 23,524 | 25,101 | 22,174 | |||||||||||||||
Shareholder reporting expenses | 65,928 | 47,481 | 27,412 | 42,149 | 15,888 | |||||||||||||||
Federal and state registration fees | 72,512 | 60,418 | 46,615 | 60,503 | 40,476 | |||||||||||||||
Other | 26,576 | 19,229 | 9,981 | 14,764 | 7,941 | |||||||||||||||
Total expenses before fee waiver/expense reimbursement | 4,151,879 | 2,638,764 | 1,027,345 | 1,654,830 | 578,705 | |||||||||||||||
Fee waiver/expense reimbursement | — | (22,288 | ) | (70,076 | ) | (140,593 | ) | (81,880 | ) | |||||||||||
Net expenses | 4,151,879 | 2,616,476 | 957,269 | 1,514,237 | 496,825 | |||||||||||||||
Net investment income (loss) | 5,623,653 | 2,086,270 | 548,701 | 1,682,746 | 877,022 | |||||||||||||||
Realized and Unrealized Gain (Loss) | ||||||||||||||||||||
Net realized gain (loss) from: | ||||||||||||||||||||
Investments | (16,502,247 | ) | (7,790,494 | ) | (2,230,884 | ) | (9,502,447 | ) | (1,642,767 | ) | ||||||||||
Common stocks sold short | — | — | — | — | — | |||||||||||||||
Change in net unrealized appreciation (depreciation) of: | ||||||||||||||||||||
Investments | 34,105,291 | 24,896,330 | 5,392,701 | 7,516,739 | 2,982,908 | |||||||||||||||
Common stocks sold short | — | — | — | — | — | |||||||||||||||
Net realized and unrealized gain (loss) | 17,603,044 | 17,105,836 | 3,161,817 | (1,985,708 | ) | 1,340,141 | ||||||||||||||
Net increase (decrease) in net assets from operations | $ | 23,226,697 | $ | 19,192,106 | $ | 3,710,518 | $ | (302,962 | ) | $ | 2,217,163 | |||||||||
See accompanying notes to financial statements.
| 112 | NUVEEN |
| Growth | Large Cap Core Plus | Equity Long/ Short | Equity Market Neutral | |||||||||||||
Investment Income (net of foreign tax withheld of $ —, $168, $2,957 and $288, respectively) | $ | 920,325 | $ | 2,316,798 | $ | 3,286,252 | $ | 1,206,270 | ||||||||
Expenses | ||||||||||||||||
Management fees | 317,051 | 1,019,367 | 1,302,761 | 833,957 | ||||||||||||
12b-1 service fees – Class A Shares | 23,241 | 40,990 | 69,722 | 25,601 | ||||||||||||
12b-1 distribution and service fees – Class C Shares | 85,953 | 147,568 | 88,669 | 21,290 | ||||||||||||
12b-1 distribution and service fees – Class R3 Shares | 632 | — | — | — | ||||||||||||
Dividends expense on common stocks sold short | — | 397,155 | 1,236,914 | 686,894 | ||||||||||||
Prime broker expenses | — | 319,107 | 792,040 | 306,118 | ||||||||||||
Shareholder servicing agent fees | 42,963 | 77,608 | 102,277 | 59,102 | ||||||||||||
Custodian fees | 39,622 | 46,697 | 56,421 | 41,325 | ||||||||||||
Trustees fees | 1,253 | 2,216 | 2,786 | 1,781 | ||||||||||||
Professional fees | 20,094 | 22,292 | 27,220 | 24,310 | ||||||||||||
Shareholder reporting expenses | 16,290 | 23,466 | 42,691 | 13,892 | ||||||||||||
Federal and state registration fees | 60,684 | 46,426 | 62,563 | 44,993 | ||||||||||||
Other | 8,191 | 11,996 | 9,911 | 7,220 | ||||||||||||
Total expenses before fee waiver/expense reimbursement | 615,974 | 2,154,888 | 3,793,975 | 2,066,483 | ||||||||||||
Fee waiver/expense reimbursement | (61,836 | ) | (184,786 | ) | (200,757 | ) | (126,482 | ) | ||||||||
Net expenses | 554,138 | 1,970,102 | 3,593,218 | 1,940,001 | ||||||||||||
Net investment income (loss) | 366,187 | 346,696 | (306,966 | ) | (733,731 | ) | ||||||||||
Realized and Unrealized Gain (Loss) | ||||||||||||||||
Net realized gain (loss) from: | ||||||||||||||||
Investments | 3,404,490 | (7,800,867 | ) | (7,304,871 | ) | (1,493,893 | ) | |||||||||
Common stocks sold short | — | 1,681,368 | 250,912 | (1,036,386 | ) | |||||||||||
Change in net unrealized appreciation (depreciation) of: | ||||||||||||||||
Investments | 222,719 | 11,120,958 | 11,139,145 | 6,658,507 | ||||||||||||
Common stocks sold short | — | (1,501,603 | ) | (6,801,971 | ) | (1,891,741 | ) | |||||||||
Net realized and unrealized gain (loss) | 3,627,209 | 3,499,856 | (2,716,785 | ) | 2,236,487 | |||||||||||
Net increase (decrease) in net assets from operations | $ | 3,993,396 | $ | 3,846,552 | $ | (3,023,751 | ) | $ | 1,502,756 | |||||||
See accompanying notes to financial statements.
| NUVEEN | 113 |
| Changes in Net Assets |
| Large Cap Value | Large Cap Core | |||||||||||||||||||
| Year Ended 8/31/16 | Year Ended 8/31/15 | Year Ended 8/31/16 | Year Ended 8/31/15 | |||||||||||||||||
Operations | ||||||||||||||||||||
Net investment income (loss) | $ | 5,623,653 | $ | 4,623,760 | $ | 2,086,270 | $ | 1,588,292 | ||||||||||||
Net realized gain (loss) from: | ||||||||||||||||||||
Investments | (16,502,247 | ) | 34,141,370 | (7,790,494 | ) | 3,588,701 | ||||||||||||||
Common stocks sold short | — | — | — | — | ||||||||||||||||
Change in net unrealized appreciation (depreciation) of: | ||||||||||||||||||||
Investments | 34,105,291 | (65,093,383 | ) | 24,896,330 | (14,707,283 | ) | ||||||||||||||
Common stocks sold short | — | — | — | — | ||||||||||||||||
Net increase (decrease) in net assets from operations | 23,226,697 | (26,328,253 | ) | 19,192,106 | (9,530,290 | ) | ||||||||||||||
Distributions to Shareholders | ||||||||||||||||||||
From net investment income: | ||||||||||||||||||||
Class A Shares | (2,740,858 | ) | (2,455,704 | ) | (260,913 | ) | (17,407 | ) | ||||||||||||
Class C Shares | (71,281 | ) | (15,633 | ) | — | — | ||||||||||||||
Class R3 Shares | (890 | ) | (694 | ) | — | — | ||||||||||||||
Class R6 Shares | — | — | — | — | ||||||||||||||||
Class I Shares | (1,620,342 | ) | (1,254,815 | ) | (1,231,787 | ) | (272,162 | ) | ||||||||||||
From accumulated net realized gains: | ||||||||||||||||||||
Class A Shares | (20,742,963 | ) | (31,890,375 | ) | (665,871 | ) | (361,833 | ) | ||||||||||||
Class C Shares | (2,587,341 | ) | (3,400,382 | ) | (672,892 | ) | (280,596 | ) | ||||||||||||
Class R3 Shares | (9,113 | ) | (13,510 | ) | — | — | ||||||||||||||
Class R6 Shares | — | — | — | — | ||||||||||||||||
Class I Shares | (9,303,235 | ) | (12,073,792 | ) | (2,305,540 | ) | (1,589,370 | ) | ||||||||||||
Decrease in net assets from distributions to shareholders | (37,076,023 | ) | (51,104,905 | ) | (5,137,003 | ) | (2,521,368 | ) | ||||||||||||
Fund Share Transactions | ||||||||||||||||||||
Proceeds from sale of shares | 86,707,395 | 107,631,449 | 127,029,994 | 216,649,260 | ||||||||||||||||
Proceeds from shares issued to shareholders due to reinvestment of distributions | 30,907,897 | 42,183,256 | 3,409,488 | 1,697,209 | ||||||||||||||||
| 117,615,292 | 149,814,705 | 130,439,482 | 218,346,469 | |||||||||||||||||
Cost of shares redeemed | (118,146,019 | ) | (96,509,905 | ) | (119,614,261 | ) | (45,410,183 | ) | ||||||||||||
Net increase (decrease) in net assets from Fund share transactions | (530,727 | ) | 53,304,800 | 10,825,221 | 172,936,286 | |||||||||||||||
Net increase (decrease) in net assets | (14,380,053 | ) | (24,128,358 | ) | 24,880,324 | 160,884,628 | ||||||||||||||
Net assets at the beginning of period | 402,426,728 | 426,555,086 | 229,907,744 | 69,023,116 | ||||||||||||||||
Net assets at the end of period | $ | 388,046,675 | $ | 402,426,728 | $ | 254,788,068 | $ | 229,907,744 | ||||||||||||
Undistributed (Over-distribution of) net investment income at the end of period | $ | 5,671,153 | $ | 4,392,053 | $ | 2,040,748 | $ | 1,489,713 | ||||||||||||
See accompanying notes to financial statements.
| 114 | NUVEEN |
| Large Cap Growth | Concentrated Core | |||||||||||||||||||
| Year Ended 8/31/16 | Year Ended 8/31/15 | Year Ended 8/31/16 | Year Ended 8/31/15 | |||||||||||||||||
Operations | ||||||||||||||||||||
Net investment income (loss) | $ | 548,701 | $ | 480,677 | $ | 1,682,746 | $ | 720,366 | ||||||||||||
Net realized gain (loss) from: | ||||||||||||||||||||
Investments | (2,230,884 | ) | 3,165,493 | (9,502,447 | ) | 4,597,216 | ||||||||||||||
Common stocks sold short | — | — | — | — | ||||||||||||||||
Change in net unrealized appreciation (depreciation) of: | ||||||||||||||||||||
Investments | 5,392,701 | (5,886,068 | ) | 7,516,739 | (8,766,932 | ) | ||||||||||||||
Common stocks sold short | — | — | — | — | ||||||||||||||||
Net increase (decrease) in net assets from operations | 3,710,518 | (2,239,898 | ) | (302,962 | ) | (3,449,350 | ) | |||||||||||||
Distributions to Shareholders | ||||||||||||||||||||
From net investment income: | ||||||||||||||||||||
Class A Shares | (118,046 | ) | (16,220 | ) | (277,738 | ) | (19,305 | ) | ||||||||||||
Class C Shares | — | — | — | — | ||||||||||||||||
Class R3 Shares | — | — | — | — | ||||||||||||||||
Class R6 Shares | — | — | — | — | ||||||||||||||||
Class I Shares | (356,988 | ) | (134,374 | ) | (321,714 | ) | (152,830 | ) | ||||||||||||
From accumulated net realized gains: | ||||||||||||||||||||
Class A Shares | (1,116,072 | ) | (548,226 | ) | (2,022,709 | ) | (307,323 | ) | ||||||||||||
Class C Shares | (307,807 | ) | (138,909 | ) | (986,428 | ) | (56,400 | ) | ||||||||||||
Class R3 Shares | — | — | — | — | ||||||||||||||||
Class R6 Shares | — | — | — | — | ||||||||||||||||
Class I Shares | (1,947,469 | ) | (1,397,584 | ) | (1,737,972 | ) | (457,404 | ) | ||||||||||||
Decrease in net assets from distributions to shareholders | (3,846,382 | ) | (2,235,313 | ) | (5,346,561 | ) | (993,262 | ) | ||||||||||||
Fund Share Transactions | ||||||||||||||||||||
Proceeds from sale of shares | 21,067,275 | 72,417,682 | 48,288,208 | 175,802,286 | ||||||||||||||||
Proceeds from shares issued to shareholders due to reinvestment of distributions | 2,458,730 | 1,012,291 | 5,221,924 | 952,809 | ||||||||||||||||
| 23,526,005 | 73,429,973 | 53,510,132 | 176,755,095 | |||||||||||||||||
Cost of shares redeemed | (49,961,218 | ) | (11,813,254 | ) | (82,303,357 | ) | (58,361,676 | ) | ||||||||||||
Net increase (decrease) in net assets from Fund share transactions | (26,435,213 | ) | 61,616,719 | (28,793,225 | ) | 118,393,419 | ||||||||||||||
Net increase (decrease) in net assets | (26,571,077 | ) | 57,141,508 | (34,442,748 | ) | 113,950,807 | ||||||||||||||
Net assets at the beginning of period | 97,541,228 | 40,399,720 | 132,343,128 | 18,392,321 | ||||||||||||||||
Net assets at the end of period | $ | 70,970,151 | $ | 97,541,228 | $ | 97,900,380 | $ | 132,343,128 | ||||||||||||
Undistributed (Over-distribution of) net investment income at the end of period | $ | 526,693 | $ | 475,127 | $ | 1,680,900 | $ | 599,018 | ||||||||||||
See accompanying notes to financial statements.
| NUVEEN | 115 |
Statement of Changes in Net Assets (continued)
| Core Dividend | Growth | |||||||||||||||||||
Year Ended | Year Ended 8/31/15 | Year Ended | Year Ended 8/31/15 | |||||||||||||||||
Operations | ||||||||||||||||||||
Net investment income (loss) | $ | 877,022 | $ | 610,857 | $ | 366,187 | $ | 229,737 | ||||||||||||
Net realized gain (loss) from: | ||||||||||||||||||||
Investments | (1,642,767 | ) | 396,705 | 3,404,490 | 7,092,074 | |||||||||||||||
Common stocks sold short | — | — | — | — | ||||||||||||||||
Change in net unrealized appreciation (depreciation) of: | ||||||||||||||||||||
Investments | 2,982,908 | (3,056,804 | ) | 222,719 | (5,681,549 | ) | ||||||||||||||
Common stocks sold short | — | — | — | — | ||||||||||||||||
Net increase (decrease) in net assets from operations | 2,217,163 | (2,049,242 | ) | 3,993,396 | 1,640,262 | |||||||||||||||
Distributions to Shareholders | ||||||||||||||||||||
From net investment income: | ||||||||||||||||||||
Class A Shares | (356,463 | ) | (266,879 | ) | (63,860 | ) | — | |||||||||||||
Class C Shares | (51,911 | ) | (42,575 | ) | — | — | ||||||||||||||
Class R3 Shares | — | — | (272 | ) | — | |||||||||||||||
Class R6 Shares | — | — | — | — | ||||||||||||||||
Class I Shares | (270,064 | ) | (261,652 | ) | (282,789 | ) | — | |||||||||||||
From accumulated net realized gains: | ||||||||||||||||||||
Class A Shares | (327,317 | ) | (324,290 | ) | (1,030,621 | ) | (698,144 | ) | ||||||||||||
Class C Shares | (92,004 | ) | (92,361 | ) | (1,133,943 | ) | (864,060 | ) | ||||||||||||
Class R3 Shares | — | — | (8,899 | ) | (5,762 | ) | ||||||||||||||
Class R6 Shares | — | — | — | — | ||||||||||||||||
Class I Shares | (249,825 | ) | (261,701 | ) | (3,506,692 | ) | (2,868,948 | ) | ||||||||||||
Decrease in net assets from distributions to shareholders | (1,347,584 | ) | (1,249,458 | ) | (6,027,076 | ) | (4,436,914 | ) | ||||||||||||
Fund Share Transactions | ||||||||||||||||||||
Proceeds from sale of shares | 14,499,430 | 37,114,879 | 17,693,817 | 25,955,934 | ||||||||||||||||
Proceeds from shares issued to shareholders due to reinvestment of distributions | 1,285,090 | 1,179,996 | 5,202,800 | 3,724,976 | ||||||||||||||||
| 15,784,520 | 38,294,875 | 22,896,617 | 29,680,910 | |||||||||||||||||
Cost of shares redeemed | (18,679,064 | ) | (7,392,122 | ) | (18,331,029 | ) | (28,811,652 | ) | ||||||||||||
Net increase (decrease) in net assets from Fund share transactions | (2,894,544 | ) | 30,902,753 | 4,565,588 | 869,258 | |||||||||||||||
Net increase (decrease) in net assets | (2,024,965 | ) | 27,604,053 | 2,531,908 | (1,927,394 | ) | ||||||||||||||
Net assets at the beginning of period | 44,585,983 | 16,981,930 | 47,236,697 | 49,164,091 | ||||||||||||||||
Net assets at the end of period | $ | 42,561,018 | $ | 44,585,983 | $ | 49,768,605 | $ | 47,236,697 | ||||||||||||
Undistributed (Over-distribution of) net investment income at the end of period | $ | 262,465 | $ | 57,802 | $ | 249,003 | $ | 229,737 | ||||||||||||
See accompanying notes to financial statements.
| 116 | NUVEEN |
| Large Cap Core Plus | Equity Long/Short | |||||||||||||||||||
Year Ended | Year Ended 8/31/15 | Year Ended | Year Ended 8/31/15 | |||||||||||||||||
Operations | ||||||||||||||||||||
Net investment income (loss) | $ | 346,696 | $ | 441,196 | $ | (306,966 | ) | $ | (431,908 | ) | ||||||||||
Net realized gain (loss) from: | ||||||||||||||||||||
Investments | (7,800,867 | ) | 4,352,493 | (7,304,871 | ) | 3,773,837 | ||||||||||||||
Common stocks sold short | 1,681,368 | (2,088,315 | ) | 250,912 | (3,904,504 | ) | ||||||||||||||
Change in net unrealized appreciation (depreciation) of: | ||||||||||||||||||||
Investments | 11,120,958 | (10,641,409 | ) | 11,139,145 | (6,167,765 | ) | ||||||||||||||
Common stocks sold short | (1,501,603 | ) | 4,191,336 | (6,801,971 | ) | 7,073,559 | ||||||||||||||
Net increase (decrease) in net assets from operations | 3,846,552 | (3,744,699 | ) | (3,023,751 | ) | 343,219 | ||||||||||||||
Distributions to Shareholders | ||||||||||||||||||||
From net investment income: | ||||||||||||||||||||
Class A Shares | (60,075 | ) | — | — | — | |||||||||||||||
Class C Shares | — | — | — | — | ||||||||||||||||
Class R3 Shares | — | — | — | — | ||||||||||||||||
Class R6 Shares | — | — | — | — | ||||||||||||||||
Class I Shares | (414,863 | ) | (73,124 | ) | — | — | ||||||||||||||
From accumulated net realized gains: | ||||||||||||||||||||
Class A Shares | (575,207 | ) | (659,729 | ) | — | (35,372 | ) | |||||||||||||
Class C Shares | (545,365 | ) | (271,761 | ) | — | (13,356 | ) | |||||||||||||
Class R3 Shares | — | — | — | — | ||||||||||||||||
Class R6 Shares | — | — | — | — | ||||||||||||||||
Class I Shares | (2,280,779 | ) | (2,273,426 | ) | — | (74,376 | ) | |||||||||||||
Decrease in net assets from distributions to shareholders | (3,876,289 | ) | (3,278,040 | ) | — | (123,104 | ) | |||||||||||||
Fund Share Transactions | ||||||||||||||||||||
Proceeds from sale of shares | 15,149,957 | 104,287,316 | 69,074,879 | 74,710,682 | ||||||||||||||||
Proceeds from shares issued to shareholders due to reinvestment of distributions | 3,342,688 | 2,746,266 | — | 122,418 | ||||||||||||||||
| 18,492,645 | 107,033,582 | 69,074,879 | 74,833,100 | |||||||||||||||||
Cost of shares redeemed | (55,037,614 | ) | (41,665,055 | ) | (69,365,741 | ) | (22,579,893 | ) | ||||||||||||
Net increase (decrease) in net assets from Fund share transactions | (36,544,969 | ) | 65,368,527 | (290,862 | ) | 52,253,207 | ||||||||||||||
Net increase (decrease) in net assets | (36,574,706 | ) | 58,345,788 | (3,314,613 | ) | 52,473,322 | ||||||||||||||
Net assets at the beginning of period | 107,892,542 | 49,546,754 | 86,466,270 | 33,992,948 | ||||||||||||||||
Net assets at the end of period | $ | 71,317,836 | $ | 107,892,542 | $ | 83,151,657 | $ | 86,466,270 | ||||||||||||
Undistributed (Over-distribution of) net investment income at the end of period | $ | 362,313 | $ | 474,354 | $ | — | $ | (180,487 | ) | |||||||||||
See accompanying notes to financial statements.
| NUVEEN | 117 |
Statement of Changes in Net Assets (continued)
| Equity Market Neutral | ||||||||
Year Ended | Year Ended 8/31/15 | |||||||
Operations | ||||||||
Net investment income (loss) | $ | (733,731 | ) | $ | (609,111 | ) | ||
Net realized gain (loss) from: | ||||||||
Investments | (1,493,893 | ) | 2,576,777 | |||||
Common stocks sold short | (1,036,386 | ) | (3,108,789 | ) | ||||
Change in net unrealized appreciation (depreciation) of: | ||||||||
Investments | 6,658,507 | (4,624,634 | ) | |||||
Common stocks sold short | (1,891,741 | ) | 6,228,428 | |||||
Net increase (decrease) in net assets from operations | 1,502,756 | 462,671 | ||||||
Distributions to Shareholders | ||||||||
From net investment income: | ||||||||
Class A Shares | — | — | ||||||
Class C Shares | — | — | ||||||
Class R3 Shares | — | — | ||||||
Class R6 Shares | — | — | ||||||
Class I Shares | — | — | ||||||
From accumulated net realized gains: | ||||||||
Class A Shares | (157,697 | ) | (29,023 | ) | ||||
Class C Shares | (34,980 | ) | (6,179 | ) | ||||
Class R3 Shares | — | — | ||||||
Class R6 Shares | — | — | ||||||
Class I Shares | (732,355 | ) | (111,998 | ) | ||||
Decrease in net assets from distributions to shareholders | (925,032 | ) | (147,200 | ) | ||||
Fund Share Transactions | ||||||||
Proceeds from sale of shares | 44,449,171 | 29,290,932 | ||||||
Proceeds from shares issued to shareholders due to reinvestment of distributions | 735,316 | 114,707 | ||||||
| 45,184,487 | 29,405,639 | |||||||
Cost of shares redeemed | (30,342,847 | ) | (26,067,879 | ) | ||||
Net increase (decrease) in net assets from Fund share transactions | 14,841,640 | 3,337,760 | ||||||
Net increase (decrease) in net assets | 15,419,364 | 3,653,231 | ||||||
Net assets at the beginning of period | 45,969,429 | 42,316,198 | ||||||
Net assets at the end of period | $ | 61,388,793 | $ | 45,969,429 | ||||
Undistributed (Over-distribution of) net investment income at the end of period | $ | (487,116 | ) | $ | (304,747 | ) | ||
See accompanying notes to financial statements.
| 118 | NUVEEN |
| Cash Flows | Year Ended August 31, 2016 |
| Large Cap Core Plus | Equity Long/Short | Equity Market Neutral | ||||||||||
Cash Flows from Operating Activities: | ||||||||||||
Net Increase (Decrease) in Net Assets from Operations | $ | 3,846,552 | $ | (3,023,751 | ) | $ | 1,502,756 | |||||
Adjustments to reconcile the net increase (decrease) in net assets from operations to net cash provided by (used in) operating activities: | ||||||||||||
Purchases of investments | (141,189,320 | ) | (337,781,272 | ) | (133,217,470 | ) | ||||||
Purchases of securities sold short | (59,441,086 | ) | (212,923,399 | ) | (83,784,262 | ) | ||||||
Proceeds from sales | 191,321,744 | 349,212,317 | 110,897,604 | |||||||||
Proceeds from sales of securities sold short | 49,288,681 | 199,693,353 | 103,377,275 | |||||||||
Proceeds from (Purchase of) short-term investments, net | (361,540 | ) | 1,036,310 | 3,576,377 | ||||||||
(Increase) Decrease in: | ||||||||||||
Cash collateral at brokers | — | 465,041 | (16,391,583 | ) | ||||||||
Receivable for dividends | 133,821 | (7,874 | ) | (54,965 | ) | |||||||
Receivable for investments sold | 2,870,607 | (67,321 | ) | 1,201,743 | ||||||||
Other assets | 93 | (640 | ) | (7,116 | ) | |||||||
Increase (Decrease) in: | ||||||||||||
Cash collateral due to brokers | 225,618 | — | — | |||||||||
Payable for dividends on common stock sold short | (11,871 | ) | (24,216 | ) | 45,957 | |||||||
Payable for investments purchased | (1,760,644 | ) | 588,719 | 1,025,624 | ||||||||
Accrued management fees | (39,809 | ) | 488 | 29,053 | ||||||||
Accrued Trustees fees | (222 | ) | 61 | 125 | ||||||||
Accrued 12b-1 distribution and service fees | (2,954 | ) | 425 | 411 | ||||||||
Accrued other expenses | (43,913 | ) | (28,267 | ) | (4,751 | ) | ||||||
Net realized (gain) loss from: | ||||||||||||
Investments | 7,800,867 | 7,304,871 | 1,493,893 | |||||||||
Common stocks sold short | (1,681,368 | ) | (250,912 | ) | 1,036,386 | |||||||
Change in net unrealized (appreciation) depreciation of: | ||||||||||||
Investments | (11,120,958 | ) | (11,139,145 | ) | (6,658,507 | ) | ||||||
Common stocks sold short | 1,501,603 | 6,801,971 | 1,891,741 | |||||||||
Net cash provided by (used in) operating activities | 41,335,901 | (143,241 | ) | (14,039,709 | ) | |||||||
Cash Flows from Financing Activities: | ||||||||||||
Increase (Decrease) in cash overdraft | 7,748 | — | — | |||||||||
Cash distributions paid to shareholders | (533,601 | ) | — | (189,716 | ) | |||||||
Proceeds from sale of shares | 15,242,415 | 69,189,184 | 44,575,817 | |||||||||
Cost of shares redeemed | (56,052,463 | ) | (69,289,852 | ) | (30,346,392 | ) | ||||||
Net cash provided by (used in) financing activities | (41,335,901 | ) | (100,668 | ) | 14,039,709 | |||||||
Net Increase (Decrease) in Cash | — | (243,909 | ) | — | ||||||||
Cash at the beginning of period | — | 243,909 | — | |||||||||
Cash at the end of period | $ | — | $ | — | $ | — | ||||||
| Large Cap Core Plus | Equity Long/Short | Equity Market Neutral | ||||||||||
Supplemental Disclosure of Cash Flow Information | ||||||||||||
Non-cash financing activities not included herein consists of reinvestments of share distributions | $ | 3,342,688 | $ | — | $ | 735,316 | ||||||
See accompanying notes to financial statements.
| NUVEEN | 119 |
Highlights
Large Cap Value
Selected data for a share outstanding throughout each period:
| Investment Operations | Less Distributions | |||||||||||||||||||||||||||||||||||
Class (Commencement Date)
| Beginning NAV | Net Investment Income (Loss)(a) | Net Realized/ Unrealized Gain (Loss) | Total | From Net Investment Income | From Accumulated Net Realized Gains | Total | Ending NAV | ||||||||||||||||||||||||||||
Class A (8/96) | ||||||||||||||||||||||||||||||||||||
Year Ended 8/31: | ||||||||||||||||||||||||||||||||||||
2016 | $ | 23.58 | $ | 0.32 | $ | 0.98 | $ | 1.30 | $ | (0.24 | ) | $ | (1.91 | ) | $ | (2.15 | ) | $ | 22.73 | |||||||||||||||||
2015 | 28.36 | 0.27 | (1.77 | ) | (1.50 | ) | (0.21 | ) | (3.07 | ) | (3.28 | ) | 23.58 | |||||||||||||||||||||||
2014 | 25.15 | 0.31 | 6.09 | 6.40 | (0.36 | ) | (2.83 | ) | (3.19 | ) | 28.36 | |||||||||||||||||||||||||
2013(e) | 24.31 | 0.03 | 0.81 | 0.84 | — | — | — | 25.15 | ||||||||||||||||||||||||||||
Year Ended 6/30: | ||||||||||||||||||||||||||||||||||||
2013 | 20.03 | 0.29 | 4.29 | 4.58 | (0.30 | ) | — | (0.30 | ) | 24.31 | ||||||||||||||||||||||||||
2012 | 20.25 | 0.26 | (0.24 | ) | 0.02 | (0.24 | ) | — | (0.24 | ) | 20.03 | |||||||||||||||||||||||||
Class C (8/96) | ||||||||||||||||||||||||||||||||||||
Year Ended 8/31: | ||||||||||||||||||||||||||||||||||||
2016 | 22.60 | 0.15 | 0.93 | 1.08 | (0.05 | ) | (1.91 | ) | (1.96 | ) | 21.72 | |||||||||||||||||||||||||
2015 | 27.31 | 0.07 | (1.70 | ) | (1.63 | ) | (0.01 | ) | (3.07 | ) | (3.08 | ) | 22.60 | |||||||||||||||||||||||
2014 | 24.33 | 0.10 | 5.88 | 5.98 | (0.17 | ) | (2.83 | ) | (3.00 | ) | 27.31 | |||||||||||||||||||||||||
2013(e) | 23.54 | — | ** | 0.79 | 0.79 | — | — | — | 24.33 | |||||||||||||||||||||||||||
Year Ended 6/30: | ||||||||||||||||||||||||||||||||||||
2013 | 19.41 | 0.12 | 4.15 | 4.27 | (0.14 | ) | — | (0.14 | ) | 23.54 | ||||||||||||||||||||||||||
2012 | 19.61 | 0.11 | (0.22 | ) | (0.11 | ) | (0.09 | ) | — | (0.09 | ) | 19.41 | ||||||||||||||||||||||||
Class R3 (8/08) | ||||||||||||||||||||||||||||||||||||
Year Ended 8/31: | ||||||||||||||||||||||||||||||||||||
2016 | 23.71 | 0.28 | 0.97 | 1.25 | (0.18 | ) | (1.91 | ) | (2.09 | ) | 22.87 | |||||||||||||||||||||||||
2015 | 28.50 | 0.19 | (1.76 | ) | (1.57 | ) | (0.15 | ) | (3.07 | ) | (3.22 | ) | 23.71 | |||||||||||||||||||||||
2014 | 25.27 | 0.24 | 6.12 | 6.36 | (0.30 | ) | (2.83 | ) | (3.13 | ) | 28.50 | |||||||||||||||||||||||||
2013(e) | 24.43 | 0.02 | 0.82 | 0.84 | — | — | — | 25.27 | ||||||||||||||||||||||||||||
Year Ended 6/30: | ||||||||||||||||||||||||||||||||||||
2013 | 20.14 | 0.24 | 4.30 | 4.54 | (0.25 | ) | — | (0.25 | ) | 24.43 | ||||||||||||||||||||||||||
2012 | 20.34 | 0.22 | (0.23 | ) | (0.01 | ) | (0.19 | ) | — | (0.19 | ) | 20.14 | ||||||||||||||||||||||||
Class R6 (6/16) | ||||||||||||||||||||||||||||||||||||
2016(f) | 21.66 | 0.06 | 1.16 | 1.22 | — | — | — | 22.88 | ||||||||||||||||||||||||||||
Class I (8/96) | ||||||||||||||||||||||||||||||||||||
Year Ended 8/31: | ||||||||||||||||||||||||||||||||||||
2016 | 23.73 | 0.37 | 0.99 | 1.36 | (0.30 | ) | (1.91 | ) | (2.21 | ) | 22.88 | |||||||||||||||||||||||||
2015 | 28.52 | 0.34 | (1.78 | ) | (1.44 | ) | (0.28 | ) | (3.07 | ) | (3.35 | ) | 23.73 | |||||||||||||||||||||||
2014 | 25.28 | 0.37 | 6.13 | 6.50 | (0.43 | ) | (2.83 | ) | (3.26 | ) | 28.52 | |||||||||||||||||||||||||
2013(e) | 24.42 | 0.04 | 0.82 | 0.86 | — | — | — | 25.28 | ||||||||||||||||||||||||||||
Year Ended 6/30: | ||||||||||||||||||||||||||||||||||||
2013 | 20.12 | 0.34 | 4.31 | 4.65 | (0.35 | ) | — | (0.35 | ) | 24.42 | ||||||||||||||||||||||||||
2012 | 20.34 | 0.31 | (0.24 | ) | 0.07 | (0.29 | ) | — | (0.29 | ) | 20.12 | |||||||||||||||||||||||||
| 120 | NUVEEN |
| Ratios/Supplemental Data | ||||||||||||||||||||||||||||||||||
| Ratios to Average Net Assets Before Waiver/Reimbursement | Ratios to Average Net Assets After Waiver/Reimbursement(c) | |||||||||||||||||||||||||||||||||
| Total Return(b) | Ending Net Assets (000) | Expenses | Net Investment Income (Loss) | Expenses | Net Investment Income (Loss) | Portfolio Turnover Rate(d) | ||||||||||||||||||||||||||||
| 6.26 | % | $ | 240,572 | 1.10 | % | 1.44 | % | 1.10 | % | 1.44 | % | 141 | % | |||||||||||||||||||||
| (5.75 | ) | 267,337 | 1.12 | 1.01 | 1.12 | 1.01 | 158 | |||||||||||||||||||||||||||
| 27.40 | 294,917 | 1.11 | 1.16 | 1.11 | 1.16 | 153 | ||||||||||||||||||||||||||||
| 3.50 | 250,052 | 1.25 | * | 0.70 | * | 1.25 | * | 0.70 | * | 42 | ||||||||||||||||||||||||
| 23.09 | 282,993 | 1.16 | 1.30 | 1.15 | 1.31 | 153 | ||||||||||||||||||||||||||||
| 0.19 | 258,324 | 1.16 | 1.33 | 1.16 | 1.33 | 99 | ||||||||||||||||||||||||||||
| 5.46 | 27,588 | 1.85 | 0.70 | 1.85 | 0.70 | 141 | ||||||||||||||||||||||||||||
| (6.45 | ) | 31,516 | 1.87 | 0.26 | 1.87 | 0.26 | 158 | |||||||||||||||||||||||||||
| 26.47 | 26,628 | 1.86 | 0.41 | 1.86 | 0.41 | 153 | ||||||||||||||||||||||||||||
| 3.36 | 17,780 | 2.00 | * | (0.02 | )* | 2.00 | * | (0.02 | )* | 42 | ||||||||||||||||||||||||
| 22.10 | 17,174 | 1.91 | 0.54 | 1.90 | 0.55 | 153 | ||||||||||||||||||||||||||||
| (0.51 | ) | 16,644 | 1.91 | 0.58 | 1.91 | 0.58 | 99 | |||||||||||||||||||||||||||
| 5.97 | 186 | 1.34 | 1.25 | 1.34 | 1.25 | 141 | ||||||||||||||||||||||||||||
| (5.99 | ) | 232 | 1.37 | 0.73 | 1.37 | 0.73 | 158 | |||||||||||||||||||||||||||
| 27.11 | 135 | 1.36 | 0.92 | 1.36 | 0.92 | 153 | ||||||||||||||||||||||||||||
| 3.44 | 87 | 1.50 | * | 0.43 | * | 1.50 | * | 0.43 | * | 42 | ||||||||||||||||||||||||
| 22.72 | 91 | 1.41 | 1.07 | 1.39 | 1.08 | 153 | ||||||||||||||||||||||||||||
| 0.04 | 76 | 1.41 | 1.14 | 1.41 | 1.14 | 99 | ||||||||||||||||||||||||||||
| 5.63 | 19,773 | 0.73 | * | 1.48 | * | 0.73 | * | 1.48 | * | 141 | ||||||||||||||||||||||||
| 6.53 | 99,927 | 0.85 | 1.69 | 0.85 | 1.69 | 141 | ||||||||||||||||||||||||||||
| (5.52 | ) | 103,342 | 0.86 | 1.29 | 0.86 | 1.29 | 158 | |||||||||||||||||||||||||||
| 27.74 | 104,875 | 0.86 | 1.40 | 0.86 | 1.40 | 153 | ||||||||||||||||||||||||||||
| 3.52 | 45,148 | 1.00 | * | 0.97 | * | 1.00 | * | 0.97 | * | 42 | ||||||||||||||||||||||||
| 23.39 | 42,285 | 0.91 | 1.53 | 0.90 | 1.55 | 153 | ||||||||||||||||||||||||||||
| 0.45 | 24,546 | 0.91 | 1.59 | 0.91 | 1.59 | 99 | ||||||||||||||||||||||||||||
| (a) | Per share Net Investment Income (Loss) is calculated using the average daily shares method. |
| (b) | Total return is the combination of changes in NAV without any sales charge, reinvested dividend income at NAV and reinvested capital gains distributions at NAV, if any. Total returns are not annualized. Performance prior to June 24, 2013, reflects the Fund’s performance under the management of multiple sub-advisers using investment strategies that differed significantly from those currently in place. |
| (c) | After fee waiver and/or expense reimbursement from the Adviser, where applicable. |
| (d) | Portfolio Turnover Rate is calculated based on the lesser of long-term purchases or sales (as disclosed in Note 5 – Investment Transactions) divided by the average long-term market value during the period. |
| (e) | For the two months ended August 31, 2013. |
| (f) | For the period June 30, 2016 (commencement of operations) through August 31, 2016. |
| * | Annualized. |
| ** | Rounds to less than $0.01 per share. |
See accompanying notes to financial statements.
| NUVEEN | 121 |
Financial Highlights (continued)
Large Cap Core
Selected data for a share outstanding throughout each period:
| Investment Operations | Less Distributions | |||||||||||||||||||||||||||||||||||
Class (Commencement Date)
Year Ended August 31, | Beginning NAV | Net Investment | Net Realized/ Unrealized Gain (Loss) | Total | From Investment Income | From Accumulated Net Realized Gains | Total | Ending NAV | ||||||||||||||||||||||||||||
Class A (6/13) | ||||||||||||||||||||||||||||||||||||
2016 | $ | 25.64 | $ | 0.22 | $ | 1.71 | $ | 1.93 | $ | (0.15 | ) | $ | (0.39 | ) | $ | (0.54 | ) | $ | 27.03 | |||||||||||||||||
2015 | 26.67 | 0.23 | (0.69 | ) | (0.46 | ) | (0.02 | ) | (0.55 | ) | (0.57 | ) | 25.64 | |||||||||||||||||||||||
2014 | 20.49 | 0.19 | 6.42 | 6.61 | (0.08 | ) | (0.35 | ) | (0.43 | ) | 26.67 | |||||||||||||||||||||||||
2013(d) | 20.00 | 0.04 | 0.45 | 0.49 | — | — | — | 20.49 | ||||||||||||||||||||||||||||
Class C (6/13) | ||||||||||||||||||||||||||||||||||||
2016 | 25.32 | 0.02 | 1.69 | 1.71 | — | (0.39 | ) | (0.39 | ) | 26.64 | ||||||||||||||||||||||||||
2015 | 26.51 | 0.02 | (0.66 | ) | (0.64 | ) | — | (0.55 | ) | (0.55 | ) | 25.32 | ||||||||||||||||||||||||
2014 | 20.46 | 0.01 | 6.39 | 6.40 | — | (0.35 | ) | (0.35 | ) | 26.51 | ||||||||||||||||||||||||||
2013(d) | 20.00 | 0.01 | 0.45 | 0.46 | — | — | — | 20.46 | ||||||||||||||||||||||||||||
Class R6 (6/16) | ||||||||||||||||||||||||||||||||||||
2016(f) | 25.46 | 0.05 | 1.57 | 1.62 | — | — | — | 27.08 | ||||||||||||||||||||||||||||
Class I (6/13) | ||||||||||||||||||||||||||||||||||||
2016 | 25.69 | 0.28 | 1.72 | 2.00 | (0.22 | ) | (0.39 | ) | (0.61 | ) | 27.08 | |||||||||||||||||||||||||
2015 | 26.71 | 0.30 | (0.68 | ) | (0.38 | ) | (0.09 | ) | (0.55 | ) | (0.64 | ) | 25.69 | |||||||||||||||||||||||
2014 | 20.50 | 0.25 | 6.41 | 6.66 | (0.10 | ) | (0.35 | ) | (0.45 | ) | 26.71 | |||||||||||||||||||||||||
2013(d) | 20.00 | 0.03 | 0.47 | 0.50 | — | — | — | 20.50 | ||||||||||||||||||||||||||||
| 122 | NUVEEN |
| Ratios/Supplemental Data | ||||||||||||||||||||||||||||||||||
| Ratios to Average Net Assets Before Waiver/Reimbursement | Ratios to Average Net Assets After Waiver/Reimbursement(c) | |||||||||||||||||||||||||||||||||
| Total Return(b) | Ending Net Assets (000) | Expenses | Net Investment Income (Loss) | Expenses | Net Investment Income (Loss) | Portfolio Turnover Rate(e) | ||||||||||||||||||||||||||||
| 7.66 | % | $ | 47,518 | 1.11 | % | 0.84 | % | 1.11 | % | 0.85 | % | 132 | % | |||||||||||||||||||||
| (1.76 | ) | 37,684 | 1.14 | 0.84 | 1.14 | 0.84 | 110 | |||||||||||||||||||||||||||
| 32.63 | 6,726 | 1.26 | 0.69 | 1.17 | 0.78 | 122 | ||||||||||||||||||||||||||||
| 2.45 | 457 | 1.54 | * | 0.53 | * | 1.17 | * | 0.90 | * | 34 | ||||||||||||||||||||||||
| 6.86 | 47,805 | 1.86 | 0.09 | 1.85 | 0.10 | 132 | ||||||||||||||||||||||||||||
| (2.47 | ) | 38,591 | 1.89 | 0.09 | 1.89 | 0.09 | 110 | |||||||||||||||||||||||||||
| 31.61 | 4,937 | 1.99 | (0.02 | ) | 1.92 | 0.06 | 122 | |||||||||||||||||||||||||||
| 2.30 | 143 | 2.31 | * | (0.18 | )* | 1.92 | * | 0.21 | * | 34 | ||||||||||||||||||||||||
| 6.36 | 18,489 | 0.74 | * | 1.05 | * | 0.69 | * | 1.10 | * | 132 | ||||||||||||||||||||||||
| 7.93 | 140,976 | 0.86 | 1.09 | 0.86 | 1.10 | 132 | ||||||||||||||||||||||||||||
| (1.49 | ) | 153,632 | 0.89 | 1.11 | 0.89 | 1.11 | 110 | |||||||||||||||||||||||||||
| 32.92 | 57,360 | 1.01 | 0.93 | 0.92 | 1.02 | 122 | ||||||||||||||||||||||||||||
| 2.50 | 11,449 | 1.55 | * | 0.07 | * | �� | 0.92 | * | 0.69 | * | 34 | |||||||||||||||||||||||
| (a) | Per share Net Investment Income (Loss) is calculated using the average daily shares method. |
| (b) | Total return is the combination of changes in NAV without any sales charge, reinvested dividend income at NAV and reinvested capital gains distributions at NAV, if any. Total returns are not annualized. |
| (c) | After fee waiver and/or expense reimbursement from the Adviser, where applicable. |
| (d) | For the period June 17, 2013 (commencement of operations) through August 31, 2013. |
| (e) | Portfolio Turnover Rate is calculated based on the lesser of long-term purchases or sales (as disclosed in Note 5 – Investment Transactions) divided by the average long-term market value during the period. |
| (f) | For the period June 30, 2016 (commencement of operations) through August 31, 2016. |
| * | Annualized. |
See accompanying notes to financial statements.
| NUVEEN | 123 |
Financial Highlights (continued)
Large Cap Growth
Selected data for a share outstanding throughout each period:
| Investment Operations | Less Distributions | |||||||||||||||||||||||||||||||||||
Class (Commencement Date)
Year Ended August 31, | Beginning NAV | Net Investment Income (Loss)(a) | Net Realized/ Unrealized Gain (Loss) | Total | From Net Investment Income | From Accumulated Net Realized Gains | Total | Ending NAV | ||||||||||||||||||||||||||||
Class A (6/13) | ||||||||||||||||||||||||||||||||||||
2016 | $ | 25.28 | $ | 0.13 | $ | 1.24 | $ | 1.37 | $ | (0.09 | ) | $ | (0.87 | ) | $ | (0.96 | ) | $ | 25.69 | |||||||||||||||||
2015 | 26.34 | 0.15 | (0.15 | ) | (0.00 | ) | (0.03 | ) | (1.03 | ) | (1.06 | ) | 25.28 | |||||||||||||||||||||||
2014 | 20.59 | 0.17 | 6.03 | 6.20 | (0.07 | ) | (0.38 | ) | (0.45 | ) | 26.34 | |||||||||||||||||||||||||
2013(d) | 20.00 | 0.05 | 0.54 | 0.59 | — | — | — | 20.59 | ||||||||||||||||||||||||||||
Class C (6/13) | ||||||||||||||||||||||||||||||||||||
2016 | 24.96 | (0.05 | ) | 1.21 | 1.16 | — | (0.87 | ) | (0.87 | ) | 25.25 | |||||||||||||||||||||||||
2015 | 26.18 | (0.06 | ) | (0.13 | ) | (0.19 | ) | — | (1.03 | ) | (1.03 | ) | 24.96 | |||||||||||||||||||||||
2014 | 20.56 | (0.01 | ) | 6.01 | 6.00 | — | (0.38 | ) | (0.38 | ) | 26.18 | |||||||||||||||||||||||||
2013(d) | 20.00 | — | * | 0.56 | 0.56 | — | — | — | 20.56 | |||||||||||||||||||||||||||
Class R6 (6/16) | ||||||||||||||||||||||||||||||||||||
2016(f) | 24.27 | 0.03 | 1.43 | 1.46 | — | — | — | 25.73 | ||||||||||||||||||||||||||||
Class I (6/13) | ||||||||||||||||||||||||||||||||||||
2016 | 25.33 | 0.20 | 1.23 | 1.43 | (0.16 | ) | (0.87 | ) | (1.03 | ) | 25.73 | |||||||||||||||||||||||||
2015 | 26.38 | 0.21 | (0.14 | ) | 0.07 | (0.09 | ) | (1.03 | ) | (1.12 | ) | 25.33 | ||||||||||||||||||||||||
2014 | 20.60 | 0.24 | 6.02 | 6.26 | (0.10 | ) | (0.38 | ) | (0.48 | ) | 26.38 | |||||||||||||||||||||||||
2013(d) | 20.00 | 0.04 | 0.56 | 0.60 | — | — | — | 20.60 | ||||||||||||||||||||||||||||
| 124 | NUVEEN |
| Ratios/Supplemental Data | ||||||||||||||||||||||||||||||||||
| Ratios to Average Net Assets Before Waiver/Reimbursement | Ratios to Average Net Assets After Waiver/Reimbursement(c) | |||||||||||||||||||||||||||||||||
| Total Return(b) | Ending Net Assets (000) | Expenses | Net Investment Income (Loss) | Expenses | Net Investment Income (Loss) | Portfolio Turnover Rate(e) | ||||||||||||||||||||||||||||
| 5.57 | % | $ | 13,654 | 1.22 | % | 0.47 | % | 1.15 | % | 0.53 | % | 117 | % | |||||||||||||||||||||
| 0.00 | 31,442 | 1.24 | 0.49 | 1.16 | 0.56 | 118 | ||||||||||||||||||||||||||||
| 30.45 | 10,734 | 1.35 | 0.53 | 1.17 | 0.72 | 145 | ||||||||||||||||||||||||||||
| 2.95 | 1,017 | 1.49 | ** | 0.92 | ** | 1.15 | ** | 1.25 | ** | 48 | ||||||||||||||||||||||||
| 4.77 | 9,344 | 1.98 | (0.30 | ) | 1.89 | (0.22 | ) | 117 | ||||||||||||||||||||||||||
| (0.74 | ) | 7,621 | 1.99 | (0.29 | ) | 1.91 | (0.22 | ) | 118 | |||||||||||||||||||||||||
| 29.49 | 2,187 | 2.11 | (0.22 | ) | 1.92 | (0.03 | ) | 145 | ||||||||||||||||||||||||||
| 2.80 | 83 | 2.50 | ** | (0.60 | )** | 1.91 | ** | (0.02 | )** | 48 | ||||||||||||||||||||||||
| 6.02 | 27 | 0.85 | ** | 0.65 | ** | 0.70 | ** | 0.81 | ** | 117 | ||||||||||||||||||||||||
| 5.80 | 47,945 | 0.97 | 0.71 | 0.89 | 0.79 | 117 | ||||||||||||||||||||||||||||
| 0.28 | 58,478 | 0.99 | 0.72 | 0.91 | 0.79 | 118 | ||||||||||||||||||||||||||||
| 30.74 | 27,478 | 1.10 | 0.81 | 0.92 | 0.99 | 145 | ||||||||||||||||||||||||||||
| 3.00 | 11,472 | 1.55 | ** | 0.22 | ** | 0.92 | ** | 0.86 | ** | 48 | ||||||||||||||||||||||||
| (a) | Per share Net Investment Income (Loss) is calculated using the average daily shares method. |
| (b) | Total return is the combination of changes in NAV without any sales charge, reinvested dividend income at NAV and reinvested capital gains distributions at NAV, if any. Total returns are not annualized. |
| (c) | After fee waiver and/or expense reimbursement from the Adviser, when applicable. |
| (d) | For the period June 17, 2013 (commencement of operations) through August 31, 2013. |
| (e) | Portfolio Turnover Rate is calculated based on the lesser of long-term purchases or sales (as disclosed in Note 5 – Investment Transactions) divided by the average long-term market value during the period. |
| (f) | For the period June 30, 2016 (commencement of operations) through August 31, 2016. |
| * | Rounds to less than $0.01 per share. |
| ** | Annualized. |
See accompanying notes to financial statements.
| NUVEEN | 125 |
Financial Highlights (continued)
Concentrated Core
Selected data for a share outstanding throughout each period:
| Investment Operations | Less Distributions | |||||||||||||||||||||||||||||||||||
Class (Commencement Date)
Year Ended August 31, | Beginning NAV | Net Investment | Net Realized/ Unrealized Gain (Loss) | Total | From Investment | From Accumulated Net Realized Gains | Total | Ending NAV | ||||||||||||||||||||||||||||
Class A (6/13) | ||||||||||||||||||||||||||||||||||||
2016 | $ | 26.89 | $ | 0.39 | $ | (0.22 | ) | $ | 0.17 | $ | (0.13 | ) | $ | (0.96 | ) | $ | (1.09 | ) | $ | 25.97 | ||||||||||||||||
2015 | 27.16 | 0.20 | (0.14 | ) | 0.06 | (0.02 | ) | (0.31 | ) | (0.33 | ) | 26.89 | ||||||||||||||||||||||||
2014 | 19.66 | 0.19 | 7.37 | 7.56 | (0.04 | ) | (0.02 | ) | (0.06 | ) | 27.16 | |||||||||||||||||||||||||
2013(d) | 20.00 | 0.05 | (0.39 | ) | (0.34 | ) | — | — | — | 19.66 | ||||||||||||||||||||||||||
Class C (6/13) | ||||||||||||||||||||||||||||||||||||
2016 | 26.50 | 0.18 | (0.21 | ) | (0.03 | ) | — | (0.96 | ) | (0.96 | ) | 25.51 | ||||||||||||||||||||||||
2015 | 26.95 | — | * | (0.14 | ) | (0.14 | ) | — | (0.31 | ) | (0.31 | ) | 26.50 | |||||||||||||||||||||||
2014 | 19.63 | 0.01 | 7.33 | 7.34 | — | (0.02 | ) | (0.02 | ) | 26.95 | ||||||||||||||||||||||||||
2013(d) | 20.00 | — | * | (0.37 | ) | (0.37 | ) | — | — | — | 19.63 | |||||||||||||||||||||||||
Class R6 (6/16) | ||||||||||||||||||||||||||||||||||||
2016(f) | 25.22 | 0.07 | 0.73 | 0.80 | — | — | — | 26.02 | ||||||||||||||||||||||||||||
Class I (6/13) | ||||||||||||||||||||||||||||||||||||
2016 | 26.94 | 0.46 | (0.22 | ) | 0.24 | (0.20 | ) | (0.96 | ) | (1.16 | ) | 26.02 | ||||||||||||||||||||||||
2015 | 27.20 | 0.27 | (0.14 | ) | 0.13 | (0.08 | ) | (0.31 | ) | (0.39 | ) | 26.94 | ||||||||||||||||||||||||
2014 | 19.68 | 0.24 | 7.36 | 7.60 | (0.06 | ) | (0.02 | ) | (0.08 | ) | 27.20 | |||||||||||||||||||||||||
2013(d) | 20.00 | 0.04 | (0.36 | ) | (0.32 | ) | — | — | — | 19.68 | ||||||||||||||||||||||||||
| 126 | NUVEEN |
| Ratios/Supplemental Data | ||||||||||||||||||||||||||||||||||
| Ratios to Average Net Assets Before Waiver/Reimbursement | Ratios to Average Net Assets After Waiver/Reimbursement(c) | |||||||||||||||||||||||||||||||||
| Total Return(b) | Ending Net | Expenses | Net Investment Income (Loss) | Expenses | Net Investment Income (Loss) | Portfolio | ||||||||||||||||||||||||||||
| 0.62 | % | $ | 41,053 | 1.32 | % | 1.38 | % | 1.20 | % | 1.50 | % | 103 | % | |||||||||||||||||||||
| 0.21 | 54,805 | 1.33 | 0.61 | 1.21 | 0.72 | 98 | ||||||||||||||||||||||||||||
| 38.46 | 8,315 | 1.85 | 0.15 | 1.22 | 0.77 | 88 | ||||||||||||||||||||||||||||
| (1.70 | ) | 239 | 5.78 | ** | (3.28 | )** | 1.21 | ** | 1.29 | ** | 24 | |||||||||||||||||||||||
| (0.13 | ) | 24,531 | 2.07 | 0.60 | 1.94 | 0.72 | 103 | |||||||||||||||||||||||||||
| (0.53 | ) | 24,583 | 2.08 | (0.10 | ) | 1.96 | 0.01 | 98 | ||||||||||||||||||||||||||
| 37.39 | 1,508 | 2.65 | (0.63 | ) | 1.97 | 0.05 | 88 | |||||||||||||||||||||||||||
| (1.85 | ) | 117 | 7.21 | ** | (5.13 | )** | 1.97 | ** | 0.11 | ** | 24 | |||||||||||||||||||||||
| 3.17 | 26 | 0.89 | ** | 1.48 | ** | 0.73 | ** | 1.64 | ** | 103 | ||||||||||||||||||||||||
| 0.88 | 32,291 | 1.06 | 1.65 | 0.95 | 1.77 | 103 | ||||||||||||||||||||||||||||
| 0.47 | 52,955 | 1.07 | 0.84 | 0.96 | 0.95 | 98 | ||||||||||||||||||||||||||||
| 38.76 | 8,569 | 1.71 | 0.26 | 0.97 | 1.00 | 88 | ||||||||||||||||||||||||||||
| (1.65) | 1,018 | 8.54 | ** | (6.56 | )** | 0.97 | ** | 1.01 | ** | 24 | ||||||||||||||||||||||||
| (a) | Per share Net Investment Income (Loss) is calculated using the average daily shares method. |
| (b) | Total return is the combination of changes in NAV without any sales charge, reinvested dividend income at NAV and reinvested capital gains distributions at NAV, if any. Total returns are not annualized. |
| (c) | After fee waiver and/or expense reimbursement from the Adviser, when applicable. |
| (d) | For the period June 17, 2013 (commencement of operations) through August 31, 2013. |
| (e) | Portfolio Turnover Rate is calculated based on the lesser of long-term purchases or sales (as disclosed in Note 5 – Investment Transactions) divided by the average long-term market value during the period. |
| (f) | For the period June 30, 2016 (commencement of operations) through August 31, 2016. |
| * | Rounds to less than $0.01 per share. |
| ** | Annualized. |
See accompanying notes to financial statements.
| NUVEEN | 127 |
Financial Highlights (continued)
Core Dividend
Selected data for a share outstanding throughout each period:
| Investment Operations | Less Distributions | |||||||||||||||||||||||||||||||||||
Class (Commencement Date)
Year Ended August 31, | Beginning NAV | Net Investment Income (Loss)(a) | Net Realized/ Unrealized Gain (Loss) | Total | From Net Investment Income | From Accumulated Net Realized Gains | Total | Ending NAV | ||||||||||||||||||||||||||||
Class A (6/13) | ||||||||||||||||||||||||||||||||||||
2016 | $ | 24.13 | $ | 0.49 | $ | 0.84 | $ | 1.33 | $ | (0.38 | ) | $ | (0.37 | ) | $ | (0.75 | ) | $ | 24.71 | |||||||||||||||||
2015 | 25.90 | 0.45 | (1.15 | ) | (0.70 | ) | (0.42 | ) | (0.65 | ) | (1.07 | ) | 24.13 | |||||||||||||||||||||||
2014 | 20.32 | 0.48 | 5.65 | 6.13 | (0.42 | ) | (0.13 | ) | (0.55 | ) | 25.90 | |||||||||||||||||||||||||
2013(d) | 20.00 | 0.08 | 0.24 | 0.32 | — | — | — | 20.32 | ||||||||||||||||||||||||||||
Class C (6/13) | ||||||||||||||||||||||||||||||||||||
2016 | 24.08 | 0.31 | 0.83 | 1.14 | (0.20 | ) | (0.37 | ) | (0.57 | ) | 24.65 | |||||||||||||||||||||||||
2015 | 25.85 | 0.26 | (1.15 | ) | (0.89 | ) | (0.23 | ) | (0.65 | ) | (0.88 | ) | 24.08 | |||||||||||||||||||||||
2014 | 20.28 | 0.29 | 5.66 | 5.95 | (0.25 | ) | (0.13 | ) | (0.38 | ) | 25.85 | |||||||||||||||||||||||||
2013(d) | 20.00 | 0.04 | 0.24 | 0.28 | — | — | — | 20.28 | ||||||||||||||||||||||||||||
Class I (6/13) | ||||||||||||||||||||||||||||||||||||
2016 | 24.14 | 0.55 | 0.83 | 1.38 | (0.44 | ) | (0.37 | ) | (0.81 | ) | 24.71 | |||||||||||||||||||||||||
2015 | 25.91 | 0.51 | (1.14 | ) | (0.63 | ) | (0.49 | ) | (0.65 | ) | (1.14 | ) | 24.14 | |||||||||||||||||||||||
2014 | 20.32 | 0.54 | 5.65 | 6.19 | (0.47 | ) | (0.13 | ) | (0.60 | ) | 25.91 | |||||||||||||||||||||||||
2013(d) | 20.00 | 0.07 | 0.25 | 0.32 | — | — | — | 20.32 | ||||||||||||||||||||||||||||
| 128 | NUVEEN |
| Ratios/Supplemental Data | ||||||||||||||||||||||||||||||||||
| Ratios to Average Net Assets Before Waiver/Reimbursement | Ratios to Average Net Assets After Waiver/Reimbursement(c) | |||||||||||||||||||||||||||||||||
| Total Return(b) | Ending Net Assets (000) | Expenses | Net Investment Income (Loss) | Expenses | Net Investment Income (Loss) | Portfolio Turnover Rate(e) | ||||||||||||||||||||||||||||
| 5.68 | % | $ | 23,978 | 1.33 | % | 1.89 | % | 1.14 | % | 2.08 | % | 127 | % | |||||||||||||||||||||
| (2.82 | ) | 20,601 | 1.37 | 1.54 | 1.16 | 1.75 | 174 | |||||||||||||||||||||||||||
| 30.48 | 8,261 | 1.76 | 1.40 | 1.17 | 1.99 | 117 | ||||||||||||||||||||||||||||
| 1.60 | 559 | 5.29 | * | (2.26 | )* | 1.17 | * | 1.86 | * | 29 | ||||||||||||||||||||||||
| 4.86 | 5,978 | 2.08 | 1.13 | 1.89 | 1.32 | 127 | ||||||||||||||||||||||||||||
| (3.55 | ) | 5,950 | 2.12 | 0.80 | 1.91 | 1.01 | 174 | |||||||||||||||||||||||||||
| 29.55 | 2,151 | 2.54 | 0.59 | 1.92 | 1.21 | 117 | ||||||||||||||||||||||||||||
| 1.40 | 111 | 6.52 | * | (3.70 | )* | 1.92 | * | 0.90 | * | 29 | ||||||||||||||||||||||||
| 5.91 | 12,605 | 1.08 | 2.13 | 0.89 | 2.31 | 127 | ||||||||||||||||||||||||||||
| (2.57 | ) | 18,035 | 1.12 | 1.79 | 0.91 | 2.00 | 174 | |||||||||||||||||||||||||||
| 30.85 | 6,571 | 1.58 | 1.63 | 0.92 | 2.29 | 117 | ||||||||||||||||||||||||||||
| 1.60 | 1,044 | 7.50 | * | (4.86 | )* | 0.92 | * | 1.72 | * | 29 | ||||||||||||||||||||||||
| (a) | Per share Net Investment Income (Loss) is calculated using the average daily shares method. |
| (b) | Total return is the combination of changes in NAV without any sales charge, reinvested dividend income at NAV and reinvested capital gains distributions at NAV, if any. Total returns are not annualized. |
| (c) | After fee waiver and/or expense reimbursement from the Adviser, when applicable. |
| (d) | For the period June 17, 2013 (commencement of operations) through August 31, 2013. |
| (e) | Portfolio Turnover Rate is calculated based on the lesser of long-term purchases or sales (as disclosed in Note 5 – Investment Transactions) divided by the average long-term market value during the period. |
| * | Annualized. |
See accompanying notes to financial statements.
| NUVEEN | 129 |
Financial Highlights (continued)
Growth
Selected data for a share outstanding throughout each period:
| Investment Operations | Less Distributions | |||||||||||||||||||||||||||||||||||
Class (Commencement Date)
| Beginning NAV | Net Investment Income (Loss)(a) | Net Realized/ Unrealized Gain (Loss) | Total | From Net Investment Income | From Accumulated Net Realized Gains | Total | Ending NAV | ||||||||||||||||||||||||||||
Class A (3/06) | ||||||||||||||||||||||||||||||||||||
Year Ended 8/31: | ||||||||||||||||||||||||||||||||||||
2016 | $ | 28.79 | $ | 0.20 | $ | 2.17 | $ | 2.37 | $ | (0.18 | ) | $ | (3.46 | ) | $ | (3.64 | ) | $ | 27.52 | |||||||||||||||||
2015 | 30.49 | 0.12 | 0.89 | 1.01 | — | (2.71 | ) | (2.71 | ) | 28.79 | ||||||||||||||||||||||||||
2014 | 25.03 | (0.01 | ) | 6.08 | 6.07 | — | (0.61 | ) | (0.61 | ) | 30.49 | |||||||||||||||||||||||||
2013(e) | 25.68 | — | ** | (0.65 | ) | (0.65 | ) | — | — | — | 25.03 | |||||||||||||||||||||||||
Year Ended 7/31: | ||||||||||||||||||||||||||||||||||||
2013 | 21.09 | 0.01 | 4.62 | 4.63 | (0.04 | ) | — | (0.04 | ) | 25.68 | ||||||||||||||||||||||||||
2012 | 20.23 | (0.02 | ) | 0.88 | 0.86 | — | — | — | 21.09 | |||||||||||||||||||||||||||
Class C (3/06) | ||||||||||||||||||||||||||||||||||||
Year Ended 8/31: | ||||||||||||||||||||||||||||||||||||
2016 | 26.72 | — | ** | 1.99 | 1.99 | — | (3.46 | ) | (3.46 | ) | 25.25 | |||||||||||||||||||||||||
2015 | 28.69 | (0.09 | ) | 0.83 | 0.74 | — | (2.71 | ) | (2.71 | ) | 26.72 | |||||||||||||||||||||||||
2014 | 23.75 | (0.21 | ) | 5.76 | 5.55 | — | (0.61 | ) | (0.61 | ) | 28.69 | |||||||||||||||||||||||||
2013(e) | 24.38 | (0.01 | ) | (0.62 | ) | (0.63 | ) | — | — | — | 23.75 | |||||||||||||||||||||||||
Year Ended 7/31: | ||||||||||||||||||||||||||||||||||||
2013 | 20.14 | (0.18 | ) | 4.42 | 4.24 | — | — | — | 24.38 | |||||||||||||||||||||||||||
2012 | 19.46 | (0.16 | ) | 0.84 | 0.68 | — | — | — | 20.14 | |||||||||||||||||||||||||||
Class R3 (3/09) | ||||||||||||||||||||||||||||||||||||
Year Ended 8/31: | ||||||||||||||||||||||||||||||||||||
2016 | 28.56 | 0.14 | 2.13 | 2.27 | (0.10 | ) | (3.46 | ) | (3.56 | ) | 27.27 | |||||||||||||||||||||||||
2015 | 30.34 | 0.05 | 0.88 | 0.93 | — | (2.71 | ) | (2.71 | ) | 28.56 | ||||||||||||||||||||||||||
2014 | 24.96 | (0.08 | ) | 6.07 | 5.99 | — | (0.61 | ) | (0.61 | ) | 30.34 | |||||||||||||||||||||||||
2013(e) | 25.62 | — | ** | (0.66 | ) | (0.66 | ) | — | — | — | 24.96 | |||||||||||||||||||||||||
Year Ended 7/31: | ||||||||||||||||||||||||||||||||||||
2013 | 21.06 | (0.03 | ) | 4.59 | 4.56 | — | — | — | 25.62 | |||||||||||||||||||||||||||
2012 | 20.24 | (0.07 | ) | 0.89 | 0.82 | — | — | — | 21.06 | |||||||||||||||||||||||||||
Class I (3/06) | ||||||||||||||||||||||||||||||||||||
Year Ended 8/31: | ||||||||||||||||||||||||||||||||||||
2016 | 29.25 | 0.28 | 2.20 | 2.48 | (0.26 | ) | (3.46 | ) | (3.72 | ) | 28.01 | |||||||||||||||||||||||||
2015 | 30.86 | 0.21 | 0.89 | 1.10 | — | (2.71 | ) | (2.71 | ) | 29.25 | ||||||||||||||||||||||||||
2014 | 25.27 | 0.06 | 6.15 | 6.21 | (0.01 | ) | (0.61 | ) | (0.62 | ) | 30.86 | |||||||||||||||||||||||||
2013(e) | 25.92 | 0.01 | (0.66 | ) | (0.65 | ) | — | — | — | 25.27 | ||||||||||||||||||||||||||
Year Ended 7/31: | ||||||||||||||||||||||||||||||||||||
2013 | 21.29 | 0.05 | 4.67 | 4.72 | (0.09 | ) | — | (0.09 | ) | 25.92 | ||||||||||||||||||||||||||
2012 | 20.40 | 0.05 | 0.88 | 0.93 | (0.04 | ) | — | (0.04 | ) | 21.29 | ||||||||||||||||||||||||||
| 130 | NUVEEN |
| Ratios/Supplemental Data | ||||||||||||||||||||||||||||||||||
| Ratios to Average Net Assets Before Waiver/Reimbursement | Ratios to Average Net Assets After Waiver/Reimbursement(c) | |||||||||||||||||||||||||||||||||
| Total Return(b) | Ending Net Assets (000) | Expenses | Net Investment Income (Loss) | Expenses | Net Investment Income (Loss) | Portfolio Turnover Rate(d) | ||||||||||||||||||||||||||||
| 8.78 | % | $ | 9,758 | 1.31 | % | 0.62 | % | 1.18 | % | 0.75 | % | 59 | % | |||||||||||||||||||||
| 3.40 | 8,792 | 1.24 | 0.38 | 1.21 | 0.41 | 65 | ||||||||||||||||||||||||||||
| 24.55 | 15,558 | 1.45 | (0.27 | ) | 1.22 | (0.05 | ) | 41 | ||||||||||||||||||||||||||
| (2.53 | ) | 13,956 | 1.37 | * | (0.03 | )* | 1.22 | * | 0.13 | * | 2 | |||||||||||||||||||||||
| 21.97 | 13,858 | 1.40 | (0.16 | ) | 1.22 | 0.02 | 67 | |||||||||||||||||||||||||||
| 4.25 | 12,947 | 1.31 | (0.18 | ) | 1.23 | (0.09 | ) | 72 | ||||||||||||||||||||||||||
| 7.95 | 7,987 | 2.06 | (0.14 | ) | 1.93 | (0.01 | ) | 59 | ||||||||||||||||||||||||||
| 2.62 | 9,150 | 2.00 | (0.36 | ) | 1.96 | (0.33 | ) | 65 | ||||||||||||||||||||||||||
| 23.67 | 9,094 | 2.21 | (1.01 | ) | 1.97 | (0.77 | ) | 41 | ||||||||||||||||||||||||||
| (2.58 | ) | 4,967 | 2.13 | * | (0.80 | )* | 1.97 | * | (0.63 | )* | 2 | |||||||||||||||||||||||
| 21.05 | 4,143 | 2.18 | (1.02 | ) | 1.97 | (0.81 | ) | 67 | ||||||||||||||||||||||||||
| 3.49 | 1,799 | 2.07 | (0.91 | ) | 1.98 | (0.82 | ) | 72 | ||||||||||||||||||||||||||
| 8.48 | 193 | 1.56 | 0.38 | 1.41 | 0.53 | 59 | ||||||||||||||||||||||||||||
| 3.14 | 65 | 1.49 | 0.14 | 1.46 | 0.17 | 65 | ||||||||||||||||||||||||||||
| 24.29 | 64 | 1.70 | (0.52 | ) | 1.47 | (0.29 | ) | 41 | ||||||||||||||||||||||||||
| (2.58 | ) | 53 | 1.63 | * | (0.28 | )* | 1.48 | * | (0.13 | )* | 2 | |||||||||||||||||||||||
| 21.65 | 54 | 1.63 | (0.28 | ) | 1.47 | (0.12 | ) | 67 | ||||||||||||||||||||||||||
| 4.05 | 110 | 1.53 | (0.42 | ) | 1.48 | (0.37 | ) | 72 | ||||||||||||||||||||||||||
| 9.05 | 31,830 | 1.06 | 0.87 | 0.93 | 1.00 | 59 | ||||||||||||||||||||||||||||
| 3.67 | 29,230 | 1.00 | 0.64 | 0.96 | 0.68 | 65 | ||||||||||||||||||||||||||||
| 24.87 | 24,449 | 1.20 | (0.01 | ) | 0.97 | 0.22 | 41 | |||||||||||||||||||||||||||
| (2.51 | ) | 15,456 | 1.12 | * | 0.23 | * | 0.97 | * | 0.38 | * | 2 | |||||||||||||||||||||||
| 22.26 | 15,621 | 1.16 | 0.04 | 0.97 | 0.23 | 67 | ||||||||||||||||||||||||||||
| 4.59 | 13,301 | 1.07 | 0.14 | 0.98 | 0.23 | 72 | ||||||||||||||||||||||||||||
| (a) | Per share Net Investment Income (Loss) is calculated using the average daily shares method. |
| (b) | Total return is the combination of changes in NAV without any sales charge, reinvested dividend income at NAV and reinvested capital gains distributions at NAV, if any. Total returns are not annualized. |
| (c) | After fee waiver and/or expense reimbursement from the Adviser, where applicable. |
| (d) | Portfolio Turnover Rate is calculated based on the lesser of long-term purchases or sales (as disclosed in Note 5 – Investment Transactions) divided by the average long-term market value during the period. |
| (e) | For the one month ended August 31, 2013. |
| * | Annualized. |
| ** | Rounds to less than $0.01 per share. |
See accompanying notes to financial statements.
| NUVEEN | 131 |
Financial Highlights (continued)
Large Cap Core Plus
Selected data for a share outstanding throughout each period:
| Investment Operations | Less Distributions | |||||||||||||||||||||||||||||||||||
Class (Commencement Date)
Year Ended August 31, | Beginning NAV | Net Investment Income (Loss)(a) | Net Realized/ Unrealized Gain (Loss) | Total | From Net Investment Income | From Accumulated Net Realized Gains | Total | Ending NAV | ||||||||||||||||||||||||||||
Class A (6/13) | ||||||||||||||||||||||||||||||||||||
2016 | $ | 25.02 | $ | 0.09 | $ | 1.38 | $ | 1.47 | $ | (0.09 | ) | $ | (0.84 | ) | $ | (0.93 | ) | $ | 25.56 | |||||||||||||||||
2015 | 26.53 | 0.09 | (0.59 | ) | (0.50 | ) | — | (1.01 | ) | (1.01 | ) | 25.02 | ||||||||||||||||||||||||
2014 | 20.53 | 0.04 | 6.32 | 6.36 | (0.02 | ) | (0.34 | ) | (0.36 | ) | 26.53 | |||||||||||||||||||||||||
2013(e) | 20.00 | 0.03 | 0.50 | 0.53 | — | — | — | 20.53 | ||||||||||||||||||||||||||||
Class C (6/13) | ||||||||||||||||||||||||||||||||||||
2016 | 24.64 | (0.09 | ) | 1.34 | 1.25 | — | (0.84 | ) | (0.84 | ) | 25.05 | |||||||||||||||||||||||||
2015 | 26.33 | (0.12 | ) | (0.56 | ) | (0.68 | ) | — | (1.01 | ) | (1.01 | ) | 24.64 | |||||||||||||||||||||||
2014 | 20.51 | (0.13 | ) | 6.29 | 6.16 | — | (0.34 | ) | (0.34 | ) | 26.33 | |||||||||||||||||||||||||
2013(e) | 20.00 | (0.03 | ) | 0.54 | 0.51 | — | — | — | 20.51 | |||||||||||||||||||||||||||
Class I (6/13) | ||||||||||||||||||||||||||||||||||||
2016 | 25.11 | 0.15 | 1.38 | 1.53 | (0.15 | ) | (0.84 | ) | (0.99 | ) | 25.65 | |||||||||||||||||||||||||
2015 | 26.59 | 0.16 | (0.60 | ) | (0.44 | ) | (0.03 | ) | (1.01 | ) | (1.04 | ) | 25.11 | |||||||||||||||||||||||
2014 | 20.55 | 0.11 | 6.32 | 6.43 | (0.05 | ) | (0.34 | ) | (0.39 | ) | 26.59 | |||||||||||||||||||||||||
2013(e) | 20.00 | 0.02 | 0.53 | 0.55 | — | — | — | 20.55 | ||||||||||||||||||||||||||||
| 132 | NUVEEN |
| Ratios/Supplemental Data | ||||||||||||||||||||||||||||||||||
| Ratios to Average Net Assets Before Waiver/Reimbursement(d) | Ratios to Average Net Assets After Waiver/Reimbursement(c)(d) | |||||||||||||||||||||||||||||||||
| Total Return(b) | Ending Net Assets (000) | Expenses | Net Investment Income (Loss) | Expenses | Net Income | Portfolio Turnover Rate(f) | ||||||||||||||||||||||||||||
| 6.00 | % | $ | 15,053 | 2.51 | % | 0.14 | % | 2.29 | % | 0.36 | % | 143 | % | |||||||||||||||||||||
| (1.99 | ) | 17,191 | 2.42 | 0.12 | 2.22 | 0.33 | 153 | |||||||||||||||||||||||||||
| 31.18 | 7,108 | 2.55 | (0.10 | ) | 2.28 | 0.17 | 152 | |||||||||||||||||||||||||||
| 2.70 | 456 | 2.38 | * | 0.26 | * | 1.99 | * | 0.65 | * | 41 | ||||||||||||||||||||||||
| 5.18 | 13,345 | 3.25 | (0.60 | ) | 3.04 | (0.39 | ) | 143 | ||||||||||||||||||||||||||
| (2.70 | ) | 15,962 | 3.18 | (0.67 | ) | 2.97 | (0.46 | ) | 153 | |||||||||||||||||||||||||
| 30.21 | 3,182 | 3.28 | (0.77 | ) | 3.03 | (0.52 | ) | 152 | ||||||||||||||||||||||||||
| 2.60 | 51 | 3.31 | * | (1.33 | )* | 2.66 | * | (0.67 | )* | 41 | ||||||||||||||||||||||||
| 6.25 | 42,919 | 2.24 | 0.40 | 2.03 | 0.61 | 143 | ||||||||||||||||||||||||||||
| (1.76 | ) | 74,740 | 2.18 | 0.38 | 1.97 | 0.59 | 153 | |||||||||||||||||||||||||||
| 31.51 | 39,257 | 2.33 | 0.17 | 2.06 | 0.44 | 152 | ||||||||||||||||||||||||||||
| 2.80 | 18,090 | 2.33 | * | (0.30 | )* | 1.66 | * | 0.37 | * | 41 | ||||||||||||||||||||||||
| (a) | Per share Net Investment Income (Loss) is calculated using the average daily shares method. |
| (b) | Total return is the combination of changes in NAV without any sales charge, reinvested dividend income at NAV and reinvested capital gains distributions at NAV, if any. Total returns are not annualized. |
| (c) | After fee waiver and/or expense reimbursement from the Adviser. |
| (d) | Each ratio includes the effect of dividends expense on common stocks sold short and prime broker expenses as follows: |
| Ratios of Dividend Expense on Common Stocks Sold Short to Average Net Assets | Ratios of Prime Broker Expenses to Average Net Assets | |||||||||||||||||||||||||||
| Year Ended August 31, | Class A | Class C | Class I | Class A | Class C | Class I | ||||||||||||||||||||||
2016 | 0.45 | % | 0.45 | % | 0.45 | % | 0.37 | % | 0.37 | % | 0.36 | % | ||||||||||||||||
2015 | 0.44 | 0.44 | 0.45 | 0.31 | 0.31 | 0.31 | ||||||||||||||||||||||
2014 | 0.48 | 0.47 | 0.48 | 0.34 | 0.34 | 0.36 | ||||||||||||||||||||||
2013(e) | 0.52 | * | 0.44 | * | 0.44 | * | — | — | — | |||||||||||||||||||
| (e) | For the period June 17, 2013 (commencement of operations) through August 31, 2013. |
| (f) | Portfolio Turnover Rate is calculated based on the lesser of long-term purchases or sales (as disclosed in Note 5 – Investment Transactions) divided by the average long-term market value during the period. |
| * | Annualized. |
See accompanying notes to financial statements.
| NUVEEN | 133 |
Financial Highlights (continued)
Equity Long/Short
Selected data for a share outstanding throughout each period:
| Investment Operations | Less Distributions | |||||||||||||||||||||||||||||||||||
Class (Commencement Date)
| Beginning NAV | Net Investment Income (Loss)(a) | Net Unrealized Gain (Loss) | Total | From Investment | From Accumulated Net Realized Gains | Total | Ending NAV | ||||||||||||||||||||||||||||
Class A (12/08) | ||||||||||||||||||||||||||||||||||||
Year Ended 8/31: | ||||||||||||||||||||||||||||||||||||
2016 | $ | 32.61 | $ | (0.11 | ) | $ | 0.11 | $ | — | $ | — | $ | — | $ | — | $ | 32.61 | |||||||||||||||||||
2015 | 31.72 | (0.26 | ) | 1.23 | 0.97 | — | (0.08 | ) | (0.08 | ) | 32.61 | |||||||||||||||||||||||||
2014 | 28.72 | (0.23 | ) | 4.78 | 4.55 | — | (1.55 | ) | (1.55 | ) | 31.72 | |||||||||||||||||||||||||
2013(g) | 29.54 | 0.02 | (0.84 | ) | (0.82 | ) | — | — | — | 28.72 | ||||||||||||||||||||||||||
Year Ended 7/31: | ||||||||||||||||||||||||||||||||||||
2013 | 26.81 | (0.03 | ) | 5.02 | 4.99 | — | (2.26 | ) | (2.26 | ) | 29.54 | |||||||||||||||||||||||||
2012 | 27.28 | (0.08 | ) | 0.93 | 0.85 | — | (1.32 | ) | (1.32 | ) | 26.81 | |||||||||||||||||||||||||
Class C (12/08) | ||||||||||||||||||||||||||||||||||||
Year Ended 8/31: | ||||||||||||||||||||||||||||||||||||
2016 | 30.80 | (0.33 | ) | 0.10 | (0.23 | ) | — | — | — | 30.57 | ||||||||||||||||||||||||||
2015 | 30.19 | (0.48 | ) | 1.17 | 0.69 | — | (0.08 | ) | (0.08 | ) | 30.80 | |||||||||||||||||||||||||
2014 | 27.60 | (0.43 | ) | 4.57 | 4.14 | — | (1.55 | ) | (1.55 | ) | 30.19 | |||||||||||||||||||||||||
2013(g) | 28.40 | — | ** | (0.80 | ) | (0.80 | ) | — | — | — | 27.60 | |||||||||||||||||||||||||
Year Ended 7/31: | ||||||||||||||||||||||||||||||||||||
2013 | 26.04 | (0.19 | ) | 4.81 | 4.62 | — | (2.26 | ) | (2.26 | ) | 28.40 | |||||||||||||||||||||||||
2012 | 26.75 | (0.27 | ) | 0.88 | 0.61 | — | (1.32 | ) | (1.32 | ) | 26.04 | |||||||||||||||||||||||||
Class I (12/08) | ||||||||||||||||||||||||||||||||||||
Year Ended 8/31: | ||||||||||||||||||||||||||||||||||||
2016 | 33.18 | (0.06 | ) | 0.15 | 0.09 | — | — | — | 33.27 | |||||||||||||||||||||||||||
2015 | 32.20 | (0.16 | ) | 1.22 | 1.06 | — | (0.08 | ) | (0.08 | ) | 33.18 | |||||||||||||||||||||||||
2014 | 29.10 | (0.12 | ) | 4.81 | 4.69 | (0.04 | ) | (1.55 | ) | (1.59 | ) | 32.20 | ||||||||||||||||||||||||
2013(g) | 29.93 | 0.03 | (0.86 | ) | (0.83 | ) | — | — | — | 29.10 | ||||||||||||||||||||||||||
Year Ended 7/31: | ||||||||||||||||||||||||||||||||||||
2013 | 27.06 | 0.07 | 5.06 | 5.13 | — | (2.26 | ) | (2.26 | ) | 29.93 | ||||||||||||||||||||||||||
2012 | 27.45 | (0.04 | ) | 0.97 | 0.93 | — | (1.32 | ) | (1.32 | ) | 27.06 | |||||||||||||||||||||||||
| 134 | NUVEEN |
| Ratios/Supplemental Data | ||||||||||||||||||||||||||||||||||
| Ratios to Average Net Assets Before Waiver/Reimbursement(d) | Ratios to Average Net Assets After Waiver/Reimbursement(c)(d) | |||||||||||||||||||||||||||||||||
| Total Return(b) | Ending Net Assets (000) | Expenses | Net Investment Income (Loss) | Expenses | Net Investment Income (Loss) | Portfolio Turnover Rate(e) | ||||||||||||||||||||||||||||
| 0.00 | % | $ | 26,012 | 3.78 | % | (0.53 | )% | 3.58 | % | (0.33 | )% | 224 | % | |||||||||||||||||||||
| 3.06 | 24,821 | 3.76 | (1.03 | ) | 3.53 | (0.79 | ) | 222 | ||||||||||||||||||||||||||
| 16.06 | 13,697 | 4.24 | (1.53 | ) | 3.46 | (0.75 | ) | 232 | ||||||||||||||||||||||||||
| (2.78 | ) | 390 | 5.42 | * | (1.73 | )* | 3.04 | * | 0.65 | * | 12 | |||||||||||||||||||||||
| 20.39 | 326 | 13.43 | (10.94 | ) | 2.62 | (0.13 | ) | 292 | ||||||||||||||||||||||||||
| 3.75 | 54 | 7.26 | (5.26 | ) | 2.31 | (0.31 | ) | 67 | ||||||||||||||||||||||||||
| (0.75 | ) | 8,236 | 4.53 | (1.29 | ) | 4.34 | (1.09 | ) | 224 | |||||||||||||||||||||||||
| 2.28 | 8,087 | 4.52 | (1.76 | ) | 4.29 | (1.53 | ) | 222 | ||||||||||||||||||||||||||
| 15.20 | 4,080 | 5.04 | (2.30 | ) | 4.21 | (1.47 | ) | 232 | ||||||||||||||||||||||||||
| (2.82 | ) | 138 | 6.24 | * | (2.44 | )* | 3.81 | * | (0.01 | )* | 12 | |||||||||||||||||||||||
| 19.53 | 64 | 10.85 | (8.13 | ) | 3.47 | (0.74 | ) | 292 | ||||||||||||||||||||||||||
| 2.90 | 54 | 8.01 | (6.01 | ) | 3.06 | (1.06 | ) | 67 | ||||||||||||||||||||||||||
| 0.27 | 48,905 | 3.52 | (0.37 | ) | 3.33 | (0.18 | ) | 224 | ||||||||||||||||||||||||||
| 3.29 | 53,559 | 3.52 | (0.72 | ) | 3.28 | (0.48 | ) | 222 | ||||||||||||||||||||||||||
| 16.34 | 16,216 | 4.20 | (1.33 | ) | 3.27 | (0.40 | ) | 232 | ||||||||||||||||||||||||||
| (2.77 | ) | 4,758 | 5.07 | * | (1.17 | )* | 2.78 | * | 1.11 | * | 12 | |||||||||||||||||||||||
| 20.74 | 1,611 | 9.92 | (7.20 | ) | 2.46 | 0.26 | 292 | |||||||||||||||||||||||||||
| 4.03 | 1,224 | 7.69 | (5.95 | ) | 1.92 | (0.17 | ) | 67 | ||||||||||||||||||||||||||
| (a) | Per share Net Investment Income (Loss) is calculated using the average daily shares method. |
| (b) | Total return is the combination of changes in NAV without any sales charge, reinvested dividend income at NAV and reinvested capital gains distributions at NAV, if any. Total returns are not annualized. Performance prior to March 1, 2013, reflects the Fund’s performance under the management of a sub-adviser using investment strategies that differed significantly from those currently in place. |
| (c) | After fee waiver and/or expense reimbursement from the Adviser, where applicable. |
| (d) | Each ratio includes the effect of dividends expense on common stocks sold short, enhanced custody expense and/or prime broker expenses as follows: |
| Ratios of Dividends Expense on Common Stocks Sold Short to Average Net Assets | Ratios of Enhanced Custody and/or Prime Broker Expenses to Average Net Assets(f) | |||||||||||||||||||||||||||
| Class A | Class C | Class I | Class A | Class C | Class I | |||||||||||||||||||||||
Year Ended 8/31: | ||||||||||||||||||||||||||||
2016 | 1.19 | % | 1.20 | % | 1.20 | % | 0.77 | % | 0.77 | % | 0.77 | % | ||||||||||||||||
2015 | 1.17 | 1.19 | 1.17 | 0.74 | 0.74 | 0.75 | ||||||||||||||||||||||
2014 | 1.12 | 1.11 | 1.12 | 0.72 | 0.74 | 0.78 | ||||||||||||||||||||||
2013(g) | 1.42 | * | 1.46 | * | 1.42 | * | — | — | — | |||||||||||||||||||
Year Ended 7/31: | ||||||||||||||||||||||||||||
2013 | 0.84 | 0.89 | 0.89 | 0.26 | 0.32 | 0.32 | ||||||||||||||||||||||
2012 | 0.70 | 0.70 | 0.58 | 0.13 | 0.13 | 0.13 | ||||||||||||||||||||||
| (e) | Portfolio Turnover Rate is calculated based on the lesser of long-term purchases or sales (as disclosed in Note 5 – Investment Transactions) divided by the average long-term market value during the period. |
| (f) | Effective June 21, 2013 the Fund ended its enhanced custody program and began selling securities short through a prime broker. |
| (g) | For the one month ended August 31, 2013. |
| * | Annualized. |
| ** | Rounds to less than $0.01 per share. |
See accompanying notes to financial statements.
| NUVEEN | 135 |
Financial Highlights (continued)
Equity Market Neutral
Selected data for a share outstanding throughout each period:
| Investment Operations | Less Distributions | |||||||||||||||||||||||||||||||||||
Class (Commencement Date)
Year Ended August 31, | Beginning NAV | Net Investment | Net Realized/ Unrealized Gain (Loss) | Total | From Investment | From Accumulated Net Realized Gains | Total | Ending NAV | ||||||||||||||||||||||||||||
Class A (6/13) | ||||||||||||||||||||||||||||||||||||
2016 | $ | 21.39 | $ | (0.28 | ) | $ | 0.90 | $ | 0.62 | $ | — | $ | (0.37 | ) | $ | (0.37 | ) | $ | 21.64 | |||||||||||||||||
2015 | 21.27 | (0.32 | ) | 0.50 | 0.18 | — | (0.06 | ) | (0.06 | ) | 21.39 | |||||||||||||||||||||||||
2014 | 20.53 | (0.44 | ) | 1.38 | 0.94 | — | (0.20 | ) | (0.20 | ) | 21.27 | |||||||||||||||||||||||||
2013(e) | 20.00 | (0.04 | ) | 0.57 | 0.53 | — | — | — | 20.53 | |||||||||||||||||||||||||||
Class C (6/13) | ||||||||||||||||||||||||||||||||||||
2016 | 21.04 | (0.44 | ) | 0.90 | 0.46 | — | (0.37 | ) | (0.37 | ) | 21.13 | |||||||||||||||||||||||||
2015 | 21.08 | (0.47 | ) | 0.49 | 0.02 | — | (0.06 | ) | (0.06 | ) | 21.04 | |||||||||||||||||||||||||
2014 | 20.50 | (0.58 | ) | 1.36 | 0.78 | — | (0.20 | ) | (0.20 | ) | 21.08 | |||||||||||||||||||||||||
2013(e) | 20.00 | (0.08 | ) | 0.58 | 0.50 | — | — | — | 20.50 | |||||||||||||||||||||||||||
Class I (6/13) | ||||||||||||||||||||||||||||||||||||
2016 | 21.51 | (0.23 | ) | 0.91 | 0.68 | — | (0.37 | ) | (0.37 | ) | 21.82 | |||||||||||||||||||||||||
2015 | 21.34 | (0.27 | ) | 0.50 | 0.23 | — | (0.06 | ) | (0.06 | ) | 21.51 | |||||||||||||||||||||||||
2014 | 20.54 | (0.38 | ) | 1.38 | 1.00 | — | (0.20 | ) | (0.20 | ) | 21.34 | |||||||||||||||||||||||||
2013(e) | 20.00 | (0.04 | ) | 0.58 | 0.54 | — | — | — | 20.54 | |||||||||||||||||||||||||||
| 136 | NUVEEN |
| Ratios/Supplemental Data | ||||||||||||||||||||||||||||||||||
| Ratios to Average Net Assets Before Waiver/Reimbursement(d) | Ratios to Average Net Assets After Waiver/Reimbursement(c)(d) | |||||||||||||||||||||||||||||||||
| Total Return(b) | Ending Net Assets (000) | Expenses | Net Investment Income (Loss) | Expenses | Net Investment Income (Loss) | Portfolio Turnover Rate(f) | ||||||||||||||||||||||||||||
| 2.86 | % | $ | 9,289 | 3.29 | % | (1.47 | )% | 3.10 | % | (1.28 | )% | 187 | % | |||||||||||||||||||||
| 0.86 | 8,972 | 3.49 | (1.73 | ) | 3.24 | (1.48 | ) | 173 | ||||||||||||||||||||||||||
| 4.55 | 7,880 | 3.52 | (2.33 | ) | 3.26 | (2.07 | ) | 187 | ||||||||||||||||||||||||||
| 2.65 | 799 | 3.00 | * | (1.10 | )* | 2.85 | * | (0.95 | )* | 112 | ||||||||||||||||||||||||
| 2.14 | 2,109 | 4.06 | (2.23 | ) | 3.87 | (2.04 | ) | 187 | ||||||||||||||||||||||||||
| 0.10 | 1,835 | 4.22 | (2.49 | ) | 3.97 | (2.24 | ) | 173 | ||||||||||||||||||||||||||
| 3.77 | 1,768 | 4.28 | (3.05 | ) | 4.02 | (2.79 | ) | 187 | ||||||||||||||||||||||||||
| 2.50 | 157 | 3.90 | * | (2.45 | )* | 3.42 | * | (1.97 | )* | 112 | ||||||||||||||||||||||||
| 3.12 | 49,990 | 3.06 | (1.23 | ) | 2.87 | (1.04 | ) | 187 | ||||||||||||||||||||||||||
| 1.09 | 35,162 | 3.21 | (1.51 | ) | 2.97 | (1.26 | ) | 173 | ||||||||||||||||||||||||||
| 4.84 | 32,668 | 3.37 | (2.08 | ) | 3.08 | (1.79 | ) | 187 | ||||||||||||||||||||||||||
| 2.70 | 13,184 | 3.04 | * | (1.77 | )* | 2.32 | * | (1.05 | )* | 112 | ||||||||||||||||||||||||
| (a) | Per share Net Investment Income (Loss) is calculated using the average daily shares method. |
| (b) | Total return is the combination of changes in NAV without any sales charge, reinvested dividend income at NAV and reinvested capital gains distributions at NAV, if any. Total returns are not annualized. |
| (c) | After fee waiver and/or expense reimbursement from the Adviser. |
| (d) | Each ratio includes the effect of dividends expense on common stocks sold short and prime broker expenses as follows: |
| Ratios of Dividends Expense on Common Stocks Sold Short to Average Net Assets | Ratios of Prime Broker Expenses to Average Net Assets | |||||||||||||||||||||||||||
| Year Ended August 31, | Class A | Class C | Class I | Class A | Class C | Class I | ||||||||||||||||||||||
2016 | 1.03 | % | 1.04 | % | 1.04 | % | 0.46 | % | 0.46 | % | 0.46 | % | ||||||||||||||||
2015 | 1.04 | 1.03 | 1.03 | 0.59 | 0.58 | 0.57 | ||||||||||||||||||||||
2014 | 1.09 | 1.06 | 1.02 | 0.55 | 0.59 | 0.70 | ||||||||||||||||||||||
2013(e) | 1.23 | * | 1.04 | * | 0.95 | * | — | — | — | |||||||||||||||||||
| (e) | For the period June 17, 2013 (commencement of operations) through August 31, 2013. |
| (f) | Portfolio Turnover Rate is calculated based on the lesser of long-term purchases or sales (as disclosed in Note 5 – Investment Transactions) divided by the average long-term market value during the period. |
| * | Annualized. |
See accompanying notes to financial statements.
| NUVEEN | 137 |
Financial Statements
1. General Information and Significant Accounting Policies
General Information
Trust and Fund Information
The Nuveen Investment Trust and the Nuveen Investment Trust II (each a “Trust” and collectively, the “Trusts”), are open-end management investment companies registered under the Investment Company Act of 1940, as amended. The Nuveen Investment Trust is comprised of Nuveen Large Cap Value Fund (“Large Cap Value”), Nuveen Large Cap Core Fund (“Large Cap Core”), Nuveen Large Cap Growth Fund (“Large Cap Growth”), Nuveen Concentrated Core Fund (“Concentrated Core”), Nuveen Core Dividend Fund (“Core Dividend”), Nuveen Large Cap Core Plus Fund (“Large Cap Core Plus”) and Nuveen Equity Market Neutral Fund (“Equity Market Neutral”) among others, and the Nuveen Investment Trust II is comprised of Nuveen Growth Fund (“Growth”) and Nuveen Equity Long/Short Fund (“Equity Long/Short”) (each a “Fund” and collectively, the “Funds”), as diversified funds, among others. The Nuveen Investment Trust and Nuveen Investment Trust II were each organized as Massachusetts business trusts on May 6, 1996 and June 27, 1997, respectively.
The end of the reporting period for the Funds is August 31, 2016, and the period covered by these Notes to Financial Statements is the fiscal year ended August 31, 2016 (the “current fiscal period”).
Investment Adviser
The Funds’ investment adviser is Nuveen Fund Advisors, LLC (the “Adviser”), a wholly-owned subsidiary of Nuveen Investments, Inc. (“Nuveen”). Nuveen is an operating division of TIAA Global Asset Management. The Adviser has overall responsibility for management of the Funds, oversees the management of the Funds’ portfolios, manages the Funds’ business affairs and provides certain clerical, bookkeeping and other administrative services, and, if necessary, asset allocation decisions. The Adviser has entered into sub-advisory agreements with Nuveen Asset Management, LLC (the “Sub-Adviser”), a subsidiary of the Adviser, under which the Sub-Adviser manages the investment portfolios of the Funds.
Investment Objectives
The investment objective of Large Cap Value, Large Cap Core, Large Cap Growth, Concentrated Core, Growth and Large Cap Core Plus is long-term capital appreciation. Core Dividend’s investment objective is total return comprised of income from dividend and long-term capital appreciation. Equity Long/Short’s investment objective is long-term capital appreciation with low correlation to the U.S. equity market. Equity Market Neutral’s investment objective is to provide investors with long-term capital appreciation independent of the U.S. equity market.
The Funds’ most recent prospectus provides further descriptions of each Fund’s investment objective, principal investment strategies and principal risks.
Significant Accounting Policies
Each Fund is an investment company and follows accounting and reporting guidance under Financial Accounting Standards Board (FASB) Accounting Standards Codification (ASC) Topic 946 “Financial Services – Investment Companies.” The following is a summary of significant accounting policies followed by the Funds in the preparation of their financial statements in accordance with U.S. generally accepted accounting principles (“U.S. GAAP”).
Investment Transactions
Investment transactions are recorded on a trade date basis. Realized gains and losses from investment transactions are determined on the specific identification method, which is the same basis used for federal income tax purposes. Investments purchased on a when-issued/delayed delivery basis may have extended settlement periods. Any investments so purchased are subject to market fluctuation during this period. The Funds have earmarked securities in their portfolios with a current value at least equal to the amount of the when-issued/delayed delivery purchase commitments.
As of the end of the reporting period, the Funds did not have any outstanding when-issued/delayed delivery purchase commitments.
Investment Income
Dividend income on investments purchased and dividends expense on common stocks sold short are recorded on the ex-dividend date or, for foreign securities, when information is available. Interest income is recorded on an accrual basis.
Professional Fees
Professional fees presented on the Statement of Operations consist of legal fees incurred in the normal course of operations, audit fees, tax consulting fees and, in some cases, workout expenditures. Workout expenditures are incurred in an attempt to protect or enhance an investment or to pursue other claims or legal actions on behalf of Fund shareholders. If a refund is received for workout expenditures paid in a prior reporting period, such amounts will be recognized as “Legal fee refund” on the Statement Operations.
| 138 | NUVEEN |
Dividends and Distributions to Shareholders
Dividends from net investment income are declared and distributed to shareholders annually, except Core Dividend will pay income dividends quarterly. Net realized capital gains from investment transactions, if any, are declared and distributed to shareholders at least annually. Furthermore, capital gains are distributed only to the extent they exceed available capital loss carryforwards.
Distributions to shareholders are recorded on the ex-dividend date. The amount and timing of distributions are determined in accordance with federal income tax regulations, which may differ from U.S. GAAP.
Share Classes and Sales Charges
Class A Shares are generally sold with an up-front sales charge and incur a 0.25% annual 12b-1 service fee. Class A Share purchases of $1 million or more are sold at net asset value (“NAV”) without an up-front sales charge but may be subject to a contingent deferred sales charge (“CDSC”) if redeemed within eighteen months (twelve months prior to November 1, 2015) of purchase. Such CDSC will be equal to 1% for any shares purchased on or after November 1, 2015 if redeemed within eighteen months of purchase. Class C Shares are sold without an up-front sales charge but incur a 0.75% annual 12b-1 distribution fee and a 0.25% annual 12b-1 service fee. Class C Shares are subject to a CDSC of 1% if redeemed within twelve months of purchase. Class R3 Shares are sold without an up-front sales charge but incur a 0.25% annual 12b-1 distribution fee and a 0.25% annual 12b-1 service fee. Class R6 Shares and Class I Shares are not subject to any sales charge or 12b-1 distribution or service fees.
Multiclass Operations and Allocations
Income and expenses of the Funds that are not directly attributable to a specific class of shares are prorated among the classes based on the relative net assets of each class. Expenses directly attributable to a class of shares are recorded to the specific class. Currently, the only expenses that are allocated on a class-specific basis are 12b-1 distribution and service fees.
Sub-transfer agent fees, which are recognized as a component of “Shareholder servicing agent fees” on the Statement of Operations, are not charged to Class R6 Shares and are prorated among the other classes based on their relative net assets.
Realized and unrealized capital gains and losses of the Funds are prorated among the classes based on the relative net assets of each class.
Indemnifications
Under each Trust’s organizational documents, its officers and trustees are indemnified against certain liabilities arising out of the performance of their duties to each Trust. In addition, in the normal course of business, each Trust enters into contracts that provide general indemnifications to other parties. Each Trust’s maximum exposure under these arrangements is unknown as this would involve future claims that may be made against each Trust that have not yet occurred. However, each Trust has not had prior claims or losses pursuant to these contracts and expects the risk of loss to be remote.
Netting Agreements
In the ordinary course of business, the Funds may enter into transactions subject to enforceable master repurchase agreements, International Swaps and Derivative Association, Inc. (“ISDA”) master agreements or other similar arrangements (“netting agreements”). Generally, the right to offset in netting agreements allows each Fund to offset certain securities and derivatives with a specific counterparty, when applicable, as well as any collateral received or delivered to that counterparty based on the terms of the agreements. Generally, each Fund manages its cash collateral and securities collateral on a counterparty basis.
The Funds’ investments subject to netting agreements as of the end of the reporting period, if any, are further described in Note 3 – Portfolio Securities and Investments in Derivatives.
Use of Estimates
The preparation of financial statements in conformity with U.S. GAAP requires management to make estimates and assumptions that affect the reported amounts of assets and liabilities at the date of the financial statements and the reported amounts of increases and decreases in net assets from operations during the reporting period. Actual results may differ from those estimates.
2. Investment Valuation and Fair Value Measurements
The fair valuation input levels as described below are for fair value measurement purposes.
Fair value is defined as the price that would be received upon selling an investment or transferring a liability in an orderly transaction to an independent buyer in the principal or most advantageous market for the investment. A three-tier hierarchy is used to maximize the use of observable market data and minimize the use of unobservable inputs and to establish classification of fair value measurements for disclosure purposes. Observable inputs reflect the assumptions market participants would use in pricing the asset or liability. Observable inputs are based on market data obtained from sources independent of the reporting entity. Unobservable inputs reflect the reporting entity’s own assumptions about the assumptions market
| NUVEEN | 139 |
Notes to Financial Statements (continued)
participants would use in pricing the asset or liability. Unobservable inputs are based on the best information available in the circumstances. The following is a summary of the three-tiered hierarchy of valuation input levels.
| Level 1 – | Inputs are unadjusted and prices are determined using quoted prices in active markets for identical securities. | |
| Level 2 – | Prices are determined using other significant observable inputs (including quoted prices for similar securities, interest rates, prepayment speeds, credit risk, etc.). | |
| Level 3 – | Prices are determined using significant unobservable inputs (including management’s assumptions in determining the fair value of investments). |
Common stocks and other equity-type securities are valued at the last sales price on the securities exchange on which such securities are primarily traded and are generally classified as Level 1. Securities primarily traded on the NASDAQ National Market (“NASDAQ”) are valued at the NASDAQ Official Closing Price and are generally classified as Level 1. However, securities traded on a securities exchange or NASDAQ for which there were no transactions on a given day or securities not listed on a securities exchange or NASDAQ are valued at the quoted bid price and are generally classified as Level 2.
Repurchase agreements are valued at contract amount plus accrued interest, which approximates market value. These securities are generally classified as Level 2.
Certain securities may not be able to be priced by the pre-established pricing methods as described above. Such securities may be valued by the Funds’ Board of Trustees (the “Board”) and/or its appointee at fair value. These securities generally include, but are not limited to, restricted securities (securities which may not be publicly sold without registration under the Securities Act of 1933, as amended) for which an independent pricing service (“pricing service”) is unable to provide a market price; securities whose trading has been formally suspended; debt securities that have gone into default and for which there is no current market quotation; a security whose market price is not available from a pre-established pricing source; a security with respect to which an event has occurred that is likely to materially affect the value of the security after the market has closed but before the calculation of a Fund’s NAV (as may be the case in non-U.S. markets on which the security is primarily traded) or make it difficult or impossible to obtain a reliable market quotation; and a security whose price, as provided by the pricing service, is not deemed to reflect the security’s fair value. As a general principle, the fair value of a security would appear to be the amount that the owner might reasonably expect to receive for it in a current sale. A variety of factors may be considered in determining the fair value of such securities, which may include consideration of the following: yields or prices of investments of comparable quality, type of issue, coupon, maturity and rating, market quotes or indications of value from security dealers, evaluations of anticipated cash flows or collateral, general market conditions and other information and analysis, including the obligor’s credit characteristics considered relevant. These securities are generally classified as Level 2 or Level 3 depending on the observability of the significant inputs. Regardless of the method employed to value a particular security, all valuations are subject to review by the Board and/or its appointee.
The inputs or methodologies used for valuing securities are not an indication of the risks associated with investing in those securities. The following is a summary of each Fund’s fair value measurements as of the end of the reporting period:
| Large Cap Value | Level 1 | Level 2 | Level 3 | Total | ||||||||||||
| Long-Term Investments*: | ||||||||||||||||
Common Stocks | $ | 386,875,070 | $ | — | $ | — | $ | 386,875,070 | ||||||||
| Short-Term Investments: | ||||||||||||||||
Repurchase Agreements | — | 236,805 | — | 236,805 | ||||||||||||
| Total | $ | 386,875,070 | $ | 236,805 | $ | — | $ | 387,111,875 | ||||||||
| Large Cap Core | ||||||||||||||||
| Long-Term Investments*: | ||||||||||||||||
Common Stocks | $ | 254,615,820 | $ | — | $ | — | $ | 254,615,820 | ||||||||
| Large Cap Growth | ||||||||||||||||
| Long-Term Investments*: | ||||||||||||||||
Common Stocks | $ | 70,765,816 | $ | — | $ | — | $ | 70,765,816 | ||||||||
| Concentrated Core | ||||||||||||||||
| Long-Term Investments*: | ||||||||||||||||
Common Stocks | $ | 98,004,187 | $ | — | $ | — | $ | 98,004,187 | ||||||||
| Short-Term Investments: | ||||||||||||||||
Repurchase Agreements | — | 100,206 | — | 100,206 | ||||||||||||
| Total | $ | 98,004,187 | $ | 100,206 | $ | — | $ | 98,104,393 | ||||||||
| 140 | NUVEEN |
| Core Dividend | Level 1 | Level 2 | Level 3 | Total | ||||||||||||
| Long-Term Investments*: | ||||||||||||||||
Common Stocks | $ | 42,551,155 | $ | — | $ | — | $ | 42,551,155 | ||||||||
| Growth | ||||||||||||||||
| Long-Term Investments*: | ||||||||||||||||
Common Stocks | $ | 49,639,366 | $ | — | $ | — | $ | 49,639,366 | ||||||||
| Large Cap Core Plus | ||||||||||||||||
| Long-Term Investments*: | ||||||||||||||||
Common Stocks | $ | 92,468,472 | $ | — | $ | — | $ | 92,468,472 | ||||||||
| Short-Term Investments: | ||||||||||||||||
Repurchase Agreements | — | 361,540 | — | 361,540 | ||||||||||||
| Common Stocks Sold Short* | (21,316,912 | ) | — | — | (21,316,912 | ) | ||||||||||
| Total | $ | 71,151,560 | $ | 361,540 | $ | — | $ | 71,513,100 | ||||||||
| Equity Long/Short | ||||||||||||||||
| Long-Term Investments*: | ||||||||||||||||
Common Stocks | $ | 129,622,878 | $ | — | $ | — | $ | 129,622,878 | ||||||||
| Short-Term Investments: | ||||||||||||||||
Repurchase Agreements | — | 2,754,605 | — | 2,754,605 | ||||||||||||
| Common Stocks Sold Short* | (62,408,143 | ) | — | — | (62,408,143 | ) | ||||||||||
| Total | $ | 67,214,735 | $ | 2,754,605 | $ | — | $ | 69,969,340 | ||||||||
| Equity Market Neutral | ||||||||||||||||
| Long-Term Investments*: | ||||||||||||||||
Common Stocks | $ | 69,291,885 | $ | — | $ | — | $ | 69,291,885 | ||||||||
| Short-Term Investments: | ||||||||||||||||
Repurchase Agreements | — | 2,918,656 | — | 2,918,656 | ||||||||||||
| Common Stocks Sold Short* | (56,848,967 | ) | — | — | (56,848,967 | ) | ||||||||||
| Total | $ | 12,442,918 | $ | 2,918,656 | $ | — | $ | 15,361,574 | ||||||||
| * | Refer to the Fund’s Portfolio of Investments for industry classifications. |
The Board is responsible for the valuation process and has appointed the oversight of the daily valuation process to the Adviser’s Valuation Committee. The Valuation Committee, pursuant to the valuation policies and procedures adopted by the Board, is responsible for making fair value determinations, evaluating the effectiveness of the Funds’ pricing policies and reporting to the Board. The Valuation Committee is aided in its efforts by the Adviser’s dedicated Securities Valuation Team, which is responsible for administering the daily valuation process and applying fair value methodologies as approved by the Valuation Committee. When determining the reliability of independent pricing services for investments owned by the Funds, the Valuation Committee, among other things, conducts due diligence reviews of the pricing services and monitors the quality of security prices received through various testing reports conducted by the Securities Valuation Team.
The Valuation Committee will consider pricing methodologies it deems relevant and appropriate when making a fair value determination, based on the facts and circumstances specific to the portfolio instrument. Fair value determinations generally will be derived as follows, using public or private market information:
| (i) | If available, fair value determinations shall be derived by extrapolating from recent transactions or quoted prices for identical or comparable securities. |
| (ii) | If such information is not available, an analytical valuation methodology may be used based on other available information including, but not limited to: analyst appraisals, research reports, corporate action information, issuer financial statements and shelf registration statements. Such analytical valuation methodologies may include, but are not limited to: multiple of earnings, discount from market value of a similar freely-traded security, discounted cash flow analysis, book value or a multiple thereof, risk premium/yield analysis, yield to maturity and/or fundamental investment analysis. |
The purchase price of a portfolio instrument will be used to fair value the instrument only if no other valuation methodology is available or deemed appropriate, and it is determined that the purchase price fairly reflects the instrument’s current value.
For each portfolio security that has been fair valued pursuant to the policies adopted by the Board, the fair value price is compared against the last available and next available market quotations. The Valuation Committee reviews the results of such testing and fair valuation occurrences are reported to the Board.
| NUVEEN | 141 |
Notes to Financial Statements (continued)
3. Portfolio Securities and Investments in Derivatives
Portfolio Securities
Repurchase Agreements
In connection with transactions in repurchase agreements, it is each Fund’s policy that its custodian take possession of the underlying collateral securities, the fair value of which exceeds the principal amount of the repurchase transaction, including accrued interest, at all times. If the counterparty defaults, and the fair value of the collateral declines, realization of the collateral may be delayed or limited.
The following table presents the repurchase agreements for the following Funds that are subject to netting agreements as of the end of the reporting period, and the collateral delivered related to those repurchase agreements.
| Fund | Counterparty | Short-Term Investments, at Value | Collateral Pledged (From) Counterparty* | Net Exposure | ||||||||||
| Large Cap Value | Fixed Income Clearing Corporation | $ | 236,805 | $ | (236,805 | ) | $ | — | ||||||
| Concentrated Core | Fixed Income Clearing Corporation | 100,206 | (100,206 | ) | — | |||||||||
| Large Cap Core Plus | Fixed Income Clearing Corporation | 361,540 | (361,540 | ) | — | |||||||||
| Equity Long/Short | Fixed Income Clearing Corporation | 2,754,605 | (2,754,605 | ) | — | |||||||||
| Equity Market Neutral | Fixed Income Clearing Corporation | 2,918,656 | (2,918,656 | ) | — | |||||||||
| * | As of the end of the reporting period, the value of the collateral pledged from the counterparty exceeded the value of the repurchase agreements. Refer to the Fund’s Portfolio of Investments for details on the repurchase agreements. |
Short Sale Transactions
Large Cap Core Plus, Equity Long/Short and Equity Market Neutral each pursue a “long/short” investment strategy, pursuant to which they sell securities short and may purchase additional long investments with some or all of the proceeds of the short sale transactions.
When the Funds sell a security short, they borrow the security from a third party and segregate assets as collateral to secure their obligation to return the security to the lender either upon closing out the short position or upon demand from the lender. Proceeds from short selling may be used to finance the purchase of additional securities for each Fund’s long portfolio. The amount of collateral required to be pledged to borrow a security is determined by reference to the market value of the security borrowed. The value of the collateral required to be pledged as of the end of the reporting period is disclosed in the Funds’ Portfolio of Investments, and any cash pledged as collateral in addition to long-term investments is recognized as “Cash collateral at broker” on the Statement of Assets and Liabilities. The Funds are obligated to pay the party from whom the securities were borrowed dividends declared on the stock by the issuer and such amounts are recognized as “Dividends expense on common stocks sold short”, on the Statement of Operations, when applicable. Short sales are valued daily, and the corresponding unrealized gains and losses are recognized as “Change in net unrealized appreciation (depreciation) of common stocks sold short” on the Statement of Operations. Liabilities for securities sold short are reported at market value on the Statement of Assets and Liabilities. Short sale transactions result in off-balance sheet risk because the ultimate obligation may exceed the related amounts shown on the Statement of Assets and Liabilities. The Funds will incur a loss if the price of the security increases between the date of the short sale and the date on which the Funds replace the borrowed security. The Funds’ losses on short sales are potentially unlimited because there is no upward limit on the price a borrowed security could attain. The Funds will realize a gain if the price of the security declines between those dates. Gains and losses from securities sold short are recognized as “Net realized gain (loss) from common stocks sold short” on the Statement of Operations.
Bank of America Merrill Lynch (“BAML”) facilitates the short sales transactions for the Funds. The Funds currently pay prime brokerage fees to BAML for its services for the Funds, which are recognized as “Prime broker expenses” on the Statement of Operations, when applicable.
Investments in Derivatives
Each Fund is authorized to invest in certain derivative instruments. The Funds record derivative instruments at fair value, with changes in fair value recognized on the Statement of Operations, when applicable. Even though the Funds’ investments in derivatives may represent economic hedges, they are not considered to be hedge transactions for financial reporting purposes.
Although the Funds are authorized to invest in derivative instruments, and may do so in the future, they did not make any such investments during the current fiscal period.
Market and Counterparty Credit Risk
In the normal course of business each Fund may invest in financial instruments and enter into financial transactions where risk of potential loss exists due to changes in the market (market risk) or failure of the other party to the transaction to perform (counterparty credit risk). The potential loss could exceed the value of the financial assets recorded on the financial statements. Financial assets, which potentially expose each Fund to counterparty credit risk, consist principally of cash due from counterparties on forward, option and swap transactions, when applicable. The extent of each Fund’s exposure to counterparty credit risk in respect to these financial assets approximates their carrying value as recorded on the Statement of Assets and Liabilities.
| 142 | NUVEEN |
Each Fund helps manage counterparty credit risk by entering into agreements only with counterparties the Adviser believes have the financial resources to honor their obligations and by having the Adviser monitor the financial stability of the counterparties. Additionally, counterparties may be required to pledge collateral daily (based on the daily valuation of the financial asset) on behalf of each Fund with a value approximately equal to the amount of any unrealized gain above a pre-determined threshold. Reciprocally, when each Fund has an unrealized loss, the Funds have instructed the custodian to pledge assets of the Funds as collateral with a value approximately equal to the amount of the unrealized loss above a pre-determined threshold. Collateral pledges are monitored and subsequently adjusted if and when the valuations fluctuate, either up or down, by at least the pre-determined threshold amount.
4. Fund Shares
Transactions in Fund shares during the current and prior fiscal period were as follows:
| Year Ended 8/31/16 | Year Ended 8/31/15 | |||||||||||||||
| Large Cap Value | Shares | Amount | Shares | Amount | ||||||||||||
| Shares sold: | ||||||||||||||||
Class A | 377,823 | $ | 8,147,030 | 1,172,532 | $ | 30,517,179 | ||||||||||
Class C | 363,328 | 7,355,274 | 554,774 | 14,010,964 | ||||||||||||
Class R3 | 3,814 | 77,759 | 6,826 | 170,216 | ||||||||||||
Class R61 – exchanges | 887,602 | 19,225,456 | — | — | ||||||||||||
Class I | 2,333,537 | 51,901,876 | 2,408,463 | 62,933,090 | ||||||||||||
| Shares issued to shareholders due to reinvestment of distributions: | ||||||||||||||||
Class A | 932,097 | 19,747,901 | 1,149,064 | 28,468,365 | ||||||||||||
Class C | 100,958 | 2,037,698 | 109,023 | 2,575,721 | ||||||||||||
Class R3 | — | — | — | — | ||||||||||||
Class R61 | — | — | — | — | ||||||||||||
Class I | 427,534 | 9,122,298 | 446,008 | 11,139,170 | ||||||||||||
| 5,426,693 | 117,615,292 | 5,846,690 | 149,814,705 | |||||||||||||
| Shares redeemed: | ||||||||||||||||
Class A | (2,063,375 | ) | (44,962,850 | ) | (1,382,590 | ) | (35,629,587 | ) | ||||||||
Class C | (588,700 | ) | (12,064,765 | ) | (244,176 | ) | (6,062,351 | ) | ||||||||
Class R3 | (5,475 | ) | (125,290 | ) | (1,784 | ) | (46,538 | ) | ||||||||
Class R61 | (23,551 | ) | (535,000 | ) | — | — | ||||||||||
Class I | (1,860,418 | ) | (41,232,658 | ) | (2,176,486 | ) | (54,771,429 | ) | ||||||||
Class I – exchanges | (887,602 | ) | (19,225,456 | ) | — | — | ||||||||||
| (5,429,121 | ) | (118,146,019 | ) | (3,805,036 | ) | (96,509,905 | ) | |||||||||
| Net increase (decrease) | (2,428 | ) | $ | (530,727 | ) | 2,041,654 | $ | 53,304,800 | ||||||||
| Year Ended 8/31/16 | Year Ended 8/31/15 | |||||||||||||||
| Large Cap Core | Shares | Amount | Shares | Amount | ||||||||||||
| Shares sold: | ||||||||||||||||
Class A | 874,945 | $ | 22,427,866 | 1,442,539 | $ | 38,956,437 | ||||||||||
Class C | 733,218 | 18,441,802 | 1,448,568 | 38,899,575 | ||||||||||||
Class R61 – exchange | 693,764 | 17,663,242 | — | — | ||||||||||||
Class I | 2,743,914 | 68,497,084 | 5,124,457 | 138,793,248 | ||||||||||||
| Shares issued to shareholders due to reinvestment of distributions: | ||||||||||||||||
Class A | 30,741 | 787,826 | 10,276 | 268,128 | ||||||||||||
Class C | 19,378 | 488,712 | 7,729 | 199,577 | ||||||||||||
Class R61 | — | — | — | — | ||||||||||||
Class I | 83,078 | 2,132,950 | 46,821 | 1,229,504 | ||||||||||||
| 5,179,038 | 130,439,482 | 8,080,390 | 218,346,469 | |||||||||||||
| Shares redeemed: | ||||||||||||||||
Class A | (617,239 | ) | (15,716,831 | ) | (235,480 | ) | (6,350,713 | ) | ||||||||
Class C | (482,058 | ) | (12,191,971 | ) | (118,466 | ) | (3,164,057 | ) | ||||||||
Class R61 | (11,119 | ) | (300,000 | ) | — | — | ||||||||||
Class I | (2,906,788 | ) | (73,742,217 | ) | (1,338,334 | ) | (35,895,413 | ) | ||||||||
Class I – exchanges | (693,764 | ) | (17,663,242 | ) | — | — | ||||||||||
| (4,710,968 | ) | (119,614,261 | ) | (1,692,280 | ) | (45,410,183 | ) | |||||||||
| Net increase (decrease) | 468,070 | $ | 10,825,221 | 6,388,110 | $ | 172,936,286 | ||||||||||
| 1 | Class R6 Shares were established on June 30, 2016. |
| NUVEEN | 143 |
Notes to Financial Statements (continued)
| Year Ended 8/31/16 | Year Ended 8/31/15 | |||||||||||||||
| Large Cap Growth | Shares | Amount | Shares | Amount | ||||||||||||
| Shares sold: | ||||||||||||||||
Class A | 371,585 | $ | 9,236,977 | 959,396 | $ | 25,308,076 | ||||||||||
Class C | 152,413 | 3,758,706 | 261,754 | 6,906,543 | ||||||||||||
Class R61 | 1,030 | 25,000 | — | — | ||||||||||||
Class I | 322,367 | 8,046,592 | 1,508,405 | 40,203,063 | ||||||||||||
| Shares issued to shareholders due to reinvestment of distributions: | ||||||||||||||||
Class A | 43,627 | 1,081,231 | 19,074 | 481,971 | ||||||||||||
Class C | 7,408 | 180,759 | 2,262 | 56,594 | ||||||||||||
Class R61 | — | — | — | — | ||||||||||||
Class I | 48,184 | 1,196,740 | 18,658 | 473,726 | ||||||||||||
| 946,614 | 23,526,005 | 2,769,549 | 73,429,973 | |||||||||||||
| Shares redeemed: | ||||||||||||||||
Class A | (1,127,331 | ) | (27,291,678 | ) | (142,352 | ) | (3,752,445 | ) | ||||||||
Class C | (95,029 | ) | (2,300,725 | ) | (42,218 | ) | (1,102,348 | ) | ||||||||
Class R61 | — | — | — | — | ||||||||||||
Class I | (816,036 | ) | (20,368,815 | ) | (259,650 | ) | (6,958,461 | ) | ||||||||
| (2,038,396 | ) | (49,961,218 | ) | (444,220 | ) | (11,813,254 | ) | |||||||||
| Net increase (decrease) | (1,091,782 | ) | $ | (26,435,213 | ) | 2,325,329 | $ | 61,616,719 | ||||||||
| Year Ended 8/31/16 | Year Ended 8/31/15 | |||||||||||||||
| Concentrated Core | Shares | Amount | Shares | Amount | ||||||||||||
| Shares sold: | ||||||||||||||||
Class A | 650,877 | $ | 16,913,790 | 2,372,515 | $ | 66,296,117 | ||||||||||
Class C | 323,796 | 8,235,687 | 904,844 | 25,204,557 | ||||||||||||
Class R61 | 991 | 25,000 | — | — | ||||||||||||
Class I | 895,274 | 23,113,731 | 3,011,031 | 84,301,612 | ||||||||||||
| Shares issued to shareholders due to reinvestment of distributions: | ||||||||||||||||
Class A | 85,190 | 2,233,298 | 11,900 | 322,682 | ||||||||||||
Class C | 37,758 | 972,267 | 2,005 | 53,670 | ||||||||||||
Class R61 | — | — | — | — | ||||||||||||
Class I | 76,728 | 2,016,359 | 21,028 | 576,457 | ||||||||||||
| 2,070,614 | 53,510,132 | 6,323,323 | 176,755,095 | |||||||||||||
| Shares redeemed: | ||||||||||||||||
Class A | (1,193,481 | ) | (30,535,390 | ) | (652,505 | ) | (18,271,599 | ) | ||||||||
Class C | (327,620 | ) | (8,191,879 | ) | (35,199 | ) | (993,597 | ) | ||||||||
Class R61 | — | — | — | — | ||||||||||||
Class I | (1,696,550 | ) | (43,576,088 | ) | (1,381,414 | ) | (39,096,480 | ) | ||||||||
| (3,217,651 | ) | (82,303,357 | ) | (2,069,118 | ) | (58,361,676 | ) | |||||||||
| Net increase (decrease) | (1,147,037 | ) | $ | (28,793,225 | ) | 4,254,205 | $ | 118,393,419 | ||||||||
| Year Ended 8/31/16 | Year Ended 8/31/15 | |||||||||||||||
| Core Dividend | Shares | Amount | Shares | Amount | ||||||||||||
| Shares sold: | ||||||||||||||||
Class A | 420,316 | $ | 9,864,308 | 677,046 | $ | 17,471,941 | ||||||||||
Class C | 55,389 | 1,294,388 | 181,535 | 4,712,492 | ||||||||||||
Class I | 139,855 | 3,340,734 | 577,577 | 14,930,446 | ||||||||||||
| Shares issued to shareholders due to reinvestment of distributions: | ||||||||||||||||
Class A | 28,864 | 681,004 | 23,140 | 583,565 | ||||||||||||
Class C | 5,653 | 132,925 | 4,942 | 123,819 | ||||||||||||
Class I | 19,995 | 471,161 | 18,711 | 472,612 | ||||||||||||
| 670,072 | 15,784,520 | 1,482,951 | 38,294,875 | |||||||||||||
| Shares redeemed: | ||||||||||||||||
Class A | (332,307 | ) | (7,849,628 | ) | (165,390 | ) | (4,215,173 | ) | ||||||||
Class C | (65,660 | ) | (1,534,854 | ) | (22,582 | ) | (573,886 | ) | ||||||||
Class I | (396,962 | ) | (9,294,582 | ) | (102,674 | ) | (2,603,063 | ) | ||||||||
| (794,929 | ) | (18,679,064 | ) | (290,646 | ) | (7,392,122 | ) | |||||||||
| Net increase (decrease) | (124,857 | ) | $ | (2,894,544 | ) | 1,192,305 | $ | 30,902,753 | ||||||||
| 1 | Class R6 Shares were established on June 30, 2016. |
| 144 | NUVEEN |
| Year Ended 8/31/16 | Year Ended 8/31/15 | |||||||||||||||
| Growth | Shares | Amount | Shares | Amount | ||||||||||||
| Shares sold: | ||||||||||||||||
Class A | 153,974 | $ | 4,114,434 | 88,331 | $ | 2,648,878 | ||||||||||
Class C | 49,421 | 1,227,124 | 60,647 | 1,685,644 | ||||||||||||
Class R3 | 5,211 | 132,605 | 202 | 6,079 | ||||||||||||
Class I | 444,006 | 12,219,654 | 702,991 | 21,615,333 | ||||||||||||
| Shares issued to shareholders due to reinvestment of distributions: | ||||||||||||||||
Class A | 35,019 | 928,930 | 19,192 | 547,540 | ||||||||||||
Class C | 31,633 | 768,666 | 21,812 | 580,653 | ||||||||||||
Class R3 | — | — | — | — | ||||||||||||
Class I | 129,712 | 3,505,204 | 89,761 | 2,596,783 | ||||||||||||
| 848,976 | 22,896,617 | 982,936 | 29,680,910 | |||||||||||||
| Shares redeemed: | ||||||||||||||||
Class A | (139,751 | ) | (3,758,259 | ) | (312,365 | ) | (9,489,916 | ) | ||||||||
Class C | (107,125 | ) | (2,661,310 | ) | (57,044 | ) | (1,590,577 | ) | ||||||||
Class R3 | (395 | ) | (10,413 | ) | (52 | ) | (1,559 | ) | ||||||||
Class I | (436,505 | ) | (11,901,047 | ) | (585,673 | ) | (17,729,600 | ) | ||||||||
| (683,776 | ) | (18,331,029 | ) | (955,134 | ) | (28,811,652 | ) | |||||||||
| Net increase (decrease) | 165,200 | $ | 4,565,588 | 27,802 | $ | 869,258 | ||||||||||
| Year Ended 8/31/16 | Year Ended 8/31/15 | |||||||||||||||
| Large Cap Core Plus | Shares | Amount | Shares | Amount | ||||||||||||
| Shares sold: | ||||||||||||||||
Class A | 171,341 | $ | 4,231,830 | 874,874 | $ | 23,363,281 | ||||||||||
Class C | 93,888 | 2,274,931 | 542,240 | 14,308,551 | ||||||||||||
Class I | 346,932 | 8,643,196 | 2,509,047 | 66,615,484 | ||||||||||||
| Shares issued to shareholders due to reinvestment of distributions: | ||||||||||||||||
Class A | 25,675 | 635,281 | 25,523 | 658,502 | ||||||||||||
Class C | 22,462 | 545,366 | 10,641 | 271,761 | ||||||||||||
Class I | 87,025 | 2,162,041 | 70,105 | 1,816,003 | ||||||||||||
| 747,323 | 18,492,645 | 4,032,430 | 107,033,582 | |||||||||||||
| Shares redeemed: | ||||||||||||||||
Class A | (295,039 | ) | (7,280,436 | ) | (481,277 | ) | (12,670,678 | ) | ||||||||
Class C | (231,412 | ) | (5,579,613 | ) | (25,955 | ) | (670,827 | ) | ||||||||
Class I | (1,737,013 | ) | (42,177,565 | ) | (1,079,281 | ) | (28,323,550 | ) | ||||||||
| (2,263,464 | ) | (55,037,614 | ) | (1,586,513 | ) | (41,665,055 | ) | |||||||||
| Net increase (decrease) | (1,516,141 | ) | $ | (36,544,969 | ) | 2,445,917 | $ | 65,368,527 | ||||||||
| Year Ended 8/31/16 | Year Ended 8/31/15 | |||||||||||||||
| Equity Long/Short | Shares | Amount | Shares | Amount | ||||||||||||
| Shares sold: | ||||||||||||||||
Class A | 450,916 | $ | 14,805,918 | 593,954 | $ | 19,697,958 | ||||||||||
Class C | 94,814 | 2,956,282 | 154,640 | 4,862,175 | ||||||||||||
Class I | 1,526,191 | 51,312,679 | 1,493,850 | 50,150,549 | ||||||||||||
| Shares issued to shareholders due to reinvestment of distributions: | ||||||||||||||||
Class A | — | — | 1,069 | 35,095 | ||||||||||||
Class C | — | — | 428 | 13,356 | ||||||||||||
Class I | — | — | 2,217 | 73,967 | ||||||||||||
| 2,071,921 | 69,074,879 | 2,246,158 | 74,833,100 | |||||||||||||
| Shares redeemed: | ||||||||||||||||
Class A | (414,391 | ) | (13,332,301 | ) | (265,615 | ) | (8,676,903 | ) | ||||||||
Class C | (87,969 | ) | (2,627,278 | ) | (27,632 | ) | (861,007 | ) | ||||||||
Class I | (1,670,119 | ) | (53,406,162 | ) | (385,716 | ) | (13,041,983 | ) | ||||||||
| (2,172,479 | ) | (69,365,741 | ) | (678,963 | ) | (22,579,893 | ) | |||||||||
| Net increase (decrease) | (100,558 | ) | $ | (290,862 | ) | 1,567,195 | $ | 52,253,207 | ||||||||
| NUVEEN | 145 |
Notes to Financial Statements (continued)
| Year Ended 8/31/16 | Year Ended 8/31/15 | |||||||||||||||
| Equity Market Neutral | Shares | Amount | Shares | Amount | ||||||||||||
| Shares sold: | ||||||||||||||||
Class A | 365,952 | $ | 7,998,762 | 290,690 | $ | 6,267,867 | ||||||||||
Class C | 48,437 | 1,037,987 | 31,840 | 679,574 | ||||||||||||
Class I | 1,621,262 | 35,412,422 | 1,037,896 | 22,343,491 | ||||||||||||
| Shares issued to shareholders due to reinvestment of distributions: | ||||||||||||||||
Class A | 7,168 | 157,697 | 1,323 | 29,023 | ||||||||||||
Class C | 1,543 | 33,306 | 285 | 6,179 | ||||||||||||
Class I | 24,585 | 544,313 | 3,611 | 79,505 | ||||||||||||
| 2,068,947 | 45,184,487 | 1,365,645 | 29,405,639 | |||||||||||||
| Shares redeemed: | ||||||||||||||||
Class A | (363,432 | ) | (7,897,928 | ) | (242,965 | ) | (5,189,127 | ) | ||||||||
Class C | (37,336 | ) | (795,804 | ) | (28,783 | ) | (613,845 | ) | ||||||||
Class I | (989,940 | ) | (21,649,115 | ) | (937,711 | ) | (20,264,907 | ) | ||||||||
| (1,390,708 | ) | (30,342,847 | ) | (1,209,459 | ) | (26,067,879 | ) | |||||||||
| Net increase (decrease) | 678,239 | $ | 14,841,640 | 156,186 | $ | 3,337,760 | ||||||||||
5. Investment Transactions
Long-term purchases and sales (including transactions for common stocks sold short, where applicable) during the current fiscal period were as follows:
| Large Cap Value | Large Cap Core | Large Cap Growth | Concentrated Core | Core Dividend | ||||||||||||||||
| Purchases | $ | 542,810,991 | $ | 327,505,345 | $ | 103,774,097 | $ | 122,346,816 | $ | 54,566,704 | ||||||||||
| Sales | 574,522,006 | 319,703,891 | 133,467,600 | 154,916,553 | 57,669,813 | |||||||||||||||
| Growth | Large Cap Core Plus | Equity Long/Short | Equity Market Neutral | |||||||||||||
| Purchases | $ | 28,164,335 | $ | 200,630,406 | $ | 550,704,671 | $ | 217,001,732 | ||||||||
| Sales | 28,530,666 | 240,610,425 | 548,905,670 | 214,274,879 | ||||||||||||
6. Income Tax Information
Each Fund is a separate taxpayer for federal income tax purposes. Each Fund intends to distribute substantially all of its net investment income and net capital gains to shareholders and to otherwise comply with the requirements of Subchapter M of the Internal Revenue Code applicable to regulated investment companies. Therefore, no federal income tax provision is required.
For all open tax years and all major taxing jurisdictions, management of the Funds has concluded that there are no significant uncertain tax positions that would require recognition in the financial statements. Open tax years are those that are open for examination by taxing authorities (i.e., generally the last four tax year ends and the interim tax period since then). Furthermore, management of the Funds is also not aware of any tax positions for which it is reasonably possible that the total amounts of unrecognized tax benefits will significantly change in the next twelve months.
The following information is presented on an income tax basis. Differences between amounts for financial statement and federal income tax purposes are primarily due to timing differences in recognizing certain gains and losses on investment transactions. To the extent that differences arise that are permanent in nature, such amounts are reclassified within the capital accounts as detailed below. Temporary differences do not require reclassification. Temporary and permanent differences do not impact the NAVs of the Funds.
As of August 31, 2016, the cost and unrealized appreciation (depreciation) of investments (excluding common stocks sold short, where applicable), as determined on a federal income tax basis, were as follows:
| Large Cap Value | Large Cap Core | Large Cap Growth | Concentrated Core | Core Dividend | ||||||||||||||||
| Cost of investments | $ | 364,879,218 | $ | 240,568,103 | $ | 67,379,024 | $ | 100,537,992 | $ | 41,597,964 | ||||||||||
| Gross unrealized: | ||||||||||||||||||||
Appreciation | $ | 47,265,931 | $ | 23,232,876 | $ | 6,979,126 | $ | 5,688,243 | $ | 3,570,101 | ||||||||||
Depreciation | (25,033,274 | ) | (9,185,159 | ) | (3,592,334 | ) | (8,121,842 | ) | (2,616,910 | ) | ||||||||||
| Net unrealized appreciation (depreciation) of investments | $ | 22,232,657 | $ | 14,047,717 | $ | 3,386,792 | $ | (2,433,599 | ) | $ | 953,191 | |||||||||
| 146 | NUVEEN |
| Growth | Large Cap Core Plus | Equity Long/Short | Equity Market Neutral | |||||||||||||
| Cost of investments | $ | 42,702,877 | $ | 86,329,879 | $ | 124,006,226 | $ | 67,579,922 | ||||||||
| Gross unrealized: | ||||||||||||||||
Appreciation | $ | 8,074,515 | $ | 9,939,429 | $ | 12,306,775 | $ | 6,982,613 | ||||||||
Depreciation | (1,138,026 | ) | (3,439,296 | ) | (3,935,518 | ) | (2,351,994 | ) | ||||||||
| Net unrealized appreciation (depreciation) of investments | $ | 6,936,489 | $ | 6,500,133 | $ | 8,371,257 | $ | 4,630,619 | ||||||||
Permanent differences, primarily due to investments in short sales, investments in partnerships, distribution reallocations, net operating losses and tax equalization, resulted in reclassifications among the Funds’ components of net assets as of August 31, 2016, the Funds’ tax year end, as follows:
| Large Cap Value | Large Cap Core | Large Cap Growth | Concentrated Core | Core Dividend | ||||||||||||||||
| Capital paid-in | $ | — | $ | 1 | $ | — | $ | — | $ | — | ||||||||||
| Undistributed (Over-distribution of) net investment income | 88,818 | (42,536 | ) | (22,101 | ) | (1,412 | ) | 6,079 | ||||||||||||
| Accumulated net realized gain (loss) | (88,818 | ) | 42,535 | 22,101 | 1,412 | (6,079 | ) | |||||||||||||
| Growth | Large Cap Core Plus | Equity Long/Short | Equity Market Neutral | |||||||||||||
| Capital paid-in | $ | 409,634 | $ | 1 | $ | (424,847 | ) | $ | (540,027 | ) | ||||||
| Undistributed (Over-distribution of) net investment income | — | 16,201 | 487,453 | 551,362 | ||||||||||||
| Accumulated net realized gain (loss) | (409,634 | ) | (16,202 | ) | (62,606 | ) | (11,335 | ) | ||||||||
The tax components of undistributed net ordinary income and net long-term capital gains as of August 31, 2016, the Funds’ tax year end, were as follows:
| Large Cap Value | Large Cap Core | Large Cap Growth | Concentrated Core | Core Dividend | ||||||||||||||||
| Undistributed net ordinary income1 | $ | 5,671,153 | $ | 2,040,748 | $ | 526,693 | $ | 1,680,900 | $ | 262,465 | ||||||||||
| Undistributed net long-term capital gains | — | — | — | — | — | |||||||||||||||
| Growth | Large Cap Core Plus | Equity Long/Short | Equity Market Neutral | |||||||||||||
| Undistributed net ordinary income1 | $ | 596,954 | $ | 362,314 | $ | — | $ | — | ||||||||
| Undistributed net long-term capital gains | 2,358,154 | — | — | — | ||||||||||||
| 1 | Net ordinary income consists of net taxable income derived from dividends, interest, and net short-term capital gains, if any. |
The tax character of distributions paid during the Funds’ tax years ended August 31, 2016 and August 31, 2015, was designated for purposes of the dividends paid deduction as follows:
| 2016 | Large Cap Value | Large Cap Core | Large Cap Growth | Concentrated Core | Core Dividend | |||||||||||||||
| Distributions from net ordinary income1 | $ | 13,655,881 | $ | 3,892,356 | $ | 2,090,622 | $ | 4,511,419 | $ | 1,200,822 | ||||||||||
| Distributions from net long-term capital gains | 23,420,142 | 1,244,647 | 1,755,760 | 835,142 | 146,762 | |||||||||||||||
| 2016 | Growth | Large Cap Core Plus | Equity Long/Short | Equity Market Neutral | ||||||||||||
| Distributions from net ordinary income1 | $ | 976,991 | $ | 1,463,354 | $ | — | $ | — | ||||||||
| Distributions from net long-term capital gains | 5,050,085 | 2,412,935 | — | 925,032 | ||||||||||||
| 2015 | Large Cap Value | Large Cap Core | Large Cap Growth | Concentrated Core | Core Dividend | |||||||||||||||
| Distributions from net ordinary income1 | $ | 35,484,644 | $ | 2,448,979 | $ | 2,228,618 | $ | 923,688 | $ | 1,211,713 | ||||||||||
| Distributions from net long-term capital gains | 15,620,261 | 72,389 | 6,695 | 69,574 | 37,745 | |||||||||||||||
| 2015 | Growth | Large Cap Core Plus | Equity Long/Short | Equity Market Neutral | ||||||||||||
| Distributions from net ordinary income1 | $ | 68,225 | $ | 3,149,388 | $ | — | $ | 47,365 | ||||||||
| Distributions from net long-term capital gains | 4,368,689 | 128,652 | 123,104 | 99,835 | ||||||||||||
| 1 | Net ordinary income consists of net taxable income derived from dividends, interest, and net short-term capital gains, if any. |
| NUVEEN | 147 |
Notes to Financial Statements (continued)
As of August 31, 2016, the Funds’ tax year end, the following Funds had unused capital losses carrying forward available for federal income tax purposes to be applied against future capital gains, if any. The capital losses are not subject to expiration.
| Large Cap Value | Large Cap Core | Large Cap Growth | Concentrated Core | Core Dividend | ||||||||||||||||
| Capital losses to be carried forward – not subject to expiration | $ | 19,797,364 | $ | 6,746,408 | $ | 2,244,394 | $ | 7,306,848 | $ | 1,760,490 | ||||||||||
| Large Cap Core Plus | Equity Long/Short | Equity Market Neutral | ||||||||||||||||||
| Capital losses to be carried forward – not subjective to expiration | $ | 6,474,311 | $ | 6,907,409 | $ | 2,717,889 | ||||||||||||||
The Funds have elected to defer late-year losses in accordance with federal income tax rules. These losses are treated as having arisen on the first day of the following fiscal year. The following Fund has elected to defer losses as follows:
| Equity Market Neutral | ||||||||
| Post-October capital losses2 | $ | — | ||||||
| Late-year ordinary losses3 | 487,116 | |||||||
| 2 | Capital losses incurred from November 1, 2015 through August 31, 2016, the Funds’ tax year end. |
| 3 | Ordinary losses incurred from January 1, 2016 through August 31, 2016, and/or specified losses incurred from November 1, 2015 through August 31, 2016. |
7. Management Fees and Other Transactions with Affiliates
Management Fees
Each Fund’s management fee compensates the Adviser for overall investment advisory and administrative services and general office facilities. The Sub-Adviser is compensated for its services to the Funds from the management fees paid to the Adviser.
Each Fund’s management fee consists of two components – a fund-level fee, based only on the amount of assets within each individual Fund, and a complex-level fee, based on the aggregate amount of all eligible fund assets managed by the Adviser. This pricing structure enables each Fund’s shareholders to benefit from growth in the assets within their respective Fund as well as from growth in the amount of complex-wide assets managed by the Adviser.
The annual Fund-level fee, payable monthly, for each Fund is calculated according to the following schedule:
| Large Cap Value | Large Cap Core | Large Cap Growth | Concentrated Core | |||||||||||||||||||||||||||||
| Average Daily Net Assets | (For the period August 1, 2015 through June 29, 2016) | (Effective June 30, 2016) | (For the period August 1, 2015 through June 29, 2016) | (Effective June 30, 2016) | (For the period August 1, 2015 through June 29, 2016) | (Effective June 30, 2016) | (For the period August 1, 2015 through June 29, 2016) | (Effective June 30, 2016) | ||||||||||||||||||||||||
| For the first $125 million | 0.5500 | % | 0.5000 | % | 0.5500 | % | 0.5000 | % | 0.5500 | % | 0.5000 | % | 0.6500 | % | 0.5500 | % | ||||||||||||||||
| For the next $125 million | 0.5375 | 0.4875 | 0.5375 | 0.4875 | 0.5375 | 0.4875 | 0.6375 | 0.5375 | ||||||||||||||||||||||||
| For the next $250 million | 0.5250 | 0.4750 | 0.5250 | 0.4750 | 0.5250 | 0.4750 | 0.6250 | 0.5250 | ||||||||||||||||||||||||
| For the next $500 million | 0.5125 | 0.4625 | 0.5125 | 0.4625 | 0.5125 | 0.4625 | 0.6125 | 0.5125 | ||||||||||||||||||||||||
| For the next $1 billion | 0.5000 | 0.4500 | 0.5000 | 0.4500 | 0.5000 | 0.4500 | 0.6000 | 0.5000 | ||||||||||||||||||||||||
| For net assets over $2 billion | 0.4750 | 0.4250 | 0.4750 | 0.4250 | 0.4750 | 0.4250 | 0.5750 | 0.4750 | ||||||||||||||||||||||||
| Core Dividend | ||||||||||||||||||||||||
| Average Daily Net Assets | (For the period August 1, 2015 through June 29, 2016) | (Effective June 30, 2016) | Growth | Large Cap Core Plus | Equity Long/Short | Equity Market Neutral | ||||||||||||||||||
| For the first $125 million | 0.5500 | % | 0.5000 | % | 0.5000 | % | 1.0000 | % | 1.1000 | % | 1.1000 | % | ||||||||||||
| For the next $125 million | 0.5375 | 0.4875 | 0.4875 | 0.9875 | 1.0875 | 1.0875 | ||||||||||||||||||
| For the next $250 million | 0.5250 | 0.4750 | 0.4750 | 0.9750 | 1.0750 | 1.0750 | ||||||||||||||||||
| For the next $500 million | 0.5125 | 0.4625 | 0.4625 | 0.9625 | 1.0625 | 1.0625 | ||||||||||||||||||
| For the next $1 billion | 0.5000 | 0.4500 | 0.4500 | 0.9500 | 1.0500 | 1.0500 | ||||||||||||||||||
| For net assets over $2 billion | 0.4750 | 0.4250 | 0.4250 | 0.9250 | 1.0250 | 1.0250 | ||||||||||||||||||
| 148 | NUVEEN |
The annual complex-level fee, payable monthly, for each Fund is calculated according to the following schedule:
| Complex-Level Asset Breakpoint Level* | Effective Rate at Breakpoint Level | |||
| $55 billion | 0.2000 | % | ||
| $56 billion | 0.1996 | |||
| $57 billion | 0.1989 | |||
| $60 billion | 0.1961 | |||
| $63 billion | 0.1931 | |||
| $66 billion | 0.1900 | |||
| $71 billion | 0.1851 | |||
| $76 billion | 0.1806 | |||
| $80 billion | 0.1773 | |||
| $91 billion | 0.1691 | |||
| $125 billion | 0.1599 | |||
| $200 billion | 0.1505 | |||
| $250 billion | 0.1469 | |||
| $300 billion | 0.1445 | |||
| * | The complex-level fee is calculated based upon the aggregate daily “eligible assets” of all Nuveen funds. Eligible assets do not include assets attributable to investments in other Nuveen funds or assets in excess of a determined amount (originally $2 billion) added to the Nuveen fund complex in connection with the Adviser’s assumption of the management of the former First American Funds effective January 1, 2011. Eligible assets include closed-end fund assets managed by the Adviser that are attributable to certain types of leverage. For these purposes, leverage includes the closed-end funds’ use of preferred stock and borrowings and certain investments in the residual interest certificates (also called inverse floating rate securities) in tender option bond (TOB) trusts, including the portion of assets held by a TOB trust that has been effectively financed by the trust’s issuance of floating rate securities, subject to an agreement by the Adviser as to certain funds to limit the amount of such assets for determining eligible assets in certain circumstances. As of August 31, 2016, the complex-level fee for each Fund was 0.1607%. |
The Adviser has agreed to waive fees and/or reimburse expenses (“Expense Cap”) of the Funds so that total annual Fund operating expenses (excluding 12b-1 distribution and/or service fees, interest expenses, taxes, acquired fund fees and expenses, fees incurred in acquiring and disposing of portfolio securities and extraordinary expenses) do not exceed the average daily net assets of any class of Fund shares in the amounts and for the time periods stated in the following table.
| Fund | Temporary Expense Cap | Temporary Expense Cap Expiration Date | Permanent Expense Cap | |||||||
| Large Cap Value | N/A | N/A | 1.20 | % | ||||||
| Large Cap Core | 0.80 | %* | December 31, 2017 | N/A | ||||||
| Large Cap Growth | 0.81 | * | December 31, 2017 | N/A | ||||||
| Concentrated Core | 0.86 | ** | December 31, 2017 | N/A | ||||||
| Core Dividend | 0.81 | * | December 31, 2017 | N/A | ||||||
| Growth | 0.81 | ** | December 31, 2017 | 1.40 | ||||||
| Large Cap Core Plus | 1.25 | December 31, 2016 | N/A | |||||||
| Equity Long/Short | 1.40 | December 31, 2016 | N/A | |||||||
| Equity Market Neutral | 1.40 | December 31, 2016 | N/A | |||||||
| * | Effective June 30, 2016. Prior to June 30, 2016, the Fund’s Temporary Expense Cap was 0.95%. |
| ** | Effective June 30, 2016. Prior to June 30, 2016, the Fund’s Temporary Expense Cap was 1.00%. |
N/A – Not applicable.
Other Transactions with affiliates
Neither Trust pays compensation directly to those of its trustees who are affiliated with the Adviser or to its officers, all of whom receive remuneration for their services to each Trust from the Adviser or its affiliates. The Board has adopted a deferred compensation plan for independent trustees that enables trustees to elect to defer receipt of all or a portion of the annual compensation they are entitled to receive from certain Nuveen-advised funds. Under the plan, deferred amounts are treated as though equal dollar amounts had been invested in shares of select Nuveen-advised funds.
During the current fiscal period, Nuveen Securities, LLC (the “Distributor”), a wholly-owned subsidiary of Nuveen, collected sales charges on purchases of Class A Shares, the majority of which were paid out as concessions to financial intermediaries as follows:
| Large Cap Value | Large Cap Core | Large Cap Growth | Concentrated Core | Core Dividend | ||||||||||||||||
| Sales charges collected (Unaudited) | $ | 80,924 | $ | 316,013 | $ | 52,848 | $ | 113,325 | $ | 96,383 | ||||||||||
| Paid to financial intermediaries (Unaudited) | 71,945 | 280,303 | 47,264 | 99,538 | 84,693 | |||||||||||||||
| Growth | Large Cap Core Plus | Equity Long/Short | Equity Market Neutral | |||||||||||||||||
| Sales charges collected (Unaudited) | $ | 24,361 | $ | 32,407 | $ | 112,663 | $ | 8,117 | ||||||||||||
| Paid to financial intermediaries (Unaudited) | 21,361 | 29,295 | 98,921 | 7,613 | ||||||||||||||||
The Distributor also received 12b-1 service fees on Class A Shares, substantially all of which were paid to compensate financial intermediaries for providing services to shareholders relating to their investments.
| NUVEEN | 149 |
Notes to Financial Statements (continued)
During the current fiscal period, the Distributor compensated financial intermediaries directly with commission advances at the time of purchase as follows:
| Large Cap Value | Large Cap Core | Large Cap Growth | Concentrated Core | Core Dividend | ||||||||||||||||
| Commission advances (Unaudited) | $ | 58,854 | $ | 190,823 | $ | 36,649 | $ | 73,570 | $ | 9,319 | ||||||||||
| Growth | Large Cap Core Plus | Equity Long/Short | Equity Market Neutral | |||||||||||||||||
| Commission advances (Unaudited) | $ | 7,819 | $ | 20,931 | $ | 28,574 | $ | 9,585 | ||||||||||||
To compensate for commissions advanced to financial intermediaries, all 12b-1 service and distribution fees collected on Class C Shares during the first year following a purchase are retained by the Distributor. During the current fiscal period, the Distributor retained such 12b-1 fees as follows:
| Large Cap Value | Large Cap Core | Large Cap Growth | Concentrated Core | Core Dividend | ||||||||||||||||
| 12b-1 fees retained (Unaudited) | $ | 60,539 | $ | 252,640 | $ | 47,341 | $ | 159,192 | $ | 23,402 | ||||||||||
| Growth | Large Cap Core Plus | Equity Long/Short | Equity Market Neutral | |||||||||||||||||
| 12b-1 fees retained (Unaudited) | $ | 9,284 | $ | 57,591 | $ | 42,546 | $ | 4,904 | ||||||||||||
The remaining 12b-1 fees charged to the Funds were paid to compensate financial intermediaries for providing services to shareholders relating to their investments.
The Distributor also collected and retained CDSC on share redemptions during the current fiscal period, as follows:
| Large Cap Value | Large Cap Core | Large Cap Growth | Concentrated Core | Core Dividend | ||||||||||||||||
| CDSC retained (Unaudited) | $ | 5,097 | $ | 16,087 | $ | 2,461 | $ | 9,233 | $ | 1,133 | ||||||||||
| Growth | Large Cap Core Plus | Equity Long/Short | Equity Market Neutral | |||||||||||||||||
| CDSC retained (Unaudited) | $ | 661 | $ | 2,783 | $ | 4,554 | $ | 1,540 | ||||||||||||
As of the end of the reporting period, Nuveen owned shares of the following Funds, as follows:
| Large Cap Value | Large Cap Growth | Concentrated Core | Core Dividend | Growth | ||||||||||||||||
| Class A Shares | — | — | — | 2,013 | — | |||||||||||||||
| Class C Shares | — | — | — | 2,015 | — | |||||||||||||||
| Class R3 Shares | 2,126 | N/A | N/A | N/A | 2,125 | |||||||||||||||
| Class R6 Shares | — | 1,030 | 991 | N/A | N/A | |||||||||||||||
| Class I Shares | — | — | — | 36,228 | — | |||||||||||||||
N/A – Fund does not offer share class.
8. Borrowing Arrangements
Uncommitted Line of Credit
During the current fiscal period, the Funds participated in an unsecured bank line of credit (“Unsecured Credit Line”) under which outstanding balances would bear interest at a variable rate. On December 31, 2015, (the only date utilized during the current fiscal period), the following Funds borrowed the following amounts from the Unsecured Credit Line, each at an annualized interest rate of 1.68% on their respective outstanding balance.
| Large Cap Core | Large Cap Growth | Concentrated Core | Core Dividend | Large Cap Core Plus | ||||||||||||||||
| Outstanding balance at December 31, 2015 | $ | 3,626,903 | $ | 376,872 | $ | 252,713 | $ | 6,860 | $ | 57,797 | ||||||||||
Committed Line of Credit
The Funds, along with certain other funds managed by the Adviser (“Participating Funds”), have established a 364-day, approximately $2.5 billion standby credit facility with a group of lenders, under which the Participating Funds may borrow for various purposes other than leveraging for investment purposes. A large portion of this facility’s capacity (and its associated costs as described below) is currently dedicated for use by a small number of Participating Funds, which does not include any of the Funds covered by this shareholder report. The remaining capacity under the facility
| 150 | NUVEEN |
(and the corresponding portion of the facility’s annual costs) is separately dedicated to most of the other open-end funds in the Nuveen fund family, including all of the Funds covered by this shareholder report, along with a number of Nuveen closed-end funds. The credit facility expires in July 2017 unless extended or renewed.
The credit facility has the following terms: a fee of 0.15% per annum on unused commitment amounts, and interest at a rate equal to the higher of (a) one-month LIBOR (London Inter-Bank Offered Rate) plus 1.25% per annum or (b) the Fed Funds rate plus 1.25% per annum on amounts borrowed. Participating Funds paid administration, legal and arrangement fees, which are recognized as a component of “Other expenses” on the Statement of Operations, and along with commitment fees, have been allocated among such Participating Funds based upon the relative proportions of the facility’s aggregate capacity reserved for them and other factors deemed relevant by the Adviser and the Board of each Participating Fund.
During the current fiscal period, none of the Funds utilized this facility.
| NUVEEN | 151 |
Fund Information (Unaudited)
Fund Manager Nuveen Fund Advisors, LLC 333 West Wacker Drive Chicago, IL 60606
Sub-Adviser Nuveen Asset Management, LLC 333 West Wacker Drive Chicago, IL 60606 | Independent Registered KPMG LLP 200 East Randolph Street Chicago, IL 60601
Custodian State Street Bank & Trust Company One Lincoln Street Boston, MA 02111 | Legal Counsel Chapman and Cutler LLP Chicago, IL 60603 | Transfer Agent and Boston Financial Data Services Nuveen Investor Services P.O. Box 8530 Boston, MA 02266-8530 (800) 257-8787 | |||||||
| ||||||||||||||||||||
| Long-Term Capital Gain Distributions: The following Funds hereby designate as long-term capital gain dividends, pursuant to Internal Revenue Code Section 852(b)(3), the amount shown in the accompanying table or, if greater, the amount necessary to reduce earnings and profits of the Funds related to net capital gain to zero for the tax year ended August 31, 2016. | ||||||||||||||||||||
| Large Cap Value | Large Cap Core | Large Cap Growth | Concentrated Core | Core Dividend | Growth | Large Cap Core Plus | Equity Market Neutral | |||||||||||||
| Long-Term Capital Gain Distributions | $23,420,142 | $1,244,647 | $1,755,760 | $835,142 | $146,762 | $5,459,719 | $2,412,935 | $925,032 | ||||||||||||
| Distribution Information: The following Funds hereby designate their percentages of dividends paid from net ordinary income as dividends qualifying for the 70% dividends received deduction (“DRD”) for corporations and their percentages as qualified dividend income (“QDI”) for individuals under Section 1 (h)(11) of the Internal Revenue Code as shown in the accompanying table. The actual qualified dividend income distributions will be reported to shareholders on Form 1099-DIV which will be sent to shareholders shortly after calendar year end. | ||||||||||||||||||||
Large Cap | Large Cap | Large Cap | Concentrated | Core | Growth | Large Cap | ||||||||||||||
| % QDI | 77% | 100% | 79% | 62% | 88% | 91% | 100% | |||||||||||||
| % DRD | 76% | 100% | 78% | 62% | 87% | 89% | 100% | |||||||||||||
| ||||||||||||||
| Quarterly Form N-Q Portfolio of Investments Information: Each Fund is required to file its complete schedule of portfolio holdings with the Securities and Exchange Commission (SEC) for the first and third quarters of each fiscal year on Form N-Q. You may obtain this information directly from the SEC. Visit the SEC on-line at http://www.sec.gov or in person at the SEC’s Public Reference Room in Washington, D.C. Call the SEC toll-free at (800) SEC-0330 for room hours and operation. | ||||||||||||||
| ||||||||||||||
| Nuveen Funds’ Proxy Voting Information: You may obtain (i) information regarding how each fund voted proxies relating to portfolio securities held during the most recent twelve-month period ended June 30, without charge, upon request, by calling Nuveen toll-free at (800) 257-8787 or on Nuveen’s website at www.nuveen.com and (ii) a description of the policies and procedures that each fund used to determine how to vote proxies relating to portfolio securities without charge, upon request, by calling Nuveen toll-free at (800) 257-8787. You may also obtain this information directly from the SEC. Visit the SEC on-line at http://www.sec.gov. | ||||||||||||||
| ||||||||||||||
| FINRA BrokerCheck: The Financial Industry Regulatory Authority (FINRA) provides information regarding the disciplinary history of FINRA member firms and associated investment professionals. This information as well as an investor brochure describing FINRA BrokerCheck is available to the public by calling the FINRA BrokerCheck Hotline number at (800) 289-9999 or by visiting www.FINRA.org. | ||||||||||||||
| 152 | NUVEEN |
Used in this Report (Unaudited)
Average Annual Total Return: This is a commonly used method to express an investment’s performance over a particular, usually multi-year time period. It expresses the return that would have been necessary each year to equal the investment’s actual cumulative performance (including change in NAV or offer price and reinvested dividends and capital gains distributions, if any) over the time period being considered.
BofA/Merrill Lynch 3-Month U.S. Treasury Bill Index: The BofA/Merrill Lynch 3-Month U.S. Treasury Bill Index is an unmanaged index that is comprised of a single U.S. Treasury issue with approximately three months to final maturity, purchased at the beginning of each month and held for one full month. The index returns assume reinvestment of distributions, but do not reflect any applicable sales charges or management fees.
Gross Domestic Product (GDP): The total market value of all final goods and services produced in a country/region in a given year, equal to total consumer, investment and government spending, plus the value of exports, minus the value of imports.
Lipper Alternative Active Extension Funds Classification Average: Represents the average annualized returns for all reporting funds in the Lipper Alternative Active Extension Funds Classification. Lipper returns account for the effects of management fees and assume reinvestment of dividends, but do not reflect any applicable sales charges.
Lipper Alternative Equity Market Neutral Funds Classification Average: Represents the average annualized returns for all reporting funds in the Lipper Alternative Equity Market Neutral Funds Classification. Lipper returns account for the effects of management fees and assume reinvestment of dividends, but do not reflect any applicable sales charges.
Lipper Alternative Long/Short Equity Funds Classification Average: Represents the average annualized returns for all reporting funds in the Lipper Alternative Long/Short Equity Funds Classification. Lipper returns account for the effects of management fees and assume reinvestment of dividends, but do not reflect any applicable sales charges.
Lipper Equity Income Funds Classification Average: Represents the average annualized returns for all reporting funds in the Lipper Equity Income Funds Classification. Lipper returns account for the effects of management fees and assume reinvestment of dividends, but do not reflect any applicable sales charges.
Lipper Large-Cap Core Funds Classification Average: Represents the average annualized returns for all reporting funds in the Lipper Large-Cap Core Funds Classification. Lipper returns account for the effects of management fees and assume reinvestment of dividends, but do not reflect any applicable sales charges.
Lipper Large-Cap Growth Funds Classification Average: Represents the average annualized returns for all reporting funds in the Lipper Large-Cap Growth Funds Classification. Lipper returns account for the effects of management fees and assume reinvestment of dividends, but do not reflect any applicable sales charges.
Lipper Multi-Cap Core Funds Classification Average: Represents the average annualized returns for all reporting funds in the Lipper Multi-Cap Core Funds Classification. Lipper returns account for the effects of management fees and assume reinvestment of dividends, but do not reflect any applicable sales charges.
Lipper Multi-Cap Value Funds Classification Average: Represents the average annualized returns for all reporting funds in the Lipper Multi-Cap Value Funds Classification. The Lipper returns account for the effects of management fees and assume reinvestment of dividends, but do not reflect any applicable sales charges.
Long Position: A security the fund owns in its portfolio.
| NUVEEN | 153 |
Glossary of Terms Used in this Report (Unaudited) (continued)
MSCI Emerging Markets Index: A free float-adjusted market capitalization index that is designed to measure equity market performance in the global emerging markets. The index returns assume reinvestment of distributions, but do not reflect any applicable sales charges or management fees.
Net Asset Value (NAV) Per Share: A fund’s Net Assets is equal to its total assets (securities, cash and accrued earnings) less its total liabilities. For funds with multiple classes, Net Assets are determined separately for each share class. NAV per share is equal to the fund’s (or share class’) Net Assets divided by its number of shares outstanding.
Price/Earnings (P/E) Ratio: is calculated by dividing the current price of the stock by its forecasted 12 months’ earnings per share. The average of the price/earnings ratio of a fund is a weighted harmonic average of all the current P/E ratios (excluding negatives) of the stocks in the fund’s portfolio. This should not be construed as a forecast of the Fund’s performance.
Russell 1000® Growth Index: An index that measures the performance of those Russell 1000® companies with higher price-to-book ratios and higher forecasted growth values. Index returns assume reinvestment of dividends, but do not reflect any applicable sales charges or management fees.
Russell 1000® Index: An unmanaged index, considered representative of large-cap stocks. The index returns assume reinvestment of dividends, but do not reflect any applicable sales charges or management fees.
Russell 1000® Value Index: An index that measures the performance of those Russell 1000® companies with lower price-to-book ratios and lower forecasted growth values. Index returns assume reinvestment of dividends, but do not include the effects of any applicable sales charges or management fees.
S&P 500® Index: An unmanaged index generally considered representative of the U.S. stock market. Index returns assume reinvestment of distributions, but do not include the effects of any applicable sales charges or management fees.
Short Position: A security the fund does not own but has sold through the delivery of a borrowed security.
Tax Equalization: The practice of treating a portion of the distribution made to a redeeming shareholder, which represents his proportionate part of undistributed net investment income and capital gain as a distribution for tax purposes. Such amounts are referred to as the equalization debits (or payments) and will be considered a distribution to the shareholder of net investment income and capital gain for calculation of the fund’s dividends paid deduction.
| 154 | NUVEEN |
Annual Investment Management Agreement
Approval Process (Unaudited)
The Board of Trustees of each Fund (the “Board,” and each Trustee a “Board Member”), including the Board Members who are not parties to the Funds’ advisory or sub-advisory agreements or “interested persons” of any such parties (the “Independent Board Members”), is responsible for overseeing the performance of the investment adviser and sub-adviser to the respective Fund and determining whether to continue such Fund’s advisory agreement (the “Investment Management Agreement”) between the Fund and Nuveen Fund Advisors, LLC (the “Adviser”) and the sub-advisory agreement (the “Sub-Advisory Agreement” and, together with the Investment Management Agreement, the “Advisory Agreements”) between the Adviser and Nuveen Asset Management, LLC (the “Sub-Adviser”). Following an initial term with respect to each Fund upon its commencement of operations, the Board reviews the Investment Management Agreement and the Sub-Advisory Agreement on behalf of such Fund and votes to determine whether the respective Advisory Agreement should be renewed. Accordingly, at an in-person meeting held on May 24-26, 2016 (the “May Meeting”), the Board, including a majority of the Independent Board Members, considered and approved the existing Advisory Agreements for the Funds.
During the year, the Board and its Committees met regularly to receive materials and discuss a variety of topics impacting the Funds including, among other things, overall market conditions and market performance, Fund investment performance, brokerage execution, valuation of securities, Rule 12b-1 plans and payments, sub-transfer agency and other payments to financial intermediaries, compliance matters, securities lending, risk management and ongoing initiatives. The Board had established several standing Committees, including the Open-end Fund Committee and Closed-end Fund Committee which permit the Board Members to delve further into the topics particularly relevant to the respective product line and enhance the Board’s effectiveness and oversight of the Funds. The Board also seeks to meet with the Sub-Adviser and its investment team at least once over a multiple year rotation through site visits. The information and knowledge the Board gained throughout the year from the Board and Committee meetings, site visits and the related materials were relevant to the Board’s evaluation of the Advisory Agreements, and the Board took such information into account in its review of the Advisory Agreements.
In addition to the materials received throughout the year, the Board received additional materials prepared specifically for its annual review of the Advisory Agreements in response to a request by independent legal counsel on behalf of the Independent Board Members. The materials addressed a variety of topics, including a description of the services provided by the Adviser and the Sub-Adviser (each, a “Fund Adviser”); a review of fund performance with a detailed focus on any performance outliers; an analysis of the investment teams; an analysis of the fees and expense ratios of the Funds, including information comparing such fees and expenses to that of peer groups; an assessment of shareholder services for the Funds and of the performance of certain service providers; a review of initiatives instituted or continued during the past year; and information regarding the profitability of the Fund Advisers, the compensation of portfolio managers, and compliance and risk matters.
As part of its annual review, the Board held a separate meeting on April 12-13, 2016 to review the Funds’ investment performance and consider an analysis by the Adviser of the Sub-Adviser examining, among other things, the team’s assets under management, investment performance, investment approach, and the stability and structure of the Sub-Adviser’s organization and investment team. During the review, the Independent Board Members requested and received additional information from management. Throughout the year and throughout their review of the Advisory Agreements, the Independent Board Members were assisted by independent legal counsel. The Independent Board Members met separately with independent legal counsel without management present and received a memorandum from such counsel outlining their fiduciary duties and legal standards in reviewing the Advisory Agreements. The Independent Board Members’ review of the Advisory Agreements reflected an ongoing process that incorporated the information and considerations that occurred over the years, including the most recent year, as well as the information specifically furnished for the renewal process. In deciding to renew the Advisory Agreements, the Independent Board Members did not identify a particular factor as controlling, but rather the decision reflected the comprehensive consideration of all the information presented. The following summarizes the principal factors, but not all the factors, the Board considered in its review of the Advisory Agreements and its conclusions.
A. Nature, Extent and Quality of Services
In evaluating the renewal of the Advisory Agreements, the Independent Board Members received and considered information regarding the nature, extent and quality of the applicable Fund Adviser’s services provided to the respective Fund and the initiatives undertaken during the past year by the Adviser. The Board recognized the comprehensive set of services the Adviser provided to manage and operate the Nuveen funds, including (a) product management (such as setting dividends, positioning the product in the marketplace, managing the relationships with the distribution platforms, maintaining and enhancing shareholder communications and reporting to the Board); (b) investment services (such as overseeing sub-advisers and other service providers; analyzing investment performance and risks; overseeing risk management and disclosure; developing and interpreting investment policies; assisting in the development of products; helping to prepare financial statements and marketing disclosures; and overseeing trade execution); (c) fund administration (such as helping to prepare fund tax returns and complete other tax compliance matters; and helping to prepare regulatory filings and shareholder reports); (d) fund Board administration (such as preparing Board materials and organizing and providing assistance
| NUVEEN | 155 |
Annual Investment Management Agreement Approval Process (Unaudited) (continued)
for Board meetings); (e) compliance (such as helping to devise and maintain the funds’ compliance program and related testing); and (f) legal support (such as helping to prepare registration statements and proxy statements, interpreting regulations and policies and overseeing fund activities).
The Board reviewed the continued investment the Adviser had made in its business to continue to strengthen the breadth and quality of its services to the benefit of the Nuveen funds. The Board noted the Adviser’s additional staffing in key areas that support the funds and the Board, including in investment services, operations, fund governance, compliance, fund administration, product management, retail distribution and information technology. Among the enhancements to its services, the Board recognized the Adviser’s (a) expanded activities and support required as a result of regulatory developments, including in areas of compliance and reporting; (b) increased support for dividend management; (c) continued investment in its technical capabilities as the Adviser continued to build out a centralized fund data platform, enhance mobility and remote access capabilities, rationalize and upgrade software platforms, and automate certain regulatory liquidity determinations; (d) continued efforts to rationalize the product line through mergers, liquidations and re-positioning of the Nuveen funds with the goal of increasing efficiencies, reducing costs, improving performance and addressing shareholder needs; (e) continued efforts to develop new lines of business designed to enhance the Nuveen product line and meet investor demands; and (f) continued commitment to enhance risk oversight, including the formation of the operational risk group to provide operational risk assessment, the access to platforms which provide better risk reporting to support investment teams, and the development of a new team to initially review new products and major product initiatives. The Board also recognized the Adviser’s efforts to renegotiate certain fees of other service providers which culminated in reduced expenses for all funds for custody and accounting services without diminishing the breadth and quality of the services provided. The Board considered the Chief Compliance Officer’s report regarding the Adviser’s compliance program, the Adviser’s continued development, execution and management of its compliance program, and the additions to the compliance team to support the continued growth of the Nuveen fund family and address regulatory developments.
The Board also considered information highlighting the various initiatives that the Adviser had implemented or continued during the year to enhance or support the open-end fund product line. The Board noted the Adviser’s continued initiatives (a) to develop and offer new outcome-oriented funds; (b) to refine the reports to the Board, including enhanced reporting regarding payments to intermediaries, as well as provide presentations to the Board to keep it apprised of various topics that are relevant to the open-end fund product line (such as marketing initiatives, portfolio analytics and sales results); (c) to modify the contingent deferred sales load structure for Class A shares to be more competitive with peers; (d) to launch a new share class to attract institutional clients; and (e) to change portfolio managers on various funds. The Board recognized that initiatives that attract assets to the Nuveen family of funds benefited the funds as fixed costs would be spread over a larger asset base and, as described below, through the complex-wide arrangement which generally would provide that the management fees of the funds (subject to limited exceptions) are reduced as asset levels for the complex increase. The Board also considered the Adviser’s review of the pricing on its entire open-end fund line which resulted in either a reduction in the contractual management fee, a reduction in (or, in certain cases, the adoption of) a temporary expense cap or a combination thereof for numerous funds in the complex helping to better position such funds for future growth, including Nuveen Large Cap Value Fund (the “Value Fund”), which reduced its management fee, Nuveen Growth Fund (the “Growth Fund”), which reduced its temporary expense cap, and Nuveen Large Cap Core Fund (the “Large Cap Core Fund”), Nuveen Large Cap Growth Fund (the “Large Cap Growth Fund”), Nuveen Concentrated Core Fund (the “Concentrated Fund”) and Nuveen Core Dividend Fund (the “Dividend Fund”), each of which reduced both its management fee and temporary expense cap.
As noted, the Adviser also oversees the Sub-Adviser who primarily provides the portfolio advisory services to the Funds. The Board recognized the skill and competency of the Adviser in monitoring and analyzing the performance of the Sub-Adviser and managing the sub-advisory relationship. The Board noted that the Adviser recommended the renewal of each Sub-Advisory Agreement.
Based on their review, the Independent Board Members found that, overall, the nature, extent and quality of services provided to the respective Funds under each applicable Advisory Agreement were satisfactory.
B. The Investment Performance of the Funds and Fund Advisers
The Board considered the long-term and short-term performance history of the Nuveen funds. As noted above, the Board reviewed fund performance at its quarterly meetings throughout the year and took into account the information derived from the discussions with representatives of the Adviser about fund performance at these meetings. The Board also considered the Adviser’s analysis of fund performance with particular focus on any performance outliers and the factors contributing to such performance and any steps the investment team had taken to address performance concerns. The Board reviewed, among other things, each Fund’s investment performance both on an absolute basis and in comparison to peer funds (the “Performance Peer Group”) and to recognized and/or customized benchmarks (i.e., generally benchmarks derived from multiple recognized benchmarks) for the quarter, one-, three- and five-year periods ending December 31, 2015 (or for such shorter periods available for the Large Cap Core Fund, the Large Cap Growth Fund, the Concentrated Fund, the Dividend Fund, Nuveen Large Cap Core Plus Fund (the “Core Plus Fund”) and Nuveen Equity Market Neutral Fund (the “Market Neutral Fund”), which did not exist for part of the foregoing time frame), as well as performance information reflecting the first quarter of 2016.
In evaluating performance information, the Board recognized the following factors may impact the performance data as well as the consideration to be given to particular performance data:
| 156 | NUVEEN |
| • | The performance data reflected a snapshot in time, in this case as of the end of the most recent calendar year or quarter. A different performance period, however, could generate significantly different results. |
| • | Long-term performance can be adversely affected by even one period of significant underperformance so that a single investment decision or theme had the ability to disproportionately affect long-term performance. |
| • | Shareholders evaluate performance based on their own holding period which may differ from the performance period reviewed by the Board, leading to different performance results. |
| • | Open-end funds offered multiple classes and the performance data provided for open-end funds was based on Class A shares. The performance of the other classes of a fund, however, should be substantially similar on a relative basis because all of the classes would be invested in the same portfolio of securities and differences in performance among classes could be principally attributed to the variations in distribution and servicing expenses of each class. |
| • | The Board recognized the difficulty in establishing appropriate peer groups and benchmarks for certain funds. The Board noted that management classified the Performance Peer Groups as low, medium and high in relevancy and took the relevancy of the Performance Peer Group into account when considering the comparative performance data. If the Performance Peer Group differed somewhat from a fund, the Board recognized that the comparative performance data may be of limited value. The Board also recognized that each fund operated pursuant to its own investment objective(s), parameters and restrictions which may differ from that of the Performance Peer Group or benchmark and that these variations lead to differences in performance results. |
With respect to any Nuveen funds for which the Board has identified performance concerns, the Board monitors such funds closely until performance improves, discusses with the Adviser the reasons for such results, considers those steps necessary or appropriate to address such issues, and reviews the results of any efforts undertaken. The Board was aware, however, that shareholders chose to invest or remain invested in a fund knowing that the Adviser and the applicable sub-adviser manage the fund, knowing the fund’s investment strategy and seeking exposure to that strategy (even if the strategy was “out of favor” in the marketplace) and knowing the fund’s fee structure.
For the Value Fund, the Board noted that the Fund underperformed its benchmark for the one-, three- and five-year periods and, although the Fund ranked in the fourth quartile in the Performance Peer Group in the shorter one-year period, the Fund ranked in the second quartile in the longer three- and five-year periods. The Board determined that the Fund’s performance was satisfactory.
For the Large Cap Core Fund, the Board noted that the Fund ranked in its Performance Peer Group in the fourth quartile and underperformed its benchmark in the one-year period. The Board noted that the factors that contributed to the Fund’s underperformance included the Fund’s investment in lower price/earnings and higher beta names and an overweight in the retail sector. Notwithstanding the weak performance in 2015, the Board noted that the Fund’s performance for the first quarter of 2016 ending March 31, 2016 was in the first quartile of its Performance Peer Group. The Board recognized that the Fund’s performance history was limited, making a meaningful assessment of performance difficult. The Board will continue to monitor this Fund closely.
For the Large Cap Growth Fund, the Board noted that the Fund ranked in its Performance Peer Group in the fourth quartile and underperformed its benchmark in the one-year period. The Board noted that the factors that contributed to the Fund’s underperformance included the Fund’s investment in lower price/earnings and higher beta names and an overweight in the retail sector. Notwithstanding the weak performance in 2015, the Board noted that the Fund’s performance for the first quarter of 2016 ended March 31, 2016 was in the first quartile of its Performance Peer Group. The Board recognized that the Fund’s performance history was limited, making a meaningful assessment of performance difficult. The Board will continue to monitor this Fund closely.
For the Concentrated Fund, the Board noted that the Fund ranked in its Performance Peer Group in the fourth quartile and underperformed its benchmark in the one-year period. The Board noted that the factors that contributed to the Fund’s underperformance included the Fund’s investment in lower price/earnings and higher beta names. The Board considered that the positioning of the Fund was not conducive to the flat or down economy and market of 2015. The Board recognized that the Fund’s performance history, however, was limited, making a meaningful assessment of performance difficult. The Board will continue to monitor this Fund closely.
For the Dividend Fund, the Board noted that the Fund ranked in its Performance Peer Group in the fourth quartile and underperformed its benchmark in the one-year period. The Board noted that the factors that contributed to the Fund’s underperformance included the Fund’s investment in lower price/earnings and higher beta names and an overweight in the retail sector. Notwithstanding the weak performance in 2015, the Board noted that the Fund’s performance for the first quarter of 2016 ended March 31, 2016 was in the second quartile of its Performance Peer Group. The Board recognized that the Fund’s performance history was limited, making a meaningful assessment of performance difficult. The Board will continue to monitor this Fund closely.
| NUVEEN | 157 |
Annual Investment Management Agreement Approval Process (Unaudited) (continued)
For the Growth Fund, the Board observed that the Fund underperformed its benchmark for the one-, three- and five-year periods. The Board further considered that, although the Fund ranked in the fourth quartile in its Performance Peer Group in the one-year period, the Fund ranked in the third quartile in the three- and five-year periods. The Board also noted that the Fund ranked in the first quartile of its Performance Peer Group for the quarter ending March 31, 2016 and noted the Fund’s positive absolute performance for the one-, three- and five-year periods. The Board determined that the Fund’s performance overall had been satisfactory.
For the Core Plus Fund, the Board noted that the Fund ranked in its Performance Peer Group in the third quartile and underperformed its benchmark in the one-year period. The Board further noted that the Fund ranked in the first quartile in its Performance Peer Group for the quarter ending March 31, 2016. The Board recognized that the Fund’s performance history, however, was limited, making a meaningful assessment of performance difficult. The Board will continue to monitor this Fund closely.
For Nuveen Equity Long/Short Fund (the “Long/Short Fund”), the Board noted that, although the Fund underperformed its benchmark in the one-, three- and five-year periods, the Fund ranked in the first quartile in the three- and five-year periods and the second quartile in the one-year period. The Board determined that the Fund’s performance had been generally favorable.
For the Market Neutral Fund, the Board noted that the Fund ranked in its Performance Peer Group in the second quartile and outperformed its benchmark in the one-year period. The Board also noted, however, that the Fund’s performance history was limited, making a meaningful assessment of performance difficult. Nevertheless, the Board determined that the Fund’s performance had been satisfactory.
C. Fees, Expenses and Profitability
1. Fees and Expenses
The Board evaluated the management fees and other fees and expenses of each Fund. The Board reviewed, among other things, the gross and net management fees and net total expenses of each Fund (expressed as a percentage of average net assets) in absolute terms and also in comparison to the fee and expense levels of a comparable universe of funds (the “Peer Universe”) and to a more focused subset in the Peer Universe (the “Peer Group”), each selected by an independent third-party fund data provider. The Independent Board Members also reviewed the methodology regarding the construction of the applicable Peer Universe and Peer Group.
In their evaluation of the management fee schedule, the Independent Board Members considered the fund-level and complex-wide breakpoint schedules, as described in further detail below. The Independent Board Members also took into account any fee waivers and/or expense reimbursements provided by Nuveen. In this regard, as noted above, the Board considered that management recently completed a review of the pricing of its open-end funds which resulted in the reduction of management fees and/or expense caps of various open-end funds. The Independent Board Members considered that the foregoing changes were estimated to result in significant savings to such funds either through a reduction in advisory fees paid or an increase in the fee waivers absorbed by Nuveen. In this regard, the Board noted that the Adviser agreed to reduce the management fee for the Value Fund, reduce the temporary expense cap for the Growth Fund, and reduce both the management fee and temporary expense cap for each of the Large Cap Core Fund, the Large Cap Growth Fund, the Concentrated Fund and the Dividend Fund.
In reviewing the comparative fee and expense information, the Independent Board Members recognized that various factors such as the limited size and particular composition of the Peer Universe or Peer Group (including the inclusion of other Nuveen funds in the peer set); expense anomalies; changes in the funds comprising the Peer Universe or Peer Group from year to year; levels of reimbursement or fee waivers; the timing of information used; and differences in services provided can impact the usefulness of the comparative data in helping to assess the appropriateness of a fund’s fees and expenses. In addition, in reviewing a fund’s fees and expenses compared to the fees and expenses of its peers, the Board generally considered the fund’s expenses and fees to be higher if they were over 10 basis points higher, slightly higher if they were 6 to 10 basis points higher, in line if they were within approximately 5 basis points higher than the peer average and below if they were below the peer average of the Peer Group. The Board reviewed the net expense ratio in recognition that the net expense ratio generally best represented the net experience of the shareholders of a fund as it directly reflected the costs of investing in the respective fund. The Board noted that the majority of the Nuveen funds had a net expense ratio near or below the average of the respective peers. For funds with a net expense ratio of 6 basis points or higher than their respective peer average, the Independent Board Members reviewed the reasons for the outlier status and were satisfied with the explanation for the difference or with any steps taken to address the difference.
The Board noted that the Value Fund, the Concentrated Fund, the Dividend Fund and the Long/Short Fund each had a net management fee and net expense ratio below the respective peer averages, the Large Cap Core Fund had a net management fee in line with its peer average and a net expense ratio below its peer average, the Large Cap Growth Fund and the Growth Fund each had a net management fee that was slightly higher than its peer average, but a net expense ratio below its peer average, the Core Plus Fund had a net management fee that was higher that its peer average but a net expense ratio below the peer average, and the Market Neutral Fund had net management fee higher than its peer average but a net expense ratio in line with the peer average. The Board further noted that the Adviser agreed to reduce the contractual management fee for the Value Fund, the temporary expense cap for the Growth Fund and both the contractual management fee and temporary expense cap for each of the Large Cap Core Fund, the Large Cap Growth Fund, the Concentrated Fund and the Dividend Fund.
| 158 | NUVEEN |
Based on their review of the fee and expense information provided, the Independent Board Members determined that each Fund’s management fees (as applicable) to a Fund Adviser were reasonable in light of the nature, extent and quality of services provided to the Fund.
2. Comparisons with the Fees of Other Clients
The Board also reviewed information regarding the fee rates for other types of clients advised or sub-advised by the respective Fund Adviser. For the Adviser and/or its affiliated sub-advisers, such other clients may include: separately managed accounts (such as retail, institutional or wrap accounts), hedge funds, other investment companies that are not offered by Nuveen but are sub-advised by one of Nuveen’s affiliated sub-advisers, foreign investment companies offered by Nuveen, and collective investment trusts.
The Board recognized that each Fund had an affiliated sub-adviser. With respect to affiliated sub-advisers, including the Sub-Adviser, the Board reviewed, among other things, the range of advisory fee rates and average fee rate assessed for the different types of clients. The Board reviewed information regarding the different types of services provided to the Funds compared to that provided to these other clients which typically did not require the same breadth of day-to-day services required for registered funds. The Board further considered information regarding the differences in, among other things, the distribution systems, investment policies, investor profiles, and account sizes between the Nuveen funds and the other types of clients. In addition, the Independent Board Members also recognized that the management fee rates of the foreign funds advised by the Adviser may also vary due to, among other things, differences in the client base, governing bodies, operational complexities and services covered by the management fee. The Independent Board Members recognized that the foregoing variations resulted in different economics among the product structures and culminated in varying management fees among the types of clients and funds.
The Board also was aware that, since the Funds had a sub-adviser, each Fund’s management fee reflected two components, the fee retained by the Adviser for its services and the fee the Adviser paid to the Sub-Adviser. The Board noted that many of the administrative services provided to support the Funds by the Adviser may not be required to the same extent or at all for the institutional clients or other clients. In general, the Board noted that higher fee levels reflected higher levels of service provided by the Fund Adviser, increased investment management complexity, greater product management requirements and higher levels of business risk or some combination of the foregoing. Given the inherent differences in the various products, particularly the extensive services provided to the Funds, the Independent Board Members concluded such facts justify the different levels of fees.
3. Profitability of Fund Advisers
In conjunction with their review of fees, the Independent Board Members also considered the profitability of Nuveen for its advisory activities on an absolute basis and in comparison to other investment advisers. The Independent Board Members reviewed, among other things, Nuveen’s adjusted operating margins, the gross and net revenue margins (pre-tax and after-tax) for advisory activities for the Nuveen funds, and the revenues, expenses, and net income (pre-tax and after-tax) of Nuveen for each of the last two calendar years. The Independent Board Members reviewed an analysis of the key drivers behind the changes in revenues and expenses that impacted profitability in 2015. The Independent Board Members also noted that the sub-advisory fees for the Funds are paid by the Adviser, however, the Board recognized that the Sub-Adviser is affiliated with Nuveen. In their review, the Independent Board Members recognized that profitability data is rather subjective as various allocation methodologies may be reasonable to employ but yet yield different results. The Board also reviewed the results of certain alternative methodologies. The Board considered the allocation methodology employed to prepare the profitability data as well as a summary of the refinements to the methodology that had been adopted over the years which may limit some of the comparability of Nuveen’s revenue margins over time. Two Independent Board Members also served as point persons for the Board throughout the year to review and discuss the methodology employed to develop the profitability analysis and any proposed changes thereto and to keep the Board apprised of such changes during the year. In reviewing the profitability data, the Independent Board Members noted that Nuveen’s operating margin as well as its margins for its advisory activities to the Nuveen funds for 2015 were consistent with such margins for 2014.
The Board also considered Nuveen’s adjusted operating margins compared to that of other comparable investment advisers (based on asset size and composition) with publicly available data. The Independent Board Members recognized, however, the limitations of the comparative data as the other advisers may have a different business mix, employ different allocation methodologies, have different capital structure and costs, may not be representative of the industry or other factors that limit the comparability of the profitability information. Nevertheless, the Independent Board Members noted that Nuveen’s adjusted operating margins appeared comparable to the adjusted margins of the peers.
Further, as the Adviser is a wholly-owned subsidiary of Nuveen which in turn is an operating division of TIAA Global Asset Management, the investment management arm of Teachers Insurance and Annuity Association of America (“TIAA-CREF”), the Board reviewed a balance sheet for TIAA-CREF reflecting its assets, liabilities and capital and contingency reserves for the last two calendar years to have a better understanding of the financial stability and strength of the TIAA-CREF complex, together with Nuveen.
Based on the information provided, the Independent Board Members noted that the Adviser appeared to be sufficiently profitable to operate as a viable investment management firm and to honor its obligations as a sponsor of the Nuveen funds.
| NUVEEN | 159 |
Annual Investment Management Agreement Approval Process (Unaudited) (continued)
With respect to the Sub-Adviser, the Independent Board Members also considered the profitability of the Sub-Adviser from its relationship with the Nuveen funds. The Independent Board Members reviewed the Sub-Adviser’s revenues, expenses and revenue margins (pre- and post-tax) for its advisory activities for the calendar year ended December 31, 2015. The Independent Board Members also reviewed profitability analysis reflecting the revenues, expenses and revenue margin (pre- and post-tax) by asset type for the Sub-Adviser for the calendar year ending December 31, 2015.
In evaluating the reasonableness of the compensation, the Independent Board Members also considered other amounts paid to a Fund Adviser by the Funds as well as indirect benefits (such as soft dollar arrangements), if any, the Fund Adviser and its affiliates received or were expected to receive that were directly attributable to the management of a Fund. See Section E below for additional information on indirect benefits a Fund Adviser may receive as a result of its relationship with the Funds.
Based on their review, the Independent Board Members determined that the Adviser’s and the Sub-Adviser’s levels of profitability were reasonable in light of the respective services provided.
D. Economies of Scale and Whether Fee Levels Reflect These Economies of Scale
The Independent Board Members recognized that as the assets of a particular fund or the Nuveen complex in the aggregate increase over time, economies of scale may be realized with respect to the management of the funds, and the Independent Board Members considered the extent to which these economies are shared with the funds and their shareholders. Although the Independent Board Members recognized that economies of scale are difficult to measure with precision, the Board noted that there were several acceptable means to share economies of scale, including through breakpoints in the management fee schedule reducing the fee rates as asset levels grow, fee waiver and expense limitation agreements and the Adviser’s investment in its business which can enhance the services provided to the funds. With respect to breakpoints, the Independent Board Members noted that subject to certain exceptions, the funds in the Nuveen complex, including the Funds, pay a management fee to the Adviser which is generally comprised of a fund-level component and complex-level component. The fund-level fee component declines as the assets of the particular fund grow and the complex-level fee component declines when eligible assets of all the funds in the Nuveen complex combined grow. The complex-wide fee arrangement was designed to capture economies of scale achieved when total fund complex assets increase, even if the assets of a particular fund are unchanged or decrease. The approach reflected the notion that some of Nuveen’s costs were attributable to services provided to all its funds in the complex, and therefore all funds should benefit if these costs were spread over a larger asset base.
The Independent Board Members reviewed the breakpoint and complex-wide schedules and any savings achieved from expense caps (as applicable), fund-level breakpoints and complex-wide fee reductions for the 2015 calendar year for the funds. In this regard, the Independent Board Members noted that additional economies of scale were shared with shareholders of each Fund through its temporary expense cap and/or permanent expense cap.
In addition, the Independent Board Members recognized the Adviser’s ongoing investment in its business to expand or enhance the services provided to the Nuveen funds. The Independent Board Members noted, among other things, the additions to groups who play a key role in supporting the funds including in fund administration, operations, fund governance, investment services, compliance, product management, retail distribution and technology. The Independent Board Members also recognized the investments in systems necessary to manage the funds including in areas of risk oversight, information technology and compliance.
Based on their review, the Independent Board Members concluded that the current fee structure was acceptable and reflected economies of scale to be shared with shareholders when assets under management increase.
E. Indirect Benefits
The Independent Board Members received and considered information regarding other additional benefits the respective Fund Adviser or its affiliates may receive as a result of their relationship with the Funds, including compensation paid to affiliates and research received in connection with brokerage transactions (i.e., soft dollar arrangements). In this regard, the Independent Board Members recognized that an affiliate of the Adviser served as the Funds’ principal underwriter and may receive compensation therefore from, among other things, sales charges, distribution fees and shareholder services fees (which included fees received pursuant to any 12b-1 plan). The Independent Board Members therefore took into account, among other things, the 12b-1 fees retained by Nuveen during the last calendar year.
In addition to the above, the Independent Board Members considered that the Funds’ portfolio transactions are allocated by the Sub-Adviser and the Sub-Adviser may benefit from research received through soft-dollar arrangements. The Board noted, however, that with respect to transactions in fixed income securities, such securities generally trade on a principal basis and do not generate soft dollar credits. Although the Board recognized the Sub-Adviser may benefit from a soft dollar arrangement if it does not have to pay for this research out of its own assets, the Board also recognized that any such research may benefit the Funds to the extent it enhances the ability of the Sub-Adviser to manage the Funds.
Based on their review, the Independent Board Members concluded that any indirect benefits received by a Fund Adviser as a result of its relationship with the Funds were reasonable and within acceptable parameters.
| 160 | NUVEEN |
F. Other Considerations
The Independent Board Members did not identify any single factor discussed previously as all-important or controlling. The Board Members, including the Independent Board Members, concluded that the terms of each Advisory Agreement were fair and reasonable, that the respective Fund Adviser’s fees were reasonable in light of the services provided to each Fund and that the Advisory Agreements be renewed.
| NUVEEN | 161 |
and Officers (Unaudited)
The management of the Funds, including general supervision of the duties performed for the Funds by the Adviser, is the responsibility of the Board of Trustees of the Funds. The number of directors of the Funds is set at twelve, effective July 1, 2016. None of the trustees who are not “interested” persons of the Funds (referred to herein as “independent trustees”) has ever been a director or employee of, or consultant to, Nuveen or its affiliates. The names and business addresses of the trustees and officers of the Funds, their principal occupations and other affiliations during the past five years, the number of portfolios each oversees and other directorships they hold are set forth below.
The Funds’ Statement of Additional Information (“SAI”) includes more information about the trustees. To request a free copy, call Nuveen Investments at (800) 257-8787 or visit the Funds’ website at www.nuveen.com.
| Name, Year of Birth & Address | Position(s) Held with the Funds | Year First Elected or Appointed (1) | Principal Occupation(s) Including other Directorships During Past 5 Years | Number of Portfolios in Fund Complex Overseen by Trustee | ||||
| Independent Trustee: | ||||||||
William J. Schneider 1944 333 W. Wacker Drive Chicago, IL 60606 | Chairman and Trustee | 1996 | Chairman of Miller-Valentine Partners, a real estate investment company; Board Member of Med-America Health System and WDPR Public Radio station; formerly, Senior Partner and Chief Operating Officer (retired (2004) of Miller-Valentine Group; formerly, Board member, Business Advisory Council of the Cleveland Federal Reserve Bank and University of Dayton Business School Advisory Council; past Chair and Director, Dayton Development Coalition. | 180 | ||||
Jack B. Evans 1948 333 W. Wacker Drive Chicago, IL 60606 | Trustee | 1999 | President, The Hall-Perrine Foundation, a private philanthropic corporation (since 1996); Director and Chairman, United Fire Group, a publicly held company; Director, The Gazette Company; Life Trustee of Coe College and the Iowa College Foundation; formerly, President Pro-Tem of the Board of Regents for the State of Iowa University System; formerly, Director, Alliant Energy; formerly, Director, Federal Reserve Bank of Chicago; formerly, President and Chief Operating Officer, SCI Financial Group, Inc., a regional financial services firm. | 180 | ||||
William C. Hunter 1948 333 W. Wacker Drive Chicago, IL 60606 | Trustee | 2003 | Dean Emeritus, formerly, Dean, Tippie College of Business, University of Iowa (2006-2012); Director (since 2004) of Xerox Corporation; Director (since 2005), and past President (2010-2014) Beta Gamma Sigma, Inc., The International Business Honor Society; Director of Wellmark, Inc. (since 2009); formerly, Dean and Distinguished Professor of Finance, School of Business at the University of Connecticut (2003-2006); previously, Senior Vice President and Director of Research at the Federal Reserve Bank of Chicago (1995-2003); formerly, Director (1997-2007), Credit Research Center at Georgetown University. | 180 | ||||
David J. Kundert 1942 333 W. Wacker Drive Chicago, IL 60606 | Trustee | 2005 | Formerly, Director, Northwestern Mutual Wealth Management Company (2006-2013); retired (since 2004) as Chairman, JPMorgan Fleming Asset Management, President and CEO, Banc One Investment Advisors Corporation, and President, One Group Mutual Funds; prior thereto, Executive Vice President, Banc One Corporation and Chairman and CEO, Banc One Investment Management Group; Regent Emeritus, Member of Investment Committee, Luther College; member of the Wisconsin Bar Association; member of Board of Directors and Chair of Investment Committee, Greater Milwaukee Foundation; member of the Board of Directors (Milwaukee), College Possible; Board member of Milwaukee Repertory Theatre (since 2016). | 180 | ||||
| 162 | NUVEEN |
| Name, Year of Birth & Address | Position(s) Held with the Funds | Year First Elected or Appointed (1) | Principal Occupation(s) Including other Directorships During Past 5 Years | Number of Portfolios in Fund Complex Overseen by Trustee | ||||
Albin F. Moschner(2) 1952 333 W. Wacker Drive Chicago, IL 60606 | Trustee | 2016 | Founder and Chief Executive Officer, Northcroft Partners, LLC, a management consulting firm (since 2012); previously, held positions at Leap Wireless International, Inc., including Consultant (2011-2012), Chief Operating Officer (2008-2011), and Chief Marketing Officer (2004-2008); formerly, President, Verizon Card Services division of Verizon Communications, Inc. (2000-2003); formerly, President, One Point Services at One Point Communications (1999-2000); formerly, Vice Chairman of the Board, Diba, Incorporated (1996-1997); formerly, various executive positions with Zenith Electronics Corporation (1991-1996). Director, USA Technologies, Inc., a provider of solutions and services to facilitate electronic payment transactions (since 2012); formerly, Director, Wintrust Financial Corporation (1996-2016). | 180 | ||||
John K. Nelson 1962 333 West Wacker Drive Chicago, IL 60606 | Trustee | 2013 | Member of Board of Directors of Core12 LLC (since 2008), a private firm which develops branding, marketing and communications strategies for clients; Director of The Curran Center for Catholic American Studies (since 2009) and The President’s Council, Fordham University (since 2010); formerly senior external advisor to the financial services practice of Deloitte Consulting LLP (2012-2014); formerly, Chairman of the Board of Trustees of Marian University (2010 as trustee, 2011-2014 as Chairman); formerly, Chief Executive Officer of ABN AMRO N.V. North America, and Global Head of its Financial Markets Division (2007-2008); prior senior positions held at ABN AMRO include Corporate Executive Vice President and Head of Global Markets—the Americas (2006-2007), CEO of Wholesale Banking—North America and Global Head of Foreign Exchange and Futures Markets (2001-2006), and Regional Commercial Treasurer and Senior Vice President Trading—North America (1996-2001); formerly, Trustee at St. Edmund Preparatory School in New York City. | 180 | ||||
Judith M. Stockdale 1947 333 W. Wacker Drive Chicago, IL 60606 | Trustee | 1997 | Board Member, Land Trust Alliance (since 2013) and U.S. Endowment for Forestry and Communities (since 2013); formerly, Executive Director (1994-2012), Gaylord and Dorothy Donnelley Foundation; prior thereto, Executive Director, Great Lakes Protection Fund (1990-1994). | 180 | ||||
Carole E. Stone 1947 333 W. Wacker Drive Chicago, IL 60606 | Trustee | 2007 | Director, Chicago Board Options Exchange (since 2006), C2 Options Exchange, Incorporated (since 2009); Director, CBOE Holdings, Inc. (since 2010); formerly, Commissioner, New York State Commission on Public Authority Reform (2005-2010). | 180 | ||||
Terence J. Toth 1959 333 W. Wacker Drive Chicago, IL 60606 | Trustee | 2008 | Managing Partner, Promus Capital (since 2008); Director, Fulcrum IT Service LLC (since 2010) and Quality Control Corporation (since 2012); member: Catalyst Schools of Chicago Board (since 2008) and Mather Foundation Board (since 2012), and chair of its investment committee; formerly, Director, Legal & General Investment Management America, Inc. (2008-2013); formerly, CEO and President, Northern Trust Global Investments (2004-2007); Executive Vice President, Quantitative Management & Securities Lending (2000-2004); prior thereto, various positions with Northern Trust Company (since 1994); formerly, Member, Northern Trust Mutual Funds Board (2005-2007), Northern Trust Global Investments Board (2004-2007), Northern Trust Japan Board (2004-2007), Northern Trust Securities Inc. Board (2003-2007) and Northern Trust Hong Kong Board (1997-2004). | 180 |
| NUVEEN | 163 |
Trustees and Officers (Unaudited) (continued)
| Name, Year of Birth & Address | Position(s) Held with the Funds | Year First Elected or Appointed (1) | Principal Occupation(s) Including other Directorships During Past 5 Years | Number of Portfolios in Fund Complex Overseen by Trustee | ||||
Margaret L. Wolff 1955 333 W. Wacker Drive Chicago, IL 60606 | Trustee | 2016 | Member of the Board of Directors (since 2013) of Travelers Insurance Company of Canada and The Dominion of Canada General Insurance Company (each, a part of Travelers Canada, the Canadian operation of The Travelers Companies, Inc.); formerly, Of Counsel, Skadden, Arps, Slate, Meagher & Flom LLP (Mergers & Acquisitions Group) (2005-2014); Member of the Board of Trustees of New York-Presbyterian Hospital (since 2005); Member (since 2004) and Chair (since 2015) of the Board of Trustees of The John A. Hartford Foundation (a philanthropy dedicated to improving the care of older adults); formerly, Member (2005-2015) and Vice Chair (2011-2015) of the Board of Trustees of Mt. Holyoke College. | 180 | ||||
| Interested Trustee: | ||||||||
William Adams IV(3) 1955 333 W. Wacker Drive Chicago, IL 60606 | Trustee | 2013 | Co-Chief Executive Officer and Co-President (since March 2016), formerly, Senior Executive Vice President, Global Structured Products (2010-2016), prior thereto, Executive Vice President, U.S. Structured Products (1999-2010) of Nuveen Investments, Inc.; Co-President of Nuveen Fund Advisors, LLC (since 2011); Co-Chief Executive Officer (since 2016), formerly, Senior Executive Vice President of Nuveen Securities, LLC; President (since 2011), of Nuveen Commodities Asset Management, LLC; Board Member of the Chicago Symphony Orchestra and of Gilda’s Club Chicago. | 180 | ||||
Margo L. Cook(2)(3) 1964 333 W. Wacker Drive Chicago, IL 60606 | Trustee | 2016 | Co-Chief Executive Officer and Co-President (since March 2016), formerly, Senior Executive Vice President of Nuveen Investments, Inc; Co-Chief Executive Officer (since 2015), previously, Executive Vice President (2013-2015) of Nuveen Securities, LLC; Co-President (since October 2016), formerly, Senior Executive Vice President (2015-2016) of Nuveen Fund Advisors, LLC (Executive Vice President 2011-2015); formerly, Managing Director of Nuveen Commodities Asset Management, LLC (2011- 2016); Chartered Financial Analyst. | 180 | ||||
| Name, Year of Birth & Address | Position(s) Held with the Funds | Year First Elected or Appointed (4) | Principal Occupation(s) During Past 5 Years | Number of Portfolios in Fund Complex Overseen by Officer | ||||
| Officers of the Funds: | ||||||||
Greg A. Bottjer 1971 333 West Wacker Drive Chicago, IL 60606 | Chief Administrative Officer | 2016 | Managing Director (since 2011), formerly, Senior Vice President (2007-2010) of Nuveen Investments Holdings, Inc.; Managing Director (since October 2016) of Nuveen Fund Advisors, LLC; Chartered Financial Analyst. | 103 | ||||
Lorna C. Ferguson 1945 333 W. Wacker Drive Chicago, IL 60606 | Vice President | 1998 | Managing Director (since 2005) of Nuveen Fund Advisors, LLC and Nuveen Securities, LLC (since 2004). | 181 | ||||
Stephen D. Foy 1954 333 W. Wacker Drive Chicago, IL 60606 | Vice President and Controller | 1998 | Managing Director (since 2014), formerly, Senior Vice President (2013-2014) and Vice President (2005-2013) of Nuveen Fund Advisors, LLC; Chief Financial Officer of Nuveen Commodities Asset Management, LLC (since 2010); Managing Director (since 2016) of Nuveen Securities, LLC; Certified Public Accountant. | 181 | ||||
| 164 | NUVEEN |
| Name, Year of Birth & Address | Position(s) Held with the Funds | Year First Elected or Appointed (4) | Principal Occupation(s) During Past 5 Years | Number of Portfolios in Fund Complex Overseen by Officer | ||||
Nathaniel T. Jones 1979 333 W. Wacker Drive Chicago, IL 60606 | Vice President and Treasurer | 2016 | Senior Vice President (since 2016), formerly, Vice President (2011- 2016) of Nuveen Investments Holdings, Inc.; Chartered Financial Analyst. | 181 | ||||
Walter M. Kelly 1970 333 W. Wacker Drive Chicago, IL 60606 | Chief Compliance Officer and Vice President | 2003 | Senior Vice President (since 2008) of Nuveen Investments Holdings, Inc. | 181 | ||||
Tina M. Lazar 1961 333 W. Wacker Drive Chicago, IL 60606 | Vice President | 2002 | Senior Vice President of Nuveen Investments Holdings, Inc. and Nuveen Securities, LLC | 181 | ||||
Kevin J. McCarthy 1966 333 W. Wacker Drive Chicago, IL 60606 | Vice President and Assistant Secretary | 2007 | Executive Vice President, Secretary and General Counsel (since March 2016), formerly, Managing Director and Assistant Secretary of Nuveen Investments, Inc.; Executive Vice President (since March 2016), formerly, Managing Director, and Assistant Secretary (since 2008) of Nuveen Securities, LLC; Executive Vice President and Secretary (since March 2016), formerly, Managing Director (2008-2016) and Assistant Secretary (2007-2016), and Co-General Counsel (since 2011) of Nuveen Fund Advisors, LLC; Executive Vice President and Secretary (since March 2016), formerly, Managing Director, Assistant Secretary (2011-2016), and Associate General Counsel (since 2011) of Nuveen Asset Management, LLC; Executive Vice President and Secretary of Nuveen Investments Advisers, LLC; Vice President (since 2007) and Secretary (since March 2016) of NWQ Investment Management Company, LLC, Symphony Asset Management LLC, Santa Barbara Asset Management, LLC, Winslow Capital Management, LLC (since 2010) and Tradewinds Global Investors, LLC (since 2016); Vice President (since 2010) and Secretary (since 2016), formerly, Assistant Secretary of Nuveen Commodities Asset Management, LLC. | 181 | ||||
Kathleen L. Prudhomme 1953 901 Marquette Avenue Minneapolis, MN 55402 | Vice President and Secretary | 2011 | Managing Director, Assistant Secretary and Co-General Counsel (since 2011) of Nuveen Fund Advisors, LLC; Managing Director, Assistant Secretary and Associate General Counsel (since 2011) of Nuveen Asset Management, LLC; Managing Director and Assistant Secretary (since 2011) of Nuveen Securities, LLC; formerly, Deputy General Counsel, FAF Advisors, Inc. (2004-2010). | 181 | ||||
Christopher M. Rohrbacher 1971 333 West Wacker Drive Chicago, IL 60606 | Vice President and Assistant Secretary | 2008 | Senior Vice President (since 2011) formerly, Vice President (2008-2011) and Assistant General Counsel (since 2008) of Nuveen Investments Holdings, Inc.; Senior Vice President and Assistant Secretary (since October 2016) of Nuveen Fund Advisors, LLC; Vice President and Assistant Secretary (since 2010) of Nuveen Commodities Asset Management, LLC. | 181 | ||||
Joel T. Slager 1978 333 West Wacker Drive Chicago, IL 60606 | Vice President and Assistant Secretary | 2013 | Fund Tax Director for Nuveen Funds (since 2013); previously, Vice President of Morgan Stanley Investment Management, Inc., Assistant Treasurer of the Morgan Stanley Funds (from 2010 to 2013). | 181 | ||||
Jeffery M. Wilson 1956 333 West Wacker Drive Chicago, IL 60606 | Vice President | 2011 | Senior Vice President of Nuveen Investments Holdings, Inc. (since 2011); formerly Senior Vice President of Nuveen Securities, LLC (since 2011); formerly, Senior Vice President of FAF Advisors, Inc. (2000-2010). | 103 |
| NUVEEN | 165 |
Trustees and Officers (Unaudited) (continued)
| Name, Year of Birth & Address | Position(s) Held with the Funds | Year First Elected or Appointed (4) | Principal Occupation(s) During Past 5 Years | Number of Portfolios in Fund Complex Overseen by Officer | ||||
Gifford R. Zimmerman 1956 333 W. Wacker Drive Chicago, IL 60606 | Vice President and Assistant Secretary | 1988 | Managing Director (since 2002), and Assistant Secretary of Nuveen Securities, LLC; Managing Director (since 2004) and Assistant Secretary (since 1994) of Nuveen Investments, Inc.; Managing Director (since 2002), Assistant Secretary (since 1997) and Co-General Counsel (since 2011) of Nuveen Fund Advisors, LLC; Managing Director, Assistant Secretary and Associate General Counsel of Nuveen Asset Management, LLC (since 2011); Managing Director and Assistant Secretary of Nuveen Investments Advisers Inc. (since 2002), and Symphony Asset Management LLC (since 2003); Vice President and Assistant Secretary of NWQ Investment Management Company, LLC (since 2002), Santa Barbara Asset Management, LLC (since 2006) and of Winslow Capital Management, LLC, (since 2010); Vice President and Assistant Secretary (since 2013), formerly, Chief Administrative Officer and Chief Compliance Officer (2006-2013) of Nuveen Commodities Asset Management, LLC; Chartered Financial Analyst. | 181 |
| (1) | Trustees serve an indefinite term until his/her successor is elected or appointed. The year first elected or appointed represents the year in which the director was first elected or appointed to any fund in the Nuveen Fund Complex. |
| (2) | On June 22, 2016, Ms. Cook and Mr. Moschner were appointed as Board Members, effective July 1, 2016. |
| (3) | “Interested persons” of the Trust, as defined in the 1940 Act, by reason of their positions with Nuveen and certain of its subsidiaries. |
| (4) | Officers serve one year terms through August of each year. The year first elected or appointed represents the year in which the officer was first elected or appointed to any fund in the Nuveen Fund Complex. |
| 166 | NUVEEN |
Notes
| NUVEEN | 167 |
| ||||||||||||||
| ||||||||||||||
| Nuveen: | ||||||||||||||
| Serving Investors for Generations | ||||||||||||||
| ||||||||||||||
| Since 1898, financial advisors and their clients have relied on Nuveen to provide dependable investment solutions through continued adherence to proven, long-term investing principles. Today, we offer a range of high quality equity and fixed-income solutions designed to be integral components of a well-diversified core portfolio. | ||||||||||||||
| ||||||||||||||
Focused on meeting investor needs.
Nuveen helps secure the long-term goals of individual investors and the advisors who serve them. As an operating division of TIAA Global Asset Management, Nuveen provides access to investment expertise from leading asset managers and solutions across traditional and alternative asset classes. Built on more than a century of industry leadership, Nuveen’s teams of experts align with clients’ specific financial needs and goals, demonstrating commitment to advisors and investors through market perspectives and wealth management and portfolio advisory services. Nuveen manages $244 billion in assets as of September 30, 2016. | ||||||||||||||
| ||||||||||||||
Find out how we can help you. To learn more about how the products and services of Nuveen may be able to help you meet your financial goals, talk to your financial advisor, or call us at (800) 257-8787. Please read the information provided carefully before you invest. Investors should consider the investment objective and policies, risk considerations, charges and expenses of any investment carefully. Where applicable, be sure to obtain a prospectus, which contains this and other relevant information. To obtain a prospectus, please contact your securities representative or Nuveen, 333 W. Wacker Dr., Chicago, IL 60606. Please read the prospectus carefully before you invest or send money.
Learn more about Nuveen Funds at: www.nuveen.com/mf | ||||||||||||||
| ||||||||||||||
| Distributed by Nuveen Securities, LLC | 333 West Wacker Drive Chicago, IL 60606 | www.nuveen.com/mf | ||||||||||||||
MAN-NLCES-0816D 19876-INV-Y-10/17
ITEM 2. CODE OF ETHICS.
As of the end of the period covered by this report, the registrant has adopted a code of ethics that applies to the registrant’s principal executive officer, principal financial officer, principal accounting officer or controller, or persons performing similar functions. There were no amendments to or waivers from the code during the period covered by this report. The registrant has posted the code of ethics on its website at www.nuveen.com/MutualFunds/ShareholderResources/FundGovernance.aspx. (To view the code, click on Code of Conduct.)
ITEM 3. AUDIT COMMITTEE FINANCIAL EXPERT.
The registrant’s Board of Directors or Trustees (“Board”) determined that the registrant has at least one “audit committee financial expert” (as defined in Item 3 of Form N-CSR) serving on its Audit Committee. The registrant’s audit committee financial experts are Carole E. Stone and Jack B. Evans, who are “independent” for purposes of Item 3 of Form N-CSR.
Ms. Stone served for five years as Director of the New York State Division of the Budget. As part of her role as Director, Ms. Stone was actively involved in overseeing the development of the State’s operating, local assistance and capital budgets, its financial plan and related documents; overseeing the development of the State’s bond-related disclosure documents and certifying that they fairly presented the State’s financial position; reviewing audits of various State and local agencies and programs; and coordinating the State’s system of internal audit and control. Prior to serving as Director, Ms. Stone worked as a budget analyst/examiner with increasing levels of responsibility over a 30 year period, including approximately five years as Deputy Budget Director. Ms. Stone has also served as Chair of the New York State Racing Association Oversight Board, as Chair of the Public Authorities Control Board, as a Commissioner on the New York State Commission on Public Authority Reform and as a member of the Boards of Directors of several New York State public authorities. These positions have involved overseeing operations and finances of certain entities and assessing the adequacy of project/entity financing and financial reporting. Currently, Ms. Stone is on the Board of Directors of CBOE Holdings, Inc., of the Chicago Board Options Exchange, and of C2 Options Exchange. Ms. Stone’s position on the boards of these entities and as a member of both CBOE Holdings’ Audit Committee and its Finance Committee has involved, among other things, the oversight of audits, audit plans and preparation of financial statements.
Mr. Evans was formerly President and Chief Operating Officer of SCI Financial Group, Inc., a full service registered broker-dealer and registered investment adviser (“SCI”). As part of his role as President and Chief Operating Officer, Mr. Evans actively supervised the Chief Financial Officer (the “CFO”) and actively supervised the CFO’s preparation of financial statements and other filings with various regulatory authorities. In such capacity, Mr. Evans was actively involved in the preparation of SCI’s financial statements and the resolution of issues raised in connection therewith. Mr. Evans has also served on the audit committee of various reporting companies. At such companies, Mr. Evans was involved in the oversight of audits, audit plans, and the preparation of financial statements. Mr. Evans also formerly chaired the audit committee of the Federal Reserve Bank of Chicago.
ITEM 4. PRINCIPAL ACCOUNTANT FEES AND SERVICES.
The following tables show the amount of fees that KPMG LLP, the Funds’ auditor, billed to the Funds’ during the Funds’ last two full fiscal years. The Audit Committee approved in advance all audit services and non-audit services that KPMG LLP provided to the Funds, except for those non-audit services that were subject to the pre-approval exception under Rule 2-01 of Regulation S-X (the “pre-approval exception”). The preapproval exception for services provided directly to the Funds waives the pre-approval requirement for services other than audit, review or attest services if: (A) the aggregate amount of all such services provided constitutes no more than 5% of the total amount of revenues paid by the Funds during the fiscal year in which the services are provided; (B) the Funds did not recognize the services as non-audit services at the time of the engagement; and (C) the services are promptly brought to the Audit Committee’s attention, and the Committee (or its delegate) approves the services before the audit is completed.
The Audit Committee has delegated certain pre-approval responsibilities to its Chairman (or, in his absence, any other member of the Audit Committee).
Fiscal Year Ended August 31, 2016 | Audit Fees Billed to Funds 1 | Audit-Related Fees Billed to Funds 2 | Tax Fees Billed to Funds 3 | All Other Fees Billed to Funds 4 | ||||||||||||
Fund Name | ||||||||||||||||
Nuveen Concentrated Core Fund | 16,025 | 0 | 0 | 0 | ||||||||||||
Nuveen Core Dividend Fund | 16,025 | 0 | 0 | 0 | ||||||||||||
Nuveen Equity Market Neutral Fund | 16,025 | 0 | 0 | 0 | ||||||||||||
Nuveen Large Cap Value Fund | 16,025 | 0 | 0 | 0 | ||||||||||||
Nuveen Large Cap Core Fund | 16,025 | 0 | 0 | 0 | ||||||||||||
Nuveen Large Cap Growth Fund | 16,025 | 0 | 0 | 0 | ||||||||||||
Nuveen Large Cap Core Plus Fund | 16,025 | 0 | 0 | 0 | ||||||||||||
|
|
|
|
|
|
|
| |||||||||
Total | $ | 112,175 | $ | 0 | $ | 0 | $ | 0 | ||||||||
| 1 | “Audit Fees” are the aggregate fees billed for professional services for the audit of the Fund’s annual financial statements and services provided in connection with statutory and regulatory filings or engagements. |
| 2 | “Audit-Related Fees” are the aggregate fees billed for assurance and related services reasonably related to the performance of the audit or review of financial statements that are not reported under “Audit Fees”. These fees include offerings related to the Fund’s common shares and leverage. |
| 3 | “Tax Fees” are the aggregate fees billed for professional services for tax advice, tax compliance, and tax planning. These fees include: all global withholding tax services; excise and state tax reviews; capital gain, tax equalization and taxable basis calculations performed by the principal accountant. |
| 4 | “All Other Fees” are the aggregate fees billed for products and services other than “Audit Fees”, “Audit-Related Fees” and “Tax Fees”. These fees represent all “Agreed-Upon Procedures” engagements pertaining to the Fund’s use of leverage. |
| Percentage Approved Pursuant to Pre-approval Exception | ||||||||||||||||
| Audit Fees Billed to Funds | Audit-Related Fees Billed to Funds | Tax Fees Billed to Funds | All Other Fees Billed to Funds | |||||||||||||
Fund Name | ||||||||||||||||
Nuveen Concentrated Core Fund | 0 | % | 0 | % | 0 | % | 0 | % | ||||||||
Nuveen Core Dividend Fund | 0 | % | 0 | % | 0 | % | 0 | % | ||||||||
Nuveen Equity Market Neutral Fund | 0 | % | 0 | % | 0 | % | 0 | % | ||||||||
Nuveen Large Cap Value Fund | 0 | % | 0 | % | 0 | % | 0 | % | ||||||||
Nuveen Large Cap Core Fund | 0 | % | 0 | % | 0 | % | 0 | % | ||||||||
Nuveen Large Cap Growth Fund | 0 | % | 0 | % | 0 | % | 0 | % | ||||||||
Nuveen Large Cap Core Plus Fund | 0 | % | 0 | % | 0 | % | 0 | % | ||||||||
August 31, 2015 | Audit Fees Billed to Funds 1 | Audit-Related Fees Billed to Funds 2 | Tax Fees Billed to Funds 3 | All Other Fees Billed to Funds 4 | ||||||||||||
Fund Name | ||||||||||||||||
Nuveen Concentrated Core Fund | 15,500 | 0 | 0 | 0 | ||||||||||||
Nuveen Core Dividend Fund | 15,500 | 0 | 0 | 0 | ||||||||||||
Nuveen Equity Market Neutral Fund | 15,500 | 0 | 0 | 0 | ||||||||||||
Nuveen Large Cap Value Fund | 15,500 | 0 | 0 | 0 | ||||||||||||
Nuveen Large Cap Core Fund | 15,500 | 0 | 0 | 0 | ||||||||||||
Nuveen Large Cap Growth Fund | 15,500 | 0 | 0 | 0 | ||||||||||||
Nuveen Large Cap Core Plus Fund | 15,500 | 0 | 0 | 0 | ||||||||||||
|
|
|
|
|
|
|
| |||||||||
Total | $ | 108,500 | $ | 0 | $ | 0 | $ | 0 | ||||||||
| 1 | “Audit Fees” are the aggregate fees billed for professional services for the audit of the Fund’s annual financial statements and services provided in connection with statutory and regulatory filings or engagements. |
| 2 | “Audit-Related Fees” are the aggregate fees billed for assurance and related services reasonably related to the performance of the audit or review of financial statements that are not reported under “Audit Fees”. These fees include offerings related to the Fund’s common shares and leverage. |
| 3 | “Tax Fees” are the aggregate fees billed for professional services for tax advice, tax compliance, and tax planning. These fees include: all global withholding tax services; excise and state tax reviews; capital gain, tax equalization and taxable basis calculations performed by the principal accountant. |
| 4 | “All Other Fees” are the aggregate fees billed for products and services other than “Audit Fees”, “Audit-Related Fees” and “Tax Fees”. These fees represent all “Agreed-Upon Procedures” engagements pertaining to the Fund’s use of leverage. |
| Percentage Approved Pursuant to Pre-approval Exception | ||||||||||||||||
| Audit Fees Billed to Funds | Audit-Related Fees Billed to Funds | Tax Fees Billed to Funds | All Other Fees Billed to Funds | |||||||||||||
Fund Name | ||||||||||||||||
Nuveen Concentrated Core Fund | 0 | % | 0 | % | 0 | % | 0 | % | ||||||||
Nuveen Core Dividend Fund | 0 | % | 0 | % | 0 | % | 0 | % | ||||||||
Nuveen Equity Market Neutral Fund | 0 | % | 0 | % | 0 | % | 0 | % | ||||||||
Nuveen Large Cap Value Fund | 0 | % | 0 | % | 0 | % | 0 | % | ||||||||
Nuveen Large Cap Core Fund | 0 | % | 0 | % | 0 | % | 0 | % | ||||||||
Nuveen Large Cap Growth Fund | 0 | % | 0 | % | 0 | % | 0 | % | ||||||||
Nuveen Large Cap Core Plus Fund | 0 | % | 0 | % | 0 | % | 0 | % | ||||||||
Fiscal Year Ended August 31, 2016 | Audit-Related Fees Billed to Adviser and Affiliated Fund Service Providers | Tax Fees Billed to Adviser and Affiliated Fund Service Providers | All Other Fees Billed to Adviser and Affiliated Fund Service Providers | |||||||||
Nuveen Investment Trust | $ | 0 | $ | 0 | $ | 0 | ||||||
| Percentage Approved Pursuant to Pre-approval Exception | ||||||||||||
| Audit-Related Fees Billed to Adviser and Affiliated Fund Service Providers | Tax Fees Billed to Adviser and Affiliated Fund Service Providers | All Other Fees Billed to Adviser and Affiliated Fund Service Providers | ||||||||||
| 0 | % | 0 | % | 0 | % | |||||||
Fiscal Year Ended August 31, 2015 | Audit-Related Fees Billed to Adviser and Affiliated Fund Service Providers | Tax Fees Billed to Adviser and Affiliated Fund Service Providers | All Other Fees Billed to Adviser and Affiliated Fund Service Providers | |||||||||
Nuveen Investment Trust | $ | 0 | $ | 0 | $ | 0 | ||||||
| Percentage Approved Pursuant to Pre-approval Exception | ||||||||||||
| Audit-Related Fees Billed to Adviser and Affiliated Fund Service Providers | Tax Fees Billed to Adviser and Affiliated Fund Service Providers | All Other Fees Billed to Adviser and Affiliated Fund Service Providers | ||||||||||
| 0 | % | 0 | % | 0 | % | |||||||
Fiscal Year Ended August 31, 2016 | Total Non-Audit Fees Billed to Trust | Total Non-Audit Fees billed to Adviser and Affiliated Fund Service Providers (engagements related directly to the operations and financial reporting of the Trust) | Total Non-Audit Fees billed to Adviser and Affiliated Fund Service Providers (all other engagements) | Total | ||||||||||||
Fund Name | ||||||||||||||||
Nuveen Concentrated Core Fund | 0 | 0 | 0 | 0 | ||||||||||||
Nuveen Core Dividend Fund | 0 | 0 | 0 | 0 | ||||||||||||
Nuveen Equity Market Neutral Fund | 0 | 0 | 0 | 0 | ||||||||||||
Nuveen Large Cap Value Fund | 0 | 0 | 0 | 0 | ||||||||||||
Nuveen Large Cap Core Fund | 0 | 0 | 0 | 0 | ||||||||||||
Nuveen Large Cap Growth Fund | 0 | 0 | 0 | 0 | ||||||||||||
Nuveen Large Cap Core Plus Fund | 0 | 0 | 0 | 0 | ||||||||||||
|
|
|
|
|
|
|
| |||||||||
Total | $ | 0 | $ | 0 | $ | 0 | $ | 0 | ||||||||
“Non-Audit Fees billed to Fund” for both fiscal year ends represent “Tax Fees” and “All Other Fees” billed to Fund in their respective amounts from the previous table.
Less than 50 percent of the hours expended on the principal accountant’s engagement to audit the registrant’s financial statements for the most recent fiscal year were attributed to work performed by persons other than the principal accountant’s full-time, permanent employees.
Fiscal Year Ended August 31, 2015 | Total Non-Audit Fees Billed to Trust | Total Non-Audit Fees billed to Adviser and Affiliated Fund Service Providers (engagements related directly to the operations and financial reporting of the Trust) | Total Non-Audit Fees billed to Adviser and Affiliated Fund Service Providers (all other engagements) | Total | ||||||||||||
Fund Name | ||||||||||||||||
Nuveen Concentrated Core Fund | 0 | 0 | 0 | 0 | ||||||||||||
Nuveen Core Dividend Fund | 0 | 0 | �� | 0 | 0 | |||||||||||
Nuveen Equity Market Neutral Fund | 0 | 0 | 0 | 0 | ||||||||||||
Nuveen Large Cap Value Fund | 0 | 0 | 0 | 0 | ||||||||||||
Nuveen Large Cap Core Fund | 0 | 0 | 0 | 0 | ||||||||||||
Nuveen Large Cap Growth Fund | 0 | 0 | 0 | 0 | ||||||||||||
Nuveen Large Cap Core Plus Fund | 0 | 0 | 0 | 0 | ||||||||||||
|
|
|
|
|
|
|
| |||||||||
Total | $ | 0 | $ | 0 | $ | 0 | $ | 0 | ||||||||
“Non-Audit Fees billed to Fund” for both fiscal year ends represent “Tax Fees” and “All Other Fees” billed to Fund in their respective amounts from the previous table.
Audit Committee Pre-Approval Policies and Procedures. Generally, the Audit Committee must approve (i) all non-audit services to be performed for the Funds by the Funds’ independent accountant and (ii) all audit and non-audit services to be performed by the Funds’ independent accountant for the Affiliated Fund Service Providers with respect to the operations and financial reporting of the Funds. Regarding tax and research projects conducted by the independent accountant for the Funds and Affiliated Fund Service Providers (with respect to operations and financial reports of the Trust), such engagements will be (i) pre-approved by the Audit Committee if they are expected to be for amounts greater than $10,000; (ii) reported to the Audit Committee Chairman for his verbal approval prior to engagement if they are expected to be for amounts under $10,000 but greater than $5,000; and (iii) reported to the Audit Committee at the next Audit Committee meeting if they are expected to be for an amount under $5,000.
ITEM 5. AUDIT COMMITTEE OF LISTED REGISTRANTS.
Not applicable to this registrant.
ITEM 6. SCHEDULE OF INVESTMENTS.
| a) | See Portfolio of Investments in Item 1. |
| b) | Not applicable. |
ITEM 7. DISCLOSURE OF PROXY VOTING POLICIES AND PROCEDURES FOR CLOSED-END
MANAGEMENT INVESTMENT COMPANIES.
Not applicable to this registrant.
ITEM 8. PORTFOLIO MANAGERS OF CLOSED-END MANAGEMENT INVESTMENT COMPANIES.
Not applicable to this registrant.
ITEM 9. PURCHASES OF EQUITY SECURITIES BY CLOSED-END MANAGEMENT INVESTMENT COMPANY AND AFFILIATED PURCHASERS.
Not applicable to this registrant.
ITEM 10. SUBMISSION OF MATTERS TO A VOTE OF SECURITY HOLDERS.
There have been no material changes to the procedures by which shareholders may recommend nominees to the registrant’s Board of Trustees implemented after the registrant last provided disclosure in response to this Item.
ITEM 11. CONTROLS AND PROCEDURES.
| (a) | The registrant’s principal executive and principal financial officers, or persons performing similar functions, have concluded that the registrant’s disclosure controls and procedures (as defined in Rule 30a-3(c) under the Investment Company Act of 1940, as amended (the “1940 Act”) (17 CFR 270.30a-3(c))) are effective, as of a date within 90 days of the filing date of this report that includes the disclosure required by this paragraph, based on their evaluation of the controls and procedures required by Rule 30a-3(b) under the 1940 Act (17 CFR 270.30a-3(b)) and Rules 13a-15(b) or 15d-15(b) under the Securities Exchange Act of 1934, as amended (the “Exchange Act”) (17 CFR 240.13a-15(b) or 240.15d-15(b)). |
| (b) | There were no changes in the registrant’s internal control over financial reporting (as defined in Rule 30a-3(d) under the 1940 Act (17 CFR 270.30a-3(d)) that occurred during the second fiscal quarter of the period covered by this report that has materially affected, or is reasonably likely to materially affect, the registrant’s internal control over financial reporting. |
ITEM 12. EXHIBITS.
File the exhibits listed below as part of this Form.
| (a)(1) | Any code of ethics, or amendment thereto, that is the subject of the disclosure required by Item 2, to the extent that the registrant intends to satisfy the Item 2 requirements through filing of an exhibit: Not applicable because the code is posted on registrant’s website at www.nuveen.com/MutualFunds/ShareholderResources/FundGovernance.aspx and there were no amendments during the period covered by this report. (To view the code, click on Code of Conduct.) | |
| (a)(2) | A separate certification for each principal executive officer and principal financial officer of the registrant as required by Rule 30a-2(a) under the 1940 Act (17 CFR 270.30a-2(a)) in the exact form set forth below: See EX-99.CERT attached hereto. | |
| (a)(3) | Any written solicitation to purchase securities under Rule 23c-1 under the 1940 Act (17 CFR 270.23c-1) sent or given during the period covered by the report by or on behalf of the registrant to 10 or more persons: Not applicable to this registrant. | |
| (b) | If the report is filed under Section 13(a) or 15(d) of the Exchange Act, provide the certifications required by Rule 30a-2(b) under the 1940 Act (17 CFR 270.30a-2(b)), Rule 13a-14(b) or Rule 15d-14(b) under the Exchange Act (17 CFR 240.13a-14(b) or 240.15d-14(b)), and Section 1350 of Chapter 63 of Title 18 of the United States Code (18 U.S.C. 1350) as an Exhibit. A certification furnished pursuant to this paragraph will not be deemed “filed” for purposes of Section 18 of the Exchange Act (15 U.S.C. 78r), or otherwise subject to the liability of that section. Such certification will not be deemed to be incorporated by reference into any filing under the Securities Act of 1933 or the Exchange Act, except to the extent that the registration specifically incorporates it by reference: See EX-99.906 CERT attached hereto. | |
SIGNATURES
Pursuant to the requirements of the Securities Exchange Act of 1934 and the Investment Company Act of 1940, the registrant has duly caused this report to be signed on its behalf by the undersigned, thereunto duly authorized.
(Registrant) Nuveen Investment Trust
| By (Signature and Title) | /s/ Kathleen L. Prudhomme | |
Kathleen L. Prudhomme | ||
| Vice President and Secretary | ||
Date: November 4, 2016
Pursuant to the requirements of the Securities Exchange Act of 1934 and the Investment Company Act of 1940, this report has been signed below by the following persons on behalf of the registrant and in the capacities and on the dates indicated.
| By (Signature and Title) | /s/ Greg A. Bottjer | |
Greg A. Bottjer | ||
| Chief Administrative Officer | ||
| (principal executive officer) | ||
Date: November 4, 2016
| By (Signature and Title) | /s/ Stephen D. Foy | |
| Stephen D. Foy | ||
| Vice President and Controller | ||
| (principal financial officer) | ||
Date: November 4, 2016