Table of Contents
SECURITIES AND EXCHANGE COMMISSION
Washington, D.C. 20549
FORM 6-K
Report of Foreign Issuer
Pursuant to Rule 13a-16 or 15d-16
of the Securities Exchange Act of 1934
For the month of October, 2005
Commission File Number: 001-14404
Telefónica del Perú S.A.A.
(Translation of registrant’s name into English)
Avenida Arequipa 1155
Santa Beatriz, Lima, Perú
(Address of principal executive offices)
Indicate by check mark whether the registrant files or will file annual reports under cover of Form 20-F or Form 40-F:
Form 20-F x Form 40-F ¨
Indicate by check mark if the registrant is submitting the Form 6-K in paper as permitted by Regulation S-T Rule 101(b)(1):
Yes ¨ No x
Indicate by check mark if the registrant is submitting the Form 6-K in paper as permitted by Regulation S-T Rule 101(b)(7):
Yes ¨ No x
Indicate by check mark whether by furnishing the information contained in this Form, the Registrant is also thereby furnishing the information to the Commission pursuant to Rule 12g3-2(b) under the Securities Exchange Act of 1934:
Yes ¨ No x
If “Yes” is marked, indicate below the file number assigned to the registrant in connection with Rule 12g3-2(b): N/A
Table of Contents
Telefónica del Perú
Table of Contents
Lima, October 19, 2005
PUBLIC REGISTRY OF THE STOCK MARKET
NATIONAL SUPERVISORY COMMISSION
ON COMPANIES AND SECURITIES (CONASEV)
Re: Key Events
Dear Sirs,
According to the Peruvian Capital Markets Law and CONASEV Resolution No. 107-2002-EF/94.10 related to Key Events, Private Information and Other Communications, we hereby inform you that yesterday, the Board of Directors of Telefónica del Perú S.A.A. approved the consolidated and non-consolidated financial statements of the third quarter of the year 2005, which will be duly registered through the system MVNet, and ordered its registration with the Comisión Nacional Supervisora de Empresas y Valores – CONASEV, the Lima Stock Exchange and other stock market institutions. Find enclosed the management report in connection with the financial statements above mentioned.
| Sincerely, |
Julia María Morales Valentín Representative to the Stock Exchange Telefónica del Perú S.A.A. |
Table of Contents

Quarterly Results
Telefónica del Perú S.A.A. and subsidiaries
July – September 2005
1
Table of Contents
Significant Events
A summary containing the most significant events since July 2005 is presented below:
| 1. | Approval of financial results |
On session held on July 20th, 2005, the Board of Directors approved the individual and consolidated financial statements of the Company corresponding to the second quarter of 2005 and decided for their filing with the Comisión Nacional Supervisora de Empresas y Valores, the Lima Stock Exchange (BVL) and corresponding institutions of the stock market.
| 2. | Corporate Governance Practices |
On July 20, the Audit Committee approved the “Operation Guidelines for the Accusation Channel” that will allow the employees to communicate and process before said Committee the information known to them about possible irregularities that affect the accounting, the internal control systems of the financial information or the auditing of the company or its economic group.
| 3. | Reimbursement of contributions to the shareholders |
On July 18, 2005, the Company proceeded to repay the contributions to the shareholders, following the decision taken on the Board of Directors’ Meeting held on May 25, 2005. The repayment for the contributions was carried on in US dollars.
| 4. | Operations with the economic group |
On its session held on August 10, 2005, the Board of Directors approved the acquisition of shares representative of the capital stock of Telefónica Empresas Perú S.A.A. through negotiation in the Lima Stock Market (BVL), aiming to reach a minimum participation of 97.08% of said company. The operation will comprise, at least, the acquisition of shares owned by Telefónica Datacorp, S.A., but may also include the shares of the minority shareholders that present sell orders that do not surpass the price that will be set for each share.
| 5. | Capital stock increase |
The General Shareholders’ Meeting held on September 08, 2005 approved the capitalization of the legal reserve in the amount of S/.344,392,883.40, which was materialized through the increase in the nominal value of the shares from S/.0.80 to S/1.00, while the number of shares issued remained the same (1,721,964,417). The referred capital stock increase was effective on September 19, 2005; consequently, the article 5 of the Company’s bylaws that deals with the amount of the capital was modified.
| 6. | Financing plans |
On its session held on August 24, 2005, the Board of Directors authorized the issuance of bonds in the international market for up to equivalent of US$250 million, to be placed in one or more tranches, considering for that the term and economic limits established by the General Shareholders’ Meeting held on March 26, 2004.
On that sense, the Company informed the market on October 04 about the private international issuance of bonds maturing in April 2016 for the amount of S/.754,050,000 (approximately US$224,921,700) at par price and paying an interest rate of 8%.
2
Table of Contents
| 7. | Changes in the management team |
On session held on July 20, 2005, the Board of Directors accepted the letter of resignation presented by Mr. Séneca de la Puente to the position of Central Manager of Resources and Client Services, and appointed Mr. Dennis Fernández as his replacement.
3
Table of Contents
TELEFÓNICA DEL PERÚ S.A.A. AND SUBSIDIARIES
Management discussion and analysis of the consolidated results
for the third quarter and nine months ended September 30, 2005
It is recommended the reading of this report along with the corresponding financial statements and their notes, presented at the same time, since they form integral part of this document and contain complementary information.
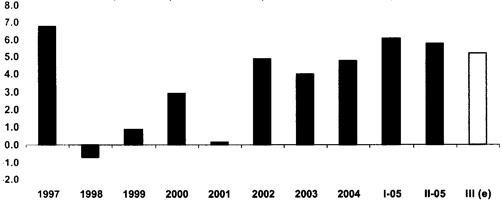
Economic Environment
During the third quarter, the Gross Domestic Product could have grown about 5.0%. As it can be observed in the graph, there is a downward trend in the yearly growth rates. Despite that trend, according to the last survey of macroeconomic expectations conducted by the Central Bank of Reserve (BCR) by the end of September, the consensus of economic analysts expects that the year 2005 ends with a growth of 5.6% (the greater expansion in eight years). The drivers for the growth are several: exports (traditional and non-traditional), private investments in different sectors (mining, construction, manufacturing, among others) and the public expenditure (mainly current expenditure). Furthermore, the 51 consecutive months of growth had a favorable impact in the confidence of the consumers and entrepreneurs. It is worth noting that different to previous expansion periods, this one materialized without macroeconomic imbalances. Conversely, this year and according to the analyst’s consensus, the first surplus in the current account in 20 years would be reached and the international reserves reached high levels (US$13,695 million by the end of September, which represents a coverage of 14 months of imports). On the fiscal side, the market consensus expects that the government accomplishes its deficit target of 1.0% of the GDP.
PBI
(Percent variation with respect to the same period in prior year)
Regarding prices, a deflation of 0.17% was recorded during the third quarter and the inflation rate in the last 12 months dropped to 1.11% (the lowest value since October 2002), below the lower target rate of the BCR for the inflation of the whole year (1.5% - 3.5%). During the last months, the downward trend of the inflation has been driven, in a larger part, by the decrease in the prices of food in light of the greater offering of agricultural products after the recovery of the sector after the drought in the year 2004. In this scenario, the BCR reduced its inflation projection from 2.2% to 1.8% for this year. Moreover, some analysts point out that the inflation could be lower than 1.5%. In front of the lack of inflationary pressures, the BCR maintains its interest rate unaltered in 3.0% since October 2004.
On the other hand, the exchange rate finished September at levels of S/.3.322 per dollar, which represented a depreciation of 2.1% compared to the previous quarter, but an improvement of 0.6% compared to September 2004. After the stability registered along 2005, the Nuevo Sol started to depreciate itself in the second half of August, which could have been the result of several factors: 1) short-term interest rates in US dollars higher than the ones in Nuevos Soles; 2) exchange position of the banks at low levels; 3) greater demand for dollars by the institutional investors in order to purchase bonds; 4) greater demand of forwards by the foreign investors. Conversely, the BCR has endorsed the depreciation by staying out of the exchange market. Therefore, several
4
Table of Contents
analysts point out that the BCR would be seeking to impose a more depreciated foreign exchange rate, which could help it to achieve its yearly inflation target. In the first days of October, the nervousness in the exchange market continued and the exchange rate almost reached S/.3.40 per US dollar (level not seen since August 2004). Nevertheless, different economic analysts and even the Ministry of Economy have noted that a partial correction of the exchange rate could be observed, since the external accounts are solid. Hence, between January and August, a commercial surplus of US$2,962 million was achieved, 80% more than in similar period of 2004.
It is worth noting that despite the fact that the accumulated depreciation of the Peruvian currency along 2005 is against the regional trend, the country risk (measured through the Embi+ index elaborated by JP Morgan) has decreased more than any other Latin-American country in the last months. By the end of September, it dropped to 138 basic points, reaching historically low values and achieving levels similar to the ones of Mexico, country that holds investment grade. It is worth highlighting that on July 11, Standard & Poor’s improved the outlook from stable to positive for the rating assigned to the sovereign debt of Peru (BB or two levels below investment grade). On the other hand, by mid-August, the Peruvian government prepaid US$1,555 million to the Club of Paris, corresponding to the debt maturing in 2009, which will result in estimated annual savings of US$350 million in the external debt service. The operation was financed with issuances in the local market (S/.2,619 million) and the external market (US$750 million)
Competitive Environment
In the local telephony business, the main competitors -Telmex and Americatel- continued to focus fundamentally on the corporate segment. In the long distance business and public telephony, IDT, Americatel, and Telmex focused in the sale of prepaid cards, applying price reductions which could not be answered due to the application by the Regulator of the tariff imputation proof (minimum prices in domestic long distance), which resulted in a reduction in the market share. In public telephony, there was an important increase in the plant of the competition, mainly Telmex. For the three businesses, fixed telephony, long distance and public telephony, it is worth mentioning the increasing competition from the mobile telephony, resulting of the plant growth and the consequent effect of substitution of the traffic of minutes. Finally, in the Internet access business, there has been a strong migration of the services of narrow band towards broadband. In an environment of strong plant growth, the different participants of the market (Telefónica del Perú, RCP and Terra) have focused in capturing the existing demand through commercial promotions based on discounts on the cost of the modem, the installation fee and the first month of service.
Operating revenues
During the 3Q05 as in previous quarters, the operating revenues were strongly affected by regulatory decisions – enforcement of a productivity factor of 10.07% since September 01, 2004, the highest worldwide, and the application of the tariff imputation proof in the Domestic Long Distance business. Therefore, despite the important growths reached in terms of the number of accesses of the main services of the Company, the operating revenues of the 3Q05 just grew 0.9% compared to the 3Q04, while the operating income dropped 14.1%.
By the end of the 3Q05, the total of accesses of Telefónica del Perú showed an important yearly increase of 9.9% in lines of fixed telephony, 86.8% in broadband accesses, 10.2% in public telephony lines and 14.1% in subscribers of cable TV. The impact during the 9M05 of the regulatory and competitive environments over the operating revenues was dimmed by the intense commercial activity of the Company that explains: i) the strong growth of fixed telephony accesses, resulting in 49,558 net adds; ii) the performance of the broadband plant that reached more than 310 thousand users by the end of September; iii) the performance of the public telephony plant that reached more than 137 thousand users; and iv) the expansion in the number of subscribers of cable TV, closing the period with more than 437 thousand subscribers.
Operating revenues for the 3Q05 reached S/.860 million, 0.9% higher than the ones registered in the 3Q04, thus reverting the trend of the 1Q05 and the 2Q05, despite the negative effect of the businesses of Local Telephony (-7.5%), Long Distance (-15.8%) and Business Communications (-9.9%). On the other hand, the
5
Table of Contents
revenues of the businesses of Internet grew 34.6% in the 3Q05 compared to the 3Q04, the ones from Cable Television grew 15.4% and the ones from Public and Rural Telephony grew 3.1%.
On the other hand, the operating revenues for the 9M05 reached S/.2,578 million, dropping 0.5% compared to the 9M04. The revenues that contributed to soften the lower revenues from the traditional businesses (Local Telephony and Long Distance) are: Internet, which increased 33.6%; Cable Television, which grew 5.4%; and Public and Rural Telephony, which increased 1.9%.
The revenues forLocal Telephonyreached S/.311 million in the 3Q05, presented a reduction of 7.5% compared with the 3Q04. Likewise, the revenues of the 9M05 showed the same percentage reduction compared to the 9M04, reaching S/.945 million. Nevertheless, at the end of the period, the plant in service reached 2.2 million lines, with an annual growth of 9.8%, which reflects the strong effort developed by the Company to increase the penetration by offering prepaid or consumption limit products that satisfy the specific needs of each market segment.
Long Distance revenues during the 3Q05 dropped 15.8% compared to the 3Q04, totaling S/.93 million. The lower revenues form DLD (-8.5%), as a result of the lower traffic, were not offset by the higher revenues from ILD (19.5%). This market presents a highly competitive environment, mainly in the prepaid card segment, and has been affected by the application of the tariff imputation proof established by Osiptel, which has caused a reduction in the volume of minutes and result in a loss of market share by the Company. On the other hand, the revenues for the 9M05 totaled S/.321 million, 7.5% lower than in the 9M04, due to the lower revenues for DLD (-6.9%). This effect was partially offset by the higher revenues from ILD (13.3%), resulting of the higher traffic, as well as the lower payments to foreign operators.
The revenues forPublic and Rural Telephony reached S/.149 million in the 3Q05, representing a 3.1% increase regarding the 3Q04, while on the 9M05 reached S/.456 million, 1.9% higher than in the 9M04. These increases are mainly due to the growth of the plant in service, 10.2% year-over-year, and the effort in managing the relocations, which was partially offset by the lower traffic per line due to the increasing substitution by the mobile telephony and the increase in the fixed telephony plant through prepaid and consumption limit products.
Cable Television revenues reached S/.89 million in the 3Q05, which represents a 15.4% increase compared to the 3Q04. Likewise, in the 9M05 an increase of 5.4% compared to the 9M04 is registered, totaling S/.244 million. This growth is explained by the increase of 14.1% year-over-year in the number of subscribers, as a result of the important commercial effort carried on and the execution of a program against illegal installations.
The revenues forBusiness Communicationsreached S/.19 million in the 3Q05, 9.9% lower than in the 3Q04, while in the 9M05 reached S/.61 million, 16.3% lower than in the 9M04. This result was mainly explained by the reduction of revenues from Digired in 17.7%, due to the migration to the product IP-VPN.
The revenues forInternetreached S/.105 million in the 3Q05, an increase of 34.6% compared to the 3Q04. This growth is chiefly explained by the year-over-year growth of the broadband plant in 86.8%, reaching 310 thousand lines through permanent commercial actions aimed to provide the customers with greater benefits. Likewise, the revenues for the 9M05 reached S/.282 million, 33.6% higher than in the 9M04.
Operating expenses
The operating expenses totaled S/.666 million in the 3Q05, which represents an increase of 6.3% in respect to the S/.627 million of the 3Q04. There were increases in: depreciation and amortization of S/.36 million, general and administrative expenses of S/.15 million and materials and supplies of S/.6 million, the latter related to the greater commercial activity and the resulting increase in the lines in service of the different products. These increases were partially offset by the lower expenses in provisions for bad debt in S/.21 million.
The accumulated operating expenses of S/.2,041 million in the 9M05 raised S/.9 million, which represents an increase of 0.4% compared to the 9M04, chiefly due to the increase in: depreciation and amortizations of
6
Table of Contents
S/.118 million, general and administrative expenses of S/.44 million and materials and supplies of S/.8 million. Said increases were partially dimmed by the decrease in the management fee (in place since July 01, 2004) in S/.128 million and the provision for bad debt in S/.38 million, due to the effect of the larger prepaid and consumption limit plant which resulted in a better collection management.
Operating Result
The operating result dropped 14.1% in the 3Q05 compared to the 3Q04, going from S/.226 million to S/.194 million, mainly due to the increase in operating expenses compared to the operating revenues during the quarter.
In the 9M05, the operating result fell 3.9% compared to the 9M04, reaching S/.536 million. This was chiefly explained by the lower revenues in local telephony and long distance, although they were offset to a certain extent by the reduction in the management fee of the controlling shareholder and the provision for bad debt.
Non-operating Result
During this period, the non-operating result improved mainly as a result of the monetary correction (or REI), which had a negative effect of S/.21 million in the 3Q04, while in the 3Q05 is no longer applied, due to the change in the accounting policies in the country starting on January 1st, 2005. Furthermore, the net financial expenses fell S/.13 million and others net dropped S/.12 million.
In the 9M05, the non-operating result was reduced in S/.165 million compared to the 9M04 mainly explained by the monetary correction recorded in 2004 (S/.109 million), as well as a higher loss in others net during the period (S/.42 million).
Net result
The net results improved from S/.78 million in the 3Q04 to S/.84 million in the 3Q05, an increase of 7.9%, mostly explained by the better non-operating result. On the other hand, the accumulated net result dropped 44.9%, from S/.273 million in the 9M04 to S/.151 million in the 9M05, mainly as a result of the positive effect of the monetary correction in the 9M04.
Consolidated Balance Sheet
The liquidity levels of the Company – measured by the current assets over current liabilities ratio – reached 0.49 in the 3Q05, lower than the 0.71 recorded in the 2Q05, mainly as a consequence of the lower cash levels. Regarding the capacity for debt payment, the financial coverage ratio (debt – cash and cash equivalents / operating result + depreciation and amortization) increased from 0.73 in the 2Q05 to 0.97 in the 3Q05. In the 9M05, the investments executed for the extension of the services reached S/.334.9 million.
7
Table of Contents
TABLE 1
TELEFONICA DEL PERU S.A.A. AND SUBSIDIARIES
CONSOLIDATED INCOME STATEMENTS IN ADJUSTED SOLES (000) AS OF SEPTEMBER 30, 2005 1
(Prepared In Accordance With Peruvian GAAP)
| 3Q04 | 3Q05 | Abs. Var. 3Q05-3Q04 | % Var. 3Q05-3Q04 | 9M04 | 9M05 | Var. Abs. 9M05-9M04 | Var. % 9M05-9M04 | |||||||||||||||||||||||||||||
| % | % | % | % | % | % | |||||||||||||||||||||||||||||||
Local Telephone Service | 335 908 | 39.4 | 310 696 | 36.1 | (25 212 | ) | (7.5 | ) | 1 022 304 | 39.5 | 945 141 | 36.7 | (77 163 | ) | (7.5 | ) | ||||||||||||||||||||
Long Distance | 110 119 | 12.9 | 92 678 | 10.8 | (17 441 | ) | (15.8 | ) | 346 701 | 13.4 | 320 828 | 12.4 | (25 873 | ) | (7.5 | ) | ||||||||||||||||||||
Public Telephones | 144 277 | 16.9 | 148 704 | 17.3 | 4 427 | 3.1 | 447 072 | 17.3 | 455 531 | 17.7 | 8 459 | 1.9 | ||||||||||||||||||||||||
Cable TV | 77 183 | 9.1 | 89 090 | 10.4 | 11 907 | 15.4 | 231 365 | 8.9 | 243 761 | 9.5 | 12 396 | 5.4 | ||||||||||||||||||||||||
Business Communications | 21 470 | 2.5 | 19 350 | 2.2 | (2 120 | ) | (9.9 | ) | 72 496 | 2.8 | 60 683 | 2.4 | (11 813 | ) | (16.3 | ) | ||||||||||||||||||||
Internet | 77 757 | 9.1 | 104 646 | 12.2 | 26 889 | 34.6 | 210 779 | 8.1 | 281 544 | 10.9 | 70 765 | 33.6 | ||||||||||||||||||||||||
Other | 85 993 | 10.1 | 95 150 | 11.1 | 9 157 | 10.6 | 259 703 | 10.0 | 270 087 | 10.5 | 10 384 | 4.0 | ||||||||||||||||||||||||
Total Operating Revenues | 852 707 | 100.0 | 860 314 | 100.0 | 7 607 | 0.9 | 2 590 420 | 100.0 | 2 577 575 | 100.0 | (12 845 | ) | (0.5 | ) | ||||||||||||||||||||||
Personnel | 94 844 | 11.1 | 95 611 | 11.1 | 767 | 0.8 | 285 941 | 11.0 | 285 683 | 11.1 | (258 | ) | (0.1 | ) | ||||||||||||||||||||||
General and Administrative | 238 210 | 27.9 | 252 896 | 29.4 | 14 686 | 6.2 | 738 658 | 28.5 | 783 031 | 30.4 | 44 373 | 6.0 | ||||||||||||||||||||||||
Depreciation | 249 526 | 29.3 | 286 004 | 33.2 | 36 478 | 14.6 | 743 364 | 28.7 | 861 385 | 33.4 | 118 021 | 15.9 | ||||||||||||||||||||||||
Technology Transfer and Management Fees | 9 926 | 1.2 | 9 922 | 1.2 | (4 | ) | (0.0 | ) | 157 870 | 6.1 | 30 224 | 1.2 | (127 646 | ) | (80.9 | ) | ||||||||||||||||||||
Materials and Supplies | 16 496 | 1.9 | 22 236 | 2.6 | 5 740 | 34.8 | 48 937 | 1.9 | 57 127 | 2.2 | 8 190 | 16.7 | ||||||||||||||||||||||||
Provisions | 27 281 | 3.2 | 6 467 | 0.8 | (20 814 | ) | (76.3 | ) | 86 413 | 3.3 | 48 644 | 1.9 | (37 769 | ) | (43.7 | ) | ||||||||||||||||||||
Own Work Capitalized | (9 421 | ) | (1.1 | ) | (6 923 | ) | (0.8 | ) | 2 498 | (26.5 | ) | (28 759 | ) | (1.1 | ) | (24 943 | ) | (1.0 | ) | 3 816 | (13.3 | ) | ||||||||||||||
Total Operating Costs and Expenses | 626 862 | 73.5 | 666 213 | 77.4 | 39 351 | 6.3 | 2 032 424 | 78.5 | 2 041 151 | 79.2 | 8 727 | 0.4 | ||||||||||||||||||||||||
Operating Income | 225 845 | 26.5 | 194 101 | 22.6 | (31 744 | ) | (14.1 | ) | 557 996 | 21.5 | 536 424 | 20.8 | (21 572 | ) | (3.9 | ) | ||||||||||||||||||||
Other Income (Expenses) | ||||||||||||||||||||||||||||||||||||
Interest Income | 44 703 | 5.2 | 10 909 | 1.3 | (33 794 | ) | (75.6 | ) | 66 428 | 2.6 | 33 494 | 1.3 | (32 934 | ) | (49.6 | ) | ||||||||||||||||||||
Interest Expenses | (61 462 | ) | (7.2 | ) | (48 139 | ) | (5.6 | ) | 13 323 | (21.7 | ) | (147 320 | ) | (5.7 | ) | (127 855 | ) | (5.0 | ) | 19 465 | (13.2 | ) | ||||||||||||||
Others Net | (13 372 | ) | (1.6 | ) | (1 718 | ) | (0.2 | ) | 11 654 | (87.2 | ) | (55 132 | ) | (2.1 | ) | (97 519 | ) | (3.8 | ) | (42 387 | ) | 76.9 | ||||||||||||||
Inflation Gain (Loss) | (21 269 | ) | (2.5 | ) | — | — | 21 269 | (100.0 | ) | 108 727 | 4.2 | — | — | (108 727 | ) | (100.0 | ) | |||||||||||||||||||
Total Other Income (Expenses) | (51 400 | ) | (6.0 | ) | (38 948 | ) | (4.5 | ) | 12 452 | (24.2 | ) | (27 297 | ) | (1.1 | ) | (191 880 | ) | (7.4 | ) | (164 583 | ) | 602.9 | ||||||||||||||
Income Before Taxes and Participations | 174 445 | 20.5 | 155 153 | 18.0 | (19 292 | ) | (11.1 | ) | 530 699 | 20.5 | 344 544 | 13.4 | (186 155 | ) | (35.1 | ) | ||||||||||||||||||||
Workers’ Participation | (25 665 | ) | (3.0 | ) | (19 033 | ) | (2.2 | ) | 6 632 | (25.8 | ) | (69 244 | ) | (2.7 | ) | (51 687 | ) | (2.0 | ) | 17 557 | (25.4 | ) | ||||||||||||||
Income Tax | (70 886 | ) | (8.3 | ) | (52 036 | ) | (6.0 | ) | 18 850 | (26.6 | ) | (188 023 | ) | (7.3 | ) | (142 137 | ) | (5.5 | ) | 45 886 | (24.4 | ) | ||||||||||||||
Net Income | 77 894 | 9.1 | 84 084 | 9.8 | 6 190 | 7.9 | 273 432 | 10.6 | 150 720 | 5.8 | (122 712 | ) | (44.9 | ) | ||||||||||||||||||||||
| 1) | According to the disposition of the Accounting Regulation Counsel No. 031-2004, from January 1, 2005 on, the adjustment resulting of the effect of the inflation is no longer be applied to the financial statements for accounting purposes, thus eliminating the entry for monetary correction (REI). Moreover, only the information for the 3Q04 and the 9M04 is adjusted by the WPI published by the Instituto Nacional de Estadística e Informática (INEI) as of December 31, 2004. It is worth noting that from January 1, 2005 on, the differences in foreign exchange are recorded in the financial revenues or expenses, were applicable. For comparison reasons, the differences in the foreign exchange corresponding to the 3Q04 and the 9M04 have been reclassified in that entry. |
8
Table of Contents
TABLE 2
TELEFONICA DEL PERU S.A.A. AND SUBSIDIARIES
CONSOLIDATED BALANCE SHEET IN ADJUSTED SOLES (000) AS OF SEPTEMBER 30, 2005(1)
(End of Period Figures)
ASSETS | |||||||||||||||
| 3Q05 | 2Q05 | 1Q05 | 4Q04 | 3Q04 | |||||||||||
CURRENT ASSETS | |||||||||||||||
Cash and cash equivalents | 331 241 | 768 061 | 282 242 | 63 332 | 352 221 | ||||||||||
Negotiable securities | 52 315 | 41 823 | 44 845 | 37 325 | 45 388 | ||||||||||
Accounts and notes receivable - net | 585 709 | 591 746 | 547 770 | 569 592 | 547 559 | ||||||||||
Other accounts receivable | 93 975 | 91 969 | 249 492 | 188 230 | 214 044 | ||||||||||
Materials and supplies | 41 828 | 39 280 | 35 806 | 37 558 | 37 487 | ||||||||||
Prepaid taxes and expenses | 53 244 | 56 542 | 56 995 | 41 307 | 48 029 | ||||||||||
Investments | 95 205 | 84 527 | |||||||||||||
Total current assets | 1 158 312 | 1 589 421 | 1 217 150 | 1 032 549 | 1 329 255 | ||||||||||
LONG-TERM INVESTMENTS | 11 678 | 10 755 | 10 035 | 9 197 | 8 593 | ||||||||||
DEFERRED EXPENSES | 8 266 | 8 699 | |||||||||||||
PROPERTY, PLANT AND EQUIPMENT | 15 789 134 | 15 642 038 | 15 539 435 | 15 473 120 | 15 195 811 | ||||||||||
Accumulated depreciation | (10 372 035 | ) | (10 109 099 | ) | (9 836 164 | ) | (9 579 437 | ) | (9 342 531 | ) | |||||
Write-off Provision | (81 844 | ) | (88 510 | ) | (79 192 | ) | (79 192 | ) | (65 355 | ) | |||||
| 5 335 255 | 5 444 429 | 5 624 079 | 5 814 491 | 5 787 925 | |||||||||||
OTHER ASSETS, net | 213 974 | 209 744 | 203 580 | 225 141 | 225 141 | ||||||||||
TOTAL ASSETS | 6 727 485 | 7 263 048 | 7 054 844 | 7 081 378 | 7 350 914 | ||||||||||
LIABILITIES AND SHAREHOLDERS’ EQUITY | |||||||||||||||
| 3Q05 | 2Q05 | 1Q05 | 4Q04 | 3Q04 | |||||||||||
CURRENT LIABILITIES | |||||||||||||||
Overdrafts | 4 759 | 4 456 | 5 239 | 5 347 | 368 | ||||||||||
Accounts payable and accrued liabilities | 421 070 | 385 536 | 418 214 | 478 260 | 355 479 | ||||||||||
Other accounts payable | 1 112 183 | 987 881 | 1 043 349 | 1 051 875 | 775 682 | ||||||||||
Provision for severance indemnities | 9 749 | 4 452 | 9 912 | 4 120 | 2 374 | ||||||||||
Bank Loans | 225 625 | 304 350 | 165 000 | 201 500 | 110 000 | ||||||||||
Current maturities of long-term debt | 49 623 | 49 439 | 89 961 | 90 211 | 120 395 | ||||||||||
Current maturities of bonds | 278 100 | 163 977 | 248 977 | 398 496 | 234 519 | ||||||||||
Commercial Papers | 282 900 | 328 185 | 215 000 | 95 000 | 51 500 | ||||||||||
Total current liabilities | 2 384 009 | 2 228 276 | 2 195 652 | 2 324 809 | 1 650 317 | ||||||||||
LONG-TERM DEBT | 636 661 | 468 955 | 323 220 | 335 144 | 235 276 | ||||||||||
BONDS | 710 849 | 822 824 | 749 961 | 582 522 | 746 561 | ||||||||||
GUARANTY DEPOSITS | 106 929 | 105 114 | 103 780 | 102 475 | 104 203 | ||||||||||
DEFERRED EARNINGS | 785 815 | 843 857 | 935 188 | 1 009 042 | 918 020 | ||||||||||
SHAREHOLDERS’ EQUITY | |||||||||||||||
Capital stock | 1 924 595 | 2 355 086 | 2 355 086 | 2 355 086 | 3 098 199 | ||||||||||
Treasury shares | (21 896 | ) | (21 896 | ) | (21 896 | ) | (21 896 | ) | (21 895 | ) | |||||
Legal reserve | 33 275 | 377 668 | 377 668 | 372 365 | 372 365 | ||||||||||
Retained earnings | 167 248 | 83 164 | 36 185 | 21 831 | 247 868 | ||||||||||
TOTAL SHAREHOLDERS’ EQUITY | 2 103 222 | 2 794 022 | 2 747 043 | 2 727 386 | 3 696 537 | ||||||||||
TOTAL LIABILITIES AND SHAREHOLDERS’ EQUITY | 6 727 485 | 7 263 048 | 7 054 844 | 7 081 378 | 7 350 914 | ||||||||||
| 1) | According to the disposition of the Accounting Regulation Counsel No. 031-2004, from January 1, 2005 on, the adjustment resulting of the effect of the inflation is no longer be applied to the financial statements for accounting purposes. Moreover, only the information for the year 2004 is adjusted by the WPI published by the Instituto Nacional de Estadística e Informática (INEI) as of December 31, 2004. |
9
Table of Contents
TABLE 3
TELEFONICA DEL PERU S.A.A. AND SUBSIDIARIES
Statistical Data, End of Period Figures
| 3Q04 | 4Q04 | 1Q05 | 2Q05 | 3Q05 | Var. Abs. 3Q05-3Q04 | 3Q05/ 3Q04 | ||||||||||
Fixed-Wire Telephone Service: Local+Long Distance | ||||||||||||||||
Lines Installed | 2 260 831 | 2 307 247 | 2 343 993 | 2 396 113 | 2 455 347 | 194 516 | 8.6 | |||||||||
Profits (losses) in Lines in Service, net | 46 990 | 50 462 | 48 380 | 46 115 | 49 558 | 2 568 | 5.5 | |||||||||
Lines in Service Including Public Telephones (1) | 2 095 838 | 2 150 827 | 2 201 167 | 2 250 663 | 2 302 585 | 206 747 | 9.9 | |||||||||
Local Traffic - Minutes (000) (2) | 1 302 021 | 1 294 169 | 1 260 216 | 1 247 663 | 1 236 312 | (65 708 | ) | (5.0 | ) | |||||||
Long Distance - Minutes (000) (3) | 235 797 | 252 848 | 267 761 | 286 576 | 294 434 | 58 637 | 24.9 | |||||||||
Number of Employees (Telefónica del Perú and Subsidiaries) | 5 227 | 5 179 | 5 158 | 5 280 | 5 371 | 144 | 2.8 | |||||||||
Number of Employees (Telefónica del Perú) | 3 328 | 3 153 | 3 144 | 3 170 | 3 196 | (132 | ) | (4.0 | ) | |||||||
Lines in Service per Employee (Telefónica del Perú) | 630 | 682 | 700 | 710 | 720 | 91 | 14.3 | |||||||||
Digitalization Rate (%) | 96.5 | 96.5 | 96.6 | 96.7 | 96.7 | 0.2 | 0.2 | |||||||||
Lines in Service per 100 inhabitants | 7.6 | 7.8 | 8.0 | 8.1 | 8.3 | 0.7 | 9.2 | |||||||||
| PUBLIC TELEPHONES | ||||||||||||||||
Lines in Service (4) | 124 499 | 129 353 | 130 980 | 134 423 | 137 226 | 12 727 | 10.2 | |||||||||
| BROAD BAND | ||||||||||||||||
Lines in Service (5) | 166 228 | 205 425 | 234 660 | 276 151 | 310 470 | 144 242 | 86.8 | |||||||||
| CABLE TV | ||||||||||||||||
Subscribers | 383 260 | 389 174 | 405 959 | 417 535 | 437 172 | 53 912 | 14.1 | |||||||||
| (1) | Excluding Cellular Public Phones, Publifón and rurals |
| (2) | Including billed traffic F2F (voice and internet), F2M and M2F |
| (3) | Excluding Prepaid cards, including packed minutes plans. |
| (4) | Including Cellular and fixed public phones and Rural fixed and cellular public phones. |
| (5) | Including broad band and Cablenet. |
10
Table of Contents
Lima, October 21, 2005
PUBLIC REGISTRY OF THE STOCK MARKET
NATIONAL SUPERVISORY COMMISSION
ON COMPANIES AND SECURITIES (CONASEV)
Re: Key Events
Dear Sirs,
According to Article 28 of the Peruvian Capital Markets Law and regarding the Rules related to Key Events, Private Information and other Communications approved by CONASEV Resolution No. 107-2002-EF/94.10 and the rules about the Economic Group we inform you that in execution of the agreement taken by the Board of Directors of Telefónica del Perú S.A.A., today it acquired through the Lima Stock Exchange, 24,973,124 representative shares of the capital stock of Telefónica Empresas Perú S.A.A. which represents 97.86% of its capital stock, paying S/. 9.70 per share.
It important to note that such acquisition does not imply a change of effective control in Telefónica Empresas Perú S.A.A. It is therefore not necessary to initiate a public offering of acquisition of shares since from the total number of acquired shares, 24,773,409 were held by Telefónica Datacorp, S.A., which belongs to the same Economic Group as Telefónica del Perú S.A.A.
As a result of such acquisition, Telefónica Empresas Perú S.A.A. becomes a direct subsidiary of Telefónica del Perú S.A.A. Attached hereto you will find the appendices containing the updated information on the Economic Group which has been modifed to reflect the acquisition.
Sincerely,
Julia María Morales Valentín
Stock Exchange Representative
Telefónica del Perú S.A.A.
Table of Contents
Item 3
Appendix of Economic Group
13) Issuer: Telefónica Empresas Perú S.A.A.
| 1. | CIIU: | 64207 | ||
| 2. | RUC: | 20500698340 | ||
| 3. | Address: | Jorge Basadre Nº 592, Piso 7, San Isidro | ||
| 4. | Legal Representative: |
Name | Identification | Position | ||
FRIAS GARCIA Gabriel | C.E. 000114157 | Chief Executive Officer |
| 5. | Shareholders with 5% or more of the capital stock: |
Name | Identification | Participation on the Capital Stock (%) | ||
TELEFÓNICA DEL PERÚ S.A.A | 20100017491 | 97.08% |
| 6. | Board of Directors |
Name | Identification | Position | ||
MUÑOZ Claudio | Passport No. 9.618.122-1. | Director | ||
FRIAS GARCIA Gabriel | C.E. 000114157 | Director | ||
MORALES VALENTIN Julia María | DNI No. 08768750 | Director – Secretary of the Board | ||
QUINN Bernardo | Passport No. 8436068 | Director | ||
REVILLA VERGARA Juan | DNI No. 08234014 | Director | ||
ROS BRUGUERAS Juan Carlos | DNI No. 46115906-D | Director | ||
VALENTE DA SILVA Antonio Carlos | Passport No. CO750.232 | Chief of the Board | ||
Table of Contents
Item 3
| 7. | Officers: |
Name | Identification | Position | ||
| FRIAS GARCIA Gabriel | C.E. 000114157 | Chief Executive Officer | ||
| ARAUJO AZALDE Carlos | DNI No. 10273563 | Gerente Central de Planificación, Administración y Finanzas (e) | ||
| CHECA GJURINOVIC Guillermo | DNI No. 07886625 | Gerente Central de Atención y Satisfacción de Clientes | ||
| GYGAX ZEGARRA BALLÓN Luis Horacio | DNI No. 09143349 | Gerente Central de Soluciones y Hosting - ASP | ||
| MORALES VALENTIN Julia María | DNI No. 08768750 | Representante Busrsátil | ||
| PALACIOS BUTRON César | DNI N° 06087649 | Gerente Comercial y de Marketing | ||
| VEREAU MONTENEGRO Fernando | DNI No. 10308030 | Gerente Central de Comunicaciones Empresariales | ||
| 8. | Advisors: |
Name | Identification | Position | ||
N/A |
Table of Contents
SIGNATURES
Pursuant to the requirements of the Securities Exchange Act of 1934, the registrant has duly caused this report to be signed on its behalf by the undersigned, thereunto duly authorized.
| Telefónica del Perú | ||||||||||
| Date: October 31, 2005 | By: | /S/ JULIA MARÍA MORALES VALENTÍN | ||||||||
| Name: | Julia María Morales Valentín | |||||||||
| Title: | General Counsel of Telefónica del Perú S.A.A. | |||||||||