Table of Contents
FORM 6-K
SECURITIES AND EXCHANGE COMMISSION
Washington, D.C. 20549
Report of Foreign Issuer
Pursuant to Rule 13a-16 or 15d-16
of the Securities Exchange Act of 1934
For the month of February, 2006
Commission File Number: 001-14404
Telefónica del Perú S.A.A.
(Translation of registrant’s name into English)
Avenida Arequipa 1155
Santa Beatriz, Lima, Perú
(Address of principal executive offices)
Indicate by check mark whether the registrant files or will file annual reports under cover of Form 20-F or Form 40-F:
Form 20-F X Form 40-F
Indicate by check mark if the registrant is submitting the Form 6-K in paper as permitted by Regulation S-T Rule 101(b)(1):
Yes No X
Indicate by check mark if the registrant is submitting the Form 6-K in paper as permitted by Regulation S-T Rule 101(b)(7):
Yes No X
Indicate by check mark whether by furnishing the information contained in this Form, the Registrant is also thereby furnishing the information to the Commission pursuant to Rule 12g3-2(b) under the Securities Exchange Act of 1934:
Yes No X
If “Yes” is marked, indicate below the file number assigned to the registrant in connection with Rule 12g3-2(b): N/A
Table of Contents
TABLE OF CONTENTS
Table of Contents
Lima, January 20, 2006
PUBLIC REGISTRY OF THE STOCK MARKET
NATIONAL SUPERVISORY COMMISSION
ON COMPANIES AND SECURITIES (CONASEV)
Re: Key Events
Dear Sirs,
According to Article 28 of the Peruvian Capital Markets Law and regarding the Rules related to Key Events, Private Information and other Communications approved by CONASEV Resolution No. 107-2002-EF/94.10, Telefónica del Perú S.A.A. informs you that it has purchased from Com S.A. 2,288,572 shares of Telefónica Servicios Digitales S.A.C.’s capital stock.
In the next days the updated information concerning Telefónica Servicios Digitales S.A.C.’s economic group will be presented.
Sincerely,
Julia María Morales Valentín
Stock Exchange Representative
Telefónica del Perú S.A.A.
Table of Contents
Lima, February 14, 2006
PUBLIC REGISTRY OF THE STOCK MARKET
NATIONAL SUPERVISORY COMMISSION
ON COMPANIES AND SECURITIES (CONASEV)
Re: Key Events
Dear Sirs,
According to the article 28 of the Peruvian Capital Markets Law and regarding the Rules related to Key Events, Private Information and other Communications approved by CONASEV Resolution No. 107-2002-EF/94.10, we inform you that the Board of Directors of Telefónica del Perú S.A.A. today, adopted the following decisions which are considered key events:
| • | Presentation of the consolidated and non-consolidated financial statements of the Company of the fourth quarter of year 2005 – which will be duly registered through the MVNet system today. Find enclosed the management report of the financial statements consolidated as to the fourth quarter of 2005. |
| • | Acceptance of the resignation of Mr. Manuel Plaza Martín, Spanish, identified with C.E. N° 0002457726 as Gerente Central de Red y Operaciones and assignment of Mr. Juan José García Pagán, Spanish, identified with C.E. N° 000093737 in such position. |
| • | Changed the “Gerencia de Recursos Humanos” to a “Gerencia Central,” with the resulting modification of the company’s structure; assigned Mr. César Andrade Nicoli as responsible for such area. |
| • | Approval to include as point of the agenda for the Mandatory Annual Shareholders’ Meeting of Telefónica del Perú S.A.A. that will be soon called, the amortization of all the shares of own issuance and the consequent reduction of the capital stock and modification of article 5 of the Company’s bylaws. |
Sincerely yours,
Julia María Morales Valentín
Stock Exchange Representative
Telefónica del Perú S.A.A.
Table of Contents

Quarterly Results
Telefónica del Perú S.A.A. and subsidiaries
October – December 2005
1
Table of Contents
Significant Events
A summary containing the most significant events since October 2005 is presented below:
| 1. | Boards of Directors’ Meetings |
On its session held on October 19, 2005, the Board of Directors approved the individual and consolidated financial statements of the Company corresponding to the third quarter of 2005 and decided for their filing with the Comisión Nacional Supervisora de Empresas y Valores, the Lima Stock Exchange (BVL) and the corresponding institutions of the stock market.
On its session held on November 24, 2005, the Board of Directors approved the 4th Bond Program for an equivalent amount of up to US$450 million and the 3rd Commercial Papers Program, for an equivalent amount of up to US$ 200 million. It also provided some executives with the corresponding powers to determine the opportunity, terms and conditions of the issuances.
| 2. | Appointment and Resignations |
The resignation of Mr. Renán Oliveira de Barros to the position of Central Manager of Strategic Planning and Development of Products and Services was accepted.
The resignation of Mr. Juan Revilla to the position of General Manager was accepted and Mr. Michael Duncan was appointed as his replacement, taking office on January 01, 2006.
The resignation of Mr. José Antonio Colomer to the positions of Director and member of the Executive Committee of the Boards of Directors was accepted. His Alternate Director, Mr. Manuel Echánove, will replace him.
| 3. | On October 21, 2005, Telefónica del Perú S.A.A. acquired the shares from Telefónica Datacorp S.A. that represents 97.08% of the capital stock of Telefónica Empresas Perú S.A.A., company that now becomes a direct subsidiary of Telefónica del Perú S.A.A. |
| 4. | On October 03, 2005, priced its international offer of notes denominated “Telefónica del Perú S.A.A. Senior Notes due 2016” at 8% for a total amount of S/. 754,050,000. |
| 5. | On December 22, 2005, the General Shareholders’ Meetings of Media Networks Perú S.A.C. and Telefónica Multimedia S.A.C. approved the spin-off project by which effective January 01, 2006 the former company will absorb the equity of the latter company, composed of assets and liabilities related to the production of contents and advertising. |
| 6. | On December 26, 2005, the General Shareholders’ Meeting of Telefónica Multimedia S.A.C. approved: (i) the payment of dividends in the amount of S/. 31,599,293.08 to be charged against the accumulated results as of December 31, 2004, less the legal reserve; and (ii) the payment of a provisional dividend in the amount of S/. 2,950,491.12 to be charged against the net profits of December 31, 2005. This amount will be considered as part of the final dividend to be declared by the General Shareholders’ Meeting. The payment of such dividends was made on December 29, 2005. |
| 7. | The General Shareholders’ Meeting of Telefónica Servicios Digitales S.A.C. approved the increase of its capital stock from S/. 2,593,210 to S/. 4,670,109. |
2
Table of Contents
TELEFÓNICA DEL PERÚ S.A.A. AND SUBSIDIARIES
Management discussion and analysis of the consolidated results
for the fourth quarter ended on December 31, 2005
It is recommended the reading of this report along with the corresponding financial statements and their notes, presented at the same time, since they form integral part of this document and contain complementary information.
Economic Environment
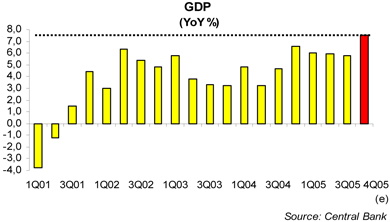
According to the estimates of the Central Bank (BCR), the Gross Domestic Product accelerated during the fourth quarter of 2005 and could have grown 7.5%, becoming the highest mark since the current economic expansion started. This outstanding growth rate was achieved despite a high comparison basis, given that the economic activity grew 6.6% in the fourth quarter of 2004. Thus, the GDP could have finished the year 2005 with an expansion of 6.3% (the highest since 1998) and accumulated 18 consecutive quarters of growth (one of the longest expansion cycles in the last decades). The highlights of last quarter of 2005, were the increase in the public expenditures (20%), the private investments (19%) and exports (12%). It is worth noting that despite the significant expansion of the public expenditures in the last quarter, the fiscal deficit could have finished the year 2005 at 0.4% of the GDP (below the 1.1% of the GDP in 2004 and its lowest level in the last eight years). On the other hand, the unemployment rate in the Metropolitan area of Lima dropped to 8.0% in the last quarter of 2005 (the lowest of all the fourth quarters over the last five years).
As for prices, an inflation of 0.63% was recorded during the fourth quarter (the highest in 2005) and the inflation rate in the last 12 months was 1.5%, at the lower target rate of the BCR for the inflation of the whole year (1.5%—3.5%). The low inflation in 2005 was mainly the result of the reversion in the foreign and domestic shocks during 2004 (that increased the prices for bread, rice and sugar), which temporarily dislocated the inflation rate even above the upper target rate (3.5%). Also, the fiscal measures (reduction of the Impuesto Selectivo al Consumo and the custom duties on the petroleum liquidized gas) directed to soften the impact of the higher international fuel prices, the appreciation of the Nuevo Sol (especially the one recorded between August 2004 and August 2005) and the fall of power tariffs due to the use of the natural gas and the telephone tariffs due to regulatory issues, contributed to the lower inflation recorded in 2005.
On the other hand, on November 4, the rating agency Fitch improved its outlook of the Peruvian sovereign debt from stable to positive BB (two notches below investment grade). According to the agency, the change in perspective reflected the favorable trend in the payment balance and the dynamics of the external public debt, since the prepayment to the Club of Paris and other financial operations in the domestic market have reduced the re-financing risk in the medium-term. Furthermore and according to Fitch, the improvement in the external solvency indexes of the country should continue in the short-term given the favorable environment for the prices of commodities. This improvement in the country’s outlook made by Fitch followed the one made by S&P in last July.
3
Table of Contents
The financial variables were affected (especially in December) by the political uncertainty before the presidential elections scheduled for April 9th. In December, the Nuevo Sol depreciated and the exchange rate closed on S/. 3.45 per dollar (an unseen FX value since July 2004). In order to avoid further depreciation, the BCR sold US$345 million and placed Re-Adjustable Depositary Certificates according to the exchange rate in the amount of S/. 1,002 million. Likewise, the BCR increased its interest rate to 3.25% after keeping it at 3.0% during 14 months. The exchange rate finished at S/. 3.43 per dollar on December, which represented a depreciation of 2.5% compared to the previous quarter and 4.5% compared to the end of 2004. Additionally, the country risk, measured through the EMBI+, increased to 208 b.p. by year end, compared to it, historical minimum in September when it reached 134 b.p. In December, the IGBVL (the General Index of the Lima Stock Exchange) dropped 4.6% yet it accumulated a growth of 29.4% during the year 2005.
Nevertheless and despite the fact that the polls do not clearly show who the next president of Peru will be, the economic fundamentals have been the main drivers of the markets developments. Such fundamentals are: i) a strong external sector (a surplus in the current account of 1.4% of the GDP – the best result in the last 26 years – and the forecast that a slight surplus could be reached in 2006), which result in an appreciation of the Nuevo Sol and returned to levels of around S/. 3.28; ii) the country risk has dropped and is currently slightly below 150 b.p.; and iii) the IGBVL (the General Index of the Lima Stock Exchange) accumulated an improvement of 31% along the year 2006 (as of February 7), also supported by the increase in the quotations for commodities.
Competitive Environment
The fiscal year 2005 was characterized by an increase of the competitive pressure in the different business in which the Company operates, both due to the presence of other companies and to the substitution effect of other technologies like mobile telephony and voice over IP. Therefore, the strong increase in the number of users of mobile telephony has impacted the local telephone business, in the fixed-to-fixed and fixed-to-mobile traffic, while the main competitors – Telmex and Americatel – continue with their strategy of mainly focusing on the corporate business sector and entering into the sub-sector of small and medium companies.
The long distance business shows high competition with several participants both in the direct dial-up as well as the sale of prepaid cards. The strong price reductions from some competitors could not be matched by Telefónica due to the application of the tariff imputation proof by the Regulator (minimum prices in domestic long distance). This led to a drop in traffic and the resulting loss in market share. Furthermore, the competition – mainly Telmex – had a significant increase in its plant in service in the business of public telephony. Also, it is worthwhile to highlight the increasing competition from the mobile telephony in the traditional business, which is reflected negatively in the public telephony and the long distance business.
Finally, regarding the Internet access business, there has been a strong migration from the narrow band services to the broadband services, which resulted in a significant increase in the number of users during 2005. In an environment characterized by a strong growth of plant, the different players in the market (Telefónica del Perú, RCP and Terra) have focused in capturing the existing demand through commercial offers based on rendering several value added services, which allowed them to capture a larger number of users.
Operating revenues1
During the fiscal year 2005, the revenues of Telefónica del Perú were largely affected by regulatory decisions – the application of a productivity factor of 10.07%, the highest in the world, from September 01, 2004 on and the application of the tariff imputation proof in the Domestic Long Distance business – as well as a competitive environment that becomes even more complex.
The Company developed a vast management effort to offset those effects and focused in achieving an important growth in the base of clients for the main services (basic telephony lines, broadband and cable TV).
| 1 | On October 21, 2005, Telefónica del Perú S.A.A. acquired 97.86% of the capital stock of Telefónica Empresas S.A.A. Therefore, the consolidated financial statements of Telefónica del Perú S.A.A. and subsidiaries include the revenues and expenses of Telefónica Empresas S.A.A. from then on. |
4
Table of Contents
Consequently, by the end of the 12M05, the number of accesses showed an important y-o-y growth of 9.4% in fixed telephony lines, 65.7% in broadband accesses, 5.5% in public telephony lines and 18.8% in cable TV lines.
As a result of all the above, theoperating revenues have grown 1.8% during the fiscal year 2005, reaching the amount of S/. 3,520 million. Excluding the effect of Telefónica Empresas to the consolidated group, the increase in revenues is reduced to 0.6%.
Regarding the performance of the businesses, the revenues from Local Telephony – heavily affected by the productivity factor of 10.07% – reached S/. 1,275 million in the 12M05, a drop of 6.4% compared to the 12M04. Nevertheless, by the end of the year, the plant in service reached 2.2 million lines, an increase of 9.4% y-o-y, which reflects the strong effort developed by the Company to increase the penetration through prepaid or products with consumption limit that satisfy the specific needs of each market segment, as well as to retain the customers’ loyalty. During the 4Q05 operating revenues reached S/. 330 million, a drop of 3.1% when compared to 4Q04.
Long Distance revenues during the 12M05 dropped 6.8% compared to the 12M04, totaling S/. 428 million. The lower revenues from DLD (-10.9%), as a result of the lower traffic, were not offset by the higher revenues from ILD (6.1%). This market continues under pressure by a highly competitive environment, mainly in the prepaid card segment and public telephony from an informal nature, which affects the coin-based traffic. Additionally, regulatory measures like the tariff imputation proof established by Osiptel have eroded the volume of traffic with the consequent reduction in the market share of the Company. During 4Q05 revenues amounted
S/. 107 million, 4.9% lower than 4Q04. Lower revenues from DLD from lower traffic were not offset by the increase in revenues from ILD of 10.7%.
The revenues forPublic and Rural Telephony reached S/. 598 million in the 12M05, representing a 0.6% increase regarding the 12M04. The increase is mainly due to the growth of plant in service, 5.5% year-over-year, and the effort in managing the relocations, which was partially offset by the lower traffic per line due to the increasing substitution of the mobile telephony and the informal public telephony.
Cable Television revenues reached S/. 340 million in the 12M05, which represents a 9.5% increase compared to the 12M04. This growth is explained by the increase of 18.8% year-over-year in the number of lines in service, reaching more than 462 thousand by the end of 2005, as a result of the important commercial effort carried on and the execution of a program against illegal installations. Revenues of 4Q05 reached S/. 97 million, an increase of 21.4% when compared to 4Q04.
The revenues forInternetreached S/. 393 million in the 12M05, an increase of 33.1% when compared to the 12M04. This growth in chiefly explained by the year-over-year growth of the broadband plant of 65.7%, that reached 340 thousand lines through permanent commercial actions aimed to provide the customers with greater benefits. On the other hand, revenues of 4Q05 reached
S/. 112 million, an increase of 31.8% compared to 4Q05.
The revenues forBusiness Communicationsreached S/. 82 million in the 12M05, 15.8% lower than in the 12M04. This result was mainly explained by the reduction of revenues from Digired circuits in 20.0%, due to the migration to the product IP-VPN. The revenues of 4Q05 dropped by 14.3% when compared to 4QT04.
Other revenues increased 19.0%, from S/. 340 million in the 12M04 to S/. 405 million in the 12M05, mainly due to the higher interconnection revenues, which grew 15.4%, increasing from S/. 151 million in the 12M04 to S/. 174 million in the 12M05, as well as to the incorporation of the company Telefónica Empresas S.A.A. as a subsidiary from late October 2005 on.
Operating expenses
As a result of the important effort carried on for increase of customer base of the new services, the operating expenses in the 12M05 totaled S/. 2,756 million, an increase of 5.6% when compared to the 12M04, mainly due to the increase of general and administrative expenses – chiefly in maintenance and repair, Internet links related to the expansion of the ADSL plant, the rental of content for cable TV and the advertising expenses, among others, depreciation and amortization, and materials and supplies. Such increases were partially offset by the
5
Table of Contents
decrease of the management fee (in place since July 1, 2004) and the provision for doubtful accounts as a result of the higher prepaid and consumption limit plant and a better collection management. Excluding the effect of the incorporation of Telefónica Empresas to the consolidated group, the increase is diminished to 4.4%.
The operating expenses totaled S/. 715��million in the 4Q05, which represents an increase of 25.6% compared to the S/. 569 million of the 4Q04, mainly due to higher charges from general and administrative expenses, depreciation, and materials and supplies. Excluding the effect of the incorporation of Telefónica Empresas to the consolidated group, the increase is diminished to 20.4%.
Operating Result
The operating result for the 12M05 dropped 9.9% compared to the 12M04, totaling S/. 764 million. This was mainly due to the increase in operating expenses compared to the operating revenues as a result of higher expenses related to the increase of plant and new services, as well as the impact in revenues that the regulatory measures had, chiefly the productivity factor. Excluding the effect of the incorporation of Telefónica Empresas to the consolidated group, the operating result would have dropped by 11.3%.
On the other hand, the operating result for the 4Q05 fell 24.0% compared to the 4Q04, going from S/. 300 million to S/. 228 million.
Non-operating Result
In the 12M05, the non-operating result improved S/. 63 million compared to the 12M04, mainly as a result of the charges in the previous fiscal year related to the execution of the Early Retirement Program and the reduction of Other Expenses – Net, as a result of the lower provisions for contingencies recorded in the current fiscal year. Conversely, the change in the accounting policies regarding the REI (Monetary Corrections) starting from January 01, 2005 on represented a negative impact in the y-o-y comparison. Lower financial revenues and higher financial expenses as a result of the higher debt level compared to the previous year had a negative impact in the non-operating result.
By the end of the 4Q05, the non-operating result significantly improved going from a loss of S/. 301 million in 2004 to a loss of S/. 64 million in 2005, due to the same aforementioned reasons.
Net result
As a result of all the above, the net result of the 12M05 reached S/. 257 million in 2005, compared to the S/. 51 million in 2004. Even though the operating result in 2005 was lower than the one in 2004, the lower non-operating loss allowed the increase of the net result in 2005.
In the 4Q05, the net result represented a profit of S/. 106 million compared to the loss of S/. 222 million in the same period of the previous year.
Consolidated Balance Sheet
The liquidity levels of the Company – measured by the current assets over current liabilities ratio – reached 0.65 in the 4Q05, higher than the 0.49 recorded in the 3Q05, mainly as a consequence of the higher cash levels. Regarding the capacity for debt payment, the financial coverage ratio (net debt of cash and cash equivalents / operating result + depreciation and amortization) slightly increased to 1.02 in the 4Q05. In the 12M05, the total investments reached S/. 484.7 million.
6
Table of Contents
TABLE 1
TELEFONICA DEL PERU S.A.A. AND SUBSIDIARIES 1/
CONSOLIDATED INCOME STATEMENTS IN ADJUSTED SOLES (000) AS OF DECEMBER 31, 2005 2/
(Prepared In Accordance With Peruvian GAAP)
| 4Q04 | 4Q05 | Abs. Var. 4Q05-4Q04 | % Var. 4Q05-4Q04 | 12M04 | 12M05 | Var. Abs. 12M05-12M04 | Var. % 12M05-12M04 | |||||||||||||||||||||||||||||
| % | % | % | % | % | % | |||||||||||||||||||||||||||||||
Local Telephone Service | 340,195 | 39.1 | 329,540 | 35.0 | (10,655 | ) | (3.1 | ) | 1,362,499 | 39.4 | 1,274,681 | 36.2 | (87,818 | ) | (6.4 | ) | ||||||||||||||||||||
Long Distance | 112,345 | 12.9 | 106,793 | 11.3 | (5,552 | ) | (4.9 | ) | 459,046 | 13.3 | 427,621 | 12.1 | (31,425 | ) | (6.8 | ) | ||||||||||||||||||||
Public Telephones | 147,202 | 16.9 | 142,479 | 15.1 | (4,723 | ) | (3.2 | ) | 594,229 | 17.2 | 598,010 | 17.0 | 3,781 | 0.6 | ||||||||||||||||||||||
Cable TV | 79,524 | 9.1 | 96,556 | 10.2 | 17,032 | 21.4 | 310,903 | 9.0 | 340,317 | 9.7 | 29,414 | 9.5 | ||||||||||||||||||||||||
Business Communications | 24,433 | 2.8 | 20,948 | 2.2 | (3,485 | ) | (14.3 | ) | 96,922 | 2.8 | 81,631 | 2.3 | (15,291 | ) | (15.8 | ) | ||||||||||||||||||||
Internet | 84,669 | 9.7 | 111,564 | 11.8 | 26,895 | 31.8 | 295,448 | 8.5 | 393,108 | 11.2 | 97,660 | 33.1 | ||||||||||||||||||||||||
Other | 80,786 | 9.3 | 134,913 | 14.3 | 54,127 | 67.0 | 340,248 | 9.8 | 404,999 | 11.5 | 64,751 | 19.0 | ||||||||||||||||||||||||
| Total Operating Revenues | 869,154 | 100.0 | 942,793 | 100.0 | 73,639 | 8.5 | 3,459,295 | 100.0 | 3,520,367 | 100.0 | 61,072 | 1.8 | ||||||||||||||||||||||||
Personnel | 97,827 | 11.3 | 107,264 | 11.4 | 9,437 | 9.6 | 383,739 | 11.1 | 392,947 | 11.2 | 9,208 | 2.4 | ||||||||||||||||||||||||
General and Administrative | 219,243 | 25.2 | 269,771 | 28.6 | 50,528 | 23.0 | 957,824 | 27.7 | 1,052,802 | 29.9 | 94,978 | 9.9 | ||||||||||||||||||||||||
Depreciation | 268,260 | 30.9 | 294,240 | 31.2 | 25,980 | 9.7 | 1,020,765 | 29.5 | 1,157,157 | 32.9 | 136,392 | 13.4 | ||||||||||||||||||||||||
Technology Transfer and Management Fees | — | — | 15,112 | 1.6 | 15,112 | — | 157,843 | 4.6 | 45,336 | 1.3 | (112,507 | ) | (71.3 | ) | ||||||||||||||||||||||
Materials and Supplies | 20,760 | 2.4 | 38,938 | 4.1 | 18,178 | 87.6 | 69,692 | 2.0 | 96,065 | 2.7 | 26,373 | 37.8 | ||||||||||||||||||||||||
Provisions | (27,558 | ) | (3.2 | ) | (8,213 | ) | (0.9 | ) | 19,345 | (70.2 | ) | 58,845 | 1.7 | 38,899 | 1.1 | (19,946 | ) | (33.9 | ) | |||||||||||||||||
Own Work Capitalized | (9,537 | ) | (1.1 | ) | (2,343 | ) | (0.2 | ) | 7,194 | (75.4 | ) | (38,293 | ) | (1.1 | ) | (27,286 | ) | (0.8 | ) | 11,007 | (28.7 | ) | ||||||||||||||
Total Operating Costs and Expenses | 568,995 | 65.5 | 714,769 | 75.8 | 145,774 | 25.6 | 2,610,415 | 75.5 | 2,755,920 | 78.3 | 145,505 | 5.6 | ||||||||||||||||||||||||
| Operating Income | 300,159 | 34.5 | 228,024 | 24.2 | (72,135 | ) | (24.0 | ) | 848,880 | 24.5 | 764,447 | 21.7 | (84,433 | ) | (9.9 | ) | ||||||||||||||||||||
Other Income (Expenses) | ||||||||||||||||||||||||||||||||||||
Interest Income | 33,087 | 3.8 | 38,163 | 4.0 | 5,076 | 15.3 | 99,515 | 2.9 | 71,657 | 2.0 | (27,858 | ) | (28.0 | ) | ||||||||||||||||||||||
Interest Expenses | (52,344 | ) | (6.0 | ) | (75,243 | ) | (8.0 | ) | (22,899 | ) | 43.7 | (190,447 | ) | (5.5 | ) | (203,098 | ) | (5.8 | ) | (12,651 | ) | 6.6 | ||||||||||||||
Others Net | (252,942 | ) | (29.1 | ) | (26,609 | ) | (2.8 | ) | 226,333 | (89.5 | ) | (298,848 | ) | (8.6 | ) | (124,127 | ) | (3.5 | ) | 174,721 | (58.5 | ) | ||||||||||||||
Inflation Gain (Loss) | (28,466 | ) | (3.3 | ) | — | — | 28,466 | (100.0 | ) | 71,035 | 2.1 | — | — | (71,035 | ) | (100.0 | ) | |||||||||||||||||||
Total Other Income (Expenses) | (300,665 | ) | (34.6 | ) | (63,689 | ) | (6.8 | ) | 236,976 | (78.8 | ) | (318,745 | ) | (9.2 | ) | (255,568 | ) | (7.3 | ) | 63,177 | (19.8 | ) | ||||||||||||||
Income Before Taxes and Participations | (506 | ) | (0.1 | ) | 164,335 | 17.4 | 164,841 | (32,577.3 | ) | 530,135 | 15.3 | 508,879 | 14.5 | (21,256 | ) | (4.0 | ) | |||||||||||||||||||
Workers’ Participation | (59,071 | ) | (6.8 | ) | (16,075 | ) | (1.7 | ) | 42,996 | (72.8 | ) | (128,309 | ) | (3.7 | ) | (67,762 | ) | (1.9 | ) | 60,547 | (47.2 | ) | ||||||||||||||
| Income Tax | (162,918 | ) | (18.7 | ) | (42,412 | ) | (4.5 | ) | 120,506 | (74.0 | ) | (350,922 | ) | (10.1 | ) | (184,549 | ) | (5.2 | ) | 166,373 | (47.4 | ) | ||||||||||||||
Net Income | (222,495 | ) | (25.6 | ) | 105,848 | 11.2 | 328,343 | (147.6 | ) | 50,904 | 1.5 | 256,568 | 7.3 | 205,664 | 404.0 | |||||||||||||||||||||
| 1/ | Starting November 2005, the financial statements of Telefónica del Perú S.A.A. and Subsidiaries consolidate results with Telefónica Empresas S.A.A. |
| 2/ | According to the disposition of the Accounting Regulation Council No. 031-2004, from January 1, 2005 on, the adjustment resulting of the effect of the inflation is no longer be applied to the financial statements for accounting purposes, thus eliminating the entry for monetary correction (REI). |
Moreover, only information for the 4Q04 and the 12M04 is adjusted by the WPI published by the Instituto Nacional de Estadística e Informática (INEI) as of December 31, 2004.
| It is worth noting that from January 1, 2005 on, the differences in foreign exchange are recorded in the financial revenues or expenses, were applicable. For comparison reasons, the differences in the foreign exchange corresponding to the 4Q04 and 12M04 have been reclassified in that entry. |
Table of Contents
TABLE 2
TELEFONICA DEL PERU S.A.A. AND SUBSIDIARIES 1/
CONSOLIDATED BALANCE SHEET IN ADJUSTED SOLES (000) AS OF DECEMBER 31, 2005 2/
(End of Period Figures)
| 4Q05 | 3Q05 | 2Q05 | 1Q05 | 4Q04 | |||||||||||
| ASSETS | |||||||||||||||
CURRENT ASSETS | |||||||||||||||
Cash and cash equivalents | 634,189 | 331,241 | 768,061 | 282,242 | 63,332 | ||||||||||
Negotiable securities | 38,327 | 52,315 | 41,823 | 44,845 | 37,325 | ||||||||||
Accounts and notes receivable - net | 698,615 | 585,709 | 591,746 | 547,770 | 569,592 | ||||||||||
Other accounts receivable | 107,202 | 93,975 | 91,969 | 249,492 | 188,230 | ||||||||||
Materials and supplies | 39,583 | 41,828 | 39,280 | 35,806 | 37,558 | ||||||||||
Prepaid taxes and expenses | 38,473 | 53,244 | 56,542 | 56,995 | 41,307 | ||||||||||
Investments | 0 | 0 | 0 | 0 | 95,205 | ||||||||||
Total current assets | 1,556,389 | 1,158,312 | 1,589,421 | 1,217,150 | 1,032,549 | ||||||||||
LONG-TERM INVESTMENTS | 10,703 | 11,678 | 10,755 | 10,035 | 9,197 | ||||||||||
DEFERRED CHARGES | 10,487 | 8,266 | 8,699 | ||||||||||||
PROPERTY, PLANT AND EQUIPMENT | 15,995,439 | 15,790,375 | 15,642,038 | 15,539,435 | 15,473,121 | ||||||||||
Accumulated depreciation | (10,675,496 | ) | (10,372,035 | ) | (10,109,099 | ) | (9,836,164 | ) | (9,579,438 | ) | |||||
| 5,319,943 | 5,418,340 | 5,532,939 | 5,703,271 | 5,893,683 | |||||||||||
Write-off Provision | (30,777 | ) | (83,085 | ) | (88,510 | ) | (79,192 | ) | (79,192 | ) | |||||
| 5,289,166 | 5,335,255 | 5,444,429 | 5,624,079 | 5,814,491 | |||||||||||
OTHER ASSETS, net | 328,891 | 213,974 | 209,744 | 203,580 | 225,141 | ||||||||||
TOTAL ASSETS | 7,195,636 | 6,727,485 | 7,263,048 | 7,054,844 | 7,081,378 | ||||||||||
| LIABILITIES AND SHAREHOLDERS’ EQUITY | |||||||||||||||
CURRENT LIABILITIES | |||||||||||||||
Overdrafts | 5,531 | 4,759 | 4,456 | 5,239 | 5,347 | ||||||||||
Accounts payable and accrued liabilities | 512,924 | 421,070 | 385,536 | 418,214 | 478,260 | ||||||||||
Other accounts payable | 1,085,463 | 1,112,183 | 987,881 | 1,043,349 | 1,051,875 | ||||||||||
Provision for severance indemnities | 5,132 | 9,749 | 4,452 | 9,912 | 4,120 | ||||||||||
Bank Loans | 241,775 | 225,625 | 304,350 | 165,000 | 201,500 | ||||||||||
Current maturities of long-term debt | 40,332 | 49,623 | 49,439 | 89,961 | 90,211 | ||||||||||
Current maturities of bonds | 392,628 | 278,100 | 163,977 | 248,977 | 398,496 | ||||||||||
Commercial Papers | 126,900 | 282,900 | 328,185 | 215,000 | 95,000 | ||||||||||
Total current liabilities | 2,410,685 | 2,384,009 | 2,228,276 | 2,195,652 | 2,324,809 | ||||||||||
LONG-TERM DEBT | 630,757 | 636,661 | 468,955 | 323,220 | 335,144 | ||||||||||
BONDS | 1,200,025 | 710,849 | 822,824 | 749,961 | 582,522 | ||||||||||
GUARANTY DEPOSITS | 83,308 | 106,929 | 105,114 | 103,780 | 102,475 | ||||||||||
DEFERRED EARNINGS | 667,357 | 785,815 | 843,857 | 935,188 | 1,009,042 | ||||||||||
OTHER ACCOUNTS PAYABLE | 460 | ||||||||||||||
SHAREHOLDERS’ EQUITY | |||||||||||||||
Capital stock | 1,924,595 | 1,924,595 | 2,355,086 | 2,355,086 | 2,355,086 | ||||||||||
Treasury Shares | -21,896 | -21,896 | -21,896 | -21,896 | -21,896 | ||||||||||
Legal reserve | 33,275 | 33,275 | 377,668 | 377,668 | 372,365 | ||||||||||
Retained earnings | 273,096 | 167,248 | 83,164 | 36,185 | 21,831 | ||||||||||
Other reserves | -6,026 | ||||||||||||||
TOTAL SHAREHOLDERS’ EQUITY | 2,203,044 | 2,103,222 | 2,794,022 | 2,747,043 | 2,727,386 | ||||||||||
TOTAL LIABILITIES AND SHAREHOLDERS’ EQUITY | 7,195,636 | 6,727,485 | 7,263,048 | 7,054,844 | 7,081,378 | ||||||||||
| 1/ | Starting October 2005, the financial statements of Telefónica del Perú S.A.A. and Subsidiaries consolidate assets and liabilities with Telefónica Empresas S.A.A. |
| 2/ | According to the disposition of the Accounting Regulation Council No. 031-2004, from January 1, 2005 on, the adjustment resulting of the effect of the inflation is no longer be applied to the financial statements for accounting purposes. Moreover, only information for the 2004 is adjusted by the WPI published by the Instituto Nacional de Estadística e Informática (INEI) as of December 31, 2004. |
Table of Contents
TABLE 3
TELEFONICA DEL PERU S.A.A. AND SUBSIDIARIES
Statistical Data, End of Period Figures
| 4Q04 | 1Q05 | 2Q05 | 3Q05 | 4Q05 | Var. Abs. 4Q05-4Q04 | 4Q05/ 4Q04 | ||||||||||
Fixed-Wire Telephone Service: Local+Long Distance | ||||||||||||||||
Lines Installed | 2,307,247 | 2,343,993 | 2,396,113 | 2,455,347 | 2,509,789 | 202,542 | 8.8 | |||||||||
Profits (losses) in Lines in Service, net | 50,462 | 48,380 | 46,115 | 49,558 | 46,470 | (3,992 | ) | (7.9 | ) | |||||||
Lines in Service Including Public Telephones (1) | 2,150,827 | 2,201,167 | 2,250,663 | 2,302,585 | 2,348,139 | 197,312 | 9.2 | |||||||||
Local Traffic - Minutes (000) (2) | 1,294,169 | 1,260,216 | 1,247,663 | 1,236,312 | 1,205,026 | (89,143 | ) | (6.9 | ) | |||||||
Long Distance - Minutes (000) (3) | 252,848 | 267,761 | 286,576 | 294,434 | 329,467 | 76,619 | 30.3 | |||||||||
Number of Employees (Telefónica del Perú and Subsidiaries) (4) | 5,179 | 5,158 | 5,280 | 5,371 | 6,163 | 984 | 19.0 | |||||||||
Number of Employees (Telefónica del Perú) | 3,153 | 3,144 | 3,170 | 3,196 | 3,449 | 296 | 9.4 | |||||||||
Lines in Service per Employee (Telefónica del Perú) | 682 | 700 | 710 | 720 | 681 | (1 | ) | (0.2 | ) | |||||||
Digitalization Rate (%) | 96.5 | 96.6 | 96.7 | 96.7 | 96.8 | 0 | 0.3 | |||||||||
Lines in Service per 100 inhabitants | 7.8 | 8.0 | 8.1 | 8.3 | 8.4 | 1 | 7.7 | |||||||||
PUBLIC TELEPHONES | ||||||||||||||||
Lines in Service (5) | 129,353 | 130,980 | 134,423 | 137,226 | 136,486 | 7,133 | 5.5 | |||||||||
BROAD BAND | ||||||||||||||||
Lines in Service (6) | 205,425 | 234,660 | 276,151 | 310,470 | 340,436 | 135,011 | 65.7 | |||||||||
CABLE TV | ||||||||||||||||
Lines in Service | 389,174 | 405,959 | 417,535 | 437,172 | 462,211 | 73,037 | 18.8 |
| (1) | Excluding Cellular Public Phones, Publifón and rurals. |
| (2) | Including billed traffic F2F (voice and internet), F2M and M2F. |
| (3) | Excluding Prepaid cards, including packed minutes plans. |
| (4) | Includes personnel of Telefónica Empresas S.A.A. starting October 2005. |
| (5) | Including Cellular and fixed public phones and Rural fixed and cellular public phones. |
| (6) | Including broad band and Cablenet. |
Table of Contents
Statement of Responsibility:
This document contains true and sufficient information on the development of Telefónica del Perú S.A.A.’s business and Subsidiaries for the fourth quarter ended December 31, 2005. The undersigned holds himself responsible for the damages that an omission of truth or insufficient information could create, within the limits of his competence, in accordance with the norms of the Código Civil.
Álvaro Badiola Guerra
Central Manager of Control
Lima, February 14, 2006
Table of Contents
SIGNATURES
Pursuant to the requirements of the Securities Exchange Act of 1934, the registrant has duly caused this report to be signed on its behalf by the undersigned, thereunto duly authorized.
| Telefónica del Perú | ||||
| Date: March 3, 2006 | By: | /s/ Julia María Morales Valentín
| ||
| Name: | Julia María Morales Valentín | |||
| Title: | General Counsel of Telefónica del Perú S.A.A. | |||