As filed with the Securities and Exchange Commission on June 19, 2006
| |
| UNITED STATES |
| SECURITIES AND EXCHANGE COMMISSION |
| Washington, D.C. 20549 |
|
|
| FORM 20-F |
| |
| o | REGISTRATION STATEMENT PURSUANT TO SECTION 12(b) OR (g) OF THE SECURITIES EXCHANGE ACT OF 1934 |
| |
| OR |
| | |
| x | ANNUAL REPORT PURSUANT TO SECTION 13 OR 15(d) OF THE SECURITIES EXCHANGE ACT OF 1934 |
| | For the fiscal year ended December 31, 2005 |
| |
| OR |
| | |
| o | TRANSITION REPORT PURSUANT TO SECTION 13 OR 15(d) OF THE SECURITIES EXCHANGE ACT OF 1934 |
| | |
| o | SHELL COMPANY REPORT PURSUANT TO SECTION 13 OR 15(d) OF THE SECURITIES EXCHANGE ACT OF 1934 |
| | |
Commission File Number: 000-28522
| |
| ASE TEST LIMITED |
| (Exact name of Registrant as specified in its charter) |
|
| |
| NOT APPLICABLE |
| (Translation of Registrant’s name into English) |
|
| |
| REPUBLIC OF SINGAPORE |
| (Jurisdiction of Incorporation or Organization) |
(Company Registration No. 199508552K
under Section 144(1A) of
the Singapore Companies Act) |
| |
10 WEST FIFTH STREET
NANTZE EXPORT PROCESSING ZONE
KAOHSIUNG, TAIWAN
REPUBLIC OF CHINA |
|
|
|
| (Address of Principal Executive Offices) |
| |
|
| Securities registered or to be registered pursuant to Section 12(b) of the Act. |
| None |
| |
| Securities registered or to be registered pursuant to Section 12(g) of the Act: |
| |
| Title of Each Class | | Name of Each Exchange on which registered |
| |
|
| Ordinary Shares | | The Nasdaq National Market* |
*Ordinary Shares are traded on the Nasdaq National Market
Securities for which there is a reporting obligation pursuant to Section 15(d) of the Act:
None
(Title of Class)
Indicate the number of outstanding shares of each of the issuer’s classes of capital or common stock as of the close of the period covered by the annual report:
100,059,031 Ordinary Shares
Indicate by check mark if the registrant is a well-known seasoned issuer, as defined in Rule 405 of the Securities Act.
Yeso Nox
If this report is an annual or transition report, indicate by check mark if the registrant is not required to file reports pursuant to Section 13 or 15(d) of the Securities Exchange Act of 1934.
Yeso Nox
Indicate by check mark whether the Registrant (1) has filed all reports required to be filed by Section 13 or 15(d) of the Securities Exchange Act of 1934 during the preceding 12 months (or for such shorter period that the Registrant was required to file such reports) and (2) has been subject to such filing requirements for the past 90 days.
Yesx No o
Indicate by check mark whether the registrant is a large accelerated filer, an accelerated filer, or a non-accelerated filer. See definition of “accelerated filer and large accelerated filer” in Rule 12b-2 of the Exchange Act. (Check one):
Large accelerated filer o Accelerated filerx Non-accelerated filero
Indicate by check mark which financial statement item the Registrant has elected to follow.
Item 17o Item 18x
If this is an annual report, indicate by check mark whether the registrant is a shell company (as defined in Rule 12b-2 of the Exchange Act).
Yeso Nox
TABLE OF CONTENTS
| | | | | | Page |
| | USE OF CERTAIN TERMS | | 1 |
| | SPECIAL NOTE REGARDING FORWARD-LOOKING STATEMENTS | | 1 |
| PART I | | | | 1 |
| | Item 1. | Identity of Directors, Senior Management and Advisers | | 1 |
| | Item 2. | Offer Statistics and Expected Timetable | | 1 |
| | Item 3. | Key Information | | 2 |
| | | | SELECTED FINANCIAL DATA | | 2 |
| | | | CAPITALIZATION AND INDEBTEDNESS | | 5 |
| | | | REASONS FOR THE OFFER AND USE OF PROCEEDS | | 5 |
| | | | RISK FACTORS | | 5 |
| | Item 4. | Information on the Company | | 15 |
| | | | HISTORY AND DEVELOPMENT OF THE COMPANY | | 15 |
| | | | BUSINESS OVERVIEW | | 16 |
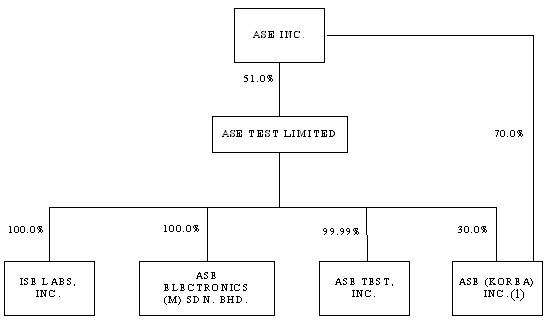
| | | | ORGANIZATIONAL STRUCTURE | | 31 |
| | | | PROPERTY, PLANTS AND EQUIPMENT | | 31 |
| | Item 4A. | Unresolved Staff Comments | | 32 |
| | Item 5. | Operating and Financial Review and Prospects | | 32 |
| | | | OPERATING RESULTS AND TREND INFORMATION | | 33 |
| | | | LIQUIDITY AND CAPITAL RESOURCES | | 51 |
| | | | RESEARCH AND DEVELOPMENT | | 54 |
| | | | OFF-BALANCE SHEET ARRANGEMENTS | | 54 |
| | | | TABULAR DISCLOSURE OF CONTRACTUAL OBLIGATIONS | | 55 |
| | Item 6. | Directors, Senior Management and Employees | | 55 |
| | | | DIRECTORS AND SENIOR MANAGEMENT | | 55 |
| | | | COMPENSATION | | 57 |
| | | | BOARD PRACTICE | | 59 |
i
| | | | EMPLOYEES | | 60 |
| | | | SHARE OWNERSHIP | | 60 |
| | Item 7. | Major Shareholders and Related Party Transactions | | 61 |
| | | | MAJOR SHAREHOLDERS | | 61 |
| | | | RELATED PARTY TRANSACTIONS | | 62 |
| | | | INTERESTS OF EXPERTS AND COUNSEL | | 63 |
| | Item 8. | Financial Information | | 63 |
| | | | CONSOLIDATED STATEMENTS AND OTHER FINANCIAL INFORMATION | | 63 |
| | | | SIGNIFICANT CHANGES | | 64 |
| | Item 9. | The Offering and Listing | | 64 |
| | | | OFFERING AND LISTING DETAILS | | 64 |
| | | | PLAN OF DISTRIBUTION | | 65 |
| | | | MARKETS | | 65 |
| | | | SELLING SHAREHOLDERS | | 65 |
| | | | DILUTION | | 65 |
| | | | EXPENSES OF THE ISSUE | | 65 |
| | Item 10. | Additional Information | | 65 |
| | | | SHARE CAPITAL | | 65 |
| | | | MEMORANDUM AND ARTICLES OF ASSOCIATION | | 66 |
| | | | MATERIAL CONTRACTS | | 70 |
| | | | EXCHANGE CONTROLS | | 70 |
| | | | TAXATION | | 70 |
| | | | DIVIDENDS AND PAYING AGENTS | | 73 |
| | | | STATEMENT BY EXPERTS | | 73 |
| | | | DOCUMENTS ON DISPLAY | | 73 |
| | | | SUBSIDIARY INFORMATION | | 73 |
| | Item 11. | Quantitative and Qualitative Disclosures About Market Risk | | 73 |
| | Item 12. | Description of Securities Other Than Equity Securities | | 74 |
| PART II | | 74 |
| | Item 13. | Defaults, Dividend Arrearages and Delinquencies | | 74 |
| | Item 14. | Material Modifications to the Rights of Security Holders and Use of Proceeds | | 74 |
| | Item 15. | Controls and Procedures | | 75 |
| | Item 16. | [Reserved] | | 75 |
| | Item 16A. | Audit Committee Financial Expert | | 75 |
| | Item 16B. | Code of Ethics | | 75 |
| | Item 16C. | Principal Accountant Fees and Services | | 75 |
| | Item 16D. | Exemptions from the Listing Standards of Audit Committees | | 76 |
| | Item 16E. | Purchases of Equity Securities by the Issuer and Affiliated Purchasers | | 76 |
| PART III | | 76 |
| | Item 17. | Financial Statements | | 76 |
| | Item 18. | Financial Statements | | 76 |
| | Item 19. | Exhibits | | 76 |
ii
USE OF CERTAIN TERMS
All references herein to (i) “ASE Test,” the “Company,” “we,” “us” or “our” are to ASE Test Limited and, unless the context requires otherwise, its subsidiaries, (ii) “ASE Group” are to Advanced Semiconductor Engineering, Inc. (“ASE Inc.”) and its subsidiaries and affiliates, (iii) “ASE Test Taiwan” are to ASE Test, Inc., a company incorporated under the laws of the Republic of China (“ROC”), (iv) “ASE Test Malaysia” are to ASE Electronics (M) Sdn. Bhd., a company incorporated under the laws of Malaysia, (v) “ISE Labs” are to ISE Labs, Inc., a corporation incorporated under the laws of the State of California, U.S.A., (vi) “ASE Chung Li” are to ASE (Chung Li) Inc., a company previously incorporated under the laws of the ROC that merged into ASE Inc. on August 1, 2004, (vii) “ASE Korea” are to ASE (Korea) Inc., a company incorporated under the laws of the Republic of Korea (“South Korea”), (viii) “ASE Material” are to ASE Material Inc., a company previously incorporated under the laws of the ROC that merged into ASE Inc. on August 1, 2004, (ix) “U.S. dollars”, “US$” or “$” are to the currency of the United States, (x) “NT dollars” or “NT$” are to the currency of the ROC, (xi) “RM” are to the currency of Malaysia, (xii) “S$” are to the currency of Singapore, (xiii) “JP¥” are to the currency of Japan, (xiv) “EUR” are to the currency of the European Union and (xv) “SEC” are to the U.S. Securities and Exchange Commission. On June 12, 2006, the noon buying rate in The City of New York for cable transfers in NT dollars per U.S. dollar as certified for customs purposes by the Federal Reserve Bank of New York was NT$32.54 = US$1.00.
SPECIAL NOTE REGARDING FORWARD-LOOKING STATEMENTS
This annual report on Form 20-F contains “forward-looking statements” within the meaning of Section 27A of the Securities Act of 1933, as amended, and Section 21E of the Securities Exchange Act of 1934, as amended, or the Exchange Act, including statements regarding our future results of operations and business prospects. Although these forward-looking statements, which may include statements regarding our future results of operations, financial condition or business prospects, are based on our own information and information from other sources we believe to be reliable, you should not place undue reliance on these forward-looking statements, which apply only as of the date of this annual report. We were not involved in the preparation of these projections. The words “anticipate”, “believe”, “estimate”, “expect”, “intend”, “plan” and similar expressions, as they relate to us, are intended to identify these forward-looking statements in this annual report. Our actual results of operations, financial condition or business prospects may differ materially from those expressed or implied in these forward-looking statements for a variety of reasons, including risks associated with cyclicality and market conditions in the semiconductor industry; demand for the outsourced semiconductor testing and packaging services we offer and for such outsourced services generally; the highly competitive semiconductor industry; our ability to introduce new testing technologies in order to remain competitive; our ability to maintain a high capacity utilization rate relative to our fixed costs; international business activities; our business strategy; our future expansion plans and capital expenditures; the strained relationship between the ROC and the People’s Republic of China, or the PRC; general economic and political conditions; possible disruptions in commercial activities caused by natural and human-induced disasters; fluctuations in foreign currency exchange rates; and other factors. For a discussion of these risks and other factors, please see “Item 3. Key Information––Risk Factors”.
PART I
Item 1. Identity of Directors, Senior Management and Advisers.
Not applicable.
Item 2. Offer Statistics and Expected Timetable.
Not applicable.
1
Item 3. Key Information.
SELECTED FINANCIAL DATA
The selected consolidated income statement data and cash flow data for the years ended December 31, 2003, 2004 and 2005 and the selected consolidated balance sheet data as of December 31, 2004 and 2005 set forth below are derived from our audited consolidated financial statements included in this annual report and should be read in conjunction with, and are qualified in their entirety by reference to, these consolidated financial statements. The selected consolidated income statement data and cash flow data for the years ended December 31, 2001 and 2002 and the selected consolidated balance sheet data as of December 31, 2001, 2002 and 2003 set forth below are derived from our audited consolidated financial statements not included in this annual report. Our consolidated financial statements have been prepared and presented in accordance with accounting principles generally accepted in the ROC (“ROC GAAP”), which differ in certain material respects from accounting principles generally accepted in the United States (“U.S. GAAP”). See note 26 to our consolidated financial statements for a description of the significant differences between ROC GAAP and U.S. GAAP for the periods covered by these consolidated financial statements. In October 2005, we disposed of our camera module assembly operations in Malaysia. Information in this annual report from our consolidated statements of income for the years ended December 31, 2003, 2004 and 2005 has been adjusted to reflect the reclassification of our camera module assembly operations as discontinued operations. Information from our consolidated statements of cash flows has not been adjusted. Because we commenced our camera module assembly operations in 2003, no reclassification for periods prior to 2003 is required. See “Item 5. Operating and Financial Review and Prospects – Operating Results and Trend Information – Discontinued Operations”.
2
| | | Year Ended and as of December 31, |
| |
|
| | | | 2001 | | | | 2002 | | | | 2003 | | | | 2004 | | | | 2005 | |
| |
|
|
| |
|
|
| |
|
|
| |
|
|
| |
|
|
|
| | | (in thousands, except shares, per share data, operating data and percentages) |
| Consolidated Statement of Income Data: | | | | | | | | | | | | | | | | | | | | |
| ROC GAAP: | | | | | | | | | | | | | | | | | | | | |
| Net revenues | | $ | 298,466 | | | $ | 301,962 | | | $ | 345,660 | | | $ | 427,763 | | | $ | 420,929 | |
| Cost of revenues | | | 265,271 | | | | 280,573 | | | | 283,135 | | | | 340,663 | | | | 330,786 | |
| |
|
|
| |
|
|
| |
|
|
| |
|
|
| |
|
|
|
| Gross profit | | | 33,195 | | | | 21,389 | | | | 62,525 | | | | 87,100 | | | | 90,143 | |
| Operating expenses: | | | | | | | | | | | | | | | | | | | | |
| Selling, general and administrative(1) | | | 35,335 | | | | 33,582 | | | | 37,502 | | | | 43,762 | | | | 46,160 | |
| Research and development | | | 14,397 | | | | 18,342 | | | | 19,513 | | | | 23,223 | | | | 24,993 | |
| Goodwill amortization(2) | | | 7,530 | | | | 10,105 | | | | 10,105 | | | | 10,105 | | | | 4,966 | |
| |
|
|
| |
|
|
| |
|
|
| |
|
|
| |
|
|
|
| Income (loss) from operations | | | (24,067 | ) | | | (40,640 | ) | | | (4,595 | ) | | | 10,010 | | | | 14,024 | |
| Non-operating income (expense): | | | | | | | | | | | | | | | | | | | | |
| Interest—net | | | (13,783 | ) | | | (14,396 | ) | | | (12,614 | ) | | | (6,187 | ) | | | (11,146 | ) |
| Investment income (loss) under equity | | | | | | | | | | | | | | | | | | | | |
| method—net(3) | | | (7,344 | ) | | | (1,496 | ) | | | 4,259 | | | | 9,844 | | | | 6,637 | |
| Impairment of long-lived assets(4) | | | — | | | | (35,321 | ) | | | — | | | | — | | | | — | |
| Impairment of goodwill | | | — | | | | — | | | | — | | | | (26,500 | ) | | | — | |
| Foreign exchange gain (loss)—net | | | 2,382 | | | | (1,169 | ) | | | (795 | ) | | | 175 | | | | 1,388 | |
| Loss on fire damage | | | — | | | | — | | | | — | | | | — | | | | (51,224 | ) |
| Other—net | | | 1,048 | | | | 1,511 | | | | 674 | | | | (380 | ) | | | (3,465 | ) |
| |
|
|
| |
|
|
| |
|
|
| |
|
|
| |
|
|
|
| Loss from continuing operations before | | | | | | | | | | | | | | | | | | | | |
| income tax and minority interest and | | | | | | | | | | | | | | | | | | | | |
| extraordinary loss | | | (41,764 | ) | | | (91,511 | ) | | | (13,071 | ) | | | (13,038 | ) | | | (43,786 | ) |
| Income tax benefit (expense) | | | (6,522 | ) | | | 10,243 | | | | 6,009 | | | | 21,209 | | | | (2,537 | ) |
| Discontinued operations(5) | | | — | | | | — | | | | 5,750 | | | | 16,968 | | | | 10,839 | |
| Extraordinary loss | | | — | | | | — | | | | (2,203 | ) | | | — | | | | — | |
| Minority interest | | | 2,527 | | | | — | | | | — | | | | — | | | | — | |
| |
|
|
| |
|
|
| |
|
|
| |
|
|
| |
|
|
|
| Net income (loss) | | $ | (45,759 | ) | | $ | (81,268 | ) | | $ | (3,515 | ) | | $ | 25,139 | | | $ | (35,484 | ) |
| |
|
|
| |
|
|
| |
|
|
| |
|
|
| |
|
|
|
| Earnings (loss) per share: | | | | | | | | | | | | | | | | | | | | |
| Basic | | $ | (0.48 | ) | | $ | (0.82 | ) | | $ | (0.04 | ) | | $ | 0.25 | | | $ | (0.35 | ) |
| Diluted | | $ | (0.48 | ) | | $ | (0.82 | ) | | $ | (0.04 | ) | | $ | 0.25 | | | $ | (0.35 | ) |
| Income (loss) from operations per share | | $ | (0.25 | ) | | $ | (0.41 | ) | | $ | (0.05 | ) | | $ | 0.10 | | | $ | 0.14 | |
| Income (loss) from continuing operations | | $ | (48,286 | ) | | $ | (81,268 | ) | | $ | (7,062 | ) | | $ | 8,171 | | | $ | (46,323 | ) |
| Income (loss) from continuing operations | | | | | | | | | | | | | | | | | | | | |
| per share | | $ | (0.51 | ) | | $ | (0.82 | ) | | $ | (0.08 | ) | | $ | 0.08 | | | $ | (0.46 | ) |
| Shares used in earnings per share | | | | | | | | | | | | | | | | | | | | |
| calculation: | | | | | | | | | | | | | | | | | | | | |
| Basic | | | 94,921,412 | | | | 98,600,205 | | | | 99,110,225 | | | | 100,037,524 | | | | 100,059,031 | |
| Diluted | | | 94,921,412 | | | | 98,600,205 | | | | 99,110,225 | | | | 100,111,113 | | | | 100,059,031 | |
| U.S. GAAP: | | | | | | | | | | | | | | | | | | | | |
| Net revenues | | $ | 298,466 | | | $ | 301,962 | | | $ | 345,660 | | | $ | 427,763 | | | $ | 420,929 | |
| Cost of revenues | | | 264,264 | | | | 281,006 | | | | 290,020 | | | | 342,394 | | | | 335,155 | |
| |
|
|
| |
|
|
| |
|
|
| |
|
|
| |
|
|
|
| Gross profit | | | 34,202 | | | | 20,956 | | | | 55,640 | | | | 85,369 | | | | 85,774 | |
| Operating expenses(6) | | | 82,819 | | | | 87,238 | | | | 61,722 | | | | 109,456 | | | | 71,917 | |
| |
|
|
| |
|
|
| |
|
|
| |
|
|
| |
|
|
|
| Income (loss) from operations | | | (48,617 | ) | | | (66,282 | ) | | | (6,082 | ) | | | (24,087 | ) | | | 13,857 | |
| Non-operating income (expense) | | | (20,316 | ) | | | (17,286 | ) | | | (9,168 | ) | | | 3,800 | | | | (57,605 | ) |
| |
|
|
| |
|
|
| |
|
|
| |
|
|
| |
|
|
|
| Loss from continuing operations before | | | | | | | | | | | | | | | | | | | | |
| income taxes and minority interest | | | (68,933 | ) | | | (83,568 | ) | | | (15,250 | ) | | | (20,287 | ) | | | (43,748 | ) |
| Income tax benefit (expense) | | | (6,522 | ) | | | 10,243 | | | | 6,009 | | | | 21,209 | | | | (2,537 | ) |
| Discontinued operations(5) | | | — | | | | — | | | | 5,750 | | | | 16,968 | | | | 10,839 | |
| Minority interest | | | 2,527 | | | | — | | | | — | | | | –– | | | | –– | |
| |
|
|
| |
|
|
| |
|
|
| |
|
|
| |
|
|
|
| Net income (loss) | | $ | (72,928 | ) | | $ | (73,325 | ) | | $ | (3,491 | ) | | $ | 17,890 | | | $ | (35,446 | ) |
| |
|
|
| |
|
|
| |
|
|
| |
|
|
| |
|
|
|
| Earnings (loss) per share: | | | | | | | | | | | | | | | | | | | | |
| Basic | | $ | (0.77 | ) | | $ | (0.74 | ) | | $ | (0.04 | ) | | $ | 0.18 | | | $ | (0.35 | ) |
| Diluted | | $ | (0.77 | ) | | $ | (0.74 | ) | | $ | (0.04 | ) | | $ | 0.18 | | | $ | (0.35 | ) |
3
| | | Year Ended and as of December 31, |
| |
|
| | | | 2001 | | | | 2002 | | | | 2003 | | | | 2004 | | | | 2005 | |
| |
|
|
| |
|
|
| |
|
|
| |
|
|
| |
|
|
|
| | | (in thousands, except shares, per share data, operating data and percentages) |
| Shares used in earnings per share | | | | | | | | | | | | | | | | | | | | |
| calculation: | | | | | | | | | | | | | | | | | | | | |
| Basic | | | 94,921,412 | | | | 98,600,205 | | | | 99,110,225 | | | | 100,037,524 | | | | 100,059,031 | |
| Diluted | | | 94,921,412 | | | | 98,600,205 | | | | 99,110,225 | | | | 100,111,113 | | | | 100,059,031 | |
| | | | | | | | | | | | | | | | | | | | | |
| Consolidated Balance Sheet Data: | | | | | | | | | | | | | | | | | | | | |
| ROC GAAP: | | | | | | | | | | | | | | | | | | | | |
| Current assets | | $ | 217,962 | | | $ | 203,124 | | | $ | 209,683 | | | $ | 227,026 | | | $ | 285,487 | |
| Long-term investments | | | 95,042 | | | | 93,702 | | | | 104,021 | | | | 133,699 | | | | 140,225 | |
| Property, plant and equipment | | | 585,265 | | | | 529,958 | | | | 570,580 | | | | 634,796 | | | | 430,079 | |
| Total assets | | | 959,406 | | | | 926,499 | | | | 978,047 | | | | 1,083,109 | | | | 940,339 | |
| Current liabilities | | | 90,157 | | | | 138,690 | | | | 176,880 | | | | 201,884 | | | | 128,219 | |
| Long-term debts | | | 248,371 | | | | 244,271 | | | | 248,028 | | | | 273,020 | | | | 245,303 | |
| Total liabilities | | | 340,679 | | | | 387,560 | | | | 432,060 | | | | 483,518 | | | | 382,134 | |
| Capital stock | | | 24,162 | | | | 24,767 | | | | 24,887 | | | | 25,015 | | | | 25,015 | |
| Cash dividend on ordinary shares | | | — | | | | — | | | | — | | | | — | | | | — | |
| Shareholders’ equity | | | 597,523 | | | | 538,939 | | | | 545,987 | | | | 599,591 | | | | 558,205 | |
| | | | | | | | | | | | | | | | | | | | | |
| U.S. GAAP: | | | | | | | | | | | | | | | | | | | | |
| Current assets | | $ | 217,962 | | | $ | 203,124 | | | $ | 209,683 | | | $ | 227,026 | | | $ | 285,487 | |
| Long-term investments | | | 95,042 | | | | 94,050 | | | | 104,717 | | | | 53,381 | | | | 60,366 | |
| Property, plant and equipment | | | 584,101 | | | | 528,363 | | | | 568,552 | | | | 632,289 | | | | 427,005 | |
| Total assets | | | 958,242 | | | | 935,357 | | | | 996,762 | | | | 1,015,599 | | | | 877,687 | |
| Current liabilities | | | 90,157 | | | | 138,690 | | | | 179,083 | | | | 206,660 | | | | 128,228 | |
| Long-term debts | | | 248,371 | | | | 244,271 | | | | 248,028 | | | | 273,020 | | | | 245,303 | |
| Total liabilities and minority interest | | | 361,990 | | | | 387,660 | | | | 434,263 | | | | 488,389 | | | | 382,231 | |
| Shareholders’ equity | | | 596,252 | | | | 547,697 | | | | 562,499 | | | | 527,210 | | | | 495,456 | |
| | | | | | | | | | | | | | | | | | | | | |
| Consolidated Statement of Cash Flow | | | | | | | | | | | | | | | | | | | | |
| Data(5): | | | | | | | | | | | | | | | | | | | | |
| ROC GAAP: | | | | | | | | | | | | | | | | | | | | |
| Depreciation and amortization | | $ | 144,860 | | | $ | 154,251 | | | $ | 142,377 | | | $ | 164,908 | | | $ | 154,302 | |
| Acquisition of property, plant and | | | | | | | | | | | | | | | | | | | 47,875 | |
| equipment | | | 104,216 | | | | 126,009 | | | | 171,271 | | | | 210,656 | | | | | |
| Net cash provided by operating activities | | | 147,020 | | | | 103,900 | | | | 134,665 | | | | 153,712 | | | | 170,064 | |
| Net cash provided by (used in) investing | | | | | | | | | | | | | | | | | | | | |
| activities | | | (183,460 | ) | | | (131,547 | ) | | | (156,585 | ) | | | (253,621 | ) | | | 13,779 | |
| Net cash provided by (used in) financing | | | | | | | | | | | | | | | | | | | | |
| activities | | | (13,575 | ) | | | 38,711 | | | | (24,041 | ) | | | 69,375 | | | | (84,447 | ) |
| Net cash inflow (outflow) | | | (51,080 | ) | | | 12,763 | | | | (47,879 | ) | | | (31,460 | ) | | | 98,722 | |
| | | | | | | | | | | | | | | | | | | | | |
| Segment Net Revenues(5): | | | | | | | | | | | | | | | | | | | | |
| Testing | | $ | 223,193 | | | $ | 214,331 | | | $ | 257,490 | | | $ | 343,116 | | | $ | 346,639 | |
| Packaging | | | 75,273 | | | | 87,631 | | | | 88,170 | | | | 84,647 | | | | 74,290 | |
| | | | | | | | | | | | | | | | | | | | | |
| Percentage of Net Revenues(5): | | | | | | | | | | | | | | | | | | | | |
| Testing | | | 74.8 | % | | | 71.0 | % | | | 74.5 | % | | | 80.2 | % | | | 82.4 | % |
| Packaging | | | 25.2 | % | | | 29.0 | % | | | 25.5 | % | | | 19.8 | % | | | 17.6 | % |
| | | | | | | | | | | | | | | | | | | | | |
| Operating Data: | | | | | | | | | | | | | | | | | | | | |
| Gross margin | | | 11.1 | % | | | 7.1 | % | | | 18.1 | % | | | 20.4 | % | | | 21.4 | % |
| Operating margin | | | (8.1 | )% | | | (13.5 | )% | | | (1.3 | )% | | | 2.4 | % | | | 3.3 | % |
| ROC GAAP net margin | | | (15.3 | )% | | | (26.9 | )% | | | (1.0 | )% | | | 5.9 | % | | | (8.4 | )% |
| U.S. GAAP net margin | | | (24.4 | )% | | | (24.3 | )% | | | (1.0 | )% | | | 4.2 | % | | | (8.4 | )% |
|
| (1) | Includes selling expenses and general and administrative expenses, but excludes goodwill amortization. |
| |
| (2) | Included in general and administrative expenses in our consolidated financial statements. See “Item 5. Operating and Financial Review and Prospects—Operating Results and Trend Information—Critical Accounting Policies—Goodwill”. |
| |
| (3) | Includes investment income (loss) from ASE Chung Li; ASE Korea, a wholly owned subsidiary of ASE Investment (Labuan), of which we hold 30.0%; and ASE Material. |
| |
| (4) | This impairment loss related to long-lived assets of $35.3 million has been reclassified from operating expense to non-operating income (expense) to conform to the current year presentation. See “Item 5. Operating and Financial Review and Prospects—Operating Results and Trend Information—Critical Accounting Policies—Valuation of Long-Lived Assets”. |
| | |
| (5) | Includes income from discontinued operations of $3.9 million and gain on disposal of discontinued operations of $6.9 million in 2005, both of which are net of income tax expense. In October 2005, we disposed of our camera module assembly operations in Malaysia. Such operations were formerly classified as part of our packaging operations. Information in this annual report from our consolidated statements of income for the years ended December 31, 2003, 2004 and 2005 has been adjusted to reflect the reclassification of our camera module assembly operations as discontinued operations. Information from our consolidated statements of cash flows has not been adjusted. Because we commenced our camera module assembly operations in 2003, no reclassification for periods prior to 2003 is required. See “Item 5. Operating and Financial Review and Prospects – Operating Results and Trend Information – Discontinued Operations”. |
| |
| (6) | Includes impairment of goodwill. See “Item 5. Operating and Financial Review and Prospects—Operating Results and Trend Information—Critical Accounting Policies—Goodwill”. |
| |
4
CAPITALIZATION AND INDEBTEDNESS
Not applicable.
REASONS FOR THE OFFER AND USE OF PROCEEDS
Not applicable.
RISK FACTORS
Risks Relating to Our Business
Since we are dependent on the highly cyclical semiconductor industry and conditions in the markets for the end-use applications of our products, our revenues and net income may fluctuate significantly.
Our semiconductor testing and packaging business is affected by market conditions in the highly cyclical semiconductor industry. All of our customers operate in this industry, and variations in order levels from our customers and service fee rates may result in volatility in our revenues and net income. From time to time, the semiconductor industry has experienced significant, and sometimes prolonged, downturns. As our business is, and will continue to be, dependent on the requirements of semiconductor companies for independent testing and packaging services, any future downturn in the semiconductor industry would reduce demand for our services. For example, in the fourth quarter of 2000, a worldwide downturn resulted in a significant deterioration in the average selling prices of, as well as demand for, our services in 2001 and significantly and adversely affected our operating results in 2001. Although the modest recovery in the semiconductor industry, evident in 2002 and 2003, strengthened in 2004 and 2005, we expect market conditions to continue to exert downward pressure on the average selling prices for our testing and packaging services. If we cannot reduce our costs to sufficiently offset any decline in average selling prices, our profitability will suffer and we may incur losses.
Market conditions in the semiconductor industry depend to a large degree on conditions in the markets for the end-use applications of semiconductor products, such as communications, personal computer and consumer electronic products. In 2005, 2004 and 2003, the substantial majority of our sales was attributable to the testing and packaging of semiconductors used in communications, personal computer and consumer electronic products. These industries are subject to intense competition and significant shifts in demand which could put pricing pressure on our testing and packaging services and adversely affect our revenues and net income.
A reversal or slowdown in the outsourcing trend for semiconductor testing and packaging services could adversely affect our growth prospects and profitability.
In recent years, semiconductor manufacturers that have their own in-house testing and packaging capabilities, known as integrated device manufacturers, have increasingly outsourced stages of the semiconductor production process, including testing and packaging, to independent companies in order to reduce costs and shorten production cycles. In addition, the availability of advanced independent semiconductor manufacturing services has also enabled the growth of so-called “fabless” semiconductor companies that focus exclusively on design and marketing and outsource their manufacturing, testing and packaging requirements to independent companies. We cannot assure you that these integrated device manufacturers and fabless semiconductor companies will continue to outsource their testing and packaging requirements to third parties like us. A reversal of, or a slowdown in, this outsourcing trend could result in reduced demand for our services and adversely affect our growth prospects and profitability.
If we are unable to compete favorably in the highly competitive semiconductor testing and packaging markets, our revenues and net income may decrease.
The semiconductor testing and packaging markets are very competitive. We face competition from a number of sources, including other independent semiconductor testing and packaging companies, especially those that offer turnkey testing and packaging services. We believe that the principal competitive factors in the testing and packaging market are:
- the ability to provide total solutions to our customers;
- technological expertise;
5
- the range of testing platforms and package types available;
- software conversion program capability;
- the ability to work closely with customers at the product development stage;
- responsiveness and flexibility;
- production cycle time;
- capacity;
- production yield; and
- price.
We face increasing competition from other testing and packaging companies, as most of our customers obtain testing or packaging services from more than one source. In addition, some of our competitors may have access to more advanced technologies and greater financial and other resources than we do. Many of our competitors have shown a willingness to quickly and sharply reduce prices, as they did in 2001, in order to maintain capacity utilization in their facilities during periods of reduced demand. Although prices have stabilized, any renewed erosion in the prices for our testing and packaging services could cause our revenues and net income to decrease and have a material adverse effect on our financial condition and results of operations.
The complexity of the semiconductor testing and packaging process increases the costs and production risks of our business.
Semiconductor testing and packaging involve significant technological and process expertise. In order to improve capacity utilization and efficiencies in our testing operations, we maintain advanced and expensive equipment and develop software conversion programs which enable us to test semiconductors utilizing different testing platforms. If we fail to successfully develop software conversion programs or if we are unable to effectively reduce the lead time necessary to interface our customers’ semiconductors with our testing equipment, our operational efficiency could suffer. In addition, our testing and packaging operations take place in clean rooms where air purity, temperature and humidity are controlled. If we are unable to effectively control our testing and packaging environment, some semiconductors could be damaged. Although we believe our operational efficiency has generally improved in recent years, we have from time to time experienced, and may in the future experience, production interruptions due to technical problems or operator errors in our testing and packaging processes. Any interruption in our operations could have a material adverse effect on our business.
Our profitability depends on our ability to respond to rapid technological changes in the semiconductor industry.
The semiconductor industry is characterized by rapid increases in the diversity and complexity of semiconductors. As a result, we expect that we will need to constantly offer more sophisticated testing and packaging technologies and processes in order to respond to competitive industry conditions and customer requirements. If we fail to develop, or obtain access to, advances in testing or packaging technologies or processes, we may become less competitive and less profitable. In addition, advances in technology typically lead to declining average selling prices for semiconductors tested or packaged with older technologies or processes. As a result, if we cannot reduce the costs associated with our testing or packaging services, the profitability of a given service and our overall profitability may decrease over time.
Our operating results are subject to significant fluctuations, which could adversely affect the market value of your investment.
Our operating results have varied significantly from period to period and may continue to vary in the future. Downward fluctuations in our operating results may result in decreases in the market price of our shares. Among the more important factors affecting our quarterly and annual operating results are the following:
6
- changes in general economic and business conditions, particularly given the cyclical nature of thesemiconductor industry and the markets served by our customers;
- our ability to quickly adjust to unanticipated declines or shortfalls in demand and market prices for ourtesting and packaging services, due to our high percentage of fixed costs;
- timing of capital expenditures in anticipation of future orders;
- changes in prices for our testing and packaging services;
- volume of orders relative to our testing and packaging capacity;
- our ability to obtain adequate testing and packaging equipment on a timely basis;
- changes in costs and availability of raw materials, equipment and labor; and
- earthquakes, drought, epidemics and other natural disasters, as well as industrial and other incidents such asfires and power outages.
Due to the factors listed above, our future operating results or growth rates may be below the expectations of research analysts and investors. If so, the market price of our shares, and thus the market value of your investment, may fall.
Due to our high percentage of fixed costs, we will be unable to maintain our gross margin at past levels if we are unable to achieve relatively high capacity utilization rates.
Our operations, in particular our testing operations, are characterized by relatively high fixed costs. We expect to continue to incur substantial depreciation and other expenses in connection with previous acquisitions of testing and packaging equipment and facilities. Our profitability depends not only on pricing levels for our services, but also on utilization rates for our testing and packaging equipment, commonly referred to as “capacity utilization rates”. In particular, increases or decreases in our capacity utilization rates can significantly affect gross margins since the unit cost of testing and packaging services generally decreases as fixed costs are allocated over a larger number of units. In periods of low demand, we experience relatively low capacity utilization rates in our operations, which leads to reduced margins. During 2001, we experienced lower than anticipated utilization rates in our operations due to a significant decline in worldwide demand for our testing and packaging services, which resulted in reduced margins during that period.Although our capacity utilization rates have improved,we cannot assure you that we will be able to maintain or surpass our past gross margin levels if we cannot consistently achieve or maintain relatively high capacity utilization rates.
Because of the highly cyclical nature of our industry, our capital requirements are difficult to plan. If we cannot obtain additional capital when we need it, our growth prospects and future profitability may be adversely affected.
Our capital requirements are difficult to plan in our highly cyclical and rapidly changing industry. We will need capital to fund the expansion of our facilities as well as fund our research and development activities in order to remain competitive. We believe that our existing cash and cash equivalents, short-term investments, expected cash flow from operations and existing credit lines will be sufficient to meet our capital expenditures, working capital, cash obligations under our existing debt and lease arrangements, and other requirements at least through the end of 2006.However, future capacity expansions or market or other developments may cause us to require additional funds. Our ability to obtain external financing in the future is subject to a variety of uncertainties, including:
- our future financial condition, results of operations and cash flows;
- general market conditions for financing activities by semiconductor companies; and
- economic, political and other conditions in Taiwan and elsewhere.
7
If we are unable to obtain funding in a timely manner or on acceptable terms, our growth prospects and future profitability may decline.
Restrictive covenants and broad default provisions in our existing debt agreements may materially restrict our operations as well as adversely affect our liquidity, financial condition and results of operations.
We are a party to numerous loan and other agreements relating to the incurrence of debt, many of which include restrictive covenants and broad default provisions. In general, covenants in the agreements governing our existing debt, and debt we may incur in the future, may materially restrict our operations, including our ability to incur debt, pay dividends, make certain investments and payments and encumber or dispose of assets. In the event of a prolonged downturn in the demand for our services as a result of a downturn in the worldwide semiconductor industry or otherwise, we cannot assure you that we will be able to remain in compliance with our financial covenants which, as a result, may lead to a default. Furthermore, a default under one agreement may also trigger cross-defaults under our other agreements. In the event of default, we may not be able to cure the default or obtain a waiver on a timely basis. An event of default under any agreement governing our existing or future debt, if not cured or waived, could have a material adverse effect on our liquidity, financial condition and results of operations.
We and our subsidiaries have on occasion failed to comply with certain financial covenants in some of our loan agreements as a result of reduced levels of operating cash flow due primarily to a downturn in the worldwide semiconductor industry in the fourth quarter of 2000, although our cash flow has subsequently improved. Such noncompliance may also have, through broadly worded cross-default provisions, resulted in defaults under some of the agreements governing our other existing debt. We and our subsidiaries obtained waivers from the relevant lenders relating specifically to such noncompliance. Such noncompliance has not had any significant effect on our ability to repay or refinance amounts due in respect of our existing debt. For these and other reasons, including our financial condition and our relationship with our lenders, no lender has to date sought and we do not believe that any of our lenders would seek to declare a default or enforce remedies in respect of our existing debt, as a result of cross-default provisions or otherwise, although we cannot provide any assurance in this regard.
We depend on select personnel and could be affected by the loss of their services.
We depend on the continued service of our executive officers and skilled technical and other personnel. Our business could suffer if we lose the services of any of these personnel and cannot adequately replace them. Although some of these management personnel have entered into employment agreements with us, they may leave before the expiration of these agreements. We are not insured against the loss of any of our personnel. In addition, we may be required to increase substantially the number of these employees in connection with our expansion plans, and there is intense competition for their services in the semiconductor industry. We may not be able to either retain our present personnel or attract additional qualified personnel as and when needed. In addition, we may need to increase employee compensation levels in order to attract and retain our existing officers and employees and the additional personnel that we expect to require. Furthermore, a portion of the workforce at our facilities in Taiwan are foreign workers employed by us under work permits which are subject to government regulations on renewal and other terms. Consequently, our business could also suffer if the Taiwan regulations relating to the import of foreign workers were to become significantly more restrictive or if we are otherwise unable to attract or retain these workers at a reasonable cost.
If we fail to maintain an effective system of internal controls, we may not be able to accurately report our financial results or prevent fraud.
The United States Securities and Exchange Commission, or the SEC, as required by Section 404 of the Sarbanes-Oxley Act of 2002, adopted rules requiring every public company to include a management report on such company’s internal controls over financial reporting in its annual report, which contains management’s assessment of the effectiveness of the company’s internal controls over financial reporting. In addition, an independent registered public accounting firm must attest to and report on management’s assessment of the effectiveness of the company’s internal controls over financial reporting. These requirements will first apply to our annual report on Form 20-F for the fiscal year ending December 31, 2006. Our management may conclude that our internal controls over our financial reporting are not effective. Moreover, even if our management concludes that our internal controls over financial reporting are effective, our independent registered public accounting firm may still decline to attest to
8
our management’s assessment or may issue a report that is qualified if it is not satisfied with our controls or the level at which our controls are documented, designed, operated or reviewed, or if it interprets the relevant requirements differently from us. Furthermore, during the course of the evaluation, documentation and attestation, we may identify deficiencies that we may not be able to remedy in time to meet the deadline imposed by the Sarbanes-Oxley Act for compliance with the requirements of Section 404. If we fail to achieve and maintain the adequacy of our internal controls, we may not be able to conclude that we have effective internal controls, on an ongoing basis, over financial reporting in accordance with the Sarbanes-Oxley Act. Moreover, effective internal controls, particularly those related to revenue recognition, are necessary for us to produce reliable financial reports and are important to help prevent fraud. As a result, our failure to achieve and maintain effective internal controls over financial reporting could result in the loss of investor confidence in the reliability of our financial statements, which in turn could harm our business and negatively impact the trading price of our shares. Furthermore, we anticipate that we will incur considerable costs and use significant management time and other resources in an effort to comply with Section 404 and other requirements of the Sarbanes-Oxley Act.
If we are unable to obtain additional testing and packaging equipment or facilities in a timely manner and at a reasonable cost, our competitiveness and future profitability may be adversely affected.
The semiconductor testing and packaging businesses are capital-intensive and require significant investment in expensive equipment manufactured by a limited number of suppliers. The market for semiconductor testing and packaging equipment is characterized, from time to time, by intense demand, limited supply and long delivery cycles. Our operations and expansion plans depend on our ability to obtain a significant amount of such equipment from a limited number of suppliers, including, in the case of testers, Agilent Technologies, Inc., Teradyne, Inc., Credence Systems Corporation, LTX Corporation and, in the case of wire bonders, Kulicke & Soffa Industries Inc. In the case of handlers, we purchase equipment from Seiko Epson, and, in the case of probers, we purchase equipment from Tokyo Electron Limited.From time to time we have also leased certain equipment and have in the past two years increased the amount of equipment we lease. See “Item 5. Operating and Financial Review andProspects—Operating Results and Trend Information—Cost of Revenues”. We have no binding supply agreements with any of our suppliers and acquire our testing and packaging equipment on a purchase order basis, which exposes us to changing market conditions and other substantial risks. For example, shortages of capital equipment could result in an increase in the price of equipment and longer delivery times. Semiconductor testing and packaging also require us to operate sizeable facilities. If we are unable to obtain equipment or facilities in a timely manner, we may be unable to fulfill our customers’ orders, which could adversely affect our growth prospects as well as financial condition and results of operations. See “Item 4. Information on the Company—Business Overview—Equipment”.
Fluctuations in exchange rates could result in foreign exchange losses.
Currently, the majority of our revenues from testing and packaging services is denominated in U.S. dollars and NT dollars. Our cost of revenues and operating expenses associated with testing and packaging services, on the other hand, are incurred in several currencies, primarily in NT dollars, U.S. dollars and Malaysian ringgit, as well as, to a lesser extent, Singapore dollars, Japanese yen and Hong Kong dollars.In addition, a substantial portion of our capital expenditures, primarily for the purchase of testing and packaging equipment, has been, and is expected to continue to be, denominated in U.S. dollars with much of the remainder in Japanese yen.Fluctuations in exchange rates, primarily among the U.S. dollar, the NT dollar and the Japanese yen, will affect our costs and operating margins. In addition, these fluctuations could result in exchange losses and increased costs in NT dollar and other local currency terms. Despite hedging and mitigating techniques implemented by us, fluctuations in exchange rates have affected, and may continue to affect, our financial condition and results of operations. See “Item 11.Quantitative and Qualitative Disclosures about Market Risk—Foreign Currency Exchange Rate Risk”.
The loss of a large customer or disruption of our strategic alliance or other commercial arrangements with semiconductor foundries and providers of other complementary semiconductor manufacturing services may result in a decline in our revenues and profitability.
Although we have over 200 customers, we have derived and expect to continue to derive a large portion of our revenues from a small group of customers during any particular period due in part to the concentration of market share in the semiconductor industry. Our five largest customers together accounted for approximately 34%, 30% and 32% of our net revenues in 2003, 2004 and 2005, respectively. There has been significant variation in the composition of our largest five customers over time. No customer accounted for more than 10% of our net revenues in 2003, 2004 or 2005. This variation is due primarily to the high level of competition in the semiconductor industry
9
in which our customers operate. The demand for our services from a customer is directly dependent on that customer’s level of business activity, which could vary significantly from year to year. Our key customers typically operate in the cyclical semiconductor business and, in the past, have varied, and may in the future vary, order levels significantly from period to period. Some of these companies are relatively small, have limited operating histories and financial resources and are highly exposed to the cyclicality of the industry. We cannot assure you that these customers or any other customers will continue to place orders with us in the future at the same levels as in past periods. The loss of one or more of our significant customers, or reduced orders by any one of them, and our inability to replace these customers or make up for such orders could adversely affect our revenues and profitability. In addition, during cyclical market downturns, we have in the past reduced, and may in the future reduce, our prices to limit the level of order cancellations. Any price reduction would likely reduce our margins and profitability.
Our strategic alliance with TSMC, the world’s largest dedicated semiconductor foundry, and ASE Inc., as well as ASE Inc.’s and our other commercial arrangements with providers of complementary semiconductor manufacturing services, enable us, in conjunction with ASE Inc., to offer total semiconductor manufacturing solutions to our customers. This strategic alliance and any of our other commercial arrangements may be terminated at any time. A termination of this strategic alliance and other commercial arrangements, and our failure to enter into substantially similar alliances and commercial arrangements, may adversely affect our competitiveness and our revenues and profitability.
We depend on our agent for a portion of our sales in North America and Europe. Any serious disruption in our relationship with our agent, or substantial loss in its effectiveness, could significantly reduce our revenues and profitability.
We depend on a non-exclusive agent, Gardex International Limited, or Gardex, for a portion of our sales service in North America and Europe. Gardex helps us identify customers and, within parameters set by us, helps us negotiate price, delivery and other terms with our customers. Purchase orders are placed directly with us by our customers.
Currently, Gardex performs services only for ASE Inc. and ASE Inc.’s subsidiaries, including us and our subsidiaries, but Gardex is not owned or controlled by us or ASE Inc. Gardex is free to perform sales and support services for others, including our competitors. While the acquisition of ASE (U.S.) Inc. by J&R Holding Limited, a subsidiary of ASE Inc., has significantly decreased our dependence upon non-exclusive agents for sales and customer service in North America and Europe, we may not be able to develop sufficient capabilities internally on a timely basis or to find an adequate replacement for Gardex should our relationship with Gardex change unexpectedly. Any serious disruption in our relationship with Gardex or substantial loss in Gardex’s effectiveness in performing its sales functions could significantly reduce our revenues and profitability. See “Item 4. Information on the Company—Business Overview—Sales and Marketing—Sales and Customer Service Agents”.
Adverse developments in ASE Inc.’s operations, competitive position or customer base could negatively affect us.
We believe that we have benefited significantly from our relationship with ASE Inc. Our proximity to, and close working relationship with, ASE Inc. have enabled us to provide value-added services to our customers. A substantial majority of our net revenues from testing services performed at our Kaohsiung, Taiwan facilities has historically been, and is expected to continue to be, derived from customers who are also customers of ASE Inc. We have from time to time billed ASE Inc. directly for some of our testing services performed in Taiwan as part of turnkey services provided by ASE Inc. and by us. Because of our close relationship with ASE Inc., any adverse development in ASE Inc.’s operations, competitive position or customer base could have a material adverse effect on our business, future revenues and profitability.
Our interests may conflict with those of our controlling shareholder, who may take actions that are not in our or our shareholders’ best interest.
ASE Inc., our controlling shareholder, is principally engaged in the semiconductor packaging business. ASE Inc. is also engaged in the semiconductor testing business through its 51.0% shareholding in our company and otherwise. ASE Inc. does not, under Singapore law, owe any fiduciary obligation to our minority shareholders. ASE
10
Inc. is in a position to control actions that require shareholders’ approval by ordinary resolution, including the timing and payment of dividends and the election of our entire board of directors. In addition, some members of our board of directors are employed by, or serve as directors of, companies within the ASE Group, and our Chairman and five other directorshold similar positions at ASE Inc. Accordingly, ASE Inc. or its affiliates may take actions that are not in our or our other shareholders’ best interest.
ASE Inc. and we have had, and will continue to have, some common customers. These customers conduct separate qualification procedures of ASE Inc.’s and our facilities based on their own evaluation of various factors, including geographic location of the facilities, range and quality of testing platforms available, technical expertise, testing capacity and price, and generally indicate which facilities they desire to use. There are no agreements between ASE Inc. and us with respect to the allocation of business from our common customers.
We and ASE Inc. and its affiliates continue to have contractual and other business relationships and may, from time to time, engage in transactions that are material to us.
The ownership by ASE Inc. of a substantial percentage of our outstanding shares and ASE Inc.’s affiliation with members of our board of directors may have the effect of:
- delaying, deferring or preventing a change in who controls us;
- discouraging bids for our shares at a premium over the market price; and
- adversely affecting the market price of our shares.
Our revenues and profitability may decline if we are unable to obtain adequate supplies of raw materials in a timely manner and at a reasonable price.
Our packaging operations require that we obtain adequate supplies of raw materials on a timely basis. Shortages in the supply of raw materials experienced by the semiconductor industry have in the past resulted in occasional price increases and delivery delays. For example, in 1999 and the first half of 2000, the industry experienced a shortage in the supply of advanced substrates used in ball grid array, or BGA, packaging. Raw materials such as advanced substrates are prone to supply shortages since such materials are produced by a limited number of suppliers such as Kinsus Interconnect Technology Corporation, SMI Electronic Devices Inc., Nanya Printed Circuit Board Corporation, Daeduck Electronics Technology Co. Ltd. and Phoenix Precision Technology Corporation. ASE Material (now operated as a division of ASE Inc. but expected to be spun-off into a separate subsidiary of ASE Inc., subject to approval at ASE Inc.’s annual general shareholders’ meeting in June 2006) and commencement of production of interconnect materials at ASE (Shanghai) Inc., a wholly-owned subsidiary of ASE Inc., have improved ASE Inc.’s and our ability to obtain advanced substrates on a timely basis and at a reasonable cost. However, we do not expect ASE Inc.’s in-house interconnect materials operations to be able to meet all of our interconnect materials requirements. Consequently, we will remain dependent on market supply and demand for our raw materials. Recently, we have experienced a tightening in the market supply of raw materials. The fire in May 2005 at our and ASE Inc.’s facilities in Chung Li, Taiwan also damaged a substantial portion of ASE Inc.’s production capacity of interconnect materials for use in packaging operations, although ASE Inc.’s interconnect materials capacity has since returned to pre-fire levels. We cannot guarantee that we will not experience shortages in the near future or that we will be able to obtain adequate supplies of raw materials in a timely manner or at a reasonable price. Our revenues and net income could decline if we are unable to obtain adequate supplies of high quality raw materials in a timely manner or if there are significant increases in the costs of raw materials that we cannot pass on to our customers.
Any environmental claims or failure to comply with any present or future environmental regulations, as well as any fire or other industrial accident, may require us to spend additional funds and may materially and adversely affect our financial condition and results of operations.
We are subject to a various laws and regulations relating to the use, storage, discharge and disposal of chemical by-products of, and water used in, our packaging process. Although we have not suffered material environmental claims in the past, the failure to comply with any present or future regulations could result in the assessment of damages or imposition of fines against us, suspension of production or a cessation of our operations. New
11
regulations could require us to acquire costly equipment or to incur other significant expenses that we may not be able to pass on to our customers. See “Item 4. Information on the Company – Business Overview –Raw Materials”. Additionally, any failure on our part to control the use, or adequately restrict the discharge, of hazardous substances could subject us to future liabilities that may have a material adverse effect on our financial condition and results of operations.
Any impairment charges may have a material adverse effect on our net income.
Under ROC GAAP and U.S. GAAP, we are required to evaluate our long-lived assets, including equipment and goodwill, for possible impairment at least annually or whenever there is an indication of impairment. If certain criteria are met, we are required to record an impairment charge.
With respect to long-lived assets, we did not recognize any impairment charges with regards to our equipment for the years ended December 31, 2003, 2004 and 2005. With respect to goodwill, in 2004, we recognized an impairment charge of $26.5 million under ROC GAAP and $41.5 million under U.S. GAAP. We did not recognized any goodwill impairment in 2005. As of December 31, 2005, goodwill under ROC GAAP and U.S. GAAP amounted to $20.6 million and $40.9 million, respectively. See “Item 5. Operating and Financial Review and Prospects-Operating Results and Trend Information – Critical Accounting Policies – Valuation of Long-Lived Assets” and “Item 5. Operating and Financial Review and Prospects – Operating Results and Trend Information – Critical Accounting Policies – Goodwill”.
We are unable to estimate the extent and timing of any impairment charges for long-lived assets or goodwill for future years under ROC GAAP or under a reconciliation with U.S. GAAP, and we cannot give any assurance that impairment charges will not be required in periods subsequent to December 31, 2005. Any impairment charge may have a material adverse effect on our net income. The determination of an impairment charge at any given time is based significantly on our expected results of operations over a number of years subsequent to that time. As a result, an impairment charge is more likely to occur during a period in which our operating results and outlook are otherwise already depressed.
Risks Relating to Countries in Which We Conduct Operations
Adverse economic conditions in Asia could negatively affect our business, financial condition and results of operations.
Our current testing and packaging facilities are located in Taiwan, Malaysia, the United States and Singapore. Our affiliated company, ASE Korea, has operations in South Korea. Furthermore, our customers are located in North America, Europe and other parts of Asia. As a result, our business is subject to various risks beyond our control, such as:
- instability of economies and governments; and
- changes in laws and policies affecting trade and investment, including foreign exchange controls.
In addition, the currencies of several countries in Asia, including Malaysia and Taiwan, where our principal operating facilities are located and where many of our customers have facilities, have in the past experienced, and may in the future experience, substantial depreciation and volatility. In response to these declines, some governments in the region have in the past taken, and may in the future take, drastic steps to stabilize their currencies, including raising official interest rates and other measures. Some governments in the region have in the past imposed, and may in the future impose, foreign currency exchange controls. In September 1998, the Malaysian government imposed strict foreign currency exchange controls. Although such foreign exchange controls imposed by Malaysia have since been liberalized and do not restrict the flow of funds arising from trade transactions and repatriation of profits to investors, we cannot assure you that Malaysia or other countries in Asia will not impose similar or other currency control measures in the future.
Furthermore, economies of the countries in Asia, including Malaysia and Taiwan, have in the past been adversely affected by prolonged inflation, drastic increases in interest rates, widespread failures of financial institutions, political instabilities and other factors in the region. If this were to occur in any future period, our liquidity, financial condition and results of operations could be materially and adversely affected. Adverse economic conditions in the region could result in reduced availability of credit and other financing sources and, as a result,
12
ASE Test Malaysia, ASE Test Taiwan and other subsidiaries would have to rely more heavily on us for funding. In addition, any adverse economic development in the region, if prolonged, could result in lower demand for, and exert further pressures on the prices of, the services and products provided by companies in the region, including us.
Strained relations between the Republic of China and the People’s Republic of China could negatively affect our business and the market value of our shares.
Our principal executive offices and our principal testing facilities are located in Taiwan and approximately 63.5% of our net revenues in 2005 was derived from our operations in Taiwan. The ROC has a unique international political status. The government of the People’s Republic of China, or the PRC, asserts sovereignty over all of China, including Taiwan and does not recognize the legitimacy of the ROC government. Although significant economic and cultural relations have been established in recent years between the ROC and the PRC, relations have often been strained and the PRC government has indicated that it may use military force to gain control over Taiwan in some circumstances, such as the declaration of independence by the ROC. Relations between the ROC and the PRC have been particularly strained in recent years. Political uncertainty could adversely affect the prices of our shares. Relations between the ROC and the PRC and other factors affecting the political or economic conditions in Taiwan could have a material adverse effect on our financial condition and results of operations, as well as the market price and the liquidity of our shares.
As a substantial portion of our business and operations is located in Taiwan, we are vulnerable to earthquakes, typhoons, drought and other natural disasters, as well as power outages and other industrial incidents, which could severely disrupt the normal operation of our business and adversely affect our results of operations.
Taiwan is susceptible to earthquakes and has experienced severe earthquakes which caused significant property damage and loss of life, particularly in the central and eastern parts of Taiwan. Earthquakes have damaged production facilities and adversely affected the operations of many companies involved in the semiconductor and other industries. We have never experienced structural damage to our facilities or damage to our machinery and equipment as a result of these earthquakes. In the past, however, we have experienced interruptions to our production schedule primarily as a result of power outages caused by earthquakes.
Taiwan is also susceptible to typhoons, which may cause damage and business interruptions to companies with facilities located in Taiwan. In 2001, Taiwan experienced severe damage from typhoons, including a typhoon on September 16 that caused over 100 deaths, severe flooding and extensive damage to property and businesses. In the third quarter of 2004, there was a typhoon that interrupted water supplies in Chung Li, Taiwan. We have not experienced any material damage or business interruption from typhoon activity in Taiwan.
In May 2002, Taiwan experienced a severe drought. Although our manufacturing process does not rely on an adequate supply of water, and we were not affected by the May 2002 drought directly, a drought may interrupt the manufacturing process of the foundries located in Taiwan, in turn disrupting some of our customers’ production, which could result in a decline in the demand for our services. In addition, the supply of electrical power in Taiwan, which is primarily provided by Taiwan Power Company, the state-owned electric utility, is susceptible to disruption that could be prolonged and frequent, caused by overload as a result of high demand or other reasons.
Our production facilities as well as many of our suppliers and customers and providers of complementary semiconductor manufacturing services, including foundries, are located in Taiwan. If our customers are affected by an earthquake, a typhoon, a drought or any other natural disasters, or power outage or other industrial incidents, it could result in a decline in the demand for our packaging and testing services. If our suppliers and providers of complementary semiconductor manufacturing services are affected, our production schedule could be interrupted or delayed. As a result, a major earthquake, typhoon, drought, or other natural disasters in Taiwan or power outage or other industrial incidents could severely disrupt the normal operation of our business and have a material adverse effect on our financial condition and results of operations.
Any outbreak of avian flu or recurrence of SARS or other contagious disease may have an adverse effect on the economies and financial markets of certain Asian countries and may adversely affect our results of operations.
The World Health Organization, or WHO, reported in January 2005 that “during 2004, large parts of Asia experienced unprecedented outbreaks of highly pathogenic avian influenza, caused by the H5N1 virus,” which
13
moved the world closer than at any time since 1968 to an influenza pandemic “with high morbidity, excess mortality, and social and economic disruption.” There have continued to be cases of outbreaks of avian flu in certain regions of Asia, Europe and Africa with human casualties reported in countries such as Azerbaijan, Cambodia, Egypt, Indonesia, Iraq, the PRC, Thailand, Turkey and Vietnam. Additionally, in the first half of 2003, the PRC, Hong Kong, Taiwan, Singapore, Vietnam and certain other countries encountered an outbreak of severe acute respiratory syndrome, or SARS, which is a highly contagious form of atypical pneumonia. The SARS outbreak had an adverse effect on our results of operations for the first half of 2003, primarily due to the lower than expected demand for our packaging and testing services that resulted from the adverse effect of such SARS outbreak on the level of economic activity in the affected regions. There is no guarantee that an outbreak of avian flu, SARS or other contagious disease will not occur again in the future and that any future outbreak of avian flu, SARS or other contagious disease, or the measures taken by the governments of the ROC, Hong Kong, the PRC or other countries against such potential outbreaks, will not seriously interrupt our production operations or those of our suppliers and customers, which may have a material adverse effect on our results of operations. The perception that an outbreak of avian flu, SARS or other contagious disease may occur again may have an adverse effect on the economic conditions of certain countries in Asia.
Risks Relating to Our Holding Company Structure
Our ability to receive dividends and other payments from our subsidiaries may be restricted by commercial, statutory and legal restrictions.
We are a holding company, and our only significant assets are our ownership interests in ASE Test Taiwan, ASE Test Malaysia, ISE Labs and our 30.0% interest in ASE Korea. Dividends we receive from our subsidiaries, if any, may be subject to taxation. The ability of our subsidiaries to pay dividends, repay intercompany loans from us or make other distributions to us may be restricted by, among other things, the availability of funds, the terms of various credit arrangements entered into by such subsidiaries, as well as statutory and other legal restrictions. In addition, although there are currently no foreign exchange control regulations which restrict the ability of our subsidiaries to distribute dividends to us, we cannot assure you that the relevant regulations will not be changed and that the ability of our subsidiaries to distribute dividends to us will not be restricted in the future.
Our ability to make further investments in our subsidiaries may depend on regulatory approvals.
Our subsidiaries depend on us for future equity-related financings, and any capital contribution by us to our subsidiaries may require the approval of the relevant authorities in the jurisdiction in which the subsidiary is incorporated. For example, any capital contribution by us to ASE Test Taiwan requires the approval of the authorities of the Export Processing Zone Administration of the ROC Ministry of Economic Affairs. We may not be able to obtain any such approval in the future in a timely manner or at all.
Risks Relating to the Shares
Our shareholders may have difficulty protecting their shareholders rights.
Our corporate affairs are governed by our Memorandum of Association and Articles of Association and by the laws governing corporations incorporated in Singapore. The rights of our shareholders and the responsibilities of members of our board of directors under Singapore law may be different from those applicable to a corporation incorporated in the United States. Therefore, our shareholders may have more difficulty protecting their interests in connection with actions by our management, members of our board of directors or our controlling shareholders than they would as shareholders of a corporation incorporated in the United States.
The volatility in the markets for our shares may result in fluctuations in the market price of our shares.
The market price of our shares and Taiwan depositary shares, also known as TDSs, representing our shares have been, and may continue to be, highly volatile and subject to wide fluctuations in response to:
- quarterly variations in operating results;
- changes in financial estimates by securities analysts; and
- other events or factors.
14
In addition, the Nasdaq National Market, on which our shares trade, has experienced significant price and volume fluctuations that have particularly affected the market prices of equity securities of many technology companies. These fluctuations have often been unrelated to the operating performance of such companies. The resulting volatility in the markets for our securities may cause the market price of our shares to fluctuate widely. Our TDSs are traded on the Taiwan Stock Exchange, which has often experienced greater fluctuations than the Nasdaq National Market or other national stock exchanges or quotation systems in the United States. As a result, our TDSs generally experience greater price volatility than our shares.
It may be difficult for you to enforce any judgment obtained in the United States against us or our affiliates.
Our company is incorporated under the laws of the Republic of Singapore. A substantial majority of our directors and executive officers reside outside the United States. In addition, a substantial majority of our assets and the assets of those persons are located outside the United States. As a result, it may be difficult for investors to enforce in the United States any judgment obtained in the United States against us or any of these persons, including judgments based upon the civil liability provisions of the United States securities laws. In addition, in original actions brought in courts in jurisdictions located outside the United States, it may be difficult for investors to enforce in or out of the United States liabilities based upon United States securities laws. We have been advised by Allen & Gledhill, our Singapore legal counsel, that judgments of United States courts based on the civil liability provisions of the federal securities laws of the United States are not automatically enforceable in Singapore courts. Allen & Gledhill has also advised us that there is doubt as to whether Singapore courts will enter judgments in original actions brought in Singapore courts based solely upon the civil liability provisions of the federal securities laws of the United States.
Singapore law contains provisions that could discourage a takeover of our company.
The Singapore Code on Takeovers and Mergers contains provisions that may delay, deter or prevent a future takeover or change in control of our company. Anyone acquiring an interest, either on his or her own or together with parties acting in concert, in 30.0% or more of our voting shares may be required to extend a takeover offer for the remaining voting shares in accordance with the Singapore Code on Takeovers and Mergers. A person holding between 30.0% and 50.0% (both inclusive) of our voting shares (either on his or her own or together with parties acting in concert) must also make a takeover offer if that person acquires an additional 1.0% of our voting shares in any six-month period. In addition, the offeror must make an appropriate offer or proposal to holders of our securities which are convertible into non-voting shares and may also be required to make such offer to holders of securities of our subsidiaries, which are convertible into our shares. These provisions may discourage or prevent some types of transactions involving an actual or threatened change of control of our company. This could harm our shareholders because a transaction of that kind might otherwise provide an opportunity for our shareholders to sell shares at a price above the prevailing market price.
Item 4. Information on the Company.
HISTORY AND DEVELOPMENT OF THE COMPANY
ASE Test Limited is a Singapore holding company incorporated on December 1, 1995 as Jarich Test Private Limited, which changed its name to ASE Test Private Limited on February 13, 1996 and to ASE Test Limited on April 23, 1996. We acquired, through an exchange of shares with our parent company, ASE Inc., and other individuals, substantially all of the shares of ASE Test, Inc. in May 1996. The exchange was accounted for as a reorganization of companies under common control.
Our registered offices are located at One Marina Boulevard #28-00, Singapore 018989, and the telephone number at the location is (65) 6890-7188. Our principal executive offices are located at 10 West Fifth Street, Nantze Export Processing Zone, Kaohsiung, Taiwan, Republic of China, and our telephone number at the location is (886-7) 363-6641.
ASE Test, Inc., whose predecessor was a subsidiary of ETC Flextronics, Inc., is located in Taiwan and is engaged in the testing of semiconductors. In 2003, ASE Test, Inc. dissolved its wholly-owned subsidiary in the United States, ASE Test (U.S.A.) Inc., which was incorporated in 1996 and was engaged in after-sales service to customers of ASE Test, Inc.
In June 1996, our shares were approved for quotation on the Nasdaq National Market in the United States.
15
On April 15, 1997, we issued 18,000,000 shares (after retroactive adjustments for two-for-one stock splits in 1998 and 1999) to ASE Holdings (Bermuda), Inc., a wholly-owned subsidiary of ASE Inc., in exchange for all of the shares of ASE Holdings (Singapore) Pte. Ltd., which is a Singapore holding company that owns 100.0% of the shares of ASE Electronics (M) Sdn. Bhd., also known as ASE Test Malaysia. ASE Test Malaysia is engaged in the testing and packaging of semiconductors.
In December 1997 and January 1999, we obtained approval from the ROC Securities and Futures Commission (since renamed the ROC Securities and Futures Bureau) to issue TDSs, representing 6,000,000 and 5,000,000 shares (after retroactive adjustments for two-for-one stock splits in 1998 and 1999) offered by our shareholder, J&R Holding Limited. Our TDSs are listed on the Taiwan Stock Exchange and trade under the code 9101.
ISE Labs
In May 1999, we acquired 70.0% of the outstanding shares of ISE Labs, a semiconductor testing company with its principal facilities located in Fremont and Santa Clara, California at a purchase price of $100.1 million.
We subsequently increased our holding to 100.0% through purchases made in April, July and November 2000 and in January 2002. The total price for our acquisition of 100.0% of the outstanding shares of ISE Labs amounted to $221.2 million.
ASE Chung Li and ASE Korea
In July 1999, we and our parent company, ASE Inc., jointly acquired Motorola’s semiconductor businesses in Chung Li, Taiwan and Paju, South Korea for the testing and packaging of semiconductors with principally communications, consumer and automotive applications. Substantially all of the assets of ASE Chung Li were acquired for a base price of $150.0 million in cash, consisting of an initial payment at closing and additional payments in installments contingent upon certain targets of revenue from packaging and testing services provided to Motorola being met. All such installments were paid by July 2004.The ASE Korea acquisition was structured as a stock acquisition of 100.0% of the outstanding shares of ASE Korea for a base price of $140.0 million in cash, consisting of an initial payment with the remainder payable over five years. In addition to the combined base price of $290.0 million, approximately $60.1 million in cash was paid to purchase capital assets at both facilities which were acquired after January 1, 1999 and specified inventories and cash positions. Under the acquisition agreements, ASE Inc. acquired a 70.0% interest in each of the two businesses, and we acquired the remaining 30.0% interest. This division of the investment reflected in part our estimate of the relative testing and packaging values at the facilities. We and ASE Inc. hold our interests in ASE Korea through ASE Investment (Labuan).
ASE Chung Li and ASE Material’s Merger into ASE Inc.
On August 1, 2004, ASE Chung Li and ASE Material merged with and into ASE Inc. with ASE Inc. as the surviving corporation. As a result of the merger, all of the assets and liabilities of ASE Chung Li and ASE Material are owned and have been assumed by ASE Inc. and the operations of ASE Chung Li and ASE Material have been integrated with the operations of ASE Inc.
The merger was consummated by means of a share exchange pursuant to which we, along with other respective shareholders, other than ASE Inc., of ASE Chung Li and ASE Material, received common shares of ASE Inc. in exchange for the common shares of each of ASE Chung Li and ASE Material. ASE Inc. issued 282,315,437 common shares in connection with the merger, representing approximately 7.9% of its outstanding shares as of October 28, 2003 before giving effect to such issuance. Following the completion of this merger, our ownership interests in ASE Chung Li were reduced to zero. See “Item 7. Major Shareholders and Related Party Transactions—Related Party Transactions”.
BUSINESS OVERVIEW
Introduction
We believe that we are one of the world’s largest independent semiconductor testing companies, providing a complete range of testing services, including:
16
- front-end engineering testing at our facilities in the Silicon Valley area in California, Austin, Texas andTaiwan;
- final testing of complex, high-performance logic/mixed-signal semiconductors at our facilities in Taiwan,Malaysia, Singapore, the Silicon Valley area in California and Austin, Texas; and
- turnkey services, which include drop shipment of tested and packaged semiconductors to end usersdesignated by our customers.
In addition, we also provide a broad range of leadframe and laminate-based semiconductor packaging services, including ball grid array, also called BGA, quad flat packages, also called QFP, and thin quad flat packages, also called TQFP, at our facilities in Malaysia.
We have a close working relationship with ASE Inc., our parent company, and our facilities in Kaohsiung are located close to the facilities of ASE Inc., which enables us to provide value-added services to our customers. A substantial majority of our net revenues from testing services performed at our Kaohsiung facilities has historically been, and is expected to continue to be, derived from customers who are also customers of ASE Inc.
We focus primarily on testing complex, high-performance logic/mixed-signal semiconductors and packaging advanced package types. In 2005, approximately 98.4% of our net testing revenues was derived from testing complex, high-performance logic/mixed-signal semiconductors and approximately 71.1% of our net packaging revenues was derived from packaging advanced substrate and leadframe-based packages. Semiconductors tested and packaged by us are used in diverse end-use markets, including communications, consumer electronic, personal computer and industrial products and other applications.
We believe that we are well positioned to meet the requirements of semiconductor companies worldwide for outsourced testing and packaging services across a diverse range of end-use applications because of:
- our ability to provide a broad range of advanced semiconductor testing services;
- our ability to offer, in conjunction with ASE Inc., a broad range of turnkey services, including advancedpackaging services;
- our scale of operations and financial position which enable us to make significant investments in capacityexpansion and research and development, as well as to make selective acquisitions;
- our geographic presence in key centers of outsourced semiconductor and electronics manufacturing; and
- our long-term relationships with providers of complementary semiconductor manufacturing services,including our strategic alliance, in conjunction with ASE Inc., with TSMC, the world’s largest dedicatedsemiconductor foundry.
As a part of our overall strategy to strengthen our testing capabilities and increase our range of services, we intend to continue expanding through internal growth and strategic acquisitions. In 1999, we completed the acquisition of ISE Labs. Through this acquisition, we have expanded our testing capabilities and established a broad geographic presence in the United States, Taiwan, Malaysia and Singapore in close proximity to foundries, integrated device manufacturers and design houses which outsource testing and packaging services. Our acquisition of ISE Labs has enabled us to become an independent provider of complete semiconductor testing solutions, adding significant depth and continuity to our testing services and providing us with a valuable competitive advantage. In particular, ISE Labs allows us to conform our front-end and back-end testing platforms for the same products tested, resulting in greater operational efficiency and cost reduction. We intend to leverage our front-end engineering testing relationships in Silicon Valley to grow our back-end testing business.
We provide semiconductor testing and packaging services both separately and on a turnkey basis. Our turnkey services include testing and packaging services and drop shipment of the tested and packaged semiconductors to end users designated by our customers. We believe that the trend for semiconductor companies to outsource their testing and packaging requirements is accelerating as semiconductor companies increasingly rely on independent providers of foundry and advanced testing and packaging services. In response to the increased pace of new product development and shortened product life and production cycles, semiconductor companies are increasingly seeking
17
independent testing and packaging companies that can provide turnkey services in order to reduce time-to-market. We believe that our expertise and scale in advanced technology and our ability to integrate our broad range of solutions into turnkey services allow us to benefit from the accelerated outsourcing trend and better serve our existing and potential customers. In addition, through the strategic alliance with TSMC that ASE Inc. and we have maintained since 1997, as well as our other commercial arrangements with providers of other complementary semiconductor manufacturing services, we, in conjunction with ASE Inc., have expanded the traditional scope of our turnkey services to offer total semiconductor manufacturing solutions to our customers.
Industry Background
General
Semiconductors are the basic building blocks used to create an increasing variety of electronic products and systems. Continuous improvements in semiconductor process and design technologies have led to smaller, more complex and more reliable semiconductors at a lower cost per function. These improvements have resulted in significant performance and price benefits to manufacturers of electronic systems. As a result, semiconductor demand has grown substantially in our primary end-user markets for communications, personal computers and consumer electronics, and has experienced increased growth in other markets such as automotive products and industrial automation and control systems.
The semiconductor industry is characterized by strong long-term growth, with periodic and sometimes severe cyclical downturns. The Semiconductor Industry Association estimates that worldwide sales of semiconductors increased from approximately $51 billion in 1990 to approximately $227 billion in 2005. The semiconductor industry experienced strong growth between 1992 and 1995 and between 1998 and 2000, with declines between 1996 and first half of 1997 as well as in 1998. Starting from the fourth quarter of 2000, the semiconductor industry experienced a severe downturn due to a slowdown in the global economy, overcapacity in the semiconductor industry and worldwide inventory adjustment. The semiconductor industry started to show signs of a modest recovery in 2002, primarily as a result of inventory replenishment and the introduction of new products. This modest recovery, evident in 2002 and 2003, strengthened in 2004 and 2005, according to Gartner Dataquest. We believe that the pattern of long-term growth and cyclical fluctuations will continue in the semiconductor industry.
Overview of Semiconductor Manufacturing Process
The manufacturing of semiconductors is a complex process that requires increasingly sophisticated engineering and manufacturing expertise. The following table sets forth the main stages of the manufacturing process. We are involved in all stages of the semiconductor manufacturing process except circuit design and wafer fabrication.
| Process | | Description |
| | | < |
| Circuit Design | | The design of a semiconductor is developed by laying out circuit components and interconnections. A complex circuit may be designed with as many as 30 layers of patterns or more. |
| | | < |
| Front-End Engineering Test | | Throughout and following the design process, prototype semiconductors undergo front-end engineering testing, which involves software development, design validation and reliability and failure analysis. |
| | | < |
| Wafer Fabrication | | The process begins with the generation of a photomask through the definition of the circuit design pattern on a photographic negative, known as a mask, by an electron beam or laser beam writer. These circuit patterns are transferred to the wafers using various advanced processes. |
| | | < |
| Wafer Probe | | Each individual die is electrically tested, or probed, for defects. Dies that fail this test are marked to be discarded. |
| | | < |
| Packaging | | Packaging, also called assembly, is the processing of bare semiconductors into finished semiconductors and serves to protect the die and facilitate electrical connections and heat dissipation. |
18
| < Final Test | | Packaged semiconductors are tested to ensure that each device meets performance specifications. |
Outsourcing Trends in Semiconductor Manufacturing
Historically, semiconductor companies designed, manufactured, tested and packaged semiconductors primarily in their own facilities. Over the past several years, there has been a trend in the industry to outsource stages in the manufacturing process. Virtually every significant stage of the manufacturing process can be outsourced. Wafer foundry services and semiconductor packaging services are currently the largest segments of the independent semiconductor manufacturing services market. Most of the world’s major integrated device manufacturers use some independent manufacturing services to maintain a strategic mix of internal and external manufacturing capacity.
The availability of technologically advanced independent manufacturing services has also enabled the growth of “fabless” semiconductor companies that focus on semiconductor design and marketing and outsource their fabrication, testing and packaging requirements to independent companies. We believe that the growth in the number and scale of fabless semiconductor companies that rely solely on independent companies to meet their manufacturing requirements will continue to be a driver of growth in the market for independent foundry, testing and packaging services. Similarly, the availability of technologically advanced independent manufacturing services has encouraged integrated device manufacturers, which had traditionally relied on in-house semiconductor manufacturing capacity, to increasingly outsource their manufacturing requirements to independent semiconductor manufacturing companies.
We believe the outsourcing of semiconductor manufacturing services will increase in the future from current levels for many reasons, including the following:
Technological Expertise and Significant Capital Expenditure. Semiconductor manufacturing processes have become highly complex, requiring substantial investment in specialized equipment and facilities and sophisticated engineering and manufacturing expertise. Technical expertise becomes increasingly important as the industry transitions from one generation of technology to another, as evidenced by the current migration of fabrication technology from 8-inch to 12-inch wafers. In addition, product life cycles have been shortening, magnifying the need to continuously upgrade or replace manufacturing equipment to accommodate new products. As a result, new investments in in-house testing, packaging and fabrication facilities are becoming less desirable to integrated device manufacturers because of the high investment costs as well as the inability to achieve sufficient economies of scale and utilization rates necessary to be competitive with the independent service providers. Independent testing, packaging and foundry companies, on the other hand, are able to realize the benefits of specialization and achieve economies of scale by providing services to a large base of customers across a wide range of products. This enables them to reduce costs and shorten production cycles through high capacity utilization and process expertise. In the process, they are also able to focus on discrete stages of semiconductor manufacturing and deliver services of superior quality.
Since the recent industry downturn that began in the fourth quarter of 2000 and started to improve in 2002, semiconductor companies have significantly reduced their investment in in-house testing and packaging technologies and capacity. As a result, some semiconductor companies may have limited in-house expertise and capacity to accommodate large orders following a recovery in demand, particularly in the area of advanced technology. We expect semiconductor companies to increasingly outsource their testing and packaging requirements to take advantage of the advanced technology and scale of operations of independent testing and packaging companies.
Focus on Core Competencies. As the semiconductor industry becomes more competitive, semiconductor companies are expected to further outsource their semiconductor manufacturing requirements in order to focus their resources on core competencies, such as semiconductor design and marketing.
Time-to-Market Pressure. The increasingly short product life cycle has accelerated time-to-market pressure for semiconductor companies, leading them to rely increasingly on outsourced suppliers as a key source for effective manufacturing solutions.
19
Principal Products and Services
We offer a broad range of advanced semiconductor testing and packaging services. Our services generally focus on complex, high-performance logic/mixed-signal semiconductors, such as system on a chip, or SOC. Our testing services include front-end engineering testing, which is performed during and following the initial circuit design stage of the semiconductor manufacturing process; wafer probing; final testing; and other related semiconductor testing services. Our package types employ either leadframes or substrates as interconnect materials. The semiconductors we package are used in a wide range of end-use applications, including communications, personal computers, consumer electronics, industrial, automotive and other applications. We focus on testing and packaging logic semiconductors. We, at our facilities in Malaysia and, in conjunction with ASE Inc., at our facilities in Taiwan, offer our customers turnkey services which consist of testing, packaging and direct shipment of semiconductors to end users designated by our customers.
The following table sets forth, for the periods indicated, our testing and packaging revenues as a percentage of net revenues.
| | | Year Ended December 31, |
| |
|
|
|
|
|
|
|
|
| | | 2003 | | | 2004 | | | 2005 | |
| |
|
| |
|
| |
|
|
| | | (percentage of net revenues) |
| Testing revenues(1) | | 74.5 | % | | 80.2 | % | | 82.4 | % |
| Packaging revenues | | 25.5 | | | 19.8 | | | 17.6 | |
| |
|
| |
|
| |
|
|
| Total net revenues | | 100.0 | % | | 100.0 | % | | 100.0 | % |
| |
|
| |
|
| |
|
|
|
| (1) | Information in this annual report from our consolidated statements of income for the years ended December 31, 2003, 2004 and 2005 has been adjusted to reflect the reclassification of our camera module assembly operations as discontinued operations. “See Item 5. Operating and Financial Review and Prospects—Operating Results and Trend Information—Discontinued Operations”. |
Testing
We provide a complete range of semiconductor testing services, including front-end engineering testing, wafer probing, final testing of logic/mixed-signal and memory semiconductors and other test-related services. The testing of semiconductors requires technical expertise and knowledge of the specific applications and functions of the semiconductors tested as well as the testing equipment utilized. We believe that our testing services employ technology and expertise that are among the most advanced in the semiconductor industry. In addition to maintaining different types of testing equipment, which enables us to test a variety of semiconductor functions, we work closely with our customers to design effective testing and conversion programs on multiple equipment platforms for particular semiconductors.
In recent years, complex, high-performance logic/mixed-signal semiconductors have accounted for an increasing portion of our overall net testing revenues. As the testing of complex, high-performance semiconductors requires a large number of functions to be tested using more advanced testing equipment, these products attract higher revenues per unit of testing time, measured in central processing unit, or CPU, seconds.
Front-End Engineering Testing. We provide front-end engineering testing services, including software program development, electrical design validation and reliability and failure analysis.
- Customized Software Development. Test engineers develop customized software to test the semiconductoron advanced testing equipment. Customized software developed on specific testing platforms is required totest the conformity of each particular semiconductor type to its unique functionality and specification.
- Electrical Design Validation. A prototype of the designed semiconductor is subjected to electrical testsusing advanced test equipment and customized software. These tests assess whether the prototypesemiconductor complies with a variety of different operating specifications, including functionality,frequency, voltage, current, timing and temperature range.
- Reliability Analysis. Reliability analysis is designed to assess the long-term reliability of thesemiconductor and its suitability of use for intended applications. Reliability testing can include “burn-in”services, which electrically stress a device, usually at high temperature and voltage, for a period of timelong enough to cause the failure of marginal devices.
20
- Failure Analysis. In the event that the prototype semiconductor does not function to specifications duringeither the electrical verification or reliability testing processes, it is typically subjected to failure analysis todetermine why it did not perform as anticipated. As part of this analysis, the prototype semiconductor maybe subjected to a variety of analyses, including electron beam probing and electrical testing.
Wafer Probing. Wafer probing is the step immediately before packaging of semiconductors and involves visual inspection and electrical testing of the processed wafer for defects to ensure that it meets our customers’ specifications. Wafer probing services require expertise and testing equipment similar to that used in final testing, and most of our testers can also be used for wafer probing.
Logic/Mixed-Signal Final Testing. We conduct final tests of a wide variety of logic/mixed-signal semiconductors, with a number of leads ranging from the single digits to over 1,000 and operating frequencies of up to 2.5 Gbps for digital semiconductors and 6 GHz for radio frequency semiconductors, which are at the high end of the range for the industry. The products we test include semiconductors used for networking and wireless communications, graphics and disk controllers for home entertainment and personal computer applications, as well as a variety of application-specific integrated circuits, or ASICs, for various specialized applications.
Memory Final Testing. We provide final testing services for a variety of memory products, such as static random access memory, or SRAM, dynamic random access memory, or DRAM, and single-bit erasable programmable read-only memory, or EPROM, semiconductors and flash memory semiconductors.
Other Test-Related Services. We provide a broad range of additional test-related services, including:
- Burn-in Testing. Burn-in testing is the process of electrically stressing a device, usually at hightemperature and voltage, for a period of time to simulate the continuous use of the device to determinewhether this use would cause the failure of marginal devices;
- Dry Pack. Dry pack is the process which involves heating semiconductors in order to remove moisturebefore packaging and shipping to customers; and
- Tape and Reel. Tape and reel is the process which involves transferring semiconductors from a tray ortube into a tape-like carrier for shipment to customers.
The following table sets forth, for the periods indicated, the percentage of our net testing revenues accounted for by each type of testing service.
| | | Year Ended December 31, |
| |
|
|
|
|
|
|
|
|
| | | 2003 | | | 2004 | | | 2005 | |
| |
|
| |
|
| |
|
|
| | | (percentage of net testing revenues) |
| Logic/mixed-signal testing | | 97.9 | % | | 98.0 | % | | 98.4 | % |
| Memory testing | | 2.1 | | | 2.0 | | | 1.6 | |
| |
|
| |
|
| |
|
|
| Total net testing revenues | | 100.0 | % | | 100.0 | % | | 100.0 | % |
| |
|
| |
|
| |
|
|
Packaging
At ASE Test Malaysia, we offer a broad range of semiconductor packages primarily using surface-mount technology, or SMT. In SMT, the leads on semiconductors and other electronic components are soldered to the surface of the printed circuit board. Within our packaging product portfolio, we focus on the packaging of semiconductor package products for which there is expected to be strong demand, including high pin-count SMT packages, such as BGA, which are based on laminate substrate, and QFP and thin quad flat packages, or TQFP, both of which are based on leadframes. In addition to the more advanced SMT packages, we also offer packaging services using the older pin-through-hole technology, such as plastic dual in-line packages, or PDIP.
An important subset of SMT packages are BGA packages. BGA packages typically feature higher pin-count, smaller package sizes, greater reliability, superior electrical signal transmission and better heat dissipation than traditional leadframe-based packaging technology. Our packaging operations focus primarily on plastic BGA, which is used in applications such as wireless products, cellular phones, global positioning systems and notebook computers, and film BGA, which is used in cellular phones, wireless communications and digital signal processors.
21
The following table sets forth our principal packaging products:
| | | Number of | | | | |
| Package Format | | Leads | | Description | | End Use Applications |
| |
| |
| |
|
| Ball Grid Array (BGA) | | 42-1,517 | | Designed for semiconductors | | Cellular phones, pagers, wireless |
| | | | | which require the enhanced | | communications, DSPs, micro- |
| | | | | performance provided by BGA, | | controller applications and high- |
| | | | | including personal computer | | performance disk drives. |
| | | | | chipsets, graphic controllers and | | |
| | | | | microprocessors, ASICs, digital | | |
| | | | | signal processors, also called | | |
| | | | | DSPs, and memory devices. | | |
| | | | | | | |
| Quad Flat Package | | 32-304 | | Designed for advanced | | Multimedia applications, cellular |
| (QFP)/Thin QFP (TQFP) | | | | processors and controllers, ASICs | | phones, personal computers, |
| | | | | and DSPs. | | automotive and industrial |
| | | | | | | products, hard disk drives, |
| | | | | | | communication boards such as |
| | | | | | | ethernet, integrated services |
| | | | | | | digital network, also called ISDN, |
| | | | | | | and notebook computers. |
| | | | | | | |
| Plastic Leaded Chip | | 20-84 | | Designed for applications that do | | Personal computers, scanners, |
| Carrier (PLCC) | | | | not require low profile package | | electronic games and monitors. |
| | | | | with high density of | | |
| | | | | interconnects. | | |
| | | | | | | |
| Small Outline Plastic | | 48-64 | | Leadframe packages designed for | | Consumer audio/video and |
| Package (SOP)/Thin SOP | | | | memory devices including logic | | entertainment products, cordless |
| (TSOP) | | | | and analog devices, SRAM, | | telephones, pagers, fax machines, |
| | | | | DRAM, fast static RAM, also | | printers, copiers, personal |
| | | | | called FSRAM, and flash | | computer peripherals, automotive |
| | | | | memory devices. | | parts, telecommunications |
| | | | | | | products, recordable optical disks |
| | | | | | | and hard disk drives. |
| | | | | | | |
| Small Outline Plastic J- | | 16-28 | | Designed for memory and low | | DRAM memory devices, |
| Bend Package (SOJ) | | | | pin-count applications. | | microcontrollers, digital analog |
| | | | | | | conversions and audio/video |
| | | | | | | applications. |
| | | | | | | |
| Plastic Dual In-line | | 8-16 | | Used in consumer electronic | | Telephones, televisions, |
| Package (PDIP) | | | | products. | | audio/video applications and |
| | | | | | | computer peripherals. |
| | | | | | | |
| Very Small Peripheral | | 80 | | Designed for fingerprint | | Notebook computers, desktop |
| Array (VSPA) | | | | identification. | | personal computers and |
| | | | | | | automated teller machines. |
| | | | | | | |
| Land Grid Array (LGA) | | 6-40 | | Designed for applications that | | Computer servers, cellular |
| | | | | require high electricity | | phones, network hubs and base |
| | | | | consumption and small package | | stations. |
| | | | | sizes. | | |
| | | | | | | |
| Quad Flat Non-Leaded | | 6-64 | | Designed for applications that | | Cellular phones, computer servers |
| Package (QFN) | | | | require low profile packages and | | and audio/visual equipment. |
| | | | | high electricity consumption. | | |
Historically, we also offered module assembly services, which combine one or more packaged semiconductors with other components in an integrated module to enable increased functionality, typically using automated surface mount technology, or SMT, machines and other machinery and equipment for system-level assembly. Beginning in 2003, we provided our module assembly services at our facilities in Malaysia to a customer for the assembly of camera modules used in handsets. Revenues from such services decreased substantially in 2005 as our customer
22
moved its camera module assembly in-house and we disposed of our camera module assembly operations in Malaysia in October 2005. See “Item 5. Operating and Financial Review and Prospects—Operating Results and Trend Information—Discontinued Operations”.
The following table sets forth, for the periods indicated, the approximate percentage of our net packaging revenues accounted for by each principal type of packaging products or services.
| | | Year Ended December 31, |
| |
|
|
|
|
|
|
|
|
| | | 2003 | | | 2004 | | | 2005 | |
| |
|
| |
|
| |
|
|
| | | (percentage of net packaging revenues) |
| Advanced substrate and leadframe-based | | | | | | | | | |
| packages(1)(2) | | 53.7 | % | | 63.9 | % | | 71.1 | % |
| Traditional leadframe-based packages(3) | | 31.8 | | | 31.2 | | | 13.5 | |
| Other | | 14.5 | | | 4.9 | | | 15.4 | |
| |
|
| |
|
| |
|
|
| Total | | 100.0 | % | | 100.0 | % | | 100.0 | % |
| |
|
| |
|
| |
|
|
|
| (1) | Information in this annual report from our consolidated statements of income for the years ended December 31, 2003, 2004 and 2005 has been adjusted to reflect the reclassification of our camera module assembly operations as discontinued operations. See “Item 5. Operating and Financial Review and Prospects—Operating Results and Trend Information—Discontinued Operations”. |
| | |
| (2) | Includes leadframe-based packages such as QFP/TQFP and QFN and substrate-based packages such as various BGA package types and LGA. |
| |
| (3) | Includes leadframe-based packages such as SOP/TSOP, SOJ, PLCC and PDIP. |
Drop Shipment Services
We offer drop shipment services for shipment of semiconductors directly to end users designated by our customers. We provide drop shipment services to many of our testing customers. A substantial portion of our customers at each of our facilities has qualified these facilities for drop shipment services. Since drop shipment eliminates the additional step of inspection by the customer prior to shipment to end users, quality of service is a key consideration. We believe that our ability to successfully execute our full range of services, including drop shipment services, is an important factor in maintaining existing customers as well as attracting new customers.
Pricing
We price our front-end engineering testing services principally on the basis of hourly test rates and the cost of engineering resources. We price our final testing services principally on the basis of the amount of time, measured in CPU seconds, taken by the automated testing equipment, including testers and handlers, to execute the test programs that are specific to the customer’s products. The price per CPU second for each particular product is determined based on a number of factors, including:
- the complexity of the product;
- the number of functions tested;
- the time required to test the product pursuant to the customer’s specifications;
- the current market landscape of each testing platform;
- labor costs;
- the ability of the machine to parallel-test, which involves testing multiple semiconductors simultaneously;and
- the cost of testers used to perform the testing services.
For example, testing complex, high-performance semiconductors requires more complex equipment, the use of which is priced significantly higher per CPU second than the use of equipment employed in testing less complex or lower-performance semiconductors.
In general, the price per CPU second for the testing of particular products tends to decline over time as the product becomes older and more advanced products in the category are introduced in the market. These newer products, which typically are more complex and higher performance, attract a higher price per CPU second and
23
generate higher margins, which have partially offset price declines related to older products. As older machines become less appropriate for testing more advanced products, prices per CPU second for using such machines decline, resulting in the gradual decline of revenues from such machines.
We price our packaging services primarily on a cost-plus basis and, to a lesser extent, with reference to market prices. Prices for our testing and packaging services are confirmed at the time firm orders are received from customers, which is typically four to eight weeks before delivery.
Equipment
Testing
Testing equipment is the most capital-intensive component of the testing process. As of December 31, 2005, we operated 787 testers, of which 171 were consigned by our customers and 73 were leased under operating leases. We generally seek to purchase and lease testers from different suppliers with similar functionality and the ability to test a variety of different semiconductors. We purchase testing equipment from major international manufacturers, including Agilent Technologies, Inc., Teradyne, Inc., Credence Systems Corporation, LTX Corporation, Seiko Epson and Tokyo Electron Limited. We lease testing equipment from CIT Group (Taiwan) Limited, Macquarie (Asia) Pte Ltd and GE International Inc.We may consider purchasing and leasing additional advanced testers depending on market demand for our testing services and the availability of testers. Upon acquisition of new testing equipment, we install, configure, calibrate, perform burn-in diagnostic tests on and establish parameters for the testing equipment based on anticipated requirements of existing and potential customers and considerations relating to market trends. In addition to testers, we maintain a variety of other types of testing equipment, such as automated handlers and probers (special handlers for wafer probing), scanners, reformers and computer workstations for use in software development. Each tester may be attached to a handler or prober. Handlers attach to testers and transport individual packaged semiconductors to the tester interface. Probers similarly attach to the tester and align each individual die on a wafer with the interface to the tester.
Test programs, which are the software that drives the testing of specific semiconductors, are written for a specific testing platform. We often perform test program conversions that enable us to test semiconductors on multiple platforms. This portability between testers enables us to allocate semiconductors tested across our available test capabilities and thereby improve capacity utilization rates. In certain cases, where a customer requires the testing of a semiconductor product that is not yet fully developed, the customer may provide computer workstations to us to test specific functions. In certain cases, where a customer has specified testing equipment that was not widely applicable to other products which we test, we have required the customer to furnish the equipment on a consignment basis.
Packaging
The most important equipment used in the semiconductor packaging process is the wire bonder. The number of wire bonders at a given facility is commonly used as a measure of the packaging capacity of the facility. The wire bonders connect the input/output terminals on the silicon die using extremely fine gold wire to leads on leadframes or substrates. Typically, wire bonders may be used, with minor modifications, for the packaging of different products. We purchase our wire bonders principally from Kulicke & Soffa Industries Inc. As of December 31, 2005, we operated 404 wire bonders, of which 250 were fine pitch wire bonders. In addition to wire bonders, we maintain a variety of other types of packaging equipment, such as wafer grind, wafer mount, wafer saw, die bonders, automated molding machines, laser markers, solder plates, pad printers, dejunkers, trimmers, formers, substrate saws and scanners.
Software Development and Engineering/Conversion Program
We work closely with our customers to provide sophisticated software engineering services, including test program development, conversion and optimization, and related hardware design. Generally, testing requires customized testing software and related hardware to be developed for each particular product. Software is often initially provided by the customer, and then converted by us at our facilities, for use on one or more of our machines and contains varying functionality depending on specified testing procedures. Once a conversion test program has been developed, we perform trial tests on the semiconductors. Customer feedback on the test results enables us to adjust the conversion test programs prior to actual testing. We also typically assist our customers in collecting and
24
analyzing the test results, and recommend engineering solutions to improve their design and production process. We have developed proprietary software, which automatically generates codes for creating and converting testing programs, and have also developed software for parallel testing of logic semiconductors, and for converting programs from one equipment platform to another. See “Item 5. Operating and Financial Review and Prospects––Research and Development”. Our inability to successfully develop conversion software programs could materially and adversely affect our operating efficiencies. See “Item 3. Key Information––Risk Factors––Risks Relating to Our Business—The complexity of the semiconductor testing and packaging process increases the costs and production risks of our business”.
Seasonality
See “Item 5. Operating and Financial Review and Prospects––Operating Results and Trend Information––Consolidated Quarterly Results”.
Sales and Marketing
Sales and Marketing Offices
We maintain sales and marketing offices in the United States, Taiwan, Austria, Belgium, Germany, Korea, Malaysia and Japan. Our sales staff at all of our sales and marketing offices often call on prospective customers with the sales staff of ASE Inc. We conduct marketing research through our in-house customer service personnel and those of our sales agent and through our relationships with our customers and suppliers to keep abreast of market trends and developments. In placing orders with us, our customers specify which of our facilities these orders will go to. Our customers conduct separate qualification and correlation processes for each of our facilities that they use. See “––Qualification and Correlation by Customers”.
Sales and Customer Service Agents
Under commission agreements, ASE Test Taiwan and ASE Test Malaysia have appointed Gardex as the non-exclusive sales agent for their services and products worldwide. Gardex helps us identify customers and, within parameters set by us, helps us negotiate price, delivery and other terms with our customers. Gardex currently focuses on markets outside of Asia. Purchase orders are placed directly with us by our customers. We currently pay Gardex a commission of 0.50% of our sales outside of Asia, payable quarterly, depending on the amount of these sales. In 2003, 2004 and 2005, we paid $0.8 million, $0.8 million and $1.3 million, respectively, in commissions to Gardex.
Gardex is wholly-owned by Y.C. Hsu, who has had a long personal relationship with Jason C.S. Chang, our Chairman and Chief Executive Officer, that predates the founding of our company. We have maintained a business relationship with Gardex and its predecessors since 1985. Gardex currently performs services only for ASE Inc. and us.See “Item 3. Key Information––Risk Factors––Risk Relating to Our Business—We depend on our agent for a portion of our sales in North America and Europe. Any serious disruption in our relationship with our agent, or substantial loss in its effectiveness, could significantly reduce our revenues and profitability”.
Before ASE Inc. acquired ASE (U.S.) Inc. in July 2004, ASE Test Taiwan, ASE Test Malaysia and ISE Labs, pursuant to service agreements, used ASE (U.S.) Inc. as its non-exclusive agent to provide customer service and after-sales support to customers in Europe and North America. In July 2004, ASE Inc., through its subsidiary J&R Holding Limited, purchased all of the outstanding shares of ASE (U.S.) Inc. We continue to pay ASE (U.S.) Inc. a monthly fee based on its monthly services, associated costs and expenses plus a commission set by reference to the lower of a percentage of sales or a fixed fee. In 2003, 2004 and 2005, we paid $5.7 million, $7.0 million and $7.7 million, respectively, in fees and service charges to ASE (U.S.) Inc.
25
Customers
We believe that our advanced testing and packaging technologies, focus on complex, high-performance products and reputation for high quality and reliable services have been, and will continue to be, important factors in attracting and retaining customers. Our global base of over 200 customers includes leading semiconductor companies across a wide range of end-use applications, including:
| | • | Agilent Technologies, Inc. | | • | Legerity Corporation |
| | • | Altera Corporation | | • | Marvell Technology Group |
| | • | ATI Technologies, Inc. | | • | Microsoft Corp. |
| | • | ATMEL Corporation | | • | NVIDIA Corporation |
| | • | Cambridge Silicon Radio Limited | | • | Philips Semiconductors Inc. |
| | • | Conexant Systems, Inc. | | • | Qualcomm Incorporated |
| | • | DSP Group, Inc. | | • | Silicon Image, Inc. |
| | • | Infineon Technologies AG | | • | STMicroelectronics Pte Ltd. |
| | • | Lattice Semiconductor Corp. | | • | VIA Technologies, Inc. |
| | | | | • | Zoran Corporation |
Our five largest customers together accounted for approximately 34%, 30% and 32% of our net revenues in 2003, 2004 and 2005 respectively. There has been significant variation in the composition of our largest five customers over time, and as a result, we have been less dependent on any particular customer over time. No customer accounted for more than 10% of our net revenues in 2003, 2004 or 2005. We test and package for our customers a wide range of semiconductors with diverse end-use applications in the communication, personal computer, consumer electronic and industrial sectors.
The following table sets forth, for the periods indicated, our net revenues categorized by the principal end-use applications of the semiconductors that we tested and packaged and the modules that we assembled as a percentage of our net revenues.
| | | Year Ended December 31, |
| |
|
|
|
|
|
|
|
|
| | | 2003 | | | 2004 | | | 2005 | |
| |
|
| |
|
| |
|
|
| | | (percentage of net revenues) |
| Communications | | 29.2 | % | | 42.8 | % | | 42.1 | % |
| Personal computers | | 30.8 | | | 26.6 | | | 29.9 | |
| Consumer electronics/industrial/automotive | | 30.7 | | | 24.5 | | | 25.2 | |
| Other | | 9.3 | | | 6.1 | | | 2.8 | |
| |
|
| |
|
| |
|
|
| Total net revenues | | 100.0 | % | | 100.0 | % | | 100.0 | % |
| |
|
| |
|
| |
|
|
Many of our customers are leaders in their respective end-use markets. For example, we provide testing and packaging services to ATI Technologies, Inc., a market leader in visual computing technology for mainstream computing platforms, and Qualcomm Incorporated, a leader in developing and delivering innovative digital wireless communications products and services.
We categorize our net testing and packaging revenues based on the country in which the customer is headquartered. The following table sets forth, for the periods indicated, the percentage breakdown of our net revenues, categorized by geographic regions.
| | | Year Ended December 31, |
| |
|
|
|
|
|
|
|
|
| | | 2003 | | | 2004 | | | 2005 | |
| |
|
| |
|
| |
|
|
| | | (percentage of net revenues) |
| North America | | 61.4 | % | | 55.3 | % | | 61.8 | % |
| Asia | | 31.3 | | | 35.6 | | | 24.8 | |
| Europe | | 7.3 | | | 9.1 | | | 13.4 | |
| |
|
| |
|
| |
|
|
| Total net revenues | | 100.0 | % | | 100.0 | % | | 100.0 | % |
| |
|
| |
|
| |
|
|
26
Qualification and Correlation by Customers
Customers generally require that our facilities undergo a stringent qualification process during which the customer evaluates our operations and production processes, including engineering, delivery control and testing capabilities. The qualification process typically takes up to eight weeks, but can take longer depending on the requirements of the customer. In the case of our testing operations, after we have been qualified by a customer and before the customer delivers semiconductors to us for testing in volume, a process known as correlation is undertaken. During the correlation process, the customer provides us with sample semiconductors to be tested and either provides us with the test program or requests that we develop a conversion program. In some cases, the customer also provides us with a data log of results of any testing of the semiconductors which the customer may have conducted previously. The correlation process typically takes up to two weeks, but can take longer depending on the requirements of the customer. We believe our ability to provide turnkey services reduces the amount of time spent by our customers in the qualification and correlation process. As a result, customers utilizing our turnkey services are able to achieve shorter production cycles.
Quality Control
We believe that our reputation for high quality and reliable services has been important in attracting and retaining leading international semiconductor companies as customers for our testing and packaging services. We maintain a quality control staff at each of our facilities. Our quality control staff typically includes engineers, technicians and other employees who monitor testing and packaging processes in order to ensure high quality. Our quality assurance systems impose strict process controls, statistical in-line monitors, supplier control, data review and management, quality controls and corrective action systems. Our quality control employees operate quality control stations along production lines, monitor clean room environments and follow up on quality through outgoing product inspection and interaction with customer service staff. We have established quality control systems which are designed to ensure high quality service to customers and testing reliability and high production yields at our facilities. In addition, our testing and packaging facilities have been qualified by all of our major customers after satisfying stringent quality standards prescribed by these customers.
Our testing and packaging operations are undertaken in clean rooms where air purity, temperature and humidity are controlled. To ensure stability and integrity of our operations, we maintain clean rooms at our facilities that meet U.S. Federal Standard 209E class 1,000, 10,000 and 100,000 standards.
Our packaging and testing facilities in Malaysia and our testing facilities in Taiwan and Singapore have been certified as meeting TS 16949 standards. Such standards were originally created by the International Automotive Task Force in conjunction with the International Standards Organization, or ISO. These standards provide for continuous improvement with an emphasis on the prevention of defects and reduction of variation and waste in the supply chain. TS 16949 certification is required by some semiconductor manufacturers as a threshold indicator of a company’s quality control standards.
Additionally, our packaging and testing facilities in Malaysia and our testing facilities in Taiwan, Singapore and California have been certified as meeting the ISO 9001. Our packaging and testing facilities in Malaysia and our testing facilities in Taiwan and California have been certified as meeting ISO 14001 quality standards set by the ISO. ISO certifications are required by many countries in connection with sales of industrial products.
Our testing facilities in Taiwan have also been certified to be in compliance with OHSAS 18001:1999, a set of standards designed upon collaboration with occupational health and safety experts and now offered by many certification organizations as an indication of compliance with certain standards for occupational health and safety. Our testing facilities in Taiwan and our testing and packaging facilities in Malaysia have been certified as a “Sony Green Partner”, which indicates our compliance with the “Sony Green Package” standard requirements.
ISE Lab’s testing facilities in Fremont, California have been approved by the U.S. military’s Defense Supply Center, Columbus, Sourcing and Qualifications Unit as a laboratory possessing the requisite level of performance, quality and reliability required of suppliers for the U.S. Department of Defense.
In addition, we have received various vendor awards from our customers for the quality of our products and services.
27
Competition
We compete in the highly competitive independent testing and packaging markets. Our competitors include large integrated device manufacturers with in-house testing and packaging capabilities, independent semiconductor packaging companies with in-house testing capabilities and small independent semiconductor testing companies which focus exclusively on testing. We believe that the principal competitive factors in the independent semiconductor testing industry are:
- the ability to provide total solutions to our customers;
- technological expertise;
- the range of testing platforms and package types available;
- software conversion program capability;
- the ability to work closely with customers at the product development stage;
- responsiveness and flexibility;
- production cycle time;
- capacity;
- production yield; and
- price.
In packaging services, we primarily compete on the basis of:
- production yield;
- production cycle time;
- process technology;
- quality of service;
- capacity;
- location;
- range and quality of packaging types available; and
- price.
Integrated device manufacturers that use our services continuously evaluate our performance against their own in-house testing and packaging capabilities. These integrated device manufacturers may have access to more advanced technologies, and greater financial and other resources than we do. We believe, however, that we can offer greater efficiency at lower cost while maintaining equivalent or higher quality for several reasons. First, as we benefit from specialization and economies of scale by providing services to a large base of customers across a wide range of products, we are better able to reduce costs and shorten production cycles through high capacity utilization and process expertise. Second, as a result of our customer base and product offerings, our equipment generally has a longer useful life. Finally, as a result of the continuing reduction of investments in in-house testing and packaging capacity and technology at integrated device manufacturers, we are better positioned to meet their advanced testing and packaging requirements on a large scale.
28
Material Effects of Government Regulations
ASE Test Taiwan is subject to regulation by the Export Processing Zone Administration of the ROC Ministry of Economic Affairs in relation to land use, company registration, factory establishment, labor safety inspections, issuance of import and export licenses, foreign exchange, international trade management and capital contributions. ASE Test Taiwan is also subject to regulation and periodic monitoring by the Environmental Protection Administration, Executive Yuan, ROC and the Bureau of Environmental Protection, Kaohsiung City.
ASE Test Malaysia operates under two licenses obtained from the Malaysian Industrial Development Authority and issued by the Ministry of International Trade and Industry of Malaysia. Some of the terms of the licenses are:
- ASE Test Malaysia’s shares that are held by non-citizens of Malaysia cannot be sold without the priorwritten consent of the Ministry of International Trade and Industry;
- ASE Test Malaysia must recruit and train Malaysian citizens in a manner that reflects the multiracialcomposition of Malaysia for all levels of occupational classification;
- If ASE Test Malaysia proposes to utilize second-hand machinery or equipment, ASE Test Malaysia shouldobtain the prior written approval of the Ministry of International Trade and Industry and a report from anindependent valuer acceptable to the Ministry of International Trade and Industry. The prior writtenapproval of the Ministry of International Trade and Industry should also be obtained before any changes,additions or reductions with respect to machinery or equipment are proposed, in cases where there will be amaterial effect on production volume or labor;
- ASE Test Malaysia must obtain the prior written consent of the Ministry of International Trade and Industrybefore executing any agreements relating to technology transfers with foreigners;
- One of the licenses requires that ASE Test Malaysia must use its best efforts to appoint companies ownedby Malaysian citizens to distribute its products within Malaysia as well as to appoint distributors of the“bumiputra” ethnicity, primarily ethnic Malays, to distribute a minimum of 30% of its sales withinMalaysia. The selection of “bumiputra” distributors should be effected only after consultation with theMinistry of International Trade and Industry. The appointment of foreign companies as distributorsrequires the prior approval of the Ministry of International Trade and Industry;
- One of the licenses requires that ASE Test Malaysia must export a minimum of 85% of its production;
- ASE Test Malaysia should use its best efforts to appoint Malaysian citizens to its board of directors andshould inform the Ministry of International Trade and Industry on any appointment or change in its boardof directors;
- ASE Test Malaysia should use its best endeavors to utilize the services of Malaysian-owned companies andenterprises in the context of the New Economic Policy of Malaysia; and
- The products of ASE Test Malaysia should attain a standard acceptable to the Malaysian government.
Raw Materials
Semiconductor testing requires minimal raw materials. Substantially all of the raw materials used in our packaging processes are interconnect materials such as leadframes and substrates, gold wire and molding compound. Raw material costs as a percentage of our net revenues were 12.6%, 9.3% and 9.1% in 2003, 2004 and 2005, respectively.
As a result of the “Directive 2002/95/EC on the restriction of the use of certain hazardous substances in electrical and electronic equipment”, or RoHS, becoming effective on July 1, 2006, we have begun adjusting our purchases of raw materials and our production processes in order to use raw materials that comply with this legislation for part of our production. The aim of this new legislation is to restrict the use in the European Union, or EU, of certain substances the EU has deemed harmful to consumers, which includes certain grades of molding compounds, solder and other raw materials that are used in our products. Manufacturers of electrical and electronic equipment will need to comply with this legislation in order to sell their products in an EU member state. As a
29
result of this legislation, we expect that our customers will increasingly request that RoHS-compliant materials be used in our packaging processes.
We do not maintain large inventories of leadframes, substrates, gold wire or molding compound, but generally maintain sufficient stock of each principal raw material for approximately two month’s production based on blanket orders and rolling forecasts of near-term requirements received from customers. In addition, several of our principal suppliers dedicate portions of their inventories, typically in amounts equal to the average monthly amounts supplied to us, as reserves to meet our production requirements. However, shortages in the supply of materials experienced by the semiconductor industry have in the past resulted in occasional price adjustments and delivery delays. For example, in the first half of 2000, the industry experienced a shortage in the supply of advanced substrates used in BGA packages, which, at the time, were only available from a limited number of suppliers located primarily in Japan. Recently, we have experienced a tightening in the market supply of raw materials, and the fire in May 2005 at our and ASE Inc.’s facilities in Chung Li, Taiwan damaged a substantial portion of ASE Inc.’s production capacity of interconnect materials for use in our packaging operations, although ASE Inc.’s interconnect materials capacity has since returned to pre-fire levels. We cannot guarantee that we will not experience shortages in the near future or that we will be able to obtain adequate supplies of raw materials in a timely manner and at a reasonable price. In the event of a shortage, we generally inform our customers and work together to accommodate changes in delivery schedules.
Environmental Matters
Semiconductor testing does not generate significant pollutants. The semiconductor packaging process generates environmental wastes, including gaseous chemical, liquid and solid industrial wastes. We have installed various types of anti-pollution equipment for the treatment of liquid and gaseous chemical waste generated at our semiconductor packaging facilities in Malaysia, where substantially all of our packaging operations are located. We believe that we have adopted adequate anti-pollution measures for the effective maintenance of environmental protection standards that are consistent with the semiconductor industry practice in the countries in which our facilities are located. In addition, we believe we are in compliance in all material respects with present environmental laws and regulations applicable to our operations and facilities. For information regarding our compliance with a recent EU Directive affecting us, see “—Raw Materials”.
Insurance
We have insurance policies covering property damage and damage to our production facilities, buildings and machinery from fire. In addition, we have insurance policies covering our liabilities in connection with certain accidents. Significant damage to any of our production facilities, whether as a result of fire or other causes, would have a material adverse effect on our results of operations.
We are not insured against the loss of key personnel.
30
ORGANIZATIONAL STRUCTURE
The following chart illustrates our corporate structure and effective ownership interest in each of our principal operating subsidiaries and affiliates as of May 31, 2006. The following chart does not include wholly-owned intermediate holding companies.
|
| (1) | We and ASE Inc. hold our interests in ASE Korea through ASE Investments (Labuan). |
The following table sets forth summary information for our subsidiaries as of May 31, 2006:
| | | | | | | Total Paid-in | | | |
| | | | | Jurisdiction of | | Capital | | Our Ownership | |
| Subsidiary | | Main Activities | | Incorporation | | (in millions) | | Interest | |
| |
| |
| |
| |
|
|
| ASE Electronics (M) Sdn. Bhd. | | Packaging and testing of | | Malaysia | | $62.3 | | 100.0 | % |
| | | semiconductors | | | | | | | |
| ASE Test, Inc. | | Testing of semiconductors | | Taiwan | | $193.3 | | 99.99 | % |
| ISE Labs, Inc. | | Testing of semiconductors | | United States | | $70.6 | | 100.0 | % |
| ASE (Korea) Inc. | | Packaging and testing of | | Korea | | $38.0 | | 30.0 | % |
| | | semiconductors | | | | | | | |
PROPERTY, PLANTS AND EQUIPMENT
We maintain operations in Taiwan, Malaysia, California and Texas and Singapore. Our operations in Kaohsiung, Taiwan are located principally in four plants located in the Nantze Export Processing Zone in Kaohsiung. Substantially all of our facilities in Kaohsiung, including our principal executive offices, are located at these plants. With our diverse facilities and through cooperation with ASE Inc., we are able to closely tailor our testing solutions to our customers’ needs. The following table sets forth the location, commencement of operation, primary use, approximate floor space and ownership of our facilities as of April 30, 2006.
31
| | | | | | | | | Approximate | | |
| | | | | Commencement | | | | Floor Space | | Owned or |
| Facility | | Location | | of Operation | | Primary Use | | (in sq. ft.) | | Leased |
| |
| |
| |
| |
| |
|
| ASE Test Taiwan | | Kaohsiung, | | December 1987 | | Our primary testing facilities, which | | 1,045,000 | | Land: leased |
| | | Taiwan | | | | offer complete semiconductor | | | | Buildings: |
| | | | | | | manufacturing solutions in | | | | owned and |
| | | | | | | conjunction with ASE Inc.’s facility | | | | leased |
| | | | | | | in Kaohsiung and foundries located | | | | |
| | | | | | | in Taiwan. Focuses primarily on | | | | |
| | | | | | | advanced logic/mixed-signal testing | | | | |
| | | | | | | for integrated device manufacturers, | | | | |
| | | | | | | fabless design companies and | | | | |
| | | | | | | system companies. | | | | |
| | | | | | | | | | | |
| | | Chung Li, | | October 2001 | | Our primarily wafer probing testing | | 17,000 | | Land and |
| | | Taiwan(1) | | | | facilities. | | | | building: |
| | | | | | | | | | | leased |
| | | | | | | | | | | |
| ASE Test Malaysia | | Penang, | | February 1991 | | An integrated packaging and testing | | 729,000 | | Land: leased |
| | | Malaysia | | | | facility that focuses primarily on the | | | | Buildings: |
| | | | | | | requirements of integrated device | | | | owned |
| | | | | | | manufacturers. | | | | |
| | | | | | | | | | | |
| ISE Labs | | Silicon Valley, | | November 1983 | | Front-end engineering and final | | 327,000 | | Land and |
| | | California | | | | testing facilities located in northern | | | | buildings: |
| | | Austin, Texas | | | | California in close proximity to | | | | leased |
| | | | | | | some of the world’s largest fabless | | | | |
| | | Singapore | | | | design companies. Testing facilities | | | | |
| | | | | | | located in close proximity to | | | | |
| | | | | | | integrated device manufacturers and | | | | |
| | | | | | | fabless companies in Texas and | | | | |
| | | | | | | Southeast Asia. | | | | |
|
| (1) | In May 2005, our facilities in Chung Li, Taiwan suffered damage from a fire. Following the fire, we leased other facilities in Chung Li and have resumed operations. |
For information on the aggregate capacity of our facilities in terms of the number of testers and bonders we operate, see “––Business Overview––Equipment”. The capacity utilization rates of the machinery and equipment installed at our production facilities typically depend on factors such as the volume and variety of different products tested or packaged using such machinery and equipment, the efficiency of our operations in terms of the loading and adjustment of machinery and equipment for the testing or packaging of different products, the complexity of the different products to be tested or packaged, the amount of time set aside for the maintenance and repair of the machinery and equipment, the experience and schedule of work shifts of operators, and others.
Item 4A. Unresolved Staff Comments
Not Applicable.
Item 5. Operating and Financial Review and Prospects.
The following discussion of our business, financial condition and results of operations should be read in conjunction with our consolidated financial statements, which are included elsewhere in this annual report. This discussion contains forward-looking statements that reflect our current views with respect to future events and financial performance. Our actual results may differ materially from those anticipated in these forward-looking statements as a result of any number of factors, such as those set forth under “Item 3. Key Information—Risk Factors” and elsewhere in this annual report. See “Special Note Regarding Forward-Looking Statements”.Information in this annual report from our consolidated statements of income for the years ended December 31, 2003, 2004 and 2005 has been adjusted to reflect the reclassification of our camera module assembly operations as discontinued operations. Information from our consolidated statements of cash flows has not been adjusted. See “—Discontinued Operations”.
32
OPERATING RESULTS AND TREND INFORMATION
Overview
We provide our customers with a complete range of semiconductor testing services. These services are primary components of the semiconductor manufacturing process. Our services generally focus on complex, high-performance logic/mixed-signal semiconductors, such as system on a chip, or SOC, and include front-end engineering testing, wafer probing and final testing. At our facilities in Malaysia, we also provide a broad range of leadframe and substrate-based semiconductor packaging services, including package types such as BGA, QFP and TQFP. Beginning in 2003, we also provided module assembly services at our facilities in Malaysia to a customer for the assembly of camera modules used in handsets. We disposed of our camera module assembly operations in Malaysia in October 2005. For more information on our camera module assembly operations, see “ – Discontinued Operations”. For more information on our testing and packaging services, see “Item 4. Information on the Company––Business Overview––Principal Products and Services”.
Beginning in the fourth quarter of 2000 and continuing through 2001, we experienced a significant downturn in the semiconductor industry. During this downturn we saw a material decline in our business caused by a decline in average selling prices and a curtailment in overall business demand for our services. The decrease in our net revenues during 2001 was across each of the principal end-use applications for the products which we tested and packaged: communications, personal computer and consumer electronics products. Starting from 2002, we experienced a gradual improvement in our net revenues compared to 2001 as a result of a modest recovery in the semiconductor industry since the second quarter of 2002. This improvement was generally concentrated in the testing of more complex, high-performance semiconductors and the packaging of more advanced package types. As a result of the modest recovery in the semiconductor industry and a gradual upturn in the outsourcing trend in 2002, 2003, 2004 and 2005, our average selling prices for packaging and testing services stabilized in 2002, 2003, 2004 and 2005 as compared to 2001.
Net Revenues and Pricing
We recorded net revenues of $345.7 million, $427.8 million and $420.9 million in 2003, 2004 and 2005, respectively. Our net revenues are primarily affected by the volume of units tested and packaged, the selling prices for these units and currency fluctuations. The volume of units tested and packaged has been primarily affected by upturns and slowdowns in the semiconductor industry, which has experienced a modest recovery since the second quarter of 2002. Currency fluctuations affect our net revenues by increasing or decreasing the revenue we receive per unit when sales are translated into local currency.
In the case of semiconductor packaging, the cost of the silicon die, by most accounts the most costly component of the packaged semiconductor, is typically not reflected in our costs (or revenues) since it is typically supplied by our customers on a consignment basis.
In 2003, 2004 and 2005, our packaging revenues accounted for 25.5%, 19.8% and 17.6% while testing revenues accounted for 74.5%, 80.2% and 82.4%, respectively, of our net revenues.
The majority of our net testing revenues is derived from testing complex, high-performance logic/mixed-signal semiconductors, and the majority of our net packaging revenues is derived from packaging advanced substrate and leadframe-based packages. We have testing capabilities and a broad geographic presence in the United States, Taiwan, Malaysia and Singapore in close proximity to key centers for outsourced semiconductor manufacturing and semiconductor designing. In 2005, approximately 36.5% of our net revenues, based on facility location, were derived from operations outside of Taiwan, as compared to approximately 39.3% in 2004.
The semiconductor industry is characterized by a general trend towards declining prices for products and services of a given level of technology over time. During periods of intense competition and adverse conditions in the semiconductor industry, the pace of this decline in prices for our services may be more rapid than that experienced in other years. The average selling prices of our testing and packaging services have experienced sharp declines during such periods as a result of intense price competition from other independent testing and packaging companies that attempt to maintain high capacity utilization levels in the face of reduced demand. During the
33
industry downturn commencing in the fourth quarter of 2000, we experienced a significant decrease in average selling prices and net revenues, which resulted in net losses in 2001 and 2002. In 2003, 2004 and 2005, we experienced a gradual improvement in our net revenues compared to 2002 as a result of a modest recovery in the semiconductor industry since the second quarter of 2002.
Declines in selling prices have been partially offset over the last three years by a change in our revenue mix. In particular, we have been testing more complex, high-performance logic/mixed-signal semiconductors, which are used in communications, personal computer and consumer electronic products, and packaging more advanced substrate and leadframe-based packages. We plan to continue to develop and offer new technologies in testing and packaging services and expanding our capacity to achieve economies of scale, as well as improve production efficiencies for older technology, in order to mitigate the effects of declining prices on our profitability.
We price our front-end engineering testing services principally on the basis of hourly test rates and the cost of engineering resources. We price our final testing services principally on the basis of the amount of time, measured in CPU seconds, taken by the automated testing equipment, including testers and handlers, to execute the test programs that are specific to the customer’s products. The price per CPU second for each particular product is determined based on a number of factors, including:
- the complexity of the product;
- the number of functions tested;
- the time required to test the product pursuant to the customer’s specifications;
- the current market landscape of each testing platform;
- labor costs;
- the ability of the machine to parallel-test, which involves testing multiple semiconductors simultaneously;and
- the cost of testers used to perform the testing services.
The testing of complex, high-performance semiconductors requires more complex equipment, the use of which is priced at significantly higher levels per CPU second than the use of equipment employed in the testing of less complex or lower-performance semiconductors.
Cost of Revenues
Our operations are capital intensive and are characterized by relatively high fixed costs. High-end testers can cost several million dollars each. See “Item 4. Information on the Company—Business Overview—Equipment”. Testing equipment has become more expensive in recent years because the growing technological complexity of semiconductors has required increasingly complex testing services. Increases or decreases in capacity utilization rates can significantly affect gross profit margins, as the unit cost of testing services generally decreases as fixed charges, such as equipment depreciation, are allocated over a larger number of units. The capacity utilization rates of the machinery and equipment installed at our production facilities typically depend on factors such as the volume and variety of products packaged or tested using such machinery and equipment, the efficiency of our operations in terms of the loading and adjustment of machinery and equipment for the packaging or testing of different products, the complexity of the different products to be packaged or tested, the amount of time set aside for the maintenance and repair of the machinery and equipment, and the experience and schedule of work shifts of operators. Depreciation, amortization and equipment leasing expense are the principal components of our testing costs as testing operations require minimal raw materials. In 2003, 2004 and 2005, our testing depreciation and amortization as a percentage of net testing revenues was approximately 42.5%, 36.5 % and 36.2%, respectively. Equipment leasing expenses of $41.4 million represented 12.0% of net testing revenues in 2005, compared with $35.4 million, or 10.3% of net testing revenues, in 2004.
We begin depreciating our equipment when it is placed into service. There may be a time lag between when our equipment is placed into service and when it achieves high levels of utilization. In periods of depressed industry conditions, we may experience lower than expected demand from customers and a sharp decline in the average
34
selling price of our testing services, resulting in an increase in depreciation relative to net revenues. In particular, the capacity utilization rates for our testing equipment are more severely affected during an industry downturn as a result of the decrease in outsourcing demand from integrated device manufacturers, which typically maintain larger in-house testing capacity than in-house packaging capacity.
In the past, we have been able to partially offset the effect of industry-wide fluctuations on our testing capacity utilization rates by relying on a number of factors, including the fact that our newer testers tend to have higher capacity utilization rates as they were purchased in response to market demand and that we have maintained the capacity utilization rates of our older testers by using them to test less complex and lower-performance products, as well as by relying upon leased testing equipment which increases our ability to change testers in a shorter period of time. In addition, we also maintained our testing capacity utilization rates through the development of conversion programs for our testers, which allows us to test semiconductors on multiple platforms. Our ability to maintain or enhance our gross margins will continue to be dependent in part on our ability to effectively manage capacity utilization rates.
As our testing operations require minimal raw materials, substantially all of our raw material costs are attributed to our packaging operations. Raw material costs as a percentage of our net packaging revenues were 48.1%, 45.9% and 49.7% in 2003, 2004 and 2005, respectively.The operations of ASE Material (now operated as a division of ASE Inc. but expected to be spun-off into a separate subsidiary of ASE Inc., subject to approval at ASE Inc.’s annual general shareholders’ meeting in June 2006 ) and ASE (Shanghai) Inc., a wholly-owned subsidiary of ASE Inc., are expected to continue to supply us with interconnect materials in order to meet a portion, but not all, of our interconnect materials requirements.
Operating Expenses
Our operating expenses are composed of selling, general and administrative expenses and research and development expenses. Selling, general and administrative expenses are primarily composed of salaries and bonuses to employees, goodwill amortization, depreciation and other amortization and sales service charges. For more information concerning goodwill amortization, see “––Goodwill Amortization”. Since selling, general and administrative expenses are stable over time, relative to other costs, selling, general and administrative expenses expressed as a percentage of net revenues will vary, in part, according to net revenues. If net revenues are increased, “economies of scale” are achieved in which selling, general and administrative expenses decrease as a percentage of net revenues. Research and development expenses include primarily salaries and bonuses of employees, factory supplies expense, depreciation and amortization. We have endeavored in recent years to expand our research and development capabilities, and, as a result, our research and development costs have increased.
Non-Operating Income and Expenses
Our non-operating income and expenses are primarily composed of loss on fire damage, losses from impairment, interest income and expenses, gain or loss on long-term investments, and foreign exchange gain or loss.
As a result of a fire that broke out in May 2005 at the principal building of ASE Inc.’s substrates facility in Chung Li, Taiwan, which also housed some of our own facilities, we incurred loss on fire damage of $51.2 million, which amount included estimated losses of $52.0 million, less insurance recoveries of $0.8 million. See note 21 to our consolidated financial statements.
Our interest income is primarily derived from fixed return deposits and investment funds. The year-end translation of our foreign exchange assets and liabilities according to the prevailing exchange rate has a large impact on our foreign exchange gain or loss.
Our long-term investments include our interests in ASE Korea (a wholly owned subsidiary of ASE Investment (Labuan)), as well as the shares of ASE Inc. we acquired in connection with the merger of ASE Chung Li and ASE Material with and into ASE Inc. See “—ASE Chung Li and ASE Material’s merger into ASE Inc”. Our income from long-term investments in equity investees was $6.6 million in 2005 compared to $9.8 million in 2004 and $4.3 million in 2003. This was composed of the results of operations of ASE Chung Li, ASE Korea and ASE Material. We own a 30.0% interest in ASE Korea and, before its merger with ASE Inc., owned a 27.6% interest in ASE Chung Li. Therefore, we accounted for our investment in ASE Korea, in 2003, 2004 and 2005, and ASE Chung Li, in 2003 and 2004, under the equity method and recorded their income or losses as investment income under equity method
35
in proportion to our ownership percentages. Before ASE Material’s merger with ASE Inc., we only owned 4.0% of ASE Material and ASE Inc. owned 57.4%; therefore, we accounted for ASE Material under the equity method, recording its income or losses as investment income under equity method in proportion to our ownership percentage. See “Item 5. Operating and Financial Review and Prospects – Operating Results and Trend Information – ASE Chung Li and ASE Material’s merger into ASE Inc”.
Goodwill Amortization
Our operating and non-operating income in recent years have been affected by goodwill amortization charges in connection with acquisitions, the restructuring of our investment holdings and other share repurchases. Under ROC GAAP, additional purchases of shares of consolidated subsidiaries (majority owned) or of companies accounted for using the equity method (less than 50% but greater than 20% owned) will generate goodwill in an amount equal to the difference between the purchase price and the investors’ proportionate equity in the fair value of net assets of the investees. Due to a change in ROC GAAP, beginning in 2006, goodwill is no longer amortized. Prior to 2006, goodwill was amortized over ten years. Amortization of goodwill from the purchases of shares or assets of consolidated subsidiaries was recognized under general and administrative expense. Amortization of goodwill from the purchases of shares of companies accounted for using the equity method was recognized as a debit under investment income. Our goodwill is derived from the acquisitions of ISE Labs and ASE Korea. See “—Recent ROC GAAP Accounting Pronouncements” and “—Critical Accounting Policies – Goodwill”.
ASE Chung Li and ASE Material’s Merger into ASE Inc.
On August 1, 2004, ASE Chung Li and ASE Material were merged with and into ASE Inc., with ASE Inc. as the surviving corporation. The merger was consummated by means of a share exchange pursuant to which the respective shareholders, other than ASE Inc., of ASE Chung Li and ASE Material received common shares of ASE Inc. in exchange for the common shares of each of ASE Chung Li and ASE Material. The share exchange pursuant to the merger agreement between ASE Inc. and entities under the control of ASE Inc. was treated as a transaction between entities under common control, and all assets and liabilities exchanged were transferred at their carrying amounts. In connection with ASE Inc.’s merger with ASE Chung Li, ASE Inc. issued 149,175,000 of its common shares to us, 79,914,225 of its common shares to J&R Holding, its wholly-owned subsidiary, and four common shares to certain individuals who were the original shareholders of ASE Chung Li. In connection with its merger with ASE Material, ASE Inc. issued 5,000,000 of its common shares to ASE Test Taiwan, one of our consolidated subsidiaries, 1,086,800 of its common shares to Hung Ching, our affiliate, and 47,139,409 of its common shares to employees and other shareholders, other than ASE Inc., of ASE Material and a strategic investor. For more information on the merger, see “Item 7. Major Shareholders and Related Party Transactions––Related Party Transactions”.
Discontinued Operations
Beginning in 2003, we provided module assembly services at our facilities in Malaysia to a customer for the assembly of camera modules used in handsets. Revenues from such services decreased substantially in 2005 as our customer moved its camera module assembly in-house and we disposed of our camera module assembly operations in Malaysia in October 2005. Such operations were formerly classified as part of our packaging operations. In the years ended December 31, 2003, 2004 and 2005, net revenues from our camera module operations were $46.3 million, $193.4 million and $66.5 million, respectively. In the years ended December 31, 2003, 2004 and 2005, gross profit from our camera module operations was $6.9 million, $20.0 million and $6.7 million, respectively. In the years ended December 31, 2003, 2004 and 2005, income from our camera module assembly operations was $5.8 million, $17.0 million and $10.8 million, respectively. In 2005, this income consisted of both income from operations of $3.9 million and gain on disposal of $6.9 million. Information in this annual report from our consolidated statements of income for the years ended December 31, 2003, 2004 and 2005 has been adjusted to reflect the reclassification of our camera module assembly operations as discontinued operations. Information from our consolidated statements of cash flows has not been adjusted. Because we commenced our camera module assembly operations in 2003, no reclassification for periods prior to 2003 is required. See “Item 4. Information on the Company – Business Overview – Principal Products and Services – Packaging”.
36
Pension Plan
Under our defined benefit pension plan, our pension costs are calculated using various actuarial assumptions and methodologies. These assumptions include discount rates, inflation, rate of compensation increases, expected return on plan assets, mortality rates, and other factors. Actual results that differ from our assumptions are accumulated and amortized over future periods and, therefore, generally affect our recognized expense and recorded obligation in such future periods. We believe that the assumptions utilized in recording the obligations under our plans are reasonable based on input from our outside actuaries and other advisers and information as to historical experience and performance. Differences in actual experience or changes in assumptions may affect our pension obligation and future expense.
In accordance with the ROC Labor Pension Act, effective July 1, 2005, all ROC companies, including ASE Test Taiwan, are required to contribute at least 6% of participating employees’ monthly salary to “portable” pension fund accounts under the new law. Under the prior applicable pension law, the required contribution amount was no less than 2%. Employees hired prior to the effectiveness of the ROC Labor Pension Act were given the choice to continue with the existing defined benefit pension plan or participate in the new portable defined contribution pension plans available under the new law. Most of the employees of ASE Test Taiwan have decided to participate in the portable pension plans, resulting in an increase in our pension costs. Employees hired after the effectiveness of the new law participate in the new portable pension plans.
Recent ROC GAAP Accounting Pronouncements
In December 2003, the ROC Accounting Research and Development Foundation, or ARDF, issued ROC Statement of Financial Accounting Standards, or ROC SFAS, No. 34 “Accounting for Financial Instruments”, which is required to be applied by us on January 1, 2006. SFAS No. 34 will require us to classify all financial instruments as either trading, available-for-sale, held-to-maturity or cost basis. Debt securities that we have the positive intent and ability to hold to maturity are classified as held-to-maturity securities and reported at amortized cost. Debt and equity securities that are bought and traded for short-term profit are classified as trading securities and reported at fair value, with unrealized gains and losses recognized in earnings. Debt and equity securities not classified as either held-to-maturity or trading are classified as available-for-sale securities and reported at fair value, with unrealized gains and losses excluded from earnings and reported as a separate component of shareholders’ equity. Equity securities without available market quotes are classified as cost-basis securities and reported at cost less any impairment loss. Additionally, SFAS No. 34 will require us to recognize all derivatives on the balance sheet at fair value. Derivatives that do not qualify as hedging instruments under SFAS No. 34 must be adjusted to fair value through earnings. If derivatives qualify as hedging instruments, depending on the nature of the hedge, changes in the fair value of derivatives will either be offset against the changes in fair value of the hedged assets, liabilities or firm commitments through earnings, or recognized in other comprehensive income until the hedged items affect earnings. The change in a derivative’s fair value related to the ineffective portion of a hedge, if any, will be immediately recognized in earnings. We are currently evaluating the effect of adopting the standard but expect the implementation will not have a material effect on our financial position or overall trends in results of operations.
In December 2005, ARDF issued a revision on SFAS No. 25 “Business Combination – Accounting Treatment under Purchase Method”, which provides certain changes to existing accounting treatment for goodwill acquired in business combinations. Under the revised standard, goodwill acquired in business combinations is no longer amortized over its estimated useful life beginning January 1, 2006. Instead, it should be evaluated for impairment in accordance with SFAS No. 35 “Accounting for Asset Impairment”. Amortized cost should be the new basis for goodwill acquired prior to January 1, 2006 for the purpose of impairment analysis. We are currently evaluating the effect of adopting the standard but expect the implementation will not have a material effect on our financial position or overall trends in results of operations.
Critical Accounting Policies
Preparation of our consolidated financial statements requires us to make estimates and judgments in applying our critical accounting policies which have a significant impact on the results we report in our consolidated financial statements. We continually evaluate these estimates, including those related to revenue recognition, allowances for doubtful accounts, inventories, allowances for deferred income tax assets, useful lives of property, plant and equipment, realizability of long-lived assets, goodwill and valuation of marketable securities and long-term investments. We base our estimates on historical experience and other assumptions, which we believe to be reasonable under the circumstances. Actual results may
37
differ from these estimates under different assumptions and conditions. We have identified below the accounting policies that are the most critical to our consolidated financial statements.
Revenue Recognition. Revenues from semiconductor packaging services that we provide are recognized upon shipment. Revenues from testing services that we provide are recognized upon completion of the services or upon shipment. We do not take ownership of:
- bare semiconductor wafers received from customers that we package into finished semiconductors; and
- packaged semiconductors received from customers that we test.
The title and risk of loss remain with the customer for those bare semiconductors and/or packaged semiconductors. Accordingly, the cost of customer-supplied semiconductor materials is not included in our consolidated financial statements. Other criteria that we use to determine when to recognize revenue are:
- existence of persuasive evidence of an arrangement;
- delivery has occurred or services have been rendered;
- the seller’s price to the buyer is fixed or determinable; and
- collectibility is reasonably assured.
These policies are consistent with provisions in the Staff Accounting Bulletin No. 101 and 104 issued by the SEC. We do not provide warranties to our customers except in cases of defects in the packaging services provided and deficiencies in testing services provided. An appropriate sales allowance is recognized in the period during which the sale is recognized, and is estimated based on historical experience.
Allowance for Doubtful Accounts. We periodically record a provision for doubtful accounts based on our evaluation of the collectibility of our accounts receivable. The total amount of this provision is determined by us as follows. We first identify the receivables of customers that are considered to be a higher credit risk based on their current overdue accounts with us, difficulties collecting from these customers in the past or their overall financial condition. For each of these customers, we estimate the extent to which the customer will be able to meet its financial obligations to us, and we record an allowance that reduces our accounts receivable for that customer to the amount that we reasonably believe will be collected. For all other customers, we maintain an allowance for doubtful accounts equal to a percentage of their aggregate accounts receivable. As of December 31, 2003, 2004 and 2005, the allowance we set aside for doubtful accounts was $2.4 million, $4.5 million and $5.0 million, respectively.
Allowances for Deferred Income Tax Assets. Tax benefits arising from deductible temporary differences, unused tax credits and net operating loss carryforwards are recognized as deferred tax assets. We record a valuation allowance to reduce our net deferred tax assets to the amount that is more likely than not to be realized. As of December 31, 2005, we had deferred income tax assets of $39.9 million, net of valuation allowance of $21.6 million. These deferred income tax assets primarily consisted of unused tax credits arising from investments in machinery, equipment, research and development and expenditures of ASE Test Taiwan. We have considered future market growth, forecasted earnings, future taxable income, the mix of earnings in the jurisdictions in which we operate and prudent and feasible tax planning strategies in determining the need for these valuation allowances. If we were to determine that we would not be able to realize a portion of our net deferred tax assets in the future for which there is currently no valuation allowance, an adjustment to the net deferred tax assets would be charged to earnings in the period such determination is made. Conversely, if we were to make a determination that it is more likely than not that the deferred tax assets for which there is currently a valuation allowance would be realized, the related valuation allowance would be reduced and a benefit to earnings would be recorded.
Useful Lives of Property, Plant and Equipment. Our operations are capital intensive, and we have significant investment in expensive testing and packaging equipment. Property, plant and equipment represented 58%, 59% and 46% of our total assets as of December 31, 2003, 2004 and 2005, respectively. We depreciate our property, plant and equipment based on our estimate of their economic useful lives to us, which in turn is based on our judgment, historical experience and the potential obsolescence of our existing equipment brought about by the introduction of more sophisticated testing and packaging technologies and
38
processes. If we subsequently determine that the actual useful life of a property is shorter than what we had estimated, we will depreciate the remaining undepreciated value of that asset over its remaining economic useful life. This would result in increased depreciation and decreased net income during those periods. Similarly, if the actual lives of property, plant and equipment are longer than what we had estimated, we would have less depreciation and higher net income in subsequent periods. As a result, if our estimations of the useful lives of our property, plant and equipment are not accurate, our net income in future periods would be affected.
Valuation of Long-Lived Assets. We are required to evaluate our equipment and other long-lived assets for impairment whenever there is an indication of impairment. If certain criteria are met, we are required to record an impairment charge. For the year ended December 31, 2004, we adopted ROC SFAS No. 35, “Accounting for Asset Impairment” to account for the impairment of our long-lived assets under ROC GAAP. In accordance with ROC SFAS No. 35, long-lived assets held and used by us are reviewed for impairment whenever events or changes in circumstances indicate that the carrying amount of an asset may not be recoverable. If the recoverable amount increases in a future period, the amount previously recognized as impairment will be reversed and recognized as a gain. However, the adjusted amount may not exceed the carrying amount that would have been determined, net of depreciation, had no impairment loss been recognized. Prior to 2004, there were no requirements related to the evaluation of recoverability of long-lived assets’ impairment under ROC GAAP, and we applied U.S. Statement of Financial Accounting Standards, or U.S. SFAS, No. 144, “Accounting for the Impairment or Disposal of Long-Lived Assets”, when accounting for impairment of long-lived assets for both ROC GAAP and U.S. GAAP.
In accordance with U.S. SFAS No. 144, long-lived assets held and used by us are reviewed for impairment whenever events or changes in circumstances indicate that the carrying amount of an asset may not be recoverable. For purposes of evaluating the recoverability of long-lived assets, the recoverability test is performed by comparing undiscounted net cash flows of the assets against the net book value of the assets. If the recoverability test indicates that an impairment has occurred, the impairment loss is the amount of the asset’s net book value in excess of the related fair value.
In 2003, 2004 and 2005, we did not take any impairment charges against long-lived assets.
Goodwill. Pursuant to a change in ROC GAAP, in 2004 we adopted ROC SFAS No. 35, “Accounting for Asset Impairment”. Under ROC SFAS No. 35, goodwill is evaluated at least annually for impairment by comparing the recorded amount of the cash-generating unit to which the goodwill has been allocated to its recoverable amount. Recoverable amount is defined as the higher of a cash-generating unit’s fair value less costs to sell or its “value in use”, which is defined as the present value of the expected future cash flows generated by the assets. An impairment charge is incurred to the extent the recorded amount exceeds the recoverable amount. As a result of our annual impairment review in 2004, we recognized an impairment loss under ROC GAAP of $26.5 million on goodwill that arose from our purchase of shares of ISE Labs due primarily to a downward revision in the forecasted revenues of ISE Labs based on internal company estimates and industry trend data that suggested the outlook for the semiconductor industry, and ISE Labs in particular, was less favorable than in prior years, including the year in which we acquired our interest in ISE Labs. Prior to the adoption of ROC SFAS No. 35, we were not required to evaluate goodwill for impairment under ROC GAAP.
Effective January 1, 2002, we adopted U.S. SFAS No. 142, “Goodwill and Other Intangible Assets”, which requires that goodwill no longer be amortized and instead be tested for impairment annually or more frequently if events or changes in circumstances indicate that the asset might be impaired. We performed impairment tests as of the date of adoption and subsequently for the years 2002, 2003, 2004 and 2005. Pursuant to these impairment tests, we did not recognize any impairment charges until 2004, when we recognized an impairment loss of $41.5 million under U.S. GAAP for impairment associated with the acquisition of ISE Labs. We did not recognize any goodwill impairment charges in 2005. As of December 31, 2005, under U.S. GAAP, we had goodwill of $40.9 million remaining that related primarily to our testing operations.
If events and circumstances warrant in the future, the value of the goodwill could be further impaired under ROC GAAP or U.S. GAAP.
Stock Based Compensation.For U.S. GAAP reporting, we have elected to follow Accounting Principles Board, or APB, Opinion No. 25, “Accounting for Stock Issued to Employees”, which measures compensation expense based on the difference, if any, between the market price of the underlying common shares and the exercise price of the stock option on the date of the grant. We are required under U.S. SFAS No. 123, “Accounting for Stock-based Compensation”, to disclose the pro forma information regarding option grants to its employees computed as if the fair value method had been applied.
39
In addition, ASE Inc. pays certain employee compensation amounts by means of stock or stock options on our behalf and does not require reimbursement. Under U.S. GAAP, such payments made by ASE Inc. directly to our employees and subsidiaries have been recorded as compensation expense, allocated to cost of revenues, research and development costs and selling, general and administrative expenses, as appropriate, and credited to capital surplus, consistent with the manner described above.
Derivatives.Premiums or discounts on foreign currency forward exchange contracts which have been acquired to manage the risk associated with assets and liabilities denominated in foreign currencies arising from the difference between the forward rate and the spot rate at the date of each contract are deferred and amortized on the straight-line method over the contract periods. At year end, the balances of the forward exchange receivables or payables are restated based on prevailing exchange rates and the resulting gain or loss is credited or charged to income. Any exchange gain or loss when the contract is settled is also credited or charged to income. In addition, the receivables and payables related to the forward contracts are netted with the resulting amount presented as either an asset or a liability.
Written option contracts to purchase foreign currencies entered into for hedging purposes are not recorded as assets or liabilities on the contract dates. Gains or losses upon settlement are credited or charged to income. Amounts received or paid are amortized over each contract period. At year end, the outstanding written option contracts are marked to market with charges to current income.
When we have a legally enforceable right to set off the recognized amount and intend either to settle on a net basis, or to realize the asset and the liability simultaneously, the difference between receivables and payables balance is netted and accounted for as either a current asset or current liability; otherwise, the receivables and payables should be accounted for as a current asset and current liability, respectively.
40
Results of Operations
Information in this annual report from our consolidated statements of income for the years ended December 31, 2003, 2004 and 2005 has been adjusted to reflect the reclassification of our camera module assembly operations as discontinued operations. See “—Discontinued Operations”.
The following table sets forth, for the periods indicated, selected income statement items from our consolidated financial statements.
| | | Year Ended December 31, |
| |
|
|
|
|
|
|
|
|
|
|
|
| | | | 2003 | | | | 2004 | | | | 2005 | |
| |
|
|
| |
|
|
| |
|
|
|
| | | (in thousands) |
| Net revenues: | | | | | | | | | | | | |
| Testing | | $ | 257,490 | | | $ | 343,116 | | | $ | 346,639 | |
| Packaging | | | 88,170 | | | | 84,647 | | | | 74,290 | |
| |
|
|
| |
|
|
| |
|
|
|
| Total net revenues | | | 345,660 | | | | 427,763 | | | | 420,929 | |
| Cost of revenues | | | 283,135 | | | | 340,663 | | | | 330,786 | |
| |
|
|
| |
|
|
| |
|
|
|
| Gross profit | | | 62,525 | | | | 87,100 | | | | 90,143 | |
| |
|
|
| |
|
|
| |
|
|
|
| Operating expenses: | | | | | | | | | | | | |
| Selling, general and administrative(1) | | | 37,502 | | | | 43,762 | | | | 46,160 | |
| Research and development | | | 19,513 | | | | 23,223 | | | | 24,993 | |
| Goodwill amortization(2) | | | 10,105 | | | | 10,105 | | | | 4,966 | |
| |
|
|
| |
|
|
| |
|
|
|
| Total operating expenses | | | 67,120 | | | | 77,090 | | | | 76,119 | |
| |
|
|
| |
|
|
| |
|
|
|
| Income (loss) from operations | | | (4,595 | ) | | | 10,010 | | | | 14,024 | |
| |
|
|
| |
|
|
| |
|
|
|
| Non-operating income (expenses): | | | | | | | | | | | | |
| Interest - - net | | | (12,614 | ) | | | (6,187 | ) | | | (11,146 | ) |
| Investment income under equity method - net(3) | | | 4,259 | | | | 9,844 | | | | 6,637 | |
| Impairment of goodwill | | | — | | | | (26,500 | ) | | | — | |
| Foreign exchange gain (loss) - net | | | (795 | ) | | | 175 | | | | 1,388 | |
| Loss on fire damage | | | — | | | | — | | | | (51,224 | ) |
| Other - - net | | | 674 | | | | (380 | ) | | | (3,465 | ) |
| |
|
|
| |
|
|
| |
|
|
|
| Total non-operating expense - net | | | (8,476 | ) | | | (23,048 | ) | | | (57,810 | ) |
| |
|
|
| |
|
|
| |
|
|
|
| Loss from continuing operations before income tax and | | | | | | | | | | | | |
| extraordinary loss | | | (13,071 | ) | | | (13,038 | ) | | | (43,786 | ) |
| Income tax benefit (expense) | | | 6,009 | | | | 21,209 | | | | (2,537 | ) |
| |
|
|
| |
|
|
| |
|
|
|
| Income (loss) from continuing operations | | | (7,062 | ) | | | 8,171 | | | | (46,323 | ) |
| Discontinued operations(4) | | | 5,750 | | | | 16,968 | | | | 10,839 | |
| Extraordinary loss | | | (2,203 | ) | | | — | | | | — | |
| |
|
|
| |
|
|
| |
|
|
|
| Net income (loss) (ROC GAAP) | | $ | (3,515 | ) | | $ | 25,139 | | | $ | (35,484 | ) |
| |
|
|
| |
|
|
| |
|
|
|
| Net income (loss) (U.S. GAAP) | | $ | (3,491 | ) | | $ | 17,890 | | | $ | (35,446 | ) |
| |
|
|
| |
|
|
| |
|
|
|
|
| (1) | Includes selling expenses and general and administrative expenses, but excludes goodwill amortization. |
| |
| (2) | Included in general and administrative expenses in our consolidated financial statements. See “Critical Accounting Policies—Goodwill”. |
| |
| (3) | Includes investment income (loss) from ASE Chung Li; ASE Korea, a wholly owned subsidiary of ASE Investment (Labuan), of which we hold 30.0%; and ASE Material. |
| |
| (4) | Includes income from discontinued operations of $3.9 million and gain on disposal of discontinued operations of $6.9 million in 2005, both of which are net of income tax expense. In October 2005, we disposed of our camera module assembly operations in Malaysia. Such operations were formerly classified as part of our packaging operations. Information in this annual report from our consolidated statements of income for the years ended December 31, 2003, 2004 and 2005 has been adjusted to reflect the reclassification of our camera module assembly operations as discontinued operations. Information from our consolidated statements of cash flows has not been adjusted. See “– Discontinued Operations”. |
41
The following table sets forth, for the periods indicated, selected income statement items from our consolidated financial statements as a percentage of net revenues.
| | | Year Ended December 31, |
| |
|
|
|
|
|
|
|
|
| | | 2003 | | | 2004 | | | 2005 | |
| |
|
| |
|
| |
|
|
| Net revenues | | 100.0 | % | | 100.0 | % | | 100.0 | % |
| Testing | | 74.5 | | | 80.2 | | | 82.4 | |
| Packaging | | 25.5 | | | 19.8 | | | 17.6 | |
| Cost of revenues | | 81.9 | | | 79.6 | | | 78.6 | |
| Gross profit | | 18.1 | | | 20.4 | | | 21.4 | |
| Operating expenses: | | | | | | | | | |
| Selling, general and administrative | | 10.9 | | | 10.2 | | | 11.0 | |
| Research and development | | 5.6 | | | 5.4 | | | 5.9 | |
| Goodwill amortization | | 2.9 | | | 2.4 | | | 1.2 | |
| Total operating expenses | | 19.4 | | | 18.0 | | | 18.1 | |
| Income (loss) from operations | | (1.3 | ) | | 2.4 | | | 3.3 | |
| Non-operating income (expense): | | | | | | | | | |
| Interest expense - net | | (3.7 | ) | | (1.4 | ) | | (2.6 | ) |
| Investment income under equity method - net | | 1.2 | | | 2.3 | | | 1.6 | |
| Impairment of goodwill | | — | | | (6.2 | ) | | — | |
| Foreign exchange gain (loss) - net | | (0.2 | ) | | — | | | 0.3 | |
| Loss on fire damage | | — | | | — | | | (12.2 | ) |
| Other - net | | 0.2 | | | (0.1 | ) | | (0.8 | ) |
| Total non-operating expense - net | | (2.5 | ) | | (5.4 | ) | | (13.7 | ) |
| Loss from continuing operations before income tax and | | | | | | | | | |
| extraordinary loss | | (3.8 | ) | | (3.0 | ) | | (10.4 | ) |
| Income tax benefit (expense) | | 1.7 | | | 4.9 | | | (0.6 | ) |
| Income (loss) from continuing operations | | (2.1 | ) | | 1.9 | | | (11.0 | ) |
| Discontinued operations | | 1.7 | | | 4.0 | | | 2.6 | |
| Extraordinary loss | | (0.6 | ) | | — | | | — | |
| |
|
| |
|
| |
|
|
| Net income (loss) (ROC GAAP) | | (1.0 | )% | | 5.9 | % | | (8.4 | )% |
| |
|
| |
|
| |
|
|
| Net income (loss) (U.S. GAAP) | | (1.0 | )% | | 4.2 | % | | (8.4 | )% |
| |
|
| |
|
| |
|
|
The following table sets forth, for the periods indicated, our consolidated net revenues, gross profit and gross margin.
| | | Year Ended December 31, |
| |
|
|
|
|
|
|
|
|
|
| | | | 2003 | | | 2004 | | | | 2005 |
| |
|
| |
|
|
| |
|
|
| Net revenues(1): | | (in thousands) |
| Testing | | $ | 257,490 | | $ | 343,116 | | | $ | 346,639 |
| Packaging | | | 88,170 | | | 84,647 | | | | 74,290 |
| |
|
| |
|
|
| |
|
|
| Total | | $ | 345,660 | | $ | 427,763 | | | $ | 420,929 |
| |
|
| |
|
|
| |
|
|
| Gross profit(1): | | | | | | | | | | |
| Testing | | $ | 58,759 | | $ | 89,042 | | | $ | 89,524 |
| Packaging | | | 3,766 | | | (1,942 | ) | | | 619 |
| |
|
| |
|
|
| |
|
|
| Total | | $ | 62,525 | | $ | 87,100 | | | $ | 90,143 |
| |
|
| |
|
|
| |
|
|
| Gross margin(1): | | | | | | | | | |
| Testing | | 22.8 | % | | 26.0 | % | | 25.8 | % |
| Packaging | | 4.3 | % | | (2.3 | )% | | 0.8 | % |
| Overall | | 18.1 | % | | 20.4 | % | | 21.4 | % |
|
| (1) | In October 2005, we disposed of our camera module assembly operations in Malaysia. Such operations were formerly classified as part of our packaging operations. Information in this annual report from our consolidated statements of income for the years ended December 31, 2003, 2004 and 2005 has been adjusted to reflect the reclassification of our camera module assembly operations as discontinued operations. See “– Discontinued Operations”. |
Year Ended December 31, 2005 Compared to Year Ended December 31, 2004
Net Revenues. Our net revenues decreased 1.6% to $420.9 million in 2005 from $427.8 million in 2004. Our net testing revenues increased 1.0% to $346.6 million in 2005 from $343.1 million in 2004. Our net packaging
42
revenues decreased 12.2% to $74.3 million in 2005 from $84.6 million in 2004. In 2005, our net testing revenues accounted for 82.4% of our net revenues and our net packaging revenues accounted for 17.6% of our net revenues, compared to 80.2% and 19.8%, respectively, of our net revenues in 2004. The increase in testing revenues resulted primarily from an increase in the average selling prices for testing services, partially offset by a decrease in testing volume. The decrease in packaging revenues resulted from a decrease in packaging volume and, to a lesser extent, a decrease in the average selling prices for packaging services. The decrease in testing volume resulted primarily from the fire that broke out in May 2005 at the principal building of ASE Inc.’s substrates facility in Chung Li, Taiwan, which housed some of our own facilities. The decrease in packaging volume resulted primarily from a change in product mix and customer composition. The increase in average selling prices for testing services reflects the fact that we are increasingly employing advanced testing equipment, which is charged out at a higher rate, and the fact that complex, high-performance logic/mixed-signal semiconductors, which typically take longer to test, accounted for a greater portion of our testing volumes, partially offset by the general trend in the semiconductor industry of declining prices for each input/output lead on a semiconductor device. We also made certain changes to our pricing in the second half of 2005 that improved our average selling prices for testing and packaging services. In response to tight capacity in the testing and packaging markets generally and, with respect to our testing services, decreased capacity that resulted from the fire in May 2005, we increased the prices for certain of our testing services, including charging our customers for certain ancillary services that we previously provided without charge. In addition, we also reduced our customer base in order to allow us to focus on higher-margin customers. The decrease in average selling prices for packaging services reflects the general trend in the semiconductor industry of declining prices for each input/output lead on a semiconductor device, partially offset by the fact that advanced package types accounted for a greater portion of our packaging volumes.
Gross Profit. Our gross profit increased 3.4% to $90.1 million in 2005 from $87.1 million in 2004 and our gross profit as a percentage of net revenues, or gross margin, increased to 21.4% in 2005 from 20.4% in 2004. This increase in gross profit was primarily a result of a decrease in depreciation and amortization, labor expense and factory supplies, partially offset by a decrease in net revenues and an increase in rental expense. Our gross margin for testing decreased to 25.8% in 2005 from 26.0% in 2004 primarily as a result of an increase in rental expense, partially offset by a decrease in factory supplies, each as a percentage of our net testing revenues. Our gross margin for packaging increased to 0.8% in 2005 from negative 2.3% in 2004 primarily as a result of a decrease in depreciation and amortization, the cost of raw materials we buy for resale to our customers and labor expense, partially offset by an increase in the cost of raw materials for use in our packaging operations, each as a percentage of net packaging revenues. Depreciation and amortization decreased 2.1% to $140.4 million in 2005 from $143.4 million in 2004 primarily as a result of a net decrease in testing and assembly equipment because we leased more testing equipment in 2005 and because of the write-off of equipment that was damaged by the fire in May 2005. Labor expense decreased 9.5% to $60.7 million in 2005 from $67.1 million in 2004 primarily as the result of a decrease in the number of contract workers in connection with cost reduction efforts. Factory supplies expense decreased 24.0% to $19.6 million in 2005 from $25.8 million in 2004 primarily as a result of a decrease in spare parts for equipment. Rental expense increased 16.0% to $41.4 million in 2005 from $35.7 million in 2004 primarily as a result of an increase in the amount of testing equipment we leased.
Operating Income. We recorded an operating profit of $14.0 million in 2005 compared to $10.0 million in 2004. Selling, general and administrative expenses, which included goodwill amortization, decreased 5.2% to $51.1 million in 2005 from $53.9 million in 2004. As a percentage of net revenues, selling, general and administrative expenses, which included goodwill amortization, decreased to 12.2% in 2005 from 12.6% in 2004. The decrease in selling, general and administrative expenses, which included goodwill amortization, was primarily due to a decrease in goodwill amortization as a result of a recognition in 2004 of an impairment loss of $26.5 million on goodwill from the purchase of shares of ISE Labs, partially offset by an increase in our salaries and bonuses expense primarily as a result of bonuses to employees and directors. See “Item 5. Operating and Financial Review and Prospects – Operating Results and Trend Information – Critical Accounting Policies – Goodwill”. Research and development expenses increased 7.8% to $25.0 million in 2005 from $23.2 million in 2004. As a percentage of net revenues, research and development expenses increased to 5.9% in 2005 from 5.4% in 2004. The increase in research and development expenses was primarily due to an increase in our salaries and bonuses expense primarily as a result of an increase in the average number of employees in 2005 and an increase in depreciation and amortization primarily as a result of increased capital expenditures. Our operating income as a percentage of net revenues, or operating margin, increased to 3.3% in 2005 from 2.4% in 2004, primarily as a result of the increase in our gross margin.
43
Non-Operating Income (Expense). Net non-operating expense increased 151.3% to $57.8 million in 2005 from $23.0 million in 2004, primarily as a result of loss on fire damage, and to a lesser extent, an increase in interest expense, partially offset by a decrease in impairment loss. We incurred loss on fire damage of $51.2 million in 2005 as a result of a fire that broke out in May 2005 at the principal building of ASE Inc’s substrates facility in Chung Li, Taiwan, which also housed some of our own facilities. In 2004, we recognized an impairment loss of $26.5 million on goodwill relating to our purchase of shares of ISE Labs; whereas in 2005 we did not recognize any impairment loss. Our net interest expenses increased 79.0% to $11.1 million in 2005 from $6.2 million in 2004, primarily as a result of an increase in interest rates on our outstanding indebtedness. Our net investment income under equity method decreased 32.7% to $6.6 million in 2005 from $9.8 million in 2004, primarily as a result of the merger of ASE Material and ASE Chung Li with and into ASE Inc. in August 2004 pursuant to a share exchange in which we received shares of ASE Inc. in exchange for the common shares we held in ASE Material and ASE Chung Li. See note 7 to our consolidated financial statements.
Net Income and Loss. As a result of the foregoing, we recorded a net loss of $35.5 million in 2005 compared to a net income of $25.1 million in 2004.
We recorded net loss of $35.4 million in 2005 compared to a net income of $17.9 million in 2004 under U.S. GAAP. The U.S. GAAP adjustment in 2005 was primarily from an upward adjustment in goodwill amortization of $5.0 million and a downward adjustment of $4.2 million for our bonuses to employees, directors and supervisors and stock compensation from ASE Inc.
Year Ended December 31, 2004 Compared to Year Ended December 31, 2003
Net Revenues. Our net revenues increased 23.7% to $427.8 million in 2004 from $345.7 million in 2003. Our net testing revenues increased 33.2% to $343.1 million in 2004 from $257.5 million in 2003. Our net packaging revenues decreased 4.1% to $84.6 million in 2004 from $88.2 million in 2003. In 2004, our net testing revenues accounted for 80.2% of our net revenues and our net packaging revenues accounted for 19.8% of our net revenues, compared to 74.5% and 25.5%, respectively, of our net revenues in 2003. The increase in testing revenues resulted from an increase in testing volume and, to a lesser extent, an increase in the average selling prices for testing services. The decrease in packaging revenues resulted primarily from a decrease in the average selling prices for packaging services. The increase in testing volume resulted primarily from the modest recovery in the semiconductor industry and the increase in outsourcing of packaging and testing of semiconductor devices. The increase in average selling prices for testing services reflects the fact that we are increasingly employing advanced testing equipment, which is charged out at a higher rate, and the fact that complex, high-performance logic/mixed-signal semiconductors, which typically take longer to test, accounted for a greater portion of our testing volumes, partially offset by the general trend in the semiconductor industry of declining prices for each input/output lead on a semiconductor device. The decrease in average selling prices for packaging services reflects the general trend in the semiconductor industry of declining prices for each input/output lead on a semiconductor device.
Gross Profit. Our gross profit increased 39.4% to $87.1 million in 2004 from $62.5 million in 2003 and our gross margin increased slightly to 20.4% in 2004 from 18.1% in 2003. This increase in gross profit was primarily a result of an increase in net revenues, partially offset by increases in rental, depreciation and amortization and labor expense. Our gross margin for testing increased to 26.0% in 2004 from 22.8% in 2003 primarily as a result of an increase in our net testing revenues and, to a lesser extent, a decrease in depreciation and amortization as a percentage of net testing revenues, partially offset by an increase in rental expense as a percentage of net testing revenues. Our gross margin for packaging decreased to negative 2.3% in 2004 from 4.3% in 2003 primarily as a result of the decrease in our net packaging revenues, partially offset by a decrease in raw materials costs as a percentage of net packaging revenues. Rental expense increased 250.0% to $35.7 million in 2004 from $10.2 million in 2003 primarily as a result of the increase in the amount of testing equipment we leased. Depreciation and amortization increased 13.1% to $143.4 million in 2004 from $126.8 million in 2003 primarily as a result of our acquisition of additional testing and packaging equipment. Labor expense increased 27.1% to $67.1 million in 2004 from $52.8 million in 2003 primarily as the result of an increase in our work force to meet increased demand for our services.
Operating Income. We recorded an operating profit of $10.0 million in 2004 compared to an operating loss of $4.6 million in 2003. Selling, general and administrative expenses, which included goodwill amortization, increased 13.2% to $53.9 million in 2004 from $47.6 million in 2003. The increase was primarily due to an increase in our salaries and bonuses expense, and, to a lesser extent, commission and sales service charge while goodwill
44
amortization remained unchanged from 2003. As a percentage of net revenues, selling, general and administrative expenses, which included goodwill amortization, decreased to 12.6% in 2004 from 13.8% in 2003. Research and development expenses increased 19.0% to $23.2 million in 2004 from $19.5 million in 2003. The increase in research and development expenses was primarily due to increases in our salaries and bonuses expense resulting from increases in both headcount and per employee compensation and the cost of maintaining our research and development equipment. As a percentage of net revenues, research and development expenses decreased to 5.4% in 2004 from 5.6% in 2003. Operating margin increased to 2.4% in 2004 from negative 1.3% in 2003, as a result of the increase in our gross margin and the foregoing.
Non-Operating Income (Expense). Net non-operating expense increased 170.6% to $23.0 million in 2004 from $8.5 million in 2003, primarily as a result of goodwill impairment, partially offset by a decrease in interest expense and an increase in net investment income under equity method. In 2004, we recognized an impairment loss of $26.5 million on goodwill relating to our purchase of shares of ISE Labs. Our net interest expenses decreased to $6.2 million in 2004 from $12.6 million in 2003, primarily as a result of the decrease in the outstanding amount of our bonds as a result of redemption in August 2003. We had a 127.9% increase of net investment income under equity method to $9.8 million in 2004 from $4.3 million in 2003, primarily as a result of increased net income of our affiliates, ASE Material and ASE Chung Li (before the completion of their merger with ASE Inc.), and ASE Korea.
Net Income and Loss. As a result of the foregoing, we recorded a net income of $25.1 million in 2004 compared to a net loss of $3.5 million in 2003.
We recorded net income of $17.9 million in 2004 compared to a net loss of $3.5 million in 2003 under U.S. GAAP. The U.S. GAAP adjustment in 2004 was primarily from a downward adjustment in our goodwill of $15.0 million resulting from differences in the amount of goodwill impairment recorded under U.S. GAAP and ROC GAAP, an upward adjustment in goodwill amortization of $10.1 million and a downward adjustment of $2.2 million for our bonuses to employees, directors, supervisors and stock compensation from ASE Inc.
Consolidated Quarterly Results
Information in this annual report from our consolidated statements of income for the years ended December 31, 2003, 2004 and 2005 has been adjusted to reflect the reclassification of our camera module assembly operations as discontinued operations. See “—Discontinued Operations”.
The following table sets forth our unaudited consolidated net revenues, gross profit and gross margin for the quarterly periods indicated. The unaudited quarterly results reflect all adjustments, consisting of normal recurring adjustments, that, in the opinion of management, are necessary for a fair presentation of the amounts, on a basis consistent with the audited consolidated financial statements included elsewhere in this annual report. You should read the following table in conjunction with the audited consolidated financial statements and related notes included elsewhere in this annual report. Our net revenues, gross profit and gross margin for any quarter are not necessarily indicative of the results for any future period. Our quarterly net revenues, gross profit and gross margin may fluctuate significantly.
| | | Quarter Ended |
| |
|
| | | | Jun. 30, | | | | Sep. 30, | | | | Dec. 31, | | | | Mar. 31, | | | | Jun. 30, | | | | Sep. 30, | | | | Dec. 31, | | | | March 31, | |
| | | | 2004 | | | | 2004 | | | | 2004 | | | | 2005 | | | | 2005 | | | | 2005 | | | | 2005 | | | | 2006 | |
| |
|
|
| |
|
|
| |
|
|
| |
|
|
| |
|
|
| |
|
|
| |
|
|
| |
|
|
|
| | | (unaudited) |
| | | (in thousands) |
| Net revenues: | | | | | | | | | | | | | | | | | | | | | | | | | | | | | | | | |
| Testing | | $ | 89,718 | | | $ | 91,431 | | | $ | 87,273 | | | $ | 74,625 | | | $ | 77,813 | | | $ | 89,231 | | | $ | 104,970 | | | $ | 106,433 | |
| Packaging | | | 22,401 | | | | 20,403 | | | | 17,521 | | | | 17,546 | | | | 18,053 | | | | 19,020 | | | | 19,671 | | | | 20,897 | |
| |
|
| | |
|
| | |
|
| | |
|
| | |
|
| | |
|
| | |
|
| | |
|
|
|
| Total net revenues | | | 112,119 | | | | 111,834 | | | | 104,794 | | | | 92,171 | | | | 95,866 | | | | 108,251 | | | | 124,641 | | | | 127,330 | |
| Cost of revenues | | | 86,463 | | | | 87,018 | | | | 88,149 | | | | 88,579 | | | | 85,225 | | | | 80,534 | | | | 76,448 | | | | 80,376 | |
| |
|
| | |
|
| | |
|
| | |
|
| | |
|
| | |
|
| | |
|
| | |
|
|
|
| Gross profit | | | 25,656 | | | | 24,816 | | | | 16,645 | | | | 3,592 | | | | 10,641 | | | | 27,717 | | | | 48,193 | | | | 46,954 | |
| |
|
| | |
|
| | |
|
| | |
|
| | |
|
| | |
|
| | |
|
| | |
|
|
|
| Operating expenses: | | | | | | | | | | | | | | | | | | | | | | | | | | | | | | | | |
| Selling, general and | | | | | | | | | | | | | | | | | | | | | | | | | | | | | | | | |
| administrative | | | 12,360 | | | | 10,729 | | | | 10,982 | | | | 9,819 | | | | 15,897 | | | | 10,354 | | | | 10,090 | | | | 10,025 | |
| Research and development | | | 6,068 | | | | 5,499 | | | | 5,395 | | | | 5,524 | | | | 6,151 | | | | 6,152 | | | | 7,166 | | | | 5,138 | |
| | | | | | | | | | | | | | | | | | | | | | | | | | | | | | | | | |
45
| | | Quarter Ended |
| |
|
| | | | Jun. 30, | | | | Sep. 30, | | | | Dec. 31, | | | | Mar. 31, | | | | Jun. 30, | | | | Sep. 30, | | | | Dec. 31, | | | | March 31, | |
| | | | 2004 | | | | 2004 | | | | 2004 | | | | 2005 | | | | 2005 | | | | 2005 | | | | 2005 | | | | 2006 | |
| |
|
|
| |
|
|
| |
|
|
| |
|
|
| |
|
|
| |
|
|
| |
|
|
| |
|
|
|
| | | (unaudited) |
| | | (in thousands) |
| Goodwill amortization | | | 2,526 | | | | 2,526 | | | | 2,526 | | | | 1,241 | | | | 1,242 | | | | 1,241 | | | | 1,242 | | | | — | |
| |
|
|
| |
|
|
| |
|
|
| |
|
|
| |
|
|
| |
|
|
| |
|
|
| |
|
|
|
| Total operating expenses | | | 20,954 | | | | 18,754 | | | | 18,903 | | | | 16,584 | | | | 23,290 | | | | 17,747 | | | | 18,498 | | | | 15,163 | |
| |
|
|
| |
|
|
| |
|
|
| |
|
|
| |
|
|
| |
|
|
| |
|
|
| |
|
|
|
| Income (loss) from operations | | | 4,702 | | | | 6,062 | | | | (2,258 | ) | | | (12,992 | ) | | | (12,649 | ) | | | 9,970 | | | | 29,695 | | | | 31,791 | |
| |
|
|
| |
|
|
| |
|
|
| |
|
|
| |
|
|
| |
|
|
| |
|
|
| |
|
|
|
| Non-operating income | | | | | | | | | | | | | | | | | | | | | | | | | | | | | | | | |
| (expense) | | | 2,888 | | | | 1,453 | | | | (29,534 | ) | | | (932 | ) | | | (53,215 | ) | | | 139 | | | | (3,802 | ) | | | (2,622 | ) |
| |
|
|
| |
|
|
| |
|
|
| |
|
|
| |
|
|
| |
|
|
| |
|
|
| |
|
|
|
| Income (loss) from continuing | | | | | | | | | | | | | | | | | | | | | | | | | | | | | | | | |
| operations before income | | | | | | | | | | | | | | | | | | | | | | | | | | | | | | | | |
| taxes | | | 7,590 | | | | 7,515 | | | | (31,792 | ) | | | (13,924 | ) | | | (65,864 | ) | | | 10,109 | | | | 25,893 | | | | 29,169 | |
| Income tax benefit (expense) | | | 9,008 | | | | 7,666 | | | | 2,793 | | | | (2,001 | ) | | | (1,167 | ) | | | 467 | | | | 164 | | | | (2,229 | ) |
| |
|
|
| |
|
|
| |
|
|
| |
|
|
| |
|
|
| |
|
|
| |
|
|
| |
|
|
|
| Income (loss) from continuing | | | | | | | | | | | | | | | | | | | | | | | | | | | | | | | | |
| operations | | | 16,598 | | | | 15,181 | | | | (28,999 | ) | | | (15,925 | ) | | | (67,031 | ) | | | 10,576 | | | | 26,057 | | | | 26,940 | |
| Discontinued operations | | | 7,768 | | | | 3,404 | | | | 2,243 | | | | 722 | | | | 1,893 | | | | 1,314 | | | | 6,910 | | | | — | |
| |
|
|
| |
|
|
| |
|
|
| |
|
|
| |
|
|
| |
|
|
| |
|
|
| |
|
|
|
| Net income (loss) | | | | | | | | | | | | | | | | | | | | | | | | | | | | | | | | |
| (ROC GAAP) | | $ | 24,366 | | | $ | 18,585 | | | $ | (26,756 | ) | | $ | (15,203 | ) | | $ | (65,138 | ) | | $ | 11,890 | | | $ | 32,967 | | | $ | 26,940 | |
| |
|
|
| |
|
|
| |
|
|
| |
|
|
| |
|
|
| |
|
|
| |
|
|
| |
|
|
|
| Net income (loss) | | | | | | | | | | | | | | | | | | | | | | | | | | | | | | | | |
| (U.S. GAAP) | | $ | 29,491 | | | $ | 20,568 | | | $ | (40,780 | ) | | $ | (13,575 | ) | | $ | (61,261 | ) | | $ | 13,629 | | | $ | 25,761 | | | $ | 20,131 | |
| |
|
|
| |
|
|
| |
|
|
| |
|
|
| |
|
|
| |
|
|
| |
|
|
| |
|
|
|
| Net revenues (ROC GAAP): | | | | | | | | | | | | | | | | | | | | | | | | | | | | | | | | |
| Testing | | | 80.0 | % | | | 81.8 | % | | | 83.3 | % | | | 81.0 | % | | | 81.2 | % | | | 82.4 | % | | | 84.2 | % | | | 83.6 | % |
| Packaging | | | 20.0 | % | | | 18.2 | % | | | 16.7 | % | | | 19.0 | % | | | 18.8 | % | | | 17.6 | % | | | 15.8 | % | | | 16.4 | % |
| | | | | | | | | | | | | | | | | | | | | | | | | | | | | | | | | |
| Gross margin | | | 22.9 | % | | | 22.2 | % | | | 15.9 | % | | | 3.9 | % | | | 11.1 | % | | | 25.6 | % | | | 38.7 | % | | | 36.9 | % |
| Operating margin | | | 4.2 | % | | | 5.4 | % | | | (2.2 | )% | | | (14.1 | )% | | | (13.2 | )% | | | 9.2 | % | | | 23.8 | % | | | 25.0 | % |
| | | | | | | | | | | | | | | | | | | | | | | | | | | | | | | | | |
| Net income margin: | | | | | | | | | | | | | | | | | | | | | | | | | | | | | | | | |
| ROC GAAP | | | 21.7 | % | | | 16.6 | % | | | (25.5 | )% | | | (16.5 | )% | | | (67.9 | )% | | | 11.0 | % | | | 26.4 | % | | | 21.2 | % |
| U.S. GAAP | | | 26.3 | % | | | 18.4 | % | | | (38.9 | )% | | | (14.7 | )% | | | (63.9 | )% | | | 12.6 | % | | | 20.7 | % | | | 15.8 | % |
In 2003 and 2004, we experienced a gradual improvement in our net revenues as a result of a modest recovery in the semiconductor industry and a gradual upturn in the outsourcing trend that has continued. We experienced a slight decrease in our net revenues in 2005 as a result of the fire that broke out at our facilities in Chung Li, Taiwan in May 2005. To a lesser extent, our results of operations have also been affected by seasonality. Our first quarter net revenues have historically shown smaller sequential increases over the preceding fourth quarter, compared to other quarters of the year, primarily due to the combined effects of holidays in the United States, Taiwan and Malaysia. Moreover, the increase or decrease in net revenues of a particular quarter as compared with the immediately preceding quarter varies significantly. See “Item 3. Key Information—Risk Factors—Risks Relating to Our Business—Our operating results are subject to significant fluctuations, which could adversely affect the market value of your investment”.
Exchange Rate Fluctuations
For quantitative and qualitative disclosure of our exposure to foreign currency exchange risk, see “Item 11. Quantitative and Qualitative Disclosures About Market Risk—Foreign Currency Exchange Rate Risk”.
Taxation
Based on our status as a company that is engaged in certain designated businesses in Taiwan, under the ROC Statute of Upgrading Industries, which gives certain preferential tax treatment to companies that qualify as operating in an “important technology industry”, ASE Test Taiwan may apply for tax holidays covering the portion of its income allocable to eligible machinery and equipment upon receipt of a cash infusion from shareholders, including through rights offerings, if the proceeds of which are used to purchase eligible machinery and equipment. See note 17 to our consolidated financial statements. Following our rights offering in September 1998,
46
ASE Test Taiwan applied for a five-year exemption under the ROC Statute for Upgrading of Industries from 2001 through 2005.ASE Test Taiwan also did rights offerings in December 2003 and December 2005, but has yet to complete the related capacity expansions. After the completion of the capacity expansions in connection with the 2003 and 2005 rights offerings, ASE Test Taiwan plans to apply for the available five-year tax holidays.
ASE Test Taiwan will also benefit in future years from other tax incentives generally available to companies in the ROC, including tax credits of 11% in 2005 and 7% in 2006 of the amount spent on qualifying machinery and equipment and tax credits set at 30% of the amount spent on qualifying research and development expenses and employee training expenses. The tax credits of ASE Test Taiwan generally expire five years following their respective grants and are available to reduce 50% of its income taxes payable in the first four years and 100% of such taxes payable in the fifth year.
The ROC government enacted the ROC Alternative Minimum Tax Act, or AMT Act, which became effective on January 1, 2006. The alternative minimum tax, or AMT, imposed under the ROC AMT Act is a supplemental tax which is payable if the income tax payable pursuant to the ROC Income Tax Act is below the minimum amount prescribed under the ROC AMT Act. The taxable income for calculating the AMT includes most income that is exempted from income tax under various legislations, such as tax holidays and investment tax credits. The AMT rate for business entities is 10%. However, the ROC AMT Act grandfathered certain tax exemptions and tax credits granted prior to the enactment of the ROC AMT Act. We currently expect the AMT to have a minimal effect on ASE Test Taiwan’s income tax expense in 2006.
On June 30, 1999, ASE Test Malaysia’s “pioneer” tax status was granted on the basis of its high technology for its “design and production of semiconductor devices” business. Its statutory income derived from the pioneer activities was fully exempted from tax for the period of five years from July 1, 1999 to June 30, 2004 and the capital allowance was claimed accordingly. The income derived from the non-pioneer activity (i.e., the letting of properties) is subject to income tax. Under the Malaysian Promotion of Investment Act, 1986, unabsorbed capital allowances accumulated during this period cannot be carried forward to the post-pioneer period.
In light of the 2003 budget of the Malaysian government, which allowed a pioneer company intending to undertake reinvestment before the expiration of its pioneer status the option to surrender its pioneer certificate and apply for a more beneficial incentive (i.e., a reinvestment allowance), ASE Test Malaysia applied for the cancellation of its pioneer certificate to be effective from September 21, 2002, the date of the government’s announcement of such option to surrender one’s pioneer certificate, and the Malaysian Industrial Development Authority accepted and agreed with their application in a letter dated September 11, 2004. ASE Test Malaysia is currently enjoying a reinvestment allowance incentive for capital expenditure incurred on factory, plant and machinery used for the purpose of expansion, modernization or automation of existing business or for diversification into related products. The reinvestment allowance claim is 60% of the qualifying capital expenditure and the allowance given is in respect of capital expenditure incurred for 15 consecutive years of assessment beginning from the year of assessment during which the allowance was first given. Since ASE Test Malaysia started claiming a reinvestment allowance in year 2003, it is eligible to claim the allowance until year 2017.
Where a reinvestment allowance is given for a year of assessment, so much of the statutory income of the company for the year of assessment as is equal to the allowance but not exceeding 70% of the statutory income is exempt from tax. Where by reason of the restriction of the allowance to 70% of the statutory income or insufficiency of statutory income, the reinvestment allowance cannot be utilized or cannot be utilized in full against statutory income of the company, the unutilized reinvestment allowance can be carried forward and used to set off future statutory income of the company.
With facilities located in special export zones such as the Nantze Export Processing Zone in Kaohsiung, Taiwan and the Bayan Lepas Free Industrial Zone in Penang, Malaysia, we and some of our subsidiaries enjoy exemptions from various import duties, commodity taxes and sales taxes on imported machinery, equipment, raw materials and components which are directly used for manufacturing finished goods. Finished goods produced by companies
47
located in such zones and exported or sold to others within the zones are exempt from otherwise applicable commodity or business taxes in Taiwan and customs duties and sales taxes in Malaysia.
As of December 31, 2005, we had deferred income tax assets of $39.9 million, net of valuation allowance of $21.6 million. These deferred tax assets primarily consisted of tax credits arising from investments in machinery and equipment and research and development expenditures of ASE Test Taiwan.We incurred a net tax expense of $2.5 million in 2005 and a net tax benefit of $21.2 million and $6.0 million in 2004 and 2003, respectively. See note 17 to our consolidated financial statements.
We are a holding company, and our only significant assets are our ownership interests in ASE Test Taiwan, ASE Test Malaysia and ISE Labs, as well as our interest in ASE Korea (a wholly owned subsidiary of ASE Investment (Labuan), of which we hold 30.0%). Accordingly, our internal sources of cash flow are primarily our share of the dividends, if any, paid by ASE Test Taiwan, ASE Test Malaysia, ISE Labs and ASE Korea.
Dividends from ASE Test Taiwan
Under existing ROC law, dividends declared by ASE Test Taiwan out of retained earnings and distributed to us are subject to ROC withholding tax, currently at the rate of 20% for non-ROC investors, such as us, holding a Foreign Investment Approval granted by the ROC Ministry of Economic Affairs, on the amount of any cash dividends or on the par value of any stock dividends. In the case of deferred-tax stock dividends distributed before January 2000, such withholding tax need not be paid by us until the time at which the shares of common stock distributed by ASE Test Taiwan as stock dividends are sold by us. Nevertheless, the law allowing for deferral of income tax on stock dividends was revoked in January 2000. As a result, dividends distributed after January 2000 are not entitled to tax deferral benefits. Except in limited circumstances, under the ROC Company Law, ASE Test Taiwan is not permitted to distribute dividends or make other distributions to shareholders in respect of any year in which it did not record net income.
The ROC Company Law also requires that 10% of annual net income as determined under ROC GAAP (less previous years’ losses and payment of taxes, if any) be set aside as a legal reserve until the accumulated legal reserve equals the paid-in capital of ASE Test Taiwan. In addition, the articles of incorporation of ASE Test Taiwan provide that, after such previous years’ losses and the payment of taxes are accounted for, and except for the certain amount of the balance that may be reserved at ASE Test Taiwan’s discretion, the remaining balance of the annual net income of ASE Test Taiwan as determined under ROC GAAP may, pursuant to a proposal made by the board of directors and approved by the shareholders, be paid (1) to the directors and supervisors as remuneration in an amount up to 2% of the annual net income of ASE Test Taiwan as determined under ROC GAAP, (2) to the employees of ASE Test Taiwan as bonuses in an amount ranging from 3% to 7% (both inclusive) of annual net income of ASE Test Taiwan as determined under ROC GAAP and (3) to the shareholders as dividends on apro ratabasis.
Dividends from ASE Test Malaysia
Section 108 Credit under the Malaysian Income Tax Act.ASE Test Malaysia is owned by our wholly-owned subsidiary, ASE Holdings (Singapore) Pte Ltd, also referred to as ASE Holdings Singapore. Under existing Malaysian law, dividends declared and paid by ASE Test Malaysia are not subject to withholding tax. Under Malaysia’s taxation system, the tax paid by a Malaysian company at the normal corporate tax rate is deemed paid by its shareholders. Thus, the shareholders receive dividends net of the tax paid by a Malaysian company. Dividends, either in cash or in any other form, received by either a resident or a non-resident of Malaysia are not subject to withholding tax. A corporate shareholder of a Malaysian company is taxed on the gross amount of dividends (namely, the cash amount of the dividend plus an amount of tax credit equal to the gross amount of dividends multiplied by the corporate income tax rate at the dividend payment date), and the tax paid by the Malaysian company effectively becomes available to its shareholders as a tax credit to offset their Malaysia income tax liability on the gross amount of dividends received. Therefore, no further Malaysian income tax will be imposed on the net dividends received by the shareholders of the Malaysian company.
Exempt Income Account – S.22(1) Promotion of Investments Act 1986 (Pioneer Income) and Section 12 Malaysian Income Tax (Amendment) Act. The dividends paid out of these exempt income accounts are exempted from income tax in Malaysia in the hands of shareholders. Income tax will not be deducted from these dividends.
Dividends from ISE Labs
ISE Labs, a California corporation, is owned by our wholly-owned subsidiary, ASE Test Holdings Limited, a Cayman Islands holding company, or ASE Test Cayman Islands. ISE Labs is subject to U.S. federal income tax on its worldwide income. Under U.S. federal income tax law, dividends received by ASE Test Cayman Islands from ISE Labs are subject to withholding tax at the rate of 30%.
48
Inflation
We do not believe that inflation in Taiwan or elsewhere has had a material impact on our results of operations.
U.S. GAAP Reconciliation
Our consolidated financial statements are prepared in accordance with ROC GAAP, which differ in certain material respects from U.S. GAAP. The following table sets forth a comparison of our net income and shareholders’ equity in accordance with ROC GAAP and U.S. GAAP as of and for the periods indicated.
| | | As of and For the Year Ended December 31, |
| |
|
|
|
|
|
|
|
|
|
|
| | | | 2003 | | | | 2004 | | | 2005 | |
| |
|
|
| |
|
| |
|
|
|
| | | (in millions) |
| Net income (loss): | | | | | | | | | | | |
| ROC GAAP | | $ | (3.5 | ) | | $ | 25.1 | | $ | (35.5 | ) |
| U.S. GAAP | | | (3.5 | ) | | | 17.9 | | | (35.4 | ) |
| Shareholders’ equity: | | | | | | | | | | | |
| ROC GAAP | | $ | 546.0 | | | $ | 599.6 | | $ | 558.2 | |
| U.S. GAAP | | | 562.5 | | | | 527.2 | | | 495.5 | |
Note 26 to our consolidated financial statements provides a description of the principal differences between ROC GAAP and U.S. GAAP as they relate to us and a reconciliation to U.S. GAAP of select items, including net income and shareholders’ equity. Significant differences between ROC GAAP and U.S. GAAP, which have a material effect on our net income as reported under ROC GAAP, include impairment of goodwill and compensation expense pertaining to bonuses to employees, directors and supervisors.
Effective January 1, 2002, we adopted U.S. SFAS No. 142, “Goodwill and other Intangible Assets”, which requires that goodwill no longer be amortized, and instead, be tested for impairment annually or more frequently if events or changes in circumstances indicate that the asset might be impaired. In conjunction with the implementation of U.S. SFAS No. 142, we completed a goodwill impairment review as of January 1, 2002 in accordance with the provision of the standard and found no impairment. U.S. SFAS No.142 also required companies to discontinue amortizing goodwill and other intangible assets with indefinite lives beginning January 1, 2002. This resulted in a decrease in amortization of approximately $10.1 million, $10.1 million and $5.0 million, respectively, for 2003, 2004 and 2005, which continued to be recorded for ROC GAAP purposes through 2005, after which goodwill amortization is no longer required under ROC GAAP. In 2003 and 2005, we found no impairment under U.S. GAAP. In 2004, we recognized an impairment loss of $41.5 million under U.S. GAAP related to goodwill from our purchase of shares of ISE Labs.
For the year ended December 31, 2004, we adopted ROC SFAS No. 35, “Accounting for Asset Impairment”. Under ROC SFAS No. 35, goodwill is evaluated at least annually to determine if it is impaired. As a result of our annual impairment review, under ROC GAAP we recognized an impairment loss of $26.5 million on goodwill from our purchase of shares of ISE Labs in 2004. See notes 3 and 9 to our consolidated financial statements.
According to ROC regulations and the articles of incorporation of ASE Inc. and ASE Test Taiwan, a portion of each company’s distributable earnings should be set aside as bonuses to employees, directors and supervisors. Bonuses to directors and supervisors are always paid in cash. However, bonuses to employees may be granted in cash or stock or both. All of these appropriations, including stock bonuses which are valued at par value of NT$10, are charged against retained earnings under ROC GAAP after such appropriations are formally approved by the shareholders in the following year. Under U.S. GAAP, such bonuses are charged against income currently in the year earned. Shares issued as part of these bonuses are recorded at fair market value. Since the amount and form of such bonuses are not usually determinable until the shareholders meeting in the subsequent year, the total amount of the aforementioned bonuses is initially accrued based on management’s estimate regarding the amount to be paid in accordance with a company’s articles of incorporation. Any difference between the initially accrued amount and the fair market value of the bonuses upon the date of shareholder approval is recognized in the year of approval by shareholders.
ASE Inc. pays the bonuses on behalf of us and does not require reimbursement. In accordance with U.S. GAAP, bonus payments made by ASE Inc. directly to ASE Test Taiwan’s employees have been recorded as compensation
49
expense, allocated to cost of revenues, research and development costs and selling, general and administrative expenses, as appropriate, and credited to capital surplus, consistent with the manner described above.
Recent U.S. GAAP Accounting Pronouncements
In November 2004, the FASB issued U.S. SFAS No. 151, “Inventory Costs – an amendment of ARB No. 43, Chapter 4”. U.S. SFAS No. 151 clarifies the accounting that requires abnormal amounts of idle facility expenses, freight, handling costs and spoilage costs to be recognized as current-period charges. It also requires that allocation of fixed production overheads to the costs of conversion be based on the normal capacity of the production facilities. U.S. SFAS No. 151 is effective for inventory costs incurred during fiscal years beginning after June 15, 2005, but early adoption is permitted during fiscal years after the date this statement is issued. We do not expect the adoption of U.S. SFAS No. 151 to impact our consolidated financial position or results of operations.
In December 2004, the FASB issued U.S. SFAS No. 123R, “Share-Based Payment”. This statement is a revision of U.S. SFAS No. 123 and supersedes APB Opinion No. 25. This statement establishes standards for the accounting for transactions in which an entity exchanges its equity instruments for goods or services, primarily focusing on the accounting for transactions in which an entity obtains employee services in share-based payment transactions. Entities will be required to measure the cost of employee services received in exchange for an award of equity instruments based on the grant-date fair value of the award (with limited exceptions). Such cost will be recognized over the period during which an employee is required to provide service, the requisite service period (usually the vesting period), in exchange for the award. The grant-date fair value of employee share options and similar instruments will be estimated using option-pricing models. If an equity award is modified after the grant date, incremental compensation cost will be recognized in an amount equal to the excess of the fair value of the modified award over the fair value of the original award immediately before the modification. This statement is effective as of the beginning of the first fiscal year beginning after June 15, 2005.
Upon adoption, we have two application methods to choose from: the modified-prospective transition approach or the modified-retrospective transition approach. Under the modified-prospective transition method, we would be required to recognize compensation cost for:
| | • | share-based awards to employees based on their grant-date fair value from the beginning of the fiscal |
| | | period in which the recognition provisions are first applied; and |
| | | |
| | • | compensation cost for awards that were granted prior to, but not vested as of, the date of adoption. |
Prior periods remain unchanged and pro forma disclosures previously required by U.S. SFAS No. 123 continue to be required. Under the modified-retrospective transition method, we would restate prior periods by recognizing compensation cost in the amounts previously reported in the pro forma footnote disclosure under U.S. SFAS No. 123. Under this method, we are permitted to apply this presentation to all periods presented or to the start of the fiscal year in which U.S. SFAS No. 123R is adopted. We would follow the same guidelines as in the modified-prospective transition method for awards granted subsequent to adoption and those that were granted and not yet vested. We adopted the modified-prospective approach and believe that the impact that adoption will have on our financial position or results of operations will be of approximately the same magnitude as our stock-based employee compensation cost disclosed in note 27(e) to our consolidated financial statements.
In December 2004, the FASB issued U.S. SFAS No. 153, “Exchanges of Nonmonetary Assets – an amendment of APB Opinion No. 29”. The amendments made by U.S. SFAS No. 153 are based on the principle that exchanges of non-monetary assets should be measured based on the fair value of the assets exchanged. Further, the amendments eliminate the exception for non-monetary exchanges of similar productive assets and replace it with a general exception for exchanges of non-monetary assets that do not have commercial substance. This statement specifies that a nonmonetary exchange has commercial substance if the future cash flows of the entity are expected to change significantly as a result of the exchange. The provisions in U.S. SFAS No. 153 are effective for non-monetary asset exchanges occurring in fiscal periods beginning after June 15, 2005 (July 1, 2005 for us). Early application of the U.S. SFAS No. 153 is permitted. The provisions of this statement shall be applied prospectively. We do not expect the adoption of U.S. SFAS No. 153 to have a material effect on our financial statements or our consolidated results of operations.
50
In March 2005, the FASB issued Interpretation No. 47, “Accounting for Conditional Asset Retirement Obligations”. Interpretation No. 47 clarifies that the term “conditional asset retirement obligation”, as used in U.S. SFAS No. 143 “Accounting for Asset Retirement Obligations,” refers to a legal obligation to perform an asset retirement activity in which the timing and/or method of settlement are conditional on a future event that may or may not be within the control of an entity. If an entity has sufficient information to reasonably estimate the fair value of an asset retirement obligation, it must recognize a liability at the time the liability is incurred. If the liability’s fair value cannot be reasonably estimated, that fact and the reasons shall be disclosed. Interpretation No. 47 is effective no later than the end of the first fiscal year ending after December 15, 2005 (December 31, 2005, for calendar-year enterprises). An entity shall recognize the cumulative effect of initially applying this Interpretation as a change in accounting principle. We adopted Interpretation No. 47 and there was no material impact to our consolidated financial position or results of operations.
In May 2005, the FASB issued U.S. SFAS No. 154, “Accounting Changes and Error Corrections.” This statement requires retrospective application for voluntary changes in accounting principle unless it is impracticable to do so. U.S. SFAS No. 154’s retrospective application requirement replaces the requirement under APB Opinion No. 20, “Accounting Changes” to recognize most voluntary changes in accounting principle by including in net income of the period of the change the cumulative effect of changing to the new accounting principle. U.S. SFAS No. 154 is effective for accounting changes and corrections of errors made in fiscal years beginning after December 15, 2005. Earlier application is permitted for accounting changes and corrections of errors occurring in fiscal periods beginning after the date this statement is issued. We do not expect the adoption of U.S. SFAS No. 154 to impact our consolidated financial position or results of operations.
In February 2006, the FASB issued U.S. SFAS No. 155, “Accounting for Certain Hybrid Financial Instruments - an amendment of FASB Statements No. 133 and 140.” U.S. SFAS No. 155 resolves issues addressed in Statement 133 Implementation Issue No. D1, “Application of Statement 133 to Beneficial Interests in Securitized Financial Assets.” U.S. SFAS No. 155 permits fair value remeasurement for any hybrid financial instrument that contains an embedded derivative that otherwise would require bifurcation, clarifies which interest-only strips and principal-only strips are not subject to the requirements of Statement 133, establishes a requirement to evaluate interests in securitized financial assets to identify interests that are freestanding derivatives or that are hybrid financial instruments that contain an embedded derivative requiring bifurcation, clarifies that concentrations of credit risk in the form of subordination are not embedded derivatives and amends Statement 140 to eliminate the prohibition on a qualifying special-purpose entity from holding a derivative financial instrument that pertains to a beneficial interest other than another derivative financial instrument. U.S. SFAS No. 155 is effective for all financial instruments acquired or issued after the beginning of an entity’s first fiscal year that begins after September 15, 2006. The fair value election provided for in this U.S. SFAS No. 155 may also be applied upon adoption of U.S. SFAS No. 155 for hybrid financial instruments that had been bifurcated under paragraph 12 of Statement 133 prior to the adoption of U.S. SFAS No. 155. Earlier adoption is permitted as of the beginning of an entity’s fiscal year, providing the entity has not yet issued financial statements for any interim period for that fiscal year. We do not expect the adoption of U.S. SFAS No. 155 to impact our consolidated financial position or results of operations.
LIQUIDITY AND CAPITAL RESOURCES
Information in this annual report from our consolidated statements of income for the years ended December 31, 2003, 2004 and 2005 has been adjusted to reflect the reclassification of our camera module assembly operations as discontinued operations. Information from our consolidated statements of cash flows has not been adjusted. See “—Discontinued Operations”.
We have historically met a significant portion of our cash requirements from cash generated from operations. In addition, we have generated cash from the exercise of stock options granted under our various share option plans. From time to time, we have incurred short-term and long-term indebtedness, including operating lease obligations. Our primary uses of cash have been to fund capital expenditures related to the expansion of our facilities and operations and for working capital requirements. If adequate funds are not available on satisfactory terms, we may be forced to curtail our expansion plans. Moreover, our ability to meet our working capital needs from cash flow from operations will be affected by the demand for our testing and packaging services, which in turn may be affected by several factors. Many of these factors are outside of our control, such as economic downturns and declines in the prices of our services caused by a downturn in the semiconductor industry. See “Item 3. Key Information––Risk Factors––Risks Relating to Our Business—Our operating results are subject to significant fluctuations, which would adversely affect the market value of your investment.” The average selling prices of our
51
testing and packaging services are likely to be subject to further downward pressure in the future. To the extent we do not generate sufficient cash flow from our operations to meet our cash requirements, we will have to rely on external financing. Our cash and cash equivalents are primarily held in Malaysian ringgit, U.S. dollars and New Taiwan dollars.
Net cash provided by operating activities amounted to $170.1 million for 2005, partially as a result of adjusting for non-cash depreciation and amortization of $154.3 million and loss on fire damage of $42.1 million. The increase in net cash provided by operating activities in 2005 was primarily a result of loss on fire damage of $42.1 million. Depreciation and amortization decreased in 2005 compared to 2004 due primarily to a net decrease in testing and assembly equipment. Net cash provided by operating activities amounted to $153.7 million for 2004, partially as a result ofadjusting for non-cash depreciation and amortization of $164.9 million. The increase in net cash generated by operating activities was primarily a result of a net income of $25.1 million in 2004, compared to a net loss of $3.5 million in 2003. Depreciation and amortization increased in 2004 compared to 2003 primarily due to the acquisition of new testing equipment in 2004. Net cash provided by operating activities amounted to $134.7 million for 2003, partially as a result of adjusting of non-cash depreciation and amortization of $142.4 million.
Net cash provided by investing activities increased to $13.8 million in 2005 from net cash used in investing activities of $253.6 million in 2004. This increase reflected a decrease in the acquisition of machinery and equipment and long-term investments and the disposal of short-term investments and machinery and equipment. Net cash used in investing activities increased to $253.6 million in 2004 from $156.6 million in 2003 primarily as a result of increases in the acquisition of machinery and equipment and short-term and long-term investments.
Net cash used in financing activities in 2005 amounted to $84.4 million. This amount primarily reflected net decreases in long-term and short-term debt. Net cash provided by financing activities in 2004 amounted to $69.4 million. This amount primarily reflected net increases in short-term and long-term debt. Net cash used in financing activities in 2003 amounted to $24.0 million. This amount primarily reflected early redemption of convertible notes of $209.0 million and repayment of long-term debt of $36.6 million, partially offset by an increase in long-term debt to $226.6 million.
We incurred capital expenditures of $50.7 million, which included the exchange of assets worth $2.8 million, in 2005, $210.7 million in 2004 and $171.3 million in 2003. These expenditures were incurred primarily for the acquisition of new testing and packaging equipment and the expansion of existing facilities. As of December 31, 2005, we had commitments of $8.8 million for capital expenditures. We have projected capital expenditures in 2006 of less than $100 million, primarily in connection with the acquisition of additional testing and packaging equipment and facility improvement. However, the actual amount of capital expenditures may vary from those budgeted for a variety of reasons, including changes in market conditions, unavailability or changes in scheduled delivery of specific equipment, changes in interest rates and other factors. In addition, we expect to continue to expand capacity in future periods. We expect to finance these expenditures from cash flow from operations and, when necessary, through debt or equity financing.
As of December 31, 2005, our primary source of liquidity was $138.2 million of cash and cash equivalents. As of December 31, 2005, we had total availability under existing short-term lines of credit of approximately $188.5 million, none of which was outstanding. As of December 31, 2005, we had working capital of $157.3 million.
Our long-term liabilities consist primarily of bank loans. As of December 31, 2005, we had outstanding long-term debt, less current portion of $49.7 million, of $245.3 million and remaining availability of $28.9 million under our long-term credit facilities. Our long-term bank loans carried variable interest rates which ranged between 1.975% and 5.73% per year as of December 31, 2005, as compared to 1.655% and 7.92% per year as of December 31, 2004. We have pledged a portion of our assets, with a carrying value of $31.9 million and $41.9 million as of December 31, 2005 and 2004, respectively, to secure our obligations under our long-term facilities.
In November 2005, ASE Inc. and ASE Test Taiwan entered into a $100.0 million three-year revolving receivables acquisition and servicing agreement with ABN Amro Bank N.V., Taipei Branch whereby ASE Inc. and ASE Test Taiwan agree to sell and ABN Amro Bank N.V., Taipei Branch agrees to buy certain eligible receivables. The total accounts receivable sold under this facility in 2005 by ASE Test Taiwan was $9.5 million. See “—Off-Balance Sheet Arrangements”.
52
In August 2005, ASE Test Finance Limited entered into a $78.0 million five-year syndicated credit facility, for which Citibank, N.A., Taipei Offshore Banking Branch and Citigroup Global Markets Asia Limited acted as arrangers and Citibank, N.A., Taipei Offshore Banking Branch acted as agent. We and ASE Inc. act as the guarantors for ASE Test Finance Limited. The proceeds were used for the repayment of loans incurred by us and ASE Test Finance in 2004. The facility bears interest at LIBOR plus 0.875% per annum.
Our 99.99% -owned subsidiary, ASE Test Taiwan, has also entered into a lease receivables purchase facility agreement in order to assist with our leasing of testing equipment. In August 2004, ASE Test Taiwan, along with ASE Inc., entered into an agreement with a syndicate of banks arranged by Citibank, N.A., Taipei Branch whereby such syndicate agrees to purchase up to $90.0 million of qualifying lease receivables from eligible leasing companies for twelve months from the date of the agreement. As evidence of the obligations entered into under the transaction, ASE Test Taiwan and ASE Inc. issued promissory notes to such leasing companies indorsed to Citibank, N.A., Taipei Branch. The leasing companies also executed a mortgage agreement granting Citibank N.A., Taipei Branch a mortgage on the leased equipment. This agreement expired in August 2005.
In June 1999, our wholly-owned subsidiary, ASE Test Finance Limited, issued $160.0 million in aggregate principal amount of 1% guaranteed convertible notes due 2004 to fund the acquisition of ISE Labs and ASE Korea. These notes were convertible at the option of the holders from December 29, 1999 through July 1, 2004. In 2000, $0.11 million in aggregate principal amount of the convertible notes were converted into our shares. No conversions were made in 2001 and 2002. In August 2003, ASE Test Finance Limited redeemed and cancelled the total outstanding convertible notes issued in June 1999 with payments of approximately $209.0 million, which resulted in an extraordinary loss of $2.2 million.
ASE Test Finance Limited financed the redemption and cancellation of the convertible notes through a syndicated credit facility and a loan from J&R Holding Limited, a subsidiary of ASE Inc. that holds our shares. In June 2003, ASE Test Finance Limited entered into a five-year syndicated credit facility, for which the total reviewed commitments under the facility amounted to $150.0 million. The loan is specified for use in the redemption of the convertible notes issued in 1999. It is repayable in semi-annual installments from June 2005 to June 2008 and bore interest of 3.63% in 2004 and 5.73% in 2005. We, our 99.99% - -owned subsidiary, ASE Test Taiwan, and ASE Inc. have guaranteed ASE Test Finance Limited’s payment obligations under the facility. Under the guaranty, we are required to maintain certain financial ratios and our tangible net worth shall not be less than $400 million at any time. In August 2003, ASE Test Finance Limited obtained a loan of $60.0 million from J&R Holding Limited, in connection with the redemption of the convertible notes issued in 1999. The loan was originally due in February 2005 but was repaid in full in July 2004. In connection with the repayment of the loan to J&R Holding Limited, in June 2004, we entered into a two-year revolving loan facility agreement for $30.0 million which was guaranteed by ASE Test Taiwan and bears interest at 3.299% .. Also in connection with the repayment of the loan to J&R Holding Limited, ASE Test Finance Limited entered into a credit facility for $30.0 million which was guaranteed by us and ASE Inc. and bears interest at 3.516% .. Both of these loans were repaid in full in 2005.
Our long-term loans and facilities contain various financial and other covenants that could trigger a requirement for early payment. Among other things, these covenants require the maintenance of certain financial ratios, such as liquidity ratio, indebtedness ratio, interest coverage ratio and other technical requirements. In general, covenants in the agreements governing our existing debt, and debt we may incur in the future, may materially restrict our operations, including our ability to incur debt, pay dividends, make certain investments and payments and encumber or dispose of assets. A default under one debt instrument may also trigger cross-defaults under our other debt instruments. An event of default under any debt instrument, if not cured or waived, could have a material adverse effect on our liquidity, as well as our financial condition and results of operations.
We and our subsidiaries have on occasion failed to comply with certain financial covenants in some of our loan agreements as a result of reduced levels of operating cash flow due primarily to a downturn in the worldwide semiconductor industry that commenced in the fourth quarter of 2000, although our cash flow has subsequently improved. Such noncompliance may also have, through broadly worded cross-default provisions, resulted in defaults under some of the agreements governing our other existing debt. We and our subsidiaries obtained waivers from the relevant lenders relating to such noncompliance. Such noncompliance has not had any significant effect on our ability to repay or refinance amounts due in respect of our existing debt. For these and other reasons, including our financial condition and our relationship with our lenders, no lender has to date sought and we do not believe that
53
any of our lenders would seek to declare a default or enforce remedies in respect of our existing debt, as a result of cross-default provisions or otherwise.
We believe that our existing cash and cash equivalents, short-term investments, expected cash flow from operations and existing credit lines will be sufficient to meet our capital expenditures, working capital, cash obligations under our existing debt and lease arrangements, and other requirements through the end of 2006. We currently hold cash and cash equivalents primarily in Malaysian ringgit, U.S. dollars and New Taiwan dollars, in addition to other currencies from time to time.We have contractual obligations of $286.1 million due in the next three years. We intend to meet our payment obligations through expected cash flow from operations, long-term debt and the issuance of additional equity or equity-linked securities. We will continue to evaluate our capital structure and may decide from time to time to increase or decrease our financial leverage through equity offerings or debt borrowings. The issuance of additional equity or equity-linked securities may result in additional dilution to our shareholders.
From time to time, we evaluate possible investments, acquisitions or divestments and may, if a suitable opportunity arises, make an investment, acquisition or divestment. We believe that after taking into account amounts available under existing banking facilities, we will have adequate working capital to meet our current requirements.
Our treasury team, under the supervision of our chief financial officer, is responsible for setting our funding and treasury policies and objectives. Our exposure to financial market risks relate primarily to changes in interest rates and foreign currency exchange rates. To mitigate these risks, we utilize derivative financial instruments, the application of which is primarily to manage these exposures, and not for speculative purposes. As of December 31, 2005, there were no outstanding interest rate swap transactions. We have entered into foreign currency option contracts to hedge our existing assets and liabilities denominated in foreign currencies and identifiable foreign currency purchase commitments. As of December 31, 2005, there was approximately $0.2 million of forward and option contracts outstanding. See “Item 11. Quantitative and Qualitative Disclosures About Market Risk—Foreign Currency Exchange Rate Risk”.
RESEARCH AND DEVELOPMENT
Our research and development efforts have focused primarily on improving the efficiency and technology of our testing services. The efforts include developing software for parallel testing of logic/mixed-signal semiconductors, rapid automatic generation and cross-platform conversion of test programs to test logic/mixed-signal semiconductors, and automatic code generation for converting and writing testing programs, testing new products using existing machines and providing customers remote access to monitor test results. We are also continuing the development of interface designs to provide for high-frequency testing by minimizing electrical noise. We work closely with our customers in designing and modifying testing software and with equipment vendors to increase the efficiency and reliability of testing equipment. Our research and development operations also include a mechanical engineering group, which currently designs handler kits for semiconductor testing and wafer probing, as well as software to optimize capacity utilization.
As of December 31, 2005, we employed 461 professionals in our research and development activities. In addition, other management and operational personnel are also involved in research and development activities but are not separately identified as research and development professionals. We incurred research and development expenditures of $19.5 million, $23.2 million and $25.0 million in 2003, 2004 and 2005, representing approximately 5.6%, 5.4% and 5.9% of our net revenues, respectively. We have historically expensed all research and development costs as incurred, and none is currently capitalized. ASE Inc. has historically shared its research and development relating to our packaging operations with ASE Test Malaysia at no cost. While such arrangements are expected to continue in the future, no assurances can be given that ASE Inc. will continue providing research and development at no cost, or at all.
OFF-BALANCE SHEET ARRANGEMENTS
ASE Inc. and ASE Test Taiwan entered into a $100.0 million, three-year revolving accounts receivable securitization agreement with a bank in November 2005. The agreement serves to increase ASE Inc.’s and ASE Test Taiwan’s financing flexibility and to meet working capital requirements. Under the agreement, ASE Inc. and ASE Test Taiwan sold accounts receivable that meet certain eligibility requirements to the bank, which issued securities to third parties backed by the accounts receivable transferred to the bank. Proceeds received from the bank equaled the net carrying value of the sold accounts receivable, less a deferred purchase price receivable at 20% of such receivables, a guarantee deposit, a program fee and other related expenses. At the time of the sale, ASE Inc. and ASE Test Taiwan lost control over the accounts receivable. After the transfer of the accounts receivable, ASE Inc. and ASE Test Taiwan continue to service, administer and collect the accounts receivable on behalf of the bank. ASE Inc. and ASE Test Taiwan collect on the initial accounts receivable sold and transfer new accounts receivable meeting the eligibility requirements with a similar value to replace the collected accounts receivable. This securitization of accounts receivable resulted in an increase in our cash inflow of US$9.4 million for 2005.
The eligibility criteria for the accounts receivable are primarily based on the accounts receivable customers’ respective credit ratings. Therefore, a change in a customer’s credit rating may cause some accounts receivable to become ineligible, requiring ASE Inc. and ASE Test Taiwan to replace such ineligible accounts receivable with new eligible accounts receivable or with cash, which may also affect ASE Inc.’s and ASE Test Taiwan’s ability to transfer additional eligible accounts receivable into the facility, and may increase ASE Inc.’s and ASE Test Taiwan’s cash outflow by the amount of the ineligible accounts receivable.
ASE Inc. and ASE Test Taiwan de-recognized accounts receivable at 80% of the carrying value, representing the portion of the sold accounts receivable on which ASE Inc. and ASE Test Taiwan do not have any recourse obligation. If ASE Inc. or ASE Test Taiwan maintain any control over these sold accounts receivable after the initial sale, the sale of these accounts receivable will no longer qualify as an off-balance sheet transaction and the total proceeds receivable from the bank would have to be recorded as borrowings in our consolidated financial statements. See note 2 and note 5 of our consolidated financial statements.
54
TABULAR DISCLOSURE OF CONTRACTUAL OBLIGATIONS
The following table sets forth our contractual obligations and commitments with definitive payment terms which will require significant cash outlays in the future, as of December 31, 2005.
| | | Payments due by Period |
| |
|
|
|
|
|
|
|
|
|
|
|
|
|
|
| Contractual Obligations | | | Total | | | Less than 1
year | | | 1-3 years | | | 3-5 years | | | More than 5
years |
| |
|
| |
|
| |
|
| |
|
| |
|
|
| | | (in millions) |
| Long-term Debt(1) | | $ | 288.1 | | $ | 46.1 | | $ | 173.2 | | $ | 68.8 | | $ | — |
| Capital (Finance) Lease Obligations(1)(2) | | | 6.9 | | | 3.6 | | | 3.3 | | | — | | | — |
| Operating Lease Obligations(3) | | | 67.2 | | | 39.0 | | | 20.9 | | | 7.3 | | | — |
| Purchase Obligations | | | — | | | — | | | — | | | — | | | — |
| |
|
| |
|
| |
|
| |
|
| |
|
|
| Total (4)(5)(6) | | $ | 362.2 | | $ | 88.7 | | $ | 197.4 | | $ | 76.1 | | $ | — |
| |
|
| |
|
| |
|
| |
|
| |
|
|
|
| (1) | Excludes interest payments. |
| |
| (2) | Capital lease obligations represent our commitment for leases of equipment. The obligations are included in the consolidated financial statements. See note 20 to our consolidated financial statements for additional details. |
| |
| (3) | Represents our commitments under leases for land, machinery and equipment such as testers, and office buildings and equipment. See note 20 to our consolidated financial statements. |
| |
| (4) | Excludes payments that vary based upon our net sales or sales volume such as commissions and service fees payments to outside sales agencies. Commissions and service fees expenses in 2005 were approximately $9.0 million. See “Item 4. Information on the Company—Business Overview—Sales and Marketing”. |
| |
| (5) | Excludes commitments to purchase equipment of approximately $8.4 million, as of December 31, 2005, which are not legally binding but which we intend to execute and therefore will likely represent a future cash outflow, and commitments for construction of a building of approximately $0.4 million, of which $0.1 million had been paid as of December 31, 2005. See note 20 to our consolidated financial statements for additional details. |
| |
| (6) | Minimum pension funding requirements are not included since such amounts have not been determined. We made pension contributions of approximately $0.4 million, $0.5 million and $0.6 million in 2003, 2004 and 2005, respectively, and we estimate that we will contribute approximately $0.5 million in 2006. See note 14 to our consolidated financial statements for additional details regarding our pension plan. |
| |
While we have guaranteed the $150.0 million credit facility and $78.0 million credit facility of our wholly-owned subsidiary, ASE Test Finance Limited, as described above in “—Liquidity and Capital Resources”, we have not entered into any financial guarantees or similar commitments to guarantee the payment obligations of third parties. In addition, we do not have any written options on non-financial assets.
Item 6. Directors, Senior Management and Employees.
DIRECTORS AND SENIOR MANAGEMENT
Directors
The following table sets forth information with respect to our directors as of April 30, 2006. Except for Mr. Jeffrey Chen and Mr. Joseph Tung, whose terms have no expiration date, the current term of our directors expires on the date of the annual general shareholders’ meeting in June 2008.
| Name | | Age | | Position | | Date of First Appointment |
| |
| |
| |
|
| Jason C.S. Chang | | 61 | | Chairman and Chief Executive Officer | | June 1996 |
| Richard H.P. Chang | | 59 | | Vice Chairman | | June 1996 |
| Raymond Lo | | 52 | | Director, President and President, ASE Test | | May 2001 |
| | | | | Taiwan | | |
| Joseph Tung | | 47 | | Director | | February 1996 |
| Jeffrey Chen | | 42 | | Director | | March 1998 |
| Freddie Liu | | 41 | | Director and Chief Financial Officer | | October 2004 |
| Chin Ko-Chien | | 60 | | Director | | June 1996 |
| Alan Cheng | | 60 | | Director | | June 1999 |
| Sim Guan Seng | | 46 | | Director | | February 1996 |
| Albert C.S. Yu | | 53 | | Director | | June 1996 |
| David D.H. Tsang | | 64 | | Director | | June 1996 |
55
Jason C.S. Chang has served as our Chairman from June 1996 to December 2000 and since April 2004. He has also served as Chairman of ASE Inc. since its founding in March 1984 and as its Chief Executive Officer since May 2003. He holds a degree in electrical engineering from National Taiwan University and a master’s degree from the Illinois Institute of Technology. He is the brother of Richard H.P. Chang, our Vice Chairman.
Richard H.P. Chang served as our Chairman from 2001 to April 2004. Mr. Chang has served as our Vice Chairman from 1996 to 2001 and since April 2004. Mr. Chang is also the Vice Chairman and President of ASE Inc. He holds a degree in industrial engineering from Chung Yuan Christian University in Taiwan. Mr. Chang is the brother of Jason C.S. Chang, our Chairman and Chief Executive Officer.
Raymond Lowas appointed President of our company in April 2004 and has served as President of ASE Test Taiwan since December 1999. Mr. Lo served as a supervisor of ASE Inc. from July 2000 to April 2006, when he began serving as a director of ASE Inc. Mr. Lo holds a degree in electrophysics from National Chiao-Tung University in Taiwan.
Joseph Tung has served as a director of our company since 1996. Mr. Tung served as our Chief Financial Officer from 1996 until 1998. Mr. Tung has also served as Chief Financial Officer of ASE Inc. since January 1995, and as a director of ASE Inc. since April 1997. Prior to joining ASE Inc., he was Vice President of corporate banking at Citibank, N.A., in Taipei, Taiwan. He holds a degree in economics from National Chengchi University in Taiwan and a master’s degree in business administration from the University of Southern California.
Jeffrey Chen has served as a director of our company since 1998 and a director of ASE Inc. since June 2003. He served as our Chief Financial Officer from July 1998 to August 2002. Mr. Chen is also a Vice President of ASE Inc. and a Special Assistant to the Chairman of ASE Inc. Prior to joining ASE Inc., Mr. Chen worked in the corporate banking department of Citibank, N.A., in Taipei and as the Vice President of corporate finance at Bankers Trust in Taipei, Taiwan. He holds a degree in finance and economics from Simon Fraser University in Canada and a master’s degree in business administration from the University of British Columbia in Canada.
Freddie Liu has served as a director of our company since October 2004 and has also served as the Financial Controller of the ASE Group since August 2002 and the Chief Financial Officer of ASE Test Limited since March 2004. Mr. Liu joined the ASE Group in February 1997. Prior to joining the ASE Group, Mr. Liu was a Vice President of corporate banking at Citibank, N.A. in Taipei. He holds a degree in diplomacy from the National Chengchi University in Taiwan and a master’s degree in business administration from the University of Michigan.
Chin Ko-Chien has served as a director of our company since 1996 and a director of ASE Test Taiwan since December 1994. Mr. Chin is also a supervisor of ASE Inc., where he worked from March 1984 to April 2006. He holds a degree in marine engineering from the National Taiwan Ocean University in Taiwan.
Alan Cheng has served as a director of our company since 1999 and is the Chairman of H.R. Silvine Electronics, Inc. as well as a director of ASE Inc. and Hung Ching Development & Construction Co., Ltd., an affiliate of ASE Inc. Mr. Cheng holds a degree in industrial engineering from Chung Yuan Christian University in Taiwan and a master’s degree in industrial engineering from Rhode Island University.
Sim Guan Seng has served as a director of our company since1996 and is a certified public accountant in Singapore and the sole proprietor of Sim Guan Seng & Co. Mr. Sim held various positions at Arthur Andersen and at GK Goh Stockbrokers in Singapore from 1983 to 1991. He holds a degree in accountancy from the National University of Singapore.
Albert C.S. Yu has served as a director of our company since 1996 and a director of ASE Test Taiwan from December 1994 to June 2002. Mr. Yu has been the publisher and chairman of theChina Times, a Chinese language newspaper in Taiwan, since 1984. He holds a master’s degree in business administration from San Francisco University.
David D.H. Tsang has served as a director of our company since 1996 and is the founder of Oak Technology, Inc. Prior to founding Oak Technology, Mr. Tsang founded and served as President and Chairman of Data Technology Corp., a manufacturer of disk controllers and high density disk drives. He holds a degree in electrical engineering from Brigham Young University and a master’s degree in electrical engineering from the University of Santa Clara.
56
Executive Officers
The following table sets forth information with respect to our executive officers as of April 30, 2006.
| Name | | Age | | Position |
| |
| |
|
| Jason C.S. Chang | | 61 | | Chairman and Chief Executive Officer |
| Raymond Lo | | 52 | | President and President, ASE Test |
| | | | | Taiwan |
| Freddie Liu | | 41 | | Chief Financial Officer |
| Lee Kwai Mun | | 44 | | President, ASE Test Malaysia |
| Tien Wu | | 49 | | Chief Executive Officer, ISE Labs |
| Kenneth Hsiang | | 36 | | President, ISE Labs |
Jason C.S. Chang. See “—Directors”.
Raymond Lo.See “—Directors”.
Freddie Liu.See “—Directors”.
Lee Kwai Mun has served as the President of ASE Test Malaysia since March 2006. Before joining ASE Test Malaysia, Mr. Lee was a special assistant to the General Manager of our packaging facility in Kaohsiung, Taiwan. He holds a degree in mechanical engineering from Chung Kung University in Taiwan.
Tien Wu has served as the Chief Executive Officer of ISE Labs since March 2003 and a director of ASE Inc. since June 2003. Mr. Wu has also served as Chief Operating Officer of ASE Inc. since April 2006, prior to which he served as the Vice President of worldwide marketing and strategy of the ASE Group. Prior to joining ASE Inc. in March 2000, he held various management positions with IBM. He holds a B.S.C.E. degree from the National Taiwan University and a master’s in mechanical engineering and a doctorate in applied mechanics from the University of Pennsylvania.
Kenneth Hsiang has served as the President of ISE Labs since June 2004. Since joining ASE in 1999, Mr. Hsiang has worked in various financial and strategic planning roles within in the ASE Group. Prior to joining the ASE Group, Mr. Hsiang held various positions at Connetics and PricewaterhouseCoopers. Mr. Hsiang is a Certified Public Accountant in California and holds bachelors degrees in economics and rhetoric from the University of California, Berkeley. Mr. Hsiang is the nephew of the wife of Jason C.S. Chang, our Chairman.
Other than disclosed in this annual report, there is no family relationship between any of our directors and executive officers and any other director or executive officer. We and our subsidiaries do not have service contracts with our directors that provide for benefits upon termination of employment.
COMPENSATION
The aggregate cash compensation paid in 2005 to our directors and executive officers was approximately $2.5 million. In 2005, we made provisions for retirement benefits for our executive officers. We did not pay any remuneration in kind to our directors, supervisors or executive officers in 2005.
Share Option Plans
We currently maintain three option plans, which included plans adopted in 1999, 2000, and 2004. Under our share option plans, our directors, employees, advisers, consultants and our affiliates, some of whom serve as ASE Inc.’s directors, supervisors and employees, may, at the discretion of a committee of our board of directors administering the plan, be granted options to purchase our shares at an exercise price of no less than their market value on the date of grant. The committee has complete discretion to determine which eligible individuals are to receive option grants, the number of shares subject to each grant, the vesting schedule for each option grant and the maximum term for which each granted option is to remain outstanding, up to a maximum term of ten years. Our board of directors may amend or modify the plans at any time. As of December 31, 2005, an aggregate of 16,500,000 of our shares had been reserved for issuance and 10,491,064 options to purchase our shares remained outstanding under our various option plans. An aggregate of 4,945,000 options (of which 4,870,000 were outstanding as of December 31, 2005) had been granted to our directors and
57
executive officers. Options granted under the various plans are exercisable at an exercise price ranging from $6.10 to $25.00 per share.
ASE Inc. currently maintains two option plans, which include plans adopted in 2002 and 2004. Pursuant to these plans, full-time employees of ASE Inc. as well as the full-time employees of ASE Inc.’s domestic and foreign subsidiaries are eligible to receive stock option grants. Each option entitles the holder to purchase one common share of ASE Inc. at a price equal to the closing market price on the date of the option issuance, such exercise price being subject to retroactive adjustment in the event of certain capital transactions in subsequent periods. Each option is exercisable upon vesting for five years. Forty percent of the options originally granted vest upon the second anniversary of the grant date, and an additional 10% of the options originally granted vest every six months thereafter. Each option expires at the end of the 10th year following its grant date. The options are generally not transferable. As of December 31, 2005, ASE Inc. had granted a total of 159,968,000 options under the 2002 plan, 145,989,000 of which were granted at an original exercise price of NT$20.80 per share (currently adjusted to NT$16.10 per share) and 13,979,000 of which were granted at an original exercise price of NT$24.60 per share (currently adjusted to NT$21.00 per share). As of December 31, 2005, ASE Inc. had granted a total of 139,917,000 options under the 2004 plan, 124,917,000 of which were granted with an original exercise price of NT$26.60 per share (currently adjusted to NT$22.70 per share) and 15,000,000 of which were granted at an original exercise price of NT$20.55 per share (currently adjusted to NT$18.60 per share).In 2004 and 2003, ASE Inc. granted 10,500,000 and 750,000 options, respectively, to our directors and executive officers. In 2005, ASE Inc. did not grant any options to our directors and executive officers.
Bonus Plans
We award bonuses to our employees at ASE Test Taiwan based on overall income and individual performance targets. All our employees at ASE Test Taiwan are eligible to receive bonuses. Our employees at ASE Test Taiwan received cash bonuses of an aggregate of $2.2 million and $3.8 million in 2004 and 2005. We did not distribute cash bonuses to employees in 2003.
Starting in 1994, ASE Inc. included employees of its subsidiaries in Taiwan in its existing employee bonus plan. Pursuant to this arrangement, our employees in Taiwan are eligible for cash and share bonuses based on ASE Inc.’s consolidated net income and our contribution to its consolidated net income. We did not contribute to the plan in 2003, 2004 and 2005. Bonuses are given in cash and ASE Inc.’s common shares, valued at par value of NT$10 per share, at the discretion of ASE Inc. Actual amounts of bonuses to individual employees are determined based upon the employee meeting specified individual performance objectives. ASE Inc. granted no share awards to our employees in 2003. It granted an aggregate of 1,737,586 shares in 2004 as share awards to our employees with a fair market value at the date of our shareholders’ approval of $1.1 million.It granted an aggregate of 3,539,787 shares in 2005 as share awards to our employees with a fair market value at the date of our shareholders’ approval of $2.7 million.We expect ASE Inc. to continue this practice in future periods. Share bonuses which are valued at par value of NT$10 are charged against retained earnings under ROC GAAP after such appropriations are formally approved by the shareholders in the following year. Under U.S. GAAP, such bonuses are charged against income currently in the year earned. Shares issued as part of these bonuses are recorded at fair market value. Since the amount and form of such bonuses are not usually determinable until the shareholders’ meeting in the subsequent year, the total amount of the aforementioned bonuses is initially accrued based on management’s estimate regarding the amount to be paid in accordance with our Memorandum and Articles of Association. Any difference between the initially accrued amount and the fair market value of the bonuses upon the issuance of shares is recognized in the year of approval by shareholders. Because these were shares of ASE Inc., the issuance of these shares will not have a dilutive effect on our shareholders.
Pension Plan
ASE Test Taiwan has a defined benefit pension plan covering participating regular employees. Retirement benefits are based on length of service and average salaries or wages in the last six months before retirement. Under this defined benefit pension plan, ASE Test Taiwan makes monthly contributions, at 2% of salaries and wages, to a pension fund which is deposited in the name of, and administered by, the employees’ pension plan committee. Under the ROC Labor Pension Act, effective July 1, 2005, employees of ROC companies, including ASE Test Taiwan, may elect to participate in a “portable” defined contribution pension plan under the new law instead of the defined benefit
58
pension plan. Under the ROC Labor Pension Act, all ROC companies to contribute at least 6% of participating employees’ monthly salaries to the pension fund accounts of such employees. Most of the employees of ASE Test Taiwan have elected to participate in the portable defined contribution pension plan under the ROC Labor Pension Act. Employees hired after the effectiveness of the new law participate in the new portable pension plans. See “Item 5. Operating and Financial Review and Prospects—Operating Results and Trend Information—ROC Labor Pension Act” and note 14 of the notes to our consolidated financial statements. Our accrued pension cost was $4.0 million, $5.1 million and $6.4 million as of December 31, 2003, 2004 and 2005, respectively.
ISE Labs has a defined “401k” contribution savings plan for eligible employees that permits employees to make contributions up to the maximum limits allowable under Internal Revenue Code Section 401k. ASE Test Malaysia also has a defined contribution plan.
BOARD PRACTICE
Audit Committee
Our board of directors established an audit committee in June 2002. The audit committee is appointed by the board of directors and currently consists of Alan Cheng, who is an independent director and financially literate with accounting or related financial management expertise. The audit committee has responsibility for, among other things, overseeing the qualifications, independence and performance of our independent auditors and the integrity of our financial statements.
Differences between Nasdaq Corporate Governance Requirements and Home Country Practices
Nasdaq allows foreign private issuers, such as us, to follow home-country practice in lieu of certain of its corporate governance rules. Nasdaq also provides exemptions from certain of its corporate governance requirements for companies of which more than 50% of the voting power is held by an individual, group or company. As such, we are exempt from compliance with the following Nasdaq rules.
Pursuant to Nasdaq rules, independent directors must comprise a majority of the board of directors. We are exempt from the Nasdaq rules pertaining to independent directors by virtue of the fact that we are a “controlled company” as a result of ASE Inc.’s beneficial ownership of more than 50% of our ordinary shares. Our board of directors has one independent director who meets the criteria set forth in Rule 10A-3 of the Exchange Act.
Pursuant to Nasdaq rules, independent directors are required to hold regularly scheduled meetings at which only independent directors are present. As permitted by home-country practice, we do not hold such executive sessions.
Pursuant to Nasdaq rules, the compensation of the executive officers and the nomination of directors must be determined, or recommended to the board, either by a majority of the independent directors or an independent committee. We are exempt from these requirements by virtue of the fact that we are a “controlled company” as a result of ASE Inc.’s beneficial ownership of more than 50% of our ordinary shares.
Pursuant to Nasdaq rules, companies must have an audit committee whose members meet certain independence requirements, in addition to the independence requirements of the Exchange Act. As permitted by home-country practice, our audit committee member meets the independence requirements of the Exchange Act.
Pursuant to Nasdaq rules, companies must have an audit committee charter that meets certain requirements. Our audit committee charter does not satisfy all the requirements of the Nasdaq rules. Our audit committee charter satisfies the requirements of the Rule 10A-3 of the Exchange Act. Pursuant to Nasdaq rules, the audit committee charter must specify the audit committee’s responsibility for ensuring its receipt from the independent auditors of a formal written statement delineating all relationships between the independent auditor and the company and the audit committee’s responsibility for actively engaging in a dialogue with the independent auditor with respect to any disclosed relationships or services that may impact the objectivity and independence of the auditor and for taking, or recommending that the full board take, appropriate action to oversee the independence of the independent auditor. As permitted by home-country practice, our audit committee charter satisfies the requirements of Rule 10A-3 of the Exchange Act and provides that our audit committee is responsible for assessing and overseeing the independence of our independent auditors.
59
Pursuant to Nasdaq rules, companies are required to solicit proxies and provide proxy statements for all shareholder meetings and furnish copies of such proxy solicitation to Nasdaq. Under Singapore law, we are only required to send notices of general meetings of shareholders in the manner prescribed by our Articles of Association and the Singapore Companies Act. Under Singapore law, we are not required to solicit proxies in connection with our shareholder meetings. We distribute notices of our shareholder meetings along with a proxy statement and proxy cards to shareholders.
EMPLOYEES
We had 7,115, 9,201 and 5,630 employees as of December 31, 2003, 2004 and 2005, respectively. The following table sets forth certain information concerning our employees as of the dates indicated:
| | | | As of December 31, |
| | |
|
|
|
|
|
| | | | 2003 | | 2004 | | 2005 |
| | |
| |
| |
|
| Total | | 7,115 | | 9,201 | | 5,630 |
| Function | | | | | | |
| | Direct labor | | 4,173 | | 5,833 | | 2,850 |
| | Indirect labor | | 1,924 | | 2,150 | | 1,663 |
| | Selling, general and administrative | | 603 | | 729 | | 656 |
| | Research and development | | 415 | | 489 | | 461 |
| Location | | | | | | |
| | Taiwan | | 2,511 | | 2,906 | | 2,693 |
| | Malaysia | | 4,207 | | 5,787 | | 2,437 |
| | United States | | 273 | | 195 | | 197 |
| | Hong Kong | | 8 | | 9 | | 0 |
| | Singapore | | 116 | | 304 | | 303 |
Our employees are not covered by any collective bargaining agreements. We have not experienced any strikes or work stoppages by our employees and believe that our relationship with our employees is good. Eligible employees may participate in the ASE Inc. employee share bonus plan and stock option plan as well as our share option plans. See “—Compensation”.
SHARE OWNERSHIP
The following table sets forth certain information with respect to our directors and officers as of April 30, 2006.
| Officer or Director | | Number of
Ordinary
Shares Held | | Percentage of
Total Ordinary
Shares Issued
and Outstanding | | | Number of
Options
Held(1) | | Exercise Price
of Options
($) | | Expiration Date of
Options |
| |
| |
|
| |
| |
| |
|
| Jason C.S. Chang | | 183,908 | | 0.2 | % | | 2,240,000 | | 8.875 – 20.00 | | 8/10/09 – 12/11/13 |
| Richard H.P. Chang | | 1,046,276 | | 1.0 | % | | 1,260,000 | | 6.10 – 20.00 | | 8/10/09 – 12/11/13 |
| Raymond Lo | | — | | — | | | * | | 6.10 – 25.00 | | 8/10/2009 – 12/11/2013 |
| Joseph Tung | | 143,000 | | 0.1 | % | | * | | 6.10 – 12.95 | | 1/5/2011 – 12/11/2013 |
| Jeffrey Chen | | — | | — | | | * | | 6.10 – 12.95 | | 1/5/2011 – 12/11/2013 |
| Freddie Liu | | 16,000 | | † | | | * | | 8.875 – 20.00 | | 8/10/2009 – 12/11/2013 |
| Chin Ko-Chien | | 4,672 | | † | | | * | | 6.10 – 12.95 | | 1/5/2011 – 12/11/2013 |
| Alan Cheng | | — | | — | | | * | | 6.10 – 9.00 | | 11/13/2001 – 11/7/2012 |
| Sim Guan Seng | | — | | — | | | — | | — | | — |
| Albert C.S. Yu | | 45,176 | | † | | | * | | 6.10 – 9.00 | | 11/13/2011 – 11/7/2012 |
| David D.H. Tsang | | 20,000 | | † | | | * | | 6.10 – 9.00 | | 11/13/2011 – 11/7/2012 |
| Lee Kwai Mun | | — | | — | | | 40,000 | | 9.79 | | 4/18/2016 |
| Tien Wu | | 11,000 | | † | | | * | | 8.875 – 25.00 | | 8/10/2009 – 12/11/2013 |
| Kenneth Hsiang | | — | | — | | | 40,000 | | 8.875 – 20.00 | | 8/10/2009 – 12/11/2013 |
|
| (1) | Each option covers one ordinary share. |
| | |
| * | The sum of the number of options held and the number of options issuable upon exercise of all options held is less than 1% of our total outstanding common shares. |
| | |
| † | Percentage is less than 0.1% . |
60
As of April 30, 2006, our directors and executive officers as a group held options covering an aggregate of 4,910,000 shares, of which options with respect to 4,279,000 shares were exercisable as of that date.
Item 7. Major Shareholders and Related Party Transactions.
MAJOR SHAREHOLDERS
We are majority-owned by ASE Inc. ASE Inc. is one of the world’s largest independent providers of semiconductor packaging services and, through its majority ownership of us, one of the largest independent providers of semiconductor testing services. ASE Inc. was founded by Mr. Jason C.S. Chang, our Chairman, and his brother, Mr. Richard H.P. Chang, our Vice-Chairman, and was incorporated in 1984. ASE Inc.’s shares have been listed on the Taiwan Stock Exchange since July 1989, and its American depositary shares have been listed on the New York Stock Exchange since September 2000.
As of April 30, 2006, ASE Inc. indirectly owned approximately 51.0% of our outstanding shares through two wholly-owned Bermuda subsidiaries, J&R Holding Limited and ASE Holding Limited. ASE Inc., as our major shareholder, does not have voting rights different from other shareholders. However, as a result of ASE Inc.’s substantial share ownership, it is in a position to control actions that require shareholders’ approval, including the timing and payment of dividends and the election of our entire board of directors.See “Item 3. Key Information—Risk Factors—Risks Relating to Our Business—Our interests may conflict with those of our controlling shareholder, who may take actions that are not in our shareholders’ best interest”.
The following table sets forth certain information regarding (1) ownership of our shares by each person who is known to us to be the owner of more than 5% of our shares and (2) ownership of our shares by our directors and executive officers as a group, as of April 30, 2006.
| Identity of Person or Group | | Number of
Shares Owned | | Percent Owned |
| |
|
| |
|
|
| ASE Inc(1) | | 50,985,143 | (1) | | 51.0 | % |
| FMR Corp.(2) | | 8,891,800 | | | 8.9 | % |
| Wasatch Advisors, Inc.(3) | | 5,971,636 | | | 6.0 | % |
| Directors and executive officers as a group(4) | | 1,470,032 | | | 1.5 | % |
|
| (1) | Owned through J&R Holding Limited and ASE Holding Limited, wholly-owned subsidiaries of ASE Inc. |
| |
| (2) | Beneficial ownership information as of December 31, 2005 as reported by FMR Corp.’s and Edward C. Johnson 3d’s Schedule 13G filed jointly with the SEC on February 14, 2006. Members of the family of Edward C. Johnson 3d, Chairman of FMR Corp., are the predominant owners of Series B shares of common stock of FMR Corp., representing 49% of the voting power of FMR Corp. We do not have any information with respect to the ownership of our common shares by FMR Corp. other than what is disclosed in their Schedule 13G filed on February 14, 2006. |
| |
| (3) | Beneficial ownership information as of December 31, 2005 as reported by Wasatch Advisors, Inc.’s Schedule 13G filed with the SEC on February 14, 2006. We do not have any information with respect to ownership of our common shares by Wasatch Advisors, Inc other than what is disclosed in its Schedule 13G filed February 14, 2006. |
| |
| (4) | Excludes shares issuable under currently exercisable options and shares held directly by J&R Holding Limited and ASE Holding Limited, which certain directors and executive officers may be deemed to beneficially own. |
As of April 28, 2006, approximately 100.1 million of our shares were outstanding. We believe that, of such number, approximately 45.2 million shares were held by approximately 1,805 holders in the United States.
Other than:
- FMR Corp. becoming the beneficial owner of more than 5% of our common shares in 2005; and
- Wasatch Advisors, Inc. becoming the beneficial owner of more than 5% of our common shares in 2005;
there were no changes in our major shareholders or significant changes in the percentage ownership of any of our major shareholders in 2003, 2004 and 2005.
61
RELATED PARTY TRANSACTIONS
ASE Inc. and ASE Test Taiwan from time to time jointly market turnkey services provided at their respective Taiwan facilities. We expect that in future periods a significant portion of our net revenues from testing services will continue to be derived from customers who are also customers of ASE Inc.
In recent years, ASE Inc. has made awards of its shares to our employees at ASE Test Taiwan as part of their compensation, based in part on the consolidated net income of ASE Inc. and our contribution to the consolidated income. ASE Inc. did not grant any stock awards to our employees at ASE Test Taiwan in 2003. In 2004, ASE Inc. granted 1,737,586 shares as stock awards to our employees at ASE Test Taiwan with a fair market value at the time of our shareholders’ approval of $1.1 million. In 2005, ASE Inc. granted 3,539,787 shares as stock awards to our employees at ASE Test Taiwan with a fair value at the time of our shareholders’ approval of $2.7 million. We expect that ASE Inc. will continue this practice in future periods.
ASE Test Taiwan has historically charged ASE Inc. fees for the testing of semiconductors packaged for a small number of customers that prefer to be billed through ASE Inc. for testing services performed by ASE Test Taiwan. These fees amounted to $13.6 million, $16.8 million and $44.6 million in 2003, 2004 and 2005, respectively.
ASE Test Malaysia has historically purchased a portion of the raw materials used in its packaging operations, principally leadframes, from ASE Inc. Additionally, after ASE Material’s merger into ASE Inc. on August 1, 2004, through which ASE Inc. assumed ASE Material’s interconnect materials operations, ASE Inc. began providing substrates to ASE Test Malaysia. These types of raw materials are typically sold by ASE Inc. to ASE Test Malaysia at the prevailing market price. Purchases of raw materials by ASE Test Malaysia amounted to $0.3 million, $2.7 million and $5.4 million in 2003, 2004 and 2005, respectively.
In 2003 and 2004, ASE Test Malaysia purchased raw materials, primarily leadframes and substrates, from ASE Material before it was merged into ASE Inc. on August 1, 2004, in the aggregate amount of $8.8 million and $3.4 million, respectively. These types of raw materials were typically sold by ASE Material to ASE Test Malaysia at the prevailing market price.
ASE Inc. has historically shared its research and development relating to packaging with ASE Test Malaysia at no cost. While ASE Inc. intends to continue such arrangements in the future, if ASE Inc. discontinued such arrangements, ASE Test Malaysia would have to develop the capability for, and bear the cost of, research and development relating to packaging.
ASE Inc. has in the past guaranteed some of our borrowings and may from time to time provide similar guarantees in the future. From time to time, some of our directors have guaranteed certain of our borrowings.
In April 2003, ASE Inc. and Hung Ching entered into an agreement for the construction of a building in the Nantze Export Processing Zone on land currently leased by ASE Inc. Under the agreement, Hung Ching bore all costs relating to the development. ASE Inc. and ASE Test Taiwan purchased Hung Ching’s interest in the development in January 2005. ASE Inc. owns the first eight floors of the building with floor space of approximately 940,000 square feet, and ASE Test Taiwan owns the remaining two floors with floor space of approximately 232,000 square feet. We use ASE Test Taiwan’s floor space to house part of our operations in Kaohsiung, Taiwan. The total cost to us of the construction project was $10.3 million.
We lease a small portion of our production facilities in Kaohsiung and Chung Li, Taiwan from ASE Inc. We also lease a small portion of our production facilities in Kaohsiung, Taiwan to ASE Inc.
In July 2004, ASE Inc., through its subsidiary J&R Holding Limited, purchased all of the outstanding shares of ASE (U.S.) Inc. from Y.C. Hsu, ASE (U.S.) Inc.’s sole shareholder, for a purchase price of $4.6 million. ASE (U.S.) Inc. is now ASE Inc.’s wholly-owned subsidiary. In 2004 and 2005, we paid $7.0 million and $7.7 million, respectively, in fees and service charges to ASE (U.S.) Inc.
On August 1, 2004, ASE Chung Li and ASE Material merged, pursuant to a merger agreement dated October 28, 2003, with and into ASE Inc. with ASE Inc. as the surviving corporation. The merger was consummated by means of a share exchange pursuant to which we, along with other respective shareholders, other than ASE Inc., of ASE Chung Li and ASE Material, received shares of ASE Inc. in exchange for the common shares of each of ASE Chung Li and ASE Material. ASE Inc. issued 282,315,437 common shares in connection with the merger,
62
representing approximately 7.9% of its outstanding shares as of October 28, 2003 before giving effect to such issuance. In connection with ASE Inc.’s merger with ASE Chung Li, ASE Inc. issued 149,175,000 of its common shares to us, 79,914,225 of its common shares to J&R Holding, its wholly-owned subsidiary, and four common shares to certain individuals who were the original shareholders of ASE Chung Li. The merger with ASE Chung Li had a transaction value of approximately NT$7,101.8 million, based on NT$31.00 per ASE Inc. common share, which was the average of the closing prices of ASE Inc.’s common shares on the Taiwan Stock Exchange for two days prior to and following October 28, 2003. In connection with its merger with ASE Material, ASE Inc. issued 5,000,000 of its common shares to ASE Test Taiwan, one of our consolidated subsidiaries, 1,086,800 of its common shares to Hung Ching, our affiliate, and 47,139,409 of its common shares to employees and other shareholders, other than ASE Inc., of ASE Material and a strategic investor. The merger with ASE Material had a transaction value of approximately NT$1,650.0 million, based on NT$31.00 per ASE Inc. common share, which was the average of the closing prices of ASE Inc.’s common shares on the Taiwan Stock Exchange for two days prior to and following October 28, 2003. In connection with its merger with ASE Material, Richard H.P. Chang, our Vice Chairman, in his individual capacity as a shareholder and director of ASE Material, also received common shares of ASE Inc. in exchange for common shares of ASE Material held by him.
All of the former assets and liabilities of ASE Chung Li and ASE Material are owned and have been assumed by ASE Inc. and the operations of ASE Chung Li and ASE Material have been integrated with the operations of ASE Inc. The merger agreement was approved by the board of directors and shareholders of each of ASE Inc., ASE Chung Li and ASE Material.
In order to comply with Singapore law, trusts organized under ROC law have been established to hold and dispose of the 149,175,000 common shares of ASE Inc. issued to us and the 5,000,000 common shares of ASE Inc. issued to ASE Test Taiwan in connection with the merger. Under Section 76(1)(b)(ii) of the Companies Act, Chapter 50, of Singapore, we, as a Singapore company, may not purport to acquire, directly or indirectly, shares or units of shares in ASE Inc., our parent company. Pursuant to the applicable trust agreements, the trustee under each trust is (1) the registered owner of the common shares, (2) authorized to exercise all of the rights as a shareholder of the common shares, (3) authorized to sell the common shares, subject to market conditions, when such common shares become available for resale under ROC law and in accordance with volume limitations under ROC law, at its sole discretion; provided such common shares are sold (i) in compliance with ROC laws and regulations, (ii) in an orderly manner in order to minimize the impact on the trading price of the common shares, and (iii) in a manner consistent with its fiduciary duties owed to us, and (4) able to transfer and deliver the proceeds from the sale of the common shares and any cash dividends distributed by ASE Inc. to us or ASE Test Taiwan, as the case may be. Neither ourselves nor ASE Test Taiwan have any rights with respect to the common shares held in trust pursuant to the applicable trust agreements other than the right to receive the proceeds from the sale of such common shares and cash dividends declared while the shares remain in trust.
In August 2003, ASE Test Finance Limited obtained a loan of $60.0 million from J&R Holding Limited in connection with the redemption of the convertible notes issued in 1999. The loan was originally due in February 2005 but was repaid in full in July 2004. In connection with the repayment of the loan to J&R Holding Limited in June 2004, we entered into a two-year revolving loan facility agreement for $30.0 million which was guaranteed by ASE Test Taiwan and bears interest at 3.299% . Also in connection with the repayment of the loan to J&R Holding Limited, ASE Test Finance Limited entered into a credit facility for $30.0 million which was guaranteed by ourselves and bears interest at 3.516% . Both of these loans were repaid in full in 2005.
INTERESTS OF EXPERTS AND COUNSEL
Not applicable.
Item 8. Financial Information.
CONSOLIDATED STATEMENTS AND OTHER FINANCIAL INFORMATION
Our consolidated financial statements are set forth under “Item 18. Financial Statements.”
Litigation
We are not involved in material legal proceedings the outcome of which we believe would have a material adverse effect on us.
63
Dividends And Dividend Policy
To date, we have not distributed any dividends. We intend to retain our earnings to finance the development and expansion of our business and operations and do not intend to pay cash dividends for the foreseeable future. See “Item 10. Additional Information—Memorandum and Articles of Association—Dividends” and “Item 10. Additional Information—Memorandum and Articles of Association—Stock Dividends and Rights Issue” for a description of the provisions of our Memorandum and Articles of Association relating to dividend distributions.
SIGNIFICANT CHANGES
Other than as disclosed elsewhere in this annual report, we have not experienced any significant changes since the date of the annual financial statements.
Item 9. The Offering and Listing.
OFFERING AND LISTING DETAILS
Our shares are traded on the Nasdaq National Market under the symbol “ASTSF”. Public trading of our shares commenced on June 6, 1996. Prior to that time, there was no public market for our shares. The following table sets forth the high and low sales prices for the shares for the periods indicated as reported by theNasdaq National Market for the periods indicated.
| | | | Ordinary Share Price |
| | |
|
|
|
|
|
| | | | | High | | | Low |
| | |
|
| |
|
|
| 2001 | | $ | 17.44 | | $ | 6.80 |
| 2002 | | | 16.68 | | | 2.88 |
| 2003 | | | 15.00 | | | 2.58 |
| 2004 | | | 16.30 | | | 4.40 |
| | First Quarter | | | 16.30 | | | 9.58 |
| | Second Quarter | | | 12.79 | | | 5.96 |
| | Third Quarter | | | 7.40 | | | 4.40 |
| | Fourth Quarter | | | 7.68 | | | 5.25 |
| 2005 | | | 8.37 | | | 4.50 |
| | First Quarter | | | 6.98 | | | 4.50 |
| | Second Quarter | | | 6.97 | | | 4.65 |
| | Third Quarter | | | 8.37 | | | 5.49 |
| | Fourth Quarter | | | 8.15 | | | 5.33 |
| | December | | | 8.15 | | | 6.38 |
| 2006 | | | | | | |
| | First Quarter | | | 9.85 | | | 6.65 |
| | January | | | 8.03 | | | 6.65 |
| | February | | | 8.71 | | | 7.38 |
| | March | | | 9.85 | | | 8.09 |
| | Second Quarter (through June 9) | | | 11.85 | | | 8.36 |
| | April | | | 11.54 | | | 9.11 |
| | May | | | 11.85 | | | 8.70 |
| | June (through June 9) | | | 9.77 | | | 8.36 |
| | | | | | | | |
Source: Nasdaq National Market database The last reported sale price of the shares on the Nasdaq National Market as of June 9, 2006 was $8.93. As of April 30, 2006, there were 25 members who were holders of record of our shares.
Taiwan depositary shares, or TDSs, representing our ordinary shares are listed on the Taiwan Stock Exchange. The Taiwan Stock Exchange is an auction market where securities traded are priced according to supply and demand through announced bid and ask prices. Each TDS represents .0125 of one share and has undergone corresponding stock splits effected on February 8, 1998 and April 4, 1999. In limited circumstances, shareholders may deposit shares in exchange for TDSs, subject to certain restrictions on the re-issuance of TDSs. The total number of TDSs outstanding is limited so that additional TDSs may be re-issued only upon cancellation by a current holder and subject to our approval. As of April 30, 2006, there were approximately 830.1 million TDSs representingapproximately 10.4 million shares outstanding.
64
Public trading of our TDSs commenced on January 8, 1998, under the symbol “9101”. Prior to that time, there was no public market for the TDSs. The Taiwan Stock Exchange generally experiences greater fluctuations than the Nasdaq National Market or other national stock exchanges or quotation systems. As a result, the TDSs generally experience greater price volatility than our shares. The following table sets forth the high and low bid prices for the TDSs as reported by the Taiwan Stock Exchange for the periods indicated:
| | | | TDS Prices |
| | |
|
|
|
|
|
| | | | High | | Low |
| | |
|
| |
|
|
| 2001 | | NT$ | 8.40 | | NT$ | 3.10 |
| 2002 | | | 7.35 | | | 4.95 |
| 2003 | | | 6.30 | | | 1.66 |
| 2004 | | | 6.80 | | | 2.75 |
| 2005 | | | 3.43 | | | 2.32 |
| | First Quarter | | | 3.12 | | | 2.54 |
| | Second Quarter | | | 3.11 | | | 2.35 |
| | Third Quarter | | | 3.31 | | | 2.56 |
| | Fourth Quarter | | | 3.43 | | | 2.32 |
| | December | | | 3.43 | | | 2.68 |
| 2006 | | | | | | |
| | First Quarter | | | 3.96 | | | 2.84 |
| | January | | | 3.30 | | | 2.84 |
| | February | | | 3.42 | | | 3.02 |
| | March | | | 3.96 | | | 3.25 |
| | Second Quarter (through June 9) | | | 5.13 | | | 3.49 |
| | April | | | 4.57 | | | 3.82 |
| | May | | | 5.13 | | | 4.08 |
| | June (through June 9) | | | 4.14 | | | 3.49 |
| | | | | | | | |
Source: Taiwan Stock Exchange databaseThe last reported sale price of the TDSs on the Taiwan Stock Exchange was NT$3.73 per TDS on June 9, 2006.
PLAN OF DISTRIBUTION
Not applicable.
MARKETS
The principal trading market for our shares is the Nasdaq National Market, and the principal trading market for TDSs representing our shares is the Taiwan Stock Exchange.
SELLING SHAREHOLDERS
Not applicable.
DILUTION
Not applicable.
EXPENSES OF THE ISSUE
Not applicable.
Item 10. Additional Information.
SHARE CAPITAL
Not applicable.
65
MEMORANDUM AND ARTICLES OF ASSOCIATION
Set forth below is a description of our share capital, Memorandum of Association and Articles of Association including brief summaries of our shareholders’ rights and the laws of Singapore. The description is not complete and is qualified by reference to Singapore law and our Articles of Association, a copy of which is incorporated by reference into the exhibits hereto.
Objects and Purposes
Clause 3 of our Memorandum of Association provides a broad range of purposes for us, including to carry on the business of investment, to acquire intellectual property, to carry on the business of advising as to matters of packing and testing integrated circuits, to advise on the administration and organization of business, to package and test integrated circuits, to carry on the business of general merchandise sales, to purchase or lease land and buildings, to develop purchased land, to lease or license our property, to vary or dispose of our investments, to carry on the business of agents for sales of merchandise, to carry on related business, to acquire any business carrying on the same business for which we are organized, to merge or amalgamate, to hold securities and to lend money and raise money.
Directors
We may have between two and fifteen directors, all of whom must be natural persons. Holding of shares is not a qualification of a director. A director who is not one of our members may nevertheless attend and speak at general meetings of shareholders. The ordinary remuneration of directors is determined by a resolution of members; however, directors may approve remuneration for expenses incurred by them in their duties as directors and may also approve remuneration for any director who is also an executive officer for his duties as an officer.
A director may be a party to or in any way interested in any contract or arrangement or transaction to which we are a party or in which we are in any way interested and he may vote in respect of such interested transaction provided he discloses such interest. He may hold and be remunerated in respect of any office or place of profit (other than the office of our auditor or any subsidiary thereof) under our company or any other company in which we are in any way interested and he (or any firm of which he is a member) may act in a professional capacity for us or any such other company and be remunerated therefor and in any such case as aforesaid (save as otherwise agreed) he may retain for his own absolute use and benefit all profits and advantages accruing to him thereunder or in consequence thereof.
There are no provisions in the Memorandum of Association or Articles of Association mandating any age limit for retirement. However, the Singapore Companies Act provides that any director over age 70 must vacate office at each annual general meeting. He may, however, be reappointed at the same annual general meeting.
Directors may exercise all the powers of us to borrow money, to mortgage or charge its undertaking, property and uncalled capital and to issue debentures and other securities, whether outright or as collateral security for any debt, liability or obligation of us or of any third party.
Shares
Our company has only one class of shares, each share having identical rights in all respects and ranking equally with one another. Our Articles of Association provide that, subject to the provisions of the Singapore Companies Act, we may issue shares of a different class with preferential, deferred or other special rights or restrictions as our board of directors may determine.
As of April 30, 2006, approximately 100.1 million of our shares were issued and outstanding. All of our shares are in registered form. Except in circumstances permitted by the Singapore Companies Act, we can neither purchase our own shares nor grant any financial assistance for the acquisition or proposed acquisition of our own shares.
New Shares
New shares may only be issued with the prior approval of our shareholders in a general meeting. The approval, if granted, will lapse at the conclusion of the next annual general meeting following the date the approval was granted or the expiration of the period within which the next annual general meeting is required by law to be held, whichever is earlier. Our shareholders have provided our board of directors with the general authority to issue any
66
authorized but unissued shares prior to the next annual general meeting, or the expiration of the period within which the next annual general meeting is required by law to be held, whichever is earlier. Subject to the foregoing and the provisions of the Singapore Companies Act, our board of directors may allot and issue new shares with such rights and restrictions as they believe are appropriate.
Members
Only persons who are registered in our register of members are recognized as members of our company. As of December 31, 2005, there were 26 members who were holders of record of our shares. We will not, except as required by law, recognize any equitable, contingent, future or partial interest in our shares or any other rights in respect of our shares other than the rights of a member. We may, on giving not less than 14 days’ notice to the Accounting and Corporate Regulatory Authority, close our register of members for any time or times except that we may not close the register for more than 30 days in the aggregate in any calendar year.
Transfer of Shares
There is no restriction on the transfer of fully paid shares except where required by law or the listing rules or by-laws of any stock exchange on which we are listed. Our directors may decline to register any transfer of our shares which are not fully paid shares or shares on which we have a lien. Our shares may be transferred upon the presentation of a duly signed instrument of transfer in any form approved by our directors. Our directors may also decline to register any instrument of transfer unless, among other things, it has been duly stamped and is presented for registration together with the relevant share certificate and such other evidence of title as our directors may require. We will replace lost or destroyed share certificates if we are properly notified and if the applicant pays a fee not exceeding two Singapore dollars and furnishes any evidence and indemnity as our directors may require.
General Meetings of Members
We are required to hold an annual general meeting each year not later than 15 months following the preceding annual general meeting. Our ninth annual general meeting was held on June 24, 2005. Our directors may convene an extraordinary general meeting whenever they think fit or if requested in writing by two or more members holding not less than 10% of our issued share capital. In addition, members holding not less than 10% of the paid-up capital carrying the right of voting at general meetings may call for a meeting. Unless otherwise required by law or by our Articles of Association, voting at general meetings is by ordinary resolution requiring an affirmative vote of a simple majority of the votes cast at that meeting. An ordinary resolution suffices, for example, in respect of re-election of directors. A special resolution requiring the affirmative vote of at least 75% of the votes cast at the meeting is necessary for some matters under Singapore law, including:
- the voluntary winding-up of our company;
- amendments to our Memorandum of Association and our Articles of Association;
- a change of name of our company; or
- a reduction in our share capital.
At least 21 days’ prior notice in writing is required to convene a general meeting for the purpose of passing a special resolution. A meeting to pass an ordinary resolution generally requires at least 14 days’ prior notice in writing.
Voting Rights
A member is entitled to attend, speak and vote at any of our general meetings, whether in person or by proxy. Except as otherwise provided in our Articles of Association, the quorum at any of our general meetings shall be members holding in aggregate not less than one-third of our total issued and fully paid shares present in person or by proxy. Under our Articles of Association, on a show of hands, every member present in person and by proxy shall have one vote, and on a poll, every member present in person or by proxy shall have one vote for each share of which he is the holder. A poll may be demanded in some circumstances, including:
- by the chairman of the meeting;
67
- by any member present in person or by proxy and representing not less than 10% of the total voting rights of all members having the right to attend and vote at the meeting; or
- by any three members present in person or by proxy and entitled to vote.
Dividends
Our members may in a general meeting by ordinary resolution declare dividends. However, no dividend will be payable in excess of the amount recommended by our board of directors. Our board of directors may also declare an interim dividend. No dividend may be paid except out of our profits. Except insofar as the rights attaching to the terms of issue of any share otherwise provide, all dividends are paid pro rata among the members. Dividends unclaimed for a period of six years after the initial date of declaration may be forfeited.
Stock Dividends and Rights Issue
Our directors may, with the approval of our members in a general meeting, capitalize amounts from our company’s retained earnings and capital surplus and distribute the same in the form of fully paid shares to our members in proportion to their shareholdings.
Takeovers
The Singapore Code on Takeovers and Mergers regulates the acquisition of shares of public companies and contains certain provisions that may delay, deter or prevent a takeover or change in control of our company. Any person acquiring an interest, either on his or her own or together with parties acting in concert, in 30.0% or more of the voting shares in our company or, if such person holds, either on his or her own or together with parties acting in concert, between 30.0% and 50.0% (both inclusive) of the voting shares in our company, and acquires additional voting shares representing more than 1.0% of our voting shares in any six-month period, may be required to extend a takeover offer for our remaining voting shares in accordance with the provisions of the Singapore Code on Takeovers and Mergers. Parties acting in concert comprise individuals or companies who, pursuant to an arrangement or understanding (whether formal or informal), cooperate, through the acquisition by any of them of shares in a company, to obtain or consolidate effective control of that company. Certain persons are presumed (unless the presumption is rebutted) to be acting in concert with each other. They are as follows:
- a company and its related and associated companies and companies whose associated companiesinclude any of these companies;
- a company and its directors (including their close relatives, related trusts and companies controlledby any of the directors, their close relatives and related trusts);
- a company and its pension funds and employee share schemes;
- a person and any investment company, unit trust or other fund whose investment such personmanages on a discretionary basis;
- a financial or other professional adviser and its clients in respect of shares held by the adviser andpersons controlling, controlled by or under the same control as the adviser and all the fundsmanaged by the adviser on a discretionary basis, where the shareholdings of the adviser and any ofthose funds in the client total 10.0% or more of the client’s equity share capital;
- directors of a company (including their close relatives, related trusts and companies controlled byany of such directors, their close relatives and related trusts) which is subject to an offer or wherethe directors have reason to believe a bona fide offer for the company may be imminent;
- partners; and
- an individual and his close relatives, related trusts, any person who is accustomed to acting inaccordance with his instructions and companies controlled by the individual, his close relatives,his related trusts or any person who is accustomed to acting in accordance with his instructions.
68
Subject to certain exceptions, a takeover offer must be in cash or be accompanied by a cash alternative at not less than the highest price paid by the offeror or parties acting in concert with the offeror within the preceding six months.
Under the Singapore Code on Takeovers and Mergers, where effective control of a company is acquired or consolidated by a person, or persons acting in concert, a general offer to all other shareholders is normally required. An offeror must treat all shareholders of the same class in an offeree company equally. A fundamental requirement is that shareholders in the company subject to the takeover offer must be given sufficient information, advice and time to consider and decide on the offer. In addition, the offeror must make an appropriate offer or proposal to holders of our securities which are convertible into our voting shares and may also be required to make such an offer to holders of securities of our subsidiaries which are convertible into shares of our company.
Liquidation or Other Return of Capital
On a winding-up or other return of capital, subject to any special rights attaching to any other classes of our shares, holders of our shares will be entitled to participate in any surplus assets in proportion to their shareholdings. Our shareholders are not entitled to the benefits of a sinking fund or redemption privileges.
Indemnity
Our Articles of Association provide that, subject to the Singapore Companies Act, our directors and officers will be indemnified by us against any liability incurred by them in defending any proceedings, whether civil or criminal, in respect of actions or omissions as an officer, director or employee of our company. We may not indemnify our directors and officers against any liability which by law would otherwise attach to them in respect of any negligence, default, breach of duty or breach of trust, of which they may be guilty in relation to our company.
Limitations on Rights to Hold or Vote Shares
Except as described in “––Voting Rights’’ and “––Takeovers’’ above, there are no limitations imposed by Singapore law or by our Memorandum of Association or Articles of Association on the right of non-resident members to hold or vote our shares.
Minority Rights
The rights of our minority shareholders are protected under Section 216 of the Singapore Companies Act, which gives the Singapore courts a general power to make any order, upon application by any member of our company, the court believes is appropriate to remedy any of the following situations:
- the affairs of our company being conducted or the powers of our directors being exercised in a manneroppressive to, or in disregard of the interests of, one or more of our members; or
- some act of our company having been done or being threatened or some resolution of our members havingbeen passed or being proposed which unfairly discriminates against, or is otherwise prejudicial to, one ormore of our members, including the applicant.
Singapore courts have wide discretion as to the forms of relief they may grant and the forms of relief are in no way limited to those listed in the Singapore Companies Act. Without prejudice to the foregoing, Singapore courts may:
- direct or prohibit any act or cancel or vary any transaction or resolution;
- regulate the conduct of our company’s affairs in the future;
- authorize civil proceedings to be brought in the name of, or on behalf of, our company by such person orpersons and on such terms as the court may direct;
- direct us or some of our members to purchase a minority member’s shares and, in the case of our purchaseof shares, a corresponding reduction of our share capital;
69
- direct that our Memorandum of Association or our Articles of Association be amended; or
- direct that our company be wound up.
Transfer Agent and Registrar
The transfer agent and registrar for our shares is The Bank of New York, 101 Barclay Street, New York, New York 10286; the transfer agent and registrar’s telephone number is: (212) 815-3700.
MATERIAL CONTRACTS
Asset Purchase Agreement by and among Flextronics Manufacturing (M) Sdn Bhd and ASE Electronics (M) Sdn. Bhd., dated as of October 3, 2005
On October 3, 2005, ASE Test Malaysia entered into an asset purchase agreement with Flextronics Manufacturing (M) Sdn Bhd, or Flextronics, in connection with the sale of our camera modules assembly operations in Penang, Malaysia to Flextronics for a purchase price of approximately US$19.1 million. Pursuant to the terms and conditions of the asset purchase agreement, all of the tangible and intangible assets, rights and properties owned by or licensed or leased to ASE Test Malaysia with respect to the camera module assembly operations were sold to Flextronics.
See “Item 4. Information on the Company—Business Overview—Sales and Marketing—Sales and Customer Service Agents” for a summary of contracts we have entered into with agents for sales and customer service.
EXCHANGE CONTROLS
Singapore Exchange Controls
There are currently no exchange control restrictions in Singapore.
ROC Exchange Controls
The Foreign Exchange Control Statute and regulations of the ROC provide that all foreign exchange transactions must be executed by banks designated by the ROC Financial Supervisory Commission and by the Central Bank of China to engage in such transactions. Current regulations favor trade-related foreign exchange transactions. Consequently, foreign currency earned from exports of merchandise and services may now be retained and used freely by exporters, and all foreign currency needed for the importation of merchandise and services may be purchased freely from the designated foreign exchange banks.
Apart from trade, ROC companies and resident individuals may, without foreign exchange approval, remit outside and into the ROC foreign currency of up to US$50 million (or its equivalent) and US$5 million (or its equivalent), respectively, in each calendar year. The above limits apply to remittances involving conversion of NT dollars to a foreign currency and vice versa. A requirement is also imposed on all enterprises to register medium and long term foreign debt with the Central Bank of China.
In addition, foreign persons may, subject to specified requirements, but without foreign exchange approval of the Central Bank of China, remit outside and into the ROC foreign currencies of up to US$100,000 (or its equivalent) for each remittance. The above limit applies to remittances involving a conversion of NT dollars to a foreign currency and vice versa. The above limit does not, however, apply to the conversion of NT dollars into other currencies, including U.S. dollars, from the proceeds of sale of any underlying shares withdrawn from a depositary receipt facility.
TAXATION
Singapore Taxation
The following discussion is a summary of the material Singapore income tax, stamp duty and estate duty consequences of the purchase, ownership and disposition of the shares to a holder of the shares that is not resident in
70
Singapore. This discussion does not purport to be a comprehensive description of all of the tax considerations that may be relevant to a decision to purchase, own or dispose of the shares and does not purport to deal with the tax consequences applicable to all categories of investors. Shareholders should consult their own tax advisers concerning the tax consequences of their particular situations. This summary is based on laws, regulations and interpretations in effect and available as of the date of this annual report. The laws, regulations and interpretations, however, may change at any time, and any change could be retroactive. These laws and regulations are also subject to various interpretations and the relevant tax authorities or the courts could later disagree with the explanations or conclusions set out below.
Dividends Distributions
Singapore does not impose withholding tax on dividends paid to non-resident shareholders.
As we are not tax resident in Singapore and we do not carry on a trade or business in Singapore, our dividends paid to our shareholders are not considered to be income sourced in Singapore, and therefore will not be subject to tax in Singapore, unless the dividends are received or deemed received in Singapore or if they are considered, in the hands of a particular shareholder, to be derived in Singapore (for example, where they constitute the income of a trade or business carried out in Singapore).
Gain on Disposal of Shares
Singapore does not impose any tax on capital gains. However, there are currently no specific laws or regulations which address the characterization of capital gains; hence gains may be construed to be of an income nature and subject to tax if they arise from activities which the Inland Revenue Authority of Singapore regards as the carrying on of a trade or business in Singapore. Thus, any profits from the disposal of shares are not taxable in Singapore unless the seller is regarded as having derived gains of an income nature, in which case the disposal profits would be taxable.
Stamp Duty
There is no stamp duty payable in respect of the issuance and holding of shares. Where existing shares are acquired in Singapore, stamp duty is payable on the instrument of transfer of the shares at the rate of S$2.00 for every S$1,000.00 of the consideration for, or market value of, the shares, whichever is higher. The stamp duty is borne by the purchaser unless there is an agreement to the contrary. Where an instrument of transfer is executed outside Singapore or no instrument of transfer is executed, no stamp duty is payable on the acquisition of existing shares. However, stamp duty would be payable if an instrument of transfer which is executed outside Singapore is received in Singapore.
Estate Duty
An individual holder of shares who is not domiciled in Singapore at the time of his or her death will not be subject to Singapore estate duty on the value of our shares.
Tax Treaty
Currently, Singapore does not have a comprehensive avoidance of double taxation treaty with the United States.
United States Federal Income Taxation
The following discussion describes the material U.S. federal income tax consequences of the ownership and disposition of the shares by U.S. holders (defined below). This summary is based on the Internal Revenue Code of 1986 (the Code), final, temporary and proposed Treasury Regulations, administrative pronouncements and judicial decisions, all of which are subject to change, possibly with retroactive effect. This discussion deals only with shares held as capital assets within the meaning of the Code. It does not discuss all of the tax consequences that may be relevant to a holder in light of such person’s particular circumstances or to holders subject to special rules, such as insurance companies, tax-exempt entities, partnerships, dealers in securities, traders in securities that elect to mark to market, certain financial institutions, persons who hold shares as a part of an integrated transaction for U.S. federal income tax purposes, persons whose functional currency is not the U.S. dollar, persons who acquired our shares
71
pursuant to the exercise of any employee stock option or otherwise as compensation or persons who own 10% or more of our voting stock.
U.S. holders should consult their tax advisers with regard to the application of the U.S. federal income tax laws to their particular situations as well as any tax consequences arising under the laws of any state, local or foreign taxing jurisdiction.
As used herein, a “U.S. holder’’ is a beneficial owner of shares that is, for U.S. federal income tax purposes:
(1) a citizen or resident of the United States;
(2) a corporation, or other entity taxable as a corporation, created or organized under the laws of the United States or of any political subdivision thereof; or
(3) an estate or trust the income of which is subject to U.S. federal income taxation regardless of its source.
This discussion assumes that we are not, and will not become, a passive foreign investment company, as discussed below.
Dividends
Distributions paid on the shares, other than certain pro rata distributions of shares to all shareholders, will constitute foreign source dividend income to the extent paid out of our current or accumulated earnings and profits, as calculated for U.S. federal income tax purposes. The amount a U.S. holder will be required to include in income for any dividend paid in a currency other than U.S. dollars will be equal to the U.S. dollar value of the non-U.S. currency paid, calculated by reference to the exchange rate in effect on the date the dividend is received regardless of whether the payment is in fact converted into U.S. dollars on the date of receipt. If a U.S. holder does not convert the amount of any dividend income received into U.S. dollars and realizes gain or loss on a sale or other disposition of such non-U.S. currency, it generally will be U.S. source ordinary income or loss. Corporate U.S. holders will not be entitled to a dividends-received deduction. Subject to applicable limitations, dividends paid to certain noncorporate U.S. holders in taxable years beginning before January 1, 2011 will be taxable at a maximum tax rate of 15.0% . Noncorporate U.S. holders should consult their own tax advisers to determine whether they are subject to any special rules that limit their ability to be taxed at this favorable rate.
Capital Gains
A U.S. holder will recognize capital gain or loss for U.S. federal income tax purposes on a sale or other disposition of shares in the same manner as on the sale or disposition of any other shares held as capital assets. Such gain or loss, if any, generally will be U.S. source income or loss and will be long-term if the shares were held for more than one year. U.S. holders should consult their tax advisers regarding the treatment of capital gains, which may be taxed at lower rates than ordinary income for non-corporate U.S. holders, and capital losses, the deductibility of which may be limited.
Passive Foreign Investment Company Rules
We do not believe that we were a passive foreign investment company, or PFIC, for U.S. federal income tax purposes for 2005. However, PFIC status depends upon the composition of a company’s income and assets and the market value of its assets from time to time. Because we have significant cash and other passive assets and because our PFIC status may depend on the value of our stock (from time to time), there can be no assurance that we will not be considered a PFIC for any taxable year. If we were treated as a PFIC for any taxable year during which a U.S. holder held shares, certain adverse tax consequences could apply.
If we are treated as a PFIC for any taxable year, gain recognized by a U.S. holder on a sale or other disposition of a share would be allocated ratably over the U.S. holder’s holding period for the share. The amount allocated to the taxable year of the sale or other exchange and to any year before we became a PFIC would be taxed as ordinary income. The amount allocated to each other taxable year would be subject to tax at the highest rate in effect for individuals or corporations, as appropriate, and an interest charge would be imposed on the amount allocated to such taxable year. Further, any distribution in respect of shares in excess of 125 percent of the average of the annual distributions on shares received by the U.S. holder during the preceding three years or the U.S. holder’s holding period, whichever if shorter, would be subject to taxation as described above. Certain elections may be available (including a mark to market election) to U.S. holders that may mitigate the adverse consequences resulting from PFIC status.
In addition, if we were to be treated as a PFIC in a taxable year in which we pay a dividend or the prior taxable year, the 15% dividend rate discussed above with respect to dividends paid to non-corporate holders would not apply.
Information Reporting and Backup Withholding
Payments of dividends and sales proceeds that are made within the United States or through certain U.S.-related financial intermediaries generally are subject to information reporting; and are subject to backup withholding unless (i) you are a corporation or other exempt recipient or (ii) in the case of backup withholding, you provide a correct taxpayer identification number and certify that you are not subject to backup withholding.
72
The amount of any backup withholding from a payment to you will be allowed as a credit against your U.S. federal income tax liability and may entitle you to a refund, provided that the required information is furnished to the Internal Revenue Service.
DIVIDENDS AND PAYING AGENTS
Not applicable.
STATEMENT BY EXPERTS
Not applicable.
DOCUMENTS ON DISPLAY
You may read and copy documents referred to in this annual report that have been filed with the SEC at the SEC’s public reference rooms in Washington, D.C., New York, New York and Chicago, Illinois. Please call the SEC at 1-800-SEC-0330 for further information on the reference rooms. Documents filed or furnished by us via EDGAR are available from the SEC’s website at:http://www.sec.gov.
SUBSIDIARY INFORMATION
Not applicable.
Item 11. Quantitative and Qualitative Disclosures About Market Risk.
Our exposure to financial market risks relates primarily to changes in interest rates and foreign exchange rates. To mitigate these risks, we have from time to time utilized derivative financial instruments, the application of which was primarily to manage these exposures and not for speculative purposes.
Foreign Currency Exchange Rate Risk
Fluctuations in exchange rates, primarily among the U.S. dollar, the Japanese yen, the NT dollar and the Malaysian ringgit, will affect our costs and operating margins and could result in foreign exchange losses. Our liabilities as of December 31, 2005 include liabilities denominated in U.S. dollars, NT dollars, Malaysian ringgit and other currencies. As of December 31, 2005, approximately 55.1% of our cash and accounts receivable and receivables from related parties were denominated in U.S. dollars, approximately 24.4% in Malaysian ringgit, approximately 19.0% in NT dollars and approximately 1.5% in other currencies. As of December 31, 2005, approximately 65.0% of our accounts payable, payable to related parties and payables for fixed assets were denominated in U.S. dollars, approximately 23.9% in NT dollars, approximately 4.6% in Malaysian ringgit and approximately 6.5% in other currencies. In addition, a substantial portion of our capital expenditures, primarily for the purchase of testing and packaging equipment, has been, and is expected to continue to be, denominated primarily in U.S. dollars with the remainder in Japanese yen. To protect against reductions in value and the volatility of future cash flows caused by changes in foreign exchange rates, we have from time to time utilized currency forward and option contracts to minimize the impact of foreign currency fluctuations on our results of operations. Despite these hedging and mitigating techniques, fluctuations in exchange rates have affected, and may continue to affect, our financial condition and results of operations. We recorded a net foreign exchange loss of $0.8 million, a net foreign exchange gain of $0.2 million and a net foreign exchange gain of $1.4 million in 2003, 2004 and 2005, respectively. Our policy is to account for such contracts on a mark-to-market rate basis, and the premiums are amortized on a straight-line method over the life of the contract. As of December 31, 2005, there was approximately $0.2 million of foreign currency forward outstanding. See notes 22 and 23 to our consolidated financial statements.
73
The tables below set forth our foreign currency forward contracts as of December 31, 2005.
| Foreign Currency Forward Contracts |
|
| Hedging assets/liabilities | | |
| Buy JP¥/sell US$ | | |
| Contract Amount (in thousand US$) | | 172 |
| Average Contractual Exchange Rate (against US$) | | 116.42 |
| Fair Value – receivable (in thousand US$) | | 176 |
| Fair Value – payable (in thousand US$) | | 172 |
| | | |
| Interest Rate Risk | | |
Our exposure to interest rate risks relates primarily to our long-term debt, which is normally incurred to support our corporate activities, primarily for capital expenditures. We currently do not enter into derivative transactions with regard to interest rates, but we would consider engaging in currency interest rate swaps to lock in currency and interest rate levels from time to time, if available, on terms considered attractive by us. No derivative contracts for interest rates were outstanding as of December 31, 2005.
The following table provides information about our significant obligations that are sensitive to interest rate fluctuations.
| | | As of December 31, 2005 |
| |
|
|
|
|
|
|
|
|
|
|
|
|
|
|
|
|
|
|
|
|
|
| | | Expected Maturity Date |
| |
|
|
|
|
|
|
|
|
|
|
|
|
|
|
|
|
|
|
|
|
|
| | | 2006 | | | 2007 | | | 2008 | | | 2009 | | | 2010 | | | Thereafter | | Total | | | Fair Value |
| | | (in millions, except percentages) |
| Long-term debt: | | | | | | | | | | | | | | | | | | | | | | |
| Variable rate (NT$) | | 342.5 | | | 1,328.4 | | | 697.7 | | | 167.7 | | | 23.5 | | | — | | 2,559.8 | | | 2,559.8 |
| Average interest | | | | | | | | | | | | | | | | | | | | | | |
| rate | | 3.08 | % | | 2.90 | % | | 3.20 | % | | 3.50 | % | | 3.82 | % | | — | | 3.05 | % | | |
| Fixed rate (NT$) | | 6.3 | | | 6.2 | | | 2.8 | | | 0.3 | | | — | | | — | | 15.6 | | | 15.6 |
| Average interest | | | | | | | | | | | | | | | | | | | | | | |
| rate | | 5.57 | % | | 5.77 | % | | 5.86 | % | | 6.35 | % | | — | | | — | | 5.79 | % | | |
| Variable rate (US$) | | 35.7 | | | 64.8 | | | 46.7 | | | 31.8 | | | 31.2 | | | — | | 210.2 | | | 210.2 |
| Average interest | | | | | | | | | | | | | | | | | | | | | | |
| rate | | 6.14 | % | | 6.40 | % | | 6.33 | % | | 6.18 | % | | 6.24 | % | | — | | 6.28 | % | | |
| Fixed rate (US$) | | 3.5 | | | 2.3 | | | 0.7 | | | — | | | — | | | — | | 6.5 | | | 6.5 |
| Average interest | | | | | | | | | | | | | | | | | | | | | | |
| rate | | 8.34 | % | | 7.98 | % | | 6.48 | % | | — | | | — | | | — | | 8.01 | % | | |
Item 12. Description of Securities Other Than Equity Securities.
Not applicable.
PART II
Item 13. Defaults, Dividend Arrearages and Delinquencies.
Not applicable.
Item 14. Material Modifications to the Rights of Security Holders and Use of Proceeds.
On February 8, 1998, we effected a stock split of 150,000,000 shares, with a par value of $1.00 per share, into 300,000,000 shares, with a par value of $0.50 per share. The effect of this stock split was to cause holders of shares on January 26, 1998 to own two shares of par value $0.50 per share for each share of par value $1.00 per share previously held by them.
74
On April 4, 1999, we effected another stock split of 300,000,000 shares of par value $0.50 per share, into 600,000,000 shares, with a par value of $0.25 per share. The effect of this stock split was to cause holders of shares on March 20, 1999 to own two shares of par value $0.25 per share for each share of par value $0.50 previously held by them.
Since all our shareholders were affected, the two stock splits did not result in a dilution of the percentage of aggregate equity ownership, voting rights, earnings or net book value of our shareholders. The stock splits reduced per share earnings and net book value of our shares since there were more shares outstanding following the stock splits.
In January 2006, the concept of par value was abolished under Singapore law.
Item 15. Controls and Procedures.
Under the supervision and with the participation of our management, including our Chief Executive Officer and Chief Financial Officer, we performed an evaluation of the effectiveness of our disclosure controls and procedures, as defined in Rules 13a-15(e) and 15d-15(e) under the Securities Exchange Act of 1934, as amended, as of the end of the period covered by this report (the “Evaluation Date”). Based on this evaluation, our Chief Executive Officer and Chief Financial Officer concluded as of the Evaluation Date that our disclosure controls and procedures are effective for gathering, analyzing and disclosing the information we are required to disclose in the reports we file under the Exchange Act, within the time periods specified in the SEC’s rules and forms. Our management necessarily applied its judgment in assessing the costs and benefits of such controls and procedures, which by their nature can provide only reasonable assurance regarding management’s control objectives.
There has been no change in our internal control over financial reporting that occurred during the period covered by this annual report that has materially affected, or is reasonably likely to materially affect, our internal control over financial reporting.
Item 16. [Reserved]
Item 16A. Audit Committee Financial Expert
Our board of directors determined that Alan Cheng is an audit committee financial expert as defined under the applicable rules of the SEC issued pursuant to Section 407 of the Sarbanes-Oxley Act of 2002 and is independent for the purposes of Rule 10A-3 of the Exchange Act.
Item 16B. Code of Ethics
We have adopted a code of ethics that satisfies the requirements of Item 16B of Form 20-F and applies to all employees, officers, supervisors and directors of our company and our subsidiaries, including our Chief Executive Officer and Chief Financial Officer. We have posted our code of ethics on our website at http://www.aseglobal.com.
Item 16C. Principal Accountant Fees and Services
Policy on Pre-Approval of Audit and Non-Audit Services of Independent Auditors
Our audit committee, which was re-established on July 21, 2005, pre-approves all audit and non-audit services provided by our independent auditor, including audit services, audit-related services, tax services and other services, on a case-by-case basis. Accordingly, we have not established any pre-approval policies and procedures. Prior to the establishment of our audit committee, such services were pre-approved by our board of directors.
Principal Independent Auditors’ Fees
We paid the following fees for professional services to our independent auditors, Deloitte & Touche, for the years ended December 31, 2004 and 2005.
| | | Year Ended December 31, |
| |
|
|
|
|
|
| Services | | | 2004 | | | 2005 |
| |
|
| |
|
|
| Audit fees(1) | | $ | 496,639 | | $ | 642,519 |
| Audit-related fees(2) | | | 169,721 | | | 18,705 |
| Tax fees(3) | | | 31,500 | | | 54,106 |
75
| | | Year Ended December 31, |
| |
|
|
|
|
|
| Services | | | 2004 | | | 2005 |
| |
|
| |
|
|
| All other fees (4) | | | — | | | 11,691 |
| | |
|
| |
|
|
| | | $ | 697,860 | | $ | 727,021 |
| | |
|
| |
|
|
|
| (1) | Audit fees are defined as the standard audit and review work that needs to be performed each year in order to issue an opinion on our consolidated financial statements and to issue reports on the local statutory financial statements. It also includes services that can only be provided by our auditor such as statutory audits required by the Tax Bureau of the ROC and the Customs Bureau of the ROC, auditing of non-recurring transactions and application of new accounting policies, pre-issuance reviews of quarterly financial results, consents and comfort letters and any other audit services required for SEC or other regulatory filings. |
| |
| (2) | Audit-related fees include assurance and related services provided by auditors that are reasonably related to the performance of the audit or review of our financial statements and not reported above under “Audit Fees”. They comprise amounts for services such as acquisition due diligence and consultation concerning financial accounting and reporting matters. |
| |
| (3) | Tax fees consist of professional services rendered by Deloitte & Touche for tax compliance and tax advice. The services for the fees disclosed under this category include tax return preparation and technical tax advice. |
| |
| (4) | Other fees consist of fees for agreed-upon procedures related to our accounts receivable securitization in 2005 and review of our capital registration with the ROC government. |
Item 16D. Exemptions from the Listing Standards of Audit Committees
Not applicable.
Item 16E. Purchases of Equity Securities by the Issuer and Affiliated Purchasers
Neither we nor any affiliated purchasers purchased any of our equity securities in 2005.
PART III
Item 17. Financial Statements.
The Company has elected to provide financial statements for fiscal year 2005 and the related information pursuant to Item 18.
Item 18. Financial Statements.
The consolidated financial statements of the Company and the report thereon by its independent auditors listed below are attached hereto as follows:
| | (a) | Report of Independent Registered Public Accounting Firm (page F-1). |
| |
| | (b) | Consolidated Balance Sheets (page F-3). |
| |
| | (c) | Consolidated Statements of Income (page F-4). |
| |
| | (d) | Consolidated Statements of Changes in Shareholders’ Equity (page F-6). |
| |
| | (e) | Consolidated Statements of Cash Flows (page F-7). |
| |
| | (f) | Notes to Consolidated Financial Statements (page F-9). |
| |
Item 19. Exhibits.
| | 1. | (a) | Memorandum and Articles of Association of the Registrant (incorporated by reference to Exhibit 1(a) to the Company’s annual report on Form 20-F for the year ended December 31, 2003). |
| | | | |
| | 4. | (a) | Asset Purchase Agreement by and among Flextronics Manufacturing (M) Sdn Bhd, as Buyer, ASE |
| | | | Electronics (M) Sdn. Bhd. as Company, dated as of October 3, 2005. |
76
| | | (b) | Commission Agreement dated as of August 1, 2004 between ASE Electronics (M) Sdn. Bhd. and Gardex International Limited. (incorporated by reference to Exhibit 4(g) to ASE Inc.’s annual report on Form 20-F for the year ended December 31, 2004). |
| |
| | | (c) | Commission Agreement dated as of August 1, 2004 between ASE Test Taiwan and Gardex International Limited. (incorporated by reference to Exhibit 4(h) to ASE Inc.’s annual report on Form 20-F for the year ended December 31, 2004). |
| |
| | | (d) | Commission Agreement dated as of August 1, 2005 between ASE Electronics (M) Sdn. Bhd. and Gardex International Limited. |
| |
| | | (e) | Commission Agreement dated as of August 1, 2005 between ASE Test, Inc. and Gardex International Limited. |
| |
| | | (f) | Commission Agreement dated as of January 1, 2006 between ASE Electronics (M) Sdn. Bhd. and Gardex International Limited. |
| |
| | | (g) | Commission Agreement dated as of January 1, 2006 between ASE Test, Inc. and Gardex International Limited. |
| |
| | | (h) | Land Lease Agreement dated as of January 1, 1997 between ASE Test Taiwan and Nantze Export Processing Zone Administration of Ministry of Economic Affairs (incorporated by reference to Exhibit 4(h) to the Company’s annual report on Form 20-F for the year ended December 31, 2003). |
| |
| | | (i) | Land Lease Agreement dated as of January 1, 2002 between ASE Test Taiwan and Nantze Export Processing Zone Administration of Ministry of Economic Affairs (incorporated by reference to Exhibit 4(i) to the Company’s annual report on Form 20-F for the year ended December 31, 2003). |
| |
| | | (j) | Land Lease Agreement dated as of April 16, 2000 between ASE Test Taiwan and Nantze Export Processing Zone Administration of Ministry of Economic Affairs (incorporated by reference to Exhibit 4(j) to the Company’s annual report on Form 20-F for the year ended December 31, 2003). |
| |
| | | (k) | Land Lease Agreement dated as of May 1, 2000 between ASE Test Taiwan and Nantze Export Processing Zone Administration of Ministry of Economic Affairs (incorporated by reference to Exhibit 4(k) to the Company’s annual report on Form 20-F for the year ended December 31, 2003). |
| |
| | | (l) | Land Lease Agreement dated as of April 1, 2004 between ASE Test Taiwan and Nantze Export Processing Zone Administration of Ministry of Economic Affairs (incorporated by reference to Exhibit 4(l) to the Company’s annual report on Form 20-F for the year ended December 31, 2003). |
| |
| | | (m) | First Amendment to Lease Agreement dated June 7, 2000 between ISE Labs, Inc. and RND Funding Company, Inc. (incorporated by reference to Exhibit 4(j) to the Company’s annual report on Form 20-F for the year ended December 31, 2000). |
| |
| | | (n) | Sublease Agreement dated June 2000 between ISE Labs, Inc. and Cirrus Logic, Inc. (incorporated by reference to Exhibit 4(n) to the Company’s annual report on Form 20-F for the year ended December 31, 2000). |
| |
| | | (o) | Land Lease Agreement dated as of April 27, 2005 between ASE Test Taiwan and Nantze Export Processing Zone Administration of Ministry of Economics Affairs. |
| |
| | | (p) | Land Lease Agreement dated as of March 1, 2006 between ASE Test Taiwan and Nantze Export Processing Zone Administration of Ministry of Economics Affairs. |
| |
| | | (q) | Office Building Lease Agreement between ISE Labs, Inc. and JER/BRE Austin Tech L.P. dated October 4, 2001 (incorporated by reference to Exhibit 10.46 to ASE Inc.’s Registration Statement on Form F-3 filed on May 30, 2002). |
| |
77
| | | (r) | Sublease Agreement dated May 5, 2004 between Apple Computer Limited and ASE Singapore Pte. Ltd. (incorporated by reference to Exhibit 4(s) to the Company’s annual report on Form 20-F for the year ended December 31, 2003). |
| | | | |
| | 8. | (a) | List of Subsidiaries. |
| | | | |
| | 12. | (a) | Certification of Jason C.S. Chang, Chief Executive Officer of ASE Test Limited, as required by Rule 13a-14(a) of the Securities Exchange Act of 1934. |
| | | | |
| | | (b) | Certification of Freddie Liu, Chief Financial Officer of ASE Test Limited, as required by Rule 13a-14(a) of the Securities Exchange Act of 1934. |
| | | | |
| | 13. | (a) | Certification of the Chief Executive Officer and the Chief Financial Officer of ASE Test Limited for the purpose of complying with Section 1350 of Chapter 63 of Title 18 of the United States Code. |
The Company agrees to furnish to the SEC upon request a copy of any instrument which defines the rights of holders of long-term debt of the Company and its consolidated subsidiaries.
78
SIGNATURES
The registrant hereby certifies that it meets all of the requirements for filing on Form 20-F and that it has duly caused and authorized the undersigned to sign this annual report on its behalf.
| ASE TEST LIMITED |
| | | |
| By: | /s/ Jason C.S. Chang |
| |
|
| | Name: | Jason C.S. Chang |
| | Title: | Chief Executive Officer |
Date: June 19, 2006
| INDEX TO CONSOLIDATED FINANCIAL STATEMENTS | | |
| |
| |
| | | Page |
| |
|
| Consolidated Financial Statements of ASE Test Limited | | |
| and Subsidiaries | | |
| Independent Registered Public Accounting Firm’s Report | | F-1 |
| Consolidated Balance Sheets | | F-3 |
| Consolidated Statements of Income | | F-4 |
| Consolidated Statements of Changes in Shareholders’ Equity | | F-6 |
| Consolidated Statements of Cash Flows | | F-7 |
| Notes to Consolidated Financial Statements | | F-9 |
REPORT OF INDEPENDENT REGISTERED PUBLIC ACCOUNTING FIRM
The Board of Directors and Shareholders
ASE Test Limited
We have audited the accompanying consolidated balance sheets of ASE Test Limited and its subsidiaries (collectively the “Company”) as of December 31, 2004 and 2005, and the related consolidated statements of income, changes in shareholders’ equity and cash flows for each of the three years ended December 31, 2005, expressed in U.S. dollars. These consolidated financial statements are the responsibility of the Company’s management. Our responsibility is to express an opinion on these financial statements based on our audits.
We conducted our audits in accordance with the Rules Governing the Audit of Financial Statements by Certified Public Accountants, auditing standards generally accepted in the Republic of China (“ROC”) and the Standards of the Public Company Accounting Oversight Board (United States). Those rules and standards require that we plan and perform the audit to obtain reasonable assurance about whether the financial statements are free of material misstatement. The Company is not required to have, nor were we engaged to perform, an audit of its internal control over financial reporting. Our audits included consideration of internal control over financial reporting as a basis for designing audit procedures that are appropriate in the circumstances, but not for the purpose of expressing an opinion on the effectiveness of the Company’s internal control over financial reporting. Accordingly, we express no such opinion. An audit also includes examining, on a test basis, evidence supporting the amounts and disclosures in the financial statements, assessing the accounting principles used and significant estimates made by management, as well as evaluating the overall financial statement presentation. We believe that our audits provide a reasonable basis for our opinion.
In our opinion, the consolidated financial statements referred to above present fairly, in all material respects, the consolidated financial position of the Company as of December 31, 2004 and 2005, and the consolidated results of their operations and their cash flows for each of the three years ended December 31, 2005, in conformity with accounting principles generally accepted in the Republic of China.
As discussed in Note 21 to the consolidated financial statements, the Company incurred fire damage to its production line in Chung Li, Taiwan on May 1, 2005. The Company recognized an estimated loss of $52,014 thousand for the damage to its machinery and equipment. The insurance recoveries of the aforementioned damages that are clearly identified and reasonably estimated amounted to $790 thousand, which reduces the total estimated loss, and of this amount, $369 thousand had been received as of December 31, 2005. Any recovery for the remaining $51,224 thousand is contingent on the result of the lengthy professional appraisal process, and as such this amount was recognized as a loss on fire damage for the year 2005.
As discussed in Note 3 to the consolidated financial statements, the Company adopted ROC Financial Accounting Standards No. 35, “Accounting for Asset Impairment” on December 31, 2004.
F-1
Accounting principles generally accepted in the Republic of China differ in certain significant respects from accounting principles generally accepted in the United States of America. The application of the latter would have affected the determination of net income (loss) for each of the three years ended December 31, 2005, and the determination of shareholders’ equity and financial position at December 31, 2004 and 2005, to the extent summarized in Note 26.
February 6, 2006
F-2
| ASE TEST LIMITED AND SUBSIDIARIES | | | | | | | | |
| |
| CONSOLIDATED BALANCE SHEETS | | | | | | | | | | | | | | | | | | |
| DECEMBER 31, 2004 AND 2005 | | | | | | | | | | | | | | | | | | |
| (In Thousands of U.S. Dollars, Except Par Value) | | | | | | | | | | | | | | | | | | |
|
|
|
|
|
|
|
|
|
|
|
|
|
|
|
|
|
|
|
| |
| |
| ASSETS | | | 2004 | | | | 2005 | | | LIABILITIES AND SHAREHOLDERS’ EQUITY | | | 2004 | | | | 2005 | |
| |
| CURRENT ASSETS | | | | | | | | | | CURRENT LIABILITIES | | | | | | | | |
| Cash and cash equivalents (Notes 2 and 4) | | $ | 39,489 | | | $ | 138,211 | | | Short-term borrowings (Notes 10 and 19) | | $ | 35,789 | | | $ | - | |
| Short-term investments (Note 2) | | | 20,000 | | | | - | | | Commercial paper (Notes 11 and 19) | | | 28,474 | | | | - | |
| Notes and accounts receivable, net (Notes 2 and 5) | | | 89,202 | | | | 77,334 | | | Notes and accounts payable | | | 16,053 | | | | 10,603 | |
| Receivables from related parties (Note 18) | | | 12,531 | | | | 20,277 | | | Payable to related parties (Note 18) | | | 9,284 | | | | 10,347 | |
| Inventories, net (Notes 2 and 6) | | | 44,335 | | | | 21,239 | | | Payable for fixed assets | | | 33,478 | | | | 10,737 | |
| Deferred income tax assets, net (Notes 2 and 17) | | | 4,581 | | | | 8,933 | | | Income tax payable | | | 3,206 | | | | 635 | |
| Pledged time deposit (Note 19) | | | 3,576 | | | | 1,902 | | | Current portion of long-term debts (Notes 12 and 19) | | | 45,740 | | | | 49,743 | |
| Prepayments and other | | | 13,312 | | | | 17,591 | | | Accrued expenses | | | 28,442 | | | | 40,141 | |
| |
|
| | |
|
| | | | | | | | | | | |
| | | | | | | | | | | Other (Note 5) | | | 1,418 | | | | 6,013 | |
| | | | | | | | | | | |
|
| | |
|
| |
| Total current assets | | | 227,026 | | | | 285,487 | | | | | | | | | | | |
| |
|
| | |
|
| | | | | | | | | | | |
| | | | | | | | | | | Total current liabilities | | | 201,884 | | | | 128,219 | |
| LONG-TERM INVESTMENTS (Notes 2 and 7) | | | 133,699 | | | | 140,225 | | | | | | | | | | | |
| |
|
| | |
|
| | | | | | | | | | | |
| | | | | | | | | | | LONG-TERM DEBTS (Notes 12 and 19) | | | 273,020 | | | | 245,303 | |
| PROPERTY, PLANT AND EQUIPMENT, NET (Notes 2, 8, 15, 18, 19, | | | | | | | | | | | | | | | | | | |
| 20, 21, 24 and 25) | | | 634,796 | | | | 430,079 | | | ACCRUED PENSION COST (Notes 2 and 14) | | | 5,119 | | | | 6,412 | |
| |
|
| | |
|
| | | | | | | | | | | |
| |
| GOODWILL (Notes 2, 3 and 9) | | | 25,612 | | | | 20,646 | | | DEFERRED INCOME TAX LIABILITIES (Notes 2 and 17) | | | 1,016 | | | | - | |
| |
|
| | |
|
| | | | | | | | | | | |
| |
| OTHER ASSETS | | | | | | | | | | OTHER LIABILITIES | | | 2,479 | | | | 2,200 | |
| | | | | | | | | | | |
|
| | |
|
| |
| Deferred income tax assets, net (Notes 2 and 17) | | | 41,323 | | | | 30,964 | | | | | | | | | | | |
| Deferred charge (Note 2) | | | 13,301 | | | | 10,492 | | | Total liabilities | | | 483,518 | | | | 382,134 | |
| | | | | | | | | | | |
|
| | |
|
| |
| Other(Note 19) | | | 7,352 | | | | 22,446 | | | | | | | | | | | |
| |
|
| | |
|
| | | | | | | | | | | |
| | | | | | | | | | | SHAREHOLDERS’ EQUITY (Notes 1, 2 and 13) | | | | | | | | |
| Total other assets | | | 61,976 | | | | 63,902 | | | Capital stock - $0.25 par value | | | | | | | | |
| |
|
| | |
|
| | | | | | | | | | | |
| | | | | | | | | | | Authorized - 600,000,000 ordinary shares | | | | | | | | |
| | | | | | | | | | | Issued and outstanding - 100,059,031 ordinary shares | | | 25,015 | | | | 25,015 | |
| | | | | | | | | | | Additional paid in capital | | | 455,059 | | | | 455,059 | |
| | | | | | | | | | | Retained earnings | | | 161,438 | | | | 125,954 | |
| | | | | | | | | | | Unrealized loss on long-term investment | | | (60 | ) | | | - | |
| | | | | | | | | | | Cumulative translation adjustments | | | (41,861 | ) | | | (47,823 | ) |
| | | | | | | | | | | |
|
| | |
|
| |
| |
| | | | | | | | | | | Total shareholders’ equity | | | 599,591 | | | | 558,205 | |
| | | | | | | | | | | |
|
| | |
|
| |
| |
| TOTAL | | $ | 1,083,109 | | | $ | 940,339 | | | TOTAL | | $ | 1,083,109 | | | $ | 940,339 | |
| |
|
| | |
|
| | | | |
|
| | |
|
| |
| The accompanying notes are an integral part of the financial statements. |
| |
| (With Deloitte & Touche audit report dated February 6, 2006) |
F-3
| ASE TEST LIMITED AND SUBSIDIARIES | | | | | | | | | | | | |
| |
| CONSOLIDATED STATEMENTS OF INCOME | | | | | | | | | | | | |
| YEARS ENDED DECEMBER 31, 2003, 2004 AND 2005 | | | | | | | | | | | | |
| (In Thousands of U.S. Dollars, Except Per Share Data) | | | | | | | | | | | | |
|
|
|
|
|
|
|
|
|
|
|
|
|
| |
| |
| | | | 2003 | | | | 2004 | | | | 2005 | |
| |
| NET REVENUES (Notes 2, 18 and 24) | | $ | 345,660 | | | $ | 427,763 | | | $ | 420,929 | |
| |
| COST OF REVENUES (Notes 15,18 and 20) | | | 283,135 | | | | 340,663 | | | | 330,786 | |
| |
|
| | |
|
| | |
|
| |
| |
| GROSS PROFIT | | | 62,525 | | | | 87,100 | | | | 90,143 | |
| |
|
| | |
|
| | |
|
| |
| |
| OPERATING EXPENSES (Notes 15, 18 and 20) | | | | | | | | | | | | |
| Selling (Note 2) | | | 8,551 | | | | 11,393 | | | | 11,235 | |
| General and administrative | | | 39,056 | | | | 42,474 | | | | 39,891 | |
| Research and development (Note 2) | | | 19,513 | | | | 23,223 | | | | 24,993 | |
| |
|
| | |
|
| | |
|
| |
| |
| Total operating expenses | | | 67,120 | | | | 77,090 | | | | 76,119 | |
| |
|
| | |
|
| | |
|
| |
| |
| INCOME (LOSS) FROM OPERATIONS | | | (4,595 | ) | | | 10,010 | | | | 14,024 | |
| |
|
| | |
|
| | |
|
| |
| |
| NON-OPERATING INCOME (EXPENSES) | | | | | | | | | | | | |
| Interest, net (Notes 2, 8 and 16) | | | (12,614 | ) | | | (6,187 | ) | | | (11,146 | ) |
| Investment income under equity method, net (Notes 2 and 7) | | | 4,259 | | | | 9,844 | | | | 6,637 | |
| Impairment loss on assets (Notes 2, 3 and 9) | | | - | | | | (26,500 | ) | | | - | |
| Foreign exchange gain (loss), net (Notes 2 and 23) | | | (795 | ) | | | 175 | | | | 1,388 | |
| Loss on fire damage (Note 21) | | | - | | | | - | | | | (51,224 | ) |
| Other | | | 674 | | | | (380 | ) | | | (3,465 | ) |
| |
|
| | |
|
| | |
|
| |
| |
| Net non-operating expenses | | | (8,476 | ) | | | (23,048 | ) | | | (57,810 | ) |
| |
|
| | |
|
| | |
|
| |
| |
| LOSS FROM CONTINUING OPERATIONS BEFORE | | | | | | | | | | | | |
| INCOME TAX AND EXTRAORDINARY LOSS | | | (13,071 | ) | | | (13,038 | ) | | | (43,786 | ) |
| |
| INCOME TAX BENEFIT (EXPENSE) (Notes 2 and 17) | | | 6,009 | | | | 21,209 | | | | (2,537 | ) |
| |
|
| | |
|
| | |
|
| |
| |
| INCOME (LOSS) FROM CONTINUING OPERATIONS | | | (7,062 | ) | | | 8,171 | | | | (46,323 | ) |
| |
|
| | |
|
| | |
|
| |
| |
| DISCONTINUED OPERATIONS (Notes 16 and 25) | | | | | | | | | | | | |
| Income from discontinued operations, net of income tax | | | | | | | | | | | | |
| expense of $17 in 2003, $21 in 2004 and $66 in 2005 | | | 5,750 | | | | 16,968 | | | | 3,929 | |
| Gain on disposal of discontinued operations, net of income | | | | | | | | | | | | |
| tax expense of $59 in 2005 | | | - | | | | - | | | | 6,910 | |
| |
|
| | |
|
| | |
|
| |
| | | | 5,750 | | | | 16,968 | | | | 10,839 | |
| |
|
| | |
|
| | |
|
| |
| |
| EXTRAORDINARY LOSS (Note 12) | | | (2,203 | ) | | | - | | | | - | |
| |
|
| | |
|
| | |
|
| |
| |
| NET INCOME (LOSS) | | $ | (3,515 | ) | | $ | 25,139 | | | $ | (35,484 | ) |
| |
|
| | |
|
| | |
|
| |
| |
| | | | | | | | | | | | (Continued | ) |
F-4
| | | | 2003 | | | | 2004 | | | | 2005 | |
| |
| EARNINGS (LOSS) PER SHARE | | | | | | | | | | | | |
| Basic and diluted | | | | | | | | | | | | |
| Earnings (Loss) from continuing operations | | $ | (0.08 | ) | | $ | 0.08 | | | $ | (0.46 | ) |
| Earnings from discontinued operations | | | 0.06 | | | | 0.17 | | | | 0.11 | |
| Extraordinary loss | | | (0.02 | ) | | | - | | | | - | |
| |
|
| | |
|
| | |
|
| |
| | | $ | (0.04 | ) | | $ | 0.25 | | | $ | (0.35 | ) |
| | |
|
| | |
|
| | |
|
| |
| | | | | | | | | | | | | |
| WEIGHTED-AVERAGE COMMON SHARES | | | | | | | | | | | | |
| OUTSTANDING | | | | | | | | | | | | |
| |
| Basic | | | 99,110,225 | | | | 100,037,524 | | | | 100,059,031 | |
| | |
|
| | |
|
| | |
|
| |
| | | | | | | | | | | | | |
| Diluted | | | 99,110,225 | | | | 100,111,113 | | | | 100,059,031 | |
| | |
|
| | |
|
| | |
|
| |
| The accompanying notes are an integral part of the financial statements. | | | |
| | | | |
| (With Deloitte & Touche audit report dated February 6, 2006) | | (Concluded | ) |
F-5
| ASE TEST LIMITED AND SUBSIDIARIES |
| |
| CONSOLIDATED STATEMENTS OF CHANGES IN SHAREHOLDERS’ EQUITY |
| YEARS ENDED DECEMBER 31, 2003, 2004 AND 2005 |
| (In Thousands of U.S. Dollars, Except Share Data) |
|
| | | Capital Stock | | | Additional
Paid-in
Capital | | | Retained
Earnings | | Unrealized
Gain (Loss)
on Long-term
Investment | | | Unrecognized
Pension
Cost | | | Cumulative
Translation
Adjustments | | | Total
Shareholders’
Equity | |
| | |
|
|
|
|
|
|
|
| | | | | | | | | | | |
| | | | Shares | | | | Amount | | | | | | | | | | | | | |
| |
| BALANCE, JANUARY 1, 2003 | | | 99,067,790 | | | $ | 24,767 | | | $ | 448,063 | | | $ | 139,814 | | | $ | (611 | ) | | $ | - | | | $ | (73,094 | ) | | $ | 538,939 | |
| |
| Issuance of shares under stock option plans | | | 478,426 | | | | 120 | | | | 4,170 | | | | - | | | | - | | | | - | | | | - | | | | 4,290 | |
| Adjustment from changes in ownership percentage of investee | | | - | | | | - | | | | (1,598 | ) | | | - | | | | - | | | | - | | | | - | | | | (1,598 | ) |
| Consolidated net loss | | | - | | | | - | | | | - | | | | (3,515 | ) | | | - | | | | - | | | | - | | | | (3,515 | ) |
| Reversal of unrealized loss on long-term investment | | | - | | �� | | - | | | | - | | | | - | | | | 211 | | | | - | | | | - | | | | 211 | |
| Unrecognized pension cost | | | - | | | | - | | | | - | | | | - | | | | - | | | | (578 | ) | | | - | | | | (578 | ) |
| Translation adjustments | | | - | | | | - | | | | - | | | | - | | | | - | | | | - | | | | 8,238 | | | | 8,238 | |
| |
|
| | |
|
| | |
|
| | |
|
| | |
|
| | |
|
| | |
|
| | |
|
| |
| |
| BALANCE, DECEMBER 31, 2003 | | | 99,546,216 | | | | 24,887 | | | | 450,635 | | | | 136,299 | | | | (400 | ) | | | (578 | ) | | | (64,856 | ) | | | 545,987 | |
| |
| Issuance of shares under stock option plans | | | 512,815 | | | | 128 | | | | 4,424 | | | | - | | | | - | | | | - | | | | - | | | | 4,552 | |
| Consolidated net income | | | - | | | | - | | | | - | | | | 25,139 | | | | - | | | | - | | | | - | | | | 25,139 | |
| Reversal of unrealized loss on long-term investment | | | - | | | | - | | | | - | | | | - | | | | 340 | | | | - | | | | - | | | | 340 | |
| Reversal of unrecognized pension cost | | | - | | | | - | | | | - | | | | - | | | | - | | | | 578 | | | | - | | | | 578 | |
| Translation adjustments | | | - | | | | - | | | | - | | | | - | | | | - | | | | - | | | | 22,995 | | | | 22,995 | |
| |
|
| | |
|
| | |
|
| | |
|
| | |
|
| | |
|
| | |
|
| | |
|
| |
| |
| BALANCE, DECEMBER 31, 2004 | | | 100,059,031 | | | | 25,015 | | | | 455,059 | | | | 161,438 | | | | (60 | ) | | | - | | | | (41,861 | ) | | | 599,591 | |
| |
| Consolidated net loss | | | - | | | | - | | | | - | | | | (35,484 | ) | | | - | | | | - | | | | - | | | | (35,484 | ) |
| Reversal of unrealized loss on long-term investment | | | - | | | | - | | | | - | | | | - | | | | 60 | | | | - | | | | - | | | | 60 | |
| Translation adjustments | | | - | | | | - | | | | - | | | | - | | | | - | | | | - | | | | (5,962 | ) | | | (5,962 | ) |
| | |
| | |
|
| | |
|
| | |
|
| | |
|
| | |
|
| | |
|
| | |
|
| |
| |
| BALANCE, DECEMBER 31, 2005 | | | 100,059,031 | | | $ | 25,015 | | | $ | 455,059 | | | $ | 125,954 | | | $ | - | | | $ | - | | | $ | (47,823 | ) | | $ | 558,205 | |
| | |
| | |
|
| | |
|
| | |
|
| | |
|
| | |
|
| | |
|
| | |
|
| |
| The accompanying notes are an integral part of the financial statements. |
| |
| (With Deloitte & Touche audit report dated February 6, 2006) |
F-6
| ASE TEST LIMITED AND SUBSIDIARIES | | | | | | | | | | | | |
| |
| CONSOLIDATED STATEMENTS OF CASH FLOWS | | | | | | | | | | | | |
| YEARS ENDED DECEMBER 31, 2003, 2004 AND 2005 | | | | | | | | | | | | |
| (In Thousands of U.S. Dollars) | | | | | | | | | | | | |
|
|
|
|
|
|
|
|
|
|
|
|
|
| |
| |
| | | | 2003 | | | | 2004 | | | | 2005 | |
| |
| CASH FLOWS FROM OPERATING ACTIVITIES | | | | | | | | | | | | |
| Net income (loss) | | $ | (3,515 | ) | | $ | 25,139 | | | $ | (35,484 | ) |
| Adjustments to reconcile net income (loss) to net cash provided by | | | | | | | | | | | | |
| operating activities: | | | | | | | | | | | | |
| Depreciation and amortization | | | 142,377 | | | | 164,908 | | | | 154,302 | |
| Impairment loss on assets | | | - | | | | 26,500 | | | | - | |
| Loss on fire damage | | | - | | | | - | | | | 42,086 | |
| Accrued interest on convertible notes | | | 8,414 | | | | - | | | | - | |
| Provision for doubtful accounts and sales discounts | | | 1,180 | | | | 2,491 | | | | 1,422 | |
| Allowance for obsolescence | | | 206 | | | | 914 | | | | 959 | |
| Investment income under equity method | | | (4,259 | ) | | | (9,844 | ) | | | (6,637 | ) |
| Gain on disposal of discontinued operations | | | - | | | | - | | | | (6,910 | ) |
| Loss (gain) on disposal of assets | | | (445 | ) | | | 34 | | | | 3,542 | |
| Loss on early redemption of convertible notes | | | 2,203 | | | | - | | | | - | |
| Deferred income taxes | | | (1,207 | ) | | | (20,597 | ) | | | 3,947 | |
| Other | | | 701 | | | | (219 | ) | | | 2,450 | |
| |
|
| | |
|
| | |
|
| |
| | | | 145,655 | | | | 189,326 | | | | 159,677 | |
| Changes in operating assets and liabilities | | | | | | | | | | | | |
| Notes and accounts receivable | | | (34,458 | ) | | | (9,123 | ) | | | 10,446 | |
| Receivable from related parties | | | (863 | ) | | | 1,565 | | | | (11,758 | ) |
| Inventories | | | (8,115 | ) | | | (23,161 | ) | | | 16,009 | |
| Prepayments and other | | | 120 | | | | (6,827 | ) | | | (1,529 | ) |
| Notes and accounts payable | | | 4,744 | | | | (4,123 | ) | | | (5,450 | ) |
| Payable to related parties | | | 5,521 | | | | 3,841 | | | | (268 | ) |
| Income tax payable | | | 1,072 | | | | (971 | ) | | | (2,571 | ) |
| Accrued pension cost | | | 2,161 | | | | 1,868 | | | | 1,293 | |
| Accrued expenses and other | | | 18,828 | | | | 1,317 | | | | 4,215 | |
| |
|
| | |
|
| | |
|
| |
| |
| Net cash provided by operating activities | | | 134,665 | | | | 153,712 | | | | 170,064 | |
| |
|
| | |
|
| | |
|
| |
| |
| CASH FLOWS FROM INVESTING ACTIVITIES | | | | | | | | | | | | |
| Decrease (increase) in short-term investments | | | (3,500 | ) | | | (14,000 | ) | | | 20,445 | |
| Acquisition of property, plant and equipment | | | (142,674 | ) | | | (228,610 | ) | | | (66,116 | ) |
| Acquisition of long-term investments in shares of stock | | | (5,963 | ) | | | (19,613 | ) | | | - | |
| Increase in pledged time deposits | | | (2,051 | ) | | | (288 | ) | | | (332 | ) |
| Proceeds from sales of property, plant and equipment | | | 5,646 | | | | 28,671 | | | | 48,174 | |
| Proceeds from disposal of discontinued operations | | | - | | | | - | | | | 17,316 | |
| Increase in other assets | | | (8,043 | ) | | | (19,781 | ) | | | (6,077 | ) |
| Proceeds from insurance claims | | | - | | | | - | | | | 369 | |
| |
|
| | |
|
| | |
|
| |
| |
| Net cash provided by (used in) investing activities | | | (156,585 | ) | | | (253,621 | ) | | | 13,779 | |
| |
|
| | |
|
| | |
|
| |
| |
| | | | | | | | | | | (Continued | ) |
F-7
| | | | 2003 | | | | 2004 | | | | 2005 | |
| |
| CASH FLOWS FROM FINANCING ACTIVITIES | | | | | | | | | | | | |
| Proceeds from issuance of ordinary shares | | $ | 3,354 | | | $ | 5,488 | | | $ | - | |
| Increase (decrease) in short-term borrowings | | | (7,501 | ) | | | 18,693 | | | | (35,789 | ) |
| Increase (decrease) in commercial paper | | | (864 | ) | | | 9,935 | | | | (28,474 | ) |
| Proceeds from long-term debts | | | 226,617 | | | | 121,511 | | | | 138,113 | |
| Repayments of long-term debts | | | (36,642 | ) | | | (86,252 | ) | | | (162,694 | ) |
| Increase in collection of accounts receivable sold | | | - | | | | - | | | | 4,397 | |
| Early redemption of convertible notes | | | (209,005 | ) | | | - | | | | - | |
| |
|
| | |
|
| | |
|
| |
| |
| Net cash provided by (used in) financing activities | | | (24,041 | ) | | | 69,375 | | | | (84,447 | ) |
| |
|
| | |
|
| | |
|
| |
| |
| EFFECT OF EXCHANGE RATE CHANGES ON CASH | | | (1,918 | ) | | | (926 | ) | | | (674 | ) |
| |
|
| | |
|
| | |
|
| |
| |
| NET INCREASE (DECREASE) IN CASH AND CASH | | | | | | | | | | | | |
| EQUIVALENTS | | | (47,879 | ) | | | (31,460 | ) | | | 98,722 | |
| |
| CASH AND CASH EQUIVALENTS, BEGINNING OF YEAR | | | 118,828 | | | | 70,949 | | | | 39,489 | |
| |
|
| | |
|
| | |
|
| |
| |
| CASH AND CASH EQUIVALENTS, END OF YEAR | | $ | 70,949 | | | $ | 39,489 | | | $ | 138,211 | |
| |
|
| | |
|
| | |
|
| |
| |
| SUPPLEMENTAL INFORMATION | | | | | | | | | | | | |
| Interest paid (excluding capitalized interest) | | $ | 4,595 | | | $ | 6,795 | | | $ | 12,267 | |
| |
|
| | |
|
| | |
|
| |
| Income tax paid | | $ | - | | | $ | 243 | | | $ | 219 | |
| |
|
| | |
|
| | |
|
| |
| Cash paid for acquisition of property, plant and equipment | | | | | | | | | | | | |
| Acquisition of property, plant and equipment | | $ | 171,271 | | | $ | 210,656 | | | $ | 47,875 | |
| Decrease (increase) in payable | | | (2,955 | ) | | | 25,338 | | | | 21,410 | |
| Increase in capital lease obligation | | | (25,642 | ) | | | (7,384 | ) | | | (3,169 | ) |
| |
|
| | |
|
| | |
|
| |
| | | $ | 142,674 | | | $ | 228,610 | | | $ | 66,116 | |
| |
|
| | |
|
| | |
|
| |
| Cash received from sales of property, plant and equipment | | | | | | | | | | | | |
| Sales price | | $ | 6,680 | | | $ | 31,530 | | | $ | 50,795 | |
| Decrease (increase) in receivable | | | (1,034 | ) | | | (2,859 | ) | | | 3,018 | |
| Proceeds from disposal of discontinued operations | | | - | | | | - | | | | (5,639 | ) |
| |
|
| | |
|
| | |
|
| |
| | | $ | 5,646 | | | $ | 28,671 | | | $ | 48,174 | |
| |
|
| | |
|
| | |
|
| |
| Cash received from disposal of discontinued operations | | | | | | | | | | | | |
| Sales price | | $ | - | | | $ | - | | | $ | 19,116 | |
| Increase in receivable | | | - | | | | - | | | | (1,800 | ) |
| |
|
| | |
|
| | |
|
| |
| | | $ | - | | | $ | - | | | $ | 17,316 | |
| |
|
| | |
|
| | |
|
| |
| Cash received from issuance of ordinary shares | | | | | | | | | | | | |
| Issuance of ordinary shares, net of issuance cost | | $ | 4,290 | | | $ | 4,552 | | | $ | - | |
| Decrease (increase) in receivable for issuance of ordinary shares | | | (936 | ) | | | 936 | | | | - | |
| |
|
| | |
|
| | |
|
| |
| | | $ | 3,354 | | | $ | 5,488 | | | $ | - | |
| |
|
| | |
|
| | |
|
| |
| The accompanying notes are an integral part of the financial statements. | | | |
| | | | |
| (With Deloitte & Touche audit report dated February 6, 2006) | | (Concluded | ) |
F-8
ASE TEST LIMITED AND SUBSIDIARIES
NOTES TO CONSOLIDATED FINANCIAL STATEMENTS YEARS ENDED DECEMBER 31, 2003, 2004 AND 2005
(In Thousands of U.S. Dollars, Except Share Data and Unless Stated Otherwise)
1. | ORGANIZATION AND OPERATION |
Overview
ASE Test Limited (“ASE Test” or the “Company”) is a Singapore holding company which, through an exchange of its shares with its parent company, Advanced Semiconductor Engineering, Inc. (“ASE Inc.”), and other individuals, acquired substantially all of the shares of ASE Test, Inc. in May 1996. The exchange was accounted for as a reorganization of companies under common control. Since June 1996, the Company’s shares have been traded on the NASDAQ National Market in the United States under the symbol “ASTSF”.
J & R Holding Limited, a shareholder of the Company, offered 6,000,000 and 5,000,000 shares of the Company’s common stock in December 1997 and February 1999, respectively, in the form of Taiwan Depositary Receipts (“TDRs”). The TDRs are traded on the Taiwan Stock Exchange under the symbol “9101” and each TDR represents 0.0125 share of the Company’s stock.
Set forth is a brief overview of the Company’s organization structure.
The Company has four direct subsidiaries:
| a. | ASE Test, Inc. (incorporated in the Republic of China (“ROC”) in December 1987), which is engaged in the testing of semiconductors. |
| |
| b. | ASE Holdings (Singapore) Pte Ltd. (incorporated in Singapore in December 1994), which holds shares in ASE Test group companies; |
| |
| c. | ASE Test Holdings, Limited (“ASE Test Holdings”) (incorporated in Cayman Islands in April 1999), which holds shares in ASE Test group companies; and |
| |
| d. | ASE Test Finance Limited (“ASE Test Finance”) (incorporated in Mauritius in June 1999), which is engaged in financing activities. |
ASE Holdings, (Singapore) Pte Ltd. has a wholly-owned subsidiary, ASE Electronics (M) Sdn. Bhd. (“ASE Test Malaysia”) (incorporated in Malaysia in February 1991), which is engaged in the packaging and testing of semiconductors. ASE Test Malaysia disposed of its camera module operations on October 3, 2005 (See Note 25).
ASE Test Holdings has a wholly-owned subsidiary, ISE Labs, Inc. (“ISE Labs”) (incorporated in California, U.S.A. in November 1983). ISE Labs and its wholly-owned subsidiaries, ISE Labs Hong Kong Limited, which was dissolved in 2005, ASE Singapore Pte Ltd., ISE Technology, Inc. and Digital Testing Services Inc., are engaged in the front-end engineering testing and final testing of semiconductors.
As of December 31, 2004 and 2005, the Company and its subsidiaries had approximately 9,200 and 5,600 employees, respectively.
F-9
2. | SIGNIFICANT ACCOUNTING POLICIES |
The accompanying consolidated financial statements have been prepared in conformity with accounting principles generally accepted in the Republic of China (“ROC GAAP”). Significant accounting policies are summarized as follows:
Basis of PresentationThe Company prepares its consolidated financial statements using ROC GAAP with reconciliation to accounting principles generally accepted in the United States of America (“U.S. GAAP”) (See Note 26) to be consistent with the basis of presentation of the consolidated financial statements of ASE Inc. The accompanying consolidated balance sheets are presented as of December 31, 2004 and 2005 and the accompanying consolidated statements of income, changes in shareholders’ equity and cash flows are presented for the three years ended December 31, 2003, 2004 and 2005.
Basis of ConsolidationThe consolidated financial statements include the accounts of the Company and all of the aforementioned subsidiaries.
All intercompany accounts and transactions have been eliminated.
Use of EstimatesThe preparation of consolidated financial statements in conformity with ROC GAAP requires management to make estimates and judgments that affect the recorded amounts of assets, liabilities, revenues and expenses of the Company. The Company continually evaluates these estimates, including those related to sales allowances, allowances for doubtful accounts, inventory values, fire loss, useful lives of property, plant and equipment, goodwill, income tax valuation allowances, accrued pension costs and the fair value of financial instruments. The Company bases its estimates on historical experience and other assumptions, which it believes to be reasonable under the circumstances. Actual results may differ from these estimates under different assumptions and conditions.
Current and Noncurrent Assets and LiabilitiesCurrent assets include cash and cash equivalents and other assets that are reasonably expected to be realized in cash or to be consumed within one year from the balance sheet date. Liabilities to be settled within one year from the balance sheet date are classified as current liabilities. All other assets and liabilities are classified as noncurrent.
Cash and Cash EquivalentsThe Company considers all highly liquid investments which mature within three months or less from the date of purchase to be cash equivalents.
Short-term InvestmentsShort-term investments are recorded at historical cost and are carried at the lower of cost or market value as of the balance sheet date. An allowance or decline in value is provided and is charged to current income when the aggregate carrying amount of the investments exceeds the aggregate market value. A reversal of the allowance is recorded for a subsequent recovery of the aggregate market value.
F-10
Accounts Receivable SecuritizationAccounts receivable securitization is the transfer of a designated pool of accounts receivable to a special purpose entity, such as a bank, in the form of issuing beneficial securities or asset-backed securities based on the accounts receivable. Under ROC SFAS No. 33 “Accounting for Transfers of Financial Assets and Extinguishments of Liabilities”, such transfer of financial assets in which the transferor surrenders control over those assets is accounted for as a sale to the extent that consideration other than beneficial interests in the transferred assets is received in exchange. The difference between the book value of accounts receivable and total proceeds received is recorded as a gain or loss on the disposal of financial assets.
Allowance for Doubtful AccountsAllowance for doubtful accounts is provided based on an analysis of the aging of accounts and an evaluation of the collectibility of receivables. The Company determines the amount of allowance for doubtful receivables by examining the aging analysis of the outstanding account receivables and current trends in the credit quality of its customers.
InventoriesInventories are stated at the lower of cost or market value. Raw materials, supplies and spare parts are recorded at moving average cost or weighted average cost; others are recorded at standard cost and adjusted to the approximate weighted average cost at the balance sheet date. Market value represents net realizable value for finished goods and work in process, and replacement costs for raw materials, supplies and spare parts. Materials received from customers for processing, mainly semiconductor wafers, are excluded from inventories as title and risk of loss remain with the customers. Estimated losses on scrap and slow-moving items are recognized and included in the allowance for losses.
Long-term InvestmentsLong-term investments of which the Company owns at least 20% of the outstanding voting shares or where the Company exercises significant influence over the investee company’s operation are accounted for by the equity method. Under the equity method, the investments are initially carried at cost and subsequently adjusted for the Company’s proportionate shares in the net earnings or losses of the investee companies. Such proportionate shares in net earnings or losses are recognized as investment income or losses while any cash dividends received are reflected as a reduction in the carrying value of the investments. The difference, if any, between the cost of investment and the Company’s proportionate equity in the fair value of the net assets of the investees at the time of investments or at the time the equity method of accounting is first applied to a particular investment, is amortized on the straight-line method over 10 years. Changes in the Company’s ownership percentage of investees under the equity method are accounted for as adjustments to long-term investments and additional paid-in capital.
Other long-term investments in shares of stock are carried at the lower of cost or market value. Allowances for decline in market value and unrealized loss on long-term investments in shares of stock (a deduction account in shareholders’ equity) are made when the market value of an investment is lower than its carrying value. If a decline in value of the stock investment is determined to be other than temporary, such decline in value is charged against current income. Stock dividends are accounted for only as increases in the number of shares held. Cash dividends are recognized as income on the declaration date. Upon sale of the investment, the cost of investment sold is calculated under the weighted average method.
Property, Plant and EquipmentProperty, plant and equipment, except for leased machinery and equipment, are stated at cost. Machinery and equipment held under capital leases are recorded as an asset and an obligation at an amount equal to the lower of: (i) the present value at the beginning of the lease term of the minimum lease payments during the lease term (including the payment called for under any bargain purchase option); or (ii) fair value of the leased machinery and equipment at the inception of the lease. Machinery in transit, construction in progress and prepayments under construction are stated at cost. These include the cost of machinery, construction, down payments and other direct costs plus interest charges attributable to the borrowings used to finance the acquisitions of these assets. Major overhauls and improvements are capitalized, while maintenance and repairs are expensed currently.
F-11
Depreciation is computed using the straight-line method over estimated service lives, which range as follows: buildings and improvements, 5 to 40 years; machinery and equipment, 3 to 6 years; furniture and fixtures, 3 to 8 years and leased assets, 5 years. Leasehold improvements and improvements on building and business flats are amortized on a straight-line basis over the shorter of the useful life of the improvements or the lease term of the building. In the event that an asset depreciated to its residual value is still in service, its residual value is depreciated over its reestimated service life.
When plant and equipment are retired or disposed of, their costs and accumulated depreciation are removed from the accounts and any gain or loss is credited or charged to income.
AssetImpairmentThe Company evaluates the recoverable amount of the assets (primarily property, plant and equipment, deferred charge and goodwill) as of the balance sheet date. If an asset’s recoverable amount is lower than its carrying amount, the carrying amount of the asset should be reduced to its recoverable amount by recording a charge to the accumulated impairment loss account of the asset and such reduction should be recognized as impairment loss in current period income. When the recoverable amount subsequently increases, then the impairment loss previously recognized would be reversed and recorded as a gain. However, the carrying amount of an asset (other than goodwill) after the reversal of impairment loss should not exceed the carrying amount of the asset that would have been determined net of depreciation as if no impairment loss had been recognized.
Deferred ChargeDeferred charge consists of certain intangibles and other assets, including tools, utility, telecommunications and computer network systems. The amounts are amortized as follows: tools, 2 years; utility, telecommunications and computer network systems, 2 - 5 years; and others, 2 - 5 years.
GoodwillGoodwill arising from acquisitions or investments in consolidated subsidiaries has been amortized on the straight-line method over 10 years (See Note 3).
Employee Stock OptionsAll stock-based compensation for awards granted or modified after January 1, 2004 is accounted for by the related Interpretations of Accounting Research and Development Foundation in ROC. The compensation cost is measured based on the intrinsic value method, for which the compensation cost for stock options is measured as the excess, if any, of the quoted market price of the Company’s stock at the date of the grant over the amount an employee must pay to acquire the stock. Total compensation cost is recognized as expense over the requisite service or vesting period.
Revenue Recognition
Revenues from semiconductor packaging services are recognized upon shipment. Revenues fromsemiconductor testing services are recognized upon completion of the services or shipment. The Company does not take ownership of: (i) bare semiconductor wafers received from customers that the Company packages into finished semiconductors, and (ii) packaged semiconductors received from customers that the Company tests as to whether they meet certain performance specifications. The title and risk of loss remain with the customer for those bare semiconductors and/or packaged semiconductors. Accordingly, the cost of customer-supplied semiconductors materials is not included in the accompanying consolidated
F-12
financial statements. Other criteria the Company uses to determine when to recognize revenue are: (i) existence of persuasive evidence of the services provided, (ii) the selling price is fixed or determinable and (iii) collectibility is reasonably assured. The Company does not provide warranties to its customers, with the exception of defects in packaging services provided and deficiencies in testing services provided. An appropriate sales allowance, based on historical experience, is recognized in the same period the sale is recognized.
Pension CostFor employees under defined benefit pension plan, pension costs are recorded based on actuarial calculations. Provisions for pension costs are accrued based on actuarially determined amounts which include service costs, interest, amortization of unrecognized net obligation and expected return on pension assets.
For employees under defined contribution pension plan, pension costs are recorded on the actual contribution made to employee’s personal pension accounts.
Shipping and Handling CostsShipping and handling costs for goods sold are recorded as selling expense and the amounts in 2003, 2004 and 2005 were $867 thousand, $1,705 thousand and $1,382 thousand, respectively.
Research and Development CostsResearch and development costs are charged to expenses as incurred.
Income TaxesThe Company uses an inter-period tax allocation method for income tax. Tax effects of deductible temporary differences, unused tax credits and operating loss carryforward are recognized as deferred income tax assets, while taxable temporary differences are recognized as deferred income tax liabilities. A valuation allowance is provided to the extent that it is more likely than not that deferred income tax assets will not be realized.
Tax credits of ASE Test, Inc. from investments in machinery and equipment, research and development and employees’ training costs are recognized in the year acquired and expensed. Capital allowances of ASE Test Malaysia from investment in industrial buildings, machinery and equipment are recognized in the year in which they are acquired.
Adjustments of prior years’ income taxes are added to or deducted from the current year’s tax provision.
Income taxes on undistributed earnings (10%) of ASE Test, Inc., the Company’s Taiwan based subsidiary, are recorded as an expense in the year of shareholders’ approval.
Foreign Currency Transactions and Translation of Foreign-currency Financial Statements
The functional and reporting currency of the Company is U.S. dollar, while the functional currencies of its major subsidiaries, ASE Test, Inc., ASE Test Malaysia and ISE Labs, Inc. are their local currencies, namely, New Taiwan dollar, Malaysia Ringgit and U.S. dollar, respectively. Foreign currency transactions, other than foreign currency forward exchange contracts, are recorded in the local currencies at the rates of exchange in effect when the transactions occur. Gains or losses resulting from the application of different foreign exchange rates when foreign-currency assets and liabilities denominated in foreign-currencies are settled are credited or charged to income in the year of settlement. At the end of year, assets and liabilities denominated in foreign-currencies are revalued at the prevailing exchange rates and the resulting gains or losses are recognized in current period income.
F-13
The financial statements of the Company’s subsidiaries are translated into U.S. dollars at the end of period using the following rates: assets and liabilities, current rate at the balance sheet date; shareholders’ equity, historical rates; and income and expenses, average rate during the year. The net resulting translation adjustment is reported as a separate component of shareholders’ equity.
Derivative Financial Instruments| | |
| a. | Forward exchange contracts |
| |
| | Premiums or discounts on foreign currency forward exchange contracts which have been acquired to manage the risk associated with assets and liabilities denominated in foreign currencies arising from the difference between the forward rate and the spot rate at the date of each contract are deferred and amortized on the straight-line method over the contract periods. At year end, the balances of the forward exchange receivables or payables are restated based on prevailing exchange rates and the resulting gain or loss is credited or charged to income. Any exchange gain or loss when the contract is settled is also credited or charged to income. In addition, the receivables and payables related to the forward contracts are netted with the resulting amount presented as either an asset or a liability. |
| |
| b. | Option contracts |
| |
| | Written option contracts to purchase foreign currencies entered into for hedging purposes are not recorded as assets or liabilities on the contract dates. Gains or losses upon settlement are credited or charged to income. Amounts received or paid are amortized over each contract period. At year end, the outstanding written option contracts are marked to market with charges to current income. |
| |
| | When the Company has a legally enforceable right to set off the recognized amount and intends either to settle on a net basis, or to realize the asset and the liability simultaneously, the difference between receivables and payables balance shall be netted and accounted for as either a current asset or current liability; otherwise, the receivables and payables should be accounted for as a current asset and current liability, respectively. |
| |
Recent Accounting PronouncementsIn December 2003, the ROC Accounting Research and Development Foundation (“ARDF”) issued ROC SFAS No. 34 “Accounting for Financial Instruments”, which is required to be applied by the Company on January 1, 2006. SFAS No. 34 will require the Company to classify all financial instruments as either trading, available-for-sale, held-to-maturity or cost basis. Debt securities that the Company has the positive intent and ability to hold to maturity are classified as held-to-maturity securities and reported at amortized cost. Debt and equity securities that are bought and traded for short-term profit are classified as trading securities and reported at fair value, with unrealized gains and losses recognized in earnings. Debt and equity securities not classified as either held-to-maturity or trading are classified as available-for-sale securities and reported at fair value, with unrealized gains and losses excluded from earnings and reported as a separate component of shareholders’ equity. Equity securities without available market quotes are classified as cost-basis securities and reported at cost less any impairment loss. Additionally, SFAS No. 34 will require the Company to recognize all derivatives on the balance sheet at fair value. Derivatives that do not qualify as hedging instruments under SFAS No. 34 must be adjusted to fair value through earnings. If derivatives qualify as hedging instruments, depending on the nature of the hedge, changes in the fair value of derivatives will either be offset against the changes in fair value of the hedged assets, liabilities or firm commitments through earnings, or recognized in other comprehensive income until the hedged items affect earnings. The change in a derivative's fair value related to the ineffective portion of a hedge, if any, will be immediately recognized in earnings. The Company is currently evaluating the effect of adopting the standard but expects the implementation will not have a material effect on the Company's financial position or overall trends in results of operations.
F-14
In June 2005, ARDF issued SFAS No. 36 “Financial Instruments: Disclosure and Presentation”, which is also required to be applied by the Company on January 1, 2006. SFAS No. 36 will require the Company for the presentation of financial instruments and identifies the information that should be disclosed about them. The presentation requirements apply to the classification of financial instruments, from the perspective of the issuer, into financial assets, financial liabilities and equity instruments; the classification of related interest, dividends, losses and gains; and the circumstances in which financial assets and financial liabilities should be offset. The Standard requires disclosure of information about factors that affect the amount, timing and certainty of an entity’s future cash flows relating to financial instruments and the accounting policies applied to those instruments. This Standard also requires disclosure of information about the nature and extent of an entity’s use of financial instruments, the business purposes they serve, the risks associated with them, and management’s policies for controlling those risks. The principles in this Standard complement the principles for recognizing and measuring financial assets and financial liabilities in SFAS No. 34 “Accounting for Financial Instruments”.
In December 2005, ARDF issued a revision on SFAS No. 25 “Business Combination – Accounting Treatment under Purchase Method”, which provides certain changes to existing accounting treatment for goodwill acquired in business combinations. Under the revised standard, goodwill acquired in business combinations is no longer amortized over its estimated useful life beginning January 1, 2006. Instead, it should be evaluated for impairment in accordance with SFAS No. 35 “Accounting for Asset Impairment”. Amortized cost should be the new basis for goodwill acquired prior to January 1, 2006 for the purpose of impairment analysis. This revised standard is effective on January 1, 2006 and no early adoption is permitted. The Company is currently evaluating the effect of adopting the standard but expects the implementation will not have a material effect on the Company's financial position or overall trends in results of operations.
Reclassifications
Certain accounts in the consolidated financial statements as of December 31, 2004 and for the years ended December 31, 2003 and 2004 have been reclassified to conform to the consolidated financial statements as of and for the year ended December 31, 2005.
Effective December 31, 2004, the Company adopted ROC SFAS No. 35,”Accounting for Asset Impairment”. In accordance with the new standard, goodwill, long-lived assets, and other indefinite lived intangible assets shall be tested for impairment. An impairment charge calculated in accordance with this new accounting standard resulted in a decrease in both the goodwill and net income by $26,500 thousand for the year ended December 31, 2004. The remaining goodwill continued to be amortized until December31, 2005 (See Note 2).
4. | CASH AND CASH EQUIVALENT |
| | |
| | | 2004 | | | 2005 | |
| | | | | | | | |
| Cash on hand | | $ | 32 | | $ | 22 | |
| Checking and saving accounts | | | 23,380 | | | 68,851 | |
| Time deposits | | | 10,628 | | | 60,807 | |
| Cash equivalents | | | 5,449 | | | 8,531 | |
| |
|
| |
|
| |
| | $ | 39,489 | | $ | 138,211 | |
| |
|
| |
|
| |
F-15
5. | NOTES AND ACCOUNTS RECEIVABLE, NET |
| | |
| | | 2004 | | | | 2005 | | |
| | | | | | | | | | |
| Notes receivable | | $ | 68 | | | $ | 68 | | |
| Accounts receivable | | | 94,547 | | | | 82,744 | | |
| Allowance for doubtful accounts (Note 2) | | | (4,544 | ) | | | (5,023 | ) | |
| Allowance for sales allowances (Note 2) | | | (869 | ) | | | (455 | ) | |
| |
|
|
| |
|
|
| |
| | $ | 89,202 | | | $ | 77,334 | | |
| |
|
|
| |
|
|
| |
The changes in allowance for sales allowances and doubtful accounts are as follows:
| | | Doubtful
Accounts | | | | Sales
Allowances | | |
| | | | | | | | | |
| Balance at January 1, 2003 | | $ | 2,531 | | | $ | 440 | | |
| Additions | | | 1,180 | | | | - | | |
| Write-offs | | | (1,325 | ) | | | - | | |
| Reclassification | | | - | | | | 440 | | |
| |
|
|
| |
|
|
| |
| Balance at December 31, 2003 | | | 2,386 | | | | 880 | | |
| Additions | | | 2,391 | | | | 100 | | |
| Write-offs | | | (233 | ) | | | (111 | ) | |
| |
|
|
| |
|
|
| |
| Balance at December 31, 2004 | | | 4,544 | | | | 869 | | |
| Additions | | | 1,109 | | | | 313 | | |
| Write-offs | | | (630 | ) | | | (727 | ) | |
| |
|
|
| |
|
|
| |
| Balance at December 31, 2005 | | $ | 5,023 | | | $ | 455 | | |
| |
|
|
| |
|
|
| |
In November 2005, ASE Test, Inc. and its parent company, ASE Inc., entered into a $100 million, three-year revolving accounts receivable securitization agreement with a bank.
Under the agreement, ASE Test, Inc. and ASE Inc. transferred a pool of accounts receivable to the bank, who issued securities backed by these accounts receivable. Proceeds received from the bank were the net carrying value of the pool of accounts receivable, less a deferred purchase price receivable at 20% of accounts receivable sold, guarantee deposit, program fee and other related expenses.
After the transfer of the accounts receivable, the Company continues to service, administer, and collect these accounts receivable on behalf of the bank. The Company collects on the initial receivables and transfers certain new accounts receivable having similar value to replace the collected receivables. Collected receivables not yet replaced by new accounts receivable due to timing difference are recorded as other current liability on the balance sheet, which amounted to $4,397 thousand at December 31, 2005. Total accounts receivable sold in 2005 was $9,525 thousand.
The Company lost control of these accounts receivable at the time of transfer to the bank, and therefore the transaction was accounted for as a sale of accounts receivable, for which the book value of the accounts receivable was derecognized and difference between the book value and the proceeds received was recorded as non-operating gain or loss.
F-16
| | | 2004 | | | | 2005 | | |
| | | | | | | | | | |
| Raw materials | | $ | 20,663 | | | $ | 9,334 | | |
| Work in process | | | 12,719 | | | | 4,272 | | |
| Finished goods | | | 3,445 | | | | 2,393 | | |
| Supplies and spare parts | | | 8,148 | | | | 6,460 | | |
| Supplies in transit | | | - | | | | 434 | | |
| |
|
|
| |
|
|
| |
| | | 44,975 | | | | 22,893 | | |
| Allowance for obsolescence | | | (640 | ) | | | (1,654 | ) | |
| |
|
|
| |
|
|
| |
| | $ | 44,335 | | | $ | 21,239 | | |
| |
|
|
| |
|
|
| |
| The changes in allowance for obsolescence are as follows: | | | | | | | | | |
| Balance at January 1, 2003 | | | | | | $ | 782 | | |
| Additions | | | | | | | 206 | | |
| Write-offs | | | | | | | (112 | ) | |
| | | | | |
|
|
| |
| Balance at December 31, 2003 | | | | | | | 876 | | |
| Additions | | | | | | | 914 | | |
| Write-offs | | | | | | | (1,150 | ) | |
| | | | | |
|
|
| |
| Balance at December 31, 2004 | | | | | | | 640 | | |
| Additions | | | | | | | 2,204 | | |
| Write-offs | | | | | | | (1,190 | ) | |
| | | | | |
|
|
| |
| Balance at December 31, 2005 | | | | | | $ | 1,654 | | |
| | | | | |
|
|
| |
| | | 2004 | | | 2005 | | |
| | |
|
|
|
|
|
| | |
|
|
|
|
|
| | |
| | | | Carrying
Value | | | | % of
Ownership | | | | Carrying
Value | | | | % of
Ownership | | |
| Equity method | | | | | | | | | | | | | | | | | |
| ASE Investment (Labuan) Inc. | | $ | 51,337 | | | | 30.0 | | | $ | 57,974 | | | | 30.0 | | |
| |
|
|
| | | | | |
|
| | | | | | |
| Cost method | | | | | | | | | | | | | | | | | |
| ASE Inc. | | | 81,422 | | | | 4.0 | | | | 81,251 | | | | 4.0 | | |
| UC Fund II | | | 1,000 | | | | - | | | | 1,000 | | | | - | | |
| |
|
|
| | | | | |
|
| | | | | | |
| | | 82,422 | | | | | | | | 82,251 | | | | | | |
| Allowance for losses (Note 2) | | | (60 | ) | | | | | | | - | | | | | | |
| |
|
|
| | | | | |
|
| | | | | | |
| | | 82,362 | | | | | | | | 82,251 | | | | | | |
| |
|
|
| | | | | |
|
| | | | | | |
| | $ | 133,699 | | | | | | | $ | 140,225 | | | | | | |
| |
|
|
| | | | | |
|
| | | | | | |
As of December 31, 2004 and 2005, the Company and its subsidiaries held 163,783,841 and 180,132,187 shares of common stock of ASE Inc. respectively. The market value of these investments in ASE Inc., which is calculated based on the average closing price of the stock as of December 2004 and 2005, is $120,899 thousand and $149,817 thousand, respectively.
The investment in ASE Investment (Labuan) Inc. (incorporated in Malaysia in June 1999) was made in connection with the acquisition of the operation of the Motorola Semiconductor Products Sector Businesses in Paju, Korea.
F-17
As of December 31, 2003, the Company held a 27.6% ownership interest in ASE (Chung Li) Inc. and a 4.0% interest in ASE Material Inc., and its parent company, ASE Inc., held 72.4% of ASE (Chung Li) Inc and 57.4% of ASE Material Inc. Prior to the merger of ASE (Chung Li) Inc. and ASE Material Inc. into ASE Inc. on August 1, 2004, the Company accounted for both investments under the equity method based on its conclusion that it had the ability to exercise significant influence over these companies.
The merger was consummated by means of a share exchange, pursuant to which the Company received approximately 154,175 thousand, or approximately 4.3%, of ASE Inc.’s outstanding shares, in exchange for its ownership interests in ASE (Chung Li) Inc. and ASE Material Inc. The number of shares exchanged was determined based on independent appraisals. Because of the trust arrangement described below, the Company is unable to exercise voting rights associated with the acquired shares and thus does not have the ability to exert influence over ASE Inc.’s operations. As a result, the Company accounts for its investment in ASE Inc. under the cost method of accounting. Under this method, the Company records dividends as income when they are received and gains and losses on the sale of the shares when they occur.
With respect to the trust arrangement, in order to comply with applicable Singapore laws, which provide that the Company may not acquire, directly or indirectly, shares in its parent company, ASE Inc., a trust was established jointly by ASE Inc. and the Company to hold and dispose of the ASE Inc. shares acquired by the Company in connection with the merger. Pursuant to the trust agreement, the Company’s rights with respect to the ASE Inc. shares held in trust are limited to the right to receive the proceeds from the sale of the shares and any cash dividends declared while the shares remain in trust. The trustee is authorized to sell the shares, subject to market conditions, when such shares become available for resale under ROC law and in accordance with volume limitations under ROC law, at its sole discretion; provided such shares are sold (i) in compliance with ROC laws and regulations, (ii) in an orderly manner in order to minimize the impact on the trading price of the shares, and (iii) in a manner consistent with its fiduciary duties owed to the Company.
Investment income under the equity method was as follows:
| | | 2003 | | | | 2004 | | | | 2005 | | |
| | | | | | | | | | | | | | |
| ASE Investment (Labuan) Inc. | | $ | 2,725 | | | $ | 3,569 | | | $ | 6,637 | | |
| ASE Material Inc. | | | 204 | | | | 1,068 | | | | - | | |
| ASE (Chung Li) Inc. | | | 1,330 | | | | 5,207 | | | | - | | |
| |
|
| | |
|
| | |
|
| | |
| | $ | 4,259 | | | $ | 9,844 | | | $ | 6,637 | | |
| |
|
| | |
|
| | |
|
| | |
| |
| 8. | PROPERTY, PLANT AND EQUIPMENT, NET |
| | |
| | | 2004 | | | | 2005 | | |
| Cost | | | | | | | | | |
| Land | | $ | 3,892 | | | $ | - | | |
| Buildings and improvements | | | 124,162 | | | | 113,195 | | |
| Machinery and equipment | | | 1,044,898 | | | | 959,270 | | |
| Furniture and fixtures | | | 18,832 | | | | 18,672 | | |
| Leased assets - machinery and equipment | | | 22,836 | | | | 10,464 | | |
| Machinery in transit and prepayments | | | 77,399 | | | | 11,302 | | |
| Construction in progress | | | 7,500 | | | | 256 | | |
| |
|
| | |
|
| | |
| | | 1,299,519 | | | | 1,113,159 | | |
| |
|
| | |
|
| | |
| | | | | | | | | |
| (Continued) | | |
F-18
| | | 2004 | | | | 2005 | | |
| Accumulated depreciation | | | | | | | | | |
| Buildings and improvements | | $ | 44,650 | | | $ | 46,622 | | |
| Machinery and equipment | | | 602,696 | | | | 621,223 | | |
| Furniture and fixtures | | | 11,892 | | | | 13,161 | | |
| Leased assets - machinery and equipment | | | 5,485 | | | | 2,074 | | |
| |
|
| | |
|
| | |
| | | 664,723 | | | | 683,080 | | |
| |
|
| | |
|
| | |
| | $ | 634,796 | | | $ | 430,079 | | |
| |
|
| | |
|
| | |
Capitalized interest consists of the following:
| | | 2003 | | | | 2004 | | | | 2005 | | |
| | | | | | | | | | | | | | |
| Total interest expense including capitalization | | $ | 14,997 | | | $ | 9,795 | | | $ | 13,766 | | |
| Capitalized interest | | | 1,451 | | | | 2,844 | | | | 878 | | |
| Capitalization interest | | | 3.00% | | | | 2.46-3.93% | | | | 2.32-3.94% | | |
The Company adopted ROC SFAS No. 35 “Accounting for Asset Impairment” on December 31, 2004, and recognized an impairment loss on goodwill of $26,500 thousand, which was determined based on the amount by which the carrying amount of the cash-generating unit exceeded its recoverable amount. In testing a cash-generating unit for impairment, the Company identified the goodwill related to ISE Labs.The recoverable amount was determined by the Company based on the “value-in-use” of ISE Labs, which was determined based on six-years of cash flows, discounted at a rate of 9.58% . The Company attributes the impairment of goodwill associated with the acquisition of ISE Labs primarily to a downward revision in the forecasted revenue of ISE Labs. The reduction in forecasted revenues was made in response to internal company estimates and industry trend data that suggested the outlook for semiconductor industry, and ISE Labs in particular, was less favorable than in prior years, including the year in which the Company acquired its interest in ISE Labs. The Company performed its annual goodwill impairment test on December 31, 2005 and found no impairment. Amortization of the goodwill is reflected in general and administrative expenses in the consolidated statements of income and was $10,105 thousand, $10,105 thousand and $4,966 thousand for each year ended December 31, 2003, 2004 and 2005 (See Note 3).
10. | SHORT-TERM BORROWINGS |
Short-term borrowings consist of revolving bank loans and letters of credit loans for the purchase of raw material and machinery and equipment which bear interest rates from 1.50% to 3.41% as of December 31, 2004.
F-19
11. | COMMERCIAL PAPER – As of December 31, 2004 |
| | |
| Guarantee/Acceptance Agency | | Period | | Interest
Rate (%) | | | Amount |
| |
| Fubon Bills Finance Co. | | 2004.11.05-2005.01.06 | | 1.500 | | $ | 1,566 |
| China Bills Finance Corporation | | 2004.11.10-2005.03.10 | | 1.370 | | | 3,133 |
| Dah Chung Bills Finance Corp. | | 2004.12.17-2005.02.15 | | 1.480 | | | 3,133 |
| E. Sun Bills Finance Corp. | | 2004.11.17-2005.02.16 | | 1.498 | | | 3,133 |
| International Bills Finance Corporation | | 2004.11.10-2005.03.10 | | 1.350 | | | 3,133 |
| Taiwan Finance Corporation | | 2004.11.10-2005.01.27 | | 1.370 | | | 3,133 |
| Taching Bill Finance Ltd. | | 2004.10.19-2005.01.13 | | 1.520 | | | 5,640 |
| China Trust Bills Finance Corporation | | 2004.09.15-2005.01.13 | | 1.238 | | | 5,640 |
| | | | | |
|
|
| | | | | | | | 28,511 |
| Less - unamortized discounts | | | | | | | 37 |
| | | | | |
|
|
| |
| | | | | | | $ | 28,474 |
| | | | | | |
|
|
| | | | 2004 | | | | 2005 | |
| |
| Bank loans | | $ | 309,726 | | | $ | 288,094 | |
| Capital lease obligation (Note 20) | | | 9,034 | | | | 6,952 | |
| |
|
| | |
|
| |
| | | | 318,760 | | | | 295,046 | |
| Less: Current portion | | | (45,740 | ) | | | (49,743 | ) |
| |
|
| | |
|
| |
| |
| | | $ | 273,020 | | | $ | 245,303 | |
| | |
|
| | |
|
| |
| |
| a. Bank loans | | | | | | | | |
| |
| | | | 2004 | | | | 2005 | |
| |
| ASE Test Limited | | | | | | | | |
| Repaid in September 2005, interest at 3.299% as of December 31, 2004 | | $ | 30,000 | | | $ | - | |
| |
|
| | |
|
| |
| |
| ASE Test, Inc. | | | | | | | | |
| Repayment at maturity in August 2007, interest at 1.655% and | | | | | | | | |
| 1.975% as of December 31, 2004 and 2005, respectively | | | 15,666 | | | | 15,216 | |
| Repayable by February 2010 in quarterly installments, interest at | | | �� | | | | | |
| 2.995% as of December 31, 2005 | | | - | | | | 12,173 | |
| Repayable by February 2008 in quarterly installments, interest at | | | | | | | | |
| 2.844% as of December 31, 2005 | | | - | | | | 9,130 | |
| Repayment at maturity in June 2008, interest at 2.5% as of | | | | | | | | |
| December 31, 2005 | | | - | | | | 9,130 | |
| Repayment at maturity in January 2007, interest at 2.748% as of | | | | | | | | |
| December 31, 2005 | | | - | | | | 7,608 | |
| Repayable by May 2008 in semi-annual installments, interest at | | | | | | | | |
| 3.096% as of December 31, 2004 and 2005 | | | 9,399 | | | | 7,303 | |
| Repayable by December 2009 in quarterly installments, interest at | | | | | | | | |
| 2.504% as of December 31, 2005 | | | - | | | | 7,273 | |
| |
| |
| | | | | | | | (Continued | ) |
F-20
| | | | 2004 | | | | 2005 | |
| |
| Repayment at maturity in June 2008, interest at 2.58% as of | | | | | | | | |
| December 31, 2005 | | $ | - | | | $ | 4,565 | |
| Repayable by April 2007 in quarterly installments, interest at | | | | | | | | |
| 4.54% and 2.8% as of December 31, 2004 and 2005, respectively | | | 6,031 | | | | 4,565 | |
| Repayable by January 2007 in quarterly installments, interest at | | | | | | | | |
| 3.85% and 3.70% as of December 31, 2004 and 2005, respectively | | | 8,676 | | | | 936 | |
| Repaid in December 2005, interest at 2.95% as of December 31, 2004 | | | 9,399 | | | | - | |
| Repaid in June 2005, interest at 4.125% as of December 31, 2004 | | | 8,355 | | | | - | |
| Repaid in June 2005, interest at 3.025% as of December 31, 2004 | | | 6,266 | | | | - | |
| Repaid in June 2005, interest at 3% as of December 31, 2004 | | | 4,700 | | | | - | |
| Repaid in May 2005, interest at 3.30% as of December 31, 2004 | | | 3,916 | | | | - | |
| Repaid in November 2005, interest at 2.9% as of December 31, 2004 | | | 3,133 | | | | - | |
| |
|
| | |
|
| |
| | | | 75,541 | | | | 77,899 | |
| |
|
| | |
|
| |
| ISE Labs | | | | | | | | |
| Mortgage bank loan, repaid in February 2005, interest at 7.92% as of | | | | | | | | |
| December 31, 2004 | | | 1,685 | | | | - | |
| Repayable by March 2009 in quarterly installments, interest at 4.7% | | | | | | | | |
| as of December 31, 2005 | | | - | | | | 1,745 | |
| Repayable by July 2009 in quarterly installments, interest at 4.2% | | | | | | | | |
| as of December 31, 2005 | | | - | | | | 1,523 | |
| Repayable by December 2009 in quarterly installments, interest at | | | | | | | | |
| 5.25% as of December 31, 2005 | | | - | | | | 607 | |
| |
|
| | |
|
| |
| | | | 1,685 | | | | 3,875 | |
| |
|
| | |
|
| |
| ASE Test Malaysia | | | | | | | | |
| Repayable by April 2006 in quarterly installments, interest at 2.87% | | | | | | | | |
| to 3.31% and 5.00% as of December 31, 2004 and 2005, respectively | | | 7,500 | | | | 2,070 | |
| Repayable by June 2007 in quarterly installments, interest at | | | | | | | | |
| 2.87% to 3.31% and 5.29% as of December 31, 2004 and 2005, | | | | | | | | |
| respectively | | | 15,000 | | | | 11,250 | |
| |
|
| | |
|
| |
| | | | 22,500 | | | | 13,320 | |
| |
|
| | |
|
| |
| ASE Test Finance | | | | | | | | |
| Repayable by June 2008 in semi-annual installments, interest | | | | | | | | |
| at 3.63% and 5.73% as of December 31, 2004 and 2005, respectively | | | 150,000 | | | | 115,000 | |
| Repayable by August 2010 in semi-annual installments, interest at | | | | | | | | |
| 5.45% as of December 31, 2005 | | | - | | | | 78,000 | |
| Repaid in September 2005, interest at 3.52% as of December 31, 2004 | | | 30,000 | | | | - | |
| |
|
| | |
|
| |
| | | | 180,000 | | | | 193,000 | |
| |
|
| | |
|
| |
| |
| | | $ | 309,726 | | | $ | 288,094 | |
| | |
|
| | |
|
| |
The loan obtained in 2003 by ASE Test Finance which was restricted for use in the redemption of its convertible notes issued in 1999 is repayable in semi-annual installments starting June 2005 to June 2008. The Company, ASE Inc. and ASE Test, Inc. provided guarantees for ASE Test Finance’s payment obligations under the facility. Under the guaranty, the Company is required to maintain certain financial ratios and the tangible net worth of the Company shall not be less than $400 million at any time.
F-21
The loan agreement’s covenants specify the following:
Without the prior written consent from the majority of the banks, the Company and the Company’s subsidiary ASE Test, Inc. should not:
| a) | Pledge, sell, lease, transfer or dispose its assets, unless the transaction involves a transfer of assets between affiliates. Assets in exchange for other comparable or superior as to type are excluded from this covenant; or |
| |
| b) | Merge with any other entity or make investments in excess of $80 million or acquire material assets from another entity. |
The loans obtained in 2005 by ASE Test Finance were restricted for use in the redemption of ASE Test Finance’s and the Company’s loans obtained in 2004 and are repayable in semi-annual installments from August 2008 to August 2010. The Company and ASE Inc. provided guarantees for ASE Test Finance’s payment obligations under the facility. Under the guaranty, the Company is required to maintain certain financial ratios and the tangible net worth of the Company shall not be less than $450 million at any time.
The loan agreement’s covenants specify the following:
Without the prior written consent from the majority of the banks, the Company should not:
| a) | Pledge its assets, assume liabilities or dispose of assets in excess of 20% of total assets, unless the transaction involves a transfer of assets between affiliates. Assets in exchange for other comparable or superior as to type are excluded from this covenant; or |
| |
| b) | Merge with any other entity or make investments in excess of $100 million or acquire material assets from another entity. |
The abovementioned bank loan contracts have variable interest rates and are subject to adjustments by banks or changes in prime rate. In addition, several of the loan agreements have default provisions, whereby a default under one debt agreement may also trigger cross-defaults under other debt agreements.
As of December 31, 2005, the Company is with compliance in its financial and non-financial covenants.
| b. | Convertible notes |
| |
| | On June 29, 1999, ASE Test Finance issued $160 million of 1% guaranteed convertible notes due on July 1, 2004. The proceeds from the issuance of the convertible notes were used to finance the acquisitions of ISE Labs and the Motorola Semiconductor Products Sector Businesses in Taiwan and Korea. On August 19, 2003, ASE Test Finance redeemed and cancelled the total outstanding convertible notes of $209,005 thousand, which resulted in an extraordinary loss of $2,203 thousand. |
| | |
| | Under ROC GAAP, the loss incurred of $2,203 thousand as a result of the early redemption and cancellation of the convertible bonds was recorded as an extraordinary loss. Under U.S. GAAP, the loss would not qualify as extraordinary and would have been included in other expenses. |
Long-term debt by currencies other than U.S. dollars as of December 31, 2004 and 2005 is as follows:
| | | 2004 | | 2005 |
| | | | | | | |
| New Taiwan dollars | | NT$ | 2,417,278 | | NT$ | 2,559,760 |
F-22
Such amounts have been translated into U.S. dollars based on the spot rates quoted by Bank of Taiwan of NT$31.917 to US$1 and NT$32.86 to US$1 as of December 31, 2004 and 2005, respectively.
| As of December 31, 2005, the maturities of long-term debts are as follows: | | | |
| |
| Within the following year | | $ | 49,743 |
| During the second year | | | 107,784 |
| During the third year | | | 68,702 |
| During the fourth year | | | 36,901 |
| During the fifth year and thereafter | | | 31,916 |
| |
|
|
| |
| | | $ | 295,046 |
| | |
|
|
As stipulated by the Company Laws of ROC, the Company's subsidiary in the ROC is required to make an appropriation for legal capital reserve at 10% of net income as determined in accordance with ROC GAAP. Use of the legal capital reserve is restricted to certain purposes, including the offset of a deficit, and the transfer of up to 50% of the legal capital reserve into capital stock when total legal reserve reaches 50% of total capital stock at par. As a result of these laws, approximately US$27,910 thousand was not available for distribution as of December 31, 2005.
As of December 31, 2005, the Company has three stock option plans, the 1999, 2000 and 2004 OptionPlans. Stock options granted under these plans are exercisable for ordinary shares of the Company and vest ratably over a period of five years. The options expire 10 years from the date of grant.
Information regarding the stock options granted or modified after January 1, 2004 is presented below:
ASE Test Limited
| | | 2004 | | 2005 |
| | |
|
|
|
|
|
|
|
|
|
| |
|
|
|
|
|
|
|
|
|
|
|
| | | | Number of
Shares | | | | Weighted
Average
Exercise
Price
Per Share | | | | Weighted
Average
Grant Date
Fair Values | | | Number of
Shares | | | | Weighted
Average
Exercise
Price
Per Share | | | | Weighted
Average
Grant Date
Fair Values | |
| |
| Beginning outstanding | | | | | | | | | | | | | | | | | | | | | | | |
| balance | | | - | | | $ | - | | | | | | | 260,000 | | | $ | 6.18 | | | | | |
| Option granted | | | 260,000 | | | | 6.18 | | | $ | 6.18 | | | 32,500 | | | | 6.50 | | | $ | 6.50 | |
| | | | | | | | | | |
|
| | | | | | | | | |
|
| |
| Option exercised | | | - | | | | - | | | | | | | - | | | | - | | | | | |
| Option forfeited | | | - | | | | - | | | | | | | - | | | | - | | | | | |
| Option expired | | | - | | | | - | | | | | | | - | | | | - | | | | | |
| |
|
| | | | | | | | | | |
| | | | | | | | | |
| |
| Ending outstanding balance | | | 260,000 | | | | 6.18 | | | | | | | 292,500 | | | | 6.21 | | | | | |
| | |
|
| | | | | | | | | | |
| | | | | | | | | |
Options outstanding on December 31, 2005, the related weighted average exercise price and remaining contractual life information are as follows:
F-23
| | | Outstanding
Shares | | Exercisable
Shares | | Weighted
Average
Remaining
Life (Years) |
| |
| Options with exercise price of: | | | | | | |
| $5.5 | | 60,000 | | 12,000 | | 8.6 |
| $6.1 | | 60,000 | | 12,000 | | 8.8 |
| $6.5 | | 172,500 | | 42,000 | | 8.6 |
| | |
| |
| | |
| | | 292,500 | | 66,000 | | |
| | |
| |
| | |
The Company has computed, for pro forma disclosure purposes, the fair value of options granted using the Black-Scholes option pricing model with the following assumptions:
| | | 2004 | | 2005 |
| |
| Risk-free interest rate | | 3.50%-3.88% | | 3.88% |
| Expected life | | 5 years | | 5 years |
| Expected volatility | | 78.28% | | 59.06% |
| Expected dividend | | 0% | | 0% |
ASE Inc.
ASE Inc., the parent company, has two option plans, which were adopted in 2002 and 2004. Under the terms of the plans, stock option rights are granted to employees including those of the Company. The option rights expire ten years from the date of grant. On the second anniversary of the grant date, 40% of the options become vested and the remaining options vest ratably over a period of three years thereafter.
Information regarding the ASE Inc.’s stock option plans for the Company and its subsidiaries is as follows:
| | | 2004 | | 2005 |
| | |
|
|
|
|
|
|
|
|
|
| |
|
|
|
|
|
|
|
|
|
|
|
| | | | Number of
Shares | | | | Weighted
Average
Exercise
Price
Per Share | | | | Weighted
Average
Grant Date
Fair Values | | | Number of
Shares | | | | Weighted
Average
Exercise
Price
Per Share | | | | Weighted
Average
Grant Date
Fair Values | |
| |
| Beginning outstanding | | | | | | | | | | | | | | | | | | | | | | | |
| balance | | | 38,852,400 | | | $ | 0.58 | | | | | | | 61,752,100 | | | $ | 0.60 | | | | | |
| Options granted | | | 25,499,500 | | | | 0.79 | | | $ | 0.79 | | | 3,000,000 | | | | 0.57 | | | $ | 0.57 | |
| | | | | | | | | | |
|
| | | | | | | | | |
|
| |
| Options forfeited | | | (2,261,800 | ) | | | 0.58 | | | | | | | (5,126,800 | ) | | | 0.58 | | | | | |
| Options expired | | | - | | | | - | | | | | | | - | | | | - | | | | | |
| Options exercised | | | (338,000 | ) | | | 0.56 | | | | | | | (6,698,720 | ) | | | 0.49 | | | | | |
| | |
|
| | | | | | | | | | |
| | | | | | | | | |
| |
| Ending outstanding balance | | | 61,752,100 | | | | 0.67 | | | | | | | 52,926,580 | | | | 0.60 | | | | | |
| | |
|
| | | | | | | | | | |
| | | | | | | | | |
Options outstanding on December 31, 2005, the related weighted average exercise price and remaining contractual life information are as follows:
F-24
| | | Outstanding
Shares | | Exercisable
Shares | | Weighted
Average
Remaining
Life (Years) |
| Options with exercise price | | | | | | |
| $0.49 | | 21,360,900 | | 10,399,800 | | 7.0 |
| $0.64 | | 5,162,680 | | 2,009,800 | | 7.6 |
| $0.69 | | 23,553,000 | | - | | 8.5 |
| $0.57 | | 2,850,000 | | - | | 9.4 |
| |
| |
| | |
| |
| | | 52,926,580 | | 12,409,600 | | |
| | |
| |
| | |
The fair value of the common stock options issued was determined using a Black-Scholes option pricing model with the following assumptions:
| | | 2004 | | 2005 |
| |
| Risk-free interest rate | | 2.50% | | 1.80% |
| Expected life | | 5 years | | 5 years |
| Expected volatility | | 59% | | 47% |
| Expected dividend | | 3% | | 3% |
For purposes of pro forma disclosure, the estimated fair values of the options are amortized to expense ratably over the option vesting periods. Had the Company recorded compensation costs based on the estimated grant date fair value, the Company’s net income (loss) would have been reduced to the pro forma amounts below (EPS in U.S. dollars).
| | | | | | 2004 | | | | 2005 | |
| |
| Net income (loss) based on ROC GAAP | | $ | 25,139 | | | $ | (35,484 | ) |
| Stock-based compensation expense (net of related tax effect) | | | | | | | | |
| From the Company | | | (97 | ) | | | (209 | ) |
| From ASE Inc. | | | | | (2,407 | ) | | | (9,084 | ) |
| | | |
|
| | |
|
| |
| Pro forma net income (loss) | | $ | 22,635 | | | $ | (44,777 | ) |
| | | |
|
| | |
|
| |
| Basic EPS | | As reported | | $ | 0.25 | | | $ | (0.35 | ) |
| | | |
|
| | |
|
| |
| | | Pro forma | | $ | 0.23 | | | $ | (0.45 | ) |
| | | |
|
| | |
|
| |
| |
| Diluted EPS | | As reported | | $ | 0.25 | | | $ | (0.35 | ) |
| | | |
|
| | |
|
| |
| | | Pro forma | | $ | 0.23 | | | $ | (0.45 | ) |
| | | |
|
| | |
|
| |
ASE Test, Inc. has a defined benefit plan for its regular employees. Retirement benefits are based on the length of service and average salaries or wages of the last six months before retirement. ASE Test, Inc. makes monthly contributions, at 2% of salaries and wages, to plan assets which are in the name of, and are administered by, the employee pension plan committee and are deposited in the Central Trust of China (the “CTC”), an ROC government agency.
As of December 31, 2005, allocations by investment type of the plan assets deposited in the CTC are as follows:
F-25
| Type of Investment | | Allocation (%) |
| |
| Cash | | 49 |
| Government Loan | | 6 |
| Equity | | 20 |
| Notes | | 14 |
| Bond | | 11 |
| | |
|
| | | 100 |
| | |
|
| Pension costs for ASE Test, Inc. consist of: | | | | | | | | | | | | |
| |
| | | | 2003 | | | | 2004 | | | | 2005 | |
| |
| Service costs | | $ | 1,709 | | | $ | 1,906 | | | $ | 1,705 | |
| Interest | | | 219 | | | | 349 | | | | 373 | |
| Projected return on pension assets | | | (76 | ) | | | (78 | ) | | | (117 | ) |
| Amortization of prior period service cost, gain or loss on plan | | | | | | | | | | | | |
| assets, etc. | | | 88 | | | | 172 | | | | 69 | |
| |
|
| | |
|
| | |
|
| |
| |
| | | $ | 1,940 | | | $ | 2,349 | | | $ | 2,030 | |
| |
|
| | |
|
| | |
|
| |
Other pension information based on actuarial calculations of the plan during the periods indicated is as follows:
| | | | | 2003 | | | | 2004 | | | | 2005 | |
| a. | Benefit obligations | | | | | | | | | | | | |
| |
| | Vested benefit obligation | | $ | 941 | | | $ | 38 | | | $ | 16 | |
| | Non-vested benefit obligation | | | 5,437 | | | | 6,978 | | | | 6,424 | |
| | |
|
| | |
|
| | |
|
| |
| | Accumulated benefit obligation | | | 6,378 | | | | 7,016 | | | | 6,440 | |
| | Additional benefits based on future salaries | | | 4,477 | | | | 5,644 | | | | 4,638 | |
| | |
|
| | |
|
| | |
|
| |
| | Projected benefit obligation | | | 10,855 | | | | 12,660 | | | | 11,078 | |
| | Fair value of assets | | | (2,386 | ) | | | (3,154 | ) | | | (3,668 | ) |
| | |
|
| | |
|
| | |
|
| |
| | Funded status | | | 8,469 | | | | 9,506 | | | | 7,410 | |
| | Unrecognized net transition obligation | | | (164 | ) | | | (163 | ) | | | (148 | ) |
| | Unrecognized actuarial loss | | | (5,054 | ) | | | (4,172 | ) | | | (814 | ) |
| | Additional accrued pension cost | | | 741 | | | | - | | | | - | |
| | Accrued expense | | | - | | | | (52 | ) | | | (36 | ) |
| | |
|
| | |
|
| | |
|
| |
| |
| | Accrued pension cost | | $ | 3,992 | | | $ | 5,119 | | | $ | 6,412 | |
| | |
|
| | |
|
| | |
|
| |
| |
| | The additional accrued pension cost of $741 thousand was treated as other asset and unrecognizedpension costs amounted to $163 thousand and $578 thousand, respectively. |
| | | |
| |
| | | | | 2003 | | | | 2004 | | | | 2005 | |
| |
| b. | Vested obligation | | $ | 990 | | | $ | 42 | | | $ | 17 | |
| | |
|
| | |
|
| | |
|
| |
| |
| c. | Actuarial assumption | | | | | | | | | | | | |
| |
| | Discount rate | | | 3.25% | | | | 3.25% | | | | 2.75% | |
| | Increase in future salary level | | | 3.00% | | | | 3.00% | | | | 2.5-3.0% | |
| | Expected rate of return on plan assets | | | 3.25% | | | | 3.25% | | | | 2.75% | |
F-26
| d. | ASE Test, Inc. expects to make contributions of $538 thousand to its defined pension plan in 2006. |
| |
| e. | Expected benefit payments: |
| Year of Payments | | | |
| |
| 2006 | | $ | 5 |
| 2007 | | | 36 |
| 2008 | | | 42 |
| 2009 | | | 76 |
| 2010 | | | 55 |
| 2011 to 2015 | | | 938 |
Plan assets and obligations reflected herein were measured as of December 31, 2005.
ISE Labs, Inc. has a defined contribution plan (“401k plan”) for eligible employees. This plan permits employees to make contributions up to the maximum limits allowable under the U.S. Internal Revenue Code Section 401k. ASE Test Malaysia also has a defined contribution plan. The Company has no other post-retirement or post-employment benefit plans.
The Labor Pension Act (“the Act”), which took effect in ROC on July 1, 2005, provides for a pension mechanism that is deemed a defined contribution plan. The employees who were subject to the Labor Standards Law of ROC before the enforcement of this Act may choose to be subject to the pension mechanism under this Act or may continue to be subject to the pension mechanism under the Labor Standards Law. For those employees who were subject to the Labor Standards Law before July 1, 2005, work for the same company after July 1, 2005 and choose to be subject to the pension mechanism under the Act, their service years as of July 1, 2005 will be retained. Under the Act, the rate of an employer’s monthly contribution to the employee’s personal pension accounts should not be less than 6% of each employee’s monthly salary or wage. Thus, since July 1, 2005, ASE Test, Inc. has made monthly contributions based on each employee’s wage to personal pension accounts, and recognized pension costs of $885 thousand for the second half of 2005.
15. | EMPLOYEES BENEFITS, DEPRECIATION AND AMORTIZATION |
| | |
| | | 2003 | | 2004 | | 2005 |
| | |
| |
| |
|
| | | | Cost of
Revenues | | | | Operating
Expenses | | | | Total | | | | Cost of
Revenues | | | | Operating
Expenses | | | | Total | | | | Cost of
Revenues | | | | Operating
Expenses | | | | Total | |
| |
| Employees benefits | | | | | | | | | | | | | | | | | | | | | | | | | | | | | | | | | | | | |
| Salary | | $ | 45,268 | | | $ | 16,326 | | | $ | 61,594 | | | $ | 63,555 | | | $ | 19,393 | | | $ | 82,948 | | | $ | 51,573 | | | $ | 20,350 | | | $ | 71,923 | |
| Insurance | | | 2,092 | | | | 975 | | | | 3,067 | | | | 4,281 | | | | 1,575 | | | | 5,856 | | | | 3,561 | | | | 1,360 | | | | 4,921 | |
| Pension costs | | | 2,839 | | | | 971 | | | | 3,810 | | | | 4,019 | | | | 1,397 | | | | 5,416 | | | | 3,666 | | | | 1,225 | | | | 4,891 | |
| Other | | | 5,040 | | | | 2,335 | | | | 7,375 | | | | 5,829 | | | | 1,668 | | | | 7,497 | | | | 7,619 | | | | 2,459 | | | | 10,078 | |
| |
|
| | |
|
| | |
|
| | |
|
| | |
|
| | |
|
| | |
|
| | |
|
| | |
|
| |
| |
| | | $ | 55,239 | | | $ | 20,607 | | | $ | 75,846 | | | $ | 77,684 | | | $ | 24,033 | | | $ | 101,717 | | | $ | 66,419 | | | $ | 25,394 | | | $ | 91,813 | |
| |
|
| | |
|
| | |
|
| | |
|
| | |
|
| | |
|
| | |
|
| | |
|
| | |
|
| |
| |
| Depreciation | | $ | 124,461 | | | $ | 2,983 | | | $ | 127,444 | | | $ | 141,839 | | | $ | 2,441 | | | $ | 144,280 | | | $ | 138,084 | | | $ | 2,691 | | | $ | 140,775 | |
| |
| Amortization | | | 3,924 | | | | 11,009 | | | | 14,933 | | | | 9,339 | | | | 11,289 | | | | 20,628 | | | | 6,875 | | | | 6,652 | | | | 13,527 | |
16. | INTEREST INCOME AND EXPENSES |
| | |
| | | | 2003 | | | | 2004 | | | | 2005 | |
| |
| Interest expense | | $ | 13,546 | | | $ | 6,951 | | | $ | 12,888 | |
| Interest income | | | (923 | ) | | | (635 | ) | | | (1,722 | ) |
| Interest expense - net, from discontinued operations | | | (9 | ) | | | (129 | ) | | | (20 | ) |
| |
|
| | |
|
| | |
|
| |
| |
| | | $ | 12,614 | | | $ | 6,187 | | | $ | 11,146 | |
| |
|
| | |
|
| | |
|
| |
F-27
| 17. | INCOME TAX |
| |
| a. Income tax expense (benefit) attributable to continuing operations is summarized as followed: |
| | | | 2003 | | | | 2004 | | | | 2005 | |
| |
| Tax expense (benefit) based on pre-tax accounting income | | | | | | | | | | | | |
| (loss) at statutory rate | | $ | 1,139 | | | $ | 10,478 | | | $ | (4,169 | ) |
| Add (deduct) tax effects of: | | | | | | | | | | | | |
| Permanent differences | | | | | | | | | | | | |
| Tax-exempt income - tax holiday | | | (4,581 | ) | | | (6,146 | ) | | | - | |
| Other | | | (545 | ) | | | (937 | ) | | | 181 | |
| Temporary differences | | | | | | | | | | | | |
| Depreciation and capital allowance | | | (294 | ) | | | (1,501 | ) | | | 1,035 | |
| Depreciation | | | (1,309 | ) | | | (945 | ) | | | (597 | ) |
| Other | | | 1,053 | | | | 689 | | | | 1,097 | |
| |
|
| | |
|
| | |
|
| |
| | | | (4,537 | ) | | | 1,638 | | | | (2,453 | ) |
| Loss carry forward | | | 1,699 | | | | - | | | | 7,101 | |
| Income taxes on undistributed earnings | | | 756 | | | | 2,244 | | | | 2,369 | |
| Credits for investments, investment in machinery and | | | | | | | | | | | | |
| equipment, and research and development | | | (2,720 | ) | | | (4,494 | ) | | | (5,637 | ) |
| Net change in deferred income tax for the period | | | (1,207 | ) | | | (20,597 | ) | | | 3,947 | |
| Adjustment of prior years’ income tax | | | - | | | | - | | | | (2,790 | ) |
| |
|
| | |
|
| | |
|
| |
| Income tax expense (benefit) | | $ | (6,009 | ) | | $ | (21,209 | ) | | $ | 2,537 | |
| |
|
| | |
|
| | |
|
| |
The above-mentioned taxes on pre-tax accounting income (loss) based on the applicable statutory rates for both domestic and foreign entities are shown below:
| | | | 2003 | | | | 2004 | | | | 2005 | |
| | | | | | | | | | | | | |
| Domestic entity | | $ | - | | | $ | 509 | | | $ | 1,079 | |
| Foreign entities | | | | | | | | | | | | |
| ASE Test, Inc. (25% statutory rate) | | | 7,505 | | | | 8,708 | | | | (4,314 | ) |
| ASE Test Malaysia (28% statutory rate) | | | (337 | ) | | | 1,765 | | | | 745 | |
| ISE Labs (federal tax rate 35% and state tax rate 6%) | | | (6,029 | ) | | | (504 | ) | | | (1,679 | ) |
| |
|
| | |
|
| | |
|
| |
| |
| | | $ | 1,139 | | | $ | 10,478 | | | $ | (4,169 | ) |
| |
|
| | |
|
| | |
|
| |
A portion of ASE Test, Inc.’s income from the testing of semiconductors is exempt from income tax for five years ending December 2005. ASE Singapore Pte Ltd, a subsidiary of ISE Labs, has been granted pioneer status under the provisions of the Economic Expansion Incentives (Relief from Income Tax) Act for its operations in Singapore for a qualifying period of 10 years commencing September 1, 1998. During the qualifying period, all income arising from pioneer status activities is wholly exempt from income tax. In addition, ASE Test Malaysia also has been granted pioneer status by Ministry of International Trade and Industry in Malaysia for five years from July 1, 1999 to June 30, 2004. During the year 2003, the Company applied to the relevant authorities to surrender its pioneer status in accordance with the 2003 budget proposal, which allows a pioneer company that intends to undertake reinvestment before the expiry of its pioneer status the option to surrender its pioneer certificate to qualify for reinvestment allowance. On September 11, 2004, the Malaysian Industrial Development Authority approved the Company’s surrender of pioneer status with effect from September 21, 2002, the date of announcement of the 2003 budget proposal. The per share effect (basic earnings per share) of tax holiday is $0.05 in 2003, $0.06 in 2004.
F-28
| b. | Deferred income tax assets and liabilities are summarized as follows: |
| | | | 2004 | | | | 2005 | |
| |
| Current deferred income tax assets | | | | | | | | |
| Unused tax credits | | $ | 4,487 | | | $ | 9,267 | |
| Loss carry forward | | | 254 | | | | 4,067 | |
| Accrued liabilities and reserve | | | 381 | | | | 918 | |
| Other | | | - | | | | 962 | |
| |
|
| | |
|
| |
| | | | 5,122 | | | | 15,214 | |
| Less - valuation allowance | | | (541 | ) | | | (6,281 | ) |
| |
|
| | |
|
| |
| |
| | | $ | 4,581 | | | $ | 8,933 | |
| |
|
| | |
|
| |
| |
| Non-current deferred income tax assets (liabilities) | | | | | | | | |
| Unused tax credits | | $ | 39,755 | | | $ | 29,528 | |
| Tax effect of unabsorbed capital allowance | | | 4,945 | | | | 10,263 | |
| Loss carry forward | | | 7,724 | | | | 9,294 | |
| Timing difference between tax capital allowance and depreciation of | | | | | | | | |
| property, plant and equipment | | | (3,772 | ) | | | (7,616 | ) |
| Accrued liabilities and reserve | | | 881 | | | | 2,235 | |
| Other | | | 436 | | | | 2,563 | |
| |
|
| | |
|
| |
| | | | 49,969 | | | | 46,267 | |
| Less - valuation allowance | | | (8,646 | ) | | | (15,303 | ) |
| |
|
| | |
|
| |
| |
| | | $ | 41,323 | | | $ | 30,964 | |
| |
|
| | |
|
| |
| |
| Non-current deferred income tax liabilities | | $ | (1,016 | ) | | $ | - | |
| |
|
| | |
|
| |
| | In assessing the realization of deferred income tax assets, the Company considers its future taxable earnings and expected timing for the reversal of temporary differences. In addition, in the event future taxable earnings do not materialize, the Company will consider executing certain tax planning strategies available to realize the deferred income tax assets. The valuation allowance is provided to reduce the gross deferred income tax assets to an amount which the Company believes will more likely than not be realized. Deferred income tax assets and liabilities are classified in the consolidated balance sheets based on the classification of the related assets or liabilities or the expected timing of the reversal of temporary differences. |
| |
| c. | As of December 31, 2005, unused tax credits of ASE Test, Inc. which can be utilized to offset its future income tax, are set forth below: |
| |
| | Year of Expiry |
| |
| | 2006 | | $ | 9,267 |
| | 2007 | | | 13,884 |
| | 2008 | | | 12,592 |
| | 2009 | | | 3,052 |
| | |
|
|
| |
| | | | $ | 38,795 |
| | |
|
|
In the ROC, the tax credits may be utilized to reduce up to 50% of income tax payable each year. In the expiring year, any remaining unused tax credits can be used entirely. Effective on January 1, 2006, ASE Test, Inc. has to pay a minimum of 10% tax on its taxable income including taxable income earned during tax holiday periods according to the new tax regulation of ROC.
F-29
The U.S. Federal and California State net operating loss carry forwards of ISE Labs as of December 31, 2005 approximated $23.3 million and $33.4 million with expiration period in 2025 and 2015, respectively.
Income tax returns of ASE Test, Inc. have been examined by the ROC tax authorities through 2002.
| 18. | RELATED PARTY TRANSACTIONS | | |
| | | | | |
| | a. | Related parties | | |
| | | | | |
| | | Related Parties | | Relationship |
| | |
| |
|
| | | ASE Inc. | | Parent company |
| | | ASE Korea, Inc. | | Affiliate |
| | | ASE Holding Electronics (Philippine) Inc. (“ASE Philippine”) | | Affiliate |
| | | Hung Ching Development & Construction Co., (“HCDC”) | | Affiliate |
| | | ASE (Shanghai) Inc. | | Affiliate |
| | | ASE (U.S.) Inc. | | Affiliate (starting August, 2004) |
| | | ASE Japan Ltd. Co., (“ASE Japan”) | | Affiliate (starting May, 2004) |
| | | ASE Material Inc. | | Affiliate (merged into ASE Inc. in |
| | | | August, 2004) |
| | | ASE (Chung Li) Inc. | | Affiliate (merged into ASE Inc. in |
| | | | August, 2004) |
| | b. | Significant related party transactions: | | | | | | | | | | | | | |
| | | | | | | | | | | | | | | | | |
| | | 1) | Revenue | | | | | | | | | | | | | |
| | | | | | | 2003 | | | | 2004 | | | | 2005 | | |
| | | | | | | | | | | | | | | | | |
| | | | ASE Inc. | | $ | 13,565 | | | $ | 16,760 | | | $ | 44,552 | | |
| | | | Other | | | 1,465 | | | | 446 | | | | - | | |
| | | | |
|
| | |
|
| | |
|
| | |
| | | | | $ | 15,030 | | | $ | 17,206 | | | $ | 44,552 | | |
| | | | |
|
| | |
|
| | |
|
| | |
| | | The revenue from related parties is generated from jointly marketed turnkey services. | | | | | | | | | | | | | |
| | | | | | 2003 | | | | 2004 | | | | 2005 | | |
| | 2) | Purchase of machinery and equipment: | | | | | | | | | | | | | |
| | | | | | | | | | | | | | | | |
| | | ASE Inc. | | $ | - | | | $ | - | | | $ | 1,124 | | |
| | | ASE (Chung Li) Inc. | | | 4,659 | | | | 1,235 | | | | - | | |
| | | ASE Korea, Inc. | | | 1,673 | | | | 146 | | | | 990 | | |
| | | ASE Philippine | | | 1,619 | | | | - | | | | - | | |
| | | Other | | | 36 | | | | 4 | | | | - | | |
| | | | |
|
| | |
|
| | |
|
| | |
| | | | | | | | | | | | | | | | | |
| | | | | $ | 7,987 | | | $ | 1,385 | | | $ | 2,114 | | |
| | | | |
|
| | |
|
| | |
|
| | |
| | 3) | Purchase of buildings - HCDC | | $ | - | | | $ | 2,995 | | | $ | 7,293 | | |
| | | | |
|
| | |
|
| | |
|
| | |
| | | | | | | | | | | | | | | | |
| | | (Continued) | | |
F-30
| | | | | | 2003 | | | | 2004 | | | | 2005 | | |
| | | 4) | Purchase of raw materials: | | | | | | | | | | | | | |
| | | | | | | | | | | | | | | | |
| | | ASE Material Inc. | | $ | 8,793 | | | $ | 3,353 | | | $ | - | | |
| | | ASE Inc. | | | 1,217 | | | | 2,650 | | | | 5,577 | | |
| | | Other | | | 9 | | | | - | | | | 4 | | |
| | | | |
|
| | |
|
| | |
|
| | |
| | | | | $ | 10,019 | | | $ | 6,003 | | | $ | 5,581 | | |
| | | | |
|
| | |
|
| | |
|
| | |
| | | 5) | Sale of property, plant and equipment: | | | | | | | | | | | | | |
| | | | | | | | | | | | | | | | |
| | | ASE Korea, Inc. | | $ | 105 | | | $ | 2,943 | | | $ | 14,119 | | |
| | | ASE Inc. | | | - | | | | 9,790 | | | | 1,598 | | |
| | | ASE Japan | | | - | | | | - | | | | 1,540 | | |
| | | ASE (Chung Li) Inc. | | | 5,953 | | | | 1,046 | | | | - | | |
| | | Other | | | 345 | | | | - | | | | 55 | | |
| | | | |
|
| | |
|
| | |
|
| | |
| | | | | $ | 6,403 | | | $ | 13,779 | | | $ | 17,312 | | |
| | | | |
|
| | |
|
| | |
|
| | |
| | | | | | | | | | | | | | | | |
| | 6) | Service fee: | | | | | | | | | | | | | |
| | | | | | | | | | | | | | | | |
| | | The Company engages ASE (U.S.) Inc. as a sales agent and the service fees paid were based on monthly incurred service-related costs and expenses (limited amounts prescribed for costs and expenses). Total service fees paid were $3,253 thousand for the period from August to December of 2004 and $7,674 thousand in 2005. | |
| c. | Balances at year end | | | 2004 | | | | 2005 | | |
| | | | | | | | | | | | | |
| | | Receivable: | | | | | | | | | |
| | | | ASE Inc. | | $ | 9,132 | | | $ | 16,394 | | |
| | | | ASE Korea, Inc. | | | 2,527 | | | | 3,416 | | |
| | | | Other | | | 872 | | | | 467 | | |
| | | | |
|
| | |
|
| | |
| | | | | $ | 12,531 | | | $ | 20,277 | | |
| | | | |
|
| | |
|
| | |
| | | Payable: | | | | | | | | | |
| | | | ASE Inc. | | $ | 8,618 | | | $ | 9,082 | | |
| | | | Other | | | 666 | | | | 1,265 | | |
| | | | |
|
| | |
|
| | |
| | | | | $ | 9,284 | | | $ | 10,347 | | |
| | | | |
|
| | |
|
| | |
| | | | | | | | | | | | |
| | These transactions were conducted at prices and terms comparable to those applied in transactions with unrelated companies, except for the purchases and sales of machinery and equipment which were recorded at net book values and the purchase of building from HCDC which was based on appraisal from an independent third party. | | |
F-31
| 19. | ASSETS PLEDGED | | |
| | | |
| The assets of ASE Test, Inc. and ISE Labs pledged as first priority collateral for bank loans and as guarantees for hiring of foreign labor and for leasing of office buildings are summarized as follows: | | |
| | | | | | | | | | | |
| | | | | 2004 | | | | 2005 | | |
| | | | | | | | | | | | |
| | | Machinery and equipment, net | | $ | 35,630 | | | $ | 28,021 | | |
| | | Land and buildings and improvements, net | | | 2,676 | | | | - | | |
| | | Time deposits | | | 3,576 | | | | 3,908 | | |
| | | |
|
| | |
|
| | |
| | | | $ | 41,882 | | | $ | 31,929 | | |
| | | |
|
| | |
|
| | |
| | | | | | | | | | | |
| Included within other long-term assets are $2,006 thousand of time deposits which have been pledged as collateral and were recorded as other assets at December 31, 2005. | | |
| | | |
| 20. | COMMITMENTS AND CONTINGENCIES | | | | | | | | | |
| | | |
| | a. | Lease commitments |
| |
| | | 1) | Operating leases |
| |
| | | | ASE Test, Inc. leases the land on which its buildings are situated under various operating lease agreements with the government expiring on various dates through December 2015. The lease agreements grant ASE Test, Inc. the option to renew the leases and reserve the right for the lessor to adjust the lease charges upon an increase in the assessed value of the land and to terminate the leases under certain conditions. Moreover, ASE Test, Inc. and ASE Test Malaysia lease machinery and equipment under non-cancellable operating leases and ISE Labs also leases office building and equipment under non-cancellable operating lease agreements. The rental expenses for the years ended December 31, 2003, 2004 and 2005 were $10,427 thousand, $40,841 thousand and $46,816 thousand, respectively. The future minimum lease payments under the above-mentioned operating leases are as follows: |
| |
| | 2006 | | $ | 39,000 | |
| | 2007 | | | 15,853 | |
| | 2008 | | | 5,079 | |
| | 2009 | | | 4,032 | |
| | 2010 and thereafter | | | 3,261 | |
| | |
|
| |
| | Total minimum lease payments | | $ | 67,225 | |
| | |
|
| |
| | | 2) | Capital leases |
| |
| | | | In addition, ASE Test, Inc. and ISE Labs also lease machinery and equipment under non-cancellable capital lease agreements. As of December 31, 2005, the net book value of the machinery and equipment acquired under the capital obligations amounted to $8,390 thousand. The future minimum lease payments under capital leases as of December 31, 2005 are as follows: |
F-32
| | 2006 | | $ | 4,056 | | |
| | 2007 | | | 2,636 | | |
| | 2008 | | | 798 | | |
| | 2009 | | | 8 | | |
| | 2010 | | | - | | |
| | |
|
|
| |
| | Total minimum lease payments | | | 7,498 | | |
| | Less: Imputed interest | | | (546 | ) | |
| | |
|
|
| |
| | Present value of future lease obligations | | | 6,952 | | |
| | Capital lease obligation, current | | | (3,654 | ) | |
| | |
|
|
| |
| | Capital lease obligation, long-term | | $ | 3,298 | | |
| | |
|
|
| |
| | b. | The Company and its subsidiaries had unused letters of credit of $10,895 thousand as of December 31, 2005. |
| |
| | c. | The Company and its subsidiaries had commitments to certain vendors to purchase property, plant and equipment of $8,809 thousand, and had paid $130 thousand as of December 31, 2005. |
| |
| | d. | At December 31, 2005, the Company and its subsidiaries did not have any significant unasserted claims or pending litigations. |
| | | |
| 21. | LOSS ON FIRE DAMAGE |
| | | |
| | Significant Unusual Loss |
ASE Test, Inc. incurred fire damage to its production line in Chung Li, Taiwan on May 1, 2005 and recognized an estimated loss of $52,014 thousand for the damage to its machinery and equipment (including $34,808 thousand for fixed assets, $1,032 thousand for other assets, $15,093 thousand for equipment under operating leases, $984 thousand for idle labor loss, and $97 for related expenses). As of February 6, 2006, with the assistance of external counsel, the Company had submitted insurance claims to its insurers for compensation for damages which the Company believes to be clearly identifiable and reasonably estimated.The insurance recoveries of the aforementioned damages amounted to $790 thousand, which was recorded as other current assets, and of this amount, $369 thousand had been received as of December 31, 2005. Based on the Company’s understanding of the process for resolving insurance claims for similar incidents where the damage incurred was not readily quantifiable, it is anticipated that it will be a lengthy process for the Company to complete the insurance claim process due to the large number of damaged assets, the damage assessment process and the need to prepare the required supporting documentation. Any recovery for the remaining amount of $51,224 thousand is contingent on the result of the lengthy professional evaluation and assessment of damage level, possibility of repair, and the related expenses, therefore, the entire amount was recognized as a loss on fire damage for the year 2005. The Company will recognize any subsequent recoveries in future years when additional insurance claims are accepted by the insurers.
F-33
| 22. | DERIVATIVE FINANCIAL INSTRUMENTS |
| | | |
| | Information on derivative transactions is as follows: |
| | | |
| | a. | Foreign currency options contracts |
| | | |
| | | ASE Test, Inc. expects to receive U.S. dollars from testing service and to pay NT dollars for short-term borrowings and payable for fixed assets; therefore ASE Test, Inc. has occasionally entered into foreign currency option contracts to manage exposures to exchange rate fluctuations. As of December 31, 2005, there were no such contracts outstanding. As of December 31, 2004, the outstanding European contracts were as below: |
| | | Contract | | Amount
(in Millions) | | Strike Price | | Maturity Date |
| | | | | | | | | |
| | | Sell US$ Call/NT$ Put | | $2 | | Note 1 | | January 12, 2005 |
| | | Sell US$ Call/NT$ Put | | 2 | | Note 2 | | January 12, 2005 |
| | | Buy US$ Put/NT$ Call | | 1 | | Note 3 | | January 12, 2005 |
| | | Buy US$ Put/NT$ Call | | 1 | | Note 4 | | January 12, 2005 |
| | | Sell US$ Call/NT$ Put | | 2 | | Note 1 | | February 14, 2005 |
| | | Sell US$ Call/NT$ Put | | 2 | | Note 2 | | February 3, 2005 |
| | | Buy US$ Put/NT$ Call | | 1 | | Note 3 | | February 14, 2005 |
| | | Buy US$ Put/NT$ Call | | 1 | | Note 4 | | February 3, 2005 |
| | | Sell US$ Call/NT$ Put | | 2 | | Note 1 | | March 10, 2005 |
| | | Sell US$ Call/NT$ Put | | 2 | | Note 2 | | March 10, 2005 |
| | | Buy US$ Put/NT$ Call | | 1 | | Note 3 | | March 10, 2005 |
| | | Buy US$ Put/NT$ Call | | 1 | | Note 4 | | March 10, 2005 |
| | | Sell US$ Call/NT$ Put | | 2 | | Note 1 | | April 12, 2005 |
| | | Sell US$ Call/NT$ Put | | 2 | | Note 2 | | April 12, 2005 |
| | | Buy US$ Put/NT$ Call | | 1 | | Note 3 | | April 12, 2005 |
| | | Buy US$ Put/NT$ Call | | 1 | | Note 4 | | April 12, 2005 |
| | | Sell US$ Call/NT$ Put | | 2 | | Note 1 | | May 12, 2005 |
| | | Buy US$ Put/NT$ Call | | 1 | | Note 3 | | May 12, 2005 |
| | | Sell US$ Call/NT$ Put | | 2 | | Note 1 | | June 10, 2005 |
| | | Buy US$ Put/NT$ Call | | 1 | | Note 3 | | June 10, 2005 |
| | Note 1: | | If US$/NT$≥32.8, strike price=32.8. |
| | | | |
| | Note 2: | | If US$/NT$≥32.6, strike price=32.6. |
| | | | |
| | Note 3: | | If 31<US$/NT$<32.525, strike price=32.525. |
| | | If US$/NT$≤31, strike price is based on the spot rate (at maturity date) plus 500 bps. |
| | | | |
| | Note 4: | | If 31<US$/NT$<32.5, strike price=32.5. |
| | | If US$/NT$≤31, strike price is based on the spot rate (at maturity date) plus 1500 bps. |
| | | |
| | | The net gain arising from such outstanding contracts as a result of valuing the contract at fair value as of December 31, 2004 was approximately $161 thousand. The gain (loss) arising from such settled option contracts was immaterial in 2003, 2004 and 2005. |
| |
F-34
| | b. | Foreign currency forward contract |
| |
| | | ASE Test, Inc. and ASE Test Malaysia expect to receive U.S. dollars from export sales and pay Japanese yen or N.T. dollars to settle payables or long-term borrowings. Therefore, these companies occasionally enter into foreign currency forward contracts to manage exposure to foreign exchange risks. |
| |
| | | As of December 31, 2005, the outstanding forward contract for ASE Test Malaysia totalled $172 thousand (exchange rate per unit of U.S. dollar =¥116.42), which matures within two months from the balance sheet date, and the total forward contract receivable and payable was $176 thousand and $172 thousand, respectively. |
| |
| | | As of December 31, 2004, the outstanding forward contract for ASE Test Malaysia totalled $287 thousand (exchange rate per unit of U.S. dollar =¥104.65), which matures within one month from the balance sheet date, and the total forward contract receivable and payable was $296 thousand and $287 thousand, respectively. |
| |
| | | The gain or loss arising from such settled forward contracts for the year ended December 31, 2003, 2004 and 2005 was immaterial. |
| |
| | c. | Transaction risk |
| |
| | | 1) | Credit risk |
| |
| | | | ASE Test, Inc. and ASE Test Malaysia are exposed to credit risk in the event of non-performance of the counter parties on the option and forward contracts at maturity. In order to manage this risk, ASE Test, Inc. and ASE Test Malaysia transact only with financial institutions with good credit ratings. As a result, no material losses resulting from counter party defaults have been experienced to date. |
| |
| | | 2) | Market risk |
| |
| | | | The Company periodically purchases and sells products in currencies other than its functional currencies. This subjects the Company to the risks associated with fluctuations of foreign currency exchange rates. The Company reduces this risk by utilizing natural hedging (offsetting receivables and payables) as well as by creating offsetting positions through the use of derivative financial instruments, primarily foreign currency options contracts with maturities of less than six months. The market risk related to the foreign currency options contracts is typically offset by the changes in valuation of the underlying items being hedged. The amount of risk and the use of derivative financial instruments described above are not material to the Company’s financial position or results of operations. As of December 31, 2005, the Company had certain outstanding debt which was in variable rate as well as fixed rate instruments. Accordingly, the Company will be impacted by any change in short-term interest rates. The Company does not hedge either its investment in its foreign operations or its floating interest rate exposures. |
| |
| | | 3) | Liquidity risk and cash flow risk |
| |
| | | | ASE Test, Inc. and ASE Test Malaysia entered into European option contracts and forward contracts to manage its exposure to the effect of exchange rate fluctuations on net assets or net liabilities. ASE Test, Inc. and ASE Test Malaysia have sufficient operating capital to meet cash requirements upon the maturity of these contracts. |
| |
F-35
23. | NON-DERIVATIVE AND DERIVATIVE FINANCIAL INSTRUMENTS |
| | |
| | | | | | | | |
| | | 2004 | | | | 2005 | |
| |
|
|
|
|
|
| | |
|
|
|
|
|
| |
| | | Carrying
Value | | | | Fair
Value | | | | Carrying
Value | | | | Fair
Value | |
| Non-derivative financial instruments | | | | | | | | | | | | | | | | |
| Assets | | | | | | | | | | | | | | | | |
| Cash and cash equivalents (including pledged | | | | | | | | | | | | | | | | |
| time deposits) | | $ | 43,065 | | | $ | 43,065 | | | $ | 142,119 | | | $ | 142,119 | |
| Short-term investments | | | 20,000 | | | | 20,000 | | | | - | | | | - | |
| Notes and accounts receivable | | | 89,202 | | | | 89,202 | | | | 77,334 | | | | 77,334 | |
| Receivable form related parties | | | 12,531 | | | | 12,531 | | | | 20,277 | | | | 20,277 | |
| Long-term investments | | | 133,699 | | | | 173,070 | | | | 140,225 | | | | 208,622 | |
| | | | | | | | | | | | | | | | | |
| Liabilities | | | | | | | | | | | | | | | | |
| Short-term borrowings | | | 35,789 | | | | 35,789 | | | | - | | | | - | |
| Commercial paper | | | 28,474 | | | | 28,474 | | | | - | | | | - | |
| Notes and accounts payable | | | 16,053 | | | | 16,053 | | | | 10,603 | | | | 10,603 | |
| Payable to related parties | | | 9,284 | | | | 9,284 | | | | 10,347 | | | | 10,347 | |
| Payable for fixed assets | | | 33,478 | | | | 33,478 | | | | 10,737 | | | | 10,737 | |
| Accrued expenses | | | 28,442 | | | | 28,442 | | | | 40,141 | | | | 40,141 | |
| Long-term debts (included current portion) | | | 318,760 | | | | 318,760 | | | | 295,046 | | | | 295,046 | |
| | | | | | | | | | | | | | | | | |
| Derivative financial instruments | | | | | | | | | | | | | | | | |
| | | | | | | | | | | | | | | | | |
| Foreign currency options | | | 161 | | | | 161 | | | | - | | | | - | |
| Foreign currency forward contracts | | | 296 | | | | 296 | | | | 176 | | | | 176 | |
| Foreign currency forward contracts | | | (287 | ) | | | (287 | ) | | | (172 | ) | | | (172 | ) |
The carrying values of cash and cash equivalents, notes and accounts receivable, payable, short-term borrowings, commercial paper, payable for fixed assets and accrued expenses approximate fair values because of the short maturity of these instruments. The fair values of short-term and long-term investments are determined based on market values or net equity values. The fair values of long-term debts are determined based on the estimated present values of future cash flows using the interest rates of similar debt instruments which the Company is able to obtain as the discount rate. Fair value of long-term debts approximate their carrying values because of the variable nature of their interest rates are applied. The derivative financial instruments are recorded at their fair market values.
a. Geographical information, net revenues
| | | | 2003 | | 2004 | | 2005 | |
| | | |
|
|
|
|
| |
|
|
|
|
| |
|
|
|
|
| |
| Area | | | | Amount | | | % | | | Amount | | | % | | | Amount | | | % | |
| | | | | | | | | | | | | | | | | | | | | |
| North America | | | $ | 212,131 | | | 61 | | $ | 236,527 | | | 55 | | $ | 260,224 | | | 62 | |
| Asia | | | | 108,291 | | | 31 | | | 152,485 | | | 36 | | | 104,179 | | | 25 | |
| Europe | | | | 25,224 | | | 8 | | | 38,740 | | | 9 | | | 56,526 | | | 13 | |
| Australia | | | | 14 | | | - | | | 11 | | | - | | | - | | | - | |
| | |
|
| | |
| |
|
| | |
| |
|
| | |
| |
| | | $ | 345,660 | | | 100 | | $ | 427,763 | | | 100 | | $ | 420,929 | | | 100 | |
| | |
|
| | |
| |
|
| | |
| |
|
| | |
| |
F-36
| b. | Geographical information - long-lived assets | | | | | |
| | | 2004 | | 2005 | |
| | |
|
|
|
|
| |
|
|
|
|
| |
| | | | Amount | | | % | | | Amount | | | % | |
| | Asia | | | | | | | | | | | | | |
| | Taiwan | | $ | 440,283 | | | 69 | | $ | 306,060 | | | 71 | |
| | Malaysia | | | 122,869 | | | 19 | | | 76,194 | | | 18 | |
| | Other | | | 46,098 | | | 8 | | | 36,847 | | | 8 | |
| | United States | | | 25,546 | | | 4 | | | 10,978 | | | 3 | |
| | |
|
| | |
| |
|
| | |
| |
| | | $ | 634,796 | | | 100 | | $ | 430,079 | | | 100 | |
| | |
|
| | |
| |
|
| | |
| |
| c. | Major customers |
| |
| | For the years ended December 31, 2003, 2004 and 2005, the Company did not have a single customer to which the net revenues accounted for over 10% of total net revenues. |
| |
| d. | Operating segment information |
| |
| | Other than its investing segment, the Company has two major operating segments: Testing, and Packaging. The Company packages bare semiconductors into finished semiconductors with enhanced electrical and thermal characteristics and provides testing services, including front-end engineering testing, wafer probing and final testing services. The accounting policies of the segments are the same as those described in Note 2. Segment information for the years ended December 31, 2003, 2004 and 2005 is as follows: |
| |
| | | | Testing | | | | Packaging | | | | Other | | | | Total | |
| | 2003 | | | | | | | | | | | | | | | | |
| | | | | | | | | | | | | | | | | | |
| | Revenue from external customers | | $ | 257,490 | | | $ | 88,170 | | | $ | - | | | $ | 345,660 | |
| | Interest revenue | | | 122 | | | | 57 | | | | 739 | | | | 918 | |
| | Interest expense | | | (1,957 | ) | | | (135 | ) | | | (11,440 | ) | | | (13,532 | ) |
| | Net interest expense | | | (1,835 | ) | | | (78 | ) | | | (10,701 | ) | | | (12,614 | ) |
| | Depreciation and amortization | | | 122,610 | | | | 17,994 | | | | 47 | | | | 140,651 | |
| | Segment profit (loss) | | | 1,027 | | | | (5,693 | ) | | | (8,405 | ) | | | (13,071 | ) |
| | Segment assets | | | 704,645 | | | | 122,003 | | | | 151,399 | | | | 978,047 | |
| | Expenditures for segment assets | | | 149,435 | | | | 21,836 | | | | - | | | | 171,271 | |
| | Goodwill | | | 62,217 | | | | - | | | | - | | | | 62,217 | |
| | | | | | | | | | | | | | | | | | |
| | 2004 | | | | | | | | | | | | | | | | |
| | | | | | | | | | | | | | | | | | |
| | Revenue from external customers | | | 343,116 | | | | 84,647 | | | | - | | | | 427,763 | |
| | Interest revenue | | | 154 | | | | 83 | | | | 341 | | | | 578 | |
| | Interest expense | | | (1,069 | ) | | | (255 | ) | | | (5,441 | ) | | | (6,765 | ) |
| | Net interest expense | | | (915 | ) | | | (172 | ) | | | (5,100 | ) | | | (6,187 | ) |
| | Depreciation and amortization | | | 138,328 | | | | 18,601 | | | | - | | | | 156,929 | |
| | Impairment loss on assets | | | (26,500 | ) | | | - | | | | - | | | | (26,500 | ) |
| | Segment profit (loss) | | | (6,248 | ) | | | (10,456 | ) | | | 3,666 | | | | (13,038 | ) |
| | Segment assets | | | 782,089 | | | | 149,820 | | | | 151,200 | | | | 1,083,109 | |
| | Expenditures for segment assets | | | 174,382 | | | | 36,274 | | | | - | | | | 210,656 | |
| | Goodwill | | | 25,612 | | | | - | | | | - | | | | 25,612 | |
| | | | | | | | | | | | | | | | | | |
| | (Continued) | |
F-37
| | | | Testing | | | | Packaging | | | | Other | | | | Total | |
| | 2005 | | | | | | | | | | | | | | | | |
| | Revenue from external customers | | $ | 346,639 | | | $ | 74,290 | | | $ | - | | | $ | 420,929 | |
| | Interest revenue | | | 868 | | | | 574 | | | | 156 | | | | 1,598 | |
| | Interest expense | | | (3,418 | ) | | | (427 | ) | | | (8,899 | ) | | | (12,744 | ) |
| | Net interest revenue (expense) | | | (2,550 | ) | | | 147 | | | | (8,743 | ) | | | (11,146 | ) |
| | Depreciation and amortization | | | 134,383 | | | | 15,239 | | | | - | | | | 149,622 | |
| | Segment loss | | | (31,709 | ) | | | (9,372 | ) | | | (2,705 | ) | | | (43,786 | ) |
| | Segment assets | | | 669,190 | | | | 125,561 | | | | 145,588 | | | | 940,339 | |
| | Expenditures for segment assets | | | 48,844 | | | | 1,842 | | | | - | | | | 50,686 | |
| | Goodwill | | | 20,646 | | | | - | | | | - | | | | 20,646 | |
| | |
25. | DISCONTINUED OPERATION |
ASE Test Malaysia sold its camera module assembly operations in early October 2005 for $19,116 thousand, which covers the book value of the equipment and inventory, plus an acquisition premium. As a result, the Company reclassified the camera module assembly segment as discontinued operations.
Summarized below are operating results of the discontinued segment for the years ended December 31, 2003, 2004 and 2005.
| | | | 2003 | | | | 2004 | | | | From
January 1,
2005 to
October 3,
2005 | | |
| | | | | | | | | | | | | | | |
| | Net revenues | | $ | 46,270 | | | $ | 193,375 | | | $ | 66,493 | | |
| | Cost of revenues | | | 39,407 | | | | 173,389 | | | | 59,819 | | |
| | |
|
| | |
|
| | |
|
|
| |
| | Gross profit | | | 6,863 | | | | 19,986 | | | | 6,674 | | |
| | Operating expenses | | | 1,097 | | | | 2,229 | | | | 1,422 | | |
| | Non-operating expenses (income ) | | | (1 | ) | | | 768 | | | | 1,257 | | |
| | |
|
| | | |
| | |
|
|
| |
| | Income from discontinued operations before income tax | | | 5,767 | | | | 16,989 | | | | 3,995 | | |
| | Income tax expense | | | (17 | ) | | | (21 | ) | | | (66 | ) | |
| | |
|
| | | |
| | | |
|
| |
| | Income from discontinued operations | | | 5,750 | | | | 16,968 | | | | 3,929 | | |
| | |
|
| | |
|
| | |
|
|
| |
| | Gain on disposal of assets | | | - | | | | - | | | | 6,969 | | |
| | Income tax expense | | | - | | | | - | | | | (59 | ) | |
| | |
|
| | |
|
| | |
|
|
| |
| | Gain on disposal of discontinued operations | | | - | | | | - | | | | 6,910 | | |
| | |
|
| | |
|
| | |
|
|
| |
| | Total | | $ | 5,750 | | | | 16,968 | | | $ | 10,839 | | |
| | |
|
| | |
|
| | |
|
|
| |
| 26. | SUMMARY OF SIGNIFICANT DIFFERENCES BETWEEN ACCOUNTING PRINCIPLES FOLLOWED BY THE COMPANY AND ACCOUNTING PRINCIPLES GENERALLY ACCEPTED IN THE UNITED STATES OF AMERICA |
| | |
| | The Company’s consolidated financial statements have been prepared in accordance with ROC GAAP, which differ in the following respects from U.S. GAAP: |
F-38
| | a. | Pension benefits |
| |
| | | U.S. Statement of Financial Accounting Standards (U.S. SFAS) No. 87, “Employers’ Accounting for Pensions”, was effective no later than the beginning of the first period for which a U.S. GAAP reconciliation is required. A portion of the unrecognized net transition obligation at the adoption date is to be allocated directly to equity. ASE Test, Inc. adopted U.S. SFAS No. 87 on January 1, 1987. ROC SFAS No. 18, which is similar in many aspects to U.S. SFAS No. 87, became effective in 1996 and was adopted by the Company for ROC GAAP purposes in the same year. Therefore, pension expense is adjusted to reflect the impact of different adoption dates. |
| |
| | b. | Short-term investments |
| |
| | | Under ROC GAAP, marketable equity securities are carried at the lower of aggregate cost or market value, and debt securities are carried at cost, with only unrealized losses recognized. Under U.S. SFAS No. 115, “Accounting for Certain Investments in Debt and Equity Securities”, debt and equity securities that have readily determinable fair values are to be classified as either trading, available-for-sale or held-to-maturity securities. Debt securities that the Company has the positive intent and ability to hold to maturity are classified as held-to-maturity securities and reported at amortized cost. Debt and equity securities that are bought and traded for short-term profit are classified as trading securities and reported at fair value, with unrealized gains and losses included in earnings. Debt and equity securities not classified as either held-to-maturity or trading are classified as available-for-sale securities and reported at fair value, with unrealized gains and losses excluded from earnings and reported as a separate component of shareholders’ equity. |
| |
| | c. | Bonuses to employees, directors and supervisors |
| |
| | | According to ROC regulations and the Articles of Incorporation of ASE Inc. and ASE Test, Inc. a portion of the Company’s earnings is required to be set aside as bonuses to employees, directors and supervisors. Bonuses to directors and supervisors are always paid in cash. However, bonuses to employees may be granted in cash or stock or both. All of these appropriations, including stock bonuses which are valued at par value of NT$10, are charged against retained earnings under ROC GAAP after such appropriations are formally approved by the shareholders in the following year. Under U.S. GAAP, such bonuses are charged against income in the year earned. Shares issued as part of these bonuses are recorded at fair market value. Since the amount and form of such bonuses are not usually determinable until the shareholders’ meeting in the subsequent year, the total amount of the aforementioned bonuses is initially accrued based on management’s estimate regarding the amount to be paid in accordance with the Company’s Articles of Incorporation. Any difference between the initially accrued amount and the fair market value of any shares issued as bonuses is recognized in the year of approval by shareholders. |
| |
| | | ASE Inc. pays the bonuses on behalf of the Company and does not require reimbursement. Under U.S. GAAP, bonus payments made by ASE Inc. directly to ASE Test, Inc.’s employees have been recorded as compensation expense, allocated to cost of revenues, research and development costs and selling, general and administrative expenses, as appropriate, and credited to additional paid-in capital, consistent with the manner described above. |
| |
| | | The impact of bonuses under U.S. GAAP to the costs and expenses is as follows: |
| |
| | | | | 2003 | | | | 2004 | | | | 2005 | | |
| | | | | | | | | | | | | | | | |
| | | Cost of revenues | | $ | 1,719 | | | $ | 2,591 | | | $ | (1,546 | ) | |
| | | Selling, general and administrative expenses | | | 957 | | | | 1,080 | | | | (1,420 | ) | |
| | | Research and development | | | 218 | | | | 418 | | | | (236 | ) | |
| | | |
|
| | |
|
| | |
|
|
| |
| | | | $ | 2,894 | | | $ | 4,089 | | | $ | (3,202 | ) | |
| | | |
|
| | |
|
| | |
|
|
| |
F-39
| | ASE Inc. pays certain employee compensation amounts, by means of stock options, on behalf of the Company and does not require reimbursement. Under U.S. GAAP, such payments made by ASE Inc. directly to the employees of ASE Test and subsidiaries have been recorded as compensation expense, allocated to cost of revenues, research and development costs and selling, general and administrative expenses, as appropriate, and credited to additional paid-in capital, consistent with the manner described above. |
| | |
| d. | Depreciation of buildings |
| | |
| | Under ROC GAAP, buildings may be depreciated over their estimated life or up to 40 years based on ROC practices and tax regulations. For U.S. GAAP purposes, buildings are depreciated over their estimated economic useful life of 25 years. |
| | |
| e. | Excess of book value on transfer of buildings between related parties |
| | |
| | ASE Test, Inc. purchased buildings and facilities from its affiliate, ASE Technology, in 1997. The purchase price was based on market value, which represented the portion of the purchase price in excess of book value NT$17,667 thousand (US$642 thousand) was capitalized by ASE Test, Inc. as allowed under ROC GAAP. Under U.S. GAAP, transfers of assets between related parties are recorded at historical costs. |
| | |
| f. | Impairment of long-lived assets |
| | |
| | Under U.S. GAAP, in accordance with U.S. SFAS No. 144, “Accounting for the Impairment or Disposal of Long-Lived Assets”, long-lived assets held and used by the Company are reviewed for impairment whenever events or changes in circumstances indicate that the carrying amount of an asset may not be recoverable. For purposes of evaluating the recoverability of long-lived assets, the recoverability test is performed by comparing undiscounted net cash flows of the assets against the net book value of the assets. If the recoverability test indicates that impairment has occurred, the impairment loss is the amount of the asset’s net book value in excess of the related fair value. Prior to 2004, there were no requirements related to the evaluation of recoverability of long-lived assets’ impairment under ROC GAAP, and the Company selected the same accounting, U.S. SFAS No. 144, for impairment of long-lived assets for both ROC GAAP and U.S. GAAP reporting. |
| | |
| g. | Derivative financial instruments |
| | |
| | Before January 1, 2006, there were no specific accounting standards under ROC GAAP which address measurement for derivative instruments, except for foreign currency forward contracts. Under ROC GAAP, forward contracts are accounted for in a manner similar to that required under U.S. SFAS No. 52. Under U.S. GAAP, accounting for derivative instruments is covered under U.S. SFAS No. 133, as amended by U.S. SFAS No. 138, which require that all companies recognize derivative instruments as assets and liabilities in the statements of financial position at fair value. If certain conditions are met, entities may elect to designate a derivative instrument as a hedge. Under U.S. GAAP, the Company does not apply hedge accounting, and derivatives have historically been, and will continue to be, recorded on the consolidated balance sheets at fair value, with the changes in fair values recorded through current period earnings. |
| | |
| h. | Stock option compensation |
| | |
| | Under ROC GAAP, all stock-based compensation for awards granted or modified after January 1, 2004 should be accounted for in conformity with the related Interpretations of ARDF in the ROC. The compensation cost is measured based on the intrinsic value method and accordingly, compensation cost for stock options is measured as the excess, if any, of the quoted market price of the Company’s stock at the date of the grant over the amount an employee must pay to acquire the stock. The intrinsic value of the shares is recognized as expense over the requisite service or vesting period. For U.S. GAAP reporting, the Company has elected to follow Accounting Principles Board (“APB”) Opinion No. 25, |
| | |
F-40
| | “Accounting for Stock Issued to Employees”, which measures compensation expense based on the difference, if any, between the market price of the underlying common shares and the exercise price of the stock option on the date of grant. The Company is required under U.S. SFAS No. 123 “Accounting for Stock-based Compensation” to disclose the pro forma information regarding option grants to its employees computed as if the fair value method had been applied. |
| | |
| i. | Goodwill |
| | |
| | Before January 1, 2006, under ROC GAAP, the Company amortized goodwill arising from acquisitions over 10 years. Total amortization expenses of goodwill under ROC GAAP were $10,105 thousand, $10,105 thousand and $4,966 thousand in 2003, 2004 and 2005, respectively. Under U.S. GAAP, the Company adopted the provisions of U.S. SFAS No. 142 on January 1, 2002. U.S. SFAS No. 142 requires the Company to review for possible impairment of goodwill existing at the date of adoption and perform subsequent impairment tests on at least an annual basis. In addition, existing goodwill and intangible assets must be reassessed and classified consistently in accordance with the criteria set forth in U.S. SFAS No. 141 and U.S. SFAS No. 142. As a result, the Company ceased to amortize goodwill effective January 1, 2002. Definite lived intangible assets will continue to be amortized over their estimated useful lives. |
| | |
| | As described in Note 3, the Company adopted ROC SFAS No. 35 on December 31, 2004, and in accordance with this new standard, performed an impairment analysis and recorded an impairment charge of $26,500 thousand for the year ended December 31, 2004 based on a “recoverable amount” as determined by an estimate of the cash flows for the next six years. Under U.S. GAAP, the determination of whether or not the goodwill is impaired is made by first estimating the fair value of the reporting unit and comparing the fair value of the reporting unit with its carrying amount, including goodwill. If the carrying amount of a reporting unit exceeds its fair value, the Company calculates an implied fair value of the goodwill based on an allocation of the fair value of the reporting unit to the underlying assets and liabilities of the reporting unit. If the carrying amount of reporting unit goodwill exceeds the implied fair value of that goodwill, an impairment loss shall be recognized in an amount equal to that excess. For the year ended December 31, 2004, the Company recognized an impairment loss of $41,500 thousand for U.S. GAAP purposes. |
| | |
| j. | Undistributed earnings tax |
| | |
| | Undistributed earnings generated after 1997 are subject to a 10% tax in compliance with the Income Tax Law of the ROC. Under ROC GAAP, the 10% tax on undistributed earnings is recorded as an expense at the time the shareholders resolve that the Company’s earnings shall be retained. Under U.S. GAAP, the Company measures its income tax expense, including the tax effects of temporary differences, using the rate that includes the tax on undistributed earnings of its Taiwan subsidiaries. |
| | |
| k. | Long-term investment in parent company accounted for as treasury stock |
| | |
| | Under ROC GAAP, shareholdings in the parent company are recorded as a long-term investment. Under U.S. GAAP, according to ARB No. 51, there is a presumption that the parent company must approve the subsidiary's transactions. Accordingly, unless this presumption can be overcome, the investment in the parent company's stock should be presented within the equity section of a wholly owned subsidiary's separate financial statements and be accounted for in the same manner as treasury stock. Upon the company’s receipt of cash dividend distributed by the parent company, the cash dividend should be recorded as additional paid-in capital. |
| | |
| The following reconciles net income (loss) and shareholders’ equity under ROC GAAP as reported in the consolidated financial statements to the approximate net income (loss) and shareholders’ equity amounts as determined under U.S. GAAP, giving effect to adjustments for the differences listed above. |
F-41
| | | | 2003 | | | | 2004 | | | | 2005 | |
| Net income (loss) | | | | | | | | | | | | |
| Net income (loss) based on ROC GAAP | | $ | (3,515 | ) | | $ | 25,139 | | | $ | (35,484 | ) |
| | |
|
| | |
|
| | |
|
| |
| Adjustments: | | | | | | | | | | | | |
| a. | Pension benefits | | | 8 | | | | 7 | | | | 7 | |
| c. | Bonuses to employees, directors and supervisors: | | | | | | | | | | | | |
| Regular bonuses | | | (2,894 | ) | | | (4,089 | ) | | | 3,202 | |
| Stock option compensation from ASE Inc. | | | (6,070 | ) | | | 1,856 | | | | (7,423 | ) |
| Special stock bonuses | | | (1,040 | ) | | | - | | | | - | |
| d. | Depreciation of buildings | | | (446 | ) | | | (489 | ) | | | (582 | ) |
| e. | Excess of book value of buildings transferred between | | | | | | | | | | | | |
| related parties | | | 13 | | | | 13 | | | | 13 | |
| i. | Goodwill | | | | | | | | | | | | |
| Amortization | | | | | | | | | | | | |
| - Consolidated subsidiary | | | 10,105 | | | | 10,105 | | | | 4,966 | |
| - Equity-method investee | | | 348 | | | | 348 | | | | 348 | |
| Impairment | | | - | | | | (15,000 | ) | | | - | |
| k. | Cash dividend from investment in parent company | | | - | | | | - | | | | (493 | ) |
| | |
|
| | |
|
| | |
|
| |
| Net increase in net income (loss) | | | 24 | | | | (7,249 | ) | | | 38 | |
| | |
|
| | |
|
| | |
|
| |
| Net income (loss) based on U.S. GAAP | | $ | (3,491 | ) | | $ | 17,890 | | | $ | (35,446 | ) |
| | |
|
| | |
|
| | |
|
| |
| Earnings (loss) per share (in U.S. dollars) | | | | | | | | | | | | |
| Basic and diluted | | $ | (0.04 | ) | | $ | 0.18 | | | $ | (0.35 | ) |
| | |
|
| | |
|
| | |
|
| |
| Number of shares (Note 27d) | | | | | | | | | | | | |
| Basic | | | 99,110,225 | | | | 100,037,524 | | | | 100,059,031 | |
| | |
|
| | |
|
| | |
|
| |
| Diluted | | | 99,110,225 | | | | 100,111,113 | | | | 100,059,031 | |
| | |
|
| | |
|
| | |
|
| |
| Shareholders’ equity | | | | | | | | | | | | |
| Shareholders’ equity based on ROC GAAP | | $ | 545,987 | | | $ | 599,591 | | | $ | 558,205 | |
| | |
|
| | |
|
| | |
|
| |
| Adjustments: | | | | | | | | | | | | |
| a. | Pension benefits and additional liability | | | (119 | ) | | | (44 | ) | | | (37 | ) |
| c. | Bonuses to employees, directors and supervisors | | | (2,194 | ) | | | (4,758 | ) | | | - | |
| d. | Depreciation of buildings | | | (1,629 | ) | | | (2,118 | ) | | | (2,700 | ) |
| e. | Excess of book value of buildings transferred between | | | | | | | | | | | | |
| related parties | | | (531 | ) | | | (518 | ) | | | (505 | ) |
| i. | Goodwill | | | | | | | | | | | | |
| Amortization | | | | | | | | | | | | |
| - Consolidated subsidiary | | | 20,210 | | | | 30,315 | | | | 35,281 | |
| - Equity-method investee | | | 696 | | | | 1,044 | | | | 1,392 | |
| Impairment | | | - | | | | (15,000 | ) | | | (15,000 | ) |
| k. | Long-term investment in parent company accounted | | | | | | | | | | | | |
| for as treasury stock | | | - | | | | (81,362 | ) | | | (81,422 | ) |
| Cumulative translation adjustment on U.S. GAAP | | | | | | | | | | | | |
| Adjustments | | | 79 | | | | 60 | | | | 242 | |
| | |
|
| | |
|
| | |
|
| |
| Net increase (decrease) in shareholders’ equity | | | 16,512 | | | | (72,381 | ) | | | (62,749 | ) |
| | |
|
| | |
|
| | |
|
| |
| Shareholders’ equity based on U.S. GAAP | | $ | 562,499 | | | $ | 527,210 | | | $ | 495,456 | |
| | |
|
| | |
|
| | |
|
| |
| | | | | | | | | | | | (Continued | ) |
F-42
| | | 2003 | | | | 2004 | | | 2005 | |
| Changes in shareholders’ equity based on U.S. GAAP | | | | | | | | | | | |
| Balance, beginning of year | | $ | 547,697 | | | $ | 562,499 | | $ | 527,210 | |
| Net income (loss) for the year | | | (3,491 | ) | | | 17,890 | | | (35,446 | ) |
| Issuance of new shares under stock option plans | | | 4,290 | | | | 4,552 | | | - | |
| Unrecognized pension cost | | | (646 | ) | | | 646 | | | - | |
| ASE Inc. shares to be distributed as bonus to employees | | | 1,740 | | | | 1,525 | | | 1,556 | |
| Stock option compensation from ASE Inc. | | | 6,070 | | | | (1,856 | ) | | 7,423 | |
| Cumulative translation adjustment for subsidiaries | | | 8,226 | | | | 22,976 | | | (5,780 | ) |
| Adjustment from changes in ownership percentage of | | | | | | | | | | | |
| Investees | | | (1,598 | ) | | | - | | | - | |
| Unrealized holding gain on equity securities | | | 211 | | | | 400 | | | - | |
| Long-term investment in parent company accounted for as | | | | | | | | | | | |
| treasury stock | | | - | | | | (81,422 | ) | | - | |
| Cash dividend income from the parent company | | | - | | | | - | | | 493 | |
| |
|
| | | |
| | |
| |
| Balance, end of year | | $ | 562,499 | | | $ | 527,210 | | $ | 495,456 | |
| |
|
| | | |
| | |
| |
As a result of the adjustments, the amounts of total assets under U.S. GAAP were $1,015,599 thousand and $877,687 thousand as of December 31, 2004 and 2005, respectively. Total liabilities under U.S. GAAP were $488,389 thousand and $382,231 thousand as of December 31, 2004 and 2005, respectively. A reconciliation of significant balance sheet accounts to the amounts as determined under U.S. GAAP is as follows:
| | | 2004 | | | | 2005 | |
| Long-term investment | | | | | | | | |
| As reported | | $ | 133,699 | | | $ | 140,225 | |
| U.S. GAAP adjustments | | | | | | | | |
| Treasury stock | | | (81,362 | ) | | | (81,422 | ) |
| Goodwill amortization | | | 1,044 | | | | 1,392 | |
| Effect of change in exchange rate | | | - | | | | 171 | |
| |
|
| | |
|
| |
| As adjusted | | $ | 53,381 | | | $ | 60,366 | |
| |
|
| | |
|
| |
| Building and improvements | | | | | | | | |
| As reported | | $ | 79,512 | | | $ | 66,573 | |
| U.S. GAAP adjustments | | | | | | | | |
| Effect of adjustments on useful life | | | (2,118 | ) | | | (2,700 | ) |
| Excess of adjustments on building transferred between related parties | | | (518 | ) | | | (505 | ) |
| Effect of change in exchange rate | | | 129 | | | | 131 | |
| |
|
| | |
|
| |
| As adjusted | | $ | 77,005 | | | $ | 63,499 | |
| |
|
| | |
|
| |
| Goodwill | | | | | | | | |
| As reported | | $ | 25,612 | | | $ | 20,646 | |
| U.S. GAAP adjustments | | | | | | | | |
| Goodwill impairment | | | (15,000 | ) | | | (15,000 | ) |
| Goodwill amortization | | | 30,315 | | | | 35,281 | |
| |
|
| | |
|
| |
| As adjusted | | $ | 40,927 | | | $ | 40,927 | |
| |
|
| | |
|
| |
| | | | | | | (Continued | ) |
F-43
| | | 2004 | | | 2005 |
| Accrued expenses | | | | | | |
| As reported | | $ | 28,442 | | $ | 40,141 |
| U.S. GAAP adjustments | | | | | | |
| Bonus to employees, directors and supervisors | | | 4,758 | | | - |
| Effect of change in exchange rate | | | 18 | | | 9 |
| |
|
| |
|
|
| As adjusted | | $ | 33,218 | | $ | 40,150 |
| |
|
| |
|
|
| Accrued pension cost | | | | | | |
| As reported | | $ | 5,119 | | $ | 6,412 |
| U.S. GAAP adjustments | | | | | | |
| Pension benefits | | | 44 | | | 37 |
| Effect of change in exchange rate | | | 51 | | | 51 |
| |
|
| |
|
|
| As adjusted | | $ | 5,214 | | $ | 6,500 |
| |
|
| |
|
|
| |
| 27. | ADDITIONAL DISCLOSURES REQUIRED BY U.S. GAAP |
| | |
| a. | Recently issued accounting standards |
| | |
| | In November 2004, the Financial Accounting Standard Board (“FASB”) issued SFAS No. 151, “Inventory Costs – an amendment of ARB No. 43, Chapter 4.” SFAS No. 151 clarifies the accounting that requires abnormal amounts of idle facility expenses, freight, handling costs, and spoilage costs to be recognized as current-period charges. It also requires that allocation of fixed production overheads to the costs of conversion be based on the normal capacity of the production facilities. SFAS No.151 is effective for inventory costs incurred during fiscal years beginning after June 15, 2005, but early adoption is permitted during fiscal years after the date of this Statement is issued. The Company does not expect the adoption of SFAS No. 151 to impact the Company’s consolidated financial position or results of operations. |
| | |
| | In December 2004, the FASB issued SFAS No. 123R, “Share-Based Payment”. This statement is a revision to SFAS No. 123 and supersedes APB Opinion No. 25. This statement establishes standards for the accounting for transactions in which an entity exchanges its equity instruments for goods or services, primarily focusing on the accounting for transactions in which an entity obtains employee services in share-based payment transactions. Entities will be required to measure the cost of employee services received in exchange for an award of equity instruments based on the grant-date fair value of the award (with limited exceptions). That cost will be recognized over the period during which an employee is required to provide service, the requisite service period (usually the vesting period), in exchange for the award. The grant-date fair value of employee share options and similar instruments will be estimated using option-pricing models. If an equity award is modified after the grant date, incremental compensation cost will be recognized in an amount equal to the excess of the fair value of the modified award over the fair value of the original award immediately before the modification. This statement is effective as of the beginning of the first fiscal year beginning after June 15, 2005. |
F-44
| | Upon adoption, the Company has two application methods to choose from: The modified-prospective transition approach or the modified-retrospective transition approach. Under the modified-prospective transition method, the Company would be required to recognize compensation cost for share-based awards to employees based on their grant-date fair value from the beginning of the fiscal period in which the recognition provisions are first applied as well as compensation cost for awards that were granted prior to, but not vested as of the date of adoption. Prior periods remain unchanged and pro forma disclosures previously required by SFAS No. 123 continue to be required. Under the modified-retrospective transition method, the Company would restate prior periods by recognizing compensation cost in the amounts previously reported in the pro forma footnote disclosure under SFAS No. 123. Under this method, the Company is permitted to apply this presentation to all periods presented or to the start of the fiscal year in which SFAS No. 123R is adopted. The Company would follow the same guidelines as in the modified-prospective transition method for awards granted subsequent to adoption and those that were granted and not yet vested. The Company adopted the modified-prospective approach, and believes the impact that adoption will have on its financial position or results of operations will approximate the magnitude of the stock-based employee compensation cost disclosed in Note 27 (e) pursuant to the disclosure requirements of SFAS No. 148. |
| | |
| | In December 2004, the FASB issued SFAS No. 153, “Exchanges of Nonmonetary Assets, an amendment of Accounting Principles Board (“APB”) Opinion No, 29.” This Statement addresses the measurement of exchanges of nonmonetary assets. It eliminates the exception from fair value measurement for nonmonetary exchanges of similar productive assets in paragraph 21(b) of APB Opinion No. 29, “Accounting for Nonmonetary Transactions,” and replaces it with an exception for exchanges that do not have commercial substance. This Statement specifies that a nonmonetary exchange has commercial substance if the future cash flows of the entity are expected to change significantly as a result of the exchange. SFAS No. 153 is effective for nonmonetary asset exchanges occurring in fiscal years beginning after June 15, 2005. Earlier application is permitted for nonmonetary asset exchanges occurring in fiscal periods beginning after the date this Statement is issued. The Company does not expect the adoption of SFAS No. 153 to impact the Company’s consolidated financial position or results of operations. |
| | |
| | In March 2005, the FASB issued Interpretation No. 47, “Accounting for Conditional Asset Retirement Obligations”. Interpretation No. 47 clarifies that the term “conditional asset retirement obligation” as used in SFAS No. 143 “Accounting for Asset Retirement Obligations,” refers to a legal obligation to perform an asset retirement activity in which the timing and/or method of settlement are conditional on a future event that may or may not be within the control of an entity. If an entity has sufficient information to reasonably estimate the fair value of an asset retirement obligation, it must recognize a liability at the time the liability is incurred. If the liability’s fair value cannot be reasonably estimated, that fact and the reasons shall be disclosed. Interpretation No. 47 is effective no later than the end of the first fiscal year ending after December 15, 2005 (December 31, 2005, for calendar-year enterprises). An entity shall recognize the cumulative effect of initially applying this Interpretation as a change in accounting principle. The Company adopted Interpretation No. 47 and there was no material impact to the Company’s consolidated financial position or results of operations. |
| | |
| | In May 2005, the FASB issued SFAS No. 154, “Accounting Changes and Error Corrections.” This Statement requires retrospective application for voluntary changes in accounting principle unless it is impracticable to do so. Statement 154’s retrospective application requirement replaces the requirement under APB Opinion No. 20, “Accounting Changes” to recognize most voluntary changes in accounting principle by including in net income of the period of the change the cumulative effect of changing to the new accounting principle. SFAS No. 154 is effective for accounting changes and corrections of errors made in fiscal years beginning after December 15, 2005. Earlier application is permitted for accounting changes and corrections of errors occurring in fiscal periods beginning after the date this Statement is issued. The Company does not expect the adoption of SFAS No. 154 to impact the Company’s consolidated financial position or results of operations. |
F-45
| | In February 2006, the FASB issued SFAS No. 155, “Accounting for Certain Hybrid Financial Instruments - an amendment of FASB Statements No. 133 and 140.” This Statement resolves issues addressed in Statement 133 Implementation Issue No. D1, “Application of Statement 133 to Beneficial Interests in Securitized Financial Assets.” SFAS No. 155 permits fair value remeasurement for any hybrid financial instrument that contains an embedded derivative that otherwise would require bifurcation, clarifies which interest-only strips and principal-only strips are not subject to the requirements of Statement 133, establishes a requirement to evaluate interests in securitized financial assets to identify interests that are freestanding derivatives or that are hybrid financial instruments that contain an embedded derivative requiring bifurcation, clarifies that concentrations of credit risk in the form of subordination are not embedded derivatives and amends Statement 140 to eliminate the prohibition on a qualifying special-purpose entity from holding a derivative financial instrument that pertains to a beneficial interest other than another derivative financial instrument. SFAS No. 155 is effective for all financial instruments acquired or issued after the beginning of an entity’s first fiscal year that begins after September 15, 2006. The fair value election provided for in this SFAS No. 155 may also be applied upon adoption of SFAS No. 155 for hybrid financial instruments that had been bifurcated under paragraph 12 of Statement 133 prior to the adoption of SFAS No. 155. Earlier adoption is permitted as of the beginning of an entity’s fiscal year, providing the entity has not yet issued financial statements for any interim period for that fiscal year. The Company does not expect the adoption of SFAS No. 155 to impact the Company’s consolidated financial position or results of operations. |
| | |
| b. | Pension |
| | |
| | According to U.S. SFAS No. 132, the pension information is disclosed below: |
| | |
| | | | 2003 | | | | 2004 | | | | 2005 | |
| | Components of net periodic benefit cost | | | | | | | | | | | | |
| | Service cost | | $ | 1,709 | | | $ | 1,906 | | | $ | 1,705 | |
| | Interest cost | | | 219 | | | | 349 | | | | 373 | |
| | Expected return on plan assets | | | (76 | ) | | | (78 | ) | | | (117 | ) |
| | Amortization of prior service cost | | | 80 | | | | 165 | | | | 59 | |
| | |
|
| | |
|
| | |
|
| |
| | Net periodic benefit cost | | $ | 1,932 | | | $ | 2,342 | | | $ | 2,020 | |
| | |
|
| | |
|
| | |
|
| |
| | Change in benefit obligation | | | | | | | | | | | | |
| | Benefit obligation at beginning of year | | $ | 6,191 | | | $ | 10,855 | | | $ | 12,660 | |
| | Service cost | | | 1,709 | | | | 1,906 | | | | 1,705 | |
| | Interest cost | | | 219 | | | | 349 | | | | 373 | |
| | Actuarial gain (loss) | | | 2,535 | | | | (1,038 | ) | | | (3,325 | ) |
| | Benefits paid | | | - | | | | (163 | ) | | | - | |
| | Exchange difference | | | 201 | | | | 751 | | | | (335 | ) |
| | |
|
| | |
|
| | |
|
| |
| | Benefit obligation at end of year | | | 10,855 | | | | 12,660 | | | | 11,078 | |
| | |
|
| | |
|
| | |
|
| |
| | Change in plan assets | | | | | | | | | | | | |
| | Fair value of plan assets at beginning of year | | | 1,892 | | | | 2,386 | | | | 3,154 | |
| | Employer contribution | | | 414 | | | | 554 | | | | 570 | |
| | Actual return on plan assets | | | 30 | | | | 32 | | | | 49 | |
| | Exchange difference | | | 50 | | | | 182 | | | | (105 | ) |
| | |
|
| | |
|
| | |
|
| |
| | | | 2,386 | | | | 3,154 | | | | 3,668 | |
| | |
|
| | |
|
| | |
|
| |
| | Funded status | | | 8,469 | | | | 9,506 | | | | 7,410 | |
| | Unrecognized actuarial loss | | | (5,123 | ) | | | (4,240 | ) | | | (874 | ) |
| | Accrued additional liability | | | 646 | | | | - | | | | - | |
| | Accrued expense | | | - | | | | (52 | ) | | | (36 | ) |
| | |
|
| | |
|
| | |
|
| |
| | Net amount recognized (recognized as accrued pension cost) | | $ | 3,992 | | | $ | 5,214 | | | $ | 6,500 | |
| | |
|
| | |
|
| | |
|
| |
F-46
| | Actuarial assumptions: | | | | | | | | | |
| | | 2003 | | | 2004 | | | 2005 | |
| | Discount rate | | 3.25 | % | | 3.25 | % | | 2.75 | % |
| | Rate of compensation increase | | 3.00 | % | | 3.00 | % | | 2.5%-3.0 | % |
| | Expected return on plan assets | | 3.25 | % | | 3.25 | % | | 2.75 | % |
| c. | Income tax |
| | |
| | Reconciliation of income tax for the years ended December 31, 2003, 2004 and 2005 calculated on pre-tax financial statement income (loss) based on the statutory tax rate and the income tax expense (benefit), which conforms to U.S. GAAP, is as follows: |
| | |
| | | | 2003 | | | | 2004 | | | | 2005 | |
| | Tax expense (benefit) based on pre-tax accounting income | | | | | | | | | | | | |
| | (loss) at statutory rate | | $ | (804 | ) | | $ | 9,920 | | | $ | (4,481 | ) |
| | Add (deduct) tax effects of: | | | | | | | | | | | | |
| | Permanent differences | | | | | | | | | | | | |
| | Bonuses to directors, supervisors and employees | | | 983 | | | | 1,022 | | | | (801 | ) |
| | Stock option compensation | | | 960 | | | | (464 | ) | | | 1,113 | |
| | Tax-exempt income - tax holiday | | | (4,581 | ) | | | (6,146 | ) | | | - | |
| | Loss carry forward | | | 1,699 | | | | - | | | | 7,101 | |
| | Other | | | (545 | ) | | | (937 | ) | | | 181 | |
| | Tax credits | | | | | | | | | | | | |
| | Deferred | | | (4,477 | ) | | | (26,848 | ) | | | (155 | ) |
| | Income taxes on undistributed earnings | | | 756 | | | | 2,244 | | | | 2,369 | |
| | Adjustment of prior years’ income tax | | | - | | | | - | | | | (2,790 | ) |
| | |
|
| | |
|
| | |
|
| |
| | Income tax expense (benefit) | | $ | (6,009 | ) | | $ | (21,209 | ) | | $ | 2,537 | |
| | |
|
| | |
|
| | |
|
| |
The above-mentioned taxes on pre-tax accounting income (loss) based on the applicable statutory rates for both domestic and foreign entities are shown below:
| | | | 2003 | | | | 2004 | | | | 2005 | |
| | | | | | | | | | | | | | |
| | Domestic entity | | $ | - | | | $ | 509 | | | $ | 1,079 | |
| | Foreign entities | | | | | | | | | | | | |
| | ASE Test, Inc. (25% statutory rate) | | | 5,562 | | | | 8,150 | | | | (4,626 | ) |
| | ASE Test Malaysia (28% statutory rate) | | | (337 | ) | | | 1,765 | | | | 745 | |
| | ISE Labs (federal tax rate 35% and state tax rate 6%) | | | (6,029 | ) | | | (504 | ) | | | (1,679 | ) |
| | |
|
| | |
|
| | |
|
| |
| | | $ | (804 | ) | | $ | 9,920 | | | $ | (4,481 | ) |
| | |
|
| | |
|
| | |
|
| |
Deferred income tax assets and liabilities are summarized as follows:
| | | | 2004 | | | | 2005 | |
| | Current deferred income tax assets | | | | | | | | |
| | Unused tax credits | | $ | 4,487 | | | $ | 9,267 | |
| | Loss carry forward | | | 254 | | | | 4,067 | |
| | Accrued liabilities and reserve | | | 381 | | | | 918 | |
| | Other | | | - | | | | 962 | |
| | |
|
| | |
|
| |
| | | | 5,122 | | | | 15,214 | |
| | Less - valuation allowance | | | (541 | ) | | | (6,281 | ) |
| | |
|
| | |
|
| |
| | | $ | 4,581 | | | $ | 8,933 | |
| | |
|
| | |
|
| |
| | | | | | | | (Continued | ) |
F-47
| | | | 2004 | | | | 2005 | |
| | Non-current deferred income tax assets (liabilities) | | | | | | | | |
| | Unused tax credits | | $ | 39,755 | | | $ | 29,528 | |
| | Tax effect of unabsorbed capital allowance | | | 4,945 | | | | 10,263 | |
| | Loss carry forward | | | 7,724 | | | | 9,294 | |
| | Timing difference between tax capital allowance and depreciation of | | | | | | | | |
| | property, plant and equipment | | | (3,772 | ) | | | (7,616 | ) |
| | Accrued liabilities and reserve | | | 881 | | | | 2,235 | |
| | Other | | | 436 | | | | 2,563 | |
| | |
|
| | |
|
| |
| | | | 49,969 | | | | 46,267 | |
| | Less - valuation allowance | | | (8,646 | ) | | | (15,303 | ) |
| | |
|
| | |
|
| |
| | | $ | 41,323 | | | $ | 30,964 | |
| | |
|
| | |
|
| |
| | Non-current deferred income tax liabilities | | $ | (1,016 | ) | | $ | - | |
| | |
|
| | |
|
| |
| d. | Earnings (loss) per share |
| | |
| | U.S. SFAS No. 128 requires the presentation of basic and diluted earnings per share. Basic net income per share is computed based on the weighted average number of common shares outstanding during the period. Diluted net income per share includes the effect of diluted equivalent common shares (stock options issued during the period using the treasury stock method). |
| | |
| | Following is a reconciliation of amounts used in the basic and diluted computation: |
| | |
| | | | 2003 | | | | 2004 | | | 2005 | |
| | | | | | | | | | | | | |
| | Net income (loss) under U.S. GAAP | | $ | (3,491 | ) | | $ | 17,890 | | $ | (35,446 | ) |
| | |
|
| | |
|
| |
|
| |
| | Weighted average shares, as adjusted - denominator | | | | | | | | | | | |
| | Basic | | | 99,110,225 | | | | 100,037,524 | | | 100,059,031 | |
| | |
|
| | |
|
| |
|
| |
| | Diluted | | | 99,110,225 | | | | 100,111,113 | | | 100,059,031 | |
| | |
|
| | |
|
| |
|
| |
| | Earnings (loss) per share (in U.S. dollars) | | | | | | | | | | | |
| | Basic and diluted | | $ | (0.04 | ) | | $ | 0.18 | | $ | (0.35 | ) |
| | | |
|
| | |
|
| |
|
| |
| | Number of shares to be potentially issued from: | | | | | | | | | | | |
| | Stock options | | | 13,301,418 | | | | 10,877,448 | | | 10,491,064 | |
| | |
|
| | |
|
| |
|
| |
| e. | Stock option plans |
| | |
| | ASE Test Limited |
| | |
| | The Company has three stock option plans, the 1999 Option Plan, the 2000 Option Plan and the 2004 Option Plan. Up to 2,000,000 shares, 12,000,000, and 2,500,000 shares have been reserved for issuance under the 1999, 2000 and 2004 option plans, respectively. |
| | |
| | The 1999, 2000 and 2004 Option Plans granted the following stock options to purchase the Company’s shares which vest ratably over a period of five years from the date of grant until the expiration of options, to directors, officers and key employees. If any granted shares are forfeited, the shares may be granted again, to the extent of any such forfeiture. |
| | |
| | The exercise price under each of the aforementioned stock option plans was equal to the stock’s market price on the date of grant. Options granted under the 1999, 2000 and 2004 Option Plans expire 10 years after grant. |
| | |
F-48
| | Information regarding the option plans of the Company is presented below: | | | | | | | | | |
| | | Number
of Shares | | | | Weighted
Average
Exercise
Price
Per Share | | | Weighted
Average
Grant Date
Fair Values |
| | | | | | | | | | | |
| | Beginning balance - January 1, 2003 | | 13,331,363 | | | $ | 11.55 | | | |
| | Option granted | | 2,000,000 | | | | 12.95 | | $ | 12.95 |
| | | | | | | | | | |
|
| | Option exercised | | (478,426 | ) | | | 8.99 | | | |
| | Option forfeited | | (568,860 | ) | | | 13.72 | | | |
| | Option expired | | (982,659 | ) | | | 11.08 | | | |
| | | |
| | | | | | | |
| | Ending balance - December 31, 2003 | | 13,301,418 | | | | 11.80 | | | |
| | Option granted | | 260,000 | | | | 6.18 | | $ | 6.18 |
| | | | | | | | | |
|
| | Option exercised | | (512,815 | ) | | | 8.90 | | | |
| | Option forfeited | | (417,815 | ) | | | 11.82 | | | |
| | Option expired | | (1,753,340 | ) | | | 20.00 | | | |
| | | |
| | | | | | | |
| | Ending balance - December 31, 2004 | | 10,877,448 | | | | 10.48 | | | |
| | Option granted | | 32,500 | | | | 6.50 | | $ | 6.50 |
| | | | | | | | | |
|
| | Option exercised | | - | | | | - | | | |
| | Option forfeited | | (358,884 | ) | | | 10.97 | | | |
| | Option expired | | (60,000 | ) | | | 25.00 | | | |
| | |
| | | | | | | |
| | Ending balance - December 31, 2005 | | 10,491,064 | | | | 10.37 | | | |
| | | |
| | | | | | | |
| | | | | | | | | | | |
| | Options outstanding on December 31, 2005, the related weighted average exercise price and remaining contractual life information are as follows (in U.S. dollars): |
| | | | Outstanding | | Exercisable | | |
| | | |
| |
| | |
| | | | Shares | | | Weighted
Average
Price | | Shares | | | Weighted
Average
Price | | Weighted
Average
Remaining
Life (Years) |
| | Options with exercise price of: | | | | | | | | | | | | |
| | $ | 20-$25 | | 627,700 | | $ | 22.46 | | 627,700 | | $ | 22.46 | | 3.94 |
| | $ | 11.5-$12.95 | | 2,167,450 | | | 12.81 | | 768,200 | | | 12.61 | | 7.69 |
| | $ | 5.5-$9 | | 7,695,914 | | | 8.69 | | 6,506,829 | | | 8.79 | | 5.25 |
| | | |
| | | | |
| | | | | |
| | | | 10,491,064 | | | | | 7,902,729 | | | | | |
| | | |
| | | | |
| | | | | |
| | | | | | | | | | | | | | |
| | The Company has computed, for pro forma disclosure purposes, the fair value of each option grant, as defined by U.S. SFAS No. 123, using the Black-Scholes option pricing model with the following assumptions: |
| | | 2003 | | 2004 | | 2005 |
| | | | | | | | |
| | Risk-free interest rate | | 3.38% | | 3.50-3.88% | | 3.88% |
| | Expected life | | 5 years | | 5 years | | 5 years |
| | Expected volatility | | 65.07% | | 78.28% | | 59.06% |
| | Expected dividend | | 0% | | 0% | | 0% |
F-49
| ASE Inc. | | | | | | | | | |
| | | | | | | | | | |
| ASE Inc, the parent company, has two option plans, the 2002 Option Plan and the 2004 Option Plan. The maximum number of units authorized to be granted under the 2002 and 2004 option plan is 160 million and 140 million, respectively, with each unit representing one share of ASE Inc. Under the terms of the plans, stock option rights are granted to employees, including those of the Company, which have an exercise price equal to the closing price of the ASE Inc. common stock as per the Taiwan Stock Exchange on the date of grant, and such exercise price is subject to retroactive adjustment in the event of certain capital transactions in subsequent periods. The option rights expire ten years from the date of grant. On the second anniversary of the grant date, 40% of the options become vested and the remaining options vest ratably over a period of three years thereafter. Under the 2002 and 2004 Option Plans, 41,603,100 and 28,499,550 units were granted, respectively, by ASE Inc. to employees of the Company. |
| | | | | | | | | | |
| Information regarding the options issued to employees of the Company under ASE Inc.’s stock option plan for the Company is as follows (in U.S. dollars): |
| | | | | | | | | | |
| | | Number of
Shares | | | | Weighted
Average
Exercise
Price
Per Share | | | Weighted
Average
Grant Date
Fair Values |
| | | | | | | | | | | |
| | Beginning outstanding balance - January 1, 2004 | | 38,852,400 | | | $ | 0.58 | | | |
| | Options granted | | 25,499,500 | | | | 0.79 | | $ | 0.79 |
| | | | | | | | |
|
|
| | Options forfeited | | (2,261,800 | ) | | | 0.58 | | | |
| | Options expired | | - | | | | - | | | |
| | Options exercised | | (338,000 | ) | | | 0.56 | | | |
| | | |
| | | | | | | |
| | Ending outstanding balance - December 31, 2004 | | 61,752,100 | | | | 0.60 | | | |
| | Options granted | | 3,000,000 | | | | 0.57 | | $ | 0.57 |
| | | | | | | | |
|
|
| | Options forfeited | | (5,126,800 | ) | | | 0.58 | | | |
| | Options expired | | - | | | | - | | | |
| | Options exercised | | (6,698,720 | ) | | | 0.49 | | | |
| | | |
| | | | | | | |
| | Ending outstanding balance - December 31, 2005 | | 52,926,580 | | | | 0.60 | | | |
| | | |
| | | | | | | |
| | | | | | | | | | | |
| | The weighted average exercise price and remaining contractual life of the options outstanding as of December 31, 2005 are as follows: |
| | | | Outstanding
Shares | | Exercisable
Shares | | Weighted
Average
Remaining
Life (Years) |
| Options with exercise price | | | | | | |
| | $ | 0.49 | | 21,360,900 | | 10,399,800 | | 7.0 |
| | $ | 0.64 | | 5,162,680 | | 2,009,800 | | 7.6 |
| | $ | 0.69 | | 23,553,000 | | - | | 8.5 |
| | $ | 0.57 | | 2,850,000 | | - | | 9.4 |
| | | |
| |
| | |
| | | | 52,926,580 | | 12,409,600 | | |
| | | |
| |
| | |
| | | | | | | | |
| The 2002 option plan is accounted for as a variable plan, as a result of a provision in the plan which would require an adjustment of the exercise price in accordance with a prescribed formula based on occurrence of certain future events. Accordingly, no adjustment is required for purposes of the pro forma compensation expense calculated in accordance with U.S. SFAS No. 123 for these options. |
F-50
| The fair value of the 2004 and 2005 option plan issued was determined using a Black-Scholes option pricing model with the following assumptions: | | | | |
| | | | | |
| | | 2004 | | 2005 |
| | | | | | |
| | Risk-free interest rate | | 2.50% | | 1.80% |
| | Expected life | | 5 years | | 5 years |
| | Expected dividend | | 3.00% | | 3.00% |
| | Expected volatility | | 59% | | 59% |
| | | | | | |
| | For purposes of pro forma disclosure, the estimated fair values of the options are amortized to expense ratably over the option vesting periods. Had the Company recorded compensation costs based on the estimated grant date fair value, as defined by U.S. SFAS No. 123, the Company’s net income (loss) would have been reduced to the pro forma amounts below (EPS in U.S. dollars). |
| | | | 2003 | | | | 2004 | | | | 2005 | |
| | | | | | | | | | | | | | |
| | Net income (loss) based on U.S. GAAP | | $ | (3,491 | ) | | $ | 17,890 | | | $ | (35,446 | ) |
| | Stock-based compensation expense (net of related tax effect) | | | | | | | | | | | | |
| | from the Company | | | (12,681 | ) | | | (13,998 | ) | | | (10,525 | ) |
| | from ASE Inc. | | | - | | | | (836 | ) | | | (1,660 | ) |
| | |
|
| | |
|
| | |
|
| |
| | Pro forma net income (loss) | | $ | (16,172 | ) | | $ | 3,056 | | | $ | (47,631 | ) |
| | |
|
| | |
|
| | |
|
| |
| | Basic EPS | | | | | | | | | | | | |
| | As reported | | $ | (0.04 | ) | | $ | 0.18 | | | $ | (0.35 | ) |
| | | |
|
| | |
|
| | |
|
| |
| | Pro forma | | $ | (0.16 | ) | | $ | 0.03 | | | $ | (0.48 | ) |
| | | |
|
| | |
|
| | |
|
| |
| | Diluted EPS | | | | | | | | | | | | |
| | As reported | | $ | (0.04 | ) | | $ | 0.18 | | | $ | (0.35 | ) |
| | | |
|
| | |
|
| | |
|
| |
| | Pro forma | | $ | (0.16 | ) | | $ | 0.03 | | | $ | (0.48 | ) |
| | | |
|
| | |
|
| | |
|
| |
| | The pro forma amounts reflect compensation expense related to option grants under the 1999, 2000 and 2004 Option Plans of the Company and 2004 Option Plan of ASE Inc. In future years, the annual compensation expense may increase relative to the fair value of the options granted and vested in those future years. |
| | |
| f. | According to U.S. SFAS No. 130 “Reporting Comprehensive Income”, the statements of comprehensive income (loss) for the years ended December 31, 2003, 2004 and 2005 are present below: |
| | |
| | | | 2003 | | | | 2004 | | | 2005 | |
| | | | | | | | | | | | | |
| | Net income (loss) based on U.S. GAAP | | $ | (3,491 | ) | | $ | 17,890 | | $ | (35,446 | ) |
| | Translation adjustment on subsidiaries | | | 8,226 | | | | 22,976 | | | (5,780 | ) |
| | Unrecognized pension cost | | | (646 | ) | | | 646 | | | - | |
| | Unrealized holding gain of long-term investments | | | 211 | | | | 400 | | | - | |
| | |
|
| | |
|
| |
|
| |
| | Comprehensive income (loss) | | $ | 4,300 | | | $ | 41,912 | | $ | (41,226 | ) |
| | |
|
| | |
|
| |
|
| |
F-51
| g. | Goodwill |
| | |
| | As of January 1, 2002, the Company adopted U.S. SFAS No. 142, “Goodwill and Other Intangible Assets’’, which requires that goodwill no longer be amortized, and instead, be tested for impairment on a periodic basis. In conjunction with the implementation of U.S. SFAS No. 142, the Company completed a goodwill impairment review as of January 1, 2002 using a fair-value based approach in accordance with the provision of the standard and found no impairment. Based on acquisitions completed as of June 30, 2001, application of the goodwill non-amortization provisions resulted in a decrease in amortization of approximately $10,105 thousand and $4,966 thousand for 2004 and 2005 respectively. The Company performed its annual goodwill impairment test on December 31, 2005 and found no impairment. As of December 31, 2005, the Company had $40,927 thousand of goodwill. |
F-52