UNITED STATES
SECURITIES AND EXCHANGE COMMISSION
Washington, D.C. 20549
FORM N-CSR
CERTIFIED SHAREHOLDER REPORT OF REGISTERED
MANAGEMENT INVESTMENT COMPANIES
Investment Company Act file number | 811-07685 |
|
Frontier Funds, Inc. |
(Exact name of registrant as specified in charter) |
|
400 Skokie Blvd. Suite 500 Northbrook, | | IL 60062 |
(Address of principal executive offices) | | (Zip code) |
|
William D. Forsyth III 400 Skokie Blvd., Suite 500 Northbrook, Illinois 60062 |
(Name and address of agent for service) |
|
Registrant’s telephone number, including area code: | (847) 509-9860 | |
|
Date of fiscal year end: | June 30 | |
|
Date of reporting period: | June 30, 2018 | |
| | | | | | | | |
Item 1. Reports to Stockholders.

ANNUAL REPORT
Frontier MFG Global Equity Fund
Frontier MFG Global Plus Fund
Frontier MFG Core Infrastructure Fund
Frontier Timpani Small Cap Growth Fund
Frontier Phocas Small Cap Value Fund
Frontegra Asset Management, Inc.
June 30, 2018

TABLE OF CONTENTS
Shareholder Letter | | | 1 | | |
Frontier MFG Global Equity Fund and Frontier MFG Global Plus Fund | |
Report from MFG Asset Management | | | 4 | | |
Investment Highlights | | | 6 | | |
Frontier MFG Core Infrastructure Fund | |
Report from MFG Asset Management | | | 10 | | |
Investment Highlights | | | 12 | | |
Frontier Timpani Small Cap Growth Fund | |
Report from Timpani Capital Management LLC | | | 14 | | |
Investment Highlights | | | 16 | | |
Frontier Phocas Small Cap Value Fund | |
Report from Phocas Financial Corporation | | | 18 | | |
Investment Highlights | | | 20 | | |
Expense Example | | | 21 | | |
Schedules of Investments | |
Frontier MFG Global Equity Fund | | | 24 | | |
Frontier MFG Global Plus Fund | | | 25 | | |
Frontier MFG Core Infrastructure Fund | | | 26 | | |
Frontier Timpani Small Cap Growth Fund | | | 29 | | |
Frontier Phocas Small Cap Value Fund | | | 32 | | |
Statements of Assets and Liabilities | | | 35 | | |
Statements of Operations | | | 37 | | |
Statements of Changes in Net Assets | | | 39 | | |
Financial Highlights | | | 42 | | |
Notes to Financial Statements | | | 52 | | |
Report of Independent Registered Public Accounting Firm | | | 61 | | |
Board of Directors' Approval of Advisory and Subadvisory Agreements | | | 62 | | |
Additional Information | |
Directors and Officers | | | 71 | | |
Foreign Tax Credit | | | 75 | | |
Qualified Dividend Income/Dividends Received Deduction | | | 75 | | |
This report is submitted for the general information of the shareholders of the above-listed Funds. It is not authorized for distribution to prospective investors unless accompanied or preceded by an effective Prospectus for the applicable Fund. The Prospectuses may be obtained by calling 1-888-825-2100. Each Prospectus includes more complete information about management fees and expenses, investment objectives, risks and operating policies of the applicable Fund. Please read the applicable Prospectus carefully.
Frontier Funds, Inc. are distributed by Frontegra Strategies, LLC, 400 Skokie Blvd., Suite 500, Northbrook, IL 60062. Frontegra Strategies, LLC, member of FINRA and SIPC, is an affiliate of Frontegra Asset Management, Inc. and Timpani Capital Management LLC, the Funds' investment advisers.

DEAR FELLOW SHAREHOLDERS:
We are pleased to report on the progress of the Frontier Funds over the past twelve months ending June 30, 2018. The S&P 500 Index was up 14.37% and small capitalization stocks were also up, with the Russell 2000® Index returning 17.57%. International stocks, as measured by the MSCI EAFE Index, returned 6.84% over the twelve-month period.
Fund Results
The Frontier MFG Global Equity Fund, managed by MFG Asset Management ("MFG"), returned 13.75% (net) versus the MSCI World Index (Net) return of 11.09% for the twelve-month period ending June 30, 2018.
The Frontier MFG Global Plus Fund — Institutional Class, also managed by MFG, returned 13.12% (net) versus the MSCI World Index (Net) return of 11.09% for the twelve-month period ending June 30, 2018. The Service Class shares returned 13.01% (net) over the same time period.
For the twelve-month period ending June 30, 2018, the Frontier MFG Core Infrastructure Fund — Institutional Class, also managed by MFG, returned 0.60% (net) versus the S&P Global Infrastructure Index return of 1.82%. The Service Class shares returned 0.60% (net) over the same time period.
The Frontier Timpani Small Cap Growth Fund — Institutional Class, managed by Timpani Capital Management, returned 35.48% (net) versus the Russell 2000® Growth Index return of 21.86% for the twelve-month period ending June 30, 2018. The Service Class shares returned 35.37% (net) and the Class Y shares returned 34.95% (net) over the same time period.
The Institutional Class of the Frontier Phocas Small Cap Value Fund, managed by Phocas Financial, returned 12.52% (net) versus the Russell 2000 Value Index return of 13.10% for the twelve-month period ending June 30, 2018. The Service Class shares returned 12.42% (net) over the same time period.
Outlook
Equity markets have enjoyed solid returns for the past twelve months, although returns thus far in calendar year 2018 have been muted relative to the last six months of 2017. While sustained and synchronized global growth and robust corporate earnings continued to support cyclical assets early in 2018, higher inflation expectations, concerns regarding monetary tightening at the Federal Reserve and political and geopolitical uncertainty — including trade tariffs — have weighed on market sentiment thus far in 2018. While consensus expectations are for positive returns from equities in the near term, volatility is also expected to increase, requiring heightened attention when navigating markets.
We will continue to oversee the investment management of the Frontier Funds with the care and diligence that have served our shareholders well in the past. As always, we appreciate your investment and continued confidence in the Frontier Funds.
Best regards,
William D. Forsyth, CFA
President
Frontier Funds, Inc.
page 1
This page intentionally left blank.

FRONTIER
MFG GLOBAL EQUITY FUND
AND
FRONTIER
MFG GLOBAL PLUS FUND

REPORT FROM MFG ASSET MANAGEMENT
Dear Fellow Shareholders:
The investment objective of the Frontier MFG Global Equity Fund and the Frontier MFG Global Plus Fund is capital appreciation. The objective is measured against the MSCI World Index (Net).
Performance Review
The Frontier MFG Global Equity Fund returned 13.75%, net of fees, for the year ended June 30, 2018, while the Frontier MFG Global Plus Fund (Institutional Class) returned 13.12%, net of fees, for the same period. Both Funds' outperformed the 11.09% return of their benchmark, the MSCI World Index (Net).
We do not manage the Funds against short-term performance metrics and it is inevitable the Funds will underperform markets at some point in the future. We feel strongly that people cannot retire on "relative investment returns"; only by generating investment returns that exceed the rate of inflation (ideally by a satisfactory margin) will investors increase their wealth over time. As such, we are happy to be judged on the absolute returns of our strategy over time.
Global stocks hit record highs in the twelve months to June 2018, as U.S. companies posted higher-than-expected earnings, the internet giants surged on strong results and upbeat outlooks, the Federal Reserve only tightened U.S. monetary policy slowly as expected, U.S. Congress slashed the corporate tax rate, and the world's major economies grew in unison for the first time in about a decade. Gains were tempered when U.S. President Donald Trump imposed import restrictions that could lead to trade wars (especially with China), concerns mounted that U.S. inflation might accelerate enough to prompt the Fed to tighten monetary policy more than expected, and worries rose that regulators might crack down on U.S. technology companies.
The stocks that contributed the most to the Funds' return included the investments in Visa, Apple and Mastercard. Visa rose after its earnings topped analyst expectations for every quarterly reporting period released over 2017 and so far in 2018, aided by outperformance of Visa Europe relative to the expectations held at the time of the acquisition. Apple rose on the strong growth in its services division. Like Visa, Mastercard gained after the payment company revealed that earnings beat estimates due to higher consumer spending, and the company boosted forecasts for 2018.
Stocks that detracted from the Funds' return included the investments in Kraft Heinz, Starbucks and Sanofi. Kraft Heinz fell as investors discounted Kraft Heinz undertaking a major acquisition, focused on the fact that the company was nearing the end of the cost savings stemming from the merger of Kraft and Heinz in 2015, and revenue growth slowed. Starbucks slid when the coffee chain reduced full-year earnings guidance due to lower same-store sales growth in the U.S. and China and store closures in the U.S. This news was partially offset by the announcement of a cost-cutting drive and an increase in the company's share-buyback program from US$15 billion to US$25 billion. Sanofi fell amid disputes regarding patent protection of its diabetes products and after earnings missed estimates due to pressure on drug prices in the U.S.
Over the twelve months to June, the Funds invested in Crown Castle International, Kraft Heinz, SAP and Reckitt Benckiser and sold out of CVS Health, PayPal, Tesco and Sanofi.
Fund Outlook and Strategy
Global stocks might be close to record highs, but there is no shortage of risks as we enter the second half of 2018. Of prime concern is that we see a fifty-fifty chance of a disruptive rise in U.S. interest rates. The risk that the Federal Reserve might need to respond quickly to a faster-than-expected increase in inflationary pressures is real given the drop in the U.S. jobless rate to an 18-year low of 3.8% in May, even if there are no signs of faster wage growth. As the outlook for the U.S. economy remains buoyant, the unemployment rate could fall further in the near term and ignite wage growth.
page 4

Another concern is that trade tensions between the U.S. and China have risen in recent months. While the two countries regularly discuss their differences, rhetoric has hardened lately because neither side appears willing to offer material concessions. We see two risks. The first is that an extended period of trade tensions causes businesses to delay investment and hiring decisions, resulting in slower economic growth. The other is a failure to find a mutually acceptable outcome, resulting in permanent barriers to trade. As neither side would benefit from a prolonged trade war, we think that a "deal" might be the most likely outcome.
The formation of a Eurosceptic government in Italy following elections in March has raised the risk that the country will move towards an exit from the EU. But the new Italian government will first discuss its citizens' two main sources of frustrations — immigration and poor economic growth — with other European countries. As Italians generally support the EU and euro membership, these talks could lead to concessions that sufficiently reduce Italian frustrations. Both sides would need to make major concessions, however, if these aggravations were to be permanently reduced.
The U.S.-North Korea summit in June might have reduced the relatively small chance of a nuclear confrontation between the two countries. The path to, and definition of, "denuclearisation", however, remains the subject of future talks. As a result, the Korean peninsula might remain a source of uncertainty and risk into the medium term.
Due to these risks, we held the cash position in both Funds at about 18% over the June quarter. Notwithstanding the uncertainty surrounding stock markets, we are confident about the long-term outlook for the investments selected for our portfolios and the portfolios' risk profile. Many of the stocks in the portfolios benefit from being leading digital platforms, the shift to a cashless society, a stronghold on the enterprise software market or the dynamics of ageing populations.
Yours sincerely,
Hamish Douglass
Portfolio Manager
MFG Asset Management
page 5

INVESTMENT HIGHLIGHTS
Growth of a $1,000,000 Investment (Unaudited)

* 12/28/11 commencement of operations.
Portfolio Total Return**
FOR PERIODS ENDED 6/30/18 | | FUND | | INDEX | |
SIX MONTHS | | | 2.89 | % | | | 0.43 | % | |
ONE YEAR | | | 13.75 | % | | | 11.09 | % | |
FIVE YEAR
AVERAGE ANNUAL | | | 10.52 | % | | | 9.94 | % | |
AVERAGE ANNUAL
SINCE INCEPTION | | | 13.34 | % | | | 11.60 | % | |
Fund Expenses | |
GROSS EXPENSE RATIO | | | 0.88 | % | |
NET EXPENSE RATIO | | | 0.83 | % | |
This chart assumes an initial gross investment of $1,000,000 made on 12/28/11 (commencement of operations). Returns shown include the reinvestment of all distributions. Past performance is not predictive of future results. Investment return and principal value will fluctuate so that shares, when redeemed, may be worth more or less than the original cost. In the absence of existing fee waivers, total return would be reduced. To receive current to the most recent month-end performance, please call 1-888-825-2100.
The MSCI World Index (Net) represents large and mid cap equities across 23 Developed Markets countries. The index covers approximately 85% of the free float-adjusted market capitalization in each country. The index does not reflect investment management fees, brokerage commissions and other expenses associated with investing in equity securities. A direct investment in the index is not possible.
Frontegra Asset Management, Inc. has contractually agreed through October 31, 2020, to waive its management fee and/or reimburse the Fund's operating expenses to the extent necessary to ensure that the Fund's total operating expenses (excluding taxes, interest, brokerage commissions, acquired fund fees and expenses and extraordinary expenses) do not exceed 0.80% of the Fund's average daily net assets. The expense ratios presented are based on the annualized expense ratios as reported in the Fund's current prospectus, which may differ from the expense ratios presented in the Fund's financial highlights.
** The returns shown do not reflect the deduction of taxes that a shareholder would pay on Fund distributions or the redemption of Fund shares.
page 6

INVESTMENT HIGHLIGHTS
Growth of a $1,000,000 Investment (Unaudited)
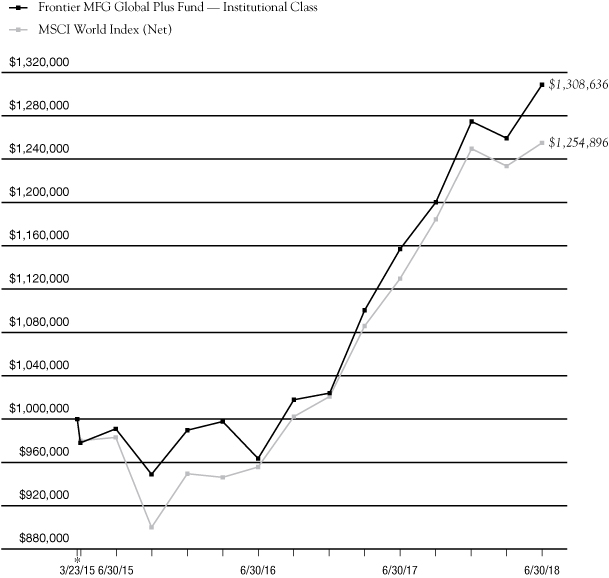
* 3/23/15 commencement of operations.
Portfolio Total Return**
FOR PERIODS ENDED 6/30/18 | | FUND | | INDEX | |
SIX MONTHS | | | 2.66 | % | | | 0.43 | % | |
ONE YEAR | | | 13.12 | % | | | 11.09 | % | |
AVERAGE ANNUAL
SINCE INCEPTION | | | 8.57 | % | | | 7.19 | % | |
Institutional Class Expenses | |
GROSS EXPENSE RATIO | | | 0.98 | % | |
NET EXPENSE RATIO | | | 0.83 | % | |
This chart assumes an initial gross investment of $1,000,000 made on 3/23/15 (commencement of operations). Returns shown include the reinvestment of all distributions. Past performance is not predictive of future results. Investment return and principal value will fluctuate so that shares, when redeemed, may be worth more or less than the original cost. In the absence of existing fee waivers, total return would be reduced. To receive current to the most recent month-end performance, please call 1-888-825-2100.
The MSCI World Index (Net) represents large and mid cap equities across 23 Developed Markets countries. The index covers approximately 85% of the free float-adjusted market capitalization in each country. The index does not reflect investment management fees, brokerage commissions and other expenses associated with investing in equity securities. A direct investment in the index is not possible.
Frontegra Asset Management, Inc. has contractually agreed through October 31, 2020, to waive its management fee and/or reimburse the Fund's operating expenses to the extent necessary to ensure that the Fund's total operating expenses (excluding taxes, interest, brokerage commissions, acquired fund fees and expenses and extraordinary expenses) do not exceed 0.80% of the Fund's average daily net assets for the Institutional Class. The expense ratios presented are based on the annualized expense ratios as reported in the Fund's current prospectus, which may differ from the expense ratios presented in the Fund's financial highlights.
** The returns shown do not reflect the deduction of taxes that a shareholder would pay on Fund distributions or the redemption of Fund shares.
The above graph relates to Institutional Class shares of the Fund. Performance for Service Class shares will vary from the performance of the Institutional Class shares shown above due to differences in expenses.
page 7
This page intentionally left blank.

FRONTIER
MFG CORE INFRASTRUCTURE FUND

REPORT FROM MFG ASSET MANAGEMENT
Dear Fellow Shareholders:
The investment objective of the Frontier MFG Core Infrastructure Fund is long-term capital appreciation. The objective is measured against the S&P Global Infrastructure Index.
The types of infrastructure assets in which the Fund invests are generally natural monopolies that provide an essential service to the community. Infrastructure assets offer investors protection from the impacts of inflation because their earnings generally have some direct linkage to inflation. Over time, the stable, reliable earnings of infrastructure assets are expected to lead to a combination of income and capital growth for investors.
The universe of infrastructure assets that are held by the Fund is made up of two main sectors:
• Utilities: Utilities include regulated energy and water utilities. Utilities are typically subject to economic regulation. The terms of regulation typically require a utility to efficiently provide an essential service to the community and, in return, permit the utility to earn a fair rate of return on the capital it has invested in its operations. As a utility provides a basic necessity, there is minimal fluctuation in demanded volumes in response to the economic cycle, while the price charged for the utility service can be adjusted with limited impact upon demanded volumes. As a result, the earnings of regulated utilities have been, and are expected to be, stable irrespective of economic conditions.
• Infrastructure: This includes airports, ports, toll roads and broadcast communications infrastructure. Regulation of infrastructure companies is generally less intensive than regulation of utilities and this allows companies to accrue the benefits of volume growth (i.e. the returns of infrastructure companies are linked to growth in passengers, vehicles or containers). As economies develop, we expect the underlying level of aviation, shipping and vehicle traffic to increase. As a result, the revenues and earnings derived by infrastructure assets are expected to grow.
A key feature of the portfolio construction process for the Frontier MFG Core Infrastructure strategy is the application of what we call "the 75% rule". This relates to those companies whose assets are a mixture of assets that MFG Asset Management classifies as infrastructure and those assets that do not meet our strict requirements. In those circumstances, we require at least, and on a consistent basis, 75% of the earnings of the company to be derived from the assets that meet our definitional requirement before it can be included in the Fund.
Performance Review
The Frontier MFG Core Infrastructure Fund returned 0.60%, net of fees, for the twelve months ended June 30, 2018. The Fund underperformed the 1.82% return of its benchmark, the S&P Global Infrastructure Index.
Global infrastructure and utility stocks rose in the twelve months to June 2018, after these companies posted healthy earnings and boosted forecasts for 2018 and beyond. Infrastructure and utility stocks, however, underperformed broader global equity markets because these stocks were seen as gaining relatively less benefit from the reduction in the U.S. corporate tax rate from 35% to 21%, while the prospects of faster inflation in the U.S. boosted U.S. bond yields and reduced the appeal of stocks considered by some to be bond proxies.
Oil prices surged about 60% over the twelve months as the world's major economies grew in unison for the first time in about a decade and the U.S. renewed sanctions against Iran. U.S. bond yields, the benchmarks for global credit markets, rose to seven-year highs in May on concerns that higher oil prices and the U.S. fiscal stimulus would boost inflation concerns and prompt the Federal Reserve to raise the cash rate more than expected in 2018. In December, March and June, the Fed raised the U.S. cash rate by a quarter point to bring the cash rate to between 1.75% and 2%, its highest range since the onset of the global financial crisis. Over the twelve months,
page 10

U.S. two-year government bond yields rose 116 basis points to 2.53% while 10-year government bond yields jumped 59 basis points to 2.86%, while reaching 3.11% in May.
At a stock level on a contributions basis, the best performers included investments in ADP, Crown Castle International and Getlink. ADP rallied on higher traffic numbers and confirmation that the French government was preparing to reduce its 50.6% stake in the airport operator formerly called Aeroports de Paris. Crown Castle rose, despite a proposed merger between U.S. telecoms Sprint and T-Mobile that would reduce the number of potential customers by one, as mobile traffic expanded strongly and the company completed its acquisition of Lightower to support its small cell business. Getlink (which changed its name from Eurotunnel) gained as Italian infrastructure company Atlantia took a 15.5% stake in the company.
Lagging stocks on a contributions basis included the investments in PG&E, PPL and SCANA of the U.S. PG&E and PPL slumped after wildfires tore through parts of California and state authorities decreed that electrical utilities could be held liable for damage from fires, even if they were not found negligent in respect of how they limit the risks that their electrical wires could ignite trees close by. SCANA dropped after the U.S. utility in July abandoned the expansion of its V.C. Summer nuclear plant.
Over the twelve months, the portfolio added four stocks. REN of Portugal was added after the credit rating of Portugal was upgraded by several credit rating houses to investment grade. North American utility company Evergy was added following the merger of Westar Energy and Great Plains Energy. Canadian Utilities was added after confirmation that the assets and ownership structure had the requisite risk profile for inclusion. John Laing Infrastructure Fund was added following a review of the earnings composition of the business.
Over the period, the portfolio sold out of six stocks. Abertis Infraestructuras was sold following a share tender offer from German contractor Hochtie. Great Plains Energy and Westar Energy were removed after the companies were combined into the newly formed Evergy. OHL Mexico was removed after a share tender offer saw its free-float drop below acceptable levels. European satellite operators, Eutelsat and SES, were removed due to concerns about their ability to deliver the reliable returns we expect from our investments.
Portfolio Outlook and Strategy
We expect global monetary conditions to become less accommodative in coming years, which means long-term interest rates are likely to rise. We believe that investment markets are pricing in higher, more "normal" levels of interest rates. This means that if interest rates increase over the medium term, we can expect the impact on asset prices to be somewhat muted because investors have already allowed for some increase in rates. We are confident that any increase in interest rates will have only a very limited impact on the financial performance of the stocks in the portfolio.
Sincerely,
Gerald Stack
Portfolio Manager
MFG Asset Management
page 11

INVESTMENT HIGHLIGHTS
Growth of a $100,000 Investment (Unaudited)

* 1/18/12 commencement of operations.
Portfolio Total Return**
FOR PERIODS
ENDED
6/30/18 | | FUND | | MSCI
INDEX | | S&P
GLOBAL
INDEX | |
SIX MONTHS | | | (3.60 | )% | | | 0.43 | % | | | (3.06 | )% | |
ONE YEAR | | | 0.60 | % | | | 11.09 | % | | | 1.82 | % | |
FIVE YEAR
AVERAGE | | | 8.98 | % | | | 9.94 | % | | | 8.04 | % | |
AVERAGE
ANNUAL
SINCE
INCEPTION | | | 9.97 | % | | | 10.92 | % | | | 8.31 | % | |
Institutional Class Expenses | |
GROSS EXPENSE RATIO | | | 0.84 | % | |
NET EXPENSE RATIO | | | 0.71 | % | |
This chart assumes an initial gross investment of $100,000 made on 1/18/12 (commencement of operations). Returns shown include the reinvestment of all distributions. Past performance is not predictive of future results. Investment return and principal value will fluctuate so that shares, when redeemed, may be worth more or less than the original cost. In the absence of existing fee waivers, total return would be reduced. To receive current to the most recent month-end performance, please call 1-888-825-2100.
The MSCI World Index (Net) represents large and mid cap equities across 23 Developed Markets countries and covers approximately 85% of the free float-adjusted market capitalization in each country. The S&P Global Infrastructure Index is a global developed markets infrastructure and utilities benchmark. Neither index reflects investment management fees, brokerage commissions or other expenses associated with investing in equity securities. A direct investment in an index is not possible.
Frontegra Asset Management, Inc. has contractually agreed through October 31, 2020, to waive its management fee and/or reimburse the Fund's operating expenses to the extent necessary to ensure that the Fund's total operating expenses (excluding taxes, interest, brokerage commissions, acquired fund fees and expenses and extraordinary expenses) do not exceed 0.70% of the Fund's average daily net assets. The expense ratios presented are based on the annualized expense ratios as reported in the Fund's current prospectus, which may differ from the expense ratios presented in the Fund's financial highlights.
** The returns shown do not reflect the deduction of taxes that a shareholder would pay on Fund distributions or the redemption of Fund shares.
The above graph relates to Institutional Class shares of the Fund. Performance for Service Class shares will vary from the performance of the Institutional Class shares shown above due to differences in expenses.
page 12

FRONTIER
TIMPANI SMALL CAP GROWTH FUND

REPORT FROM TIMPANI CAPITAL MANAGEMENT LLC
Dear Fellow Shareholders:
The Frontier Timpani Small Cap Growth Fund strives to achieve capital appreciation by investing in a diversified portfolio of growth companies with small market capitalizations. Timpani seeks to:
• Invest in companies where growth is robust, sustainable and underestimated by the market.
• Conduct fundamental research that provides unique insights into the growth gap that exists between market expectations and a company's true growth rate.
• Manage risk by continuously evaluating the size of the growth gap relative to market expectations and monitoring market sentiment.
• Act on new relevant incremental data points, both positive and negative, in an effort to exploit investor biases.
Performance Review
For the year ended June 30, 2018, the Frontier Timpani Small Cap Growth Fund (Institutional Class) outperformed its benchmark, the Russell 2000® Growth Index, returning 35.48% (net of fees) vs. 21.86% for the benchmark.
Timpani's disciplined stock selection process generated several more winners than losers during the period. This, along with a positive environment for growth stocks in general combined to generate impressive absolute and relative performance. We continue to see strong fundamental momentum within the Timpani portfolio.
Detailed attribution analysis of the portfolio suggests both stock selection and sector allocation contributed positively, however, stock selection drove the bulk of the upside. Technology and Consumer Discretionary stock selection were the biggest contributors to the upside while Health Care stock selection was the largest detractor.
The top two individual contributors came from two different sectors. Leading the way was Chegg, a Consumer Discretionary company targeting the education market. Chegg's subscription services give students a learning edge and investors a stream of fast-growing and highly visible revenues and cash flows. We think Chegg's growth has legs as it has penetrated less than 15% of U.S. college undergraduates, is growing its revenue per student with additional services, and is expanding into new markets. Another winner was Technology stock, Varonis Systems. Varonis provides security software solutions to companies looking for data protection, a key issue given numerous high-profile corporate data breaches and increasing regulatory scrutiny. Negative outliers included Financial Services stock, Health Insurance Innovations and Health Care stock, Amedisys. Both went through periods of fundamental choppiness and both were sold from the portfolio as a result.
Regarding sector positioning, we ended the quarter with notable overweights in Technology and Consumer Discretionary and underweights in Financial Services, Producer Durables, and Materials & Processing. Technology continues to have the strongest fundamental momentum in the economy. Our exposure within Technology is mostly to software, which has a strong secular growth profile.
Portfolio Outlook
During the period, growth outperformed value and small caps outperformed mid and large caps. For 2018, we believe all domestic equity asset classes should perform well, but are especially upbeat on the prospects for small caps based on where we are in the stock market cycle and on recently approved tax reform, which disproportionately benefits small companies. In addition, given their mostly domestic exposure, we see small caps as a safe-haven from the uncertainty being created by changes in trade policy and a strong dollar. Further, it is important to note that small cap stocks went through a bear market in late-2015 / early-2016, thus, are at a less mature stage of their
page 14

current bull market relative to large cap stocks. Finally, despite outperformance year-to-date, small cap growth stocks still look modestly inexpensive versus small cap value stocks, potentially boding well for future small cap growth stock returns.
As stated, we believe the outlook for small cap growth stocks is strong, and the outlook for Timpani is equally robust. In recent months, the overall stock market has shifted from being driven by easy monetary policy to being driven by earnings momentum. For most of 2017 and 2018 year-to-date, we saw stocks show high sensitivity to company-specific earnings reports, both good and bad. This is great news for Timpani given in 2017 and thus far in 2018, Timpani tended to be skilled at predicting company-specific positive earnings surprise. As long as the market keeps rewarding positive earnings reports, we think Timpani will be well-positioned to outperform.
In conclusion, we are bullish on Timpani's prospects and remain committed to our long-term approach of investing in companies with fundamental momentum. We seek companies with a sustained, underestimated growth profile and overlay that approach with an unemotional, value-added sell discipline. We believe this process creates the most value for our mutual fund shareholders.
Thank you for your continued interest, support, and trust.
Sincerely,
Brandon M. Nelson, CFA
Chief Investment Officer
Timpani Capital Management LLC
page 15

INVESTMENT HIGHLIGHTS
Growth of a $100,000 Investment (Unaudited)

* 3/23/11 commencement of operations.
Portfolio Total Return**
FOR PERIODS ENDED 6/30/18 | | FUND | | INDEX | |
SIX MONTHS | | | 18.41 | % | | | 9.70 | % | |
ONE YEAR | | | 35.48 | % | | | 21.86 | % | |
FIVE YEAR
AVERAGE ANNUAL | | | 14.50 | % | | | 13.65 | % | |
AVERAGE ANNUAL
SINCE INCEPTION | | | 14.05 | % | | | 12.63 | % | |
Institutional Class Expenses | |
GROSS EXPENSE RATIO | | | 1.36 | % | |
NET EXPENSE RATIO | | | 1.10 | % | |
This chart assumes an initial gross investment of $100,000 made on 3/23/11. Returns shown include the reinvestment of all distributions. Past performance is not predictive of future results. Investment return and principal value will fluctuate so that shares, when redeemed, may be worth more or less than the original cost. In the absence of fee waivers, total return would be reduced. To receive current to the most recent month-end performance, please call 1-888-825-2100.
The Russell 2000® Growth Index measures the performance of the small-cap growth segment of the U.S. equity universe. The index does not reflect investment management fees, brokerage commissions and other expenses associated with investing in equity securities. A direct investment in the index is not possible.
Timpani Capital Management LLC has contractually agreed through October 31, 2020, to waive its management fee and/or reimburse the Fund's operating expenses to the extent necessary to ensure that the Fund's total operating expenses (excluding taxes, interest, brokerage commissions, acquired fund fees and expenses and extraordinary expenses) do not exceed 1.10% of the Fund's average daily net assets of the Institutional Class. The expense ratios presented are based on the annualized expense ratios as reported in the Fund's current prospectus, which may differ from the expense ratios presented in the Fund's financial highlights.
** The returns shown do not reflect the deduction of taxes that a shareholder would pay on Fund distributions or the redemption of Fund shares.
The above graph relates to Institutional Class shares of the Fund. Performance for Service Class and Class Y shares will vary from the performance of the Institutional Class shares shown above due to differences in expenses.
page 16

FRONTIER
PHOCAS SMALL CAP VALUE FUND

REPORT FROM PHOCAS FINANCIAL CORPORATION
Dear Fellow Shareholders:
The Frontier Phocas Small Cap Value Fund strives to achieve long-term total investment return through capital appreciation by investing in a diversified portfolio of equity securities of companies with small market capitalizations. The Fund's performance is measured against the Russell 2000® Value Index.
Performance Review
For the twelve-month period ended June 30, 2018, the Frontier Phocas Small Cap Value Fund (Institutional Class) returned 12.52%, net of fees, compared to the 13.10% return of the benchmark, the Russell 2000 Value Index (the "Benchmark").
Portfolio Review and Strategy
The stronger economy had investors seeking faster growing companies across many parts of the economy over the last twelve months while more stable, slower growing companies were laggards. The best performing sector was Health Care, led by sizable gains from the biotechnology group. Many companies in this group are using genetics to discover new medicines to combat a myriad of cancers and diseases. Energy was another leading area as OPEC cut the supply of oil, and other producers such as Venezuela and Iran are hobbled, all the while world demand for the commodity continues to be strong. Industrials and Materials generated healthy gains as the continued global expansion increases demand for companies in these sectors, especially for those in transportation, paper, metals, and coal. Lagging sectors, but still positive, were Real Estate and Utilities, two sectors that many investors consider to be particularly sensitive to a rise in interest rates.
For the year ended June 30, sectors in the Benchmark which contributed positively to the Fund's performance versus the Benchmark were Materials, Real Estate, Consumer Discretionary, Industrials, and Consumer Staples. Within Materials, KapStone Paper and Packaging was acquired at a significant premium which drove the outperformance in this sector. The Real Estate performance was driven by National Storage Affiliates, a storage REIT, and by hotel owner Summit Hotel Properties. Within Consumer Discretionary, a strong run-up in G-III Apparel Group and large gains from recently acquired SeaWorld Entertainment were behind this sector's outperformance versus the benchmark. The outperformance in the Industrials sector resulted partially from General Cable, a company in the portfolio that received an acquisition offer, but also from stronger results from Kadant, supplier of parts to the papermaking industry. Cargo plane lessor Atlas Air Worldwide was another strong performer for the period. The winner in Consumer Staples was USANA Health Sciences, provider of nutritional products primarily in Asia. USANA is experiencing strong demand from consumers seeing the value in USANA's nutritional supplements and healthy foods.
On the other hand, Health Care and Energy were underperforming sectors for the Fund. Most of the Energy sector's underperformance came from declines in Callon Petroleum, Ring Energy, Basic Energy, and C&J Energy Services, all of which are (or are perceived to be) sensitive to conditions in the Permian Basin. While extraction of energy is robust, crude pricing within the Permian is weaker than other producing areas because of insufficient infrastructure to take the oil and gas to market. We believe current pipeline expansion plans will alleviate this short-term situation, and investors will move back into the Permian based energy companies as they continue to have the best prospects and lowest peer valuations. Health Care's underperformance was partially driven by a 2% underweight versus the Benchmark, but also due to our unwillingness to own biotechnology stocks with no earnings and little, if any, revenues. These were the stocks that skyrocketed for the Benchmark, 16 of which experienced triple digit gains. Gene technology is making significant strides to the point that it may be possible soon to reliably kill certain niche forms of cancer. In our minds, it is extremely difficult to be able to pick the winners, so choosing stocks in the biotechnology sector is fraught with peril.
Because it is quite difficult, if not impossible, to time markets or sectors on a consistent basis, our core investment strategy remains to concentrate on identifying undervalued stocks in each sector. We believe that this will continue to be the best strategy, longer-term.
page 18

Looking ahead, we see an economy that is likely to continue expanding at least through 2018 and likely into 2019. Stocks have gotten modestly expensive in certain areas including Health Care and Industrials, while the defensives Utilities and Consumer Staples also trade at loftier prices as they often do. Real Estate and Energy offer better values today, but as always, the best opportunities are found in stock specific situations across all economic sectors where the market is failing to notice brighter futures.
Thank you for your continued support.
William Schaff, CFA | | Steve Block, CFA | |
Chief Executive Officer and Portfolio Manager | | Portfolio Manager | |
Phocas Financial Corporation | | Phocas Financial Corporation | |
page 19

INVESTMENT HIGHLIGHTS
Growth of a $100,000 Investment (Unaudited)

Portfolio Total Return*
FOR PERIODS ENDED 6/30/18 | | FUND | | INDEX | |
SIX MONTHS | | | 3.61 | % | | | 5.44 | % | |
ONE YEAR | | | 12.52 | % | | | 13.10 | % | |
FIVE YEAR
AVERAGE ANNUAL | | | 11.97 | % | | | 11.18 | % | |
TEN YEAR
AVERAGE ANNUAL | | | 11.13 | % | | | 9.88 | % | |
Institutional Class Expenses | |
GROSS EXPENSE RATIO | | | 1.45 | % | |
NET EXPENSE RATIO | | | 0.95 | % | |
This chart assumes an initial gross investment of $100,000 made on 6/30/08. Returns shown include the reinvestment of all distributions. Past performance is not predictive of future results. Investment return and principal value will fluctuate so that shares, when redeemed, may be worth more or less than the original cost. In the absence of fee waivers, total return would be reduced. Effective October 8, 2010, Phocas Financial Corp. ("Phocas") became subadviser to the Fund and Frontegra Asset Management, Inc. became adviser to the Fund. Prior to October 8, 2010, Phocas served as adviser to the Fund. To receive current to the most recent month-end performance, please call 1-888-825-2100.
The Russell 2000® Value Index measures the performance of those Russell 2000® companies with lower price-to-book ratios and lower forecasted growth values. The index does not reflect investment management fees, brokerage commissions and other expenses associated with investing in equity securities. A direct investment in the index is not possible.
Frontegra Asset Management, Inc. has contractually agreed through October 31, 2020, to waive its management fee and/or reimburse the Fund's operating expenses to the extent necessary to ensure that the Fund's total operating expenses (excluding taxes, interest, brokerage commissions, acquired fund fees and expenses and extraordinary expenses) do not exceed 0.95% of the Fund's average daily net assets. The expense ratios presented are based on the annualized expense ratios as reported in the Fund's current prospectus, which may differ from the expense ratios presented in the Fund's financial highlights.
* The returns shown do not reflect the deduction of taxes that a shareholder would pay on Fund distributions or the redemption of Fund shares.
The above graph relates to Institutional Class shares of the Fund. Performance for Service Class shares will vary from the performance of the Institutional Class shares shown above due to differences in expenses.
page 20

Frontier Funds
EXPENSE EXAMPLE
June 30, 2018 (Unaudited)
As a shareholder of a mutual fund, you incur two types of costs: (1) transaction costs, including redemption fees, and (2) ongoing costs, including management fees, distribution and/or service (12b-1) fees and other fund expenses. Although the Funds charge no sales loads, you will be assessed fees for outgoing wire transfers, returned checks and stop payment orders at prevailing rates charged by U.S. Bancorp Fund Services, LLC, the Funds' transfer agent. If you request that a redemption be made by wire transfer, currently the Funds' transfer agent charges a $15.00 fee. A redemption fee of 2.00% of the then current value of the shares redeemed may be imposed on certain redemptions of shares made within 30 days of purchase for the Frontier MFG Global Equity, Frontier MFG Global Plus and Frontier MFG Core Infrastructure Funds.
This Example is intended to help you understand your ongoing costs (in dollars) of investing in the Funds and to compare these costs with the ongoing costs of investing in other mutual funds. The Example is based on an investment of $1,000 invested at the beginning of the period and held for the entire period (1/1/18 – 6/30/18).
Actual Expenses
The first line of the table on the following page for each Fund provides information about actual account values and actual expenses. The Example includes management fees, registration fees, fee waivers/reimbursements and other expenses. However, the Example does not include portfolio trading commissions and related expenses and other extraordinary expenses as determined under generally accepted accounting principles. You may use the information in this line, together with the amount you invested, to estimate the expenses that you paid over the period. Simply divide your account value by $1,000 (for example, an $8,600 account value divided by $1,000 = 8.6), then multiply the result by the number in the first line under the heading entitled "Expenses Paid During the Period" to estimate the expenses you paid on your account during this period.
Hypothetical Example for Comparison Purposes
The second line of the table for each Fund provides information about hypothetical account values and hypothetical expenses based on each of the Fund's actual expense ratios and an assumed rate of return of 5% per year before expenses, which is not the actual return. The hypothetical account values and expenses may not be used to estimate the actual ending account balance or expenses you paid for the period. You may use this information to compare the ongoing costs of investing in each of the Funds and other funds. To do so, compare this 5% hypothetical example with the 5% hypothetical examples that appear in the shareholder reports of the other funds.
Please note that the expenses shown in the table are meant to highlight your ongoing costs only and do not reflect any transactional costs, such as redemption fees. Therefore, the second line of the table is useful in comparing ongoing costs only, and will not help you determine the relative total costs of owning different funds. In addition, if these transactional costs were included, your costs could have been higher.
page 21

Frontier Funds
EXPENSE EXAMPLE (continued)
June 30, 2018 (Unaudited)
| | Beginning Account
Value 1/1/2018 | | Ending Account
Value 6/30/2018 | | Annualized
Expense Ratio* | | Expenses Paid
During the Period* | |
MFG Global Equity Fund –
Institutional Class | |
Actual Fund Return | | $ | 1,000.00 | | | $ | 1,028.90 | | | | 0.80 | % | | $ | 4.02 | | |
Hypothetical 5% Return | | $ | 1,000.00 | | | $ | 1,020.83 | | | | 0.80 | % | | $ | 4.01 | | |
MFG Global Plus Fund –
Institutional Class | |
Actual Fund Return | | $ | 1,000.00 | | | $ | 1,026.60 | | | | 0.80 | % | | $ | 4.02 | | |
Hypothetical 5% Return | | $ | 1,000.00 | | | $ | 1,020.83 | | | | 0.80 | % | | $ | 4.01 | | |
MFG Global Plus Fund –
Service Class | |
Actual Fund Return | | $ | 1,000.00 | | | $ | 1,026.60 | | | | 0.88 | % | | $ | 4.40 | | |
Hypothetical 5% Return | | $ | 1,000.00 | | | $ | 1,020.45 | | | | 0.88 | % | | $ | 4.39 | | |
MFG Core Infrastructure
Fund – Institutional Class | |
Actual Fund Return | | $ | 1,000.00 | | | $ | 964.00 | | | | 0.70 | % | | $ | 3.41 | | |
Hypothetical 5% Return | | $ | 1,000.00 | | | $ | 1,021.32 | | | | 0.70 | % | | $ | 3.51 | | |
MFG Core Infrastructure
Fund – Service Class | |
Actual Fund Return | | $ | 1,000.00 | | | $ | 965.00 | | | | 0.80 | % | | $ | 3.90 | | |
Hypothetical 5% Return | | $ | 1,000.00 | | | $ | 1,020.83 | | | | 0.80 | % | | $ | 4.01 | | |
Timpani Small Cap Growth
Fund – Institutional Class | |
Actual Fund Return | | $ | 1,000.00 | | | $ | 1,184.10 | | | | 1.10 | % | | $ | 5.96 | | |
Hypothetical 5% Return | | $ | 1,000.00 | | | $ | 1,019.34 | | | | 1.10 | % | | $ | 5.51 | | |
Timpani Small Cap Growth
Fund – Service Class | |
Actual Fund Return | | $ | 1,000.00 | | | $ | 1,183.20 | | | | 1.20 | % | | $ | 6.49 | | |
Hypothetical 5% Return | | $ | 1,000.00 | | | $ | 1,018.85 | | | | 1.20 | % | | $ | 6.00 | | |
Timpani Small Cap Growth
Fund – Class Y | |
Actual Fund Return | | $ | 1,000.00 | | | $ | 1,181.30 | | | | 1.50 | % | | $ | 8.11 | | |
Hypothetical 5% Return | | $ | 1,000.00 | | | $ | 1,017.36 | | | | 1.50 | % | | $ | 7.50 | | |
* Expenses are equal to each Fund's annualized expense ratio indicated above, multiplied by the average account value over the period, multiplied by 181/365 to reflect the one-half year period.
page 22

Frontier Funds
EXPENSE EXAMPLE (continued)
June 30, 2018 (Unaudited)
| | | Beginning Account
Value 1/1/2018 | | Ending Account
Value 6/30/2018 | | Annualized
Expense Ratio* | | Expenses Paid
During the Period* | |
Phocas Small Cap Value
Fund – Institutional Class | |
Actual Fund Return | | $ | 1,000.00 | | | $ | 1,036.10 | | | | 0.95 | % | | $ | 4.80 | | |
Hypothetical 5% Return | | $ | 1,000.00 | | | $ | 1,020.08 | | | | 0.95 | % | | $ | 4.76 | | |
Phocas Small Cap Value
Fund – Service Class | |
Actual Fund Return | | $ | 1,000.00 | | | $ | 1,036.20 | | | | 0.95 | % | | $ | 4.80 | | |
Hypothetical 5% Return | | $ | 1,000.00 | | | $ | 1,020.08 | | | | 0.95 | % | | $ | 4.76 | | |
* Expenses are equal to each Fund's annualized expense ratio indicated above, multiplied by the average account value over the period, multiplied by 181/365 to reflect the one-half year period.
page 23

Frontier MFG Global Equity Fund
SCHEDULE OF INVESTMENTS
June 30, 2018
Number of Shares | | | | Value | |
COMMON STOCKS 81.8% | | | |
| | | Germany 3.2% | |
| | 312,106 | | | SAP SE | | $ | 36,022,628 | | |
| | | Switzerland 6.0% | |
| | 435,589 | | | Nestle SA | | | 33,758,517 | | |
| | 426,775 | | | Novartis AG | | | 32,328,609 | | |
| | | | 66,087,126 | | |
| | | United Kingdom 2.6% | |
| | 3,086,493 | | | Lloyds Banking Group PLC | | | 2,560,915 | | |
| | 326,633 | | | Reckitt Benckiser Group PLC | | | 26,837,720 | | |
| | | | 29,398,635 | | |
| | | United States 70.0% | |
| | 8,160 | | | Alphabet, Inc. - Class A (a) | | | 9,214,190 | | |
| | 59,763 | | | Alphabet, Inc. - Class C (a) | | | 66,674,603 | | |
| | 305,501 | | | Apple, Inc. | | | 56,551,290 | | |
| | 115,363 | | | Costco Wholesale Corp. | | | 24,108,560 | | |
| | 309,123 | | | Crown Castle International
Corp. | | | 33,329,642 | | |
| | 678,311 | | | eBay, Inc. (a) | | | 24,595,557 | | |
| | 374,978 | | | Facebook, Inc. - Class A (a) | | | 72,865,725 | | |
| | 363,031 | | | HCA Healthcare, Inc. | | | 37,246,981 | | |
| | 574,581 | | | Lowe's Companies, Inc. | | | 54,912,706 | | |
| | 211,642 | | | Mastercard, Inc. - Class A | | | 41,591,886 | | |
| | 172,648 | | | McDonald's Corp. | | | 27,052,215 | | |
| | 415,184 | | | Microsoft Corp. | | | 40,941,294 | | |
| | 778,944 | | | Oracle Corp. | | | 34,320,273 | | |
| | 939,909 | | | Starbucks Corp. | | | 45,914,555 | | |
| | 958,587 | | | The Kraft Heinz Co. | | | 60,218,435 | | |
| | 433,752 | | | Visa, Inc. - Class A | | | 57,450,452 | | |
| | 887,025 | | | Wells Fargo & Co. | | | 49,176,666 | | |
| | 457,764 | | | Yum! Brands, Inc. | | | 35,806,300 | | |
| | | | 771,971,330 | | |
| | | Total Common Stocks | |
| | | | | (Cost $620,703,957) | | | 903,479,719 | | |
Number of Shares | | | | Value | |
SHORT-TERM INVESTMENTS 18.0% | |
| | | Investment Company 18.0% | |
| | 198,221,662 | | | Morgan Stanley Institutional
Liquidity Funds -
Government Portfolio -
Institutional Class, 1.82% | | $ | 198,221,662 | | |
| | | Total Short-Term Investments | |
| | | (Cost $198,221,662) | | | 198,221,662 | | |
| | | Total Investments 99.8% | |
| | | (Cost $818,925,619) | | | 1,101,701,381 | | |
| | | Other Assets in Excess of
Liabilities 0.2% | | | 1,819,210 | | |
| | | TOTAL NET ASSETS 100.0% | | $ | 1,103,520,591 | | |
(a) Non-Income Producing.
PORTFOLIO DIVERSIFICATION
Sectors | | Percentage | |
Information Technology | | | 39.9 | % | |
Consumer Discretionary | | | 14.8 | | |
Consumer Staples | | | 13.1 | | |
Health Care | | | 6.3 | | |
Financials | | | 4.7 | | |
Real Estate | | | 3.0 | | |
Total Common Stocks | | | 81.8 | | |
Total Short-Term Investments | | | 18.0 | | |
Total Investments | | | 99.8 | | |
Other Assets in Excess of Liabilities | | | 0.2 | | |
Total Net Assets | | | 100.0 | % | |
The accompanying notes are an integral part of these financial statements.
page 24

Frontier MFG Global Plus Fund
SCHEDULE OF INVESTMENTS
June 30, 2018
Number of Shares | | | | Value | |
COMMON STOCKS 81.6% | | | |
| | | Germany 3.3% | |
| | 117,510 | | | SAP SE | | $ | 13,562,761 | | |
| | | Switzerland 5.9% | |
| | 163,854 | | | Nestle SA | | | 12,698,824 | | |
| | 158,622 | | | Novartis AG | �� | | 12,015,766 | | |
| | | | 24,714,590 | | |
| | | United Kingdom 2.6% | |
| | 1,224,939 | | | Lloyds Banking Group PLC | | | 1,016,352 | | |
| | 121,874 | | | Reckitt Benckiser Group PLC | | | 10,013,747 | | |
| | | | 11,030,099 | | |
| | | United States 69.8% | |
| | 3,016 | | | Alphabet, Inc. - Class A (a) | | | 3,405,637 | | |
| | 22,389 | | | Alphabet, Inc. - Class C (a) | | | 24,978,288 | | |
| | 114,990 | | | Apple, Inc. | | | 21,285,799 | | |
| | 43,035 | | | Costco Wholesale Corp. | | | 8,993,454 | | |
| | 115,954 | | | Crown Castle International
Corp. | | | 12,502,160 | | |
| | 252,890 | | | eBay, Inc. (a) | | | 9,169,791 | | |
| | 140,489 | | | Facebook, Inc. - Class A (a) | | | 27,299,823 | | |
| | 136,853 | | | HCA Healthcare, Inc. | | | 14,041,118 | | |
| | 215,768 | | | Lowe's Companies, Inc. | | | 20,620,948 | | |
| | 79,742 | | | Mastercard, Inc. - Class A | | | 15,670,898 | | |
| | 64,733 | | | McDonald's Corp. | | | 10,143,014 | | |
| | 156,013 | | | Microsoft Corp. | | | 15,384,442 | | |
| | 293,654 | | | Oracle Corp. | | | 12,938,396 | | |
| | 352,309 | | | Starbucks Corp. | | | 17,210,295 | | |
| | 359,898 | | | The Kraft Heinz Co. | | | 22,608,792 | | |
| | 162,825 | | | Visa, Inc. - Class A | | | 21,566,171 | | |
| | 332,977 | | | Wells Fargo & Co. | | | 18,460,245 | | |
| | 171,847 | | | Yum! Brands, Inc. | | | 13,441,872 | | |
| | | | 289,721,143 | | |
| | | Total Common Stocks | |
| | | | | (Cost $278,149,472) | | | 339,028,593 | | |
Number of Shares | | | | Value | |
SHORT-TERM INVESTMENTS 18.3% | |
| | | Investment Company 18.3% | |
| | 75,868,492 | | | Morgan Stanley Institutional
Liquidity Funds -
Government Portfolio -
Institutional Class, 1.82% | | $ | 75,868,492 | | |
| | | Total Short-Term Investments | |
| | | (Cost $75,868,492) | | | 75,868,492 | | |
| | | Total Investments 99.9% | |
| | | (Cost $354,017,964) | | | 414,897,085 | | |
| | | Other Assets in Excess of
Liabilities 0.1% | | | 240,041 | | |
| | | TOTAL NET ASSETS 100.0% | | $ | 415,137,126 | | |
(a) Non-Income Producing.
PORTFOLIO DIVERSIFICATION
Sectors | | Percentage | |
Information Technology | | | 39.8 | % | |
Consumer Discretionary | | | 14.8 | | |
Consumer Staples | | | 13.1 | | |
Health Care | | | 6.2 | | |
Financials | | | 4.7 | | |
Real Estate | | | 3.0 | | |
Total Common Stocks | | | 81.6 | | |
Total Short-Term Investments | | | 18.3 | | |
Total Investments | | | 99.9 | | |
Other Assets in Excess of Liabilities | | | 0.1 | | |
Total Net Assets | | | 100.0 | % | |
The accompanying notes are an integral part of these financial statements.
page 25

Frontier MFG Core Infrastructure Fund
SCHEDULE OF INVESTMENTS
June 30, 2018
Number of Shares | | | | Value | |
COMMON STOCKS 97.0% | | | |
| | | Australia 8.2% | |
| | 764,307 | | | APA Group | | $ | 5,568,301 | | |
| | 434,003 | | | Atlas Arteria Ltd. | | | 2,065,213 | | |
| | 2,385,248 | | | AusNet Services | | | 2,832,969 | | |
| | 1,088,691 | | | Spark Infrastructure Group | | | 1,836,634 | | |
| | 1,593,796 | | | Sydney Airport | | | 8,437,469 | | |
| | 1,303,614 | | | Transurban Group | | | 11,543,910 | | |
| | | | 32,284,496 | | |
| | | Canada 12.4% | |
| | 130,008 | | | Canadian Utilities Ltd. - Class A | | | 3,283,205 | | |
| | 148,495 | | | Emera, Inc. | | | 4,834,432 | | |
| | 363,180 | | | Enbridge, Inc. | | | 12,984,034 | | |
| | 299,208 | | | Fortis, Inc. | | | 9,563,549 | | |
| | 386,013 | | | Hydro One Ltd. | | | 5,884,228 | | |
| | 269,518 | | | TransCanada Corp. | | | 11,661,038 | | |
| | 12,902 | | | Valener, Inc. | | | 198,440 | | |
| | | | 48,408,926 | | |
| | | France 4.4% | |
| | 54,163 | | | Aeroports de Paris | | | 12,234,914 | | |
| | 356,275 | | | Getlink | | | 4,884,489 | | |
| | | | 17,119,403 | | |
| | | Germany 1.5% | |
| | 59,899 | | | Fraport AG Frankfurt Airport
Services Worldwide | | | 5,762,566 | | |
| | | Hong Kong 2.7% | |
| | 1,509,428 | | | Power Assets Holdings Ltd. | | | 10,552,683 | | |
| | | Italy 9.4% | |
| | 420,709 | | | Atlantia SpA | | | 12,403,445 | | |
| | 368,855 | | | Enav SpA | | | 1,845,309 | | |
| | 533,930 | | | Italgas SpA | | | 2,938,722 | | |
| | 2,453,739 | | | Snam SpA | | | 10,225,737 | | |
| | 147,396 | | | Societa Iniziative Autostradali
e Servizi SpA | | | 2,211,219 | | |
Number of Shares | | | | Value | |
| | | Italy 9.4% (continued) | |
| | 1,302,018 | | | Terna Rete Elettrica
Nazionale SpA | | $ | 7,031,783 | | |
| | | | 36,656,215 | | |
| | | Mexico 1.8% | |
| | 209,270 | | | Grupo Aeroportuario del Centro
Norte SAB de CV | | | 1,092,911 | | |
| | 314,639 | | | Grupo Aeroportuario del Pacifico
SAB de CV - Class B | | | 2,919,800 | | |
| | 182,805 | | | Grupo Aeroportuario del Sureste
SAB de CV - Class B | | | 2,904,041 | | |
| | | | 6,916,752 | | |
| | | Netherlands 1.0% | |
| | 82,809 | | | Koninklijke Vopak NV | | | 3,816,831 | | |
| | | New Zealand 1.3% | |
| | 793,976 | | | Auckland International
Airport Ltd. | | | 3,642,999 | | |
| | 602,680 | | | Vector Ltd. | | | 1,383,099 | | |
| | | | 5,026,098 | | |
| | | Portugal 0.3% | |
| | 440,253 | | | REN - Redes Energeticas
Nacionais SGPS SA | | | 1,231,644 | | |
| | | Spain 6.9% | |
| | 63,478 | | | Aena SME SA | | | 11,492,515 | | |
| | 150,079 | | | Cellnex Telecom SA | | | 3,773,211 | | |
| | 154,646 | | | Enagas SA | | | 4,510,451 | | |
| | 350,497 | | | Red Electrica Corp SA | | | 7,120,713 | | |
| | | | 26,896,890 | | |
| | | Switzerland 1.0% | |
| | 19,888 | | | Flughafen Zuerich AG | | | 4,046,514 | | |
| | | United Kingdom 5.8% | |
| | 1,024,140 | | | National Grid PLC | | | 11,317,828 | | |
| | 271,878 | | | Pennon Group PLC | | | 2,843,308 | | |
The accompanying notes are an integral part of these financial statements.
page 26

Frontier MFG Core Infrastructure Fund
SCHEDULE OF INVESTMENTS (continued)
June 30, 2018
Number of Shares | | | | Value | |
| COMMON STOCKS 97.0% (continued) | | | |
| | | United Kingdom 5.8% (continued) | |
| | 153,257 | | | Severn Trent PLC | | $ | 3,995,984 | | |
| | 441,684 | | | United Utilities Group PLC | | | 4,440,374 | | |
| | | | 22,597,494 | | |
| | | United States 40.3% | |
| | 13,265 | | | ALLETE, Inc. | | | 1,026,844 | | |
| | 68,684 | | | Alliant Energy Corp. | | | 2,906,707 | | |
| | 72,090 | | | Ameren Corp. | | | 4,386,676 | | |
| | 114,222 | | | American Electric Power Co., Inc. | | | 7,909,873 | | |
| | 8,650 | | | American States Water Co. | | | 494,434 | | |
| | 56,091 | | | American Tower Corp. | | | 8,086,639 | | |
| | 52,377 | | | American Water Works Co., Inc. | | | 4,471,948 | | |
| | 56,416 | | | Aqua America, Inc. | | | 1,984,715 | | |
| | 32,909 | | | Atmos Energy Corp. | | | 2,966,417 | | |
| | 16,995 | | | Avista Corp. | | | 894,957 | | |
| | 13,884 | | | Black Hills Corp. | | | 849,840 | | |
| | 8,881 | | | California Water Service Group | | | 345,915 | | |
| | 84,106 | | | CMS Energy Corp. | | | 3,976,532 | | |
| | 91,408 | | | Consolidated Edison, Inc. | | | 7,127,996 | | |
| | 74,520 | | | Crown Castle International Corp. | | | 8,034,746 | | |
| | 120,913 | | | Dominion Energy Corp. | | | 8,243,848 | | |
| | 53,387 | | | DTE Energy Co. | | | 5,532,495 | | |
| | 100,587 | | | Duke Energy Corp. | | | 7,954,420 | | |
| | 95,844 | | | Edison International | | | 6,064,050 | | |
| | 10,449 | | | El Paso Electric Co. | | | 617,536 | | |
| | 80,525 | | | Evergy, Inc. | | | 4,521,479 | | |
| | 93,219 | | | Eversource Energy | | | 5,463,566 | | |
| | 15,008 | | | IDACORP, Inc. | | | 1,384,338 | | |
| | 7,850 | | | InfraREIT, Inc. | | | 174,035 | | |
| | 100,146 | | | NiSource, Inc. | | | 2,631,837 | | |
| | 8,491 | | | Northwest Natural Gas Co. | | | 541,726 | | |
| | 14,596 | | | NorthWestern Corp. | | | 835,621 | | |
| | 13,556 | | | ONE Gas, Inc. | | | 1,013,175 | | |
| | 151,919 | | | PG&E Corp. | | | 6,465,673 | | |
Number of Shares | | | | Value | |
| | | United States 40.3% (continued) | |
| | 33,253 | | | Pinnacle West Capital Corp. | | $ | 2,678,862 | | |
| | 23,705 | | | PNM Resources, Inc. | | | 922,124 | | |
| | 28,292 | | | Portland General Electric Co. | | | 1,209,766 | | |
| | 220,186 | | | PPL Corp. | | | 6,286,310 | | |
| | 33,885 | | | SBA Communications Corp. (a) | | | 5,595,091 | | |
| | 42,414 | | | SCANA Corp. | | | 1,633,787 | | |
| | 77,633 | | | Sempra Energy | | | 9,013,968 | | |
| | 4,152 | | | SJW Group | | | 274,945 | | |
| | 15,283 | | | Southwest Gas Holdings, Inc. | | | 1,165,634 | | |
| | 15,331 | | | Spire, Inc. | | | 1,083,135 | | |
| | 172,860 | | | The Southern Co. | | | 8,005,147 | | |
| | 92,823 | | | WEC Energy Group, Inc. | | | 6,001,007 | | |
| | 149,692 | | | Xcel Energy, Inc. | | | 6,837,931 | | |
| | | | 157,615,745 | | |
| | | Total Common Stocks | |
| | | | | (Cost $354,201,512) | | | 378,932,257 | | |
CLOSED-END FUNDS 1.3% | | | |
| | | Guernsey 0.2% | |
| | 598,379 | | | John Laing Infrastructure
Fund Ltd. | | | 935,526 | | |
| | | United Kingdom 1.1% | |
| | 1,156,881 | | | HICL Infrastructure Co. Ltd. | | | 2,204,989 | | |
| | 1,001,874 | | | International Public
Partnerships Ltd. | | | 1,896,067 | | |
| | | | 4,101,056 | | |
| | | Total Closed-End Funds | |
| | | | | (Cost $5,479,175) | | | 5,036,582 | | |
The accompanying notes are an integral part of these financial statements.
page 27

Frontier MFG Core Infrastructure Fund
SCHEDULE OF INVESTMENTS (continued)
June 30, 2018
Number of Shares | | | | Value | |
SHORT-TERM INVESTMENTS 3.0% | |
| | | Investment Company 3.0% | |
| | 11,821,574 | | | Morgan Stanley Institutional
Liquidity Funds - Government
Portfolio - Institutional
Class, 1.82% | | $ | 11,821,574 | | |
| | | Total Short-Term Investments | |
| | | (Cost $11,821,574) | | | 11,821,574 | | |
| | | Total Investments 101.3% | |
| | | (Cost $371,502,261) | | | 395,790,413 | | |
| | | Liabilities in Excess of
Other Assets (1.3)% | | | (4,987,807 | ) | |
| | | TOTAL NET ASSETS 100.0% | | $ | 390,802,606 | | |
(a) Non-Income Producing.
PORTFOLIO DIVERSIFICATION
Sectors | | Percentage | |
Integrated Power | | | 29.2 | % | |
Transmission & Distribution | | | 16.8 | | |
Airports | | | 13.9 | | |
Energy Infrastructure | | | 8.7 | | |
Gas Utilities | | | 8.6 | | |
Toll Roads | | | 8.5 | | |
Communications | | | 6.5 | | |
Water Utilities | | | 4.8 | | |
Total Common Stocks | | | 97.0 | | |
Social | | | 1.3 | | |
Total Closed-End Funds | | | 1.3 | | |
Total Short-Term Investments | | | 3.0 | | |
Total Investments | | | 101.3 | | |
Liabilities in Excess of Other Assets | | | (1.3 | ) | |
Total Net Assets | | | 100.0 | % | |
The accompanying notes are an integral part of these financial statements.
page 28

Frontier Timpani Small Cap Growth Fund
SCHEDULE OF INVESTMENTS
June 30, 2018
Number of Shares | | | | Value | |
COMMON STOCKS 98.5% | | | |
| | | Consumer Discretionary 24.6% | |
| | 15,371 | | | 2U, Inc. (a) | | $ | 1,284,401 | | |
| | 13,422 | | | Aspen Group, Inc. (a) | | | 100,262 | | |
| | 27,508 | | | At Home Group, Inc. (a) | | | 1,076,938 | | |
| | 10,577 | | | BJ's Restaurants, Inc. | | | 634,620 | | |
| | 2,282 | | | BJ's Wholesale Club Holdings,
Inc. (a) | | | 53,969 | | |
| | 40,298 | | | Boot Barn Holdings, Inc. (a) | | | 836,183 | | |
| | 15,911 | | | Canada Goose Holdings, Inc. (a) | | | 936,362 | | |
| | 22,587 | | | Century Communities, Inc. (a) | | | 712,620 | | |
| | 84,601 | | | Chegg, Inc. (a) | | | 2,351,062 | | |
| | 8,037 | | | Chuy's Holdings, Inc. (a) | | | 246,736 | | |
| | 21,299 | | | Floor & Decor Holdings, Inc. -
Class A (a) | | | 1,050,680 | | |
| | 13,893 | | | Grand Canyon Education, Inc. (a) | | | 1,550,598 | | |
| | 18,759 | | | Instructure, Inc. (a) | | | 798,195 | | |
| | 11,325 | | | Meritor, Inc. (a) | | | 232,955 | | |
| | 51,616 | | | Noodles & Co. (a) | | | 634,877 | | |
| | 16,416 | | | Ollie's Bargain Outlet Holdings,
Inc. (a) | | | 1,190,160 | | |
| | 29,083 | | | Planet Fitness, Inc. - Class A (a) | | | 1,277,907 | | |
| | 16,697 | | | Ruth's Hospitality Group, Inc. | | | 468,351 | | |
| | 11,235 | | | SiteOne Landscape Supply, Inc. (a) | | | 943,403 | | |
| | 8,226 | | | Texas Roadhouse, Inc. | | | 538,885 | | |
| | 9,316 | | | The Children's Place, Inc. | | | 1,125,373 | | |
| | 9,792 | | | The Lovesac Co. (a) | | | 203,184 | | |
| | 4,666 | | | Wingstop, Inc. | | | 243,192 | | |
| | | | 18,490,913 | | |
| | | Consumer Staples 1.3% | |
| | 17,327 | | | Central Garden & Pet Co. (a) | | | 753,378 | | |
| | 13,280 | | | Primo Water Corp. (a) | | | 232,267 | | |
| | | | 985,645 | | |
| | | Energy 2.4% | |
| | 16,070 | | | DMC Global, Inc. | | | 721,543 | | |
| | 36,412 | | | TPI Composites, Inc. (a) | | | 1,064,687 | | |
| | | | 1,786,230 | | |
Number of Shares | | | | Value | |
| | | Financial Services 5.0% | |
| | 21,065 | | | Cadence BanCorp | | $ | 608,147 | | |
| | 26,910 | | | Green Dot Corp. - Class A (a) | | | 1,974,925 | | |
| | 1,630 | | | LendingTree, Inc. (a) | | | 348,494 | | |
| | 8,064 | | | LPL Financial Holdings, Inc. | | | 528,514 | | |
| | 6,721 | | | Triumph Bancorp, Inc. (a) | | | 273,881 | | |
| | | | 3,733,961 | | |
| | | Health Care 23.4% | |
| | 17,110 | | | Addus HomeCare Corp. (a) | | | 979,547 | | |
| | 17,704 | | | AxoGen, Inc. (a) | | | 889,626 | | |
| | 25,560 | | | CareDx, Inc. (a) | | | 312,854 | | |
| | 26,317 | | | Collegium Pharmaceutical, Inc. (a) | | | 627,660 | | |
| | 17,560 | | | Corcept Therapeutics, Inc. (a) | | | 276,043 | | |
| | 9,127 | | | Inogen, Inc. (a) | | | 1,700,634 | | |
| | 7,832 | | | iRadimed Corp. (a) | | | 162,514 | | |
| | 3,469 | | | Jazz Pharmaceuticals PLC (a) | | | 597,709 | | |
| | 15,028 | | | LHC Group, Inc. (a) | | | 1,286,247 | | |
| | 6,340 | | | Ligand Pharmaceuticals, Inc. (a) | | | 1,313,458 | | |
| | 33,789 | | | Merit Medical Systems, Inc. (a) | | | 1,729,997 | | |
| | 6,874 | | | Neurocrine Biosciences, Inc. (a) | | | 675,302 | | |
| | 2,721 | | | Neuronetics, Inc. (a) | | | 72,406 | | |
| | 5,532 | | | Penumbra, Inc. (a) | | | 764,246 | | |
| | 24,231 | | | PetIQ, Inc. (a) | | | 650,845 | | |
| | 54,577 | | | R1 RCM, Inc. (a) | | | 473,728 | | |
| | 15,796 | | | Supernus Pharmaceuticals,
Inc. (a) | | | 945,390 | | |
| | 17,910 | | | Tabula Rasa HealthCare, Inc. (a) | | | 1,143,195 | | |
| | 32,561 | | | Tactile Systems Technology,
Inc. (a) | | | 1,693,172 | | |
| | 11,124 | | | Teladoc, Inc. (a) | | | 645,748 | | |
| | 72,023 | | | Vericel Corp. (a) | | | 698,623 | | |
| | | | 17,638,944 | | |
| | | Materials & Processing 3.5% | |
| | 21,172 | | | Ingevity Corp. (a) | | | 1,711,968 | | |
| | 45,887 | | | PGT Innovations, Inc. (a) | | | 956,744 | | |
| | | | 2,668,712 | | |
The accompanying notes are an integral part of these financial statements.
page 29

Frontier Timpani Small Cap Growth Fund
SCHEDULE OF INVESTMENTS (continued)
June 30, 2018
Number of Shares | | | | Value | |
| COMMON STOCKS 98.5% (continued) | | | |
| | | Producer Durables 10.3% | |
| | 18,632 | | | ACM Research, Inc. -
Class A (a) | | $ | 200,853 | | |
| | 2,607 | | | Barrett Business Services, Inc. | | | 251,758 | | |
| | 25,564 | | | BG Staffing, Inc. | | | 594,363 | | |
| | 8,784 | | | FLIR Systems, Inc. | | | 456,504 | | |
| | 11,330 | | | HEICO Corp. | | | 826,297 | | |
| | 11,215 | | | KMG Chemicals, Inc. | | | 827,443 | | |
| | 7,523 | | | Knight-Swift Transportation
Holdings, Inc. | | | 287,454 | | |
| | 17,342 | | | MasTec, Inc. (a) | | | 880,106 | | |
| | 7,442 | | | NV5 Global, Inc. (a) | | | 515,731 | | |
| | 8,318 | | | Old Dominion Freight Line, Inc. | | | 1,239,049 | | |
| | 85,440 | | | Profire Energy, Inc. (a) | | | 288,787 | | |
| | 7,811 | | | Saia, Inc. (a) | | | 631,519 | | |
| | 47,772 | | | Spartan Motors, Inc. | | | 721,357 | | |
| | | | 7,721,221 | | |
| | | Technology 27.2% | |
| | 60,986 | | | Adesto Technologies Corp. (a) | | | 512,282 | | |
| | 6,362 | | | Altair Engineering, Inc. -
Class A (a) | | | 217,453 | | |
| | 30,562 | | | Apptio, Inc. - Class A (a) | | | 1,106,344 | | |
| | 19,488 | | | Asure Software, Inc. (a) | | | 310,834 | | |
| | 15,316 | | | BlackLine, Inc. (a) | | | 665,174 | | |
| | 16,524 | | | Blucora, Inc. (a) | | | 611,388 | | |
| | 24,254 | | | Bottomline Technologies (de),
Inc. (a) | | | 1,208,577 | | |
| | 21,686 | | | Carbonite, Inc. (a) | | | 756,841 | | |
| | 7,235 | | | Coupa Software, Inc. (a) | | | 450,306 | | |
| | 8,235 | | | Diodes, Inc. (a) | | | 283,860 | | |
| | 13,192 | | | Everbridge, Inc. (a) | | | 625,565 | | |
| | 38,867 | | | Five9, Inc. (a) | | | 1,343,632 | | |
| | 8,519 | | | GTT Communications, Inc. (a) | | | 383,355 | | |
| | 24,826 | | | Mimecast Ltd. (a) | | | 1,023,080 | | |
| | 6,748 | | | NICE Ltd. - ADR (a) | | | 700,240 | | |
Number of Shares | | | | Value | |
| | | Technology 27.2% (continued) | |
| | 11,938 | | | Nova Measuring Instruments
Ltd. (a) | | $ | 325,311 | | |
| | 32,597 | | | RealPage, Inc. (a) | | | 1,796,095 | | |
| | 19,884 | | | RingCentral, Inc. - Class A (a) | | | 1,398,839 | | |
| | 31,777 | | | ShotSpotter, Inc. (a) | | | 1,205,302 | | |
| | 12,082 | | | TechTarget, Inc. (a) | | | 343,129 | | |
| | 17,011 | | | Telaria, Inc. (a) | | | 68,725 | | |
| | 7,072 | | | Twilio, Inc. - Class A (a) | | | 396,173 | | |
| | 114,945 | | | USA Technologies, Inc. (a) | | | 1,609,230 | | |
| | 30,993 | | | Varonis Systems, Inc. (a) | | | 2,308,979 | | |
| | 15,425 | | | WNS (Holdings) Ltd. - ADR (a) | | | 804,877 | | |
| | | | 20,455,591 | | |
| | | Utilities 0.8% | |
| | 27,696 | | | Boingo Wireless, Inc. (a) | | | 625,653 | | |
| | | Total Common Stocks | |
| | | | | (Cost $50,260,854) | | | 74,106,870 | | |
SHORT-TERM INVESTMENTS 4.9% | | | |
| | | Investment Company 4.9% | |
| | 3,701,714 | | | Morgan Stanley Institutional
Liquidity Funds - Government
Portfolio - Institutional
Class, 1.82% | | | 3,701,714 | | |
| | | Total Short-Term Investments | |
| | | | | (Cost $3,701,714) | | | 3,701,714 | | |
| | | Total Investments 103.4% | |
| | | | | (Cost $53,962,568) | | | 77,808,584 | | |
| | | | | Liabilities in Excess of
Other Assets (3.4)% | | | (2,573,661 | ) | |
| | | | | TOTAL NET ASSETS 100.0% | | $ | 75,234,923 | | |
(a) Non-Income Producing.
ADR - American Depositary Receipt
The accompanying notes are an integral part of these financial statements.
page 30

Frontier Timpani Small Cap Growth Fund
SCHEDULE OF INVESTMENTS (continued)
June 30, 2018
PORTFOLIO DIVERSIFICATION
Sectors | | Percentage | |
Technology | | | 27.2 | % | |
Consumer Discretionary | | | 24.6 | | |
Health Care | | | 23.4 | | |
Producer Durables | | | 10.3 | | |
Financial Services | | | 5.0 | | |
Materials & Processing | | | 3.5 | | |
Energy | | | 2.4 | | |
Consumer Staples | | | 1.3 | | |
Utilities | | | 0.8 | | |
Total Common Stocks | | | 98.5 | | |
Total Short-Term Investments | | | 4.9 | | |
Total Investments | | | 103.4 | | |
Liabilities in Excess of Other Assets | | | (3.4 | ) | |
Total Net Assets | | | 100.0 | % | |
The accompanying notes are an integral part of these financial statements.
page 31

Frontier Phocas Small Cap Value Fund
SCHEDULE OF INVESTMENTS
June 30, 2018
Number of Shares | | | | Value | |
COMMON STOCKS 97.7% | | | |
| | | Consumer Discretionary 11.8% | |
| | 11,415 | | | American Eagle Outfitters, Inc. | | $ | 265,399 | | |
| | 18,249 | | | Entercom Communications
Corp. - Class A | | | 137,780 | | |
| | 11,706 | | | G-III Apparel Group Ltd. (a) | | | 519,746 | | |
| | 21,198 | | | Modine Manufacturing Co. (a) | | | 386,863 | | |
| | 7,649 | | | Nexstar Media Group, Inc. -
Class A | | | 561,437 | | |
| | 7,558 | | | Penske Automotive Group, Inc. | | | 354,092 | | |
| | 17,189 | | | SeaWorld Entertainment, Inc. (a) | | | 375,064 | | |
| | 15,614 | | | Sinclair Broadcast Group, Inc. -
Class A | | | 501,990 | | |
| | 3,663 | | | The Cheesecake Factory, Inc. | | | 201,685 | | |
| | 8,679 | | | TopBuild Corp. (a) | | | 679,913 | | |
| | 7,716 | | | Tower International, Inc. | | | 245,369 | | |
| | 1,618 | | | Williams-Sonoma, Inc. | | | 99,313 | | |
| | 6,439 | | | Wolverine World Wide, Inc. | | | 223,884 | | |
| | | | 4,552,535 | | |
| | | Consumer Staples 1.3% | |
| | 7,322 | | | B&G Foods, Inc. | | | 218,928 | | |
| | 2,584 | | | USANA Health Sciences, Inc. (a) | | | 297,935 | | |
| | | | 516,863 | | |
| | | Energy 6.4% | |
| | 8,217 | | | C&J Energy Services, Inc. (a) | | | 193,921 | | |
| | 53,048 | | | Callon Petroleum Co. (a) | | | 569,736 | | |
| | 4,020 | | | Delek US Holdings, Inc. | | | 201,683 | | |
| | 10,254 | | | PDC Energy, Inc. (a) | | | 619,854 | | |
| | 46,831 | | | Ring Energy, Inc. (a) | | | 591,007 | | |
| | 17,140 | | | Superior Energy Services, Inc. (a) | | | 166,944 | | |
| | 5,442 | | | US Silica Holdings, Inc. | | | 139,805 | | |
| | | | 2,482,950 | | |
| | | Financials 30.1% | |
| | 6,574 | | | Banner Corp. | | | 395,295 | | |
| | 9,529 | | | Bryn Mawr Bank Corp. | | | 441,193 | | |
| | 13,528 | | | Carolina Financial Corp. | | | 580,622 | | |
| | 22,254 | | | CenterState Bank Corp. | | | 663,614 | | |
Number of Shares | | | | Value | |
| | | Financials 30.1% (continued) | |
| | 5,065 | | | Chemical Financial Corp. | | $ | 281,968 | | |
| | 16,762 | | | CNO Financial Group, Inc. | | | 319,148 | | |
| | 6,436 | | | Eagle Bancorp, Inc. (a) | | | 394,527 | | |
| | 7,984 | | | Enterprise Financial Services Corp. | | | 430,737 | | |
| | 23,993 | | | F.N.B. Corp. | | | 321,986 | | |
| | 9,096 | | | First Interstate BancSystem, Inc. -
Class A | | | 383,851 | | |
| | 8,849 | | | Franklin Financial Network,
Inc. (a) | | | 332,722 | | |
| | 8,422 | | | Green Bancorp, Inc. | | | 181,915 | | |
| | 7,850 | | | Guaranty Bancorp | | | 233,930 | | |
| | 3,462 | | | Heartland Financial USA, Inc. | | | 189,891 | | |
| | 23,455 | | | Heritage Insurance Holdings, Inc. | | | 390,995 | | |
| | 4,822 | | | IBERIABANK Corp. | | | 365,508 | | |
| | 8,824 | | | LegacyTexas Financial Group, Inc. | | | 344,312 | | |
| | 1,719 | | | Meta Financial Group, Inc. | | | 167,431 | | |
| | 12,273 | | | OneMain Holdings, Inc. (a) | | | 408,568 | | |
| | 9,334 | | | Pacific Premier Bancorp, Inc. (a) | | | 356,092 | | |
| | 8,588 | | | Preferred Bank | | | 527,818 | | |
| | 3,038 | | | Primerica, Inc. | | | 302,585 | | |
| | 7,306 | | | Selective Insurance Group, Inc. | | | 401,830 | | |
| | 6,257 | | | Simmons First National Corp. -
Class A | | | 187,084 | | |
| | 14,984 | | | State Bank Financial Corp. | | | 500,466 | | |
| | 5,783 | | | Stifel Financial Corp. | | | 302,162 | | |
| | 11,207 | | | Triumph Bancorp, Inc. (a) | | | 456,685 | | |
| | 17,717 | | | Umpqua Holdings Corp. | | | 400,227 | | |
| | 10,143 | | | Union Bankshares Corp. | | | 394,360 | | |
| | 15,785 | | | United Community Banks, Inc. | | | 484,126 | | |
| | 3,107 | | | Walker & Dunlop, Inc. | | | 172,904 | | |
| | 4,021 | | | Wintrust Financial Corp. | | | 350,028 | | |
| | | | 11,664,580 | | |
| | | Health Care 5.7% | |
| | 1,498 | | | ANI Pharmaceuticals, Inc. (a) | | | 100,067 | | |
| | 7,507 | | | Avanos Medical, Inc. (a) | | | 429,776 | | |
| | 7,312 | | | Diplomat Pharmacy, Inc. (a) | | | 186,895 | | |
The accompanying notes are an integral part of these financial statements.
page 32

Frontier Phocas Small Cap Value Fund
SCHEDULE OF INVESTMENTS (continued)
June 30, 2018
Number of Shares | | | | Value | |
| COMMON STOCKS 97.7% (continued) | | | |
| | | Health Care 5.7% (continued) | |
| | 7,554 | | | Emergent BioSolutions, Inc. (a) | | $ | 381,402 | | |
| | 3,614 | | | NuVasive, Inc. (a) | | | 188,362 | | |
| | 62,959 | | | Progenics Pharmaceuticals, Inc. (a) | | | 506,190 | | |
| | 15,134 | | | RadNet, Inc. (a) | | | 227,010 | | |
| | 4,364 | | | Syneos Health, Inc. (a) | | | 204,672 | | |
| | | | 2,224,374 | | |
| | | Industrials 13.8% | |
| | 4,575 | | | ABM Industries, Inc. | | | 133,498 | | |
| | 3,688 | | | ASGN, Inc. (a) | | | 288,365 | | |
| | 5,538 | | | Astec Industries, Inc. | | | 331,172 | | |
| | 6,056 | | | Atlas Air Worldwide Holdings,
Inc. (a) | | | 434,215 | | |
| | 29,942 | | | CBIZ, Inc. (a) | | | 688,666 | | |
| | 9,301 | | | Columbus McKinnon Corp. | | | 403,291 | | |
| | 3,699 | | | Deluxe Corp. | | | 244,911 | | |
| | 4,116 | | | EMCOR Group, Inc. | | | 313,557 | | |
| | 11,818 | | | Gibraltar Industries, Inc. (a) | | | 443,175 | | |
| | 10,631 | | | Heartland Express, Inc. | | | 197,205 | | |
| | 5,487 | | | Kadant, Inc. | | | 527,575 | | |
| | 6,815 | | | MYR Group, Inc. (a) | | | 241,660 | | |
| | 9,357 | | | SkyWest, Inc. | | | 485,628 | | |
| | 8,019 | | | Tetra Tech, Inc. | | | 469,112 | | |
| | 3,690 | | | The Timken Company | | | 160,700 | | |
| | | | 5,362,730 | | |
| | | Information Technology 8.0% | |
| | 2,770 | | | Belden, Inc. | | | 169,302 | | |
| | 2,402 | | | CACI International, Inc. -
Class A (a) | | | 404,857 | | |
| | 11,403 | | | Conduent, Inc. (a) | | | 207,193 | | |
| | 30,149 | | | Cypress Semiconductor Corp. | | | 469,721 | | |
| | 9,512 | | | Finisar Corp. (a) | | | 171,216 | | |
| | 3,093 | | | MKS Instruments, Inc. | | | 296,000 | | |
| | 4,906 | | | NCR Corp. (a) | | | 147,082 | | |
| | 14,712 | | | Photronics, Inc. (a) | | | 117,328 | | |
| | 3,137 | | | Plexus Corp. (a) | | | 186,777 | | |
Number of Shares | | | | Value | |
| | | Information
Technology 8.0% (continued) | |
| | 5,977 | | | Progress Software Corp. | | $ | 232,027 | | |
| | 7,576 | | | Syntel, Inc. (a) | | | 243,114 | | |
| | 2,186 | | | Tech Data Corp. (a) | | | 179,514 | | |
| | 6,449 | | | Verint Systems, Inc. (a) | | | 286,013 | | |
| | | | 3,110,144 | | |
| | | Materials 5.1% | |
| | 20,258 | | | Ferro Corp. (a) | | | 422,379 | | |
| | 4,932 | | | HB Fuller Co. | | | 264,750 | | |
| | 2,805 | | | Kaiser Aluminum Corp. | | | 292,029 | | |
| | 2,703 | | | KapStone Paper and Packaging
Corp. | | | 93,253 | | |
| | 2,832 | | | KMG Chemicals, Inc. | | | 208,945 | | |
| | 8,832 | | | Materion Corp. | | | 478,253 | | |
| | 12,102 | | | TimkenSteel Corp. (a) | | | 197,868 | | |
| | | | 1,957,477 | | |
| | | Real Estate 10.9% | |
| | 12,738 | | | Acadia Realty Trust | | | 348,639 | | |
| | 12,888 | | | Chatham Lodging Trust | | | 273,483 | | |
| | 2,722 | | | CoreSite Realty Corp. | | | 301,652 | | |
| | 10,171 | | | Hudson Pacific Properties, Inc. | | | 360,359 | | |
| | 47,044 | | | Independence Realty Trust, Inc. | | | 485,024 | | |
| | 17,711 | | | Jernigan Capital, Inc. | | | 337,572 | | |
| | 14,003 | | | National Storage Affiliates Trust | | | 431,572 | | |
| | 13,239 | | | NorthStar Realty Europe Corp. | | | 191,833 | | |
| | 13,046 | | | Pebblebrook Hotel Trust | | | 506,185 | | |
| | 5,489 | | | QTS Realty Trust, Inc. - Class A | | | 216,816 | | |
| | 16,354 | | | Rexford Industrial Realty, Inc. | | | 513,352 | | |
| | 10,806 | | | Sabra Health Care REIT, Inc. | | | 234,814 | | |
| | | | 4,201,301 | | |
| | | Utilities 4.6% | |
| | 3,527 | | | Black Hills Corp. | | | 215,888 | | |
| | 3,960 | | | IDACORP, Inc. | | | 365,270 | | |
| | 4,632 | | | New Jersey Resources Corp. | | | 207,282 | | |
| | 5,212 | | | Portland General Electric Co. | | | 222,865 | | |
| | 8,949 | | | South Jersey Industries, Inc. | | | 299,523 | | |
The accompanying notes are an integral part of these financial statements.
page 33

Frontier Phocas Small Cap Value Fund
SCHEDULE OF INVESTMENTS (continued)
June 30, 2018
Number of Shares | | | | Value | |
| COMMON STOCKS 97.7% (continued) | | | |
| | | Utilities 4.6% (continued) | |
| | 3,804 | | | Spire, Inc. | | $ | 268,752 | | |
| | 16,921 | | | TerraForm Power, Inc. - Class A | | | 197,976 | | |
| | | | 1,777,556 | | |
| | | Total Common Stocks | |
| | | | | (Cost $28,839,389) | | | 37,850,510 | | |
SHORT-TERM INVESTMENTS 2.8% | | | |
| | | Investment Company 2.8% | |
| | 1,065,523 | | | Morgan Stanley Institutional
Liquidity Funds - Government
Portfolio - Institutional
Class, 1.82% | | | 1,065,523 | | |
| | | Total Short-Term Investments | |
| | | | | (Cost $1,065,523) | | | 1,065,523 | | |
| | | Total Investments 100.5% | |
| | | | | (Cost $29,904,912) | | | 38,916,033 | | |
| | | | | Liabilities in Excess of
Other Assets (0.5)% | | | (180,765 | ) | |
| | | | | TOTAL NET ASSETS 100.0% | | $ | 38,735,268 | | |
(a) Non-Income Producing.
PORTFOLIO DIVERSIFICATION
Sectors | | Percentage | |
Financials | | | 30.1 | % | |
Industrials | | | 13.8 | | |
Consumer Discretionary | | | 11.8 | | |
Real Estate | | | 10.9 | | |
Information Technology | | | 8.0 | | |
Energy | | | 6.4 | | |
Health Care | | | 5.7 | | |
Materials | | | 5.1 | | |
Utilities | | | 4.6 | | |
Consumer Staples | | | 1.3 | | |
Total Common Stocks | | | 97.7 | | |
Total Short-Term Investments | | | 2.8 | | |
Total Investments | | | 100.5 | | |
Liabilities in Excess of Other Assets | | | (0.5 | ) | |
Total Net Assets | | | 100.0 | % | |
The accompanying notes are an integral part of these financial statements.
page 34

Frontier Funds
STATEMENTS OF ASSETS AND LIABILITIES
June 30, 2018
| | | MFG Global
Equity Fund | | MFG Global
Plus Fund | | MFG Core
Infrastructure Fund | |
ASSETS: | |
Investments at cost | | $ | 818,925,619 | | | $ | 354,017,964 | | | $ | 371,502,261 | | |
Foreign currency at cost | | $ | 48,369 | | | $ | 41,734 | | | $ | 486,397 | | |
Investments at value | | $ | 1,101,701,381 | | | $ | 414,897,085 | | | $ | 395,790,413 | | |
Foreign currency at value | | | 47,853 | | | | 41,939 | | | | 478,904 | | |
Receivable for Fund shares sold | | | 606,903 | | | | 157 | | | | 32,987 | | |
Interest and dividends receivable | | | 2,018,546 | | | | 486,236 | | | | 2,180,270 | | |
Prepaid expenses and other assets | | | 25,156 | | | | 22,721 | | | | 25,160 | | |
Total assets | | | 1,104,399,839 | | | | 415,448,138 | | | | 398,507,734 | | |
LIABILITIES: | |
Payable for Fund shares redeemed | | | 100,000 | | | | — | | | | 7,462,002 | | |
Payable to Adviser | | | 686,827 | | | | 241,545 | | | | 175,253 | | |
Accrued shareholder servicing fees | | | — | | | | 8,643 | | | | 1,212 | | |
Accrued expenses | | | 92,421 | | | | 60,824 | | | | 66,661 | | |
Total liabilities | | | 879,248 | | | | 311,012 | | | | 7,705,128 | | |
Net Assets | | $ | 1,103,520,591 | | | $ | 415,137,126 | | | $ | 390,802,606 | | |
NET ASSETS CONSIST OF: | |
Paid in capital | | $ | 766,044,729 | | | $ | 338,639,409 | | | $ | 368,203,688 | | |
Undistributed net investment income | | | 5,196,032 | | | | 2,438,924 | | | | 976,524 | | |
Accumulated undistributed net realized gain (loss) | | | 49,547,076 | | | | 13,182,752 | | | | (2,666,350 | ) | |
Net unrealized appreciation/depreciation on: | |
Investments | | | 282,775,762 | | | | 60,879,121 | | | | 24,288,152 | | |
Foreign currency | | | (43,008 | ) | | | (3,080 | ) | | | 592 | | |
Net Assets | | $ | 1,103,520,591 | | | $ | 415,137,126 | | | $ | 390,802,606 | | |
CAPITAL STOCK, $0.01 PAR VALUE | | | | Institutional Class | | Institutional Class | |
Net Assets | | $ | 1,103,520,591 | | | $ | 340,203,907 | | | $ | 381,749,278 | | |
Authorized | | | 100,000,000 | | | | 100,000,000 | | | | 50,000,000 | | |
Issued and Outstanding | | | 58,423,224 | | | | 26,750,190 | | | | 24,785,186 | | |
Net Asset Value, Redemption Price and Offering Price Per Share | | $ | 18.89 | | | $ | 12.72 | | | $ | 15.40 | | |
CAPITAL STOCK, $0.01 PAR VALUE | | | | Service Class | | Service Class | |
Net Assets | | | | $ | 74,933,219 | | | $ | 9,053,328 | | |
Authorized | | | | | 50,000,000 | | | | 50,000,000 | | |
Issued and Outstanding | | | | | 5,893,101 | | | | 586,595 | | |
Net Asset Value, Redemption Price and Offering Price Per Share | | | | $ | 12.72 | | | $ | 15.43 | | |
The accompanying notes are an integral part of these financial statements.
page 35

Frontier Funds
STATEMENTS OF ASSETS AND LIABILITIES (continued)
June 30, 2018
| | | Timpani Small Cap
Growth Fund | | Phocas Small Cap
Value Fund | |
ASSETS: | |
Investments at cost | | $ | 53,962,568 | | | $ | 29,904,912 | | |
Investments at value | | $ | 77,808,584 | | | $ | 38,916,033 | | |
Receivable for investments sold | | | — | | | | 12,905 | | |
Receivable for Fund shares sold | | | 78,281 | | | | 6,496 | | |
Interest and dividends receivable | | | 2,291 | | | | 53,634 | | |
Prepaid expenses and other assets | | | 20,363 | | | | 14,894 | | |
Total assets | | | 77,909,519 | | | | 39,003,962 | | |
LIABILITIES: | |
Payable for investments purchased | | | 2,508,968 | | | | 132,626 | | |
Payable for Fund shares redeemed | | | 80,166 | | | | 88,402 | | |
Payable to Adviser | | | 48,347 | | | | 16,657 | | |
Accrued distribution and shareholder servicing fees | | | 2,373 | | | | — | | |
Accrued expenses | | | 34,742 | | | | 31,009 | | |
Total liabilities | | | 2,674,596 | | | | 268,694 | | |
Net Assets | | $ | 75,234,923 | | | $ | 38,735,268 | | |
NET ASSETS CONSIST OF: | |
Paid in capital | | $ | 47,837,590 | | | $ | 25,164,604 | | |
Undistributed net investment income (loss) | | | (295,069 | ) | | | 45,360 | | |
Accumulated undistributed net realized gain | | | 3,846,386 | | | | 4,514,183 | | |
Net unrealized appreciation on investments | | | 23,846,016 | | | | 9,011,121 | | |
Net Assets | | $ | 75,234,923 | | | $ | 38,735,268 | | |
CAPITAL STOCK, $0.01 PAR VALUE | | Institutional Class | | Institutional Class | |
Net Assets | | $ | 69,094,849 | | | $ | 38,735,140 | | |
Authorized | | | 50,000,000 | | | | 100,000,000 | | |
Issued and Outstanding | | | 2,713,304 | | | | 963,583 | | |
Net Asset Value, Redemption Price and Offering Price Per Share | | $ | 25.47 | | | $ | 40.20 | | |
CAPITAL STOCK, $0.01 PAR VALUE | | Service Class | | Service Class | |
Net Assets | | $ | 250,167 | | | $ | 128 | | |
Authorized | | | 50,000,000 | | | | 50,000,000 | | |
Issued and Outstanding | | | 9,830 | | | | 3 | | |
Net Asset Value, Redemption Price and Offering Price Per Share | | $ | 25.45 | | | $ | 40.10 | (1) | |
CAPITAL STOCK, $0.01 PAR VALUE | | Class Y | | | |
Net Assets | | $ | 5,889,907 | | | | |
Authorized | | | 50,000,000 | | | | |
Issued and Outstanding | | | 235,368 | | | | |
Net Asset Value, Redemption Price and Offering Price Per Share | | $ | 25.02 | | | | |
(1) Net Asset Value is calculated using unrounded net assets and shares outstanding.
The accompanying notes are an integral part of these financial statements.
page 36

Frontier Funds
STATEMENTS OF OPERATIONS
For the Year Ended June 30, 2018
| | | MFG Global
Equity Fund | | MFG Global
Plus Fund | | MFG Core
Infrastructure Fund | |
INVESTMENT INCOME: | |
Dividend income | | $ | 15,358,070 | (1) | | $ | 6,197,492 | (2) | | $ | 13,373,435 | (3) | |
Interest income | | | 1,781,961 | | | | 713,695 | | | | 114,797 | | |
Total investment income | | | 17,140,031 | | | | 6,911,187 | | | | 13,488,232 | | |
EXPENSES: | |
Investment advisory fees | | | 9,222,273 | | | | 3,491,914 | | | | 2,159,094 | | |
Fund administration and accounting fees | | | 255,555 | | | | 111,451 | | | | 94,641 | | |
Custody fees | | | 111,212 | | | | 64,916 | | | | 79,084 | | |
Transfer agent fees | | | 32,516 | | | | 22,646 | | | | 22,451 | | |
Directors' fees and related expenses | | | 27,214 | | | | 27,214 | | | | 27,214 | | |
Federal and state registration fees | | | 24,584 | | | | 39,208 | | | | 37,204 | | |
Legal fees | | | 21,616 | | | | 23,279 | | | | 20,482 | | |
Audit fees | | | 17,751 | | | | 17,751 | | | | 17,751 | | |
Reports to shareholders | | | 12,823 | | | | 5,868 | | | | 7,475 | | |
Shareholder servicing fees | | | — | | | | 61,257 | | | | 13,632 | | |
Other | | | 46,663 | | | | 18,885 | | | | 19,268 | | |
Total expenses before waiver | | | 9,772,207 | | | | 3,884,389 | | | | 2,498,296 | | |
Waiver of expenses by Adviser | | | (549,935 | ) | | | (331,218 | ) | | | (325,570 | ) | |
Net expenses | | | 9,222,272 | | | | 3,553,171 | | | | 2,172,726 | | |
Net Investment Income | | | 7,917,759 | | | | 3,358,016 | | | | 11,315,506 | | |
REALIZED AND UNREALIZED GAIN (LOSS)
ON INVESTMENTS: | |
Net realized gain (loss) on: | |
Investments | | | 91,508,887 | | | | 20,626,161 | | | | (1,311,785 | ) | |
Foreign currency transactions | | | (87,745 | ) | | | (26,823 | ) | | | (101,134 | ) | |
Change in net unrealized appreciation/depreciation on: | |
Investments | | | 50,612,177 | | | | 28,125,679 | | | | (6,402,938 | ) | |
Foreign currency transactions | | | (48,651 | ) | | | (10,070 | ) | | | (15,320 | ) | |
Net Realized and Unrealized Gain (Loss) on Investments | | | 141,984,668 | | | | 48,714,947 | | | | (7,831,177 | ) | |
Net Increase in Net Assets Resulting from Operations | | $ | 149,902,427 | | | $ | 52,072,963 | | | $ | 3,484,329 | | |
(1) Net of $430,908 in foreign withholding taxes.
(2) Net of $190,876 in foreign withholding taxes.
(3) Net of $937,841 in foreign withholding taxes.
The accompanying notes are an integral part of these financial statements.
page 37

Frontier Funds
STATEMENTS OF OPERATIONS (continued)
For the Year Ended June 30, 2018
| | | Timpani Small Cap
Growth Fund | | Phocas Small Cap
Value Fund | |
INVESTMENT INCOME: | |
Dividend income | | $ | 89,916 | | | $ | 475,575 | | |
Interest income | | | 12,657 | | | | 12,825 | | |
Total investment income | | | 102,573 | | | | 488,400 | | |
EXPENSES: | |
Investment advisory fees | | | 582,637 | | | | 383,855 | | |
Fund administration and accounting fees | | | 39,099 | | | | 36,369 | | |
Federal and state registration fees | | | 37,944 | | | | 32,733 | | |
Transfer agent fees | | | 31,138 | | | | 18,725 | | |
Directors' fees and related expenses | | | 27,214 | | | | 27,214 | | |
Custody fees | | | 21,588 | | | | 16,250 | | |
Legal fees | | | 20,498 | | | | 23,226 | | |
Distribution and shareholder servicing fees | | | 18,209 | | | | — | | |
Audit fees | | | 15,749 | | | | 15,749 | | |
Reports to shareholders | | | 8,324 | | | | 9,675 | | |
Other | | | 7,431 | | | | 6,222 | | |
Total expenses before waiver | | | 809,831 | | | | 570,018 | | |
Waiver of expenses by Adviser | | | (150,722 | ) | | | (205,354 | ) | |
Net expenses | | | 659,109 | | | | 364,664 | | |
Net Investment Income (Loss) | | | (556,536 | ) | | | 123,736 | | |
REALIZED AND UNREALIZED GAIN ON INVESTMENTS: | |
Net realized gain on investments | | | 6,591,334 | | | | 6,034,290 | | |
Change in net unrealized appreciation on investments | | | 11,921,485 | | | | (1,218,847 | ) | |
Net Realized and Unrealized Gain on Investments | | | 18,512,819 | | | | 4,815,443 | | |
Net Increase in Net Assets Resulting from Operations | | $ | 17,956,283 | | | $ | 4,939,179 | | |
The accompanying notes are an integral part of these financial statements.
page 38

Frontier Funds
STATEMENTS OF CHANGES IN NET ASSETS
| | | MFG Global Equity Fund | | MFG Global Plus Fund | |
| | | For the
Year Ended
June 30, 2018 | | For the
Year Ended
June 30, 2017 | | For the
Year Ended
June 30, 2018 | | For the
Year Ended
June 30, 2017 | |
OPERATIONS: | |
Net investment income | | $ | 7,917,759 | | | $ | 9,884,765 | | | $ | 3,358,016 | | | $ | 1,765,624 | | |
Net realized gain (loss) on: | |
Investments | | | 91,508,887 | | | | 17,985,225 | | | | 20,626,161 | | | | (847,150 | ) | |
Foreign currency transactions | | | (87,745 | ) | | | 13,341 | | | | (26,823 | ) | | | 11,932 | | |
Change in net unrealized appreciation/depreciation on: | |
Investments | | | 50,612,177 | | | | 170,335,609 | | | | 28,125,679 | | | | 33,462,289 | | |
Foreign currency transactions | | | (48,651 | ) | | | 53,301 | | | | (10,070 | ) | | | 7,695 | | |
Net increase in net assets resulting from operations | | | 149,902,427 | | | | 198,272,241 | | | | 52,072,963 | | | | 34,400,390 | | |
DISTRIBUTIONS PAID TO SHAREHOLDERS: | |
From net investment income: | |
Institutional Class | | | (9,290,907 | ) | | | (9,428,431 | ) | | | (2,143,460 | ) | | | (139,634 | ) | |
Service Class | | | | | | | (412,974 | ) | | | (62,179 | ) | |
From net realized gain on investments: | |
Institutional Class | | | (36,753,527 | ) | | | (39,274,536 | ) | | | (5,315,960 | ) | | | (37,020 | ) | |
Service Class | | | | | | | (1,211,349 | ) | | | (18,277 | ) | |
Net decrease in net assets resulting from distributions paid | | | (46,044,434 | ) | | | (48,702,967 | ) | | | (9,083,743 | ) | | | (257,110 | ) | |
CAPITAL SHARE TRANSACTIONS: | |
Shares sold: | |
Institutional Class | | | 47,464,279 | | | | 98,152,122 | | | | 127,903,475 | | | | 271,791,475 | | |
Service Class | | | | | | | 10,267,372 | | | | 74,184,960 | | |
Shares issued to holders in reinvestment of distributions: | |
Institutional Class | | | 43,073,263 | | | | 43,253,679 | | | | 7,446,694 | | | | 169,072 | | |
Service Class | | | | | | | 1,525,665 | | | | 57,773 | | |
Shares redeemed: | |
Institutional Class | | | (224,973,653 | ) | | | (230,185,991 | ) | | | (132,197,976 | ) | | | (16,187,102 | ) | |
Service Class | | | | | | | (26,695,882 | ) | | | (12,534,699 | ) | |
Redemption fees: | |
Institutional Class | | | 1,103 | | | | 598 | | | | — | | | | — | | |
Service Class | | | | | | | — | | | | 15 | | |
Net increase (decrease) in net assets resulting from capital
share transactions | | | (134,435,008 | ) | | | (88,779,592 | ) | | | (11,750,652 | ) | | | 317,481,494 | | |
Total Increase (Decrease) in Net Assets | | | (30,577,015 | ) | | | 60,789,682 | | | | 31,238,568 | | | | 351,624,774 | | |
NET ASSETS: | |
Beginning of Period | | | 1,134,097,606 | | | | 1,073,307,924 | | | | 383,898,558 | | | | 32,273,784 | | |
End of Period | | $ | 1,103,520,591 | | | $ | 1,134,097,606 | | | $ | 415,137,126 | | | $ | 383,898,558 | | |
Undistributed net investment income | | $ | 5,196,032 | | | $ | 6,656,925 | | | $ | 2,438,924 | | | $ | 1,664,165 | | |
TRANSACTIONS IN SHARES: | |
Shares sold: | |
Institutional Class | | | 2,558,520 | | | | 6,093,506 | | | | 10,288,566 | | | | 25,516,402 | | |
Service Class | | | | | | | 837,958 | | | | 7,106,628 | | |
Shares issued to holders in reinvestment of distributions: | |
Institutional Class | | | 2,325,770 | | | | 2,788,761 | | | | 595,736 | | | | 16,431 | | |
Service Class | | | | | | | 122,053 | | | | 5,609 | | |
Shares redeemed: | |
Institutional Class | | | (12,204,242 | ) | | | (14,446,327 | ) | | | (10,471,305 | ) | | | (1,442,248 | ) | |
Service Class | | | | | | | (2,132,206 | ) | | | (1,164,893 | ) | |
Net increase (decrease) in shares outstanding | | | (7,319,952 | ) | | | (5,564,060 | ) | | | (759,198 | ) | | | 30,037,929 | | |
The accompanying notes are an integral part of these financial statements.
page 39

Frontier Funds
STATEMENTS OF CHANGES IN NET ASSETS (continued)
| | | MFG Core Infrastructure Fund | | Timpani Small Cap Growth Fund | |
| | | For the
Year Ended
June 30, 2018 | | For the
Year Ended
June 30, 2017 | | For the
Year Ended
June 30, 2018 | | For the
Year Ended
June 30, 2017 | |
OPERATIONS: | |
Net investment income (loss) | | $ | 11,315,506 | | | $ | 6,289,254 | | | $ | (556,536 | ) | | $ | (343,823 | ) | |
Net realized gain (loss) on: | |
Investments | | | (1,311,785 | ) | | | 287,930 | | | | 6,591,334 | | | | 8,113,527 | | |
Foreign currency transactions | | | (101,134 | ) | | | (30,933 | ) | | | — | | | | — | | |
Change in net unrealized appreciation/depreciation on: | |
Investments | | | (6,402,938 | ) | | | 5,445,033 | | | | 11,921,485 | | | | 3,970,394 | | |
Foreign currency transactions | | | (15,320 | ) | | | 38,565 | | | | — | | | | — | | |
Net increase in net assets resulting from operations | | | 3,484,329 | | | | 12,029,849 | | | | 17,956,283 | | | | 11,740,098 | | |
DISTRIBUTIONS PAID TO SHAREHOLDERS: | |
From net investment income: | |
Institutional Class | | | (10,827,533 | ) | | | (5,686,075 | ) | | | — | | | | — | | |
Service Class(1) | | | (347,439 | ) | | | (35,825 | ) | | | — | | | | — | | |
From net realized gain on investments: | |
Institutional Class | | | (41,708 | ) | | | (358,342 | ) | | | — | | | | — | | |
Service Class(1) | | | (903 | ) | | | (188 | ) | | | — | | | | — | | |
Net decrease in net assets resulting from distributions paid | | | (11,217,583 | ) | | | (6,080,430 | ) | | | — | | | | — | | |
CAPITAL SHARE TRANSACTIONS: | |
Shares sold: | |
Institutional Class | | | 179,185,572 | | | | 105,929,907 | | | | 19,540,583 | | | | 7,235,268 | | |
Service Class(1) | | | 50,605,851 | | | | 2,960,141 | | | | 215,521 | | | | 100 | | |
Class Y | | | | | | | 1,462,983 | | | | 644,887 | | |
Shares issued to holders in reinvestment of distributions: | |
Institutional Class | | | 9,719,865 | | | | 5,059,438 | | | | — | | | | — | | |
Service Class(1) | | | 157,769 | | | | 28,882 | | | | — | | | | — | | |
Shares redeemed: | |
Institutional Class | | | (50,370,221 | ) | | | (73,769,006 | ) | | | (10,819,013 | ) | | | (26,881,349 | ) | |
Service Class(1) | | | (44,897,280 | ) | | | (15,315 | ) | | | (10,748 | ) | | | — | | |
Class Y | | | | | | | (897,610 | ) | | | (916,331 | ) | |
Redemption fees: | |
Institutional Class | | | — | | | | 1,922 | | | | — | | | | — | | |
Service Class(1) | | | 3,746 | | | | — | | | | — | | | | — | | |
Net increase (decrease) in net assets resulting from capital share transactions | | | 144,405,302 | | | | 40,195,969 | | | | 9,491,716 | | | | (19,917,425 | ) | |
Total Increase (Decrease) in Net Assets | | | 136,672,048 | | | | 46,145,388 | | | | 27,447,999 | | | | (8,177,327 | ) | |
NET ASSETS: | |
Beginning of Period | | | 254,130,558 | | | | 207,985,170 | | | | 47,786,924 | | | | 55,964,251 | | |
End of Period | | $ | 390,802,606 | | | $ | 254,130,558 | | | $ | 75,234,923 | | | $ | 47,786,924 | | |
Undistributed net investment income (loss) | | $ | 976,524 | | | $ | 937,124 | | | $ | (295,069 | ) | | $ | (225,282 | ) | |
TRANSACTIONS IN SHARES: | |
Shares sold: | |
Institutional Class | | | 11,546,967 | | | | 6,946,015 | | | | 880,142 | | | | 439,861 | | |
Service Class(1) | | | 3,280,891 | | | | 187,321 | | | | 10,341 | | | | 6 | | |
Class Y | | | | | | | 65,597 | | | | 39,962 | | |
Shares issued to holders in reinvestment of distributions: | |
Institutional Class | | | 621,680 | | | | 333,193 | | | | — | | | | — | | |
Service Class(1) | | | 10,079 | | | | 1,809 | | | | — | | | | — | | |
Shares redeemed: | |
Institutional Class | | | (3,235,069 | ) | | | (5,050,933 | ) | | | (498,921 | ) | | | (1,669,929 | ) | |
Service Class(1) | | | (2,892,546 | ) | | | (959 | ) | | | (517 | ) | | | — | | |
Class Y | | | | | | | (43,464 | ) | | | (57,099 | ) | |
Net increase (decrease) in shares outstanding | | | 9,332,002 | | | | 2,416,446 | | | | 413,178 | | | | (1,247,199 | ) | |
(1) MFG Core Infrastructure Fund — Service Class and Timpani Small Cap Growth Fund — Service Class each commenced operations on July 15, 2016.
The accompanying notes are an integral part of these financial statements.
page 40

Frontier Funds
STATEMENTS OF CHANGES IN NET ASSETS (continued)
| | | Phocas Small Cap Value Fund | |
| | | For the
Year Ended
June 30, 2018 | | For the
Year Ended
June 30, 2017 | |
OPERATIONS: | |
Net investment income | | $ | 123,736 | | | $ | 111,152 | | |
Net realized gain on investments | | | 6,034,290 | �� | | | 2,043,378 | | |
Change in net unrealized appreciation on investments | | | (1,218,847 | ) | | | 3,609,367 | | |
Net increase in net assets resulting from operations | | | 4,939,179 | | | | 5,763,897 | | |
DISTRIBUTIONS PAID TO SHAREHOLDERS: | |
From net investment income: | |
Institutional Class | | | (130,243 | ) | | | (148,581 | ) | |
Service Class(1) | | | — | (2) | | | — | (2) | |
From net realized gain on investments: | |
Institutional Class | | | (3,114,421 | ) | | | — | | |
Service Class(1) | | | (11 | ) | | | — | | |
Net decrease in net assets resulting from distributions paid | | | (3,244,675 | ) | | | (148,581 | ) | |
CAPITAL SHARE TRANSACTIONS: | |
Shares issued in the Reorganization: | |
Institutional Class(3) | | | 25,882,024 | | | | — | | |
Shares sold: | |
Institutional Class | | | 3,896,170 | | | | 6,140,605 | | |
Service Class(1) | | | — | | | | 100 | | |
Shares issued to holders in reinvestment of distributions: | |
Institutional Class | | | 3,244,640 | | | | 148,581 | | |
Service Class(1) | | | 11 | | | | — | (2) | |
Shares redeemed: | |
Institutional Class | | | (30,488,173 | ) | | | (9,344,993 | ) | |
Net increase (decrease) in net assets resulting from capital share transactions | | | 2,534,672 | | | | (3,055,707 | ) | |
Total Increase In Net Assets | | | 4,229,176 | | | | 2,559,609 | | |
NET ASSETS: | |
Beginning of Period | | | 34,506,092 | | | | 31,946,483 | | |
End of Period | | $ | 38,735,268 | | | $ | 34,506,092 | | |
Undistributed net investment income | | $ | 45,360 | | | $ | 51,867 | | |
TRANSACTIONS IN SHARES: | |
Shares issued in the Reorganization: | |
Institutional Class(3) | | | 692,998 | | | | — | | |
Shares sold: | |
Institutional Class | | | 98,800 | | | | 160,115 | | |
Service Class(1) | | | — | | | | 3 | | |
Shares issued to holders in reinvestment of distributions: | |
Institutional Class | | | 88,444 | | | | 3,694 | | |
Service Class(1) | | | — | (4) | | | — | (4) | |
Shares redeemed: | |
Institutional Class | | | (791,437 | ) | | | (243,970 | ) | |
Net increase (decrease) in shares outstanding | | | 88,805 | | | | (80,158 | ) | |
(1) Phocas Small Cap Value Fund — Service Class commenced operations on July 15, 2016.
(2) Less than one dollar.
(3) See Note 2(f) in Notes to Financial Statements.
(4) Less than one share.
The accompanying notes are an integral part of these financial statements.
page 41

Frontier MFG Global Equity Fund
FINANCIAL HIGHLIGHTS
| | | Year
Ended
June 30,
2018 | | Year
Ended
June 30,
2017 | | Year
Ended
June 30,
2016 | | Year
Ended
June 30,
2015 | | Year
Ended
June 30,
2014 | |
Net Asset Value, Beginning of Period | | $ | 17.25 | | | $ | 15.05 | | | $ | 15.99 | | | $ | 15.33 | | | $ | 13.43 | | |
INCOME (LOSS) FROM INVESTMENT OPERATIONS: | |
Net investment income | | | 0.13 | | | | 0.15 | | | | 0.14 | | | | 0.10 | (1) | | | 0.19 | (1) | |
Net realized and unrealized gain (loss) on investments | | | 2.22 | | | | 2.77 | | | | (0.48 | ) | | | 0.91 | | | | 1.91 | | |
Total Income (Loss) from Investment Operations | | | 2.35 | | | | 2.92 | | | | (0.34 | ) | | | 1.01 | | | | 2.10 | | |
LESS DISTRIBUTIONS: | |
From net investment income | | | (0.14 | ) | | | (0.14 | ) | | | (0.12 | ) | | | (0.12 | ) | | | (0.08 | ) | |
From net realized gain on investments | | | (0.57 | ) | | | (0.58 | ) | | | (0.48 | ) | | | (0.23 | ) | | | (0.12 | ) | |
Total Distributions | | | (0.71 | ) | | | (0.72 | ) | | | (0.60 | ) | | | (0.35 | ) | | | (0.20 | ) | |
Redemption fees retained(2) | | | — | | | | — | | | | — | | | | — | | | | — | | |
Net Asset Value, End of Period | | $ | 18.89 | | | $ | 17.25 | | | $ | 15.05 | | | $ | 15.99 | | | $ | 15.33 | | |
Total Return | | | 13.75 | % | | | 19.96 | % | | | (2.19 | )% | | | 6.72 | % | | | 15.76 | % | |
SUPPLEMENTAL DATA AND RATIOS: | |
Net assets, end of period (in thousands) | | $ | 1,103,521 | | | $ | 1,134,098 | | | $ | 1,073,308 | | | $ | 1,106,525 | | | $ | 791,043 | | |
Ratio of expenses to average net assets | |
Before waivers and reimbursements | | | 0.85 | % | | | 0.85 | % | | | 0.85 | % | | | 0.86 | % | | | 0.89 | % | |
Net of waivers and reimbursements | | | 0.80 | % | | | 0.80 | % | | | 0.80 | % | | | 0.80 | % | | | 0.80 | % | |
Ratio of net investment income to average net assets | |
Before waivers and reimbursements | | | 0.64 | % | | | 0.85 | % | | | 0.85 | % | | | 0.56 | % | | | 1.18 | % | |
Net of waivers and reimbursements | | | 0.69 | % | | | 0.90 | % | | | 0.90 | % | | | 0.62 | % | | | 1.27 | % | |
Portfolio turnover rate | | | 28 | % | | | 30 | % | | | 38 | % | | | 69 | % | | | 20 | % | |
(1) Per share net investment income has been calculated using the daily average share method.
(2) Less than one cent per share.
The accompanying notes are an integral part of these financial statements.
page 42

Frontier MFG Global Plus Fund
FINANCIAL HIGHLIGHTS
| | | Institutional Class | |
| | | Year
Ended
June 30,
2018 | | Year
Ended
June 30,
2017 | | Year
Ended
June 30,
2016 | | Period
Ended
June 30,
2015(1) | |
Net Asset Value, Beginning of Period | | $ | 11.49 | | | $ | 9.59 | | | $ | 9.91 | | | $ | 10.00 | | |
INCOME (LOSS) FROM INVESTMENT OPERATIONS: | |
Net investment income | | | 0.10 | | | | 0.13 | (2) | | | 0.09 | (2) | | | 0.03 | | |
Net realized and unrealized gain (loss) on investments | | | 1.40 | | | | 1.79 | | | | (0.36 | ) | | | (0.12 | ) | |
Total Income (Loss) from Investment Operations | | | 1.50 | | | | 1.92 | | | | (0.27 | ) | | | (0.09 | ) | |
LESS DISTRIBUTIONS: | |
From net investment income | | | (0.08 | ) | | | (0.02 | ) | | | (0.05 | ) | | | — | | |
From net realized gain on investments | | | (0.19 | ) | | | — | (3) | | | — | | | | — | | |
Total Distributions | | | (0.27 | ) | | | (0.02 | ) | | | (0.05 | ) | | | — | | |
Net Asset Value, End of Period | | $ | 12.72 | | | $ | 11.49 | | | $ | 9.59 | | | $ | 9.91 | | |
Total Return | | | 13.12 | % | | | 20.06 | % | | | (2.77 | )% | | | (0.90 | )%(4) | |
SUPPLEMENTAL DATA AND RATIOS: | |
Net assets, end of period (in thousands) | | $ | 340,204 | | | $ | 302,726 | | | $ | 21,547 | | | $ | 5,859 | | |
Ratio of expenses to average net assets | |
Before waivers and reimbursements | | | 0.88 | % | | | 0.95 | % | | | 2.03 | % | | | 4.96 | %(5) | |
Net of waivers and reimbursements | | | 0.80 | % | | | 0.80 | % | | | 0.80 | % | | | 0.80 | %(5) | |
Ratio of net investment income (loss) to average net assets | |
Before waivers and reimbursements | | | 0.71 | % | | | 1.02 | % | | | (0.29 | )% | | | (3.16 | )%(5) | |
Net of waivers and reimbursements | | | 0.79 | % | | | 1.17 | % | | | 0.94 | % | | | 1.00 | %(5) | |
Portfolio turnover rate(6) | | | 59 | % | | | 31 | % | | | 30 | % | | | 7 | %(4) | |
(1) Commenced operations on March 23, 2015.
(2) Per share net investment income has been calculated using the daily average share method.
(3) Less than one cent per share.
(4) Not annualized.
(5) Annualized.
(6) Portfolio turnover is calculated on the basis of the Fund as a whole without distinguishing between the classes of shares issued.
The accompanying notes are an integral part of these financial statements.
page 43

Frontier MFG Global Plus Fund
FINANCIAL HIGHLIGHTS
| | | Service Class | |
| | | Year
Ended
June 30,
2018 | | Year
Ended
June 30,
2017 | | Period
Ended
June 30,
2016(1) | |
Net Asset Value, Beginning of Period | | $ | 11.49 | | | $ | 9.60 | | | $ | 9.73 | | |
INCOME (LOSS) FROM INVESTMENT OPERATIONS: | |
Net investment income | | | 0.10 | | | | 0.11 | (2) | | | — | (3) | |
Net realized and unrealized gain (loss) on investments | | | 1.39 | | | | 1.80 | | | | (0.13 | ) | |
Total Income (Loss) from Investment Operations | | | 1.49 | | | | 1.91 | | | | (0.13 | ) | |
LESS DISTRIBUTIONS: | |
From net investment income | | | (0.07 | ) | | | (0.02 | ) | | | — | | |
From net realized gain on investments | | | (0.19 | ) | | | — | (3) | | | — | | |
Total Distributions | | | (0.26 | ) | | | (0.02 | ) | | | — | | |
Redemption fees retained | | | — | | | | — | (3) | | | — | (3) | |
Net Asset Value, End of Period | | $ | 12.72 | | | $ | 11.49 | | | $ | 9.60 | | |
Total Return | | | 13.01 | % | | | 19.92 | % | | | (1.34 | )%(4) | |
SUPPLEMENTAL DATA AND RATIOS: | |
Net assets, end of period (in thousands) | | $ | 74,933 | | | $ | 81,173 | | | $ | 10,727 | | |
Ratio of expenses to average net assets | |
Before waivers and reimbursements | | | 0.95 | % | | | 1.09 | % | | | 1.38 | %(5) | |
Net of waivers and reimbursements | | | 0.88 | % | | | 0.89 | % | | | 0.80 | %(5) | |
Ratio of net investment income (loss) to average net assets | |
Before waivers and reimbursements | | | 0.60 | % | | | 0.80 | % | | | (0.70 | )%(5) | |
Net of waivers and reimbursements | | | 0.67 | % | | | 1.00 | % | | | (0.12 | )%(5) | |
Portfolio turnover rate(6) | | | 59 | % | | | 31 | % | | | 30 | % | |
(1) Commenced operations on March 9, 2016.
(2) Per share net investment income has been calculated using the daily average share method.
(3) Less than one cent per share.
(4) Not annualized.
(5) Annualized.
(6) Portfolio turnover is calculated on the basis of the Fund as a whole without distinguishing between the classes of shares issued.
The accompanying notes are an integral part of these financial statements.
page 44

Frontier MFG Core Infrastructure Fund
FINANCIAL HIGHLIGHTS
| | | Institutional Class | |
| | | Year
Ended
June 30,
2018 | | Year
Ended
June 30,
2017 | | Year
Ended
June 30,
2016 | | Year
Ended
June 30,
2015 | | Year
Ended
June 30,
2014 | |
Net Asset Value, Beginning of Period | | $ | 15.84 | | | $ | 15.27 | | | $ | 13.09 | | | $ | 14.13 | | | $ | 11.54 | | |
INCOME (LOSS) FROM INVESTMENT OPERATIONS: | |
Net investment income | | | 0.58 | (1) | | | 0.50 | (1) | | | 0.37 | | | | 0.42 | (1) | | | 0.55 | (1) | |
Net realized and unrealized gain (loss) on investments | | | (0.48 | ) | | | 0.52 | | | | 2.21 | | | | (0.96 | ) | | | 2.22 | | |
Total Income (Loss) from Investment Operations | | | 0.10 | | | | 1.02 | | | | 2.58 | | | | (0.54 | ) | | | 2.77 | | |
LESS DISTRIBUTIONS: | |
From net investment income | | | (0.54 | ) | | | (0.42 | ) | | | (0.36 | ) | | | (0.47 | ) | | | (0.18 | ) | |
From net realized gain on investments | | | — | (2) | | | (0.03 | ) | | | (0.04 | ) | | | (0.03 | ) | | | — | | |
Total Distributions | | | (0.54 | ) | | | (0.45 | ) | | | (0.40 | ) | | | (0.50 | ) | | | (0.18 | ) | |
Redemption fees retained | | | — | | | | — | (2) | | | — | (2) | | | — | (2) | | | — | (2) | |
Net Asset Value, End of Period | | $ | 15.40 | | | $ | 15.84 | | | $ | 15.27 | | | $ | 13.09 | | | $ | 14.13 | | |
Total Return | | | 0.60 | % | | | 6.83 | % | | | 20.00 | % | | | (4.03 | )% | | | 24.22 | % | |
SUPPLEMENTAL DATA AND RATIOS: | |
Net assets, end of period (in thousands) | | $ | 381,749 | | | $ | 251,149 | | | $ | 207,985 | | | $ | 161,722 | | | $ | 65,666 | | |
Ratio of expenses to average net assets | |
Before waivers and reimbursements | | | 0.81 | % | | | 0.83 | % | | | 0.83 | % | | | 0.93 | % | | | 1.45 | % | |
Net of waivers and reimbursements | | | 0.70 | % | | | 0.70 | % | | | 0.70 | % | | | 0.70 | % | | | 0.70 | % | |
Ratio of net investment income to average net assets | |
Before waivers and reimbursements | | | 3.57 | % | | | 3.18 | % | | | 2.62 | % | | | 2.77 | % | | | 3.47 | % | |
Net of waivers and reimbursements | | | 3.68 | % | | | 3.31 | % | | | 2.75 | % | | | 3.00 | % | | | 4.22 | % | |
Portfolio turnover rate(3) | | | 19 | % | | | 39 | % | | | 15 | % | | | 17 | % | | | 16 | % | |
(1) Per share net investment income has been calculated using the daily average share method.
(2) Less than one cent per share.
(3) Portfolio turnover is calculated on the basis of the Fund as a whole without distinguishing between the classes of shares issued.
The accompanying notes are an integral part of these financial statements.
page 45

Frontier MFG Core Infrastructure Fund
FINANCIAL HIGHLIGHTS
| | | Service Class | |
| | | Year
Ended
June 30,
2018 | | Period
Ended
June 30,
2017(1) | |
Net Asset Value, Beginning of Period | | $ | 15.85 | | | $ | 15.23 | | |
INCOME (LOSS) FROM INVESTMENT OPERATIONS: | |
Net investment income(2) | | | 0.53 | | | | 0.90 | | |
Net realized and unrealized gain (loss) on investments | | | (0.43 | ) | | | 0.16 | | |
Total Income from Investment Operations | | | 0.10 | | | | 1.06 | | |
LESS DISTRIBUTIONS: | |
From net investment income | | | (0.52 | ) | | | (0.41 | ) | |
From net realized gain on investments | | | — | (3) | | | (0.03 | ) | |
Total Distributions | | | (0.52 | ) | | | (0.44 | ) | |
Redemption fees retained | | | — | (3) | | | — | | |
Net Asset Value, End of Period | | $ | 15.43 | | | $ | 15.85 | | |
Total Return | | | 0.60 | % | | | 7.14 | %(4) | |
SUPPLEMENTAL DATA AND RATIOS: | |
Net assets, end of period (in thousands) | | $ | 9,054 | | | $ | 2,982 | | |
Ratio of expenses to average net assets | |
Before waivers and reimbursements | | | 0.91 | % | | | 5.15 | %(5) | |
Net of waivers and reimbursements | | | 0.80 | % | | | 0.80 | %(5) | |
Ratio of net investment income to average net assets | |
Before waivers and reimbursements | | | 3.30 | % | | | 1.68 | %(5) | |
Net of waivers and reimbursements | | | 3.41 | % | | | 6.03 | %(5) | |
Portfolio turnover rate(6) | | | 19 | % | | | 39 | % | |
(1) Commenced operations on July 15, 2016.
(2) Per share net investment income has been calculated using the daily average share method.
(3) Less than one cent per share.
(4) Not annualized.
(5) Annualized.
(6) Portfolio turnover is calculated on the basis of the Fund as a whole without distinguishing between the classes of shares issued.
The accompanying notes are an integral part of these financial statements.
page 46

Frontier Timpani Small Cap Growth Fund
FINANCIAL HIGHLIGHTS
| | | Institutional Class | |
| | | Year
Ended
June 30,
2018 | | Year
Ended
June 30,
2017 | | Year
Ended
June 30,
2016 | | Year
Ended
June 30,
2015 | | Year
Ended
June 30,
2014 | |
Net Asset Value, Beginning of Period | | $ | 18.80 | | | $ | 14.77 | | | $ | 18.58 | | | $ | 16.06 | | | $ | 13.22 | | |
INCOME (LOSS) FROM INVESTMENT OPERATIONS: | |
Net investment loss(1) | | | (0.20 | ) | | | (0.10 | ) | | | (0.12 | ) | | | (0.16 | ) | | | (0.14 | ) | |
Net realized and unrealized gain (loss) on investments | | | 6.87 | | | | 4.13 | | | | (3.69 | ) | | | 2.68 | | | | 3.32 | | |
Total Income (Loss) from Investment Operations | | | 6.67 | | | | 4.03 | | | | (3.81 | ) | | | 2.52 | | | | 3.18 | | |
LESS DISTRIBUTIONS: | |
From net realized gain on investments | | | — | | | | — | | | | — | | | | — | | | | (0.34 | ) | |
Total Distributions | | | — | | | | — | | | | — | | | | — | | | | (0.34 | ) | |
Net Asset Value, End of Period | | $ | 25.47 | | | $ | 18.80 | | | $ | 14.77 | | | $ | 18.58 | | | $ | 16.06 | | |
Total Return | | | 35.48 | % | | | 27.29 | % | | | (20.51 | )% | | | 15.62 | % | | | 24.16 | % | |
SUPPLEMENTAL DATA AND RATIOS: | |
Net assets, end of period (in thousands) | | $ | 69,095 | | | $ | 43,833 | | | $ | 52,595 | | | $ | 47,455 | | | $ | 13,478 | | |
Ratio of expenses to average net assets | |
Before waivers and reimbursements | | | 1.36 | % | | | 1.36 | % | | | 1.32 | % | | | 1.52 | % | | | 2.46 | % | |
Net of waivers and reimbursements | | | 1.10 | % | | | 1.10 | % | | | 1.10 | % | | | 1.10 | % | | | 1.10 | % | |
Ratio of net investment loss to average net assets | |
Before waivers and reimbursements | | | (1.18 | )% | | | (0.90 | )% | | | (0.99 | )% | | | (1.37 | )% | | | (2.26 | )% | |
Net of waivers and reimbursements | | | (0.92 | )% | | | (0.64 | )% | | | (0.77 | )% | | | (0.95 | )% | | | (0.90 | )% | |
Portfolio turnover rate(2) | | | 126 | % | | | 179 | % | | | 156 | % | | | 124 | % | | | 173 | % | |
(1) Per share net investment loss has been calculated using the daily average share method.
(2) Portfolio turnover is calculated on the basis of the Fund as a whole without distinguishing between the classes of shares issued.
The accompanying notes are an integral part of these financial statements.
page 47

Frontier Timpani Small Cap Growth Fund
FINANCIAL HIGHLIGHTS
| | | Service Class | |
| | | Year
Ended
June 30,
2018 | | Period
Ended
June 30,
2017(1) | |
Net Asset Value, Beginning of Period | | $ | 18.80 | | | $ | 15.42 | | |
INCOME FROM INVESTMENT OPERATIONS: | |
Net investment loss(2) | | | (0.23 | ) | | | (0.12 | ) | |
Net realized and unrealized gain on investments | | | 6.88 | | | | 3.50 | | |
Total Income from Investment Operations | | | 6.65 | | | | 3.38 | | |
Net Asset Value, End of Period | | $ | 25.45 | | | $ | 18.80 | | |
Total Return | | | 35.37 | % | | | 21.92 | %(3) | |
SUPPLEMENTAL DATA AND RATIOS: | |
Net assets, end of period (in hundreds) | | $ | 2,502 | | | $ | 1 | | |
Ratio of expenses to average net assets | |
Before waivers and reimbursements | | | 1.42 | % | | | 292.37 | %(4) | |
Net of waivers and reimbursements | | | 1.20 | % | | | 1.10 | %(4) | |
Ratio of net investment loss to average net assets | |
Before waivers and reimbursements | | | (1.20 | )% | | | (292.04 | )%(4) | |
Net of waivers and reimbursements | | | (0.98 | )% | | | (0.77 | )%(4) | |
Portfolio turnover rate(5) | | | 126 | % | | | 179 | % | |
(1) Commenced operations on July 15, 2016.
(2) Per share net investment loss has been calculated using the daily average share method.
(3) Not annualized.
(4) Annualized.
(5) Portfolio turnover is calculated on the basis of the Fund as a whole without distinguishing between the classes of shares issued.
The accompanying notes are an integral part of these financial statements.
page 48

Frontier Timpani Small Cap Growth Fund
FINANCIAL HIGHLIGHTS
| | | Class Y | |
| | | Year
Ended
June 30,
2018 | | Year
Ended
June 30,
2017 | | Year
Ended
June 30,
2016 | | Year
Ended
June 30,
2015 | | Period
Ended
June 30,
2014(1) | |
Net Asset Value, Beginning of Period | | $ | 18.54 | | | $ | 14.62 | | | $ | 18.48 | | | $ | 16.04 | | | $ | 16.35 | | |
INCOME (LOSS) FROM INVESTMENT OPERATIONS: | |
Net investment loss(2) | | | (0.28 | ) | | | (0.18 | ) | | | (0.18 | ) | | | (0.23 | ) | | | (0.08 | ) | |
Net realized and unrealized gain (loss) on investments | | | 6.76 | | | | 4.10 | | | | (3.68 | ) | | | 2.67 | | | | (0.23 | )(3) | |
Total Income (Loss) from Investment Operations | | | 6.48 | | | | 3.92 | | | | (3.86 | ) | | | 2.44 | | | | (0.31 | ) | |
Net Asset Value, End of Period | | $ | 25.02 | | | $ | 18.54 | | | $ | 14.62 | | | $ | 18.48 | | | $ | 16.04 | | |
Total Return | | | 34.95 | % | | | 26.81 | % | | | (20.84 | )% | | | 15.15 | % | | | (1.90 | )%(4) | |
SUPPLEMENTAL DATA AND RATIOS: | |
Net assets, end of period (in thousands) | | $ | 5,890 | | | $ | 3,954 | | | $ | 3,369 | | | $ | 2,262 | | | $ | 1,215 | | |
Ratio of expenses to average net assets | |
Before waivers and reimbursements | | | 1.74 | % | | | 1.75 | % | | | 1.70 | % | | | 1.95 | % | | | 2.73 | %(5) | |
Net of waivers and reimbursements | | | 1.50 | % | | | 1.50 | % | | | 1.50 | % | | | 1.50 | % | | | 1.50 | %(5) | |
Ratio of net investment loss to average net assets | |
Before waivers and reimbursements | | | (1.57 | )% | | | (1.35 | )% | | | (1.36 | )% | | | (1.82 | )% | | | (2.36 | )%(5) | |
Net of waivers and reimbursements | | | (1.33 | )% | | | (1.10 | )% | | | (1.16 | )% | | | (1.37 | )% | | | (1.13 | )%(5) | |
Portfolio turnover rate(6) | | | 126 | % | | | 179 | % | | | 156 | % | | | 124 | % | | | 173 | % | |
(1) Commenced operations on January 6, 2014.
(2) Per share net investment loss has been calculated using the daily average share method.
(3) Net realized and unrealized loss on investments does not reconcile with net realized and unrealized gain on investments in the Statement of Operations due to the timing of the Class Y inception.
(4) Not annualized.
(5) Annualized.
(6) Portfolio turnover is calculated on the basis of the Fund as a whole without distinguishing between the classes of shares issued.
The accompanying notes are an integral part of these financial statements.
page 49

Frontier Phocas Small Cap Value Fund
FINANCIAL HIGHLIGHTS
| | | Institutional Class | |
| | | Year
Ended
June 30,
2018 | | Year
Ended
June 30,
2017 | | Year
Ended
June 30,
2016 | | Year
Ended
June 30,
2015 | | Year
Ended
June 30,
2014 | |
Net Asset Value, Beginning of Period | | $ | 39.45 | | | $ | 33.45 | | | $ | 34.33 | | | $ | 35.96 | | | $ | 28.72 | | |
INCOME (LOSS) FROM INVESTMENT OPERATIONS: | |
Net investment income (loss) | | | 0.14 | | | | 0.12 | | | | 0.15 | | | | 0.19 | | | | (0.05 | )(1) | |
Net realized and unrealized gain (loss) on investments | | | 4.43 | | | | 6.04 | | | | (0.62 | ) | | | 0.08 | | | | 9.25 | | |
Total Income (Loss) from Investment Operations | | | 4.57 | | | | 6.16 | | | | (0.47 | ) | | | 0.27 | | | | 9.20 | | |
LESS DISTRIBUTIONS: | |
From net investment income | | | (0.15 | ) | | | (0.16 | ) | | | (0.22 | ) | | | (0.03 | ) | | | (0.05 | ) | |
From net realized gain on investments | | | (3.67 | ) | | | — | | | | (0.19 | ) | | | (1.87 | ) | | | (1.91 | ) | |
Total Distributions | | | (3.82 | ) | | | (0.16 | ) | | | (0.41 | ) | | | (1.90 | ) | | | (1.96 | ) | |
Net Asset Value, End of Period | | $ | 40.20 | | | $ | 39.45 | | | $ | 33.45 | | | $ | 34.33 | | | $ | 35.96 | | |
Total Return | | | 12.52 | % | | | 18.40 | % | | | (1.29 | )% | | | 0.84 | % | | | 32.72 | % | |
SUPPLEMENTAL DATA AND RATIOS: | |
Net assets, end of period (in thousands) | | $ | 38,735 | | | $ | 34,506 | | | $ | 31,946 | | | $ | 28,686 | | | $ | 24,152 | | |
Ratio of expenses to average net assets | |
Before waivers and reimbursements | | | 1.48 | % | | | 1.45 | % | | | 1.49 | % | | | 1.54 | % | | | 1.97 | % | |
Net of waivers and reimbursements | | | 0.95 | % | | | 1.10 | % | | | 1.10 | % | | | 1.10 | % | | | 1.10 | % | |
Ratio of net investment income (loss) to average net assets | |
Before waivers and reimbursements | | | (0.21 | )% | | | (0.03 | )% | | | 0.06 | % | | | 0.16 | % | | | (1.00 | )% | |
Net of waivers and reimbursements | | | 0.32 | % | | | 0.32 | % | | | 0.45 | % | | | 0.60 | % | | | (0.13 | )% | |
Portfolio turnover rate(2) | | | 68 | % | | | 53 | % | | | 49 | % | | | 52 | % | | | 53 | % | |
(1) Per share net investment loss has been calculated using the daily average share method.
(2) Portfolio turnover is calculated on the basis of the Fund as a whole without distinguishing between the classes of shares issued.
The accompanying notes are an integral part of these financial statements.
page 50

Frontier Phocas Small Cap Value Fund
FINANCIAL HIGHLIGHTS
| | | Service Class | |
| | | Year
Ended
June 30,
2018 | | Period
Ended
June 30,
2017(1) | |
Net Asset Value, Beginning of Period | | $ | 39.40 | | | $ | 34.66 | | |
INCOME FROM INVESTMENT OPERATIONS: | |
Net investment income | | | 0.10 | (2) | | | 0.12 | | |
Net realized and unrealized gain on investments | | | 4.43 | | | | 4.78 | | |
Total Income from Investment Operations | | | 4.53 | | | | 4.90 | | |
LESS DISTRIBUTIONS: | |
From net investment income | | | (0.16 | ) | | | (0.16 | ) | |
From net realized gain on investments | | | (3.67 | ) | | | — | | |
Total Distributions | | | (3.83 | ) | | | (0.16 | ) | |
Net Asset Value, End of Period | | $ | 40.10 | | | $ | 39.40 | | |
Total Return | | | 12.42 | % | | | 14.13 | %(3) | |
SUPPLEMENTAL DATA AND RATIOS: | |
Net assets, end of period (in hundreds) | | $ | 1 | | | $ | 1 | | |
Ratio of expenses to average net assets | |
Before waivers and reimbursements | | | 492.96 | % | | | 285.93 | %(4) | |
Net of waivers and reimbursements | | | 0.95 | % | | | 1.10 | %(4) | |
Ratio of net investment income (loss) to average net assets | |
Before waivers and reimbursements | | | (491.76 | )% | | | (284.49 | )%(4) | |
Net of waivers and reimbursements | | | 0.25 | % | | | 0.34 | %(4) | |
Portfolio turnover rate(5) | | | 68 | % | | | 53 | % | |
(1) Commenced operations on July 15, 2016.
(2) Per share net investment income has been calculated using the daily average share method.
(3) Not annualized.
(4) Annualized.
(5) Portfolio turnover is calculated on the basis of the Fund as a whole without distinguishing between the classes of shares issued.
The accompanying notes are an integral part of these financial statements.
page 51

NOTES TO FINANCIAL STATEMENTS
June 30, 2018
(1) ORGANIZATION
Frontier Funds, Inc. (the "Company") was incorporated on May 24, 1996, as a Maryland corporation and is registered under the Investment Company Act of 1940, as amended (the "1940 Act"), as an open-end investment company issuing shares in series (each, a "Fund," or collectively, the "Funds"), each series representing a distinct portfolio with its own investment objectives and policies. The investment objective of each of the Frontier MFG Global Equity Fund (the "Global Equity Fund"), Frontier MFG Global Plus Fund (the "Global Plus Fund") and Frontier Timpani Small Cap Growth Fund (the "Timpani Fund") is capital appreciation. The investment objective of the Frontier MFG Core Infrastructure Fund (the "Core Fund") is long-term capital appreciation. The investment objective of the Frontier Phocas Small Cap Value Fund (the "Phocas Fund") is long-term total investment through capital appreciation. Each Fund is a diversified fund, except the Global Equity and Global Plus Funds, which are non-diversified.
A summary of each Fund's investment adviser, subadviser and capital structure is as follows:
Fund | | Investment Adviser | | Subadviser | | Capital Structure | | Commencement
of Operations | |
Global Equity Fund (a) | | Frontegra Asset Management, Inc. ("Frontegra") | | MFG Asset Management ("MFG") | | Multi-Class
• Institutional
• Service Class (b) | | Dec. 28, 2011 | |
Global Plus Fund (a) | | Frontegra | | MFG | | Multi-Class
• Institutional
• Service Class
• Class Y (c) | | Mar. 23, 2015 | |
Core Fund (a) | | Frontegra | | MFG | | Multi-Class
• Institutional
• Service Class | | Jan. 18, 2012 | |
Timpani Fund | | Timpani Capital Management LLC ("Timpani") (d) | | None | | Multi-Class
• Institutional
• Service Class
• Class Y | | Mar. 23, 2011 | |
Phocas Fund | | Frontegra | | Phocas Financial Corp. ("Phocas") | | Multi-Class
• Institutional
• Service Class | | Sep. 29, 2006 | |
(a) A redemption fee of 2.00% will be charged on shares of the Fund redeemed 30 days or less from their date of purchase.
(b) As of June 30, 2018, the Service Class shares of the Global Equity Fund had not commenced operations.
(c) As of June 30, 2018, the Class Y shares of the Global Plus Fund had not commenced operations.
(d) Timpani is an affiliate of Frontegra.
(2) SIGNIFICANT ACCOUNTING POLICIES
Each Fund is an investment company and accordingly follows the investment company accounting and reporting guidance of the Financial Accounting Standards Board ("FASB") Accounting Standards Codification Topic 946 Financial Services — Investment Companies.
page 52

NOTES TO FINANCIAL STATEMENTS (continued)
June 30, 2018
The following is a summary of significant accounting policies consistently followed by the Funds in the preparation of their financial statements.
(a) Investment Valuation
Equity securities for which market quotations are readily available are valued at the last reported sale price on the national securities exchange on which such securities are primarily traded. Equity securities for which there were no transactions on a given day or securities not listed on a national securities exchange are valued at the most recent bid price. Equity securities that are traded on NASDAQ are valued using the NASDAQ Official Closing Price ("NOCP"). Debt securities are valued at the bid price provided by an independent pricing service, which uses valuation methods such as matrix pricing and other analytical pricing models as well as market transactions and dealer bid quotations. Shares of underlying mutual funds are valued at their respective Net Asset Value ("NAV"). Exchange-traded funds and closed-end funds are valued at the last reported sale price on the exchange on which the security is principally traded. Securities that are primarily traded on foreign exchanges generally are valued at the last sale price of such securities on their respective exchange. In the case of foreign securities, the occurrence of events after the close of the foreign markets, but prior to the time the Fund's NAV is calculated, will result in a systematic fair value adjustment to the trading prices of foreign securities. The Fund will value foreign securities at fair value using fair valuation procedures approved by the Board of Directors (the "Board"), taking into account such events in calculating the NAV. In such cases, use of fair valuation can reduce an investor's ability to seek to profit by estimating the Fund's NAV in advance of the time the NAV is calculated. The Board has retained an independent fair value pricing service to assist in valuing foreign securities held by the Global Equity, Global Plus and Core Funds. In valuing assets, prices denominated in foreign currencies are converted to U.S. dollar equivalents at the current exchange rate, which approximates fair value. Any securities or other assets for which market quotations are not readily available are valued at their fair value as determined in good faith by the advisers or subadvisers pursuant to guidelines established by the Board. The Board has appointed a Valuation Committee to assist the Board in its oversight of valuation procedures.
The Funds follow a fair value hierarchy that distinguishes between market data obtained from independent sources (observable inputs) and the Funds' own market assumptions (unobservable inputs). These inputs are used in determining the value of each Fund's investments and are summarized in the following fair value hierarchy:
Level 1 — Quoted prices in active markets for identical securities that the Funds have the ability to access
Level 2 — Evaluated prices based on other significant observable inputs (including quoted prices for similar securities, foreign security indices, foreign exchange rates, fair value estimates for foreign securities and changes in benchmark securities indices)
Level 3 — Significant unobservable inputs (including the Fund's own assumptions in determining fair value of investments)
The following is a summary of inputs used to value the Funds' securities as of June 30, 2018:
Global Equity Fund
Description | | Level 1 | | Level 2 | | Level 3 | | Total | |
Equity (a) | |
| Common Stocks | | $ | 771,971,330 | | | $ | 131,508,389 | | | $ | — | | | $ | 903,479,719 | | |
| Total Equity | | | 771,971,330 | | | | 131,508,389 | | | | — | | | | 903,479,719 | | |
Short-Term Investments | | | 198,221,662 | | | | — | | | | — | | | | 198,221,662 | | |
Total Investments in Securities | | $ | 970,192,992 | | | $ | 131,508,389 | | | $ | — | | | $ | 1,101,701,381 | | |
page 53

NOTES TO FINANCIAL STATEMENTS (continued)
June 30, 2018
Global Plus Fund
Description | | Level 1 | | Level 2 | | Level 3 | | Total | |
Equity (a) | |
| Common Stocks | | $ | 289,721,143 | | | $ | 49,307,450 | | | $ | — | | | $ | 339,028,593 | | |
| Total Equity | | | 289,721,143 | | | | 49,307,450 | | | | — | | | | 339,028,593 | | |
Short-Term Investments | | | 75,868,492 | | | | — | | | | — | | | | 75,868,492 | | |
Total Investments in Securities | | $ | 365,589,635 | | | $ | 49,307,450 | | | $ | — | | | $ | 414,897,085 | | |
Core Fund
Description | | Level 1 | | Level 2 | | Level 3 | | Total | |
Equity (a) | |
| Common Stocks | | $ | 225,559,319 | | | $ | 153,372,938 | | | $ | — | | | $ | 378,932,257 | | |
| Closed-End Funds | | | 1,896,067 | | | | 3,140,515 | | | | — | | | | 5,036,582 | | |
| Total Equity | | | 227,455,386 | | | | 156,513,453 | | | | — | | | | 383,968,839 | | |
Short-Term Investments | | | 11,821,574 | | | | — | | | | — | | | | 11,821,574 | | |
Total Investments in Securities | | $ | 239,276,960 | | | $ | 156,513,453 | | | $ | — | | | $ | 395,790,413 | | |
Timpani Fund
Description | | Level 1 | | Level 2 | | Level 3 | | Total | |
Equity (a) | |
| Common Stocks | | $ | 74,106,870 | | | $ | — | | | $ | — | | | $ | 74,106,870 | | |
| Total Equity | | | 74,106,870 | | | | — | | | | — | | | | 74,106,870 | | |
Short-Term Investments | | | 3,701,714 | | | | — | | | | — | | | | 3,701,714 | | |
Total Investments in Securities | | $ | 77,808,584 | | | $ | — | | | $ | — | | | $ | 77,808,584 | | |
Phocas Fund
Description | | Level 1 | | Level 2 | | Level 3 | | Total | |
Equity (a) | |
| Common Stocks | | $ | 37,850,510 | | | $ | — | | | $ | — | | | $ | 37,850,510 | | |
| Total Equity | | | 37,850,510 | | | | — | | | | — | | | | 37,850,510 | | |
Short-Term Investments | | | 1,065,523 | | | | — | | | | — | | | | 1,065,523 | | |
Total Investments in Securities | | $ | 38,916,033 | | | $ | — | | | $ | — | | | $ | 38,916,033 | | |
(a) See each Fund's Schedule of Investments for sector or country classifications.
It is the Funds' policy to record transfers between levels at the end of the reporting period. The table below shows the transfers between Level 1 and Level 2 due to fair valuation in certain foreign markets pursuant to a systematic valuation model. The Funds did not hold any Level 3 securities as of June 30, 2018.
| | Global Equity
Fund | | Global Plus
Fund | | Core
Fund | |
Transfers out of Level 1 | | $ | (68,323,733 | ) | | $ | (24,873,966 | ) | | $ | (91,755,573 | ) | |
Transfers into Level 2 | | | 68,323,733 | | | | 24,873,966 | | | | 91,755,573 | | |
Net transfers | | $ | — | | | $ | — | | | $ | — | | |
page 54

NOTES TO FINANCIAL STATEMENTS (continued)
June 30, 2018
(b) Federal Income Taxes
Each Fund intends to comply with the requirements of Subchapter M of the Internal Revenue Code of 1986, as amended, necessary to qualify as a regulated investment company and to make the requisite distributions of income and capital gains to its shareholders sufficient to relieve it from all or substantially all federal income taxes. Therefore, no federal income tax provision has been provided.
The Funds have adopted financial reporting rules regarding recognition and measurement of tax positions taken or expected to be taken on a tax return. The Funds recognize interest and penalties, if any, related to unrecognized tax benefits as income tax expense on the Statements of Operations. During the year, the Funds did not incur any interest or penalties. The Funds have reviewed all open tax years and concluded that there is no effect to any of the Fund's financial positions or results of operations and no tax liability resulting from unrecognized tax benefits relating to uncertain income tax positions taken or expected to be taken on a tax return. The Funds have no examinations in progress.
(c) Distributions to Shareholders
With the exception of the Core Fund, dividends from net investment income are usually declared and paid annually. The Core Fund usually declares and pays dividends quarterly. Distributions from net realized gains, if any, are declared and paid at least annually for all Funds. All short-term capital gains are included in ordinary income for tax purposes. Distributions to shareholders are recorded on the ex-dividend date.
The tax character of distributions paid during the fiscal years ended June 30, 2018, and June 30, 2017, were as follows:
| | Year Ended June 30, 2018 | | Year Ended June 30, 2017 | |
| | | Ordinary
Income | | Long-Term
Capital Gains | | Total
Distributions | | Ordinary
Income | | Long-Term
Capital Gains | | Total
Distributions | |
Global Equity Fund | | $ | 11,470,292 | | | $ | 34,574,142 | | | $ | 46,044,434 | | | $ | 16,181,930 | | | $ | 32,521,037 | | | $ | 48,702,967 | | |
Global Plus Fund | | | 8,238,519 | | | | 845,224 | | | | 9,083,743 | | | | 257,110 | | | | — | | | | 257,110 | | |
Core Fund | | | 11,183,377 | | | | 34,206 | | | | 11,217,583 | | | | 5,721,900 | | | | 358,530 | | | | 6,080,430 | | |
Phocas Fund | | | 130,243 | | | | 3,114,432 | | | | 3,244,675 | | | | 148,581 | | | | — | | | | 148,581 | | |
At June 30, 2018, the components of accumulated earnings/losses on a tax basis were as follows:
| | Global Equity
Fund | | Global Plus
Fund | | Core
Fund | | Timpani
Fund | | Phocas
Fund | |
Cost of investments | | $ | 822,939,923 | | | $ | 356,380,638 | | | $ | 374,570,329 | | | $ | 54,097,561 | | | $ | 30,178,180 | | |
Gross unrealized appreciation | | $ | 303,657,569 | | | $ | 67,628,002 | | | $ | 38,501,787 | | | $ | 24,302,776 | | | $ | 9,647,477 | | |
Gross unrealized depreciation | | | (24,896,111 | ) | | | (9,111,555 | ) | | | (17,281,703 | ) | | | (591,753 | ) | | | (909,624 | ) | |
Net unrealized appreciation | | | 278,761,458 | | | | 58,516,447 | | | | 21,220,084 | | | | 23,711,023 | | | | 8,737,853 | | |
Undistributed ordinary income | | | 14,214,372 | | | | 11,688,260 | | | | 1,378,242 | | | | — | | | | 1,853,423 | | |
Undistributed long-term capital gain | | | 44,543,040 | | | | 6,318,710 | | | | — | | | | 3,981,485 | | | | 2,979,388 | | |
Other accumulated gains (losses) | | | (43,008 | ) | | | (25,700 | ) | | | 592 | | | | (295,175 | ) | | | — | | |
Total distributable earnings | | $ | 337,475,862 | | | $ | 76,497,717 | | | $ | 22,598,918 | | | $ | 27,397,333 | | | $ | 13,570,664 | | |
page 55

NOTES TO FINANCIAL STATEMENTS (continued)
June 30, 2018
The difference between book-basis and tax-basis unrealized appreciation is attributable primarily to the tax deferral of losses on wash sales and mark-to-market on passive foreign investment companies.
During the year ended June 30, 2018, the Global Plus Fund and the Timpani Fund utilized capital loss carryforwards of $312,481 and $2,523,110, respectively.
In order to meet certain excise tax requirements, the Funds are required to measure and distribute annually, net capital gains realized during the twelve month period ending October 31. In connection with this requirement, the Funds are permitted, for tax purposes, to defer into their next fiscal year any net capital losses incurred from November 1 through the end of the fiscal year. As of the fiscal year ended June 30, 2018, the Timpani Fund deferred, on a tax basis, an ordinary late-year loss of $295,069.
(d) Foreign Currency Translation
Values of investments denominated in foreign currencies are converted into U.S. dollars using a spot market rate of exchange each day. Purchases and sales of investments and dividend and interest income are translated to U.S. dollars using a spot market rate of exchange prevailing on the dates of such transactions. The Funds do not isolate that portion of the results of operations resulting from changes in foreign exchange rates on investments from the fluctuations arising from changes in fair value of securities held. Such fluctuations are included with the net realized and unrealized gain or loss on investments. Each Fund separately reports net realized foreign exchange gains and losses that arise from sales of foreign currencies, currency gains or losses realized between the trade and settlement dates on securities transactions, and the difference between the amounts of dividends, interest, and foreign withholding taxes recorded on the Fund's books and the U.S. dollar equivalent of the amounts actually received or paid. Net unrealized foreign exchange gains and losses arise from changes in the fair values of assets and liabilities, other than investments in securities at fiscal period end, resulting from changes in exchange rates.
Each Fund, respectively, bears the risk of changes in the foreign currency exchange rates and their impact on the value of assets and liabilities denominated in foreign currency. Each Fund also bears the risk of a counterparty failing to fulfill its obligation under a foreign currency contract.
Investing in foreign companies involves risks not generally associated with investment in the securities of U.S. companies, including risks relating to political, social and economic developments abroad and differences between U.S. and foreign regulatory requirements and market practices, including fluctuations in foreign currencies. The risks of foreign investments are typically greater in emerging and less developed markets.
(e) Indemnifications
Under the Funds' organizational documents, their officers and directors are indemnified against certain liabilities arising out of the performance of their duties to the Funds. In addition, in the normal course of business, the Funds enter into contracts that provide general indemnifications to other parties. The Funds' maximum exposure under these arrangements is unknown as this would involve future claims that may be made against the Funds that have not yet occurred. However, the Funds have not had prior claims or losses pursuant to these contracts and expect the risk of loss to be remote.
page 56

NOTES TO FINANCIAL STATEMENTS (continued)
June 30, 2018
(f) Agreement and Plan of Reorganization
On November 14, 2017, shareholders of the Frontier Netols Small Cap Value Fund — Institutional Class and Class Y ("Netols Fund — Institutional Class" and "Netols Fund — Class Y" and together, the "Netols Fund") approved the reorganization of the Netols Fund with and into the Phocas Fund — Institutional Class. The purpose of the reorganization was to combine two funds within the Company with similar investment objectives and strategies. The reorganization provided for the transfer of assets of the Netols Fund to the Phocas Fund and the assumption of the liabilities of the Netols Fund by the Phocas Fund. The reorganization was effective as of the close of business on November 17, 2017. For each share of the Netols Fund — Institutional Class and Netols Fund — Class Y, shareholders received 0.0988 share and 0.0825 share, respectively, of the Phocas Fund — Institutional Class. The following tables illustrate the specifics of the reorganization:
Netols Fund
Net Assets | | Shares Issued
to Shareholders
of Netols Fund | | Phocas Fund
Net Assets | | Combined
Net Assets | | Tax Status
of Transfer | |
$ | 25,882,024 | (1) | | | 692,998 | | | $ | 34,717,866 | | | $ | 60,599,890 | | | Non-taxable | |
(1) Includes accumulated net realized gain and net unrealized appreciation on investments in the amounts of $9,571,855 and $2,222,159, respectively.
For financial reporting purposes, assets received and shares issued by the Phocas Fund were recorded at fair value; however, the cost basis of the investments received from the Netols Fund was carried forward to align ongoing reporting of the Phocas Fund's realized and unrealized gains and losses with amounts distributable to shareholders for tax purposes.
Assuming the reorganization had been completed on July 1, 2017, the beginning of the reporting period, the pro forma results of operations for the year ended June 30, 2018, would have been as follows:
Net investment income | | $ | 179,970 | | |
Net realized gain on investments | | | 20,712,322 | | |
Change in net unrealized depreciation on investments | | | (15,076,133 | ) | |
Net increase in net assets resulting from operations | | $ | 5,816,159 | | |
Because the Phocas Fund has been managed as a single integrated portfolio since the reorganization was completed, it is not practicable to separate the amounts of revenue and earnings of the Netols and Phocas Funds that have been included in the Phocas Fund's Statement of Operations since November 17, 2017.
(g) Other
Investment transactions are accounted for on the trade date. The Funds determine the gain or loss realized from investment transactions by comparing the original cost of the specifically identified security lot sold with the net sale proceeds. Dividend income, less foreign taxes withheld, is recognized on the ex-dividend date, except that certain dividends from foreign securities are recorded as soon as the information becomes available to the Funds. Interest income is recognized on an accrual basis. All discounts/premiums are accreted/amortized using the effective interest method and are included in interest income. Withholding taxes on foreign dividends have been provided for in accordance with the Funds' understanding of the applicable country's tax codes and regulations.
page 57

NOTES TO FINANCIAL STATEMENTS (continued)
June 30, 2018
Income, expenses (other than expenses attributable to a specific class) and realized and unrealized gains or losses on investments attributable to the Funds are generally allocated to each respective class in proportion to the relative net assets of each class. Expenses incurred that do not specifically relate to an individual Fund are allocated among all Funds in the Company in proportion to each Fund's relative net assets or by other equitable means.
The preparation of financial statements in conformity with U.S. generally accepted accounting principles ("GAAP") requires management to make estimates and assumptions that affect the reported amounts of assets and liabilities and disclosure of contingent assets and liabilities at the date of the financial statements, and the reported amounts of increases and decreases in net assets from operations during the reporting period. Actual results could differ from those estimates.
Net investment income and realized gains and losses for federal income tax purposes may differ from that reported on the financial statements because of permanent book-to-tax differences. GAAP requires that permanent differences in net investment income and realized gains and losses due to differences between financial reporting and tax reporting be reclassified between various components of net assets. These reclassifications have no effect on net assets or net asset value per share. For the fiscal year ended June 30, 2018, the following table shows the reclassifications made:
| | Global Equity
Fund | | Global Plus
Fund | | Core
Fund | | Timpani
Fund | | Phocas
Fund | |
Paid in capital | | $ | — | | | $ | — | | | $ | — | | | $ | (486,749 | ) | | $ | 50,032 | | |
Undistributed net investment income (loss) | | | (87,745 | ) | | | (26,823 | ) | | | (101,134 | ) | | | 486,749 | | | | — | | |
Accumulated undistributed net realized gain (loss) | | | 87,745 | | | | 26,823 | | | | 101,134 | | | | — | | | | (50,032 | ) | |
The permanent differences primarily relate to foreign currency and net operating losses.
(3) INVESTMENT ADVISER AND RELATED PARTIES
The Company, on behalf of the Global Equity, Global Plus, Core and Phocas Funds, has entered into an agreement with Frontegra, with whom certain officers and a director of the Funds are affiliated, to furnish investment advisory services to such Funds. Timpani, an affiliate of Frontegra, is the investment adviser to the Timpani Fund. Fees are calculated daily and payable monthly, at annual rates set forth in the following table (expressed as a percentage of each Fund's average daily net assets). Pursuant to expense cap agreements, Frontegra and Timpani have agreed to waive their respective management fees and/or reimburse each Fund's operating expenses (exclusive of brokerage, acquired fund fees and expenses, interest, taxes and extraordinary expenses) to ensure that each Fund's operating expenses do not exceed the expense limitation listed below. Expenses waived are netted with advisory fees payable on the Statements of Assets and Liabilities. On a monthly basis, these accounts are settled by each Fund making payment to the respective adviser or the respective adviser reimbursing the Fund if the reimbursement amount exceeds the advisory fee. If the amount of fees waived exceeds the advisory fee earned, this is shown on the Statements of Assets and Liabilities as a receivable from the respective adviser. The expense cap agreements will continue in effect until October 31, 2020, with successive renewal terms of one year unless terminated by an adviser or a Fund prior to any such renewal.
Frontier Fund | | Annual Advisory Fees | | Expense Limitation | |
Global Equity Fund | | | 0.80 | % | | | 0.80 | % | |
Global Plus Fund - Institutional Class | | | 0.80 | % | | | 0.80 | % | |
Global Plus Fund - Service Class | | | 0.80 | % | | | 0.95 | % | |
Core Fund - Institutional Class | | | 0.70 | % | | | 0.70 | % | |
Core Fund - Service Class | | | 0.70 | % | | | 0.85 | % | |
page 58

NOTES TO FINANCIAL STATEMENTS (continued)
June 30, 2018
Frontier Fund | | Annual Advisory Fees | | Expense Limitation | |
Timpani Fund - Institutional Class | | | 1.00 | % | | | 1.10 | % | |
Timpani Fund - Service Class | | | 1.00 | % | | | 1.25 | % | |
Timpani Fund - Class Y | | | 1.00 | % | | | 1.50 | % | |
Phocas Fund - Institutional Class | | | 1.00 | % | | | 0.95 | % | |
Phocas Fund - Service Class | | | 1.00 | % | | | 1.10 | % | |
Effective July 1, 2018, the annual advisory fees for each class of the Phocas Fund were reduced to 0.85%.
An adviser is entitled to recoup the fees waived and/or expenses reimbursed within a three-year period from the time the expenses were incurred to the extent of the expense limitations described above and in place at the time of the recoupment. Expenses attributable to a specific class may only be recouped with respect to that class.
The following table shows the waived or reimbursed expenses subject to potential recovery expiring on:
| | June 30, | |
| | 2019 | | 2020 | | 2021 | | Total | |
Global Equity Fund | | $ | 543,066 | | | $ | 520,095 | | | $ | 549,935 | | | $ | 1,613,096 | | |
Global Plus Fund | | | 161,019 | | | | 258,029 | | | | 331,218 | | | | 750,266 | | |
Core Fund | | | 235,636 | | | | 272,224 | | | | 325,570 | | | | 833,430 | | |
Timpani Fund | | | 117,182 | | | | 129,977 | | | | 150,722 | | | | 397,881 | | |
Phocas Fund | | | 115,125 | | | | 122,491 | | | | 205,354 | | | | 442,970 | | |
Frontegra has entered into a subadvisory agreement under which MFG serves as the subadviser to the Global Equity, Global Plus and Core Funds, and subject to Frontegra's supervision, manages each Fund's portfolio assets. Under the agreement, MFG is compensated by Frontegra for its investment advisory services at the annual rate of 75% of the net advisory fee received by Frontegra with respect to each Fund, after giving effect to any fee waiver or reimbursement by Frontegra pursuant to the expense cap agreement discussed above. In the event Frontegra is required to reimburse expenses to a Fund under the terms of the expense cap agreement, MFG shall reimburse Frontegra 75% of the reimbursed expenses.
Frontegra has also entered into a subadvisory agreement under which Phocas serves as the subadviser to the Phocas Fund, and subject to Frontegra's supervision, manages the Fund's portfolio assets. Under the agreement, Phocas is compensated by Frontegra for its investment advisory services at the annual rate of 0.25% of the Fund's average daily net assets when the Fund has net assets of $75,000,000 or less, after giving effect to any fee waiver or reimbursement by Frontegra pursuant to the expense cap agreement discussed above. When the Phocas Fund's net assets exceed $75,000,000, Frontegra will compensate Phocas at 50% of the net advisory fee received by Frontegra from the Fund after giving effect to any fee waiver or reimbursement by Frontegra pursuant to the expense cap agreement.
The beneficial ownership, either directly or indirectly, of more than 25% of a Fund's voting securities creates a presumption of control. As of June 30, 2018, the Global Equity, Global Plus, Core and Timpani Funds had individual shareholder accounts and/or omnibus shareholder accounts (comprised of a group of individual shareholders), which amounted to more than 25% of the total shares outstanding of the respective Fund. Shareholders with a controlling interest could affect the outcome of proxy voting or direction of management of a Fund.
page 59

NOTES TO FINANCIAL STATEMENTS (continued)
June 30, 2018
(4) INVESTMENT TRANSACTIONS
The aggregate purchases and sales of securities, excluding short-term investments, for the Funds for the year ended June 30, 2018, are summarized below:
| | | Global Equity
Fund | | Global Plus
Fund | | Core
Fund | | Timpani
Fund | | Phocas
Fund | |
Purchases | | $ | 283,444,165 | | | $ | 220,754,386 | | | $ | 204,617,169 | | | $ | 81,078,571 | | | $ | 25,620,507 | | |
Sales | | $ | 485,298,044 | | | $ | 257,132,588 | | | $ | 55,981,712 | | | $ | 72,318,798 | | | $ | 51,969,505 | | |
There were no purchases or sales of U.S. Government securities for the Funds.
(5) DISTRIBUTION PLAN AND SHAREHOLDER SERVICING FEE
The Company, on behalf of the Global Plus and Timpani Funds, has adopted a distribution plan pursuant to Rule 12b-1 under the 1940 Act for each Fund's Class Y shares (the "12b-1 Plan"). Pursuant to the 12b-1 Plan, the Class Y shares of each Fund pay an annual fee of up to 0.25% to Frontegra Strategies, LLC (the "Distributor"), an affiliate of Frontegra and MFG, for payments to brokers, dealers and other financial intermediaries who perform activities or incur expenses intended to result in the sale of Class Y shares of the Funds. As of June 30, 2018, the Class Y shares of the Global Plus Fund had not commenced operations. For the year ended June 30, 2018, the Timpani Fund incurred $11,299 under the 12b-1 Plan.
The Company has adopted a shareholder servicing plan (the "Service Plan") on behalf of the Class Y and Service Class shares offered by certain Funds. Pursuant to the Service Plan, the Service Class and Class Y shares of the applicable Funds pay an annual shareholder servicing fee of up to 0.15% per year to the Distributor for payments to brokers, dealers, and other financial intermediaries who provide on-going account services to shareholders. Those services include establishing and maintaining shareholder accounts, mailing prospectuses, account statements and other Fund documents to shareholders, processing shareholder transactions, and providing other recordkeeping and administrative services. As of June 30, 2018, the Class Y shares of the Global Plus Fund and the Service Class shares of the Global Equity Fund had not commenced operations. For the year ended June 30, 2018, the Service Plan expenses were as follows:
| | Service Plan Expenses | |
| Global Plus Fund - Service Class | | $ | 61,257 | | |
| Core Fund - Service Class | | $ | 13,632 | | |
| Timpani Fund - Service Class | | $ | 131 | | |
| Timpani Fund - Class Y | | $ | 6,779 | | |
| Phocas Fund - Service Class | | $ | — | | |
page 60

REPORT OF INDEPENDENT REGISTERED PUBLIC ACCOUNTING FIRM
June 30, 2018
To the Shareholders and Board of Directors of Frontier Funds, Inc.
Opinion on the Financial Statements
We have audited the accompanying statements of assets and liabilities, including the schedules of investments, of Frontier Funds, Inc. comprising Frontier MFG Global Equity Fund, Frontier MFG Global Plus Fund, Frontier MFG Core Infrastructure Fund, Frontier Timpani Small Cap Growth Fund, and Frontier Phocas Small Cap Value Fund (the "Funds") as of June 30, 2018, and the related statements of operations for the year then ended, the statements of changes in net assets for each of the two years in the period then ended, including the related notes, and the financial highlights for each of the five years in the period then ended for Frontier MFG Global Equity Fund, Frontier MFG Core Infrastructure Fund, Frontier Timpani Small Cap Growth Fund, and Frontier Phocas Small Cap Value Fund, and the related statement of operations for the year then ended, the statements of changes in net assets for each of the two years in the period then ended, including the related notes, and the financial highlights for each of the four periods in the period then ended for Frontier MFG Global Plus Fund (collectively referred to as the "financial statements"). In our opinion, the financial statements present fairly, in all material respects, the financial position of each of the Funds as of June 30, 2018, the results of their operations for the year then ended, the changes in their net assets for each of the two years in the period then ended, and the financial highlights for each of the periods indicated above, in conformity with accounting principles generally accepted in the United States of America.
Basis for Opinion
These financial statements are the responsibility of the Funds' management. Our responsibility is to express an opinion on the Funds' financial statements based on our audits. We are a public accounting firm registered with the Public Company Accounting Oversight Board (United States) ("PCAOB") and are required to be independent with respect to the Funds in accordance with the U.S. federal securities laws and the applicable rules and regulations of the Securities and Exchange Commission and the PCAOB.
We conducted our audits in accordance with the standards of the PCAOB. Those standards require that we plan and perform the audit to obtain reasonable assurance about whether the financial statements are free of material misstatement, whether due to error or fraud.
Our audits include performing procedures to assess the risks of material misstatement of the financial statements, whether due to error or fraud, and performing procedures that respond to those risks. Such procedures include examining, on a test basis, evidence regarding the amounts and disclosures in the financial statements and confirmation of securities owned as of June 30, 2018, by correspondence with the custodian and brokers or by other appropriate auditing procedures where replies from brokers were not received. Our audits also included evaluating the accounting principles used and significant estimates made by management, as well as evaluating the overall presentation of the financial statements. We believe that our audits provide a reasonable basis for our opinion.
We have served as the Funds' auditor since 2012.

COHEN & COMPANY, LTD.
Milwaukee, Wisconsin
August 27, 2018
page 61

BOARD OF DIRECTORS' APPROVAL OF ADVISORY AND
SUBADVISORY AGREEMENTS
(Unaudited)
The Board of Directors (the "Board") of Frontier Funds, Inc. (the "Company"), including the directors who are not "interested persons" as defined in Section 2(a)(9) of the Investment Company Act of 1940, as amended (the "Independent Directors"), met on May 22, 2018, to consider the annual renewal of:
(a) the investment advisory agreement between Frontegra Asset Management, Inc. ("Frontegra") and the Company on behalf of the Frontier MFG Global Equity Fund (the "Global Equity Fund"), the Frontier MFG Global Plus Fund (the "Global Plus Fund"), the Frontier MFG Core Infrastructure Fund (the "Core Fund"), and the Frontier Phocas Small Cap Value Fund (the "Phocas Fund") (the "Existing Frontegra Advisory Agreement");
(b) the investment advisory agreement between Timpani Capital Management, LLC ("Timpani") and the Company on behalf of the Frontier Timpani Small Cap Growth Fund (the "Timpani Fund") (the "Timpani Advisory Agreement"); and
(c) the existing subadvisory agreements for the Global Equity Fund, the Global Plus Fund, the Core Fund and the Phocas Fund (collectively, the "Subadvised Funds").
At the May 22, 2018 meeting, the Board also considered new advisory and subadvisory agreements to take effect upon a change in control of Frontegra. As discussed in more detail in the Company's Definitive Proxy Statement, filed with the SEC on July 23, 2018, the Existing Frontegra Advisory Agreement and existing subadvisory agreements will terminate later this year due to a proposed change of control of Frontegra. Frontegra North America Holdings Inc. ("FNAH"), a majority-owned subsidiary of Magellan Financial Group Limited ("MFG") and affiliate of Magellan Asset Management Limited doing business as MFG Asset Management ("MFG Asset Management") (the subadviser to the Global Equity Fund, the Global Plus Fund and the Core Fund (collectively, the "MFG Funds")), will acquire 100% of the equity interests of Frontegra in accordance with the terms of certain purchase and sale agreements relating to Frontegra and affiliated companies owned or previously owned by William D. Forsyth III (the "Transaction"). The purchase of Frontegra will constitute an "assignment" of the Existing Frontegra Advisory Agreement within the meaning of the Investment Company Act of 1940, as amended (the "1940 Act"). The new agreements will become effective upon closing of the purchase of Frontegra, subject to approval by shareholders. Timpani is not affected by the Transaction. Accordingly, no changes will occur to the Timpani Advisory Agreement.
In light of the Transaction and in order to avoid disruption to the Subadvised Funds' investment programs, the Board, including a majority of Independent Directors, also considered the approval of:
(a) the proposed investment advisory agreement between Frontegra and the Company on behalf of the Subadvised Funds to be effective upon the change of control of Frontegra (the "New Frontegra Advisory Agreement"); and
(b) the new subadvisory agreements for the Subadvised Funds to be effective upon the change of control of Frontegra.
New and Existing Frontegra Advisory Agreements (Global Equity Fund, Global Plus Fund, Core Fund and Phocas Fund)
In connection with its review of the Existing Frontegra Advisory Agreement and the New Frontegra Advisory Agreement, the Board was provided materials relevant to its consideration of such agreements, such as information regarding Frontegra's compliance program, personnel and financial condition, summary data and risk management reports provided by Fund management and a memorandum prepared by the Company's legal counsel. The Board also reviewed the advisory fee payable by each Subadvised Fund under both agreements, the expense cap agreement between the Company and Frontegra on behalf of each Subadvised Fund and comparative fee and expense information provided by an independent service. The Board noted that the New Frontegra Advisory Agreement contains similar terms with respect to the investment advisory services provided by Frontegra and an identical fee structure as the Existing Frontegra
page 62

Advisory Agreement, except for the reduction of the Phocas Fund's advisory fee to 0.85%, effective July 1, 2018. The Directors noted that the New Frontegra Advisory Agreement would continue the relationship between the Company and Frontegra while adding more specificity about the advisory and administrative services provided by Frontegra under such agreement. The Board was also provided with Frontegra's response to the Section 15(c) request submitted by the Company's legal counsel on behalf of the Directors, as well as a response provided by MFG Asset Management that provided additional details about the Transaction.
The Directors discussed with representatives of Frontegra the operations of the Subadvised Funds and the nature, extent and quality of the advisory and other services provided to the Subadvised Funds by Frontegra. The Directors also met with representatives of MFG via teleconference at the May 22, 2018, meeting who provided additional information about the Transaction, MFG's and FNAH's financial arrangements with Frontegra and its affiliates and other relevant information. The Board also referred to a memorandum from Frontegra's legal counsel that contained a detailed discussion regarding the Transaction and was previously reviewed by the Board at its February 27, 2018, Board meeting.
In reaching its decision to renew the Existing Frontegra Advisory Agreement and approve the New Frontegra Advisory Agreement, the Board considered their legal responsibilities with regard to all factors deemed to be relevant to its consideration of each agreement, as applicable, including but not limited to the following: (1) information routinely provided at quarterly meetings throughout the year regarding the quality of services provided by Frontegra, as well as the quality of the services provided to the Subadvised Funds and other portfolios of the Company since Frontegra first became investment adviser to the Company in 1996; (2) the performance of each Subadvised Fund since Frontegra became the investment adviser to such Fund; (3) the fact that the Transaction is not expected to affect the manner in which each Subadvised Fund is advised and MFG and Frontegra's assurances that no diminution in services provided by Frontegra will occur; (4) the fact that the Company's key management personnel are not expected to change following the Transaction and the investment management teams at each Subadviser will continue to manage the applicable Subadvised Funds; (5) the fee structure under the New Frontegra Advisory Agreement would be identical to the fee structure under the Existing Frontegra Advisory Agreement, including the pending reduction in the Phocas Fund's advisory fee that would be effective July 1, 2018; (6) the fact that Frontegra and FNAH have no present intention to increase the advisory fee rate or alter the expense waivers; (7) MFG's and Frontegra's representations about Frontegra's financial resources notwithstanding the restructuring of, and increase to, MFG Asset Management's subadvisory fee and the anticipated financial support to be available to Frontegra through FNAH; (8) the changes to terms in the New Frontegra Advisory Agreement from the Existing Frontegra Advisory Agreement are generally to conform to current regulatory requirements and industry best practices and to specify the additional advisory and administrative services Frontegra provides as investment adviser to the Subadvised Funds; and (9) other factors deemed relevant. The Board noted that if the Transaction was not consummated, the Existing Frontegra Advisory Agreement would remain in effect through the current term of the agreement.
The Board also considered whether the Transaction was structured in compliance with Section 15(f) of the 1940 Act, which contains provisions intended to protect the interests of Fund shareholders.
The Board also took into account their cumulative experience in working with Frontegra and its ongoing review of information and discussions with representatives of Frontegra throughout the year at Board meetings. The Board also considered the information routinely provided at quarterly meetings throughout the year regarding brokerage and trading, Fund expenses, compliance issues and related matters. The Independent Directors met in executive session to discuss Frontegra's 15(c) response and the proposed renewal of the Existing Frontegra Advisory Agreement and approval of the New Frontegra Advisory Agreement. During the executive session, the Independent Directors discussed the responsibilities and duties of the Board of Directors in considering the renewal and approval of the agreements with the Company's legal counsel. The Independent Directors also met in executive session with the Company's Chief Compliance Officer to discuss compliance matters.
With respect to both the Existing Frontegra Advisory Agreement and the New Frontegra Advisory Agreement, the Board considered whether such agreements would be in the best interests of each Subadvised Fund and its shareholders and the overall fairness of the
page 63

agreements. Among other things, the Board reviewed information concerning: (1) the nature, extent and quality of the services provided by Frontegra; (2) each Subadvised Fund's investment performance; (3) the cost of the services provided and the profits realized by Frontegra and its affiliates from their relationship with the Company on behalf of each Subadvised Fund; (4) the extent to which economies of scale have been or will be realized as each Subadvised Fund grows; and (5) the extent to which fee levels reflect the economies of scale, if any, for the benefit of each Subadvised Fund's shareholders. In its deliberations, the Board did not identify any single factor as determinative.
In considering the Existing Frontegra Advisory Agreement and the New Frontegra Advisory Agreement, the Board reviewed and analyzed various factors with respect to each Subadvised Fund that it determined were relevant, including the factors below, and made the following conclusions with respect to each Subadvised Fund.
Nature, Extent and Quality of the Services to be Provided. The Board considered Frontegra's background and services it would continue to provide to the Subadvised Funds and their shareholders under both agreements, as well as the qualifications and background of Frontegra and its personnel. The Board noted that Frontegra serves as a manager of managers and had selected the subadvisers to make the day-to-day investment decisions for the Subadvised Funds. The Board considered that Frontegra has 22 years of experience in hiring and supervising subadvisers to portfolios in the Frontier family of funds. The Board discussed Frontegra's responsibilities for overseeing the subadvisers and supervising the management of the Subadvised Funds' investments. The Board also considered the quality of other services provided by Frontegra, including monitoring each Fund's compliance with applicable requirements under the securities laws, due diligence of subadvisers, performance oversight, risk management oversight, oversight and coordination of service providers, oversight of financial reporting, oversight of the Subadvised Funds' valuation policy, administration of the Subadvised Funds' compliance program and the shareholder servicing and administrative services provided by Frontegra to the Subadvised Funds, such as the provision of Fund officers and office space. The Board concluded that the range of services to be provided by Frontegra was appropriate and that Frontegra was qualified to provide such services. With respect to the New Frontegra Advisory Agreement, the Board took into account that there will be no changes that will adversely impact Frontegra's ability to provide the same quality of services as are provided under the Existing Advisory Agreement, and the advisory services to be provided under the New Frontegra Advisory Agreement are similar to those provided under the Existing Frontegra Advisory Agreement. The Board concluded that the range of services to be provided by Frontegra under both agreements was appropriate and that Frontegra was qualified to provide such services.
Performance Record of the Funds. As described in more detail under "Subadvisory Agreements," the Board reviewed each Subadvised Fund's performance record for the periods ended December 31, 2017. The Directors considered that Frontegra does not directly manage the Subadvised Funds' investment portfolios, but had delegated those duties to the respective subadvisers. After considering all of the information, the Board concluded that, although past performance is not a guarantee of future results, the Subadvised Funds and their shareholders were likely to benefit from Frontegra's continued management.
Advisory Fees. The Board compared each Subadvised Fund's contractual advisory fee and total expense ratio to the industry data with respect to other mutual funds in the same Morningstar peer group under both the Existing and New Frontegra Advisory Agreements. The Board noted that the advisory fees for the Global Equity Fund and Global Plus Fund (the "MFG Global Funds") were higher than the industry average for funds in the same Morningstar category. It also noted that the total expense ratios of the Institutional Class shares of each of the MFG Global Funds and Service Class shares of the Global Plus Fund, after giving effect to the contractual expense cap agreement, were generally in line with industry averages. The net expense ratio of the Class Y shares of the Global Plus Fund was well below the industry average of comparable funds. The Board noted that the advisory fee for the Core Fund was below the industry average for funds in the same Morningstar category, and that the total expense ratio of the Institutional Class and Service Class shares of the Core Fund, after giving effect to the contractual expense cap agreement, were both well below industry averages. With respect to the Phocas Fund, the Board noted that the Phocas Fund's advisory fee would be reduced under both the Existing and New Frontegra Advisory Agreements from an annual rate of 1.00% to 0.85% of the Fund's average daily net assets ("ADNA"), effective July 1, 2018. The Board noted that the new advisory fee for the Phocas Fund was below the industry average for funds in the same Morningstar category, and
page 64

that the total expense ratios of the Institutional Class and Service Class shares of the Phocas Fund, after giving effect to the contractual expense cap agreement, were both below industry averages. Based on the foregoing, the Board concluded that the advisory fee paid by each Subadvised Fund to Frontegra was reasonable in light of the nature and quality of services to be provided and fees paid by comparable funds.
Costs and Profitability. The Board considered information regarding the costs and profitability of Frontegra with respect to the Subadvised Funds. The Board considered the amount of the advisory fee Frontegra would retain with respect to each of the MFG Funds under the new subadvisory agreement with MFG Asset Management. The Board considered information concerning Frontegra's financial condition, costs and profitability. The Board considered the proposed restructuring of, and increase to, the subadvisory fee with MFG Asset Management on Frontegra's expected profitability for the MFG Funds, as well as representations by Frontegra and MFG that Frontegra will have sufficient financial resources to provide the contracted services to the Subadvised Funds following the closing of the Transaction. The Board considered the fact that Frontegra had renewed the contractual expense cap agreement on behalf of the Subadvised Funds. The Board noted that Frontegra was still waiving a portion of its fees for each Subadvised Fund. The Board concluded that Frontegra's current level of profitability was reasonable considering the quality of management and the fact that Frontegra was waiving a portion of its fees for the Subadvised Funds.
Economies of Scale. The Board reviewed asset levels on a per Subadvised Fund and aggregate basis, and considered whether there may be economies of scale in the management of each Subadvised Fund at current levels and if its assets were to increase significantly. The Board noted that the Global Equity Fund is closed to new investors. The Board concluded that the assets of the Subadvised Funds were not likely to increase to such an extent that breakpoints would be appropriate, particularly in light of the expense cap agreements in place between Frontegra and each Subadvised Fund and that the current fee arrangements were appropriate.
Benefits to Frontegra. The Board considered information presented regarding any benefits to Frontegra or its affiliates from serving as adviser to the Subadvised Funds (in addition to the advisory fee). The Board noted that Frontier Partners, Inc., an affiliated company ("Frontier"), provides consulting and marketing services to, and is compensated by the subadvisers to the Subadvised Funds for new client relationships introduced to the subadvisers, and Frontegra Strategies, LLC, the Company's distributor (the "Distributor"), will receive solicitation fees from MFG Asset Management for referrals of new shareholders to the MFG Funds. However, the Board determined that Frontegra's services to the Subadvised Funds would not be compromised by this potential conflict of interest, noting that the Subadvised Funds do not pay any solicitation fees to Frontier or any affiliate. The Board also considered financial arrangements, stock ownership and other benefits to Mr. Forsyth under the purchase and sale agreements and the employment agreement with FNAH, as well as the parties' undertaking to comply with the Section 15(f) safe harbor with respect to payments in connection with the transfer of advisory arrangements.
On the basis of its review of the foregoing information, the Board found that the terms of the Existing Frontegra Advisory Agreement and the New Frontegra Advisory Agreement were fair and reasonable and in the best interests of each Fund's shareholders.
Timpani Advisory Agreement (Timpani Fund)
In connection with the Board's review of the Timpani Advisory Agreement at the May 22, 2018, meeting, the Board was provided materials relevant to its consideration of the agreement, such as performance assessments against the Timpani Fund's peer group and benchmark index, Timpani's Form ADV, information regarding the Timpani's compliance program, personnel and financial condition, summary data and a risk management report provided by Fund management and a memorandum prepared by the Company's legal counsel. The Board also reviewed the advisory fee payable by the Timpani Fund under the Timpani Advisory Agreement, the expense cap agreement between the Company and Timpani on behalf of the Timpani Fund and comparative fee and expense information provided by an independent service. The Board was also provided with Timpani's response to the Section 15(c) request submitted by the Company's
page 65

legal counsel on behalf of the Directors. The Directors discussed with representatives of Timpani the operations of the Timpani Fund and the nature, extent and quality of the advisory and other services provided to the Timpani Fund by Timpani.
In evaluating the Timpani Advisory Agreement, the Board took into account their cumulative experience in working with Timpani and their ongoing review of information and discussions with representatives of Timpani throughout the year at Board meetings. The Board also took into account information routinely provided at quarterly meetings throughout the year regarding the quality of services provided by Timpani, performance of the Timpani Fund, brokerage and trading, Timpani Fund expenses, compliance issues and related matters. The Independent Directors met in executive session to discuss Timpani's 15(c) response and the proposed renewal of the Timpani Advisory Agreement. The Board also noted that the Transaction had no effect on the Timpani Fund. During the executive session, the Independent Directors discussed the responsibilities and duties of the Board of Directors in considering the continuation of the agreements with legal counsel. The Independent Directors also met in executive session with the Company's Chief Compliance Officer to discuss compliance matters.
With respect to the Timpani Advisory Agreement, the Board considered whether such agreement would be in the best interests of the Timpani Fund and its shareholders and the overall fairness of the agreement. Among other things, the Board reviewed information concerning: (1) the nature, extent and quality of the services provided by Timpani; (2) the Timpani Fund's investment performance; (3) the cost of the services provided and the profits realized by Timpani and its affiliates from their relationship with the Company on behalf of the Timpani Fund; (4) the extent to which economies of scale have been or will be realized as the Timpani Fund grows; and (5) the extent to which fee levels reflect the economies of scale, if any, for the benefit of the Timpani Fund's shareholders. In its deliberations, the Board did not identify any single factor as determinative.
In considering the Timpani Advisory Agreement, the Board reviewed and analyzed various factors with respect to the Timpani Fund that it determined were relevant, including the factors below, and made the following conclusions with respect to the Timpani Fund.
Nature, Extent and Quality of the Services to be Provided. The Board considered Timpani's experience as a small cap growth manager and services it would continue to provide to the Timpani Fund and its shareholders under the Timpani Advisory Agreement. The Board considered the experience of Timpani and its portfolio manager managing small cap growth accounts. The Board discussed Timpani's responsibilities for managing the Fund's investments and overseeing the Fund's other activities, such as monitoring its compliance with applicable requirements under the securities laws. The Board noted that certain distribution, administrative and compliance services are provided by Frontegra and the Distributor, each an affiliate of Timpani. The Board concluded that the range of services to be provided by Timpani was appropriate and that Timpani was qualified to provide such services.
Investment Performance. The Board reviewed the performance of the Institutional Class for the one-year, three-year, five-year and since-inception periods ended December 31, 2017. The Board also reviewed performance information for the Service Class and Class Y shares for the applicable periods. The Board noted that the Institutional Class of the Timpani Fund has outperformed the index for the one-year, five-year and since-inception periods, and has underperformed the index for the three-year period. The Board noted that the Timpani Fund had significant underperformance in 2014 and 2016 due to Timpani's style being out of favor, followed by outperformance in 2017. The Board concluded that the Timpani Fund's performance was satisfactory and that Timpani would continue to provide a high level of advisory services to the Timpani Fund.
Advisory Fee. The Board compared the Fund's contractual advisory fee and total expense ratio to industry data with respect to other mutual funds in the same Morningstar peer group. The Board noted that the Fund's advisory fee was above the industry average. The Board considered the expenses of the Institutional Class of the Fund, and also reviewed Service Class and Class Y expense information. The Board noted that, after giving effect to the expense cap agreement, the total expense ratio for Institutional Class and Class Y shares was slightly below the industry average and the net expense ratio for Service Class shares was above the industry average. The Board also considered the fee rates charged to Timpani's separate account clients and noted that the fee schedule is consistent with the Fund's advisory fee. The Board noted that Timpani maintains a number of subadvisory arrangements with unaffiliated mutual funds and a
page 66

collective investment trust but did not consider the subadvisory fees to be a material factor given that Timpani's services are limited to asset management. The Board concluded that the advisory fee paid by the Timpani Fund to Timpani was reasonable in light of the nature and quality of services to be provided and fees paid by comparable funds.
Costs and Profitability. The Board reviewed information concerning Timpani's financial condition, costs and profitability. The Board also considered the effect of the expense cap agreement on Timpani's compensation, noting that Timpani had waived a portion of its advisory fee under the agreement for the past two years. The Board concluded that Timpani's current level of profitability was reasonable considering the quality of management and the fact that Timpani was waiving fees for the Fund.
Economies of Scale. Given the Fund's current asset level, the Board did not consider whether any alternative fee structures, such as breakpoint fees, would be appropriate to reflect any economies of scale that may result from increases in the Fund's assets.
Benefits to Timpani. The Board considered information presented regarding any benefits to Timpani or its affiliates from serving as adviser to the Fund (in addition to the advisory fee). The Board noted that Timpani's affiliate, Frontier, provides consulting services to, and is entitled to compensation from, Timpani, including with respect to new shareholders introduced to the Timpani Fund. However, the Board determined that Timpani's services to the Fund would not be compromised by this potential conflict of interest. The Board also noted that William D. Forsyth III, the President of the Company and Frontegra, is also an officer and director of Timpani and that Frontegra and its affiliates provide various services to Timpani with respect to the Fund for which Timpani is not charged. The Board concluded that the other benefits to Timpani from its relationship with the Fund were reasonable.
On the basis of its review of the foregoing information, the Board found that the terms of the Timpani Advisory Agreement were fair and reasonable and in the best interests of the shareholders of the Timpani Fund.
New and Existing Subadvisory Agreements
New and Existing Subadvisory Agreements between Frontegra and MFG Asset Management
In connection with the Board's consideration of the existing subadvisory agreement between Frontegra and MFG Asset Management (the "Existing MFG Agreement") and the proposed new subadvisory agreement between Frontegra and MFG Asset Management (the "New MFG Agreement") at the May 22, 2018, meeting, the Board was provided materials relevant to its consideration of both agreements, such as performance assessments against each MFG Fund's peer group and benchmark index, MFG Asset Management's Form ADV, information regarding MFG Asset Management's compliance program, personnel and financial condition, summary data and a risk management report provided by Fund management and a memorandum prepared by the Company's legal counsel. The Board was also provided with MFG Asset Management's responses to the Section 15(c) request submitted by the Company's legal counsel on behalf of the Directors. The Directors discussed the Transaction and the 15(c) response with two representatives of MFG who participated in the meeting telephonically, including the nature, extent and quality of the subadvisory and other services provided and to be provided to the MFG Funds by MFG Asset Management.
The Independent Directors met in executive session to discuss MFG Asset Management's 15(c) response and the proposed renewal of the Existing MFG Agreement and approval of the New MFG Agreement. During the executive session, the Independent Directors discussed the responsibilities and duties of the Board of Directors in considering the approval of the New MFG Agreement with the Company's legal counsel. The Independent Directors also met in executive session with the Company's Chief Compliance Officer to discuss compliance matters.
In considering the Existing MFG Agreement and the New MFG Agreement, the Board reviewed and analyzed various factors with respect to each of the MFG Funds that it determined were relevant, including the factors below, and made the following conclusions with respect to each MFG Fund.
page 67

Nature, Extent and Quality of the Services to be Provided. The Board reviewed and considered MFG Asset Management's investment strategy for each MFG Fund, experience as a global equity and core infrastructure manager, key personnel involved in providing investment management services to the MFG Funds and financial condition, including the financial condition of MFG Asset Management's parent company. The Board also considered services provided by MFG Asset Management under the Existing and New MFG Agreements, including the management of each MFG Fund's investments, the selection of broker-dealers for execution of portfolio transactions, monitoring adherence to each Fund's investment restrictions, reporting and assisting with the Funds' compliance program. The Board considered certain additional responsibilities MFG Asset Management had agreed to perform under the New MFG Agreement. The Board concluded that the nature, extent and quality of the services provided by MFG Asset Management to the MFG Funds were appropriate and that each Fund was likely to continue to benefit from services provided by MFG Asset Management under the Existing MFG Agreement and New MFG Agreement.
Investment Performance. The Board reviewed the performance record of the Institutional Class of the MFG Funds as of December 31, 2017. The Board also reviewed performance information for the Service Class shares of the Global Plus Fund and the Core Fund for the applicable periods. It noted that the Institutional Class of the Global Equity Fund and the Core Fund had outperformed its benchmark index for the one-year, three-year, five-year and since inception periods ended December 31, 2017. The Board noted that the Institutional Class of the Global Plus Fund had outperformed its benchmark index for the one-year and since inception periods ended December 31, 2017. The Board also considered MFG Asset Management's quarterly portfolio commentary and discussion of each of the MFG Funds' performance. The Board also reviewed the performance of MFG Asset Management's composite of other accounts managed in the global equity and global equity plus style and the core infrastructure style. The Board concluded that MFG Asset Management would continue to provide a high level of subadvisory services to each of the MFG Funds. After considering all of the information, the Board concluded that, although past performance is not a guarantee of future results, each of the MFG Funds and their shareholders was likely to benefit from Frontegra's continued management.
Subadvisory Fees. The Board reviewed and considered the subadvisory fee payable by Frontegra to MFG Asset Management under the Existing MFG Agreement and New MFG Agreement, noting that the subadvisory fee structure was negotiated at arm's length between Frontegra and MFG Asset Management, which was an unaffiliated third party at the time the fee schedule was negotiated. The Board noted there was no change to the fees under the Existing MFG Agreement. With respect to the Existing MFG Agreement, the Board determined that the subadvisory fee was appropriate. With respect to the New MFG Agreement, the Board considered the proposed increase in subadvisory fees payable to MFG Asset Management and that MFG Asset Management agreed to pay for or reimburse Frontegra for, as applicable, organizational expenses of the MFG Funds, any expense reimbursements made by Frontegra pursuant to the expense cap agreement, and all sub-transfer agent fees. The Board determined that the increased subadvisory fee payable with respect to the MFG Funds was appropriate in light of these additional financial obligations of MFG Asset Management as they relate to Frontegra and the fact that that MFG Asset Management and Frontegra will be under common control following the Transaction. As a result, MFG has provided additional financial undertakings through its subsidiary MFG Asset Management in the New MFG Agreement and has represented that Frontegra will receive sufficient financial support through FNAH. The Board also considered that the fees paid by shareholders of the MFG Funds will not change as a result of the restructuring of, and increase to, the subadvisory fee under the New MFG Agreement. In evaluating the subadvisory fee under the Existing MFG Agreement and the revised subadvisory fee under the New MFG Agreement, the Board noted that such amounts are paid by Frontegra and that therefore the overall advisory fee paid by the Funds is not directly affected by the subadvisory fee.
Costs and Profitability. The Board did not consider the cost of services provided by MFG Asset Management or the profitability to MFG Asset Management from its relationship with the Funds to be material factors because the subadvisory fee is paid by Frontegra.
Economies of Scale. Because the subadvisory fee is not paid by the Funds, the Board did not consider whether the fee should reflect any potential economies of scale that might be realized as the Funds' assets increase.
page 68

Benefits to MFG Asset Management. The Board considered information presented regarding any benefits to MFG Asset Management from serving as subadviser to the MFG Funds (in addition to the subadvisory fee). The Board noted that Frontier, an affiliated company, provides consulting and marketing services to MFG Asset Management for which Frontier (or the Distributor, with respect to new shareholders introduced to the MFG Funds is compensated by MFG Asset Management. The Board concluded that the benefits realized by MFG Asset Management from its relationship with each MFG Fund was reasonable.
New and Existing Subadvisory Agreements between Frontegra and Phocas Financial Corp. ("Phocas")
In connection with the Board's review of the existing subadvisory agreement between Frontegra and Phocas (the "Existing Phocas Agreement") and the proposed new subadvisory agreement between Frontegra and Phocas (the "New Phocas Agreement") at the May 22, 2018, meeting, the Board was provided materials relevant to its consideration of the agreements, such as performance assessments against the Phocas Fund's peer group and benchmark index, Phocas' Form ADV, information regarding Phocas' compliance program, personnel and financial condition, summary data and a risk management report provided by Fund management and a memorandum prepared by the Company's legal counsel. The Board noted that the New Phocas Agreement contains similar terms and an identical fee structure as the Existing Phocas Agreement. The Independent Directors met in executive session to discuss Phocas' 15(c) response and the proposed approval of the New Phocas Agreement. During the executive session, the Independent Directors discussed the responsibilities and duties of the Board in considering the approval of the New Phocas Agreement with the Company's legal counsel. The Independent Directors also met in executive session with the Company's Chief Compliance Officer to discuss compliance matters.
In considering the Existing Phocas Agreement and the New Phocas Agreement, the Board reviewed and analyzed various factors with respect to the Phocas Fund that it determined were relevant, including the factors below, and made the following conclusions with respect to the Phocas Fund.
Nature, Extent and Quality of the Services to be Provided. The Board reviewed and considered Phocas' investment strategy, experience as a small cap value manager, key personnel involved in providing investment management services to the Phocas Fund, compliance record and financial condition. The Board also considered services that will continue to be provided by Phocas under the Existing and New Phocas Agreements, including managing the Phocas Fund's investments, the selection of broker-dealers for execution of portfolio transactions, monitoring adherence to the Phocas Fund's investment restrictions, reporting and assisting with the Phocas Fund's compliance program. The Board also considered the clarifying changes added to the New Phocas Agreement about other services provided to the Fund and regulatory obligations of Phocas as subadviser. The Board concluded that the nature, extent and quality of the services provided by Phocas to the Phocas Fund were appropriate and that the Phocas Fund was likely to continue to benefit from services provided by Phocas under both the Existing Phocas Agreement and New Phocas Agreement.
Investment Performance of the Phocas Fund. The Board reviewed the performance record of the Institutional Class of the Phocas Fund for the one-year, three-year, five-year, 10-year and since-inception periods ended December 31, 2017. The Board also reviewed performance information for the Service Class shares for the applicable periods. The Board noted that the Institutional Class of the Phocas Fund had underperformed its benchmark index for the three-year period and had outperformed its benchmark index for the one-year, five-year, ten-year and since inception periods ended December 31, 2017. The Board noted that the Phocas Fund had been reorganized into the Company in 2010 and returns for the since inception period included the returns for the predecessor fund, also managed by Phocas. The Board also reviewed the performance of Phocas' composite of other accounts managed in the small cap value style. The Board concluded that the Phocas Fund's performance was satisfactory and that Phocas would continue to provide a high level of subadvisory services to the Phocas Fund.
Subadvisory Fee. The Board reviewed and considered the subadvisory fee payable by Frontegra to Phocas, noting that the subadvisory fee structure was negotiated at arm's length between Frontegra and Phocas. The Board also noted that both agreements contain an identical fee schedule. The Board determined that the subadvisory fee was appropriate. In evaluating the subadvisory fee, the Board noted that
page 69

such amounts are paid by Frontegra and that therefore the overall advisory fee paid by the Phocas Fund is not directly affected by the subadvisory fee.
Costs and Profitability. The Board did not consider the cost of services provided by Phocas or the profitability to Phocas from its relationship with the Phocas Fund to be material factors because the subadvisory fee is paid by Frontegra.
Economies of Scale. Because the subadvisory fee is not paid by the Phocas Fund, the Board did not consider whether the fee should reflect any potential economies of scale that might be realized as the Phocas Fund's assets increase.
Benefits to Phocas. The Board considered information presented regarding any benefits to Phocas from serving as subadviser to the Phocas Fund (in addition to the subadvisory fee). The Board noted Phocas' representation that the Phocas Fund allows Phocas to serve clients that do not meet Phocas' eligibility criteria for separate accounts. The Board noted that Frontier, an affiliated company of Frontegra, provides consulting and marketing services to Phocas for which Frontier may be compensated by Phocas. The Board concluded that the benefits realized by Phocas from its relationship to the Phocas Fund were reasonable.
On the basis of its review of the foregoing information, the Board found that the terms of the Existing Phocas Agreement and New Phocas Agreement were fair and reasonable and in the best interests of the shareholders of the Phocas Fund.
page 70

ADDITIONAL INFORMATION
(Unaudited)
DIRECTORS AND OFFICERS AS OF JUNE 30, 2018
The business and affairs of the Funds are managed under the direction of the Funds' Board of Directors. Information pertaining to the directors and officers of the Funds is set forth below. The SAI includes additional information about the Funds' directors and officers and is available without charge, upon request by calling 1-888-825-2100.
Interested Director and Officers
Name, Address and
Year of Birth | | Position(s)
Held with
Company | | Term of
Office and
Length
of Time
Served | | Principal
Occupation(s)
During Past
Five Years | | Number of
Funds in
Complex
Overseen
by Director | | Other
Directorships
Held by
Director | |
William D. Forsyth III*
Frontier Funds, Inc.
400 Skokie Boulevard
Suite 500
Northbrook, Illinois 60062
Year of Birth: 1963 | | President
Director
Secretary | | Elected
annually by
the Board;
since
August
2008 (co-
president
from
1996 – 2008).
Indefinite;
since
May 1996.
Indefinite;
since
August
2014. | | Mr. Forsyth has served as President of Frontegra since August 2008 and as Treasurer and a Director of Frontegra since May 1996. Mr. Forsyth served as Co-President and Assistant Secretary of Frontegra from May 1996 to August 2008. Mr. Forsyth has served as Executive Chairman of North American Operations, MFG Asset Management, since February 5, 2018. Mr. Forsyth has served as Vice President of Timpani since August 2015. Mr. Forsyth served as President of Timpani from August 2008 to August 2015. Mr. Forsyth served as President of Timpani from August 2008 to August 2015 and served as Co-President from April 2008 to August 2008. Mr. Forsyth has served as President of Frontegra Strategies, LLC, the principal distributor of the Funds' shares, since August 2008 and as Co-President from August 2007 to August 2008. From July 1993 until the present, Mr. Forsyth also served as a Partner of Frontier Partners, Inc., a consulting/marketing firm ("Frontier Partners"). | | | 5 | | | None | |
* Mr. Forsyth is an "interested person" of the Funds because he serves as a director and officer of Frontegra, owns 100% of Frontegra and has an indirect equity ownership interest in Timpani.
page 71

ADDITIONAL INFORMATION (continued)
(Unaudited)
Interested Director and Officers
Name, Address and
Year of Birth | | Position(s)
Held with
Company | | Term of
Office and
Length
of Time
Served | | Principal
Occupation(s)
During Past
Five Years | | Number of
Funds in
Complex
Overseen
by Director | | Other
Directorships
Held by
Director | |
Elyce D. Dilworth Frontier Funds, Inc. 400 Skokie Boulevard Suite 500 Northbrook, Illinois 60062 Year of Birth: 1966 | | Treasurer, Assistant Secretary, Chief Compliance Officer and Anti-Money Laundering Compliance Officer | | Elected annually by the Board; Treasurer and Assistant Secretary since August 2008; Chief Compliance Officer since January 2008; Anti-Money Laundering Compliance Officer since February 2008. | | Ms. Dilworth has served as Chief Compliance Officer of Frontegra since January 2008 and as Secretary since August 2008. Ms. Dilworth served as Chief Compliance Officer of Timpani from April 2008 to June 2011 and from September 2014 to February 2015. She served as Chief Financial Officer of Timpani from April 2008 to March 2010. Ms. Dilworth served as Chief Compliance Officer of Frontier Partners from September 2010 to June 2011 and from September 2014 to February 2015. Ms. Dilworth has also served as Chief Compliance Officer of the Distributor since August 2008. | | N/A | | N/A | |
page 72

ADDITIONAL INFORMATION (continued)
(Unaudited)
Independent Directors
Name, Address and
Year of Birth | | Position(s)
Held with
Company | | Term of
Office and
Length
of Time
Served | | Principal
Occupation(s)
During Past
Five Years | | Number of
Funds in
Complex
Overseen
by Director | | Other
Directorships
Held by
Director | |
David L. Heald 400 Skokie Boulevard Suite 500 Northbrook, Illinois 60062 Year of Birth: 1943 | | Lead Independent Director; Chair, Audit Committee | | Indefinite; since June 1996 | | Mr. Heald previously served as a principal and a director of Consulting Fiduciaries, Inc. ("CFI") from 1994 to 2011 when he retired. CFI was a registered investment adviser that provided professional, independent, fiduciary decision making, consultation and alternative dispute resolution services to ERISA plans, plan sponsors and investment managers. Between April 1994 and August 1994, Mr. Heald engaged in the private practice of law. From August 1992 until April 1994, Mr. Heald was a managing director and the chief administrative officer of Calamos Asset Management, Inc., a registered investment adviser specializing in convertible securities, and he served as an officer and director of CFS Investment Trust, a registered investment company comprised of four series. From January 1990 until August 1992, Mr. Heald was a partner in the Chicago based law firm of Gardner, Carton & Douglas. | | | 5 | | | None | |
page 73

ADDITIONAL INFORMATION (continued)
(Unaudited)
Independent Directors
Name, Address and
Year of Birth | | Position(s)
Held with
Company | | Term of
Office and
Length
of Time
Served | | Principal
Occupation(s)
During Past
Five Years | | Number of
Funds in
Complex
Overseen
by Director | | Other
Directorships
Held by
Director | |
Steven K. Norgaard
400 Skokie Boulevard
Suite 500
Northbrook, Illinois 60062
Year of Birth: 1964 | | Independent Director | | Indefinite; since October 2013 | | Mr. Norgaard has been an attorney with Steven K. Norgaard P.C. since 1994. From 1990 to 1994, he was an attorney at McDermott, Will & Emery. | | | 5 | | | Boulder Growth & Income Fund, Inc. | |
James M. Snyder
400 Skokie Boulevard
Suite 500
Northbrook, Illinois 60062
Year of Birth: 1947 | | Independent Director; Chair, Nominating Committee | | Indefinite; since May 2002 | | Mr. Snyder is a private investor and chairman of a family foundation. Mr. Snyder served as an investment professional with Northern Trust from June 1969 until his retirement in June 2001. He served in a variety of capacities at Northern Trust, including as Chief Investment Officer, Executive Vice President of Northern Trust and Vice Chairman of Northern Trust Global Investments. Mr. Snyder has earned the right to use the Chartered Financial Analyst (CFA) designation. | | | 5 | | | IronBridge Funds, Inc. (with oversight of three portfolios) | |
page 74

ADDITIONAL INFORMATION (continued)
(Unaudited)
FOREIGN TAX CREDIT
For the year ended June 30, 2018, the Core Fund earned $10,282,037 in foreign source income and paid $914,985 in foreign taxes, which it intends to pass through to its shareholders pursuant to Section 853 of the Internal Revenue Code.
QUALIFIED DIVIDEND INCOME/DIVIDENDS RECEIVED DEDUCTION
For the fiscal year ended June 30, 2018, certain dividends paid by the Funds may be subject to a maximum tax rate of 15%, as provided for by the Jobs and Growth Tax Relief Reconciliation Act of 2004. The percentage of dividends declared from ordinary income designated as qualified dividend income was as follows:
Global Equity Fund | | | 95.67 | % | |
Global Plus Fund | | | 46.05 | % | |
Core Fund | | | 92.84 | % | |
Phocas Fund | | | 43.39 | % | |
For corporate shareholders, the percent of ordinary income distributions qualifying for the corporate dividends received deduction for the fiscal year ended June 30, 2018 was as follows:
Global Equity Fund | | | 88.60 | % | |
Global Plus Fund | | | 38.65 | % | |
Core Fund | | | 29.79 | % | |
Phocas Fund | | | 43.37 | % | |
page 75
This page intentionally left blank.

A NOTE ON FORWARD-LOOKING STATEMENTS
This report includes forward-looking statements such as adviser, subadviser and/or portfolio manager predictions, opinions, assessments, analyses or outlooks for individual securities, industries, market sectors and/or markets. These statements involve risks and uncertainties. In addition to the general risks described for the Funds in the current Prospectuses, other factors bearing on these statements include the accuracy of the advisers', subadvisers' or portfolio managers' forecasts and predictions, and the appropriateness of the investment programs designed by an adviser, subadviser or portfolio manager to implement their strategies efficiently and effectively. Any one or more of these factors, as well as other risks affecting the securities markets and investment instruments generally, could cause the actual results of the Funds to differ materially as compared to benchmarks associated with the Funds.
In addition, portfolio composition will change due to ongoing management of the Funds. Specific securities named in this report may not currently be owned by the applicable Fund, or the Fund's position in the securities may have changed.
ADDITIONAL INFORMATION
Frontier Funds has adopted proxy voting policies and procedures that delegate to Frontegra Asset Management, Inc. ("Frontegra") and Timpani Capital Management LLC the authority to vote proxies. The proxy voting policies permit Frontegra to delegate its authority to vote proxies to a Fund's subadviser. A description of the Frontier Funds' proxy voting policies and procedures is available without charge, upon request, by calling the Funds toll free at 1-888-825-2100. A description of these policies and procedures is also included in the Funds' Statement of Additional Information, which is available on the SEC's website at http://www.sec.gov and the Funds' website at www.frontiermutualfunds.com or by calling the Funds toll free at 1-888-825-2100.
The actual voting records relating to each Fund's portfolio securities during the most recent twelve months ended June 30 are available without charge by calling the Funds toll free at 1-888-825-2100 or by accessing the SEC's website at http://www.sec.gov.
Each Fund files a complete schedule of portfolio holdings for its first and third fiscal quarters with the SEC on Form N-Q. The Form N-Q is available on the SEC's website at http://www.sec.gov. The Form N-Q may also be reviewed and copied at the SEC's Public Reference Room in Washington, D.C. Information on the operation of the Public Reference Room may be obtained by calling toll-free 1-800-SEC-0330.
Item 2. Code of Ethics.
The registrant has adopted a code of ethics that applies to the registrant’s principal executive officer and principal financial officer. The registrant has not made any substantive amendments to its code of ethics during the period covered by this report. The registrant has not granted any waivers from any provisions of the code of ethics during the period covered by this report.
A copy of the registrant’s Code of Ethics is filed herewith.
Item 3. Audit Committee Financial Expert.
The registrant’s board of directors has determined that there is at least one audit committee financial expert serving on its audit committee. Steven Norgaard is the “audit committee financial expert” and is considered to be “independent” as each term is defined in Item 3 of Form N-CSR.
Item 4. Principal Accountant Fees and Services.
The registrant has engaged its principal accountant to perform audit services, audit-related services, tax services and other services during the past two fiscal years. In the following table, “Audit Fees” are fees billed for professional services for the audit of the registrant’s annual financial statements or services that are normally provided by the accountant in connection with statutory and regulatory filings or engagements for those fiscal years. The “All Other Fees” for fiscal year 2018 relate to the principal accountant’s review of the registrant’s semi-annual report for the period ended December 31, 2017, and for consent of post effective registration statement update. “Tax Fees” refer to professional services rendered by the principal accountant for tax compliance, tax advice, and tax planning. There were no other services provided by the principal accountant. The following table details the aggregate fees billed for each of the last two fiscal years by the principal accountant.
| | FYE 6/30/2018 | | FYE 6/30/2017 | |
Audit Fees | | $ | 66,000 | | $ | 90,600 | |
Tax Fees | | $ | 16,250 | | $ | 26,000 | |
All Other Fees | | $ | 3,000 | | $ | 2,000 | |
The audit committee has adopted pre-approval policies and procedures that require the audit committee to pre-approve all audit and non-audit services of the registrant, including services provided to any entity affiliated with the registrant with respect to any engagement that directly relates to the operations and financial reporting of the registrant. In accordance with its pre-approval policies and procedures, the audit committee pre-approved all audit and tax services provided by the principal accountant during fiscal year 2018. All of the hours spent on auditing the registrant’s financial statements were attributed to work performed by full-time permanent employees of the principal accountant.
The following table indicates the non-audit fees billed or expected to be billed by the registrant’s accountant for services to the registrant and to the registrant’s investment adviser for the last two years. The audit committee has considered whether the provision of non-audit services that were rendered to the registrant’s investment adviser is compatible with maintaining the principal accountant’s independence and has concluded that the provision of such non-audit services by the accountant has not compromised the accountant’s independence.
Non-Audit Related Fees | | FYE 6/30/2018 | | FYE 6/30/2017 | |
Registrant | | — | | — | |
Registrant’s Investment Adviser | | $ | 8,000 | �� | $ | 8,000 | |
| | | | | | | |
Item 5. Audit Committee of Listed Registrants.
Not applicable to registrants who are not listed issuers (as defined in Rule 10A-3 under the Securities Exchange Act of 1934).
Item 6. Investments.
(a) Schedule of Investments is included as part of the report to shareholders filed under Item 1 of this Form.
(b) Not Applicable.
Item 7. Disclosure of Proxy Voting Policies and Procedures for Closed-End Management Investment Companies.
Not applicable to open-end investment companies.
Item 8. Portfolio Managers of Closed-End Management Investment Companies.
Not applicable to open-end investment companies.
Item 9. Purchases of Equity Securities by Closed-End Management Investment Company and Affiliated Purchasers.
Not applicable to open-end investment companies.
Item 10. Submission of Matters to a Vote of Security Holders.
Not Applicable.
Item 11. Controls and Procedures.
(a) Based on an evaluation of the registrant’s disclosure controls and procedures (as defined in Rule 30a-3(c) under the Investment Company Act of 1940 (the “Act”)) as of a date within 90 days prior to the filing date of this Form N-CSR, the registrant’s principal executive officer and principal financial officer have concluded that the disclosure controls and procedures are effective.
2
(b) There were no changes in the Registrant’s internal control over financial reporting (as defined in Rule 30a-3(d) under the Act) that occurred during the second fiscal quarter of the period covered by this report that has materially affected, or is reasonably likely to materially affect, the Registrant’s internal control over financial reporting.
Item 12. Disclosure of Securities Lending Activities for Closed-End Management Investment Companies.
Not applicable to open-end investment companies.
Item 13. Exhibits.
(a) (1) Any code of ethics or amendment thereto, that is the subject of the disclosure required by Item 2, to the extent that the registrant intends to satisfy Item 2 requirements through filing an exhibit. Filed herewith.
(2) A separate certification for each principal executive officer and principal financial officer pursuant to Section 302 of the Sarbanes-Oxley Act of 2002. Filed herewith.
(3) Any written solicitation to purchase securities under Rule 23c-1 under the Act sent or given during the period covered by the report by or on behalf of the registrant to 10 or more persons. Not applicable to open-end investment companies.
(4) Change in the registrant’s independent public accountant. Not Applicable.
(b) Certifications pursuant to Section 906 of the Sarbanes-Oxley Act of 2002. Furnished herewith.
3
SIGNATURES
Pursuant to the requirements of the Securities Exchange Act of 1934 and the Investment Company Act of 1940, the registrant has duly caused this report to be signed on its behalf by the undersigned, thereunto duly authorized.
Frontier Funds, Inc. |
|
| |
By: | /s/ William D. Forsyth III | |
| William D. Forsyth III, President and Secretary | |
| (Principal Executive Officer) | |
| |
Date: | 8/22/2018 | |
Pursuant to the requirements of the Securities Exchange Act of 1934 and the Investment Company Act of 1940, this report has been signed below by the following persons on behalf of the registrant and in the capacities and on the dates indicated.
By: | /s/ William D. Forsyth III | |
| William D. Forsyth III, President and Secretary |
| (Principal Executive Officer) |
Date: | 8/22/2018 | |
| | |
By: | /s/ Elyce D. Dilworth | |
| Elyce D. Dilworth, Treasurer and Assistant Secretary |
| (Principal Financial Officer) |
Date: | 8/22/2018 | |
4