UNITED STATES
SECURITIES AND EXCHANGE COMMISSION
Washington, D.C. 20549
FORM N-CSR
CERTIFIED SHAREHOLDER REPORT OF REGISTERED MANAGEMENT INVESTMENT COMPANIES
Investment Company Act file number 811-07685
Frontier Funds, Inc.
(Exact name of registrant as specified in charter)
400 Skokie Blvd.
Suite 500
Northbrook, IL 60062
(Address of principal executive offices) (Zip code)
William D. Forsyth III
400 Skokie Blvd., Suite 500
Northbrook, Illinois 60062
(Name and address of agent for service)
(847) 509-9860
Registrant's telephone number, including area code
Date of fiscal year end: June 30
Date of reporting period: June 30, 2020
Item 1. Reports to Stockholders.

ANNUAL REPORT
Frontier MFG Global Equity Fund
Frontier MFG Global Plus Fund
Frontier MFG Global Sustainable Fund
Frontier MFG Core Infrastructure Fund
Frontier MFG Select Infrastructure Fund
Frontier Caravan Emerging Markets Fund
Frontegra Asset Management, Inc.
June 30, 2020
Beginning in February 2021, as permitted by regulations adopted by the Securities and Exchange Commission, paper copies of the Funds' shareholder reports like this one will no longer be sent by mail, unless you specifically request paper copies of the reports from the Funds or from your financial intermediary, such as a broker-dealer or bank. Instead, the reports will be made available on a website, and you will be notified by mail each time a report is posted and provided with a website link to access the report.
If you already elected to receive shareholder reports electronically, you will not be affected by this change and you need not take any action. If you invest through a financial intermediary, you may elect to receive shareholder reports and other communications electronically from the Funds by contacting your financial intermediary (such as a broker-dealer or bank). If you invest directly with the Funds, you will receive shareholder reports electronically beginning in February 2021.
You may elect to receive all future shareholder reports in paper free of charge. You can request to continue receiving paper copies of your shareholder reports by contacting your financial intermediary or, if you invest directly with a Fund, calling 1-888-825-2100 to let the Fund know of your request. Your election to receive shareholder reports in paper will apply to all funds held with Frontier Funds, Inc.

TABLE OF CONTENTS
Shareholder Letter | | | 1 | | |
Frontier MFG Global Equity Fund and Frontier MFG Global Plus Fund | |
Report from MFG Asset Management | | | 4 | | |
Investment Highlights | | | 6 | | |
Frontier MFG Global Sustainable Fund | |
Report from MFG Asset Management | | | 10 | | |
Investment Highlights | | | 12 | | |
Frontier MFG Core Infrastructure Fund and Frontier MFG Select Infrastructure Fund | |
Report from MFG Asset Management | | | 14 | | |
Investment Highlights | | | 16 | | |
Frontier Caravan Emerging Markets Fund | |
Report from Caravan Capital Management, LLC | | | 20 | | |
Investment Highlights | | | 22 | | |
Expense Example | | | 23 | | |
Schedules of Investments | |
Frontier MFG Global Equity Fund | | | 26 | | |
Frontier MFG Global Plus Fund | | | 28 | | |
Frontier MFG Global Sustainable Fund | | | 30 | | |
Frontier MFG Core Infrastructure Fund | | | 32 | | |
Frontier MFG Select Infrastructure Fund | | | 35 | | |
Frontier Caravan Emerging Markets Fund | | | 37 | | |
Statements of Assets and Liabilities | | | 44 | | |
Statements of Operations | | | 46 | | |
Statements of Changes in Net Assets | | | 48 | | |
Financial Highlights | | | 51 | | |
Notes to Financial Statements | | | 61 | | |
Report of Independent Registered Public Accounting Firm | | | 70 | | |
Additional Information | |
Directors and Officers | | | 71 | | |
Foreign Tax Credit | | | 74 | | |
Qualified Dividend Income/Dividends Received Deduction | | | 74 | | |
Board of Directors' Approval of Advisory and Subadvisory Agreements | | | 75 | | |
Statement Regarding Liquidity Risk Management Program | | | 79 | | |
This report is submitted for the general information of the shareholders of the above-listed Funds. It is not authorized for distribution to prospective investors unless accompanied or preceded by an effective Prospectus for the applicable Fund. The Prospectuses may be obtained by calling 1-888-825-2100. Each Prospectus includes more complete information about management fees and expenses, investment objectives, risks and operating policies of the applicable Fund. Please read the applicable Prospectus carefully.
Frontier Funds, Inc. are distributed by Frontegra Strategies, LLC, 400 Skokie Blvd., Suite 500, Northbrook, IL 60062. Frontegra Strategies, LLC, member of FINRA and SIPC, is an affiliate of Frontegra Asset Management, Inc., the Funds' investment adviser.

DEAR FELLOW SHAREHOLDERS:
We are pleased to report on the progress of the Frontier Funds over the past twelve months ending June 30, 2020. The S&P 500 Index was up 7.51%. International stocks, as measured by the MSCI EAFE Index, returned -5.13% over the twelve-month period.
Fund Results
The Frontier MFG Global Equity Fund, managed by MFG Asset Management ("MFG"), returned 7.58% (net) versus the MSCI World Index (Net) return of 2.84% for the twelve-month period ending June 30, 2020.
The Frontier MFG Global Plus Fund — Institutional Class, also managed by MFG, returned 7.65% (net) versus the MSCI World Index (Net) return of 2.84% for the twelve-month period ending June 30, 2020. The Service Class shares returned 7.50% (net) over the same time period.
For the period from October 9, 2019, (inception), through June 30, 2020, the Frontier MFG Global Sustainable Fund, also managed by MFG Asset Management, returned 4.36% (net) versus the MSCI World Index (Net) return of 4.29%.
For the twelve-month period ending June 30, 2020, the Frontier MFG Core Infrastructure Fund — Institutional Class, managed by MFG, returned -2.40% (net) versus the S&P Global Infrastructure Index return of -14.76%. The Service Class shares returned -2.49% (net) over the same time period.
The Frontier MFG Select Infrastructure Fund — Institutional Class, also managed by MFG, returned -8.26% (net) versus the S&P Global Infrastructure Index return of -14.76% for the twelve-month period ending June 30, 2020. The Service Class shares returned -8.32% (net) over the same time period.
For the period from December 4, 2019, (inception), through June 30, 2020, the Frontier Caravan Emerging Markets Fund, managed by Caravan Capital Management, returned -9.44% (net) versus the MSCI Emerging Markets Index (Net) return of -2.74%. The Service Class shares returned 15.01% (net) versus the 17.32% return of the Fund's benchmark for the period April 6, 2020, (inception of Service Class), through June 30, 2020.
Outlook
The past twelve months have been dominated by the COVID-19 pandemic, which took hold in the U.S. in early 2020. Markets suffered a sharp drop in Q1 but bounced back nicely in Q2. Like all investors, we are considering what the future holds and what that means from an economic, and therefore investment, perspective. The landscape may well worsen before it gets better. While coming into the crisis economic fundamentals were robust and the financial system was healthy, the pandemic has put an enormous strain on virtually every sector of the economy. The path forward is unclear, especially as it pertains to unemployment, manufacturing and the resumption of routine activities.
We will continue to oversee the investment management of the Frontier Funds with the skill and agility that have served our shareholders well in the past. As always, we appreciate your investment and continued confidence.
Best regards,
William D. Forsyth, CFA
President
Frontier Funds, Inc.
page 1
This page intentionally left blank.

FRONTIER
MFG GLOBAL EQUITY FUND
AND
FRONTIER
MFG GLOBAL PLUS FUND

REPORT FROM MFG ASSET MANAGEMENT
Dear Fellow Shareholders:
The investment objective of the Frontier MFG Global Equity Fund and the Frontier MFG Global Plus Fund is capital appreciation. The objective is measured against the MSCI World Index (Net).
Performance Review
The Frontier MFG Global Equity Fund returned 7.58%, net of fees, for the year ended June 30, 2020, while the Frontier MFG Global Plus Fund (Institutional Class) returned 7.65%, net of fees, for the same period. Both Funds outperformed the 2.84% return of their benchmark, the MSCI World Index (Net).
Global stocks rose in the twelve months ended June 30, 2020, after huge fiscal and monetary stimulus offset the damage from the coronavirus to economic activity, company profits and investor confidence. In the June quarter, stocks recovered from post-virus lows after an ebbing in infection rates in developed countries allowed governments to ease restrictions on everyday life, even though the economic hit from the virus was so stark that the U.S. entered its first recession in nearly 11 years.
The stocks that performed best in local currency terms included the investments in Microsoft, Alphabet and Tencent Holdings. Microsoft surged to a record high over the period after its cloud business helped the software giant beat earnings and revenue forecasts and then held up relatively well when COVID-19 hit because it was judged a stock that would benefit from greater online activity. Alphabet, the owner of Google, gained as it reported higher earnings over the twelve months and as online advertising held up better than expected during the pandemic. Tencent rose on an improving earnings outlook and as the virus forced Chinese citizens to work from home and engage more with the company's suite of digital services.
The stocks that detracted from performance included the investments in Yum! Brands, Anheuser-Busch InBev and HCA Healthcare. Yum! Brands fell after posting downbeat earnings and after its KFC, Pizza Hut and Taco Bell outlets were closed when countries ordered lockdowns or restrictions on restaurants to stop the transmission of the virus. AB InBev fell after the world's biggest brewer said that a decline in beer sales in Brazil, China and the U.S. slowed profit growth and the company said it expects only "moderate" full-year earnings growth, down from "strong" before. HCA Healthcare dropped on disappointing earnings and after elective surgeries were deferred as hospitals built capacity to respond to the pandemic and investors weighed the impact of the unprecedented jump in U.S. unemployment on HCA's revenue.
Fund Outlook and Strategy
The outlooks for the economy and equity markets remain uncertain. Key will be the pace of economic reopening and policymaker responses. We continue to see four scenarios.
The best scenario is a V-shaped recovery; a fleeting recession. This would require a quick and successful reopening supported by policymakers, with most furloughed workers returning to their pre-pandemic hours. This scenario still appears relatively unlikely.
The worst scenario is a depression, where reopening is very slow and there is a policy error, hurting employment and output. This would be the worst outcome for markets but also appears relatively unlikely.
The two middle scenarios are a U-shaped recovery from a recession and a prolonged and deep recession. The downturn that occurred after the global financial recession lay between these two scenarios. It is still challenging to definitively predict if the current downturn will be more or less severe than the recession of 2008-2009.
page 4

Due to our cautious economic outlook and the risks confronting equities, we only reduced the cash position in the strategy over the June quarter from approximately 16% to approximately 15% for Global Equity and from approximately 17% to approximately 16% for Global Plus.
Even amid the uncertainty hovering over stock markets, we are confident about the long-term outlook for the investments selected for our portfolio and the portfolio's risk profile. Many of the stocks in the portfolio benefit from having a stronghold on the enterprise software market, being leading digital platforms, the shift to a cashless society, consumption growth in China, resilient demand given the essential nature of their services or the dynamics of ageing populations.
Yours sincerely,
Hamish Douglass
Portfolio Manager
MFG Asset Management
page 5

INVESTMENT HIGHLIGHTS
Growth of a $1,000,000 Investment (Unaudited)

* 12/28/11 commencement of operations.
Portfolio Total Return** | |
FOR PERIODS ENDED 6/30/20 | | FUND | | INDEX | |
SIX MONTHS | | | (1.10 | )% | | | (5.77 | )% | |
ONE YEAR | | | 7.58 | % | | | 2.84 | % | |
FIVE YEAR
AVERAGE ANNUAL | | | 10.56 | % | | | 6.90 | % | |
AVERAGE ANNUAL
SINCE INCEPTION | | | 12.84 | % | | | 9.91 | % | |
Fund Expenses | |
GROSS EXPENSE RATIO | | | 0.88 | % | |
NET EXPENSE RATIO | | | 0.83 | % | |
This chart assumes an initial gross investment of $1,000,000 made on 12/28/11 (commencement of operations). Returns shown include the reinvestment of all distributions. Past performance is not predictive of future results. Investment return and principal value will fluctuate so that shares, when redeemed, may be worth more or less than the original cost. In the absence of existing fee waivers, total return would be reduced. To receive current to the most recent month-end performance, please call 1-888-825-2100.
The MSCI World Index (Net) represents large and mid cap equities across 23 Developed Markets countries. The index covers approximately 85% of the free float-adjusted market capitalization in each country. The index does not reflect investment management fees, brokerage commissions and other expenses associated with investing in equity securities. A direct investment in the index is not possible.
Frontegra Asset Management, Inc. has contractually agreed through October 31, 2022, to waive its management fee and/or reimburse the Fund's operating expenses to the extent necessary to ensure that the Fund's total operating expenses (excluding taxes, interest, brokerage commissions, acquired fund fees and expenses and extraordinary expenses) do not exceed 0.80% of the Fund's average daily net assets. The expense ratios presented are based on the annualized expense ratios as reported in the Fund's current prospectus, which may differ from the expense ratios presented in the Fund's financial highlights.
** The returns shown do not reflect the deduction of taxes that a shareholder would pay on Fund distributions or the redemption of Fund shares.
page 6

INVESTMENT HIGHLIGHTS
Growth of a $1,000,000 Investment (Unaudited)

* 3/23/15 commencement of operations.
Portfolio Total Return** | |
FOR PERIODS ENDED 6/30/20 | | FUND | | INDEX | |
SIX MONTHS | | | (0.94 | )% | | | (5.77 | )% | |
ONE YEAR | | | 7.65 | % | | | 2.84 | % | |
FIVE YEAR
AVERAGE ANNUAL | | | 10.37 | % | | | 6.90 | % | |
AVERAGE ANNUAL
SINCE INCEPTION | | | 9.62 | % | | | 6.19 | % | |
Institutional Class Expenses | |
GROSS EXPENSE RATIO | | | 0.92 | % | |
NET EXPENSE RATIO | | | 0.83 | % | |
This chart assumes an initial gross investment of $1,000,000 made on 3/23/15 (commencement of operations). Returns shown include the reinvestment of all distributions. Past performance is not predictive of future results. Investment return and principal value will fluctuate so that shares, when redeemed, may be worth more or less than the original cost. In the absence of existing fee waivers, total return would be reduced. To receive current to the most recent month-end performance, please call 1-888-825-2100.
The MSCI World Index (Net) represents large and mid cap equities across 23 Developed Markets countries. The index covers approximately 85% of the free float-adjusted market capitalization in each country. The index does not reflect investment management fees, brokerage commissions and other expenses associated with investing in equity securities. A direct investment in the index is not possible.
Frontegra Asset Management, Inc. has contractually agreed through October 31, 2022, to waive its management fee and/or reimburse the Fund's operating expenses to the extent necessary to ensure that the Fund's total operating expenses (excluding taxes, interest, brokerage commissions, acquired fund fees and expenses and extraordinary expenses) do not exceed 0.80% of the Fund's average daily net assets for the Institutional Class. The expense ratios presented are based on the annualized expense ratios as reported in the Fund's current prospectus, which may differ from the expense ratios presented in the Fund's financial highlights.
** The returns shown do not reflect the deduction of taxes that a shareholder would pay on Fund distributions or the redemption of Fund shares.
The above graph relates to Institutional Class shares of the Fund. Performance for Service Class shares will vary from the performance of the Institutional Class shares shown above due to differences in expenses.
page 7
This page intentionally left blank.

FRONTIER
MFG GLOBAL SUSTAINABLE FUND

REPORT FROM MFG ASSET MANAGEMENT
Dear Fellow Shareholders:
The investment objective of the Frontier MFG Global Sustainable Fund is to seek attractive risk-adjusted returns over the medium to long-term while reducing the risk of permanent capital loss.
The Fund invests, under normal market conditions, at least 80% of its net assets in shares of common stock of issuers listed on U.S. and international stock exchanges that meet our criteria for environmental, social and governance ("ESG") and low carbon investments. In selecting ESG investments, we review a broad spectrum of ESG issues for their materiality of impact on the future earnings and risks of companies. We consider amongst other things and where applicable: environmental issues, such as climate change and pollution; social issues, such as human rights and health and safety; and corporate governance issues, such as governance and compensation structures. The choice of ESG factors for any company will vary by industry and company. In addition, we incorporate a proprietary process that facilitates the identification of companies with materially lower carbon factor risk through the analysis of factors such as carbon emissions intensity and fossil fuel exposure.
The Fund invests in a non-diversified portfolio of high-quality companies, which are companies that we believe are market leaders in their industry, earn returns on capital above the cost of capital, and have long-term and sustainable competitive advantages. The Fund will normally hold a limited number (generally 20 to 50) of companies in its portfolio that meet these criteria. The Fund may invest in companies of any size, but generally invests in companies with a market capitalization of at least $5 billion.
Performance Review
The Frontier MFG Global Sustainable Fund returned 4.36%, net of fees, for the partial period from the inception date of the Fund on October 9, 2019, to June 30, 2020, versus the 4.29% return of the benchmark, the MSCI World Index (Net) over the same period.
Global stocks rose from the inception of the strategy in October to June 2020 after huge fiscal and monetary stimulus offset the damage from the coronavirus to economic activity, company profits and investor confidence. Over the June quarter, stocks recovered from post-virus lows after an ebbing in infection rates in developed countries allowed governments to ease restrictions on everyday life, even though the economic hit from the virus was so stark that the U.S. entered its first recession in nearly 11 years.
The stocks that contributed the most to performance in local currency terms included the investments in Microsoft, Chipotle Mexican Grill and Facebook. Microsoft surged to record highs after its cloud business helped the software giant beat earnings and revenue forecasts and held up relatively well during the pandemic lockdowns as it was judged a beneficiary from greater online activity. Chipotle rose strongly as management noted its digital strategy had performed strongly during the lockdown and mused it expected sales and margins to rise with further digital penetration and rollout of Chipotlanes, its drive-through concept. Facebook proved resilient as its financial results beat expectations, supported by increased consumer engagement during the lockdown and advertising revenues remaining robust, notwithstanding challenges faced by certain economic sectors such as travel and bricks-and-mortar retailers.
Stocks that detracted from performance included the investments in Yum! Brands, Anheuser-Busch InBev and Lowe's. Yum! Brands and AB InBev were hit by market concerns about their elevated levels of debt, as well as the closure of their restaurants (in the case of Yum! Brands) and decreased on-premises consumption as bars and locales were ordered shut. Lowe's fell as prospects of a U.S. recession dented stocks such as home-improvement companies that are tied to the state of the economy.
Fund Outlook and Strategy
The outlooks for the economy and equity markets remain uncertain. Key will be the pace of economic reopening, policymaker responses, scientific advances in dealing with the pandemic, and consumer and business behaviours. We continue to see four scenarios.
page 10

The best scenario is a V-shaped recovery; a deep, but fleeting, recession. This would require a quick and successful reopening supported by policymakers, with most furloughed workers returning to their pre-pandemic hours. This scenario still appears relatively unlikely.
The worst scenario is a depression, where reopening is very slow and there is a policy error, hurting employment and output. This would be the worst outcome for markets but also appears relatively unlikely.
The two middle scenarios are a U-shaped recovery from a recession or a prolonged and deep recession. The downturn that occurred after the global financial recession lay between these two scenarios. It is still too early to form strong conviction on whether or not the current downturn will be more or less severe than the recession of 2008-2009.
Due to our cautious economic outlook and the risks confronting equities, we held the cash position in the strategy at approximately 16% over the June quarter.
Even amid the uncertainty hovering over stock markets, we are confident about the long-term outlook for the investments selected for our portfolio and the portfolio's risk profile. Many of the stocks in the portfolio benefit from having a stronghold on the enterprise software market, being leading digital platforms, the shift to a cashless society, consumption growth in China, resilient demand given the essential nature of their services, or the dynamics of ageing populations.
Yours sincerely,
Domenico Giuliano
Portfolio Manager
MFG Asset Management
page 11

INVESTMENT HIGHLIGHTS
Growth of a $1,000,000 Investment (Unaudited)
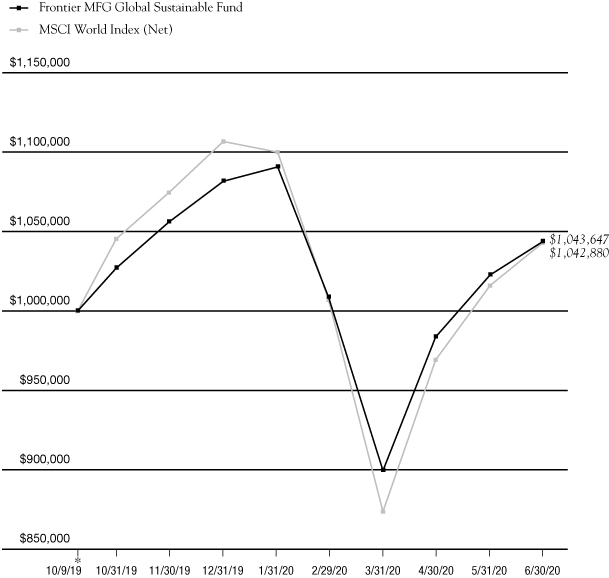
* 10/9/19 commencement of operations.
Portfolio Total Return** | |
FOR PERIODS ENDED 6/30/20 | | FUND | | INDEX | |
SIX MONTHS | | | (3.52 | )% | | | (5.77 | )% | |
SINCE INCEPTION | | | 4.36 | % | | | 4.29 | % | |
Fund Expenses | |
GROSS EXPENSE RATIO | | | 1.45 | % | |
NET EXPENSE RATIO | | | 0.80 | % | |
This chart assumes an initial gross investment of $1,000,000 made on 10/9/19 (commencement of operations). Returns shown include the reinvestment of all distributions. Past performance is not predictive of future results. Investment return and principal value will fluctuate so that shares, when redeemed, may be worth more or less than the original cost. In the absence of existing fee waivers, total return would be reduced. To receive current to the most recent month-end performance, please call 1-888-825-2100.
The MSCI World Index (Net) represents large and mid cap equities across 23 Developed Markets countries. The index covers approximately 85% of the free float-adjusted market capitalization in each country. The index does not reflect investment management fees, brokerage commissions and other expenses associated with investing in equity securities. A direct investment in the index is not possible.
Frontegra Asset Management, Inc. has contractually agreed through October 31, 2022, to waive its management fee and/or reimburse the Fund's operating expenses to the extent necessary to ensure that the Fund's total operating expenses (excluding taxes, interest, brokerage commissions, acquired fund fees and expenses and extraordinary expenses) do not exceed 0.80% of the Fund's average daily net assets. The expense ratios presented are based on the annualized expense ratios as reported in the Fund's current prospectus, which may differ from the expense ratios presented in the Fund's financial highlights.
** The returns shown do not reflect the deduction of taxes that a shareholder would pay on Fund distributions or the redemption of Fund shares.
page 12

FRONTIER
MFG CORE INFRASTRUCTURE FUND
AND
FRONTIER
MFG SELECT INFRASTRUCTURE FUND

REPORT FROM MFG ASSET MANAGEMENT
Dear Fellow Shareholders:
The investment objective of the Frontier MFG Core Infrastructure Fund is long-term capital appreciation. The investment objective of the Frontier MFG Select Infrastructure Fund is to seek attractive risk-adjusted returns over the medium- to long-term, while reducing the risk of permanent capital loss. The objectives for both Funds are measured against the S&P Global Infrastructure Index.
Over time, the stable, reliable earnings of infrastructure assets are expected to lead to a combination of income and capital growth for investors. The types of companies purchased in the Funds are generally natural monopolies that provide essential services to the community. The universe of infrastructure assets held in both Funds is made up of two main sectors:
• Utilities: Utilities includes both regulated energy utilities and regulated water utilities. Utilities are typically subject to economic regulation. The terms of regulation typically require a utility to efficiently provide an essential service to the community and, in return, permit the utility to earn a fair rate of return on the capital it has invested in its operations. As a utility provides a basic necessity, such as energy or water, there is minimal fluctuation in demanded volumes in response to the economic cycle, while the price charged for the utility service can be adjusted with limited impact upon demanded volumes. As a result, the earnings of regulated utilities have been, and are expected to continue to be, stable irrespective of economic conditions.
• Infrastructure: This includes airports, ports, toll roads and broadcast communications infrastructure. Regulation of infrastructure companies is generally less intensive than regulation of utilities and this allows companies to accrue the benefits of volume growth (i.e. the returns of infrastructure companies are linked to growth in passengers, vehicles or containers). As economies develop, grow and become more inter-dependent, we expect the underlying level of aviation, shipping and vehicle traffic to increase. As a result, the revenues and earnings derived by infrastructure assets are expected to grow.
If a company isn't either a regulated utility or an infrastructure asset per se, we require at least 75% of its earnings to be consistently derived from either regulated assets or infrastructure assets before it can be included in the Funds.
Performance Review
Global stocks rose in the twelve months ended June 30, 2020, after huge fiscal and monetary stimulus offset the damage from the coronavirus to economic activity, company profits and investor confidence. But infrastructure stocks fell over the twelve months as the restrictions on everyday activity, including air and road travel, hit these stocks to a greater degree.
The Frontier MFG Core Infrastructure Fund, Institutional Class, returned -2.40%, net of fees, for the year ended June 30, 2020. The Fund's return outperformed the -14.76% return of its benchmark, the S&P Global Infrastructure Index.
Stocks that detracted the most in local currency terms included the investments in the airport operators Aeroports De Paris of France, Aena of Spain and Power Assets Holdings of Hong Kong. Aeroports De Paris, which runs the airports of Paris, and Aena, the world's largest airport operator, dived after the outbreak of the virus that causes the illness called COVID-19 prompted governments to close borders and order their populations not to travel to control the pandemic. Power Assets fell after China moved to implement new security laws that were widely viewed to reduce the region's political independence.
Stocks that contributed the most included the investments in Cellnex Telecom of Spain, and American Tower and SBA Communications of the U.S. The trio of companies that own communications towers that provide co-location space to wireless carriers rose as investors judged they would benefit from higher demand for data across mobile telephony and the internet as a locked-down world went online.
The Frontier MFG Select Infrastructure Fund, Institutional Class, returned -8.26%, net of fees, for the year ended June 30, 2020. The Fund's return outperformed the -14.76% return of its benchmark, the S&P Global Infrastructure Index, for the same time period.
page 14

Stocks that detracted the most in local currency terms included the investments in the airport operators Aeroports De Paris of France, Sydney Airport and Aena of Spain. Aeroports De Paris, which runs the airports of Paris, Sydney Airport and Aena, the world's largest airport operator, dived after the outbreak of the virus that causes the illness called COVID-19 prompted governments to close borders and order their populations not to travel to control the pandemic.
Stocks that contributed the most included the investments in Crown Castle International of the U.S., Koninklijke Vopak of the Netherlands and Snam of Italy. Crown Castle rose as investors judged that the company that owns more than 40,000 communications towers in the U.S. that provide co-location space to wireless carriers would benefit from higher demand for data across mobile telephony and the internet as a locked-down world went online. Vopak gained as demand for oil storage surged as the oil price fell. Snam, a gas transmission utility, rose as investors sought highly defensive stocks.
Portfolio Outlook and Strategy
Notwithstanding our expectations for greater volatility in the short to medium term driven by the COVID-19 crisis, we are confident that the underlying businesses that we have included in our defined universe and in our investment strategy will prove resilient over the longer term. We regard the businesses that we invest in to be of high quality and, while short-term movements in share prices reflect issues of the day, we expect that share prices over the longer term will reflect the underlying cash flows leading to investment returns consistent with our expectations.
The strategy seeks to provide investors with attractive risk-adjusted returns from infrastructure securities. It does this by investing in a portfolio of listed infrastructure companies that meet our strict definition of infrastructure. We believe that infrastructure assets, with requisite earnings reliability and a linkage of earnings to inflation, offer attractive, long-term investment propositions. Furthermore, given the resilient nature of earnings and the structural linkage of those earnings to inflation, investment returns generated by infrastructure stocks are different from standard asset classes and offer investors diversification when included in an investment portfolio. In the current uncertain economic and investment climate, the reliable financial performance of infrastructure investments makes them attractive and an investment in listed infrastructure can be expected to reward patient investors with a long-term time frame.
Yours sincerely,
Gerald Stack
Portfolio Manager
MFG Asset Management
page 15

INVESTMENT HIGHLIGHTS
Growth of a $100,000 Investment (Unaudited)

* 1/18/12 commencement of operations.
Portfolio Total Return** | |
FOR PERIODS
ENDED
6/30/20 | | FUND | | MSCI
INDEX | | S&P
GLOBAL
INDEX | |
SIX MONTHS | | | (9.77 | )% | | | (5.77 | )% | | | (19.35 | )% | |
ONE YEAR | | | (2.40 | )% | | | 2.84 | % | | | (14.76 | )% | |
FIVE YEAR
AVERAGE | | | 7.61 | % | | | 6.90 | % | | | 2.62 | % | |
AVERAGE
ANNUAL
SINCE
INCEPTION | | | 8.96 | % | | | 9.38 | % | | | 5.72 | % | |
Institutional Class Expenses | |
GROSS EXPENSE RATIO | | | 0.61 | % | |
NET EXPENSE RATIO | | | 0.52 | % | |
This chart assumes an initial gross investment of $100,000 made on 1/18/12 (commencement of operations). Returns shown include the reinvestment of all distributions. Past performance is not predictive of future results. Investment return and principal value will fluctuate so that shares, when redeemed, may be worth more or less than the original cost. In the absence of existing fee waivers, total return would be reduced. To receive current to the most recent month-end performance, please call 1-888-825-2100.
The MSCI World Index (Net) represents large and mid cap equities across 23 Developed Markets countries and covers approximately 85% of the free float-adjusted market capitalization in each country. The S&P Global Infrastructure Index is a global developed markets infrastructure and utilities benchmark. Neither index reflects investment management fees, brokerage commissions or other expenses associated with investing in equity securities. A direct investment in an index is not possible.
Frontegra Asset Management, Inc. has contractually agreed through October 31, 2022, to waive its management fee and/or reimburse the Fund's operating expenses to the extent necessary to ensure that the Fund's total operating expenses (excluding taxes, interest, brokerage commissions, acquired fund fees and expenses and extraordinary expenses) do not exceed 0.50% of the Fund's average daily net assets for the Institutional Class. The expense ratios presented are based on the annualized expense ratios as reported in the Fund's current prospectus, which may differ from the expense ratios presented in the Fund's financial highlights.
** The returns shown do not reflect the deduction of taxes that a shareholder would pay on Fund distributions or the redemption of Fund shares.
The above graph relates to Institutional Class shares of the Fund. Performance for Service Class shares will vary from the performance of the Institutional Class shares shown above due to differences in expenses.
page 16

INVESTMENT HIGHLIGHTS
Growth of a $1,000,000 Investment (Unaudited)
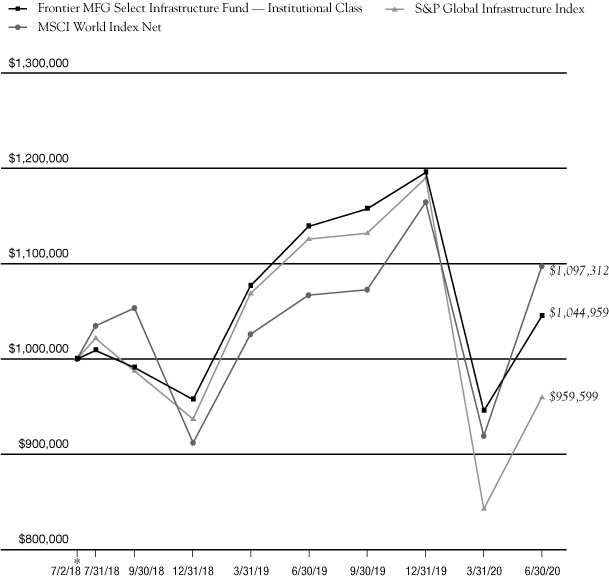
* 7/2/18 commencement of operations.
Portfolio Total Return** | |
FOR PERIODS
ENDED
6/30/20 | | FUND | | MSCI
INDEX | | S&P
GLOBAL
INDEX | |
SIX MONTHS | | | (12.60 | )% | | | (5.77 | )% | | | (19.35 | )% | |
ONE YEAR | | | (8.26 | )% | | | 2.84 | % | | | (14.76 | )% | |
AVERAGE
ANNUAL
SINCE
INCEPTION | | | 2.23 | % | | | 4.77 | % | | | (2.05 | )% | |
Institutional Class Expenses | |
GROSS EXPENSE RATIO | | | 1.25 | % | |
NET EXPENSE RATIO | | | 0.81 | % | |
This chart assumes an initial gross investment of $1,000,000 made on 7/2/18 (commencement of operations). Returns shown include the reinvestment of all distributions. Past performance is not predictive of future results. Investment return and principal value will fluctuate so that shares, when redeemed, may be worth more or less than the original cost. In the absence of existing fee waivers, total return would be reduced. To receive current to the most recent month-end performance, please call 1-888-825-2100.
The MSCI World Index (Net) represents large and mid cap equities across 23 Developed Markets countries and covers approximately 85% of the free float-adjusted market capitalization in each country. The S&P Global Infrastructure Index is a global developed markets infrastructure and utilities benchmark. Neither index reflects investment management fees, brokerage commissions or other expenses associated with investing in equity securities. A direct investment in an index is not possible.
Frontegra Asset Management, Inc. has contractually agreed through October 31, 2022, to waive its management fee and/or reimburse the Fund's operating expenses to the extent necessary to ensure that the Fund's total operating expenses (excluding taxes, interest, brokerage commissions, acquired fund fees and expenses and extraordinary expenses) do not exceed 0.80% of the Fund's average daily net assets for the Institutional Class. The expense ratios presented are based on the annualized expense ratios as reported in the Fund's current prospectus, which may differ from the expense ratios presented in the Fund's financial highlights.
** The returns shown do not reflect the deduction of taxes that a shareholder would pay on Fund distributions or the redemption of Fund shares.
The above graph relates to Institutional Class shares of the Fund. Performance for Service Class shares will vary from the performance of the Institutional Class shares shown above due to differences in expenses.
page 17
This page intentionally left blank.

FRONTIER
CARAVAN EMERGING MARKETS FUND

REPORT FROM CARAVAN CAPITAL MANAGEMENT, LLC
Dear Shareholders:
The investment objective of the Frontier Caravan Emerging Markets Fund is long-term capital appreciation.
Performance Review
The Frontier Caravan Emerging Markets Fund returned -9.44%, net of fees, for the partial period from the inception date of the Fund on December 4, 2019, to June 30, 2020, versus the -2.74% return of the benchmark, the MSCI Emerging Markets (Net), over the same period.
A significant source of the underperformance was the Fund's lower relative country allocations to the index heavyweight countries of China, Taiwan, and Korea — all of which were strong outperformers. The lower weights to these large market cap countries resulted from the Fund's more balanced investment approach to portfolio construction that caps any single country exposure and reduces concentration risks. China, Taiwan, and Korea comprised an average weight in the index over this period of 61% while they only accounted for 30% of the Fund. As a group, during this period these three countries returned +8.9%, far ahead of the -18.7% aggregate return of the remaining countries in the index. In addition, timing and cost impacts of investing the initial contribution at start-up of the Fund in its first month of operation also contributed to the relative underperformance.
This period stands out as unique, because almost all countries in the world were confronted with the same, unexpected massive risk — the health and economic fallout from the pandemic. We believe how each country effectively worked to contain the pandemic and "re-open" its economy was an important driver of market performance during this period. Based on these criteria, the three heavyweight countries of northeast Asia did particularly well relative to not just the other emerging market countries, but also most of the developed market countries. In terms of equity market performance, China, Taiwan, and Korea delivered positive returns that clearly separated them from the rest of the emerging markets pack. The Fund was not as well positioned as the market cap weighted index for the unexpected shocks that came with COVID-19.
Most other emerging markets (with notable exceptions such as Vietnam) were weighed down by concerns about the lack of healthcare infrastructure to absorb the surge in infections and limited financial resources to offset the sharp fall in economic activity with large-enough stimulus measures. COVID-19 also amplified pre-existing country-specific risks. For instance, the ongoing credit crunch in India and political instability in Brazil became even more onerous as downside risk factors. We note the Fund's lower relative weights to India and Brazil were top positive contributors to the portfolio's return as these large market cap countries returns were sharply below the index return.
Relative value, correlation and recent volatility are factors that drive country allocation in our investment process. As a result, the Fund tended to allocate larger relative weights to countries that are on paths to recovery following economic crises such as Egypt, Pakistan, and Turkey. These positions became significant drags to relative performance, as COVID-19 effectively derailed these countries' comeback stories in the near-term. These markets sold off sharply on concerns that the hard-won improvements in their external balances may reverse on increased fiscal spending to staunch the effects of the healthcare/economic fallout. They were also at risk of facing deep cuts to their hard-currency earnings streams. Egypt and Turkey depend heavily on tourism which grounded to a standstill, while Egypt and Pakistan rely on remittances, a large percentage of which come from oil-dependent Gulf countries whose economies were reeling from a collapse in oil prices.
Within each country, the Fund tilts its holdings heavily towards secular growth sectors such as technology and consumer-facing sectors with a particular focus on digital e-commerce plays. This sector strategy was positive for the Fund's relative performance over the period. While the lower relative weights to northeast Asia hurt the Fund's relative return, the Fund actually posted higher country returns in China, Taiwan, and Korea compared to their respective country benchmarks. Megacap e-commerce and tech names benefited from the
page 20

sudden and sizeable shifts in consumer behavior brought about by the pandemic. Lockdowns accelerated the adoption and usage intensity of internet consumer services from Alibaba and Tencent. The jump in e-commerce and the broader virtual economy worldwide, in turn, increased demand from data centers (the cloud) for chips supplied by TSMC and Samsung Electronics.
Sector-wise, the Fund's higher weight to the banking sector was the largest detractor to relative performance. While COVID-19 gave digital economy stocks an unexpected boost, it had the opposite effect on banks. The unprecedented level of monetary loosening via rate cuts and quantitative easing lifted investor sentiment particularly for tech stocks but were detrimental to banks' fundamentals. The Fund's position in the sector is not entirely a reflection of our bullish view on the banking sector per se, but an outcome of our bullish country views. Banking is an under-penetrated sector that provides a broad, leveraged exposure to these countries' reform-driven, idiosyncratic macro growth stories. Amid an environment of ultra-low interest rates and steep economic contractions, we acknowledge that banks worldwide are faced with the same predicament of contracting net investment margins and surging credit costs, while differentiated long-term growth outlooks for emerging market banks may be overlooked in the near-term.
Fund Outlook and Strategy
For most of this year, markets have mostly shrugged off the rising and broadening US-China tensions across multiple fronts (in trade, technology, geopolitics, human rights, and COVID-19). We believe the markets may be underestimating this risk. An anti-China stance is one of the few issues that appears to unite the two U.S. political parties. Ahead of the November U.S. Presidential election, we expect the two candidates to compete on who is tougher on China. This raises the possibility of President Trump placing additional economic sanctions to prove his toughness and deflect criticism about his own handling of the virus.
During 2018 and 2019, when the U.S. and China were engaged in an escalation of tit-for-tat trade tariffs, China mostly underperformed against the MSCI Emerging Markets Index. We expect similar market dynamics to play out in the second half of 2020 given the escalating geo-political tensions. In June, we realized some profits in China and lowered our country target relative to the index.
There has been a significant divergence in returns and valuations between stocks in tech and the traditional cyclical/financial sectors. We believe tech stocks have run up too much relative to fundamentals (even after accounting for ultra-low interest rates) and expect laggards such as banks to catch up. The extent of this catch-up, however, may hinge on a factor that has little visibility — scientific progress in the development of an effective healthcare solution to the virus that in turn, will shape expectations on how quickly economies can return to a semblance of normality. We take comfort in the fact that all earlier pandemics in history came to an end. In addition, while the pandemic continues, we believe many of the emerging market countries we have positioned at weights higher than the benchmark have younger populations which should weather the pandemic better than countries with older demographics.
Yours sincerely,
Cliff Quisenberry
Portfolio Manager
Caravan Capital Management, LLC
page 21

INVESTMENT HIGHLIGHTS
Growth of a $100,000 Investment (Unaudited)
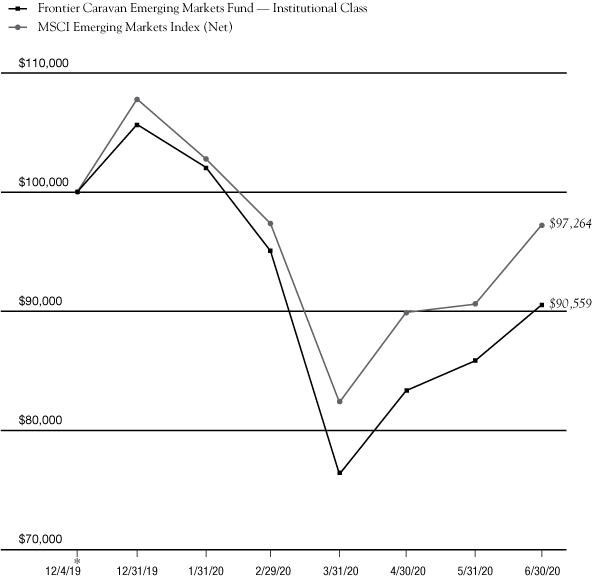
* 12/4/19 commencement of operations.
Portfolio Total Return** | |
FOR PERIODS
ENDED 6/30/20 | | FUND | | INDEX | |
SIX MONTHS | | | (14.31 | )% | | | (9.78 | )% | |
SINCE INCEPTION | | | (9.44 | )% | | | (2.74 | )% | |
Institutional Class Expenses | |
GROSS EXPENSE RATIO | | | 2.00 | % | |
NET EXPENSE RATIO | | | 0.80 | % | |
This chart assumes an initial gross investment of $100,000 made on 12/4/19 (commencement of operations). Returns shown include the reinvestment of all distributions. Past performance is not predictive of future results. Investment return and principal value will fluctuate so that shares, when redeemed, may be worth more or less than the original cost. In the absence of existing fee waivers, total return would be reduced. To receive current to the most recent month-end performance, please call 1-888-825-2100.
The MSCI Emerging Markets Index (Net) represents large and mid cap equities across 26 Emerging Markets countries and covers approximately 85% of the free float-adjusted market capitalization in each country. The index does not reflect investment management fees, brokerage commissions or other expenses associated with investing in equity securities. A direct investment in the index is not possible.
Frontegra Asset Management, Inc. has contractually agreed through October 31, 2021, to waive its management fee and/or reimburse the Fund's operating expenses to the extent necessary to ensure that the Fund's total operating expenses (excluding taxes, interest, brokerage commissions, acquired fund fees and expenses and extraordinary expenses) do not exceed 0.80% of the Fund's average daily net assets for the Institutional Class. The expense ratios presented are based on the annualized expense ratios as reported in the Fund's current prospectus, which may differ from the expense ratios presented in the Fund's financial highlights.
** The returns shown do not reflect the deduction of taxes that a shareholder would pay on Fund distributions or the redemption of Fund shares.
The above graph relates to Institutional Class shares of the Fund. Performance for Service Class shares will vary from the performance of the Institutional Class shares shown above due to differences in expenses.
page 22

Frontier Funds
EXPENSE EXAMPLE
June 30, 2020 (Unaudited)
As a shareholder of a mutual fund, you incur two types of costs: (1) transaction costs, including redemption fees, and (2) ongoing costs, including management fees, distribution and/or service (12b-1) fees and other fund expenses. Although the Funds charge no sales loads, you will be assessed fees for outgoing wire transfers, returned checks and stop payment orders at prevailing rates charged by U.S. Bancorp Fund Services, LLC, the Funds' transfer agent. If you request that a redemption be made by wire transfer, currently the Funds' transfer agent charges a $15.00 fee. A redemption fee of 2.00% of the then current value of the shares redeemed may be imposed on certain redemptions of shares made within 30 days of purchase for the Frontier MFG Global Equity, Frontier MFG Global Plus, Frontier MFG Global Sustainable, Frontier MFG Core Infrastructure and Frontier MFG Select Infrastructure Funds and within 90 days of purchase for the Frontier Caravan Emerging Markets Fund.
This Example is intended to help you understand your ongoing costs (in dollars) of investing in the Funds and to compare these costs with the ongoing costs of investing in other mutual funds. The Example is based on an investment of $1,000 invested at the beginning of the period and held for the entire period (1/1/20 – 6/30/20).
Actual Expenses
The first line of the table on the following page for each Fund provides information about actual account values and actual expenses. The Example includes management fees, registration fees, fee waivers/reimbursements and other expenses. However, the Example does not include portfolio trading commissions and related expenses and other extraordinary expenses as determined under generally accepted accounting principles. You may use the information in this line, together with the amount you invested, to estimate the expenses that you paid over the period. Simply divide your account value by $1,000 (for example, an $8,600 account value divided by $1,000 = 8.6), then multiply the result by the number in the first line under the heading entitled "Expenses Paid During the Period" to estimate the expenses you paid on your account during this period.
Hypothetical Example for Comparison Purposes
The second line of the table for each Fund provides information about hypothetical account values and hypothetical expenses based on each of the Fund's actual expense ratios and an assumed rate of return of 5% per year before expenses, which is not the actual return. The hypothetical account values and expenses may not be used to estimate the actual ending account balance or expenses you paid for the period. You may use this information to compare the ongoing costs of investing in each of the Funds and other funds. To do so, compare this 5% hypothetical example with the 5% hypothetical examples that appear in the shareholder reports of the other funds.
Please note that the expenses shown in the table are meant to highlight your ongoing costs only and do not reflect any transactional costs, such as redemption fees. Therefore, the second line of the table is useful in comparing ongoing costs only, and will not help you determine the relative total costs of owning different funds. In addition, if these transactional costs were included, your costs could have been higher.
page 23

Frontier Funds
EXPENSE EXAMPLE (continued)
June 30, 2020 (Unaudited)
| | | Beginning Account
Value 1/1/2020 | | Ending Account
Value 6/30/2020 | | Annualized
Expense Ratio* | | Expenses Paid
During the Period* | |
MFG Global Equity Fund | |
Actual Fund Return | | $ | 1,000.00 | | | $ | 989.00 | | | | 0.80 | % | | $ | 3.96 | | |
Hypothetical 5% Return | | $ | 1,000.00 | | | $ | 1,020.89 | | | | 0.80 | % | | $ | 4.02 | | |
MFG Global Plus Fund –
Institutional Class | |
Actual Fund Return | | $ | 1,000.00 | | | $ | 990.60 | | | | 0.80 | % | | $ | 3.96 | | |
Hypothetical 5% Return | | $ | 1,000.00 | | | $ | 1,020.89 | | | | 0.80 | % | | $ | 4.02 | | |
MFG Global Plus Fund –
Service Class | |
Actual Fund Return | | $ | 1,000.00 | | | $ | 989.10 | | | | 0.90 | % | | $ | 4.45 | | |
Hypothetical 5% Return | | $ | 1,000.00 | | | $ | 1,020.39 | | | | 0.90 | % | | $ | 4.52 | | |
MFG Global Sustainable
Fund – Institutional Class | |
Actual Fund Return | | $ | 1,000.00 | | | $ | 964.80 | | | | 0.80 | % | | $ | 3.91 | | |
Hypothetical 5% Return | | $ | 1,000.00 | | | $ | 1,020.89 | | | | 0.80 | % | | $ | 4.02 | | |
MFG Core Infrastructure
Fund – Institutional Class | |
Actual Fund Return | | $ | 1,000.00 | | | $ | 902.30 | | | | 0.50 | % | | $ | 2.36 | | |
Hypothetical 5% Return | | $ | 1,000.00 | | | $ | 1,022.38 | | | | 0.50 | % | | $ | 2.51 | | |
MFG Core Infrastructure
Fund – Service Class | |
Actual Fund Return | | $ | 1,000.00 | | | $ | 902.50 | | | | 0.60 | % | | $ | 2.84 | | |
Hypothetical 5% Return | | $ | 1,000.00 | | | $ | 1,021.88 | | | | 0.60 | % | | $ | 3.02 | | |
MFG Select Infrastructure
Fund – Institutional Class | |
Actual Fund Return | | $ | 1,000.00 | | | $ | 874.00 | | | | 0.80 | % | | $ | 3.73 | | |
Hypothetical 5% Return | | $ | 1,000.00 | | | $ | 1,020.89 | | | | 0.80 | % | | $ | 4.02 | | |
MFG Select Infrastructure
Fund – Service Class | |
Actual Fund Return | | $ | 1,000.00 | | | $ | 873.00 | | | | 0.90 | % | | $ | 4.19 | | |
Hypothetical 5% Return | | $ | 1,000.00 | | | $ | 1,020.39 | | | | 0.90 | % | | $ | 4.52 | | |
Caravan Emerging Markets
Fund – Institutional Class | |
Actual Fund Return | | $ | 1,000.00 | | | $ | 856.90 | | | | 0.80 | % | | $ | 3.69 | | |
Hypothetical 5% Return | | $ | 1,000.00 | | | $ | 1,020.89 | | | | 0.80 | % | | $ | 4.02 | | |
* Expenses are equal to each Fund's annualized expense ratio indicated above, multiplied by the average account value over the period, multiplied by 182/366 to reflect the one-half year period.
page 24

Frontier Funds
EXPENSE EXAMPLE (continued)
June 30, 2020 (Unaudited)
| | | Beginning
Account Value | | Ending Account
Value 6/30/2020 | | Annualized
Expense Ratio | | Expenses Paid
During the Period | |
Caravan Emerging Markets
Fund – Service Class | |
Actual Fund Return** | | $ | 1,000.00 | | | $ | 1,150.10 | | | | 0.90 | % | | $ | 2.27 | | |
Hypothetical 5% Return*** | | $ | 1,000.00 | | | $ | 1,020.39 | | | | 0.90 | % | | $ | 4.52 | | |
** Actual expenses are equal to the Fund's annualized expense ratio of 0.90% multiplied by the average account value over the period, multiplied by 86/366 to reflect the most recent fiscal period end since the Caravan Emerging Markets Fund — Service Class commenced operations on April 6, 2020.
*** Hypothetical expenses are equal to the Funds' annualized expense ratio of 0.90% multiplied by the average account value over the period commencing January 1, 2020, multiplied by 182/366 to reflect information had the Caravan Emerging Markets Fund — Service Class been in operation for the entire fiscal half year.
page 25

Frontier MFG Global Equity Fund
SCHEDULE OF INVESTMENTS
June 30, 2020
Number of Shares | | | | Value | |
COMMON STOCKS 84.6% | | | |
| | | China 13.3% | |
| | 357,775 | | | Alibaba Group
Holding Ltd. - ADR (a) | | $ | 77,172,067 | | |
| | 1,208,720 | | | Tencent Holdings Ltd. | | | 77,452,255 | | |
| | | | 154,624,322 | | |
| | | France 1.1% | |
| | 29,478 | | | LVMH Moet Hennessy
Louis Vuitton SE | | | 13,014,335 | | |
| | | Germany 3.9% | |
| | 322,866 | | | SAP SE | | | 45,133,063 | | |
| | | Switzerland 7.7% | |
| | 366,744 | | | Nestle SA | | | 40,661,137 | | |
| | 556,297 | | | Novartis AG | | | 48,465,188 | | |
| | | | 89,126,325 | | |
| | | United Kingdom 4.6% | |
| | 589,096 | | | Reckitt Benckiser Group PLC | | | 54,195,730 | | |
| | | United States 54.0% | |
| | 5,871 | | | Alphabet, Inc. - Class A (a) | | | 8,325,372 | | |
| | 43,471 | | | Alphabet, Inc. - Class C (a) | | | 61,451,040 | | |
| | 275,755 | | | Crown Castle International
Corp. | | | 46,147,599 | | |
| | 483,176 | | | Eversource Energy | | | 40,234,066 | | |
| | 294,035 | | | Facebook, Inc. - Class A (a) | | | 66,766,527 | | |
| | 101,948 | | | Mastercard, Inc. - Class A | | | 30,146,024 | | |
| | 133,361 | | | McDonald's Corp. | | | 24,601,104 | | |
| | 463,255 | | | Microsoft Corp. | | | 94,277,025 | | |
| | 252,171 | | | PepsiCo, Inc. | | | 33,352,136 | | |
| | 672,465 | | | Starbucks Corp. | | | 49,486,699 | | |
| | 111,642 | | | The Estee Lauder
Companies, Inc. - Class A | | | 21,064,613 | | |
| | 228,213 | | | Visa, Inc. - Class A | | | 44,083,905 | | |
| | 388,089 | | | WEC Energy Group, Inc. | | | 34,016,001 | | |
Number of Shares | | | | Value | |
| | | United States 54.0% (continued) | |
| | 668,245 | | | Xcel Energy, Inc. | | $ | 41,765,312 | | |
| | 374,803 | | | Yum! Brands, Inc. | | | 32,574,129 | | |
| | | | 628,291,552 | | |
| | | Total Common Stocks | |
| | | | | (Cost $640,986,004) | | | 984,385,327 | | |
SHORT-TERM INVESTMENTS 15.1% | | | |
| | | Money Market Deposit Account 15.1% | |
| | 175,108,478 | | | U.S. Bank N.A., 0.07% (b) | | | 175,108,478 | | |
| | | Total Short-Term Investments | |
| | | | | (Cost $175,108,478) | | | 175,108,478 | | |
| | | Total Investments 99.7% | |
| | | | | (Cost $816,094,482) | | | 1,159,493,805 | | |
| | | | | Other Assets in Excess of
Liabilities 0.3% | | | 2,954,578 | | |
| | | | | TOTAL NET ASSETS 100.0% | | $ | 1,162,448,383 | | |
(a) Non-Income Producing.
(b) The Money Market Deposit Account ("MMDA") is a short-term investment vehicle in which the Fund holds cash balances. The MMDA will bear interest at a variable rate that is determined based on market conditions and may change daily and by any amount. The rate shown is as of June 30, 2020.
ADR - American Depositary Receipt
The accompanying notes are an integral part of these financial statements.
page 26

Frontier MFG Global Equity Fund
SCHEDULE OF INVESTMENTS (continued)
June 30, 2020
PORTFOLIO DIVERSIFICATION
Sectors | | Percentage | |
Consumer Discretionary | | | 18.4 | % | |
Information Technology | | | 18.4 | | |
Communication Services | | | 16.9 | | |
Consumer Staples | | | 12.8 | | |
Utilities | | | 10.0 | | |
Health Care | | | 4.1 | | |
Real Estate | | | 4.0 | | |
Total Common Stocks | | | 84.6 | | |
Total Short-Term Investments | | | 15.1 | | |
Total Investments | | | 99.7 | | |
Other Assets in Excess of Liabilities | | | 0.3 | | |
Total Net Assets | | | 100.0 | % | |
The accompanying notes are an integral part of these financial statements.
page 27

Frontier MFG Global Plus Fund
SCHEDULE OF INVESTMENTS
June 30, 2020
Number of Shares | | | | Value | |
COMMON STOCKS 84.1% | | | |
| | | China 13.2% | |
| | 163,924 | | | Alibaba Group
Holding Ltd. - ADR (a) | | $ | 35,358,407 | | |
| | 554,369 | | | Tencent Holdings Ltd. | | | 35,522,809 | | |
| | | | 70,881,216 | | |
| | | France 1.1% | |
| | 13,550 | | | LVMH Moet Hennessy
Louis Vuitton SE | | | 5,982,232 | | |
| | | Germany 3.9% | |
| | 148,409 | | | SAP SE | | | 20,745,921 | | |
| | | Switzerland 7.6% | |
| | 168,534 | | | Nestle SA | | | 18,685,470 | | |
| | 255,374 | | | Novartis AG | | | 22,248,455 | | |
| | | | 40,933,925 | | |
| | | United Kingdom 4.6% | |
| | 269,941 | | | Reckitt Benckiser Group PLC | | | 24,834,067 | | |
| | | United States 53.7% | |
| | 2,704 | | | Alphabet, Inc. - Class A (a) | | | 3,834,407 | | |
| | 19,942 | | | Alphabet, Inc. - Class C (a) | | | 28,190,211 | | |
| | 126,702 | | | Crown Castle International Corp. | | | 21,203,580 | | |
| | 221,047 | | | Eversource Energy | | | 18,406,584 | | |
| | 134,744 | | | Facebook, Inc. - Class A (a) | | | 30,596,320 | | |
| | 46,831 | | | Mastercard, Inc. - Class A | | | 13,847,927 | | |
| | 61,289 | | | McDonald's Corp. | | | 11,305,982 | | |
| | 212,388 | | | Microsoft Corp. | | | 43,223,082 | | |
| | 115,373 | | | PepsiCo, Inc. | | | 15,259,233 | | |
| | 308,290 | | | Starbucks Corp. | | | 22,687,061 | | |
| | 51,197 | | | The Estee Lauder
Companies, Inc. - Class A | | | 9,659,850 | | |
| | 104,636 | | | Visa, Inc. - Class A | | | 20,212,536 | | |
Number of Shares | | | | Value | |
| | | United States 53.7% (continued) | |
| | 177,597 | | | WEC Energy Group, Inc. | | $ | 15,566,377 | | |
| | 306,095 | | | Xcel Energy, Inc. | | | 19,130,937 | | |
| | 171,631 | | | Yum! Brands, Inc. | | | 14,916,450 | | |
| | | | 288,040,537 | | |
| | | Total Common Stocks | |
| | | | | (Cost $345,411,895) | | | 451,417,898 | | |
SHORT-TERM INVESTMENTS 15.5% | | | |
| | | Money Market Deposit Account 15.5% | |
| | 83,035,429 | | | U.S. Bank N.A., 0.07% (b) | | | 83,035,429 | | |
| | | Total Short-Term Investments | |
| | | | | (Cost $83,035,429) | | | 83,035,429 | | |
| | | Total Investments 99.6% | |
| | | | | (Cost $428,447,324) | | | 534,453,327 | | |
| | | | | Other Assets in Excess of
Liabilities 0.4% | | | 2,028,669 | | |
| | | | | TOTAL NET ASSETS 100.0% | | $ | 536,481,996 | | |
(a) Non-Income Producing.
(b) The Money Market Deposit Account ("MMDA") is a short-term investment vehicle in which the Fund holds cash balances. The MMDA will bear interest at a variable rate that is determined based on market conditions and may change daily and by any amount. The rate shown is as of June 30, 2020.
ADR - American Depositary Receipt
The accompanying notes are an integral part of these financial statements.
page 28

Frontier MFG Global Plus Fund
SCHEDULE OF INVESTMENTS (continued)
June 30, 2020
PORTFOLIO DIVERSIFICATION
Sectors | | Percentage | |
Communication Services | | | 18.3 | % | |
Information Technology | | | 18.3 | | |
Consumer Discretionary | | | 16.8 | | |
Consumer Staples | | | 12.7 | | |
Utilities | | | 9.9 | | |
Health Care | | | 4.2 | | |
Real Estate | | | 3.9 | | |
Total Common Stocks | | | 84.1 | | |
Total Short-Term Investments | | | 15.5 | | |
Total Investments | | | 99.6 | | |
Other Assets in Excess of Liabilities | | | 0.4 | | |
Total Net Assets | | | 100.0 | % | |
The accompanying notes are an integral part of these financial statements.
page 29

Frontier MFG Global Sustainable Fund
SCHEDULE OF INVESTMENTS
June 30, 2020
Number of Shares | | | | Value | |
COMMON STOCKS 83.5% | | | |
| | | China 11.5% | |
| | 3,089 | | | Alibaba Group
Holding Ltd. - ADR (a) | | $ | 666,297 | | |
| | 8,414 | | | Tencent Holdings Ltd. | | | 539,152 | | |
| | | | 1,205,449 | | |
| | | France 2.3% | |
| | 3,521 | | | Danone SA | | | 244,402 | | |
| | | Germany 3.9% | |
| | 2,963 | | | SAP SE | | | 414,195 | | |
| | | Italy 2.2% | |
| | 34,101 | | | Terna Rete Elettrica
Nazionale SpA | | | 235,212 | | |
| | | Netherlands 3.8% | |
| | 7,530 | | | Unilever NV | | | 401,481 | | |
| | | Spain 2.9% | |
| | 16,396 | | | Red Electrica Corp SA | | | 306,760 | | |
| | | Switzerland 7.8% | |
| | 3,404 | | | Nestle SA | | | 377,403 | | |
| | 5,103 | | | Novartis AG | | | 444,579 | | |
| | | | 821,982 | | |
| | | United Kingdom 4.7% | |
| | 5,375 | | | Reckitt Benckiser Group PLC | | | 494,490 | | |
| | | United States 44.4% | |
| | 542 | | | Alphabet, Inc. - Class C (a) | | | 766,177 | | |
| | 290 | | | Chipotle Mexican Grill, Inc. (a) | | | 305,184 | | |
| | 818 | | | CME Group, Inc. | | | 132,958 | | |
| | 1,269 | | | Eversource Energy | | | 105,670 | | |
| | 2,502 | | | Facebook, Inc. - Class A (a) | | | 568,129 | | |
| | 2,742 | | | Intercontinental Exchange, Inc. | | | 251,167 | | |
| | 876 | | | Mastercard, Inc. - Class A | | | 259,033 | | |
| | 3,665 | | | Microsoft Corp. | | | 745,864 | | |
Number of Shares | | | | Value | |
| | | United States 44.4% (continued) | |
| | 3,636 | | | Mondelez International, Inc. -
Class A | | $ | 185,909 | | |
| | 2,447 | | | PepsiCo, Inc. | | | 323,640 | | |
| | 3,969 | | | Starbucks Corp. | | | 292,079 | | |
| | 1,645 | | | Visa, Inc. - Class A | | | 317,765 | | |
| | 1,621 | | | Walmart, Inc. | | | 194,163 | | |
| | 2,647 | | | Yum! Brands, Inc. | | | 230,051 | | |
| | | | 4,677,789 | | |
| | | Total Common Stocks | |
| | | | | (Cost $7,840,303) | | | 8,801,760 | | |
SHORT-TERM INVESTMENTS 15.9% | | | |
| | | Money Market Deposit Account 15.9% | |
| | 1,672,923 | | | U.S. Bank N.A., 0.07% (b) | | | 1,672,923 | | |
| | | Total Short-Term Investments | |
| | | | | (Cost $1,672,923) | | | 1,672,923 | | |
| | | Total Investments 99.4% | |
| | | | | (Cost $9,513,226) | | | 10,474,683 | | |
| | | | | Other Assets in Excess of
Liabilities 0.6% | | | 61,911 | | |
| | | | | TOTAL NET ASSETS 100.0% | | $ | 10,536,594 | | |
(a) Non-Income Producing.
(b) The Money Market Deposit Account ("MMDA") is a short-term investment vehicle in which the Fund holds cash balances. The MMDA will bear interest at a variable rate that is determined based on market conditions and may change daily and by any amount. The rate shown is as of June 30, 2020.
ADR - American Depositary Receipt
The accompanying notes are an integral part of these financial statements.
page 30

Frontier MFG Global Sustainable Fund
SCHEDULE OF INVESTMENTS (continued)
June 30, 2020
PORTFOLIO DIVERSIFICATION
Sectors | | Percentage | |
Consumer Staples | | | 21.1 | % | |
Communication Services | | | 17.8 | | |
Information Technology | | | 16.5 | | |
Consumer Discretionary | | | 14.2 | | |
Utilities | | | 6.1 | | |
Health Care | | | 4.2 | | |
Financials | | | 3.6 | | |
Total Common Stocks | | | 83.5 | | |
Total Short-Term Investments | | | 15.9 | | |
Total Investments | | | 99.4 | | |
Other Assets in Excess of Liabilities | | | 0.6 | | |
Total Net Assets | | | 100.0 | % | |
The accompanying notes are an integral part of these financial statements.
page 31

Frontier MFG Core Infrastructure Fund
SCHEDULE OF INVESTMENTS
June 30, 2020
Number of Shares | | | | Value | |
COMMON STOCKS 88.7% | | | |
| | | Australia 7.3% | |
| | 1,172,217 | | | APA Group | | $ | 9,063,929 | | |
| | 808,689 | | | Atlas Arteria Ltd. | | | 3,734,520 | | |
| | 4,016,566 | | | AusNet Services | | | 4,640,625 | | |
| | 1,505,111 | | | Spark Infrastructure Group | | | 2,247,953 | | |
| | 2,245,177 | | | Sydney Airport | | | 8,860,765 | | |
| | 1,827,792 | | | Transurban Group | | | 17,924,592 | | |
| | | | 46,472,384 | | |
| | | Canada 11.9% | |
| | 188,300 | | | Canadian Utilities Ltd. - Class A | | | 4,688,082 | | |
| | 239,563 | | | Emera, Inc. | | | 9,426,529 | | |
| | 539,231 | | | Enbridge, Inc. | | | 16,396,181 | | |
| | 451,284 | | | Fortis, Inc. | | | 17,162,487 | | |
| | 593,120 | | | Hydro One Ltd. | | | 11,153,767 | | |
| | 386,459 | | | TC Energy Corp. | | | 16,510,476 | | |
| | | | 75,337,522 | | |
| | | Chile 0.3% | |
| | 6,257,149 | | | Aguas Andinas SA - Class A | | | 2,119,234 | | |
| | | France 5.6% | |
| | 98,314 | | | Aeroports de Paris | | | 10,149,958 | | |
| | 546,447 | | | Getlink SE (a) | | | 7,901,983 | | |
| | 188,971 | | | Vinci SA | | | 17,521,931 | | |
| | | | 35,573,872 | | |
| | | Germany 0.6% | |
| | 87,628 | | | Fraport AG Frankfurt
Airport Services
Worldwide (a) | | | 3,838,519 | | |
| | | Hong Kong 1.8% | |
| | 2,120,573 | | | Power Assets Holdings Ltd. | | | 11,586,950 | | |
| | | Italy 7.0% | |
| | 223,289 | | | ACEA SpA | | | 4,293,310 | | |
| | 152,100 | | | ASTM SpA (a) | | | 3,482,396 | | |
| | 480,410 | | | Enav SpA | | | 2,170,136 | | |
Number of Shares | | | | Value | |
| | | Italy 7.0% (continued) | |
| | 753,707 | | | Italgas SpA | | $ | 4,386,280 | | |
| | 3,373,387 | | | Snam SpA | | | 16,445,701 | | |
| | 1,997,289 | | | Terna Rete Elettrica
Nazionale SpA | | | 13,776,344 | | |
| | | | 44,554,167 | | |
| | | Mexico 1.4% | |
| | 324,904 | | | Grupo Aeroportuario del
Centro Norte SAB de CV (a) | | | 1,510,126 | | |
| | 439,880 | | | Grupo Aeroportuario del
Pacifico SAB de CV - Class B | | | 3,175,396 | | |
| | 257,847 | | | Grupo Aeroportuario del
Sureste SAB de CV - Class B (a) | | | 2,888,712 | | |
| | 322,178 | | | Infraestructura Energetica
Nova SAB de CV | | | 926,676 | | |
| | | | 8,500,910 | | |
| | | Netherlands 1.2% | |
| | 138,483 | | | Koninklijke Vopak NV | | | 7,330,195 | | |
| | | New Zealand 1.4% | |
| | 1,546,837 | | | Auckland International
Airport Ltd. | | | 6,578,318 | | |
| | 1,044,104 | | | Vector Ltd. | | | 2,430,131 | | |
| | | | 9,008,449 | | |
| | | Portugal 0.3% | |
| | 621,444 | | | REN - Redes Energeticas
Nacionais SGPS SA | | | 1,695,768 | | |
| | | Spain 8.2% | |
| | 122,363 | | | Aena SME SA (a) | | | 16,364,951 | | |
| | 308,149 | | | Cellnex Telecom SA | | | 18,820,960 | | |
| | 260,337 | | | Enagas SA | | | 6,368,737 | | |
| | 537,661 | | | Red Electrica Corp SA | | | 10,059,344 | | |
| | | | 51,613,992 | | |
| | | Switzerland 0.6% | |
| | 28,597 | | | Flughafen Zuerich AG (a) | | | 3,734,976 | | |
The accompanying notes are an integral part of these financial statements.
page 32

Frontier MFG Core Infrastructure Fund
SCHEDULE OF INVESTMENTS (continued)
June 30, 2020
Number of Shares | | | | Value | |
| COMMON STOCKS 88.7% (continued) | | | |
| | | United Kingdom 6.2% | |
| | 1,521,943 | | | National Grid PLC | | $ | 18,568,246 | | |
| | 418,224 | | | Pennon Group PLC | | | 5,791,422 | | |
| | 236,383 | | | Severn Trent PLC | | | 7,234,192 | | |
| | 677,389 | | | United Utilities Group PLC | | | 7,611,617 | | |
| | | | 39,205,477 | | |
| | | United States 34.9% | |
| | 17,333 | | | ALLETE, Inc. | | | 946,555 | | |
| | 90,439 | | | Alliant Energy Corp. | | | 4,326,602 | | |
| | 87,986 | | | Ameren Corp. | | | 6,190,695 | | |
| | 139,510 | | | American Electric
Power Co., Inc. | | | 11,110,576 | | |
| | 12,310 | | | American States Water Co. | | | 967,935 | | |
| | 45,305 | | | American Tower Corp. | | | 11,713,155 | | |
| | 63,636 | | | American Water Works Co., Inc. | | | 8,187,408 | | |
| | 41,264 | | | Atmos Energy Corp. | | | 4,109,069 | | |
| | 108,628 | | | Avangrid, Inc. | | | 4,560,203 | | |
| | 24,153 | | | Avista Corp. | | | 878,928 | | |
| | 19,149 | | | Black Hills Corp. | | | 1,084,982 | | |
| | 15,472 | | | California Water Service Group | | | 738,014 | | |
| | 99,911 | | | CMS Energy Corp. | | | 5,836,801 | | |
| | 117,336 | | | Consolidated Edison, Inc. | | | 8,439,978 | | |
| | 67,938 | | | Crown Castle International Corp. | | | 11,369,424 | | |
| | 146,907 | | | Dominion Energy Corp. | | | 11,925,910 | | |
| | 67,533 | | | DTE Energy Co. | | | 7,259,797 | | |
| | 142,700 | | | Duke Energy Corp. | | | 11,400,303 | | |
| | 10,450 | | | El Paso Electric Co. | | | 700,150 | | |
| | 75,193 | | | Entergy Corp. | | | 7,053,855 | | |
| | 91,237 | | | Essential Utilities, Inc. | | | 3,853,851 | | |
| | 76,540 | | | Evergy, Inc. | | | 4,538,057 | | |
| | 119,865 | | | Eversource Energy | | | 9,981,159 | | |
| | 190,083 | | | FirstEnergy Corp. | | | 7,371,419 | | |
| | 15,745 | | | IDACORP, Inc. | | | 1,375,641 | | |
| | 10,756 | | | MGE Energy, Inc. | | | 693,870 | | |
Number of Shares | | | | Value | |
| | | United States 34.9% (continued) | |
| | 129,691 | | | NiSource, Inc. | | $ | 2,949,173 | | |
| | 8,491 | | | Northwest Natural
Holding Company | | | 473,713 | | |
| | 15,312 | | | NorthWestern Corp. | | | 834,810 | | |
| | 16,970 | | | ONE Gas, Inc. | | | 1,307,539 | | |
| | 38,013 | | | Pinnacle West Capital Corp. | | | 2,785,973 | | |
| | 24,868 | | | PNM Resources, Inc. | | | 955,926 | | |
| | 29,679 | | | Portland General Electric Co. | | | 1,240,879 | | |
| | 274,648 | | | PPL Corp. | | | 7,096,904 | | |
| | 38,886 | | | SBA Communications Corp. | | | 11,584,917 | | |
| | 93,860 | | | Sempra Energy | | | 11,003,208 | | |
| | 8,232 | | | SJW Group | | | 511,290 | | |
| | 28,661 | | | South Jersey Industries, Inc. | | | 716,238 | | |
| | 16,083 | | | Spire, Inc. | | | 1,056,814 | | |
| | 211,137 | | | The Southern Co. | | | 10,947,453 | | |
| | 116,357 | | | WEC Energy Group, Inc. | | | 10,198,691 | | |
| | 175,875 | | | Xcel Energy, Inc. | | | 10,992,188 | | |
| | | | 221,270,053 | | |
| | | Total Common Stocks | |
| | | | | (Cost $498,388,396) | | | 561,842,468 | | |
CLOSED-END FUNDS 1.2% | | | |
| | | United Kingdom 1.2% | |
| | 2,013,608 | | | HICL Infrastructure PLC | | | 4,312,189 | | |
| | 1,489,602 | | | International Public
Partnerships Ltd. | | | 3,099,165 | | |
| | | | 7,411,354 | | |
| | | Total Closed-End Funds | |
| | | | | (Cost $7,193,624) | | | 7,411,354 | | |
The accompanying notes are an integral part of these financial statements.
page 33

Frontier MFG Core Infrastructure Fund
SCHEDULE OF INVESTMENTS (continued)
June 30, 2020
Number of Shares | | | | Value | |
SHORT-TERM INVESTMENTS 2.0% | |
| | | Money Market Deposit Account 2.0% | |
| | 12,697,565 | | | U.S. Bank N.A., 0.07% (b) | | $ | 12,697,565 | | |
| | | Total Short-Term Investments | |
| | | (Cost $12,697,565) | | | 12,697,565 | | |
| | | Total Investments 91.9% | |
| | | (Cost $518,279,585) | | | 581,951,387 | | |
| | | Other Assets in Excess of
Liabilities 8.1% | | | 51,334,062 | | |
| | | TOTAL NET ASSETS 100.0% | | $ | 633,285,449 | | |
(a) Non-Income Producing.
(b) The Money Market Deposit Account ("MMDA") is a short-term investment vehicle in which the Fund holds cash balances. The MMDA will bear interest at a variable rate that is determined based on market conditions and may change daily and by any amount. The rate shown is as of June 30, 2020.
PORTFOLIO DIVERSIFICATION
Sectors | | Percentage | |
Integrated Power | | | 22.9 | % | |
Transmission & Distribution | | | 19.1 | | |
Airports | | | 9.4 | | |
Communications | | | 8.4 | | |
Toll Roads | | | 8.0 | | |
Energy Infrastructure | | | 7.9 | | |
Gas Utilities | | | 7.2 | | |
Water Utilities | | | 5.8 | | |
Total Common Stocks | | | 88.7 | | |
Social | | | 1.2 | | |
Total Closed-End Funds | | | 1.2 | | |
Total Short-Term Investments | | | 2.0 | | |
Total Investments | | | 91.9 | | |
Other Assets in Excess of Liabilities | | | 8.1 | | |
Total Net Assets | | | 100.0 | % | |
The accompanying notes are an integral part of these financial statements.
page 34

Frontier MFG Select Infrastructure Fund
SCHEDULE OF INVESTMENTS
June 30, 2020
Number of Shares | | | | Value | |
COMMON STOCKS 89.0% | | | |
| | | Australia 15.4% | |
| | 206,242 | | | APA Group | | $ | 1,594,724 | | |
| | 701,958 | | | Atlas Arteria Ltd. | | | 3,241,638 | | |
| | 1,473,348 | | | Spark Infrastructure Group | | | 2,200,513 | | |
| | 258,150 | | | Sydney Airport | | | 1,018,809 | | |
| | 554,096 | | | Transurban Group | | | 5,433,848 | | |
| | | | 13,489,532 | | |
| | | Canada 4.6% | |
| | 131,304 | | | Enbridge, Inc. | | | 3,992,508 | | |
| | | Chile 0.9% | |
| | 2,305,075 | | | Aguas Andinas SA - Class A | | | 780,706 | | |
| | | France 4.1% | |
| | 5,876 | | | Aeroports de Paris | | | 606,639 | | |
| | 32,627 | | | Vinci SA | | | 3,025,269 | | |
| | | | 3,631,908 | | |
| | | Italy 8.4% | |
| | 78,637 | | | ASTM SpA (a) | | | 1,800,428 | | |
| | 659,918 | | | Snam SpA | | | 3,217,186 | | |
| | 344,645 | | | Terna Rete Elettrica
Nazionale SpA | | | 2,377,197 | | |
| | | | 7,394,811 | | |
| | | Netherlands 4.2% | |
| | 69,326 | | | Koninklijke Vopak NV | | | 3,669,570 | | |
| | | New Zealand 1.4% | |
| | 288,319 | | | Auckland International
Airport Ltd. | | | 1,226,150 | | |
| | | Spain 8.2% | |
| | 20,866 | | | Aena SME SA (a) | | | 2,790,640 | | |
| | 236,886 | | | Red Electrica Corp SA | | | 4,432,008 | | |
| | | | 7,222,648 | | |
| | | United Kingdom 3.4% | |
| | 178,766 | | | National Grid PLC | | | 2,181,009 | | |
| | 69,066 | | | United Utilities Group PLC | | | 776,074 | | |
| | | | 2,957,083 | | |
Number of Shares | | | | Value | |
| | | United States 38.4% | |
| | 23,939 | | | American Water Works Co., Inc. | | $ | 3,079,992 | | |
| | 50,774 | | | Atmos Energy Corp. | | | 5,056,075 | | |
| | 27,306 | | | Crown Castle International Corp. | | | 4,569,659 | | |
| | 40,900 | | | CSX Corp. | | | 2,852,366 | | |
| | 48,839 | | | Eversource Energy | | | 4,066,823 | | |
| | 49,801 | | | FirstEnergy Corp. | | | 1,931,283 | | |
| | 33,686 | | | Sempra Energy | | | 3,949,010 | | |
| | 11,666 | | | Union Pacific Corp. | | | 1,972,371 | | |
| | 27,800 | | | WEC Energy Group, Inc. | | | 2,436,670 | | |
| | 61,016 | | | Xcel Energy, Inc. | | | 3,813,499 | | |
| | | | 33,727,748 | | |
| | | Total Common Stocks | |
| | | | | (Cost $74,053,177) | | | 78,092,664 | | |
SHORT-TERM INVESTMENTS 10.2% | | | |
| | | Money Market Deposit Account 10.2% | |
| | 8,936,024 | | | U.S. Bank N.A., 0.07% (b) | | | 8,936,024 | | |
| | | Total Short-Term Investments | |
| | | | | (Cost $8,936,024) | | | 8,936,024 | | |
| | | Total Investments 99.2% | |
| | | | | (Cost $82,989,201) | | | 87,028,688 | | |
| | | | | Other Assets in Excess of
Liabilities 0.8% | | | 731,391 | | |
| | | | | TOTAL NET ASSETS 100.0% | | $ | 87,760,079 | | |
(a) Non-Income Producing.
(b) The Money Market Deposit Account ("MMDA") is a short-term investment vehicle in which the Fund holds cash balances. The MMDA will bear interest at a variable rate that is determined based on market conditions and may change daily and by any amount. The rate shown is as of June 30, 2020.
The accompanying notes are an integral part of these financial statements.
page 35

Frontier MFG Select Infrastructure Fund
SCHEDULE OF INVESTMENTS (continued)
June 30, 2020
PORTFOLIO DIVERSIFICATION
Sectors | | Percentage | |
Toll Roads | | | 15.4 | % | |
Transmission & Distribution | | | 15.0 | | |
Gas Utilities | | | 13.9 | | |
Integrated Power | | | 11.8 | | |
Energy Infrastructure | | | 10.5 | | |
Airports | | | 6.4 | | |
Rail | | | 5.5 | | |
Water Utilities | | | 5.3 | | |
Communications | | | 5.2 | | |
Total Common Stocks | | | 89.0 | | |
Total Short-Term Investments | | | 10.2 | | |
Total Investments | | | 99.2 | | |
Other Assets in Excess of Liabilities | | | 0.8 | | |
Total Net Assets | | | 100.0 | % | |
The accompanying notes are an integral part of these financial statements.
page 36

Frontier Caravan Emerging Markets Fund
SCHEDULE OF INVESTMENTS
June 30, 2020
Number of Shares | | | | Value | |
COMMON STOCKS 94.0% | | | |
| | | Argentina 1.7% | |
| | 1,700 | | | Banco Macro SA - ADR (a) | | $ | 31,535 | | |
| | 1,400 | | | Globant SA (a) | | | 209,790 | | |
| | 3,800 | | | Grupo Financiero Galicia
SA - ADR (a) | | | 36,860 | | |
| | 3,700 | | | Telecom Argentina
SA - ADR | | | 33,115 | | |
| | | | 311,300 | | |
| | | Brazil 2.7% | |
| | 2,100 | | | B2W Cia Digital (a) | | | 41,860 | | |
| | 4,600 | | | B3 SA - Brasil Bolsa Balcao | | | 47,107 | | |
| | 4,620 | | | Banco Bradesco SA | | | 16,269 | | |
| | 2,700 | | | Banco do Brasil SA - ADR | | | 16,146 | | |
| | 21,000 | | | Cielo SA - ADR | | | 17,010 | | |
| | 8,800 | | | Cogna Educacao | | | 10,826 | | |
| | 2,000 | | | JBS SA - ADR | | | 15,640 | | |
| | 4,800 | | | Lojas Renner SA | | | 37,204 | | |
| | 4,300 | | | Magazine Luiza SA | | | 56,774 | | |
| | 1,000 | | | Natura & Co Holding
SA - ADR (a) | | | 14,510 | | |
| | 1,700 | | | Notre Dame Intermedica
Participacoes SA | | | 21,398 | | |
| | 4,400 | | | Petrobras Distribuidora SA | | | 17,380 | | |
| | 3,300 | | | Petroleo Brasileiro SA - ADR | | | 27,291 | | |
| | 1,100 | | | StoneCo Ltd. - Class A (a) | | | 42,636 | | |
| | 1,600 | | | Suzano SA - ADR (a) | | | 10,816 | | |
| | 9,300 | | | Vale SA - ADR (a) | | | 95,883 | | |
| | | | 488,750 | | |
| | | Chile 2.2% | |
| | 4,000 | | | Banco de Chile - ADR | | | 70,600 | | |
| | 580 | | | Banco de Credito e
Inversiones SA | | | 19,701 | | |
| | 2,100 | | | Banco Santander Chile - ADR | | | 34,440 | | |
| | 17,360 | | | Cencosud SA | | | 24,305 | | |
| | 14,285 | | | Empresas CMPC SA | | | 28,382 | | |
| | 4,842 | | | Empresas COPEC SA | | | 32,480 | | |
Number of Shares | | | | Value | |
| | | Chile 2.2% (continued) | |
| | 9,000 | | | Enel Americas SA - ADR | | $ | 67,590 | | |
| | 27,717 | | | SACI Falabella | | | 87,734 | | |
| | 1,500 | | | Sociedad Quimica y Minera de
Chile SA - ADR | | | 39,105 | | |
| | | | 404,337 | | |
| | | China 21.2% | |
| | 4,500 | | | AAC Technologies Holdings, Inc. | | | 27,791 | | |
| | 67,000 | | | Agricultural Bank of China Ltd. | | | 27,118 | | |
| | 4,700 | | | Alibaba Group Holding
Ltd. - ADR (a) | | | 1,013,790 | | |
| | 82 | | | ANTA Sports Products
Ltd. - ADR | | | 17,971 | | |
| | 100 | | | Autohome, Inc. - ADR | | | 7,550 | | |
| | 500 | | | Baidu, Inc. - ADR (a) | | | 59,945 | | |
| | 191,000 | | | Bank of China Ltd. | | | 70,753 | | |
| | 242,000 | | | China Construction Bank Corp. | | | 196,839 | | |
| | 2,700 | | | China Life Insurance Co.
Ltd. - ADR (a) | | | 27,243 | | |
| | 18,000 | | | China Mengniu Dairy Co. Ltd. | | | 69,022 | | |
| | 9,500 | | | China Merchants Bank Co. Ltd. | | | 44,024 | | |
| | 2,400 | | | China Mobile Ltd. - ADR | | | 80,736 | | |
| | 10,000 | | | China Overseas Land &
Investment Ltd. | | | 30,535 | | |
| | 5,200 | | | China Pacific Insurance
Group Co. Ltd. | | | 13,976 | | |
| | 500 | | | China Petroleum & Chemical
Corp. - ADR | | | 20,980 | | |
| | 6,000 | | | China Resources Land Ltd. | | | 22,933 | | |
| | 300 | | | CNOOC Ltd. - ADR | | | 33,852 | | |
| | 14,000 | | | Country Garden Holdings Co. Ltd. | | | 17,364 | | |
| | 10,400 | | | CSPC Pharmaceutical Group Ltd. | | | 19,696 | | |
| | 400 | | | ENN Energy Holdings Ltd. - ADR | | | 17,812 | | |
| | 400 | | | GDS Holdings Ltd. - ADR (a) | | | 31,864 | | |
| | 400 | | | Geely Automobile Holdings
Ltd. - ADR | | | 12,488 | | |
The accompanying notes are an integral part of these financial statements.
page 37

Frontier Caravan Emerging Markets Fund
SCHEDULE OF INVESTMENTS (continued)
June 30, 2020
Number of Shares | | | | Value | |
| COMMON STOCKS 94.0% (continued) | | | |
| | | China 21.2% (continued) | |
| | 1,000 | | | Hengan International
Group Co. Ltd. - ADR | | $ | 38,910 | | |
| | 100 | | | HUYA, Inc. - ADR (a) | | | 1,867 | | |
| | 187,000 | | | Industrial & Commercial Bank of
China Ltd. | | | 113,054 | | |
| | 1,300 | | | JD.com, Inc. - ADR (a) | | | 78,234 | | |
| | 100 | | | JOYY, Inc. - ADR (a) | | | 8,855 | | |
| | 14,000 | | | Kingdee International Software
Group Co. Ltd. | | | 32,758 | | |
| | 48,000 | | | Lenovo Group Ltd. | | | 26,781 | | |
| | 5,800 | | | Meituan Dianping - Class B (a) | | | 128,470 | | |
| | 100 | | | NetEase, Inc. - ADR | | | 42,938 | | |
| | 200 | | | New Oriental Education &
Technology Group, Inc. - ADR (a) | | | 26,046 | | |
| | 400 | | | PetroChina Co. Ltd. - ADR | | | 13,228 | | |
| | 400 | | | Pinduoduo, Inc. - ADR (a) | | | 34,336 | | |
| | 5,400 | | | Ping An Insurance Group
Company of China Ltd. - ADR | | | 107,244 | | |
| | 3,800 | | | Semiconductor Manufacturing
International Corp. - ADR (a) | | | 66,500 | | |
| | 1,900 | | | Shenzhou International
Group Holdings Ltd. | | | 23,099 | | |
| | 12,000 | | | Sino Biopharmaceutical Ltd. | | | 22,618 | | |
| | 15,000 | | | Sun Art Retail Group Ltd. | | | 25,734 | | |
| | 6,000 | | | Sunac China Holdings Ltd. | | | 25,392 | | |
| | 4,500 | | | Sunny Optical Technology
Group Co. Ltd. | | | 72,425 | | |
| | 700 | | | TAL Education Group - ADR (a) | | | 47,866 | | |
| | 11,600 | | | Tencent Holdings Ltd. - ADR | | | 742,401 | | |
| | 600 | | | Tencent Music Entertainment
Group - ADR (a) | | | 8,076 | | |
| | 14,000 | | | Tingyi Cayman Islands Holding
Corp. | | | 21,809 | | |
| | 900 | | | Trip.com Group Ltd. - ADR (a) | | | 23,328 | | |
| | 700 | | | Vipshop Holdings Ltd. - ADR (a) | | | 13,937 | | |
Number of Shares | | | | Value | |
| | | China 21.2% (continued) | |
| | 33,000 | | | Want Want China Holdings Ltd. | | $ | 25,067 | | |
| | 1,500 | | | Wuxi Biologics Cayman, Inc. (a) | | | 27,533 | | |
| | 67,800 | | | Xiaomi Corp. - Class B (a) | | | 112,667 | | |
| | 4,000 | | | Yihai International Holding Ltd. | | | 41,220 | | |
| | 600 | | | Yum China Holdings, Inc. | | | 28,842 | | |
| | 600 | | | ZTO Express Cayman,
Inc. - ADR | | | 22,026 | | |
| | | | 3,867,543 | | |
| | | Colombia 2.4% | |
| | 10,482 | | | Bancolombia SA | | | 66,942 | | |
| | 5,400 | | | Ecopetrol SA - ADR | | | 60,102 | | |
| | 26,543 | | | Grupo Argos SA | | | 69,924 | | |
| | 48,135 | | | Interconexion Electrica SA ESP | | | 240,803 | | |
| | | | 437,771 | | |
| | | Cyprus 0.3% | |
| | 2,246 | | | Polymetal International PLC | | | 44,966 | | |
| | | Czech Republic 1.1% | |
| | 6,230 | | | CEZ AS | | | 133,398 | | |
| | 1,477 | | | Komercni banka AS (a) | | | 34,454 | | |
| | 10,580 | | | Moneta Money Bank AS | | | 23,962 | | |
| | | | 191,814 | | |
| | | Egypt 4.8% | |
| | 113,476 | | | Commercial International
Bank Egypt SAE | | | 454,059 | | |
| | 129,811 | | | Egyptian Financial
Group-Hermes Holding Co. (a) | | | 112,588 | | |
| | 139,468 | | | El Sewedy Electric Co. | | | 57,542 | | |
| | 511,434 | | | Talaat Moustafa Group | | | 185,665 | | |
| | 85,010 | | | Telecom Egypt Co. | | | 70,360 | | |
| | | | 880,214 | | |
| | | Greece 1.9% | |
| | 21,797 | | | Alpha Bank AE (a) | | | 16,375 | | |
| | 44,969 | | | Eurobank Ergasias SA (a) | | | 20,823 | | |
| | 10,712 | | | Hellenic Telecommunications
Organization SA | | | 144,697 | | |
The accompanying notes are an integral part of these financial statements.
page 38

Frontier Caravan Emerging Markets Fund
SCHEDULE OF INVESTMENTS (continued)
June 30, 2020
Number of Shares | | | | Value | |
| COMMON STOCKS 94.0% (continued) | | | |
| | | Greece 1.9% (continued) | |
| | 5,858 | | | JUMBO SA | | $ | 105,506 | | |
| | 2,874 | | | Motor Oil Hellas Corinth
Refineries SA | | | 39,700 | | |
| | 15,838 | | | National Bank of Greece SA (a) | | | 22,412 | | |
| | | | 349,513 | | |
| | | Hungary 1.2% | |
| | 5,788 | | | MOL Hungarian Oil & Gas PLC (a) | | | 34,219 | | |
| | 3,810 | | | OTP Bank NYRT (a) | | | 133,942 | | |
| | 2,499 | | | Richter Gedeon NYRT | | | 51,854 | | |
| | | | 220,015 | | |
| | | India 3.9% | |
| | 1,311 | | | Axis Bank Ltd. - GDR | | | 34,735 | | |
| | 700 | | | Dr. Reddy's Laboratories
Ltd. - ADR | | | 37,107 | | |
| | 4,300 | | | HDFC Bank Ltd. - ADR | | | 195,478 | | |
| | 7,700 | | | ICICI Bank Ltd. - ADR | | | 71,533 | | |
| | 17,000 | | | Infosys Ltd. - ADR | | | 164,220 | | |
| | 453 | | | Larsen & Toubro Ltd. - GDR | | | 5,614 | | |
| | 3,578 | | | Reliance Industries Ltd. - GDR | | | 165,383 | | |
| | 555 | | | State Bank of India - GDR (a) | | | 13,030 | | |
| | 3,800 | | | Tata Motors Ltd. - ADR (a) | | | 24,966 | | |
| | | | 712,066 | | |
| | | Indonesia 2.8% | |
| | 366,800 | | | Astra International Tbk PT | | | 124,065 | | |
| | 59,800 | | | Bank Central Asia Tbk PT | | | 119,648 | | |
| | 3,400 | | | Bank Mandiri Persero
Tbk PT - ADR | | | 22,950 | | |
| | 345,400 | | | Bank Rakyat Indonesia
Persero Tbk PT | | | 73,723 | | |
| | 63,700 | | | Charoen Pokphand Indonesia
Tbk PT (a) | | | 24,978 | | |
| | 310,000 | | | Kalbe Farma Tbk PT | | | 31,804 | | |
Number of Shares | | | | Value | |
| | | Indonesia 2.8% (continued) | |
| | 4,100 | | | Telekomunikasi Indonesia
Persero Tbk PT - ADR (a) | | $ | 89,708 | | |
| | 45,500 | | | Unilever Indonesia Tbk PT | | | 25,249 | | |
| | | | 512,125 | | |
| | | Kuwait 2.8% | |
| | 27,565 | | | Agility Public Warehousing
Co. KSC (a) | | | 66,198 | | |
| | 11,199 | | | Humansoft Holding Co. KSC (a) | | | 101,751 | | |
| | 39,605 | | | Kuwait Finance House KSCP | | | 79,395 | | |
| | 60,777 | | | Mobile Telecommunications
Co. KSC | | | 110,089 | | |
| | 58,828 | | | National Bank of Kuwait SAKP | | | 157,493 | | |
| | | | 514,926 | | |
| | | Malaysia 2.9% | |
| | 37,000 | | | CIMB Group Holdings BHD | | | 30,867 | | |
| | 33,100 | | | Dialog Group BHD | | | 28,052 | | |
| | 28,300 | | | DiGi.Com BHD | | | 28,554 | | |
| | 17,900 | | | Hartalega Holdings BHD | | | 54,600 | | |
| | 38,600 | | | Malayan Banking BHD | | | 67,824 | | |
| | 23,700 | | | Maxis BHD | | | 29,768 | | |
| | 21,700 | | | Petronas Chemicals Group BHD | | | 31,618 | | |
| | 7,600 | | | Petronas Gas BHD | | | 30,082 | | |
| | 25,900 | | | Public Bank BHD | | | 100,010 | | |
| | 27,300 | | | Tenaga Nasional BHD | | | 74,232 | | |
| | 15,300 | | | Top Glove Corp. BHD | | | 57,741 | | |
| | | | 533,348 | | |
| | | Mexico 2.9% | |
| | 11,200 | | | America Movil SAB de
CV - ADR | | | 142,128 | | |
| | 7,900 | | | Cemex SAB de CV - ADR | | | 22,752 | | |
| | 300 | | | Coca-Cola Femsa SAB de
CV - ADR | | | 13,155 | | |
| | 16,600 | | | Fibra Uno Administracion
SA de CV | | | 13,130 | | |
| | 1,400 | | | Fomento Economico Mexicano
SAB de CV - ADR | | | 86,814 | | |
The accompanying notes are an integral part of these financial statements.
page 39

Frontier Caravan Emerging Markets Fund
SCHEDULE OF INVESTMENTS (continued)
June 30, 2020
Number of Shares | | | | Value | |
| COMMON STOCKS 94.0% (continued) | | | |
| | | Mexico 2.9% (continued) | |
| | 200 | | | Grupo Aeroportuario del Pacifico
SAB de CV - ADR | | $ | 14,364 | | |
| | 100 | | | Grupo Aeroportuario del Sureste
SAB de CV - ADR (a) | | | 11,229 | | |
| | 21,900 | | | Grupo Financiero Banorte
SAB de CV (a) | | | 75,777 | | |
| | 18,500 | | | Grupo Mexico SAB de
CV -Class B | | | 42,981 | | |
| | 2,500 | | | Grupo Televisa SAB - ADR (a) | | | 13,100 | | |
| | 3,600 | | | Wal-Mart de Mexico SAB de
CV - ADR | | | 86,544 | | |
| | | | 521,974 | | |
| | | Pakistan 4.6% | |
| | 72,254 | | | Engro Corp. Ltd. | | | 125,832 | | |
| | 207,700 | | | Fauji Fertilizer Co. Ltd. | | | 136,550 | | |
| | 41,366 | | | Lucky Cement Ltd. | | | 113,990 | | |
| | 157,148 | | | MCB Bank Ltd. | | | 152,215 | | |
| | 85,400 | | | Oil & Gas Development Co. Ltd. | | | 56,302 | | |
| | 312,500 | | | The Hub Power Co. Ltd (a) | | | 135,816 | | |
| | 174,900 | | | United Bank Ltd. | | | 108,092 | | |
| | | | 828,797 | | |
| | | Peru 1.6% | |
| | 6,800 | | | Cia de Minas Buenaventura
SAA - ADR | | | 62,152 | | |
| | 800 | | | Credicorp Ltd. | | | 106,936 | | |
| | 2,800 | | | Southern Copper Corp. | | | 111,356 | | |
| | | | 280,444 | | |
| | | Philippines 2.5% | |
| | 2,990 | | | Ayala Corp. | | | 46,933 | | |
| | 75,200 | | | Ayala Land, Inc. | | | 51,290 | | |
| | 16,820 | | | Bank of the Philippine Islands | | | 24,372 | | |
| | 45,200 | | | BDO Unibank, Inc. | | | 89,192 | | |
| | 27,150 | | | JG Summit Holdings, Inc. | | | 35,438 | | |
| | 15,680 | | | Jollibee Foods Corp. | | | 44,270 | | |
| | 980 | | | PLDT, Inc. | | | 24,401 | | |
Number of Shares | | | | Value | |
| | | Philippines 2.5% (continued) | |
| | 2,710 | | | SM Investments Corp. | | $ | 51,468 | | |
| | 114,000 | | | SM Prime Holdings, Inc. | | | 73,320 | | |
| | 7,680 | | | Universal Robina Corp. | | | 20,105 | | |
| | | | 460,789 | | |
| | | Poland 1.5% | |
| | 1,099 | | | Bank Polska Kasa Opieki SA | | | 15,058 | | |
| | 574 | | | CD Projekt SA (a) | | | 57,844 | | |
| | 586 | | | Dino Polska SA (a) | | | 29,850 | | |
| | 1,224 | | | KGHM Polska Miedz SA (a) | | | 28,440 | | |
| | 44 | | | LPP SA (a) | | | 67,145 | | |
| | 1,224 | | | Polski Koncern Naftowy
ORLEN SA | | | 19,451 | | |
| | 5,475 | | | Powszechna Kasa Oszczednosci
Bank Polski SA | | | 31,882 | | |
| | 3,869 | | | Powszechny Zaklad
Ubezpieczen SA | | | 28,475 | | |
| | | | 278,145 | | |
| | | Qatar 2.9% | |
| | 39,021 | | | Industries Qatar QSC | | | 82,713 | | |
| | 95,127 | | | Mesaieed Petrochemical
Holding Co. | | | 53,056 | | |
| | 11,691 | | | Qatar Electricity & Water
Co. QSC | | | 50,880 | | |
| | 11,190 | | | Qatar Fuel QSC | | | 49,674 | | |
| | 13,513 | | | Qatar Islamic Bank SAQ | | | 58,580 | | |
| | 48,778 | | | Qatar National Bank QPSC | | | 233,880 | | |
| | | | 528,783 | | |
| | | Russia 6.2% | |
| | 14,531 | | | Gazprom PJSC - ADR | | | 78,467 | | |
| | 967 | | | LUKOIL PJSC - ADR | | | 71,881 | | |
| | 6,776 | | | Magnit PJSC - GDR | | | 88,116 | | |
| | 3,270 | | | Mail.ru Group Ltd. - GDR (a) | | | 73,760 | | |
| | 6,976 | | | MMC Norilsk Nickel PJSC - ADR | | | 182,344 | | |
| | 4,300 | | | Mobile TeleSystems PJSC - ADR | | | 39,517 | | |
| | 206 | | | Novatek PJSC - GDR | | | 29,199 | | |
| | 614 | | | Polyus PJSC - GDR | | | 51,667 | | |
The accompanying notes are an integral part of these financial statements.
page 40

Frontier Caravan Emerging Markets Fund
SCHEDULE OF INVESTMENTS (continued)
June 30, 2020
Number of Shares | | | | Value | |
| COMMON STOCKS 94.0% (continued) | | | |
| | | Russia 6.2% (continued) | |
| | 25,396 | | | Sberbank of Russia
PJSC - ADR (a) | | $ | 288,696 | | |
| | 523 | | | Tatneft PJSC - ADR | | | 24,356 | | |
| | 2,236 | | | X5 Retail Group NV - GDR | | | 79,306 | | |
| | 2,400 | | | Yandex NV - Class A (a) | | | 120,048 | | |
| | | | 1,127,357 | | |
| | | South Africa 2.0% | |
| | 2,622 | | | Absa Group Ltd. | | | 12,944 | | |
| | 900 | | | AngloGold Ashanti Ltd. - ADR | | | 26,541 | | |
| | 717 | | | Bid Corp. Ltd. | | | 11,774 | | |
| | 8,128 | | | FirstRand Ltd. | | | 17,874 | | |
| | 1,800 | | | Gold Fields Ltd. - ADR | | | 16,920 | | |
| | 1,900 | | | Impala Platinum Holdings
Ltd. - ADR | | | 12,464 | | |
| | 3,842 | | | MTN Group Ltd. | | | 11,767 | | |
| | 4,700 | | | Naspers Ltd. - ADR | | | 172,255 | | |
| | 1,353 | | | Nedbank Group Ltd. | | | 7,933 | | |
| | 10,484 | | | Old Mutual Ltd. | | | 7,307 | | |
| | 1,907 | | | Remgro Ltd. | | | 11,010 | | |
| | 4,171 | | | Sanlam Ltd. | | | 14,188 | | |
| | 900 | | | Sasol Ltd. - ADR (a) | | | 6,939 | | |
| | 2,743 | | | Standard Bank Group Ltd. | | | 16,557 | | |
| | 1,470 | | | Vodacom Group Ltd. | | | 10,430 | | |
| | | | 356,903 | | |
| | | South Korea 4.5% | |
| | 114 | | | Celltrion, Inc. (a) | | | 29,177 | | |
| | 199 | | | Hyundai Mobis Co. Ltd. | | | 31,943 | | |
| | 587 | | | Hyundai Motor Co. | | | 48,218 | | |
| | 169 | | | Kakao Corp. | | | 37,924 | | |
| | 600 | | | KB Financial Group, Inc. - ADR | | | 16,692 | | |
| | 793 | �� | | Kia Motors Corp. | | | 21,429 | | |
| | 900 | | | Korea Electric Power
Corp. - ADR (a) | | | 7,182 | | |
| | 56 | | | LG Chem Ltd. | | | 23,110 | | |
| | 33 | | | LG Household & Health Care Ltd. | | | 36,987 | | |
Number of Shares | | | | Value | |
| | | South Korea 4.5% (continued) | |
| | 341 | | | NAVER Corp. | | $ | 76,719 | | |
| | 500 | | | POSCO - ADR | | | 18,520 | | |
| | 31 | | | Samsung Biologics Co. Ltd. (a) | | | 20,111 | | |
| | 337 | | | Samsung Electronics Co.
Ltd. - GDR | | | 368,414 | | |
| | 700 | | | Shinhan Financial Group Co.
Ltd. - ADR | | | 16,842 | | |
| | 845 | | | SK Hynix, Inc. | | | 60,332 | | |
| | 320 | | | Woori Financial Group,
Inc. - ADR | | | 7,094 | | |
| | | | 820,694 | | |
| | | Taiwan 4.5% | |
| | 2,600 | | | ASE Technology Holding Co.
Ltd. - ADR | | | 11,804 | | |
| | 59,000 | | | CTBC Financial Holding Co. Ltd. | | | 40,889 | | |
| | 34,000 | | | E.Sun Financial Holding Co. Ltd. | | | 32,205 | | |
| | 2,000 | | | Eclat Textile Co. Ltd. | | | 23,298 | | |
| | 7,000 | | | Formosa Plastics Corp. | | | 20,842 | | |
| | 9,000 | | | Hon Hai Precision Industry
Co. Ltd. - GDR | | | 53,775 | | |
| | 1,000 | | | Hotai Motor Co. Ltd. | | | 23,977 | | |
| | 2,000 | | | MediaTek, Inc. | | | 39,541 | | |
| | 32,000 | | | Mega Financial Holding Co. Ltd. | | | 33,637 | | |
| | 3,000 | | | President Chain Store Corp. | | | 30,179 | | |
| | 8,100 | | | Taiwan Semiconductor
Manufacturing Co. Ltd. - ADR | | | 459,837 | | |
| | 22,000 | | | Uni-President Enterprises Corp. | | | 53,302 | | |
| | | | 823,286 | | |
| | | Thailand 1.3% | |
| | 3,000 | | | Advanced Info Service
PCL - NVDR | | | 18,055 | | |
| | 11,400 | | | Airports of Thailand
PCL - NVDR | | | 22,443 | | |
| | 4,200 | | | Bumrungrad Hospital
PCL - NVDR | | | 15,861 | | |
The accompanying notes are an integral part of these financial statements.
page 41

Frontier Caravan Emerging Markets Fund
SCHEDULE OF INVESTMENTS (continued)
June 30, 2020
Number of Shares | | | | Value | |
| COMMON STOCKS 94.0% (continued) | | | |
| | | Thailand 1.3% (continued) | |
| | 11,400 | | | Central Pattana
PCL - NVDR | | $ | 18,121 | | |
| | 17,400 | | | Central Retail Corp.
PCL - NVDR (a) | | | 18,645 | | |
| | 15,100 | | | CP ALL PCL - NVDR | | | 33,280 | | |
| | 53,500 | | | Home Product Center
PCL - NVDR | | | 26,873 | | |
| | 9,500 | | | Kasikornbank PCL - NVDR | | | 28,821 | | |
| | 23,700 | | | Minor International
PCL - NVDR (a) | | | 15,663 | | |
| | 15,800 | | | PTT PCL - NVDR | | | 19,503 | | |
| | 1,900 | | | The Siam Cement PCL - NVDR | | | 22,728 | | |
| | | | 239,993 | | |
| | | Turkey 2.9% | |
| | 73,596 | | | Akbank TAS (a) | | | 65,290 | | |
| | 15,754 | | | BIM Birlesik Magazalar AS | | | 156,193 | | |
| | 8,685 | | | Ford Otomotiv Sanayi AS | | | 90,124 | | |
| | 4,772 | | | Tupras Turkiye Petrol
Rafinerileri AS (a) | | | 62,424 | | |
| | 35,633 | | | Turkcell Iletisim Hizmetleri AS | | | 84,953 | | |
| | 57,255 | | | Turkiye Garanti Bankasi AS (a) | | | 70,596 | | |
| | | | 529,580 | | |
| | | United Arab Emirates 2.3% | |
| | 28,885 | | | Abu Dhabi Commercial
Bank PJSC | | | 39,140 | | |
| | 88,180 | | | Aldar Properties PJSC | | | 43,166 | | |
| | 77,417 | | | Emaar Properties PJSC (a) | | | 58,489 | | |
| | 39,121 | | | Emirates Telecommunications
Group Co. PJSC | | | 176,295 | | |
| | 30,900 | | | First Abu Dhabi Bank PJSC | | | 95,851 | | |
| | | | 412,941 | | |
| | | Vietnam 2.4% | |
| | 14,090 | | | Bank for Foreign Trade of
Vietnam JSC | | | 49,303 | | |
| | 36,530 | | | Hoa Phat Group JSC (a) | | | 42,601 | | |
Number of Shares | | | | Value | |
| | | Vietnam 2.4% (continued) | |
| | 11,520 | | | Masan Group Corp. (a) | | $ | 26,947 | | |
| | 22,640 | | | Vietnam Dairy Products JSC | | | 110,670 | | |
| | 24,870 | | | Vincom Retail JSC (a) | | | 26,721 | | |
| | 28,730 | | | Vingroup JSC (a) | | | 110,892 | | |
| | 22,410 | | | Vinhomes JSC | | | 73,592 | | |
| | | | 440,726 | | |
| | | Total Common Stocks | |
| | | | | (Cost $18,378,978) | | | 17,119,100 | | |
PREFERRED STOCKS 1.7% | | | |
| | | Brazil 1.0% | |
| | 8,640 | | | Banco Bradesco SA - ADR (b) | | | 32,918 | | |
| | 9,100 | | | Itau Unibanco
Holding SA - ADR (b) | | | 42,679 | | |
| | 14,400 | | | Itausa - Investimentos Itau SA (b) | | | 25,580 | | |
| | 4,543 | | | Lojas Americanas SA (b) | | | 26,983 | | |
| | 4,100 | | | Petroleo Brasileiro
SA - ADR (b) | | | 32,677 | | |
| | 1,300 | | | Telefonica Brasil
SA - ADR (b) | | | 11,518 | | |
| | | | 172,355 | | |
| | | Colombia 0.7% | |
| | 5,100 | | | Bancolombia SA - ADR (b) | | | 134,181 | | |
| | | Total Preferred Stocks | |
| | | | | (Cost $455,882) | | | 306,536 | | |
EXCHANGE-TRADED FUNDS 2.9% | | | |
| | 19,900 | | | iShares MSCI Saudi Arabia ETF | | | 523,768 | | |
| | | Total Exchange-Traded Funds | |
| | | | | (Cost $591,914) | | | 523,768 | | |
The accompanying notes are an integral part of these financial statements.
page 42

Frontier Caravan Emerging Markets Fund
SCHEDULE OF INVESTMENTS (continued)
June 30, 2020
Number of Shares | | | | Value | |
RIGHTS 0.0% | |
| | | Thailand 0.0% | |
| | 2,890 | | | Minor International
PLC - NVDR (c) | | $ | 14 | | |
| | | Total Rights | |
| | | (Cost $221) | | | 14 | | |
SHORT-TERM INVESTMENTS 0.3% | |
| | | Money Market Deposit Account 0.3% | |
| | 63,553 | | | U.S. Bank N.A., 0.07% (d) | | | 63,553 | | |
| | | Total Short-Term Investments | |
| | | (Cost $63,553) | | | 63,553 | | |
| | | Total Investments 98.9% | |
| | | (Cost $19,490,548) | | | 18,012,971 | | |
| | | Other Assets in Excess of
Liabilities 1.1% | | | 208,179 | | |
| | | TOTAL NET ASSETS 100.0% | | $ | 18,221,150 | | |
(a) Non-Income Producing.
(b) Preferred stocks are shares that carry certain preferential rights. The dividend rate may not be consistent each pay period and could be zero for a particular year.
(c) Illiquid security. Pursuant to the Funds' Liquidity Risk Management Program, the Fund may invest up to 15% of its net assets in illiquid securities. Securities are considered illiquid if they cannot be sold or disposed of in current market conditions in seven calendar days or less without the sale or disposition significantly changing the market value of the investment.
(d) The Money Market Deposit Account ("MMDA") is a short-term investment vehicle in which the Fund holds cash balances. The MMDA will bear interest at a variable rate that is determined based on market conditions and may change daily and by any amount. The rate shown is as of June 30, 2020.
ADR - American Depositary Receipt
GDR - Global Depositary Receipt
NVDR - Non-Voting Depository Receipt
PORTFOLIO DIVERSIFICATION
Sectors | | Percentage | |
Financials | | | 24.8 | % | |
Consumer Discretionary | | | 14.5 | | |
Communication Services | | | 12.9 | | |
Information Technology | | | 9.9 | | |
Materials | | | 7.9 | | |
Consumer Staples | | | 6.5 | | |
Energy | | | 4.8 | | |
Utilities | | | 4.2 | | |
Real Estate | | | 4.1 | | |
Industrials | | | 2.3 | | |
Health Care | | | 2.1 | | |
Total Common Stocks | | | 94.0 | | |
Financials | | | 1.3 | | |
Energy | | | 0.2 | | |
Consumer Discretionary | | | 0.1 | | |
Communication Services | | | 0.1 | | |
Total Preferred Stocks | | | 1.7 | | |
Total Exchange Traded Funds | | | 2.9 | | |
Total Rights | | | 0.0 | | |
Short-Term Investments | | | 0.3 | | |
Total Investments | | | 98.9 | | |
Other Assets in Excess of Liabilities | | | 1.1 | | |
Total Net Assets | | | 100.0 | % | |
The accompanying notes are an integral part of these financial statements.
page 43

Frontier Funds
STATEMENTS OF ASSETS AND LIABILITIES
June 30, 2020
| | | MFG Global
Equity Fund | | MFG Global
Plus Fund | | MFG Global
Sustainable Fund | |
ASSETS: | |
Investments at cost | | $ | 816,094,482 | | | $ | 428,447,324 | | | $ | 9,513,226 | | |
Foreign currency at cost | | $ | 294,205 | | | $ | 120,904 | | | $ | 46,730 | | |
Investments at value | | $ | 1,159,493,805 | | | $ | 534,453,327 | | | $ | 10,474,683 | | |
Foreign currency at value | | | 293,236 | | | | 120,473 | | | | 46,763 | | |
Receivable for Fund shares sold | | | 1,166,667 | | | | 1,469,000 | | | | — | | |
Interest and dividends receivable | | | 302,467 | | | | 136,240 | | | | 12,761 | | |
Dividend tax reclaims receivable | | | 2,007,664 | | | | 636,291 | | | | 5,185 | | |
Prepaid expenses and other assets | | | 25,588 | | | | 48,605 | | | | 16,776 | | |
Total assets | | | 1,163,289,427 | | | | 536,863,936 | | | | 10,556,168 | | |
LIABILITIES: | |
Payable for Fund shares redeemed | | | 36,076 | | | | — | | | | — | | |
Payable to Adviser | | | 723,898 | | | | 301,600 | | | | 4,955 | | |
Accrued shareholder servicing fees | | | — | | | | 18,600 | | | | — | | |
Accrued expenses | | | 81,070 | | | | 61,740 | | | | 14,619 | | |
Total liabilities 841,044 381,940 19,574
Net Assets | | $ | 1,162,448,383 | | | $ | 536,481,996 | | | $ | 10,536,594 | | |
NET ASSETS CONSIST OF: | |
Paid in capital | | $ | 770,460,607 | | | $ | 428,273,324 | | | $ | 10,105,734 | | |
Total distributable earnings | | | 391,987,776 | | | | 108,208,672 | | | | 430,860 | | |
Net Assets | | $ | 1,162,448,383 | | | $ | 536,481,996 | | | $ | 10,536,594 | | |
CAPITAL STOCK, $0.01 PAR VALUE | | | | Institutional Class | | | |
Net Assets | | $ | 1,162,448,383 | | | $ | 306,282,856 | | | $ | 10,536,594 | | |
Authorized | | | 100,000,000 | | | | 100,000,000 | | | | 50,000,000 | | |
Issued and Outstanding | | | 58,773,708 | | | | 22,379,285 | | | | 1,010,534 | | |
Net Asset Value, Redemption Price and Offering Price Per Share | | $ | 19.78 | | | $ | 13.69 | | | $ | 10.43 | | |
CAPITAL STOCK, $0.01 PAR VALUE | | | | Service Class | | | |
Net Assets | | | | $ | 230,199,140 | | | | | | |
Authorized | | | | | 50,000,000 | | | | |
Issued and Outstanding | | | | | 16,839,342 | | | | |
Net Asset Value, Redemption Price and Offering Price Per Share | | | | $ | 13.67 | | | | |
The accompanying notes are an integral part of these financial statements.
page 44

Frontier Funds
STATEMENTS OF ASSETS AND LIABILITIES (continued)
June 30, 2020
| | | MFG Core
Infrastructure Fund | | MFG Select
Infrastructure Fund | | Caravan Emerging
Markets Fund | |
ASSETS: | |
Investments at cost | | $ | 518,279,585 | | | $ | 82,989,201 | | | $ | 19,490,548 | | |
Foreign currency at cost | | $ | 1,250,893 | | | $ | 276,537 | | | $ | 151,386 | | |
Investments at value | | $ | 581,951,387 | | | $ | 87,028,688 | | | $ | 18,012,971 | | |
Foreign currency at value | | | 1,256,118 | | | | 274,780 | | | | 151,595 | | |
Receivable for investments sold | | | — | | | | 91,364 | | | | 121,709 | | |
Receivable for Fund shares sold | | | 48,274,965 | | | | 72,000 | | | | — | | |
Interest and dividends receivable | | | 1,937,995 | | | | 368,656 | | | | 47,821 | | |
Receivable from Adviser | | | — | | | | — | | | | 6,854 | | |
Dividend tax reclaims receivable | | | 223,727 | | | | 65,090 | | | | 219 | | |
Prepaid expenses and other assets | | | 29,626 | | | | 23,692 | | | | 31,516 | | |
Total assets | | | 633,673,818 | | | | 87,924,270 | | | | 18,372,685 | | |
LIABILITIES: | |
Payable for investments purchased | | | — | | | | 100,933 | | | | 62,381 | | |
Payable for Fund shares redeemed | | | 102,081 | | | | — | | | | — | | |
Payable to Custodian | | | — | | | | — | | | | 63,045 | | |
Payable to Adviser | | | 193,995 | | | | 37,446 | | | | — | | |
Accrued shareholder servicing fees | | | 22,704 | | | | — | | | | 4 | | |
Accrued expenses | | | 69,589 | | | | 25,812 | | | | 26,105 | | |
Total liabilities 388,369 164,191 151,535
Net Assets | | $ | 633,285,449 | | | $ | 87,760,079 | | | $ | 18,221,150 | | |
NET ASSETS CONSIST OF: | |
Paid in capital | | $ | 585,264,303 | | | $ | 88,468,686 | | | $ | 20,152,558 | | |
Total distributable earnings (accumulated losses) | | | 48,021,146 | | | | (708,607 | ) | | | (1,931,408 | ) | |
Net Assets | | $ | 633,285,449 | | | $ | 87,760,079 | | | $ | 18,221,150 | | |
CAPITAL STOCK, $0.01 PAR VALUE | | Institutional Class | | Institutional Class | | Institutional Class | |
Net Assets | | $ | 449,609,182 | | | $ | 78,775,349 | | | $ | 18,198,412 | | |
Authorized | | | 50,000,000 | | | | 50,000,000 | | | | 50,000,000 | | |
Issued and Outstanding | | | 27,512,143 | | | | 7,883,956 | | | | 2,013,623 | | |
Net Asset Value, Redemption Price and Offering Price Per Share | | $ | 16.34 | | | $ | 9.99 | | | $ | 9.04 | | |
CAPITAL STOCK, $0.01 PAR VALUE | | Service Class | | Service Class | | Service Class | |
Net Assets | | $ | 183,676,267 | | | $ | 8,984,730 | | | $ | 22,738 | | |
Authorized | | | 50,000,000 | | | | 50,000,000 | | | | 50,000,000 | | |
Issued and Outstanding | | | 11,213,829 | | | | 898,102 | | | | 2,516 | | |
Net Asset Value, Redemption Price and Offering Price Per Share | | $ | 16.38 | | | $ | 10.00 | | | $ | 9.04 | | |
The accompanying notes are an integral part of these financial statements.
page 45

Frontier Funds
STATEMENTS OF OPERATIONS
For the Year Ended June 30, 2020
| | | MFG Global
Equity Fund | | MFG Global
Plus Fund | | MFG Global
Sustainable Fund(1) | |
INVESTMENT INCOME: | |
Dividend income | | $ | 14,282,258 | (2) | | $ | 5,400,076 | (3) | | $ | 94,956 | (4) | |
Interest income | | | 1,111,128 | | | | 427,056 | | | | 12,842 | | |
Total investment income | | | 15,393,386 | | | | 5,827,132 | | | | 107,798 | | |
EXPENSES: | |
Investment advisory fees | | | 9,154,432 | | | | 3,458,919 | | | | 59,937 | | |
Fund administration and accounting fees | | | 263,906 | | | | 113,627 | | | | 20,868 | | |
Custody fees | | | 122,986 | | | | 67,971 | | | | 6,289 | | |
Directors' fees and related expenses | | | 30,858 | | | | 30,858 | | | | 12,858 | | |
Legal fees | | | 29,840 | | | | 30,142 | | | | 11,282 | | |
Transfer agent fees | | | 28,275 | | | | 22,179 | | | | 7,522 | | |
Reports to shareholders | | | 27,634 | | | | 22,617 | | | | 11,283 | | |
Federal and state registration fees | | | 25,379 | | | | 57,899 | | | | 17,461 | | |
Audit and tax fees | | | 17,583 | | | | 17,583 | | | | 17,583 | | |
Shareholder servicing fees | | | — | | | | 196,800 | | | | — | | |
Other | | | 45,368 | | | | 39,297 | | | | 4,274 | | |
Total expenses before waiver | | | 9,746,261 | | | | 4,057,892 | | | | 169,357 | | |
Waiver and reimbursement of expenses by Adviser | | | (591,829 | ) | | | (402,090 | ) | | | (109,420 | ) | |
Net expenses | | | 9,154,432 | | | | 3,655,802 | | | | 59,937 | | |
Net Investment Income | | | 6,238,954 | | | | 2,171,330 | | | | 47,861 | | |
REALIZED AND UNREALIZED GAIN (LOSS)
ON INVESTMENTS:
Net realized gain (loss) on: | |
Investments | | | 126,876,233 | | | | 15,692,483 | | | | (573,772 | ) | |
Foreign currency transactions | | | (115,910 | ) | | | (13,343 | ) | | | 1,917 | | |
Change in net unrealized appreciation/depreciation on: | |
Investments | | | (47,195,762 | ) | | | 14,273,150 | | | | 961,457 | | |
Foreign currency transactions | | | 79,071 | | | | 8,418 | | | | 131 | | |
Net Realized and Unrealized Gain on Investments | | | 79,643,632 | | | | 29,960,708 | | | | 389,733 | | |
Net Increase in Net Assets Resulting from Operations | | $ | 85,882,586 | | | $ | 32,132,038 | | | $ | 437,594 | | |
(1) Commenced operations on October 9, 2019.
(2) Net of $567,762 in foreign withholding taxes.
(3) Net of $222,326 in foreign withholding taxes.
(4) Net of $7,638 in foreign withholding taxes.
The accompanying notes are an integral part of these financial statements.
page 46

Frontier Funds
STATEMENTS OF OPERATIONS (continued)
For the Year Ended June 30, 2020
| | | MFG Core
Infrastructure Fund | | MFG Select
Infrastructure Fund | | Caravan Emerging
Markets Fund(1) | |
INVESTMENT INCOME: | |
Dividend income | | $ | 16,615,176 | (2) | | $ | 2,315,133 | (3) | | $ | 298,654 | (4) | |
Interest income | | | 157,755 | | | | 49,835 | | | | 521 | | |
Total investment income | | | 16,772,931 | | | | 2,364,968 | | | | 299,175 | | |
EXPENSES: | |
Investment advisory fees | | | 2,770,790 | | | | 726,840 | | | | 74,150 | | |
Fund administration and accounting fees | | | 148,539 | | | | 44,920 | | | | 29,809 | | |
Shareholder servicing fees | | | 144,278 | | | | 5,244 | | | | 5 | | |
Custody fees | | | 100,323 | | | | 32,507 | | | | 39,536 | | |
Federal and state registration fees | | | 40,902 | | | | 47,935 | | | | 730 | | |
Transfer agent fees | | | 35,573 | | | | 23,262 | | | | 8,363 | | |
Legal fees | | | 31,380 | | | | 30,271 | | | | 11,740 | | |
Directors' fees and related expenses | | | 30,858 | | | | 30,858 | | | | 12,858 | | |
Reports to shareholders | | | 27,755 | | | | 18,599 | | | | 9,468 | | |
Audit and tax fees | | | 17,583 | | | | 17,583 | | | | 22,583 | | |
Other | | | 33,128 | | | | 11,324 | | | | 8,995 | | |
Total expenses before waiver | | | 3,381,109 | | | | 989,343 | | | | 218,237 | | |
Waiver and reimbursement of expenses by Adviser | | | (466,041 | ) | | | (257,259 | ) | | | (133,489 | ) | |
Net expenses | | | 2,915,068 | | | | 732,084 | | | | 84,748 | | |
Net Investment Income | | | 13,857,863 | | | | 1,632,884 | | | | 214,427 | | |
REALIZED AND UNREALIZED LOSS
ON INVESTMENTS:
Net realized loss on: | |
Investments | | | (3,767,581 | ) | | | (4,371,541 | ) | | | (599,697 | ) | |
Foreign currency transactions | | | (342,936 | ) | | | (66,693 | ) | | | (31,478 | ) | |
Change in net unrealized appreciation/depreciation on: | |
Investments | | | (19,186,159 | ) | | | (5,052,284 | ) | | | (1,477,577 | ) | |
Foreign currency transactions | | | (10,593 | ) | | | (5,502 | ) | | | (85 | ) | |
Net Realized and Unrealized Loss on Investments | | | (23,307,269 | ) | | | (9,496,020 | ) | | | (2,108,837 | ) | |
Net Decrease in Net Assets Resulting from Operations | | $ | (9,449,406 | ) | | $ | (7,863,136 | ) | | $ | (1,894,410 | ) | |
(1) Commenced operations on December 4, 2019.
(2) Net of $1,027,067 foreign withholding taxes.
(3) Net of $130,982 in foreign withholding taxes.
(4) Net of $31,261 in foreign withholding taxes.
The accompanying notes are an integral part of these financial statements.
page 47

Frontier Funds
STATEMENTS OF CHANGES IN NET ASSETS
| | | MFG Global Equity Fund | | MFG Global Plus Fund | |
| | | For the
Year Ended
June 30, 2020 | | For the
Year Ended
June 30, 2019 | | For the
Year Ended
June 30, 2020 | | For the
Year Ended
June 30, 2019 | |
OPERATIONS: | |
Net investment income | | $ | 6,238,954 | | | $ | 9,118,617 | | | $ | 2,171,330 | | | $ | 2,848,591 | | |
Net realized gain (loss) on: | |
Investments | | | 126,876,233 | | | | 36,595,228 | | | | 15,692,483 | | | | 19,648,964 | | |
Foreign currency transactions | | | (115,910 | ) | | | (45,008 | ) | | | (13,343 | ) | | | (5,828 | ) | |
Change in net unrealized appreciation/depreciation on: | |
Investments | | | (47,195,762 | ) | | | 107,819,323 | | | | 14,273,150 | | | | 30,853,732 | | |
Foreign currency transactions | | | 79,071 | | | | 25,399 | | | | 8,418 | | | | 5,010 | | |
Net increase in net assets resulting from operations | | | 85,882,586 | | | | 153,513,559 | | | | 32,132,038 | | | | 53,350,469 | | |
DISTRIBUTIONS TO SHAREHOLDERS: | |
Institutional Class | | | (78,767,198 | ) | | | (90,489,457 | ) | | | (6,021,828 | ) | | | (19,324,487 | ) | |
Service Class | | | | | | | (5,160,722 | ) | | | (13,371,301 | ) | |
Net decrease in net assets resulting from distributions paid | | | (78,767,198 | ) | | | (90,489,457 | ) | | | (11,182,550 | ) | | | (32,695,788 | ) | |
CAPITAL SHARE TRANSACTIONS: | |
Shares sold: | |
Institutional Class | | | 152,075,761 | | | | 57,115,148 | | | | 98,803,092 | | | | 43,842,794 | | |
Service Class | | | | | | | 133,475,784 | | | | 109,412,748 | | |
Shares issued to holders in reinvestment of distributions: | |
Institutional Class | | | 63,790,435 | | | | 74,009,184 | | | | 5,963,193 | | | | 18,788,999 | | |
Service Class | | | | | | | 5,088,038 | | | | 13,158,079 | | |
Shares redeemed: | |
Institutional Class | | | (185,850,088 | ) | | | (172,366,228 | ) | | | (26,383,540 | ) | | | (205,713,913 | ) | |
Service Class | | | | | | | (34,192,027 | ) | | | (82,510,166 | ) | |
Redemption fees: | |
Institutional Class | | | 12,054 | | | | 2,036 | | | | 32 | | | | — | | |
Service Class | | | | | | | 7,588 | | | | — | | |
Net increase (decrease) in net assets resulting from
capital share transactions | | | 30,028,162 | | | | (41,239,860 | ) | | | 182,762,160 | | | | (103,021,459 | ) | |
Total Increase (Decrease) in Net Assets | | | 37,143,550 | | | | 21,784,242 | | | | 203,711,648 | | | | (82,366,778 | ) | |
NET ASSETS: | |
Beginning of Period | | | 1,125,304,833 | | | | 1,103,520,591 | | | | 332,770,348 | | | | 415,137,126 | | |
End of Period | | $ | 1,162,448,383 | | | $ | 1,125,304,833 | | | $ | 536,481,996 | | | $ | 332,770,348 | | |
TRANSACTIONS IN SHARES: | |
Shares sold: | |
Institutional Class | | | 8,094,376 | | | | 3,226,459 | | | | 7,397,686 | | | | 3,498,571 | | |
Service Class | | | | | | | 10,093,424 | | | | 8,571,448 | | |
Shares issued to holders in reinvestment of distributions: | |
Institutional Class | | | 3,216,865 | | | | 4,387,029 | | | | 434,952 | | | | 1,683,602 | | |
Service Class | | | | | | | 371,390 | | | | 1,180,097 | | |
Shares redeemed: | |
Institutional Class | | | (9,595,792 | ) | | | (8,978,453 | ) | | | (2,010,549 | ) | | | (15,375,167 | ) | |
Service Class | | | | | | | (2,593,149 | ) | | | (6,676,969 | ) | |
Net increase (decrease) in shares outstanding | | | 1,715,449 | | | | (1,364,965 | ) | | | 13,693,754 | | | | (7,118,418 | ) | |
The accompanying notes are an integral part of these financial statements.
page 48

Frontier Funds
STATEMENTS OF CHANGES IN NET ASSETS (continued)
| | | MFG Global Sustainable Fund | | MFG Core Infrastructure Fund | |
| | | For the Period
October 9, 2019(1)
through
June 30, 2020 | | For the
Year Ended
June 30, 2019 | | For the
Year Ended
June 30, 2019 | |
OPERATIONS: | |
Net investment income | | $ | 47,861 | | | $ | 13,857,863 | | | $ | 12,116,900 | | |
Net realized gain (loss) on: | |
Investments | | | (573,772 | ) | | | (3,767,581 | ) | | | (9,873,751 | ) | |
Foreign currency transactions | | | 1,917 | | | | (342,936 | ) | | | 11,465 | | |
Change in net unrealized appreciation/depreciation on: | |
Investments | | | 961,457 | | | | (19,186,159 | ) | | | 58,569,809 | | |
Foreign currency transactions | | | 131 | | | | (10,593 | ) | | | 13,857 | | |
Net increase (decrease) in net assets resulting from operations | | | 437,594 | | | | (9,449,406 | ) | | | 60,838,280 | | |
DISTRIBUTIONS TO SHAREHOLDERS: | |
Institutional Class | | | (6,734 | ) | | | (9,955,940 | ) | | | (10,808,572 | ) | |
Service Class | | | | | (3,637,951 | ) | | | (1,564,183 | ) | |
Net decrease in net assets resulting from distributions paid | | | (6,734 | ) | | | (13,593,891 | ) | | | (12,372,755 | ) | |
CAPITAL SHARE TRANSACTIONS: | |
Shares sold: | |
Institutional Class | | | 10,100,000 | | | | 97,567,733 | | | | 37,574,020 | | |
Service Class | | | | | 120,240,944 | | | | 107,891,242 | | |
Shares issued to holders in reinvestment of distributions: | |
Institutional Class | | | 5,734 | | | | 8,762,791 | | | | 9,924,679 | | |
Service Class | | | | | 2,211,505 | | | | 903,036 | | |
Shares redeemed: | |
Institutional Class | | | — | | | | (40,773,091 | ) | | | (67,234,040 | ) | |
Service Class | | | | | (39,459,879 | ) | | | (20,569,822 | ) | |
Redemption fees: | |
Institutional Class | | | — | | | | 1,396 | | | | — | | |
Service Class | | | | | 10,696 | | | | 9,405 | | |
Net increase in net assets resulting from capital share transactions | | | 10,105,734 | | | | 148,562,095 | | | | 68,498,520 | | |
Total Increase in Net Assets | | | 10,536,594 | | | | 125,518,798 | | | | 116,964,045 | | |
NET ASSETS: | |
Beginning of Period | | | — | | | | 507,766,651 | | | | 390,802,606 | | |
End of Period | | $ | 10,536,594 | | | $ | 633,285,449 | | | $ | 507,766,651 | | |
TRANSACTIONS IN SHARES: | |
Shares sold: | |
Institutional Class | | | 1,010,000 | | | | 5,969,027 | | | | 2,333,837 | | |
Service Class | | | | | 7,446,735 | | | | 6,823,918 | | |
Shares issued to holders in reinvestment of distributions: | |
Institutional Class | | | 534 | | | | 519,363 | | | | 617,817 | | |
Service Class | | | | | 132,037 | | | | 53,756 | | |
Shares redeemed: | |
Institutional Class | | | — | | | | (2,410,302 | ) | | | (4,302,785 | ) | |
Service Class | | | | | (2,506,857 | ) | | | (1,322,355 | ) | |
Net increase in shares outstanding | | | 1,010,534 | | | | 9,150,003 | | | | 4,204,188 | | |
(1) Commencement of operations.
The accompanying notes are an integral part of these financial statements.
page 49

Frontier Funds
STATEMENTS OF CHANGES IN NET ASSETS (continued)
| | | MFG Select Infrastructure Fund | | Caravan Emerging Markets Fund | |
| | | For the
Year Ended
June 30, 2020 | | For the Period
July 2, 2018(1)
through
June 30, 2019 | | For the Period
December 4, 2019(1)
through
June 30, 2020 | |
OPERATIONS: | |
Net investment income | | $ | 1,632,884 | | | $ | 1,444,491 | | | $ | 214,427 | | |
Net realized gain (loss) on: | |
Investments | | | (4,371,541 | ) | | | 268,759 | | | | (599,697 | ) | |
Foreign currency transactions | | | (66,693 | ) | | | 10,030 | | | | (31,478 | ) | |
Change in net unrealized appreciation/depreciation on: | |
Investments | | | (5,052,284 | ) | | | 9,091,771 | | | | (1,477,577 | ) | |
Foreign currency transactions | | | (5,502 | ) | | | 4,082 | | | | (85 | ) | |
Net increase (decrease) in net assets resulting from operations | | | (7,863,136 | ) | | | 10,819,133 | | | | (1,894,410 | ) | |
DISTRIBUTIONS TO SHAREHOLDERS: | |
Institutional Class | | | (2,277,635 | ) | | | (1,210,470 | ) | | | (36,998 | ) | |
Service Class | | | (144,467 | ) | | | (20,837 | ) | | | — | | |
Net decrease in net assets resulting from distributions paid | | | (2,422,102 | ) | | | (1,231,307 | ) | | | (36,998 | ) | |
CAPITAL SHARE TRANSACTIONS: | |
Shares sold: | |
Institutional Class | | | 6,769,754 | | | | 81,297,633 | | | | 20,100,000 | | |
Service Class | | | 7,528,214 | | | | 2,205,780 | | | | 20,000 | | |
Shares issued to holders in reinvestment of distributions: | |
Institutional Class | | | 1,114,231 | | | | 593,377 | | | | 32,558 | | |
Service Class | | | 61,186 | | | | 11,070 | | | | — | | |
Shares redeemed: | |
Institutional Class | | | (6,299,112 | ) | | | (4,558,013 | ) | | | — | | |
Service Class | | | (259,514 | ) | | | (8,394 | ) | | | — | | |
Redemption fees: | |
Institutional Class | | | 478 | | | | — | | �� | | — | | |
Service Class | | | 791 | | | | 10 | | | | — | | |
Net increase in net assets resulting from capital share transactions | | | 8,916,028 | | | | 79,541,463 | | | | 20,152,558 | | |
Total Increase (Decrease) in Net Assets | | | (1,369,210 | ) | | | 89,129,289 | | | | 18,221,150 | | |
NET ASSETS: | |
Beginning of Period | | | 89,129,289 | | | | — | | | | — | | |
End of Period | | $ | 87,760,079 | | | $ | 89,129,289 | | | $ | 18,221,150 | | |
TRANSACTIONS IN SHARES: | |
Shares sold: | |
Institutional Class | | | 606,430 | | | | 8,143,160 | | | | 2,010,537 | | |
Service Class | | | 712,420 | | | | 204,974 | | | | 2,516 | | |
Shares issued to holders in reinvestment of distributions: | |
Institutional Class | | | 102,703 | | | | 55,345 | | | | 3,086 | | |
Service Class | | | 5,745 | | | | 1,002 | | | | — | | |
Shares redeemed: | |
Institutional Class | | | (594,964 | ) | | | (428,718 | ) | | | — | | |
Service Class | | | (25,275 | ) | | | (764 | ) | | | — | | |
Net increase in shares outstanding | | | 807,059 | | | | 7,974,999 | | | | 2,016,139 | | |
(1) Commencement of operations.
The accompanying notes are an integral part of these financial statements.
page 50

Frontier MFG Global Equity Fund
FINANCIAL HIGHLIGHTS
| | | Year
Ended
June 30,
2020 | | Year
Ended
June 30,
2019 | | Year
Ended
June 30,
2018 | | Year
Ended
June 30,
2017 | | Year
Ended
June 30,
2016 | |
Net Asset Value, Beginning of Period | | $ | 19.72 | | | $ | 18.89 | | | $ | 17.25 | | | $ | 15.05 | | | $ | 15.99 | | |
INCOME (LOSS) FROM INVESTMENT OPERATIONS: | |
Net investment income | | | 0.11 | (1) | | | 0.17 | | | | 0.13 | | | | 0.15 | | | | 0.14 | | |
Net realized and unrealized gain (loss) on investments | | | 1.39 | | | | 2.38 | | | | 2.22 | | | | 2.77 | | | | (0.48 | ) | |
Total Income (Loss) from Investment Operations | | | 1.50 | | | | 2.55 | | | | 2.35 | | | | 2.92 | | | | (0.34 | ) | |
LESS DISTRIBUTIONS: | |
From net investment income | | | (0.14 | ) | | | (0.17 | ) | | | (0.14 | ) | | | (0.14 | ) | | | (0.12 | ) | |
From net realized gain on investments | | | (1.30 | ) | | | (1.55 | ) | | | (0.57 | ) | | | (0.58 | ) | | | (0.48 | ) | |
Total Distributions | | | (1.44 | ) | | | (1.72 | ) | | | (0.71 | ) | | | (0.72 | ) | | | (0.60 | ) | |
Redemption fees retained(2) | | | — | | | | — | | | | — | | | | — | | | | — | | |
Net Asset Value, End of Period | | $ | 19.78 | | | $ | 19.72 | | | $ | 18.89 | | | $ | 17.25 | | | $ | 15.05 | | |
Total Return | | | 7.58 | % | | | 15.06 | % | | | 13.75 | % | | | 19.96 | % | | | (2.19 | )% | |
SUPPLEMENTAL DATA AND RATIOS: | |
Net assets, end of period (in thousands) | | $ | 1,162,448 | | | $ | 1,125,305 | | | $ | 1,103,521 | | | $ | 1,134,098 | | | $ | 1,073,308 | | |
Ratio of expenses to average net assets | |
Before waivers and reimbursements | | | 0.85 | % | | | 0.85 | % | | | 0.85 | % | | | 0.85 | % | | | 0.85 | % | |
Net of waivers and reimbursements | | | 0.80 | % | | | 0.80 | % | | | 0.80 | % | | | 0.80 | % | | | 0.80 | % | |
Ratio of net investment income to average net assets | |
Before waivers and reimbursements | | | 0.49 | % | | | 0.80 | % | | | 0.64 | % | | | 0.85 | % | | | 0.85 | % | |
Net of waivers and reimbursements | | | 0.54 | % | | | 0.85 | % | | | 0.69 | % | | | 0.90 | % | | | 0.90 | % | |
Portfolio turnover rate | | | 45 | % | | | 34 | % | | | 28 | % | | | 30 | % | | | 38 | % | |
(1) Per share net investment income has been calculated using the daily average share method.
(2) Less than one cent per share.
The accompanying notes are an integral part of these financial statements.
page 51

Frontier MFG Global Plus Fund
FINANCIAL HIGHLIGHTS
| | | Institutional Class | |
| | | Year
Ended
June 30,
2020 | | Year
Ended
June 30,
2019 | | Year
Ended
June 30,
2018 | | Year
Ended
June 30,
2017 | | Year
Ended
June 30,
2016 | |
Net Asset Value, Beginning of Period | | $ | 13.04 | | | $ | 12.72 | | | $ | 11.49 | | | $ | 9.59 | | | $ | 9.91 | | |
INCOME (LOSS) FROM INVESTMENT OPERATIONS: | |
Net investment income | | | 0.07 | (1) | | | 0.10 | (1) | | | 0.10 | | | | 0.13 | (1) | | | 0.09 | (1) | |
Net realized and unrealized gain (loss) on investments | | | 0.93 | | | | 1.60 | | | | 1.40 | | | | 1.79 | | | | (0.36 | ) | |
Total Income (Loss) from Investment Operations | | | 1.00 | | | | 1.70 | | | | 1.50 | | | | 1.92 | | | | (0.27 | ) | |
LESS DISTRIBUTIONS: | |
From net investment income | | | (0.08 | ) | | | (0.16 | ) | | | (0.08 | ) | | | (0.02 | ) | | | (0.05 | ) | |
From net realized gain on investments | | | (0.27 | ) | | | (1.22 | ) | | | (0.19 | ) | | | — | (2) | | | — | | |
Total Distributions | | | (0.35 | ) | | | (1.38 | ) | | | (0.27 | ) | | | (0.02 | ) | | | (0.05 | ) | |
Redemption fees retained | | | — | (2) | | | — | | | | — | | | | — | | | | — | | |
Net Asset Value, End of Period | | $ | 13.69 | | | $ | 13.04 | | | $ | 12.72 | | | $ | 11.49 | | | $ | 9.59 | | |
Total Return | | | 7.65 | % | | | 15.22 | % | | | 13.12 | % | | | 20.06 | % | | | (2.77 | )% | |
SUPPLEMENTAL DATA AND RATIOS: | |
Net assets, end of period (in thousands) | | $ | 306,283 | | | $ | 215,921 | | | $ | 340,204 | | | $ | 302,726 | | | $ | 21,547 | | |
Ratio of expenses to average net assets | |
Before waivers and reimbursements | | | 0.89 | % | | | 0.89 | % | | | 0.88 | % | | | 0.95 | % | | | 2.03 | % | |
Net of waivers and reimbursements | | | 0.80 | % | | | 0.80 | % | | | 0.80 | % | | | 0.80 | % | | | 0.80 | % | |
Ratio of net investment income (loss) to average net assets | |
Before waivers and reimbursements | | | 0.45 | % | | | 0.73 | % | | | 0.71 | % | | | 1.02 | % | | | (0.29 | )% | |
Net of waivers and reimbursements | | | 0.54 | % | | | 0.82 | % | | | 0.79 | % | | | 1.17 | % | | | 0.94 | % | |
Portfolio turnover rate(3) | | | 44 | % | | | 56 | % | | | 59 | % | | | 31 | % | | | 30 | % | |
(1) Per share net investment income has been calculated using the daily average share method.
(2) Less than one cent per share.
(3) Portfolio turnover is calculated on the basis of the Fund as a whole without distinguishing between the classes of shares issued.
The accompanying notes are an integral part of these financial statements.
page 52

Frontier MFG Global Plus Fund
FINANCIAL HIGHLIGHTS
| | | Service Class | |
| | | Year
Ended
June 30,
2020 | | Year
Ended
June 30,
2019 | | Year
Ended
June 30,
2018 | | Year
Ended
June 30,
2017 | | Period
Ended
June 30,
2016(1) | |
Net Asset Value, Beginning of Period | | $ | 13.03 | | | $ | 12.72 | | | $ | 11.49 | | | $ | 9.60 | | | $ | 9.73 | | |
INCOME (LOSS) FROM INVESTMENT OPERATIONS: | |
Net investment income | | | 0.06 | (2) | | | 0.10 | (2) | | | 0.10 | | | | 0.11 | (2) | | | — | (3) | |
Net realized and unrealized gain (loss) on investments | | | 0.92 | | | | 1.58 | | | | 1.39 | | | | 1.80 | | | | (0.13 | ) | |
Total Income (Loss) from Investment Operations | | | 0.98 | | | | 1.68 | | | | 1.49 | | | | 1.91 | | | | (0.13 | ) | |
LESS DISTRIBUTIONS: | |
From net investment income | | | (0.07 | ) | | | (0.15 | ) | | | (0.07 | ) | | | (0.02 | ) | | | — | | |
From net realized gain on investments | | | (0.27 | ) | | | (1.22 | ) | | | (0.19 | ) | | | — | (3) | | | — | | |
Total Distributions | | | (0.34 | ) | | | (1.37 | ) | | | (0.26 | ) | | | (0.02 | ) | | | — | | |
Redemption fees retained | | | — | (3) | | | — | | | | — | | | | — | (3) | | | — | (3) | |
Net Asset Value, End of Period | | $ | 13.67 | | | $ | 13.03 | | | $ | 12.72 | | | $ | 11.49 | | | $ | 9.60 | | |
Total Return | | | 7.50 | % | | | 15.09 | % | | | 13.01 | % | | | 19.92 | % | | | (1.34 | )%(4) | |
SUPPLEMENTAL DATA AND RATIOS: | |
Net assets, end of period (in thousands) | | $ | 230,199 | | | $ | 116,849 | | | $ | 74,933 | | | $ | 81,173 | | | $ | 10,727 | | |
Ratio of expenses to average net assets | |
Before waivers and reimbursements | | | 0.99 | % | | | 0.98 | % | | | 0.95 | % | | | 1.09 | % | | | 1.38 | %(5) | |
Net of waivers and reimbursements | | | 0.90 | % | | | 0.89 | % | | | 0.88 | % | | | 0.89 | % | | | 0.80 | %(5) | |
Ratio of net investment income (loss) to average net assets | |
Before waivers and reimbursements | | | 0.37 | % | | | 0.68 | % | | | 0.60 | % | | | 0.80 | % | | | (0.70 | )%(5) | |
Net of waivers and reimbursements | | | 0.46 | % | | | 0.77 | % | | | 0.67 | % | | | 1.00 | % | | | (0.12 | )%(5) | |
Portfolio turnover rate(6) | | | 44 | % | | | 56 | % | | | 59 | % | | | 31 | % | | | 30 | %(4) | |
(1) Commenced operations on May 9, 2016.
(2) Per share net investment income has been calculated using the daily average share method.
(3) Less than one cent per share.
(4) Not annualized.
(5) Annualized.
(6) Portfolio turnover is calculated on the basis of the Fund as a whole without distinguishing between the classes of shares issued.
The accompanying notes are an integral part of these financial statements.
page 53

Frontier MFG Global Sustainable Fund
FINANCIAL HIGHLIGHTS
| | | Period
Ended
June 30,
2020(1) | |
Net Asset Value, Beginning of Period | | $ | 10.00 | | |
INCOME FROM INVESTMENT OPERATIONS: | |
Net investment income | | | 0.05 | | |
Net realized and unrealized gain on investments | | | 0.39 | | |
Total Income from Investment Operations | | | 0.44 | | |
LESS DISTRIBUTIONS: | |
From net investment income | | | (0.01 | ) | |
Total Distributions | | | (0.01 | ) | |
Net Asset Value, End of Period | | $ | 10.43 | | |
Total Return | | | 4.36 | %(2) | |
SUPPLEMENTAL DATA AND RATIOS: | |
Net assets, end of period (in thousands) | | $ | 10,537 | | |
Ratio of expenses to average net assets | |
Before waivers and reimbursements | | | 2.26 | %(3) | |
Net of waivers and reimbursements | | | 0.80 | %(3) | |
Ratio of net investment income (loss) to average net assets | |
Before waivers and reimbursements | | | (0.82 | )%(3) | |
Net of waivers and reimbursements | | | 0.64 | %(3) | |
Portfolio turnover rate | | | 43 | %(2) | |
(1) Commenced operations on October 9, 2019.
(2) Not annualized.
(3) Annualized.
The accompanying notes are an integral part of these financial statements.
page 54

Frontier MFG Core Infrastructure Fund
FINANCIAL HIGHLIGHTS
| | | Institutional Class | |
| | | Year
Ended
June 30,
2020 | | Year
Ended
June 30,
2019 | | Year
Ended
June 30,
2018 | | Year
Ended
June 30,
2017 | | Year
Ended
June 30,
2016 | |
Net Asset Value, Beginning of Period | | $ | 17.16 | | | $ | 15.40 | | | $ | 15.84 | | | $ | 15.27 | | | $ | 13.09 | | |
INCOME (LOSS) FROM INVESTMENT OPERATIONS: | |
Net investment income | | | 0.41 | | | | 0.45 | | | | 0.58 | (1) | | | 0.50 | (1) | | | 0.37 | | |
Net realized and unrealized gain (loss) on investments | | | (0.81 | ) | | | 1.77 | | | | (0.48 | ) | | | 0.52 | | | | 2.21 | | |
Total Income (Loss) from Investment Operations | | | (0.40 | ) | | | 2.22 | | | | 0.10 | | | | 1.02 | | | | 2.58 | | |
LESS DISTRIBUTIONS: | |
From net investment income | | | (0.42 | ) | | | (0.44 | ) | | | (0.54 | ) | | | (0.42 | ) | | | (0.36 | ) | |
From net realized gain on investments | | | — | | | | (0.02 | ) | | | — | (2) | | | (0.03 | ) | | | (0.04 | ) | |
Total Distributions | | | (0.42 | ) | | | (0.46 | ) | | | (0.54 | ) | | | (0.45 | ) | | | (0.40 | ) | |
Redemption fees retained | | | — | (2) | | | — | | | | — | | | | — | (2) | | | — | (2) | |
Net Asset Value, End of Period | | $ | 16.34 | | | $ | 17.16 | | | $ | 15.40 | | | $ | 15.84 | | | $ | 15.27 | | |
Total Return | | | (2.40 | )% | | | 14.65 | % | | | 0.60 | % | | | 6.83 | % | | | 20.00 | % | |
SUPPLEMENTAL DATA AND RATIOS: | |
Net assets, end of period (in thousands) | | $ | 449,609 | | | $ | 402,142 | | | $ | 381,749 | | | $ | 251,149 | | | $ | 207,985 | | |
Ratio of expenses to average net assets | |
Before waivers and reimbursements | | | 0.58 | % | | | 0.79 | % | | | 0.81 | % | | | 0.83 | % | | | 0.83 | % | |
Net of waivers and reimbursements | | | 0.50 | % | | | 0.70 | % | | | 0.70 | % | | | 0.70 | % | | | 0.70 | % | |
Ratio of net investment income to average net assets | |
Before waivers and reimbursements | | | 2.41 | % | | | 2.74 | % | | | 3.57 | % | | | 3.18 | % | | | 2.62 | % | |
Net of waivers and reimbursements | | | 2.49 | % | | | 2.83 | % | | | 3.68 | % | | | 3.31 | % | | | 2.75 | % | |
Portfolio turnover rate(3) | | | 18 | % | | | 18 | % | | | 19 | % | | | 39 | % | | | 15 | % | |
(1) Per share net investment income has been calculated using the daily average share method.
(2) Less than one cent per share.
(3) Portfolio turnover is calculated on the basis of the Fund as a whole without distinguishing between the classes of shares issued.
The accompanying notes are an integral part of these financial statements.
page 55

Frontier MFG Core Infrastructure Fund
FINANCIAL HIGHLIGHTS
| | | Service Class | |
| | | Year
Ended
June 30,
2020 | | Year
Ended
June 30,
2019 | | Year
Ended
June 30,
2018 | | Period
Ended
June 30,
2017(1) | |
Net Asset Value, Beginning of Period | | $ | 17.20 | | | $ | 15.43 | | | $ | 15.85 | | | $ | 15.23 | | |
INCOME (LOSS) FROM INVESTMENT OPERATIONS: | |
Net investment income(2) | | | 0.43 | | | | 0.65 | | | | 0.53 | | | | 0.90 | | |
Net realized and unrealized gain (loss) on investments | | | (0.85 | ) | | | 1.57 | | | | (0.43 | ) | | | 0.16 | | |
Total Income (Loss) from Investment Operations | | | (0.42 | ) | | | 2.22 | | | | 0.10 | | | | 1.06 | | |
LESS DISTRIBUTIONS: | |
From net investment income | | | (0.40 | ) | | | (0.43 | ) | | | (0.52 | ) | | | (0.41 | ) | |
From net realized gain on investments | | | — | | | | (0.02 | ) | | | — | (3) | | | (0.03 | ) | |
Total Distributions | | | (0.40 | ) | | | (0.45 | ) | | | (0.52 | ) | | | (0.44 | ) | |
Redemption fees retained | | | — | (3) | | | — | (3) | | | — | (3) | | | — | | |
Net Asset Value, End of Period | | $ | 16.38 | | | $ | 17.20 | | | $ | 15.43 | | | $ | 15.85 | | |
Total Return | | | (2.49 | )% | | | 14.60 | % | | | 0.60 | % | | | 7.14 | %(4) | |
SUPPLEMENTAL DATA AND RATIOS: | |
Net assets, end of period (in thousands) | | $ | 183,676 | | | $ | 105,625 | | | $ | 9,054 | | | $ | 2,982 | | |
Ratio of expenses to average net assets | |
Before waivers and reimbursements | | | 0.69 | % | | | 0.90 | % | | | 0.91 | % | | | 5.15 | %(5) | |
Net of waivers and reimbursements | | | 0.60 | % | | | 0.80 | % | | | 0.80 | % | | | 0.80 | %(5) | |
Ratio of net investment income to average net assets | |
Before waivers and reimbursements | | | 2.44 | % | | | 3.89 | % | | | 3.30 | % | | | 1.68 | %(5) | |
Net of waivers and reimbursements | | | 2.53 | % | | | 3.99 | % | | | 3.41 | % | | | 6.03 | %(5) | |
Portfolio turnover rate(6) | | | 18 | % | | | 18 | % | | | 19 | % | | | 39 | %(4) | |
(1) Commenced operations on July 15, 2016.
(2) Per share net investment income has been calculated using the daily average share method.
(3) Less than one cent per share.
(4) Not annualized.
(5) Annualized.
(6) Portfolio turnover is calculated on the basis of the Fund as a whole without distinguishing between the classes of shares issued.
The accompanying notes are an integral part of these financial statements.
page 56

Frontier MFG Select Infrastructure Fund
FINANCIAL HIGHLIGHTS
| | | Institutional Class | |
| | | Year
Ended
June 30,
2020 | | Period
Ended
June 30,
2019(1) | |
Net Asset Value, Beginning of Period | | $ | 11.18 | | | $ | 10.00 | | |
INCOME (LOSS) FROM INVESTMENT OPERATIONS: | |
Net investment income | | | 0.18 | | | | 0.29 | (2) | |
Net realized and unrealized gain (loss) on investments | | | (1.08 | ) | | | 1.09 | | |
Total Income (Loss) from Investment Operations | | | (0.90 | ) | | | 1.38 | | |
LESS DISTRIBUTIONS: | |
From net investment income | | | (0.18 | ) | | | (0.20 | ) | |
From net realized gain on investments | | | (0.11 | ) | | | — | | |
Total Distributions | | | (0.29 | ) | | | (0.20 | ) | |
Redemption fees retained | | | — | (3) | | | — | | |
Net Asset Value, End of Period | | $ | 9.99 | | | $ | 11.18 | | |
Total Return | | | (8.26 | )% | | | 13.90 | %(4) | |
SUPPLEMENTAL DATA AND RATIOS: | |
Net assets, end of period (in thousands) | | $ | 78,775 | | | $ | 86,833 | | |
Ratio of expenses to average net assets | |
Before waivers and reimbursements | | | 1.08 | % | | | 1.24 | %(5)(6) | |
Net of waivers and reimbursements | | | 0.80 | % | | | 0.80 | %(5)(6) | |
Ratio of net investment income to average net assets | |
Before waivers and reimbursements | | | 1.50 | % | | | 2.37 | %(5)(7) | |
Net of waivers and reimbursements | | | 1.78 | % | | | 2.81 | %(5)(7) | |
Portfolio turnover rate(8) | | | 40 | % | | | 29 | %(4) | |
(1) Commenced operations on July 2, 2018.
(2) Per share net investment income has been calculated using the daily average share method.
(3) Less than one cent per share.
(4) Not annualized.
(5) Annualized.
(6) The ratio of expenses to average net assets includes tax expense. For the period ended June 30, 2019, the ratio of expenses to average net assets excluding tax expense before waivers and reimbursements was 1.24%. Excluding tax expense, the ratio of expenses to average net assets net of waivers and reimbursements was 0.80%.
(7) The ratio of net investment income to average net assets includes tax expense. For the period ended June 30, 2019, the ratio of net investment income to average net assets excluding tax expense before waivers and reimbursements was 2.38%. Excluding tax expense, the ratio of net investment income to average net assets net of waivers and reimbursements was 2.82%.
(8) Portfolio turnover is calculated on the basis of the Fund as a whole without distinguishing between the classes of shares issued.
The accompanying notes are an integral part of these financial statements.
page 57

Frontier MFG Select Infrastructure Fund
FINANCIAL HIGHLIGHTS
| | | Service Class | |
| | | Year
Ended
June 30,
2020 | | Period
Ended
June 30,
2019(1) | |
Net Asset Value, Beginning of Period | | $ | 11.19 | | | $ | 10.33 | | |
INCOME (LOSS) FROM INVESTMENT OPERATIONS: | |
Net investment income(2) | | | 0.23 | | | | 0.17 | | |
Net realized and unrealized gain (loss) on investments | | | (1.14 | ) | | | 0.82 | | |
Total Income (Loss) from Investment Operations | | | (0.91 | ) | | | 0.99 | | |
LESS DISTRIBUTIONS: | |
From net investment income | | | (0.17 | ) | | | (0.13 | ) | |
From net realized gain on investments | | | (0.11 | ) | | | — | | |
Total Distributions | | | (0.28 | ) | | | (0.13 | ) | |
Redemption fees retained(3) | | | — | | | | — | | |
Net Asset Value, End of Period | | $ | 10.00 | | | $ | 11.19 | | |
Total Return | | | (8.32 | )% | | | 9.60 | %(4) | |
SUPPLEMENTAL DATA AND RATIOS: | |
Net assets, end of period (in thousands) | | $ | 8,985 | | | $ | 2,296 | | |
Ratio of expenses to average net assets | |
Before waivers and reimbursements | | | 1.18 | % | | | 1.35 | %(5) | |
Net of waivers and reimbursements | | | 0.90 | % | | | 0.90 | %(5) | |
Ratio of net investment income to average net assets | |
Before waivers and reimbursements | | | 1.85 | % | | | 3.99 | %(5) | |
Net of waivers and reimbursements | | | 2.13 | % | | | 4.44 | %(5) | |
Portfolio turnover rate(6) | | | 40 | % | | | 29 | %(4) | |
(1) Commenced operations on February 19, 2019.
(2) Per share net investment income has been calculated using the daily average share method.
(3) Less than one cent per share.
(4) Not annualized.
(5) Annualized.
(6) Portfolio turnover is calculated on the basis of the Fund as a whole without distinguishing between the classes of shares issued.
The accompanying notes are an integral part of these financial statements.
page 58

Frontier Caravan Emerging Markets Fund
FINANCIAL HIGHLIGHTS
| | | Institutional Class | |
| | | Period
Ended
June 30,
2020(1) | |
Net Asset Value, Beginning of Period | | $ | 10.00 | | |
INCOME (LOSS) FROM INVESTMENT OPERATIONS: | |
Net investment income | | | 0.09 | | |
Net realized and unrealized loss on investments | | | (1.03 | ) | |
Total Loss from Investment Operations | | | (0.94 | ) | |
LESS DISTRIBUTIONS: | |
From net investment income | | | (0.02 | ) | |
Total Distributions | | | (0.02 | ) | |
Net Asset Value, End of Period | | $ | 9.04 | | |
Total Return | | | (9.44 | )%(2) | |
SUPPLEMENTAL DATA AND RATIOS: | |
Net assets, end of period (in thousands) | | $ | 18,198 | | |
Ratio of expenses to average net assets | |
Before waivers and reimbursements | | | 2.06 | %(3) | |
Net of waivers and reimbursements | | | 0.80 | %(3) | |
Ratio of net investment income to average net assets | |
Before waivers and reimbursements | | | 0.76 | %(3) | |
Net of waivers and reimbursements | | | 2.02 | %(3) | |
Portfolio turnover rate | | | 24 | %(2) | |
(1) Commenced operations on December 4, 2019.
(2) Not annualized.
(3) Annualized.
The accompanying notes are an integral part of these financial statements.
page 59

Frontier Caravan Emerging Markets Fund
FINANCIAL HIGHLIGHTS
| | | Service Class | |
| | | Period
Ended
June 30,
2020(1) | |
Net Asset Value, Beginning of Period | | $ | 7.86 | | |
INCOME FROM INVESTMENT OPERATIONS: | |
Net investment income | | | 0.04 | | |
Net realized and unrealized gain on investments | | | 1.14 | | |
Total Income from Investment Operations | | | 1.18 | | |
Net Asset Value, End of Period | | $ | 9.04 | | |
Total Return | | | 15.01 | %(2) | |
SUPPLEMENTAL DATA AND RATIOS: | |
Net assets, end of period (in thousands) | | $ | 23 | | |
Ratio of expenses to average net assets | |
Before waivers and reimbursements | | | 2.13 | %(3) | |
Net of waivers and reimbursements | | | 0.90 | %(3) | |
Ratio of net investment income to average net assets | |
Before waivers and reimbursements | | | 1.43 | %(3) | |
Net of waivers and reimbursements | | | 2.66 | %(3) | |
Portfolio turnover rate | | | 24 | %(2) | |
(1) Commenced operations on April 6, 2020.
(2) Not annualized.
(3) Annualized.
The accompanying notes are an integral part of these financial statements.
page 60

NOTES TO FINANCIAL STATEMENTS
June 30, 2020
(1) ORGANIZATION
Frontier Funds, Inc. (the "Company") was incorporated on May 24, 1996, as a Maryland corporation and is registered under the Investment Company Act of 1940, as amended (the "1940 Act"), as an open-end investment company issuing shares in series (each, a "Fund," or collectively, the "Funds"), each series representing a distinct portfolio with its own investment objectives and policies. The investment objective of each of the Frontier MFG Global Equity Fund (the "Global Equity Fund") and Frontier MFG Global Plus Fund (the "Global Plus Fund") is capital appreciation. The investment objective of each of the Frontier MFG Global Sustainable Fund (the "Global Sustainable Fund") and the Frontier MFG Select Infrastructure Fund (the "Select Fund") is to seek attractive risk-adjusted returns over the medium- to long-term, while reducing the risk of permanent capital loss. The investment objective of each of the Frontier MFG Core Infrastructure Fund (the "Core Fund") and the Frontier Caravan Emerging Markets Fund (the "Caravan Fund") is long-term capital appreciation. Each of the Core Fund and the Caravan Fund is a diversified fund, and each of the Global Equity Fund, the Global Plus Fund, the Global Sustainable Fund and the Select Fund is a non-diversified fund.
A summary of each Fund's investment adviser, subadviser and capital structure is as follows:
Fund | | Investment Adviser | | Subadviser | | Capital Structure | | Commencement
of Operations | |
Global Equity Fund (a) | | Frontegra Asset Management, Inc. ("Frontegra" or the "Adviser") | | MFG Asset Management ("MFG") | | Multi-Class
• Institutional
• Service Class (b) | | Dec. 28, 2011 | |
Global Plus Fund (a) | | Frontegra | | MFG | | Multi-Class
• Institutional
• Service Class
• Class Y (c) | | Mar. 23, 2015 | |
Global Sustainable Fund (a) | | Frontegra | | MFG | | Multi-Class
• Institutional
• Service Class (b) | | Oct. 9, 2019 | |
Core Fund (a) | | Frontegra | | MFG | | Multi-Class
• Institutional
• Service Class | | Jan. 18, 2012 | |
Select Fund (a) | | Frontegra | | MFG | | Multi-Class
• Institutional
• Service Class | | July 2, 2018 | |
Caravan Fund (d) | | Frontegra | | Caravan Capital Management, LLC ("Caravan") | | Multi-Class
• Institutional
• Service Class | | Dec. 4, 2019 | |
(a) A redemption fee of 2.00% will be charged on shares of the Fund redeemed 30 days or less from their date of purchase.
(b) As of June 30, 2020, the Service Class shares of the Global Equity and Global Sustainable Funds had not commenced operations.
(c) As of June 30, 2020, the Class Y shares of the Global Plus Fund had not commenced operations.
(d) A redemption fee of 2.00% will be charged on shares of the Fund redeemed 90 days or less from their date of purchase.
page 61

NOTES TO FINANCIAL STATEMENTS (continued)
June 30, 2020
(2) SIGNIFICANT ACCOUNTING POLICIES
The financial statements are prepared in accordance with accounting principles generally accepted in the United States of America ("GAAP"). Each Fund is an investment company and accordingly follows the investment company accounting and reporting guidance of the Financial Accounting Standards Board ("FASB") Accounting Standards Codification Topic 946 Financial Services — Investment Companies.
The following is a summary of significant accounting policies consistently followed by the Funds in the preparation of their financial statements.
(a) Investment Valuation
Securities are valued at their fair value. Equity securities, including preferred stocks, that are traded on a national securities exchange, except for those traded on NASDAQ Global Market, NASDAQ Global Select Market and NASDAQ Capital Market exchanges (together, "NASDAQ"), for which market quotations are readily available are valued at the last reported sale price on the national securities exchange on which such securities are principally traded. Equity securities that are traded on NASDAQ are valued using the NASDAQ Official Closing Price ("NOCP"). Equity securities for which there were no transactions on a given day or securities not listed on a national securities exchange are valued at the most recent quoted bid price. Debt securities are valued at the bid price provided by an independent pricing service, which uses valuation methods such as matrix pricing and other analytical pricing models, as well as market transactions and other market inputs. Shares of underlying mutual funds are valued at their respective Net Asset Value ("NAV"). Deposit accounts are valued at acquisition cost, which approximates fair value. Exchange-traded funds and closed-end funds are valued at the last reported sale price on the exchange on which the security is principally traded. Securities that are primarily traded on foreign exchanges generally are valued at the last sale price of such securities on their respective exchange. In the case of foreign securities, the occurrence of events after the close of the foreign markets, but prior to the time a Fund's NAV is calculated, will result in a systematic fair value adjustment to the trading prices of foreign securities provided that there is a movement in the markets that exceeds a threshold established by the Board of Directors (the "Board") and provided the fair value prices exceed a pre-established confidence level. The Funds will also value foreign securities at fair value using fair valuation procedures approved by the Board in the case of other significant events relating to a particular foreign issuer or market. In such cases, use of fair valuation can reduce an investor's ability to seek to profit by estimating the Fund's NAV in advance of the time the NAV is calculated. The Board has retained an independent fair value pricing service to assist in valuing foreign securities held by the Funds. In valuing assets, prices denominated in foreign currencies are converted to U.S. dollar equivalents at the current exchange rate, which approximates fair value. Any securities or other assets for which market quotations are not readily available are valued at their fair value as determined in good faith by the Adviser or subadvisers pursuant to guidelines established by the Board. The Board has appointed a Valuation Committee to assist the Board in its oversight of the Funds' valuation procedures.
The Funds follow a fair value hierarchy that distinguishes between market data obtained from independent sources (observable inputs) and the Funds' own market assumptions (unobservable inputs). These inputs are used in determining the value of each Fund's investments and are summarized in the following fair value hierarchy:
Level 1 — Quoted prices in active markets for identical securities that the Funds have the ability to access
Level 2 — Evaluated prices based on other significant observable inputs (including quoted prices for similar securities, foreign security indices, foreign exchange rates, fair value estimates for foreign securities and changes in benchmark securities indices)
Level 3 — Significant unobservable inputs (including the Fund's own assumptions in determining fair value of investments)
page 62

NOTES TO FINANCIAL STATEMENTS (continued)
June 30, 2020
The following is a summary of inputs used to value the Funds' investments as of June 30, 2020:
Global Equity Fund
Description | | Level 1 | | Level 2 | | Level 3 | | Total | |
Equity (a) | |
| Common Stocks | | $ | 705,463,619 | | | $ | 278,921,708 | | | $ | — | | | $ | 984,385,327 | | |
| Total Equity | | | 705,463,619 | | | | 278,921,708 | | | | — | | | | 984,385,327 | | |
Short-Term Investments | | | 175,108,478 | | | | — | | | | — | | | | 175,108,478 | | |
Total Investments in Securities | | $ | 880,572,097 | | | $ | 278,921,708 | | | $ | — | | | $ | 1,159,493,805 | | |
Global Plus Fund
Description | | Level 1 | | Level 2 | | Level 3 | | Total | |
Equity (a) | |
| Common Stocks | | $ | 323,398,944 | | | $ | 128,018,954 | | | $ | — | | | $ | 451,417,898 | | |
| Total Equity | | | 323,398,944 | | | | 128,018,954 | | | | — | | | | 451,417,898 | | |
Short-Term Investments | | | 83,035,429 | | | | — | | | | — | | | | 83,035,429 | | |
Total Investments in Securities | | $ | 406,434,373 | | | $ | 128,018,954 | | | $ | — | | | $ | 534,453,327 | | |
Global Sustainable Fund
Description | | Level 1 | | Level 2 | | Level 3 | | Total | |
Equity (a) | |
| Common Stocks | | $ | 5,344,086 | | | $ | 3,457,674 | | | $ | — | | | $ | 8,801,760 | | |
| Total Equity | | | 5,344,086 | | | | 3,457,674 | | | | — | | | | 8,801,760 | | |
Short-Term Investments | | | 1,672,923 | | | | — | | | | — | | | | 1,672,923 | | |
Total Investments in Securities | | $ | 7,017,009 | | | $ | 3,457,674 | | | $ | — | | | $ | 10,474,683 | | |
Core Fund
Description | | Level 1 | | Level 2 | | Level 3 | | Total | |
Equity (a) | |
| Common Stocks | | $ | 307,227,719 | | | $ | 254,614,749 | | | $ | — | | | $ | 561,842,468 | | |
| Closed-End Funds | | | — | | | | 7,411,354 | | | | — | | | | 7,411,354 | | |
| Total Equity | | | 307,227,719 | | | | 262,026,103 | | | | — | | | | 569,253,822 | | |
Short-Term Investments | | | 12,697,565 | | | | — | | | | — | | | | 12,697,565 | | |
Total Investments in Securities | | $ | 319,925,284 | | | $ | 262,026,103 | | | $ | — | | | $ | 581,951,387 | | |
Select Fund
Description | | Level 1 | | Level 2 | | Level 3 | | Total | |
Equity (a) | |
| Common Stocks | | $ | 38,500,962 | | | $ | 39,591,702 | | | $ | — | | | $ | 78,092,664 | | |
| Total Equity | | | 38,500,962 | | | | 39,591,702 | | | | — | | | | 78,092,664 | | |
Short-Term Investments | | | 8,936,024 | | | | — | | | | — | | | | 8,936,024 | | |
Total Investments in Securities | | $ | 47,436,986 | | | $ | 39,591,702 | | | $ | — | | | $ | 87,028,688 | | |
page 63

NOTES TO FINANCIAL STATEMENTS (continued)
June 30, 2020
Caravan Fund
Description | | Level 1 | | Level 2 | | Level 3 | | Total | |
Equity (a) | |
| Common Stocks | | $ | 6,859,593 | | | $ | 10,259,507 | | | $ | — | | | $ | 17,119,100 | | |
| Preferred Stocks | | | 306,536 | | | | — | | | | — | | | | 306,536 | | |
| Exchange-Traded Funds | | | 523,768 | | | | — | | | | — | | | | 523,768 | | |
| Total Equity | | | 7,689,897 | | | | 10,259,507 | | | | — | | | | 17,949,404 | | |
Rights | | | — | | | | 14 | | | | — | | | | 14 | | |
Short-Term Investments | | | 63,553 | | | | — | | | | — | | | | 63,553 | | |
Total Investments in Securities | | $ | 7,753,450 | | | $ | 10,259,521 | | | $ | — | | | $ | 18,012,971 | | |
(a) See each Fund's Schedule of Investments for sector or country classifications.
(b) Federal Income Taxes
Each Fund intends to comply with the requirements of Subchapter M of the Internal Revenue Code of 1986, as amended, necessary to qualify as a regulated investment company and to make the requisite distributions of income and capital gains to its shareholders sufficient to relieve it from all or substantially all federal income taxes. Therefore, no federal income tax provision has been provided.
The Funds have adopted financial reporting rules regarding recognition and measurement of tax positions taken or expected to be taken on a tax return. The Funds recognize interest and penalties, if any, related to unrecognized tax benefits as income tax expense on the Statements of Operations as incurred. During the period, the Funds did not incur any interest or penalties. The Funds have reviewed all open tax years and concluded that there is no effect to any of the Fund's financial positions or results of operations and no tax liability resulting from unrecognized tax benefits relating to uncertain income tax positions taken or expected to be taken on a tax return. The Funds have no examinations in progress.
(c) Distributions to Shareholders
With the exception of the Core and Select Funds, dividends from net investment income are usually declared and paid annually. The Core and Select Funds usually declare and pay dividends quarterly. Distributions from net realized gains, if any, are declared and paid at least annually for all Funds. All short-term capital gains are included in ordinary income for tax purposes. Distributions to shareholders are recorded on the ex-dividend date. The Funds may utilize earnings and profits distributed to shareholders on redemption of shares as part of the dividends paid deduction.
The tax character of distributions paid during the fiscal years ended June 30, 2020, and June 30, 2019, were as follows:
| | Year Ended June 30, 2020 | | Year Ended June 30, 2019 | |
| | Ordinary
Income | | Long-Term
Capital Gains | | Total
Distributions | | Ordinary
Income | | Long-Term
Capital Gains | | Total
Distributions | |
Global Equity Fund | | $ | 11,540,910 | | | $ | 67,226,288 | | | $ | 78,767,198 | | | $ | 17,986,260 | | | $ | 72,503,197 | | | $ | 90,489,457 | | |
Global Plus Fund | | | 3,753,234 | | | | 7,429,316 | | | | 11,182,550 | | | | 15,831,630 | | | | 16,864,158 | | | | 32,695,788 | | |
Global Sustainable Fund | | | 6,734 | | | | — | | | | 6,734 | | | | | | | | |
Core Fund | | | 13,593,891 | | | | — | | | | 13,593,891 | | | | 12,372,755 | | | | — | | | | 12,372,755 | | |
Select Fund | | | 2,083,713 | | | | 338,389 | | | | 2,422,102 | | | | 1,231,307 | | | | — | | | | 1,231,307 | | |
Caravan Fund | | | 36,998 | | | | — | | | | 36,998 | | | | | | | | |
page 64

NOTES TO FINANCIAL STATEMENTS (continued)
June 30, 2020
At June 30, 2020, the components of distributable earnings (accumulated losses) on a tax basis were as follows:
| | Global Equity
Fund | | Global Plus
Fund | | Global
Sustainable
Fund | | Core
Fund | | Select
Fund | | Caravan
Fund | |
Cost of investments | | $ | 820,272,891 | | | $ | 430,069,369 | | | $ | 9,513,226 | | | $ | 528,748,769 | | | $ | 83,754,126 | | | $ | 19,490,548 | | |
Gross unrealized appreciation | | $ | 346,440,709 | | | $ | 109,840,474 | | | $ | 1,176,606 | | | $ | 93,721,478 | | | $ | 7,991,757 | | | $ | 1,094,654 | | |
Gross unrealized depreciation | | | (7,219,795 | ) | | | (5,456,516 | ) | | | (215,149 | ) | | | (40,518,860 | ) | | | (4,717,195 | ) | | | (2,572,231 | ) | |
Net unrealized appreciation/depreciation | | | 339,220,914 | | | | 104,383,958 | | | | 961,457 | | | | 53,202,618 | | | | 3,274,562 | | | | (1,477,577 | ) | |
Undistributed ordinary income | | | — | | | | — | | | | 43,044 | | | | 1,322,568 | | | | 251,254 | | | | 145,951 | | |
Undistributed long-term capital gain | | | 52,818,413 | | | | 3,841,410 | | | | — | | | | — | | | | — | | | | — | | |
Other accumulated losses | | | (51,551 | ) | | | (16,696 | ) | | | (573,641 | ) | | | (6,504,040 | ) | | | (4,234,423 | ) | | | (599,782 | ) | |
Total distributable earnings
(accumulated losses) | | $ | 391,987,776 | | | $ | 108,208,672 | | | $ | 430,860 | | | $ | 48,021,146 | | | $ | (708,607 | ) | | $ | (1,931,408 | ) | |
The difference between book-basis and tax-basis unrealized appreciation is attributable primarily to the tax deferral of losses on wash sales and mark-to-market on passive foreign investment companies.
During the fiscal year ended June 30, 2020, the Core Fund utilized long-term and short-term capital loss carryforwards of $125,767 and $2,117,964, respectively.
At June 30, 2020, the Core Fund had long-term capital loss carryforwards that will not expire of $5,591,168 and the Global Sustainable Fund, Core Fund and Caravan Fund had short-term capital loss carryforwards that will not expire of $573,772, $782,795 and $599,697, respectively.
In order to meet certain excise tax requirements, the Funds are required to measure and distribute annually, net capital gains realized during the twelve month period ending October 31. In connection with this requirement, the Funds are permitted, for tax purposes, to defer into their next fiscal year any net capital losses incurred from November 1 through the end of the fiscal year. The Funds are also permitted to defer into their next fiscal year any net ordinary losses incurred from January 1 through the end of the fiscal year. As of the fiscal year ended June 30, 2020, the following Funds deferred, on a tax basis, post-October losses and late-year losses:
| | | Post-October
Capital Loss Deferred | | Ordinary Late-Year
Loss Deferred | |
Global Equity Fund | | $ | — | | | $ | 113,013 | | |
Global Plus Fund | | | — | | | | 27,044 | | |
Select Fund | | | 4,233,003 | | | | — | | |
(d) Foreign Currency Translation
Values of investments denominated in foreign currencies are converted into U.S. dollars using a spot market rate of exchange each day. Purchases and sales of investments and dividend and interest income are translated to U.S. dollars using a spot market rate of exchange prevailing on the dates of such transactions. The Funds do not isolate that portion of the results of operations resulting from changes in foreign exchange rates and currency gains or losses realized between the trade and settlement dates on securities transactions from the fluctuations arising from changes in fair value of securities held. Such fluctuations are included with the net realized and unrealized gain or loss on investments. Each Fund separately reports net realized foreign exchange
page 65

NOTES TO FINANCIAL STATEMENTS (continued)
June 30, 2020
gains and losses that arise from sales of foreign currencies, currency gains or losses realized between the trade and settlement dates on foreign currency transactions, and the difference between the amounts of dividends, interest, and foreign withholding taxes recorded on the Fund's books and the U.S. dollar equivalent of the amounts actually received or paid. Net unrealized foreign exchange gains and losses arise from changes in the fair values of assets and liabilities, other than investments in securities at fiscal period end, which result from changes in exchange rates.
Each Fund, respectively, bears the risk of changes in the foreign currency exchange rates and their impact on the value of assets and liabilities denominated in foreign currency. Each Fund also bears the risk of a counterparty failing to fulfill its obligation under a foreign currency contract.
Investing in foreign companies involves risks not generally associated with investment in the securities of U.S. companies, including risks relating to political, social and economic developments abroad and differences between U.S. and foreign regulatory requirements and market practices, including fluctuations in foreign currencies. The risks of foreign investments are typically greater in emerging and less developed markets.
(e) Indemnifications
Under the Funds' organizational documents, their officers and directors are indemnified against certain liabilities arising out of the performance of their duties to the Funds. In addition, in the normal course of business, the Funds enter into contracts that provide general indemnifications to other parties. The Funds' maximum exposure under these arrangements is unknown as this would involve future claims that may be made against the Funds that have not yet occurred. However, the Funds have not had prior claims or losses pursuant to these contracts and expect the risk of loss to be remote.
(f) Other
Investment transactions are accounted for on the trade date. The Funds determine the gain or loss realized from investment transactions by comparing the original cost of the specifically identified security lot sold with the net sale proceeds. Dividend income, less foreign taxes withheld, is recognized on the ex-dividend date, except that certain dividends from foreign securities are recorded as soon as the information becomes available to the Funds. Interest income is recognized on an accrual basis. All discounts/premiums are accreted/amortized using the effective interest method and are included in interest income. Withholding taxes on foreign dividends have been provided for in accordance with the Funds' understanding of the applicable country's tax codes and regulations.
Income, expenses (other than expenses attributable to a specific class) and realized and unrealized gains or losses on investments attributable to the Funds are generally allocated to each respective class in proportion to the relative net assets of each class. Expenses incurred that do not specifically relate to an individual Fund are allocated among all Funds in the Company in proportion to each Fund's relative net assets or by other equitable means.
The preparation of financial statements in conformity with GAAP requires management to make estimates and assumptions that affect the reported amounts of assets and liabilities and disclosure of contingent assets and liabilities at the date of the financial statements, and the reported amounts of increases and decreases in net assets from operations during the reporting period. Actual results could differ from those estimates.
Net investment income and realized gains and losses for federal income tax purposes may differ from that reported on the financial statements because of permanent book-to-tax differences. GAAP requires that permanent differences in distributable earnings
page 66

NOTES TO FINANCIAL STATEMENTS (continued)
June 30, 2020
due to differences between financial reporting and tax reporting be reclassified to or from paid in capital. These reclassifications have no effect on net assets or net asset value per share. For the fiscal year ended June 30, 2020, the following table shows the reclassifications made among tax components:
| | Global Equity
Fund | | Global Plus
Fund | | Global Sustainable
Fund | | Core
Fund | | Select
Fund | | Caravan
Fund | |
Paid in capital | | $ | 7,667,581 | | | $ | 628,924 | | | $ | — | | | $ | — | | | $ | 12,633 | | | $ | — | | |
Total distributable earnings (accumulated losses) | | | (7,667,581 | ) | | | (628,924 | ) | | | — | | | | — | | | | (12,633 | ) | | | — | | |
The permanent differences primarily relate to equalization.
(3) INVESTMENT ADVISER AND RELATED PARTIES
Each of the Funds has entered into an agreement with Frontegra, with whom certain officers and a director of the Company are affiliated, to furnish investment advisory services to such Funds. Frontegra is a wholly owned subsidiary of Frontier North America Holdings Inc., a majority-owned subsidiary of Magellan Financial Group Limited and an affiliate of MFG. William D. Forsyth III, the President and a director of the Company, is a control person of Frontegra and a minority owner of Frontier North America Holdings Inc.
Advisory fees are calculated daily and payable monthly, at annual rates set forth in the following table (expressed as a percentage of each Fund's average daily net assets). Pursuant to expense cap agreements, Frontegra has agreed to waive its management fees and/or reimburse each Fund's operating expenses (exclusive of taxes, interest, brokerage commissions, acquired fund fees and expenses and extraordinary expenses) to ensure that each Fund's operating expenses do not exceed the expense limitation listed below. Expenses waived are netted with advisory fees payable on the Statements of Assets and Liabilities. On a monthly basis, these accounts are settled by each Fund making payment to the Adviser or the Adviser reimbursing the Fund if the reimbursement amount exceeds the advisory fee. If the amount of fees waived exceeds the advisory fee earned, this is shown on the Statements of Assets and Liabilities as a receivable from the Adviser. The expense cap agreement for the Global Equity, Global Plus, Global Sustainable, Core and Select Funds will continue in effect until October 31, 2022, with successive renewal terms of one year unless terminated by the Adviser or a Fund prior to any such renewal. The expense cap agreement for the Caravan Fund will continue in effect until October 31, 2021, with successive renewal terms of one year unless terminated by the Adviser or the Caravan Fund prior to any such renewal.
Frontier Fund | | Annual Advisory Fees | | Expense Limitation | |
Global Equity Fund | | | 0.80 | % | | | 0.80 | % | |
Global Plus Fund - Institutional Class | | | 0.80 | % | | | 0.80 | % | |
Global Plus Fund - Service Class | | | 0.80 | % | | | 0.95 | % | |
Global Sustainable Fund | | | 0.80 | % | | | 0.80 | % | |
Core Fund - Institutional Class | | | 0.50 | % | | | 0.50 | % | |
Core Fund - Service Class | | | 0.50 | % | | | 0.65 | % | |
Select Fund - Institutional Class | | | 0.80 | % | | | 0.80 | % | |
Select Fund - Service Class | | | 0.80 | % | | | 0.95 | % | |
Caravan Fund - Institutional Class | | | 0.70 | % | | | 0.80 | % | |
Caravan Fund - Service Class | | | 0.70 | % | | | 0.95 | % | |
The Adviser is entitled to recoup the fees waived and/or expenses reimbursed within a three-year period from the date of the waiver or expense payment if such reimbursement will not cause a Fund's expense ratio to exceed the lesser of (a) the expense limitation in place at the time of the waiver and/or expense payment, or (b) the expense limitation in place at the time of recoupment. Expenses attributable to a specific class may only be recouped with respect to that class.
page 67

NOTES TO FINANCIAL STATEMENTS (continued)
June 30, 2020
The following table shows the waived or reimbursed expenses subject to potential recovery expiring on:
| | June 30, | |
| | 2021 | | 2022 | | 2023 | | Total | |
Global Equity Fund | | $ | 549,935 | | | $ | 541,860 | | | $ | 591,829 | | | $ | 1,683,624 | | |
Global Plus Fund | | | 331,218 | | | | 323,110 | | | | 402,090 | | | | 1,056,418 | | |
Global Sustainable Fund | | | — | | | | — | | | | 109,420 | (a) | | | 109,420 | | |
Core Fund | | | 325,570 | | | | 388,266 | | | | 466,041 | | | | 1,179,877 | | |
Select Fund | | | — | | | | 224,214 | (b) | | | 257,259 | | | | 481,473 | | |
Caravan Fund | | | — | | | | — | | | | 133,489 | (c) | | | 133,489 | | |
(a) Expenses waived/reimbursed were for the period October 9, 2019, through June 30, 2020.
(b) Expenses waived/reimbursed were for the period July 2, 2018, through June 30, 2020.
(c) Expenses waived/reimbursed were for the period December 4, 2019, through June 30, 2020.
Frontegra has entered into a subadvisory agreement under which MFG serves as the subadviser to the Global Equity, Global Plus, Global Sustainable, Core and Select Funds, and subject to Frontegra's supervision, manages each Fund's portfolio assets. Under the agreement, for each Fund subadvised by MFG, MFG is paid the net advisory fee received by Frontegra after giving effect to any fee waiver or reimbursement by Frontegra pursuant to the expense cap agreement discussed above, less an annual flat fee retained by Frontegra; provided however, if the net advisory fee is less than such flat fee, Frontegra shall retain the entire net advisory fee and no subadvisory fee will be payable to MFG. The Global Sustainable Fund's organizational costs were paid for by MFG and are not recoupable.
Frontegra has also entered into a subadvisory agreement under which Caravan serves as the subadviser to the Caravan Fund and, subject to Frontegra's supervision, manages the Fund's portfolio assets. Under the agreement, Caravan is compensated by Frontegra for its investment advisory services at the annual rate of 65% of the net advisory fee received by Frontegra from the Fund after giving effect to any fee waiver or reimbursement by Frontegra pursuant to the expense cap agreement. The Caravan Fund's organizational costs were paid for by Frontegra and Caravan and are not recoupable.
The beneficial ownership, either directly or indirectly, of more than 25% of a Fund's voting securities creates a presumption of control. As of June 30, 2020, the Global Equity Fund, Global Plus Fund, Global Sustainable Fund, Select Fund and Caravan Fund had individual shareholder accounts and/or omnibus shareholder accounts (comprised of a group of individual shareholders), which amounted to more than 25% of the total shares outstanding of the respective Fund. Affiliates of the Adviser own 100% of the total shares outstanding of the Global Sustainable Fund and 99% of the total shares outstanding of the Caravan Fund. Shareholders with a controlling interest could affect the outcome of proxy voting or direction of management of a Fund.
(4) INVESTMENT TRANSACTIONS
The aggregate purchases and sales of securities, excluding short-term investments, for the Funds for the year ended June 30, 2020, are summarized below:
| | Global Equity
Fund | | Global Plus
Fund | | Global Sustainable
Fund | | Core
Fund | | Select
Fund | | Caravan
Fund | |
Purchases | | $ | 458,719,078 | | | $ | 285,646,320 | | | $ | 12,186,149 | | | $ | 188,676,781 | | | $ | 36,161,306 | | | $ | 24,392,812 | | |
Sales | | $ | 590,281,121 | | | $ | 168,059,496 | | | $ | 3,772,075 | | | $ | 94,749,975 | | | $ | 34,387,265 | | | $ | 4,365,632 | | |
There were no purchases or sales of U.S. Government securities for the Funds.
page 68

NOTES TO FINANCIAL STATEMENTS (continued)
June 30, 2020
(5) DISTRIBUTION PLAN AND SHAREHOLDER SERVICING FEE
The Company, on behalf of the Global Plus Fund, has adopted a distribution plan pursuant to Rule 12b-1 under the 1940 Act for the Fund's Class Y shares (the "12b-1 Plan"). Pursuant to the 12b-1 Plan, the Class Y shares of the Fund pay an annual fee of up to 0.25% to Frontegra Strategies, LLC (the "Distributor"), an affiliate of Frontegra and MFG, for payments to brokers, dealers and other financial intermediaries who perform activities or incur expenses intended to result in the sale of Class Y shares of the Fund. As of June 30, 2020, the Class Y shares of the Fund had not commenced operations.
The Company has adopted a shareholder servicing plan (the "Service Plan") on behalf of the Class Y and Service Class shares offered by certain Funds. Pursuant to the Service Plan, the Service Class and Class Y shares of the applicable Funds pay an annual shareholder servicing fee of up to 0.15% per year to the Distributor for payments to brokers, dealers, and other financial intermediaries who provide on-going account services to shareholders. Those services include establishing and maintaining shareholder accounts, mailing prospectuses, account statements and other Fund documents to shareholders, processing shareholder transactions, and providing other recordkeeping and administrative services. As of June 30, 2020, the Class Y shares of the Global Plus Fund and the Service Class shares of the Global Equity and Global Sustainable Funds had not commenced operations. For the year ended June 30, 2020, the Service Plan expenses were as follows:
| | | Service Plan Expenses | |
Global Plus Fund - Service Class | | $ | 196,800 | | |
Core Fund - Service Class | | $ | 144,278 | | |
Select Fund - Service Class | | $ | 5,244 | | |
Caravan Fund - Service Class | | $ | 5 | | |
(6) RECENT ACCOUNTING PRONOUNCEMENT
In August 2018, FASB issued Accounting Standards Update 2018-13, Fair Value Measurement (Topic 820): Disclosure Framework — Changes to the Disclosure Requirements for Fair Value Measurement ("ASU 2018-13"). The primary focus of ASU 2018-13 is to improve the effectiveness of the disclosure requirements for fair value measurements. The changes affect all companies that are required to include fair value measurement disclosures. In general, the amendments in ASU 2018-13 are effective for all entities for fiscal years and interim periods within those fiscal years, beginning after December 15, 2019. An entity is permitted to early adopt the removed or modified disclosures upon the issuance of ASU 2018-13 and may delay adoption of the additional disclosures, which are required for public companies only, until their effective date. Management has evaluated ASU 2018-13 and has adopted ASU 2018-13.
(7) IMPACTS OF COVID-19
The recent global outbreak of COVID-19 has disrupted economic markets and the prolonged economic impact is uncertain. The operational and financial performance of the Funds' investments depends on future developments, including the duration and spread of the outbreak, and such uncertainty may in turn impact the value of each of the Funds' investments.
page 69

REPORT OF INDEPENDENT REGISTERED PUBLIC ACCOUNTING FIRM
June 30, 2020
To the Shareholders and Board of Directors of Frontier Funds, Inc.
Opinion on the Financial Statements
We have audited the accompanying statements of assets and liabilities, including the schedules of investments, of Frontier Funds, Inc. comprising the funds listed below (the "Funds") as of June 30, 2020, the related statements of operations, the statements of changes in net assets, and the financial highlights for each of the periods indicated below, including the related notes (collectively referred to as the "financial statements"). In our opinion, the financial statements present fairly, in all material respects, the financial position of each of the Funds as of June 30, 2020, the results of their operations, the changes in their net assets, and the financial highlights for each of the periods indicated below in conformity with accounting principles generally accepted in the United States of America.
| Fund Name | | Statements of
Operations | | Statement(s) of
Changes in
Net Assets | | Financial
Highlights | |
Frontier MFG Global Equity Fund
Frontier MFG Global Plus Fund
Frontier MFG Core Infrastructure Fund | | For the year ended June 30, 2020 | | For the years ended June 30, 2020 and 2019 | | For the years ended June 30, 2020, 2019, 2018, 2017, and 2016 | |
Frontier MFG Select Infrastructure Fund | | For the year ended June 30, 2020 | | For the year ended June 30, 2020 and for the period from July 2, 2018 (commencement of operations) through June 30, 2019 | | | |
Frontier MFG Global Sustainable Fund | | For the period from October 9, 2019 (commencement of operations) through June 30, 2020 | | | |
Frontier Caravan Emerging Markets Fund | | For the period from December 4, 2019 (commencement of operations) through June 30, 2020 | | | |
Basis for Opinion
These financial statements are the responsibility of the Funds' management. Our responsibility is to express an opinion on the Funds' financial statements based on our audits. We are a public accounting firm registered with the Public Company Accounting Oversight Board (United States) ("PCAOB") and are required to be independent with respect to the Funds in accordance with the U.S. federal securities laws and the applicable rules and regulations of the Securities and Exchange Commission and the PCAOB.
We conducted our audits in accordance with the standards of the PCAOB. Those standards require that we plan and perform the audit to obtain reasonable assurance about whether the financial statements are free of material misstatement whether due to error or fraud.
Our audits included performing procedures to assess the risks of material misstatement of the financial statements, whether due to error or fraud, and performing procedures that respond to those risks. Such procedures included examining, on a test basis, evidence regarding the amounts and disclosures in the financial statements. Our procedures included confirmation of securities owned as of June 30, 2020, by correspondence with the custodian and brokers or by other appropriate auditing procedures where replies from brokers were not received. Our audits also included evaluating the accounting principles used and significant estimates made by management, as well as evaluating the overall presentation of the financial statements. We believe that our audits provide a reasonable basis for our opinion.
We have served as the Funds' auditor since 2012.

COHEN & COMPANY, LTD.
Milwaukee, Wisconsin
August 26, 2020
page 70

ADDITIONAL INFORMATION
(Unaudited)
DIRECTORS AND OFFICERS AS OF JUNE 30, 2020
The business and affairs of the Funds are managed under the direction of the Funds' Board of Directors. Information pertaining to the directors and officers of the Funds is set forth below. The SAI includes additional information about the Funds' directors and officers and is available without charge, upon request by calling 1-888-825-2100.
Interested Director and Officers
Name, Address and
Year of Birth | | Position(s)
Held with
Company | | Term of
Office and
Length
of Time
Served | | Principal
Occupation(s)
During Past
Five Years | | Number of
Funds in
Complex
Overseen
by Director | | Other
Directorships
Held by
Director | |
William D. Forsyth III*
Frontier Funds, Inc.
400 Skokie Boulevard
Suite 500
Northbrook, Illinois 60062
Year of Birth: 1963 | | President
Director
Secretary | | Elected
annually by
the Board;
since
August
2008 (co-
president
from
1996 – 2008).
Indefinite;
since
May 1996.
Indefinite;
since
August
2014. | | Mr. Forsyth has served as President of Frontegra since August 2008 and as Treasurer and a Director of Frontegra since May 1996. Mr. Forsyth served as Co-President and Assistant Secretary of Frontegra from May 1996 to August 2008. Mr. Forsyth has served as Executive Chairman of North American Operations, MFG, since February 5, 2018. Mr. Forsyth served as Vice President of Timpani Capital Management LLC ("Timpani") from August 2015 to June 2019. Mr. Forsyth served as President of Timpani from August 2008 to August 2015 and served as Co-President from April 2008 to August 2008. Mr. Forsyth has served as President of the Distributor since August 2008 and as Co-President from August 2007 to August 2008. From July 1993 until the present, Mr. Forsyth has also served as a Partner and President of Frontier Partners, Inc. ("Frontier Partners"), a consulting/marketing firm. | | | 7 | | | None | |
* Mr. Forsyth is an "interested person" of the Funds because he serves as a director and officer of Frontegra.
page 71

ADDITIONAL INFORMATION (continued)
(Unaudited)
Interested Director and Officers
Name, Address and
Year of Birth | | Position(s)
Held with
Company | | Term of
Office and
Length
of Time
Served | | Principal
Occupation(s)
During Past
Five Years | | Number of
Funds in
Complex
Overseen
by Director | | Other
Directorships
Held by
Director | |
Elyce D. Dilworth
Frontier Funds, Inc.
400 Skokie Boulevard
Suite 500
Northbrook, Illinois 60062
Year of Birth: 1966 | | Treasurer, Assistant Secretary, Chief Compliance Officer and Anti-Money Laundering Compliance Officer | | Elected annually by the Board; Treasurer and Assistant Secretary since August 2008; Chief Compliance Officer since January 2008; Anti-Money Laundering Compliance Officer since February 2008. | | Ms. Dilworth has served as Chief Compliance Officer of Frontegra since January 2008 and as Secretary since August 2008. Ms. Dilworth served as Chief Compliance Officer of Timpani from April 2008 to June 2011 and from September 2014 to February 2015. She served as Chief Financial Officer of Timpani from April 2008 to March 2010. Ms. Dilworth served as Chief Compliance Officer of Frontier Partners from September 2010 to June 2011 and from September 2014 to February 2015. Ms. Dilworth has also served as Chief Compliance Officer of the Distributor from August 2008 to September 2018. | | N/A | | N/A | |
page 72

ADDITIONAL INFORMATION (continued)
(Unaudited)
Independent Directors
Name, Address and
Year of Birth | | Position(s)
Held with
Company | | Term of
Office and
Length
of Time
Served | | Principal
Occupation(s)
During Past
Five Years | | Number of
Funds in
Complex
Overseen
by Director | | Other
Directorships
Held by
Director | |
Pamela H. Conroy
400 Skokie Boulevard
Suite 500
Northbrook, Illinois 60062
Year of Birth: 1961 | | Independent Director
Chair, Nominating Committee | | Indefinite;
since
January
2020
Indefinite;
since
February
2020 | | Ms. Conroy is currently retired. Ms. Conroy served as Executive Vice President, Chief Operating Officer and Chief Compliance Officer of Institutional Capital Corporation, an investment management firm, from 1994-2008. | | | 7 | | | Listed Funds Trust (with oversight of 24 portfolios)* | |
Steven K. Norgaard
400 Skokie Boulevard
Suite 500
Northbrook, Illinois 60062
Year of Birth: 1964 | | Independent Director
Chair, Audit Committee | | Indefinite;
since
October
2013
Indefinite;
since
January
2020 | | Mr. Norgaard has been an attorney with Steven K. Norgaard P.C. since 1994. From 1990 to 1994, he was an attorney at McDermott, Will & Emery. | | | 7 | | | Boulder Growth & Income Fund, Inc. (with oversight of one portfolio) | |
James M. Snyder
400 Skokie Boulevard
Suite 500
Northbrook, Illinois 60062
Year of Birth: 1947 | | Independent Director
Lead Independent Director | | Indefinite;
since
May 2002
Indefinite;
since
January
2020 | | Mr. Snyder is a private investor and chairman of a family foundation. Mr. Snyder served as an investment professional with Northern Trust from June 1969 until his retirement in June 2001. He served in a variety of capacities at Northern Trust, including as Chief Investment Officer, Executive Vice President of Northern Trust and Vice Chairman of Northern Trust Global Investments. Mr. Snyder has earned the right to use the Chartered Financial Analyst (CFA) designation. | | | 7 | | | RMB Investors Trust (with oversight of six portfolios) | |
* As of August 14, 2020.
page 73

ADDITIONAL INFORMATION (continued)
(Unaudited)
FOREIGN TAX CREDIT
For the year ended June 30, 2020, the Core Fund earned $10,954,327 in foreign source income and paid $1,000,299 in foreign taxes, which it intends to pass through to its shareholders pursuant to Section 853 of the Internal Revenue Code.
For the year ended June 30, 2020, the Select Fund earned $1,498,391 in foreign source income and paid $128,238 in foreign taxes, which it intends to pass through to its shareholders pursuant to Section 853 of the Internal Revenue Code.
For the year ended June 30, 2020, the Caravan Fund earned $302,968 in foreign source income and paid $31,261 in foreign taxes, which it intends to pass through to its shareholders pursuant to Section 853 of the Internal Revenue Code.
QUALIFIED DIVIDEND INCOME/DIVIDENDS RECEIVED DEDUCTION
For the fiscal year ended June 30, 2020, certain dividends paid by the Funds may be subject to a maximum tax rate of 15%, as provided for by the Jobs and Growth Tax Relief Reconciliation Act of 2004. The percentage of dividends declared from ordinary income designated as qualified dividend income was as follows:
| Global Equity Fund | | | 93.11 | % | |
| Global Plus Fund | | | 71.49 | % | |
Global Sustainable Fund | | | 100.00 | % | |
| Core Fund | | | 99.31 | % | |
| Select Fund | | | 96.74 | % | |
| Caravan Fund | | | 93.47 | % | |
For corporate shareholders, the percent of ordinary income distributions qualifying for the corporate dividends received deduction for the fiscal year ended June 30, 2020, was as follows:
| Global Equity Fund | | | 100.00 | % | |
| Global Plus Fund | | | 81.90 | % | |
Global Sustainable Fund | | | 87.45 | % | |
| Core Fund | | | 42.57 | % | |
| Select Fund | | | 37.60 | % | |
| Caravan Fund | | | 0.60 | % | |
page 74

BOARD OF DIRECTORS' APPROVAL OF ADVISORY AND
SUBADVISORY AGREEMENTS
(Unaudited)
The Board of Directors (the "Board") of Frontier Funds, Inc. (the "Company"), including the directors who are not "interested persons" as defined in Section 2(a)(9) of the Investment Company Act of 1940, as amended (the "Independent Directors"), met on May 18, 2020, to consider the annual renewal of:
(a) the investment advisory agreement between Frontegra Asset Management, Inc. ("Frontegra") and the Company on behalf of the Frontier MFG Global Equity Fund (the "Global Equity Fund"), the Frontier MFG Global Plus Fund (the "Global Plus Fund"), the Frontier MFG Global Sustainable Fund (the "Global Sustainable Fund"), the Frontier MFG Core Infrastructure Fund (the "Core Fund") and the Frontier MFG Select Infrastructure Fund (the "Select Fund"); and
(b) the subadvisory agreement between Frontegra and Magellan Asset Management Limited d/b/a MFG Asset Management ("MFG Asset Management"), on behalf of the Global Equity Fund, the Global Plus Fund, the Global Sustainable Fund, the Core Fund and the Select Fund (collectively, the "Funds").
In connection with its review, the Board was provided materials relevant to its consideration of the agreements with Frontegra and with MFG Asset Management, such as performance assessments against each Fund's peer group and benchmark index, Frontegra's and MFG Asset Management's Form ADV, information regarding Frontegra's and MFG Asset Management's compliance programs, personnel and financial condition, profitability information, summary data and risk management reports provided by Fund management and a memorandum prepared by the Company's legal counsel regarding the Board's duties in considering the renewal of the agreements. The Board also reviewed the advisory fee payable by each Fund under the advisory agreement, the expense cap agreement between the Company and Frontegra on behalf of each Fund and comparative fee and expense information provided by an independent service. The Board considered the subadvisory fees paid by Frontegra to MFG Asset Management, noting that the applicable subadvisory fee structure was negotiated at arm's length between Frontegra and MFG Asset Management and that Frontegra compensates MFG Asset Management from its own fees. The Board was also provided with Frontegra's and MFG Asset Management's responses to the Section 15(c) request submitted by the Company's legal counsel on behalf of the Board. The Directors discussed with officers of Frontegra the operations of the Funds and the nature, extent and quality of the advisory and other services provided to the Funds by Frontegra and MFG Asset Management, as applicable. The Board also considered information provided by Frontegra and MFG Asset Management regarding the implementation of the respective firm's business continuity plan and the performance and operation of the Funds during the COVID-19 pandemic.
In evaluating the advisory and subadvisory agreements, the Board took into account their cumulative experience in working with Frontegra and MFG Asset Management and their ongoing review of information and discussions with representatives of Frontegra and MFG Asset Management throughout the year at Board meetings. The Board also took into account information routinely provided at quarterly meetings throughout the year regarding the quality of services provided by Frontegra and MFG Asset Management, the performance of the Funds, brokerage and trading, Fund expenses, asset flows, compliance issues and related matters. The Independent Directors met via videoconference with legal counsel and representatives of Frontegra on May 11, 2020, to discuss the 15(c) responses provided by Frontegra and MFG Asset Management. The Independent Directors also met in executive session via teleconference prior to the May 18, 2020, meeting to discuss Frontegra's and MFG Asset Management's 15(c) responses and the proposed approval of the advisory and subadvisory agreements.
In considering the advisory and subadvisory agreements, the Board reviewed and analyzed various factors with respect to each Fund that it determined were relevant, including the factors below, and made the following conclusions. In its deliberations, the Board did not identify any single factor as determinative.
page 75

Advisory Agreement
Nature, Extent and Quality of the Services to be Provided. The Board considered the background and services Frontegra would continue to provide to the Funds and their shareholders under the advisory agreement, as well as the qualifications and background of Frontegra and its personnel. The Board noted that Frontegra serves as a manager of managers and had selected MFG Asset Management to make the day-to-day investment decisions for the Funds. The Board considered that Frontegra has 24 years of experience in hiring and supervising subadvisers to portfolios in the Frontier family of funds. The Board discussed Frontegra's responsibilities for overseeing MFG Asset Management, and for supervising the management of the Funds' investments. The Board also considered the services provided by Frontegra compared to those provided by MFG Asset Management, as well as the level of the risks assumed by Frontegra as investment adviser/sponsor of the Funds. The Board also considered the quality of other services provided by Frontegra, including: subadviser due diligence; performance oversight; risk management oversight; Board support; oversight and coordination of service providers; oversight of financial reporting; administration of the Funds' compliance program; oversight of the Funds' valuation and liquidity policies; tax and global custody services; regulatory administration services; and general shareholder servicing and administration services provided by Frontegra to the Funds, such as the provision of Fund officers and office space. The Board also considered the effective operation of Frontegra's business continuity plan during the COVID-19 pandemic. The Board concluded that the range of services to be provided by Frontegra was appropriate and that Frontegra was qualified to provide such services.
Performance Record of the Funds. As described in more detail under "Subadvisory Agreement," the Board reviewed each Fund's performance record for the periods ended December 31, 2019. The Directors considered that Frontegra does not directly manage the Funds' investment portfolios, but had delegated those duties to MFG Asset Management, subject to Frontegra's oversight. After considering all of the information, the Board concluded that, although past performance is not a guarantee of future results, the Funds and their shareholders were likely to benefit from Frontegra's continued management.
Advisory Fees. The Board compared each Fund's advisory fee and total net expense ratio to industry data with respect to other mutual funds in the same Morningstar peer group. The Board noted that the advisory fees for the Global Equity Fund and Global Plus Fund were higher than the average for funds in the same Morningstar category. The Board also noted that the total net expense ratios of the Institutional Class of the Global Equity Fund and the Service Class shares of the Global Equity and Global Plus Funds, after giving effect to the expense cap agreement, were above the category averages and the total net expense ratios of the Institutional and Class Y shares of the Global Plus Fund were slightly below the category averages of comparable funds. The Board noted that the advisory fee for the Global Sustainable Fund was above the category average. The Board also considered that the total net expense ratio of the Institutional Class shares of the Global Sustainable Fund, after giving effect to the expense cap agreement, was below the category average, and the total net expense ratio of the Service Class shares of the Fund, after giving effect to the expense cap agreement, was above the category average. The Board noted that the advisory fee for the Core Fund was well below the category average and that the total net expense ratios of the Institutional Class and Service Class shares of the Core Fund, after giving effect to the expense cap agreement, were both well below the category averages. The Board noted that the advisory fee for the Select Fund was slightly below the category average and that the total net expense ratios of the Institutional Class and Service Class shares of the Select Fund, after giving effect to the expense cap agreement, were below the category averages. Based on their review of the industry data, the Directors found that each Fund's advisory fee and net expense ratios are competitive as they relate to peer funds. The Board concluded that the advisory fee paid by each Fund to Frontegra was reasonable in light of the nature and quality of services provided and fees paid by comparable funds.
Costs and Profitability. The Board considered information regarding the costs and profitability of Frontegra with respect to the Funds. The Board considered the fixed amount of the advisory fee Frontegra retains with respect to each of the Funds under the subadvisory agreement and also considered profitability information with respect to MFG Asset Management. The Board noted that the Global Sustainable Fund was not yet profitable to Frontegra, given that it had only recently commenced operations. The Board considered the fact that Frontegra had renewed the expense cap agreement on behalf of the Funds and was currently reimbursing each Fund's expenses under the
page 76

agreement. The Board also considered Frontegra's financial condition and determined it to be sound. The Board concluded that Frontegra's current level of profitability was reasonable.
Economies of Scale. The Board reviewed asset levels on a per Fund and aggregate basis, and considered whether there may be economies of scale in the management of each Fund at current levels and if its assets were to increase significantly. The Board noted that the Global Equity Fund is closed to new investors. The Board concluded that the assets of the Funds were not likely to increase to such an extent that breakpoints would be appropriate, particularly in light of the expense cap agreement in place between Frontegra and each Fund and that the current fee arrangements were appropriate. The Board also noted that Frontegra has shared economies of scale with shareholders through its investment in resources and services that benefit the Funds.
Benefits to Frontegra. The Board considered information presented regarding any benefits to Frontegra or its affiliates from serving as adviser to the Funds (in addition to the advisory fee). The Board noted that Frontier Partners, Inc., an affiliated company ("Frontier"), provides consulting and marketing services to, and is compensated by MFG Asset Management for new client relationships introduced to MFG Asset Management, and Frontegra Strategies, LLC, the Company's distributor (the "Distributor"), also may receive solicitation fees from MFG Asset Management for referrals of new shareholders to the Funds. However, the Board determined that Frontegra's services to the Funds would not be compromised by this potential conflict of interest, noting that the Funds do not pay any solicitation fees. The Board also considered the benefits to Frontegra and its affiliates due to the affiliation with MFG Asset Management, such as the subadvisory fee paid to MFG Asset Management and Mr. Forsyth's employment with an affiliate of MFG Asset Management.
On the basis of its review of the foregoing information, the Board found that the terms of the advisory agreement were fair and reasonable and in the best interests of each Fund's shareholders.
Subadvisory Agreement
Nature, Extent and Quality of the Services to be Provided. The Board reviewed and considered MFG Asset Management's investment strategy for each Fund, experience as a global equity and infrastructure manager, key personnel involved in providing investment management services to the Funds, compliance record and financial condition, including the financial condition of MFG Asset Management's parent company. The Board also considered services provided by MFG Asset Management under the subadvisory agreement, including the management of each Fund's investments, the selection of broker-dealers for execution of portfolio transactions, monitoring adherence to each Fund's investment restrictions, reporting and assisting with the Funds' compliance program. The Board also considered the effective operation of MFG Asset Management's business continuity plan during COVID-19. The Board concluded that the nature, extent and quality of the services provided by MFG Asset Management to the Funds were appropriate and that each Fund was likely to continue to benefit from services provided by MFG Asset Management under the subadvisory agreement.
Investment Performance. The Board reviewed the performance record of the Institutional Class of the Funds as of December 31, 2019. The Board noted that the Institutional Class of the Global Equity Fund and the Core Fund had outperformed its respective benchmark index for the one-year, three-year, five-year and respective since inception periods ended December 31, 2019, and that the Institutional Class of the Global Plus Fund had outperformed its benchmark index for the one-year, three-year and since inception periods ended December 31, 2019. The Board also noted that the Select Fund outperformed its benchmark index for the since inception period ended December 31, 2019, but had underperformed its benchmark for the one-year period ended December 31, 2019. The Board did not consider the Global Sustainable Fund's performance to be a material factor given that it had only recently commenced operations. The Board also considered MFG Asset Management's quarterly portfolio commentary and discussion of each Fund's performance. The Board also considered each Fund's absolute performance over the periods presented and each Fund's relative performance compared to its Morningstar peer group average, as well as the performance of the Service Class shares of the Funds for the applicable periods. The Board also reviewed the performance of MFG Asset Management's composite of other accounts managed in strategies similar to the Funds. The Board concluded that MFG Asset Management would continue to provide a high level of subadvisory services to each of the Funds.
page 77

Subadvisory Fees. The Board reviewed and considered the subadvisory fee payable by Frontegra to MFG Asset Management under the subadvisory agreement, noting that Frontegra and MFG Asset Management are affiliates but that the subadvisory fee structure was negotiated at arm's length prior to such affiliation. The Board considered the net advisory fee received by Frontegra and paid to MFG Asset Management, less an annual flat fee retained by Frontegra, with respect to each of the Funds under the subadvisory agreement. The Board noted that the Global Sustainable Fund was not yet operating at breakeven and was not yet generating advisory fees or subadvisory fees to Frontegra or MFG Asset Management. The Board also considered that MFG Asset Management agreed to pay for or reimburse Frontegra for, as applicable, any expense reimbursements made by Frontegra pursuant to the expense cap agreement, and all sub-transfer agent fees. The Board determined that the subadvisory fee payable with respect to the Funds was appropriate in light of MFG Asset Management's financial obligations as they relate to Frontegra. In evaluating the subadvisory fee, the Board noted that such amounts are paid by Frontegra and that therefore the overall advisory fee paid by the Funds is not directly affected by the subadvisory fee.
Costs and Profitability. The Board considered information regarding the costs and profitability of MFG Asset Management with respect to the Funds. The Board noted that the Global Sustainable Fund was not yet profitable to MFG Asset Management, given that it had only recently commenced operations. The Board considered the fact that MFG Asset Management has also agreed to pay for or reimburse Frontegra for, as applicable, any expense reimbursements made by Frontegra pursuant to the expense cap/reimbursement agreement, and all amounts paid by Frontegra to financial intermediaries for sub-transfer agent and other administrative services. The Board also considered the financial condition of MFG Asset Management's parent company, Magellan Financial Group Limited and determined it to be sound. The Board concluded that MFG Asset Management's current level of profitability was reasonable.
Economies of Scale. Because the subadvisory fee is not paid by the Funds, the Board did not consider whether the fee should reflect any potential economies of scale that might be realized as the Funds' assets increase.
Benefits to MFG Asset Management. The Board considered information presented regarding any benefits to MFG Asset Management from serving as subadviser to the Funds (in addition to the subadvisory fee). The Board noted that MFG Asset Management is under common control with Frontegra and thus indirectly benefits from the advisory fee paid to Frontegra. The Board noted that Frontier, an affiliated company, provides consulting and marketing services to MFG Asset Management for which Frontier (or the Distributor, with respect to new shareholders introduced to the Funds) may be compensated by MFG Asset Management. The Board concluded that the benefits realized by MFG Asset Management from its relationship with each Fund was reasonable.
On the basis of its review of the foregoing information, the Board found that the terms of the subadvisory agreement were fair and reasonable and in the best interests of the shareholders of each Fund.
page 78

STATEMENT REGARDING LIQUIDITY RISK MANAGEMENT PROGRAM
(Unaudited)
In accordance with Rule 22e-4 under the Investment Company Act of 1940, Frontier Funds, Inc. (the "Company") has adopted and implemented a liquidity risk management program (the "Program"). The Program seeks to promote effective liquidity risk management for each series of the Company (the "Funds") and to protect Fund shareholders from dilution of their interests. The Board of Directors (the "Board") of the Company has appointed Frontegra Asset Management, Inc., the Funds' investment adviser, as the program administrator (the "Program Administrator"). The Program Administrator has further delegated administration of the Program to the members of the Company's Valuation Committee. The Program Administrator is required to provide an annual report to the Board regarding the adequacy and effectiveness of the Program and any material changes to the Program.
On May 18, 2020, the Board reviewed the Program Administrator's annual written report (the "Report") for the period December 1, 2018, through March 31, 2020 (the "review period"). The Report provided an assessment of each Fund's liquidity risk, which is the risk that a Fund could not meet requests to redeem shares issued by the Fund without significant dilution of the remaining investors' interests in the Fund. The Program assesses liquidity risk under both normal and reasonably foreseeable stressed market conditions. The Program Administrator has retained U.S. Bancorp Global Fund Services to provide liquidity classification services from a third party data service provider, ICE Data Services, and the Report noted that each Fund primarily held investments that were classified as highly liquid during the review period. The Report noted that each Fund's portfolio is expected to continue to primarily hold highly liquid investments and that each Fund is considered to be a "primarily highly liquid fund" (as defined in the Program) and can therefore continue to rely on the exclusion in Rule 22e-4 from the requirements to determine and review a highly liquid investment minimum for each Fund and to adopt policies and procedures for responding to a highly liquid investment minimum shortfall. The Report stated that each Fund's percentage of illiquid investments was well below the 15% limitation and the Company was not required to file Form N-LIQUID during the review period. The Report also provided that, during the recent period of market volatility in March and April of 2020, each Fund was able to meet redemption requests without significant dilution to each Fund's remaining shareholders. The Report noted that no changes had been made to the Program since the Board's approval of the Program.
The Program Administrator concluded that the Program is operating effectively and no changes are recommended to the Program at this time. The Program Administrator noted that each Fund was able to meet redemption requests in all market conditions and under Fund-specific stresses during the review period without significant dilution to the Fund's remaining investors. The Program Administrator determined that the Program has been effectively implemented and is operating as intended to manage the liquidity risk of each Fund.
page 79

A NOTE ON FORWARD-LOOKING STATEMENTS
This report includes forward-looking statements such as adviser, subadviser and/or portfolio manager predictions, opinions, assessments, analyses or outlooks for individual securities, industries, market sectors and/or markets. These statements involve risks and uncertainties. In addition to the general risks described for the Funds in the current Prospectuses, other factors bearing on these statements include the accuracy of the adviser's, subadvisers' or portfolio managers' forecasts and predictions, and the appropriateness of the investment programs designed by an adviser, subadviser or portfolio manager to implement their strategies efficiently and effectively. Any one or more of these factors, as well as other risks affecting the securities markets and investment instruments generally, could cause the actual results of the Funds to differ materially as compared to benchmarks associated with the Funds.
In addition, portfolio composition will change due to ongoing management of the Funds. Specific securities named in this report may not currently be owned by the applicable Fund, or the Fund's position in the securities may have changed.
ADDITIONAL INFORMATION
Frontier Funds has adopted proxy voting policies and procedures that delegate to Frontegra the authority to vote proxies. The proxy voting policies permit Frontegra to delegate its authority to vote proxies to a Fund's subadviser. A description of the Frontier Funds' proxy voting policies and procedures is available without charge, upon request, by calling the Funds toll free at 1-888-825-2100. A description of these policies and procedures is also included in the Funds' Statements of Additional Information, which is available on the SEC's website at http://www.sec.gov and the Funds' website at www.frontiermutualfunds.com or by calling the Funds toll free at 1-888-825-2100.
The actual voting records relating to each Fund's portfolio securities during the most recent twelve months ended June 30 are available without charge by calling the Funds toll free at 1-888-825-2100 or by accessing the SEC's website at http://www.sec.gov.
Each Fund files a complete schedule of portfolio holdings for its first and third fiscal quarters with the SEC on Part F of Form N-PORT. Part F of Form N-PORT is available on the SEC's website at http://www.sec.gov. Part F of Form N-PORT may also be reviewed and copied at the SEC's Public Reference Room in Washington, D.C. Information on the operation of the Public Reference Room may be obtained by calling toll-free 1-800-SEC-0330.
Item 2. Code of Ethics.
The registrant has adopted a code of ethics that applies to the registrant’s principal executive officer and principal financial officer. The registrant has not made any substantive amendments to its code of ethics during the period covered by this report. The registrant has not granted any waivers from any provisions of the code of ethics during the period covered by this report.
A copy of the registrant’s Code of Ethics is incorporated by reference. See Item 13(a)(1).
Item 3. Audit Committee Financial Expert.
The registrant’s board of directors has determined that there are at least two audit committee financial experts serving on its audit committee. Steven K. Norgaard and Pamela H. Conroy are the “audit committee financial experts” and are considered to be “independent” as each term is defined in Item 3 of Form N-CSR.
Item 4. Principal Accountant Fees and Services.
The registrant has engaged its principal accountant to perform audit services, audit-related services, tax services and other services during the past two fiscal years. In the following table, “Audit Fees” are fees billed for professional services for the audit of the registrant's annual financial statements or services that are normally provided by the accountant in connection with statutory and regulatory filings or engagements for those fiscal years. The “All Other Fees” for fiscal year 2020 relate to the principal accountant’s review of the registrant’s semi-annual report for the period ended December 31, 2019. “Tax Fees” refer to professional services rendered by the principal accountant for tax compliance, tax advice, and tax planning. There were no other services provided by the principal accountant. The following table details the aggregate fees billed for each of the last two fiscal years by the principal accountant.
| | | FYE 6/30/2020 | | | FYE 6/30/2019 | |
| Audit Fees | | $ | 89,000 | | | $ | 68,000 | |
| Tax Fees | | $ | 23,500 | | | $ | 20,500 | |
| All Other Fees | | $ | 2,331 | | | $ | 3,000 | |
The audit committee has adopted pre-approval policies and procedures that require the audit committee to pre-approve all audit and non-audit services rendered to the registrant, as well as non-audit services provided to the registrant’s investment adviser and any entity affiliated with the registrant’s investment adviser with respect to any engagement that directly relates to the operations and financial reporting of the registrant. In accordance with its pre-approval policies and procedures, the audit committee pre-approved all audit and tax services provided by the principal accountant to the registrant during fiscal year 2020. All of the hours spent on auditing the registrant’s financial statements were attributed to work performed by full time permanent employees of the principal accountant.
Item 5. Audit Committee of Listed Registrants.
Not applicable to registrants who are not listed issuers (as defined in Rule 10A-3 under the Securities Exchange Act of 1934).
Item 6. Investments.
| (a) | Schedule of Investments is included as part of the report to shareholders filed under Item 1 of this Form. |
| | |
Item 7. Disclosure of Proxy Voting Policies and Procedures for Closed-End Management Investment Companies.
Not applicable to open-end investment companies.
Item 8. Portfolio Managers of Closed-End Management Investment Companies.
Not applicable to open-end investment companies.
Item 9. Purchases of Equity Securities by Closed-End Management Investment Company and Affiliated Purchasers.
Not applicable to open-end investment companies.
Item 10. Submission of Matters to a Vote of Security Holders.
Not Applicable.
Item 11. Controls and Procedures.
| (a) | Based on an evaluation of the registrant’s disclosure controls and procedures (as defined in Rule 30a-3(c) under the Investment Company Act of 1940 (the “Act”)) as of a date within 90 days prior to the filing date of this Form N-CSR, the registrant’s principal executive officer and principal financial officer have concluded that the disclosure controls and procedures are effective. |
| (b) | There were no changes in the Registrant's internal control over financial reporting (as defined in Rule 30a-3(d) under the Act) that occurred during the second fiscal quarter of the period covered by this report that has materially affected, or is reasonably likely to materially affect, the Registrant's internal control over financial reporting. |
Item 12. Disclosure of Securities Lending Activities for Closed-End Management Investment Companies.
Not applicable to open-end investment companies.
Item 13. Exhibits.
(2) A separate certification for each principal executive officer and principal financial officer pursuant to Section 302 of the Sarbanes-Oxley Act of 2002. Filed herewith.
(3) Any written solicitation to purchase securities under Rule 23c-1 under the Act sent or given during the period covered by the report by or on behalf of the registrant to 10 or more persons. Not applicable to open-end investment companies.
(4) Change in the registrant’s independent public accountant. Not Applicable.
SIGNATURES
Pursuant to the requirements of the Securities Exchange Act of 1934 and the Investment Company Act of 1940, the registrant has duly caused this report to be signed on its behalf by the undersigned, thereunto duly authorized.
| | Frontier Funds, Inc. | |
| | | |
| | By: | /s/ William D, Forsyth III | |
| | | William D. Forsyth III, President and Secretary | |
| | | (Principal Executive Officer) | |
| | | |
| | Date: | August 28, 2020 | |
Pursuant to the requirements of the Securities Exchange Act of 1934 and the Investment Company Act of 1940, this report has been signed below by the following persons on behalf of the registrant and in the capacities and on the dates indicated.
| | By: | /s/ William D. Forsyth III | |
| | | William D. Forsyth III, President and Secretary | |
| | | (Principal Executive Officer) | |
| | | |
| | Date: | August 28, 2020 | |
| | | |
| | | |
| | By: | /s/ Elyce D. Dilworth | |
| | | Elyce D. Dilworth, Treasurer and Assistant Secretary | |
| | | (Principal Financial Officer) | |
| | | |
| | Date: | August 28, 2020 | |