November 15, 2007
VIA EDGAR SUBMISSION AND FEDERAL EXPRESS
Mr. Hugh West, Accounting Branch Chief
Ms. Sharon Blume, Staff Accountant
Mail Stop 4561
Securities and Exchange Commission
Division of Corporation Finance
100 F Street, N.E.
Washington, DC 20549
Re: | E*TRADE Financial Corporation | |
| Form 10-Q for the Fiscal Quarter Ended June 30, 2007 | ||
| File No. 1-11921 |
Dear Mr. West and Ms. Blume:
This letter responds to the comments of the Staff (the “Staff”) of the Securities and Exchange Commission (the “Commission”) to Robert J. Simmons, E*TRADE Financial Corporation (the “Company”) in the letter dated October 12, 2007 (the “Comment Letter”) regarding the above-referenced Form 10-Q for the Company’s fiscal quarter ended June 30, 2007.
Set forth below are the Staff’s comments (in italics) and the Company’s responses thereto, organized as set forth in the Comment Letter.
Form 10-Q for the Fiscal Quarter Ended June 30, 2007
Management’s Discussion and Analysis of Financial Condition and Results of Operations
General
| 1. | Considering the significance of your lending activities to your business as a whole, and in an effort to provide greater transparency surrounding the risks related to those lending activities (particularly credit risk), please disclose the following information in a separate section (e.g.Credit Risk Management) of your September 30, 2007 Form 10-Q and future 1934 Act Filings: |
| • | discuss each of your business activities where credit risk arises and explain how you manage and assess loan quality and the related credit risks; |
• | discuss (quantitatively and qualitatively) the key performance indicators or metrics you use in managing credit risk (e.g. 1st lien and 2nd lien loan distribution by FICO, etc.); and |
| • | provide your proposed disclosures in your correspondence to us. |
In response to the Staff’s comment, we have added a new Credit Risk Management section to the Form 10-Q, which begins on page 24 and which we believe addresses each item above. We have included a copy of this section below.
Credit Risk Management
Credit risk is the risk of loss resulting from adverse changes in a borrower’s or counterparty’s ability to meet its financial obligations under agreed upon terms. Our primary sources of credit risk are our loan and securities portfolios, where it results from extending credit to customers and purchasing securities, respectively. The degree of credit risk associated with our loans and securities varies based on many factors including the size of the transaction, the credit characteristics of the borrower, features of the loan product or security, the contractual terms of the related documents and the availability and quality of collateral. Credit risk is one of the most common risks in financial services and is one of our most significant risks.
Credit risk is monitored by our Credit Risk Committee. The Credit Risk Committee’s duties include monitoring asset quality trends, evaluating market conditions including those in residential real estate markets, determining the adequacy of our allowance for loan losses, establishing underwriting standards, approving large credit exposures, approving large portfolio purchases and delegating credit approval authority. The Credit Risk Committee uses detailed tracking and analysis to measure credit performance and routinely reviews and modifies credit policies as appropriate. The section below includes some of the
2
information reviewed by the committee in determining asset quality and the level of adequacy of the allowance.
Lending Products and Underwriting Standards
We originate loans that generally fall into two categories:
| • | Mortgage Loans – Prime credit quality first-lien mortgage loans secured by single-family residences. |
| • | Home Equity Loans – Prime credit quality second-lien mortgage loans, including home equity lines of credit, secured by single-family residences. |
We originate loans primarily through our mortgage lending sales force. The loans are almost entirely secured by a primary residence for the purpose of purchase money, refinance, debt consolidation, or home equity loans. We originate both amortizing and interest-only mortgage loans; however, we do not originate negative amortization or option ARMs.
We price our loans based on the competitive environment as well as the risk elements inherent in the loan. We evaluate criteria such as, but not limited to: borrower credit score, loan-to-value ratio (“LTV”), documentation type, occupancy type and other risk elements.
Our underwriting guidelines were established with a focus on both the credit quality of the borrower as well as the adequacy of the collateral securing the loan. We have designed our underwriting guidelines so that our loans are salable in the secondary market. These guidelines include limitations on loan amount, loan-to-value ratio, debt-to-income ratio, documentation type and occupancy type. We also require borrowers to obtain mortgage insurance on higher loan-to-value first lien mortgage loans.
We supplement our loan underwriting process with a post-closing quality control process. Our quality control process consists of a re-verification of loan documentation, an underwriting and appraisal review, and other underwriting guideline reviews. This combination of an underwriting process and a quality control process allows us to evaluate and measure adherence to the prescribed underwriting guidelines.
Loan Portfolio
We track and review many factors to predict and monitor credit risk in our loan portfolios, which are primarily made up of loans secured by residential real estate. These factors include, but are not limited to: borrowers’ debt-to income ratio when loans are made, borrowers’ credit scores when loans are made, loan-to-value ratios, housing prices, documentation type, occupancy type, and loan type.
3
We believe that loan type, loan-to-value ratios and credit scores are the key factors in determining future loan performance.
We believe certain categories of loans inherently have a higher level of credit risk due to characteristics of the borrower and/or features of the loan. Two of these categories are sub-prime and option ARM loans. As a general matter, we do not originate or purchase these loans to hold on our balance sheet; however, in the normal course of purchasing large pools of real estate loans, we invariably end up acquiring a de minimis amount of sub-prime loans. As of September 30, 2007, sub-prime real estate loans represented less than one-fifth of one percent of our total real estate loan portfolio and we held no option ARM loans.
As noted above, loan type, loan-to-value ratios and borrowers’ credit scores are key determinates of future loan performance. Our home equity loan portfolio is primarily second lien loans(1) on residential real estate properties, which have a higher level of credit risk than first lien mortgage loans. We believe home equity loans with a combined loan-to-value ratio (“CLTV”) of 90% or higher or a FICO score below 700 are the loans with the highest levels of credit risk in our portfolios.
The breakdowns by LTV/CLTV and FICO score of our two main loan portfolios, one-to four-family and home equity, are as follows (dollars in thousands):
LTV/CLTV | One- to Four-Family | Home Equity | FICO | One- to Four-Family | Home Equity | |||||||||||
<=70% | $ | 7,134,469 | $ | 3,823,262 | >=720 | $ | 11,104,189 | $ | 7,284,273 | |||||||
70% - 80% | 9,212,228 | 2,177,195 | 719 - 700 | 2,293,358 | 1,975,416 | |||||||||||
80% - 90% | 246,323 | 3,985,354 | 699 - 680 | 1,788,304 | 1,736,651 | |||||||||||
>90% | 264,221 | 2,437,155 | 679 - 660 | 1,072,209 | 803,750 | |||||||||||
Total | $ | 16,857,241 | $ | 12,422,966 | 659 - 620 | 583,250 | 604,985 | |||||||||
| <620 | 15,931 | 17,891 | ||||||||||||||
| Total | $ | 16,857,241 | $ | 12,422,966 | ||||||||||||
(1) | Approximately 13% of the home equity portfolio is in the first lien position. For home equity loans that are in a second lien position, we also hold the first lien position on the same residential real estate property for less than 1% of the loans in this portfolio. |
4
In addition to the factors described above, we monitor credit trends in loans by acquisition channel and vintage, which are summarized below (dollars in thousands):
Acquisition Channel | One- to Four-Family | Home Equity | Total | ||||||
Purchased from a third party | $ | 14,436,776 | $ | 11,127,678 | $ | 25,564,454 | |||
Originated by the Company | 2,420,465 | 1,295,288 | 3,715,753 | ||||||
Total real estate loans | $ | 16,857,241 | $ | 12,422,966 | $ | 29,280,207 | |||
Vintage Year | One- to Four-Family | Home Equity | Total | ||||||
2003 and prior | $ | 1,792,964 | $ | 954,464 | $ | 2,747,428 | |||
2004 | 1,695,886 | 1,237,537 | 2,933,423 | ||||||
2005 | 3,082,319 | 2,920,112 | 6,002,431 | ||||||
2006 | 5,878,965 | 5,760,373 | 11,639,338 | ||||||
2007 | 4,407,107 | 1,550,480 | 5,957,587 | ||||||
Total real estate loans | $ | 16,857,241 | $ | 12,422,966 | $ | 29,280,207 | |||
Allowance for Loan Losses
The allowance for loan losses is management’s estimate of credit losses inherent in our loan portfolio as of the balance sheet date. The estimate of the allowance for loan losses is based on a variety of factors, including the composition and quality of the portfolio; delinquency levels and trends; probable expected losses for the next twelve months; current and historical charge-off and loss experience; current industry charge-off and loss experience; the condition of the real estate market and geographic concentrations within the loan portfolio; the interest rate climate as it affects adjustable-rate loans; the conditions of the residential real estate and credit markets; and general economic conditions. Determining the adequacy of the allowance is complex and requires judgment by management about the effect of matters that are inherently uncertain. Subsequent evaluations of the loan portfolio, in light of the factors then prevailing, may result in significant changes in the allowance for loan losses in future periods. We believe our allowance for loan losses at September 30, 2007 is representative of probable losses inherent in the loan portfolio at the balance sheet date.
In determining the allowance for loan losses, we allocate a portion of the allowance to various loan products based on an analysis of individual loans and pools of loans. However, the entire allowance is available to absorb credit losses inherent in the total loan portfolio as of the balance sheet date.
5
The following table presents the allowance for loan losses by major loan category (dollars in thousands):
| One- to Four-Family | Home Equity | Consumer and Other | Total | |||||||||||||||||||||
| Allowance | Allowance of Loans | Allowance | Allowance of Loans | Allowance | Allowance of Loans | Allowance | Allowance of Loans | |||||||||||||||||
September 30, 2007 | $ | 9,363 | 0.06 | % | $ | 175,088 | 1.38 | % | $ | 24,587 | 0.82 | % | $ | 209,038 | 0.64 | % | ||||||||
December 31, 2006 | $ | 7,760 | 0.07 | % | $ | 31,671 | 0.26 | % | $ | 28,197 | 0.82 | % | $ | 67,628 | 0.26 | % | ||||||||
(1) | Allowance as a percentage of loans receivable is calculated based on each respective categories gross loans receivable. |
During the nine months ended September 30, 2007, the allowance for loan losses increased by $141.4 million from the level at December 31, 2006. This increase was driven primarily by the increase in the allowance allocated to the home equity loan portfolio, which deteriorated significantly during the three months ended September 30, 2007. We believe this deterioration was caused by several factors, which are described below. First, the combined impact of rising mortgage rates and home price depreciation in key markets contributed to the declining performance of our home equity loan portfolio. Second, concerns that began in the sub-prime mortgage loan market spread to the broader credit markets in the third quarter of 2007 resulting in a significant deterioration in the overall credit markets. This deterioration led to a dramatic tightening of lending standards across the industry, and general liquidity pressure for many mortgage lenders, some of whom ultimately ceased operations as a result. The factors described above dramatically reduced the ability of borrowers to refinance their mortgage loans, specifically their home equity loans, therefore drastically increasing the risk of loss once a loan becomes delinquent. During the third quarter of 2007, we also observed a decline in the percentage of delinquent loans that cure prior to charge-off or foreclosure once they have become delinquent. We attribute this change in behavior to the factors described above, which have significantly limited borrowers’ alternatives to avoid defaulting on their loans. In addition, because of the likely decline in value of the homes collateralizing our home equity loans, our ability to recover our investment by foreclosing on the underlying properties has diminished as well.
6
The following table provides an analysis of the net charge-offs for the three and nine months ended September 30, 2007 and 2006 (dollars in thousands):
| Charge-offs | Recoveries | Net Charge-offs | % of Average Loans (Annualized) | |||||||||||
Three months ended September 30, 2007: | ||||||||||||||
One-to four-family | $ | (760 | ) | $ | 308 | $ | (452 | ) | 0.01 | % | ||||
Home equity | (46,328 | ) | 687 | (45,641 | ) | 1.46 | % | |||||||
Recreational vehicle | (8,731 | ) | 4,029 | (4,702 | ) | 0.90 | % | |||||||
Marine | (1,878 | ) | 876 | (1,002 | ) | 0.70 | % | |||||||
Credit card | (1,891 | ) | 248 | (1,643 | ) | 6.74 | % | |||||||
Other | (246 | ) | 484 | 238 | (0.29 | )% | ||||||||
Total | $ | (59,834 | ) | $ | 6,632 | $ | (53,202 | ) | 0.66 | % | ||||
Three months ended September 30, 2006: | ||||||||||||||
One- to four-family | $ | (57 | ) | $ | 107 | $ | 50 | (0.00 | )% | |||||
Home equity | (3,562 | ) | 222 | (3,340 | ) | 0.13 | % | |||||||
Recreational vehicle | (5,131 | ) | 1,777 | (3,354 | ) | 0.53 | % | |||||||
Marine | (1,779 | ) | 772 | (1,007 | ) | 0.57 | % | |||||||
Credit card | (3,016 | ) | 224 | (2,792 | ) | 5.54 | % | |||||||
Other | (405 | ) | 1,088 | 683 | (0.94 | )% | ||||||||
Total | $ | (13,950 | ) | $ | 4,190 | $ | (9,760 | ) | 0.17 | % | ||||
Nine months ended September 30, 2007: | ||||||||||||||
One- to four-family | $ | (1,595 | ) | $ | 415 | $ | (1,180 | ) | 0.01 | % | ||||
Home equity | (75,219 | ) | 2,477 | (72,742 | ) | 0.77 | % | |||||||
Recreational vehicle | (24,255 | ) | 12,050 | (12,205 | ) | 0.74 | % | |||||||
Marine | (6,246 | ) | 3,522 | (2,724 | ) | 0.60 | % | |||||||
Credit card | (8,957 | ) | 695 | (8,262 | ) | 10.24 | % | |||||||
Other | (809 | ) | 1,565 | 756 | (0.32 | )% | ||||||||
Total | $ | (117,081 | ) | $ | 20,724 | $ | (96,357 | ) | 0.42 | % | ||||
Nine months ended September 30, 2006: | ||||||||||||||
One- to four-family | $ | (321 | ) | $ | 154 | $ | (167 | ) | 0.00 | % | ||||
Home equity | (9,017 | ) | 406 | (8,611 | ) | 0.13 | % | |||||||
Recreational vehicle | (18,080 | ) | 8,396 | (9,684 | ) | 0.49 | % | |||||||
Marine | (4,133 | ) | 3,230 | (903 | ) | 0.16 | % | |||||||
Credit card | (8,128 | ) | 600 | (7,528 | ) | 5.09 | % | |||||||
Other | (2,243 | ) | 2,744 | 501 | (0.23 | )% | ||||||||
Total | $ | (41,922 | ) | $ | 15,530 | $ | (26,392 | ) | 0.17 | % | ||||
Loan losses are recognized when it is probable that a loss will be incurred. Our policy is to charge-off closed-end consumer loans when the loan is 120 days delinquent or when we determine that collection is not probable. For first-lien real estate loans, a charge-off is recognized when we foreclose on the property. For home equity loans and credit cards, our policy is to charge-off loans when collection is not probable or the loan has been delinquent for 180 days.
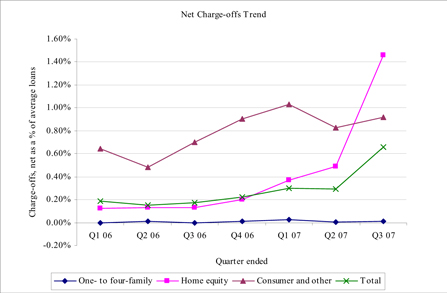
Net charge-offs for the three and nine months ended September 30, 2007 compared to the same periods in 2006 increased by $43.4 million and $70.0
7
million, respectively. The overall increase was primarily due to higher net charge-offs on home equity loans, which was driven mainly by the same factors as described above. The continued pressure in the residential real estate market including home price depreciation, rising mortgage interest rates and tighter mortgage lending guidelines across the industry will likely lead to a higher level of charge-offs in the future. The following graph illustrates the net charge-offs by quarter:
8
Nonperforming Assets
We classify loans as nonperforming when full and timely collection of interest or principal becomes uncertain or when they are 90 days past due. The following table shows the comparative data for nonperforming loans and assets (dollars in thousands):
| September 30, 2007 | December 31, 2006 | |||||||
One-to four-family(1) | $ | 115,446 | $ | 33,588 | ||||
Home equity | 151,336 | 32,216 | ||||||
Consumer and other loans | 7,399 | 8,906 | ||||||
Total nonperforming loans | 274,181 | 74,710 | ||||||
Real estate owned (“REO”) and other repossessed assets, net | 22,852 | 12,904 | ||||||
Total nonperforming assets, net | $ | 297,033 | $ | 87,614 | ||||
Total nonperforming loans receivable as a percentage of total gross loans receivable | 0.84 | % | 0.28 | % | ||||
One-to four-family allowance for loan losses as a percentage of one-to four-family nonperforming loans receivable | 8.11 | % | 23.10 | % | ||||
Home equity allowance for loan losses as a percentage of home equity nonperforming loans receivable | 115.69 | % | 98.31 | % | ||||
Consumer and other allowance for loan losses as a percentage of consumer and other nonperforming loans receivable | 332.30 | % | 316.61 | % | ||||
Total allowance for loan losses as a percentage of total nonperforming loans receivable | 76.24 | % | 90.52 | % | ||||
(1) | One-to four-family excludes held-for-sale loans of $0.7 million and $0.6 million at September 30, 2007 and December 31, 2006, respectively. Loans held-for-sale are accounted for at lower of cost or market value with adjustments recorded in the gain (loss) on loans and securities, net line item and are not considered in the allowance for loan losses. |
We expect nonperforming loan levels to increase over time due to the deteriorating conditions in the residential real estate and credit markets. The performance of any loan can be affected by external factors, such as economic conditions or factors particular to the borrower.
During the nine months ended September 30, 2007, our nonperforming assets, net increased $209.4 million from $87.6 million at December 31, 2006. The increase was attributed primarily to an increase in nonperforming one-to four-family loans of $81.9 million and home equity loans of $119.1 million for the period ended September 30, 2007 when compared to December 31, 2006.
The allowance as a percentage of total nonperforming loans receivable, net decreased from 91% at December 31, 2006 to 76% at September 30, 2007.
9
Our total loan portfolio has shifted towards a larger concentration of one-to four-family real estate loans, where the risk of loss is generally less than the risk of loss on home equity real estate and consumer loans. As such, the total allowance as a percentage of nonperforming assets decreased.
In addition to nonperforming assets in the table above, we monitor loans where a borrower’s past credit history casts doubt on their ability to repay a loan (“Special Mention” loans). Special Mention loans represented $520.3 million, or 2%, and $259.0 million, or 1%, of the total loan portfolio at September 30, 2007 and December 31, 2006, respectively, and are generally secured by real estate assets, reducing the potential loss should they become nonperforming. These loans are actively monitored, continue to accrue interest and remain a component of the loans receivable balance. The increase in Special Mention loans was due primarily to an increase in the 30-day delinquency category of real estate loans. We expect migration from this category to more serious delinquency classifications to increase over time consistent with the current instability in the residential real estate and credit markets.
Securities
We focus primarily on security type and credit rating to monitor credit risk in our securities portfolios. We believe asset-backed securities represent our highest concentration of credit risk. The table below details the average credit ratings by type of asset as of September 30, 2007 (dollars in thousands):
AA or Higher | A | BBB | Below Investment Grade | Non-Rated | Total | |||||||||||||
Mortgage-backed securities | $ | 12,372,763 | $ | 498 | $ | — | $ | — | $ | 106 | $ | 12,373,367 | ||||||
Asset-backed securities | 1,767,037 | 814,324 | 431,529 | 16,528 | 28,950 | 3,058,368 | ||||||||||||
Corporate bonds, municipal bonds and preferred stock | 1,965,985 | 15,524 | — | — | — | 1,981,509 | ||||||||||||
Total | $ | 16,105,785 | $ | 830,346 | $ | 431,529 | $ | 16,528 | $ | 29,056 | $ | 17,413,244 | ||||||
| 2. | We do not see (either in this Form 10-Q or in your 2006 Form 10-K) where you have provided an ample discussion of your significant products and services (particularly your lending products). In light of our comments in this letter as well as our letter to you dated July 26, 2007, please address the following in your September 30, 2007 Form 10-Q and future 1934 Act Filings (refer to Item 101 of Regulation S-K): |
| • | provide a robust discussion ofeach of your business products and services; |
We believe that our 2006 Form 10-K contains a robust discussion of each of our business products and services and that this discussion fully complies with the
10
requirements of Form 10-K and Item 101 of Regulation S-K. Based on the Staff’s comments and developments during the third quarter, however, we determined that it would be beneficial to investors to provide additional disclosure on our lending products and did so in the new Credit Risk Management section to the Form 10-Q, which begins on page 24. We intend to incorporate this additional information into the broader discussion of our products and services in future filings on Form 10-K. With respect to our Form 10-Q, the Company submits that discussion of each of its products and services is not required by Form 10-Q, except to the extent that such products and services have materially changed since the end of the Company’s 2006 fiscal year. Although not strictly mandated by Form 10-Q, the Company does provide disclosure of these sorts of changes where it believes that such disclosure would be beneficial to investors. For example, in addition to the supplemental disclosure in the Form 10-Q described above, page 5 of the Company’s Form 10-Q for the quarter ended March 31, 2007, discloses the launch of the Company’s Global Trading Platform pilot program, and page 5 of the Company’s Form 10-Q for the quarter ended June 30, 2007, discloses various new services made available to international investors during that period. The Company confirms that it will continue to draft future 1934 Act Filings to disclose interim period changes in its products and services where it believes that such information would be beneficial to investors.
| • | as it relates to your mortgage, home equity and other lending activities, disclose your loan pricing and underwriting practices/standards; |
In response to the Staff’s comment, we included a discussion of our loan pricing and underwriting practices as they relate to our mortgage loan portfolio on pages 24-25 of the new Credit Risk Management section of our Form 10-Q.
• | discuss any significant concentrations within your loan portfolio, particularly concentrations where there is an inherent elevated credit risk (e.g. 2nd lien HELOCs and HEILs, etc.); and |
In response to the Staff’s comment, we included a discussion of significant concentrations in our loan portfolio on pages 25-26 of the new Credit Risk Management section of our Form 10-Q.
| • | disclose the amount or percentage of total revenue contributed by any class of similar products or services which accounted for 10% or more of consolidated revenue. |
In response to the Staff’s comment, we disclosed on page 16 of our Form 10-Q that our retail trading and investing products contributed 62% and our deposit products contributed 21% of total net revenue for the nine months ended September 30, 2007. We further disclosed that our other groups of similar products and services each contributed less than 10% of total net revenue for the nine months ended September 30, 2007.
11
| 3. | We read your response to comments one and two of our letter to you dated July 26, 2007 and have additional questions. Please address the following regarding your “HELOCs, HEILs and other loans” (collectively referred to as “loans”): |
| • | tell us your underwriting policies for purchased loans; |
Our underwriting policies for purchased loans focus primarily on ensuring (i) adherence to the underwriting policies of the originator of the loan and (ii) that the loans meet certain minimum credit criteria.
In order to confirm adherence to the underwriting policies of the originator, we obtain a copy of the underwriting guidelines used to originate the loans prior to purchase. We perform an analysis on a sample of the loans to ensure compliance with these guidelines, with a focus on: appraisal methodology and type; equity methodology and calculation; debt-to-income methodology and calculation; credit characteristics, including credit score; employment and income requirements; and the exception policy of the originator. To the extent loans do not adhere to the underwriting policies of the originator, they are excluded from the purchase.
When purchasing a portfolio of loans, our strategy is to attempt to exclude loans that we believe have a lower credit quality. We review a detailed listing of the credit characteristics of the portfolio prior to purchase and attempt to exclude lower credit quality loans. Our review criteria are not static and vary by purchase, but typically focus on excluding loans in the following categories: FICO scores below 640; combined loan-to-value ratios above 100%; debt-to-income ratios above 50%; and investor property loans. Even though our strategy focuses on excluding loans with a lower credit quality, we invariably end up purchasing an insignificant amount of loans that do not meet the credit criteria. This typically occurs in a portfolio purchase where the seller of the loans requires the purchaser of the loans to buy all loans in the pool.
12
| • | tell us who you purchased the loans from (quantify such amounts from each seller); |
The following table outlines the purchased home equity loans in our loan portfolio as of September 30, 2007 (dollars in thousands):
Seller | Principal Balance | ||
National City | $ | 4,864,089 | |
E-Loan | 1,175,057 | ||
GMAC | 1,170,985 | ||
Countrywide | 928,878 | ||
Sovereign | 559,474 | ||
National City Mortgage Co. | 470,798 | ||
AmSouth | 425,734 | ||
USAA | 359,971 | ||
Fremont | 230,040 | ||
GreenPoint | 214,164 | ||
NY Community Bank | 188,420 | ||
First Horizon | 185,221 | ||
Macquarie | 149,475 | ||
Quicken | 106,353 | ||
Wells Fargo | 54,147 | ||
Morgan Stanley Credit Corp. | 35,581 | ||
Wachovia | 9,291 | ||
| $ | 11,127,678 | ||
| • | tell us if you are the service provider for the loans; |
We are not the service provider for our home equity loan portfolio. PNC provides the servicing for our originated home equity loans. Our purchased home equity loans are primarily serviced by the entity who sold us the loans.
• | tell us if you originated the 1st lien mortgages associated with the loans and subsequently sold those loans, and if so, tell us who you sold those loans to; |
The substantial majority of our home equity loans were purchased, not originated, and we did not purchase the first lien mortgage associated with these home equity loans. For the home equity loans we originated, which comprise approximately 10% of our home equity loan portfolio, we did originate some of the first lien mortgage loans associated with those loans. While we do not specifically track the data requested, we believe that the number of loans that meet this criteria is insignificant.
In addition, please note that approximately 13% of our home equity loans are in a first lien position.
13
• | tell us if you are the service provider for the 1st lien mortgages associated with the loans; and |
We are not the service provider for our first lien mortgage portfolio. GMAC is the primary service provider for our originated first lien mortgage loans.
| • | tell us if there are any differences (both qualitative and quantitative) in your methodology for determining the allowance for loan losses on originated loans and purchased loans. |
There are no differences in our methodology for determining the allowance for loan losses between originated loans and purchased loans.
Allowance for Loan Losses, page 20
| 4. | We note your tabular presentation of the analysis of the allowance for loan losses is less detailed that provided in your December 31, 2006 Form 10-K. In an effort to provide greater transparency throughout your periodic filings, please revise this table, starting with your September 30, 2007 Form 10-Q to include a greater level of detail (i.e. charge-offs and recoveries by loan type). Further, you should include additional discussion and analysis, as necessary, to allow an investor to understand the credit quality of loans in your loan portfolio. Refer to Section IV.A-B of Industry Guide III and revise accordingly. |
In response to the Staff’s comment, we included additional disclosure regarding our allowance for loan losses, charge-offs and recoveries by loan type on pages 27-28 of the new Credit Risk Management section of our Form 10-Q. Pages 25-26 of this section also include discussion and analysis designed to assist investors in understanding the credit quality of loans in our loan portfolio.
14
| 5. | Please provide us with the information requested above for the quarterly period ended June 30, 2007. |
The following tables include detailed information on charge-offs and recoveries by loan type and the allowance for loan losses by loan category for the quarterly period ended June 30, 2007 (dollars in thousands):
| Charge-offs | Recoveries | Net Charge-offs | % of Average Loans (Annualized) | |||||||||||
Three months ended June 30, 2007: | ||||||||||||||
One- to four-family | $ | (161 | ) | $ | 107 | $ | (54 | ) | 0.00 | % | ||||
Home equity | (16,950 | ) | 1,368 | (15,582 | ) | 0.49 | % | |||||||
Recreational vehicle | (8,036 | ) | 4,648 | (3,388 | ) | 0.61 | % | |||||||
Marine | (1,756 | ) | 1,408 | (348 | ) | 0.23 | % | |||||||
Credit card | (3,497 | ) | 253 | (3,244 | ) | 12.35 | % | |||||||
Other | (209 | ) | 495 | 286 | (0.37 | )% | ||||||||
Total | $ | (30,609 | ) | $ | 8,279 | $ | (22,330 | ) | 0.29 | % | ||||
| One- to Four-Family | Home Equity | Consumer and Other | Total | |||||||||||||||||||||
| Allowance | Allowance of Loans | Allowance | Allowance of Loans | Allowance | Allowance of Loans | Allowance | Allowance of Loans | |||||||||||||||||
June 30, 2007 | $ | 3,554 | 0.02 | % | $ | 50,090 | 0.40 | % | $ | 22,060 | 0.70 | % | $ | 75,704 | 0.24 | % | ||||||||
December 31, 2006 | $ | 7,760 | 0.07 | % | $ | 31,671 | 0.26 | % | $ | 28,197 | 0.82 | % | $ | 67,628 | 0.26 | % | ||||||||
Form 8-K filed September 17, 2007
| 6. | We note your disclosure that given the significant deterioration in the mortgage market in August and particularly the pace of change in the performance of home equity loans in August, you expect charge-offs of $95 million and total provision expense of $245 million in the second half of 2007. Please address the following: |
| • | describe for us, and clarify in your September 30, 2007 Form 10-Q, the significant deterioration events that occurred during August 2007; |
| • | explain to us how those events resulted in the expected charge-off and provision amounts noted above and justify why the amounts should not have been recorded in previous periods; |
| • | explain to us how you determined the expected amounts noted above are sufficient and larger amounts are not required; and |
We believe the significant deterioration events that occurred during August 2007 were a key driver of the increase in our provision for loan losses for the third quarter of 2007. We described the reasons for this increase on pages 11 and 27 of the Form 10-Q and have included a copy of this disclosure below.
15
Provision for loan losses increased to $186.5 million and to $237.8 million for the three and nine months ended September 30, 2007, respectively, compared to the same periods in 2006. The increase in the provision for loan losses in the third quarter of 2007 was related primarily to deterioration in the performance of our home equity loan portfolio. We believe this deterioration was caused by several factors, which are described below. First, the combined impact of rising mortgage rates and home price depreciation in key markets contributed to the declining performance of our home equity loan portfolio. Second, concerns that began in the sub-prime mortgage loan market spread to the broader credit markets in the third quarter of 2007 resulting in a significant deterioration in the overall credit markets. This deterioration led to a dramatic tightening of lending standards across the industry, and general liquidity pressure for many mortgage lenders, some of whom ultimately ceased operations as a result. The factors described above dramatically reduced the ability of borrowers to refinance their mortgage loans, specifically their home equity loans, therefore drastically increasing the risk of loss once a loan becomes delinquent. During the third quarter of 2007, we also observed a decline in the percentage of delinquent loans that cure prior to charge-off or foreclosure once they have become delinquent. We attribute this change in behavior to the factors described above, which have significantly limited borrowers’ alternatives to avoid defaulting on their loans. In addition, because of the decline in value of the homes collateralizing our home equity loans, our ability to recover our investment by foreclosing on the underlying properties has diminished as well.
We note that the amounts described in the comment above are from a management forecast. Our actual results for the second half of 2007, which could differ materially, will be based on the actual performance of our loans during the second half of 2007.
The allowance for loan losses is management’s estimate of credit losses inherent in our loan portfolio as of the balance sheet date. The events that led to the large increase in the estimated losses inherent in our loan portfolio, which are described above, occurred during the third quarter of 2007; therefore we recorded the related provision during that same period.
We believe additional provisions are not required as of September 30, 2007 as we have reserved for the estimated losses inherent in the portfolio as of that date. However, as emphasized in our Form 10-Q and our 2006 Form 10-K, determining the adequacy of the allowance is complex and requires judgment by management about the effect of matters that are inherently uncertain. Subsequent evaluations of the loan portfolio, in light of the factors then prevailing, may result in significant changes in the allowance for loan losses in future periods.
| • | clarify in your September 30, 2007 Form 10-Q how the increased charge-offs and increased provision expense impacted the allowance for loan losses and related key metrics (e.g. allowance for loan losses as a |
16
percentage of total loans, and the allocation of the allowance to the HELOCs, HEILs and other portfolio, etc.) |
In response to the Staff’s comment, we included additional disclosure regarding the impact of increased charge-offs and provision expenses on our allowance for loan losses and related key metrics on pages 27-29 of the new Credit Risk Management section of our Form 10-Q. The Company supplementally advises the Staff that the presentation of such information in the Form 10-Q places one- to four-family and home equity loans in separate categories, whereas prior to September 30, 2007, the Company’s presentation combined both these types of loans within the single category “real estate loans”.
17
* * * * * * * *
We are grateful for your assistance in this matter. Please address any comments or questions with respect to the foregoing to the undersigned at (703) 236-8077.
Very truly yours, |
/s/ Arlen W. Gelbard |
Arlen W. Gelbard |
| cc: | Robert J. Simmons | |
| E*TRADE Financial Corporation | ||
| Daniel G. Kelly, Jr. | ||
| Mischa Travers | ||
| Davis Polk & Wardwell | ||
| Robert A. Crawford | ||
| Richard J. Larkworthy | ||
| Deloitte & Touche LLP | ||
18