[Letterhead of E*TRADE Financial Corporation]
February 8, 2008
VIA EDGAR SUBMISSION AND FEDERAL EXPRESS
Mr. Hugh West, Accounting Branch Chief
Ms. Sharon Blume, Staff Accountant
Mail Stop 4561
Securities and Exchange Commission
Division of Corporation Finance
100 F Street, N.E.
Washington, DC 20549
| E*TRADE Financial Corporation |
| Re: | Form 10-Q for the Fiscal Quarter Ended September 30, 2007 |
| File No. 1-11921 |
Dear Mr. West and Ms. Blume:
This letter responds to the comments of the Staff (the “Staff”) of the Securities and Exchange Commission (the “Commission”) to Robert J. Simmons, E*TRADE Financial Corporation (the “Company”) in the letter dated December 13, 2007 (the “Comment Letter”) regarding the above-referenced Form 10-Q for the Company’s fiscal quarter ended September 30, 2007.
Set forth below are the Staff’s comments (in italics) and the Company’s responses thereto, organized as set forth in the Comment Letter.
Form 10-Q for the Fiscal Quarter Ended September 30, 2007
Management’s Discussion and Analysis of Financial Condition and Results of Operations
Credit Risk Management
Lending Products and Underwriting Standards, page 25
| 1. | We read your response to our prior comment two from our letter dated October 12, 2007. We note that for originated loans, you have designed your underwriting guidelines so that your loans are salable into the secondary market. Such guidelines include limitations on loan amount, loan-to-value ratio, debt-to-income ratio, documentation type and occupancy type. Please revise your future filings to disclose the specific underwriting requirements you use when originating loans in your two main portfolios, one-to-four-family and home equity loans. Provide us with your proposed future disclosure. |
In response to the Staff’s comment, in future filings the Company will supplement the Underwriting Standards discussion in its MD&A with a table substantially to the effect of the following:
The underwriting guidelines for our major originated loan types are summarized below(1):
| First Lien – Full Documentation | First Lien – Stated Income/Stated Asset | HELOC/HEIL | ||||||||
Underwriting Requirement | Conforming(2) | Non- conforming(3) | Conforming(2) | Non- conforming(3) | ||||||
Minimum Credit Score | 620 | 620 | 680 | 680 | 640 | |||||
Maximum Debt-to-Income | 50% | 40% | 50% | 50% | 50% | |||||
Maximum CLTV | 100% | 100% | 95% | 95% | 100% | |||||
No Bankruptcy/ foreclosures | 4+ Years | 4+ Years | 4+ Years | 5+ Years | 5+ Years | |||||
(1) | The majority of loans are originated within the guidelines listed above; however, loans can be originated outside these guidelines if there are compensating factors that improve the overall credit quality of the loan (e.g. a FICO score below 620 compensated by a low CLTV). |
(2) | Conforming loans conform to the standards set forth by Fannie Mae and Freddie Mac. The single family conforming loans limit is currently $417,000. |
(3) | Non-conforming loans (or jumbo loans) have a loan amount greater than the standard set by Fannie Mae and Freddie Mac. |
2
| 2. | In addition to our comment above, please revise your future filings to disclose your underwriting policies for purchased loans as described in your response to comment three of our letter dated October 12, 2007. Disclose these policies in a separate section from underwriting policies for originated loans. Provide us with your proposed future disclosure. |
In response to the Staff’s comment, in future filings the Company will include a discussion in the Credit Risk Management section of its MD&A substantially to the effect of the following:
Our underwriting policies for purchased loans focus primarily on ensuring (i) adherence to the underwriting policies of the originator of the loan and (ii) that the loans meet certain minimum credit criteria.
In order to confirm adherence to the underwriting policies of the originator, we obtain a copy of the underwriting guidelines used to originate the loans prior to purchase. We perform an analysis on a sample of the loans to ensure compliance with these guidelines, with a focus on: appraisal methodology and type; equity methodology and calculation; debt-to-income methodology and calculation; credit characteristics, including documentation type and credit score; employment and income requirements; and the exception policy of the originator. To the extent loans do not adhere to the underwriting policies of the originator, they are excluded from the purchase.
When purchasing a portfolio of loans, our strategy is to attempt to exclude loans that we believe have a lower credit quality. We review a detailed listing of the credit characteristics of the portfolio prior to purchase and attempt to exclude lower credit quality loans. Our review criteria are not static and vary by purchase, but typically focus on excluding loans in the following categories: FICO scores below 640; combined loan-to-value ratios above 100%; debt-to-income ratios above 50%; and investor property loans. Even though our strategy focuses on excluding loans with a lower credit quality, we invariably end up purchasing an insignificant amount of loans that do not meet the credit criteria. This typically occurs in a portfolio purchase where the seller of the loans requires the purchaser of the loans to buy all loans in the pool.
3
Loan Portfolio
| 3. | Please tell us and revise your future filings to clarify whether the LTV/CLTV information presented is reflective of original LTV/CLTV ratios or if it represents current estimated LTV/CLTV ratios. Considering the decline in value of homes collateralizing your home equity loans (as you have stated on page 11,Provision for Loan Losses), it would be beneficial to investors if your disclosure included current estimated LTV/CLTV ratios compared to original LTV/CLTV ratios. Tell us if you analyze this information, at what frequency, and provide such information in a comparable tabular format. Provide us with you proposed future disclosure. |
The LTV/CLTV information presented is reflective of original LTV/CLTV ratios. We generally update home value data on nonperforming loans, primarily to assist in making foreclosure decisions and to estimate the allowance for loan losses; however, we do not track the current LTV/CLTV ratios for the entire loan portfolio.
We will include a footnote the first time LTV/CLTV information appears in the Form 10-K that states “LTV/CLTV data is based on LTV/CLTV ratios at the time of loan origination, and has not been updated to reflect changes in property values since that time.”
We do recognize that in the current credit environment, updating the LTV/CLTV ratios for our entire loan portfolio would provide useful information for both our internal credit risk management process as well as for our investors. Therefore, we have initiated a project to update this information; however we do not anticipate this project being completed in time to disclose the results in our Form 10-K for the period ended December 31, 2007.
4
| 4. | Please revise your future filings to present comparative tabular information (i.e. December 31, 2006) for LTV/CLTV and FICO score, acquisition channel and vintage year information for your one-to-four-family and home equity portfolios and discuss any significant changes. Provide us with your proposed future disclosure. |
In response to the Staff’s comment, in future filings the Company will include a discussion in its MD&A substantially to the effect of the following:
The breakdowns by LTV/CLTV and FICO score of our two main loan portfolios, one-to four-family and home equity, are as follows (dollars in thousands):
| One- to Four-Family | Home Equity | |||||||||||
LTV/CLTV | December 31, 2007 | December 31, 2006 | December 31, 2007 | December 31, 2006 | ||||||||
<=70% | $ | 6,666,212 | $ | 4,957,948 | $ | 3,628,619 | $ | 3,877,377 | ||||
70% - 80% | 8,450,977 | 5,603,921 | 2,086,277 | 2,055,692 | ||||||||
80% - 90% | 202,133 | 127,519 | 3,871,249 | 3,400,903 | ||||||||
>90% | 187,207 | 180,826 | 2,315,179 | 2,475,036 | ||||||||
Total | $ | 15,506,529 | $ | 10,870,214 | $ | 11,901,324 | $ | 11,809,008 | ||||
| One- to Four-Family | Home Equity | |||||||||||
FICO | December 31, 2007 | December 31, 2006 | December 31, 2007 | December 31, 2006 | ||||||||
>=720 | $ | 10,373,807 | $ | 7,370,649 | $ | 6,992,793 | $ | 7,058,794 | ||||
719 - 700 | 2,089,014 | 1,411,458 | 1,898,924 | 1,802,172 | ||||||||
699 - 680 | 1,585,613 | 1,073,235 | 1,668,427 | 1,434,947 | ||||||||
679 - 660 | 943,538 | 619,449 | 757,016 | 830,433 | ||||||||
659 - 620 | 503,573 | 382,033 | 566,030 | 659,063 | ||||||||
<620 | 10,984 | 13,390 | 18,134 | 23,599 | ||||||||
Total | $ | 15,506,529 | $ | 10,870,214 | $ | 11,901,324 | $ | 11,809,008 | ||||
The increases in one- to four-family loans with FICO scores above 680 were driven predominantly by the purchase of loans in those categories during the year ended December 31, 2007.
In addition to the factors described above, we monitor credit trends in loans by acquisition channel and vintage, which are summarized below as of December 31, 2007 (dollars in thousands):
| One- to Four-Family | Home Equity | |||||||||||
Acquisition Channel | December 31, 2007 | December 31, 2006 | December 31, 2007 | December 31, 2006 | ||||||||
Purchased from a third party | $ | 12,904,759 | $ | 8,679,568 | $ | 10,638,021 | $ | 10,541,250 | ||||
Originated by the Company | 2,601,770 | 2,190,646 | 1,263,303 | 1,267,758 | ||||||||
Total real estate loans | $ | 15,506,529 | $ | 10,870,214 | $ | 11,901,324 | $ | 11,809,008 | ||||
5
| One- to Four-Family | Home Equity | |||||||||||
Vintage Year | December 31, 2007 | December 31, 2006 | December 31, 2007 | December 31, 2006 | ||||||||
2003 and prior | $ | 844,670 | $ | 1,044,221 | $ | 901,240 | $ | 1,176,320 | ||||
2004 | 1,669,492 | 2,080,872 | 1,156,867 | 1,609,906 | ||||||||
2005 | 3,084,336 | 3,657,194 | 2,790,423 | 3,582,871 | ||||||||
2006 | 5,829,146 | 4,087,927 | 5,760,906 | 5,439,911 | ||||||||
2007 | 4,078,885 | — | 1,291,888 | — | ||||||||
Total real estate loans | $ | 15,506,529 | $ | 10,870,214 | $ | 11,901,324 | $ | 11,809,008 | ||||
Allowance for Loan Losses, page 26
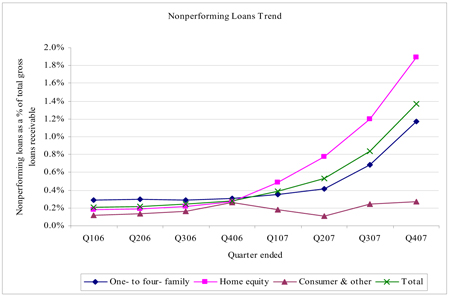
| 5. | We read your response to comments one and two from our letter dated October 12, 2007. As it relates to your discussion surrounding the increase in your allowance for loan losses (in the final paragraph on page 27), please provide us with and disclose in future filings the following: |
| • | Provide a table, similar to that provided on page 29 (net charge-offs trend) that is representative of your delinquency trends for your one- to four-family and home equity loans. In this regard, it would be useful to an investor to see such information for loans originated versus loans purchased. |
In response to the Staff’s comment, in future filings the Company will include in the Credit Risk Management section of its MD&A a chart substantially to the effect of the chart below. For reasons described in our response to Question 6, we do not believe that breaking out the data in this chart between originated and purchased loans would provide useful additional information to investors. Rather, we believe that this disclosure is more relevant and informative for investors when the data is categorized by loan type, as presented below.
6
| • | Quantify separately the impact to the allowance for loan losses that were the result of rising mortgage rates and home price depreciation. |
The increase in the allowance for loan losses due to the combined impact of rising mortgage rates and home price depreciation cannot be separately quantified. We believe that these two conditions occurring at the same time were one of the primary causes for the deterioration in our home equity loan portfolio; therefore, we cannot separately quantify the impact of these two factors.
| 6. | We noted your response to comment three from our letter dated October 12, 2007 where you indicated there are no differences in your methodology for determining the allowance for loan losses between originated and purchased loans. Please explain to us why there is not a difference here. In this regard, tell us how your allowance methodology considers inherent quality differences in originated loans versus purchased loans (e.g. the purchaser of loans has no input into the credit quality measures, individual versus pooled-loan purchases, loan administration characteristics, etc.). |
The estimate of the allowance for loan losses is based on a variety of factors, including the composition and quality of the portfolio; delinquency levels and trends; probable expected losses for the next twelve months; current and historical charge-off and loss experience; current industry charge-off and loss experience; the condition of the real estate market and geographic concentrations within the loan portfolio; the interest rate climate as it affects adjustable-rate loans; the conditions of the residential real estate and credit markets; and general economic conditions. Specific to the composition and quality of the portfolio, we consider factors such as: loan-to-value, credit score, documentation type, and occupancy type.
For purchased loans, we are generally able to obtain the data noted above in order to estimate the allowance for loan losses. We do acknowledge the possibility of inherent
7
quality differences in originated loans versus purchased loans, particularly when a loan is originated for a customer who has an existing relationship with the Company (e.g. a checking account). We believe it is possible for such a loan to perform inherently better than a loan where the customer has no other relationship with the Company (e.g. a purchased loan). However, we have not observed a pattern of inherently better credit performance for loans with borrowers who had an existing customer relationship with us when compared to loans with the same credit characteristics with borrowers who did not have such a relationship. Therefore, we do not assume originated loans perform better than purchased loans when estimating the allowance for loan losses.
Nonperforming Assets, page 29
| 7. | Considering the current instability in the residential real estate and credit markets and increasing delinquency rate trends, please tell us and revise your future filings to discuss how you mitigate losses. For example, tell us whether you provide borrowers with alternatives to foreclosure (i.e. repayment plans, forbearance agreements, loan modifications, etc.). Quantify, for each significant loan category, the total number of loans with foreclosure alternatives for each period presented. Provide us with your proposed future disclosure. |
In response to the Staff’s comment, in future filings the Company will include a discussion in the Credit Risk Management section of its MD&A substantially to the effect of the following:
Loss Mitigation
Given the deterioration in the performance of our loan portfolio, particularly in our home equity loan portfolio, we formed a special credit management team to focus on the mitigation of potential losses in the home equity loan portfolio.
This group is focused on providing loan modification alternatives to borrowers who qualify through our servicers. These programs include forbearance arrangements, rate and term modifications, re-aging programs and short sale options. To date, an insignificant number of borrowers have utilized these programs.
We are also focused on managing the exposure of undrawn home equity lines of credit. These efforts include, but are not limited to:
| • | Restricting lines of credit from additional draws when a borrower fails to make a timely payment. The criteria applied vary by loan servicer, but they generally range between 15 days past due and 30 days past due. |
| • | Additional line management strategies under development that would restrict additional draws on open lines of credit for performing loans based on a change in the property value of the |
8
collateral securing the loan, or a significant change in the borrower’s financial condition and ability to repay the loan. |
In addition, we are reviewing our purchased home equity loan portfolio in order to identify loans to be repurchased by the originator. More specifically, home equity loans that become 30 days delinquent are reviewed for early payment defaults, violations of transaction representations and warranties, or material misrepresentation on the part of the seller. Any loans identified with these deficiencies are submitted to the original seller for repurchase. Historically, the majority of these repurchase requests were honored by the original seller; however, beginning in the third quarter of 2007 our repurchase rate declined substantially.
Securities, page 30
| 8. | Please revise your future filings to provide comparative information (i.e. December 31, 2006) for average credit ratings by type of asset and discuss any significant changes. Provide us with your proposed future disclosure. |
In response to the Staff’s comment, in future filings the Company will include a discussion in its MD&A substantially to the effect of the following:
The table below details the average credit ratings by type of asset as of December 31, 2007 and 2006 (dollars in thousands):
December 31, 2007 | AA or Higher | A | BBB | Below Investment Grade | Non-Rated | Total | ||||||||||||
Mortgage-backed securities | $ | 10,896,343 | $ | 469 | $ | — | $ | — | $ | — | $ | 10,896,812 | ||||||
Asset-backed securities | — | — | — | 64 | 58 | 122 | ||||||||||||
Corporate bonds, municipal bonds and preferred stock | 1,271,105 | 8,342 | — | — | — | 1,279,447 | ||||||||||||
Total | $ | 12,167,448 | $ | 8,811 | $ | — | $ | 64 | $ | 58 | $ | 12,176,381 | ||||||
December 31, 2006 | AA or Higher | A | BBB | Below Investment Grade | Non-Rated | Total | ||||||||||||
Mortgage-backed securities | $ | 10,531,264 | $ | 3,771 | $ | 10,370 | $ | 4,800 | $ | 2,667 | $ | 10,552,872 | ||||||
Asset-backed securities | 948,309 | 780,639 | 452,992 | 22,966 | 34,159 | 2,239,065 | ||||||||||||
Corporate bonds, municipal bonds and preferred stock | 1,412,150 | 63,061 | 30,632 | — | — | 1,505,843 | ||||||||||||
Total | $ | 12,891,723 | $ | 847,471 | $ | 493,994 | $ | 27,766 | $ | 36,826 | $ | 14,297,780 | ||||||
During the year ended December 31, 2007, we sold substantially all of our asset-backed securities portfolio in connection with the Citadel transaction on November 29, 2007. This sale was the primary reason for the decline in available-for-sale securities rated below “AA”.
9
Financial Statements for the Fiscal Quarter Ended September 30, 2007
Notes to Consolidated Financial Statements
Note 9 – Asset Securitization
Collateralized Debt Obligations (“CDO”), page 60
| 9. | Please tell us the frequency of which you reconsider, and the typical triggers which require you to reconsider, whether you are the primary beneficiary of each of your CDO entities under FIN 46-R. |
As of December 31, 2007, there were five outstanding CDOs issued by the Company (CDOs I, III, VI, V and VI; CDO II was called on November 1, 2006) with a combined fair value of approximately $100,000. CDOs I and III are static CDOs involving qualifying special purpose entities (QSPEs) and, therefore, are not subject to the consolidation requirements of FASB Interpretation No. 46 (Revised 2003),Consolidation of Variable Interest Entities-an interpretation of ARB No. 51 (“FIN 46(R)”). CDOs IV-VI are managed CDOs involving special purpose entities that are subject to the consolidation criteria of FIN 46(R). However, when those CDOs were issued, the Company determined that it was not the primary beneficiary and did not have to consolidate the CDOs. The Company purchased only 20% of the equity interests (i.e., preference shares) in CDOs IV-VI and as Collateral Manager has the right to receive collateral management fees under each deal. However, for each CDO, it was determined that the Company did not have a variable interest that would absorb a majority of the entity’s expected losses. Since the issuance of CDOs IV-VI there have been no triggering events pursuant to paragraphs 7 and 15 of FIN 46(R) that would require reconsideration as to whether the Company is the primary beneficiary. Paragraph 7 states the following:
An entity that previously was not subject to this Interpretation shall not become subject to it simply because of losses in excess of its expected losses that reduce the equity investment. The initial determination of whether an entity is a variable interest entity shall be reconsidered if one or more of the following occur:
a. The entity’s governing documents or contractual arrangements are changed in a manner that changes the characteristics or adequacy of the entity’s equity investment at risk.
b. The equity investment or some part thereof is returned to the equity investors, and other interests become exposed to expected losses of the entity.
c. The entity undertakes additional activities or acquires additional assets, beyond those that were anticipated at the later of the inception of the entity or the latest reconsideration event, that increase the entity’s expected losses.
10
d. The entity receives an additional equity investment that is at risk, or the entity curtails or modifies its activities in a way that decreases its expected losses.
Paragraph 15 states the following:
An enterprise with an interest in a variable interest entity shall reconsider whether it is the primary beneficiary of the entity if the entity’s governing documents or contractual arrangements are changed in a manner that reallocates between the existing primary beneficiary and other unrelated parties (a) the obligation to absorb the expected losses of the variable interest entity or (b) the right to receive the expected residual returns of the variable interest entity. The primary beneficiary also shall reconsider its initial decision to consolidate a variable interest entity if the primary beneficiary sells or otherwise disposes of all or part of its variable interests to unrelated parties or if the variable interest entity issues new variable interests to parties other than the primary beneficiary or the primary beneficiary’s related parties. A holder of a variable interest that is not the primary beneficiary also shall reconsider whether it is the primary beneficiary of a variable interest entity if that enterprise acquires additional variable interests in the variable interest entity.
None of the above triggering events has occurred with respect to CDOs IV-VI.
Notwithstanding the above, during the fourth quarter of 2007, the Company reached an agreement in terms to sell all of its residual interests in the CDOs as well as the collateral management agreements under which they serve as Collateral Manager to a third party. The closing of this sale is expected to occur in February 2008.
| 10. | Please tell us whether recent market volatility impacted your calculations of expected benefits or losses when determining whether you are the primary beneficiary each of your CDO entities. For example, if you changed your valuation methodology for determining the value of the collateral of the CDOs during the quarter, describe the change and explain how it impacted the amounts of portfolio management fees you expect to receive. |
As noted above, the Company owns 20% of the preference shares of each of CDOs IV-VI as well as the right to receive the collateral management fees as Collateral Manager of each deal. In the review of each of the CDOs in question, it was determined that the Company was not the primary beneficiary. Since the initial determination, there have been no triggering events in accordance with paragraphs 7 and 15 of FIN 46(R) that would alter the conclusions reached from the initial review of the CDOs regarding the primary beneficiary nor have there been any triggering events that would warrant a reconsideration of the primary beneficiary. Although the deterioration of the collateral backing CDOs IV-VI had the effect of decreasing the Company’s collateral management fees, such decrease was not significant enough to result in the Company absorbing a majority of the entity’s expected losses.
11
Item 1A – Risk Factors, page 77
| 11. | We note your disclosure that the recent market volatility has made it extremely difficult to value certain of your securities, particularly your CDO and second lien mortgage-backed assets. Please tell us whether you changed the method in which you were valuing these securities during the quarter as compared to the prior quarter. If so, please provide us with the following additional information: |
| • | tell us why you changed your valuation methodology; |
| • | provide us with a description of the method used historically; |
| • | provide us with a description of the method used during the current period; and |
| • | tell us whether you would have obtained significantly different results had you continued to use the same methodology historically used (quantify amounts in your response, if possible). |
The Company did not change the valuation methodology for these securities for any period during 2007. The methodology for valuing securities is a tiered approach, beginning with obtaining market prices for each security from third parties. If it is not possible to obtain market prices for certain securities, the Company attempts to obtain prices for similar securities, again from third parties. If it is not possible to obtain third party prices, either for the exact or a similar security, the Company derives a price using a cash flow model. The models use observable market inputs, if available. If it is not possible to obtain observable market inputs, the inputs are derived from other market inputs and/or historical trends.
During the third quarter of 2007, market prices for our asset-backed securities portfolio became increasingly difficult to obtain from third parties. As such, the Company was forced to rely more on market prices for similar securities and internal models when valuing securities compared to recent prior quarters.
In addition, please note that the Company sold all of the securities referenced by this disclosure during the fourth quarter of 2007.
Form 8-K filed December 4, 2007
| 12. | We note the arrangements discussed in your Form 8-K (“Citadel Investment Agreement” and “Blackrock Purchase Agreement”) involves multiple elements. Please tell us how you plan to account for this transaction. |
The transaction resulted in the Company receiving $2.5 billion in proceeds primarily in consideration for the following elements:
12
• | Sale of the entire ABS portfolio(1) (approximately $3 billion in amortized cost); |
| • | Exchange of $186 million of existing senior notes held by Citadel for $186 million of 12.5% Springing Lien Notes; |
| • | Issuance of $1.75 billion in 12.5% Springing Lien Notes; |
| • | Issuance of approximately 84.7 million shares of the Company’s common stock; and |
| • | An agreement to route customers’ equity and option orders to the Citadel for order handling and execution for a term of three years. |
The Company looked to numerous pieces of distinct accounting literature which could collectively be used to determine the appropriate accounting for this transaction.
The transaction contained multiple elements which were negotiated and transacted simultaneously and in contemplation of one another. Considering EITF Issue No. 00-21: Revenue Arrangements with Multiple Deliverables,Derivatives Implementation Group Issue No. K1, Miscellaneous:Determining Whether Separate Transactions Should Be Viewed as a Unit,and APB No. 14,Accounting for Convertible Debt and Debt Issued with Stock Purchase Warrants, we concluded that transaction should be viewed as an integrated transaction (with each element representing a separate unit of account) and that the proceeds should be allocated to each element based on their relative fair value at the time of the transaction.
The fair values used to allocate the proceeds were estimated as follows:
| • | Asset-backed securities – As noted in our response to Question 11, recent market volatility made it extremely difficult to value our asset-backed securities. However, we were able to obtain certain third party data to assist in this allocation. The fair value was based on market participant bids for our portfolio, as well as a valuation estimate specific to our securities from a third party. |
| • | Common Stock – The fair value of the common stock issued to Citadel was based on the Company’s closing price of common stock on November 28, 2007 (the day prior to the announcement of the transaction as the transaction was signed and announced prior to the open of market trading on November 29, 2007). |
| • | Springing Lien Notes – The fair value of the springing lien notes was based on an internal analysis of fair value, which included external prices for similar securities as well as a market based estimate from a third party. |
(1) | The ABS Sale meets the definition of a sale as described in FASB Statement No. 140,Accounting for Transfers and Servicing of Financial Assets and Extinguishments of Liabilities, a replacement of FASB Statement 125. |
13
The Springing Lien Notes contained embedded derivatives that were bifurcated in accordance with paragraph 12 of SFAS No. 133,Accounting for Derivative Instruments and Hedging Activities (“FAS 133”), resulting in an additional discount to the Springing Lien Notes. Any subsequent gains or losses on the two embedded derivatives will be recognized through earnings in accordance with paragraph 18 of FAS 133.
In summary and based on the above, the key components of the Company’s accounting for this transaction were as follows:
| • | ABS Sale – Loss on the sale of ABS of approximately $2.2 billion (pre-tax); |
| • | Common Stock – increase to common stock/paid in capital of approximately $330 million; and |
| • | Springing Lien Notes – assigned approximately $500 million of discount to the springing lien notes, which will be amortized as an increase to interest expense using the effective interest method over the 10 year term of the notes. |
14
* * * * * * * *
We are grateful for your assistance in this matter. Please address any comments or questions with respect to the foregoing to the undersigned at (703) 236-8077.
Very truly yours,
|
/s/ Arlen W. Gelbard Arlen W. Gelbard |
| cc: | Robert J. Simmons |
| E*TRADE Financial Corporation |
| Daniel G. Kelly, Jr. |
| Mischa Travers |
| Davis Polk & Wardwell |
| Robert A. Crawford |
| Richard J. Larkworthy |
| Deloitte & Touche LLP |
15