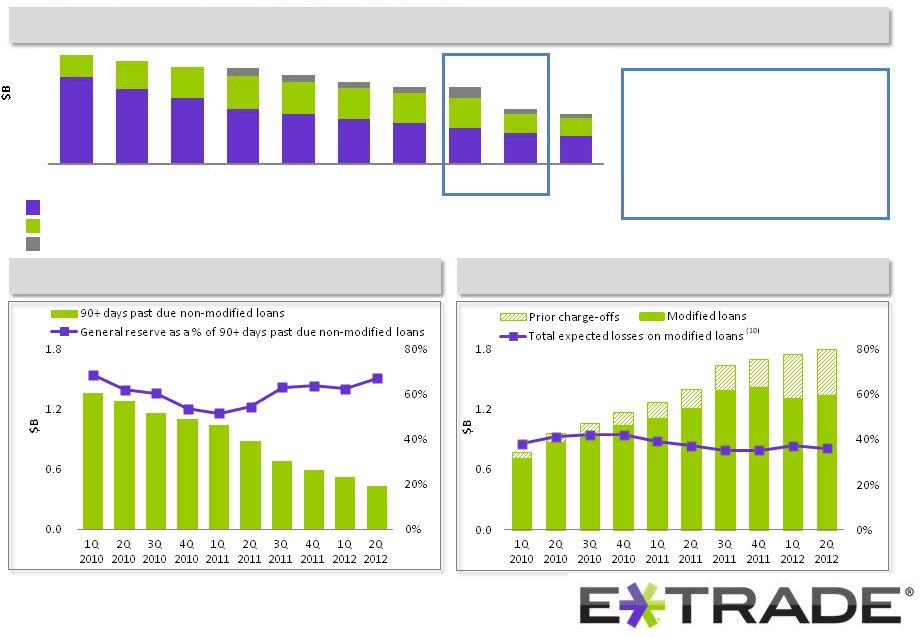
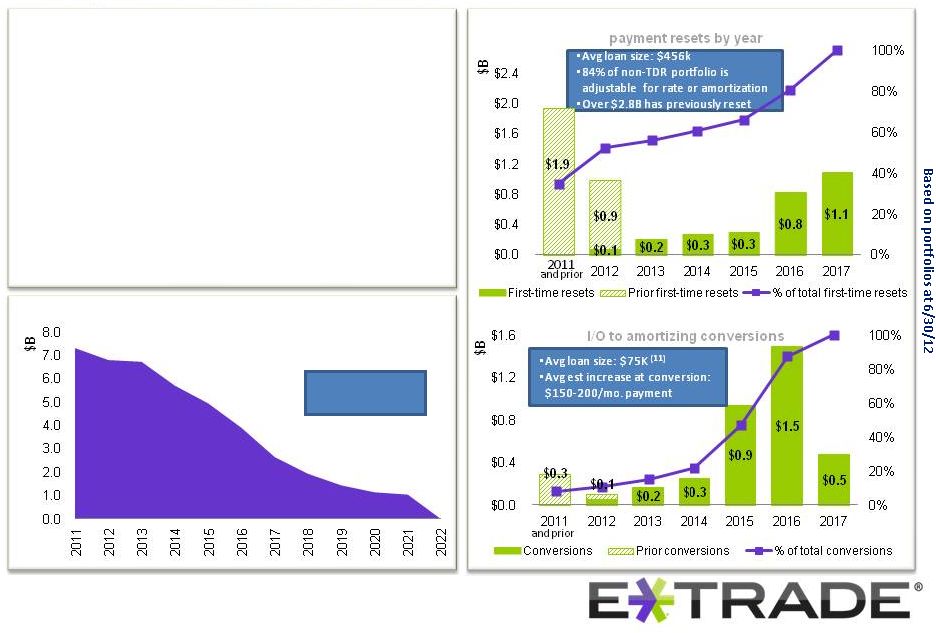
© 2012 E*TRADE FINANCIAL Corp. All rights reserved. This presentation contains confidential information and may not be disclosed without E*TRADE FINANCIAL Corporation’s written permission. 22 Appendix FY 2009 Net loss (1,297,762) $ Add back: non-cash charge on Debt Exchange 772,908 Adjusted net loss (524,854) $ The fund's prospectus contains its investment objectives, risks, charges, expenses and other important information and should be read and considered carefully before investing. For a current prospectus, visit www.etrade.com Explanation of Non-GAAP Measures and Certain Metrics Management believes that Bank earnings before taxes and before credit losses and E*TRADE Financial ratios are appropriate measures for evaluating the operating and liquidity performance of the Company. Management believes that adjusting GAAP measures by excluding or including certain items from the related GAAP measures is helpful to investors and analysts who may wish to use some or all of this information to analyze our current performance, prospects and valuation. Management uses non-GAAP information internally to evaluate our operating performance in formulating our budget for future periods. (1) Excludes impact of the debt exchange. In the third quarter of 2009, the Company exchanged $1.7 billion aggregate principal amount of interest-bearing corporate debt for an equal principal amount of newly-issued non-interest-bearing convertible debentures. This Debt Exchange resulted in a non-cash charge of $723 million. The following table provides a reconciliation of GAAP net loss to non-GAAP net loss for FY2009: (2) The parent total capital to risk-weighted assets, Tier 1 capital to risk-weighted assets and Tier 1 leverage capital ratios are based on the Federal Reserve regulatory minimum well-capitalized threshold, although the parent is not currently subject to capital requirements. See the Company’s Form 10-Q filed August 3, 2012 for a reconciliation of those non-GAAP measures to the comparable GAAP measures. (3) The parent Tier 1 common ratio is Tier 1 capital less elements of Tier 1 capital that are not in the form of common equity, such as trust preferred securities, divided by total risk-weighted assets for the holding company. The holding company is not yet held to the capital requirements; as such, the 7.0% well-capitalized threshold is not based on regulatory guidance. See the Company’s Form 10-Q filed August 3, 2012 for a reconciliation of the non-GAAP measure of Tier 1 common ratio to the comparable GAAP measure. (a) Attriting brokerage accounts: Gross new brokerage accounts, less net new brokerage accounts. (5) The net new brokerage assets metrics treat asset flows between E*TRADE entities in the same manner as unrelated third party accounts. (6) Average brokerage assets per account is calculated as the sum of security holdings and brokerage related cash divided by end of period brokerage accounts. (7) Based on data as of 6/30/12. (8) Represents unpaid principal balances. (9) Net paydowns includes paydowns on loans as well as limited origination activity, home equity advances, repurchase activity, limited sale and securitization activities and transfers to real estate owned assets. (10) The total expected losses on TDRs includes both the previously recorded charge-offs and the specific valuation allowance. (11) Excludes $0 balance home equity lines of credit. annualized basis (where it appears quarterly). (4) The attrition rate is calculated by dividing attriting brokerage accounts, by total brokerage accounts, for the previous period end. This measure is presented annually and on an (a) |