OMB APPROVAL
OMB Number: 3235-0570
Expires: August 31, 2011
Estimated average burden hours per response: 18.9
UNITED STATES
SECURITIES AND EXCHANGE COMMISSION
Washington, D.C. 20549
FORM N-CSR
CERTIFIED SHAREHOLDER REPORT OF
REGISTERED MANAGEMENT INVESTMENT COMPANIES
Investment Company Act file number: 811-07651
ING Variable Portfolios, Inc.
(Exact name of registrant as specified in charter)
7337 E. Doubletree Ranch Rd., Scottsdale, AZ | | 85258 |
(Address of principal executive offices) | | (Zip code) |
The Corporation Trust Incorporated, 300 E. Lombard Street, Baltimore, MD 21201
(Name and address of agent for service)
Registrant’s telephone number, including area code: 1-800-992-0180
Date of fiscal year end: | December 31 |
| |
Date of reporting period: | January 1, 2010 to December 31, 2010 |
ITEM 1. REPORTS TO STOCKHOLDERS.
The following is a copy of the report transmitted to stockholders pursuant to Rule 30e-1 under the Act (17 CFR 270.30e-1):

Annual Report
December 31, 2010
Classes ADV, I, S and S2
ING Variable Product Funds
Domestic Equity and Income Portfolios
n ING Balanced Portfolio
n ING Growth and Income Portfolio
Domestic Equity Growth Portfolio
n ING Small Company Portfolio
Fixed-Income Portfolios
n ING Intermediate Bond Portfolio
n ING Money Market Portfolio
Global Equity Portfolio
n ING BlackRock Science and Technology Opportunities Portfolio
This report is submitted for general information to shareholders of the ING Funds. It is not authorized for distribution to prospective shareholders unless accompanied or preceded by a prospectus which includes details regarding the funds' investment objectives, risks, charges, expenses and other information. This information should be read carefully.
MUTUAL FUNDS

TABLE OF CONTENTS
| President's Letter | | | 1 | | |
|
| Market Perspective | | | 2 | | |
|
| Portfolio Managers' Reports | | | 4 | | |
|
| Shareholder Expense Examples | | | 15 | | |
|
| Report of Independent Registered Public Accounting Firm | | | 17 | | |
|
| Statements of Assets and Liabilities | | | 18 | | |
|
| Statements of Operations | | | 22 | | |
|
| Statements of Changes in Net Assets | | | 24 | | |
|
| Financial Highlights | | | 27 | | |
|
| Notes to Financial Statements | | | 30 | | |
|
| Summary Portfolios of Investments | | | 50 | | |
|
| Tax Information | | | 93 | | |
|
| Director/Trustee and Officer Information | | | 94 | | |
|
| Advisory Contract Approval Discussion | | | 99 | | |
|
PROXY VOTING INFORMATION
A description of the policies and procedures that the Portfolios use to determine how to vote proxies related to portfolio securities is available: (1) without charge, upon request, by calling Shareholder Services toll-free at (800) 992-0180; (2) on the ING Funds' website at www.ingfunds.com; and (3) on the U.S. Securities and Exchange Commission's (the "SEC") website at www.sec.gov. Information regarding how the Portfolios voted proxies related to portfolio securities during the most recent 12-month period ended June 30 is available without charge on the ING Funds' website at www.ingfunds.com and on the SEC's website at www.sec.gov.
QUARTERLY PORTFOLIO HOLDINGS
The Portfolios file their complete schedule of portfolio holdings with the SEC for the first and third quarters of each fiscal year on Form N-Q. This report contains a summary portfolio of investments for certain Portfolios. The Portfolios' Forms N-Q are available on the SEC's website at www.sec.gov. The Portfolios' Forms N-Q may be reviewed and copied at the SEC's Public Reference Room in Washington, DC, and information on the operation of the Public Reference Room may be obtained by calling (800) SEC-0330. The Portfolios' Forms N-Q, as well as a complete portfolio of investments, are available without charge upon request from the Portfolios by calling Shareholder Services toll-free at (800) 992-0180.
PRESIDENT'S LETTER

Big Picture vs. Details
Dear Shareholder,
On January 25, 2011, President Obama delivered his second State of the Union address. He called on Americans to put aside partisan differences and harness the nation's creativity to adapt and thrive in a rapidly changing global economy. The president's challenge is timely: the United States is approaching a nexus of intermediate- and long-term concerns, and the choices we make over the next two years could determine the nation's competitiveness in the global economy for decades to come.
There are reasons to be optimistic — the International Monetary Fund ("IMF") predicts the U.S. economy will grow about 3% in 2011. China and India are expected to grow at about 9% and even the euro zone appears to be recovering from crisis; this growth, however, is being accompanied by mounting inflation pressures in certain regions, suggesting that many economies are expanding at unsustainable rates.
As I write this, the World Economic Forum is getting underway in Davos, Switzerland, and there are numerous concerns to deal with. Chief among them are the still-present risk of sovereign debt defaults in the euro zone; high unemployment and banking problems in the advanced economies; and inflationary pressures in emerging markets, especially with regard to food, fuel and commodities.
As we've noted before, uncertainty is a defining characteristic of our age and, in our opinion, is likely to remain so beyond this year. How should you respond within your investment portfolio? Remember that the most important consideration is your long-term goals, not the outlook for 2011. With investment hazards and opportunities everywhere, we believe it makes sense to cast as broad a net as possible around the globe. In our opinion, you want your portfolio to be well diversified so that it is not harmed too much by the trouble spots, and has some exposure to positive trends.
As always, we believe the best approach is a well-diversified portfolio and a well-defined investment plan. As we've noted many times before, it's important to discuss any proposed changes thoroughly with your advisor before taking any action. Thank you for your continued confidence in ING Funds. We look forward to serving your investment needs in the future.
Sincerely,

Shaun Mathews
President and Chief Executive Officer
ING Funds
January 26, 2011
The views expressed in the President's Letter reflect those of the President as of the date of the letter. Any such views are subject to change at any time based upon market or other conditions and ING Funds disclaims any responsibility to update such views. These views may not be relied on as investment advice and because investment decisions for an ING Fund are based on numerous factors, may not be relied on as an indication of investment intent on behalf of any ING Fund. Reference to specific company securities should not be construed as recommendations or investment advice.
International investing poses special risks including currency fluctuation, economic and political risks not found in investments that are solely domestic.
1
MARKET PERSPECTIVE: YEAR ENDED DECEMBER 31, 2010
In our semi-annual report we described how, after a 13-month advance through mid-April, a confluence of local and world issues sent global equities, in the form of the MSCI World IndexSM measured in local currencies, including net reinvested dividends ("MSCI" for regions discussed below), reeling to a loss for the first half of the fiscal year. In the second half of the year, the MSCI World IndexSM bounced back and for 2010 returned 10.01%. (The MSCI World IndexSM returned 11.76% for the one year ended December 31, 2010, measured in U.S. dollars.) By year end, investor sentiment had turned distinctly positive, despite the grave concerns that remained.
It was a bumpy ride. Markets from stocks to bonds to currencies were continually buffeted by news and events relating to three main themes: the stuttering U.S. economic recovery, the sovereign debt crisis in the Eurozone and growth dynamics in China.
In the U.S., quarterly gross domestic product ("GDP") growth decelerated from 2.7% (annualized) in the first quarter of 2010 to 1.7% in the second, before recovering to 2.6% in the third. But attention was focused more on employment and housing. The 18-month recession which ended in June of 2009 had cost some 8.7 million jobs. But since then, the unemployment rate had been stuck between 9.4% and 10.1%, barely dented by private sector new jobs averaging 107,000 per month as 2010 ended.
The other weakening link was housing. Sales of new and existing homes collapsed after the expiry in April of a program of tax credits for home buyers and languished thereafter. House prices (based on the S&P/Case-Shiller 20-City Composite Home Price Index), having shown annual increases from February, resumed a downward trend in October with the index still 30% below the peak recorded in April 2006.
To be sure, there were some grounds for optimism as 2010 drew to a close. Consumer spending had risen for five straight months. Investment in equipment and software was growing at double-digit annual percentage rates. On December 30, new unemployment claims were reported below 400,000 for the first time since July 2008. The Federal Reserve in November announced a second round of quantitative easing and would buy $600 billion in Treasury notes and bonds. The mixed mid-term election results forced a "compromise" stimulus package worth an estimated $858 billion for 2011. In combination, these two measures increased the attractiveness of riskier asset classes like equities at the expense of high grade bonds, which sold off.
In the Eurozone, after default was narrowly averted on Greece's maturing bonds, the creation in May of a European Financial Stabilization "mechanism", funded with up to €750 billion seemed to calm nerves for a while. But in October, attention turned to Ireland, where the Irish government had injected huge sums into local banks, rendering its own fiscal position untenable. The November 29, 2010 European Union/International Monetary Fund bail-out worth €67.5 billion left markets unimpressed. Suddenly it was May again with downgrades, soaring yields on peripheral Eurozone bonds, fears of contagion, falling stock markets and doubts about the viability of the euro itself. The European Central Bank aggressively bought sovereign bonds and the mood settled. But with Spain's banks needing to refinance €85 billion of debt in 2011, the issue remains unresolved.
Investors watched nervously as China, the source of much of the world's growth, wrestled with inflation, which reached 5.1% in November, and a housing bubble. The authorities tightened mortgage requirements, raised banks' reserve ratio requirements six times in 2010 and interest rates twice in the last quarter. More interest rate increases seem inevitable.
In U.S. fixed income markets, the Barclays Capital U.S. Aggregate Bond Index of investment grade bonds returned 6.54% in 2010. A slight balance towards risk aversion in the first half gave way to improved risk appetite in the second. For the whole year, the Barclays Capital U.S. Treasury index returned 5.87%, underperforming the Barclays Capital Corporate Investment Grade Bond Index with a return of 9.00%, but both fell well short of the Barclays Capital High Yield Bond — 2% Issuer Constrained Composite Index which gained 14.94% for the one year period.
U.S. equities, represented by the S&P 500® Index including dividends, rose 15.06% in 2010, including its best September, a return of 8.92%, since 1939 and best December, a return of 6.68%, since 1991. Prices were supported by strong earnings reports, with operating earnings per share for S&P 500® companies recording four straight quarters of annual growth. Equities also benefited from improved risk appetite through the quantitative easing initiative and stimulus package referred to above.
In currencies, the worst of the gloom about the Eurozone in early June was replaced by renewed pessimism about the dollar in a stalling economy, before markets were seized by another bout of Eurozone angst. For the year, the dollar gained 8.15% against the euro and 2.95% against the pound, but lost 11.59% to the yen, which was sold in the market by the Bank of Japan after breaching 15-year high levels.
In international markets, the MSCI Japan® Index returned just 0.57% for the year after a strong last quarter, as quarterly GDP growth bounced back to 1.1% and the yen retreated from multi-year peaks. The tone of the market was generally poor with household spending fragile and consumer prices down for 21 months. The MSCI Europe ex UK® Index returned 4.84%, with Germany up 15.97% and Portugal, Italy, Ireland, Greece and Spain all falling. This broadly reflected the two-tier economy that has developed, with economic statistics favoring more soundly based countries at the expense of the peripherals. The MSCI UK® Index advanced 12.18%, despite the prospect of severe public spending cuts intended to eliminate an 11% budget deficit. Supporting sentiment was resilient, if perhaps temporary, quarterly GDP growth averaging 0.9% in the second half of the year.
Parentheses denote a negative number.
All indices are unmanaged and investors cannot invest directly in an index. Past performance does not guarantee future results. The performance quoted represents past performance. Investment return and principal value of an investment will fluctuate, and shares, when redeemed, may be worth more or less than their original cost. The Portfolios' performance is subject to change since the period's end and may be lower or higher than the performance data shown. Please call (800) 992-0180 or log on to www.ingfunds.com to obtain performance data current to the most recent month end.
Market Perspective reflects the views of ING's Chief Investment Risk Officer only through the end of the period, and is subject to change based on market and other conditions.
2
BENCHMARK DESCRIPTIONS
| Index | | Description | |
| MSCI World IndexSM | | An unmanaged index that measures the performance of over 1,400 securities listed on exchanges in the U.S., Europe, Canada, Australia, New Zealand and the Far East. | |
|
| S&P/Case-Shiller 20-City Composite Home Price Index | | A composite index of the home price index for the top 20 Metropolitan Statistical Areas in the United States. The index is published monthly by Standard & Poor's. | |
|
| Barclays Capital U.S. Aggregate Bond Index | | An unmanaged index of publicly issued investment grade U.S. Government, mortgage-backed, asset-backed and corporate debt securities. | |
|
| Barclays Capital U.S. Treasury Index | | An unmanaged index that includes public obligations of the U.S. Treasury. Treasury bills, certain special issues, such as state and local government series bonds (SLGs), as well as U.S. Treasury TIPS and STRIPS, are excluded. | |
|
| Barclays Capital Corporate Investment Grade Bond Index | | The corporate component of the Barclays Capital U.S. Credit Index. The U.S. Credit Index includes publicly-issued U.S. corporate and specified foreign debentures and secured notes that meet the specified maturity, liquidity, and quality requirements. The index includes both corporate and non-corporate sectors. The corporate sectors are industrial, utility and finance, which includes both U.S. and non-U.S. corporations. | |
|
| Barclays Capital High Yield Bond — 2% Issuer Constrained Composite Index | | An unmanaged index that includes all fixed income securities having a maximum quality rating of Ba1, a minimum amount outstanding of $150 million, and at least one year to maturity. | |
|
| S&P 500® Index | | An unmanaged index that measures the performance of securities of approximately 500 large-capitalization companies whose securities are traded on major U.S. stock markets. | |
|
| MSCI Japan® Index | | A free float-adjusted market capitalization index that is designed to measure developed market equity performance in Japan. | |
|
| MSCI Europe ex UK® Index | | A free float-adjusted market capitalization index that is designed to measure developed market equity performance in Europe, excluding the UK. | |
|
| MSCI UK® Index | | A free float-adjusted market capitalization index that is designed to measure developed market equity performance in the UK. | |
|
| S&P Target Risk Growth Index | | Seeks to provide increased exposure to equities, while also using some fixed-income exposure to dampen risk. | |
|
| Russell 2000® Index | | An unmanaged index that measures the performance of securities of small U.S. companies. | |
|
| iMoneyNet First Tier Retail Index | | An unmanaged index that includes the most broadly based money market funds. | |
|
| NYSE Arca Tech 100 Index | | A multi-industry technology index measuring the performance of companies using technology innovation across a broad spectrum of industries. It is comprised of 100 listed and over-the-counter stocks from 14 different subsectors including computer hardware, software, semiconductors, telecommunications, data storage and processing, electronics and biotechnology. | |
|
3
ING BALANCED PORTFOLIO
PORTFOLIO MANAGERS' REPORT
ING Balanced Portfolio (the "Portfolio") seeks total return consisting of capital appreciation (both realized and unrealized) and current income; the secondary investment objective is long-term capital appreciation. The Portfolio is managed by Christine Hurtsellers, Paul Zemsky, Heather Hackett and Christopher Corapi, Portfolio Managers, of ING Investment Management Co. — the Sub-Adviser.*
Performance: For the year ended December 31, 2010, the Portfolio's Class I shares provided a total return of 14.22% compared to the S&P Target Risk Growth Index and the ING Balanced Portfolio Composite Index (29% S&P 500 Index; 8% S&P MidCap 400 Index; 18% MSCI EAFE Index; 5% MSCI Emerging Markets Index; 40% Barclays Capital Global Aggregate Bond Index) which returned 11.18% and 11.37%, respectively, for the same period.
Portfolio Specifics(1): On April 30, 2010, the Portfolio changed its benchmark indices from the S&P 500® Index and the Barclays Capital U.S. Aggregate Bond Index to the S&P Target Risk Growth Index because the adviser considers the S&P Target Risk Growth Index to be a more appropriate benchmark index, as it reflects the types of securities in which the Portfolio invests.
From the beginning of the period through April 30, 2010, allocation and stock selection effects were both positive compared to the Composite Index. Our average underweight to fixed income contributed to performance. Strong stock selection helped performance in all asset classes including the large-, mid- and small-capitalization stocks; bonds also contributed to results.
When the Portfolio switched benchmarks as of May 1, 2010, we began to switch its investments as well. The Portfolio's investments in large- and mid-cap enhanced index funds were replaced by investments in fundamental equity funds in May. Small-cap exposure was eliminated and international exposure was added through developed international markets and emerging markets. From May 1, 2010 through the end of the year, allocation effect was slightly negative compared to the Composite Index. U.S. stock selection was favorable overall, especially within mid-cap equities. Stock selection within international equities detracted from performance. We added global bonds to the Portfolio's fixed income allocation in May; this strategic change had a neutral asset allocation effect compared to the Composite Index. On a total return basis, global bonds outperformed core bonds benefiting the Portfolio.
As we entered 2010, our assessment of the U.S. economy and financial markets suggested that equities were attractive. In particular, we believed that markets were too skeptical about the sustainability and magnitude of economic recovery in the Unites States and around the world. This skepticism meant that consensus earnings estimates for U.S. and global stocks were probably too low. In January, we moved to an overweight position in large-cap core U.S. stocks and an underweight in fixed income. On average, we remained tactically bullish and more optimistic than the consensus about cyclical economic prospects for the U.S. and world economies throughout the year.
While the capital markets activity, bank lending and other financial processes slowly and unevenly moved back to normal, they remained under pressure and sensitive to shifts in the outlook. Therefore, we made tactical moves back to a neutral asset allocation stance, reversing the equity overweight at different key points throughout the year. For example, in spring the heightened risk of a sovereign debt crisis affecting Greece, and other highly indebted European countries such as Portugal, seemed likely to offset positive economic and earnings news in the short term. Spreads on risky assets widened, inter-bank lending contracted and stock markets declined as this reappraisal of risk continued. Eventually, the Eurozone governments, the European Central Bank and the International Monetary Fund made an aggressive policy response stemming the nearly panic conditions that had emerged on global markets and providing near-term stability to European bond markets and to the euro exchange rate.
Current Strategy and Outlook: We continue to see the overall economic environment of the U.S. economy developing in the direction of a sustainable recovery through an expansion driven more broadly by final demand. U.S. economic data have turned relatively more positive with the Purchasing Managers' Index, initial jobless claims, and retail sales data suggesting that the economy is gaining momentum. U.S. monetary and fiscal policies remain stimulative. We believe the extension of the Bush tax cuts along with the large scale Treasury purchases by the U.S. Federal Reserve should provide additional stimulus via consumer spending and stable interest rates.
Investment Type Allocation
as of December 31, 2010
(as a percent of net assets)
| Common Stock | | | 56.1 | % | |
| Corporate Bonds/Notes | | | 13.6 | % | |
| U.S. Government Agency Obligations | | | 8.2 | % | |
| U.S. Treasury Obligations | | | 6.7 | % | |
| Exchange-Traded Funds | | | 5.1 | % | |
| Collateralized Mortgage Obligations | | | 4.9 | % | |
| Asset-Backed Securities | | | 3.5 | % | |
| Other Bonds | | | 3.2 | % | |
| Municipal Bonds | | | 0.1 | % | |
| Preferred Stock | | | 0.1 | % | |
| Real Estate Investment Trusts | | | 0.1 | % | |
| Positions in Purchased Options | | | 0.0 | % | |
| Other Assets and Liabilities — Net* | | | (1.6 | )% | |
| Net Assets | | | 100.0 | % | |
* Includes short-term investments related to Blackrock Liquidity Funds TempFund Portfolio — Class I and securities lending collateral.
Portfolio holdings are subject to change daily.
Top Ten Holdings*
as of December 31, 2010
(as a percent of net assets)
| Vanguard Emerging Markets ETF | | | 4.5 | % | |
| ExxonMobil Corp. | | | 1.5 | % | |
| Apple, Inc. | | | 1.3 | % | |
| U.S. Treasury Note, 0.625%, due 12/31/12 | | | 1.2 | % | |
| Microsoft Corp. | | | 1.2 | % | |
| U.S. Treasury Note, 3.875%, due 08/15/40 | | | 1.2 | % | |
| JPMorgan Chase & Co. | | | 1.0 | % | |
| Wells Fargo & Co. | | | 1.0 | % | |
| Qualcomm, Inc. | | | 0.9 | % | |
| Wal-Mart Stores, Inc. | | | 0.9 | % | |
* Excludes short-term investments related to Blackrock Liquidity Funds TempFund Portfolio — Class I and securities lending collateral.
Portfolio holdings are subject to change daily.
* Effective April 30, 2010, Vincent Costa and Michael Hyman were removed as portfolio managers to the Portfolio and Heather Hackett and Christopher Corapi were added as portfolio managers to the Portfolio.
(1) Effective April 30, 2010, the Portfolio changed from a quantitatively oriented allocation to a fundamental one.
Portfolio holdings and characteristics are subject to change and may not be representative of current holdings and characteristics. The outlook for this Portfolio may differ from that presented for other ING Funds. Performance for the different classes of shares will vary based on differences in fees associated with each class.
4
ING BALANCED PORTFOLIO
PORTFOLIO MANAGERS' REPORT

| Average Annual Total Returns for the Periods Ended December 31, 2010 | |
| | | 1 Year | | 5 Year | | 10 Year | | Since Inception
of Class S
May 29, 2003 | |
| Class I | | | 14.22 | % | | | 2.60 | % | | | 2.85 | % | | | — | | |
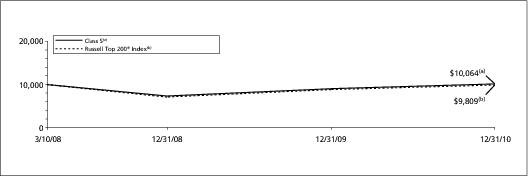
| Class S | | | 13.87 | % | | | 2.32 | % | | | — | | | | 4.58 | % | |
| S&P Target Risk Growth Index | | | 11.18 | % | | | — | | | | — | | | | — | | |
| ING Balanced Portfolio Composite Index | | | 11.37 | % | | | 5.37 | % | | | 5.53 | % | | | 7.85 | %(1) | |
Based on a $10,000 initial investment, the graph and table above illustrate the total return of ING Balanced Portfolio against the indices indicated. An index has no cash in its portfolio, imposes no sales charges and incurs no operating expenses. An investor cannot invest directly in an index. The Portfolio's performance is shown without the imposition of any expenses or charges which are, or may be, imposed under your annuity contract. Total returns would have been lower if such expenses or charges were included.
The performance graph and table do not reflect the deduction of taxes that a shareholder will pay on portfolio distributions or the redemption of portfolio shares.
The performance shown may include the effect of fee waivers and/or expense reimbursements by the Investment Adviser and/or other service providers, which have the effect of increasing total return. Had all fees and expenses been considered, the total returns would have been lower.
The performance update illustrates performance for a variable investment option available through a variable annuity contract. The performance shown indicates past performance and is not a projection or prediction of future results. Actual investment returns and principal value will fluctuate so that shares and/or units, at redemption, may be worth more or less than their original cost. Please call (800) 992-0180 to get performance through the most recent month end.
This report contains statements that may be "forward-looking" statements. Actual results may differ materially from those projected in the "forward-looking" statements.
The views expressed in this report reflect those of the portfolio managers, only through the end of the period as stated on the cover. The portfolio managers' views are subject to change at any time based on market and other conditions.
Portfolio holdings are subject to change daily.
(1) Since inception performance for the indices is shown from June 1, 2003.
Effective March 1, 2002, ING Investments, LLC began serving as investment adviser and ING Investment Management Co., the former investment adviser, began serving as sub-adviser to the Portfolio.
5
ING GROWTH AND INCOME PORTFOLIO
PORTFOLIO MANAGERS' REPORT
ING Growth and Income Portfolio (the "Portfolio") seeks to maximize total return through investments in a diversified portfolio of common stocks and securities convertible into common stocks. It is anticipated that capital appreciation and investment income will both be major factors in achieving total return. The Portfolio is managed by Christopher F. Corapi and Michael Pytosh, Portfolio Managers of ING Investment Management Co. — the Sub-Adviser.
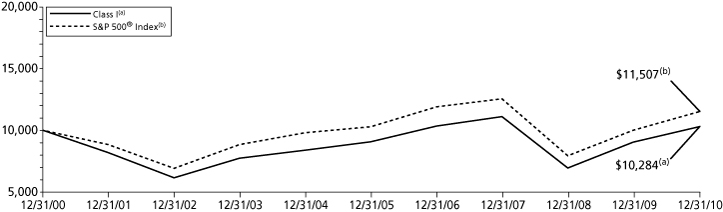
Performance: For the year ended December 31, 2010, the Portfolio's Class I shares provided a total return of 14.14% compared to the S&P 500® Index, which returned 15.06% for the same period.
Portfolio Specifics: The Portfolio lagged the benchmark for the one year period. Security selection in a handful of stocks, particularly in the financials, healthcare and consumer discretionary sectors, detracted from performance during the period. Selection among industrials and information technology, however, partially offset those losses.
Within financials our focus on what we believe are high quality companies was a headwind for the Portfolio as a number of high quality banks and lenders got tarnished due to the foreclosure issues towards the middle of the past year. The Portfolio's position in Bank of America Corp. was most unfavorable within the sector. We owned the stock as it was trading at a significantly discounted valuation, representing an attractive entry point for the stock of a dominant consumer bank with opportunities to better leverage its scale and more efficiently integrate its diverse business lines. The company had disappointing second quarter earnings and was mired in the mortgage foreclosure issues during the third quarter, which led to a drop in the stock price.
Within healthcare, the Portfolio's position in Zimmer Holdings, Inc. was negatively affected by some bad news at a competitor firm. In technology, our position in Cisco Systems, Inc. was unfavorable as the stock was down for the period. We owned the stock because we believed it had strong growth potential. The company has had some near term sales and earnings variability which hurt its stock price. We have exited all the above mentioned positions as of the end of the reporting period.
Among the Portfolio's favorable positions was Wabco Holdings, Inc. ("Wabco"), an industrials company. The company is a component supplier to trucks, trailers, buses and autos, predominantly in Western Europe. The Portfolio owns shares of Wabco as we believe it offers exposure to the cyclical recovery in European trucks, is a good play on secular growth and most importantly, it is a company that is not well covered by sell-side analysts. The position added returns to the portfolio as it reported strong third quarter numbers which were above analyst's estimates. We continue to hold this position as we believe it has further upside potential.
Apple, Inc. was among the top performers for the period. We believed in the company's growth prospects due to its strong product cycles despite the weak economy, and due to the success of the iPhone. We see further upside potential for the stock with the launch of the iPad and the iPhone4, which we believe will add value to the company's bottom line. We believe the market did not fully appreciate the strength of these products; the stock rose with the successful launches and better than anticipated sales of both the iPad and iPhone. We continue to hold the stock as we believe it has more upside potential.
Current Strategy and Outlook: Currently, the Portfolio is positioned in companies that we believe have strong or improving competitive positions, robust end markets or superior capital allocation opportunities. We believe each stock possesses an attractive valuation and a clear catalyst to improve it. We continue to be cautiously optimistic about the economy and believe that the Portfolio is well positioned to benefit from any uptick in the markets. We find plenty of companies that have strong financial characteristics, which we believe will benefit as the markets continue to invest in and differentiate among companies based on fundamentals. We continue to be constructive on U.S. and global economic prospects and are slightly biased towards companies that are leveraged to the global economic recovery. In light of this, we are currently overweight in technology, energy and early cycle industrials. We are cautious, however, about sectors that may confront significant policy changes or are defensively positioned in the business cycle, such as healthcare, utilities and consumer staples.
Industry Allocation
as of December 31, 2010
(as a percent of net assets)
| Information Technology | | | 19.5 | % | |
| Financials | | | 16.3 | % | |
| Energy | | | 13.4 | % | |
| Industrials | | | 10.8 | % | |
| Health Care | | | 10.2 | % | |
| Consumer Discretionary | | | 9.8 | % | |
| Consumer Staples | | | 9.7 | % | |
| Materials | | | 3.9 | % | |
| Telecommunication Services | | | 2.6 | % | |
| Utilities | | | 1.8 | % | |
| Other Assets and Liabilities — Net* | | | 2.0 | % | |
| Net Assets | | | 100.0 | % | |
* Includes short-term investments related to Blackrock Liquidity Funds TempFund Portfolio — Class I and securities lending collateral.
Portfolio holdings are subject to change daily.
Top Ten Holdings*
as of December 31, 2010
(as a percent of net assets)
| ExxonMobil Corp. | | | 5.0 | % | |
| Apple, Inc. | | | 4.3 | % | |
| Microsoft Corp. | | | 3.7 | % | |
| JPMorgan Chase & Co. | | | 3.3 | % | |
| Wells Fargo & Co. | | | 3.1 | % | |
| Qualcomm, Inc. | | | 2.9 | % | |
| Wal-Mart Stores, Inc. | | | 2.9 | % | |
| PepsiCo, Inc. | | | 2.8 | % | |
| Google, Inc. — Class A | | | 2.5 | % | |
| Citigroup, Inc. | | | 2.5 | % | |
* Excludes short-term investments related to securities lending collateral.
Portfolio holdings are subject to change daily.
Portfolio holdings and characteristics are subject to change and may not be representative of current holdings and characteristics. The outlook for this Portfolio may differ from that presented for other ING Funds. Performance for the different classes of shares will vary based on differences in fees associated with each class.
6
ING GROWTH AND INCOME PORTFOLIO
PORTFOLIO MANAGERS' REPORT
| Average Annual Total Returns for the Periods Ended December 31, 2010 | |
| | | 1 Year | | 5 Year | | 10 Year | | Since Inception
of Class ADV
December 20, 2006 | | Since Inception
of Class S
June 11, 2003 | | Since Inception
of Class S2
February 27, 2009 | |
| Class ADV | | | 13.55 | % | | | — | | | | — | | | | (0.69 | )% | | | — | | | | — | | |
| Class I | | | 14.14 | % | | | 2.60 | % | | | 0.28 | % | | | — | | | | — | | | | — | | |
| Class S | | | 13.81 | % | | | 2.31 | % | | | — | | | | — | | | | 5.17 | % | | | — | | |
| Class S2 | | | 12.55 | % | | | — | | | | — | | | | — | | | | — | | | | 34.09 | % | |
| S&P 500® Index | | | 15.06 | % | | | 2.29 | % | | | 1.41 | % | | | (0.83 | )%(1) | | | 5.67 | %(2) | | | 36.89 | %(3) | |
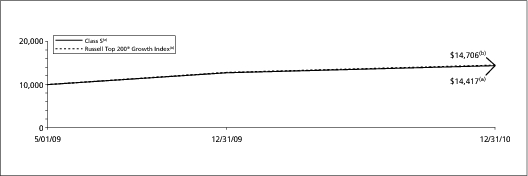
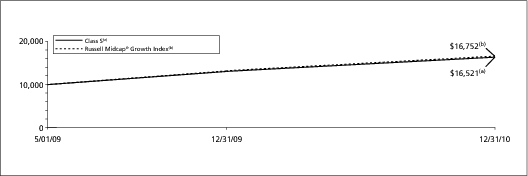
Based on a $10,000 initial investment, the graph and table above illustrate the total return of ING Growth and Income Portfolio against the index indicated. An index has no cash in its portfolio, imposes no sales charges and incurs no operating expenses. An investor cannot invest directly in an index. The Portfolio's performance is shown without the imposition of any expenses or charges which are, or may be, imposed under your annuity contract. Total returns would have been lower if such expenses or charges were included.
The performance graph and table do not reflect the deduction of taxes that a shareholder will pay on portfolio distributions or the redemption of portfolio shares.
The performance shown may include the effect of fee waivers and/or expense reimbursements by the Investment Adviser and/or other service providers, which have the effect of increasing total return. Had all fees and expenses been considered, the total returns would have been lower.
The performance update illustrates performance for a variable investment option available through a variable annuity contract. The performance shown indicates past performance and is not a projection or prediction of future results. Actual investment returns and principal value will fluctuate so that shares and/or units, at redemption, may be worth more or less than their original cost. Please call (800) 992-0180 to get performance through the most recent month end.
This report contains statements that may be "forward-looking" statements. Actual results may differ materially from those projected in the "forward-looking" statements.
The views expressed in this report reflect those of the portfolio manager only through the end of the period as stated on the cover. The portfolio manager's views are subject to change at any time based on market and other conditions.
Portfolio holdings are subject to change daily.
(1) Since inception performance for the index is shown from January 1, 2007.
(2) Since inception performance for the index is shown from June 1, 2003.
(3) Since inception performance for the index is shown from March 1, 2009.
Effective March 1, 2002, ING Investments, LLC began serving as investment adviser and ING Investment Management Co., the former investment adviser, began serving as sub-adviser to the Portfolio.
7
ING SMALL COMPANY PORTFOLIO
PORTFOLIO MANAGERS' REPORT
ING Small Company Portfolio (the "Portfolio") seeks growth of capital primarily through investment in a diversified portfolio of common stocks of companies with smaller market capitalizations. The Portfolio is managed by Joseph Basset, CFA, and Steve Salopek, Portfolio Managers of ING Investment Management Co. — the Sub Adviser.
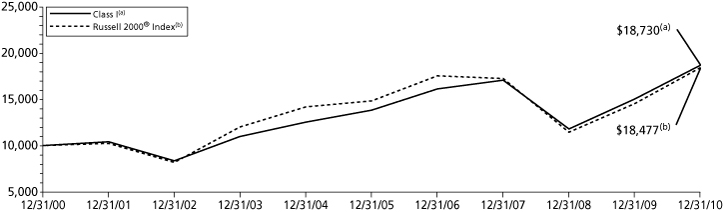
Performance: For the year ended December 31, 2010, the Portfolio's Class I shares provided a total return of 24.38% compared to the Russell 2000® Index, which returned 26.85% for the same period.
Portfolio Specifics: The Russell 2000® Index gained nearly 27% during 2010, outperforming both large- and mid-capitalization stocks for the reporting period. Small caps responded positively to the launch of a second round of quantitative easing by the U.S. Federal Reserve, coupled with improved economic data. Also helping to boost performance was greater merger and acquisition activity than in the past few years, due to cash on company balance sheets and easier access to capital. Cyclical sectors, e.g., information technology, materials, energy and consumer discretionary, led the benchmark's performance. All sectors produced double-digit returns, with technology leading the way.
The Portfolio's underperformance was due largely to negative security selection within the financials, information technology and materials sectors. In information technology, returns were held back by stock selection within semiconductors and semiconductor equipment and computers and peripherals. Within financials, stock selection within capital markets and commercial banks detracted from performance.
Positive stock selection within healthcare, energy and consumer staples partially offset those negative effects. Notable outperformance within healthcare was due to strong stock selection within biotechnology, healthcare providers and services and healthcare equipment and supplies. Energy benefited from stock selection within oil, gas and consumable fuels, while strong stock selection within food products benefited consumer staples.
McMoRan Exploration Co. ("McMoRan") and American Italian Pasta contributed significantly to performance over the period. McMoRan engages in the exploration and production of crude oil and natural gas offshore in the Gulf of Mexico and onshore in the Gulf Coast area. The company announced a very large natural gas discovery in the Gulf of Mexico in January. Also, energy companies with exposure to the Gulf of Mexico generally rebounded in the third quarter after the BP oil well was plugged. Specific to McMoRan, the market has begun to anticipate good results from its Blackbeard East project.
American Italian Pasta, which engages in the production of dry pasta, has agreed to be acquired by Ralcorp for $1.2 billion, a 27% premium. The acquisition will expand Ralcorp's private label business by entering into the pasta category.
QLogic Corp. ("QLogic") and FormFactor, Inc. ("FormFactor") were two of the largest detractors from performance over the period. QLogic engages in the design and supply of storage networking, high performance computing networking and converged networking infrastructure solutions. The company is a steady albeit slower growing company. We believe it underperformed other faster growing storage companies in 2010, which benefited from M&A speculation or by being acquired by larger technology companies. We continue to hold the stock for its attractive valuation, consistent cash flow generation and our belief that the business will show growth in 2011 supported by good IT spending.
FormFactor, which designs and sells semiconductor wafer probe cards, negatively pre-announced fourth quarter earnings at the beginning of 2010. The fact that they were one of the very few semiconductor companies that pre-announced negatively caused investor uncertainty regarding this stock. The company's earnings announcement and guidance for first quarter were also below expectations. Furthermore, FormFactor had a change in management which created uncertainty regarding its future business strategy. We continue to hold the position in the Portfolio as we believe that the company's technology is still good and that despite numerous missteps the intermediate term value of the company far exceeds the current stock price. As a result, we believe the company remains attractive from a risk/return perspective.
Current Strategy and Outlook: We continue to believe that the economy will improve slowly and that this environment will favor quality companies, as investors focus on fundamentals. The Portfolio's positioning has not changed significantly. We have slightly increased our exposure to commodities due to the attractiveness of individual stocks. We are cautious about possible inflationary pressures and the potential impact they may have on the performance of companies and valuations.
As the Portfolio has, in our opinion, a higher quality bias and we remain focused on companies that we believe have strong managements teams, strong balance sheets and good cash flow generation capabilities, we believe that we are well positioned for this market environment. Even among cyclicals our primary focus is on management quality, cash flows and the strength of the balance sheet. We continue to take advantage of the volatility in the market to invest in what we believe we are quality companies that are attractively valued.
Industry Allocation
as of December 31, 2010
(as a percent of net assets)
| Financials | | | 20.1 | % | |
| Information Technology | | | 17.1 | % | |
| Industrials | | | 16.4 | % | |
| Consumer Discretionary | | | 14.6 | % | |
| Health Care | | | 10.5 | % | |
| Materials | | | 6.0 | % | |
| Energy | | | 5.3 | % | |
| Utilities | | | 4.0 | % | |
| Consumer Staples | | | 2.0 | % | |
| Exchange-Traded Funds | | | 1.7 | % | |
| Telecommunication Services | | | 1.6 | % | |
| Other Assets and Liabilities — Net* | | | 0.7 | % | |
| Net Assets | | | 100.0 | % | |
* Includes short-term investments related to Blackrock Liquidity Funds TempFund Portfolio — Class I and securities lending collateral.
Portfolio holdings are subject to change daily.
Top Ten Holdings*
as of December 31, 2010
(as a percent of net assets)
| iShares Russell 2000 Index Fund | | | 1.3 | % | |
| Jo-Ann Stores, Inc. | | | 1.2 | % | |
| Healthsouth Corp. | | | 1.1 | % | |
| Silgan Holdings, Inc. | | | 1.1 | % | |
| OfficeMax, Inc. | | | 1.1 | % | |
| Portland General Electric Co. | | | 1.1 | % | |
| DiamondRock Hospitality Co. | | | 1.1 | % | |
| Collective Brands, Inc. | | | 1.0 | % | |
| Life Time Fitness, Inc. | | | 1.0 | % | |
| Watsco, Inc. | | | 1.0 | % | |
* Excludes short-term investments related to Blackrock Liquidity Funds TempFund Portfolio — Class I.
Portfolio holdings are subject to change daily.
Portfolio holdings and characteristics are subject to change and may not be representative of current holdings and characteristics. The outlook for this Portfolio may differ from that presented for other ING Funds. Performance for the different classes of shares will vary based on differences in fees associated with each class.
8
ING SMALL COMPANY PORTFOLIO
PORTFOLIO MANAGERS' REPORT
| Average Annual Total Returns for the Periods Ended December 31, 2010 | |
| | | 1 Year | | 5 Year | | 10 Year | | Since Inception
of Class ADV
December 16, 2008 | | Since Inception
of Class S
November 1, 2001 | | Since Inception
of Class S2
February 27, 2009 | |
| Class ADV | | | 23.75 | % | | | — | | | | — | | | | 27.22 | % | | | — | | | | — | | |
| Class I | | | 24.38 | % | | | 6.23 | % | | | 6.47 | % | | | — | | | | — | | | | | | |
| Class S | | | 24.00 | % | | | 5.88 | % | | | — | | | | — | | | | 7.57 | % | | | — | | |
| Class S2 | | | 23.85 | % | | | — | | | | — | | | | — | | | | — | | | | 44.36 | % | |
| Russell 2000® Index | | | 26.85 | % | | | 4.47 | % | | | 6.33 | % | | | 27.01 | %(1) | | | 8.22 | % | | | 48.56 | %(2) | |
Based on a $10,000 initial investment, the graph and table above illustrate the total return of ING Small Company Portfolio against the index indicated. An index has no cash in its portfolio, imposes no sales charges and incurs no operating expenses. An investor cannot invest directly in an index. The Portfolio's performance is shown without the imposition of any expenses or charges which are, or may be, imposed under your annuity contract. Total returns would have been lower if such expenses or charges were included.
The performance graph and table do not reflect the deduction of taxes that a shareholder will pay on portfolio distributions or the redemption of portfolio shares.
The performance shown may include the effect of fee waivers and/or expense reimbursements by the Investment Adviser and/or other service providers, which have the effect of increasing total return. Had all fees and expenses been considered, the total returns would have been lower.
The performance update illustrates performance for a variable investment option available through a variable annuity contract. The performance shown indicates past performance and is not a projection or prediction of future results. Actual investment returns and principal value will fluctuate so that shares and/or units, at redemption, may be worth more or less than their original cost. Please call (800) 992-0180 to get performance through the most recent month end.
This report contains statements that may be "forward-looking" statements. Actual results may differ materially from those projected in the "forward-looking" statements.
The views expressed in this report reflect those of the portfolio manager, only through the end of the period as stated on the cover. The portfolio manager's views are subject to change at any time based on market and other conditions.
Portfolio holdings are subject to change daily.
(1) Since inception performance for the index is January 1, 2009.
(2) Since inception performance for the index is March 1, 2009.
Effective March 1, 2002, ING Investments, LLC began serving as investment adviser and ING Investment Management Co., the former investment adviser, began serving as sub-adviser to the Portfolio.
9
ING INTERMEDIATE BOND PORTFOLIO
PORTFOLIO MANAGERS' REPORT
ING Intermediate Bond Portfolio (the "Portfolio") seeks to maximize total return consistent with reasonable risk. The Portfolio seeks its objective through investments in a diversified portfolio consisting primarily of debt securities. It is anticipated that capital appreciation and investment income will both be major factors in achieving total return. The Portfolio is managed by Christine Hurtsellers, Matthew Toms and Michael Mata, Portfolio Managers of ING Investment Management Co. — the Sub-Adviser.*
Performance: For the year ended December 31, 2010, the Portfolio's Class I shares provided a total return of 9.84% compared to the Barclays Capital U.S. Aggregate Bond Index, which returned 6.54% for the same period.
Portfolio Specifics: The Portfolio outperformed its benchmark for 2010. We saw dramatic shifts of interest rates throughout the year as the economy reacted to events such as the BP oil spill in the Gulf of Mexico, the European debt crisis, quantitative easing and tax policy changes. On balance the Portfolio stayed close to the benchmark duration for most of the year. Consequently, our yield curve and duration positioning slightly detracted from performance over the period.
The economy continued to heal and expand in 2010. Most non-Treasury or spread sectors within fixed income consequently outperformed. Our specific overweight positions to several spread sectors, e.g., corporate bonds, residential mortgage-backed securities ("RMBS") and commercial mortgage-backed securities ("CMBS") led our outperformance for the year. Additionally, allocations to non-index sectors like emerging market debt and high yield debt also helped contribute to the strong performance. Our underweighting of U.S. Treasuries and agency debentures to fund the spread sector overweight positions also benefited the performance of the Portfolio.
As economic data improved through the year and consumer confidence and spending returned, investment grade credit outperformed along with our security selection within investment grade corporate bonds. Our favoring of issuers in a variety of subsectors in the financial services sector, and several industrials subsectors, helped the portfolio outperform. Finally, our security selection decisions within mortgage-backed securities also had a very positive impact on Portfolio results for the year.
Our derivatives usage consisted of futures, swaps and options in the Portfolio. Futures and swaps were mostly used for duration management, which was a detractor over the period. Also, some swaps and options were used to hedge mortgage volatility towards the end of the year, due to our slight underweight in agency MBS. The net result and impact to relative performance over the period was negligible.
Current Outlook and Strategy: We begin 2011 with an economy that is absent any signs of inflation. We believe this allows the U.S. Federal Reserve (the "Fed") to remain accommodative, keeping short rates near zero and following its program of Treasury purchases out the yield curve. We believe interest rates will be somewhat contained given our tempered economic growth view and the Fed's commitment to a second round of quantitative easing. Consequently, we remain close to neutral in our duration positioning.
We believe this base case of slow continued economic growth with zero inflation will be supportive of risk assets and therefore remain overweight across most spread sectors. We continue to be positive on investment grade credit. Discussions about potentially more quantitative easing and the sovereign debt issues could keep investors seeking a safer trade for some time, which could be supportive for high-quality fixed income assets. Even if interest rates drift modestly higher, we believe corporate bonds still could perform well under our base economic forecast.
We believe MBS remain fundamentally sound, and if interest rate volatility remains contained they could outperform Treasuries in 2011. We continue to overweight CMBS and non-agency RMBS, as we believe the supply/demand factors will remain supportive and the underlying fundamentals are likely to continue to support current valuations.
In non-index sectors, we remain constructive but selective in high yield and see value in emerging market debt ("EMD"). We see the greatest value and opportunity in local currency EMD as further dollar depreciation could benefit investments denominated in local currencies.
Investment Type Allocation
as of December 31, 2010
(as a percent of net assets)
| Corporate Bonds/Notes | | | 39.1 | % | |
| U.S. Government Agency Obligations | | | 27.0 | % | |
| Collateralized Mortgage Obligations | | | 13.8 | % | |
| U.S. Treasury Obligations | | | 11.7 | % | |
| Asset-Backed Securities | | | 9.9 | % | |
| Foreign Government Bonds | | | 5.7 | % | |
| Preferred Stock | | | 0.2 | % | |
| Municipal Bonds | | | 0.1 | % | |
| Other Assets and Liabilities — Net* | | | (7.5 | )% | |
| Net Assets | | | 100.0 | % | |
* Includes short-term investments related to Blackrock Liquidity Funds TempFund Portfolio — Class I and securities lending collateral.
Portfolio holdings are subject to change daily.
Top Ten Holdings*
as of December 31, 2010
(as a percent of net assets)
| U.S. Treasury Note, 3.875%, due 08/15/40 | | | 3.8 | % | |
| Federal National Mortgage Association, | | | |
| 4.500%, due 01/25/39 | | | 3.2 | % | |
| Brazil Notas do Tesouro Nacional Series F, | | | |
| 10.000%, due 01/01/14 | | | 2.6 | % | |
| U.S. Treasury Note, 3.375%, due 11/15/19 | | | 2.0 | % | |
| Federal Home Loan Mortgage Corporation, | | | |
| 4.000%, due 08/15/40 | | | 1.8 | % | |
| U.S. Treasury Note, 2.250%, due 11/30/17 | | | 1.6 | % | |
| South Africa Government International Bond, | | | |
| 7.250%, due 01/15/20 | | | 1.6 | % | |
| U.S. Treasury Note, 2.625%, due 11/15/20 | | | 1.6 | % | |
| MBNA Credit Card Master Note Trust, | | | |
| 5.600%, due 07/17/14 | | | 1.5 | % | |
| Mexican Bonos, 8.000%, due 06/11/20 | | | 1.5 | % | |
* Excludes short-term investments related to Blackrock Liquidity Funds TempFund Portfolio — Class I.
Portfolio holdings are subject to change daily.
* Effective August 2, 2010 Michael Hyman, Peter Guan and Christopher Diaz were removed as Portfolio Managers to the Portfolio and Matthew Toms and Michael Mata were added as Portfolio Managers to the Portfolio.
Portfolio holdings and characteristics are subject to change and may not be representative of current holdings and characteristics. The outlook for this Portfolio may differ from that presented for other ING Funds. Performance for the different classes of shares will vary based on differences in fees associated with each class.
10
ING INTERMEDIATE BOND PORTFOLIO
PORTFOLIO MANAGERS' REPORT

| Average Annual Total Returns for the Periods Ended December 31, 2010 | |
| | | 1 Year | | 5 Year | | 10 Year | | Since Inception
of Class ADV
December 20, 2006 | | Since Inception
of Class S
May 3, 2002 | | Since Inception
of Class S2
February 27, 2009 | |
| Class ADV | | | 9.01 | % | | | — | | | | — | | | | 3.71 | % | | | — | | | | — | | |
| Class I | | | 9.84 | % | | | 4.35 | % | | | 5.30 | % | | | — | | | | — | | | | — | | |
| Class S | | | 9.51 | % | | | 4.07 | % | | | — | | | | — | | | | 4.77 | % | | | — | | |
| Class S2 | | | 9.29 | % | | | — | | | | — | | | | — | | | | — | | | | 13.01 | % | |
Barclays Capital U.S.
Aggregate Bond Index | | | 6.54 | % | | | 5.80 | % | | | 5.84 | % | | | 6.17 | %(1) | | | 5.52 | %(2) | | | 7.56 | %(3) | |
Based on a $10,000 initial investment, the graph and table above illustrate the total return of ING Intermediate Bond Portfolio against the index indicated. An index has has no cash in its portfolio, imposes no sales charges and incurs no operating expenses. An investor cannot invest directly in an index. The Portfolio's performance is shown without the imposition of any expenses or charges which are, or may be, imposed under your annuity contract. Total returns would have been lower if such expenses or charges were included.
The performance graph and table do not reflect the deduction of taxes that a shareholder will pay on portfolio distributions or the redemption of portfolio shares.
The performance shown may include the effect of fee waivers and/or expense reimbursements by the Investment Adviser and/or other service providers, which have the effect of increasing total return. Had all fees and expenses been considered, the total returns would have been lower.
The performance update illustrates performance for a variable investment option available through a variable annuity contract. The performance shown indicates past performance and is not a projection or prediction of future results. Actual investment returns and principal value will fluctuate so that shares and/or units, at redemption, may be worth more or less than their original cost. Please call (800) 992-0180 to get performance through the most recent month end.
This report contains statements that may be "forward-looking" statements. Actual results may differ materially from those projected in the "forward-looking" statements.
The views expressed in this report reflect those of the portfolio managers, only through the end of the period as stated on the cover. The portfolio managers' views are subject to change at any time based on market and other conditions.
Portfolio holdings are subject to change daily.
(1) Since inception performance for the the index is shown from January 1, 2007.
(2) Since inception performance for the index is shown from May 1, 2002.
(3) Since inception performance for the index is shown from March 1, 2009.
Effective March 1, 2002, ING Investments, LLC began serving as investment adviser and ING Investment Management Co., the former investment adviser, began serving as sub-adviser to the Portfolio.
11
ING MONEY MARKET PORTFOLIO
PORTFOLIO MANAGERS' REPORT
ING Money Market Portfolio (the "Portfolio") seeks to provide high current return, consistent with preservation of capital and liquidity, through investment in high-quality money market instruments, while maintaining a stable share price of $1.00 per share. The Portfolio is managed by David S. Yealy, Portfolio Manager of ING Investment Management Co. — the Sub-Adviser.
Performance: For the year ended December 31, 2010, the Portfolio's shares provided a total return of 0.24% compared to the iMoneyNet First Tier Retail Index, which returned 0.03% for the same period.
Portfolio Specifics: For money market investors, 2010 was a year characterized by a low interest rate environment, continued government support and both the U.S. economy and global economy struggling in the first half of the year followed by stabilization and modest recovery in the second half of the year. Most money market funds were forced to waive a portion of their fees in order to maintain a yield at or above 0.00%.
Economic conditions improved modestly during the first quarter of 2010, building on the improvement seen in the second half of 2009, although portions of the economy such as housing continued to struggle. The unemployment rate remained elevated but declined to 9.7% at quarter-end, down from 10.0% as of December 31, 2009. The Federal Open Market Committee ("FOMC") kept short-term rates extremely low versus historical standards and indicated that rates would remain low for an extended period of time. Short-term money market rates changed little during the quarter. Revisions to SEC Rule 2a-7 were announced late in the quarter seeking to reduce risks for money market funds; but the revisions also reduce potential yields going forward.
During the second quarter of 2010, the public finance problems faced by the Greek government gradually evolved into a full-blown fiscal crisis for the euro zone. This weighed heavily on the short-term money markets here in the United States as most of the large European banks fund a portion of their liquidity needs in our market. In light of the deteriorating outlook for Europe and implications for global economic growth, the stubbornly high U.S. unemployment, continuing week housing market and below target inflation, the FOMC reiterated at both of the Federal Reserve (the "Fed") meetings during the quarter its intent to maintain an "exceptionally low levels of the federal funds rate for an extended period."
Economic reports during the third quarter of 2010 primarily painted a picture of a slowing recovery, continued high unemployment, below target inflation and continued difficulty in the housing sector. Market expectations for the Fed to start the next round of quantitative easing ("QE2") as early as November increased as the quarter progressed. Short-term yields declined during the quarter with the two-year Treasury going from 0.61% as of the end of June to 0.43% at the end of September. Yield for the various money market securities declined as well, led by the money market securities of high quality European banks on improving credit outlook.
The fourth quarter of 2010 saw the implementation of QE2 and on balance an improving economic picture, albeit only a modest recovery and not one expected to pull the economy out of the ditch in the near term. Housing and unemployment continued to recover in the U.S. Unemployment ended the year at 9.4%. Longer-term U.S. Treasury yields rose as the economic outlook improved but short-term money market rates remained anchored by expectations that the FOMC would keep the federal funds rate within the current range well into 2011 or beyond.
Our focus this past year was similar to 2009: not on maximizing yield and return but on preservation of capital, limiting credit risk and keeping an excess liquidity cushion against the still elevated risks in the market. We adjusted the overall makeup of the Portfolio to comply with SEC Rule 2a-7. The Portfolio performed in-line with its benchmark despite our risk reduction strategy, returning 0.02% for the year compared to the 0.03% return of the iMoneyNet First Tier Retail average return. The Portfolio took on interest rate risk throughout the year, maintaining a weighted average maturity ("WAM") at the longer end of its maturity range primarily by buying longer term Treasury and agency securities and selectively adding longer-term credit exposure later in the year. The Portfolio finished the year with a 54-day WAM, which is just shy of the new 60 day maximum WAM limit.
Current Strategy and Outlook: It is our opinion that the economy is positioned for a slow recovery in 2011 due to expected high continuing unemployment and the significant slack in the productive capacity. The lack of a sustained and significant housing recovery, constrained consumer spending and low inflation presents significant headwinds to a robust recovery. We believe the FOMC will be forced to keep the federal funds rate in the 0.00% to 0.25% range well into 2011 or beyond and that additional quantitative easing may be warranted. In our opinion, the potential for a significant increase in short-term money market yields and increase in the Portfolio's yield remain very low.
The Portfolio continues to focus on maintaining an extended weighted average maturity posture with limited credit risk, though current yields reduce the incentive to do so. Preservation of capital and liquidity remain our top objectives. We plan to maintain above normal liquidity to give the Portfolio the flexibility to take advantage of any periods of temporary yield increases.
Principal Risk Factors: Although the Portfolio seeks to preserve the value of your investment at $1.00 per share, it is possible to lose money by investing in the Portfolio.
Investment Type Allocation
as of December 31, 2010
(as a percent of net assets)
| Commercial Paper | | | 49.3 | % | |
| Repurchase Agreement | | | 22.5 | % | |
| Corporate Bonds/Notes | | | 16.8 | % | |
| Certificates Of Deposit | | | 7.3 | % | |
| U.S. Government Agency Obligations | | | 3.7 | % | |
| U.S. Treasury Notes | | | 0.7 | % | |
| Securities Lending Collateral | | | 0.1 | % | |
| Other Assets and Liabilities — Net | | | (0.4 | )% | |
| Net Assets | | | 100.0 | % | |
Portfolio holdings are subject to change daily.
* Please see Note 5 for more information regarding the contractual waiver in place to reimburse certain expenses of the Portfolio to the extent necessary to assist the Portfolio in maintaining a net yield of not less than zero.
Portfolio holdings and characteristics are subject to change and may not be representative of current holdings and characteristics. The outlook for this Portfolio may differ from that presented for other ING Funds. Performance for the different classes of shares will vary based on differences in fees associated with each class.
12
ING BLACKROCK SCIENCE AND TECHNOLOGY OPPORTUNITIES PORTFOLIO
PORTFOLIO MANAGERS' REPORT
ING BlackRock Science and Technology Opportunities Portfolio (the "Portfolio") seeks long-term capital appreciation. The Portfolio is managed by Thomas P. Callan, CFA, Managing Director and Senior Portfolio Manager, Erin Xie, PhD, Managing Director and Portfolio Manager and Jean M. Rosenbaum, CFA, Managing Director and Portfolio Manager of BlackRock Advisors, LLC — the Sub-Adviser.
Performance: For the year ended December 31, 2010, the Portfolio's Class I shares provided a total return of 18.56% compared to the S&P 500® Index and the NYSE Arca Tech 100 IndexSM, which returned 15.06% and 25.40%, respectively, for the same period.
Portfolio Specifics: Since the market lows in March of 2009, we have witnessed a robust, albeit choppy, recovery in equity markets. Similar to past recoveries, consumer-related stocks and other early-stage cyclicals were leaders of the rebound. Overall, emerging markets and small cap equities have led the recovery in financial markets. Despite the upward trend, equity markets have not been unidirectional, but rather characterized by pronounced reversals of range-bound trading patterns driven by massive swings in investor risk tolerance. These trading patterns suggest to us that the market is still searching for a consistent trend and one might argue that the late-stage 2010 rally was fueled more by market-friendly developments in Washington, DC and rampant energy and commodity prices rather than fundamentally solid signals of sustained economic recovery.
The Portfolio underperformed its reference benchmark, the NYSE Arca Tech 100 IndexSM, for the year. Disappointing stock selection across the semiconductors, communication equipment, and internet software & services sub-industries stood out as the primary cause of Portfolio underperformance, while cash was a notable drag and the effects of sector allocation were mixed. To start off the year, the software & services industry group was notably weak as the mix of Portfolio holdings within the internet software & services, systems software, and application software sub-industries returned poor relative results. In the second quarter, transaction timing hurt performance as additions to the Portfolio's semiconductors holdings suffered when the advancing market stalled out in mid-April as the European sovereign crisis took hold and fell steadily to close the first half of 2010. The underperformance of semiconductors was in part driven by fears of a global slowdown in economic growth coupled with investors' shifting opinions that forward earnings estimates were too high relative to current business conditions. Fears of a double dip recession were abruptly replaced with renewed optimism in the second half of 2010, causing equities to rebound sharply through year end. As investors turned toward higher-risk assets, information technology ("IT") stocks handily outperformed the health care sector, and as such, the Portfolio's large overweight in IT relative to the NYSE Arca Tech 100 IndexSM was a source of strength. In healthcare, the biggest detractor for the year was the decision to underweight the life sciences tools & services sub-industry. Industry consolidation and the advancement of research & development in the emerging markets were key drivers for these stocks.
From an individual holdings perspective, priceline.com, Inc., ARM Holdings PLC and Western Digital Corp. were the strongest relative contributors to returns, while Cisco Systems, Inc. and AsiaInfo-Linkage detracted from performance, as did underweight positions in Salesforce.com, Inc. and F5 Networks, Inc.
Current Strategy and Outlook: We are cautiously optimistic on financial markets in 2011. While we are alert to continuing signs of economic strength, particularly as it relates to employment figures in the U.S., we remain cognizant that the recent equity rally might not be long-sustained and a short-term retrenchment is possible. The robust government spending in the U.S. may prove successful in pulling the U.S. economy fully out of the doldrums, but an eventual need for austerity seems likely. The theme of austerity has already entered the lexicon in the Eurozone amidst the very real exogenous risks tied to the unresolved sovereign debt crisis. Given these environmental factors, we have constructively positioned the Portfolio with a bias toward companies that we believe have been demonstrating sustainable growth.
At year-end, 88% of the Portfolio was invested in IT, 4.5% in healthcare, and 2.5% in telecommunication services, with the remainder invested in industrials and consumer discretionary stocks. Within IT, the Portfolio's primary overweights relative to the benchmark were in semiconductors, internet software & services, and systems software, while it was underweight in application software, data processing & outsourced services, and communications equipment.
Industry Allocation
as of December 31, 2010
(as a percent of net assets)
| Information Technology | | | 87.1 | % | |
| Health Care | | | 4.4 | % | |
| Telecommunication Services | | | 2.4 | % | |
| Consumer Discretionary | | | 2.2 | % | |
| Industrials | | | 0.6 | % | |
| Other Assets and Liabilities — Net* | | | 3.3 | % | |
| Net Assets | | | 100.0 | % | |
* Includes short-term investments related to Blackrock Liquidity Funds TempFund Portfolio — Class I and securities lending collateral.
Portfolio holdings are subject to change daily.
Top Ten Holdings*
as of December 31, 2010
(as a percent of net assets)
| Apple, Inc. | | | 8.4 | % | |
| International Business Machines Corp. | | | 3.4 | % | |
| Google, Inc. — Class A | | | 3.0 | % | |
| F5 Networks, Inc. | | | 2.5 | % | |
| Qualcomm, Inc. | | | 2.4 | % | |
| Microsoft Corp. | | | 2.3 | % | |
| EMC Corp. | | | 2.2 | % | |
| Oracle Corp. | | | 2.1 | % | |
| Cisco Systems, Inc. | | | 1.9 | % | |
| Texas Instruments, Inc. | | | 1.8 | % | |
* Excludes short-term investments related to Blackrock Liquidity Funds TempFund Portfolio — Class I and securities lending collateral.
Portfolio holdings are subject to change daily.
Portfolio holdings and characteristics are subject to change and may not be representative of current holdings and characteristics. The outlook for this Portfolio may differ from that presented for other ING Funds. Performance for the different classes of shares will vary based on differences in fees associated with each class.
13
ING BLACKROCK SCIENCE AND TECHNOLOGY OPPORTUNITIES PORTFOLIO
PORTFOLIO MANAGERS' REPORT

| Average Annual Total Returns for the Periods Ended December 31, 2010 | |
| | | 1 Year | | 5 Year | | 10 Year | | Since Inception
of Class S
November 1, 2001 | | Since Inception
of Class ADV
December 16, 2008 | | Since Inception
of Class S2
February 27, 2009 | |
| Class ADV | | | 18.02 | % | | | — | | | | — | | | | — | | | | 32.35 | % | | | — | | |
| Class I | | | 18.56 | % | | | 6.82 | % | | | 0.10 | % | | | — | | | | — | | | | — | | |
| Class S(1) | | | 18.15 | % | | | 6.53 | % | | | — | | | | 2.18 | % | | | — | | | | — | | |
| Class S2 | | | 18.18 | % | | | — | | | | — | | | | — | | | | — | | | | 43.47 | % | |
| S&P 500® Index | | | 15.06 | % | | | 2.29 | % | | | 1.41 | % | | | 3.89 | % | | | 20.63 | %(2) | | | 36.89 | %(3) | |
| NYSE Arca Tech 100 IndexSM | | | 25.40 | % | | | 6.10 | % | | | 3.43 | % | | | 7.27 | % | | | 34.54 | %(2) | | | 44.43 | %(3) | |
Based on a $10,000 initial investment, the graph and table above illustrate the total return of ING BlackRock Global Science and Technology Portfolio against the indices indicated. An index has no cash in its portfolio, imposes no sales charges and incurs no operating expenses. An investor cannot invest directly in an index. The Portfolio's performance is shown without the imposition of any expenses or charges which are, or may be, imposed under your annuity contract. Total returns would have been lower if such expenses or charges were included.
The performance graph and table do not reflect the deduction of taxes that a shareholder will pay on portfolio distributions or the redemption of portfolio shares.
The performance shown may include the effect of fee waivers and/or expense reimbursements by the Investment Adviser and/or other service providers, which have the effect of increasing total return. Had all fees and expenses been considered, the total returns would have been lower.
The performance update illustrates performance for a variable investment option available through a variable annuity contract. The performance shown indicates past performance and is not a projection or prediction of future results. Actual investment returns and principal value will fluctuate so that shares and/or units, at redemption, may be worth more or less than their original cost. Please call (800) 992-0180 to get performance through the most recent month end.
This report contains statements that may be "forward-looking" statements. Actual results may differ materially from those projected in the "forward-looking" statements.
The views expressed in this report reflect those of the portfolio managers, only through the end of the period as stated on the cover. The portfolio managers' views are subject to change at any time based on market and other conditions.
Portfolio holdings are subject to change daily.
(1) On December 16, 2003, all outstanding shares of Class S were fully redeemed. On July 20, 2005, Class S recommenced operations. The returns for Class S include the performance for Class I, adjusted to reflect the higher expenses of Class S, for the period December 17, 2003 to July 19, 2005.
(2) Since inception performance for the indices is shown from January 1, 2009.
(3) Since inception performance for the indices is shown from March 1, 2009.
Effective March 1, 2002, ING Investments, LLC began serving as investment adviser. Formerly, ING Investment Management Co. served as the investment adviser. Prior to January 1, 2004, the Portfolio was sub-advised by a different sub-adviser.
14
SHAREHOLDER EXPENSE EXAMPLES (UNAUDITED)
As a shareholder of a Portfolio, you incur two types of costs: (1) transaction costs, including redemption fees and exchange fees; and (2) ongoing costs, including management fees, distribution and/or service (12b-1) fees, and other Portfolio expenses. These Examples are intended to help you understand your ongoing costs (in dollars) of investing in a Portfolio and to compare these costs with the ongoing costs of investing in other mutual funds.
The Examples are based on an investment of $1,000 invested at the beginning of the period and held for the entire period from July 1, 2010 to December 31, 2010. The Portfolios' expenses are shown without the imposition of any charges which are, or may be, imposed under your annuity contract. Expenses would have been higher if such charges were included.
Actual Expenses
The left section of the table shown below, "Actual Portfolio Return," provides information about actual account values and actual expenses. You may use the information in this section, together with the amount you invested, to estimate the expenses that you paid over the period. Simply divide your account value by $1,000 (for example, an $8,600 account value divided by $1,000 = 8.6), then multiply the result by the number in the first section under the heading entitled "Expenses Paid During the Period" to estimate the expenses you paid on your account during this period.
Hypothetical Example for Comparison Purposes
The right section of the table shown below, "Hypothetical (5% return before expenses)," provides information about hypothetical account values and hypothetical expenses based on a Portfolio's actual expense ratio and an assumed rate of return of 5% per year before expenses, which is not a Portfolio's actual return. The hypothetical account values and expenses may not be used to estimate the actual ending account balance or expenses you paid for the period. You may use this information to compare the ongoing costs of investing in a Portfolio and other mutual funds. To do so, compare this 5% hypothetical example with the 5% hypothetical examples that appear in the shareholder reports of the other mutual funds.
Please note that the expenses shown in the table are meant to highlight your ongoing costs only and do not reflect any transactional costs, such as redemption fees or exchange fees. Therefore, the hypothetical lines of the table are useful in comparing ongoing costs only, and will not help you determine the relative total costs of owning different mutual funds. In addition, if these transactional costs were included, your costs would have been higher.
| | | Actual Portfolio Return | | Hypothetical (5% return before expenses) | |
| ING Balanced Portfolio | | Beginning
Account
Value
July 1,
2010 | | Ending
Account
Value
December 31,
2010 | | Annualized
Expense
Ratio | | Expenses Paid
During the
Period Ended
December 31,
2010* | | Beginning
Account
Value
July 1,
2010 | | Ending
Account
Value
December 31,
2010 | | Annualized
Expense
Ratio | | Expenses Paid
During the
Period Ended
December 31,
2010* | |
| Class I | | $ | 1,000.00 | | | $ | 1,147.80 | | | | 0.62 | % | | $ | 3.36 | | | $ | 1,000.00 | | | $ | 1,022.08 | | | | 0.62 | % | | $ | 3.16 | | |
| Class S | | | 1,000.00 | | | | 1,146.60 | | | | 0.87 | | | | 4.71 | | | | 1,000.00 | | | | 1,020.82 | | | | 0.87 | | | | 4.43 | | |
| ING Growth and Income Portfolio | |
| Class ADV | | $ | 1,000.00 | | | $ | 1,222.20 | | | | 1.10 | % | | $ | 6.16 | | | $ | 1,000.00 | | | $ | 1,019.66 | | | | 1.10 | % | | $ | 5.60 | | |
| Class I | | | 1,000.00 | | | | 1,224.60 | | | | 0.60 | | | | 3.36 | | | | 1,000.00 | | | | 1,022.18 | | | | 0.60 | | | | 3.06 | | |
| Class S | | | 1,000.00 | | | | 1,223.20 | | | | 0.85 | | | | 4.76 | | | | 1,000.00 | | | | 1,020.92 | | | | 0.85 | | | | 4.33 | | |
| Class S2 | | | 1,000.00 | | | | 1,222.70 | | | | 1.00 | | | | 5.60 | | | | 1,000.00 | | | | 1,020.16 | | | | 1.00 | | | | 5.09 | | |
15
SHAREHOLDER EXPENSE EXAMPLES (UNAUDITED) (CONTINUED)
| | | Actual Portfolio Return | | Hypothetical (5% return before expenses) | |
| ING Small Company Portfolio | | Beginning
Account
Value
July 1,
2010 | | Ending
Account
Value
December 31,
2010 | | Annualized
Expense
Ratio | | Expenses Paid
During the
Period Ended
December 31,
2010* | | Beginning
Account
Value
July 1,
2010 | | Ending
Account
Value
December 31,
2010 | | Annualized
Expense
Ratio | | Expenses Paid
During the
Period Ended
December 31,
2010* | |
| Class ADV | | $ | 1,000.00 | | | $ | 1,260.90 | | | | 1.34 | % | | $ | 7.64 | | | $ | 1,000.00 | | | $ | 1,018.45 | | | | 1.34 | % | | $ | 6.82 | | |
| Class I | | | 1,000.00 | | | | 1,264.80 | | | | 0.84 | | | | 4.80 | | | | 1,000.00 | | | | 1,020.97 | | | | 0.84 | | | | 4.28 | | |
| Class S | | | 1,000.00 | | | | 1,262.40 | | | | 1.09 | | | | 6.22 | | | | 1,000.00 | | | | 1,019.71 | | | | 1.09 | | | | 5.55 | | |
| Class S2 | | | 1,000.00 | | | | 1,262.40 | | | | 1.24 | | | | 7.07 | | | | 1,000.00 | | | | 1,018.95 | | | | 1.24 | | | | 6.31 | | |
| ING Intermediate Bond Portfolio | |
| Class ADV | | $ | 1,000.00 | | | $ | 1,026.50 | | | | 1.00 | % | | $ | 5.11 | | | $ | 1,000.00 | | | $ | 1,020.16 | | | | 1.00 | % | | $ | 5.09 | | |
| Class I | | | 1,000.00 | | | | 1,029.90 | | | | 0.50 | | | | 2.56 | | | | 1,000.00 | | | | 1,022.68 | | | | 0.50 | | | | 2.55 | | |
| Class S | | | 1,000.00 | | | | 1,028.20 | | | | 0.75 | | | | 3.83 | | | | 1,000.00 | | | | 1,021.42 | | | | 0.75 | | | | 3.82 | | |
| Class S2 | | | 1,000.00 | | | | 1,026.50 | | | | 0.90 | | | | 4.60 | | | | 1,000.00 | | | | 1,020.67 | | | | 0.90 | | | | 4.58 | | |
| ING Money Market Portfolio | |
| Class I | | $ | 1,000.00 | | | $ | 1,000.20 | | | | 0.31 | %(1) | | $ | 1.56 | | | $ | 1,000.00 | | | $ | 1,023.64 | | | | 0.31 | %(1) | | $ | 1.58 | | |
| Class S | | | 1,000.00 | | | | 1,000.00 | | | | 0.36 | (1) | | | 1.81 | | | | 1,000.00 | | | | 1,023.39 | | | | 0.36 | (1) | | | 1.84 | | |
| ING BlackRock Science and Technology Opportunities Portfolio | |
| Class ADV | | $ | 1,000.00 | | | $ | 1,281.30 | | | | 1.55 | % | | $ | 8.91 | | | $ | 1,000.00 | | | $ | 1,017.39 | | | | 1.55 | % | | $ | 7.88 | | |
| Class I | | | 1,000.00 | | | | 1,285.70 | | | | 1.05 | | | | 6.05 | | | | 1,000.00 | | | | 1,019.91 | | | | 1.05 | | | | 5.35 | | |
| Class S | | | 1,000.00 | | | | 1,282.30 | | | | 1.30 | | | | 7.48 | | | | 1,000.00 | | | | 1,018.65 | | | | 1.30 | | | | 6.61 | | |
| Class S2 | | | 1,000.00 | | | | 1,282.90 | | | | 1.45 | | | | 8.34 | | | | 1,000.00 | | | | 1,017.90 | | | | 1.45 | | | | 7.37 | | |
* Expenses are equal to each Portfolio's respective annualized expense ratios multiplied by the average account value over the period, multiplied by 184/365 to reflect the most recent fiscal half-year.
(1) Expense ratios reflect waivers of 0.03% and 0.13% of distribution and shareholder servicing fees for Classes I and S, respectively, in order to maintain a yield of not less than zero.
16
REPORT OF INDEPENDENT REGISTERED PUBLIC ACCOUNTING FIRM
The Shareholders, Board of Directors/Trustees
ING Balanced Portfolio, Inc., ING Variable Funds, ING Variable Portfolios, Inc., ING Intermediate Bond Portfolio, and ING Money Market Portfolio
We have audited the accompanying statements of assets and liabilities, including the portfolio of investments or summary portfolios of investments, as indicated, of ING Balanced Portfolio, ING Growth and Income Portfolio, a series of ING Variable Funds, ING Small Company Portfolio and ING BlackRock Science and Technology Opportunities Portfolio, each a series of ING Variable Portfolios, Inc., ING Intermediate Bond Portfolio, and ING Money Market Portfolio, as of December 31, 2010, and the related statements of operations for the year then ended, the statements of changes in net assets for each of the years in the two-year period then ended, and the financial highlights for each of the years or periods in the five-year period then ended. These financial statements and financial highlights are the responsibility of management. Our responsibility is to express an opinion on these financial statements and financial highlights based on our audits.
We conducted our audits in accordance with the standards of the Public Company Accounting Oversight Board (United States). Those standards require that we plan and perform the audit to obtain reasonable assurance about whether the financial statements and financial highlights are free of material misstatement. An audit includes examining, on a test basis, evidence supporting the amounts and disclosures in the financial statements. Our procedures included confirmation of securities owned as of December 31, 2010, by correspondence with the custodian, transfer agent, and brokers, or by other appropriate auditing procedures when replies from brokers were not received. An audit also includes assessing the accounting principles used and significant estimates made by management, as well as evaluating the overall financial statement presentation. We believe that our audits provide a reasonable basis for our opinion.
In our opinion, the financial statements and financial highlights referred to above present fairly, in all material respects, the financial position of the aforementioned portfolios as of December 31, 2010, and the results of their operations, the changes in their net assets, and the financial highlights for the periods specified in the first paragraph above, in conformity with U.S. generally accepted accounting principles.

Boston, Massachusetts
February 24, 2011
17
STATEMENTS OF ASSETS AND LIABILITIES AS OF DECEMBER 31, 2010
| | | ING
Balanced
Portfolio | | ING
Growth
and Income
Portfolio | | ING
Small
Company
Portfolio | |
| ASSETS: | |
| Investments in securities at value+* | | $ | 632,026,619 | | | $ | 2,686,321,310 | | | $ | 625,050,403 | | |
| Short-term investments at value** | | | 26,549,259 | | | | 128,178,767 | | | | 15,318,226 | | |
| Cash | | | 41,758 | | | | 224,041 | | | | 328,938 | | |
| Cash collateral for futures | | | 2,383,527 | | | | — | | | | — | | |
| Derivatives collateral, at value (Note 2) | | | 980,000 | | | | — | | | | — | | |
| Foreign currencies at value*** | | | 447,131 | | | | — | | | | — | | |
| Foreign cash collateral for futures**** | | | 406,690 | | | | — | | | | — | | |
| Receivables: | |
| Investment securities sold | | | 14,029,027 | | | | — | | | | 2,101,263 | | |
Investment securities sold on a delayed-delivery
or when-issued basis | | | 9,431,305 | | | | — | | | | — | | |
| Fund shares sold | | | 60,919 | | | | 107,923 | | | | 148,024 | | |
| Dividends and interest | | | 2,903,060 | | | | 2,911,055 | | | | 677,660 | | |
| Unrealized appreciation on forward foreign currency contracts | | | 2,560,193 | | | | — | | | | — | | |
| Upfront payments made on swap agreements | | | 167,974 | | | | — | | | | — | | |
| Unrealized appreciation on swap agreements | | | 30,993 | | | | — | | | | — | | |
| Prepaid expenses | | | 11,347 | | | | 44,295 | | | | 9,450 | | |
| Total assets | | | 692,029,802 | | | | 2,817,787,391 | | | | 643,633,964 | | |
| LIABILITIES: | |
| Payable for investment securities purchased | | | 14,814,416 | | | | 709,837 | | | | 2,200,751 | | |
Payable for investment securities purchased on a delayed-delivery
or when-issued basis | | | 32,266,220 | | | | — | | | | — | | |
| Payable for fund shares redeemed | | | 285,056 | | | | 3,522,644 | | | | 5,852,043 | | |
| Payable upon receipt of securities loaned | | | 18,547,690 | | | | 71,347,354 | | | | 5,706,180 | | |
| Unrealized depreciation on forward foreign currency contracts | | | 2,568,076 | | | | — | | | | — | | |
| Upfront payments received on swap agreements | | | 189,180 | | | | — | | | | — | | |
| Unrealized depreciation on swap agreements | | | 621,736 | | | | — | | | | — | | |
| Payable to affiliates | | | 293,723 | | | | 1,381,429 | | | | 457,634 | | |
| Payable for directors fees | | | 3,113 | | | | 12,509 | | | | 2,701 | | |
| Other accrued expenses and liabilities | | | 152,181 | | | | 447,698 | | | | 87,160 | | |
| Written options^, at fair value | | | 94,388 | | | | — | | | | — | | |
| Total liabilities | | | 69,835,779 | | | | 77,421,471 | | | | 14,306,469 | | |
| NET ASSETS | | $ | 622,194,023 | | | $ | 2,740,365,920 | | | $ | 629,327,495 | | |
| NET ASSETS WERE COMPRISED OF: | |
| Paid-in capital | | $ | 729,137,953 | | | $ | 2,935,426,170 | | | $ | 567,481,949 | | |
| Undistributed net investment income | | | 16,455,621 | | | | 9,058 | | | | 2,207,911 | | |
| Accumulated net realized loss | | | (163,164,149 | ) | | | (661,764,439 | ) | | | (69,563,001 | ) | |
| Net unrealized appreciation | | | 39,764,598 | | | | 466,695,131 | | | | 129,200,636 | | |
| NET ASSETS | | $ | 622,194,023 | | | $ | 2,740,365,920 | | | $ | 629,327,495 | | |
| + Including securities loaned at value | | $ | 18,140,531 | | | $ | 69,727,858 | | | $ | 5,587,097 | | |
| * Cost of investments in securities | | $ | 591,720,548 | | | $ | 2,219,462,869 | | | $ | 495,426,813 | | |
| ** Cost of short-term investments | | $ | 26,874,690 | | | $ | 128,343,354 | | | $ | 15,741,180 | | |
| *** Cost of foreign currencies | | $ | 437,110 | | | $ | — | | | $ | — | | |
| **** Cost of foreign cash collateral for futures | | $ | 405,507 | | | $ | — | | | $ | — | | |
| ^ Premiums received on written options | | $ | 293,535 | | | $ | — | | | $ | — | | |
See Accompanying Notes to Financial Statements
18
STATEMENTS OF ASSETS AND LIABILITIES AS OF DECEMBER 31, 2010 (CONTINUED)
| | | ING
Balanced
Portfolio | | ING
Growth
and Income
Portfolio | | ING
Small
Company
Portfolio | |
| Class ADV: | |
| Net assets | | | n/a | | | $ | 6,037,481 | | | $ | 3,252,788 | | |
| Shares authorized | | | n/a | | | | unlimited | | | | 100,000,000 | | |
| Par value | | | n/a | | | $ | 1.000 | | | $ | 0.001 | | |
| Shares outstanding | | | n/a | | | | 277,746 | | | | 180,933 | | |
| Net asset value and redemption price per share | | | n/a | | | $ | 21.74 | | | $ | 17.98 | | |
| Class I: | |
| Net assets | | $ | 614,260,911 | | | $ | 2,253,794,002 | | | $ | 503,739,380 | | |
| Shares authorized | | | 500,000,000 | | | | unlimited | | | | 100,000,000 | | |
| Par value | | $ | 0.001 | | | $ | 1.000 | | | $ | 0.001 | | |
| Shares outstanding | | | 53,037,514 | | | | 102,720,601 | | | | 27,472,895 | | |
| Net asset value and redemption price per share | | $ | 11.58 | | | $ | 21.94 | | | $ | 18.34 | | |
| Class S: | |
| Net assets | | $ | 7,933,112 | | | $ | 480,529,350 | | | $ | 122,285,691 | | |
| Shares authorized | | | 500,000,000 | | | | unlimited | | | | 100,000,000 | | |
| Par value | | $ | 0.001 | | | $ | 1.000 | | | $ | 0.001 | | |
| Shares outstanding | | | 689,555 | | | | 22,071,149 | | | | 6,758,763 | | |
| Net asset value and redemption price per share | | $ | 11.50 | | | $ | 21.77 | | | $ | 18.09 | | |
| Class S2: | |
| Net assets | | | n/a | | | $ | 5,087 | | | $ | 49,636 | | |
| Shares authorized | | | n/a | | | | unlimited | | | | 100,000,000 | | |
| Par value | | | n/a | | | $ | 1.000 | | | $ | 0.001 | | |
| Shares outstanding | | | n/a | | | | 236 | | | | 2,751 | | |
| Net asset value and redemption price per share | | | n/a | | | $ | 21.52 | | | $ | 18.04 | | |
See Accompanying Notes to Financial Statements
19
STATEMENTS OF ASSETS AND LIABILITIES AS OF DECEMBER 31, 2010
| | | ING
Intermediate
Bond
Portfolio | | ING
Money
Market
Portfolio | | ING
BlackRock Science and
Technology Opportunities
Portfolio | |
| ASSETS: | |
| Investments in securities at value+* | | $ | 2,703,761,087 | | | $ | — | | | $ | 388,384,956 | | |
| Short-term investments at value** | | | 52,987,668 | | | | 597,605 | | | | 21,567,413 | | |
| Short-term investments at amortized cost | | | — | | | | 832,669,564 | | | | — | | |
| Repurchase agreements | | | — | | | | 240,855,000 | | | | — | | |
| Cash | | | 5,603,560 | | | | 551 | | | | — | | |
| Cash collateral for futures | | | 2,398,134 | | | | — | | | | — | | |
| Derivatives collateral, at value (Note 2) | | | 3,514,000 | | | | — | | | | — | | |
| Foreign currencies at value*** | | | 1,392,232 | | | | — | | | | 695,896 | | |
| Receivables: | |
| Investment securities sold | | | 9,920,592 | | | | — | | | | — | | |
Investment securities sold on a delayed-delivery
or when-issued basis | | | 143,893,058 | | | | — | | | | — | | |
| Fund shares sold | | | 13,062,217 | | | | 3,635 | | | | 682 | | |
| Dividends and interest | | | 29,244,163 | | | | 595,132 | | | | 78,470 | | |
Unrealized appreciation on forward foreign
currency contracts | | | — | | | | — | | | | 126,112 | | |
| Upfront payments made on swap agreements | | | 2,245,812 | | | | — | | | | — | | |
| Unrealized appreciation on swap agreements | | | 62,616 | | | | — | | | | — | | |
| Prepaid expenses | | | 48,571 | | | | 25,535 | | | | 8,040 | | |
| Total assets | | | 2,968,133,710 | | | | 1,074,747,022 | | | | 410,861,569 | | |
| LIABILITIES: | |
| Payable for investment securities purchased | | | 36,130,753 | | | | — | | | | — | | |
Payable for investment securities purchased on
a delayed-delivery or when-issued basis | | | 386,018,141 | | | | — | | | | — | | |
| Payable for fund shares redeemed | | | 5,524,400 | | | | 3,248,467 | | | | 1,476,945 | | |
| Payable for derivatives collateral, at value (Note 2) | | | 410,000 | | | | — | | | | — | | |
| Payable upon receipt of securities loaned | | | 9,829,180 | | | | 747,006 | | | | 7,302,409 | | |
Unrealized depreciation on forward foreign
currency contracts | | | 6,392,110 | | | | — | | | | 59,601 | | |
| Upfront payments received on swap agreements | | | 2,512,996 | | | | — | | | | — | | |
| Unrealized depreciation on swap agreements | | | 5,328,312 | | | | — | | | | — | | |
| Payable to affiliates | | | 1,240,957 | | | | 280,199 | | | | 400,721 | | |
| Payable for directors fees | | | 12,752 | | | | 5,987 | | | | 1,716 | | |
| Other accrued expenses and liabilities | | | 404,508 | | | | 205,132 | | | | 58,035 | | |
| Total liabilities | | | 453,804,109 | | | | 4,486,791 | | | | 9,299,427 | | |
| NET ASSETS | | $ | 2,514,329,601 | | | $ | 1,070,260,231 | | | $ | 401,562,142 | | |
| NET ASSETS WERE COMPRISED OF: | |
| Paid-in capital | | $ | 2,842,373,224 | | | $ | 1,070,443,676 | | | $ | 333,930,354 | | |
Undistributed (distributions in excess of) net investment
income/accumulated net investment loss | | | 7,614,810 | | | | — | | | | (66,455 | ) | |
| Accumulated net realized loss | | | (407,347,887 | ) | | | (34,044 | ) | | | (29,726,232 | ) | |
| Net unrealized appreciation or depreciation | | | 71,689,454 | | | | (149,401 | ) | | | 97,424,475 | | |
| NET ASSETS | | $ | 2,514,329,601 | | | $ | 1,070,260,231 | | | $ | 401,562,142 | | |
| + Including securities loaned at value | | $ | 9,665,366 | | | $ | — | | | $ | 7,049,598 | | |
| * Cost of investments in securities | | $ | 2,618,197,207 | | | $ | — | | | $ | 291,010,051 | | |
| ** Cost of short-term investments | | $ | 54,829,180 | | | $ | 747,006 | | | $ | 21,646,773 | | |
| *** Cost of foreign currencies | | $ | 1,389,148 | | | $ | — | | | $ | 636,451 | | |
See Accompanying Notes to Financial Statements
20
STATEMENTS OF ASSETS AND LIABILITIES AS OF DECEMBER 31, 2010 (CONTINUED)
| | | ING
Intermediate
Bond
Portfolio | | ING
Money
Market
Portfolio | | ING
BlackRock Science and
Technology Opportunities
Portfolio | |
| Class ADV: | |
| Net assets | | $ | 4,314,975 | | | | n/a | | | $ | 5,608,701 | | |
| Shares authorized | | | unlimited | | | | n/a | | | | 100,000,000 | | |
| Par value | | $ | 1.000 | | | | n/a | | | $ | 0.001 | | |
| Shares outstanding | | | 358,289 | | | | n/a | | | | 962,088 | | |
| Net asset value and redemption price per share | | $ | 12.04 | | | | n/a | | | $ | 5.83 | | |
| Class I: | |
| Net assets | | $ | 1,217,279,965 | | | $ | 1,069,947,193 | | | $ | 121,442,851 | | |
| Shares authorized | | | unlimited | | | | unlimited | | | | 100,000,000 | | |
| Par value | | $ | 1.000 | | | $ | 1.000 | | | $ | 0.001 | | |
| Shares outstanding | | | 100,873,734 | | | | 1,069,798,389 | | | | 20,436,830 | | |
| Net asset value and redemption price per share | | $ | 12.07 | | | $ | 1.00 | | | $ | 5.94 | | |
| Class S: | |
| Net assets | | $ | 1,292,731,302 | | | $ | 313,038 | | | $ | 274,470,844 | | |
| Shares authorized | | | unlimited | | | | unlimited | | | | 100,000,000 | | |
| Par value | | $ | 1.000 | | | $ | 1.000 | | | $ | 0.001 | | |
| Shares outstanding | | | 107,637,360 | | | | 313,015 | | | | 46,813,963 | | |
| Net asset value and redemption price per share | | $ | 12.01 | | | $ | 1.00 | | | $ | 5.86 | | |
| Class S2: | |
| Net assets | | $ | 3,359 | | | | n/a | | | $ | 39,746 | | |
| Shares authorized | | | unlimited | | | | n/a | | | | 100,000,000 | | |
| Par value | | $ | 1.000 | | | | n/a | | | $ | 0.001 | | |
| Shares outstanding | | | 278 | | | | n/a | | | | 6,798 | | |
| Net asset value and redemption price per share | | $ | 12.08 | | | | n/a | | | $ | 5.85 | | |
See Accompanying Notes to Financial Statements
21
STATEMENTS OF OPERATIONS FOR THE YEAR ENDED DECEMBER 31, 2010
| | | ING
Balanced
Portfolio | | ING
Growth
and Income
Portfolio | | ING
Small
Company
Portfolio | |
| INVESTMENT INCOME: | |
| Dividends, net of foreign taxes withheld*(1) | | $ | 7,667,475 | | | $ | 43,030,168 | | | $ | 7,241,779 | | |
| Interest, net of foreign taxes withheld* | | | 11,528,260 | | | | 30 | | | | 398 | | |
| Securities lending income, net | | | 63,311 | | | | 43,685 | | | | 74,006 | | |
| Total investment income | | | 19,259,046 | | | | 43,073,883 | | | | 7,316,183 | | |
| EXPENSES: | |
| Investment management fees | | | 3,112,916 | | | | 12,509,222 | | | | 4,051,441 | | |
| Distribution and service fees: | |
| Class ADV | | | — | | | | 10,930 | | | | 4,522 | | |
| Class S | | | 19,859 | | | | 1,151,631 | | | | 217,984 | | |
| Class S2 | | | 6 | | | | 22 | | | | 109 | | |
| Transfer agent fees | | | 753 | | | | 8,503 | | | | 756 | | |
| Administrative service fees | | | 342,410 | | | | 1,375,973 | | | | 297,097 | | |
| Shareholder reporting expense | | | 53,160 | | | | 136,081 | | | | 25,274 | | |
| Professional fees | | | 96,144 | | | | 149,928 | | | | 34,750 | | |
| Custody and accounting expense | | | 200,479 | | | | 495,590 | | | | 66,825 | | |
| Directors fees | | | 30,909 | | | | 148,735 | | | | 22,701 | | |
| Miscellaneous expense | | | 38,659 | | | | 169,613 | | | | 36,646 | | |
| Interest expense | | | 2,391 | | | | 3,287 | | | | 346 | | |
| Total expenses | | | 3,897,686 | | | | 16,159,515 | | | | 4,758,451 | | |
| Net waived and reimbursed fees | | | (17,089 | ) | | | (43,057 | ) | | | (8,881 | ) | |
| Net expenses | | | 3,880,597 | | | | 16,116,458 | | | | 4,749,570 | | |
| Net investment income | | | 15,378,449 | | | | 26,957,425 | | | | 2,566,613 | | |
| REALIZED AND UNREALIZED GAIN (LOSS): | |
| Net realized gain (loss) on: | |
| Investments | | | 74,555,219 | | | | 277,163,301 | | | | 78,068,411 | | |
| Foreign currency related transactions | | | (330,614 | ) | | | (3,248 | ) | | | — | | |
| Futures | | | 786,874 | | | | 2,849,405 | | | | — | | |
| Swaps | | | (149,841 | ) | | | — | | | | — | | |
| Written options | | | 466,371 | | | | — | | | | — | | |
| Net realized gain | | | 75,328,009 | | | | 280,009,458 | | | | 78,068,411 | | |
| Net change in unrealized appreciation or depreciation on: | |
| Investments | | | (7,605,632 | ) | | | 41,876,840 | | | | 45,929,479 | | |
| Foreign currency related transactions | | | (54,297 | ) | | | (3,545 | ) | | | — | | |
| Futures | | | (337,122 | ) | | | (240,734 | ) | | | — | | |
| Swaps | | | (495,547 | ) | | | — | | | | — | | |
| Written options | | | 199,147 | | | | — | | | | — | | |
| Net change in unrealized appreciation or depreciation | | | (8,293,451 | ) | | | 41,632,561 | | | | 45,929,479 | | |
| Net realized and unrealized gain | | | 67,034,558 | | | | 321,642,019 | | | | 123,997,890 | | |
| Increase in net assets resulting from operations | | $ | 82,413,007 | | | $ | 348,599,444 | | | $ | 126,564,503 | | |
| * Foreign taxes withheld | | $ | 212,951 | | | $ | 447,995 | | | $ | 2,441 | | |
| (1) Dividends from affiliates | | $ | 37,187 | | | $ | 83,265 | | | $ | 17,121 | | |
See Accompanying Notes to Financial Statements
22
STATEMENTS OF OPERATIONS FOR THE YEAR ENDED DECEMBER 31, 2010
| | | ING
Intermediate
Bond
Portfolio | | ING
Money
Market
Portfolio | | ING
BlackRock Science and
Technology Opportunities
Portfolio | |
| INVESTMENT INCOME: | |
| Dividends, net of foreign taxes withheld*(1) | | $ | 454,673 | | | $ | — | | | $ | 2,883,192 | | |
| Interest, net of foreign taxes withheld* | | | 137,787,238 | | | | 3,990,858 | | | | 1,831 | | |
| Securities lending income, net | | | 99,230 | | | | — | | | | 31,819 | | |
| Total investment income | | | 138,341,141 | | | | 3,990,858 | | | | 2,916,842 | | |
| EXPENSES: | |
| Investment management fees | | | 10,201,809 | | | | 2,991,847 | | | | 3,261,318 | | |
| Distribution and service fees: | |
| Class ADV | | | 3,778 | | | | — | | | | 8,284 | | |
| Class S | | | 3,295,392 | | | | 449 | | | | 591,130 | | |
| Class S2 | | | 17 | | | | — | | | | 50 | | |
| Transfer agent fees | | | 5,038 | | | | 1,381 | | | | 668 | | |
| Administrative service fees | | | 1,402,703 | | | | 658,186 | | | | 188,807 | | |
| Shareholder reporting expense | | | 166,025 | | | | 51,221 | | | | 16,801 | | |
| Professional fees | | | 196,953 | | | | 54,230 | | | | 29,840 | | |
| Custody and accounting expense | | | 402,190 | | | | 130,177 | | | | 62,619 | | |
| Directors fees | | | 144,661 | | | | 62,073 | | | | 14,154 | | |
| Miscellaneous expense | | | 204,590 | | | | 76,563 | | | | 22,364 | | |
| Interest expense | | | 3,839 | | | | — | | | | 686 | | |
| Total expenses | | | 16,026,995 | | | | 4,026,127 | | | | 4,196,721 | | |
| Net waived and reimbursed fees | | | (24,988 | ) | | | (314,136 | ) | | | (10 | ) | |
| Net expenses | | | 16,002,007 | | | | 3,711,991 | | | | 4,196,711 | | |
| Net investment income (loss) | | | 122,339,134 | | | | 278,867 | | | | (1,279,869 | ) | |
| REALIZED AND UNREALIZED GAIN (LOSS): | |
| Net realized gain (loss) on: | |
| Investments | | | 70,006,035 | | | | 210,645 | | | | 22,540,560 | | |
| Foreign currency related transactions | | | (8,396,923 | ) | | | — | | | | (1,058,197 | ) | |
| Futures | | | (3,583,064 | ) | | | — | | | | — | | |
| Swaps | | | (4,321,617 | ) | | | — | | | | — | | |
| Written options | | | 2,267,173 | | | | — | | | | — | | |
| Net realized gain | | | 55,971,604 | | | | 210,645 | | | | 21,482,363 | | |
| Net change in unrealized appreciation or depreciation on: | |
| Investments | | | 71,352,490 | | | | — | | | | 37,767,579 | | |
| Foreign currency related transactions | | | (6,804,550 | ) | | | — | | | | (177,257 | ) | |
| Futures | | | (4,271,889 | ) | | | — | | | | — | | |
| Swaps | | | (3,774,758 | ) | | | — | | | | — | | |
| Net change in unrealized appreciation or depreciation | | | 56,501,293 | | | | — | | | | 37,590,322 | | |
| Net realized and unrealized gain | | | 112,472,897 | | | | 210,645 | | | | 59,072,685 | | |
| Increase in net assets resulting from operations | | $ | 234,812,031 | | | $ | 489,512 | | | $ | 57,792,816 | | |
| * Foreign taxes withheld | | $ | 3,231 | | | $ | — | | | $ | 97,984 | | |
| (1) Dividends from affiliates | | $ | 55,750 | | | $ | — | | | $ | 2,090 | | |
See Accompanying Notes to Financial Statements
23
STATEMENTS OF CHANGES IN NET ASSETS
| | | ING Balanced Portfolio | | ING Growth and Income Portfolio | |
| | | Year Ended
December 31,
2010 | | Year Ended
December 31,
2009 | | Year Ended
December 31,
2010 | | Year Ended
December 31,
2009 | |
| FROM OPERATIONS: | |
| Net investment income | | $ | 15,378,449 | | | $ | 15,275,573 | | | $ | 26,957,425 | | | $ | 33,198,999 | | |
| Net realized gain (loss) | | | 75,328,009 | | | | (76,149,640 | ) | | | 280,009,458 | | | | (47,564,144 | ) | |
| Net change in unrealized appreciation or depreciation | | | (8,293,451 | ) | | | 168,234,494 | | | | 41,632,561 | | | | 600,589,394 | | |
| Increase in net assets resulting from operations | | | 82,413,007 | | | | 107,360,427 | | | | 348,599,444 | | | | 586,224,249 | | |
| FROM DISTRIBUTIONS TO SHAREHOLDERS: | |
| Net investment income: | |
| Class ADV | | | — | | | | (24 | ) | | | (50,616 | ) | | | (12,868 | ) | |
| Class I | | | (17,430,470 | ) | | | (27,411,197 | ) | | | (23,102,823 | ) | | | (27,834,564 | ) | |
| Class S | | | (209,221 | ) | | | (285,533 | ) | | | (3,810,949 | ) | | | (5,611,654 | ) | |
| Class S2 | | | — | | | | (164 | ) | | | (37 | ) | | | (21 | ) | |
| Total distributions | | | (17,639,691 | ) | | | (27,696,918 | ) | | | (26,964,425 | ) | | | (33,459,107 | ) | |
| FROM CAPITAL SHARE TRANSACTIONS: | |
| Net proceeds from sale of shares | | | 4,763,613 | | | | 17,370,766 | | | | 108,981,973 | | | | 232,270,324 | | |
| Proceeds from shares issued in merger (Note 14) | | | — | | | | — | | | | 133,730,864 | | | | 169,747,571 | | |
| Reinvestment of distributions | | | 17,639,691 | | | | 27,696,730 | | | | 26,946,348 | | | | 33,439,582 | | |
| | | | 22,403,304 | | | | 45,067,496 | | | | 269,659,185 | | | | 435,457,477 | | |
| Cost of shares redeemed | | | (103,467,259 | ) | | | (95,745,942 | ) | | | (424,150,059 | ) | | | (328,028,775 | ) | |
Net increase (decrease) in net assets resulting from capital
share transactions | | | (81,063,955 | ) | | | (50,678,446 | ) | | | (154,490,874 | ) | | | 107,428,702 | | |
| Net increase (decrease) in net assets | | | (16,290,639 | ) | | | 28,985,063 | | | | 167,144,145 | | | | 660,193,844 | | |
| NET ASSETS: | |
| Beginning of year | | | 638,484,662 | | | | 609,499,599 | | | | 2,573,221,775 | | | | 1,913,027,931 | | |
| End of year | | $ | 622,194,023 | | | $ | 638,484,662 | | | $ | 2,740,365,920 | | | $ | 2,573,221,775 | | |
| Undistributed net investment income at end of year | | $ | 16,455,621 | | | $ | 17,032,817 | | | $ | 9,058 | | | $ | — | | |
See Accompanying Notes to Financial Statements
24
STATEMENTS OF CHANGES IN NET ASSETS
| | | ING Small Company Portfolio | | ING Intermediate Bond Portfolio | |
| | | Year Ended
December 31,
2010 | | Year Ended
December 31,
2009 | | Year Ended
December 31,
2010 | | Year Ended
December 31,
2009 | |
| FROM OPERATIONS: | |
| Net investment income | | $ | 2,566,613 | | | $ | 3,187,842 | | | $ | 122,339,134 | | | $ | 125,593,975 | | |
| Net realized gain (loss) | | | 78,068,411 | | | | (63,907,060 | ) | | | 55,971,604 | | | | (266,342,197 | ) | |
| Net change in unrealized appreciation or depreciation | | | 45,929,479 | | | | 200,263,455 | | | | 56,501,293 | | | | 444,410,693 | | |
| Increase in net assets resulting from operations | | | 126,564,503 | | | | 139,544,237 | | | | 234,812,031 | | | | 303,662,471 | | |
| FROM DISTRIBUTIONS TO SHAREHOLDERS: | |
| Net investment income: | |
| Class ADV | | | (343 | ) | | | (21 | ) | | | (208,636 | ) | | | (54 | ) | |
| Class I | | | (2,439,964 | ) | | | (3,140,359 | ) | | | (60,836,973 | ) | | | (81,850,494 | ) | |
| Class S | | | (298,881 | ) | | | (330,410 | ) | | | (61,395,211 | ) | | | (75,398,390 | ) | |
| Class S2 | | | (16 | ) | | | (26 | ) | | | (163 | ) | | | (213 | ) | |
| Total distributions | | | (2,739,204 | ) | | | (3,470,816 | ) | | | (122,440,983 | ) | | | (157,249,151 | ) | |
| FROM CAPITAL SHARE TRANSACTIONS: | |
| Net proceeds from sale of shares | | | 93,100,818 | | | | 163,340,263 | | | | 271,722,100 | | | | 368,789,890 | | |
| Proceeds from shares issued in merger (Note 14) | | | 39,171,474 | | | | — | | | | — | | | | — | | |
| Reinvestment of distributions | | | 2,739,166 | | | | 3,470,762 | | | | 122,418,062 | | | | 157,218,648 | | |
| | | | 135,011,458 | | | | 166,811,025 | | | | 394,140,162 | | | | 526,008,538 | | |
| Cost of shares redeemed | | | (146,270,085 | ) | | | (251,517,739 | ) | | | (508,433,813 | ) | | | (1,113,574,605 | ) | |
Net decrease in net assets resulting from capital
share transactions | | | (11,258,627 | ) | | | (84,706,714 | ) | | | (114,293,651 | ) | | | (587,566,067 | ) | |
| Net increase (decrease) in net assets | | | 112,566,672 | | | | 51,366,707 | | | | (1,922,603 | ) | | | (441,152,747 | ) | |
| NET ASSETS: | |
| Beginning of year | | | 516,760,823 | | | | 465,394,116 | | | | 2,516,252,204 | | | | 2,957,404,951 | | |
| End of year | | $ | 629,327,495 | | | $ | 516,760,823 | | | $ | 2,514,329,601 | | | $ | 2,516,252,204 | | |
| Undistributed net investment income at end of year | | $ | 2,207,911 | | | $ | 2,738,722 | | | $ | 7,614,810 | | | $ | 303,718 | | |
See Accompanying Notes to Financial Statements
25
STATEMENTS OF CHANGES IN NET ASSETS
| | | ING Money Market Portfolio | | ING BlackRock
Science and Technology
Opportunities Portfolio | |
| | | Year Ended
December 31,
2010 | | Year Ended
December 31,
2009 | | Year Ended
December 31,
2010 | | Year Ended
December 31,
2009 | |
| FROM OPERATIONS: | |
| Net investment income (loss) | | $ | 278,867 | | | $ | 4,033,241 | | | $ | (1,279,869 | ) | | $ | (712,173 | ) | |
| Net realized gain (loss) | | | 210,645 | | | | 1,060,979 | | | | 21,482,363 | | | | (16,152,304 | ) | |
| Net change in unrealized appreciation or depreciation | | | — | | | | — | | | | 37,590,322 | | | | 115,546,601 | | |
| Increase in net assets resulting from operations | | | 489,512 | | | | 5,094,220 | | | | 57,792,816 | | | | 98,682,124 | | |
| FROM DISTRIBUTIONS TO SHAREHOLDERS: | |
| Net investment income: | |
| Class I | | | (490,254 | ) | | | (4,611,290 | ) | | | — | | | | — | | |
| Class S | | | (1 | ) | | | — | | | | — | | | | — | | |
| Net realized gains: | |
| Class I | | | — | | | | (674,273 | ) | | | — | | | | — | | |
| Class S | | | — | | | | — | | | | — | | | | — | | |
| Return of capital: | |
| Class I | | | (2,509,972 | ) | | | — | | | | — | | | | — | | |
| Class S | | | — | | | | — | | | | — | | | | — | | |
| Total distributions | | | (3,000,227 | ) | | | (5,285,563 | ) | | | — | | | | — | | |
| FROM CAPITAL SHARE TRANSACTIONS: | |
| Net proceeds from sale of shares | | | 78,344,418 | | | | 83,164,700 | | | | 96,792,335 | | | | 128,558,035 | | |
| Reinvestment of distributions | | | 3,000,227 | | | | 5,285,563 | | | | — | | | | — | | |
| | | | 81,344,645 | | | | 88,450,263 | | | | 96,792,335 | | | | 128,558,035 | | |
| Cost of shares redeemed | | | (337,002,648 | ) | | | (558,662,896 | ) | | | (83,946,139 | ) | | | (41,766,442 | ) | |
Net increase (decrease) in net assets resulting from
capital share transactions | | | (255,658,003 | ) | | | (470,212,633 | ) | | | 12,846,196 | | | | 86,791,593 | | |
| Net increase (decrease) in net assets | | | (258,168,718 | ) | | | (470,403,976 | ) | | | 70,639,012 | | | | 185,473,717 | | |
| NET ASSETS: | |
| Beginning of year | | | 1,328,428,949 | | | | 1,798,832,925 | | | | 330,923,130 | | | | 145,449,413 | | |
| End of year | | $ | 1,070,260,231 | | | $ | 1,328,428,949 | | | $ | 401,562,142 | | | $ | 330,923,130 | | |
Undistributed (distributions in excess of) net investment
income/accumulated net investment loss at end of year | | $ | — | | | $ | — | | | $ | (66,455 | ) | | $ | (283,187 | ) | |
See Accompanying Notes to Financial Statements
26
FINANCIAL HIGHLIGHTS
Selected data for a share of beneficial interest outstanding throughout each year or period.
| | | | | Income (loss)
from investment
operations | | | | Less distributions | | | |
| | | Net asset value, beginning of year or period | | Net investment income (loss) | | Net realized and unrealized gain (loss) | | Total from investment operations | | From net investment income | | From net realized gains | | From return of capital | | Total distributions | | Net asset value, end of year or period | |
| | | | | | | | | | | | | | | | | | | | |
| Year or period ended | | ($) | | ($) | | ($) | | ($) | | ($) | | ($) | | ($) | | ($) | | ($) | |
| ING Balanced Portfolio | | | |
| Class I | | | |
| 12-31-10 | | | 10.42 | | | | 0.27 | • | | | 1.19 | | | | 1.46 | | | | 0.30 | | | | — | | | | — | | | | 0.30 | | | | 11.58 | | |
| 12-31-09 | | | 9.18 | | | | 0.24 | • | | | 1.43 | | | | 1.67 | | | | 0.43 | | | | — | | | | — | | | | 0.43 | | | | 10.42 | | |
| 12-31-08 | | | 14.45 | | | | 0.40 | | | | (4.07 | ) | | | (3.67 | ) | | | 0.45 | | | | 1.15 | | | | — | | | | 1.60 | | | | 9.18 | | |
| 12-31-07 | | | 14.65 | | | | 0.39 | • | | | 0.38 | | | | 0.77 | | | | 0.39 | | | | 0.58 | | | | — | | | | 0.97 | | | | 14.45 | | |
| 12-31-06 | | | 13.64 | | | | 0.34 | • | | | 1.00 | | | | 1.34 | | | | 0.33 | | | | — | | | | — | | | | 0.33 | | | | 14.65 | | |
| Class S | | | |
| 12-31-10 | | | 10.36 | | | | 0.24 | | | | 1.18 | | | | 1.42 | | | | 0.28 | | | | — | | | | — | | | | 0.28 | | | | 11.50 | | |
| 12-31-09 | | | 9.12 | | | | 0.21 | • | | | 1.43 | | | | 1.64 | | | | 0.40 | | | | — | | | | — | | | | 0.40 | | | | 10.36 | | |
| 12-31-08 | | | 14.36 | | | | 0.34 | | | | (4.02 | ) | | | (3.68 | ) | | | 0.41 | | | | 1.15 | | | | — | | | | 1.56 | | | | 9.12 | | |
| 12-31-07 | | | 14.57 | | | | 0.35 | • | | | 0.38 | | | | 0.73 | | | | 0.36 | | | | 0.58 | | | | — | | | | 0.94 | | | | 14.36 | | |
| 12-31-06 | | | 13.58 | | | | 0.32 | • | | | 0.97 | | | | 1.29 | | | | 0.30 | | | | — | | | | — | | | | 0.30 | | | | 14.57 | | |
| ING Growth and Income Portfolio | | | |
| Class ADV | | | |
| 12-31-10 | | | 19.31 | | | | 0.15 | • | | | 2.47 | | | | 2.62 | | | | 0.19 | | | | — | | | | — | | | | 0.19 | | | | 21.74 | | |
| 12-31-09 | | | 15.04 | | | | 0.18 | • | | | 4.29 | | | | 4.47 | | | | 0.20 | | | | — | | | | — | | | | 0.20 | | | | 19.31 | | |
| 12-31-08 | | | 24.61 | | | | 0.23 | • | | | (9.58 | ) | | | (9.35 | ) | | | 0.22 | | | | — | | | | — | | | | 0.22 | | | | 15.04 | | |
| 12-31-07 | | | 23.38 | | | | 0.72 | • | | | 0.84 | | | | 1.56 | | | | 0.33 | | | | — | | | | — | | | | 0.33 | | | | 24.61 | | |
| 12-20-06(4)-12-31-06 | | | 23.70 | | | | 0.01 | • | | | (0.06 | ) | | | (0.05 | ) | | | 0.27 | | | | — | | | | — | | | | 0.27 | | | | 23.38 | | |
| Class I | | | |
| 12-31-10 | | | 19.42 | | | | 0.22 | | | | 2.53 | | | | 2.75 | | | | 0.23 | | | | — | | | | — | | | | 0.23 | | | | 21.94 | | |
| 12-31-09 | | | 15.11 | | | | 0.27 | • | | | 4.30 | | | | 4.57 | | | | 0.26 | | | | — | | | | — | | | | 0.26 | | | | 19.42 | | |
| 12-31-08 | | | 24.76 | | | | 0.36 | | | | (9.69 | ) | | | (9.33 | ) | | | 0.32 | | | | — | | | | — | | | | 0.32 | | | | 15.11 | | |
| 12-31-07 | | | 23.38 | | | | 0.33 | • | | | 1.40 | | | | 1.73 | | | | 0.35 | | | | — | | | | — | | | | 0.35 | | | | 24.76 | | |
| 12-31-06 | | | 20.71 | | | | 0.25 | • | | | 2.69 | | | | 2.94 | | | | 0.27 | | | | — | | | | — | | | | 0.27 | | | | 23.38 | | |
| Class S | | | |
| 12-31-10 | | | 19.28 | | | | 0.18 | | | | 2.48 | | | | 2.66 | | | | 0.17 | | | | — | | | | — | | | | 0.17 | | | | 21.77 | | |
| 12-31-09 | | | 15.00 | | | | 0.19 | | | | 4.32 | | | | 4.51 | | | | 0.23 | | | | — | | | | — | | | | 0.23 | | | | 19.28 | | |
| 12-31-08 | | | 24.63 | | | | 0.25 | • | | | (9.58 | ) | | | (9.33 | ) | | | 0.30 | | | | — | | | | — | | | | 0.30 | | | | 15.00 | | |
| 12-31-07 | | | 23.30 | | | | 0.37 | • | | | 1.29 | | | | 1.66 | | | | 0.33 | | | | — | | | | — | | | | 0.33 | | | | 24.63 | | |
| 12-31-06 | | | 20.69 | | | | 0.20 | • | | | 2.64 | | | | 2.84 | | | | 0.23 | | | | — | | | | — | | | | 0.23 | | | | 23.30 | | |
| Class S2 | | | |
| 12-31-10 | | | 19.26 | | | | 0.14 | | | | 2.28 | | | | 2.42 | | | | 0.16 | | | | — | | | | — | | | | 0.16 | | | | 21.52 | | |
| 02-27-09(4)-12-31-09 | | | 12.69 | | | | (0.06 | )• | | | 6.72 | | | | 6.66 | | | | 0.09 | | | | — | | | | — | | | | 0.09 | | | | 19.26 | | |
| ING Small Company Portfolio | | | |
| Class ADV | | | |
| 12-31-10 | | | 14.60 | | | | 0.04 | • | | | 3.42 | | | | 3.46 | | | | 0.08 | | | | — | | | | — | | | | 0.08 | | | | 17.98 | | |
| 12-31-09 | | | 11.58 | | | | 0.08 | • | | | 3.02 | | | | 3.10 | | | | 0.08 | | | | — | | | | — | | | | 0.08 | | | | 14.60 | | |
| 12-16-08(4)-12-31-08 | | | 11.13 | | | | 0.00 | *• | | | 0.45 | | | | 0.45 | | | | — | | | | — | | | | — | | | | — | | | | 11.58 | | |
| Class I | | | |
| 12-31-10 | | | 14.82 | | | | 0.09 | | | | 3.52 | | | | 3.61 | | | | 0.09 | | | | — | | | | — | | | | 0.09 | | | | 18.34 | | |
| 12-31-09 | | | 11.70 | | | | 0.09 | | | | 3.11 | | | | 3.20 | | | | 0.08 | | | | — | | | | — | | | | 0.08 | | | | 14.82 | | |
| 12-31-08 | | | 19.56 | | | | 0.11 | • | | | (5.52 | ) | | | (5.41 | ) | | | 0.18 | | | | 2.27 | | | | — | | | | 2.45 | | | | 11.70 | | |
| 12-31-07 | | | 21.70 | | | | 0.24 | • | | | 0.99 | | | | 1.23 | | | | 0.04 | | | | 3.33 | | | | — | | | | 3.37 | | | | 19.56 | | |
| 12-31-06 | | | 21.65 | | | | 0.05 | | | | 3.46 | | | | 3.51 | | | | 0.09 | | | | 3.37 | | | | — | | | | 3.46 | | | | 21.70 | | |
| Class S | | | |
| 12-31-10 | | | 14.64 | | | | 0.04 | | | | 3.47 | | | | 3.51 | | | | 0.06 | | | | — | | | | — | | | | 0.06 | | | | 18.09 | | |
| 12-31-09 | | | 11.57 | | | | 0.05 | • | | | 3.09 | | | | 3.14 | | | | 0.07 | | | | — | | | | — | | | | 0.07 | | | | 14.64 | | |
| 12-31-08 | | | 19.39 | | | | 0.09 | • | | | (5.50 | ) | | | (5.41 | ) | | | 0.14 | | | | 2.27 | | | | — | | | | 2.41 | | | | 11.57 | | |
| 12-31-07 | | | 21.54 | | | | 0.18 | • | | | 1.00 | | | | 1.18 | | | | — | | | | 3.33 | | | | — | | | | 3.33 | | | | 19.39 | | |
| 12-31-06 | | | 21.59 | | | | (0.05 | )• | | | 3.41 | | | | 3.36 | | | | 0.04 | | | | 3.37 | | | | — | | | | 3.41 | | | | 21.54 | | |
| Class S2 | | | |
| 12-31-10 | | | 14.61 | | | | 0.06 | • | | | 3.42 | | | | 3.48 | | | | 0.05 | | | | — | | | | — | | | | 0.05 | | | | 18.04 | | |
| 02-27-09(4)-12-31-09 | | | 9.27 | | | | 0.03 | • | | | 5.39 | | | | 5.42 | | | | 0.08 | | | | — | | | | — | | | | 0.08 | | | | 14.61 | | |
| | | | | Ratios to average net assets | | Supplemental data | |
| | | Total Return(1) | | Expenses before reductions/additions(2)(3) | | Expenses net of fee waivers and/or recoupments, if any(2)(3) | | Expenses net of all reductions/additions(2)(3) | | Net investment income (loss)(2)(3) | | Net assets, end of year or period | | Portfolio turnover rate | |
| | | | | | | | | | | | | | | | |
| Year or period ended | | (%) | | (%) | | (%) | | (%) | | (%) | | ($000's) | | (%) | |
| ING Balanced Portfolio | |
| Class I | |
| 12-31-10 | | | 14.22 | | | | 0.62 | | | | 0.62 | † | | | 0.62 | † | | | 2.47 | † | | | 614,261 | | | | 328 | | |
| 12-31-09 | | | 19.23 | | | | 0.63 | | | | 0.63 | † | | | 0.63 | † | | | 2.55 | † | | | 631,106 | | | | 337 | | |
| 12-31-08 | | | (28.10 | ) | | | 0.62 | | | | 0.62 | † | | | 0.62 | † | | | 2.97 | † | | | 602,815 | | | | 294 | | |
| 12-31-07 | | | 5.57 | | | | 0.60 | | | | 0.60 | † | | | 0.60 | † | | | 2.68 | † | | | 1,046,498 | | | | 257 | | |
| 12-31-06 | | | 9.99 | | | | 0.60 | | | | 0.60 | † | | | 0.60 | † | | | 2.44 | † | | | 1,183,928 | | | | 236 | | |
| Class S | |
| 12-31-10 | | | 13.87 | | | | 0.87 | | | | 0.87 | † | | | 0.87 | † | | | 2.22 | † | | | 7,933 | | | | 328 | | |
| 12-31-09 | | | 18.94 | | | | 0.88 | | | | 0.88 | † | | | 0.88 | † | | | 2.30 | † | | | 7,374 | | | | 337 | | |
| 12-31-08 | | | (28.28 | ) | | | 0.87 | | | | 0.87 | † | | | 0.87 | † | | | 2.73 | † | | | 6,684 | | | | 294 | | |
| 12-31-07 | | | 5.31 | | | | 0.85 | | | | 0.85 | † | | | 0.85 | † | | | 2.43 | † | | | 10,281 | | | | 257 | | |
| 12-31-06 | | | 9.62 | | | | 0.85 | | | | 0.85 | † | | | 0.85 | † | | | 2.29 | † | | | 10,683 | | | | 236 | | |
| ING Growth and Income Portfolio | |
| Class ADV | |
| 12-31-10 | | | 13.55 | | | | 1.10 | | | | 1.10 | † | | | 1.10 | † | | | 0.77 | † | | | 6,037 | | | | 117 | | |
| 12-31-09 | | | 29.69 | | | | 1.11 | | | | 1.11 | † | | | 1.11 | † | | | 1.10 | † | | | 1,302 | | | | 104 | | |
| 12-31-08 | | | (37.94 | )(a) | | | 1.10 | | | | 1.10 | † | | | 1.10 | † | | | 1.14 | † | | | 791 | | | | 169 | | |
| 12-31-07 | | | 6.66 | | | | 1.09 | | | | 1.09 | † | | | 1.09 | † | | | 2.95 | † | | | 1,211 | | | | 146 | | |
| 12-20-06(4)-12-31-06 | | | (0.23 | ) | | | 1.09 | | | | 1.09 | † | | | 1.09 | † | | | 1.08 | † | | | 1 | | | | 103 | | |
| Class I | |
| 12-31-10 | | | 14.14 | | | | 0.60 | | | | 0.60 | † | | | 0.60 | † | | | 1.12 | † | | | 2,253,794 | | | | 117 | | |
| 12-31-09 | | | 30.24 | | | | 0.61 | | | | 0.61 | † | | | 0.61 | † | | | 1.60 | † | | | 2,090,019 | | | | 104 | | |
| 12-31-08 | | | (37.63 | )(a) | | | 0.60 | | | | 0.60 | † | | | 0.60 | † | | | 1.64 | † | | | 1,622,085 | | | | 169 | | |
| 12-31-07 | | | 7.40 | | | | 0.59 | | | | 0.59 | † | | | 0.59 | † | | | 1.32 | † | | | 2,796,115 | | | | 146 | | |
| 12-31-06 | | | 14.20 | | | | 0.59 | | | | 0.59 | † | | | 0.59 | † | | | 1.15 | † | | | 3,098,120 | | | | 103 | | |
| Class S | |
| 12-31-10 | | | 13.81 | | | | 0.85 | | | | 0.85 | † | | | 0.85 | † | | | 0.87 | † | | | 480,529 | | | | 117 | | |
| 12-31-09 | | | 30.03 | | | | 0.86 | | | | 0.86 | † | | | 0.86 | † | | | 1.34 | † | | | 481,897 | | | | 104 | | |
| 12-31-08 | | | (37.82 | )(a) | | | 0.85 | | | | 0.85 | † | | | 0.85 | † | | | 1.44 | † | | | 290,152 | | | | 169 | | |
| 12-31-07 | | | 7.13 | | | | 0.84 | | | | 0.84 | † | | | 0.84 | † | | | 1.50 | † | | | 25,169 | | | | 146 | | |
| 12-31-06 | | | 13.72 | | | | 0.84 | | | | 0.84 | † | | | 0.84 | † | | | 0.94 | † | | | 4,758 | | | | 103 | | |
| Class S2 | |
| 12-31-10 | | | 12.55 | | | | 1.10 | | | | 1.00 | † | | | 1.00 | † | | | 0.72 | † | | | 5 | | | | 117 | | |
| 02-27-09(4)-12-31-09 | | | 52.46 | | | | 1.11 | | | | 1.01 | † | | | 1.01 | † | | | (0.39 | )† | | | 5 | | | | 104 | | |
| ING Small Company Portfolio | |
| Class ADV | |
| 12-31-10 | | | 23.75 | | | | 1.34 | | | | 1.34 | † | | | 1.34 | † | | | 0.25 | † | | | 3,253 | | | | 86 | | |
| 12-31-09 | | | 26.96 | | | | 1.36 | | | | 1.36 | † | | | 1.36 | † | | | 0.67 | † | | | 36 | | | | 128 | | |
| 12-16-08(4)-12-31-08 | | | 4.04 | | | | 1.35 | | | | 1.35 | † | | | 1.35 | † | | | 0.65 | † | | | 3 | | | | 145 | | |
| Class I | |
| 12-31-10 | | | 24.38 | | | | 0.84 | | | | 0.84 | † | | | 0.84 | † | | | 0.51 | † | | | 503,739 | | | | 86 | | |
| 12-31-09 | | | 27.56 | | | | 0.86 | | | | 0.86 | † | | | 0.86 | † | | | 0.67 | † | | | 437,930 | | | | 128 | | |
| 12-31-08 | | | (31.05 | ) | | | 0.85 | | | | 0.85 | † | | | 0.85 | † | | | 0.71 | † | | | 420,626 | | | | 145 | | |
| 12-31-07 | | | 5.90 | | | | 0.84 | | | | 0.84 | † | | | 0.84 | † | | | 1.16 | † | | | 603,492 | | | | 106 | | |
| 12-31-06 | | | 16.79 | | | | 0.85 | | | | 0.85 | † | | | 0.85 | † | | | 0.26 | † | | | 512,446 | | | | 83 | | |
| Class S | |
| 12-31-10 | | | 24.00 | | | | 1.09 | | | | 1.09 | † | | | 1.09 | † | | | 0.29 | † | | | 122,286 | | | | 86 | | |
| 12-31-09 | | | 27.33 | | | | 1.11 | | | | 1.11 | † | | | 1.11 | † | | | 0.43 | † | | | 78,790 | | | | 128 | | |
| 12-31-08 | | | (31.28 | ) | | | 1.10 | | | | 1.10 | † | | | 1.10 | † | | | 0.71 | † | | | 44,764 | | | | 145 | | |
| 12-31-07 | | | 5.68 | | | | 1.09 | | | | 1.09 | † | | | 1.09 | † | | | 0.90 | † | | | 2,890 | | | | 106 | | |
| 12-31-06 | | | 16.07 | | | | 1.10 | | | | 1.10 | † | | | 1.10 | † | | | (0.24 | )† | | | 2,162 | | | | 83 | | |
| Class S2 | |
| 12-31-10 | | | 23.85 | | | | 1.34 | | | | 1.24 | † | | | 1.24 | † | | | 0.40 | † | | | 50 | | | | 86 | | |
| 02-27-09(4)-12-31-09 | | | 58.73 | | | | 1.36 | | | | 1.26 | † | | | 1.26 | † | | | 0.27 | † | | | 5 | | | | 128 | | |
See Accompanying Notes to Financial Statements
27
FINANCIAL HIGHLIGHTS (CONTINUED)
Selected data for a share of beneficial interest outstanding throughout each year or period.
| | | | | Income (loss)
from investment
operations | | | | Less distributions | | | |
| | | Net asset value, beginning of year or period | | Net investment income (loss) | | Net realized and unrealized gain (loss) | | Total from investment operations | | From net investment income | | From net realized gains | | From return of capital | | Total distributions | | Net asset value, end of year or period | |
| | | | | | | | | | | | | | | | | | | | |
| Year or period ended | | ($) | | ($) | | ($) | | ($) | | ($) | | ($) | | ($) | | ($) | | ($) | |
| ING Intermediate Bond Portfolio | | | |
| Class ADV | | | |
| 12-31-10 | | | 11.62 | | | | 0.57 | • | | | 0.48 | | | | 1.05 | | | | 0.63 | | | | — | | | | — | | | | 0.63 | | | | 12.04 | | |
| 12-31-09 | | | 11.12 | | | | 0.47 | | | | 0.76 | | | | 1.23 | | | | 0.73 | | | | — | | | | — | | | | 0.73 | | | | 11.62 | | |
| 12-31-08 | | | 13.23 | | | | 0.58 | | | | (1.77 | ) | | | (1.19 | ) | | | 0.62 | | | | 0.30 | | | | — | | | | 0.92 | | | | 11.12 | | |
| 12-31-07 | | | 12.96 | | | | 0.63 | | | | 0.09 | | | | 0.72 | | | | 0.45 | | | | — | | | | — | | | | 0.45 | | | | 13.23 | | |
| 12-20-06(4)-12-31-06 | | | 13.53 | | | | 0.02 | | | | (0.06 | ) | | | (0.04 | ) | | | 0.53 | | | | — | | | | — | | | | 0.53 | | | | 12.96 | | |
| Class I | | | |
| 12-31-10 | | | 11.57 | | | | 0.61 | • | | | 0.53 | | | | 1.14 | | | | 0.64 | | | | — | | | | — | | | | 0.64 | | | | 12.07 | | |
| 12-31-09 | | | 11.08 | | | | 0.53 | • | | | 0.75 | | | | 1.28 | | | | 0.79 | | | | — | | | | — | | | | 0.79 | | | | 11.57 | | |
| 12-31-08 | | | 13.22 | | | | 0.64 | • | | | (1.73 | ) | | | (1.09 | ) | | | 0.75 | | | | 0.30 | | | | — | | | | 1.05 | | | | 11.08 | | |
| 12-31-07 | | | 12.96 | | | | 0.69 | • | | | 0.08 | | | | 0.77 | | | | 0.51 | | | | — | | | | — | | | | 0.51 | | | | 13.22 | | |
| 12-31-06 | | | 12.97 | | | | 0.65 | • | | | (0.12 | ) | | | 0.53 | | | | 0.54 | | | | — | | | | — | | | | 0.54 | | | | 12.96 | | |
| Class S | | | |
| 12-31-10 | | | 11.52 | | | | 0.57 | • | | | 0.52 | | | | 1.09 | | | | 0.60 | | | | — | | | | — | | | | 0.60 | | | | 12.01 | | |
| 12-31-09 | | | 11.00 | | | | 0.50 | • | | | 0.75 | | | | 1.25 | | | | 0.73 | | | | — | | | | — | | | | 0.73 | | | | 11.52 | | |
| 12-31-08 | | | 13.14 | | | | 0.60 | • | | | (1.72 | ) | | | (1.12 | ) | | | 0.72 | | | | 0.30 | | | | — | | | | 1.02 | | | | 11.00 | | |
| 12-31-07 | | | 12.89 | | | | 0.65 | • | | | 0.08 | | | | 0.73 | | | | 0.48 | | | | — | | | | — | | | | 0.48 | | | | 13.14 | | |
| 12-31-06 | | | 12.91 | | | | 0.61 | • | | | (0.12 | ) | | | 0.49 | | | | 0.51 | | | | — | | | | — | | | | 0.51 | | | | 12.89 | | |
| Class S2 | | | |
| 12-31-10 | | | 11.59 | | | | 0.55 | • | | | 0.53 | | | | 1.08 | | | | 0.59 | | | | — | | | | — | | | | 0.59 | | | | 12.08 | | |
| 02-27-09(4)-12-31-09 | | | 10.79 | | | | 0.42 | • | | | 1.15 | | | | 1.57 | | | | 0.77 | | | | — | | | | — | | | | 0.77 | | | | 11.59 | | |
| ING Money Market Portfolio(b) | | | |
| Class I | | | |
| 12-31-10 | | | 1.00 | | | | 0.00 | * | | | 0.00 | * | | | 0.00 | * | | | 0.00 | * | | | — | | | | 0.00 | * | | | 0.00 | * | | | 1.00 | | |
| 12-31-09 | | | 1.00 | | | | 0.00 | * | | | 0.00 | * | | | 0.00 | * | | | 0.00 | * | | | 0.00 | * | | | — | | | | 0.00 | * | | | 1.00 | | |
| 12-31-08 | | | 1.05 | | | | 0.02 | | | | 0.00 | | | | 0.02 | | | | 0.07 | | | | — | | | | — | | | | 0.07 | | | | 1.00 | | |
| 12-31-07 | | | 1.04 | | | | 0.05 | | | | (0.00 | ) | | | 0.05 | | | | 0.04 | | | | — | | | | — | | | | 0.04 | | | | 1.05 | | |
| 12-31-06 | | | 1.02 | | | | 0.05 | | | | 0.00 | | | | 0.05 | | | | 0.03 | | | | — | | | | — | | | | 0.03 | | | | 1.04 | | |
| Class S | | | |
| 03-15-10(4)-12-31-10 | | | 1.00 | | | | 0.00 | * | | | 0.00 | * | | | 0.00 | * | | | 0.00 | * | | | — | | | | — | | | | 0.00 | * | | | 1.00 | | |
| ING BlackRock Science and Technology Opportunities Portfolio | | | |
| Class ADV | | | |
| 12-31-10 | | | 4.94 | | | | (0.03 | )• | | | 0.92 | | | | 0.89 | | | | — | | | | — | | | | — | | | | — | | | | 5.83 | | |
| 12-31-09 | | | 3.25 | | | | (0.02 | ) | | | 1.71 | | | | 1.69 | | | | — | | | | — | | | | — | | | | — | | | | 4.94 | | |
| 12-16-08(4)-12-31-08 | | | 3.29 | | | | (0.01 | ) | | | (0.03 | ) | | | (0.04 | ) | | | — | | | | — | | | | — | | | | — | | | | 3.25 | | |
| Class I | | | |
| 12-31-10 | | | 5.01 | | | | (0.01 | ) | | | 0.94 | | | | 0.93 | | | | — | | | | — | | | | — | | | | — | | | | 5.94 | | |
| 12-31-09 | | | 3.28 | | | | (0.01 | ) | | | 1.74 | | | | 1.73 | | | | — | | | | — | | | | — | | | | — | | | | 5.01 | | |
| 12-31-08 | | | 5.45 | | | | 0.00 | * | | | (2.17 | ) | | | (2.17 | ) | | | — | | | | — | | | | — | | | | — | | | | 3.28 | | |
| 12-31-07 | | | 4.58 | | | | (0.01 | ) | | | 0.88 | | | | 0.87 | | | | — | | | | — | | | | — | | | | — | | | | 5.45 | | |
| 12-31-06 | | | 4.27 | | | | (0.01 | ) | | | 0.32 | | | | 0.31 | | | | — | | | | — | | | | — | | | | — | | | | 4.58 | | |
| Class S | | | |
| 12-31-10 | | | 4.96 | | | | (0.02 | ) | | | 0.92 | | | | 0.90 | | | | — | | | | — | | | | — | | | | — | | | | 5.86 | | |
| 12-31-09 | | | 3.25 | | | | (0.02 | ) | | | 1.73 | | | | 1.71 | | | | — | | | | — | | | | — | | | | — | | | | 4.96 | | |
| 12-31-08 | | | 5.42 | | | | (0.01 | ) | | | (2.16 | ) | | | (2.17 | ) | | | — | | | | — | | | | — | | | | — | | | | 3.25 | | |
| 12-31-07 | | | 4.56 | | | | (0.02 | ) | | | 0.88 | | | | 0.86 | | | | — | | | | — | | | | — | | | | — | | | | 5.42 | | |
| 12-31-06 | | | 4.27 | | | | (0.02 | ) | | | 0.31 | | | | 0.29 | | | | — | | | | — | | | | — | | | | — | | | | 4.56 | | |
| Class S2 | | | |
| 12-31-10 | | | 4.95 | | | | (0.03 | )• | | | 0.93 | | | | 0.90 | | | | — | | | | — | | | | — | | | | — | | | | 5.85 | | |
| 02-27-09(4)-12-31-09 | | | 3.01 | | | | (0.02 | )• | | | 1.96 | | | | 1.94 | | | | — | | | | — | | | | — | | | | — | | | | 4.95 | | |
| | | | | Ratios to average net assets | | Supplemental data | |
| | | Total Return(1) | | Expenses before reductions/additions(2)(3) | | Expenses net of fee waivers and/or recoupments, if any(2)(3) | | Expenses net of all reductions/additions(2)(3) | | Net investment income (loss)(2)(3) | | Net assets, end of year or period | | Portfolio turnover rate | |
| | | | | | | | | | | | | | | | |
| Year or period ended | | (%) | | (%) | | (%) | | (%) | | (%) | | ($000's) | | (%) | |
| ING Intermediate Bond Portfolio | |
| Class ADV | |
| 12-31-10 | | | 9.01 | | | | 1.00 | | | | 1.00 | † | | | 1.00 | † | | | 4.56 | † | | | 4,315 | | | | 438 | | |
| 12-31-09 | | | 11.08 | | | | 1.01 | | | | 1.01 | † | | | 1.01 | † | | | 4.08 | † | | | 1 | | | | 692 | | |
| 12-31-08 | | | (9.16 | ) | | | 1.01 | | | | 1.00 | † | | | 1.00 | † | | | 4.58 | † | | | 1 | | | | 666 | | |
| 12-31-07 | | | 5.60 | (a) | | | 0.99 | | | | 0.99 | † | | | 0.99 | † | | | 4.77 | † | | | 1 | | | | 438 | | |
| 12-20-06(4)-12-31-06 | | | (0.30 | ) | | | 0.99 | | | | 0.99 | † | | | 0.99 | † | | | 6.82 | † | | | 1 | | | | 390 | | |
| Class I | |
| 12-31-10 | | | 9.84 | | | | 0.50 | | | | 0.50 | † | | | 0.50 | † | | | 4.93 | † | | | 1,217,280 | | | | 438 | | |
| 12-31-09 | | | 11.57 | | | | 0.51 | | | | 0.51 | † | | | 0.51 | † | | | 4.62 | † | | | 1,236,593 | | | | 692 | | |
| 12-31-08 | | | (8.41 | ) | | | 0.51 | | | | 0.50 | † | | | 0.50 | † | | | 5.05 | † | | | 1,803,886 | | | | 666 | | |
| 12-31-07 | | | 5.95 | (a) | | | 0.49 | | | | 0.49 | † | | | 0.49 | † | | | 5.19 | † | | | 2,267,008 | | | | 438 | | |
| 12-31-06 | | | 4.06 | | | | 0.49 | | | | 0.49 | † | | | 0.49 | † | | | 4.97 | † | | | 1,909,376 | | | | 390 | | |
| Class S | |
| 12-31-10 | | | 9.51 | | | | 0.75 | | | | 0.75 | † | | | 0.75 | † | | | 4.67 | † | | | 1,292,731 | | | | 438 | | |
| 12-31-09 | | | 11.38 | | | | 0.76 | | | | 0.76 | † | | | 0.76 | † | | | 4.41 | † | | | 1,279,655 | | | | 692 | | |
| 12-31-08 | | | (8.73 | ) | | | 0.76 | | | | 0.75 | † | | | 0.75 | † | | | 4.82 | † | | | 1,153,518 | | | | 666 | | |
| 12-31-07 | | | 5.70 | (a) | | | 0.74 | | | | 0.74 | † | | | 0.74 | † | | | 4.92 | † | | | 1,079,662 | | | | 438 | | |
| 12-31-06 | | | 3.77 | | | | 0.74 | | | | 0.74 | † | | | 0.74 | † | | | 4.69 | † | | | 620,849 | | | | 390 | | |
| Class S2 | |
| 12-31-10 | | | 9.29 | | | | 1.00 | | | | 0.90 | † | | | 0.90 | † | | | 4.50 | † | | | 3 | | | | 438 | | |
| 02-27-09(4)-12-31-09 | | | 14.59 | | | | 1.01 | | | | 0.91 | † | | | 0.91 | † | | | 4.31 | † | | | 3 | | | | 692 | | |
| ING Money Market Portfolio(b) | |
| Class I | |
| 12-31-10 | | | 0.24 | | | | 0.34 | | | | 0.31 | † | | | 0.31 | † | | | 0.02 | † | | | 1,069,947 | | | | — | | |
| 12-31-09 | | | 0.33 | | | | 0.37 | | | | 0.37 | | | | 0.37 | | | | 0.25 | | | | 1,328,429 | | | | — | | |
| 12-31-08 | | | 2.67 | | | | 0.35 | | | | 0.35 | | | | 0.35 | | | | 2.66 | | | | 1,798,833 | | | | — | | |
| 12-31-07 | | | 5.13 | | | | 0.33 | | | | 0.33 | | | | 0.33 | | | | 5.03 | | | | 1,711,139 | | | | — | | |
| 12-31-06 | | | 4.88 | | | | 0.34 | | | | 0.34 | | | | 0.34 | | | | 4.79 | | | | 1,355,850 | | | | — | | |
| Class S | |
| 03-15-10(4)-12-31-10 | | | 0.00 | | | | 0.59 | | | | 0.36 | † | | | 0.36 | † | | | 0.00 | † | | | 313 | | | | — | | |
| ING BlackRock Science and Technology Opportunities Portfolio | |
| Class ADV | |
| 12-31-10 | | | 18.02 | | | | 1.55 | | | | 1.55 | | | | 1.55 | | | | (0.66 | ) | | | 5,609 | | | | 52 | | |
| 12-31-09 | | | 52.00 | | | | 1.57 | | | | 1.55 | | | | 1.55 | | | | (0.92 | ) | | | 54 | | | | 74 | | |
| 12-16-08(4)-12-31-08 | | | (1.22 | ) | | | 1.58 | | | | 1.56 | | | | 1.56 | | | | (2.08 | ) | | | 3 | | | | 137 | | |
| Class I | |
| 12-31-10 | | | 18.56 | | | | 1.05 | | | | 1.05 | | | | 1.05 | | | | (0.20 | ) | | | 121,443 | | | | 52 | | |
| 12-31-09 | | | 52.74 | | | | 1.07 | | | | 1.05 | | | | 1.05 | | | | (0.13 | ) | | | 100,726 | | | | 74 | | |
| 12-31-08 | | | (39.82 | ) | | | 1.08 | | | | 1.06 | | | | 1.06 | | | | 0.09 | | | | 55,899 | | | | 137 | | |
| 12-31-07 | | | 19.00 | | | | 1.08 | | | | 1.08 | | | | 1.08 | | | | (0.24 | ) | | | 97,943 | | | | 84 | | |
| 12-31-06 | | | 7.26 | | | | 1.08 | | | | 1.08 | | | | 1.08 | | | | (0.29 | ) | | | 81,599 | | | | 129 | | |
| Class S | |
| 12-31-10 | | | 18.15 | | | | 1.30 | | | | 1.30 | | | | 1.30 | | | | (0.45 | ) | | | 274,471 | | | | 52 | | |
| 12-31-09 | | | 52.62 | | | | 1.32 | | | | 1.30 | | | | 1.30 | | | | (0.41 | ) | | | 230,138 | | | | 74 | | |
| 12-31-08 | | | (40.04 | ) | | | 1.33 | | | | 1.31 | | | | 1.31 | | | | (0.02 | ) | | | 89,548 | | | | 137 | | |
| 12-31-07 | | | 18.86 | | | | 1.33 | | | | 1.33 | | | | 1.33 | | | | (0.50 | ) | | | 1,140 | | | | 84 | | |
| 12-31-06 | | | 6.79 | | | | 1.33 | | | | 1.33 | | | | 1.33 | | | | (0.51 | ) | | | 551 | | | | 129 | | |
| Class S2 | |
| 12-31-10 | | | 18.18 | | | | 1.55 | | | | 1.45 | | | | 1.45 | | | | (0.51 | ) | | | 40 | | | | 52 | | |
| 02-27-09(4)-12-31-09 | | | 64.45 | | | | 1.57 | | | | 1.45 | | | | 1.45 | | | | (0.56 | ) | | | 5 | | | | 74 | | |
See Accompanying Notes to Financial Statements
28
FINANCIAL HIGHLIGHTS (CONTINUED)
(1) Total return is calculated assuming reinvestment of all dividends, capital gain distributions and return of capital distributions, if any, at net asset value and does not reflect the effect of insurance contract charges. Total return for periods less than one year is not annualized.
(2) Annualized for periods less than one year.
(3) Expense ratios reflect operating expenses of a Portfolio. Expenses before reductions/additions do not reflect amounts reimbursed by the Investment Adviser and/or Distributor or reductions from brokerage commission recapture arrangements or other expense offset arrangements and do not represent the amount paid by a Portfolio during periods when reimbursements or reductions occur. Expenses net of fee waivers reflect expenses after reimbursement by the Investment Adviser and/or Distributor but prior to reductions from brokerage commission recapture arrangements or other expense offset arrangements. Expenses net of all reductions/additions represent the net expenses paid by a Portfolio. Net investment income (loss) is net of all such additions or reductions.
(4) Commencement of operations.
* Amount is less than $0.005 or more than $(0.005).
• Calculated using average number of shares outstanding throughout the period.
† Impact of waiving the advisory fee for the ING Institutional Prime Money Market Fund holding has less than 0.005% impact on the expense ratio and net investment income or loss ratio (Note 4).
(a) There was no impact on total return by the affiliate payment.
(b) NAV and per share amounts have been restated to reflect the stock split that occurred on October 7, 2008. Effective October 7, 2008, the Portfolio converted to a stable share price of $1.00 per share. In connection with this change, the Portfolio utilized a stock split and distributed additional shares to its shareholders (adjustment factor: 12.926 shares to 1 share) such that each shareholder's proportionate interest and aggregate value of investment in the Portfolio remained the same.
See Accompanying Notes to Financial Statements
29
NOTES TO FINANCIAL STATEMENTS AS OF DECEMBER 31, 2010
NOTE 1 — ORGANIZATION
Organization. The ING Variable Product Funds are comprised of ING Balanced Portfolio, Inc., ING Variable Funds, ING Variable Portfolios, Inc., ING Intermediate Bond Portfolio, and ING Money Market Portfolio (collectively, "Registrants"), all of which are open-end investment management companies registered under the Investment Company Act of 1940, as amended ("1940 Act" or "Act").
ING Balanced Portfolio, Inc. is a company incorporated under the laws of Maryland on December 14, 1988 with one diversified series, ING Balanced Portfolio ("Balanced"). ING Variable Funds is a business trust formed under the laws of Massachusetts on January 25, 1984 with one diversified series, ING Growth and Income Portfolio ("Growth and Income"). ING Variable Portfolios, Inc. is a company incorporated under the laws of Maryland on June 4, 1996 and has eighteen separate active diversified and non-diversified series. The two diversified series that are in this report are: ING Small Company Portfolio ("Small Company"), and ING BlackRock Science and Technology Opportunities Portfolio ("Science and Technology Opportunities"). ING Intermediate Bond Portfolio is a business trust formed under the laws of Massachusetts on January 25, 1984 with one diversified series, ING Intermediate Bond Portfolio ("Intermediate Bond"). ING Money Market Portfolio is a business trust formed under the laws of Massachusetts on January 25, 1984 with one diversified series, ING Money Market Portfolio ("Money Market"). Each of the portfolios is a "Portfolio" and collectively, they are the "Portfolios".
Each Portfolio offers at least two of the following classes of shares: Adviser ("ADV") Class, Class I, Class S and Service 2 Class (Class "S2") shares. Each class has equal rights as to class and voting privileges. The classes differ principally in the applicable distribution and shareholder service fees. Shareholders of each class also bear certain expenses that pertain to that particular class. All shareholders bear the common expenses of the Portfolios and earn income and realized gains/losses from the Portfolios pro rata based on the average daily net assets of each class, without distinction between share classes. Expenses that are specific to a portfolio or a class are charged directly to that portfolio or class. Other operating expenses shared by several portfolios are generally allocated among those portfolios based on average net assets. Dividends are determined separately for each class based on income and expenses allocable to each class. Realized gain distributions are allocated to each class pro rata based on the shares outstanding of each class on the date of distribution. Differences in per share dividend rates generally result from differences in separate class expenses, including distribution and shareholder service fees, if applicable.
Shares of the Portfolios may be offered to separate accounts of insurance companies as investment options under variable annuity contracts and variable life insurance policies. Shares may also be offered to qualified pension and retirement plans outside the variable contract and to certain investment advisers and their affiliates. Class I shares may be made available to other investment companies, including series of the companies under fund-of-funds arrangements.
Participating insurance companies and other designated organizations are authorized to receive purchase orders on each Portfolio's behalf.
ING Investments, LLC serves as the investment adviser ("ING Investments" or the "Investment Adviser") to the Portfolios. ING Investment Management Co. ("ING IM") serves as the sub-adviser to each of the Portfolios except Science and Technology Opportunities. ING Funds Services, LLC serves as the administrator ("IFS" or the "Administrator") for the Portfolios. ING Investments Distributor, LLC ("IID" or the "Distributor") serves as the principal underwriter to the Portfolios.
The Investment Adviser, ING IM, IFS and IID are indirect, wholly-owned subsidiaries of ING Groep N.V. ("ING Groep"). ING Groep is a global financial institution of Dutch origin offering banking, investments, life insurance and retirement services.
ING Groep has adopted a formal restructuring plan that was approved by the European Commission in November 2009 under which the ING life insurance businesses, including the retirement services and investment management businesses, which include the Investment Adviser and its affiliates, would be divested by by ING Groep by the end of 2013. While there can be no assurance that it will be carried out, the restructuring plan presents certain risks, including uncertainty about the effect on the businesses of the ING entities that service the Portfolios and potential termination of the Portfolios' existing advisory agreement, which may trigger the need for shareholder approval of new agreements.
NOTE 2 — SIGNIFICANT ACCOUNTING POLICIES
The following significant accounting policies are consistently followed by the Portfolios in the preparation of their financial statements. Such policies are in conformity with U.S. generally accepted accounting principles for investment companies.
A. Security Valuation. All investments in securities are recorded at their estimated fair value, as described
30
NOTES TO FINANCIAL STATEMENTS AS OF DECEMBER 31, 2010 (CONTINUED)
NOTE 2 — SIGNIFICANT ACCOUNTING POLICIES (continued)
below. Investments in equity securities traded on a national securities exchange are valued at the last reported sale price. Securities reported by NASDAQ are valued at the NASDAQ official closing prices. Securities traded on an exchange or NASDAQ for which there has been no sale and securities traded in the over-the-counter-market are valued at the mean between the last reported bid and ask prices. All investments quoted in foreign currencies are valued daily in U.S. dollars on the basis of the foreign currency exchange rates prevailing at that time. Debt securities acquired with more than 60 days to maturity are valued using matrix pricing methods determined by an independent pricing service which takes into consideration such factors as yields, maturities, liquidity, ratings and traded prices in similar or identical securities. Securities for which valuations are not readily available from an independent pricing service may be valued by brokers which use prices provided by market makers or estimates of fair market value obtained from yield data relating to investments or securities with similar characteristics. U.S. government obligations are valued by using market quotations or independent pricing services that use prices provided by market-makers or estimates of market values obtained from yield data relating to instruments or securities with similar characteristics. Investments in open-end mutual funds are valued at net asset value. Investments in securities of sufficient credit quality maturing in 60 days or less are valued at amortized cost which approximates fair value.
Securities and assets for which market quotations are not readily available (which may include certain restricted securities, which are subject to limitations as to their sale) are valued at their fair values, as defined in the 1940 Act, and as determined in good faith by or under the supervision of the Portfolios' Board of Directors/Trustees ("Board"), in accordance with methods that are specifically authorized by the Board. Securities traded on exchanges, including foreign exchanges, which close earlier than the time that a Portfolio calculates its net asset value ("NAV") may also be valued at their fair values as defined by the 1940 Act, and as determined in good faith by or under the supervision of the Board, in accordance with methods that are specifically authorized by the Board. All such fair valuations are made in accordance with valuation procedures of the Portfolios (the "Valuation Procedures") which have been approved by the Board. The valuation techniques applied in any specific instance are set forth in the Valuation Procedures and may vary from case to case. With respect to a restricted security, for example, consideration is generally given to the cost of the investment, the market value of any unrestricted securities of the same class at the time of valuation, the potential expiration of restrictions on the security, the existence of any registration rights, the costs to the Portfolios related to registration of the security, as well as factors relevant to the issuer itself. Consideration may also be given to the price and extent of any public trading in similar securities of the issuer or comparable companies' securities. The value of a foreign security traded on an exchange outside the United States is generally based on its price on the principal foreign exchange where it trades as of the time a Portfolio determines its NAV or if the foreign exchange closes prior to the time a Portfolio determines its NAV, the most recent closing price of the foreign security on its principal exchange. Trading in certain non-U.S. securities may not take place on all days on which the New York Stock Exchange ("NYSE") is open. Further, trading takes place in various foreign markets on days on which the NYSE is not open. Consequently, the calculation of a Portfolio's NAV may not take place contemporaneously with the determination of the prices of securities held by a Portfolio in foreign securities markets. Further, the value of a Portfolio's assets may be significantly affected by foreign trading on days when a shareholder cannot purchase or redeem shares of a Portfolio. In calculating a Portfolio's NAV, foreign securities denominated in foreign currency are converted to U.S. dollar equivalents. If an event occurs after the time at which the market for foreign securities held by a Portfolio closes but before the time that a Portfolio's NAV is calculated, such event may cause the closing price on the foreign exchange to not represent a readily available reliable market value quotation for such securities at the time a Portfolio determines its NAV. In such a case, a Portfolio will use the fair value of such securities as determined under a Portfolio's valuation procedures. Events after the close of trading on a foreign market that could require a Portfolio to fair value some or all of its foreign securities include, among others, securities trading in the U.S. and other markets, corporate announcements, natural and other disasters, and political and other events. Among other elements of analysis in the determination of a security's fair value, the Board has authorized the use of one or more independent research services to assist with such determinations. An independent research service may use statistical analyses and quantitative models to help determine fair value as of the time a Portfolio calculates its NAV. There can be no assurance that such models accurately reflect the behavior of the applicable
31
NOTES TO FINANCIAL STATEMENTS AS OF DECEMBER 31, 2010 (CONTINUED)
NOTE 2 — SIGNIFICANT ACCOUNTING POLICIES (continued)
markets or the effect of the behavior of such markets on the fair value of securities, or that such markets will continue to behave in a fashion that is consistent with such models. Unlike the closing price of a security on an exchange, fair value determinations employ elements of judgment. Consequently, the fair value assigned to a security may not represent the actual value that a Portfolio could obtain if it were to sell the security at the time of the close of the NYSE. Pursuant to procedures adopted by the Board, a Portfolio is not obligated to use the fair valuations suggested by any research service, and valuation recommendations provided by such research services may be overridden if other events have occurred or if other fair valuations are determined in good faith to be more accurate. Unless an event is such that it causes a Portfolio to determine that the closing prices for one or more securities do not represent readily available reliable market value quotations at the time a Portfolio determines its NAV, events that occur between the time of the close of the foreign market on which they are traded and the close of regular trading on the NYSE will not be reflected in a Portfolio's NAV.
Money Market uses the amortized cost method to value its portfolio securities, which approximates fair value. The amortized cost method involves valuing a security at its cost and amortizing any discount or premium over the period until maturity, regardless of the impact of fluctuating interest rates or the fair value of the security.
Fair value is defined as the price that the Portfolios would receive to sell an asset or pay to transfer a liability in an orderly transaction between market participants at the measurement date. Each investment asset or liability of the Portfolios is assigned a level at measurement date based on the significance and source of the inputs to its valuation. Quoted prices in active markets for identical securities are classified as "Level 1," inputs other than quoted prices for an asset or liability that are observable are classified as "Level 2" and unobservable inputs, including the adviser's or sub-adviser's, judgment about the assumptions that a market participant would use in pricing an asset or liability are classified as "Level 3." The inputs used for valuing securities are not necessarily an indication of the risks associated with investing in those securities. Short-term securities of sufficient credit quality which are valued at amortized cost, which approximates fair value, are generally considered to be Level 2 securities under applicable accounting rules. A table summarizing the Portfolios' investments under these levels of classification is included following the Summary Portfolios of Investments.
For the year ended December 31, 2010, there have been no significant changes to the fair valuation methodologies.
B. Security Transactions and Revenue Recognition. Securities transactions are accounted for on the trade date. Realized gains and losses are reported on the basis of identified cost of securities sold. Interest income is recorded on an accrual basis. Dividend income is recorded on the ex-dividend date, or for certain foreign securities, when the information becomes available to the Portfolios. Premium amortization and discount accretion are determined by the effective yield method.
C. Foreign Currency Translation. The books and records of the Portfolios are maintained in U.S. dollars. Any foreign currency amounts are translated into U.S. dollars on the following basis:
(1) Market value of investment securities, other assets and liabilities — at the exchange rates prevailing at the end of the day.
(2) Purchases and sales of investment securities, income and expenses — at the rates of exchange prevailing on the respective dates of such transactions.
Although the net assets and the market values are presented at the foreign exchange rates at the end of the day, the Portfolios do not isolate the portion of the results of operations resulting from changes in foreign exchange rates on investments from the fluctuations arising from changes in market prices of securities held. Such fluctuations are included with the net realized and unrealized gains or losses from investments. For securities, which are subject to foreign withholding tax upon disposition, liabilities are recorded on the Statements of Assets and Liabilities for the estimated tax withholding based on the securities' current market value. Upon disposition, realized gains or losses on such securities are recorded net of foreign withholding tax.
Reported net realized foreign exchange gains or losses arise from sales of foreign currencies, currency gains or losses realized between the trade and settlement dates on securities transactions, the difference between the amounts of dividends, interest, and foreign withholding taxes recorded on a Portfolio's books, and the U.S. dollar equivalent of the amounts actually received or paid. Net unrealized
32
NOTES TO FINANCIAL STATEMENTS AS OF DECEMBER 31, 2010 (CONTINUED)
NOTE 2 — SIGNIFICANT ACCOUNTING POLICIES (continued)
foreign exchange gains and losses arise from changes in the value of assets and liabilities other than investments in securities at fiscal year end, resulting from changes in the exchange rate. Foreign security and currency transactions may involve certain considerations and risks not typically associated with investing in U.S. companies and U.S. government securities. These risks include, but are not limited to, revaluation of currencies and future adverse political and economic developments, which could cause securities and their markets to be less liquid and prices more volatile than those of comparable U.S. companies and U.S. government securities.
D. Risk Exposures and the use of Derivative Instruments. Certain Portfolios' investment strategies permit the Portfolios to enter into various types of derivatives contracts, including, but not limited to, futures contracts, forward foreign currency exchange contracts, credit default swaps, interest rate swaps, total return swaps, and purchased and written options. In doing so, a Portfolio will employ strategies in differing combinations to permit it to increase or decrease the level of risk, or change the level or types of exposure to market risk factors. This may allow a Portfolio to pursue its objectives more quickly, and efficiently than if it were to make direct purchases or sales of securities capable of affecting a similar response to market factors.
Market Risk Factors. In pursuit of its investment objectives, a Portfolio may seek to use derivatives to increase or decrease its exposure to the following market risk factors:
Credit Risk. Credit risk relates to the ability of the issuer to meet interest and principal payments, or both, as they come due. In general, lower-grade, higher-yield bonds are subject to credit risk to a greater extent than lower-yield, higher-quality bonds.
Equity Risk. Equity risk relates to the change in value of equity securities as they relate to increases or decreases in the general market.
Foreign Exchange Rate Risk. Foreign exchange rate risk relates to the change in the U.S. dollar value of a security held that is denominated in a foreign currency. The U.S. dollar value of a foreign currency denominated security will decrease as the dollar appreciates against the currency, while the U.S. dollar value will increase as the dollar depreciates against the currency.
Interest Rate Risk. Interest rate risk refers to the fluctuations in value of fixed-income securities resulting from the inverse relationship between price and yield. For example, an increase in general interest rates will tend to reduce the market value of already issued fixed-income investments, and a decline in general interest rates will tend to increase their value. In addition, debt securities with longer durations, which tend to have higher yields, are subject to potentially greater fluctuations in value from changes in interest rates than obligations with shorter durations.
Risks of Investing in Derivatives. A Portfolio's use of derivatives can result in losses due to unanticipated changes in the market risk factors and the overall market. In instances where a Portfolio is using derivatives to decrease, or hedge, exposures to market risk factors for securities held by a Portfolio, there are also risks that those derivatives may not perform as expected resulting in losses for the combined or hedged positions.
The use of these strategies involves certain special risks, including a possible imperfect correlation, or even no correlation, between price movements of derivative instruments and price movements of related investments. While some strategies involving derivative instruments can reduce the risk of loss, they can also reduce the opportunity for gain or even result in losses by offsetting favorable price movements in related investments or otherwise, due to the possible inability of a Portfolio to purchase or sell a portfolio security at a time that otherwise would be favorable or the possible need to sell a portfolio security at a disadvantageous time because a Portfolio is required to maintain asset coverage or offsetting positions in connection with transactions in derivative instruments. Additional associated risks from investing in derivatives also exist and potentially could have significant effects on the valuation of the derivative and a Portfolio. Associated risks are not the risks that a Portfolio is attempting to increase or decrease exposure to, per their investment objectives, but are the additional risks from investing in derivatives. Examples of these associated risks are liquidity risk, which is the risk that a Portfolio will not be able to sell the derivative in the open market in a timely manner, and counterparty credit risk, which is the risk that the counterparty will not fulfill its obligation to a Portfolio. Associated risks can be different for each type of derivative and are discussed by each derivative type in the following notes.
Counterparty Credit Risk and Credit Related Contingent Features. Certain derivative positions are subject to counterparty credit risk, which is the risk that the
33
NOTES TO FINANCIAL STATEMENTS AS OF DECEMBER 31, 2010 (CONTINUED)
NOTE 2 — SIGNIFICANT ACCOUNTING POLICIES (continued)
counterparty will not fulfill its obligation to a Portfolio. Each Portfolio's derivative counterparties are financial institutions who are subject to market conditions that may weaken their financial position. A Portfolio intends to enter into financial transactions with counterparties that they believe to be creditworthy at the time of the transaction. To reduce this risk, a Portfolio has entered into master netting arrangements, established within each Portfolio's International Swap and Derivatives Association, Inc. Master Agreements ("Master Agreements"). These agreements are with select counterparties and they govern transactions, including certain over-the-counter ("OTC") derivative and forward foreign currency contracts, entered into by a Portfolio and the counterparty. The Master Agreements maintain provisions for general obligations, representations, agreements, collateral, and events of default or termination. The occurrence of a specified event of termination may give a counterparty the right to terminate all of its contracts and affect settlement of all outstanding transactions under the applicable Master Agreement.
A Portfolio may also enter into collateral agreements with certain counterparties to further mitigate counterparty risk on OTC derivative and forward foreign currency contracts. Subject to established minimum levels, collateral is generally determined based on the net aggregate unrealized gain or loss on contracts with a certain counterparty. Collateral pledged to or from a Portfolio is held in a segregated account by a third-party agent and can be in the form of cash or debt securities issued by the U.S. government or related agencies.
As of December 31, 2010, the maximum amount of loss that Balanced, Intermediate Bond, and Science and Technology Opportunities would incur if the counterparties to its derivative transactions failed to perform would be $2,773,221, $1,903,428 and $126,112, respectively, which represents the gross payments to be received by the Portfolios on open credit default swaps, interest rate swaps and forward foreign currency transactions were they to be unwound as of December 31, 2010. To reduce the risk of loss, Intermediate Bond has received $410,000 in cash collateral from various counterparties.
Each Portfolio has credit related contingent features that if triggered would allow its derivative counterparties to close out and demand payment or additional collateral to cover their exposure from a Portfolio. Credit related contingent features are established between each Portfolio and their derivatives counterparties to reduce the risk that a Portfolio will not fulfill its payment obligations to its counterparties. These triggering features include, but are not limited to, a percentage decrease in a Portfolio's net assets and or a percentage decrease in a Portfolio's NAV, which could cause a Portfolio to accelerate payment of any net liability owed to the counterparty. The contingent features are established within each Portfolio's Master Agreements.
As of December 31, 2010, Balanced, Intermediate Bond, and Science and Technology Opportunities had a net liability position of $3,440,166, $13,828,418 and $59,601, respectively, on open credit default swaps, interest rate swaps and forward foreign currency contracts with credit related contingent features. If a contingent feature would have been triggered as of December 31, 2010, the Portfolio's could have been required to pay this amount in cash to its counterparties. As of December 31, 2010, Balanced and Intermediate Bond have posted $980,000 and $3,514,000, respectively, for open OTC derivative transactions with their respective counterparties.
E. Forward Foreign Currency Transactions and Futures Contracts. Certain Portfolios may enter into foreign currency exchange transactions to convert to and from different foreign currencies and to and from the U.S. dollar in connection with the planned purchases or sales of securities. When entering into a forward foreign currency contract, a Portfolio agrees to receive or deliver a fixed quantity of foreign currency for an agreed-upon price on an agreed upon future date. A Portfolio either enters into these transactions on a spot basis at the spot rate prevailing in the foreign currency exchange market or uses forward foreign currency contracts to purchase or sell foreign currencies. When the contract is fulfilled or closed, gains or losses are realized. Until then, the gain or loss is included in unrealized appreciation or depreciation. Risks may arise upon entering into forward contracts from the potential inability of counterparties to meet the terms of their forward contracts and from unanticipated movements in the value of foreign currencies relative to the U.S. dollar.
During the year ended December 31, 2010, the following Portfolios had average contract amounts on forward foreign currency contracts to buy and sell as disclosed below:
| | | Buy | | Sell | |
| Balanced* | | $ | 68,370,586 | | | $ | 43,763,090 | | |
| Intermediate Bond* | | | 11,772,738 | | | | 105,802,348 | | |
Science and Technology
Opportunities** | | | 1,953,781 | | | | 12,639,796 | | |
* For the year ended December 31, 2010, Balanced and Intermediate used forward foreign currency contracts to protect
34
NOTES TO FINANCIAL STATEMENTS AS OF DECEMBER 31, 2010 (CONTINUED)
NOTE 2 — SIGNIFICANT ACCOUNTING POLICIES (continued)
its non-U.S. dollar denominated holdings from adverse currency movements and to gain exposure to currencies for the purposes of risk management or enhanced return. Please refer to the tables following the Summary Portfolio of Investments for each respective Portfolio for open forward foreign currency contract at December 31, 2010.
** For the year ended December 31, 2010, Science and Technology Opportunities used forward foreign currency contracts primarily to protect its non-U.S. dollar denominated holdings from adverse currency movements. Please refer to the table following the Summary Portfolio of Investments for open forward foreign currency contracts at December 31, 2010.
Each Portfolio, with the exception of Money Market, may enter into futures contracts involving foreign currency, interest rates, securities and security indices. A futures contract is a commitment to buy or sell a specific amount of a financial instrument at a negotiated price on a stipulated future date. A Portfolio may buy and sell futures contracts. Futures contracts traded on a commodities or futures exchange will be valued at the final settlement price or official closing price on the principal exchange as reported by such principal exchange at its trading session ending at, or most recently prior to, the time when each Portfolio's assets are valued.
Upon entering into a futures contract, a Portfolio is required to deposit either cash or securities (initial margin) in an amount equal to a certain percentage of the contract value. Subsequent payments (variation margin) are made or received by a Portfolio each day. The variation margin payments are equal to the daily changes in the contract value and are recorded as unrealized gains and losses. Open futures contracts are reported on a table following each Portfolio's Summary Portfolio of Investments. Securities held in collateralized accounts to cover initial margin requirements on open futures contracts are footnoted in the Summary Portfolio of Investments. Cash collateral held by the broker to cover initial margin requirements on open futures contracts are noted in the Statements of Assets and Liabilities. The net change in unrealized appreciation and depreciation is reported in the Statements of Operations. Realized gains (losses) are reported in the Statements of Operations at the closing or expiration of futures contracts.
Futures contracts are exposed to the market risk factor of the underlying financial instrument. During the year ended December 31, 2010, Balanced and Intermediate Bond have purchased and sold futures contracts on various equity indices (Balanced only), bonds, and notes. Balanced purchased equity futures to increase exposure to equity risk. Both Balanced and Intermediate Bond purchased and sold futures on bonds and notes as part of their duration management. Growth and Income entered into equity futures to increase exposure to equity risk. Additional associated risks of entering into futures contracts include the possibility that there may be an illiquid market where a Portfolio is unable to liquidate the contract or enter into an offsetting position and, if used for hedging purposes, the risk that the price of the contract will correlate imperfectly with the prices of a Portfolio's securities. With futures, there is minimal counterparty credit risk to the Portfolios since futures are exchange traded and the exchange's clearinghouse, as counterparty to all exchange traded futures, guarantees the futures against default. During the year ended December 31, 2010, the following Portfolios had average notional values on futures contracts purchased and sold as disclosed below:
| | | Purchased | | Sold | |
| Balanced | | $ | 61,155,649 | | | $ | 56,534,495 | | |
| Growth and Income | | | 13,420,958 | | | | — | | |
| Intermediate Bond | | | 280,201,095 | | | | 584,715,766 | | |
F. Options Contracts. Certain Portolios may write call and put options on futures, swaps ("swaptions"), securities, commodities or foreign currencies it owns or in which it may invest. Writing put options tends to increase the Portfolios exposure to the underlying instrument. Writing call options tends to decrease the Portfolios exposure to the underlying instrument. When a Portfolio writes a call or put option, an amount equal to the premium received is recorded as a liability and subsequently marked to market to reflect the current value of the option written. These liabilities are reflected as written options outstanding on the Statements of Assets and Liabilities. Certain options may be written with premiums to be determined on a future date. Premiums received from writing options which expire are treated as realized gains. Premiums received from writing options which are exercised or closed are added to the proceeds or offset against amounts paid on the underlying futures, swap, security or currency transaction to determine the realized gain or loss. A Portfolio as a writer of an option has no control over whether the underlying instrument may be sold (call) or purchased (put) and as a result bears the market risk of an unfavorable change in the price of the instrument underlying the written option. There is the risk the Portfolios may not be able to enter into a closing transaction because of an illiquid market. The Portfolios may also purchase put and call options. Purchasing call options tends to increase the Portfolios exposure to the underlying instrument. Purchasing put options tends to decrease the Portfolios exposure
35
NOTES TO FINANCIAL STATEMENTS AS OF DECEMBER 31, 2010 (CONTINUED)
NOTE 2 — SIGNIFICANT ACCOUNTING POLICIES (continued)
to the underlying instrument. The Portfolios pay a premium which is included on the Statements of Assets and Liabilities as an investment and subsequently marked to market to reflect the current value of the option. Premiums paid for purchasing options which expire are treated as realized losses. Certain options may be purchased with premiums to be determined on a future date. The premiums for these options are based upon implied volatility parameters at specified terms. The risk associated with purchasing put and call options is limited to the premium paid. Premiums paid for purchasing options which are exercised or closed are added to the amounts paid or offset against the proceeds on the underlying investment transaction to determine the realized gain or loss.
During the year ended December 31, 2010, Balanced and Intermediate Bond have purchased and written foreign currency options to gain exposure to currencies and to generate income. Please refer to the Summary Portfolio of Investments for open purchased foreign currency options and the table following the Summary Portfolio of Investments for open written foreign currency options at December 31, 2010 for Balanced. Intermediate Bond had no purchased or written options outstanding at December 31, 2010.
During the year ended December 31, 2010, Balanced and Intermediate Bond have purchased and written swaptions on credit default swap indices "CDX" in order to hedge the credit risk of the Portfolios and to generate income. A CDX index is a basket of credit instruments or exposures designed to be representative of some part of the credit market. There were no open CDX swaptions at December 31, 2010 for either Portfolio.
During the year ended December 31, 2010, Intermediate Bond has written swaptions on interest rate swaps to generate income. There were no open interest rate swaptions at December 31, 2010.
Please refer to Note 9 for the volume of both purchased and written option activity during the year ended December 31, 2010.
G. Distributions to Shareholders. The Portfolios record distributions to their shareholders on the ex-dividend date. Balanced, Small Company and Science and Technology Opportunities declare and pay dividends annually. Growth and Income and Intermediate Bond, declare and pay dividends semi-annually. Money Market declares dividends daily and pays dividends, if any, monthly. Each Portfolio distributes capital gains, if any, annually. The Portfolios may make distributions on a more frequent basis to comply with the distribution requirements of the Internal Revenue Code. The characteristics of income and gains to be distributed are determined in accordance with income tax regulations, which may differ from U.S. generally accepted accounting principles for investment companies.
H. Federal Income Taxes. It is the policy of the Portfolios to comply with the requirements of subchapter M of the Internal Revenue Code that are applicable to regulated investment companies and to distribute substantially all of their net investment income and any net realized capital gains to their shareholders. Therefore, a federal income tax or excise tax provision is not required. Management has considered the sustainability of the Portfolios' tax positions taken on federal income tax returns for all open tax years in making this determination. No capital gain distributions shall be made until the capital loss carryforwards have been fully utilized or expire.
I. Use of Estimates. The preparation of financial statements in conformity with U.S. generally accepted accounting principles requires management to make estimates and assumptions that affect the reported amounts of assets and liabilities and disclosure of contingent assets and liabilities at the date of the financial statements and the reported amounts of increases and decreases in net assets from operations during the reporting period. Actual results could differ from those estimates.
J. Repurchase Agreements. Each Portfolio may invest in repurchase agreements only with government securities dealers recognized by the Board of Governors of the Federal Reserve System. Under such agreements, the seller of the security agrees to repurchase it at a mutually agreed upon time and price. The resale price is in excess of the purchase price and reflects an agreed upon interest rate for the period of time the agreement is outstanding. The period of the repurchase agreements is usually short, from overnight to one week, while the underlying securities generally have longer maturities. Each Portfolio will receive as collateral securities acceptable to it whose market value is equal to at least 100% of the carrying amount of the repurchase agreements, plus accrued interest, being invested by the Portfolio. The underlying collateral is valued daily on a mark-to-market basis to assure that the value, including accrued interest is at least equal to the repurchase price. There would be potential loss to the Portfolio in the event the Portfolio is delayed or prevented from exercising its right to dispose of the collateral, and it might incur disposition costs in liquidating the collateral.
36
NOTES TO FINANCIAL STATEMENTS AS OF DECEMBER 31, 2010 (CONTINUED)
NOTE 2 — SIGNIFICANT ACCOUNTING POLICIES (continued)
K. Securities Lending. Each Portfolio (except Money Market) has the option to temporarily loan up to 331/3% of its total assets to brokers, dealers or other financial institutions in exchange for a negotiated lender's fee. The borrower is required to fully collateralize the loans with cash or U.S. government securities. Generally, in the event of counterparty default, a Portfolio has the right to use collateral to offset losses incurred. There would be potential loss to a Portfolio in the event a Portfolio is delayed or prevented from exercising its right to dispose of the collateral. A Portfolio bears the risk of loss with respect to the investment of collateral. Engaging in securities lending could have a leveraging effect, which may intensify the credit, market and other risks associated with investing in a Portfolio.
L. Restricted Securities. The Portfolios may invest in restricted securities, which include those sold under Rule 144A of the Securities Act of 1933 ("1933 Act") or securities offered pursuant to Section 4(2) of the 1933 Act, and/or are subject to legal or contractual restrictions on resale and may not be publicly sold without registration under the 1933 Act. Restricted securities are fair valued using market quotations when readily available. In the absence of market quotations, the securities are valued based upon their fair value, as defined by the Act, determined under procedures approved by the Board.
M. When-Issued and Delayed-Delivery Transactions. Each Portfolio may purchase or sell securities on a when-issued or forward commitment basis. The price of the underlying securities and date when the securities will be delivered and paid for are fixed at the time the transaction is negotiated. The market value of such is identified in the Summary Portfolio of Investments. Losses may arise due to changes in the market value of the securities or from the inability of counterparties to meet the terms of the contract. In connection with such purchases, the Portfolios are required to hold liquid assets as collateral with the Portfolios' custodian sufficient to cover the purchase price.
N. Mortgage Dollar Roll Transactions. Each Portfolio, except Small Company, may engage in dollar roll transactions with respect to mortgage-backed securities issued by Government National Mortgage Association, Federal National Mortgage Association and Federal Home Loan Mortgage Corp. In a dollar roll transaction, a Portfolio sells a mortgage-backed security to a financial institution, such as a bank or broker/dealer, and simultaneously agrees to repurchase a substantially similar (i.e., same type, coupon, and maturity) security from the institution on a delayed delivery basis at an agreed upon price. The mortgage-backed securities that are repurchased will bear the same interest rate as those sold, but generally will be collateralized by different pools of mortgages with different prepayment histories. The Portfolios account for dollar roll transactions as purchases and sales.
O. Swap Agreements. Certain Portfolios may enter into swap agreements. A swap is an agreement between two parties pursuant to which each party agrees to make one or more payments to the other at specified future intervals based on the return of an asset (such as a stock, bond or currency) or non-asset reference (such as an interest rate or index). The swap agreement will specify the "notional" amount of the asset or non-asset reference to which the contract relates. Subsequent changes in fair value, if any, are calculated based upon changes in the performance of the asset or non-asset reference multiplied by the notional value of the contract. A Portfolio may enter into credit default, interest rate, total return and currency swaps to manage its exposure to credit, currency and interest rate risk. All outstanding swap agreements are reported following each Portfolio's Summary Portfolio of Investments.
Swaps are marked to market daily using quotations primarily from third party pricing services, counterparties or brokers. The value of the swap contract is recorded on each Portfolio's Statement of Assets or Liabilities. During the term of the swap, changes in the value of the swap, if any, are recorded as unrealized gains or losses on the Statement of Operations. Upfront payments paid or received by a Portfolio when entering into the agreements are reported on the Statement of Assets and Liabilities and as a component of the changes in unrealized gains or losses on the Statement of Operations. These upfront payments represent the amounts paid or received when initially entering into the swap agreement to compensate for differences between the stated terms of the swap agreement and the prevailing market conditions. The upfront payments are included as a component in the realized gains or losses on each Portfolio's Statement of Operations upon termination or maturity of the swap. A Portfolio also records net periodic payments paid or received on the swap contract as a realized gain or loss on the Statement of Operations.
Entering into swap agreements involves the risk that the maximum potential loss of an investment exceeds the current value of the investment as reported on each Portfolio's Statement of Assets and Liabilities. Other
37
NOTES TO FINANCIAL STATEMENTS AS OF DECEMBER 31, 2010 (CONTINUED)
NOTE 2 — SIGNIFICANT ACCOUNTING POLICIES (continued)
risks involve the possibility that the counterparty to the agreements may default on its obligation to perform, that there will be no liquid market for these investments and that unfavorable changes in the market will have a negative impact on the value of the index or securities underlying the respective swap agreement.
Credit Default Swap Contracts. A credit default swap is a bilateral agreement between counterparties in which the buyer of the protection agrees to make a stream of periodic payments to the seller of protection in exchange for the right to receive a specified return in the event of a default or other credit event for a referenced entity, obligation or index. As a seller of protection on credit default swaps, a Portfolio will generally receive from the buyer a fixed payment stream based on the notional amount of the swap contract. This fixed payment stream will continue until the swap contract expires or a defined credit event occurs.
A Portfolio is subject to credit risk in the normal course of pursuing its investment objectives. As a seller of protection in a credit default swap, a Portfolio may execute these contracts to manage its exposure to the market or certain sectors of the market. Certain Portfolios may also enter into credit default swaps to speculate on changes in an issuer's credit quality, to take advantage of perceived spread advantages, or to offset an existing short equivalent (i.e. buying protection on an equivalent reference entity).
Certain Portfolios may sell credit default swaps which expose these Portfolios to the risk of loss from credit risk related events specified in the contract. Although contract specific, credit events are generally defined as bankruptcy, failure to pay, restructuring, obligation acceleration, obligation default or repudiation/moratorium. If a Portfolio is a seller of protection, and a credit event occurs, as defined under the terms of that particular swap agreement, a Portfolio will generally either (i) pay to the buyer an amount equal to the notional amount of the swap and take delivery of the referenced obligation, other deliverable obligations, or underlying securities comprising a referenced index or (ii) pay a net settlement amount in the form of cash or securities equal to the notional amount of the swap less the recovery value of the referenced obligation or underlying securities comprising a referenced index. If a Portfolio is a buyer of protection and a credit event occurs, as defined under the terms of that particular swap agreement, a Portfolio will either (i) receive from the seller of protection an amount equal to the notional amount of the swap and deliver the referenced obligation, other deliverable obligations or underlying securities comprising the referenced index or (ii) receive a net settlement amount in the form of cash or securities equal to the notional amount of the swap less the recovery value of the referenced obligation or underlying securities comprising the referenced index. Recovery values are assumed by market makers considering either industry standard recovery rates or entity specific factors and considerations until a credit event occurs. If a credit event has occurred, the recovery value is determined by a facilitated auction whereby a minimum number of allowable broker bids, together with a specified valuation method, are used to calculate the settlement value.
Implied credit spreads, represented in absolute terms, utilized in determining the fair value of credit default swap agreements on corporate issues or sovereign issues are disclosed in each Portfolio's Summary Portfolio of Investment and serve as an indicator of the current status of the payment/performance risk and represent the likelihood or risk of default for the credit derivative. The implied credit spread of a particular referenced entity reflects the cost of buying/selling protection and may include upfront payments required to be made to enter into the agreement. For credit default swaps on asset-backed securities or credit indices, the quoted market prices and resulting fair values serve as the indicator of the current status of the payment/performance risk. Wider credit spreads and increasing fair values, in absolute terms when compared to the notional amount of the swap, represent a deterioration of the referenced entity's credit soundness and a greater likelihood or risk of default or other credit event occurring as defined under the terms of the agreement.
The maximum amount of future payments (undiscounted) that a Portfolio as seller of protection could be required to make under a credit default swap agreement would be an amount equal to the notional amount of the agreement. Notional amounts of all credit default swap agreements outstanding as of December 31, 2010, for which a Portfolio is seller of protection are disclosed in each Portfolio's Summary Portfolio of Investments. These potential amounts would be partially offset by any recovery values of the respective referenced obligations, upfront payments received upon entering into the agreements, or net amounts received from the settlement of buy protection credit default swap agreements entered into by a Portfolio for the same referenced entity or entities.
For the year ended December 31, 2010, both Balanced and Intermediate Bond have purchased credit
38
NOTES TO FINANCIAL STATEMENTS AS OF DECEMBER 31, 2010 (CONTINUED)
NOTE 2 — SIGNIFICANT ACCOUNTING POLICIES (continued)
protection through credit default swaps to decrease exposure to the credit risk of individual securities and to hedge against anticipated potential credit events. Balanced and Intermediate Bond also purchased credit protection on CDX indices to decrease its exposure to various credit sectors.
For the year ended December 31, 2010, both Balanced and Intermediate Bond have sold credit protection through credit default swaps to gain exposure to the credit risk of individual securities that are either unavailable or considered to be less attractive in the bond market.
For the year ended December 31, 2010, Balanced and Intermediate Bond had average notional amounts of $4,938,300 and $49,825,700 on credit default swaps to buy protection and average notional amounts of $2,413,264 and $26,939,966 on credit default swaps to sell protection, respectively.
Interest Rate Swap Contracts. An interest rate swap involves the agreement between counterparties to exchange periodic payments based on interest rates. One payment will be based on a floating rate of a specified interest rate while the other will be a fixed rate. Risks involve the future fluctuations of interest rates in which a Portfolio may make payments that are greater than what a Portfolio received from the counterparty. Other risks include credit, liquidity and market risk.
For the year ended December 31, 2010, Balanced has entered into interest rate swaps in which it pays a floating interest rate and receives a fixed interest rate ("Long interest rate swap") in order to increase exposure to interest rate risk. Average notional amounts on long interest rate swaps were $9,640,326.
For the year ended December 31, 2010, Balanced and Intermediate Bond have entered into interest rate swaps in which it pays a fixed interest rate and receives a floating interest rate ("Short interest rate swap") in order to decrease exposure to interest rate risk. Average notional amounts on short interest rate swaps were $9,759,891 and $38,712,000, respectively.
Balanced and Intermediate Bond entered into interest rate swaps to adjust interest rate and yield curve exposures and to substitute for physical fixed-income securities. Please refer to the tables following the Summary Portfolio of Investments for open interest rate swaps at December 31, 2010.
Cross-Currency Swap Agreements. Cross-currency swaps are interest rate swaps in which interest cash flows are exchanged between two parties based on the notional amounts of two different currencies. The notional amounts are typically determined based on the spot exchange rates at the inception of the trade. Cross-currency swaps also involve the exchange of the notional amounts at the start of the contract at the current spot rate with an agreement to re-exchange such amounts at a later date at either the same exchange rate, a specified rate or the then current spot rate. The entire principal value of a cross-currency swap is subject to the risk that the counterparty to the swap will default on its contractual delivery obligations.
For the year ended December 31, 2010, Balanced had an average notional amount of $388,052 and $400,882 on currency bought and sold, respectively, on cross-currency swaps.
For the year ended December 31, 2010, Balanced has entered into cross-currency swaps to increase exposure to both foreign exchange and interest rate risk (inflation hedge). Please refer to the table following the Summary Portfolio of Investments for open cross currency swaps at December 31, 2010.
P. Indemnifications. In the normal course of business, the Registrants may enter into contracts that provide certain indemnifications. The Registrants' maximum exposure under these arrangements is dependent on future claims that may be made against the Portfolios and, therefore, cannot be estimated; however, based on experience, management considers the risk of loss from such claims remote.
NOTE 3 — INVESTMENT TRANSACTIONS
For the year ended December 31, 2010, the cost of purchases and the proceeds from the sales of securities, excluding short-term and U.S. government securities, were as follows:
| | | Purchases | | Sales | |
| Balanced | | $ | 1,038,708,201 | | | $ | 1,084,676,844 | | |
| Growth and Income | | | 2,840,770,220 | | | | 3,083,159,119 | | |
| Small Company | | | 451,709,429 | | | | 455,167,553 | | |
| Intermediate Bond | | | 2,228,240,599 | | | | 2,103,599,990 | | |
Science and Technology
Opportunities | | | 177,754,555 | | | | 172,019,751 | | |
U.S. government securities not included above were as follows:
| | | Purchases | | Sales | |
| Balanced | | $ | 949,296,042 | | | $ | 976,072,883 | | |
| Intermediate Bond | | | 9,355,751,453 | | | | 9,622,053,114 | | |
39
NOTES TO FINANCIAL STATEMENTS AS OF DECEMBER 31, 2010 (CONTINUED)
NOTE 4 — INVESTMENT MANAGEMENT AND ADMINISTRATIVE FEES
The Portfolios entered into investment management agreements ("Investment Management Agreements") with the Investment Adviser. The Investment Management Agreements compensate the Investment Adviser with a fee, computed daily and payable monthly, based on the average daily net assets of each Portfolio, at the following annual rates:
| Balanced | | 0.500% | |
Growth and Income
| | 0.500% on first $10 billion;
0.450% on next $5 billion; and
0.425% over $15 billion | |
| Small Company | | 0.750% | |
| Intermediate Bond | | 0.400% | |
| Money Market | | 0.250% | |
Science and Technology
Opportunities | | 0.950% | |
The Investment Adviser entered into sub-advisory agreements with ING IM. ING IM acts as sub-adviser to all Portfolios except for Science and Technology Opportunities. Subject to such policies as the Board or the Investment Adviser may determine, ING IM manages the Portfolios' assets in accordance with the Portfolios' investment objectives, policies, and limitations.
BlackRock Advisors, LLC ("BlackRock"), serves as Sub-Adviser to Science and Technology Opportunities pursuant to a Sub-Advisory Agreement, effective February 2, 2007, between the Investment Adviser and BlackRock.
During the period, ING Portfolios were permitted to invest end-of-day cash balances into ING Institutional Prime Money Market Fund. Investment management fees paid by the Portfolios were reduced by an amount equal to the management fees paid indirectly to ING Institutional Prime Money Market Fund with respect to assets invested by the Portfolios. For the year ended December 31, 2010, the Investment Adviser for Balanced, Growth and Income, Small Company, and Intermediate Bond waived $17,088, $43,053, $8,859, $24,984 of such management fees, respectively. These fees are not subject to recoupment.
Effective December 20, 2010, ING Institutional Prime Money Market Fund was liquidated. As a result of this liquidation, the Portfolios will no longer invest end-of-day cash balances into ING Institutional Prime Money Market Fund.
Pursuant to administration agreements, IFS acts as administrator and provides certain administrative and shareholder services necessary for Portfolio operations and is responsible for the supervision of other service providers.
IFS is entitled to receive from each Portfolio a fee at an annual rate of 0.055% on the first $5 billion of daily net assets and 0.03% thereafter.
In placing equity security transactions, each sub-adviser is required to use its best efforts to choose a broker capable of providing brokerage services necessary to obtain the best execution for each transaction. Subject to this requirement, each sub-adviser may allocate equity security transactions through certain designated broker-dealers. Some of these broker-dealers participate in commission recapture programs that have been established for the benefit of the Portfolios. Under these programs, the participating broker-dealers will return to a Portfolio a portion of the brokerage commissions (in the form of a credit to a Portfolio) paid to the broker-dealers to pay certain expenses of a Portfolio. These commission recapture payments benefit the Portfolios and not the sub-adviser. Any amount credited to a Portfolio is recognized as brokerage commission recapture in the Statements of Operations.
NOTE 5 — DISTRIBUTION AND SERVICE FEES
ADV Class and Class S2 shares of the respective Portfolios are subject to a Shareholder Service and Distribution Plan (the "Plan"). Under the Plan, the Distributor is paid an annual shareholder service fee at the rate of 0.25% and an annual distribution fee at the rate of 0.25% of the average daily net assets attributable to its ADV Class and Class S2 shares. The Distributor has contractually agreed to waive a portion of its fee equal to 0.10% of the average daily net assets attributable to the distribution fee paid by Class S2 of the Portfolios, so that the actual fee paid by a Portfolio is an annual rate of 0.15%. The expense waiver will continue through at least May 1, 2011. For the year ended December 31, 2010, Balanced, Growth and Income, Small Company, Intermediate Bond and Science and Technology Opportunities waived $1, $4, $22, $4 and $10, respectively.
Class S shares of the respective Portfolios have adopted either a Distribution Plan or a Shareholder Service and Distribution Plan pursuant to Rule 12b-1 under the 1940 Act (collectively, the "12b-1 Plans"), whereby the Distributor is compensated by each Portfolio for expenses incurred for Shareholder Servicing and/or the distribution of each Portfolio's shares. Pursuant to the 12b-1 Plans, the Distributor is entitled to a payment each month to compensate for expenses incurred in the distribution and promotion of each Portfolio's shares, including expenses incurred in printing prospectuses and reports used for sales purposes, expenses incurred in preparing and printing sales
40
NOTES TO FINANCIAL STATEMENTS AS OF DECEMBER 31, 2010 (CONTINUED)
NOTE 5 — DISTRIBUTION AND SERVICE FEES (continued)
literature and other such distribution related expenses, including any distribution or shareholder servicing fees paid to securities dealers who have executed a distribution agreement with the Distributor. Under the 12b-1 Plans, Class S shares of the Portfolios pay the Distributor a fee calculated at an annual rate of 0.25% of average daily net assets. For Money Market, effective March 15, 2010, the Distributor agreed to waive 0.10% of average daily net assets attributable to distribution fees for Class S shares through May 1, 2011. During the year ended December 31, 2010, Money Market waived $180.
IID and ING Investments have contractually agreed to waive a portion of their distribution and/or shareholder servicing fees and management fees, as applicable, and to reimburse certain expenses to the extent necessary to assist Money Market in maintaining a yield of not less than zero. This arrangement will continue through at least May 1, 2011. There is no guarantee that this waiver will continue after that date. Fees waived or expenses reimbursed are subject to possible recoupment by IID or ING Investments, as applicable, within three years subject to certain restrictions. For the year ended December 31, 2010, IID waived $199 of Class S specific distribution fees and ING Investments waived $313,757 of management fees for Money Market to maintain a yield of not less than zero. This expense waiver or reimbursement may be discontinued at any time.
NOTE 6 — OTHER TRANSACTIONS WITH AFFILIATED AND RELATED PARTIES
At December 31, 2010, the Portfolios had the following amounts recorded as payable to affiliates on the accompanying Statements of Assets and Liabilities (see Notes 4 and 5):
| Portfolio | | Accrued
Investment
Management
Fees | | Accrued
Administrative
Fees | | Accrued
Shareholder
Service and
Distribution
Fees | | Total | |
| Balanced | | $ | 263,033 | | | $ | 28,971 | | | $ | 1,719 | | | $ | 293,723 | | |
| Growth and Income | | | 1,150,856 | | | | 126,940 | | | | 103,633 | | | | 1,381,429 | | |
| Small Company | | | 401,036 | | | | 29,443 | | | | 27,155 | | | | 457,634 | | |
| Intermediate Bond | | | 849,406 | | | | 116,874 | | | | 274,677 | | | | 1,240,957 | | |
| Money Market | | | 229,601 | | | | 50,557 | | | | 41 | | | | 280,199 | | |
Science and Technology
Opportunities | | | 322,058 | | | | 18,645 | | | | 60,018 | | | | 400,721 | | |
The Registrants have adopted a Deferred Compensation Plan (the "Policy"), which allows eligible non-affiliated directors as described in the Policy to defer the receipt of all or a portion of the directors' fees payable. Amounts deferred are treated as though invested in various "notional" funds advised by ING Investments until distribution in accordance with the Policy.
At December 31, 2010, the following ING Portfolios or indirect, wholly owned subsidiaries of ING Groep owned more than 5% of the following Portfolios:
| Subsidiary | | Porfolio | | Percentage (%) | |
ING Life Insurance &
Annuity Co | | Balanced | | | 91.15 | % | |
| | | Science and Technology
Opportunities | | | 29.63 | % | |
| | | Money Market | | | 98.44 | % | |
| | | Growth and Income | | | 64.76 | % | |
| | | Intermediate Bond | | | 37.73 | % | |
| | | Small Company | | | 49.14 | % | |
ING USA Annuity and Science and Technology
Life Insurance | | Opportunities | | | 66.07 | % | |
| | | Growth and Income | | | 16.99 | % | |
| | | Intermediate Bond | | | 49.73 | % | |
| | | Small Company | | | 16.92 | % | |
| ING Solution 2025 Portfolio | | Small Company | | | 11.78 | % | |
| ING Solution 2035 Portfolio | | Small Company | | | 5.02 | % | |
| ING Solution 2045 Portfolio | | Small Company | | | 5.36 | % | |
Control is defined by the 1940 Act as the beneficial ownership, either directly or through one or more controlled companies, of more than 25% of the voting securities of a company. The 1940 Act defines affiliates as companies that are under common control. Therefore, because the Portfolios have a common owner that owns over 25% of the outstanding securities of the Portfolios, they may be deemed to be affiliates of each other. Investment activities of these shareholders could have a material impact on the Portfolios.
NOTE 7 — EXPENSE LIMITATION AGREEMENTS
ING Investments entered into written expense limitation agreements ("Expense Limitation Agreements") with each of the following Portfolios whereby the Investment Adviser has agreed to limit expenses, excluding interest expense, taxes, brokerage commissions and extraordinary expenses (and acquired fund fees and expenses) to the levels listed below:
| | | Class ADV | | Class I | | Class S | | Class S2 | |
| Small Company | | | 1.45 | % | | | 0.95 | % | | | 1.20 | % | | | 1.35 | % | |
Science and Technology
Opportunities | | | 1.55 | % | | | 1.05 | % | | | 1.30 | % | | | 1.45 | % | |
The Investment Adviser may at a later date recoup from a Portfolio management fees waived and other expenses assumed by the Investment Adviser during the previous 36 months, but only if, after such recoupment, the Portfolio's expense ratio does not exceed the percentage described above. Waived and reimbursed fees net of any recoupment by the Investment Adviser of such waived and reimbursed fees are reflected on the accompanying Statements of Operations. Amounts payable by the Investment
41
NOTES TO FINANCIAL STATEMENTS AS OF DECEMBER 31, 2010 (CONTINUED)
NOTE 7 — EXPENSE LIMITATION AGREEMENTS (continued)
Manager are reflected on the accompanying Statements of Assets and Liabilities for each Portfolio.
As of December 31, 2010, the amount of waived and reimbursed fees that are subject to recoupment by the Investment Adviser, and the related expiration dates are as follows:
| | | December 31, | | | |
| | | 2011 | | 2012 | | 2013 | | Total | |
Science and Technology
Opportunities | | $ | 32,093 | | | $ | 48,166 | | | | — | | | $ | 80,259 | | |
The Expense Limitation Agreements are contractual and shall renew automatically for one-year terms unless ING Investments provides written notice of the termination of an Expense Limitation Agreement within 90 days of the end of the then current term.
NOTE 8 — LINE OF CREDIT
The Portfolios, in addition to certain other funds managed by the Investment Adviser, have entered into an unsecured committed revolving line of credit agreement (the "Credit Agreement") with The Bank of New York Mellon for an aggregate amount of $100,000,000. The proceeds may be used to: (1) temporarily finance the purchase or sale of securities; or (2) finance the redemption of shares of an investor in the funds. During the period, the funds to which the line of credit is available paid a commitment fee equal to 0.15% per annum, and beginning December 15, 2010, 0.10% per annum on the daily unused portion of the committed line amount.
Generally, borrowings under the Credit Agreement accrue interest at the federal funds rate plus a specified margin. Repayments generally must be made within 60 days after the date of a revolving credit advance. The following Portfolios utilized the line of credit during the year ended December 31, 2010:
| | | Days
Utilized | | Avg Balance | | Weighted
Rate | |
| Balanced | | | 32 | | | $ | 1,893,906 | | | | 1.44 | % | |
| Growth and Income | | | 37 | | | | 2,251,486 | | | | 1.44 | % | |
| Small Company | | | 8 | | | | 1,104,375 | | | | 1.43 | % | |
| Intermediate Bond | | | 34 | | | | 2,862,059 | | | | 1.44 | % | |
Science and Technology
Opportunities | | | 5 | | | | 3,653,000 | | | | 1.37 | % | |
NOTE 9 — PURCHASED AND WRITTEN OPTIONS
Transactions in purchased foreign currency options for Balanced during the year ended December 31, 2010 were as follows:
| | | USD
Notional | | Cost | |
| Balance at 12/31/09 | | | — | | | $ | — | | |
| Options Purchased | | | 66,892,866 | | | | 711,535 | | |
Options Terminated in
Closing Sell Transactions | | | (7,400,000 | ) | | | (43,460 | ) | |
| Options Expired | | | (37,442,866 | ) | | | (280,730 | ) | |
| Balance at 12/31/10 | | | 22,050,000 | | | $ | 387,345 | | |
Transactions in purchased swaptions on CDX indices for Balanced during the year ended December 31, 2010 were as follows:
| | | USD
Notional | | Cost | |
| Balance at 12/31/09 | | | — | | | $ | — | | |
| Options Purchased | | | 24,859,000 | | | | 176,499 | | |
Options Terminated in
Closing Sell Transactions | | | — | | | | — | | |
| Options Expired | | | (24,859,000 | ) | | | (176,499 | ) | |
| Balance at 12/31/10 | | | — | | | $ | — | | |
Transactions in written foreign currency options for Balanced during the year ended December 31, 2010 were as follows:
| | | USD
Notional | | Premiums
Received | |
| Balance at 12/31/09 | | | — | | | $ | — | | |
| Options Written | | | 78,812,866 | | | | 686,556 | | |
Options Terminated in
Closing Purchase Transactions | | | (2,120,000 | ) | | | (118,031 | ) | |
| Options Expired | | | (44,842,866 | ) | | | (274,990 | ) | |
| Balance at 12/31/10 | | | 31,850,000 | | | $ | 293,535 | | |
Transactions in written swaptions on CDX indices for Balanced during the year ended December 31, 2010 were as follows:
| | | USD
Notional | | Premiums
Received | |
| Balance at 12/31/09 | | | — | | | $ | — | | |
| Options Written | | | 60,050,000 | | | | 302,056 | | |
Options Terminated in
Closing Purchase Transactions | | | (10,332,000 | ) | | | (198,891 | ) | |
| Options Expired | | | (49,718,000 | ) | | | (103,165 | ) | |
| Balance at 12/31/10 | | | — | | | $ | — | | |
Transactions in purchased foreign currency options for Intermediate Bond during the year ended December 31, 2010 were as follows:
| | | USD
Notional | | Cost | |
| Balance at 12/31/09 | | | — | | | $ | — | | |
| Options Purchased | | | 51,559,000 | | | | 316,057 | | |
Options Terminated in
Closing Sell Transactions | | | (51,559,000 | ) | | | (316,057 | ) | |
| Options Expired | | | — | | | | — | | |
| Balance at 12/31/10 | | | — | | | $ | — | | |
42
NOTES TO FINANCIAL STATEMENTS AS OF DECEMBER 31, 2010 (CONTINUED)
NOTE 9 — PURCHASED AND WRITTEN OPTIONS (continued)
Transactions in purchased swaptions on CDX indices for Intermediate Bond during the year ended December 31, 2010 were as follows:
| | | USD
Notional | | Cost | |
| Balance at 12/31/09 | | | — | | | $ | — | | |
| Options Purchased | | | 258,130,000 | | | | 1,832,723 | | |
Options Terminated in
Closing Sell Transactions | | | — | | | | — | | |
| Options Expired | | | (258,130,000 | ) | | | (1,832,723 | ) | |
| Balance at 12/31/10 | | | — | | | $ | — | | |
Transactions in written foreign currency options for Intermediate Bond during the year ended December 31, 2010 were as follows:
| | | USD
Notional | | Premiums
Received | |
| Balance at 12/31/09 | | | — | | | $ | — | | |
| Options Written | | | 92,659,000 | | | | 2,540,882 | | |
Options Terminated in
Closing Purchase Transactions | | | (92,659,000 | ) | | | (2,540,882 | ) | |
| Options Expired | | | — | | | | — | | |
| Balance at 12/31/10 | | | — | | | $ | — | | |
Transactions in written swaptions on CDX indices for Intermediate Bond during the year ended December 31, 2010 were as follows:
| | | USD
Notional | | Premiums
Received | |
| Balance at 12/31/09 | | | — | | | $ | — | | |
| Options Written | | | 516,260,000 | | | | 1,071,240 | | |
Options Terminated in
Closing Purchase Transactions | | | — | | | | — | | |
| Options Expired | | | (516,260,000 | ) | | | (1,071,240 | ) | |
| Balance at 12/31/10 | | | — | | | $ | — | | |
Transactions in written swaptions on interest rate swaps for Intermediate Bond during the year ended December 31, 2010 were as follows:
| | | USD
Notional | | Premiums
Received | |
| Balance at 12/31/09 | | | — | | | $ | — | | |
| Options Written | | | 116,249,000 | | | | 2,237,793 | | |
Options Terminated in
Closing Purchase Transactions | | | (116,249,000 | ) | | | (2,237,793 | ) | |
| Options Expired | | | — | | | | — | | |
| Balance at 12/31/10 | | | — | | | $ | — | | |
NOTE 10 — CAPITAL SHARES
Transactions in capital shares and dollars were as follows:
| | | Shares sold | | Shares
issued
in merger | | Reinvestment
of
distributions | | Shares
redeemed | | Net increase
(decrease)
in shares
outstanding | | Shares sold | | Proceeds
from shares
issued
in merger | | Reinvestment
of
distributions | | Shares
redeemed | | Net increase
(decrease) | |
| Year or period ended | | # | | # | | # | | # | | # | | ($) | | ($) | | ($) | | ($) | | ($) | |
| Balanced | | | |
| Class ADV(2) | | | |
| 12-31-10 | | | — | | | | — | | | | — | | | | (68 | ) | | | (68 | ) | | | — | | | | — | | | | — | | | | (758 | ) | | | (758 | ) | |
| 12-31-09 | | | — | | | | — | | | | — | | | | (1 | ) | | | (1 | ) | | | — | | | | — | | | | — | | | | (10 | ) | | | (10 | ) | |
| Class S | | | |
| 12-31-10 | | | 109,991 | | | | — | | | | 19,205 | | | | (151,439 | ) | | | (22,243 | ) | | | 1,172,653 | | | | — | | | | 209,217 | | | | (1,643,655 | ) | | | (261,785 | ) | |
| 12-31-09 | | | 44,415 | | | | — | | | | 33,289 | | | | (98,804 | ) | | | (21,100 | ) | | | 412,647 | | | | — | | | | 285,533 | | | | (894,457 | ) | | | (196,277 | ) | |
| Class I | | | |
| 12-31-10 | | | 329,180 | | | | — | | | | 1,591,438 | | | | (9,447,108 | ) | | | (7,526,490 | ) | | | 3,593,953 | | | | — | | | | 17,430,474 | | | | (101,822,846 | ) | | | (80,798,419 | ) | |
| 12-31-09 | | | 2,039,704 | | | | — | | | | 3,180,956 | | | | (10,322,866 | ) | | | (5,102,206 | ) | | | 16,955,119 | | | | — | | | | 27,411,197 | | | | (94,851,475 | ) | | | (50,485,159 | ) | |
| Class S2(2) | | | |
| 12-31-10 | | | — | | | | — | | | | — | | | | (376 | ) | | | (376 | ) | | | (2,993 | ) | | | — | | | | — | | | | — | | | | (2,993 | ) | |
| 12-31-09 | | | 376 | | | | — | | | | — | | | | — | | | | 376 | | | | 3,000 | | | | — | | | | — | | | | — | | | | 3,000 | | |
| ING Growth and Income Portfolio | | | |
| Class ADV | | | |
| 12-31-10 | | | 193,647 | | | | 38,530 | | | | 2,324 | | | | (24,189 | ) | | | 210,312 | | | | 3,961,350 | | | | 714,546 | | | | 50,616 | | | | (482,731 | ) | | | 4,243,781 | | |
| 12-31-09 | | | 9,153 | | | | 28,372 | | | | 670 | | | | (23,354 | ) | | | 14,841 | | | | 152,836 | | | | 501,131 | | | | 13,059 | | | | (360,455 | ) | | | 306,571 | | |
| Class S | | | |
| 12-31-10 | | | 256,483 | | | | 853,542 | | | | 174,734 | | | | (4,212,773 | ) | | | (2,928,014 | ) | | | 5,131,721 | | | | 15,830,977 | | | | 3,810,949 | | | | (83,123,342 | ) | | | (58,349,695 | ) | |
| 12-31-09 | | | 844,328 | | | | 8,254,997 | | | | 288,517 | | | | (3,727,272 | ) | | | 5,660,570 | | | | 14,473,186 | | | | 145,680,614 | | | | 5,611,654 | | | | (60,244,561 | ) | | | 105,520,893 | | |
| Class I | | | |
| 12-31-10 | | | 4,936,564 | | | | 6,260,609 | | | | 1,050,263 | | | | (17,136,308 | ) | | | (4,888,872 | ) | | | 99,888,902 | | | | 117,185,341 | | | | 23,084,783 | | | | (340,543,986 | ) | | | (100,384,960 | ) | |
| 12-31-09 | | | 13,792,242 | | | | 755,790 | | | | 1,419,123 | | | | (15,741,817 | ) | | | 225,338 | | | | 217,641,302 | | | | 13,448,552 | | | | 27,814,869 | | | | (257,306,489 | ) | | | 1,598,234 | | |
| Class S2 | | | |
| 12-31-10 | | | — | | | | — | | | | — | | | | — | | | | — | | | | — | | | | — | | | | — | | | | — | | | | — | | |
| 02-27-09(1) - 12-31-09 | | | 236 | | | | 572,428 | | | | — | | | | (572,428 | ) | | | 236 | | | | 3,000 | | | | 10,117,274 | | | | — | | | | (10,117,270 | ) | | | 3,004 | | |
(1) Commencement of operations.
(2) Class liquidated on April 6, 2010.
43
NOTES TO FINANCIAL STATEMENTS AS OF DECEMBER 31, 2010 (CONTINUED)
NOTE 10 — CAPITAL SHARES (continued)
| | | Shares sold | | Shares
issued
in merger | | Reinvestment
of
distributions | | Shares
redeemed | | Net increase
(decrease)
in shares
outstanding | | Shares sold | | Proceeds
from shares
issued
in merger | | Reinvestment
of
distributions | | Shares
redeemed | | Net increase
(decrease) | |
| Year or period ended | | # | | # | | # | | # | | # | | ($) | | ($) | | ($) | | ($) | | ($) | |
| ING Small Company Portfolio | | | |
| Class ADV | | | |
| 12-31-10 | | | 174,304 | | | | 25,523 | | | | 19 | | | | (21,358 | ) | | | 178,488 | | | | 2,822,855 | | | | 368,908 | | | | 321 | | | | (352,419 | ) | | | 2,839,665 | | |
| 12-31-09 | | | 2,418 | | | | — | | | | — | | | | (243 | ) | | | 2,175 | | | | 33,776 | | | | — | | | | — | | | | (3,555 | ) | | | 30,221 | | |
| Class S | | | |
| 12-31-10 | | | 3,062,872 | | | | 2,236,773 | | | | 17,727 | | | | (3,941,124 | ) | | | 1,376,248 | | | | 48,820,329 | | | | 32,508,979 | | | | 298,881 | | | | (60,524,887 | ) | | | 21,103,302 | | |
| 12-31-09 | | | 3,757,468 | | | | — | | | | 29,034 | | | | (2,271,330 | ) | | | 1,515,172 | | | | 47,085,121 | | | | — | | | | 330,410 | | | | (28,087,792 | ) | | | 19,327,739 | | |
| Class I | | | |
| 12-31-10 | | | 2,599,588 | | | | 402,111 | | | | 143,022 | | | | (5,219,625 | ) | | | (2,074,904 | ) | | | 41,384,189 | | | | 5,917,059 | | | | 2,439,964 | | | | (84,977,782 | ) | | | (35,236,570 | ) | |
| 12-31-09 | | | 10,067,622 | | | | — | | | | 272,837 | | | | (16,743,997 | ) | | | (6,403,538 | ) | | | 116,218,366 | | | | — | | | | 3,140,352 | | | | (223,426,392 | ) | | | (104,067,674 | ) | |
| Class S2 | | | |
| 12-31-10 | | | 4,816 | | | | 25,982 | | | | — | | | | (28,371 | ) | | | 2,427 | | | | 73,445 | | | | 376,528 | | | | — | | | | (414,997 | ) | | | 34,976 | | |
| 02-27-09(1) - 12-31-09 | | | 324 | | | | — | | | | — | | | | — | | | | 324 | | | | 3,000 | | | | — | | | | — | | | | — | | | | 3,000 | | |
| ING Intermediate Bond Portfolio | | | |
| Class ADV | | | |
| 12-31-10 | | | 343,606 | | | | — | | | | 17,368 | | | | (2,759 | ) | | | 358,215 | | | | 4,375,479 | | | | — | | | | 208,590 | | | | (34,961 | ) | | | 4,549,108 | | |
| 12-31-09 | | | — | | | | — | | | | — | | | | (1 | ) | | | (1 | ) | | | — | | | | — | | | | — | | | | (11 | ) | | | (11 | ) | |
| Class S | | | |
| 12-31-10 | | | 10,865,448 | | | | — | | | | 5,124,809 | | | | (19,423,739 | ) | | | (3,433,482 | ) | | | 132,070,207 | | | | — | | | | 61,395,211 | | | | (238,497,525 | ) | | | (45,032,107 | ) | |
| 12-31-09 | | | 15,825,364 | | | | — | | | | 6,557,925 | | | | (16,132,158 | ) | | | 6,251,131 | | | | 179,118,265 | | | | — | | | | 75,398,390 | | | | (182,847,886 | ) | | | 71,668,769 | | |
| Class I | | | |
| 12-31-10 | | | 10,988,428 | | | | — | | | | 5,055,217 | | | | (22,010,813 | ) | | | (5,967,168 | ) | | | 135,276,414 | | | | — | | | | 60,814,261 | | | | (269,901,327 | ) | | | (73,810,652 | ) | |
| 12-31-09 | | | 16,916,551 | | | | — | | | | 7,105,709 | | | | (79,964,789 | ) | | | (55,942,529 | ) | | | 189,668,625 | | | | — | | | | 81,820,258 | | | | (930,726,708 | ) | | | (659,237,825 | ) | |
| Class S2 | | | |
| 12-31-10 | | | — | | | | — | | | | — | | | | — | | | | — | | | | — | | | | — | | | | — | | | | — | | | | — | | |
| 02-27-09(1) - 12-31-09 | | | 278 | | | | — | | | | — | | | | — | | | | 278 | | | | 3,000 | | | | — | | | | — | | | | — | | | | 3,000 | | |
| ING Money Market Portfolio | | | |
| Class S | | | |
| 03-15-10(1) - 12-31-10 | | | 389,581 | | | | — | | | | — | | | | (76,566 | ) | | | 313,015 | | | | 389,581 | | | | — | | | | — | | | | (76,566 | ) | | | 313,015 | | |
| 12-31-09 | | | — | | | | — | | | | — | | | | — | | | | — | | | | — | | | | — | | | | — | | | | — | | | | — | | |
| Class I | | | |
| 12-31-10 | | | 77,954,840 | | | | — | | | | 3,000,224 | | | | (336,926,082 | ) | | | (255,971,018 | ) | | | 77,954,837 | | | | — | | | | 3,000,227 | | | | (336,926,082 | ) | | | (255,971,018 | ) | |
| 12-31-09 | | | 83,164,700 | | | | — | | | | 5,386,753 | | | | (558,662,896 | ) | | | (470,111,443 | ) | | | 83,164,700 | | | | — | | | | 5,285,563 | | | | (558,662,896 | ) | | | (470,212,633 | ) | |
| ING BlackRock Science and Technology Opportunities Portfolio | | | |
| Class ADV | | | |
| 12-31-10 | | | 978,124 | | | | — | | | | — | | | | (27,031 | ) | | | 951,093 | | | | 5,149,717 | | | | — | | | | — | | | | (138,236 | ) | | | 5,011,481 | | |
| 12-31-09 | | | 10,083 | | | | — | | | | — | | | | — | | | | 10,083 | | | | 46,727 | | | | — | | | | — | | | | — | | | | 46,727 | | |
| Class S | | | |
| 12-31-10 | | | 14,891,327 | | | | — | | | | — | | | | (14,515,694 | ) | | | 375,633 | | | | 77,014,151 | | | | — | | | | — | | | | (71,369,356 | ) | | | 5,644,795 | | |
| 12-31-09 | | | 28,025,709 | | | | — | | | | — | | | | (9,114,688 | ) | | | 18,911,021 | | | | 109,710,300 | | | | — | | | | — | | | | (34,899,591 | ) | | | 74,810,709 | | |
| Class I | | | |
| 12-31-10 | | | 2,756,986 | | | | — | | | | — | | | | (2,424,940 | ) | | | 332,046 | | | | 14,560,149 | | | | — | | | | — | | | | (12,403,091 | ) | | | 2,157,058 | | |
| 12-31-09 | | | 4,765,612 | | | | — | | | | — | | | | (1,699,898 | ) | | | 3,065,714 | | | | 18,798,005 | | | | — | | | | — | | | | (6,866,848 | ) | | | 11,931,157 | | |
| Class S2 | | | |
| 12-31-10 | | | 11,913 | | | | — | | | | — | | | | (6,112 | ) | | | 5,801 | | | | 68,318 | | | | — | | | | — | | | | (35,456 | ) | | | 32,862 | | |
| 02-27-09(1) - 12-31-09 | | | 998 | | | | — | | | | — | | | | (1 | ) | | | 997 | | | | 3,003 | | | | — | | | | — | | | | (3 | ) | | | 3,000 | | |
(1) Commencement of operations.
44
NOTES TO FINANCIAL STATEMENTS AS OF DECEMBER 31, 2010 (CONTINUED)
NOTE 11 — SECURITIES LENDING
Under an agreement with The Bank of New York Mellon ("BNY"), the Portfolios may lend their securities to approved brokers, dealers and other financial institutions. Loans are collateralized by cash and U.S. government securities. The collateral is equal to at least 105% of the market value of non-U.S. securities loaned and 102% of the market value of U.S. securities loaned. The market value of the loaned securities is determined at the close of business of the Portfolios at their last sale price or official closing price on the principal exchange or system on which they are traded and any additional collateral is delivered to the Portfolios on the next business day. The cash collateral received is invested in approved investments as defined in the Securities Lending Agreement with BNY (the "Agreement"). The Portfolios bear the risk of loss with respect to the investment of collateral. Currently, the cash collateral is invested in the BNY Mellon Overnight Government Fund (formerly, The BNY Institutional Cash Reserves Fund — Series A) and the BNY Institutional Cash Reserves Fund — Series B ("BICR — Series B"), each a series within the BNY Institutional Cash Reserves Trust (collectively, the "BICR Fund"). BNY serves as investment manager, custodian and operational trustee of the BICR Fund. As of December 31, 2010, and throughout the period covered by this report, BICR — Series B held certain defaulted securities issued by Lehman Brothers Holdings, Inc. (the "Lehman Securities"). The Lehman Securities have market values significantly below amortized cost. On May 22, 2009, the Portfolios agreed to the terms of a capital support agreement (the "Capital Support Agreement") extended by The Bank of New York Mellon Corporation ("BNYC"), an affiliated company of BNY, for the Lehman Securities held by BICR — Series B. Under the terms of the Capital Support Agreement, BNYC will support the value of the Lehman Securities up to 80% of the par value (the remaining 20% of the par value represents an unrealized loss to the Portfolios) and subject, in part, to the Portfolios' continued participation in the BNY securities lending program through September 15, 2011. At September 15, 2011, if the Portfolios have complied with the requirements under the Capital Support Agreement to continue to participate in the BNY securities lending program and if such securities have not otherwise been sold, the Portfolios will have the right to sell the defaulted securities to BNYC at a price equal to 80% of par value. The recorded value of each Portfolio's investment in BICR — Series B includes the value of the underlying securities held by BICR — Series B and the estimated value of the support to be provided by BNYC. The investments in the BNY Mellon Overnight Government Fund and in BICR — Series B are included in the Summary Portfolio of Investments under Securities Lending Collateral and the unrealized loss on BICR — Series B is included in Net Unrealized Depreciation on the Statements of Assets and Liabilities.
Generally, in the event of counterparty default, the Portfolios have the right to use the collateral to offset losses incurred. The Agreement contains certain guarantees by BNY in the event of counterparty default and/or a borrower's failure to return a loaned security; however, there would be a potential loss to the Portfolios in the event the Portfolios are delayed or prevented from exercising their right to dispose of the collateral. Engaging in securities lending could have a leveraging effect, which may intensify the credit, market and other risks associated with investing in a Portfolio. At December 31, 2010, the following Portfolios had securities on loan with the following market values:
| | | Value of
Securities
Loaned | | Cash
Collateral
Received* | |
| Balanced | | $ | 18,140,531 | | | $ | 18,547,690 | | |
| Growth and Income | | | 69,727,858 | | | | 71,347,354 | | |
| Small Company | | | 5,587,097 | | | | 5,706,180 | | |
| Intermediate Bond | | | 9,665,366 | | | | 9,829,180 | | |
Science and Technology
Opportunities | | | 7,049,598 | | | | 7,302,409 | | |
* Cash collateral received was invested in the BICR Fund, the fair value of which is presented in the respective Portfolio's Summary Portfolio of Investments.
NOTE 12 — CONCENTRATION OF INVESTMENT RISKS
All mutual funds involve risk — some more than others — and there is always the chance that you could lose money or not earn as much as you hope. A Portfolio's risk profile is largely a factor of the principal securities in which it invests and investment techniques that it uses. For more information regarding the types of securities and investment techniques that may be used by each Portfolio and their corresponding risks, see the Portfolios' most recent Prospectus and/or the Statement of Additional Information.
Concentration (Science and Technology Opportunities). The Portfolio concentrates (for purposes of the 1940 Act) its assets in securities related to a particular industry, which means that at least 25% of its assets will be invested in that particular industry at all times. As a result, the Portfolio may be subject to greater market fluctuation than a portfolio which has securities representing a broader range of investment alternatives.
45
NOTES TO FINANCIAL STATEMENTS AS OF DECEMBER 31, 2010 (CONTINUED)
NOTE 12 — CONCENTRATION OF INVESTMENT RISKS (continued)
Foreign Securities (All Portfolios). Investments in foreign securities may entail risks not present in domestic investments. Since securities in which the Portfolios may invest are denominated in foreign currencies, changes in the relationship of these foreign currencies to the U.S. dollar can significantly affect the value of the investments and earnings of the Portfolios. Foreign investments may also subject the Portfolios to foreign government exchange restrictions, expropriation, taxation or other political, social or economic developments, as well as changes vis-a-vis the U.S. dollar from movements in currency, and changes in security value and interest rate, all of which could affect the market and/or credit risk of the Portfolios' investments.
Emerging Markets Investments (Intermediate Bond and Science and Technology Opportunities). Because of less developed markets and economies and, in some countries, less mature governments and governmental institutions, the risks of investing in foreign securities can be intensified in the case of investments in issuers domiciled or doing substantial business in emerging market countries.
NOTE 13 — FEDERAL INCOME TAXES
The amount of distributions from net investment income and net realized capital gains are determined in accordance with federal income tax regulations, which may differ from U.S. generally accepted accounting principles for investment companies. These book/tax differences may be either temporary or permanent. Permanent differences are reclassified within the capital accounts based on their federal tax-basis treatment; temporary differences are not reclassified. Key differences include the treatment of short-term capital gains, foreign currency transactions, income from passive foreign investment companies (PFICs), and wash sale deferrals. Distributions in excess of net investment income and/or net realized capital gains for tax purposes are reported as return of capital.
The following permanent tax differences have been reclassified as of December 31, 2010:
| | | Paid-in
Capital | | Undistributed
Net Investment
Income | | Accumulated
Net Realized
Gains/
(Losses) | |
| Balanced | | $ | — | | | $ | 1,684,046 | | | $ | (1,684,046 | ) | |
| Growth and Income(1) | | | (25,866,551 | ) | | | 16,058 | | | | 25,850,493 | | |
| Small Company(2) | | | (40,909,035 | ) | | | (358,220 | ) | | | 41,267,255 | | |
| Intermediate Bond | | | 2,942 | | | | 7,412,941 | | | | (7,415,883 | ) | |
| Money Market | | | (211,388 | ) | | | 211,388 | | | | — | | |
Science and Technology
Opportunities | | | (2,554,798 | ) | | | 1,496,601 | | | | 1,058,197 | | |
(1) $25,866,551 relates to the expiration of capital loss carryforwards.
(2) $40,909,035 relates to the expiration of capital loss carryforwards.
Dividends paid by the Portfolios from net investment income and distributions of net realized short-term capital gains are, for federal income tax purposes, taxable as ordinary income to shareholders.
The tax composition of dividends and distributions to shareholders was as follows:
| | | Year
Ended
December 31,
2010 | | Year
Ended
December 31,
2009 | |
| | | Ordinary
Income | | Return of
Capital | | Ordinary
Income | |
| Balanced | | $ | 17,639,691 | | | $ | — | | | $ | 27,696,918 | | |
| Growth and Income | | | 26,964,425 | | | | — | | | | 33,459,107 | | |
| Small Company | | | 2,739,204 | | | | — | | | | 3,470,816 | | |
| Intermediate Bond | | | 122,440,983 | | | | — | | | | 157,249,151 | | |
| Money Market | | | 490,255 | | | | 2,509,972 | | | | 5,285,563 | | |
The tax-basis components of distributable earnings and the expiration dates of the capital loss carryforwards which may be used to offset future realized capital gains for federal income tax purposes as of December 31, 2010 were:
| | | Undistributed
Ordinary Income | | Unrealized
Appreciation/
(Depreciation) | | Post-October
Capital Loss
Deferred | | Post-October
Currency Loss
Deferred | | Capital Loss
Carryforwards | | Expiration
Dates | |
| Balanced | | $ | 16,047,435 | | | $ | 35,029,825 | | | $ | — | | | $ | — | | | $ | (75,704,597 | ) | | | 2016 | | |
| | | | | | | | | | | | (82,316,593 | ) | | | 2017 | | |
| | | | | | | | | | | $ | (158,021,190 | ) | | | | | |
| Growth and Income | | | 9,058 | | | | 425,772,756 | | | | — | | | | — | | | $ | (13,396,292 | ) | | | 2014 | | |
| | | | | | | | | | | | (67,479,275 | ) | | | 2015 | | |
| | | | | | | | | | | | (322,238,329 | ) | | | 2016 | | |
| | | | | | | | | | | | (217,728,168 | ) | | | 2017 | | |
| | | | | | | | | | | $ | (620,842,064 | )* | | | | | |
46
NOTES TO FINANCIAL STATEMENTS AS OF DECEMBER 31, 2010 (CONTINUED)
NOTE 13 — FEDERAL INCOME TAXES (continued)
| | | Undistributed
Ordinary Income | | Unrealized
Appreciation/
(Depreciation) | | Post-October
Capital Loss
Deferred | | Post-October
Currency Loss
Deferred | | Capital Loss
Carryforwards | | Expiration
Dates | |
| Small Company | | $ | 2,207,911 | | | $ | 111,490,196 | | | $ | — | | | $ | — | | | $ | (7,853,881 | ) | | | 2015 | | |
| | | | | | | | | | | | (1,570,776 | ) | | | 2016 | | |
| | | | | | | | | | | | (42,427,043 | ) | | | 2017 | | |
| | | | | | | | | | | $ | (51,851,700 | )* | | | | | |
| Intermediate Bond | | | 203,389 | | | | 79,557,967 | | | | (18,161,067 | ) | | | (3,122,281 | ) | | $ | (386,521,631 | ) | | | 2017 | | |
| Money Market | | | — | | | | (150,144 | ) | | | — | | | | — | | | $ | (33,301 | ) | | | 2012 | | |
| Science and Technology Opportunities | | | — | | | | 92,318,085 | | | | — | | | | — | | | $ | (3,997,473 | ) | | | 2011 | | |
| | | | | | | | | | | | (8,579,872 | ) | | | 2016 | | |
| | | | | | | | | | | | (12,108,952 | ) | | | 2017 | | |
| | | | | | | | | | | $ | (24,686,297 | )* | | | | | |
* Utilization of these capital losses is subject to annual limitations under Section 382 of the Internal Revenue Code.
The Regulated Investment Company Modernization Act of 2010 (the "Act") was enacted on December 22, 2010. The Act makes changes to several tax rules impacting the Portfolios. In general, the provisions of the Act will be effective for the Portfolios' fiscal year ending December 31, 2011. Although the Act provides several benefits, including the unlimited carryforward of future capital losses, there may be a greater likelihood that all or a portion of each Portfolio's pre-enactment capital loss carryforwards may expire without being utilized due to the fact that post-enactment capital losses get utilized before pre-enactment capital loss carryforwards. Relevant information regarding the impact of the Act on the Portfolios, if any, will be contained within the Federal Income Taxes section of the notes to financial statements for the fiscal year ending December 31, 2011.
The Portfolios' major tax jurisdictions are federal, Arizona, and Massachusetts. The earliest tax year that remains subject to examination by these jurisdictions is 2006.
As of December 31, 2010, no provisions for income tax would be required in the Portfolios' financial statements as a result of tax positions taken on federal and state income tax returns for open tax years. The Portfolios' federal and state income and federal excise tax returns for tax years for which the applicable statutes of limitations have not expired are subject to examination by the Internal Revenue Service and state department of revenue.
NOTE 14 — REORGANIZATIONS
On August 20, 2010, Growth and Income ("Acquiring Portfolio") acquired all of the net assets of ING Opportunistic LargeCap Portfolio ("Acquired Portfolio"), an open-end investment company in a tax-free reorganization in exchange for shares of the Acquiring Portfolio, pursuant to a plan of reorganization approved by the Acquired Portfolio's shareholders on August 10, 2010. The primary purpose of the transaction was to lower the overall gross and net expense ratios for all classes. For financial reporting purposes, assets received and shares issued by the Acquiring Portfolio were recorded at fair value; however, the cost basis of the investments received from the Acquired Portfolio was carried forward to align ongoing reporting of the Acquiring Portfolio's realized and unrealized gains and losses with amounts distributable to shareholders for tax purposes.
Assuming the acquisition had been completed on January 1, 2010, the beginning of the annual reporting period of the Acquiring Portfolio, the Acquiring Portfolio's pro forma results of operations for the period ended December 31, 2010, are as follows:
| Net investment income | | $ | 28,138,444 | | |
Net realized and unrealized gain on
investments | | $ | 294,061,617 | | |
Net increase in net assets resulting from
operations | | $ | 322,200,061 | | |
47
NOTES TO FINANCIAL STATEMENTS AS OF DECEMBER 31, 2010 (CONTINUED)
NOTE 14 — REORGANIZATIONS (continued)
Because the combined investment Portfolios have been managed as a single integrated Portfolio since the acquisition was completed, it is not practicable to separate the amounts of revenue and earnings of the Acquired Portfolio that have been included in the Acquiring Portfolio's statement of operations since August 20, 2010. Net assets and unrealized appreciation as of the reorganization date were as follows:
Acquiring
Portfolio | | Acquired
Portfolio | | Total Net Assets of
Acquired Portfolio (000s) | | Total Net Assets of
Acquiring Portfolio (000s) | | Acquired
Capital Loss
Carryforwards (000s) | | Acquired Portfolio
Unrealized
Appreciation (000s) | | Conversion
Ratio | |
Growth
and Income | | ING
Opportunistic
LargeCap
Portfolio | | $ | 133,731 | | | $ | 2,267,223 | | | $ | 59,967 | | | $ | (4,893 | ) | | | 0.4690 | | |
The net assets of Growth and Income after the acquisition were $2,400,953,698.
On August 20, 2010, Small Company ("Acquiring Portfolio") acquired all of the net assets of ING Wells Fargo Small Cap Disciplined Portfolio ("Acquired Portfolio"), an open-end investment company in a tax-free reorganization in exchange for shares of the Acquiring Portfolio, pursuant to a plan of reorganization approved by the Acquired Portfolio's shareholders on August 10, 2010. The primary purpose of the transaction was to lower the overall gross and net expense ratios for all classes. For financial reporting purposes, assets received and shares issued by the Acquiring Portfolio were recorded at fair value; however, the cost basis of the investments received from the Acquired Portfolio was carried forward to align ongoing reporting of the Acquiring Portfolio's realized and unrealized gains and losses with amounts distributable to shareholders for tax purposes.
Assuming the acquisition had been completed on January 1, 2010, the beginning of the annual reporting period of the Acquiring Portfolio, the Acquiring Portfolio's pro forma results of operations for the period ended December 31, 2010, are as follows:
| Net investment income | | $ | 2,595,067 | | |
Net realized and unrealized gain on
investments | | $ | 121,007,609 | | |
Net increase in net assets resulting from
operations | | $ | 123,602,676 | | |
Because the combined investment Portfolios have been managed as a single integrated Portfolio since the acquisition was completed, it is not practicable to separate the amounts of revenue and earnings of the Acquired Portfolio that have been included in the Acquiring Portfolio's statement of operations since August 20, 2010. Net assets and unrealized appreciation as of the reorganization date were as follows:
Acquiring
Portfolio | | Acquired
Portfolio | | Total Net Assets of
Acquired Portfolio (000s) | | Total Net Assets of
Acquiring Portfolio (000s) | | Acquired
Capital Loss
Carryforwards (000s) | | Acquired Portfolio
Unrealized
Appreciation (000s) | | Conversion
Ratio | |
Small
Company | | ING
Wells Fargo
Small Cap
Disciplined
Portfolio | | $ | 39,171 | | | $ | 476,552 | | | $ | 51,431 | | | $ | (976 | ) | | | 0.5148 | | |
The net assets of Small Company after the acquisition were $515,722,984.
NOTE 15 — LITIGATION
On December 12, 2003, Aeltus Investment Management, Inc. (now known as ING Investment Management Co.)("IIM") received a copy of a complaint (the "Complaint") filed in the United States Bankruptcy Court for the Southern District of New York (the "Bankruptcy Court") in the matter of Enron Corp. v. Mass Mutual Life Insurance Co., et al. Among other defendants named in the Complaint are defendants ING VP Balanced Portfolio, Inc. and ING VP Bond Portfolio (the "Subject Portfolios"). As of August 6, 2004, ING VP Bond Portfolio changed its name to ING VP Intermediate Bond Portfolio. As of May 1, 2009, ING VP Intermediate Bond Portfolio and ING VP Balanced Portfolio, Inc. changed their names to ING Intermediate Bond Portfolio and ING Balanced Portfolio, Inc., respectively. The Complaint alleges that Enron Corp. ("Enron") transferred to the defendants, including the Subject Portfolios, over $1 billion in the aggregate for the purpose of prepaying certain commercial paper issued by Enron (the "Notes") and held by the defendants prior to the filing by Enron for
48
NOTES TO FINANCIAL STATEMENTS AS OF DECEMBER 31, 2010 (CONTINUED)
NOTE 15 — LITIGATION (continued)
bankruptcy protection under Chapter 11 of Title 11 of the Bankruptcy Code (the "Bankruptcy Code").
The Complaint seeks to recover these transfers under the alternative but interrelated bankruptcy theories of preferential transfer and fraudulent conveyance. Although the Complaint does not specify the amount of each transfer in dispute, it appears that the sale of ING VP Balanced Portfolio, Inc. of $23,181,757 of the Notes on or about October 29, 2001, and the sale by ING VP Bond Portfolio of $24,963,125 of the Notes on or about October 29, 2001 are in dispute. The Complaint seeks to require the Subject Portfolios to repay to Enron the full amount of these transfers, in which event the Subject Portfolios would be granted unsecured claims against the Enron bankruptcy estate in the amounts of the repayments. If Enron proves up the elements of preferential transfer and/or fraudulent conveyance, these are strict liability theories of recovery.
On April 29, 2008, IIM and the Subject Portfolios joined a plenary motion for summary judgment filed by Goldman Sachs. In addition, a separate brief was filed on behalf of IIM asserting the defenses unique to the investment advisor defendants; that they were merely conduits. On June 29, 2009, the Bankruptcy Court ruled on the motion for summary judgment and held that the pre-payments made were not protected from avoidance by section 546(e) of the Bankruptcy Code and denied the summary judgment to the Subject Portfolios; however, the Bankruptcy Court granted the summary judgment to dismiss IIM.
The Subject Portfolios filed an interlocutory appeal of the Bankruptcy Court's denial of summary judgment with the United States District Court of Southern New York ("District Court"). On November 19, 2009, (prior to the Bankruptcy Court ruling on Enron's motion for summary judgment filed in September 2009) the District Court ruled in favor of the Subject Portfolios and the one other remaining defendant, agreeing with the Subject Portfolios' reliance on section 546(e) and reversing the Bankruptcy Court. The judge directed the Bankruptcy Court to enter summary judgment in favor of the Subject Portfolios and the remaining defendant, essentially dismissing the preference claim against them.
Enron appealed the District Court's ruling to the Second Circuit Court of Appeals (the "Court of Appeals) on April 16, 2010. An Oral Arguments hearing was held in November and a decision by the Court of Appeals could come during the second quarter of 2011.
NOTE 16 — SUBSEQUENT EVENTS.
On January 21, 2011, ING American Funds Growth-Income Portfolio merged into Growth and Income. In conjunction with the merger of ING American Funds Growth-Income Portfolio into Growth and Income, Growth and Income's Class ADV share' distribution fee is reduced via a side letter so that the total distribution fee paid is 0.20%.
The Portfolios have evaluated events occurring after the Statements of Assets and Liabilities date (subsequent events) to determine whether any subsequent events necessitated adjustment to or disclosure in the financial statements. Other than the above, no such subsequent events were identified.
49
SUMMARY PORTFOLIO OF INVESTMENTS
ING BALANCED PORTFOLIO AS OF DECEMBER 31, 2010
| Shares | |
| |
| | Value | | Percent of
Net Assets | |
| COMMON STOCK: 56.1% | | | |
| | | Consumer Discretionary: 6.2% | | | |
| | 137,800 | | | | | | | Comcast Corp. -
Class A | | $ | 3,027,466 | | | | 0.5 | | |
| | 111,469 | | | | | | | Wyndham
Worldwide Corp. | | | 3,339,611 | | | | 0.5 | | |
| | | | | | | | | Other Securities | | | 32,341,828 | | | | 5.2 | | |
| | | | | | | | | | | | | | 38,708,905 | | | | 6.2 | | |
| | | Consumer Staples: 4.4% | | | |
| | 123,880 | | | | | | | Coca-Cola
Enterprises, Inc. | | | 3,100,716 | | | | 0.5 | | |
| | 83,300 | | | | | | | PepsiCo, Inc. | | | 5,441,989 | | | | 0.9 | | |
| | 63,635 | | | | | | | Procter & Gamble Co. | | | 4,093,640 | | | | 0.6 | | |
| | 104,433 | | | | | | | Wal-Mart Stores, Inc. | | | 5,632,072 | | | | 0.9 | | |
| | | | | | | | | Other Securities | | | 9,203,466 | | | | 1.5 | | |
| | | | | | | | | | | | | | 27,471,883 | | | | 4.4 | | |
| | | Energy: 6.8% | | | |
| | 101,616 | | | | | | | Arch Coal, Inc. | | | 3,562,657 | | | | 0.6 | | |
| | 133,532 | | | | | | | ExxonMobil Corp. | | | 9,763,860 | | | | 1.5 | | |
| | 48,149 | | | | S | | | National Oilwell
Varco, Inc. | | | 3,238,020 | | | | 0.5 | | |
| | 114,600 | | | | | | | Royal Dutch Shell
PLC - Class A | | | 3,826,309 | | | | 0.6 | | |
| | 42,700 | | | | | | | Schlumberger Ltd. | | | 3,565,450 | | | | 0.6 | | |
| | 101,300 | | | | S | | | Suncor Energy, Inc. | | | 3,878,777 | | | | 0.6 | | |
| | | | | | | | | Other Securities | | | 14,771,558 | | | | 2.4 | | |
| | | | | | | | | | | | | | 42,606,631 | | | | 6.8 | | |
| | | Financials: 9.6% | | | |
| | 1,041,900 | | | | @ | | | Citigroup, Inc. | | | 4,928,187 | | | | 0.8 | | |
| | 71,750 | | | | | | | Comerica, Inc. | | | 3,030,720 | | | | 0.5 | | |
| | 11,642 | | | | | | | Goldman Sachs
Group, Inc. | | | 1,957,719 | | | | 0.3 | | |
| | 151,157 | | | | | | | JPMorgan Chase & Co. | | | 6,412,080 | | | | 1.0 | | |
| | 198,533 | | | | | | | Wells Fargo & Co. | | | 6,152,538 | | | | 1.0 | | |
| | | | | | | | | Other Securities | | | 37,083,360 | | | | 6.0 | | |
| | | | | | | | | | | | | | 59,564,604 | | | | 9.6 | | |
| | | Health Care: 5.5% | | | |
| | 108,198 | | | | | | | AmerisourceBergen
Corp. | | | 3,691,716 | | | | 0.6 | | |
| | 116,384 | | | | | | | Merck & Co., Inc. | | | 4,194,479 | | | | 0.7 | | |
| | 266,871 | | | | | | | Pfizer, Inc. | | | 4,672,911 | | | | 0.7 | | |
| | | | | | | | | Other Securities | | | 21,882,450 | | | | 3.5 | | |
| | | | | | | | | | | | | | 34,441,556 | | | | 5.5 | | |
| | | Industrials: 6.5% | | | |
| | 46,600 | | | | | | | Fluor Corp. | | | 3,087,716 | | | | 0.5 | | |
| | 183,300 | | | | | | | General Electric Co. | | | 3,352,557 | | | | 0.5 | | |
| | 24,802 | | | | | | | Siemens AG | | | 3,072,339 | | | | 0.5 | | |
| | 46,600 | | | | @ | | | WABCO Holdings, Inc. | | | 2,839,338 | | | | 0.5 | | |
| | | | | | | | | Other Securities | | | 28,335,987 | | | | 4.5 | | |
| | | | | | | | | | | | | | 40,687,937 | | | | 6.5 | | |
| Shares | |
| |
| | Value | | Percent of
Net Assets | |
| | | Information Technology: 9.8% | | | |
| | 26,122 | | | | @,S | | | Apple, Inc. | | $ | 8,425,912 | | | | 1.3 | | |
| | 8,100 | | | | @ | | | Google, Inc. - Class A | | | 4,811,157 | | | | 0.8 | | |
| | 188,400 | | | | | | | Intel Corp. | | | 3,962,052 | | | | 0.6 | | |
| | 191,100 | | | | | | | Jabil Circuit, Inc. | | | 3,839,199 | | | | 0.6 | | |
| | 189,940 | | | | @ | | | Marvell Technology
Group Ltd. | | | 3,523,387 | | | | 0.6 | | |
| | 260,532 | | | | | | | Microsoft Corp. | | | 7,274,027 | | | | 1.2 | | |
| | 114,866 | | | | | | | Qualcomm, Inc. | | | 5,684,718 | | | | 0.9 | | |
| | 44,900 | | | | | | | Tokyo Electron Ltd. | | | 2,826,958 | | | | 0.5 | | |
| | | | | | | | | Other Securities | | | 20,304,609 | | | | 3.3 | | |
| | | | | | | | | | | | | | 60,652,019 | | | | 9.8 | | |
| | | Materials: 3.9% | | | |
| | | | | | | | | Other Securities | | | 24,071,604 | | | | 3.9 | | |
| | | Telecommunication Services: 1.6% | | | |
| | 82,700 | | | | | | | Verizon
Communications, Inc. | | | 2,959,006 | | | | 0.5 | | |
| | | | | | | | | Other Securities | | | 6,946,362 | | | | 1.1 | | |
| | | | | | | | | | | | | | 9,905,368 | | | | 1.6 | | |
| | | Utilities: 1.8% | | | |
| | 104,900 | | | | | | | Fortum OYJ | | | 3,164,146 | | | | 0.5 | | |
| | 187,200 | | | | | | | Great Plains
Energy, Inc. | | | 3,629,808 | | | | 0.6 | | |
| | | | | | | | | Other Securities | | | 4,196,024 | | | | 0.7 | | |
| | | | | | | | | | | | | | 10,989,978 | | | | 1.8 | | |
| | | | | | | | | Total Common Stock
( Cost $316,958,124 ) | | | 349,100,485 | | | | 56.1 | | |
| REAL ESTATE INVESTMENT TRUSTS: 0.1% | | | |
| | | Financials: 0.1% | | | |
| | | | | | | | | Other Securities | | | 593,741 | | | | 0.1 | | |
| | | | | | | | | Total Real Estate
Investment Trusts
( Cost $680,705 ) | | | 593,741 | | | | 0.1 | | |
| EXCHANGE-TRADED FUNDS: 5.1% | | | |
| | | Exchange-Traded Funds: 5.1% | | | |
| | 77,000 | | | | | | | iShares MSCI
Emerging Markets
Index Fund | | | 3,666,740 | | | | 0.6 | | |
| | 578,000 | | | | | | | Vanguard Emerging
Markets ETF | | | 27,830,700 | | | | 4.5 | | |
| | | | | | | | | Total Exchange-Traded
Funds
( Cost $27,591,858 ) | | | 31,497,440 | | | | 5.1 | | |
| PREFERRED STOCK: 0.1% | | | |
| | | Financials: 0.1% | | | |
| | | | | | | | | Other Securities | | | 529,862 | | | | 0.1 | | |
| | | | | | | | | Total Preferred Stock
( Cost $500,625 ) | | | 529,862 | | | | 0.1 | | |
See Accompanying Notes to Financial Statements
50
SUMMARY PORTFOLIO OF INVESTMENTS
ING BALANCED PORTFOLIO AS OF DECEMBER 31, 2010 (CONTINUED)
Notional
Amount | |
| |
| | Value | | Percent of
Net Assets | |
| POSITIONS IN PURCHASED OPTIONS: 0.0% | | | |
| | | Foreign Currency Options: 0.0% | | | |
| $ | 2,500,000 | | | | @ | | | Currency Option
OTC - Morgan
Stanley EUR
Put vs USD Call
Strike @ 1.296
(USD)-Exp 01/14/11 | | $ | 4,170 | | | | 0.0 | | |
| | 2,400,000 | | | | @ | | | Currency Option
OTC - Morgan
Stanley EUR
Put vs USD Call
Strike @ 1.310
(USD)-Exp 01/21/11 | | | 12,615 | | | | 0.0 | | |
| | 2,450,000 | | | | @ | | | Currency Option
OTC - Morgan
Stanley EUR
Put vs USD Call
Strike @ 1.310
(USD)-Exp 01/21/11 | | | 12,878 | | | | 0.0 | | |
| | 9,800,000 | | | | @ | | | Currency Option
OTC - Morgan
Stanley USD
Put vs EUR Call
Strike @ 1.405
(USD)-Exp 01/21/11 | | | 6,736 | | | | 0.0 | | |
| | 4,900,000 | | | | @ | | | Currency Option
OTC - Morgan
Stanley JPY
Put vs USD Call
Strike @ 85.000
(JPY)-Exp 02/09/11 | | | 10,876 | | | | 0.0 | | |
| | | | | | | | | Total Positions in
Purchased Options
( Cost $387,345 ) | | | 47,275 | | | | 0.0 | | |
Principal
Amount | |
| |
| | Value | | Percent of
Net Assets | |
| CORPORATE BONDS/NOTES: 13.6% | | | |
| | | Consumer Discretionary: 1.8% | | | |
| | 837,000 | | | | S | | | Comcast Corp.,
5.900%-6.500%,
due 03/15/16-
11/15/17 | | $ | 960,128 | | | | 0.2 | | |
| | 88,000 | | | | #,S | | | COX Communications, Inc.,
6.250%,
due 06/01/18 | | | 98,432 | | | | 0.0 | | |
| | 97,000 | | | | # | | | COX Communications, Inc.,
6.950%,
due 06/01/38 | | | 108,253 | | | | | | |
| | 797,000 | | | | # | | | Hyatt Hotels Corp.,
6.875%,
due 08/15/19 | | | 872,719 | | | | 0.2 | | |
| | 200,000 | | | | # | | | Myriad International
Holding BV,
6.375%,
due 07/28/17 | | | 210,480 | | | | 0.0 | | |
Principal
Amount | |
| |
| | Value | | Percent of
Net Assets | |
| $ | 617,000 | | | | # | | | NBC Universal, Inc.,
2.875%,
due 04/01/16 | | $ | 603,509 | | | | | | |
| | 112,000 | | | | # | | | NBC Universal, Inc.,
3.650%,
due 04/30/15 | | | 114,992 | | | | 0.2 | | |
| | 416,000 | | | | # | | | NBC Universal, Inc.,
5.150%,
due 04/30/20 | | | 432,032 | | | | | | |
| | 107,000 | | | | # | | | NBC Universal, Inc.,
6.400%,
due 04/30/40 | | | 114,018 | | | | | | |
| | 450,000 | | | | # | | | QVC, Inc.,
7.500%,
due 10/01/19 | | | 475,875 | | | | 0.1 | | |
| | 170,000 | | | | # | | | Rent-A-Center, Inc.,
6.625%,
due 11/15/20 | | | 170,000 | | | | 0.0 | | |
| | | | | | | | | Other Securities | | | 6,903,131 | | | | 1.1 | | |
| | | | | | | | | | | | | | 11,063,569 | | | | 1.8 | | |
| | | Consumer Staples: 0.8% | | | |
| | 459,000 | | | | # | | | JBS Finance II Ltd.,
8.250%,
due 01/29/18 | | | 463,590 | | | | 0.0 | | |
| | 495,000 | | | | &, # | | | ServiceMaster Co.,
10.750%,
due 07/15/15 | | | 532,125 | | | | 0.1 | | |
| | 525,000 | | | | # | | | Smithfield Foods, Inc.,
10.000%,
due 07/15/14 | | | 607,688 | | | | 0.1 | | |
| | | | | | | | | Other Securities | | | 3,679,465 | | | | 0.6 | | |
| | | | | | | | | | | | | | 5,282,868 | | | | 0.8 | | |
| | | Energy: 1.5% | | | |
| | 610,000 | | | | | | | Arch Coal, Inc.,
8.750%,
due 08/01/16 | | | 667,950 | | | | 0.1 | | |
| | 85,000 | | | | # | | | Consol Energy, Inc.,
8.000%,
due 04/01/17 | | | 90,950 | | | | 0.1 | | |
| | 335,000 | | | | # | | | Consol Energy, Inc.,
8.250%,
due 04/01/20 | | | 363,475 | | | | | | |
| | 150,000 | | | | # | | | Gazprom Via Gaz
Capital SA,
5.092%,
due 11/29/15 | | | 154,500 | | | | 0.0 | | |
| | 312,000 | | | | # | | | KazMunaiGaz Finance
Sub BV,
7.000%,
due 05/05/20 | | | 326,040 | | | | 0.1 | | |
| | 170,000 | | | | # | | | Kinder Morgan Finance
Co. LLC,
6.000%,
due 01/15/18 | | | 167,875 | | | | 0.0 | | |
| | 256,000 | | | | #, L | | | Odebrecht Drilling
Norbe VIII/IX Ltd.,
6.350%,
due 06/30/21 | | | 267,520 | | | | 0.1 | | |
| | | | | | | | | Other Securities (a) | | | 7,086,357 | | | | 1.1 | | |
| | | | | | | | | | | | | | 9,124,667 | | | | 1.5 | | |
See Accompanying Notes to Financial Statements
51
SUMMARY PORTFOLIO OF INVESTMENTS
ING BALANCED PORTFOLIO AS OF DECEMBER 31, 2010 (CONTINUED)
Principal
Amount | |
| |
| | Value | | Percent of
Net Assets | |
| | | Financials: 4.6% | | | |
| $ | 264,000 | | | | # | | | Banco Bradesco
SA/Cayman Islands,
5.900%,
due 01/16/21 | | $ | 265,637 | | | | 0.1 | | |
| | 213,000 | | | | # | | | Banco de Credito del
Peru,
5.375%,
due 09/16/20 | | | 210,870 | | | | 0.0 | | |
| | 200,000 | | | | # | | | Banco Votorantim SA,
7.375%,
due 01/21/20 | | | 211,760 | | | | 0.0 | | |
| | 470,000 | | | | # | | | Barclays Bank PLC,
5.926%,
due 09/29/49 | | | 423,000 | | | | 0.1 | | |
| | 228,000 | | | | # | | | Barclays Bank PLC,
6.050%,
due 12/04/17 | | | 234,211 | | | | | | |
| | 200,000 | | | | # | | | BM&FBovespa SA,
5.500%,
due 07/16/20 | | | 204,513 | | | | 0.0 | | |
| | 170,000 | | | | # | | | Celanese US
Holdings LLC,
6.625%,
due 10/15/18 | | | 175,950 | | | | 0.0 | | |
| EUR | 2,559,000 | | | | | | | Citibank Credit Card
Issuance Trust,
5.375%,
due 04/11/11 | | | 3,446,622 | | | | 0.6 | | |
| $ | 1,338,000 | | | | S | | | Citigroup, Inc.,
4.587%-8.500%,
due 09/15/14-
08/09/20 | | | 1,482,365 | | | | 0.2 | | |
| | 322,000 | | | | # | | | Cooperatieve
Centrale
Raiffeisen-
Boerenleenbank
BA/Netherlands,
11.000%,
due 12/29/49 | | | 417,410 | | | | 0.1 | | |
| | 241,000 | | | | # | | | Corestates Capital
Trust I,
8.000%,
due 12/15/26 | | | 246,532 | | | | 0.0 | | |
| | 161,000 | | | | # | | | Fibria Overseas
Finance Ltd.,
7.500%,
due 05/04/20 | | | 169,855 | | | | 0.0 | | |
| | 1,491,000 | | | | S | | | Goldman Sachs
Group, Inc.,
3.700%-6.250%,
due 08/01/15-
03/15/20 | | | 1,584,177 | | | | 0.3 | | |
| | 358,000 | | | | # | | | HSBC Finance
Corp.,
6.676%,
due 01/15/21 | | | 362,337 | | | | 0.1 | | |
| | 100,000 | | | | # | | | Hyundai Capital
America,
3.750%,
due 04/06/16 | | | 98,328 | | | | 0.0 | | |
Principal
Amount | |
| |
| | Value | | Percent of
Net Assets | |
| $ | 92,000 | | | | # | | | Iberdrola Finance
Ireland Ltd.,
3.800%,
due 09/11/14 | | $ | 91,664 | | | | 0.1 | | |
| | 742,000 | | | | # | | | Iberdrola Finance
Ireland Ltd.,
5.000%,
due 09/11/19 | | | 712,738 | | | | | | |
| | 138,000 | | | | # | | | ICICI Bank Ltd.,
5.750%,
due 11/16/20 | | | 137,855 | | | | 0.0 | | |
| | 181,000 | | | | # | | | International Lease
Finance Corp.,
7.125%,
due 09/01/18 | | | 193,218 | | | | | | |
| | 53,000 | | | | # | | | International Lease
Finance Corp.,
8.625%,
due 09/15/15 | | | 57,108 | | | | 0.1 | | |
| | 231,000 | | | | | | | International Lease
Finance Corp.,
8.250%,
due 12/15/20 | | | 238,219 | | | | | | |
| | 455,000 | | | | S | | | JPMorgan Chase
Bank NA,
4.400%-5.875%,
due 06/13/16-
07/22/20 | | | 486,138 | | | | 0.1 | | |
| | 371,000 | | | | # | | | LBI Escrow Corp.,
8.000%,
due 11/01/17 | | | 411,346 | | | | 0.1 | | |
| | 280,000 | | | | # | | | Lukoil International
Finance BV,
6.125%,
due 11/09/20 | | | 281,736 | | | | 0.1 | | |
| | 487,000 | | | | # | | | Pacific Life
Insurance Co.,
9.250%,
due 06/15/39 | | | 640,449 | | | | 0.1 | | |
| | 29,850 | | | | # | | | Power Receivable
Finance, LLC,
6.290%,
due 01/01/12 | | | 29,874 | | | | 0.0 | | |
| | 130,000 | | | | # | | | Reynolds Group DL
Escrow, Inc./Reynolds
Group Escrow LLC,
7.750%,
due 10/15/16 | | | 138,125 | | | | 0.0 | | |
| | 138,000 | | | | # | | | Sinochem Overseas
Capital Co., Ltd.,
6.300%,
due 11/12/40 | | | 142,125 | | | | 0.0 | | |
| | 100,000 | | | | # | | | Vnesheconombank
Via VEB Finance Ltd.,
6.902%,
due 07/09/20 | | | 105,000 | | | | 0.0 | | |
| | 333,000 | | | | # | | | Voto-Votorantim Ltd.,
6.750%,
due 04/05/21 | | | 349,650 | | | | 0.1 | | |
| | 200,000 | | | | # | | | VTB Bank Via VTB
Capital SA,
6.551%,
due 10/13/20 | | | 197,500 | | | | 0.0 | | |
See Accompanying Notes to Financial Statements
52
SUMMARY PORTFOLIO OF INVESTMENTS
ING BALANCED PORTFOLIO AS OF DECEMBER 31, 2010 (CONTINUED)
Principal
Amount | |
| |
| | Value | | Percent of
Net Assets | |
| | | Financials (continued) | | | |
| $ | 218,000 | | | | # | | | Xstrata Finance
Canada Ltd.,
5.500%,
due 11/16/11 | | $ | 226,320 | | | | 0.0 | | |
| | | | | | | | | Other Securities(a) | | | 14,730,100 | | | | 2.4 | | |
| | | | | | | | | | | | | | 28,702,732 | | | | 4.6 | | |
| | | Health Care: 0.6% | | | |
| | 155,000 | | | | # | | | Mylan, Inc./PA,
7.625%,
due 07/15/17 | | | 165,656 | | | | 0.1 | | |
| | 100,000 | | | | # | | | Valeant
Pharmaceuticals
International,
7.000%,
due 10/01/20 | | | 99,000 | | | | 0.0 | | |
| | | | | | | | | Other Securities | | | 3,242,721 | | | | 0.5 | | |
| | | | | | | | | | | | | | 3,507,377 | | | | 0.6 | | |
| | | Industrials: 0.5% | | | |
| | 255,000 | | | | # | | | Bombardier, Inc.,
7.500%,
due 03/15/18 | | | 274,763 | | | | 0.1 | | |
| | 255,000 | | | | # | | | Bombardier, Inc.,
7.750%,
due 03/15/20 | | | 276,038 | | | | | | |
| | 505,000 | | | | S | | | General Electric Co.,
5.250%,
due 12/06/17 | | | 546,242 | | | | 0.1 | | |
| | 203,000 | | | | # | | | Kazatomprom,
6.250%,
due 05/20/15 | | | 216,195 | | | | 0.1 | | |
| | 270,000 | | | | | | | Kazatomprom,
6.250%,
due 05/20/15 | | | 287,550 | | | | | | |
| | 317,000 | | | | # | | | SCF Capital Ltd.,
5.375%,
due 10/27/17 | | | 311,865 | | | | 0.0 | | |
| | 170,000 | | | | # | | | SPX Corp.,
6.875%,
due 09/01/17 | | | 181,475 | | | | 0.0 | | |
| | | | | | | | | Other Securities | | | 1,302,172 | | | | 0.2 | | |
| | | | | | | | | | | | | | 3,396,300 | | | | 0.5 | | |
| | | Information Technology: 0.5% | | | |
| | 335,000 | | | | S | | | Jabil Circuit, Inc.,
7.750%,
due 07/15/16 | | | 377,713 | | | | 0.1 | | |
| | 544,000 | | | | # | | | Oracle Corp.,
5.375%,
due 07/15/40 | | | 552,907 | | | | 0.1 | | |
| | | | | | | | | Other Securities | | | 1,883,142 | | | | 0.3 | | |
| | | | | | | | | | | | | | 2,813,762 | | | | 0.5 | | |
| | | Materials: 1.2% | | | |
| | 270,000 | | | | #, L | | | ALROSA Finance SA,
7.750%,
due 11/03/20 | | | 284,513 | | | | 0.0 | | |
Principal
Amount | |
| |
| | Value | | Percent of
Net Assets | |
| $ | 84,000 | | | | # | | | Celulosa Arauco y
Constitucion S.A.,
5.000%,
due 01/21/21 | | $ | 82,870 | | | | 0.1 | | |
| | 235,000 | | | | | | | Celulosa Arauco y
Constitucion S.A.,
7.250%,
due 07/29/19 | | | 270,884 | | | | | | |
| | 287,000 | | | | # | | | Chevron Phillips
Chemical Co. LLC,
7.000%,
due 06/15/14 | | | 325,613 | | | | 0.1 | | |
| | 207,000 | | | | # | | | Chevron Phillips
Chemical Co. LLC,
8.250%,
due 06/15/19 | | | 250,080 | | | | | | |
| | 215,000 | | | | # | | | Georgia-Pacific LLC,
5.400%,
due 11/01/20 | | | 212,967 | | | | 0.0 | | |
| | 414,000 | | | | # | | | Gerdau Trade, Inc.,
5.750%,
due 01/30/21 | | | 417,105 | | | | 0.1 | | |
| | 303,000 | | | | # | | | Gold Fields Ltd.,
4.875%,
due 10/07/20 | | | 290,413 | | | | 0.1 | | |
| | 320,000 | | | | # | | | Inversiones CMPC SA,
6.125%,
due 11/05/19 | | | 341,589 | | | | 0.1 | | |
| | 88,000 | | | | #, L | | | Sino-Forest Corp.,
6.250%,
due 10/21/17 | | | 89,210 | | | | 0.0 | | |
| | | | | | | | | Other Securities | | | 4,617,142 | | | | 0.7 | | |
| | | | | | | | | | | | | | 7,182,386 | | | | 1.2 | | |
| | | Telecommunication Services: 1.0% | | | |
| | 477,000 | | | | # | | | Intelsat Subsidiary
Holding Co., Ltd.,
8.875%,
due 01/15/15 | | | 490,118 | | | | 0.1 | | |
| | 250,000 | | | | # | | | Qtel International
Finance Ltd.,
3.375%,
due 10/14/16 | | | 238,755 | | | | 0.0 | | |
| | | | | | | | | Other Securities | | | 5,698,167 | | | | 0.9 | | |
| | | | | | | | | | | | | | 6,427,040 | | | | 1.0 | | |
| | | Utilities: 1.1% | | | |
| | 307,000 | | | | #,S,L | | | Allegheny Energy
Supply Co. LLC,
5.750%,
due 10/15/19 | | | 309,536 | | | | 0.0 | | |
| | 250,000 | | | | # | | | Calpine Corp.,
7.500%,
due 02/15/21 | | | 247,500 | | | | 0.1 | | |
| | 175,000 | | | | # | | | Calpine Corp.,
7.875%,
due 07/31/20 | | | 178,063 | | | | | | |
| | 206,000 | | | | # | | | Duquesne Light
Holdings, Inc.,
6.400%,
due 09/15/20 | | | 204,832 | | | | 0.0 | | |
See Accompanying Notes to Financial Statements
53
SUMMARY PORTFOLIO OF INVESTMENTS
ING BALANCED PORTFOLIO AS OF DECEMBER 31, 2010 (CONTINUED)
Principal
Amount | |
| |
| | Value | | Percent of
Net Assets | |
| | | Utilities (continued) | | | | | |
| $ | 232,000 | | | | #, L | | | E.CL SA,
5.625%,
due 01/15/21 | | $ | 230,993 | | | | 0.0 | | |
| | 222,000 | | | | # | | | EDP Finance BV,
4.900%,
due 10/01/19 | | | 189,564 | | | | 0.1 | | |
| | 168,000 | | | | # | | | EDP Finance BV,
6.000%,
due 02/02/18 | | | 157,246 | | | | | | |
| | 333,000 | | | | # | | | Enel Finance
International S.A.,
6.000%,
due 10/07/39 | | | 299,663 | | | | 0.1 | | |
| | 169,000 | | | | # | | | Enel Finance
International S.A.,
6.250%,
due 09/15/17 | | | 184,836 | | | | | | |
| | 210,861 | | | | # | | | Juniper
Generation, LLC,
6.790%,
due 12/31/14 | | | 198,895 | | | | 0.0 | | |
| | | | | | | | | Other Securities | | | 4,760,315 | | | | 0.8 | | |
| | | | | | | | | | | | | | 6,961,443 | | | | 1.1 | | |
| | | | | | | | | Total Corporate
Bonds/Notes
( Cost $81,540,219 ) | | | 84,462,144 | | | | 13.6 | | |
| U.S. GOVERNMENT AGENCY OBLIGATIONS: 8.2% | | | | | |
| | | Federal Home Loan Mortgage
Corporation##: 4.5% | | | | | |
| | 3,957,000 | | | | W | | | 4.000%,
due 08/15/40 | | | 3,929,178 | | | | | | |
| | 4,709,000 | | | | W | | | 4.500%,
due 02/15/40 | | | 4,826,725 | | | | | | |
| | 3,938,603 | | | | S | | | 5.000%,
due 08/15/16-
02/15/35 | | | 4,181,038 | | | | 4.5 | | |
| | 6,191,712 | | | | S | | | 5.500%,
due 09/15/32-
07/15/37 | | | 6,627,314 | | | | | | |
| | 3,118,000 | | | | W | | | 6.000%,
due 01/15/39 | | | 3,377,673 | | | | | | |
| | 4,453,859 | | | | W,S, ^ | | | 4.866%-6.500%,
due 11/01/28-
01/15/39 | | | 4,859,253 | | | | | | |
| | | | | | | | | | | | | | 27,801,181 | | | | 4.5 | | |
| | | Federal National Mortgage Association##: 2.9% | | | | | |
| | 3,868,000 | | | | W | | | 5.000%,
due 01/13/40 | | | 4,066,838 | | | | | | |
| | 3,794,212 | | | | S | | | 6.000%,
due 06/01/16-
12/25/49 | | | 4,181,660 | | | | 2.9 | | |
| | 9,593,622 | | | | W,S | | | 4.000%-7.500%,
due 02/25/29-
09/01/40 | | | 10,129,261 | | | | | | |
| | | | | | | | | | | | | | 18,377,759 | | | | 2.9 | | |
Principal
Amount | |
| |
| | Value | | Percent of
Net Assets | |
| | | Government National Mortgage
Association: 0.8% | | | |
| $ | 4,792,833 | | | | W,S | | | 3.125%-7.500%,
due 12/15/23-
10/20/60 | | $ | 5,132,794 | | | | 0.8 | | |
| | | | | | | | | Total U.S. Government
Agency Obligations
( Cost $49,982,325 ) | | | 51,311,734 | | | | 8.2 | | |
| U.S. TREASURY OBLIGATIONS: 6.7% | | | | | |
| | | U.S. Treasury Notes: 6.7% | | | |
| | 7,411,000 | | | | | | | 0.625%,
due 12/31/12 | | | 7,416,210 | | | | | | |
| | 4,667,000 | | | | L | | | 0.750%,
due 12/15/13 | | | 4,634,550 | | | | | | |
| | 4,047,000 | | | | L,S | | | 2.250%,
due 11/30/17 | | | 3,936,023 | | | | | | |
| | 4,459,000 | | | | L,S | | | 2.500%,
due 04/30/15 | | | 4,610,539 | | | | 6.7 | | |
| | 4,549,000 | | | | L | | | 2.625%,
due 11/15/20 | | | 4,291,699 | | | | | | |
| | 3,928,000 | | | | | | | 3.375%,
due 11/15/19 | | | 4,010,551 | | | | | | |
| | 7,823,000 | | | | S | | | 3.875%,
due 08/15/40 | | | 7,206,939 | | | | | | |
| | 5,451,000 | | | | L | | | 1.250%-2.750%,
due 08/31/15-
12/31/17 | | | 5,402,587 | | | | | | |
| | | | | | | | | Total U.S. Treasury
Obligations
( Cost $41,719,998 ) | | | 41,509,098 | | | | 6.7 | | |
| ASSET-BACKED SECURITIES: 3.5% | | | | | |
| | | Credit Card Asset-Backed Securities: 2.9% | | | |
| | 6,673,000 | | | | S | | | Capital One
Multi-Asset
Execution Trust,
0.320%-5.750%,
due 03/17/14-
07/15/20 | | | 6,933,936 | | | | 1.1 | | |
| | 3,353,000 | | | | S | | | Citibank Credit Card
Issuance Trust,
0.670%-6.950%,
due 05/15/13-
04/22/15 | | | 3,522,386 | | | | 0.6 | | |
| EUR | 3,064,000 | | | | | | | MBNA Credit Card
Master Note Trust,
5.600%,
due 07/17/14 | | | 4,243,042 | | | | 1.0 | | |
| $ | 1,913,000 | | | | S | | | MBNA Credit Card
Master Note Trust,
0.680%-6.800%,
due 07/15/14-
07/15/15 | | | 1,954,879 | | | | | | |
| | 416,000 | | | | # | | | MBNA Master
Credit Card Trust,
7.100%,
due 09/15/13 | | | 422,651 | | | | 0.1 | | |
| | | | | | | | | Other Securities | | | 928,559 | | | | 0.1 | | |
| | | | | | | | | | | | | | 18,005,453 | | | | 2.9 | | |
See Accompanying Notes to Financial Statements
54
SUMMARY PORTFOLIO OF INVESTMENTS
ING BALANCED PORTFOLIO AS OF DECEMBER 31, 2010 (CONTINUED)
Principal
Amount | |
| |
| | Value | | Percent of
Net Assets | |
| | | Home Equity Asset-Backed Securities: 0.0% | | | |
| $ | | | | | | | | Other Securities | | $ | 123,288 | | | | 0.0 | | |
| | | Other Asset-Backed Securities: 0.6% | | | |
| | 496,347 | | | | # | | | Atrium CDO Corp.,
0.622%,
due 10/27/16 | | | 469,048 | | | | 0.1 | | |
| | 213,777 | | | | # | | | Callidus Debt
Partners Fund Ltd.,
0.786%,
due 05/15/15 | | | 206,295 | | | | 0.0 | | |
| | 479,126 | | | | #,S | | | Carlyle High Yield
Partners,
0.656%,
due 08/11/16 | | | 448,784 | | | | 0.1 | | |
| | 459,000 | | | | # | | | Credit-Based Asset
Servicing and
Securitization, LLC,
5.746%,
due 12/25/37 | | | 455,306 | | | | 0.1 | | |
| | 241,000 | | | | # | | | Credit-Based Asset
Servicing and
Securitization, LLC,
6.020%,
due 12/25/37 | | | 207,552 | | | | | | |
| | 230,981 | | | | # | | | First CLO Ltd.,
0.638%,
due 07/27/16 | | | 225,553 | | | | 0.0 | | |
| | 335,168 | | | | # | | | GSC Partners CDO
Fund Ltd.,
0.664%,
due 11/20/16 | | | 320,923 | | | | 0.1 | | |
| | | | | | | | | Other Securities | | | 1,390,832 | | | | 0.2 | | |
| | | | | | | | | | | | | | 3,724,293 | | | | 0.6 | | |
| | | | | | | | | Total Asset-Backed
Securities
( Cost $22,237,171 ) | | | 21,853,034 | | | | 3.5 | | |
| COLLATERALIZED MORTGAGE OBLIGATIONS: 4.9% | | | |
| | 766,000 | | | | # | | | American General
Mortgage Loan Trust,
5.750%,
due 09/25/48 | | | 777,577 | | | | 0.1 | | |
| | 170,000 | | | | # | | | Banc of America
Large Loan, Inc.,
5.334%,
due 12/16/43 | | | 175,920 | | | | | | |
| | 240,000 | | | | # | | | Banc of America
Large Loan, Inc.,
5.721%,
due 10/10/45 | | | 235,005 | | | | 0.1 | | |
| | 280,000 | | | | # | | | Banc of America
Large Loan, Inc.,
5.816%,
due 10/10/45 | | | 272,861 | | | | | | |
Principal
Amount | |
| |
| | Value | | Percent of
Net Assets | |
| $ | 120,000 | | | | # | | | Bear Stearns
Commercial
Mortgage
Securities,
6.500%,
due 02/15/32 | | $ | 118,466 | | | | 0.0 | | |
| | 160,000 | | | S | | Bear Stearns
Commercial
Mortgage
Securities,
8.050%,
due 10/15/32 | | | 163,629 | | | | | | |
| | 28,825,535 | | | | #,S, ^ | | | Citigroup/Deutsche
Bank Commercial
Mortgage Trust,
0.124%,
due 12/11/49 | | | 260,831 | | | | 0.1 | | |
| | 110,000 | | | | | | | Citigroup/Deutsche
Bank Commercial
Mortgage Trust,
5.222%,
due 07/15/44 | | | 107,271 | | | | | | |
| | 540,000 | | | | # | | | Commercial Mortgage
Pass-Through
Certificates, 5.449%,
due 02/05/19 | | | 542,332 | | | | | | |
| | 1,090,000 | | | | # | | | Commercial Mortgage
Pass-through
Certificates, 0.761%,
due 07/16/34 | | | 1,087,892 | | | | 0.3 | | |
| | 180,000 | | | | S | | | Commercial Mortgage
Pass-through
Certificates, 5.815%,
due 12/10/49 | | | 193,950 | | | | | | |
| | 11,841,797 | | | | #, ^ | | | Credit Suisse First
Boston Mortgage
Securities Corp.,
0.143%,
due 02/15/38 | | | 110,966 | | | | 0.0 | | |
| | 41,155,359 | | | | #, ^ | | | Credit Suisse
Mortgage Capital
Certificates,
0.126%,
due 09/15/40 | | | 268,374 | | | | | | |
| | 380,000 | | | | # | | | Credit Suisse
Mortgage Capital
Certificates,
5.342%,
due 12/15/43 | | | 396,433 | | | | 0.2 | | |
| | 360,000 | | | | | | | Credit Suisse
Mortgage Capital
Certificates,
5.378%,
due 08/12/48 | | | 374,506 | | | | | | |
| | 170,000 | | | | # | | | DLJ Commercial
Mortgage Corp.,
7.225%,
due 06/10/31 | | | 185,511 | | | | 0.1 | | |
| | 134,107 | | | | | | | DLJ Commercial
Mortgage Corp.,
8.490%,
due 06/10/33 | | | 134,024 | | | | | | |
See Accompanying Notes to Financial Statements
55
SUMMARY PORTFOLIO OF INVESTMENTS
ING BALANCED PORTFOLIO AS OF DECEMBER 31, 2010 (CONTINUED)
Principal
Amount | |
| |
| | Value | | Percent of
Net Assets | |
| COLLATERALIZED MORTGAGE OBLIGATIONS (continued) | | | |
| $ | 100,000 | | | | # | | | GE Capital
Commercial
Mortgage Corp.,
6.024%,
due 12/10/37 | | $ | 102,858 | | | | 0.0 | | |
| | 17,454,460 | | | | #, ^ | | | Greenwich Capital
Commercial
Funding Corp.,
0.310%,
due 03/10/39 | | | 236,831 | | | | 0.6 | | |
| | 3,255,000 | | | | S | | | Greenwich Capital
Commercial
Funding Corp.,
5.190%-5.883%,
due 04/10/37-
12/10/49 | | | 3,459,205 | | | | | | |
| | 350,000 | | | | # | | | GS Mortgage
Securities Corp. II,
6.055%,
due 07/12/38 | | | 353,152 | | | | 0.1 | | |
| | 270,000 | | | | # | | | JPMorgan Chase
Commercial
Mortgage Securities
Corp., 4.070%,
due 11/15/43 | | | 257,295 | | | | | | |
| | 300,000 | | | | # | | | JPMorgan Chase
Commercial
Mortgage Securities
Corp., 5.716%,
due 03/12/39 | | | 307,267 | | | | 0.8 | | |
| | 100,000 | | | | # | | | JPMorgan Chase
Commercial
Mortgage Securities
Corp., 6.335%,
due 07/12/37 | | | 96,840 | | | | | | |
| | 72,704,249 | | | | S, ^ | | | JPMorgan
Mortgage Trust,
0.153%-5.989%,
due 07/25/35-
02/15/51 | | | 4,296,574 | | | | | | |
| | 11,019,381 | | | | #, ^ | | | LB-UBS Commercial
Mortgage Trust,
0.715%,
due 11/15/38 | | | 295,152 | | | | | | |
| | 240,000 | | | | # | | | LB-UBS Commercial
Mortgage Trust,
5.350%,
due 09/15/37 | | | 237,938 | | | | 0.6 | | |
| | 8,466,364 | | | | S, ^ | | | LB-UBS Commercial
Mortgage Trust,
0.175%-5.901%,
due 12/15/29-
11/15/40 | | | 3,142,669 | | | | | | |
| | 8,610,326 | | | | #, ^ | | | Merrill Lynch
Mortgage Trust,
0.554%,
due 02/12/51 | | | 185,670 | | | | 0.0 | | |
Principal
Amount | |
| |
| | Value | | Percent of
Net Assets | |
| $ | 90,000 | | | | # | | | Morgan Stanley
Dean Witter
Capital I, 6.979%,
due 10/15/35 | | $ | 90,644 | | | | 0.0 | | |
| | 200,000 | | | | # | | | Morgan Stanley
Dean Witter
Capital I, 7.280%,
due 12/15/35 | | | 212,100 | | | | | | |
| | 4,416,374 | | | | #, ^ | | | RBSCF Trust,
1.004%,
due 04/15/24 | | | 129,848 | | | | | | |
| | 600,000 | | | | # | | | RBSCF Trust,
5.336%,
due 05/16/47 | | | 585,590 | | | | 0.2 | | |
| | 320,000 | | | | # | | | RBSCF Trust,
5.420%,
due 01/19/49 | | | 311,839 | | | | | | |
| | 350,000 | | | | # | | | Vornado DP LLC,
5.280%,
due 09/13/28 | | | 344,004 | | | | 0.1 | | |
| | 260,000 | | | | # | | | Vornado DP LLC,
6.356%,
due 09/13/28 | | | 259,491 | | | | | | |
| | 250,000 | | | | # | | | Wachovia Bank
Commercial
Mortgage Trust,
5.125%,
due 08/15/35 | | | 252,967 | | | | 0.2 | | |
| | 1,190,000 | | | | S | | | Wachovia Bank
Commercial
Mortgage Trust,
5.308%-5.500%,
due 12/15/43-
11/15/48 | | | 1,206,973 | | | | | | |
| | 540,000 | | | | # | | | Wells Fargo
Commercial
Mortgage Trust,
4.393%,
due 11/15/43 | | | 535,051 | | | | 0.1 | | |
| | | | | | | | | Other Securities (d) | | | 8,002,941 | | | | 1.3 | | |
| | | | | | | | | Total Collateralized
Mortgage
Obligations
( Cost $29,893,755 ) | | | 30,308,447 | | | | 4.9 | | |
| MUNICIPAL BONDS: 0.1% | |
| | | Louisiana: 0.1% | | | |
| | | | | | | | | Other Securities | | | 574,212 | | | | 0.1 | | |
| | | | | | | Total Municipal Bonds
( Cost $574,835 ) | | | 574,212 | | | | 0.1 | | |
See Accompanying Notes to Financial Statements
56
SUMMARY PORTFOLIO OF INVESTMENTS
ING BALANCED PORTFOLIO AS OF DECEMBER 31, 2010 (CONTINUED)
Principal
Amount | |
| |
| | Value | | Percent of
Net Assets | |
| OTHER BONDS: 3.2% | | | |
| | | Foreign Government Bonds: 3.2% | | | |
| BRL | 8,552,000 | | | | | | | Brazil Notas do
Tesouro Nacional
Series F,
10.000%,
due 01/01/14 | | $ | 4,876,984 | | | | 0.8 | | |
| KRW | 4,569,000,000 | | | | | | | Korea Treasury
Bond, 4.750%,
due 12/10/11 | | | 4,094,853 | | | | 0.6 | | |
| ZAR | 27,546,994 | | | | | | | South Africa
Government
International Bond,
7.250%,
due 01/15/20 | | | 3,956,217 | | | | 0.6 | | |
| $ | | | | | | | | Other Securities | | | 7,311,093 | | | | 1.2 | | |
| | | | | | | | | Total Other Bonds
( Cost $19,653,588 ) | | | 20,239,147 | | | | 3.2 | | |
| | | | | | | | | Total Long-Term
Investments
( Cost $591,720,548 ) | | | 632,026,619 | | | | 101.6 | | |
| Shares | |
| |
| | Value | | Percent of
Net Assets | |
| SHORT-TERM INVESTMENTS: 4.2% | | | |
| | | Mutual Funds: 1.3% | | | |
| | 8,327,000 | | | | | | | Blackrock Liquidity
Funds TempFund
Portfolio - Class I | | $ | 8,327,000 | | | | 1.3 | | |
| | | | | | | | | Total Mutual Funds
( Cost $8,327,000 ) | | | 8,327,000 | | | | 1.3 | | |
| | | Securities Lending Collateralcc: 2.9% | | | |
| | 16,920,534 | | | | | | | BNY Mellon
Overnight
Government Fund (1) | | | 16,920,534 | | | | 2.7 | | |
| | 1,627,156 | | | | R | | | BNY Institutional
Cash Reserves Fund,
Series B (1)(2) | | | 1,301,725 | | | | 0.2 | | |
| | | | | | | | | Total Securities
Lending Collateral
( Cost $18,547,690 ) | | | 18,222,259 | | | | 2.9 | | |
| | | | | | | | | Total Short-Term
Investments
( Cost $26,874,690 ) | | | 26,549,259 | | | | 4.2 | | |
| | | | | | | | | Total Investments in
Securities
( Cost $618,595,238 ) * | | $ | 658,575,878 | | | | 105.8 | | |
| | | | | | | | | Other Assets and
Liabilities - Net | | | (36,381,855 | ) | | | (5.8 | ) | |
| | | | | | | | | Net Assets | | $ | 622,194,023 | | | | 100.0 | | |
"Other Securities" represents issues not identified as the top 50 holdings in terms of market value and issues or issuers not exceeding 1% of net assets individually or in aggregate respectively as of December 31, 2010.
The following footnotes apply to either the individual securities noted or one or more of the securities aggregated and listed as a single line item.
@ Non-income producing security
& Payment-in-kind
# Securities with purchases pursuant to Rule 144A or section 4(2), under the Securities Act of 1933 and may not be resold subject to that rule except to qualified institutional buyers. Unless otherwise noted, these securities have been determined to be liquid under the guidelines established by the Funds' Board of Directors/Trustees.
cc Securities purchased with cash collateral for securities loaned.
(1) Collateral received from brokers for securities lending was invested in these short-term investments.
(2) On September 12, 2008, BNY established a separate sleeve of the Institutional Cash Reserves Fund (Series B) to hold certain Lehman Brothers defaulted debt obligations. The Portfolio's position in Series B is being fair valued daily. Please see the accompanying Notes to Financial Statements for additional details on securities lending.
## On September 7, 2008, the Federal Housing Finance Agency placed the Federal National Mortgage Association and the Federal Home Loan Mortgage Corporation into conservatorship and the U.S. Treasury guaranteed the debt issued by those organizations.
W Settlement is on a when-issued or delayed-delivery basis.
R Restricted security
L Loaned security, a portion or all of the security is on loan at December 31, 2010.
S All or a portion of this security has been identified by the Fund to cover future collateral requirements for applicable futures, options, swaps, foreign currency contracts and/or when-issued or delayed-delivery securities.
^ Interest only securities represent the right to receive the monthly interest payments on an underlying pool of mortgage loans. Principal amount shown represents the notional amount on which current interest is calculated. Payments of principal on the pool reduce the value of the interest only security.
BRL Brazilian Real
EUR EU Euro
KRW South Korean Won
ZAR South African Rand
(a) The grouping contains securities in default.
(d) The grouping contains Interest only securities.
* Cost for federal income tax purposes is $623,622,651.
| Net unrealized appreciation consists of: | |
| Gross Unrealized Appreciation | | $ | 47,472,635 | | |
| Gross Unrealized Depreciation | | | (12,519,408 | ) | |
| Net Unrealized Appreciation | | $ | 34,953,227 | | |
See Accompanying Notes to Financial Statements
57
SUMMARY PORTFOLIO OF INVESTMENTS
ING BALANCED PORTFOLIO AS OF DECEMBER 31, 2010 (CONTINUED)
Fair Value Measurements^
The following is a summary of the fair valuations according to the inputs used as of December 31, 2010 in valuing the Portfolio's assets and liabilities:
| | | Quoted Prices
in Active Markets
for Identical Investments
(Level 1) | | Other
Observable
Inputs#
(Level 2) | | Significant
Unobservable
Inputs
(Level 3) | | Fair Value
at
12/31/10 | |
| Asset Table | |
| Investments, at value | |
| Common Stock | |
| Consumer Discretionary | | $ | 30,252,336 | | | $ | 8,456,569 | | | $ | — | | | $ | 38,708,905 | | |
| Consumer Staples | | | 21,704,034 | | | | 5,767,849 | | | | — | | | | 27,471,883 | | |
| Energy | | | 32,743,414 | | | | 9,863,217 | | | | — | | | | 42,606,631 | | |
| Financials | | | 36,607,359 | | | | 22,957,245 | | | | — | | | | 59,564,604 | | |
| Health Care | | | 27,739,222 | | | | 6,702,334 | | | | — | | | | 34,441,556 | | |
| Industrials | | | 29,289,884 | | | | 11,398,053 | | | | — | | | | 40,687,937 | | |
| Information Technology | | | 52,273,838 | | | | 8,378,181 | | | | — | | | | 60,652,019 | | |
| Materials | | | 14,764,066 | | | | 9,307,538 | | | | — | | | | 24,071,604 | | |
| Telecommunication Services | | | 5,652,698 | | | | 4,252,670 | | | | — | | | | 9,905,368 | | |
| Utilities | | | 5,766,876 | | | | 5,223,102 | | | | — | | | | 10,989,978 | | |
| Total Common Stock | | | 256,793,727 | | | | 92,306,758 | | | | — | | | | 349,100,485 | | |
| Real Estate Investment Trusts | | | 593,741 | | | | — | | | | — | | | | 593,741 | | |
| Exchange-Traded Funds | | | 31,497,440 | | | | — | | | | — | | | | 31,497,440 | | |
| Preferred Stock | | | — | | | | 529,862 | | | | — | | | | 529,862 | | |
| Positions In Purchased Options | | | — | | | | 47,275 | | | | — | | | | 47,275 | | |
| Corporate Bonds/Notes | | | — | | | | 84,462,144 | | | | — | | | | 84,462,144 | | |
| U.S. Government Agency Obligations | | | — | | | | 50,710,729 | | | | 601,005 | | | | 51,311,734 | | |
| U.S. Treasury Obligations | | | — | | | | 41,509,098 | | | | — | | | | 41,509,098 | | |
| Asset-Backed Securities | | | — | | | | 20,631,215 | | | | 1,221,819 | | | | 21,853,034 | | |
| Collateralized Mortgage Obligations | | | — | | | | 30,308,447 | | | | — | | | | 30,308,447 | | |
| Municipal Bonds | | | — | | | | 574,212 | | | | — | | | | 574,212 | | |
| Foreign Government Bonds | | | — | | | | 20,239,147 | | | | — | | | | 20,239,147 | | |
| Short-Term Investments | | | 25,247,534 | | | | — | | | | 1,301,725 | | | | 26,549,259 | | |
| Total Investments, at value | | $ | 314,132,442 | | | $ | 341,318,887 | | | $ | 3,124,549 | | | $ | 658,575,878 | | |
| Other Financial Instruments+: | |
| Forward foreign currency contracts, at fair value | | | | | 2,560,193 | | | | — | | | | 2,560,193 | | |
| Futures | | | 362,473 | | | | — | | | | — | | | | 362,473 | | |
| Swaps, at fair value | | | — | | | | 150,712 | | | | 15,041 | | | | 165,753 | | |
| Total Assets | | $ | 314,494,915 | | | $ | 344,029,792 | | | $ | 3,139,590 | | | $ | 661,664,297 | | |
| Liabilities Table | |
| Other Financial Instruments+: | |
| Forward foreign currency contracts, at fair value | | | | $ | (2,568,076 | ) | | $ | — | | | $ | (2,568,076 | ) | |
| Futures | | | (175,742 | ) | | | — | | | | — | | | | (175,742 | ) | |
| Swaps, at fair value | | | — | | | | (770,321 | ) | | | (7,381 | ) | | | (777,702 | ) | |
| Written options, at fair value | | | — | | | | (94,388 | ) | | | — | | | | (94,388 | ) | |
| Total Liabilities | | $ | (175,742 | ) | | $ | (3,432,785 | ) | | $ | (7,381 | ) | | $ | (3,615,908 | ) | |
See Accompanying Notes to Financial Statements
58
SUMMARY PORTFOLIO OF INVESTMENTS
ING BALANCED PORTFOLIO AS OF DECEMBER 31, 2010 (CONTINUED)
The following is a reconciliation of the fair valuations using significant unobservable inputs (Level 3) for the Portfolio's assets and liabilities during the period ended December 31, 2010:
| | | Beginning
Balance
12/31/2009 | | Purchases | | Sales | | Accrued
Discounts/
(Premiums) | | Total
Realized
Gain/(Loss) | | Total
Unrealized
Appreciation/
(Depreciation) | | Transfers
Into
Level 3 | | Transfers
Out of
Level 3 | | Ending
Balance
12/31/10 | |
| Asset Table | |
| Investments, at value | |
| Corporate Bonds/Notes | | $ | 192 | | | $ | — | | | $ | — | | | $ | — | | | $ | — | | | $ | (192 | ) | | $ | — | | | $ | — | | | $ | — | | |
U.S. Government
Agency Obligations | | | — | | | | 623,391 | | | | — | | | | 209 | | | | — | | | | (22,595 | ) | | | — | | | | — | | | | 601,005 | | |
| Asset-Backed Securities | | | — | | | | 1,323,369 | | | | (123,553 | ) | | | 3,523 | | | | 7,697 | | | | 10,783 | | | | — | | | | — | | | | 1,221,819 | | |
| Short-Term Investments | | | 1,301,725 | | | | — | | | | — | | | | — | | | | — | | | | — | | | | — | | | | — | | | | 1,301,725 | | |
Total Investments,
at value | | $ | 1,301,917 | | | $ | 1,946,760 | | | $ | (123,553 | ) | | $ | 3,732 | | | $ | 7,697 | | | $ | (12,004 | ) | | $ | — | | | $ | — | | | $ | 3,124,549 | | |
| Other Financial Instruments+: | |
| Swaps, at fair value | | | | | | | | | | | | | | | | | | | | | | | 15,041 | | | | | | | | | | | | 15,041 | | |
| Total Assets | | $ | 1,301,917 | | | $ | 1,946,760 | | | $ | (123,553 | ) | | $ | 3,732 | | | $ | 7,697 | | | $ | 3,037 | | | $ | — | | | $ | — | | | $ | 3,139,590 | | |
| Liabilities Table | |
| Other Financial Instruments+: | |
| Swaps, at fair value | | | | | | | | | | | | | | | | | | | | | | | (7,381 | ) | | | | | | | | | | | (7,381 | ) | |
| Total Liabilities | | $ | — | | | $ | — | | | $ | — | | | $ | — | | | $ | — | | | $ | (7,381 | ) | | $ | — | | | $ | — | | | $ | (7,381 | ) | |
As of December 31, 2010, total change in unrealized gain (loss) on Level 3 securities still held at year end and included in the change in net assets was $(4,292).
^ See Note 2, "Significant Accounting Policies" in the Notes to Financial Statements for additional information.
'+ Other Financial Instruments are derivatives not reflected in the Summary Portfolio of Investments and may include open forward foreign currency contracts, futures, swaps, and written options. Forward foreign currency contracts and futures are reported at their unrealized gain/loss at measurement date which represents the amount due to/from the Portfolio. Swaps and written options are reported at their market value at measurement date.
Transfers in or out of Level 3 represents either the beginning value (for transfers in), or the ending value (for transfers out) of any security or derivative instrument where a change in the pricing level occurred from the beginning to the end of the period. It is the policy of the Portfolio to recognize transfers at the end of the reporting period.
# The earlier close of the foreign markets gives rise to the possibility that significant events, including broad market moves, may have occurred in the interim and may materially affect the value of those securities. To account for this, the Portfolio may frequently value many of its foreign equity securities using fair value prices based on third party vendor modeling tools to the extent available. Accordingly, a significant portion of the Portfolio's investments are categorized as Level 2 investments.
At December 31, 2010 the following forward foreign currency contracts were outstanding for the ING Balanced Portfolio:
| Counterparty | | Currency | | Buy/Sell | | Settlement
Date | | In Exchange
For | | Fair Value | | Unrealized
Appreciation
(Depreciation) | |
BEST Direct Securities, LLC
| | Japanese Yen
JPY 197,640,742 | | |
BUY | | | |
1/14/11 | | | $ | 2,393,000 | | | $ | 2,434,702 | | | $ | 41,702 | | |
BEST Direct Securities, LLC
| | Canadian Dollar
CAD 349,474 | | |
BUY | | | |
1/14/11 | | | | 348,000 | | | | 351,382 | | | | 3,382 | | |
BEST Direct Securities, LLC
| | EU Euro
EUR 5,271,055 | | |
BUY | | | |
1/14/11 | | | | 6,911,107 | | | | 7,043,582 | | | | 132,475 | | |
Charles Schwab
| | Japanese Yen
JPY 126,248,049 | | |
BUY | | | |
1/14/11 | | | | 1,513,000 | | | | 1,555,228 | | | | 42,228 | | |
Charles Schwab
| | Swiss Franc
CHF 698,207 | | |
BUY | | | |
1/28/11 | | | | 714,837 | | | | 747,036 | | | | 32,199 | | |
Citigroup, Inc.
| | Australian Dollar
AUD 1,538,059 | | |
BUY | | | |
1/14/11 | | | | 1,470,068 | | | | 1,570,133 | | | | 100,065 | | |
Citigroup, Inc.
| | Canadian Dollar
CAD 9,866,440 | | |
BUY | | | |
1/14/11 | | | | 9,652,190 | | | | 9,920,301 | | | | 268,111 | | |
Citigroup, Inc.
| | Canadian Dollar
CAD 158,709 | | |
BUY | | | |
1/14/11 | | | | 156,000 | | | | 159,576 | | | | 3,576 | | |
Citigroup, Inc.
| | EU Euro
EUR 1,834,486 | | |
BUY | | | |
1/14/11 | | | | 2,405,000 | | | | 2,451,379 | | | | 46,379 | | |
Citigroup, Inc.
| | EU Euro
EUR 1,832,312 | | |
BUY | | | |
1/14/11 | | | | 2,407,000 | | | | 2,448,473 | | | | 41,473 | | |
Citigroup, Inc.
| | EU Euro
EUR 1,811,823 | | |
BUY | | | |
1/14/11 | | | | 2,406,000 | | | | 2,421,095 | | | | 15,095 | | |
See Accompanying Notes to Financial Statements
59
SUMMARY PORTFOLIO OF INVESTMENTS
ING BALANCED PORTFOLIO AS OF DECEMBER 31, 2010 (CONTINUED)
| Counterparty | | Currency | | Buy/Sell | | Settlement
Date | | In Exchange
For | | Fair Value | | Unrealized
Appreciation
(Depreciation) | |
Citigroup, Inc.
| | Japanese Yen
JPY 122,155,721 | | | BUY | | | |
1/14/11 | | | $ | 1,464,000 | | | $ | 1,504,815 | | | $ | 40,815 | | |
Citigroup, Inc.
| | Japanese Yen
JPY 55,962,866 | | |
BUY | | | |
1/14/11 | | | | 678,000 | | | | 689,397 | | | | 11,397 | | |
Citigroup, Inc.
| | Japanese Yen
JPY 239,944,262 | | |
BUY | | | |
1/14/11 | | | | 2,943,000 | | | | 2,955,831 | | | | 12,831 | | |
Citigroup, Inc.
| | South Korean Won
KRW 459,093,000 | | |
BUY | | | |
1/28/11 | | | | 398,000 | | | | 403,842 | | | | 5,842 | | |
Citigroup, Inc.
| | Mexican Peso
MXN 17,002,598 | | |
BUY | | | |
1/14/11 | | | | 1,368,000 | | | | 1,375,418 | | | | 7,418 | | |
Citigroup, Inc.
| | Mexican Peso
MXN 8,183,190 | | |
BUY | | | |
1/14/11 | | | | 662,000 | | | | 661,976 | | | | (24 | ) | |
Citigroup, Inc.
| | Swedish Krona
SEK 15,941,456 | | |
BUY | | | |
1/28/11 | | | | 2,309,975 | | | | 2,367,990 | | | | 58,015 | | |
Credit Suisse First Boston
| | Canadian Dollar
CAD 496,977 | | |
BUY | | | |
1/14/11 | | | | 497,000 | | | | 499,690 | | | | 2,690 | | |
Credit Suisse First Boston
| | EU Euro
EUR 1,318,883 | | |
BUY | | | |
1/14/11 | | | | 1,764,000 | | | | 1,762,392 | | | | (1,608 | ) | |
Credit Suisse First Boston
| | EU Euro
EUR 114,248 | | |
BUY | | | |
1/14/11 | | | | 151,000 | | | | 152,666 | | | | 1,666 | | |
Credit Suisse First Boston
| | British Pound
GBP 724,788 | | |
BUY | | | |
1/28/11 | | | | 1,143,000 | | | | 1,129,763 | | | | (13,237 | ) | |
Credit Suisse First Boston
| | British Pound
GBP 627,301 | | |
BUY | | | |
1/28/11 | | | | 968,000 | | | | 977,806 | | | | 9,806 | | |
Credit Suisse First Boston
| | New Zealand Dollar
NZD 1,057,892 | | |
BUY | | | |
1/14/11 | | | | 798,000 | | | | 823,328 | | | | 25,328 | | |
Credit Suisse First Boston
| | Swedish Krona
SEK 1,171,643 | | |
BUY | | | |
1/28/11 | | | | 172,000 | | | | 174,039 | | | | 2,039 | | |
Deutsche Bank AG
| | Australian Dollar
AUD 1,623,768 | | |
BUY | | | |
1/14/11 | | | | 1,644,000 | | | | 1,657,629 | | | | 13,629 | | |
Deutsche Bank AG
| | Canadian Dollar
CAD 1,237,794 | | |
BUY | | | |
1/14/11 | | | | 1,233,000 | | | | 1,244,551 | | | | 11,551 | | |
Deutsche Bank AG
| | Canadian Dollar
CAD 428,910 | | |
BUY | | | |
1/14/11 | | | | 425,000 | | | | 431,251 | | | | 6,251 | | |
Deutsche Bank AG
| | EU Euro
EUR 462,446 | | |
BUY | | | |
1/14/11 | | | | 612,000 | | | | 617,955 | | | | 5,955 | | |
Deutsche Bank AG
| | EU Euro
EUR 1,103,026 | | |
BUY | | | |
1/14/11 | | | | 1,480,000 | | | | 1,473,947 | | | | (6,053 | ) | |
Deutsche Bank AG
| | British Pound
GBP 5,011,120 | | |
BUY | | | |
1/28/11 | | | | 7,884,386 | | | | 7,811,080 | | | | (73,306 | ) | |
Deutsche Bank AG
| | Mexican Peso
MXN 8,242,442 | | |
BUY | | | |
1/14/11 | | | | 665,000 | | | | 666,769 | | | | 1,769 | | |
Deutsche Bank AG
| | Norwegian Krone
NOK 8,926,280 | | |
BUY | | | |
1/28/11 | | | | 1,492,476 | | | | 1,527,614 | | | | 35,138 | | |
Deutsche Bank AG
| | New Zealand Dollar
NZD 1,556,526 | | |
BUY | | | |
1/14/11 | | | | 1,188,000 | | | | 1,211,400 | | | | 23,400 | | |
HSBC
| | Australian Dollar
AUD 2,010,520 | | |
BUY | | | |
1/14/11 | | | | 1,960,000 | | | | 2,052,446 | | | | 92,446 | | |
HSBC
| | EU Euro
EUR 1,836,722 | | |
BUY | | | |
1/14/11 | | | | 2,407,000 | | | | 2,454,366 | | | | 47,366 | | |
HSBC
| | Mexican Peso
MXN 15,117,385 | | |
BUY | | | |
1/14/11 | | | | 1,219,000 | | | | 1,222,914 | | | | 3,914 | | |
HSBC
| | Singapore Dollar
SGD 2,746,292 | | |
BUY | | | |
1/28/11 | | | | 2,102,827 | | | | 2,140,033 | | | | 37,206 | | |
Credit Suisse First Boston
| | Swiss Franc
CHF 821,078 | | |
BUY | | | |
1/28/11 | | | | 855,000 | | | | 878,500 | | | | 23,500 | | |
Credit Suisse First Boston
| | South Korean Won
KRW 532,450,000 | | |
BUY | | | |
1/28/11 | | | | 463,000 | | | | 468,371 | | | | 5,371 | | |
Credit Suisse First Boston
| | Swedish Krona
SEK 267,451 | | |
BUY | | | |
1/28/11 | | | | 39,000 | | | | 39,728 | | | | 728 | | |
Credit Suisse First Boston
| | EU Euro
EUR 3,681,008 | | |
BUY | | | |
1/14/11 | | | | 4,814,000 | | | | 4,918,841 | | | | 104,841 | | |
Credit Suisse First Boston
| | Japanese Yen
JPY 39,073,554 | | |
BUY | | | |
1/14/11 | | | | 468,000 | | | | 481,340 | | | | 13,340 | | |
Credit Suisse First Boston
| | Japanese Yen
JPY 518,434,872 | | |
BUY | | | |
1/14/11 | | | | 6,155,999 | | | | 6,386,508 | | | | 230,509 | | |
JPMorgan Chase & Co.
| | Australian Dollar
AUD 790,164 | | |
BUY | | | |
1/14/11 | | | | 776,000 | | | | 806,641 | | | | 30,641 | | |
JPMorgan Chase & Co.
| | Canadian Dollar
CAD 100,476 | | |
BUY | | | |
1/14/11 | | | | 100,000 | | | | 101,024 | | | | 1,024 | | |
See Accompanying Notes to Financial Statements
60
SUMMARY PORTFOLIO OF INVESTMENTS
ING BALANCED PORTFOLIO AS OF DECEMBER 31, 2010 (CONTINUED)
| Counterparty | | Currency | | Buy/Sell | | Settlement
Date | | In Exchange
For | | Fair Value | | Unrealized
Appreciation
(Depreciation) | |
JPMorgan Chase & Co.
| | Swiss Franc
CHF 298,800 | | | BUY | | | |
1/28/11 | | | $ | 309,000 | | | $ | 319,697 | | | $ | 10,697 | | |
JPMorgan Chase & Co.
| | Japanese Yen
JPY 23,563,540 | | |
BUY | | | |
1/14/11 | | | | 280,000 | | | | 290,275 | | | | 10,275 | | |
JPMorgan Chase & Co.
| | Japanese Yen
JPY 53,502,000 | | |
BUY | | | |
1/14/11 | | | | 639,000 | | | | 659,082 | | | | 20,082 | | |
JPMorgan Chase & Co.
| | South Korean Won
KRW 168,021,000 | | |
BUY | | | |
1/28/11 | | | | 147,000 | | | | 147,800 | | | | 800 | | |
JPMorgan Chase & Co.
| | Mexican Peso
MXN 12,402 | | |
BUY | | | |
1/14/11 | | | | 1,000 | | | | 1,003 | | | | 3 | | |
JPMorgan Chase & Co.
| | New Zealand Dollar
NZD 513,456 | | |
BUY | | | |
1/14/11 | | | | 391,000 | | | | 399,608 | | | | 8,608 | | |
JPMorgan Chase & Co.
| | Swedish Krona
SEK 3,515,181 | | |
BUY | | | |
1/28/11 | | | | 513,000 | | | | 522,155 | | | | 9,155 | | |
Morgan Stanley
| | Australian Dollar
AUD 1,610,439 | | |
BUY | | | |
1/14/11 | | | | 1,577,000 | | | | 1,644,022 | | | | 67,022 | | |
Morgan Stanley
| | Australian Dollar
AUD 1,037,954 | | |
BUY | | | |
1/14/11 | | | | 1,019,000 | | | | 1,059,599 | | | | 40,599 | | |
Morgan Stanley
| | Australian Dollar
AUD 1,836,016 | | |
BUY | | | |
1/14/11 | | | | 1,825,000 | | | | 1,874,303 | | | | 49,303 | | |
Morgan Stanley
| | Australian Dollar
AUD 245,269 | | |
BUY | | | |
1/14/11 | | | | 244,000 | | | | 250,384 | | | | 6,384 | | |
Credit Suisse First Boston
| | Australian Dollar
AUD 1,063,598 | | |
BUY | | | |
1/14/11 | | | | 1,066,333 | | | | 1,085,778 | | | | 19,445 | | |
Morgan Stanley
| | Australian Dollar
AUD 1,062,806 | | |
BUY | | | |
1/14/11 | | | | 1,066,333 | | | | 1,084,969 | | | | 18,636 | | |
Morgan Stanley
| | Canadian Dollar
CAD 807,219 | | |
BUY | | | |
1/14/11 | | | | 803,000 | | | | 811,626 | | | | 8,626 | | |
Morgan Stanley
| | Canadian Dollar
CAD 542,153 | | |
BUY | | | |
1/14/11 | | | | 537,000 | | | | 545,113 | | | | 8,113 | | |
Morgan Stanley
| | Swiss Franc
CHF 494,615 | | |
BUY | | | |
1/28/11 | | | | 529,000 | | | | 529,206 | | | | 206 | | |
Morgan Stanley
| | Danish Krone
DKK 2,787,869 | | |
BUY | | | |
1/28/11 | | | | 496,710 | | | | 499,756 | | | | 3,046 | | |
Morgan Stanley
| | EU Euro
EUR 1,873,863 | | |
BUY | | | |
1/14/11 | | | | 2,451,468 | | | | 2,503,997 | | | | 52,529 | | |
Morgan Stanley
| | EU Euro
EUR 1,859,478 | | |
BUY | | | |
1/14/11 | | | | 2,440,000 | | | | 2,484,775 | | | | 44,775 | | |
Morgan Stanley
| | EU Euro
EUR 1,835,523 | | |
BUY | | | |
1/14/11 | | | | 2,405,000 | | | | 2,452,765 | | | | 47,765 | | |
Morgan Stanley
| | EU Euro
EUR 1,082,149 | | |
BUY | | | |
1/14/11 | | | | 1,432,000 | | | | 1,446,049 | | | | 14,049 | | |
Morgan Stanley
| | EU Euro
EUR 1,345,993 | | |
BUY | | | |
1/14/11 | | | | 1,780,000 | | | | 1,798,617 | | | | 18,617 | | |
Morgan Stanley
| | British Pound
GBP 699,438 | | |
BUY | | | |
1/28/11 | | | | 1,075,000 | | | | 1,090,249 | | | | 15,249 | | |
Morgan Stanley
| | Indonesian Rupiah
IDR 8,951,290,000 | | |
BUY | | | |
1/14/11 | | | | 982,794 | | | | 991,284 | | | | 8,490 | | |
Morgan Stanley
| | Indian Rupee
INR 130,780,440 | | |
BUY | | | |
1/14/11 | | | | 2,817,937 | | | | 2,917,242 | | | | 99,305 | | |
Morgan Stanley
| | Japanese Yen
JPY 98,254,044 | | |
BUY | | | |
1/14/11 | | | | 1,187,000 | | | | 1,210,374 | | | | 23,374 | | |
Morgan Stanley
| | Japanese Yen
JPY 98,240,987 | | |
BUY | | | |
1/14/11 | | | | 1,187,000 | | | | 1,210,213 | | | | 23,213 | | |
Morgan Stanley
| | South Korean Won
KRW 279,600,000 | | |
BUY | | | |
1/28/11 | | | | 240,000 | | | | 245,951 | | | | 5,951 | | |
Morgan Stanley
| | South Korean Won
KRW 500,976,800 | | |
BUY | | | |
1/28/11 | | | | 437,000 | | | | 440,685 | | | | 3,685 | | |
Morgan Stanley
| | South Korean Won
KRW 328,626,300 | | |
BUY | | | |
1/28/11 | | | | 291,000 | | | | 289,077 | | | | (1,923 | ) | |
Morgan Stanley
| | Mexican Peso
MXN 11,736,256 | | |
BUY | | | |
1/14/11 | | | | 952,000 | | | | 949,399 | | | | (2,601 | ) | |
Morgan Stanley
| | Norwegian Krone
NOK 3,045,230 | | |
BUY | | | |
1/28/11 | | | | 509,000 | | | | 521,151 | | | | 12,151 | | |
Morgan Stanley
| | Norwegian Krone
NOK 5,693,257 | | |
BUY | | | |
1/28/11 | | | | 955,000 | | | | 974,325 | | | | 19,325 | | |
Morgan Stanley
| | New Zealand Dollar
NZD 4,261,911 | | |
BUY | | | |
1/14/11 | | | | 3,175,000 | | | | 3,316,924 | | | | 141,924 | | |
Morgan Stanley
| | New Zealand Dollar
NZD 1,347,602 | | |
BUY | | | |
1/14/11 | | | | 1,007,000 | | | | 1,048,801 | | | | 41,801 | | |
See Accompanying Notes to Financial Statements
61
SUMMARY PORTFOLIO OF INVESTMENTS
ING BALANCED PORTFOLIO AS OF DECEMBER 31, 2010 (CONTINUED)
| Counterparty | | Currency | | Buy/Sell | | Settlement
Date | | In Exchange
For | | Fair Value | | Unrealized
Appreciation
(Depreciation) | |
Morgan Stanley
| | Philippine Peso
PHP 85,606,910 | | | BUY | | | |
1/28/11 | | | $ | 1,954,139 | | | $ | 1,954,674 | | | $ | 535 | | |
Morgan Stanley
| | Swedish Krona
SEK 453,201 | | |
BUY | | | |
1/28/11 | | | | 66,000 | | | | 67,320 | | | | 1,320 | | |
Morgan Stanley
| | Australian Dollar
AUD 1,063,014 | | |
BUY | | | |
1/14/11 | | | | 1,066,333 | | | | 1,085,182 | | | | 18,849 | | |
UBS Warburg LLC
| | Japanese Yen
JPY 117,123,119 | | |
BUY | | | |
1/14/11 | | | | 1,389,000 | | | | 1,442,819 | | | | 53,819 | | |
UBS Warburg LLC
| | Japanese Yen
JPY 75,889,914 | | |
BUY | | | |
1/14/11 | | | | 908,000 | | | | 934,874 | | | | 26,874 | | |
| | | | | | | | | | | | | | | | | | | | | | | $ | 2,448,959 | | |
BEST Direct Securities, LLC
| | Mexican Peso
MXN 3,131,748 | | |
SELL | | | |
1/14/11 | | | | 253,000 | | | | 253,341 | | | | (341 | ) | |
BEST Direct Securities, LLC
| | EU Euro
EUR 1,832,957 | | |
SELL | | | |
1/14/11 | | | | 2,407,000 | | | | 2,449,335 | | | | (42,335 | ) | |
BEST Direct Securities, LLC
| | EU Euro
EUR 1,835,653 | | |
SELL | | | |
1/14/11 | | | | 2,407,000 | | | | 2,452,938 | | | | (45,938 | ) | |
BEST Direct Securities, LLC
| | EU Euro
EUR 1,837,841 | | |
SELL | | | |
1/14/11 | | | | 2,407,000 | | | | 2,455,862 | | | | (48,862 | ) | |
BEST Direct Securities, LLC
| | South African Rand
ZAR 15,831,114 | | |
SELL | | | |
1/14/11 | | | | 2,231,998 | | | | 2,398,045 | | | | (166,047 | ) | |
BEST Direct Securities, LLC
| | New Zealand Dollar
NZD 2,436,278 | | |
SELL | | | |
1/14/11 | | | | 1,813,000 | | | | 1,896,086 | | | | (83,086 | ) | |
BEST Direct Securities, LLC
| | EU Euro
EUR 1,852,440 | | |
SELL | | | |
1/14/11 | | | | 2,405,000 | | | | 2,475,370 | | | | (70,370 | ) | |
BEST Direct Securities, LLC
| | EU Euro
EUR 1,296,833 | | |
SELL | | | |
1/14/11 | | | | 1,700,333 | | | | 1,732,926 | | | | (32,593 | ) | |
BEST Direct Securities, LLC
| | EU Euro
EUR 1,882,469 | | |
SELL | | | |
1/14/11 | | | | 2,466,000 | | | | 2,515,497 | | | | (49,497 | ) | |
BEST Direct Securities, LLC
| | Australian Dollar
AUD 586,739 | | |
SELL | | | |
1/14/11 | | | | 562,000 | | | | 598,974 | | | | (36,974 | ) | |
Charles Schwab
| | Japanese Yen
JPY 96,277,250 | | |
SELL | | | |
1/14/11 | | | | 1,148,000 | | | | 1,186,022 | | | | (38,022 | ) | |
Charles Schwab
| | Brazilian Real
BRL 4,276,409 | | |
SELL | | | |
1/28/11 | | | | 2,483,252 | | | | 2,559,036 | | | | (75,784 | ) | |
Charles Schwab
| | Brazilian Real
BRL 4,016,962 | | |
SELL | | | |
1/28/11 | | | | 2,332,595 | | | | 2,403,781 | | | | (71,186 | ) | |
Charles Schwab
| | South Korean Won
KRW 2,199,881,979 | | |
SELL | | | |
1/28/11 | | | | 1,923,394 | | | | 1,935,131 | | | | (11,737 | ) | |
Citigroup, Inc.
| | Mexican Peso
MXN 18,973,176 | | |
SELL | | | |
1/14/11 | | | | 1,508,022 | | | | 1,534,827 | | | | (26,805 | ) | |
Citigroup, Inc.
| | Mexican Peso
MXN 9,034,989 | | |
SELL | | | |
1/14/11 | | | | 716,000 | | | | 730,881 | | | | (14,881 | ) | |
Citigroup, Inc.
| | Mexican Peso
MXN 4,944,966 | | |
SELL | | | |
1/14/11 | | | | 393,035 | | | | 400,021 | | | | (6,986 | ) | |
Citigroup, Inc.
| | EU Euro
EUR 479,670 | | |
SELL | | | |
1/14/11 | | | | 639,000 | | | | 640,971 | | | | (1,971 | ) | |
Citigroup, Inc.
| | New Zealand Dollar
NZD 814,463 | | |
SELL | | | |
1/14/11 | | | | 619,000 | | | | 633,873 | | | | (14,873 | ) | |
Citigroup, Inc.
| | British Pound
GBP 28,956 | | |
SELL | | | |
1/28/11 | | | | 45,000 | | | | 45,135 | | | | (135 | ) | |
Citigroup, Inc.
| | Mexican Peso
MXN 9,193,370 | | |
SELL | | | |
1/14/11 | | | | 736,000 | | | | 743,694 | | | | (7,694 | ) | |
Citigroup, Inc.
| | New Zealand Dollar
NZD 1,434,448 | | |
SELL | | | |
1/14/11 | | | | 1,072,000 | | | | 1,114,018 | | | | (42,018 | ) | |
Citigroup, Inc.
| | Mexican Peso
MXN 9,213,591 | | |
SELL | | | |
1/14/11 | | | | 740,000 | | | | 745,329 | | | | (5,329 | ) | |
Citigroup, Inc.
| | Australian Dollar
AUD 1,689,715 | | |
SELL | | | |
1/14/11 | | | | 1,715,000 | | | | 1,724,951 | | | | (9,951 | ) | |
Citigroup, Inc.
| | Canadian Dollar
CAD 839,018 | | |
SELL | | | |
1/14/11 | | | | 839,000 | | | | 843,599 | | | | (4,599 | ) | |
Citigroup, Inc.
| | Swedish Krona
SEK 3,638,975 | | |
SELL | | | |
1/28/11 | | | | 539,000 | | | | 540,544 | | | | (1,544 | ) | |
Credit Suisse First Boston
| | South Korean Won
KRW 157,734,000 | | |
SELL | | | |
1/28/11 | | | | 138,000 | | | | 138,751 | | | | (751 | ) | |
Credit Suisse First Boston
| | Japanese Yen
JPY 164,563,440 | | |
SELL | | | |
1/14/11 | | | | 1,966,000 | | | | 2,027,228 | | | | (61,228 | ) | |
Credit Suisse First Boston
| | Norwegian Krone
NOK 2,878,542 | | |
SELL | | | |
1/28/11 | | | | 487,000 | | | | 492,624 | | | | (5,624 | ) | |
See Accompanying Notes to Financial Statements
62
SUMMARY PORTFOLIO OF INVESTMENTS
ING BALANCED PORTFOLIO AS OF DECEMBER 31, 2010 (CONTINUED)
| Counterparty | | Currency | | Buy/Sell | | Settlement
Date | | In Exchange
For | | Fair Value | | Unrealized
Appreciation
(Depreciation) | |
Credit Suisse First Boston
| | Swiss Franc
CHF 307,950 | | | SELL | | | |
1/28/11 | | | $ | 321,000 | | | $ | 329,487 | | | $ | (8,487 | ) | |
Credit Suisse First Boston
| | New Zealand Dollar
NZD 1,418,506 | | |
SELL | | | |
1/14/11 | | | | 1,064,000 | | | | 1,103,983 | | | | (39,983 | ) | |
Credit Suisse First Boston
| | British Pound
GBP 1,590,674 | | |
SELL | | | |
1/28/11 | | | | 2,470,000 | | | | 2,479,462 | | | | (9,462 | ) | |
Credit Suisse First Boston
| | Swiss Franc
CHF 2,397,967 | | |
SELL | | | |
1/28/11 | | | | 2,470,000 | | | | 2,565,670 | | | | (95,670 | ) | |
Credit Suisse First Boston
| | Japanese Yen
JPY 181,433,333 | | |
SELL | | | |
1/14/11 | | | | 2,211,000 | | | | 2,235,045 | | | | (24,045 | ) | |
Credit Suisse First Boston
| | EU Euro
EUR 1,200,778 | | |
SELL | | | |
1/14/11 | | | | 1,577,000 | | | | 1,604,570 | | | | (27,570 | ) | |
Credit Suisse First Boston
| | British Pound
GBP 431,891 | | |
SELL | | | |
1/28/11 | | | | 666,000 | | | | 673,209 | | | | (7,209 | ) | |
Deutsche Bank AG
| | EU Euro
EUR 1,845,706 | | |
SELL | | | |
1/14/11 | | | | 2,447,000 | | | | 2,466,372 | | | | (19,372 | ) | |
Deutsche Bank AG
| | Japanese Yen
JPY 76,280,808 | | |
SELL | | | |
1/14/11 | | | | 908,000 | | | | 939,690 | | | | (31,690 | ) | |
Deutsche Bank AG
| | New Zealand Dollar
NZD 413,306 | | |
SELL | | | |
1/14/11 | | | | 309,000 | | | | 321,664 | | | | (12,664 | ) | |
Deutsche Bank AG
| | New Zealand Dollar
NZD 316,160 | | |
SELL | | | |
1/14/11 | | | | 236,000 | | | | 246,058 | | | | (10,058 | ) | |
Deutsche Bank AG
| | Norwegian Krone
NOK 4,940,045 | | |
SELL | | | |
1/28/11 | | | | 833,000 | | | | 845,423 | | | | (12,423 | ) | |
Deutsche Bank AG
| | British Pound
GBP 424,749 | | |
SELL | | | |
1/28/11 | | | | 674,000 | | | | 662,078 | | | | 11,922 | | |
Deutsche Bank AG
| | New Zealand Dollar
NZD 1,075,447 | | |
SELL | | | |
1/14/11 | | | | 812,000 | | | | 836,990 | | | | (24,990 | ) | |
Deutsche Bank AG
| | New Zealand Dollar
NZD 981,718 | | |
SELL | | | |
1/14/11 | | | | 723,000 | | | | 764,043 | | | | (41,043 | ) | |
Deutsche Bank AG
| | Swiss Franc
CHF 487,351 | | |
SELL | | | |
1/28/11 | | | | 513,000 | | | | 521,433 | | | | (8,433 | ) | |
HSBC
| | South African Rand
ZAR 10,973,074 | | |
SELL | | | |
1/14/11 | | | | 1,531,290 | | | | 1,662,165 | | | | (130,875 | ) | |
HSBC
| | Canadian Dollar
CAD 1,236,006 | | |
SELL | | | |
1/14/11 | | | | 1,202,000 | | | | 1,242,753 | | | | (40,753 | ) | |
HSBC
| | EU Euro
EUR 1,840,144 | | |
SELL | | | |
1/14/11 | | | | 2,407,000 | | | | 2,458,939 | | | | (51,939 | ) | |
HSBC
| | Mexican Peso
MXN 14,701,439 | | |
SELL | | | |
1/14/11 | | | | 1,178,000 | | | | 1,189,266 | | | | (11,266 | ) | |
Credit Suisse First Boston
| | Swedish Krona
SEK 2,733,412 | | |
SELL | | | |
1/28/11 | | | | 400,000 | | | | 406,029 | | | | (6,029 | ) | |
Credit Suisse First Boston
| | British Pound
GBP 789,009 | | |
SELL | | | |
1/28/11 | | | | 1,215,000 | | | | 1,229,867 | | | | (14,867 | ) | |
Credit Suisse First Boston
| | British Pound
GBP 540,017 | | |
SELL | | | |
1/28/11 | | | | 830,000 | | | | 841,751 | | | | (11,751 | ) | |
Credit Suisse First Boston
| | British Pound
GBP 1,596,472 | | |
SELL | | | |
1/28/11 | | | | 2,471,000 | | | | 2,488,499 | | | | (17,499 | ) | |
Credit Suisse First Boston
| | British Pound
GBP 1,597,930 | | |
SELL | | | |
1/28/11 | | | | 2,471,000 | | | | 2,490,772 | | | | (19,772 | ) | |
Credit Suisse First Boston
| | New Zealand Dollar
NZD 1,371,275 | | |
SELL | | | |
1/14/11 | | | | 1,018,613 | | | | 1,067,224 | | | | (48,611 | ) | |
JPMorgan Chase & Co.
| | Japanese Yen
JPY 19,279,464 | | |
SELL | | | |
1/14/11 | | | | 229,000 | | | | 237,500 | | | | (8,500 | ) | |
JPMorgan Chase & Co.
| | Japanese Yen
JPY 30,825,780 | | |
SELL | | | |
1/14/11 | | | | 372,000 | | | | 379,737 | | | | (7,737 | ) | |
JPMorgan Chase & Co.
| | Japanese Yen
JPY 79,611,760 | | |
SELL | | | |
1/14/11 | | | | 956,000 | | | | 980,723 | | | | (24,723 | ) | |
JPMorgan Chase & Co.
| | Swedish Krona
SEK 315,448 | | |
SELL | | | |
1/28/11 | | | | 46,000 | | | | 46,858 | | | | (858 | ) | |
JPMorgan Chase & Co.
| | Australian Dollar
AUD 37,648 | | |
SELL | | | |
1/14/11 | | | | 37,000 | | | | 38,433 | | | | (1,433 | ) | |
Morgan Stanley
| | EU Euro
EUR 1,625,083 | | |
SELL | | | |
1/14/11 | | | | 2,158,320 | | | | 2,171,559 | | | | (13,239 | ) | |
Morgan Stanley
| | Canadian Dollar
CAD 1,582,730 | | |
SELL | | | |
1/14/11 | | | | 1,551,000 | | | | 1,591,371 | | | | (40,371 | ) | |
Morgan Stanley
| | Canadian Dollar
CAD 2,509,201 | | |
SELL | | | |
1/14/11 | | | | 2,440,000 | | | | 2,522,899 | | | | (82,899 | ) | |
Morgan Stanley
| | Australian Dollar
AUD 2,003,414 | | |
SELL | | | |
1/14/11 | | | | 1,913,000 | | | | 2,045,192 | | | | (132,192 | ) | |
See Accompanying Notes to Financial Statements
63
SUMMARY PORTFOLIO OF INVESTMENTS
ING BALANCED PORTFOLIO AS OF DECEMBER 31, 2010 (CONTINUED)
| Counterparty | | Currency | | Buy/Sell | | Settlement
Date | | In Exchange
For | | Fair Value | | Unrealized
Appreciation
(Depreciation) | |
Morgan Stanley
| | Australian Dollar
AUD 780,096 | | | SELL | | | |
1/14/11 | | | $ | 751,000 | | | $ | 796,364 | | | $ | (45,364 | ) | |
Morgan Stanley
| | EU Euro
EUR 761,803 | | |
SELL | | | |
1/14/11 | | | | 1,007,000 | | | | 1,017,979 | | | | (10,979 | ) | |
Morgan Stanley
| | Australian Dollar
AUD 760,844 | | |
SELL | | | |
1/14/11 | | | | 750,000 | | | | 776,710 | | | | (26,710 | ) | |
Morgan Stanley
| | EU Euro
EUR 527,821 | | |
SELL | | | |
1/14/11 | | | | 701,000 | | | | 705,314 | | | | (4,314 | ) | |
Morgan Stanley
| | New Zealand Dollar
NZD 600,173 | | |
SELL | | | |
1/14/11 | | | | 454,000 | | | | 467,098 | | | | (13,098 | ) | |
Morgan Stanley
| | Canadian Dollar
CAD 1,425,211 | | |
SELL | | | |
1/14/11 | | | | 1,409,000 | | | | 1,432,991 | | | | (23,991 | ) | |
Morgan Stanley
| | New Zealand Dollar
NZD 1,087,634 | | |
SELL | | | |
1/14/11 | | | | 812,000 | | | | 846,474 | | | | (34,474 | ) | |
Morgan Stanley
| | South Korean Won
KRW 524,086,200 | | |
SELL | | | |
1/28/11 | | | | 459,000 | | | | 461,013 | | | | (2,013 | ) | |
Morgan Stanley
| | Canadian Dollar
CAD 281,882 | | |
SELL | | | |
1/14/11 | | | | 280,000 | | | | 283,420 | | | | (3,420 | ) | |
Morgan Stanley
| | Canadian Dollar
CAD 2,497,975 | | |
SELL | | | |
1/14/11 | | | | 2,470,000 | | | | 2,511,612 | | | | (41,612 | ) | |
Morgan Stanley
| | Mexican Peso
MXN 25,241,934 | | |
SELL | | | |
1/14/11 | | | | 2,026,000 | | | | 2,041,935 | | | | (15,935 | ) | |
Morgan Stanley
| | EU Euro
EUR 562,912 | | |
SELL | | | |
1/14/11 | | | | 737,000 | | | | 752,205 | | | | (15,205 | ) | |
Morgan Stanley
| | Canadian Dollar
CAD 731,912 | | |
SELL | | | |
1/14/11 | | | | 726,000 | | | | 735,907 | | | | (9,907 | ) | |
Morgan Stanley
| | EU Euro
EUR 1,281,649 | | |
SELL | | | |
1/14/11 | | | | 1,685,000 | | | | 1,712,636 | | | | (27,636 | ) | |
Morgan Stanley
| | EU Euro
EUR 1,281,688 | | |
SELL | | | |
1/14/11 | | | | 1,685,000 | | | | 1,712,688 | | | | (27,688 | ) | |
Morgan Stanley
| | EU Euro
EUR 1,281,454 | | |
SELL | | | |
1/14/11 | | | | 1,685,000 | | | | 1,712,375 | | | | (27,375 | ) | |
Morgan Stanley
| | New Zealand Dollar
NZD 941,989 | | |
SELL | | | |
1/14/11 | | | | 705,000 | | | | 733,124 | | | | (28,124 | ) | |
Morgan Stanley
| | Canadian Dollar
CAD 332,836 | | |
SELL | | | |
1/14/11 | | | | 333,000 | | | | 334,653 | | | | (1,653 | ) | |
Morgan Stanley
| | EU Euro
EUR 1,150,665 | | |
SELL | | | |
1/14/11 | | | | 1,508,000 | | | | 1,537,605 | | | | (29,605 | ) | |
UBS Warburg LLC
| | Australian Dollar
AUD 1,325,995 | | |
SELL | | | |
1/14/11 | | | | 1,289,000 | | | | 1,353,647 | | | | (64,647 | ) | |
UBS Warburg LLC
| | EU Euro
EUR 313,887 | | |
SELL | | | |
1/14/11 | | | | 420,000 | | | | 419,440 | | | | 560 | | |
| | | | | | | | | | | | | | | | | | | | | | | $ | (2,456,842 | ) | |
ING Balanced Portfolio Open Futures Contracts on December 31, 2010:
| Contract Description | | Number
of Contracts | | Expiration Date | | Notional
Value | | Unrealized
Appreciation/
(Depreciation) | |
| Long Contracts | |
| Australia 10-Year Bond | | | 14 | | | 03/15/11 | | $ | 1,479,198 | | | $ | 6,076 | | |
| Australia 3-Year Bond | | | 20 | | | 03/15/11 | | | 2,084,835 | | | | 26 | | |
| Canada 10-Year Bond | | | 16 | | | 03/22/11 | | | 1,972,202 | | | | 4,294 | | |
| Euro-Bund | | | 124 | | | 03/08/11 | | | 20,764,155 | | | | 3,183 | | |
| Euro-Schatz | | | 185 | | | 03/08/11 | | | 26,947,904 | | | | (3,029 | ) | |
| Japan 10-Year Bond (TSE) | | | 6 | | | 03/10/11 | | | 10,391,181 | | | | 43,292 | | |
| Long Gilt | | | 39 | | | 03/29/11 | | | 7,265,529 | | | | (63,896 | ) | |
| Short Gilt | | | 13 | | | 03/29/11 | | | 2,214,297 | | | | (7,713 | ) | |
| U.S. Treasury 2-Year Note | | | 45 | | | 03/31/11 | | | 9,850,782 | | | | 8,607 | | |
| U.S. Treasury 5-Year Note | | | 24 | | | 03/31/11 | | | 2,825,250 | | | | (35,357 | ) | |
| U.S. Treasury Long Bond | | | 5 | | | 03/22/11 | | | 610,625 | | | | (21,106 | ) | |
| U.S. Treasury Ultra Long Bond | | | 14 | | | 03/22/11 | | | 1,779,313 | | | | (20,980 | ) | |
| | | | | | | $ | 88,185,271 | | | $ | (86,603 | ) | |
See Accompanying Notes to Financial Statements
64
SUMMARY PORTFOLIO OF INVESTMENTS
ING BALANCED PORTFOLIO AS OF DECEMBER 31, 2010 (CONTINUED)
| Contract Description | | Number
of Contracts | | Expiration Date | | Notional
Value | | Unrealized
Appreciation/
(Depreciation) | |
| Short Contracts | |
| Euro-Bobl 5-Year | | | 95 | | | 03/08/11 | | $ | 15,079,043 | | | $ | 19,262 | | |
| Medium Gilt | | | 24 | | | 03/29/11 | | | 4,315,435 | | | | 32,193 | | |
| U.S. Treasury 2-Year Note | | | 52 | | | 03/31/11 | | | 11,383,126 | | | | 6,369 | | |
| U.S. Treasury 5-Year Note | | | 31 | | | 03/31/11 | | | 3,649,281 | | | | 55,868 | | |
| U.S. Treasury 10-Year Note | | | 55 | | | 03/22/11 | | | 6,624,062 | | | | (23,661 | ) | |
| U.S. Treasury Long Bond | | | 60 | | | 03/22/11 | | | 7,327,500 | | | | 183,303 | | |
| | | | | | | $ | 48,378,447 | | | $ | 273,334 | | |
ING Balanced Portfolio Credit Default Swap Agreements Outstanding on December 31, 2010:
Credit Default Swaps on Corporate and Sovereign Issues — Buy Protection(1)
| Counterparty | | Reference
Entity/Obligation | | Buy/Sell
Protection | | (Pay)/
Receive
Fixed
Rate (%) | | Termination
Date | | Notional
Amount(4) | | Fair
Value(5) | | Upfront
Premium
Paid/
(Received) | | Unrealized
Appreciation/
(Depreciation) | |
| Citigroup, Inc. | | MBIA Inc.
6.625%, 10/01/28 | | Buy | | | (5.000 | ) | | 09/20/13 | | USD | 140,000 | | | $ | 14,083 | | | $ | 25,745 | | | $ | (11,662 | ) | |
| Citigroup, Inc. | | MBIA Inc.
6.625%, 10/01/28 | | Buy | | | (5.000 | ) | | 09/20/13 | | USD | 284,000 | | | | 28,570 | | | | 50,122 | | | | (21,552 | ) | |
JPMorgan
Chase & Co. | | MBIA Inc.
6.625%, 10/01/28 | | Buy | | | (5.000 | ) | | 09/20/13 | | USD | 959,000 | | | | 96,474 | | | | 92,107 | | | | 4,367 | | |
| | | | | | | | | | | | | $ | 139,127 | | | $ | 167,974 | | | $ | (28,847 | ) | |
Credit Default Swaps on Corporate and Sovereign Issues — Sell Protection(2)
| Counterparty | | Reference
Entity/Obligation | | Buy/Sell
Protection | | (Pay)/
Receive
Fixed
Rate (%) | | Termination
Date | | Implied
Credit
Spread at
12/31/10 (%)(3) | | Notional
Amount(4) | | Fair
Value(5) | | Upfront
Premium
Paid/
(Received) | | Unrealized
Appreciation/
(Depreciation) | |
| Citigroup, Inc. | | MBIA Global
Funding LLC | | Sell | | | 5.000 | | | 09/20/13 | | �� | 27.381 | | | USD | 139,000 | | | $ | (56,683 | ) | | $ | (28,441 | ) | | $ | (28,242 | ) | |
| Citigroup, Inc. | | MBIA Global
Funding LLC | | Sell | | | 5.000 | | | 09/20/13 | | | 27.381 | | | USD | 284,000 | | | | (115,813 | ) | | | (63,390 | ) | | | (52,423 | ) | |
Goldman
Sachs & Co. | | MBIA Global
Funding LLC | | Sell | | | 5.000 | | | 09/20/13 | | | 27.381 | | | USD | 241,000 | | | | (98,277 | ) | | | (48,686 | ) | | | (49,591 | ) | |
JPMorgan
Chase & Co. | | MBIA Global
Funding LLC | | Sell | | | 5.000 | | | 09/20/13 | | | 27.381 | | | USD | 480,000 | | | | (195,740 | ) | | | (48,663 | ) | | | (147,077 | ) | |
| | | | | | | | | | | | | | | | | $ | (466,513 | ) | | $ | (189,180 | ) | | $ | (277,333 | ) | |
(1) If a Portfolio is a buyer of protection and a credit event occurs, as defined under the terms of that particular swap agreement, a Portfolio will either 1.) receive from the seller of protection an amount equal to the notional amount of the swap and deliver the referenced obligation, other deliverable obligations or underlying securities comprising the referenced index or 2.) receive a net settlement amount in the form of cash or securities equal to the notional amount of the swap less the recovery value of the referenced obligation or underlying securities comprising the referenced index.
(2) If the Portfolio is a seller of protection, and a credit event occurs, as defined under the terms of that particular swap agreement, the Portfolio will generally either 1.) Pay to the buyer an amount equal to the notional amount of the swap and take delivery of the referenced obligation, other deliverable obligations, or underlying securities comprising a referenced index or 2.) Pay a net settlement amount in the form of cash or securities equal to the notional amount of the swap less the recovery value of the referenced obligation or underlying securities comprising a referenced index.
(3) Implied credit spreads, represented in absolute terms, utilized in determining the fair value of credit default swap agreements on corporate issues or sovereign issues are disclosed in each Portfolio's Portfolio of Investment and serve as an indicator of the current status of the payment/performance risk and represent the likelihood or risk of default for the credit derivative. The implied credit spread of a particular referenced entity reflects the cost of buying/selling protection and may include upfront payments required to be made to enter into the agreement. For credit default swaps on asset-backed securities or credit indices, the quoted fair prices and resulting fair values serve as the indicator of the current status of the payment/performance risk. Wider credit spreads and increasing fair values, in absolute terms when compared to the notional amount of the swap, represent a deterioration of the referenced entity's credit soundness and a greater likelihood or risk of default or other credit event occurring as defined under the terms of the agreement.
(4) The maximum amount of future payments (undiscounted) that a Portfolio as a seller of protection could be required to make or receive as a buyer of credit protection under a credit default swap agreement would be an amount equal to the notional amount of the agreement.
(5) The fair values for credit default swap agreements serve as an indicator of the current status of the payment/performance risk and represent the likelihood or risk of default for the credit derivative. Increasing fair values, in absolute terms, when compared to the notional amount of the agreement, represent a deterioration of the referenced obligation's credit soundness and a greater likelihood or risk of default or other credit event occurring.
See Accompanying Notes to Financial Statements
65
SUMMARY PORTFOLIO OF INVESTMENTS
ING BALANCED PORTFOLIO AS OF DECEMBER 31, 2010 (CONTINUED)
ING Balanced Portfolio Interest Rate Swap Agreements Outstanding on December 31, 2010:
| | | Termination
Date | | Notional
Amount | | Fair
Value | | Upfront Premium
Paid/(Received) | | Unrealized
Appreciation/
(Depreciation) | |
Receive a fixed rate equal to 2.056% and pay a floating rate
based on 3-month CAD-BA-CDOR
Counterparty: Citigroup, Inc. | | 07/28/13 | | CAD | 6,000,000 | | | $ | 11,585 | | | $ | — | | | $ | 11,585 | | |
Receive a fixed rate equal to 1.803% and pay a floating rate
based on 6-month CAD-BA-CDOR
Counterparty: Deutsche Bank AG | | 09/21/13 | | CAD | 5,000,000 | | | | (29,090 | ) | | | — | | | | (29,090 | ) | |
Pay a fixed rate equal to 4.140% and receive a floating rate
based on the 6-month Tasa Nominal Anual Promedio (TNA)
Counterparty: Deutsche Bank AG | | 10/19/12 | | CLP | 937,955,000 | | | | 15,041 | | | | — | | | | 15,041 | | |
Receive a fixed rate equal to 5.800% and pay a floating rate
based on 28-day MXN-TIIE-BANXICO
Counterparty: Citigroup, Inc. | | 07/17/15 | | MXN | 15,020,000 | | | | (31,312 | ) | | | — | | | | (31,312 | ) | |
Receive a fixed rate equal to 6.225% and pay a floating rate
based on 28-day MXN-TIIE-BANXICO
Counterparty: Citigroup, Inc. | | 07/17/15 | | MXN | 23,000,000 | | | | (15,416 | ) | | | — | | | | (15,416 | ) | |
Receive a fixed rate equal to 5.950% and pay a floating rate
based on 28-day MXN-TIIE-BANXICO
Counterparty: Deutsche Bank AG | | 11/12/15 | | MXN | 12,187,000 | | | | (24,568 | ) | | | — | | | | (24,568 | ) | |
Pay a fixed rate equal to 3.478% and receive a floating rate
based on the 3-month USD-LIBOR-BBA
Counterparty: Citigroup, Inc. | | 05/11/20 | | USD | 6,583,000 | | | | (114,693 | ) | | | — | | | | (114,693 | ) | |
Pay a fixed rate equal to 2.870% and receive a floating rate
based on the 3-month USD-LIBOR-BBA
Counterparty: Credit Suisse First Boston | | 12/24/17 | | USD | 5,000,000 | | | | (22,061 | ) | | | — | | | | (22,061 | ) | |
Pay a fixed rate equal to 3.444% and receive a floating rate
based on the 3-month USD-LIBOR-BBA
Counterparty: Credit Suisse First Boston | | 12/24/20 | | USD | 9,000,000 | | | | (66,668 | ) | | | — | | | | (66,668 | ) | |
| | | | | $(277,182) | | $— | | $(277,182) | |
ING Balanced Portfolio Cross-Currency Inflation-Linked Swap Agreements Outstanding on December 31, 2010:
| Counterparty | | Notional
Amount on
Fixed Rate
(Currency
Received) | | Notional
Amount on
Floating Rate
(Currency
Delivered) | | Floating
Rate | | Fixed Rate | | Termination
Date | | Fair
Value | | Upfront
Payment
Paid
(Received) | | Unrealized
Appreciation | |
| Deutsche Bank AG | | U.F. 43,910 | | CLP | 937,955,000 | | | 6-month Tasa Nominal Anual
Promedio (TNA) | | | 0.88 | % | | 10/19/12 | | $ | (7,381 | ) | | $ | — | | | $ | (7,381 | ) | |
| | | | | | | | | | | | | | | | | | | | | | | $ | (7,381 | ) | | $ | — | | | $ | (7,381 | ) | |
Unidad de Fomento (U.F.). A Chilean currency unit indexed according to inflation. The index is calculated on a monthly basis effective on the 10th day of the current month until the 9th day of the following month, with the value of the U.F. adjusted daily.
ING Balanced Portfolio Written Currency Options Outstanding on December 31, 2010:
Foreign Currency Options
| Description | | Counterparty | | Exercise
Price | | Expiration
Date | | Notional
Amount | | Premiums
Received | | Fair
Value | |
Currency Option OTC
EUR Call vs USD Put | | Morgan Stanley | | | 1.360 | | | 01/14/11 | | USD | 2,500,000 | | | $ | 11,875 | | | $ | (8,698 | ) | |
Currency Option OTC
EUR Call vs USD Put | | Morgan Stanley | | | 1.360 | | | 01/21/11 | | USD | 2,400,000 | | | | 16,080 | | | | (13,318 | ) | |
Currency Option OTC
EUR Call vs USD Put | | Morgan Stanley | | | 1.375 | | | 01/21/11 | | USD | 2,450,000 | | | | 12,250 | | | | (7,213 | ) | |
Currency Option OTC
EUR Call vs USD Put | | Morgan Stanley | | | 1.450 | | | 01/21/11 | | USD | 19,600,000 | | | | 222,460 | | | | (1,257 | ) | |
Currency Option OTC
JPY Call vs USD Put | | Morgan Stanley | | | 81.000 | | | 02/09/11 | | USD | 4,900,000 | | | | 30,870 | | | | (63,902 | ) | |
| | | | | | | | | | | | | | | | | | | $ | 293,535 | | | $ | (94,388 | ) | |
See Accompanying Notes to Financial Statements
66
SUMMARY PORTFOLIO OF INVESTMENTS
ING BALANCED PORTFOLIO AS OF DECEMBER 31, 2010 (CONTINUED)
A summary of derivative instruments by primary risk exposure is outlined in the following tables.
The fair value of derivative instruments as of December 31, 2010 was as follows:
Derivatives not accounted
for as hedging instruments | | Location on Statement of Assets and Liabilities | | Fair Value | |
| Asset Derivatives | |
| Foreign exchange contracts | | Investments in securities at value* | | $ | 47,275 | | |
| Foreign exchange contracts | | Unrealized appreciation on forward foreign currency contracts | | | 2,560,193 | | |
| Credit contracts | | Swaps, at fair value | | | 139,127 | | |
| Interest rate contracts | | Swaps, at fair value | | | 26,626 | | |
| Interest rate contracts | | Net Assets — Unrealized appreciation** | | | 362,473 | | |
| Total Asset Derivatives | | | | $ | 3,135,694 | | |
| Liability Derivatives | |
| Foreign exchange contracts | | Unrealized depreciation on forward foreign currency contracts | | $ | 2,568,076 | | |
| Credit contracts | | Swaps, at fair value | | | 466,513 | | |
| Interest rate contracts | | Swaps, at fair value | | | 311,189 | | |
| Interest rate contracts | | Net Assets — Unrealized depreciation** | | | 175,742 | | |
| Foreign exchange contracts | | Written options, at fair value | | | 94,388 | | |
| Total Liability Derivatives | | | | $ | 3,615,908 | | |
* Includes purchased options.
** Includes cumulative appreciation/depreciation of futures contracts as reported in the table following the Summary Portfolio of Investments.
The effect of derivative instruments on the Portfolio's Statement of Operations for the year ended December 31, 2010 was as follows:
| | | Amount of Realized Gain or (Loss) on Derivatives Recognized in Income | |
Derivatives not
accounted for as
hedging instruments | | Investments* | | Foreign currency
related transactions** | | Futures | | Swaps | | Written
options | | Total | |
| Credit contracts | | $ | (176,498 | ) | | $ | — | | | $ | — | | | $ | (259,050 | ) | | $ | 103,165 | | | $ | (332,383 | ) | |
| Equity contracts | | | — | | | | — | | | | 516,197 | | | | — | | | | — | | | | 516,197 | | |
| Foreign exchange contracts | | | (234,190 | ) | | | (2,484,340 | ) | | | — | | | | — | | | | 274,990 | | | | (2,443,540 | ) | |
| Interest rate contracts | | | — | | | | — | | | | 270,677 | | | | 109,209 | | | | 88,216 | | | | 468,102 | | |
| Total | | $ | (410,688 | ) | | $ | (2,484,340 | ) | | $ | 786,874 | | | $ | (149,841 | ) | | $ | 466,371 | | | $ | (1,791,624 | ) | |
| | | Change in Unrealized Appreciation or (Depreciation) on Derivatives Recognized in Income | |
Derivatives not
accounted for as
hedging instruments | | Investments* | | Foreign currency
related transactions** | | Futures | | Swaps | | Written
options | | Total | |
| Credit contracts | | $ | — | | | $ | — | | | $ | — | | | $ | (210,984 | ) | | $ | — | | | $ | (210,984 | ) | |
| Equity contracts | | | — | | | | — | | | | (100,697 | ) | | | — | | | | — | | | | (100,697 | ) | |
| Foreign exchange contracts | | | (340,070 | ) | | | (46,542 | ) | | | — | | | | — | | | | 199,147 | | | | (187,465 | ) | |
| Interest rate contracts | | | — | | | | — | | | | (236,425 | ) | | | (284,563 | ) | | | — | | | | (520,988 | ) | |
| Total | | $ | (340,070 | ) | | $ | (46,542 | ) | | $ | (337,122 | ) | | $ | (495,547 | ) | | $ | 199,147 | | | $ | (1,020,134 | ) | |
* Amounts recognized for purchased options are included in net realized gain (loss) on investments and net change in unrealized appreciation or depreciation on investments.
** Amounts recognized for forward foreign currency contracts are included in net realized gain (loss) on foreign currency related transactions and net change in unrealized appreciation or depreciation on foreign currency related transactions.
See Accompanying Notes to Financial Statements
67
SUMMARY PORTFOLIO OF INVESTMENTS
ING GROWTH AND INCOME PORTFOLIO AS OF DECEMBER 31, 2010
| Shares | |
| |
| | Value | | Percent of
Net Assets | |
| COMMON STOCK: 98.0% | | | |
| | | Consumer Discretionary: 9.8% | | | |
| | 1,936,300 | | | | | | | Comcast Corp. -
Class A | | $ | 42,540,511 | | | | 1.5 | | |
| | 965,271 | | | | @ | | | DIRECTV | | | 38,543,271 | | | | 1.4 | | |
| | 1,659,500 | | | | L | | | International Game
Technology | | | 29,356,555 | | | | 1.1 | | |
| | 1,249,232 | | | | | | | Macy's, Inc. | | | 31,605,570 | | | | 1.2 | | |
| | 1,253,900 | | | | | | | Wyndham
Worldwide Corp. | | | 37,566,844 | | | | 1.4 | | |
| | | | | | | | | Other Securities | | | 89,044,212 | | | | 3.2 | | |
| | | | | | | | | | | | | | 268,656,963 | | | | 9.8 | | |
| | | Consumer Staples: 9.7% | | | |
| | 1,256,400 | | | | | | | Coca-Cola
Enterprises, Inc. | | | 31,447,692 | | | | 1.1 | | |
| | 1,164,882 | | | | | | | PepsiCo, Inc. | | | 76,101,741 | | | | 2.8 | | |
| | 917,192 | | | | | | | Procter & Gamble Co. | | | 59,002,961 | | | | 2.1 | | |
| | 1,452,600 | | | | | | | Wal-Mart Stores, Inc. | | | 78,338,718 | | | | 2.9 | | |
| | | | | | | | | Other Securities | | | 20,783,790 | | | | 0.8 | | |
| | | | | | | | | | | | | | 265,674,902 | | | | 9.7 | | |
| | | Energy: 13.4% | | | |
| | 1,089,200 | | | | | | | Arch Coal, Inc. | | | 38,187,352 | | | | 1.4 | | |
| | 1,885,315 | | | | | | | ExxonMobil Corp. | | | 137,854,233 | | | | 5.0 | | |
| | 544,415 | | | | | | | National Oilwell
Varco, Inc. | | | 36,611,909 | | | | 1.4 | | |
| | 596,100 | | | | | | | Schlumberger Ltd. | | | 49,774,350 | | | | 1.8 | | |
| | 944,600 | | | | | | | Suncor Energy, Inc. | | | 36,168,734 | | | | 1.3 | | |
| | 399,400 | | | | @ | | | Transocean Ltd. | | | 27,762,294 | | | | 1.0 | | |
| | | | | | | | | Other Securities | | | 41,916,703 | | | | 1.5 | | |
| | | | | | | | | | | | | | 368,275,575 | | | | 13.4 | | |
| | | Financials: 16.3% | | | |
| | 1,875,673 | | | | @, L | | | Blackstone Group LP | | | 26,540,773 | | | | 1.0 | | |
| | 14,365,800 | | | | @ | | | Citigroup, Inc. | | | 67,950,234 | | | | 2.5 | | |
| | 844,400 | | | | L | | | Comerica, Inc. | | | 35,667,456 | | | | 1.3 | | |
| | 167,100 | | | | | | | Goldman Sachs
Group, Inc. | | | 28,099,536 | | | | 1.0 | | |
| | 2,140,960 | | | | | | | JPMorgan Chase & Co. | | | 90,819,523 | | | | 3.3 | | |
| | 595,300 | | | | | | | Prudential
Financial, Inc. | | | 34,950,063 | | | | 1.3 | | |
| | 539,685 | | | | | | | Reinsurance Group
of America, Inc. | | | 28,986,481 | | | | 1.1 | | |
| | 2,755,400 | | | | | | | Wells Fargo & Co. | | | 85,389,846 | | | | 3.1 | | |
| | 1,535,600 | | | | | | | XL Group PLC | | | 33,506,792 | | | | 1.2 | | |
| | | | | | | | | Other Securities | | | 14,018,224 | | | | 0.5 | | |
| | | | | | | | | | | | | | 445,928,928 | | | | 16.3 | | |
| | | Health Care: 10.2% | | | |
| | 966,200 | | | | | | | Aetna, Inc. | | | 29,478,762 | | | | 1.1 | | |
| | 1,181,300 | | | | | | | AmerisourceBergen
Corp. | | | 40,305,956 | | | | 1.5 | | |
| Shares | |
| |
| | Value | | Percent of
Net Assets | |
| | | Health Care (continued) | | | |
| | 627,100 | | | | @ | | | Medco Health
Solutions, Inc. | | $ | 38,422,417 | | | | 1.4 | | |
| | 1,625,100 | | | | | | | Merck & Co., Inc. | | | 58,568,604 | | | | 2.1 | | |
| | 3,709,217 | | | | | | | Pfizer, Inc. | | | 64,948,390 | | | | 2.4 | | |
| | | | | | | | | Other Securities | | | 48,484,469 | | | | 1.7 | | |
| | | | | | | | | | | | | | 280,208,598 | | | | 10.2 | | |
| | | Industrials: 10.8% | | | |
| | 578,600 | | | | | | | Boeing Co. | | | 37,759,436 | | | | 1.4 | | |
| | 474,200 | | | | @ | | | Cooper Industries
PLC | | | 27,641,118 | | | | 1.0 | | |
| | 642,900 | | | | | | | Fluor Corp. | | | 42,598,554 | | | | 1.6 | | |
| | 2,640,900 | | | | | | | General Electric Co. | | | 48,302,061 | | | | 1.8 | | |
| | 408,530 | | | | @ | | | TransDigm
Group, Inc. | | | 29,418,245 | | | | 1.1 | | |
| | 298,980 | | | | | | | Union Pacific
Corp. | | | 27,703,487 | | | | 1.0 | | |
| | 517,859 | | | | @ | | | WABCO Holdings, Inc. | | | 31,553,149 | | | | 1.1 | | |
| | | | | | | | | Other Securities | | | 49,421,333 | | | | 1.8 | | |
| | | | | | | | | | | | | | 294,397,383 | | | | 10.8 | | |
| | | Information Technology: 19.5% | | | |
| | 368,607 | | | | @ | | | Apple, Inc. | | | 118,897,874 | | | | 4.3 | | |
| | 116,600 | | | | @ | | | Google, Inc. - Class A | | | 69,256,902 | | | | 2.5 | | |
| | 2,647,300 | | | | | | | Intel Corp. | | | 55,672,719 | | | | 2.0 | | |
| | 2,602,800 | | | | L | | | Jabil Circuit, Inc. | | | 52,290,252 | | | | 1.9 | | |
| | 2,078,400 | | | | @ | | | Marvell Technology
Group Ltd. | | | 38,554,320 | | | | 1.4 | | |
| | 3,615,761 | | | | | | | Microsoft Corp. | | | 100,952,048 | | | | 3.7 | | |
| | 1,593,917 | | | | | | | Qualcomm, Inc. | | | 78,882,952 | | | | 2.9 | | |
| | | | | | | | | Other Securities | | | 20,919,120 | | | | 0.8 | | |
| | | | | | | | | | | | | | 535,426,187 | | | | 19.5 | | |
| | | Materials: 3.9% | | | |
| | 717,100 | | | | | | | EI Du Pont de
Nemours & Co. | | | 35,768,948 | | | | 1.3 | | |
| | 1,451,800 | | | | | | | Packaging Corp. of
America | | | 37,514,512 | | | | 1.4 | | |
| | 576,100 | | | | L | | | United States Steel
Corp. | | | 33,655,762 | | | | 1.2 | | |
| | | | | | | | | | | | | | 106,939,222 | | | | 3.9 | | |
| | | Telecommunication Services: 2.6% | | | |
| | 6,587,700 | | | | @ | | | Sprint Nextel Corp. | | | 27,865,971 | | | | 1.0 | | |
| | 1,191,300 | | | | | | | Verizon
Communications, Inc. | | | 42,624,714 | | | | 1.6 | | |
| | | | | | | | | | | | | | 70,490,685 | | | | 2.6 | | |
| | | Utilities: 1.8% | | | |
| | 2,595,300 | | | | L | | | Great Plains
Energy, Inc. | | | 50,322,867 | | | | 1.8 | | |
| | | | | | | | | Total Common Stock
( Cost $2,219,462,869 ) | | | 2,686,321,310 | | | | 98.0 | | |
See Accompanying Notes to Financial Statements
68
SUMMARY PORTFOLIO OF INVESTMENTS
ING GROWTH AND INCOME PORTFOLIO AS OF DECEMBER 31, 2010 (CONTINUED)
Principal
Amount | |
| |
| | Value | | Percent of
Net Assets | |
| CORPORATE BONDS/NOTES: 0.0% | | | |
| | | Energy: 0.0% | | | |
| | | | | | | | | Other Securities | | $ | — | | | | 0.0 | | |
| | | Utilities: 0.0% | | | |
| | | | | | | | | Other Securities | | | — | | | | 0.0 | | |
| | | | | | | | | Total Corporate
Bonds/Notes
( Cost $— ) | | | — | | | | 0.0 | | |
| | | | | | | | | Total Long-Term
Investments
( Cost $2,219,462,869 ) | | | 2,686,321,310 | | | | 98.0 | | |
| Shares | |
| |
| | Value | | Percent of
Net Assets | |
| SHORT-TERM INVESTMENTS: 4.7% | | | |
| | | Mutual Funds: 2.1% | | | |
| | 56,996,000 | | | | | | | Blackrock Liquidity
Funds TempFund
Portfolio - Class I | | $ | 56,996,000 | | | | 2.1 | | |
| | | | | | | | | Total Mutual Funds
( Cost $56,996,000 ) | | | 56,996,000 | | | | 2.1 | | |
| | | Securities Lending Collateralcc: 2.6% | | | |
| | 70,524,418 | | | | | | | BNY Mellon
Overnight
Government Fund (1) | | | 70,524,418 | | | | 2.6 | | |
| | 822,936 | | | | R | | | BNY Institutional
Cash Reserves
Fund, Series B (1)(2) | | | 658,349 | | | | 0.0 | | |
| | | | | | | | | Total Securities
Lending Collateral
( Cost $71,347,354) | | | 71,182,767 | | | | 2.6 | | |
| | | | | | | | | Total Short-Term
Investments
( Cost $128,343,354 ) | | | 128,178,767 | | | | 4.7 | | |
| | | | | | | | | Total Investments in
Securities
( Cost $2,347,806,223 ) * | | $ | 2,814,500,077 | | | | 102.7 | | |
| | | | | | | | | Other Assets and
Liabilities - Net | | | (74,134,157 | ) | | | (2.7 | ) | |
| | | | | | | | | Net Assets | | $ | 2,740,365,920 | | | | 100.0 | | |
"Other Securities" represents issues not identified as the top 50 holdings in terms of market value and issues or issuers not exceeding 1% of net assets individually or in aggregate respectively as of December 31, 2010.
The following footnotes apply to either the individual securities noted or one or more of the securities aggregated and listed as a single line item.
@ Non-income producing security
cc Securities purchased with cash collateral for securities loaned.
(1) Collateral received from brokers for securities lending was invested in these short-term investments.
(2) On September 12, 2008, BNY established a separate sleeve of the Institutional Cash Reserves Fund (Series B) to hold certain Lehman Brothers defaulted debt obligations. The Portfolio's position in Series B is being fair valued daily. Please see the accompanying Notes to Financial Statements for additional details on securities lending.
R Restricted security
L Loaned security, a portion or all of the security is on loan at December 31, 2010.
* Cost for federal income tax purposes is $2,388,728,598.
| Net unrealized appreciation consists of: | |
| Gross Unrealized Appreciation | | $ | 476,758,851 | | |
| Gross Unrealized Depreciation | | | (50,987,372 | ) | |
| Net Unrealized Appreciation | | $ | 425,771,479 | | |
See Accompanying Notes to Financial Statements
69
SUMMARY PORTFOLIO OF INVESTMENTS
ING GROWTH AND INCOME PORTFOLIO AS OF DECEMBER 31, 2010 (CONTINUED)
Fair Value Measurements^
The following is a summary of the fair valuations according to the inputs used as of December 31, 2010 in valuing the Portfolio's assets and liabilities:
| | | Quoted Prices
in Active Markets
for Identical Investments
(Level 1) | | Other
Observable
Inputs
(Level 2) | | Significant
Unobservable
Inputs
(Level 3) | | Fair Value
at
12/31/10 | |
| Asset Table | |
| Investments, at value | |
| Common Stock* | | $ | 2,686,321,310 | | | $ | — | | | $ | — | | | $ | 2,686,321,310 | | |
| Short-Term Investments | | | 127,520,418 | | | | — | | | | 658,349 | | | | 128,178,767 | | |
| Total Investments, at value | | $ | 2,813,841,728 | | | $ | — | | | $ | 658,349 | | | $ | 2,814,500,077 | | |
The following is a reconciliation of the fair valuations using significant unobservable inputs (Level 3) for the Portfolio's assets and liabilities during the period ended December 31, 2010:
| | | Beginning
Balance
12/31/2009 | | Purchases | | Sales | | Accrued
Discounts/
(Premiums) | | Total
Realized
Gain/(Loss) | | Total
Unrealized
Appreciation/
(Depreciation) | | Transfers
Into
Level 3 | | Transfers
out of
Level 3 | | Ending
Balance
12/31/10 | |
| Asset Table | |
| Investments, at value | |
| Short-Term Investments | | $ | 337,614 | | | $ | — | | | $ | — | | | $ | — | | | $ | — | | | $ | — | | | $ | 320,735 | | | $ | — | | | $ | 658,349 | | |
| Total Investments, at value | | $ | 337,614 | | | $ | — | | | $ | — | | | $ | — | | | $ | — | | | $ | — | | | $ | 320,735 | | | $ | — | | | $ | 658,349 | | |
As of December 31, 2010, total change in unrealized gain (loss) on Level 3 securities still held at period end and included in the change in net assets was $0.
^ See Note 2, "Significant Accounting Policies" in the Notes to Financial Statements for additional information.
Transfers in or out of Level 3 represents either the beginning value (for transfers in), or the ending value (for transfers out) of any security or derivative instrument where a change in the pricing level occurred from the beginning to the end of the period. It is the policy of the Portfolio to recognize transfers at the end of the reporting period.
* For further breakdown of Common Stock by Industry type, please refer to the Portfolio of Investments.
See Accompanying Notes to Financial Statements
70
SUMMARY PORTFOLIO OF INVESTMENTS
ING SMALL COMPANY PORTFOLIO AS OF DECEMBER 31, 2010
| Shares | |
| |
| | Value | | Percent of
Net Assets | |
| COMMON STOCK: 91.6% | | | |
| | | Consumer Discretionary: 14.6% | | | |
| | 142,237 | | | | | | | Arbitron, Inc. | | $ | 5,905,680 | | | | 0.9 | | |
| | 312,200 | | | | @ | | | Collective
Brands, Inc. | | | 6,587,420 | | | | 1.0 | | |
| | 246,100 | | | | | | | Cooper Tire &
Rubber Co. | | | 5,803,038 | | | | 0.9 | | |
| | 227,800 | | | | @ | | | Dress Barn, Inc. | | | 6,018,476 | | | | 1.0 | | |
| | 121,498 | | | | @ | | | Jo-Ann Stores, Inc. | | | 7,316,610 | | | | 1.2 | | |
| | 160,100 | | | | @ | | | Life Time Fitness, Inc. | | | 6,562,499 | | | | 1.0 | | |
| | 385,949 | | | | @ | | | OfficeMax, Inc. | | | 6,831,293 | | | | 1.1 | | |
| | 184,100 | | | | @ | | | Papa John's
International, Inc. | | | 5,099,570 | | | | 0.8 | | |
| | 332,700 | | | | | | | Regis Corp. | | | 5,522,820 | | | | 0.9 | | |
| | 158,300 | | | | | | | Wolverine World
Wide, Inc. | | | 5,046,604 | | | | 0.8 | | |
| | | | | | | | | Other Securities | | | 31,289,919 | | | | 5.0 | | |
| | | | | | | | | | | | | | 91,983,929 | | | | 14.6 | | |
| | | Consumer Staples: 2.0% | | | |
| | 131,800 | | | | | | | Casey's General
Stores, Inc. | | | 5,602,818 | | | | 0.9 | | |
| | | | | | | | | Other Securities | | | 6,887,193 | | | | 1.1 | | |
| | | | | | | | | | | | | | 12,490,011 | | | | 2.0 | | |
| | | Energy: 5.3% | | | |
| | 134,900 | | | | @ | | | Bill Barrett Corp. | | | 5,548,437 | | | | 0.9 | | |
| | 162,615 | | | | @ | | | Carrizo Oil & Gas, Inc. | | | 5,608,591 | | | | 0.9 | | |
| | 73,800 | | | | @ | | | Dril-Quip, Inc. | | | 5,735,736 | | | | 0.9 | | |
| | 371,700 | | | | @ | | | McMoRan
Exploration Co. | | | 6,370,938 | | | | 1.0 | | |
| | 121,900 | | | | @ | | | Unit Corp. | | | 5,665,912 | | | | 0.9 | | |
| | | | | | | | | Other Securities | | | 4,439,465 | | | | 0.7 | | |
| | | | | | | | | | | | | | 33,369,079 | | | | 5.3 | | |
| | | Financials: 14.1% | | | |
| | 161,620 | | | | | | | Cash America
International, Inc. | | | 5,968,627 | | | | 1.0 | | |
| | 311,754 | | | | | | | FirstMerit Corp. | | | 6,169,612 | | | | 1.0 | | |
| | 102,400 | | | | | | | IBERIABANK Corp. | | | 6,054,912 | | | | 1.0 | | |
| | 143,288 | | | | @ | | | Piper Jaffray Cos. | | | 5,016,513 | | | | 0.8 | | |
| | 135,218 | | | | | | | Prosperity
Bancshares, Inc. | | | 5,311,363 | | | | 0.8 | | |
| | 101,354 | | | | @ | | | Stifel Financial Corp. | | | 6,288,002 | | | | 1.0 | | |
| | 107,600 | | | | @ | | | | SVB Financial Group | | | | 5,708,180 | | | | 0.9 | | |
| | | | | | | | | Other Securities | | | 48,132,095 | | | | 7.6 | | |
| | | | | | | | | | | | | | 88,649,304 | | | | 14.1 | | |
| | | Health Care: 10.5% | | | |
| | 349,606 | | | | @ | | | Healthsouth Corp. | | | 7,240,340 | | | | 1.1 | | |
| | 225,000 | | | | @ | | | PSS World
Medical, Inc. | | | 5,085,000 | | | | 0.8 | | |
| | 132,000 | | | | | | | Universal Health
Services, Inc. | | | 5,731,440 | | | | 0.9 | | |
| | | | | | | | | Other Securities | | | 48,317,309 | | | | 7.7 | | |
| | | | | | | | | | | | | | 66,374,089 | | | | 10.5 | | |
| Shares | |
| |
| | Value | | Percent of
Net Assets | |
| | | Industrials: 16.4% | | | |
| | 103,311 | | | | @ | | | Atlas Air Worldwide
Holdings, Inc. | | $ | 5,767,853 | | | | 0.9 | | |
| | 246,900 | | | | | | | Barnes Group, Inc. | | | 5,103,423 | | | | 0.8 | | |
| | 169,300 | | | | | | | Brady Corp. | | | 5,520,873 | | | | 0.9 | | |
| | 317,300 | | | | | | | Heartland Express, Inc. | | | 5,083,146 | | | | 0.8 | | |
| | 85,200 | | | | | | | Regal-Beloit Corp. | | | 5,687,952 | | | | 0.9 | | |
| | 119,500 | | | | @ | | | Teledyne
Technologies, Inc. | | | 5,254,415 | | | | 0.8 | | |
| | 103,300 | | | | | | | Watsco, Inc. | | | 6,516,164 | | | | 1.0 | | |
| | 161,400 | | | | | | | Watts Water
Technologies, Inc. | | | 5,905,626 | | | | 1.0 | | |
| | | | | | | | | Other Securities | | | 58,599,322 | | | | 9.3 | | |
| | | | | | | | | | | | | | 103,438,774 | | | | 16.4 | | |
| | | Information Technology: 17.1% | | | |
| | 371,700 | | | | @ | | | Advanced Energy
Industries, Inc. | | | 5,069,988 | | | | 0.8 | | |
| | 92,900 | | | | @ | | | Anixter
International, Inc. | | | 5,548,917 | | | | 0.9 | | |
| | 99,709 | | | | @ | | | Ansys, Inc. | | | 5,191,848 | | | | 0.8 | | |
| | 240,400 | | | | @ | | | Parametric
Technology Corp. | | | 5,416,212 | | | | 0.9 | | |
| | 174,852 | | | | @ | | | Plexus Corp. | | | 5,409,921 | | | | 0.9 | | |
| | 123,000 | | | | @ | | | Progress Software
Corp. | | | 5,205,360 | | | | 0.8 | | |
| | 385,942 | | | | @ | | | Verigy Ltd. | | | 5,024,965 | | | | 0.8 | | |
| | | | | | | | | Other Securities | | | 70,700,443 | | | | 11.2 | | |
| | | | | | | | | | | | | | 107,567,654 | | | | 17.1 | | |
| | | Materials: 6.0% | | | |
| | 84,000 | | | | | | | Minerals
Technologies, Inc. | | | 5,494,440 | | | | 0.9 | | |
| | 199,800 | | | | | | | Silgan Holdings, Inc. | | | 7,154,838 | | | | 1.1 | | |
| | | | | | | | | Other Securities | | | 25,107,135 | | | | 4.0 | | |
| | | | | | | | | | | | | | 37,756,413 | | | | 6.0 | | |
| | | Telecommunication Services: 1.6% | | | |
| | | | | | | | | Other Securities | | | 9,978,891 | | | | 1.6 | | |
| | | Utilities: 4.0% | | | |
| | 211,500 | | | | | | | Cleco Corp. | | | 6,505,740 | | | | 1.0 | | |
| | 314,000 | | | | | | | Portland General
Electric Co. | | | 6,813,800 | | | | 1.1 | | |
| | | | | | | | | Other Securities | | | 11,912,920 | | | | 1.9 | | |
| | | | | | | | | | | | | | 25,232,460 | | | | 4.0 | | |
| | | | | | | | | Total Common Stock
( Cost $455,279,574 ) | | | 576,840,604 | | | | 91.6 | | |
| REAL ESTATE INVESTMENT TRUSTS: 6.0% | | | |
| | | Financials: 6.0% | | | |
| | 549,744 | | | | @ | | | DiamondRock
Hospitality Co. | | | 6,596,928 | | | | 1.1 | | |
| | 111,300 | | | | | | | Entertainment
Properties Trust | | | 5,147,625 | | | | 0.8 | | |
See Accompanying Notes to Financial Statements
71
SUMMARY PORTFOLIO OF INVESTMENTS
ING SMALL COMPANY PORTFOLIO AS OF DECEMBER 31, 2010 ( CONTINUED)
| Shares | |
| |
| | Value | | Percent of
Net Assets | |
| | | Financials: (continued) | | | |
| | 196,572 | | | | | | | National Retail
Properties, Inc. | | $ | 5,209,158 | | | | 0.8 | | |
| | | | | | | | | Other Securities | | | 20,787,976 | | | | 3.3 | | |
| | | | | | | | | Total Real Estate
Investment Trusts
( Cost $31,376,059 ) | | | 37,741,687 | | | | 6.0 | | |
| EXCHANGE-TRADED FUNDS: 1.7% | | | |
| | | Exchange-Traded Funds: 1.7% | | | |
| | 105,565 | | | | | | | iShares Russell 2000
Index Fund | | | 8,258,350 | | | | 1.7 | | |
| | 31,084 | | | | | | | iShares Russell 2000
Value Index Fund | | | 2,209,762 | | | | | | |
| | | | | | | | | Total Exchange-
Traded Funds
( Cost $8,771,180 ) | | | 10,468,112 | | | | 1.7 | | |
| | | | | | | Total Long-Term
Investments
( Cost $495,426,813 ) | | | 625,050,403 | | | | 99.3 | | |
| SHORT-TERM INVESTMENTS: 2.5% | | | |
| | | Mutual Funds: 1.6% | | | |
| | 10,035,000 | | | | | | | Blackrock Liquidity
Funds TempFund
Portfolio - Class I | | | 10,035,000 | | | | 1.6 | | |
| | | | | | | Total Mutual Funds
( Cost $10,035,000 ) | | | 10,035,000 | | | | 1.6 | | |
| | | Securities Lending Collateralcc: 0.9% | | | |
| | 3,591,410 | | | | | | | BNY Mellon
Overnight
Government Fund (1) | | | 3,591,410 | | | | 0.6 | | |
| | 2,114,770 | | | | R | | | BNY Institutional
Cash Reserves Fund,
Series B (1)(2) | | | 1,691,816 | | | | 0.3 | | |
| | | | | | | Total Securities
Lending Collateral
( Cost $5,706,180 ) | | | 5,283,226 | | | | 0.9 | | |
| | | | | | | Total Short-Term
Investments
( Cost $15,741,180 ) | | | 15,318,226 | | | | 2.5 | | |
| | | | | | | Total Investments in
Securities
( Cost $511,167,993 ) * | | $ | 640,368,629 | | | | 101.8 | | |
| | | | | | | Other Assets and
Liabilities - Net | | | (11,041,134 | ) | | | (1.8 | ) | |
| | | | | | | Net Assets | | $ | 629,327,495 | | | | 100.0 | | |
"Other Securities" represents issues not identified as the top 50 holdings in terms of market value and issues or issuers not exceeding 1% of net assets individually or in aggregate respectively as of December 31, 2010.
The following footnotes apply to either the individual securities noted or one or more of the securities aggregated and listed as a single line item.
@ Non-income producing security
cc Securities purchased with cash collateral for securities loaned.
(1) Collateral received from brokers for securities lending was invested in these short-term investments.
(2) On September 12, 2008, BNY established a separate sleeve of the Institutional Cash Reserves Fund (Series B) to hold certain Lehman Brothers defaulted debt obligations. The Portfolio's position in Series B is being fair valued daily. Please see the accompanying Notes to Financial Statements for additional details on securities lending.
R Restricted security
* Cost for federal income tax purposes is $528,879,294.
| Net unrealized appreciation consists of: | |
| Gross Unrealized Appreciation | | $ | 133,368,609 | | |
| Gross Unrealized Depreciation | | | (21,879,274 | ) | |
| Net Unrealized Appreciation | | $ | 111,489,335 | | |
See Accompanying Notes to Financial Statements
72
SUMMARY PORTFOLIO OF INVESTMENTS
ING SMALL COMPANY PORTFOLIO AS OF DECEMBER 31, 2010 ( CONTINUED)
Fair Value Measurements^
The following is a summary of the fair valuations according to the inputs used as of December 31, 2010 in valuing the Portfolio's assets and liabilities:
| | | Quoted Prices
in Active Markets
for Identical Investments
(Level 1) | | Other
Observable
Inputs
(Level 2) | | Significant
Unobservable
Inputs
(Level 3) | | Fair Value
at
12/31/10 | |
| Asset Table | |
| Investments, at value | |
| Common Stock* | | $ | 576,840,604 | | | $ | — | | | $ | — | | | $ | 576,840,604 | | |
| Real Estate Investment Trusts | | | 37,741,687 | | | | — | | | | — | | | | 37,741,687 | | |
| Exchange-Traded Funds | | | 10,468,112 | | | | — | | | | — | | | | 10,468,112 | | |
| Short-Term Investments | | | 13,626,410 | | | | — | | | | 1,691,816 | | | | 15,318,226 | | |
| Total Investments, at value | | $ | 638,676,813 | | | $ | — | | | $ | 1,691,816 | | | $ | 640,368,629 | | |
The following is a reconciliation of the fair valuations using significant unobservable inputs (Level 3) for the Portfolio's assets and liabilities during the period ended December 31, 2010:
| | | Beginning
Balance
12/31/09 | | Purchases | | Sales | | Accrued
Discounts/
(Premiums) | | Total
Realized
Gain/(Loss) | | Total
Unrealized
Appreciation/
(Depreciation) | | Transfers
Into
Level 3 | | Transfers
Out of
Level 3 | | Ending
Balance at
12/31/10 | |
| Asset Table | |
| Investments, at value | |
Short-Term
Investments | | $ | 1,363,431 | | | $ | — | | | $ | — | | | $ | — | | | $ | — | | | $ | — | | | $ | 328,385 | | | $ | — | | | $ | 1,691,816 | | |
Total Investments,
at value | | $ | 1,363,431 | | | $ | — | | | $ | — | | | $ | — | | | $ | — | | | $ | — | | | $ | 328,385 | | | $ | — | | | $ | 1,691,816 | | |
As of December 31, 2010, total change in unrealized gain (loss) on Level 3 securities still held at period end and included in the change in net assets was $0.
^ See Note 2, "Significant Accounting Policies" in the Notes to Financial Statements for additional information.
Transfers in or out of Level 3 represents either the beginning value (for transfers in), or the ending value (for transfers out) of any security or derivative instrument where a change in the pricing level occurred from the beginning to the end of the period. It is the policy of the Portfolio to recognize transfers at the end of the reporting period.
* For further breakdown of Common Stock by Industry type, please refer to the Portfolio of Investments.
See Accompanying Notes to Financial Statements
73
SUMMARY PORTFOLIO OF INVESTMENTS
ING INTERMEDIATE BOND PORTFOLIO AS OF DECEMBER 31, 2010
Principal
Amount | |
| |
| | Value | | Percent of
Net Assets | |
| CORPORATE BONDS/NOTES: 39.1% | | | |
| | | Consumer Discretionary: 5.1% | | | |
| $ | 9,471,000 | | | | S | | | Comcast Corp.,
5.900%-6.500%,
due 03/15/16-
11/15/17 | | $ | 10,840,221 | | | | 0.4 | | |
| | 1,515,000 | | | | #,S | | | COX Communications,
Inc., 6.250%,
due 06/01/18 | | | 1,694,590 | | | | 0.1 | | |
| | 751,000 | | | | #,S | | | COX Communications,
Inc., 6.950%,
due 06/01/38 | | | 838,124 | | | | | | |
| | 3,376,000 | | | | #,S | | | Cox Enterprises, Inc.,
7.375%,
due 07/15/27 | | | 3,837,246 | | | | 0.2 | | |
| | 8,757,000 | | | | # | | | Hyatt Hotels Corp.,
6.875%,
due 08/15/19 | | | 9,588,959 | | | | 0.4 | | |
| | 7,691,000 | | | | # | | | NBC Universal, Inc.,
2.875%,
due 04/01/16 | | | 7,522,836 | | | | | | |
| | 1,649,000 | | | | # | | | NBC Universal, Inc.,
3.650%,
due 04/30/15 | | | 1,693,053 | | | | 0.5 | | |
| | 2,831,000 | | | | # | | | NBC Universal, Inc.,
5.150%,
due 04/30/20 | | | 2,940,104 | | | | | | |
| | 1,587,000 | | | | # | | | NBC Universal, Inc.,
6.400%,
due 04/30/40 | | | 1,691,085 | | | | | | |
| | 2,660,000 | | | | # | | | QVC, Inc.,
7.500%,
due 10/01/19 | | | 2,812,950 | | | | 0.1 | | |
| | 11,876,000 | | | | S | | | Time Warner
Cable, Inc.,
3.500%-8.750%,
due 02/01/15-
11/15/40 | | | 12,656,490 | | | | 0.5 | | |
| | 9,613,000 | | | | S | | | Time Warner, Inc.,
7.700%,
due 05/01/32 | | | 11,768,119 | | | | 0.5 | | |
| | | | | | | | | Other Securities | | | 61,661,645 | | | | 2.4 | | |
| | | | | | | | | | | | | | 129,545,422 | | | | 5.1 | | |
| | | Consumer Staples: 1.6% | | | |
| | 5,496,000 | | | | # | | | JBS Finance II Ltd.,
8.250%,
due 01/29/18 | | | 5,550,960 | | | | 0.2 | | |
| | 6,555,000 | | | | &, # | | | ServiceMaster Co.,
10.750%,
due 07/15/15 | | | 7,046,625 | | | | 0.3 | | |
| | 5,345,000 | | | | # | | | Smithfield Foods, Inc.,
10.000%,
due 07/15/14 | | | 6,186,838 | | | | 0.2 | | |
| | | | | | | | | Other Securities | | | 21,944,801 | | | | 0.9 | | |
| | | | | | | | | | | | | | 40,729,224 | | | | 1.6 | | |
Principal
Amount | |
| |
| | Value | | Percent of
Net Assets | |
| | | Energy: 4.7% | | | |
| $ | 955,000 | | | | # | | | Consol Energy, Inc.,
8.000%,
due 04/01/17 | | $ | 1,021,850 | | | | 0.1 | | |
| | 955,000 | | | | # | | | Consol Energy, Inc.,
8.250%,
due 04/01/20 | | | 1,036,175 | | | | | | |
| | 8,939,000 | | | | | | | El Paso Pipeline
Partners Operating
Co. LLC, 7.500%,
due 11/15/40 | | | 9,308,789 | | | | 0.4 | | |
| | 8,734,000 | | | | | | | Enterprise Products
Operating LLC,
5.200%-6.450%,
due 09/01/20-
09/01/40 | | | 9,239,307 | | | | 0.4 | | |
| | 1,240,000 | | | | # | | | Gazprom Via Gaz
Capital SA,
5.092%,
due 11/29/15 | | | 1,277,200 | | | | 0.0 | | |
| | 3,174,000 | | | | # | | | KazMunaiGaz
Finance Sub BV,
7.000%,
due 05/05/20 | | | 3,316,830 | | | | 0.1 | | |
| | 9,515,000 | | | | | | | Nexen, Inc.,
7.875%,
due 03/15/32 | | | 10,566,017 | | | | 0.4 | | |
| | 12,909,000 | | | | | | | Occidental Petroleum
Corp., 2.500%,
due 02/01/16 | | | 12,887,740 | | | | 0.5 | | |
| | 2,646,000 | | | | # | | | Odebrecht Drilling
Norbe VIII/IX Ltd.,
6.350%,
due 06/30/21 | | | 2,765,070 | | | | 0.1 | | |
| | 2,530,000 | | | | # | | | Reliance Holdings
USA, Inc., 6.250%,
due 10/19/40 | | | 2,538,228 | | | | 0.1 | | |
| | | | | | | | | Other Securities (a) | | | 65,176,115 | | | | 2.6 | | |
| | | | | | | | | | | | | | 119,133,321 | | | | 4.7 | | |
| | | Financials: 13.6% | | | |
| | 5,016,000 | | | | # | | | Banco Bradesco SA/
Cayman Islands,
5.900%,
due 01/16/21 | | | 5,047,099 | | | | 0.2 | | |
| | 1,980,000 | | | | # | | | Banco de Credito del
Peru, 5.375%,
due 09/16/20 | | | 1,960,200 | | | | 0.1 | | |
| | 16,316,000 | | | | S | | | Bank of America
Corp.,
3.700%-8.000%,
due 09/01/15-
12/29/49 | | | 16,532,426 | | | | 0.7 | | |
| | 5,289,000 | | | | # | | | Barclays Bank PLC,
5.926%,
due 09/29/49 | | | 4,760,100 | | | | | | |
| | 3,234,000 | | | | #,S | | | Barclays Bank PLC,
6.050%,
due 12/04/17 | | | 3,322,104 | | | | 0.4 | | |
| | 2,000,000 | | | | S | | | Barclays Bank PLC,
5.140%,
due 10/14/20 | | | 1,802,846 | | | | | | |
See Accompanying Notes to Financial Statements
74
SUMMARY PORTFOLIO OF INVESTMENTS
ING INTERMEDIATE BOND PORTFOLIO AS OF DECEMBER 31, 2010 ( CONTINUED)
Principal
Amount | |
| |
| | Value | | Percent of
Net Assets | |
| | | Financials (continued) | | | |
| EUR | 25,430,000 | | | | | | | Citibank Credit Card
Issuance Trust,
5.375%,
due 04/11/11 | | $ | 34,250,726 | | | | 1.4 | | |
| $ | 18,173,000 | | | | S | | | Citigroup, Inc.,
4.587%-8.500%,
due 01/15/15-
08/09/20 | | | 20,254,633 | | | | 0.8 | | |
| | 5,491,000 | | | | # | | | Cooperatieve
Centrale Raiffeisen-
Boerenleenbank
BA/Netherlands,
11.000%,
due 12/29/49 | | | 7,118,000 | | | | 0.3 | | |
| | 3,403,000 | | | | #,S | | | Corestates Capital
Trust I, 8.000%,
due 12/15/26 | | | 3,481,116 | | | | 0.1 | | |
| | 3,179,000 | | | | # | | | Fibria Overseas
Finance Ltd.,
7.500%,
due 05/04/20 | | | 3,353,845 | | | | 0.1 | | |
| | 9,876,000 | | | | S | | | Fifth Third Bancorp.,
8.250%,
due 03/01/38 | | | 11,399,225 | | | | 0.5 | | |
| | 18,358,000 | | | | S | | | Goldman Sachs
Group, Inc.,
3.700%-6.250%,
due 08/01/15-
03/15/20 | | | 19,539,652 | | | | 0.8 | | |
| | 6,165,000 | | | | # | | | HSBC Finance Corp.,
6.676%,
due 01/15/21 | | | 6,239,683 | | | | 0.2 | | |
| | 9,712,000 | | | | S | | | HSBC USA, Inc.,
5.000%,
due 09/27/20 | | | 9,418,795 | | | | 0.4 | | |
| | 3,124,000 | | | | # | | | Iberdrola Finance
Ireland Ltd.,
3.800%,
due 09/11/14 | | | 3,112,597 | | | | 0.5 | | |
| | 10,838,000 | | | | # | | | Iberdrola Finance
Ireland Ltd.,
5.000%,
due 09/11/19 | | | 10,410,593 | | | | | | |
| | 3,437,000 | | | | # | | | International Lease
Finance Corp.,
7.125%,
due 09/01/18 | | | 3,668,998 | | | | 0.5 | | |
| | 9,616,000 | | | | S | | | International Lease
Finance Corp.,
5.650%-8.250%,
due 11/15/13-
12/15/20 | | | 9,809,570 | | | | | | |
| | 3,734,000 | | | | | | | JPMorgan Chase
Bank NA, 5.875%,
due 06/13/16 | | | 4,088,681 | | | | 0.2 | | |
| | 1,099,000 | | | | # | | | LBI Escrow Corp.,
8.000%,
due 11/01/17 | | | 1,218,516 | | | | 0.0 | | |
| | 5,440,000 | | | | # | | | Lukoil International
Finance BV,
6.125%,
due 11/09/20 | | | 5,473,728 | | | | 0.2 | | |
Principal
Amount | |
| |
| | Value | | Percent of
Net Assets | |
| $ | 9,571,000 | | | | S | | | Morgan Stanley,
3.450%-4.100%,
due 01/26/15-
11/02/15 | | $ | 9,571,273 | | | | 0.4 | | |
| | 8,064,000 | | | | S | | | National City
Preferred Capital
Trust I, 12.000%,
due 12/29/49 | | | 9,090,475 | | | | 0.4 | | |
| | 5,301,000 | | | | # | | | Pacific Life
Insurance Co.,
9.250%,
due 06/15/39 | | | 6,971,292 | | | | 0.3 | | |
| | 299,307 | | | | #,S | | | Power Receivable
Finance, LLC,
6.290%,
due 01/01/12 | | | 299,543 | | | | 0.0 | | |
| | 2,410,000 | | | | # | | | Reynolds Group
DL Escrow, Inc./
Reynolds Group
Escrow LLC,
7.750%,
due 10/15/16 | | | 2,560,625 | | | | 0.1 | | |
| | 3,726,000 | | | | # | | | Voto-Votorantim Ltd.,
6.750%,
due 04/05/21 | | | 3,912,300 | | | | 0.2 | | |
| | 2,657,000 | | | | # | | | Xstrata Finance
Canada Ltd.,
5.500%,
due 11/16/11 | | | 2,758,402 | | | | 0.1 | | |
| | | | | | | | | Other Securities (a) | | | 119,333,786 | | | | 4.7 | | |
| | | | | | | | | | | | | | 340,760,829 | | | | 13.6 | | |
| | | Health Care: 1.7% | | | |
| | 10,094,000 | | | | S | | | St. Jude Medical,
Inc., 2.500%,
due 01/15/16 | | | 9,975,628 | | | | 0.4 | | |
| | | | | | | | | Other Securities | | | 32,724,506 | | | | 1.3 | | |
| | | | | | | | | | | | | | 42,700,134 | | | | 1.7 | | |
| | | Industrials: 1.6% | | | |
| | 2,835,000 | | | | # | | | Bombardier, Inc.,
7.500%,
due 03/15/18 | | | 3,054,713 | | | | 0.2 | | |
| | 2,835,000 | | | | # | | | Bombardier, Inc.,
7.750%,
due 03/15/20 | | | 3,068,888 | | | | | | |
| | 8,169,000 | | | | S | | | General Electric Co.,
5.250%,
due 12/06/17 | | | 8,836,146 | | | | 0.4 | | |
| | 2,300,000 | | | | # | | | Kazatomprom,
6.250%,
due 05/20/15 | | | 2,449,500 | | | | 0.3 | | |
| | 4,260,000 | | | | | | | Kazatomprom,
6.250%,
due 05/20/15 | | | 4,536,900 | | | | | | |
| | 8,206,000 | | | | S | | | RR Donnelley &
Sons Co.,
7.625%-8.600%,
due 08/15/16-
06/15/20 | | | 9,237,841 | | | | 0.4 | | |
| | | | | | | | | Other Securities | | | 8,825,633 | | | | 0.3 | | |
| | | | | | | | | | | | | | 40,009,621 | | | | 1.6 | | |
See Accompanying Notes to Financial Statements
75
SUMMARY PORTFOLIO OF INVESTMENTS
ING INTERMEDIATE BOND PORTFOLIO AS OF DECEMBER 31, 2010 ( CONTINUED)
Principal
Amount | |
| |
| | Value | | Percent of
Net Assets | |
| | | Information Technology: 1.1% | | | |
| $ | | | | | | | | Other Securities | | $ | 26,697,695 | | | | 1.1 | | |
| | | Materials: 3.8% | | | |
| | 5,400,000 | | | | # | | | ALROSA Finance SA,
7.750%,
due 11/03/20 | | | 5,690,250 | | | | 0.2 | | |
| | 11,408,000 | | | | S | | | ArcelorMittal,
5.250%-9.850%,
due 06/01/19-
08/05/20 | | | 12,917,215 | | | | 0.5 | | |
| | 2,116,000 | | | | # | | | Chevron Phillips
Chemical Co. LLC,
7.000%,
due 06/15/14 | | | 2,400,687 | | | | 0.3 | | |
| | 3,442,000 | | | | # | | | Chevron Phillips
Chemical Co. LLC,
8.250%,
due 06/15/19 | | | 4,158,339 | | | | | | |
| | 12,402,000 | | | | S | | | Dow Chemical Co.,
4.250%-7.600%,
due 05/15/14-
11/15/20 | | | 12,850,329 | | | | 0.5 | | |
| | 1,585,000 | | | | # | | | Georgia-Pacific LLC,
5.400%,
due 11/01/20 | | | 1,570,009 | | | | 0.1 | | |
| | 3,755,000 | | | | # | | | Gerdau Trade, Inc.,
5.750%,
due 01/30/21 | | | 3,783,163 | | | | 0.1 | | |
| | 5,864,000 | | | | # | | | Gold Fields Ltd.,
4.875%,
due 10/07/20 | | | 5,620,404 | | | | 0.2 | | |
| | 3,590,000 | | | | # | | | Inversiones CMPC SA,
6.125%,
due 11/05/19 | | | 3,832,203 | | | | 0.2 | | |
| | | | | | | Other Securities | | | 41,551,698 | | | | 1.7 | | |
| | | | | | | | | | | | | | 94,374,297 | | | | 3.8 | | |
| | | Telecommunication Services: 2.2% | | | |
| | 4,723,000 | | | | # | | | Intelsat Subsidiary
Holding Co., Ltd.,
8.875%,
due 01/15/15 | | | 4,852,883 | | | | 0.2 | | |
| | 3,374,000 | | | | # | | | Qtel International
Finance Ltd.,
4.750%,
due 02/16/21 | | | 3,231,752 | | | | 0.1 | | |
| | 3,140,000 | | | | # | | | Qwest Communications
International, Inc.,
7.125%,
due 04/01/18 | | | 3,265,600 | | | | 0.2 | | |
| | 2,508,000 | | | | S | | | Qwest Communications
International, Inc.,
7.500%,
due 02/15/14 | | | 2,551,890 | | | | | | |
| | | | | | | | | Other Securities | | | 41,677,632 | | | | 1.7 | | |
| | | | | | | | | | | | | | 55,579,757 | | | | 2.2 | | |
Principal
Amount | |
| |
| | Value | | Percent of
Net Assets | |
| | | Utilities: 3.7% | | | |
| $ | 3,604,000 | | | | # | | | Allegheny Energy
Supply Co. LLC,
5.750%,
due 10/15/19 | | $ | 3,633,773 | | | | 0.1 | | |
| | 4,255,000 | | | | # | | | Calpine Corp.,
7.500%,
due 02/15/21 | | | 4,212,450 | | | | 0.2 | | |
| | 3,957,000 | | | | # | | | Duquesne Light
Holdings, Inc.,
6.400%,
due 09/15/20 | | | 3,934,556 | | | | 0.2 | | |
| | 1,825,000 | | | | # | | | E.CL SA, 5.625%,
due 01/15/21 | | | 1,817,080 | | | | 0.1 | | |
| | 3,810,000 | | | | # | | | EDP Finance BV,
4.900%,
due 10/01/19 | | | 3,253,325 | | | | 0.2 | | |
| | 3,166,000 | | | | # | | | EDP Finance BV,
6.000%,
due 02/02/18 | | | 2,963,344 | | | | | | |
| | 5,418,000 | | | | # | | | Enel Finance
International S.A.,
6.000%,
due 10/07/39 | | | 4,875,599 | | | | 0.3 | | |
| | 3,176,000 | | | | # | | | Enel Finance
International S.A.,
6.250%,
due 09/15/17 | | | 3,473,601 | | | | | | |
| | 553,929 | | | | #,S | | | Juniper Generation,
LLC, 6.790%,
due 12/31/14 | | | 522,494 | | | | 0.0 | | |
| | 7,572,000 | | | | S | | | Oncor Electric
Delivery Co. LLC,
7.000%-7.500%,
due 05/01/32-
09/01/38 | | | 9,000,728 | | | | 0.4 | | |
| | | | | | | | | Other Securities | | | 54,470,901 | | | | 2.2 | | |
| | | | | | | | | | | | | | 92,157,851 | | | | 3.7 | | |
| | | | | | | | | Total Corporate
Bonds/Notes
( Cost $929,092,602 ) | | | 981,688,151 | | | | 39.1 | | |
| U.S. GOVERNMENT AGENCY OBLIGATIONS: 27.0% | | | | | |
| | | Federal Home Loan Mortgage
Corporation##: 10.1% | | | |
| | 46,352,000 | | | | W | | | 4.000%,
due 08/15/40 | | | 46,026,099 | | | | | | |
| | 37,280,177 | | | | S | | | 5.000%,
due 08/15/16-
02/15/35 | | | 39,326,833 | | | | | | |
| | 103,793,258 | | | | S | | | 5.500%,
due 08/15/20-
07/15/37 | | | 110,897,166 | | | | 10.1 | | |
| | 17,008,000 | | | | W | | | 6.000%,
due 01/15/39 | | | 18,424,460 | | | | | | |
| | 18,243,703 | | | | S | | | 6.000%,
due 01/15/29-
04/15/36 | | | 20,066,380 | | | | | | |
| | 70,191,822 | | | | W,S, ^ | | | 3.360%-7.500%,
due 05/15/17-
02/15/40 | | | 19,086,723 | | | | | | |
| | | | | | | | | | | | | | 253,827,661 | | | | 10.1 | | |
See Accompanying Notes to Financial Statements
76
SUMMARY PORTFOLIO OF INVESTMENTS
ING INTERMEDIATE BOND PORTFOLIO AS OF DECEMBER 31, 2010 ( CONTINUED)
Principal
Amount | |
| |
| | Value | | Percent of
Net Assets | |
| | | Federal National Mortgage
Association##: 13.6% | | | |
| $ | 35,924,000 | | | | W | | | 4.000%,
due 08/25/40 | | $ | 35,744,380 | | | | | | |
| | 78,445,000 | | | | W | | | 4.500%,
due 01/25/39 | | | 80,540,972 | | | | | | |
| | 36,191,531 | | | | | | | 4.500%,
due 09/01/40-
11/01/40 | | �� | 37,194,639 | | | | | | |
| | 14,119,000 | | | | W | | | 5.000%,
due 01/13/40 | | | 14,844,801 | | | | | | |
| | 54,007,473 | | | | S | | | 5.000%,
due 12/01/23-
11/01/40 | | | 57,080,096 | | | | 13.6 | | |
| | 24,300,301 | | | | S | | | 5.500%,
due 11/01/16-
06/01/37 | | | 25,972,896 | | | | | | |
| | 28,136,418 | | | | S | | | 6.000%,
due 06/01/16-
12/25/49 | | | 30,993,533 | | | | | | |
| | 16,387,000 | | | | W | | | 6.500%,
due 01/15/32-
01/15/39 | | | 18,176,054 | | | | | | |
| | 9,595,458 | | | | S | | | 7.000%,
due 08/01/25-
04/01/38 | | | 10,875,117 | | | | | | |
| | 129,017,729 | | | | S, ^ | | | 2.277%-27.557%,
due 11/01/18-
03/25/38 | | | 31,733,299 | | | | | | |
| | | | | | | | | | | | | | 343,155,787 | | | | 13.6 | | |
| | | Government National Mortgage
Association: 3.3% | | | |
| | 23,268,000 | | | | W | | | 4.000%,
due 09/15/40 | | | 23,344,342 | | | | | | |
| | 9,385,797 | | | | | | | 4.500%,
due 04/15/39-
01/20/40 | | | 9,795,151 | | | | 3.3 | | |
| | 239,714,980 | | | | S, ^ | | | 3.125%-7.500%,
due 04/15/22-
10/20/60 | | | 49,251,241 | | | | | | |
| | | | | | | | | | | | | | 82,390,734 | | | | 3.3 | | |
| | | | | | | | | Total U.S. Government
Agency Obligations
( Cost $649,005,019 ) | | | 679,374,182 | | | | 27.0 | | |
| U.S. TREASURY OBLIGATIONS: 11.7% | | | | | |
| | | U.S. Treasury Notes: 11.7% | | | |
| | 12,267,000 | | | | | | | 0.625%,
due 12/31/12 | | | 12,275,624 | | | | | | |
| | 34,937,000 | | | | L | | | 0.750%,
due 12/15/13 | | | 34,694,083 | | | | | | |
| | 42,316,000 | | | | | | | 2.250%,
due 11/30/17 | | | 41,155,611 | | | | 11.7 | | |
| | 9,796,000 | | | | | | | 2.500%,
due 04/30/15 | | | 10,128,917 | | | | | | |
| | 42,160,000 | | | | | | | 2.625%,
due 11/15/20 | | | 39,775,346 | | | | | | |
| | 9,830,000 | | | | | | | 2.750%,
due 12/31/17 | | | 9,853,042 | | | | | | |
Principal
Amount | |
| |
| | Value | | Percent of
Net Assets | |
| $ | 48,589,000 | | | | | | | 3.375%,
due 11/15/19 | | $ | 49,610,146 | | | | 11.7 | | |
| | 103,088,000 | | | | S | | | 3.875%,
due 08/15/40 | | | 94,969,820 | | | | | | |
| | 1,902,000 | | | | | | | 2.125%,
due 12/31/15 | | | 1,912,402 | | | | | | |
| | | | | | | | | Total U.S. Treasury
Obligations
( Cost $296,126,187 ) | | | 294,374,991 | | | | 11.7 | | |
| ASSET-BACKED SECURITIES: 9.9% | | | |
| | | Automobile Asset-Backed Securities: 1.0% | | | |
| | 5,424,000 | | | | # | | | Chrysler Financial
Auto Securitization
Trust, 5.570%,
due 08/08/14 | | | 5,640,803 | | | | | | |
| | 5,738,000 | | | | # | | | Chrysler Financial
Auto Securitization
Trust, 6.250%,
due 05/08/14 | | | 5,985,968 | | | | 0.9 | | |
| | 11,297,000 | | | | # | | | Chrysler Financial
Auto Securitization
Trust, 6.540%,
due 11/10/14 | | | 11,769,448 | | | | | | |
| | | | | | | | | Other Securities | | | 919,596 | | | | 0.1 | | |
| | | | | | | | | | | | | | 24,315,815 | | | | 1.0 | | |
| | | Credit Card Asset-Backed Securities: | | 7.3% | |
| | 10,122,000 | | | | | | | Capital One
Multi-Asset
Execution Trust,
0.320%,
due 07/15/16 | | | 10,015,627 | | | | | | |
| | 15,892,000 | | | | | | | Capital One
Multi-Asset
Execution Trust,
0.550%,
due 03/17/14 | | | 15,807,825 | | | | | | |
| | 10,706,000 | | | | | | | Capital One
Multi-Asset
Execution Trust,
5.050%,
due 12/17/18 | | | 11,885,931 | | | | 3.3 | | |
| | 16,710,000 | | | | | | | Capital One
Multi-Asset
Execution Trust,
5.750%,
due 07/15/20 | | | 19,015,536 | | | | | | |
| | 27,245,000 | | | | | | | Capital One
Multi-Asset
Execution Trust,
0.320%-5.050%,
due 08/15/14-
06/17/19 | | | 27,095,907 | | | | | | |
| | 9,753,000 | | | | | | | Citibank Credit Card
Issuance Trust,
0.910%,
due 07/15/13 | | | 9,704,060 | | | | 1.7 | | |
| | 15,935,000 | | | | | | | Citibank Credit Card
Issuance Trust,
6.300%,
due 06/20/14 | | | 16,863,024 | | | | | | |
See Accompanying Notes to Financial Statements
77
SUMMARY PORTFOLIO OF INVESTMENTS
ING INTERMEDIATE BOND PORTFOLIO AS OF DECEMBER 31, 2010 ( CONTINUED)
Principal
Amount | |
| |
| | Value | | Percent of
Net Assets | |
| | | Credit Card Asset-Backed Securities (continued) | | | |
| $ | 13,505,000 | | | | S | | | Citibank Credit Card
Issuance Trust,
6.950%,
due 02/18/14 | | $ | 14,225,246 | | | | 1.7 | | |
| | 2,248,000 | | | | | | | Citibank Credit Card
Issuance Trust,
0.670%-5.700%,
due 05/15/13-
07/15/14 | | | 2,283,576 | | | | | | |
| EUR | 27,084,000 | | | | | | | MBNA Credit Card
Master Note Trust,
5.600%,
due 07/17/14 | | | 37,506,054 | | | | | | |
| $ | 10,176,000 | | | | | | | MBNA Credit Card
Master Note Trust,
6.800%,
due 07/15/14 | | | 10,710,165 | | | | 2.0 | | |
| | 2,130,000 | | | | | | | MBNA Credit Card
Master Note Trust,
0.680%-1.610%,
due 10/15/14-
07/15/15 | | | 2,095,006 | | | | | | |
| | 3,461,000 | | | | # | | | MBNA Master
Credit Card Trust,
7.100%,
due 09/15/13 | | | 3,516,332 | | | | 0.2 | | |
| | | | | | | | | Other Securities | | | 2,559,846 | | | | 0.1 | | |
| | | | | | | | | | | | | | 183,284,135 | | | | 7.3 | | |
| | | Home Equity Asset-Backed Securities: 0.1% | | | |
| | | | | | | | | Other Securities | | | 2,937,285 | | | | 0.1 | | |
| | | Other Asset-Backed Securities: 1.5% | | | |
| | 6,055,434 | | | | # | | | Atrium CDO Corp.,
0.622%,
due 10/27/16 | | | 5,722,385 | | | | 0.2 | | |
| | 3,741,100 | | | | # | | | Callidus Debt Partners
Fund Ltd.,
0.786%,
due 05/15/15 | | | 3,610,162 | | | | 0.1 | | |
| | 4,024,654 | | | | #,S | | | Carlyle High Yield
Partners, 0.656%,
due 08/11/16 | | | 3,769,789 | | | | 0.2 | | |
| | 3,360,000 | | | | #,S | | | Credit-Based Asset
Servicing and
Securitization, LLC,
5.746%,
due 12/25/37 | | | 3,332,957 | | | | | | |
| | 2,876,000 | | | | #,S | | | Credit-Based Asset
Servicing and
Securitization, LLC,
6.020%,
due 12/25/37 | | | 2,476,846 | | | | 0.4 | | |
| | 4,548,789 | | | | S | | | Credit-Based Asset
Servicing and
Securitization, LLC,
4.831%-5.501%,
due 08/25/35-
12/25/36 | | | 4,078,643 | | | | | | |
Principal
Amount | |
| |
| | Value | | Percent of
Net Assets | |
| $ | 4,454,640 | | | | # | | | First CLO Ltd.,
0.638%,
due 07/27/16 | | $ | 4,349,956 | | | | 0.2 | | |
| | 6,133,574 | | | | # | | | GSC Partners CDO
Fund Ltd.,
0.664%,
due 11/20/16 | | | 5,872,897 | | | | 0.2 | | |
| | | | | | | | | Other Securities | | | 4,990,930 | | | | 0.2 | | |
| | | | | | | | | | | | | | 38,204,565 | | | | 1.5 | | |
| | | | | | | | | Total Asset-Backed
Securities
( Cost $252,555,729 ) | | | 248,741,800 | | | | 9.9 | | |
| COLLATERALIZED MORTGAGE OBLIGATIONS: 13.8% | | | |
| | 8,665,000 | | | | # | | | American General
Mortgage Loan
Trust, 5.750%,
due 09/25/48 | | | 8,795,954 | | | | 0.3 | | |
| | 4,529,573 | | | | # | | | Banc of America
Large Loan, Inc.,
5.334%,
due 12/16/43 | | | 4,687,305 | | | | | | |
| | 2,730,658 | | | | # | | | Banc of America
Large Loan, Inc.,
5.721%,
due 10/10/45 | | | 2,673,830 | | | | 0.4 | | |
| | 3,060,000 | | | | # | | | Banc of America
Large Loan, Inc.,
5.816%,
due 10/10/45 | | | 2,981,979 | | | | | | |
| | 2,200,000 | | | | # | | | Bear Stearns
Commercial
Mortgage Securities,
6.000%,
due 07/15/31 | | | 2,317,638 | | | | 0.5 | | |
| | 2,269,000 | | | | # | | | Bear Stearns
Commercial
Mortgage Securities,
6.500%,
due 02/15/32 | | | 2,239,996 | | | | | | |
| | 6,654,000 | | | | | | | Bear Stearns
Commercial
Mortgage Securities,
8.050%-8.264%,
due 10/15/32 | | | 7,098,718 | | | | | | |
| | 8,584,000 | | | | S | | | Citigroup Commercial
Mortgage Trust,
5.698%,
due 12/10/49 | | | 9,189,564 | | | | 0.4 | | |
| | 186,135,708 | | | | #,S, ^ | | | Citigroup/Deutsche
Bank Commercial
Mortgage Trust,
0.124%,
due 12/11/49 | | | 1,684,268 | | | | 0.1 | | |
| | 1,970,000 | | | | | | | Citigroup/Deutsche
Bank Commercial
Mortgage Trust,
5.222%,
due 07/15/44 | | | 1,921,129 | | | | | | |
| | 4,496,579 | | | | #,S, ^ | | | Commercial
Mortgage Asset
Trust, 0.840%,
due 01/17/32 | | | 86,849 | | | | 0.0 | | |
See Accompanying Notes to Financial Statements
78
SUMMARY PORTFOLIO OF INVESTMENTS
ING INTERMEDIATE BOND PORTFOLIO AS OF DECEMBER 31, 2010 ( CONTINUED)
Principal
Amount | |
| |
| | Value | | Percent of
Net Assets | |
| COLLATERALIZED MORTGAGE OBLIGATIONS (continued) | | | |
| $ | 10,492,000 | | | | # | | | Commercial Mortgage
Pass-Through
Certificates, 5.449%,
due 02/05/19 | | $ | 10,537,319 | | | | | | |
| | 6,105,000 | | | | #,S | | | Commercial Mortgage
Pass-through
Certificates, 0.761%,
due 07/16/34 | | | 6,093,191 | | | | 0.8 | | |
| | 3,000,000 | | | | # | | | Commercial Mortgage
Pass-through
Certificates, 6.609%,
due 02/16/34 | | | 3,000,248 | | | | | | |
| | 207,921,685 | | | | #, ^ | | | Credit Suisse First
Boston Mortgage
Securities Corp.,
0.143%,
due 02/15/38 | | | 1,948,372 | | | | 0.1 | | |
| | 1,232,000 | | | | | | | Credit Suisse First
Boston Mortgage
Securities Corp.,
6.133%,
due 04/15/37 | | | 1,283,459 | | | | | | |
| | 400,755,253 | | | | #, ^ | | | Credit Suisse Mortgage
Capital Certificates,
0.126%,
due 09/15/40 | | | 2,613,325 | | | | 0.3 | | |
| | 4,320,000 | | | | #,S | | | Credit Suisse Mortgage
Capital Certificates,
5.342%,
due 12/15/43 | | | 4,506,821 | | | | | | |
| | 1,980,000 | | | | # | | | GE Capital Commercial
Mortgage Corp.,
6.024%,
due 12/10/37 | | | 2,036,588 | | | | 0.1 | | |
| | 304,483,366 | | | | #, ^ | | | Greenwich Capital
Commercial Funding
Corp., 0.310%,
due 03/10/39 | | | 4,131,383 | | | | | | |
| | 12,455,000 | | | | S | | | Greenwich Capital
Commercial Funding
Corp., 5.444%,
due 03/10/39 | | | 13,140,944 | | | | 1.4 | | |
| | 10,823,061 | | | | S | | | Greenwich Capital
Commercial Funding
Corp., 5.736%,
due 12/10/49 | | | 11,454,091 | | | | | | |
| | 6,371,000 | | | | S | | | Greenwich Capital
Commercial Funding
Corp., 5.224%-5.475%,
due 04/10/37-
03/10/39 | | | 6,723,978 | | | | | | |
| | 5,209,000 | | | | # | | | GS Mortgage
Securities Corp. II,
6.055%,
due 07/12/38 | | | 5,255,913 | | | | 0.2 | | |
| | 6,300,000 | | | | # | | | JPMorgan Chase
Commercial
Mortgage
Securities Corp.,
4.070%,
due 11/15/43 | | | 6,003,550 | | | | 2.1 | | |
Principal
Amount | |
| |
| | Value | | Percent of
Net Assets | |
| $ | 15,557,008 | | | | | | | JPMorgan Chase
Commercial
Mortgage
Securities Corp.,
5.989%,
due 02/15/51 | | $ | 16,313,972 | | | | | | |
| | 2,000,000 | | | | # | | | JPMorgan Chase
Commercial
Mortgage
Securities Corp.,
6.047%,
due 03/12/39 | | | 2,028,627 | | | | 2.1 | | |
| | 1,980,000 | | | | # | | | JPMorgan Chase
Commercial
Mortgage
Securities Corp.,
6.335%,
due 07/12/37 | | | 1,917,437 | | | | | | |
| | 767,487,945 | | | | S, ^ | | | JPMorgan Mortgage
Trust, 0.153%-5.388%,
due 07/25/35-
02/15/51 | | | 26,017,838 | | | | | | |
| | 134,476,264 | | | | #, ^ | | | LB-UBS Commercial
Mortgage Trust,
0.248%,
due 09/15/39 | | | 2,334,145 | | | | | | |
| | 44,954,355 | | | | #, ^ | | | LB-UBS Commercial
Mortgage Trust,
0.324%,
due 11/15/38 | | | 727,173 | | | | | | |
| | 191,477,715 | | | | #, ^ | | | LB-UBS Commercial
Mortgage Trust,
0.715%,
due 11/15/38 | | | 5,128,692 | | | | 1.7 | | |
| | 2,000,000 | | | | # | | | LB-UBS Commercial
Mortgage Trust,
5.296%,
due 09/15/37 | | | 2,035,112 | | | | | | |
| | 93,061,058 | | | | S, ^ | | | LB-UBS Commercial
Mortgage Trust,
0.175%-5.901%,
due 06/15/38-
11/15/40 | | | 32,820,486 | | | | | | |
| | 163,807,143 | | | | #, ^ | | | Merrill Lynch
Mortgage Trust,
0.554%,
due 02/12/51 | | | 3,532,272 | | | | 0.1 | | |
| | 10,067,758 | | | | S | | | Morgan Stanley
Capital I,
5.598%-5.685%,
due 07/12/44-
04/12/49 | | | 10,508,387 | | | | 0.4 | | |
| | 1,870,000 | | | | # | | | Morgan Stanley
Dean Witter
Capital I, 6.979%,
due 10/15/35 | | | 1,883,386 | | | | 0.2 | | |
| | 3,840,000 | | | | # | | | Morgan Stanley
Dean Witter
Capital I, 7.280%,
due 12/15/35 | | | 4,072,314 | | | | | | |
| | 49,774,311 | | | | #, ^ | | | RBSCF Trust,
1.004%,
due 04/15/24 | | | 1,463,439 | | | | 0.6 | | |
See Accompanying Notes to Financial Statements
79
SUMMARY PORTFOLIO OF INVESTMENTS
ING INTERMEDIATE BOND PORTFOLIO AS OF DECEMBER 31, 2010 (CONTINUED)
Principal
Amount | |
| |
| | Value | | Percent of
Net Assets | |
| COLLATERALIZED MORTGAGE OBLIGATIONS (continued) | | | |
| $ | 7,721,000 | | | | # | | | RBSCF Trust,
5.336%,
due 05/16/47 | | $ | 7,535,561 | | | | 0.6 | | |
| | 6,236,000 | | | | # | | | RBSCF Trust,
5.420%,
due 01/19/49 | | | 6,076,963 | | | | | | |
| | 6,600,000 | | | | # | | | Vornado DP LLC,
5.280%,
due 09/13/28 | | | 6,486,941 | | | | 0.5 | | |
| | 4,940,000 | | | | # | | | Vornado DP LLC,
6.356%,
due 09/13/28 | | | 4,930,329 | | | | | | |
| | 3,960,000 | | | | # | | | Wachovia Bank
Commercial
Mortgage Trust,
5.125%,
due 08/15/35 | | | 4,006,999 | | | | | | |
| | 676,000 | | | | # | | | Wachovia Bank
Commercial
Mortgage Trust,
5.125%,
due 08/15/35 | | | 659,240 | | | | 0.6 | | |
| | 9,870,000 | | | | | | | Wachovia Bank
Commercial
Mortgage Trust,
5.342%,
due 12/15/43 | | | 9,990,453 | | | | | | |
| | 6,060,000 | | | | # | | | Wells Fargo
Commercial
Mortgage Trust,
4.393%,
due 11/15/43 | | | 6,004,466 | | | | 0.2 | | |
| | 6,487,133 | | | | #,S | | | Wells Fargo
Mortgage-Backed
Securities Trust,
5.283%,
due 06/26/35 | | | 6,408,081 | | | | 1.2 | | |
| | 23,632,922 | | | | S | | | Wells Fargo
Mortgage-Backed
Securities Trust,
2.844%-5.095%,
due 12/25/33-
11/25/36 | | | 23,544,036 | | | | | | |
| | | | | | | | | Other Securities (d) | | | 39,183,670 | | | | 1.6 | | |
| | | | | | | | | Total Collateralized
Mortgage
Obligations
( Cost $344,245,440 ) | | | 348,016,431 | | | | 13.8 | | |
| MUNICIPAL BONDS: 0.1% | | | |
| | | Louisiana: 0.1% | | | |
| | | | | | | | | Other Securities | | | 3,510,184 | | | | 0.1 | | |
| | | | | | | | | Total Municipal Bonds
( Cost $3,513,994 ) | | | 3,510,184 | | | | 0.1 | | |
Principal
Amount | |
| |
| | Value | | Percent of
Net Assets | |
| OTHER BONDS: 5.7% | | | |
| | | Foreign Government Bonds: | | 5.7% | |
| BRL | 114,067,000 | | | | | | | Brazil Notas do
Tesouro Nacional
Series F, 10.000%,
due 01/01/14 | | $ | 65,049,455 | | | | 2.6 | | |
| MXN | 424,640,000 | | | | | | | Mexican Bonos,
8.000%,
due 06/11/20 | | | 36,996,975 | | | | 1.5 | | |
| ZAR | 278,669,523 | | | | | | | South Africa
Government
International
Bond, 7.250%,
due 01/15/20 | | | 40,021,681 | | | | 1.6 | | |
| | | | | | | | | Total Other Bonds
( Cost $138,001,361 ) | | | 142,068,111 | | | | 5.7 | | |
| Shares | |
| |
| | Value | | Percent of
Net Assets | |
| PREFERRED STOCK: 0.2% | | | |
| | | Financials: 0.2% | | | |
| | | | | | | | | Other Securities | | $ | 5,987,237 | | | | 0.2 | | |
| | | | | | | | | Total Preferred Stock
( Cost $5,656,875 ) | | | 5,987,237 | | | | 0.2 | | |
| | | | | | | | | Total Long-Term
Investments
( Cost $2,618,197,207 ) | | | 2,703,761,087 | | | | 107.5 | | |
| SHORT-TERM INVESTMENTS: 2.1% | | | |
| | | Mutual Funds: 1.8% | | | |
| | 45,000,000 | | | | | | | Blackrock Liquidity
Funds TempFund
Portfolio - Class I | | | 45,000,000 | | | | 1.8 | | |
| | | | | | | | | Total Mutual Funds
( Cost $45,000,000 ) | | | 45,000,000 | | | | 1.8 | | |
| | | Securities Lending Collateralcc: 0.3% | | | |
| | 621,621 | | | | | | | BNY Mellon
Overnight
Government Fund (1) | | | 621,621 | | | | 0.0 | | |
| | 9,207,559 | | | | R | | | BNY Institutional
Cash Reserves Fund,
Series B (1)(2) | | | 7,366,047 | | | | 0.3 | | |
| | | | | | | | | Total Securities
Lending Collateral
( Cost $9,829,180 ) | | | 7,987,668 | | | | 0.3 | | |
| | | | | | | | | Total Short-Term
Investments
( Cost $54,829,180 ) | | | 52,987,668 | | | | 2.1 | | |
| | | | | | | | | Total Investments in
Securities
( Cost $2,673,026,387 ) * | | $ | 2,756,748,755 | | | | 109.6 | | |
| | | | | | | | | Other Assets and
Liabilities - Net | | | (242,419,154 | ) | | | (9.6 | ) | |
| | | | | | | | | Net Assets | | $ | 2,514,329,601 | | | | 100.0 | | |
See Accompanying Notes to Financial Statements
80
SUMMARY PORTFOLIO OF INVESTMENTS
ING INTERMEDIATE BOND PORTFOLIO AS OF DECEMBER 31, 2010 (CONTINUED)
"Other Securities" represents issues not identified as the top 50 holdings in terms of market value and issues or issuers not exceeding 1% of net assets individually or in aggregate respectively as of December 31, 2010.
The following footnotes apply to either the individual securities noted or one or more of the securities aggregated and listed as a single line item.
& Payment-in-kind
# Securities with purchases pursuant to Rule 144A or section 4(2), under the Securities Act of 1933 and may not be resold subject to that rule except to qualified institutional buyers. Unless otherwise noted, these securities have been determined to be liquid under the guidelines established by the Funds' Board of Directors/Trustees.
cc Securities purchased with cash collateral for securities loaned.
(1) Collateral received from brokers for securities lending was invested in these short-term investments.
(2) On September 12, 2008, BNY established a separate sleeve of the Institutional Cash Reserves Fund (Series B) to hold certain Lehman Brothers defaulted debt obligations. The Portfolio's position in Series B is being fair valued daily. Please see the accompanying Notes to Financial Statements for additional details on securities lending.
## On September 7, 2008, the Federal Housing Finance Agency placed the Federal National Mortgage Association and the Federal Home Loan Mortgage Corporation into conservatorship and the U.S. Treasury guaranteed the debt issued by those organizations.
W Settlement is on a when-issued or delayed-delivery basis.
R Restricted security
L Loaned security, a portion or all of the security is on loan at December 31, 2010.
S All or a portion of this security has been identified by the Fund to cover future collateral requirements for applicable futures, options, swaps, foreign currency contracts and/or when-issued or delayed-delivery securities.
^ Interest only securities represent the right to receive the monthly interest payments on an underlying pool of mortgage loans. Principal amount shown represents the notional amount on which current interest is calculated. Payments of principal on the pool reduce the value of the interest only security.
BRL Brazilian Real
EUR EU Euro
MXN Mexican Peso
ZAR South African Rand
(a) The grouping contains securities in default.
(d) The grouping contains Interest only securities.
* Cost for federal income tax purposes is $2,676,120,317.
| Net unrealized appreciation consists of: | |
| Gross Unrealized Appreciation | | $ | 121,302,974 | | |
| Gross Unrealized Depreciation | | | (40,674,536 | ) | |
| Net Unrealized Appreciation | | $ | 80,628,438 | | |
See Accompanying Notes to Financial Statements
81
SUMMARY PORTFOLIO OF INVESTMENTS
ING INTERMEDIATE BOND PORTFOLIO AS OF DECEMBER 31, 2010 ( CONTINUED)
Fair Value Measurements^
The following is a summary of the fair valuations according to the inputs used as of December 31, 2010 in valuing the Portfolio's assets and liabilities:
| | | Quoted Prices
in Active Markets
for Identical Investments
(Level 1) | | Other
Observable
Inputs
(Level 2) | | Significant
Unobservable
Inputs
(Level 3) | | Fair Value
at
12/31/10 | |
| Asset Table | |
| Investments, at value | |
| Preferred Stock | | $ | — | | | $ | 5,987,237 | | | $ | — | | | $ | 5,987,237 | | |
| Corporate Bonds/Notes | | | — | | | | 981,688,151 | | | | — | | | | 981,688,151 | | |
| U.S. Government Agency Obligations | | | — | | | | 672,422,126 | | | | 6,952,056 | | | | 679,374,182 | | |
| U.S. Treasury Obligations | | | — | | | | 294,374,991 | | | | — | | | | 294,374,991 | | |
| Asset-Backed Securities | | | — | | | | 229,186,400 | | | | 19,555,400 | | | | 248,741,800 | | |
| Collateralized Mortgage Obligations | | | — | | | | 348,016,431 | | | | — | | | | 348,016,431 | | |
| Municipal Bonds | | | — | | | | 3,510,184 | | | | — | | | | 3,510,184 | | |
| Other Bonds | | | — | | | | 142,068,111 | | | | — | | | | 142,068,111 | | |
| Short-Term Investments | | | 45,621,621 | | | | — | | | | 7,366,047 | | | | 52,987,668 | | |
| Total Investments, at value | | $ | 45,621,621 | | | $ | 2,677,253,631 | | | $ | 33,873,503 | | | $ | 2,756,748,755 | | |
| Other Financial Instruments+: | |
| Futures | | | 3,637,330 | | | | — | | | | — | | | | 3,637,330 | | |
| Swaps, at fair value | | | — | | | | 1,903,428 | | | | — | | | | 1,903,428 | | |
| Total Assets | | $ | 49,258,951 | | | $ | 2,679,157,059 | | | $ | 33,873,503 | | | $ | 2,762,289,513 | | |
| Liabilities Table | |
| Other Financial Instruments+: | |
Forward foreign currency contracts,
at fair value | | $ | — | | | $ | (6,392,110 | ) | | $ | — | | | $ | (6,392,110 | ) | |
| Futures | | | | | (4,066,071 | ) | | | — | | | | (4,066,071 | ) | |
| Swaps, at fair value | | | — | | | | (7,436,308 | ) | | | — | | | | (7,436,308 | ) | |
| Total Liabilities | | $ | (4,066,071 | ) | | $ | (13,828,418 | ) | | $ | — | | | $ | (17,894,489 | ) | |
The following is a reconciliation of the fair valuations using significant unobservable inputs (Level 3) for the Portfolio's assets and liabilities during the period ended December 31, 2010:
| | | Beginning
Balance
12/31/09 | | Purchases | | Sales | | Accrued
Discounts/
(Premiums) | | Total
Realized
Gain/(Loss) | | Total
Unrealized
Appreciation/
(Depreciation) | | Transfers
Into
Level 3 | | Transfers
Out of
Level 3 | | Ending
Balance
12/31/10 | |
| Asset Table | |
| Investments, at value | |
| Corporate Bonds/Notes | | $ | 1,362 | | | $ | — | | | $ | — | | | $ | — | | | $ | — | | | $ | (1,362 | ) | | $ | — | | | $ | — | | | $ | — | | |
U.S. Government
Agency Obligations | | | — | | | | 7,200,983 | | | | — | | | | 2,346 | | | | — | | | | (251,273 | ) | | | — | | | | — | | | | 6,952,056 | | |
| Asset-Backed Securities | | | — | | | | 21,215,954 | | | | (1,989,651 | ) | | | 50,121 | | | | 116,532 | | | | 162,444 | | | | — | | | | — | | | | 19,555,400 | | |
| Short-Term Investments | | | 7,366,047 | | | | — | | | | — | | | | — | | | | — | | | | — | | | | — | | | | — | | | | 7,366,047 | | |
Total Investments,
at value | | $ | 7,367,409 | | | $ | 28,416,937 | | | $ | (1,989,651 | ) | | $ | 52,467 | | | $ | 116,532 | | | $ | (90,191 | ) | | $ | — | | | $ | — | | | $ | 33,873,503 | | |
As of December 31, 2010, total change in unrealized gain (loss) on Level 3 securities still held at year end and included in the change in net assets was $(89,779).
^ See Note 2, "Significant Accounting Policies" in the Notes to Financial Statements for additional information.
+ Other Financial Instruments are derivatives not reflected in the Summary Portfolio of Investments and may include open forward foreign currency contracts, futures, swaps, and written options. Forward foreign currency contracts and futures are reported at their unrealized gain/loss at measurement date which represents the amount due to/from the Portfolio. Swaps and written options are reported at their market value at measurement date.
Transfers in or out of Level 3 represents either the beginning value (for transfers in), or the ending value (for transfers out) of any security or derivative instrument where a change in the pricing level occurred from the beginning to the end of the period. It is the policy of the Portfolio to recognize transfers at the end of the reporting period.
See Accompanying Notes to Financial Statements
82
SUMMARY PORTFOLIO OF INVESTMENTS
ING INTERMEDIATE BOND PORTFOLIO AS OF DECEMBER 31, 2010 ( CONTINUED)
At December 31, 2010 the following forward foreign currency contracts were outstanding for the ING Intermediate Bond Portfolio:
| Counterparty | | Currency | | Buy/Sell | | Settlement
Date | | In Exchange
For | | Fair Value | | Unrealized
Appreciation
(Depreciation) | |
Citigroup, Inc.
| | Mexican Peso
MXN 327,175,533 | | |
SELL | | | |
1/14/11 | | | $ | 26,004,492 | | | $ | 26,466,721 | | | $ | (462,229 | ) | |
Citigroup, Inc.
| | Mexican Peso
MXN 151,184,645 | | |
SELL | | | |
1/14/11 | | | | 11,981,000 | | | | 12,230,015 | | | | (249,015 | ) | |
Credit Suisse First Boston
| | Brazilian Real
BRL 110,421,544 | | |
SELL | | | |
1/28/11 | | | | 64,120,286 | | | | 66,077,107 | | | | (1,956,821 | ) | |
Deutsche Bank AG
| | EU Euro
EUR 25,110,524 | | |
SELL | | | |
1/14/11 | | | | 32,923,488 | | | | 33,554,579 | | | | (631,091 | ) | |
Deutsche Bank AG
| | South African Rand
ZAR 270,802,933 | | |
SELL | | | |
1/14/11 | | | | 38,179,976 | | | | 41,020,337 | | | | (2,840,361 | ) | |
Morgan Stanley
| | EU Euro
EUR 31,006,322 | | |
SELL | | | |
1/14/11 | | | | 41,180,396 | | | | 41,432,989 | | | | (252,593 | ) | |
| | | | | | | | | | | | | | | | | | | | | | | $ | (6,392,110 | ) | |
ING Intermediate Bond Portfolio Open Futures Contracts on December 31, 2010:
| Contract Description | | Number
of Contracts | | Expiration Date | | Notional
Value | | Unrealized
Appreciation/
(Depreciation) | |
| Long Contracts | |
| U.S. Treasury 5-Year Note | | | 2,507 | | | 03/31/11 | | $ | 295,120,906 | | | $ | (4,009,508 | ) | |
| U.S. Treasury Ultra Long Bond | | | 297 | | | 03/22/11 | | | 37,746,844 | | | | (56,563 | ) | |
| | | | | | | $ | 332,867,750 | | | $ | (4,066,071 | ) | |
| Short Contracts | |
| U.S. Treasury 2-Year Note | | | 201 | | | 03/31/11 | | $ | 44,000,158 | | | $ | 24,620 | | |
| U.S. Treasury 10-Year Note | | | 1,801 | | | 03/22/11 | | | 216,907,938 | | | | 422,614 | | |
| U.S. Treasury Long Bond | | | 793 | | | 03/22/11 | | | 96,845,125 | | | | 3,190,096 | | |
| | | | | | | $ | 357,753,221 | | | $ | 3,637,330 | | |
ING Intermediate Bond Portfolio Credit Default Swap Agreements Outstanding on December 31, 2010:
Credit Default Swaps on Corporate and Sovereign Issues — Buy Protection(1)
| Counterparty | | Reference
Entity/Obligation | | Buy/Sell
Protection | | (Pay)/
Receive
Fixed
Rate(%) | | Termination
Date | | Notional
Amount(4) | | Fair
Value(5) | | Upfront
Premium
Paid/
(Received) | | Unrealized
Appreciation/
(Depreciation) | |
| Citigroup, Inc. | | MBIA Inc.
6.625%, 10/01/28 | | Buy | | | (5.000 | ) | | 09/20/13 | | USD | 1,710,000 | | | $ | 172,024 | | | $ | 314,450 | | | $ | (142,426 | ) | |
| Citigroup, Inc. | | MBIA Inc.
6.625%, 10/01/28 | | Buy | | | (5.000 | ) | | 09/20/13 | | USD | 3,460,000 | | | | 348,071 | | | | 610,645 | | | | (262,574 | ) | |
JPMorgan
Chase & Co. | | MBIA Inc.
6.625%, 10/01/28 | | Buy | | | (5.000 | ) | | 09/20/13 | | USD | 13,751,000 | | | | 1,383,333 | | | | 1,320,717 | | | | 62,616 | | |
| | | | | | | | | | | | | $ | 1,903,428 | | | $ | 2,245,812 | | | $ | (342,384 | ) | |
See Accompanying Notes to Financial Statements
83
SUMMARY PORTFOLIO OF INVESTMENTS
ING INTERMEDIATE BOND PORTFOLIO AS OF DECEMBER 31, 2010 ( CONTINUED)
Credit Default Swaps on Corporate and Sovereign Issues — Sell Protection(2)
| Counterparty | | Reference
Entity/Obligation | | Buy/Sell
Protection | | (Pay)/
Receive
Fixed
Rate(%) | | Termination
Date | | Implied
Credit
Spread at
12/31/10(%)(3) | | Notional
Amount(4) | | Fair
Value(5) | | Upfront
Premium
Paid/
(Received) | | Unrealized
Appreciation/
(Depreciation) | |
| Citigroup, Inc. | | MBIA Global
Funding LLC | | Sell | | | 5.000 | | | 09/20/13 | | | 27.381 | | | USD | 1,710,000 | | | $ | (697,323 | ) | | $ | (349,881 | ) | | $ | (347,442 | ) | |
| Citigroup, Inc. | | MBIA Global
Funding LLC | | Sell | | | 5.000 | | | 09/20/13 | | | 27.381 | | | USD | 3,460,000 | | | | (1,410,958 | ) | | | (772,287 | ) | | | (638,671 | ) | |
Goldman Sachs
& Co. | | MBIA Global
Funding LLC | | Sell | | | 5.000 | | | 09/20/13 | | | 27.381 | | | USD | 3,435,000 | | | | (1,400,764 | ) | | | (693,935 | ) | | | (706,829 | ) | |
JPMorgan
Chase & Co. | | MBIA Global
Funding LLC | | Sell | | | 5.000 | | | 09/20/13 | | | 27.381 | | | USD | 6,874,000 | | | | (2,803,159 | ) | | | (696,893 | ) | | | (2,106,266 | ) | |
| | | | | | | | | | | | | | | $ | (6,312,204 | ) | | $ | (2,512,996 | ) | | $ | (3,799,208 | ) | |
(1) If a Portfolio is a buyer of protection and a credit event occurs, as defined under the terms of that particular swap agreement, a Portfolio will either 1.) receive from the seller of protection an amount equal to the notional amount of the swap and deliver the referenced obligation, other deliverable obligations or underlying securities comprising the referenced index or 2.) receive a net settlement amount in the form of cash or securities equal to the notional amount of the swap less the recovery value of the referenced obligation or underlying securities comprising the referenced index.
(2) If the Portfolio is a seller of protection, and a credit event occurs, as defined under the terms of that particular swap agreement, the Portfolio will generally either 1.) Pay to the buyer an amount equal to the notional amount of the swap and take delivery of the referenced obligation, other deliverable obligations, or underlying securities comprising a referenced index or 2.) Pay a net settlement amount in the form of cash or securities equal to the notional amount of the swap less the recovery value of the referenced obligation or underlying securities comprising a referenced index.
(3) Implied credit spreads, represented in absolute terms, utilized in determining the fair value of credit default swap agreements on corporate issues or sovereign issues are disclosed in each Portfolio's Portfolio of Investment and serve as an indicator of the current status of the payment/performance risk and represent the likelihood or risk of default for the credit derivative. The implied credit spread of a particular referenced entity reflects the cost of buying/selling protection and may include upfront payments required to be made to enter into the agreement. For credit default swaps on asset-backed securities or credit indices, the quoted fair prices and resulting fair values serve as the indicator of the current status of the payment/performance risk. Wider credit spreads and increasing fair values, in absolute terms when compared to the notional amount of the swap, represent a deterioration of the referenced entity's credit soundness and a greater likelihood or risk of default or other credit event occurring as defined under the terms of the agreement.
(4) The maximum amount of future payments (undiscounted) that a Portfolio as a seller of protection could be required to make or receive as a buyer of credit protection under a credit default swap agreement would be an amount equal to the notional amount of the agreement.
(5) The fair values for credit default swap agreements serve as an indicator of the current status of the payment/performance risk and represent the likelihood or risk of default for the credit derivative. Increasing fair values, in absolute terms, when compared to the notional amount of the agreement, represent a deterioration of the referenced obligation's credit soundness and a greater likelihood or risk of default or other credit event occurring.
ING Intermediate Bond Portfolio Interest Rate Swap Agreements Outstanding on December 31, 2010:
| | | Termination
Date | | Notional
Amount | | Fair
Value | | Upfront Premium
Paid/(Received) | | Unrealized
Appreciation/
(Depreciation) | |
Pay a fixed rate equal to 3.478% and receive a floating rate
based on the 3-month USD-LIBOR-BBA
Counterparty: Citigroup, Inc. | | 05/11/20 | | USD | 64,520,000 | | | $ | (1,124,104 | ) | | $ | — | | | $ | (1,124,104 | ) | |
| | | | | $(1,124,104) | | $— | | $(1,124,104) | |
See Accompanying Notes to Financial Statements
84
SUMMARY PORTFOLIO OF INVESTMENTS
ING INTERMEDIATE BOND PORTFOLIO AS OF DECEMBER 31, 2010 ( CONTINUED)
A summary of derivative instruments by primary risk exposure is outlined in the following tables.
The fair value of derivative instruments as of December 31, 2010 was as follows:
Derivatives not accounted
for as hedging instruments | | Location on Statement of Assets and Liabilities | | Fair Value | |
| Asset Derivatives | |
| Credit contracts | | Swaps, at fair value | | $ | 1,903,428 | | |
| Interest rate contracts | | Net Assets — Unrealized appreciation* | | | 3,637,330 | | |
| Total Asset Derivatives | | | | $ | 5,540,758 | | |
| Liability Derivatives | |
| Foreign exchange contracts | | Unrealized depreciation on forward foreign currency contracts | | $ | 6,392,110 | | |
| Credit contracts | | Swaps, at fair value | | | 6,312,204 | | |
| Interest rate contracts | | Swaps, at fair value | | | 1,124,104 | | |
| Interest rate contracts | | Net Assets — Unrealized depreciation* | | | 4,066,071 | | |
| Total Liability Derivatives | | | | $ | 17,894,489 | | |
* Includes cumulative appreciation/depreciation of futures contracts as reported in the table following the Summary Portfolio of Investments.
The effect of derivative instruments on the Portfolio's Statement of Operations for the year ended December 31, 2010 was as follows:
| | | Amount of Realized Gain or (Loss) on Derivatives Recognized in Income | |
Derivatives not
accounted for as
hedging instruments | | Investments* | | Foreign currency
related transactions** | | Futures | | Swaps | | Written
options | | Total | |
| Credit contracts | | $ | (1,832,723 | ) | | $ | — | | | $ | — | | | $ | (3,041,032 | ) | | $ | 1,071,239 | | | $ | (3,802,516 | ) | |
| Foreign exchange contracts | | | (316,057 | ) | | | (6,229,555 | ) | | | — | | | | — | | | | 252,639 | | | | (6,292,973 | ) | |
| Interest rate contracts | | | — | | | | — | | | | (3,583,064 | ) | | | (1,280,585 | ) | | | 943,295 | | | | (3,920,354 | ) | |
| Total | | $ | (2,148,780 | ) | | $ | (6,229,555 | ) | | $ | (3,583,064 | ) | | $ | (4,321,617 | ) | | $ | 2,267,173 | | | $ | (14,015,843 | ) | |
| | | Change in Unrealized Appreciation or (Depreciation) on Derivatives Recognized in Income | |
Derivatives not
accounted for as
hedging instruments | | Investments* | | Foreign currency
related transactions** | | Futures | | Swaps | | Written
options | | Total | |
| Credit contracts | | $ | — | | | $ | — | | | $ | — | | | $ | (2,650,654 | ) | | $ | — | | | $ | (2,650,654 | ) | |
| Foreign exchange contracts | | | — | | | | (6,812,958 | ) | | | — | | | | — | | | | — | | | | (6,812,958 | ) | |
| Interest rate contracts | | | — | | | | — | | | | (4,271,889 | ) | | | (1,124,104 | ) | | | — | | | | (5,395,993 | ) | |
| Total | | $ | — | | | $ | (6,812,958 | ) | | $ | (4,271,889 | ) | | $ | (3,774,758 | ) | | $ | — | | | $ | (14,859,605 | ) | |
* Amounts recognized for purchased options are included in net realized gain (loss) on investments and net change in unrealized appreciation or depreciation on investments.
** Amounts recognized for forward foreign currency contracts are included in net realized gain (loss) on foreign currency related transactions and net change in unrealized appreciation or depreciation on foreign currency related transactions.
See Accompanying Notes to Financial Statements
85
PORTFOLIO OF INVESTMENTS
ING MONEY MARKET PORTFOLIO(1) AS OF DECEMBER 31, 2010
Principal
Amount | | | | | | Value | |
| CERTIFICATES OF DEPOSIT: 7.3% | | | |
| $ | 4,000,000 | | | | | | | BNP Paribas New York,
0.380%, due 04/19/11 | | $ | 4,000,119 | | |
| | 14,750,000 | | | | | | | BNP Paribas New York,
0.520%, due 02/09/11 | | | 14,751,912 | | |
| | 4,000,000 | | | | | | | BNP Paribas New York,
0.630%, due 01/27/11 | | | 4,000,980 | | |
| | 10,000,000 | | | | | | | Credit Suisse New York,
0.250%, due 01/20/11 | | | 9,999,894 | | |
| | 12,500,000 | | | | | | | Deutsche Bank, 0.510%,
due 05/25/11 | | | 12,500,494 | | |
| | 1,100,000 | | | | | | | Lloyds TSB Bank PLC,
0.500%, due 04/28/11 | | | 1,100,355 | | |
| | 3,250,000 | | | | | | | Lloyds TSB Bank PLC,
0.700%, due 01/21/11 | | | 3,250,811 | | |
| | 8,000,000 | | | | | | | Rabobank Nederland NV NY,
0.470%, due 11/16/11 | | | 8,000,000 | | |
| | 3,750,000 | | | | | | | Societe Generale NY, 0.340%
due 01/14/11 | | | 3,750,054 | | |
| | 1,907,000 | | | | | | | Svenska Handelsbanken AB,
0.265%, due 02/02/11 | | | 1,907,008 | | |
| | 7,250,000 | | | | | | | Svenska Handelsbanken AB,
0.280%, due 03/10/11 | | | 7,249,999 | | |
| | 7,750,000 | | | | | | | Toronto Dominion Bank NY,
0.620%, due 07/15/11 | | | 7,750,000 | | |
Total Certificates of Deposit
( Cost $78,261,626 ) | | | 78,261,626 | | |
| COMMERCIAL PAPER: 49.3% | | | |
| | 600,000 | | | | | | | ANZ National Int'l Ltd.,
0.502%, due 09/13/11 | | | 597,875 | | |
| | 15,000,000 | | | | | | | ANZ National Int'l Ltd.,
0.603%, due 04/20/11 | | | 14,972,750 | | |
| | 20,750,000 | | | | | | | ASB Finance Ltd., 0.376%,
due 02/24/11 | | | 20,738,327 | | |
| | 2,750,000 | | | | | | | ASB Finance Ltd., 0.401%,
due 06/01/11 | | | 2,745,386 | | |
| | 22,250,000 | | | | | | | Barclays US Funding LLC,
0.230%, due 01/04/11 | | | 22,249,574 | | |
| | 3,250,000 | | | | | | | Barton Capital LLC, 0.260%,
due 01/04/11 | | | 3,249,930 | | |
| | 1,500,000 | | | | | | | Barton Capital LLC, 0.270%,
due 01/05/11 | | | 1,499,955 | | |
| | 1,000,000 | | | | | | | Barton Capital LLC, 0.280%,
due 02/03/11 | | | 999,743 | | |
| | 5,250,000 | | | | | | | Barton Capital LLC, 0.300%,
due 02/01/11 | | | 5,248,644 | | |
| | 19,500,000 | | | | | | | Barton Capital LLC, 0.381%,
due 01/14/11 | | | 19,497,375 | | |
| | 3,750,000 | | | | | | | BNP Paribas Finance, Inc.,
0.240%, due 01/11/11 | | | 3,749,750 | | |
| | 1,100,000 | | | | | | | CAFCO LLC, 0.300%,
due 02/10/11 | | | 1,099,642 | | |
| | 5,750,000 | | | | | | | CAFCO LLC, 0.330%,
due 03/02/11 | | | 5,747,129 | | |
| | 1,750,000 | | | | | | | CAFCO LLC, 0.391%,
due 02/17/11 | | | 1,749,109 | | |
| | 14,250,000 | | | | | | | CAFCO LLC, 0.602%,
due 01/19/11 | | | 14,245,725 | | |
| | 7,500,000 | | | | | | | CAFCO LLC, 0.672%,
due 01/14/11 | | | 7,498,185 | | |
| | 615,000 | | | | | | | Cargill, Inc., 0.250%,
due 02/28/11 | | | 614,752 | | |
Principal
Amount | | | | | | Value | |
| $ | 9,500,000 | | | | | | | Ciesco LLC, 0.295%,
due 02/22/11 | | $ | 9,495,952 | | |
| | 1,750,000 | | | | | | | Ciesco LLC, 0.340%,
due 02/14/11 | | | 1,749,273 | | |
| | 8,750,000 | | | | | | | Ciesco LLC, 0.672%,
due 01/10/11 | | | 8,748,534 | | |
| | 10,250,000 | | | | | | | Ciesco LLC, 0.672%,
due 01/13/11 | | | 10,247,711 | | |
| | 12,500,000 | | | | | | | Commonwealth Bank of
Australia, 0.290%,
due 03/03/11 | | | 12,493,858 | | |
| | 8,511,000 | | | | | | | Concord Minutemen
Capital Co., 0.652%,
due 08/15/11 | | | 8,476,270 | | |
| | 7,000,000 | | | | | | | Concord Minutemen
Capital Co., 0.702%,
due 03/24/11 | | | 6,988,839 | | |
| | 15,000,000 | | | | | | | Concord Minutemen
Capital Co., 0.955%,
due 01/11/11 | | | 14,996,583 | | |
| | 2,750,000 | | | | | | | Crown Point Capital Co.,
0.310%, due 01/06/11 | | | 2,749,882 | | |
| | 7,500,000 | | | | | | | Crown Point Capital Co.,
0.652%, due 08/15/11 | | | 7,469,396 | | |
| | 9,750,000 | | | | | | | Crown Point Capital Co.,
0.702%, due 03/24/11 | | | 9,735,935 | | |
| | 10,500,000 | | | | | | | Crown Point Capital Co.,
0.955%, due 01/11/11 | | | 10,497,229 | | |
| | 4,750,000 | | | | | | | Danske Corp., 0.250%,
due 01/06/11 | | | 4,749,835 | | |
| | 17,250,000 | | | | | | | Danske Corp., 0.250%,
due 01/11/11 | | | 17,248,697 | | |
| | 4,500,000 | | | | | | | Danske Corp., 0.300%,
due 02/08/11 | | | 4,498,615 | | |
| | 2,750,000 | | | | | | | Deutsche Bank, 0.240%,
due 01/10/11 | | | 2,749,835 | | |
| | 9,250,000 | | | | | | | Deutsche Bank, 0.280%,
due 01/18/11 | | | 9,248,777 | | |
| | 4,250,000 | | | | | | | Dexia Delaware LLC, 0.370%,
due 01/04/11 | | | 4,249,869 | | |
| | 3,000,000 | | | | | | | Dexia Delaware LLC, 0.440%,
due 01/12/11 | | | 2,999,597 | | |
| | 2,300,000 | | | | | | | Jupiter Securitization
Company LLC, 0.240%,
due 01/27/11 | | | 2,299,601 | | |
| | 9,500,000 | | | | | | | Jupiter Securitization
Company LLC, 0.240%,
due 01/18/11 | | | 9,498,923 | | |
| | 5,000,000 | | | | | | | Jupiter Securitization
Company LLC, 0.270%,
due 01/10/11 | | | 4,999,663 | | |
| | 1,200,000 | | | | | | | Jupiter Securitization
Company LLC, 0.270%,
due 01/13/11 | | | 1,199,892 | | |
| | 7,750,000 | | | | | | | Jupiter Securitization
Company LLC, 0.280%,
due 03/11/11 | | | 7,745,841 | | |
| | 750,000 | | | | | | | Lloyds TSB Bank PLC, 0.300%,
due 02/22/11 | | | 749,675 | | |
| | 3,750,000 | | | | | | | Natixis US Finance Co., 0.260%,
due 01/06/11 | | | 3,749,865 | | |
| | 18,000,000 | | | | | | | Natixis US Finance Co.,
0.290%, due 01/10/11 | | | 17,998,695 | | |
See Accompanying Notes to Financial Statements
86
PORTFOLIO OF INVESTMENTS
ING MONEY MARKET PORTFOLIO(1) AS OF DECEMBER 31, 2010 ( CONTINUED)
Principal
Amount | | | | | | Value | |
| COMMERCIAL PAPER (continued) | | | |
| $ | 5,250,000 | | | | | | | Natixis US Finance Co.,
0.602%, due 02/08/11 | | $ | 5,246,675 | | |
| | 824,000 | | | | | | | Old Line Funding LLC,
0.270%, due 02/07/11 | | | 823,771 | | |
| | 14,500,000 | | | | | | | Old Line Funding LLC,
0.270%, due 01/18/11 | | | 14,498,151 | | |
| | 7,582,000 | | | | | | | Old Line Funding LLC,
0.270%, due 02/22/11 | | | 7,579,043 | | |
| | 7,250,000 | | | | | | | Old Line Funding LLC,
0.280%, due 03/18/11 | | | 7,245,714 | | |
| | 12,750,000 | | | | | | | Rabobank USA Finance Corp.,
0.280%, due 03/10/11 | | | 12,743,257 | | |
| | 20,750,000 | | | | | | | RBS Holdings USA, Inc.,
0.310%, due 01/12/11 | | | 20,748,035 | | |
| | 9,500,000 | | | | | | | Societe Generale North
America, 0.370%,
due 02/04/11 | | | 9,496,680 | | |
| | 4,250,000 | | | | | | | Thunder Bay Funding LLC,
0.270%, due 03/07/11 | | | 4,247,928 | | |
| | 2,411,000 | | | | | | | Thunder Bay Funding LLC,
0.270%, due 02/08/11 | | | 2,410,313 | | |
| | 695,000 | | | | | | | Thunder Bay Funding LLC,
0.280%, due 03/03/11 | | | 694,670 | | |
| | 3,750,000 | | | | | | | Thunder Bay Funding LLC,
0.280%, due 03/14/11 | | | 3,747,900 | | |
| | 19,500,000 | | | | | | | Thunder Bay Funding LLC,
0.280%, due 03/10/11 | | | 19,489,668 | | |
| | 26,500,000 | | | | | | | UBS Finance Delaware LLC,
0.160%, due 01/05/11 | | | 26,499,529 | | |
| | 650,000 | | | | | | | Variable Funding Capital,
0.270%, due 01/25/11 | | | 649,883 | | |
| | 6,750,000 | | | | | | | Variable Funding Capital,
0.270%, due 01/21/11 | | | 6,748,988 | | |
| | 4,500,000 | | | | | | | Variable Funding Capital,
0.270%, due 01/14/11 | | | 4,499,561 | | |
| | 14,500,000 | | | | | | | Variable Funding Capital,
0.270%, due 01/13/11 | | | 14,498,695 | | |
| | 1,500,000 | | | | | | | Westpac Banking Group,
0.300%, due 03/21/11 | | | 1,499,013 | | |
| | 6,500,000 | | | | | | | Westpac Banking Group,
0.300%, due 01/06/11 | | | 6,499,729 | | |
| | 6,250,000 | | | | | | | Windmill Funding Group,
0.260%, due 01/10/11 | | | 6,249,594 | | |
| | 12,500,000 | | | | | | | Windmill Funding Group,
0.310%, due 04/14/11 | | | 12,488,913 | | |
| | 14,750,000 | | | | | | | Windmill Funding Group,
0.531%, due 01/18/11 | | | 14,746,769 | | |
Total Commercial Paper
( Cost $527,493,172 ) | | | 527,493,172 | | |
| CORPORATE BONDS/NOTES: 16.8% | | | |
| | 1,750,000 | | | | C | | | Abbott Laboratories,
3.750%,due 03/15/11 | | | 1,760,635 | | |
| | 3,500,000 | | | | # | | | ANZ National Int'l Ltd.,
0.388%, due 07/25/11 | | | 3,500,000 | | |
| | 10,000,000 | | | | # | | | Commonwealth Bank of
Australia, 0.321%,
due 06/20/11 | | | 10,000,000 | | |
| | 12,564,000 | | | | | | | Credit Suisse FB USA Inc.,
0.490%, due 03/02/11 | | | 12,566,158 | | |
| | 3,250,000 | | | | | | | Credit Suisse FB USA Inc.,
5.500%, due 08/16/11 | | | 3,347,570 | | |
Principal
Amount | | | | | | Value | |
| $ | 1,250,000 | | | | | | | Deutsche Bank, 0.350%,
due 03/21/11 | | $ | 1,249,838 | | |
| | 18,750,000 | | | | | | | Dexia Credit Local S.A.
New York, 0.561%,
due 06/29/11 | | | 18,750,000 | | |
| | 10,750,000 | | | | | | | Federal National Mortgage
Association, 5.375%,
due 11/15/11 | | | 11,218,966 | | |
| | 1,350,000 | | | | | | | Kreditanstalt fuer
Wiederaufbau, 0.575%,
due 03/02/11 | | | 1,350,479 | | |
| | 6,500,000 | | | | | | | Kreditanstalt fuer
Wiederaufbau, 1.875%,
due 03/15/11 | | | 6,520,539 | | |
| | 11,185,000 | | | | | | | Kreditanstalt fuer
Wiederaufbau, 3.250%,
due 02/15/11 | | | 11,223,252 | | |
| | 2,500,000 | | | | | Kreditanstalt fuer
Wiederaufbau, 3.250%,
due 10/14/11 | | | 2,554,559 | | |
| | 4,500,000 | | | | # | | | Rabobank Nederland NV NY,
0.354%, due 12/16/11 | | | 4,500,000 | | |
| | 1,250,000 | | | | # | | | Rabobank Nederland NV NY,
0.486%, due 08/05/11 | | | 1,251,337 | | |
| | 15,250,000 | | | | #,C,S | | | Royal Bank of Canada,
0.290%, due 03/01/12 | | | 15,250,000 | | |
| | 7,000,000 | | | | C,S | | | Royal Bank of Canada,
0.630%, due 02/01/12 | | | 7,020,402 | | |
| | 2,900,000 | | | | # | | | Royal Bank of Scottland PLC,
1.450%, due 10/20/11 | | | 2,919,188 | | |
| | 13,250,000 | | | | | | | Societe Generale NY, 0.350%,
due 07/19/11 | | | 13,230,247 | | |
| | 14,000,000 | | | | #,C | | | Svenska Handelsbanken AB,
0.386%, due 03/09/12 | | | 14,000,000 | | |
| | 19,000,000 | | | | | | | Toyota Motor Credit Corp.,
0.440%, due 12/14/11 | | | 19,000,000 | | |
| | 18,500,000 | | | | C | | | Westpac Banking Group,
0.358%, due 02/28/12 | | | 18,500,000 | | |
Total Corporate Bonds/Notes
( Cost $179,713,170 ) | | | 179,713,170 | | |
| U.S. GOVERNMENT AGENCY OBLIGATIONS: 3.7% | | | |
| | 1,650,000 | | | | | | | Federal Farm Credit Bank,
4.700%, due 01/03/12 | | | 1,721,365 | | |
| | 17,500,000 | | | | | | | Federal Home Loan Bank,
0.450%, due 12/14/11 | | | 17,500,000 | | |
| | 20,000,000 | | | | | | | Federal Home Loan Bank,
0.500%, due 12/29/11 | | | 20,000,000 | | |
Total U.S. Government
Agency Obligations
( Cost $39,221,365 ) | | | 39,221,365 | | |
| U.S. TREASURY NOTES: 0.7% | | | |
| | 8,000,000 | | | | | | | United States Treasury Bill,
0.000%, due 11/17/11 | | | 7,980,231 | | |
Total U.S. Treasury Notes
( Cost $7,980,231 ) | | | 7,980,231 | | |
See Accompanying Notes to Financial Statements
87
PORTFOLIO OF INVESTMENTS
ING MONEY MARKET PORTFOLIO(1) AS OF DECEMBER 31, 2010 ( CONTINUED)
Principal
Amount | | | | Value | |
| REPURCHASE AGREEMENTS: 22.5% | |
| $ | 140,000,000 | | | Goldman Sachs Repurchase
Agreement dated 12/31/10, 0.150%,
due 01/03/11, $140,001,750
to be received upon repurchase
(Collateralized by $142,940,000
Federal Home Loan Mortgage
Corporation, 0.000%-0.625%,
Market Value plus accrued interest
$142,800,226, due 06/07/11-06/22/12)
Goldman Sachs Repurchase
Agreement dated 12/31/10, 0.150%,
due 01/03/11, $140,001,750 to be
received upon repurchase
(Collateralized by $142,940,000
Federal Home Loan Mortgage
Corporation, 0.000%-0.625%,
Market Value plus accrued
interest $142,800,226,
due 06/07/11-06/22/12) | | $ | 140,000,000 | | |
| | 100,855,000 | | | Morgan Stanley Repurchase
Agreement dated 12/31/10, 0.120%,
due 01/03/11, $100,856,009
to be received upon repurchase
(Collateralized by $103,448,000
Federal Farm Credit Bank,
1.980%-3.625%, Market Value
plus accrued interest $102,872,815,
due 11/24/15-05/18/17)
Morgan Stanley Repurchase
Agreement dated 12/31/10,
0.120%, due 01/03/11, $100,856,009
to be received upon repurchase
(Collateralized by $103,448,000 FCSB,
1.980%-3.625%, Market Value
plus accrued interest $102,872,815,
due 11/24/15-05/18/17) | | | 100,855,000 | | |
Total Repurchase Agreement
( Cost $240,855,000 ) | | | 240,855,000 | | |
Principal
Amount | | | | Value | |
| SECURITIES LENDING COLLATERALcc: 0.1% | |
| | 747,006 | | | | R | | | BNY Institutional Cash Reserves
Fund, Series B(2) | | $ | 597,605 | | |
Total Securities Lending Collateral
( Cost $747,006 ) | | | | | 597,605 | | |
Total Investments in
Securities
( Cost $1,074,271,570 )* | | | 100.4 | % | | $ | 1,074,122,169 | | |
Other Assets and
Liabilities - Net | | | (0.4 | ) | | | (3,861,938 | ) | |
| Net Assets | | | 100.0 | % | | $ | 1,070,260,231 | | |
(1) All securities with a maturity date of greater than 13 months have either a variable rate, a demand feature, prerefunded, optional or mandatory put resulting in a maturity of one year or less. Rate shown reflects current rate.
(2) On September 12, 2008, BNY established a separate sleeve of the Institutional Cash Reserves Fund (Series B) to hold certain Lehman Brothers defaulted debt obligations. The Portfolio's position in Series B is being fair valued daily. Please see the accompanying Notes to Financial Statements for additional details on securities lending.
# Securities with purchases pursuant to Rule 144A or section 4(2), under the Securities Act of 1933 and may not be resold subject to that rule except to qualified institutional buyers. Unless otherwise noted, these securities have been determined to be liquid under the guidelines established by the Funds' Board of Directors/Trustees.
C Bond may be called prior to maturity date.
cc Securities purchased with cash collateral for securities loaned.
S All or a portion of this security is segregated to cover collateral requirements for applicable futures, options, swaps, foreign forward currency contracts and/or when-issued or delayed-delivery securities.
R Restricted security
* Cost for federal income tax purposes is $1,074,272,313.
Net unrealized depreciation consists of:
| Gross Unrealized Appreciation | | $ | — | | |
| Gross Unrealized Depreciation | | | (150,144 | ) | |
| Net Unrealized Depreciation | | $ | (150,144 | ) | |
Fair Value Measurements^
The following is a summary of the fair valuations according to the inputs used as of December 31, 2010 in valuing the Portfolio's assets and liabilities:
| | | Quoted Prices
in Active Markets
for Identical Investments
(Level 1) | | Other
Observable
Inputs
(Level 2) | | Significant
Unobservable
Inputs
(Level 3) | | Fair Value
at
12/31/10 | |
| Asset Table | |
| Investments, at value | |
| Certificates of Deposit | | $ | — | | | $ | 78,261,626 | | | $ | — | | | $ | 78,261,626 | | |
| Commercial Paper | | | — | | | | 527,493,172 | | | | — | | | | 527,493,172 | | |
| Corporate Bonds/Notes | | | — | | | | 179,713,170 | | | | — | | | | 179,713,170 | | |
| U.S. Treasury Obligations | | | — | | | | 7,980,231 | | | | — | | | | 7,980,231 | | |
| U.S. Government Agency Obligations | | | — | | | | 39,221,365 | | | | — | | | | 39,221,365 | | |
| Repurchase Agreements | | | — | | | | 240,855,000 | | | | — | | | | 240,855,000 | | |
| Securities Lending | | | — | | | | — | | | | 597,605 | | | | 597,605 | | |
| Total Investments, at value | | $ | — | | | $ | 1,073,524,564 | | | $ | 597,605 | | | $ | 1,074,122,169 | | |
The following is a reconciliation of the fair valuations using significant unobservable inputs (Level 3) for the Portfolio's assets and liabilities during the period ended September 30, 2010:
| | | Beginning
Balance
12/31/09 | | Purchases | | Sales | | Accrued
Discounts/
(Premiums) | | Total
Realized
Gain/(Loss) | | Total
Unrealized
Appreciation/
(Depreciation) | | Transfers
Into
Level 3 | | Transfers
Out of
Level 3 | | Ending
Balance
12/31/10 | |
| Asset Table | |
| Investments, at value | |
| Securities Lending | | $ | 597,605 | | | $ | — | | | $ | — | | | $ | — | | | $ | — | | | $ | — | | | $ | — | | | $ | — | | | $ | 597,605 | | |
Total Investments,
at value | | $ | 597,605 | | | $ | — | | | $ | — | | | $ | — | | | $ | — | | | $ | — | | | $ | — | | | $ | — | | | $ | 597,605 | | |
As of September 30, 2010, total change in unrealized gain (loss) on Level 3 securities still held at period end and included in the change in net assets was $0.
^ See Note 2, "Significant Accounting Policies" in the Notes to Financial Statements for additional information.
See Accompanying Notes to Financial Statements
88
ING BLACKROCK SCIENCE AND SUMMARY PORTFOLIO OF INVESTMENTS
TECHNOLOGY OPPORTUNITIES PORTFOLIO AS OF DECEMBER 31, 2010
| Shares | |
| |
| | Value | | Percent of
Net Assets | |
| COMMON STOCK: 96.7% | | | |
| | | Consumer Discretionary: 2.2% | | | |
| | 28,500 | | | | @ | | | Amazon.com, Inc. | | $ | 5,130,000 | | | | 1.3 | | |
| | 6,900 | | | | @ | | | Priceline.com, Inc. | | | 2,756,895 | | | | 0.7 | | |
| | | | | | | | | Other Securities | | | 923,369 | | | | 0.2 | | |
| | | | | | | | | | | | | | 8,810,264 | | | | 2.2 | | |
| | | Health Care: 4.4% | | | |
| | 85,900 | | | | @ | | | Agilent
Technologies, Inc. | | | 3,558,837 | | | | 0.9 | | |
| | 79,800 | | | | | | | Medtronic, Inc. | | | 2,959,782 | | | | 0.7 | | |
| | 54,700 | | | | | | | Novartis AG | | | 3,219,949 | | | | 0.8 | | |
| | | | | | | | | Other Securities | | | 8,042,247 | | | | 2.0 | | |
| | | | | | | | | | | | | | 17,780,815 | | | | 4.4 | | |
| | | Industrials: 0.6% | | | |
| | | | | | | | | Other Securities | | | 2,390,260 | | | | 0.6 | | |
| | | Information Technology: 87.1% | | | |
| | 50,900 | | | | @ | | | Acme Packet, Inc. | | | 2,705,844 | | | | 0.7 | | |
| | 65,500 | | | | | | | Amphenol Corp. | | | 3,457,090 | | | | 0.9 | | |
| | 105,100 | | | | @ | | | Apple, Inc. | | | 33,901,056 | | | | 8.4 | | |
| | 291,800 | | | | | | | Applied Materials, Inc. | | | 4,099,790 | | | | 1.0 | | |
| | 150,700 | | | | @ | | | Ariba, Inc. | | | 3,539,943 | | | | 0.9 | | |
| | 67,200 | | | | | | | Automatic Data
Processing, Inc. | | | 3,110,016 | | | | 0.8 | | |
| | 100,100 | | | | @ | | | BMC Software, Inc. | | | 4,718,714 | | | | 1.2 | | |
| | 133,800 | | | | | | | Broadcom Corp. | | | 5,826,990 | | | | 1.4 | | |
| | 117,900 | | | | | | | CA, Inc. | | | 2,881,476 | | | | 0.7 | | |
| | 72,000 | | | | @ | | | Cavium Networks, Inc. | | | 2,712,960 | | | | 0.7 | | |
| | 377,600 | | | | @ | | | Cisco Systems, Inc. | | | 7,638,848 | | | | 1.9 | | |
| | 91,900 | | | | @ | | | Citrix Systems, Inc. | | | 6,286,879 | | | | 1.6 | | |
| | 91,700 | | | | @ | | | Cognizant Technology
Solutions Corp. | | | 6,720,693 | | | | 1.7 | | |
| | 244,800 | | | | @ | | | Compuware Corp. | | | 2,856,816 | | | | 0.7 | | |
| | 228,900 | | | | @ | | | eBay, Inc. | | | 6,370,287 | | | | 1.6 | | |
| | 395,300 | | | | @ | | | EMC Corp. | | | 9,052,370 | | | | 2.2 | | |
| | 78,300 | | | | @ | | | F5 Networks, Inc. | | | 10,191,529 | | | | 2.5 | | |
| | 20,110 | | | | @ | | | Google, Inc. - Class A | | | 11,944,737 | | | | 3.0 | | |
| | 154,200 | | | | | | | Hewlett-Packard Co. | | | 6,491,820 | | | | 1.6 | | |
| | 279,100 | | | | | | | Intel Corp. | | | 5,869,473 | | | | 1.5 | | |
| | 93,300 | | | | | | | International Business
Machines Corp. | | | 13,692,708 | | | | 3.4 | | |
| | 79,700 | | | | @ | | | Intuit, Inc. | | | 3,929,210 | | | | 1.0 | | |
| | 143,900 | | | | @ | | | Juniper Networks, Inc. | | | 5,312,788 | | | | 1.3 | | |
| | 85,000 | | | | @ | | | Lam Research Corp. | | | 4,401,300 | | | | 1.1 | | |
| | 288,200 | | | | @ | | | Marvell Technology
Group Ltd. | | | 5,346,110 | | | | 1.3 | | |
| | 330,000 | | | | | | | Microsoft Corp. | | | 9,213,600 | | | | 2.3 | | |
| | 77,400 | | | | @ | | | NetApp, Inc. | | | 4,253,904 | | | | 1.1 | | |
| | 128,600 | | | | @ | | | Novellus Systems, Inc. | | | 4,156,352 | | | | 1.0 | | |
| | 267,100 | | | | | | | Oracle Corp. | | | 8,360,230 | | | | 2.1 | | |
| | 92,900 | | | | @ | | | Polycom, Inc. | | | 3,621,242 | | | | 0.9 | | |
| Shares | |
| |
| | Value | | Percent of
Net Assets | |
| | 83,400 | | | | @ | | | Progress Software
Corp. | | $ | 3,529,488 | | | | 0.9 | | |
| | 194,780 | | | | | | | Qualcomm, Inc. | | | 9,639,662 | | | | 2.4 | | |
| | 124,400 | | | | @ | | | Red Hat, Inc. | | | 5,678,860 | | | | 1.4 | | |
| | 50,700 | | | | @ | | | Sandisk Corp. | | | 2,527,902 | | | | 0.6 | | |
| | 54,300 | | | | L | | | SAP AG ADR | | | 2,748,123 | | | | 0.7 | | |
| | 84,700 | | | | @ | | | Teradata Corp. | | | 3,486,252 | | | | 0.9 | | |
| | 221,500 | | | | | | | Texas Instruments, Inc. | | | 7,198,750 | | | | 1.8 | | |
| | 99,100 | | | | @ | | | VeriSign, Inc. | | | 3,237,597 | | | | 0.8 | | |
| | 29,900 | | | | @ | | | VMware, Inc. | | | 2,658,409 | | | | 0.7 | | |
| | 288,700 | | | | | | | Xerox Corp. | | | 3,325,824 | | | | 0.8 | | |
| | 250,200 | | | | @ | | | Yahoo!, Inc. | | | 4,160,826 | | | | 1.0 | | |
| | | | | | | | | Other Securities | | | 98,810,769 | | | | 24.6 | | |
| | | | | | | | | | | | | | 349,667,237 | | | | 87.1 | | |
| | | Telecommunication Services: 2.4% | | | |
| | 73,600 | | | | @ | | | American Tower Corp. | | | 3,800,704 | | | | 0.9 | | |
| | 112,600 | | | | | | | AT&T, Inc. | | | 3,308,188 | | | | 0.8 | | |
| | 174,700 | | | | | | | VimpelCom Ltd. ADR | | | 2,627,488 | | | | 0.7 | | |
| | | | | | | | | | | | | | 9,736,380 | | | | 2.4 | | |
| | | | | | | | | Total Common Stock
( Cost $291,010,051 ) | | | 388,384,956 | | | | 96.7 | | |
| SHORT-TERM INVESTMENTS: 5.4% | | | |
| | | Mutual Funds: 3.6% | | | |
| | 14,344,364 | | | | | | | Blackrock Liquidity
Funds TempFund
Portfolio - Class I | | | 14,344,364 | | | | 3.6 | | |
| | | | | | | | | Total Mutual Funds
( Cost $14,344,364 ) | | | 14,344,364 | | | | 3.6 | | |
| | | Securities Lending Collateralcc: 1.8% | | | |
| | 6,905,608 | | | | | | | BNY Mellon
Overnight
Government Fund (1) | | | 6,905,608 | | | | 1.7 | | |
| | 396,801 | | | | R | | | BNY Institutional
Cash Reserves Fund,
Series B (1)(2) | | | 317,441 | | | | 0.1 | | |
| | | | | | | | | Total Securities
Lending Collateral
( Cost $7,302,409 ) | | | 7,223,049 | | | | 1.8 | | |
| | | | | | | | | Total Short-Term
Investments
( Cost $21,646,773 ) | | | 21,567,413 | | | | 5.4 | | |
| | | | | | | | | Total Investments in
Securities
( Cost $312,656,824 ) * | | $ | 409,952,369 | | | | 102.1 | | |
| | | | | | | | | Other Assets and
Liabilities - Net | | | (8,390,227 | ) | | | (2.1 | ) | |
| | | | | | | | | Net Assets | | $ | 401,562,142 | | | | 100.0 | | |
See Accompanying Notes to Financial Statements
89
ING BLACKROCK SCIENCE AND SUMMARY PORTFOLIO OF INVESTMENTS
TECHNOLOGY OPPORTUNITIES PORTFOLIO AS OF DECEMBER 31, 2010 ( CONTINUED)
"Other Securities" represents issues not identified as the top 50 holdings in terms of market value and issues or issuers not exceeding 1% of net assets individually or in aggregate respectively as of December 31, 2010.
The following footnotes apply to either the individual securities noted or one or more of the securities aggregated and listed as a single line item.
@ Non-income producing security
ADR American Depositary Receipt
cc Securities purchased with cash collateral for securities loaned.
(1) Collateral received from brokers for securities lending was invested in these short-term investments.
(2) On September 12, 2008, BNY established a separate sleeve of the Institutional Cash Reserves Fund (Series B) to hold certain Lehman Brothers defaulted debt obligations. The Portfolio's position in Series B is being fair valued daily. Please see the accompanying Notes to Financial Statements for additional details on securities lending.
R Restricted security
L Loaned security, a portion or all of the security is on loan at December 31, 2010.
* Cost for federal income tax purposes is $317,696,759.
| Net unrealized appreciation consists of: | |
| Gross Unrealized Appreciation | | $ | 100,870,795 | | |
| Gross Unrealized Depreciation | | | (8,615,185 | ) | |
| Net Unrealized Appreciation | | $ | 92,255,610 | | |
Fair Value Measurements^
The following is a summary of the fair valuations according to the inputs used as of December 31, 2010 in valuing the Portfolio's assets and liabilities:
| | | Quoted Prices
in Active Markets
for Identical Investments
(Level 1) | | Other
Observable
Inputs#
(Level 2) | | Significant
Unobservable
Inputs
(Level 3) | | Fair Value
at
12/31/10 | |
| Asset Table | |
| Investments, at value | |
| Common Stock | |
| Consumer Discretionary | | $ | 7,886,895 | | | $ | 923,369 | | | $ | — | | | $ | 8,810,264 | | |
| Health Care | | | 14,560,866 | | | | 3,219,949 | | | | — | | | | 17,780,815 | | |
| Industrials | | | — | | | | 2,390,260 | | | | — | | | | 2,390,260 | | |
| Information Technology | | | 337,904,309 | | | | 11,762,928 | | | | — | | | | 349,667,237 | | |
| Telecommunication Services | | | 9,736,380 | | | | — | | | | — | | | | 9,736,380 | | |
| Total Common Stock | | | 370,088,450 | | | | 18,296,506 | | | | — | | | | 388,384,956 | | |
| Short-Term Investments | | | 21,249,972 | | | | — | | | | 317,441 | | | | 21,567,413 | | |
| Total Investments, at value | | $ | 391,338,422 | | | $ | 18,296,506 | | | $ | 317,441 | | | $ | 409,952,369 | | |
| Other Financial Instruments+: | |
| Forward foreign currency contracts | | | — | | | | 126,112 | | | | — | | | | 126,112 | | |
| Total Assets | | $ | 391,338,422 | | | $ | 18,422,618 | | | $ | 317,441 | | | $ | 410,078,481 | | |
| Liabilities Table | |
| Other Financial Instruments+: | |
| Forward foreign currency contracts | | $ | — | | | $ | (59,601 | ) | | $ | — | | | $ | (59,601 | ) | |
| Total Liabilities | | $ | — | | | $ | (59,601 | ) | | $ | — | | | $ | (59,601 | ) | |
See Accompanying Notes to Financial Statements
90
ING BLACKROCK SCIENCE AND SUMMARY PORTFOLIO OF INVESTMENTS
TECHNOLOGY OPPORTUNITIES PORTFOLIO AS OF DECEMBER 31, 2010 ( CONTINUED)
The following is a reconciliation of the fair valuations using significant unobservable inputs (Level 3) for the Portfolio's assets and liabilities during the period ended December 31, 2010:
| | | Beginning
Balance
12/31/2009 | | Purchases | | Sales | | Accrued
Discounts/
(Premiums) | | Total
Realized
Gain/(Loss) | | Total
Unrealized
Appreciation/
(Depreciation) | | Transfers
Into
Level 3 | | Transfers
Out of
Level 3 | | Ending
Balance at
12/31/2010 | |
| Asset Table | |
| Investments, at value | |
Short-Term
Investments | | $ | 317,441 | | | $ | — | | | $ | — | | | $ | — | | | $ | — | | | $ | — | | | $ | — | | | $ | — | | | $ | 317,441 | | |
Total Investments,
at value | | $ | 317,441 | | | $ | — | | | $ | — | | | $ | — | | | $ | — | | | $ | — | | | $ | — | | | $ | — | | | $ | 317,441 | | |
As of December 31, 2010, total change in unrealized gain (loss) on Level 3 securities still held at period end and included in the change in net assets was $0.
^ See Note 2, "Significant Accounting Policies" in the Notes to Financial Statements for additional information.
'+ Other Financial Instruments are derivatives not reflected in the Summary Portfolio of Investments and may include open forward foreign currency contracts, futures, swaps, and written options. Forward foreign currency contracts and futures are reported at their unrealized gain/loss at measurement date which represents the amount due to/from the Portfolio. Swaps and written options are reported at their market value at measurement date. Transfers in or out of Level 3 represents either the beginning value (for transfers in), or the ending value (for transfers out) of any security or derivative instrument where a change in the pricing level occurred from the beginning to the end of the period. It is the policy of the Portfolio to recognize transfers at the end of the reporting period.
# The earlier close of the foreign markets gives rise to the possibility that significant events, including broad market moves, may have occurred in the interim and may materially affect the value of those securities. To account for this, the Portfolio may frequently value many of its foreign equity securities using fair value prices based on third party vendor modeling tools to the extent available. Accordingly, a significant portion of the Portfolio's investments are categorized as Level 2 investments.
At December 31, 2010 the following forward foreign currency contracts were outstanding for the ING BlackRock Science and Technology Opportunities Portfolio:
| Counterparty | | Currency | | Buy/Sell | | Settlement
Date | | In Exchange
For | | Fair Value | | Unrealized
Appreciation
(Depreciation) | |
Citigroup, Inc.
| | Japanese Yen
JPY166,542,000 | | BUY | | 1/19/11 | | $ | 1,985,801 | | | $ | 2,051,723 | | | $ | 65,922 | | |
Citigroup, Inc.
| | Japanese Yen
JPY1,156,000 | | BUY | | 1/19/11 | | | 13,791 | | | | 14,241 | | | | 450 | | |
Deutsche Bank AG
| | Japanese Yen
JPY32,259,000 | | BUY | | 1/19/11 | | | 384,193 | | | | 397,416 | | | | 13,223 | | |
| | | | | | | | | | | | | | | | | | | | | | | $ | 79,595 | | |
Citigroup, Inc.
| | British Pound
GBP1,009,000 | | SELL | | 1/19/11 | | $ | 1,617,260 | | | $ | 1,572,888 | | | $ | 44,372 | | |
Citigroup, Inc.
| | Japanese Yen
JPY618,111,000 | | SELL | | 1/19/11 | | | 7,613,611 | | | | 7,614,850 | | | | (1,239 | ) | |
Citigroup, Inc.
| | Japanese Yen
JPY33,136,000 | | SELL | | 1/19/11 | | | 409,174 | | | | 408,221 | | | | 953 | | |
Citigroup, Inc.
| | Swiss Franc
CHF144,000 | | SELL | | 1/19/11 | | | 149,743 | | | | 154,051 | | | | (4,308 | ) | |
Citigroup, Inc.
| | Hong Kong Sar Dollar
HKD277,000 | | SELL | | 1/19/11 | | | 35,699 | | | | 35,644 | | | | 55 | | |
Deutsche Bank AG
| | Swiss Franc
CHF2,368,000 | | SELL | | 1/19/11 | | | 2,479,236 | | | | 2,533,290 | | | | (54,054 | ) | |
Deutsche Bank AG
| | British Pound
GBP63,000 | | SELL | | 1/19/11 | | | 99,345 | | | | 98,208 | | | | 1,137 | | |
| | | | | | | | | | | | | | | | | | | | | | | $ | (13,084 | ) | |
See Accompanying Notes to Financial Statements
91
ING BLACKROCK SCIENCE AND SUMMARY PORTFOLIO OF INVESTMENTS
TECHNOLOGY OPPORTUNITIES PORTFOLIO AS OF DECEMBER 31, 2010 (CONTINUED)
A summary of derivative instruments by primary risk exposure is outlined in the following tables.
The fair value of derivative instruments as of December 31, 2010 was as follows:
Derivatives not accounted
for as hedging instruments | | Location on Statement of Assets and Liabilities | | Fair Value | |
| Asset Derivatives | |
| Foreign exchange contracts | | Unrealized appreciation on forward foreign currency contracts | | $ | 126,112 | | |
| Total Asset Derivatives | | | | $ | 126,112 | | |
| Liability Derivatives | |
| Foreign exchange contracts | | Unrealized depreciation on forward foreign currency contracts | | $ | 59,601 | | |
| Total Liability Derivatives | | | | $ | 59,601 | | |
The effect of derivative instruments on the Portfolio's Statement of Operations for the year ended December 31, 2010 was as follows:
| Amount of Realized Gain or (Loss) on Derivatives Recognized in Income | |
| Derivatives not accounted for as hedging instruments | | Foreign currency
related transactions* | |
| Foreign exchange contracts | | $ | (1,028,383 | ) | |
| Total | | $ | (1,028,383 | ) | |
| Change in Unrealized Appreciation or (Depreciation) on Derivatives Recognized in Income | |
| Derivatives not accounted for as hedging instruments | | Foreign currency
related transactions* | |
| Foreign exchange contracts | | $ | (216,721 | ) | |
| Total | | $ | (216,721 | ) | |
* Amounts recognized for forward foreign currency contracts are included in net realized gain (loss) on foreign currency related transactions and net change in unrealized appreciation or depreciation on foreign currency related transactions.
See Accompanying Notes to Financial Statements
92
TAX INFORMATION (UNAUDITED)
Dividends paid during the year ended December 31, 2010 were as follows:
| Portfolio Name | | Type | | Per Share Amount | |
| ING Balanced Portfolio | |
| Class I | | NII | | $ | 0.3035 | | |
| Class S | | NII | | $ | 0.2815 | | |
| ING Growth and Income Portfolio | |
| Class ADV | | NII | | $ | 0.1867 | | |
| Class I | | NII | | $ | 0.2262 | | |
| Class S | | NII | | $ | 0.1737 | | |
| Class S2 | | NII | | $ | 0.1582 | | |
| ING Small Company Portfolio | |
| Class ADV | | NII | | $ | 0.0816 | | |
| Class I | | NII | | $ | 0.0867 | | |
| Class S | | NII | | $ | 0.0592 | | |
| Class S2 | | NII | | $ | 0.0505 | | |
| Portfolio Name | | Type | | Per Share Amount | |
| ING Intermediate Bond Portfolio | |
| Class ADV | | NII | | $ | 0.6259 | | |
| Class I | | NII | | $ | 0.6365 | | |
| Class S | | NII | | $ | 0.6041 | | |
| Class S2 | | NII | | $ | 0.5858 | | |
| ING Money Market Portfolio | |
| Class I | | NII | | $ | 0.0004 | | |
| Class S(1) | | NII | | $ | 0.0000 | | |
| Class I | | ROC | | $ | 0.0020 | | |
NII — Net investment income
ROC — Return of capital
(1) Commenced operations March 15, 2010; amount is less than $0.00005.
Of the ordinary distributions made during the year ended December 31, 2010, the following percentages qualify for the dividends received deduction (DRD) available to corporate shareholders:
| ING Balanced Portfolio | | | 40.09 | % | |
| ING Growth and Income Portfolio | | | 100.00 | % | |
| ING Small Company Portfolio | | | 100.00 | % | |
For the year ended December 31, 2010, the following are percentages of ordinary income dividends paid by the Portfolios that are designated as qualifying dividend income (QDI) subject to reduced income tax rates for individuals:
| ING Growth and Income Portfolio | | | 100.00 | % | |
Above figures may differ from those cited elsewhere in this report due to differences in the calculation of income and gains under U.S. generally accepted accounting principles (book) purposes and Internal Revenue Service (tax) purposes.
Shareholders are strongly advised to consult their own tax advisers with respect to the tax consequences of their investments in the Portfolios. In January, shareholders, excluding corporate shareholders, receive an IRS 1099-DIV regarding the federal tax status of the dividends and distributions they received in the calendar year.
93
DIRECTOR/TRUSTEE AND OFFICER INFORMATION (UNAUDITED)
The business and affairs of the Registrants are managed under the direction of the Board. A Director/Trustee who is not an interested person of the Company, as defined in the 1940 Act, is an independent director ("Non-Interested Director/Trustee"). The Directors/Trustees and Officers of the Registrants are listed below. The Statement of Additional Information includes additional information about directors of the Registrants and is available, without charge, upon request at (800) 992-0180.
Name, Address
and Age | | Position(s)
held with the
Company/Trust | | Term of
Office and
Length of
Time
Served(1) | | Principal
Occupation(s)
During the
Past 5 Years* | | Number of
Funds in
Fund Complex
Overseen by
Director/Trustee(2) | | Other
Board Positions
Held by
Director/Trustee | |
| Independent Directors/Trustees: | |
|
Albert E. DePrince, Jr.
7337 E. Doubletree Ranch Rd.
Suite 100
Scottsdale, Arizona 85258
Age: 69 | | Director/ Trustee | | June 1998 - Present | | Professor of Economics and Finance, Middle Tennessee State University (August 1991 - Present). Formerly, Director of Business and Economics Research Center, Middle Tennessee State University (1999 - 2002); Chief Economist, Marine Midland Bank (1987 - 1990); Various Management Positions, Marine Midland Bank (1978 - 1990). Ph.D. in Economics Published numerous scholarly papers and journal articles in the areas of financial markets, financial institutions, corporate finance and monetary policy. | | | 37 | | | Academy of Economics and Finance (February 2002 - Present). | |
|
Sidney Koch
7337 E. Doubletree Ranch Rd.
Suite 100
Scottsdale, Arizona 85258
Age: 75 | | Director/ Trustee | | April 1994 - Present | | Retired. Self-Employed Consultant (June 2000 - Present). Formerly, Senior Adviser, Hambro America, Inc. (1993 - 2000); Executive Vice President of Investment Banking, Daiwa Securities America, Inc. (1986 - 1993). | | | 37 | | | None. | |
|
Corine T. Norgaard
7337 E. Doubletree Ranch Rd.
Suite 100
Scottsdale, Arizona 85258
Age: 73 | | Director/ Trustee | | June 1991 - Present | | President and Owner, Retirement Options, LLC, a training provider for retirement coaches (August 2009 - Present) Formerly, President, Thompson Enterprises (September 2004 - September 2005); Dean of the Barney School of Business, University of Hartford (August 1996 - June 2004). Various other academic positions (1969 - 1993). Certified Public Accountant Ph. D in Accounting and Business | | | 37 | | | MassMutual Corporate Investors and MassMutual Participation Investors (April 1997 - Present); MassMutual Premier Funds (20 funds), Chair of Audit Committee (December 2004 - Present); and MML Series Investment Funds II (8 funds), Chair of Audit Committee (December 2005 - Present). | |
|
94
DIRECTOR/TRUSTEE AND OFFICER INFORMATION (UNAUDITED) (CONTINUED)
Name, Address
and Age | | Position(s)
held with the
Company/Trust | | Term of
Office and
Length of
Time
Served(1) | | Principal
Occupation(s)
During the
Past 5 Years* | | Number of
Funds in
Fund Complex
Overseen by
Director/Trustee(2) | | Other
Board Positions
Held by
Director/Trustee | |
Joseph E. Obermeyer
7337 E. Doubletree Ranch Rd.
Suite 100
Scottsdale, Arizona 85258
Age: 53 | | Director/ Trustee | | January 2003 - Present | | President, Obermeyer & Associates, Inc., a provider of financial and economic consulting services (November 1999 - Present). Formerly, Senior Manager, Arthur Anderson LLP (1995 - 1999); Senior Manager, Coopers & Lybrand, LLP (1993 - 1995); Manager, Price Waterhouse (1988 - 1993); Second Vice President, Smith Barney (1985 - 1988); Consultant, Arthur Anderson & Co. (1984 - 1985). | | | 37 | | | None. | |
|
Russell Jones
7337 E. Doubletree Ranch Rd.
Suite 100
Scottsdale, Arizona 85258
Age: 66 | | Director/ Trustee | | December 2007 - Present | | Retired. Formerly, Senior Vice President, Chief Investment Officer and Treasurer, and other various positions including Principal Investor Relations Officer, Principal Public Relations Officer and Corporate Parent Treasurer, Kaman Corporation, an aerospace and industrial distribution manufacturer (April 1973 - March 2008). President, Hartford Area Business Economists (1986 - 1987) and Corporate Loan Officer and Credit Analyst, Hartford National Bank (1966 - 1973). Certified AARP Tax Counselor (2011). | | | 37 | | | Independent Director, CIGNA Mutual Funds (8 funds), Chair of Contracts Committee (1995 - 2005). | |
|
95
DIRECTOR/TRUSTEE AND OFFICER INFORMATION (UNAUDITED) (CONTINUED)
Name, Address
and Age | | Position(s)
held with the
Company/Trust | | Term of
Office and
Length of
Time
Served(1) | | Principal
Occupation(s)
During the
Past 5 Years* | | Number of
Funds in
Fund Complex
Overseen by
Director/Trustee(2) | | Other
Board Positions
Held by
Director/Trustee | |
| Directors/Trustees who are "Interested Persons"(4) | |
|
Shaun Mathews(3)(4)
7337 E. Doubletree Ranch Rd.
Suite 100
Scottsdale, Arizona 85258
Age: 55 | | Director/ Trustee | | December 2007 - Present | | President and Chief Executive Officer, ING Investments, LLC (5) (November 2006 - Present). Formerly, Head of ING Mutual Funds and Investment Products (November 2004 - November 2006). | | | 175 | | | ING Retirement Holdings, Inc. (September 1998 - Present); ING Services Holding Company, Inc. (May 2000 - Present); ING Financial Advisers, LLC (April 2002 - Present); Southland Life Insurance Company (June 2002 - Present); ING Capital Corporation, LLC and ING Investments Distributor, LLC(6) (December 2005 - Present); ING Funds Services, LLC(7), ING Investments, LLC(5) and ING Pilgrim Funding, Inc. (March 2006 - Present); and Directed Services LLC (December 2006 - Present)(8). | |
|
* The information reported includes the principle occupation during the last five years for each Director and other information relating to the professional experience, attributes and skills relevant to each Director's qualifications to serve as Director.
(1) Directors/Trustees serve until their successors are duly elected and qualified.
(2) For the purposes of this table (except for Mr. Mathews), "Fund Complex" means the following investment companies: ING Series Fund, Inc.; ING Strategic Allocation Portfolios, Inc.; ING Variable Funds; ING Variable Portfolios, Inc.; ING Balanced Portfolio, Inc.; ING Intermediate Bond Portfolio; and ING Money Market Portfolio.
(3) For Mr. Mathews, the Fund Complex also includes the following investment companies: ING Asia Pacific High Dividend Equity Income Fund, ING Emerging Markets High Dividend Equity Fund; ING Emerging Markets Local Bond Fund; ING Equity Trust; ING Funds Trust; ING Global Equity Dividend and Premium Opportunity Fund; ING Global Advantage and Premium Opportunity Fund; ING Infrastructure, Industrials, and Materials Fund; ING International High Dividend Equity Income Fund; ING Investors Trust; ING Mayflower Trust; ING Mutual Funds; ING Partners, Inc.; ING Prime Rate Trust; ING Risk Managed Natural Resources Fund; ING Senior Income Fund; ING Separate Portfolios Trust; ING Variable Insurance Trust; and ING Variable Products Trust.
(4) "Interested person," as defined in the 1940 Act, by virtue of this Director's/Trustee's affiliation with any of the Funds, ING or any of ING's affiliates.
(5) ING Investments, LLC was previously named ING Pilgrim Investments, LLC. ING Pilgrim Investments, LLC is the successor in interest to ING Pilgrim Investments, Inc., which was previously known as Pilgrim Investments, Inc. and before that was known as Pilgrim America Investments, Inc.
(6) ING Investments Distributor, LLC was previously named ING Funds Distributor, LLC. ING Funds Distributor, LLC is the successor in interest to ING Funds Distributor, Inc., which was previously known as ING Pilgrim Securities, Inc., and before that, was known as Pilgrim Securities, Inc., and before that was known as Pilgrim America Securities, Inc.
(7) ING Funds Services, LLC was previously named ING Pilgrim Group, LLC. ING Pilgrim Group, LLC is the successor in interest to ING Pilgrim Group, Inc., which was previously known as Pilgrim Group, Inc. and before that was known as Pilgrim America Group, Inc.
(8) Directed Services LLC is the successor in interest to Directed Services, Inc.
96
DIRECTOR/TRUSTEE AND OFFICER INFORMATION (UNAUDITED) (CONTINUED)
Name, Address
and Age | | Position(s) Held
With Company/Trust | | Term of Office and
Length of Time Served(1) | | Principal Occupation(s) -
During the Past 5 Years | |
Shaun P. Mathews(5)
7337 East Doubletree Ranch Rd.
Suite 100
Scottsdale, Arizona 85258
Age: 55 | | President and Chief Executive Officer | | December 2006 - Present | | President and Chief Executive Officer, ING Investments, LLC (November 2006 - Present). Formerly, Head of ING Mutual Funds and Investment Products (November 2004 - November 2006). | |
|
Michael J. Roland
7337 East Doubletree Ranch Rd.
Suite 100
Scottsdale, Arizona 85258
Age: 52 | | Executive Vice President | | April 2002 - Present | | Executive Vice President and Chief Operating Officer, ING Investments, LLC(2) and ING Funds Services, LLC(3) (January 207 - Present). Formerly, Executive Vice President, Head of Product Management (January 2005 - January 2007). | |
|
Stanley D. Vyner
230 Park Avenue
New York, New York 10169
Age: 60 | | Executive Vice President | | March 2002 - Present | | Executive Vice President, ING Investments, LLC(2) (July 2000 - Present) and Chief Investment Risk Officer, ING Investments, LLC(2) (January 2003 - Present). | |
|
Joseph M. O'Donnell
7337 East Doubletree Ranch Rd.
Suite 100
Scottsdale, Arizona 85258
Age: 56 | | Executive Vice President and Chief Compliance Officer | | March 2006 - Present November 2004 - Present | | Chief Compliance Officer of the ING Funds (November 2004 - Present); Executive Vice President of the ING Funds (March 2006 - Present); Chief Compliance Officer of ING Investments, LLC(2) (March 2006 - July 2008 and October 2009 - Present); and Investment Advisor Chief Compliance Officer, Directed Services LLC(6) (March 2006 - July 2008 and October 2009 - Present). Formerly, Investment Advisor Chief Compliance Officer, ING Life Insurance and Annuity Company (March 2006 - December 2006). | |
|
Todd Modic
7337 East Doubletree Ranch Rd.
Suite 100
Scottsdale, Arizona 85258
Age: 43 | | Senior Vice President, Chief/Principal Financial Officer and Assistant Secretary | | March 2005 - Present | | Senior Vice President, ING Funds Services, LLC(3) (March 2005 - Present). | |
|
Kimberly A. Anderson
7337 East Doubletree Ranch Rd.
Suite 100
Scottsdale, Arizona 85258
Age: 46 | | Senior Vice President | | December 2003 - Present | | Senior Vice President, ING Investments, LLC(2) (October 2003 - Present). | |
|
Robert Terris
7337 East Doubletree Ranch Rd.
Suite 100
Scottsdale, Arizona 85258
Age: 40 | | Senior Vice President | | June 2006 - Present | | Senior Vice President, Head of Division Operations, ING Funds Services, LLC(3) (May 2006 - Present). Formerly, Vice President of Administration, ING Funds Services, LLC(3) (October 2001 - May 2006). | |
|
Robyn L. Ichilov
7337 East Doubletree Ranch Rd.
Suite 100
Scottsdale, Arizona 85258
Age: 43 | | Vice President and Treasurer | | March 2002 - Present | | Vice President and Treasurer, ING Funds Services, LLC(3) (November 1995 - Present) and ING Investments, LLC(2) (August 1997 - Present). | |
|
Lauren D. Bensinger
7337 East Doubletree Ranch Rd.
Suite 100
Scottsdale, Arizona 85258
Age: 56 | | Vice President | | March 2003 - Present | | Vice President, ING Investments, LLC(2) and ING Funds Services, LLC(3) (February 1996 - Present); Director of Compliance, ING Investments, LLC(2) (October 2004 - Present); and Vice President and Money Laundering Reporting Officer, ING Investments Distributor, LLC(4) (April 2010 - Present). Formerly, Chief Compliance Officer, ING Investments Distributor, LLC(4) (August 1995 - April 2010). | |
|
William Evans
10 State House Square
Hartford, Connecticut 06103
Age: 38 | | Vice President | | September 2007 - Present | | Senior Vice President (March 2010 - Present) and Head of Manager Research and Selection Group (April 2007 - Present). Formerly, Vice President, U.S. Mutual Funds and Investment Products (May 2005 - April 2007). | |
|
97
DIRECTOR/TRUSTEE AND OFFICER INFORMATION (UNAUDITED) (CONTINUED)
Name, Address
and Age | | Position(s) Held
With Company/Trust | | Term of Office and
Length of Time Served(1) | | Principal Occupation(s) -
During the Past 5 Years | |
Maria M. Anderson
7337 East Doubletree Ranch Rd.
Suite 100
Scottsdale, Arizona 85258
Age: 52 | | Vice President | | September 2004 - Present | | Vice President, ING Funds Services, LLC(3) (September 2004 - Present). | |
|
Denise Lewis
7337 East Doubletree Ranch Rd.
Suite 100
Scottsdale, Arizona 85258
Age: 47 | | Vice President | | April 2007 - Present | | Vice President, ING Funds Services, LLC (December 2006 - Present). Formerly, Senior Vice President, UMB Investment Services Group, LLC (November 2003 - December 2006). | |
|
Kimberly K. Springer
7337 East Doubletree Ranch Rd.
Suite 100
Scottsdale, Arizona 85258
Age: 53 | | Vice President | | March 2006 - Present | | Vice President, ING Investment Management - ING Funds (March 2010 - Present); Vice President, ING Funds Services, LLC(3) (March 2006 - Present) and Managing Paralegal, Registration Statements (June 2003 - Present). Formerly, Assistant Vice President, ING Funds Services, LLC(3) (August 2004 - March 2006). | |
|
Craig Wheeler
7337 East Doubletree Ranch Rd.
Suite 100
Scottsdale, Arizona 85258
Age: 41 | | Assistant Vice President | | June 2008 - Present | | Assistant Vice President - Director of Tax, ING Funds Services (March 2008 - Present). Formerly, Tax Manager, ING Funds Services (March 2005 - March 2008). | |
|
Huey P. Falgout, Jr.
7337 East Doubletree Ranch Rd.
Suite 100
Scottsdale, Arizona 85258
Age: 47 | | Assistant Secretary | | September 2003 - Present | | Senior Vice President and Chief Counsel, ING Investment Management - ING Funds (March 2010 - Present). Formerly, Chief Counsel, ING Americas, U.S. Legal Services (October 2003 - March 2010). | |
|
Theresa K. Kelety
7337 East Doubletree Ranch Rd.
Suite 100
Scottsdale, Arizona 85258
Age: 47 | | Secretary | | September 2003 - Present | | Vice President and Senior Counsel, ING Investment Management - ING Funds (March 2010 -Present). Formerly, Senior Counsel, ING Americas, U.S. Legal Services (April 2008 - March 2010) and Counsel, ING Americas, U.S. Legal Services (April 2003 - April 2008). | |
|
Kathleen Nichols
7337 East Doubletree Ranch Rd.
Suite 100
Scottsdale, Arizona 85258
Age: 35 | | Assistant Secretary | | June 2008 - Present | | Vice President and Counsel, ING Investment Management - ING Funds (March 2010 - Present). Formerly, Counsel, ING Americas, U.S. Legal Services (February 2008 - March 2010) and Associate, Ropes & Gray LLP (September 2005 - February 2008) | |
|
Paul Caldarelli
7337 East Doubletree Ranch Rd.
Suite 100
Scottsdale, Arizona 85258
Age: 59 | | Assistant Secretary | | August 2010 - Present | | Vice President and Senior Counsel, ING Investment Management - ING Funds (March 2010-Present). Formerly, Senior Counsel, ING Americas, U.S. Legal Services (April 2008 - March 2010) and Counsel, ING Americas, U.S. Legal Services (May 2005 - April 2008). | |
|
(1) The officers hold office until the next annual meeting of the Trustees and until their successors shall have been elected and qualified.
(2) ING Investments, LLC was previously named ING Pilgrim Investments, LLC. ING Pilgrim Investments, LLC is the successor in interest to ING Pilgrim Investments, Inc., which was previously known as Pilgrim Investments, Inc. and before that was known as Pilgrim America Investments, Inc.
(3) ING Funds Services, LLC was previously named ING Pilgrim Group, LLC. ING Pilgrim Group, LLC is the successor in interest to ING Pilgrim Group, Inc., which was previously known as Pilgrim Group, Inc. and before that was known as Pilgrim America Group, Inc.
(4) ING Investments Distributor, LLC was previously named ING Funds Distributor, LLC. ING Funds Distributor, LLC is the successor in interest to ING Funds Distributor, Inc., which was previously known as ING Pilgrim Securities, Inc., and before that, was known as Pilgrim Securities, Inc., and before that was known as Pilgrim America Securities, Inc.
(5) Mr. Mathews commenced services as CEO and President of the ING Funds on November 11, 2006.
(6) Directed Services LLC is the successor in interest to Directed Services, Inc.
98
ADVISORY CONTRACT APPROVAL DISCUSSION (UNAUDITED)
BOARD CONSIDERATION AND APPROVAL OF INVESTMENT ADVISORY AND SUB-ADVISORY AGREEMENTS
The Investment Company Act of 1940, as amended (the "1940 Act"), provides, in substance, that each investment advisory agreement and sub-advisory agreement for a mutual fund will terminate automatically after the initial term of the agreement (which term may not exceed two years), unless continuation of the agreement is approved annually by the Board of Trustees or Directors, as the case may be (the "Board") of the fund, including a majority of the Trustees/Directors who have no direct or indirect interest in the agreement and who are not "interested persons" of the fund (the "Independent Trustees"). Consistent with this requirement of the 1940 Act, the Board of ING Balanced Portfolio, Inc., ING Strategic Allocation Portfolios, Inc., ING Intermediate Bond Portfolio, ING Money Market Portfolio, ING Variable Funds, ING Variable Portfolios, Inc. and ING Series Fund, Inc., with respect to each portfolio series thereof (each, a "Fund" and, collectively, the "Funds") has established a process for considering on an annual basis approval of the continuation of the investment management agreement for each Fund (the "Advisory Agreement") with ING Investments, LLC (the "Adviser") and the sub-advisory agreement for each Fund (collectively, the "Sub-Advisory Agreements") with each sub-adviser of the Funds (the "Sub-Advisers"). Set forth below is a description of the process followed by the Board in considering approval of the continuation of each Advisory and Sub-Advisory Agreement (collectively, the "Agreements"), together with an explanation of many of the factors considered and related conclusions reached by the Board in voting to approve the continuation of each Agreement for an additional one-year period commencing January 1, 2011, followed by specific considerations with respect to each Fund covered by this report (each, a "Portfolio").
Overview of the Review Process
At a meeting of the Board held on December 15, 2010, the Board, including all of the Independent Trustees, voted to approve continuation of each of the existing Agreements for the Funds. Prior to voting such approvals, the Board received the affirmative recommendation of the Contracts Committee of the Board, which is a Committee of the Board comprised of all of the Independent Trustees and exclusively of the Independent Trustees. The Contracts Committee recommended approval of the Agreements after completing an extensive review of information requested by the Committee from the Adviser and each Sub-Adviser, including the following: (1) comparative performance data for each Fund for various time periods; (2) comparative data regarding management fees, including data regarding the fees charged by the Adviser and Sub-Advisers for managing other mutual funds and institutional accounts using investment strategies and techniques similar to those used in managing the Funds; (3) comparative data regarding the total expenses of each Fund; (4) copies of each form of Advisory Agreement and Sub-Advisory Agreement; (5) copies of the codes of ethics of the Adviser and each Sub-Adviser, together with information relating to the manner in which each code is administered; (6) financial statements of the Adviser and each Sub-Adviser; (7) profitability analyses for the Adviser and each Sub-Adviser with respect to each Fund, and all Funds as a group; (8) descriptions of the qualifications of the investment personnel responsible for managing each Fund, the structure of their compensation and their responsibilities with respect to managing other accounts or mutual funds; (9) descriptions of the services provided to the Funds, including the investment strategies and techniques used by each Sub-Adviser in managing the Funds; (10) data relating to portfolio turnover and brokerage practices, including practices with respect to the acquisition of research through "soft dollar" benefits received in connection with the Funds' brokerage; (11) descriptions of the policies and procedures of the various service providers of the Funds for protecting the privacy of shareholder information; (12) information relating to projected sales and redemptions of Fund shares and business plans relating to the Adviser's mutual fund platform; (13) descriptions of the business continuity and disaster recovery plans of the Adviser and each Sub-Adviser; (14) descriptions of various compliance programs of the Adviser and Sub-Advisers, including the Adviser's programs for monitoring and enforcing compliance with the Funds' policies with respect to market-timing, late trading and selective portfolio disclosure; (15) independent reports analyzing the quality of the trade execution services performed by Sub-Advisers for the Funds; and (16) other information relevant to an evaluation of the nature, extent and quality of the services provided by the Adviser and each Sub-Adviser in response to a series of detailed questions posed by Goodwin Procter LLP, legal counsel for the Independent Trustees ("Independent Counsel") on behalf of the Independent Trustees.
99
ADVISORY CONTRACT APPROVAL DISCUSSION (UNAUDITED) (CONTINUED)
The Contracts Committee began the formal review process in August 2010 when it met separately with Independent Counsel to review the information to be requested from management and the methodology to be used in determining the selected peer groups for comparing performance and expenses (the "Peer Group Methodology"). Prior to the August meeting, the Contracts Committee engaged an independent consultant (the "Independent Consultant") to evaluate, and make recommendations with respect to, the Peer Group Methodology. The Independent Consultant's findings were reported to the Contracts Committee at the August meeting and incorporated into the Peer Group Methodology approved by the Board. The Contracts Committee then held meetings on October 19-20, 2010 and December 13-14, 2010, during which the Independent Trustees, meeting separately with Independent Counsel, reviewed and evaluated the information described above. As part of the review process, the Contracts Committee also met with representatives from the Adviser and/or the Sub-Advisers to discuss the information provided to the Committee. The Contracts Committee also considered information that had been provided by the Adviser and Sub-Advisers throughout the year at other meetings of the Contracts Committee, the Audit Committee, the Compliance Committee and the full Board.
The Independent Trustees were assisted by Independent Counsel, throughout the contract review process. The Independent Trustees relied upon the advice of Independent Counsel and their own business judgment in determining the material factors to be considered in evaluating each Advisory and Sub-Advisory Agreement and the weight to be given to each such factor. The conclusions reached by the Independent Trustees were based on a comprehensive evaluation of all of the information provided and were not the result of any one factor. Moreover, each Independent Trustee may have afforded different weight to the various factors in reaching his or her conclusions with respect to each Advisory and Sub-Advisory Agreement.
Nature, Extent and Quality of Services
In considering whether to approve the Advisory and Sub-Advisory Agreements for the Funds for the year commencing January 1, 2011, the Board evaluated the nature, extent and quality of services provided to the Funds by the Adviser and Sub-Advisers. The Board considered the investment management and related services provided by the Adviser and Sub-Advisers, including the quantity and quality of the resources available to provide such services. Among other things, the Board considered the qualifications of the individuals responsible for performing various investment related services.
The Board also considered the quality of the compliance programs of the Adviser and each Sub-Adviser, including the manner in which the Adviser and each Sub-Adviser monitor for compliance with the investment policies and restrictions of a Fund and with the Codes of Ethics of the Funds, the Adviser and the Sub-Advisers with respect to personal trading by employees with access to portfolio information. The Board also considered the actions taken by the Adviser and Sub-Advisers to establish and maintain effective disaster recovery and business continuity plans.
The Board considered the actions taken by the Adviser and its affiliated companies to administer the Funds' policies and procedures for voting proxies, valuing the Funds' assets, selective disclosure of portfolio holdings and preventing late-trading and frequent trading of Fund shares.
The Board also took into account the efforts of the Adviser and its affiliated companies to reduce the expenses of the Funds. With respect to those Funds that are sub-advised by an affiliate of the Adviser, the Board specifically noted that, in recent years, the Adviser and its affiliated companies have significantly reduced the Funds' brokerage costs and portfolio turnover rates, as well as the quantity of research acquired through the use of soft dollars from the Funds' brokerage. The Board also noted the efforts of the Adviser to optimize the number of Funds in the ING complex of mutual funds and to standardize the asset management characteristics and policies across the ING mutual fund platform. The Board considered information provided by management with respect to the progress made within ING Groep to establish an integrated global asset management firm (the "Global Transition"), including information with respect to any benefits to the Funds and their shareholders as a result of operational efficiencies achieved through the Global Transition. The Board also considered the benefits that shareholders of the Funds realize because the Funds are part of the larger ING family of mutual funds, including, in most cases, the ability of shareholders to exchange or transfer investments within the same class of shares among a wide variety of mutual funds without incurring additional sales charges. In that regard, the Board considered the potential impacts of any divestiture of its insurance business, which includes the investment management businesses, by ING Groep or significant
100
ADVISORY CONTRACT APPROVAL DISCUSSION (UNAUDITED) (CONTINUED)
change in structure of the investment management business, if any, on the services provided to the Funds by the Adviser and Sub-Advisers. The Board also considered the actions that have been taken by management to retain key investment management personnel in light of such a potential divestiture.
The Board also considered the Adviser's responsiveness and recommendations for Board action and other steps taken in response to the extraordinary dislocations experienced in the capital markets in recent years, including sustained periods of high volatility, credit disruption and government intervention. In particular, the Board considered the Adviser's efforts and expertise with respect to each of the following matters as they relate to the Funds: (i) negotiating and maintaining the availability of bank loan facilities and other sources of credit used to satisfy liquidity needs; (ii) establishing the fair value of securities and other instruments held in investment portfolios during periods of market volatility and issuer-specific disruptions; (iii) negotiating and maintaining credit support from the Funds' securities lending agent with respect to certain defaulted securities held indirectly by the Funds as collateral for securities on loan; and (iv) the ongoing monitoring of investment management processes and risk controls.
The Board's approval of the Advisory and Sub-Advisory Agreements was informed by certain information provided by the Adviser and the applicable Sub-Advisers with respect to certain actions to be taken to correct underperformance and lack of scale with respect to certain Funds as indicated in the Portfolio-by-Portfolio analysis below.
The Board concluded that the nature, extent and quality of advisory and related services provided by the Adviser and each of the Sub-Advisers, taken as a whole, are consistent with the terms of the respective Advisory and Sub-Advisory Agreements and justify the fees paid by the Funds for such services.
Fund Performance
The Board reviewed each Fund's investment performance over various time periods on an absolute basis and relative to the performance of (i) one or more appropriate benchmark indexes (such as the S&P 500 Composite Stock Price Index), (ii) a group of similarly managed mutual funds identified by Lipper, Inc. and/or Morningstar, Inc., and (iii) similarly managed mutual funds within a specified peer group based upon the Peer Group Methodology approved by the Contracts Committee (each, a "Selected Peer Group"). The Board reviewed comparative performance data for the most recent calendar quarter, year-to-date, one-, three-, five- and ten-year periods, where applicable, ending June 30, 2010 and the most recent calendar quarter, year-to-date, one-, three-, and five-year periods ending September 30, 2010. In considering the performance of the Funds, the Board noted the instability of the markets and periods of high volatility during the prior two years and the response of the Adviser and each Sub-Adviser to such volatility. Summaries of selected portions of the performance information reviewed by the Board, together with the Board's conclusions regarding the performance of each Portfolio, are set forth below under "Portfolio-by-Portfolio Analysis."
Management Fees, Sub-Advisory Fees and Expenses
Consideration was given to the contractual investment advisory fee rates, inclusive of administrative fee rates, payable by the Funds to the Adviser and its affiliated companies (referred to collectively as "management fees") and the contractual sub-advisory fee rates payable by the Adviser to each Sub-Adviser for sub-advisory services. As part of its review, the Board considered each Fund's management fee and total expense ratio, as compared to its Selected Peer Group, both before and after giving effect to any undertaking by the Adviser to waive fees and/or limit the total expenses of a Fund. In addition, the Trustees received information regarding the fees charged by each Sub-Adviser to similarly-managed institutional accounts and other mutual funds, if any, and the comparability (or lack thereof) of the services provided by the Sub-Adviser in managing such accounts and other mutual funds to the services provided in managing the Funds. With respect to the Funds sub-advised by an affiliate of the Adviser, the Board evaluated the reasonableness of the total fees received by the Adviser and its affiliate in the aggregate under the Advisory and Sub-Advisory Agreements. With respect to those Funds sub-advised by a Sub-Adviser that is not affiliated with the Adviser, the Board considered the reasonableness of the fees payable to the Sub-Adviser by the Adviser in light of the ability of the Adviser to negotiate such fees on an arm's-length basis. Summaries of selected portions of the fee and expense information reviewed with respect to each Portfolio are set forth below under "Portfolio-by-Portfolio Analysis." After reviewing the foregoing information, and in light of the nature, extent and quality of the services provided by the Adviser and each Sub-Adviser, the Board concluded with respect to each Fund that the management fee charged to the Fund for advisory, sub-advisory and
101
ADVISORY CONTRACT APPROVAL DISCUSSION (UNAUDITED) (CONTINUED)
related services is fair and reasonable and that the total expense ratio of the Fund is reasonable.
Profitability
The Board considered information relating to revenues, expenses, and profits realized by the Adviser and each Sub-Adviser attributable to performing advisory, sub-advisory and administrative services for the Funds. With respect to Funds sub-advised by an unaffiliated Sub-Adviser, the Board did not consider the profitability of the Sub-Adviser to be a material factor because the Board believes that the Adviser negotiates sub-advisory fees with the unaffiliated Sub-Adviser on an arm's-length basis. The Board reviewed profitability data for the Adviser and its affiliated companies, including the distributor of the Funds, relating to (i) each Fund separately, (ii) all Funds as a group, (iii) all "retail" Funds as a group, and (iv) all variable insurance product Funds as a group, in each case for the one-year periods ended December 31, 2009 and December 31, 2008 and the nine-month period ended September 30, 2010. With respect to the Adviser and its affiliates, such information was prepared in accordance with a methodology approved by the Contracts Committee. The Board considered the profitability of the Adviser and its affiliated companies attributable to managing and operating each Fund both with and without the profitability of the distributor of the Funds and both before and after giving effect to any expenses incurred by the Adviser or any affiliated company in making revenue sharing or other payments to third parties, including affiliated insurance companies, for distribution and administrative services. With respect to Funds sub-advised by an affiliate of the Adviser, the Board considered the total profits derived by the Adviser and its affiliate in the aggregate attributable to managing and operating each Fund. The Board also considered other direct or indirect benefits that the Adviser and Sub-Advisers, and any affiliated companies thereof, derive from their relationships with the Funds, including the receipt by certain affiliates of the Adviser, of fees relating to the offering of bundled financial products, such as annuity contracts, and the receipt by Sub-Advisers of "soft dollar" benefits from the Funds' brokerage. The Board concluded that, in light of the nature, extent and quality of the services provided, the profits realized by the Adviser and its affiliated companies, individually and taken as a whole, with respect to providing advisory, sub-advisory and administrative services for each Fund are reasonable.
Economies of Scale
In considering the reasonableness of the management fee of each Fund, the Board considered the extent to which economies of scale can be expected to be realized by a Fund's Adviser and its affiliated companies, on the one hand, and by the Fund, on the other hand, as the assets of the Fund increase. The Board noted that the advisory fee schedule for certain Funds includes breakpoints such that, as the assets of the Fund increase, the Fund's management fee will decrease as a percentage of the Fund's total assets. The Board recognized the inherent difficulties in measuring precisely the impact of any economies of scale being realized by the Adviser and its affiliated companies with respect to their management of any one or more Funds. In an effort to determine the extent to which economies of scale, if any, will be realized by the Adviser and its affiliated companies as the assets of the Funds grow, the Board considered the profitability data described above relating to the Adviser and its affiliated companies in light of changes in the assets of the Funds over various time periods. The Board noted that the total assets under management of many of the Funds have decreased during the past several years and concluded that the economies of scale realized by the Adviser and its affiliated companies from managing the Funds have not increased with respect to such Funds. The Board also reviewed information regarding the expense ratio of each Fund in light of changes in the assets of the Funds over various time periods, noting that, as the assets of a Fund increase, the fixed expenses of the Fund, as a percentage of the total assets of the Fund, can be expected to decrease. The Board considered such expense information in light of projections provided by the Adviser with respect to the future growth of assets of the Funds. The Board also considered the extent to which economies of scale have been, or are expected to be, realized as a result of the Global Transition. Based upon the foregoing, the Board concluded that the economies of scale being realized by the Adviser and its affiliated companies do not mandate the implementation of breakpoints or additional breakpoints, as the case may be, with respect to any Fund at this time except as otherwise indicated with respect to any specific Portfolio in the Portfolio-by-Portfolio analysis.
Portfolio-by-Portfolio Analysis
In deciding to approve the continuation of each Advisory and Sub-Advisory Agreement for an additional one-year period beginning January 1, 2011, the Board took into account the specific data and
102
ADVISORY CONTRACT APPROVAL DISCUSSION (UNAUDITED) (CONTINUED)
factors identified below relating to the performance, fees and expenses of each Fund and actions being taken by the Adviser or Sub-Adviser, as the case may be, with respect to these matters. Except as otherwise indicated, the performance data described below for each Portfolio is for periods ended September 30, 2010 and the management fees and expense data described below are as of June 30, 2010.
ING Balanced Portfolio
In evaluating the investment performance of ING Balanced Portfolio, the Board noted that the Portfolio outperformed its Morningstar category median for the most recent calendar quarter, year-to-date and one-year periods but had underperformed its Morningstar category median for the three-year and five-year periods. The Board received performance information relating to a benchmark index of fixed income securities (the "FISB") and equity securities (the "ESB") from which the Board could calculate a composite benchmark index (the "Composite Benchmark") comprised of 60% ESB and 40% FISB. The Board noted that the Portfolio outperformed the Composite Benchmark for the most recent calendar quarter, one-year and year-to-date periods but underperformed for the three-year and five-year periods. The Board considered the fact that the Portfolio is ranked in its Morningstar category in the first quintile for the year-to-date and one-year periods, the second quintile for the most recent calendar quarter, in the third quintile for the three-year period, and in the fourth quintile for the five-year period. The Board noted that the Portfolio underwent a strategy change whereby the method of selecting stocks for the equity component of the Portfolio shifted from the use of a quantitative based model to a fundamental research method and that in connection therewith the Sub-adviser replaced the portfolio manager. Additionally, the Board noted that the Sub-Adviser replaced the portfolio manager for the fixed income component of the Portfolio during the first part of 2009. The Board concluded that appropriate actions are being taken to improve performance and that additional time is needed to evaluate the effectiveness of these actions.
In assessing the reasonableness of the management fee and expense ratio of ING Balanced Portfolio, the Board noted that the management fee for the Portfolio is below the median and below the average management fees of the funds in its Selected Peer Group and that the expense ratio for the Portfolio is below the median and average expense ratios of the funds in its Selected Peer Group.
ING BlackRock Science and Technology Opportunities Portfolio
In evaluating the investment performance of ING BlackRock Science and Technology Opportunities Portfolio, the Board noted that: (1) the Portfolio outperformed its Morningstar category median and benchmark index for all periods presented; and (2) the Portfolio is ranked in its Morningstar category in the third quintile for all periods presented. The Board concluded that the performance of the Portfolio has been satisfactory.
In assessing the reasonableness of the management fee and expense ratio for ING BlackRock Science and Technology Opportunities Portfolio, the Board noted that the management fee for the Portfolio is above the median and average management fees of the funds in its Selected Peer Group and that the expense ratio for the Portfolio is above the median and average expense ratios of the portfolios in its Selected Peer Group. Additionally, the Board noted that the Portfolio benefits from an expense cap implemented by the Adviser for the Portfolio, which resulted in a management fee waiver of .02 of 1% (two basis points) of the Portfolio's average net assets.
ING Growth and Income Portfolio
In evaluating the investment performance of ING Growth and Income Portfolio, the Board noted that: (1) the Portfolio outperformed its Morningstar category median for the year-to-date, three-year and five-year periods, but underperformed for the most recent calendar quarter and one-year period; (2) the Portfolio outperformed its benchmark index for the three-year and five-year periods but underperformed for the most recent calendar quarter, year-to-date and one-year periods; and (3) the Portfolio is ranked in its Morningstar category in the second quintile for the three-year and five-year periods, and in the third quintile for the most recent calendar quarter, year-to-date and one-year periods. The Board concluded that the performance of the Portfolio is satisfactory.
In assessing the reasonableness of the management fee and expense ratio for ING Growth and Income Portfolio, the Board noted that the management fee for the Portfolio is below the median and average management fees of the funds in its Selected Peer Group and that the expense ratio for the Portfolio is below the median and average expense ratios of the funds in its Selected Peer Group.
103
ADVISORY CONTRACT APPROVAL DISCUSSION (UNAUDITED) (CONTINUED)
ING Small Company Portfolio
In evaluating the investment performance of ING Small Company Portfolio, the Board noted that: (1) the Portfolio outperformed its Morningstar category median all periods presented; (2) the Portfolio underperformed its benchmark index for the most recent calendar quarter, but outperformed the benchmark index for the one-year, three-year and five-year periods; and (3) the Portfolio is ranked in its Morningstar category in the first quintile for the five-year period, in the second quintile for the three-year period, one-year period and year-to-date period and in the third quintile for the most recent calendar quarter. The Board concluded that the performance of the Portfolio is satisfactory.
In assessing the reasonableness of the management fee and expense ratio for ING Small Company Portfolio, the Board noted that the management fee for the Portfolio is below the median and average management fees of the funds in its Selected Peer Group, and that the expense ratio for the Portfolio is below the median and average expense ratios of the funds in its Selected Peer Group.
ING Intermediate Bond Portfolio
In evaluating the investment performance of ING Intermediate Bond Portfolio, the Board noted that: (1) the Portfolio outperformed its Morningstar category median for the most recent calendar quarter, year-to-date and one-year periods, but underperformed for the three-year and five-year periods; (2) the Portfolio outperformed its benchmark index for the most recent calendar quarter, year-to-date and one-year periods but underperformed for the three-year and five-year periods; and (3) the Portfolio is ranked in its Morningstar category in the first quintile for the year-to-date and one-year periods, the second quintile for the most recent calendar quarter, in the fourth quintile for the five-year period and in the fifth quintile for the three-year period. The Board noted that the Sub-Adviser replaced the portfolio manager to the Portfolio in January 2009 and that, under the direction of the new portfolio manager, the performance of the Portfolio has improved. The Board concluded that the performance of the Portfolio is satisfactory.
In assessing the reasonableness of the management fee and expense ratio for ING Intermediate Bond Portfolio, the Board noted that the management fee for the Portfolio is below the median and average management fees of the funds in its Selected Peer Group, and that the expense ratio for the Portfolio is below the median and average expense ratios of the funds in its Selected Peer Group.
ING Money Market Portfolio
In evaluating the investment performance of ING Money Market Portfolio, the Board noted that: (1) the Portfolio outperformed its Morningstar category median and its benchmark index for all periods presented; and (2) although the Portfolio is not ranked by Morningstar, the Portfolio is ranked in its Lipper category in the first quintile for all periods presented. In assessing the performance of the Portfolio, the Board noted that in response to the extreme volatility throughout 2009 the Sub-Adviser voluntarily chose to reduce the level of risk in the Portfolio by investing primarily in highly liquid instruments of short duration of high quality issuers that have received direct central government support or guarantees and securities that are the subject of liquidity programs of the Federal Reserve or the U.S. Treasury, and that the Sub-Adviser continued to operate the Portfolio in a risk averse manner throughout 2010. The Board also recognized that throughout 2009 and 2010 the Adviser and its affiliates have been waiving, and/or reimbursing fees in order for the Portfolio to maintain a net yield equal to, or greater than zero. The Board concluded that the performance of the Portfolio is satisfactory.
In assessing the reasonableness of the management fee and expense ratio for ING Money Market Portfolio, the Board noted that the management fee for the Portfolio is below the median and average management fees of the funds in its Selected Peer Group, and that the expense ratio for the Portfolio is equal to the median and above the average expense ratios of the funds in its Selected Peer Group. The Board noted that during 2010 the Adviser and its affiliates continued to voluntarily waive, and/or reimburse fees in order for the Portfolio to maintain a net yield equal to, or greater than zero.
104
Investment Adviser
ING Investments, LLC
7337 East Doubletree Ranch Road
Scottsdale, Arizona 85258
Administrator
ING Funds Services, LLC
7337 East Doubletree Ranch Road, Suite 100
Scottsdale, Arizona 85258
Distributor
ING Investments Distributor, LLC
7337 East Doubletree Ranch Road, Suite 100
Scottsdale, Arizona 85258
Transfer Agent
BNY Mellon Investment Servicing (U.S.) Inc.
301 Bellevue Parkway
Wilmington, Delaware 19809
Independent Registered Public Accounting Firm
KPMG LLP
Two Financial Center
60 South Street
Boston, Massachusetts 02111
Custodian
The Bank of New York Mellon
One Wall Street
New York, New York 10286
Legal Counsel
Goodwin Procter LLP
Exchange Place
53 State Street
Boston, Massachusetts 02109
Before investing, carefully consider the investment objectives, risks, charges and expenses of the variable annuity contract and the underlying variable investment options. This and other information is contained in the prospectus for the variable annuity contract and the underlying variable investment options. Obtain these prospectuses from your agent/registered representative and read them carefully before investing.
VPAR-ACAPAPALL (1210 021811)


Annual Report
December 31, 2010
Classes I and S
Domestic Equity Index Portfolios
| n | ING Index Plus LargeCap Portfolio |
| n | ING Index Plus MidCap Portfolio |
| n | ING Index Plus SmallCap Portfolio |
This report is submitted for general information to shareholders of the ING Funds. It is not authorized for distribution to prospective shareholders unless accompanied or preceded by a prospectus which includes details regarding the funds’ investment objectives, risks, charges, expenses and other information. This information should be read carefully.
MUTUAL FUNDS 
| |
TABLE OF CONTENTS
PROXY VOTING INFORMATION
A description of the policies and procedures that the Portfolios use to determine how to vote proxies related to portfolio securities is available: (1) without charge, upon request, by calling Shareholder Services toll-free at (800) 992-0180; (2) on the ING Funds’ website at www.ingfunds.com; and (3) on the U.S. Securities and Exchange Commission’s (“SEC”) website at www.sec.gov. Information regarding how the Portfolios voted proxies related to portfolio securities during the most recent 12-month period ended December 31 is available without charge on the ING Funds’ website at www.ingfunds.com and on the SEC’s website at www.sec.gov.
QUARTERLY PORTFOLIO HOLDINGS
The Portfolios file their complete schedule of portfolio holdings with the SEC for the first and third quarters of each fiscal year on Form N-Q. This report contains a summary portfolio of investments for certain Portfolios. The Portfolios’ Forms N-Q are available on the SEC’s website at www.sec.gov. The Portfolios’ Forms N-Q may be reviewed and copied at the SEC’s Public Reference Room in Washington, DC, and information on the operation of the Public Reference Room may be obtained by calling (800) SEC-0330. The Portfolios’ Forms N-Q, as well as a complete portfolio of investments, are available without charge upon request from the Portfolios by calling Shareholder Services toll-free at (800) 992-0180.
PRESIDENT’S LETTER

Big Picture vs. Details
Dear Shareholder,
On January 25, 2011, President Obama delivered his second State of the Union address. He called on Americans to put aside partisan differences and harness the nation’s creativity to adapt and thrive in a rapidly changing global economy. The president’s challenge is timely: the United States is approaching a nexus of intermediate- and long-term concerns, and the choices we make over the next two years could determine the nation’s competitiveness in the global economy for decades to come.
There are reasons to be optimistic — the International Monetary Fund (“IMF”) predicts the U.S. economy will grow about 3% in 2011. China and India are expected to grow at about 9% and even the euro zone appears to be recovering from crisis; this growth, however, is being accompanied by mounting inflation pressures in certain regions,
suggesting that many economies are expanding at unsustainable rates.
As I write this, the World Economic Forum is getting underway in Davos, Switzerland, and there are numerous concerns to deal with. Chief among them are the still-present risk of sovereign debt defaults in the euro zone; high unemployment and banking problems in the advanced economies; and inflationary pressures in emerging markets, especially with regard to food, fuel and commodities.
As we’ve noted before, uncertainty is a defining characteristic of our age and, in our opinion, is likely to remain so beyond this year. How should you respond within your investment portfolio Remember that the most important consideration is your long-term goals, not the outlook for 2011. With investment hazards and opportunities everywhere, we believe it makes sense to cast as broad a net as possible around the globe. In our opinion, you want your portfolio to be well diversified so that it is not harmed too much by the trouble spots, and has some exposure to positive trends.
As always, we believe the best approach is a well-diversified portfolio and a well-defined investment plan. As we’ve noted many times before, it’s important to discuss any proposed changes thoroughly with your advisor before taking any action. Thank you for your continued confidence in ING Funds. We look forward to serving your investment needs in the future.
Sincerely,

Shaun Mathews
President and Chief Executive Officer
ING Funds
January 26, 2011
The views expressed in the President’s Letter reflect those of the President as of the date of the letter. Any such views are subject to change at any time based upon market or other conditions and ING Funds disclaim any responsibility to update such views. These views may not be relied on as investment advice and because investment decisions for an ING Fund are based on numerous factors, may not be relied on as an indication of investment intent on behalf of any ING Fund. Reference to specific company securities should not be construed as recommendations or investment advice. Consider the fund’s investment objectives, risks, and charges and expenses carefully before investing. The prospectus contains this information and other information about the fund.
International investing poses special risks including currency fluctuation, economic and political risks not found in investments that are solely domestic.
1
MARKET PERSPECTIVE: YEAR ENDED DECEMBER 31, 2010
In our semi-annual report we described how, after a 13-month advance through mid-April, a confluence of local and world issues sent global equities, in the form of the MSCI World IndexSM measured in local currencies, including net reinvested dividends (“MSCI” for regions discussed below), reeling to a loss for the first half of the fiscal year. In the second half of the year, the MSCI World IndexSM bounced back and for 2010 returned 10.01%. (The MSCI World IndexSM returned 11.76% for the one year ended December 31, 2010, measured in U.S. dollars.) By year end, investor sentiment had turned distinctly positive, despite the grave concerns that remained.
It was a bumpy ride. Markets from stocks to bonds to currencies were continually buffeted by news and events relating to three main themes: the stuttering U.S. economic recovery, the sovereign debt crisis in the Eurozone and growth dynamics in China.
In the U.S., quarterly gross domestic product (“GDP”) growth decelerated from 2.7% (annualized) in the first quarter of 2010 to 1.7% in the second, before recovering to 2.6% in the third. But attention was focused more on employment and housing. The 18-month recession which ended in June of 2009 had cost some 8.7 million jobs. But since then, the unemployment rate had been stuck between 9.4% and 10.1%, barely dented by private sector new jobs averaging 107,000 per month as 2010 ended.
The other weakening link was housing. Sales of new and existing homes collapsed after the expiry in April of a program of tax credits for home buyers and languished thereafter. House prices (based on the S&P/Case-Shiller 20-City Composite Home Price Index), having shown annual increases from February, resumed a downward trend in October with the index still 30% below the peak recorded in April 2006.
To be sure, there were some grounds for optimism as 2010 drew to a close. Consumer spending had risen for five straight months. Investment in equipment and software was growing at double-digit annual percentage rates. On December 30, new unemployment claims were reported below 400,000 for the first time since July 2008. The Federal Reserve in November announced a second round of quantitative easing and would buy $600 billion in Treasury notes and bonds. The mixed mid-term election results forced a “compromise” stimulus package worth an estimated $858 billion for 2011. In combination, these two measures increased the attractiveness of riskier asset classes like equities at the expense of high grade bonds, which sold off.
In the Eurozone, after default was narrowly averted on Greece’s maturing bonds, the creation in May of a European Financial Stabilization “mechanism”, funded with up to €750 billion seemed to calm nerves for a while. But in October, attention turned to Ireland, where the Irish government had injected huge sums into local banks, rendering its own fiscal position untenable. The November 29, 2010 European Union/International Monetary Fund bail-out worth €67.5 billion left markets unimpressed. Suddenly it was May again with downgrades, soaring yields on peripheral Eurozone bonds, fears of contagion, falling stock markets and doubts about the viability of the euro itself. The European Central Bank aggressively bought sovereign bonds and the mood settled. But with Spain’s banks needing to refinance €85 billion of debt in 2011, the issue remains unresolved.
Investors watched nervously as China, the source of much of the world’s growth, wrestled with inflation, which reached
5.1% in November, and a housing bubble. The authorities tightened mortgage requirements, raised banks’ reserve ratio requirements six times in 2010 and interest rates twice in the last quarter. More interest rate increases seem inevitable.
In U.S. fixed income markets, the Barclays Capital U.S. Aggregate Bond Index of investment grade bonds returned 6.54% in 2010. A slight balance towards risk aversion in the first half gave way to improved risk appetite in the second. For the whole year, the Barclays Capital U.S. Treasury index returned 5.87%, underperforming the Barclays Capital Corporate Investment Grade Bond Index with a return of 9.00%, but both fell well short of the Barclays Capital High Yield Bond — 2% Issuer Constrained Composite Index which gained 14.94% for the one year period.
U.S. equities, represented by the S&P 500® Index including dividends, rose 15.06% in 2010, including its best September, a return of 8.92%, since 1939 and best December, a return of 6.68%, since 1991. Prices were supported by strong earnings reports, with operating earnings per share for S&P 500® companies recording four straight quarters of annual growth. Equities also benefited from improved risk appetite through the quantitative easing initiative and stimulus package referred to above.
In currencies, the worst of the gloom about the Eurozone in early June was replaced by renewed pessimism about the dollar in a stalling economy, before markets were seized by another bout of Eurozone angst. For the year, the dollar gained 8.15% against the euro and 2.95% against the pound, but lost 11.59% to the yen, which was sold in the market by the Bank of Japan after breaching 15-year high levels.
In international markets, the MSCI Japan® Index returned just 0.57% for the year after a strong last quarter, as quarterly GDP growth bounced back to 1.1% and the yen retreated from multi-year peaks. The tone of the market was generally poor with household spending fragile and consumer prices down for 21 months. The MSCI Europe ex UK® Index returned 4.84%, with Germany up 15.97% and Portugal, Italy, Ireland, Greece and Spain all falling. This broadly reflected the two-tier economy that has developed, with economic statistics favoring more soundly based countries at the expense of the peripherals. The MSCI UK® Index advanced 12.18%, despite the prospect of severe public spending cuts intended to eliminate an 11% budget deficit. Supporting sentiment was resilient, if perhaps temporary, quarterly GDP growth averaging 0.9% in the second half of the year.
Parentheses denote a negative number.
All indices are unmanaged and investors cannot invest directly in an index. Past performance does not guarantee future results. The performance quoted represents past performance. Investment return and principal value of an investment will fluctuate, and shares, when redeemed, may be worth more or less than their original cost. The Portfolios’ performance is subject to change since the period’s end and may be lower or higher than the performance data shown. Please call (800) 992-0180 or log on to www.ingfunds.com to obtain performance data current to the most recent month end.
Market Perspective reflects the views of ING’s Chief Investment Risk Officer only through the end of the period, and is subject to change based on market and other conditions.
2
BENCHMARK DESCRIPTIONS
| | |
| Index | | Description |
| MSCI World IndexSM | | An unmanaged index that measures the performance of over 1,400 securities listed on exchanges in the U.S., Europe, Canada, Australia, New Zealand and the Far East. |
| S&P/Case-Shiller 20-City Composite Home Price Index | | A composite index of the home price index for the top 20 Metropolitan Statistical Areas in the United States. The index is published monthly by Standard & Poor’s. |
| Barclays Capital U.S. Aggregate Bond Index | | An unmanaged index of publicly issued investment grade U.S. Government, mortgage-backed, asset-backed and corporate debt securities. |
| Barclays Capital U.S. Treasury Index | | An unmanaged index that includes public obligations of the U.S. Treasury. Treasury bills, certain special issues, such as state and local government series bonds (SLGs), as well as U.S. Treasury TIPS and STRIPS, are excluded. |
| Barclays Capital Corporate Investment Grade Bond Index | | The corporate component of the Barclays Capital U.S. Credit Index. The U.S. Credit Index includes publicly-issued U.S. corporate and specified foreign debentures and secured notes that meet the specified maturity, liquidity, and quality requirements. The index includes both corporate and non-corporate sectors. The corporate sectors are industrial, utility and finance, which includes both U.S. and non-U.S. corporations. |
| Barclays Capital High Yield Bond — 2% Issuer Constrained Composite Index | | An unmanaged index that includes all fixed income securities having a maximum quality rating of Ba1, a minimum amount outstanding of $150 million, and at least one year to maturity. |
| S&P 500® Index | | An unmanaged index that measures the performance of securities of approximately 500 large-capitalization companies whose securities are traded on major U.S. stock markets. |
| MSCI Japan® Index | | A free float-adjusted market capitalization index that is designed to measure developed market equity performance in Japan. |
| MSCI Europe ex UK® Index | | A free float-adjusted market capitalization index that is designed to measure developed market equity performance in Europe, excluding the UK. |
| MSCI UK® Index | | A free float-adjusted market capitalization index that is designed to measure developed market equity performance in the UK. |
| S&P MidCap 400 Index | | An unmanaged index that measures the performance of the mid-size company segment of the U.S. market. |
| S&P SmallCap 600 Index | | An unmanaged index used to measure stock market performance composed of companies with a weighted average market value of approximately $630 million. |
3
| | |
| ING INDEX PLUS LARGECAP PORTFOLIO | | PORTFOLIO MANAGERS’ REPORT |
Industry Allocation
as of December 31, 2010
(as a percent of net assets)
| | | | |
Information Technology | | | 19.1% | |
Financials | | | 15.7% | |
Energy | | | 11.9% | |
Health Care | | | 11.3% | |
Industrials | | | 10.8% | |
Consumer Discretionary | | | 10.2% | |
Consumer Staples | | | 10.2% | |
Telecommunication Services | | | 3.5% | |
Utilities | | | 3.2% | |
Materials | | | 2.8% | |
Other Assets and Liabilities — Net* | | | 1.3% | |
| | | | |
Net Assets | | | 100.0% | |
| | | | |
| | * | Includes short-term investments related to Blackrock Liquidity Funds TempFund Portfolio — Class I and securities lending collateral. |
Portfolio holdings are subject to change daily.
ING Index Plus LargeCap Portfolio (the “Portfolio”) seeks to outperform the total return performance of the S&P 500® Index, while maintaining a market level of risk. The Portfolio is managed by Vincent Costa, CFA and Pranay Gupta, Portfolio Managers, of ING Investment Management Co. — the Sub-Adviser.*
Performance: For the year ended December 31, 2010, the Portfolio’s Class I shares provided a total return of 13.96% compared to the S&P 500® Index, which returned 15.06% for the same period.
Portfolio Specifics: The performance of our models was down in 2010. Security selection in the financials, energy and materials sectors had the biggest negative impact on performance. In financials, overweights in M&T Bank Corp., CME Group, Inc. and Vornado Realty Trust were the biggest detractors. In energy, an overweight in Nabors Industries and an underweight in Schlumberger Ltd. hurt performance. In materials, overweights in paper companies MeadWestVaco Corp. and International Paper Co. had a negative contribution to relative performance. We saw positive gains in the technology and utilities sectors. Within technology, underweights in hardware makers — including Cisco Systems, Inc. and Qualcomm, Inc. — added to results. In utilities, underweights in Exelon Corp. and PPL Corp. helped performance.
Other notable detractors for the period included overweights in Abbot
Laboratories and Bristol-Myers Squibb Co., as well as an underweight in Boeing Co. Top contributors to performance included underweights in Johnson & Johnson and Procter & Gamble Co., as well as overweights in Limited Brands and DuPont. Sector allocation had a small positive impact on performance, as an overweight in industrials benefited the Portfolio.
Current Strategy and Outlook: Our strategy uses a quantitative investment process to construct enhanced index portfolios. This process employs multiple, uncorrelated alpha streams and advanced forecasting techniques to determine which stocks to over- and underweight relative to the benchmark. The process then combines the forecasted alpha with estimates of risk and trading costs for each stock to construct a portfolio designed to maximize return and control for risk relative to the benchmark.
The Portfolio currently has overweights in information technology and health care and underweights in materials and consumer staples.
| * | | Effective April 30, 2010, Mr. Gupta was added as portfolio manager to the Portfolio. |
Portfolio holdings and characteristics are subject to change and may not be representative of current holdings and characteristics. The outlook for this Portfolio may differ from that presented for other ING Funds. Performance for the different classes of shares will vary based on differences in fees associated with each class.
Top Ten Holdings*
as of December 31, 2010
(as a percent of net assets)
| | | | |
Apple, Inc. | | | 2.7% | |
Chevron Corp. | | | 2.3% | |
ExxonMobil Corp. | | | 2.2% | |
ConocoPhillips | | | 1.3% | |
General Electric Co. | | | 1.3% | |
Microsoft Corp. | | | 1.2% | |
McDonald’s Corp. | | | 1.2% | |
AT&T, Inc. | | | 1.1% | |
Merck & Co., Inc. | | | 1.1% | |
Citigroup, Inc. | | | 1.1% | |
| | * | Excludes short-term investments related to Blackrock Liquidity Funds TempFund Portfolio — Class I. |
Portfolio holdings are subject to change daily.
4
| | |
| ING INDEX PLUS LARGECAP PORTFOLIO | | PORTFOLIO MANAGERS’ REPORT |
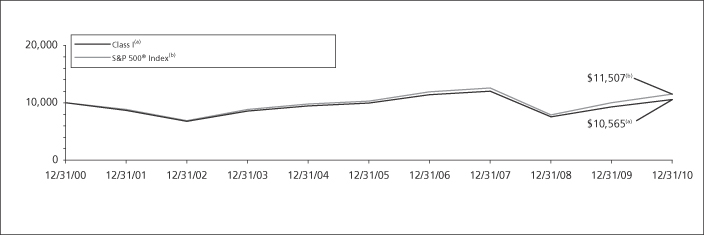
| | | | | | | | | | | | | | | | | | | | | | | | |
| | | |
| | | | | Average Annual Total Returns for the Periods Ended December 31, 2010 | | | | | |
| | | | | | 1 Year | | | 5 Year | | | 10 Year | | | Since
Inception
of Class S
July 16,
2001 | | | | |
| | | | | Class I | | | 13.96 | % | | | 1.19 | % | | | 0.56 | % | | | 5.99 | % | | | | |
| | | | | Class S | | | 13.63 | % | | | 0.93 | % | | | — | | | | 1.40 | % | | | | |
| | | | | S&P 500® Index | | | 15.06 | % | | | 2.29 | % | | | 1.41 | % | | | 2.36 | %(1) | | | | |
Based on a $10,000 initial investment, the graph and table above illustrate the total return of ING Index Plus LargeCap Portfolio against the index indicated. An index is unmanaged and has no cash in its portfolio, imposes no sales charges and incurs no operating expenses. An investor cannot invest directly in an index. The Portfolio’s performance is shown without the imposition of any expenses or charges which are, or may be, imposed under your annuity contract or life insurance policy. Total returns would have been lower if such expenses or charges were included.
The performance graph and table do not reflect the deduction of taxes that a shareholder will pay on Portfolio distributions or the redemption of Portfolio shares.
The performance shown may include the effect of fee waivers and/or expense reimbursements by the Investment Adviser and/or other service providers, which have the effect of increasing total return. Had all fees and expenses been considered, the total returns would have been lower.
The performance update illustrates performance for a variable investment option available through a variable annuity contract and/or a variable universal life policy. The performance shown indicates past performance and is not a projection or prediction of future results. Actual investment returns and principal value will fluctuate so that shares and/or units, at redemption, may be worth
more or less than their original cost. For variable annuity contracts, please call (800) 992-0180 to get performance through the most recent month end. For variable universal life policies, please log on to www.ing.com/us to get performance through the most recent month end.
This report contains statements that may be “forward-looking” statements. Actual results may differ materially from those projected in the “forward-looking” statements.
The views expressed in this report reflect those of the portfolio managers, only through the end of the period as stated on the cover. The portfolio managers’ views are subject to change at any time based on market and other conditions.
Portfolio holdings are subject to change daily.
| (1) | | Since inception performance for the index is shown from August 1, 2001. |
Effective March 1, 2002, ING Investments, LLC began serving as investment adviser and ING Investment Management Co., the former investment adviser, began serving as sub-adviser to the Portfolio.
5
| | |
| ING INDEX PLUS MIDCAP PORTFOLIO | | PORTFOLIO MANAGERS’ REPORT |
Industry Allocation
as of December 31, 2010
(as a percent of net assets)
| | | | |
Financials | | | 18.6% | |
Industrials | | | 16.2% | |
Information Technology | | | 14.9% | |
Consumer Discretionary | | | 14.0% | |
Health Care | | | 10.9% | |
Materials | | | 6.5% | |
Utilities | | | 5.5% | |
Energy | | | 5.3% | |
Consumer Staples | | | 3.5% | |
Telecommunication Services | | | 0.7% | |
Other Assets and Liabilities — Net* | | | 3.9% | |
| | | | |
Net Assets | | | 100.0% | |
| | | | |
| | * | Includes short-term investments related to Blackrock Liquidity Funds TempFund Portfolio — Class I and securities lending collateral. |
Portfolio holdings are subject to change daily.
ING Index Plus MidCap Portfolio (the “Portfolio”) seeks to outperform the total return performance of the S&P MidCap 400 Index, while maintaining a market level of risk. The Portfolio is managed by Vincent Costa, CFA and Pranay Gupta, Portfolio Managers, of ING Investment Management Co. — the Sub-Adviser.*
Performance: For the year ended December 31, 2010, the Portfolio’s Class I shares provided a total return of 21.91% compared to the S&P MidCap 400 Index, which returned 26.64% for the same period.
Portfolio Specifics: The performance of our models was down in 2010. Security selection in information technology, financials and energy had the biggest negative impact on performance. In technology, the hardware industry — in particular, our positions in Adtran Inc., Tech Data Corp. and Avnet Inc. — hurt the most. Within financials, an overweight in underperforming REITs resulted in a largely negative allocation effect. The only positive contributing sector was telecom, as holdings in Syniverse Holdings Inc. and Telephone & Data Systems Inc. added to performance.
Other notable detractors for the period included underweight positions in Netflix, Inc. and Cimarex Energy Co. and an overweight position in Federal Realty Investment Trust. Top contributors to
performance included overweight positions in Sybase, Inc. and Valeant Pharmaceuticals International, Inc. and an underweight position in Vertex Pharmaceuticals, Inc. Despite active exposures on a sector level, minimal impact due to allocation effect was seen.
Current Strategy and Outlook: Our strategy uses a quantitative investment process to construct enhanced index portfolios. This process employs multiple, uncorrelated alpha streams and advanced forecasting techniques to determine which stocks to over- and underweight relative to the benchmark. The process then combines the forecasted alpha with estimates of risk and trading costs for each stock to construct a portfolio designed to maximize return and control for risk relative to the benchmark.
The Portfolio currently has overweights in information technology and healthcare and underweights in materials and consumer staples.
| * | | Effective April 30, 2010, Mr. Gupta was added as portfolio manager to the Portfolio. |
Portfolio holdings and characteristics are subject to change and may not be representative of current holdings and characteristics. The outlook for this Portfolio may differ from that presented for other ING Funds. Performance for the different classes of shares will vary based on differences in fees associated with each class.
Top Ten Holdings*
as of December 31, 2010
(as a percent of net assets)
| | | | |
BorgWarner, Inc. | | | 1.3% | |
Dollar Tree, Inc. | | | 1.1% | |
Joy Global, Inc. | | | 1.1% | |
Lubrizol Corp. | | | 1.0% | |
Chipotle Mexican Grill, Inc. | | | 1.0% | |
Perrigo Co. | | | 1.0% | |
Macerich Co. | | | 0.9% | |
Edwards Lifesciences Corp. | | | 0.9% | |
Rovi Corp. | | | 0.9% | |
Advance Auto Parts, Inc. | | | 0.8% | |
| | * | Excludes short-term investments related to Blackrock Liquidity Funds TempFund Portfolio — Class I and securities lending collateral. |
Portfolio holdings are subject to change daily.
6
| | |
| PORTFOLIO MANAGERS’ REPORT | | ING INDEX PLUS MIDCAP PORTFOLIO |
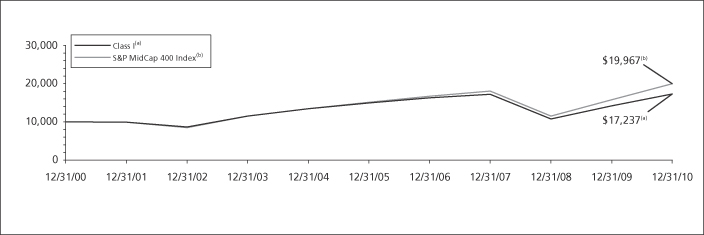
| | | | | | | | | | | | | | | | | | | | | | | | |
| | | |
| | | | | Average Annual Total Returns for the Periods Ended December 31, 2010 | | | | | |
| | | | | | 1 Year | | | 5 Year | | | 10 Year | | | Since Inception of Class S July 16, 2001 | | | | |
| | | | | Class I | | | 21.91 | % | | | 2.97 | % | | | 5.59 | % | | | 9.00 | % | | | | |
| | | | | Class S | | | 21.57 | % | | | 2.71 | % | | | — | | | | 5.93 | % | | | | |
| | | | | S&P MidCap 400 Index(1) | | | 26.64 | % | | | 5.74 | % | | | 7.16 | % | | | 7.68 | % | | | | |
Based on a $10,000 initial investment, the graph and table above illustrate the total return of ING Index Plus MidCap Portfolio against the index indicated. An index is unmanaged and has no cash in its portfolio, imposes no sales charges and incurs no operating expenses. An investor cannot invest directly in an index. The Portfolio’s performance is shown without the imposition of any expenses or charges which are, or may be, imposed under your annuity contract or life insurance policy. Total returns would have been lower if such expenses or charges were included.
The performance graph and table do not reflect the deduction of taxes that a shareholder will pay on Portfolio distributions or the redemption of Portfolio shares.
The performance shown may include the effect of fee waivers and/or expense reimbursements by the Investment Adviser and/or other service providers, which have the effect of increasing total return. Had all fees and expenses been considered, the total returns would have been lower.
The performance update illustrates performance for a variable investment option available through a variable annuity contract and/or a variable universal life policy. The performance shown indicates past performance and is not a projection or prediction of future results. Actual investment returns and principal value will fluctuate so that shares and/or units, at redemption, may be worth
more or less than their original cost. For variable annuity contracts, please call (800) 992-0180 to get performance through the most recent month end. For variable universal life policies, please log on to www.ing.com/us to get performance through the most recent month end.
This report contains statements that may be “forward-looking” statements. Actual results may differ materially from those projected in the “forward-looking” statements.
The views expressed in this report reflect those of the portfolio managers, only through the end of the period as stated on the cover. The portfolio managers’ views are subject to change at any time based on market and other conditions.
Portfolio holdings are subject to change daily.
| (1) | | Since inception performance for the index is shown from August 1, 2001. |
Effective March 1, 2002, ING Investments, LLC began serving as investment adviser and ING Investment Management Co., the former investment adviser, began serving as sub-adviser to the Portfolio.
7
| | |
| ING INDEX PLUS SMALLCAP PORTFOLIO | | PORTFOLIO MANAGERS’ REPORT |
Industry Allocation
as of December 31, 2010
(as a percent of net assets)
| | | | |
Information Technology | | | 18.7% | |
Financials | | | 17.7% | |
Industrials | | | 16.4% | |
Consumer Discretionary | | | 14.3% | |
Health Care | | | 12.5% | |
Energy | | | 5.2% | |
Materials | | | 4.4% | |
Utilities | | | 3.6% | |
Consumer Staples | | | 3.3% | |
Telecommunication Services | | | 0.8% | |
Other Assets and Liabilities — Net* | | | 3.1% | |
| | | | |
Net Assets | | | 100.0% | |
| | | | |
| | * | Includes short-term investments related to Blackrock Liquidity Funds TempFund Portfolio — Class I and securities lending collateral. |
Portfolio holdings are subject to change daily.
ING Index Plus SmallCap Portfolio (the “Portfolio”) seeks to outperform the total return performance of the S&P SmallCap 600 Index, while maintaining a market level of risk. The Portfolio is managed by Vincent Costa, CFA and Pranay Gupta, Portfolio Managers, of ING Investment Management Co. — the Sub-Adviser.*
Performance: For the year ended December 31, 2010, the Portfolio’s Class I shares provided a total return of 22.84% compared to the S&P SmallCap 600 Index, which returned 26.31% for the same period.
Portfolio Review: The performance of our models was down in 2010. Security selection in the industrials, healthcare and information technology sectors had the biggest negative impact on performance. Within industrials, positions in GenCorp, Inc., Tetra Tech, Inc. and Baldor Electric Co. detracted most; within healthcare, a variety of stocks across the pharmaceuticals industry hurt performance. The only 2 positive contributing sectors were utilities and materials as overweights in Quaker Chemical Corp., Piedmont Natural Gas Co. and an underweight in Schweitzer-Maudit International, Inc. contributed to performance.
Other notable detractors for the period included underweight positions in Coinstar, Inc. and Salix Pharmaceuticals Ltd. and an
overweight position in Neutral Tandem, Inc. Top contributors to performance included overweight positions in Odyssey HealthCare, Inc., National Financial Partners Corp. and NetScout Systems, Inc.
Current Strategy and Outlook: Our strategy uses a quantitative investment process to construct enhanced index portfolios. This process employs multiple, uncorrelated alpha streams and advanced forecasting techniques to determine which stocks to over- and underweight relative to the benchmark. The process then combines the forecasted alpha with estimates of risk and trading costs for each stock to construct a portfolio designed to maximize return and control for risk relative to the benchmark.
The Portfolio currently has overweights in information technology and healthcare and underweights in materials and consumer staples.
| * | | Effective April 30, 2010, Mr. Gupta was added as portfolio manager to the Portfolio. |
Portfolio holdings and characteristics are subject to change and may not be representative of current holdings and characteristics. The outlook for this Portfolio may differ from that presented for other ING Funds. Performance for the different classes of shares will vary based on differences in fees associated with each class.
Top Ten Holdings*
as of December 31, 2010
(as a percent of net assets)
| | | | |
BioMed Realty Trust, Inc. | | | 0.7% | |
Varian Semiconductor Equipment Associates, Inc. | | | 0.6% | |
Cooper Cos., Inc. | | | 0.6% | |
Regeneron Pharmaceuticals, Inc. | | | 0.6% | |
National Retail Properties, Inc. | | | 0.6% | |
Tanger Factory Outlet Centers, Inc. | | | 0.5% | |
Actuant Corp. | | | 0.5% | |
Viasat, Inc. | | | 0.5% | |
Oil States International, Inc. | | | 0.5% | |
Toro Co. | | | 0.5% | |
| | * | Excludes short-term investments related to Blackrock Liquidity Funds TempFund Portfolio — Class I and securities lending collateral. |
Portfolio holdings are subject to change daily.
8
| | |
| ING INDEX PLUS SMALLCAP PORTFOLIO | | PORTFOLIO MANAGERS’ REPORT |
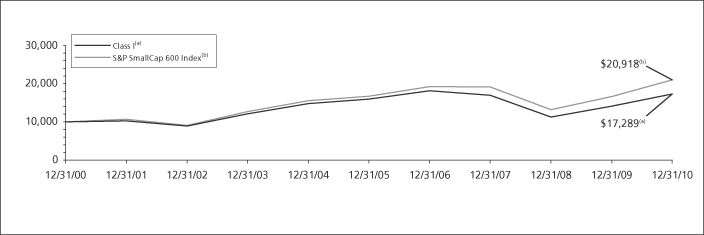
| | | | | | | | | | | | | | | | | | | | | | | | |
| | | |
| | | | | Average Annual Total Returns for the Periods Ended December 31, 2010 | | | | | |
| | | | | | 1 Year | | | 5 Year | | | 10 Year | | | Since Inception of Class S July 16, 2001 | | | | |
| | | | | Class I | | | 22.84 | % | | | 1.69 | % | | | 5.62 | % | | | 6.10 | % | | | | |
| | | | | Class S | | | 22.47 | % | | | 1.43 | % | | | — | | | | 5.70 | % | | | | |
| | | | | S&P SmallCap 600 Index(1) | | | 26.31 | % | | | 4.64 | % | | | 7.66 | % | | | 7.65 | % | | | | |
Based on a $10,000 initial investment, the graph and table above illustrate the total return of ING Index Plus SmallCap Portfolio against the index indicated. An index is unmanaged and has no cash in its portfolio, imposes no sales charges and incurs no operating expenses. An investor cannot invest directly in an index. The Portfolio’s performance is shown without the imposition of any expenses or charges which are, or may be, imposed under your annuity contract or life insurance policy. Total returns would have been lower if such expenses or charges were included.
The performance graph and table do not reflect the deduction of taxes that a shareholder will pay on Portfolio distributions or the redemption of Portfolio shares.
The performance shown may include the effect of fee waivers and/or expense reimbursements by the Investment Adviser and/or other service providers, which have the effect of increasing total return. Had all fees and expenses been considered, the total returns would have been lower.
The performance update illustrates performance for a variable investment option available through a variable annuity contract and/or a variable universal life policy. The performance shown indicates past performance and is not a projection or prediction of future results. Actual investment returns and principal value will fluctuate so that shares and/or units, at redemption, may be worth
more or less than their original cost. For variable annuity contracts, please call (800) 992-0180 to get performance through the most recent month end. For variable universal life policies, please log on to www.ing.com/us to get performance through the most recent month end.
This report contains statements that may be “forward-looking” statements. Actual results may differ materially from those projected in the “forward-looking” statements.
The views expressed in this report reflect those of the portfolio managers, only through the end of the period as stated on the cover. The portfolio managers’ views are subject to change at any time based on market and other conditions.
Portfolio holdings are subject to change daily.
| (1) | | Since inception performance for the index is shown from August 1, 2001. |
Effective March 1, 2002, ING Investments, LLC began serving as investment adviser and ING Investment Management Co., the former investment adviser, began serving as sub-adviser to the Portfolio.
9
SHAREHOLDER EXPENSE EXAMPLES (UNAUDITED)
As a shareholder of a Portfolio, you incur two types of costs: (1) transaction costs, including redemption fees and exchange fees; and (2) ongoing costs, including management fees, distribution and/or service (12b-1) fees, and other Portfolio expenses. These Examples are intended to help you understand your ongoing costs (in dollars) of investing in a Portfolio and to compare these costs with the ongoing costs of investing in other mutual funds.
The Examples are based on an investment of $1,000 invested at the beginning of the period and held for the entire period from July 1, 2010 to December 31, 2010. The Portfolios’ expenses are shown without the imposition of any charges which are, or may be, imposed under your variable annuity contract, variable life insurance policy, qualified pension or retirement plan. Expenses would have been higher if such charges were included.
Actual Expenses
The left section of the table shown below, “Actual Portfolio Return,” provides information about actual account values and actual expenses. You may use the information in this section, together with the amount you invested, to estimate the expenses that you paid over the period. Simply divide your account value by $1,000 (for example, an $8,600 account value divided by $1,000 = 8.6), then multiply the result by the number in the first section under the heading entitled “Expenses Paid During the Period” to estimate the expenses you paid on your account during this period.
Hypothetical Example for Comparison Purposes
The right section of the table shown below, “Hypothetical (5% return before expenses),” provides information about hypothetical account values and hypothetical expenses based on a Portfolio’s actual expense ratio and an assumed rate of return of 5% per year before expenses, which is not a Portfolio’s actual return. The hypothetical account values and expenses may not be used to estimate the actual ending account balance or expenses you paid for the period. You may use this information to compare the ongoing costs of investing in a Portfolio and other mutual funds. To do so, compare this 5% hypothetical example with the 5% hypothetical examples that appear in the shareholder reports of the other mutual funds.
Please note that the expenses shown in the table are meant to highlight your ongoing costs only and do not reflect any transactional costs, such as redemption fees or exchange fees. Therefore, the hypothetical lines of the table are useful in comparing ongoing costs only, and will not help you determine the relative total costs of owning different mutual funds. In addition, if these transactional costs were included, your costs would have been higher.
| | | | | | | | | | | | | | | | | | | | | | | | | | | | | | | | |
| | | Actual Portfolio Return | | | Hypothetical (5% return before expenses) | |
| | | Beginning
Account
Value
July 1, 2010 | | | Ending
Account Value
December 31, 2010 | | | Annualized
Expense
Ratio | | | Expenses Paid
During the Period Ended
December 31, 2010* | | | Beginning
Account Value
July 1, 2010 | | | Ending
Account Value
December 31, 2010 | | | Annualized
Expense
Ratio | | | Expenses Paid
During the Period
Ended
December 31, 2010* | |
Index Plus LargeCap Portfolio | | | | | | | | | | | | | | | | | | | | | |
Class I | | $ | 1,000.00 | | | $ | 1,221.60 | | | | 0.44 | % | | $ | 2.46 | | | $ | 1,000.00 | | | $ | 1,022.99 | | | | 0.44 | % | | $ | 2.24 | |
Class S | | | 1,000.00 | | | | 1,220.50 | | | | 0.69 | | | | 3.86 | | | | 1,000.00 | | | | 1,021.73 | | | | 0.69 | | | | 3.52 | |
Index Plus MidCap Portfolio | | | | | | | | | | | | | | | | | | | | | |
Class I | | $ | 1,000.00 | | | $ | 1,254.90 | | | | 0.48 | % | | $ | 2.73 | | | $ | 1,000.00 | | | $ | 1,022.79 | | | | 0.48 | % | | $ | 2.45 | |
Class S | | | 1,000.00 | | | | 1,253.30 | | | | 0.73 | | | | 4.15 | | | | 1,000.00 | | | | 1,021.53 | | | | 0.73 | | | | 3.72 | |
Index Plus SmallCap Portfolio | | | | | | | | | | | | | | | | | | | | | |
Class I | | $ | 1,000.00 | | | $ | 1,255.40 | | | | 0.49 | % | | $ | 2.79 | | | $ | 1,000.00 | | | $ | 1,022.74 | | | | 0.49 | % | | $ | 2.50 | |
Class S | | | 1,000.00 | | | | 1,253.20 | | | | 0.74 | | | | 4.20 | | | | 1,000.00 | | | | 1,021.48 | | | | 0.74 | | | | 3.77 | |
| * | | Expenses are equal to each Portfolio’s respective annualized expense ratios multiplied by the average account value over the period, multiplied by 184/365 to reflect the most recent fiscal half-year. |
10
REPORT OF INDEPENDENT REGISTERED PUBLIC ACCOUNTING FIRM
The Shareholders and Board of Directors
ING Variable Portfolios, Inc.
We have audited the accompanying statements of assets and liabilities, including the summary portfolios of investments, of ING Index Plus LargeCap Portfolio, ING Index Plus MidCap Portfolio, and ING Index Plus SmallCap Portfolio, each a series of ING Variable Portfolios, Inc., as of December 31, 2010, and the related statements of operations for the year then ended, the statements of changes in net assets for each of the years in the two-year period then ended, and the financial highlights for each of the years in the five-year period then ended. These financial statements and financial highlights are the responsibility of management. Our responsibility is to express an opinion on these financial statements and financial highlights based on our audits.
We conducted our audits in accordance with the standards of the Public Company Accounting Oversight Board (United States). Those standards require that we plan and perform the audit to obtain reasonable assurance about whether the financial statements and financial highlights are free of material misstatement. An audit includes examining, on a test basis, evidence supporting the amounts and disclosures in the financial statements. Our procedures included confirmation of securities owned as of December 31, 2010, by correspondence with the custodian and transfer agent. An audit also includes assessing the accounting principles used and significant estimates made by management, as well as evaluating the overall financial statement presentation. We believe that our audits provide a reasonable basis for our opinion.
In our opinion, the financial statements and financial highlights referred to above present fairly, in all material respects, the financial position of the aforementioned portfolios as of December 31, 2010, and the results of their operations, the changes in their net assets, and the financial highlights for the periods specified in the first paragraph above, in conformity with U.S. generally accepted accounting principles.

Boston, Massachusetts
February 18, 2011
11
STATEMENTS OF ASSETS AND LIABILITIES AS OF DECEMBER 31, 2010
| | | | | | | | | | | | |
| | | ING Index Plus
LargeCap
Portfolio | | | ING Index Plus
MidCap
Portfolio | | | ING Index Plus
SmallCap
Portfolio | |
ASSETS: | | | | | | | | | | | | |
Investments in securities at value+* | | $ | 792,357,769 | | | $ | 667,231,030 | | | $ | 314,615,593 | |
Short-term investments at value** | | | 14,775,429 | | | | 42,290,685 | | | | 24,766,635 | |
Cash | | | 597 | | | | 676 | | | | 782 | |
Cash collateral for futures | | | 796,500 | | | | 1,825,800 | | | | 650,370 | |
Receivables: | | | | | | | | | | | | |
Investment securities sold | | | 540,916 | | | | — | | | | — | |
Fund shares sold | | | 95,250 | | | | 7,936 | | | | — | |
Dividends and interest | | | 1,120,697 | | | | 549,651 | | | | 234,926 | |
Prepaid expenses | | | 14,129 | | | | 11,494 | | | | 5,243 | |
| | | | | | | | | | | | |
Total assets | | | 809,701,287 | | | | 711,917,272 | | | | 340,273,549 | |
| | | | | | | | | | | | |
LIABILITIES: | | | | | | | | | | | | |
Payable for fund shares redeemed | | | 988,608 | | | | 2,833,394 | | | | 2,101,195 | |
Payable upon receipt of securities loaned | | | 5,468,190 | | | | 14,185,923 | | | | 13,224,488 | |
Payable to affiliates | | | 310,102 | | | | 298,272 | | | | 148,245 | |
Payable for directors fees | | | 4,006 | | | | 3,274 | | | | 1,506 | |
Other accrued expenses and liabilities | | | 196,210 | | | | 121,643 | | | | 67,759 | |
| | | | | | | | | | | | |
Total liabilities | | | 6,967,116 | | | | 17,442,506 | | | | 15,543,193 | |
| | | | | | | | | | | | |
NET ASSETS | | $ | 802,734,171 | | | $ | 694,474,766 | | | $ | 324,730,356 | |
| | | | | | | | | | | | |
NET ASSETS WERE COMPRISED OF: | | | | | | | | | | | | |
Paid-in capital | | $ | 1,080,605,868 | | | $ | 799,189,184 | | | $ | 428,788,151 | |
Undistributed net investment income | | | 13,756,731 | | | | 5,146,093 | | | | 2,327,592 | |
Accumulated net realized loss | | | (376,506,188 | ) | | | (205,284,038 | ) | | | (147,650,722 | ) |
Net unrealized appreciation | | | 84,877,760 | | | | 95,423,527 | | | | 41,265,335 | |
| | | | | | | | | | | | |
NET ASSETS | | $ | 802,734,171 | | | $ | 694,474,766 | | | $ | 324,730,356 | |
| | | | | | | | | | | | |
| | | | | | | | | | | | |
+ Including securities loaned at value | | $ | 5,314,402 | | | $ | 13,801,824 | | | $ | 12,886,658 | |
* Cost of investments in securities | | $ | 707,457,763 | | | $ | 571,521,302 | | | $ | 273,189,258 | |
** Cost of short-term investments | | $ | 15,097,190 | | | $ | 42,860,923 | | | $ | 25,052,488 | |
Class I: | | | | | | | | | | | | |
Net assets | | $ | 631,278,461 | | | $ | 549,499,290 | | | $ | 215,342,901 | |
Shares authorized | | | 200,000,000 | | | | 100,000,000 | | | | 100,000,000 | |
Par value | | $ | 0.001 | | | $ | 0.001 | | | $ | 0.001 | |
Shares outstanding | | | 45,437,980 | | | | 35,434,270 | | | | 15,317,948 | |
Net asset value and redemption price per share | | $ | 13.89 | | | $ | 15.51 | | | $ | 14.06 | |
Class S: | | | | | | | | | | | | |
Net assets | | $ | 171,455,710 | | | $ | 144,975,476 | | | $ | 109,387,455 | |
Shares authorized | | | 100,000,000 | | | | 100,000,000 | | | | 100,000,000 | |
Par value | | $ | 0.001 | | | $ | 0.001 | | | $ | 0.001 | |
Shares outstanding | | | 12,440,914 | | | | 9,453,000 | | | | 7,863,271 | |
Net asset value and redemption price per share | | $ | 13.78 | | | $ | 15.34 | | | $ | 13.91 | |
See Accompanying Notes to Financial Statements
12
STATEMENTS OF OPERATIONS FOR THE YEAR ENDED DECEMBER 31, 2010
| | | | | | | | | | | | |
| | | ING Index Plus
LargeCap
Portfolio | | | ING Index Plus
MidCap
Portfolio | | | ING Index Plus
SmallCap
Portfolio | |
INVESTMENT INCOME: | | | | | | | | | | | | |
Dividends, net of foreign taxes withheld*(1) | | $ | 17,494,259 | | | $ | 8,431,953 | | | $ | 4,073,749 | |
Interest | | | 6,575 | | | | 2,278 | | | | 919 | |
Securities lending income, net | | | 31,890 | | | | 217,900 | | | | 369,576 | |
| | | | | | | | | | | | |
Total investment income | | | 17,532,724 | | | | 8,652,131 | | | | 4,444,244 | |
| | | | | | | | | | | | |
EXPENSES: | | | | | | | | | | | | |
Investment management fees | | | 2,804,072 | | | | 2,619,452 | | | | 1,204,802 | |
Distribution and service fees | | | 426,096 | | | | 345,674 | | | | 257,752 | |
Transfer agent fees | | | 988 | | | | 677 | | | | 371 | |
Administrative service fees | | | 440,627 | | | | 360,163 | | | | 165,655 | |
Shareholder reporting expense | | | 11,136 | | | | 22,621 | | | | 6,314 | |
Professional fees | | | 62,117 | | | | 39,586 | | | | 21,909 | |
Custody and accounting expense | | | 97,917 | | | | 53,060 | | | | 37,581 | |
Directors fees | | | 40,504 | | | | 31,906 | | | | 20,532 | |
Miscellaneous expense | | | 43,145 | | | | 39,402 | | | | 18,844 | |
Interest expense | | | 1,029 | | | | 189 | | | | 131 | |
| | | | | | | | | | | | |
Total expenses | | | 3,927,631 | | | | 3,512,730 | | | | 1,733,891 | |
Net waived and reimbursed fees | | | (6,000 | ) | | | (7,919 | ) | | | (4,926 | ) |
| | | | | | | | | | | | |
Net expenses | | | 3,921,631 | | | | 3,504,811 | | | | 1,728,965 | |
| | | | | | | | | | | | |
Net investment income | | | 13,611,093 | | | | 5,147,320 | | | | 2,715,279 | |
| | | | | | | | | | | | |
REALIZED AND UNREALIZED GAIN (LOSS): | | | | | | | | | | | | |
Net realized gain on: | | | | | | | | | | | | |
Investments | | | 92,129,824 | | | | 94,087,033 | | | | 44,186,041 | |
Futures | | | 1,154,969 | | | | 3,004,707 | | | | 1,633,196 | |
| | | | | | | | | | | | |
Net realized gain | | | 93,284,793 | | | | 97,091,740 | | | | 45,819,237 | |
| | | | | | | | | | | | |
Net change in unrealized appreciation or depreciation on: | | | | | | | | | | | | |
Investments | | | (5,098,755 | ) | | | 26,776,977 | | | | 13,690,617 | |
Futures | | | 255,791 | | | | (69,850 | ) | | | (160,834 | ) |
| | | | | | | | | | | | |
Net change in unrealized appreciation or depreciation | | | (4,842,964 | ) | | | 26,707,127 | | | | 13,529,783 | |
| | | | | | | | | | | | |
Net realized and unrealized gain | | | 88,441,829 | | | | 123,798,867 | | | | 59,349,020 | |
| | | | | | | | | | | | |
Increase in net assets resulting from operations | | $ | 102,052,922 | | | $ | 128,946,187 | | | $ | 62,064,299 | |
| | | | | | | | | | | | |
| | | | | | | | | | | | |
* Foreign taxes withheld | | $ | 2,871 | | | $ | — | | | $ | 12 | |
(1) Dividends from affiliates | | $ | 11,827 | | | $ | 15,224 | | | $ | 9,852 | |
See Accompanying Notes to Financial Statements
13
STATEMENTS OF CHANGES IN NET ASSETS
| | | | | | | | | | | | | | | | |
| | | ING Index Plus LargeCap Portfolio | | | ING Index Plus MidCap Portfolio | |
| | | Year Ended December 31, 2010 | | | Year Ended December 31, 2009 | | | Year Ended December 31, 2010 | | | Year Ended December 31, 2009 | |
FROM OPERATIONS: | | | | | | | | | | | | | | | | |
Net investment income | | $ | 13,611,093 | | | $ | 15,962,911 | | | $ | 5,147,320 | | | $ | 7,649,990 | |
Net realized gain (loss) | | | 93,284,793 | | | | (97,349,768 | ) | | | 97,091,740 | | | | (124,931,250 | ) |
Net change in unrealized appreciation or depreciation | | | (4,842,964 | ) | | | 254,411,259 | | | | 26,707,127 | | | | 281,471,755 | |
| | | | | | | | | | | | | | | | |
Increase in net assets resulting from operations | | | 102,052,922 | | | | 173,024,402 | | | | 128,946,187 | | | | 164,190,495 | |
| | | | | | | | | | | | | | | | |
FROM DISTRIBUTIONS TO SHAREHOLDERS: | | | | | | | | | | | | | | | | |
Net investment income: | | | | | | | | | | | | | | | | |
Class I | | | (12,854,302 | ) | | | (21,659,223 | ) | | | (5,687,907 | ) | | | (8,141,405 | ) |
Class S | | | (3,027,104 | ) | | | (5,041,109 | ) | | | (1,213,000 | ) | | | (1,755,366 | ) |
| | | | | | | | | | | | | | | | |
Total distributions | | | (15,881,406 | ) | | | (26,700,332 | ) | | | (6,900,907 | ) | | | (9,896,771 | ) |
| | | | | | | | | | | | | | | | |
FROM CAPITAL SHARE TRANSACTIONS: | | | | | | | | | | | | | | | | |
Net proceeds from sale of shares | | | 7,721,772 | | | | 21,792,590 | | | | 21,583,457 | | | | 20,942,249 | |
Reinvestment of distributions | | | 15,881,406 | | | | 26,700,332 | | | | 6,900,907 | | | | 9,896,771 | |
| | | | | | | | | | | | | | | | |
| | | 23,603,178 | | | | 48,492,922 | | | | 28,484,364 | | | | 30,839,020 | |
Cost of shares redeemed | | | (170,313,253 | ) | | | (197,222,557 | ) | | | (107,195,884 | ) | | | (105,802,404 | ) |
| | | | | | | | | | | | | | | | |
Net decrease in net assets resulting from capital share transactions | | | (146,710,075 | ) | | | (148,729,635 | ) | | | (78,711,520 | ) | | | (74,963,384 | ) |
| | | | | | | | | | | | | | | | |
Net increase (decrease) in net assets | | | (60,538,559 | ) | | | (2,405,565 | ) | | | 43,333,760 | | | | 79,330,340 | |
| | | | | | | | | | | | | | | | |
NET ASSETS: | | | | | | | | | | | | | | | | |
Beginning of year | | | 863,272,730 | | | | 865,678,295 | | | | 651,141,006 | | | | 571,810,666 | |
| | | | | | | | | | | | | | | | |
End of year | | $ | 802,734,171 | | | $ | 863,272,730 | | | $ | 694,474,766 | | | $ | 651,141,006 | |
| | | | | | | | | | | | | | | | |
Undistributed net investment income at end of year | | $ | 13,756,731 | | | $ | 15,880,790 | | | $ | 5,146,093 | | | $ | 6,897,927 | |
| | | | | | | | | | | | | | | | |
See Accompanying Notes to Financial Statements
14
STATEMENTS OF CHANGES IN NET ASSETS
| | | | | | | | |
| | | ING Index Plus SmallCap Portfolio | |
| | | Year Ended December 31, 2010 | | | Year Ended December 31, 2009 | |
FROM OPERATIONS: | | | | | | | | |
Net investment income | | $ | 2,715,279 | | | $ | 2,273,049 | |
Net realized gain (loss) | | | 45,819,237 | | | | (71,816,252 | ) |
Net change in unrealized appreciation or depreciation | | | 13,529,783 | | | | 133,120,587 | |
| | | | | | | | |
Increase in net assets resulting from operations | | | 62,064,299 | | | | 63,577,384 | |
| | | | | | | | |
FROM DISTRIBUTIONS TO SHAREHOLDERS: | | | | | | | | |
Net investment income: | | | | | | | | |
Class I | | | (1,452,197 | ) | | | (3,679,023 | ) |
Class S | | | (526,966 | ) | | | (1,395,586 | ) |
| | | | | | | | |
Total distributions | | | (1,979,163 | ) | | | (5,074,609 | ) |
| | | | | | | | |
FROM CAPITAL SHARE TRANSACTIONS: | | | | | | | | |
Net proceeds from sale of shares | | | 17,091,543 | | | | 16,733,517 | |
Reinvestment of distributions | | | 1,979,163 | | | | 5,074,609 | |
| | | | | | | | |
| | | 19,070,706 | | | | 21,808,126 | |
Cost of shares redeemed | | | (55,074,577 | ) | | | (77,225,953 | ) |
| | | | | | | | |
Net decrease in net assets resulting from capital share transactions | | | (36,003,871 | ) | | | (55,417,827 | ) |
| | | | | | | | |
Net increase in net assets | | | 24,081,265 | | | | 3,084,948 | |
| | | | | | | | |
NET ASSETS: | | | | | | | | |
Beginning of year | | | 300,649,091 | | | | 297,564,143 | |
| | | | | | | | |
End of year | | $ | 324,730,356 | | | $ | 300,649,091 | |
| | | | | | | | |
Undistributed net investment income at end of year | | $ | 2,327,592 | | | $ | 1,978,110 | |
| | | | | | | | |
See Accompanying Notes to Financial Statements
15
FINANCIAL HIGHLIGHTS
Selected data for a share of beneficial interest outstanding throughout each year or period.
| | | | | | | | | | | | | | | | | | | | | | | | | | | | | | | | | | | | | | | | | | | | | | | | | | | | | | | | | | | | | | | | |
| | | | | | Income (loss)
from
investment
operations | | | | | | Less distributions | | | | | | | | | | | | Ratios to average net assets | | | Supplemental
data | |
| | | | | | | | | | | | | | | | | | | | | | | | | | | | | | | | | | | | | | | | | | | | | | | | | | | | | | | | | | | | | | | | |
| | | Net asset value, beginning of year or period | | | Net investment income (loss) | | | Net realized and unrealized gain (loss) | | | Total from investment operations | | | From net investment income | | | From net realized gains | | | From return of capital | | | Total distributions | | | Net asset value, end of year or period | | | Total Return(1) | | | Expenses before reductions/ additions(2) | | | Expenses net of fee waivers and/or recoupments, if any(2)(3) | | | Expenses net of all reductions/ additions(2)(3) | | | `Net investment income (loss)(2)(3) | | | Net assets, end of year or period | | | Portfolio turnover rate | |
| | | | | | | | | | | | | | | | | | | | | | | | | | | | | | | | | | | | | | | | | | | | | | | | | | | | | | | | | | | | | | | | |
Year or period ended | | ($) | | | ($) | | | ($) | | | ($) | | | ($) | | | ($) | | | ($) | | | ($) | | | ($) | | | (%) | | | (%) | | | (%) | | | (%) | | | (%) | | | ($000’s) | | | (%) | |
ING Index Plus LargeCap Portfolio | | | | | | | | | | | | | | | | | | | | | | | | | | | | | | | | | | | | | | | | | | | | | | | | | | | | | | | | | | | | | | | | |
Class I | | | | | | | | | | | | | | | | | | | | | | | | | | | | | | | | | | | | | | | | | | | | | | | | | | | | | | | | | | | | | | | | |
12-31-10 | | | 12.42 | | | | 0.22 | • | | | 1.50 | | | | 1.72 | | | | 0.25 | | | | — | | | | — | | | | 0.25 | | | | 13.89 | | | | 13.96 | | | | 0.44 | | | | 0.44 | † | | | 0.44 | † | | | 1.75 | † | | | 631,278 | | | | 157 | |
12-31-09 | | | 10.44 | | | | 0.21 | • | | | 2.12 | | | | 2.33 | | | | 0.35 | | | | — | | | | — | | | | 0.35 | | | | 12.42 | | | | 23.20 | | | | 0.45 | | | | 0.45 | † | | | 0.45 | † | | | 2.01 | † | | | 678,612 | | | | 142 | |
12-31-08 | | | 18.13 | | | | 0.25 | • | | | (6.57 | ) | | | (6.32 | ) | | | 0.30 | | | | 1.07 | | | | — | | | | 1.37 | | | | 10.44 | | | | (37.21 | ) | | | 0.47 | | | | 0.47 | † | | | 0.47 | † | | | 1.70 | † | | | 680,918 | | | | 175 | |
12-31-07 | | | 17.48 | | | | 0.29 | • | | | 0.58 | | | | 0.87 | | | | 0.22 | | | | — | | | | — | | | | 0.22 | | | | 18.13 | | | | 5.03 | †† | | | 0.44 | | | | 0.44 | † | | | 0.44 | † | | | 1.62 | † | | | 2,323,707 | | | | 121 | |
12-31-06 | | | 15.42 | | | | 0.23 | • | | | 2.00 | | | | 2.23 | | | | 0.17 | | | | — | | | | — | | | | 0.17 | | | | 17.48 | | | | 14.58 | | | | 0.43 | | | | 0.43 | † | | | 0.43 | † | | | 1.46 | † | | | 2,352,193 | | | | 128 | |
Class S | | | | | | | | | | | | | | | | | | | | | | | | | | | | | | | | | | | | | | | | | | | | | | | | | | | | | | | | | | | | | | | | |
12-31-10 | | | 12.33 | | | | 0.19 | • | | | 1.48 | | | | 1.67 | | | | 0.22 | | | | — | | | | — | | | | 0.22 | | | | 13.78 | | | | 13.63 | | | | 0.69 | | | | 0.69 | † | | | 0.69 | † | | | 1.50 | † | | | 171,456 | | | | 157 | |
12-31-09 | | | 10.34 | | | | 0.18 | • | | | 2.12 | | | | 2.30 | | | | 0.31 | | | | — | | | | — | | | | 0.31 | | | | 12.33 | | | | 23.01 | | | | 0.70 | | | | 0.70 | † | | | 0.70 | † | | | 1.76 | † | | | 184,661 | | | | 142 | |
12-31-08 | | | 17.99 | | | | 0.21 | • | | | (6.51 | ) | | | (6.30 | ) | | | 0.28 | | | | 1.07 | | | | — | | | | 1.35 | | | | 10.34 | | | | (37.40 | ) | | | 0.72 | | | | 0.72 | † | | | 0.72 | † | | | 1.53 | † | | | 184,760 | | | | 175 | |
12-31-07 | | | 17.32 | | | | 0.25 | • | | | 0.57 | | | | 0.82 | | | | 0.15 | | | | — | | | | — | | | | 0.15 | | | | 17.99 | | | | 4.77 | †† | | | 0.69 | | | | 0.69 | † | | | 0.69 | † | | | 1.38 | † | | | 319,717 | | | | 121 | |
12-31-06 | | | 15.30 | | | | 0.18 | • | | | 1.99 | | | | 2.17 | | | | 0.15 | | | | — | | | | — | | | | 0.15 | | | | 17.32 | | | | 14.28 | | | | 0.68 | | | | 0.68 | † | | | 0.68 | † | | | 1.13 | † | | | 209,440 | | | | 128 | |
| | | | | | | | | | | | | | | | |
ING Index Plus MidCap Portfolio | | | | | | | | | | | | | | | | | | | | | | | | | | | | | | | | | | | | | | | | | | | | | | | | | | | | | | | | | | | | | | | | |
Class I | | | | | | | | | | | | | | | | | | | | | | | | | | | | | | | | | | | | | | | | | | | | | | | | | | | | | | | | | | | | | | | | |
12-31-10 | | | 12.85 | | | | 0.11 | • | | | 2.70 | | | | 2.81 | | | | 0.15 | | | | — | | | | — | | | | 0.15 | | | | 15.51 | | | | 21.91 | | | | 0.48 | | | | 0.48 | † | | | 0.48 | † | | | 0.84 | † | | | 549,499 | | | | 162 | |
12-31-09 | | | 9.94 | | | | 0.15 | • | | | 2.95 | | | | 3.10 | | | | 0.19 | | | | — | | | | — | | | | 0.19 | | | | 12.85 | | | | 31.71 | | | | 0.52 | | | | 0.52 | † | | | 0.52 | † | | | 1.38 | † | | | 512,163 | | | | 132 | |
12-31-08 | | | 18.33 | | | | 0.22 | | | | (6.37 | ) | | | (6.15 | ) | | | 0.22 | | | | 2.02 | | | | — | | | | 2.24 | | | | 9.94 | | | | (37.56 | ) | | | 0.52 | | | | 0.52 | † | | | 0.52 | † | | | 1.14 | † | | | 447,503 | | | | 113 | |
12-31-07 | | | 18.89 | | | | 0.21 | | | | 0.83 | | | | 1.04 | | | | 0.15 | | | | 1.45 | | | | — | | | | 1.60 | | | | 18.33 | | | | 5.50 | †† | | | 0.49 | | | | 0.49 | † | | | 0.49 | † | | | 1.06 | † | | | 1,177,708 | | | | 127 | |
12-31-06 | | | 18.69 | | | | 0.17 | • | | | 1.57 | | | | 1.74 | | | | 0.12 | | | | 1.42 | | | | — | | | | 1.54 | | | | 18.89 | | | | 9.44 | | | | 0.49 | | | | 0.49 | † | | | 0.49 | † | | | 0.92 | † | | | 1,148,074 | | | | 84 | |
Class S | | | | | | | | | | | | | | | | | | | | | | | | | | | | | | | | | | | | | | | | | | | | | | | | | | | | | | | | | | | | | | | | |
12-31-10 | | | 12.72 | | | | 0.08 | • | | | 2.66 | | | | 2.74 | | | | 0.12 | | | | — | | | | — | | | | 0.12 | | | | 15.34 | | | | 21.57 | | | | 0.73 | | | | 0.73 | † | | | 0.73 | † | | | 0.59 | † | | | 144,975 | | | | 162 | |
12-31-09 | | | 9.82 | | | | 0.12 | • | | | 2.93 | | | | 3.05 | | | | 0.15 | | | | — | | | | — | | | | 0.15 | | | | 12.72 | | | | 31.47 | | | | 0.77 | | | | 0.77 | † | | | 0.77 | † | | | 1.13 | † | | | 138,978 | | | | 132 | |
12-31-08 | | | 18.13 | | | | 0.14 | | | | (6.26 | ) | | | (6.12 | ) | | | 0.17 | | | | 2.02 | | | | — | | | | 2.19 | | | | 9.82 | | | | (37.73 | ) | | | 0.77 | | | | 0.77 | † | | | 0.77 | † | | | 0.91 | † | | | 124,308 | | | | 113 | |
12-31-07 | | | 18.69 | | | | 0.15 | | | | 0.84 | | | | 0.99 | | | | 0.10 | | | | 1.45 | | | | — | | | | 1.55 | | | | 18.13 | | | | 5.26 | †† | | | 0.74 | | | | 0.74 | † | | | 0.74 | † | | | 0.81 | † | | | 245,948 | | | | 127 | |
12-31-06 | | | 18.53 | | | | 0.12 | | | | 1.55 | | | | 1.67 | | | | 0.09 | | | | 1.42 | | | | — | | | | 1.51 | | | | 18.69 | | | | 9.12 | | | | 0.74 | | | | 0.74 | † | | | 0.74 | † | | | 0.63 | † | | | 227,616 | | | | 84 | |
See Accompanying Notes to Financial Statements
16
FINANCIAL HIGHLIGHTS (CONTINUED)
Selected data for a share of beneficial interest outstanding throughout each year or period.
| | | | | | | | | | | | | | | | | | | | | | | | | | | | | | | | | | | | | | | | | | | | | | | | | | | | | | | | | | | | | | | | |
| | | | | | Income (loss)
from
investment
operations | | | | | | Less distributions | | | | | | | | | | | | Ratios to average net assets | | | Supplemental
data | |
| | | | | | | | | | | | | | | | | | | | | | | | | | | | | | | | | | | | | | | | | | | | | | | | | | | | | | | | | | | | | | | | |
| | | Net asset value, beginning of year or period | | | Net investment income (loss) | | | Net realized and unrealized gain (loss) | | | Total from investment operations | | | From net investment income | | | From net realized gains | | | From return of capital | | | Total distributions | | | Net asset value, end of year or period | | | Total Return(1) | | | Expenses before reductions/ additions(2) | | | Expenses net of fee waivers and/or recoupments, if any(2)(3) | | | Expenses net of all reductions/ additions(2)(3) | | | Net investment income (loss)(2)(3) | | | Net assets, end of year or period | | | Portfolio turnover rate | |
| | | | | | | | | | | | | | | | | | | | | | | | | | | | | | | | | | | | | | | | | | | | | | | | | | | | | | | | | | | | | | | | |
Year or period ended | | ($) | | | ($) | | | ($) | | | ($) | | | ($) | | | ($) | | | ($) | | | ($) | | | ($) | | | (%) | | | (%) | | | (%) | | | (%) | | | (%) | | | ($000’s) | | | (%) | |
ING Index Plus SmallCap Portfolio | | | | | | | | | | | | | | | | | | | | | | | | | | | | | | | | | | | | | | | | | | | | | | | | | | | | | | | | | | | | | | | | |
Class I | | | | | | | | | | | | | | | | | | | | | | | | | | | | | | | | | | | | | | | | | | | | | | | | | | | | | | | | | | | | | | | | |
12-31-10 | | | 11.52 | | | | 0.12 | • | | | 2.51 | | | | 2.63 | | | | 0.09 | | | | — | | | | — | | | | 0.09 | | | | 14.06 | | | | 22.84 | | | | 0.49 | | | | 0.49 | † | | | 0.49 | † | | | 0.99 | † | | | 215,343 | | | | 160 | |
12-31-09 | | | 9.41 | | | | 0.09 | • | | | 2.20 | | | | 2.29 | | | | 0.18 | | | | — | | | | — | | | | 0.18 | | | | 11.52 | | | | 24.85 | | | | 0.52 | | | | 0.52 | † | | | 0.52 | † | | | 0.90 | † | | | 197,476 | | | | 98 | |
12-31-08 | | | 15.19 | | | | 0.14 | • | | | (4.97 | ) | | | (4.83 | ) | | | 0.12 | | | | 0.83 | | | | — | | | | 0.95 | | | | 9.41 | | | | (33.58 | ) | | | 0.52 | | | | 0.52 | † | | | 0.52 | † | | | 1.10 | † | | | 201,978 | | | | 100 | |
12-31-07 | | | 17.99 | | | | 0.12 | | | | (1.07 | ) | | | (0.95 | ) | | | 0.08 | | | | 1.77 | | | | — | | | | 1.85 | | | | 15.19 | | | | (6.22 | ) | | | 0.49 | | | | 0.49 | † | | | 0.49 | † | | | 0.67 | † | | | 638,474 | | | | 126 | |
12-31-06 | | | 16.68 | | | | 0.09 | • | | | 2.20 | | | | 2.29 | | | | 0.07 | | | | 0.91 | | | | — | | | | 0.98 | | | | 17.99 | | | | 13.82 | | | | 0.49 | | | | 0.49 | † | | | 0.49 | † | | | 0.52 | † | | | 745,115 | | | | 93 | |
Class S | | | | | | | | | | | | | | | | | | | | | | | | | | | | | | | | | | | | | | | | | | | | | | | | | | | | | | | | | | | | | | | | |
12-31-10 | | | 11.41 | | | | 0.09 | • | | | 2.47 | | | | 2.56 | | | | 0.06 | | | | — | | | | — | | | | 0.06 | | | | 13.91 | | | | 22.47 | | | | 0.74 | | | | 0.74 | † | | | 0.74 | † | | | 0.74 | † | | | 109,387 | | | | 160 | |
12-31-09 | | | 9.30 | | | | 0.06 | • | | | 2.19 | | | | 2.25 | | | | 0.14 | | | | — | | | | — | | | | 0.14 | | | | 11.41 | | | | 24.65 | | | | 0.77 | | | | 0.77 | † | | | 0.77 | † | | | 0.65 | † | | | 103,173 | | | | 98 | |
12-31-08 | | | 15.01 | | | | 0.13 | | | | (4.93 | ) | | | (4.80 | ) | | | 0.08 | | | | 0.83 | | | | — | | | | 0.91 | | | | 9.30 | | | | (33.73 | ) | | | 0.77 | | | | 0.77 | † | | | 0.77 | † | | | 0.87 | † | | | 95,586 | | | | 100 | |
12-31-07 | | | 17.79 | | | | 0.07 | | | | (1.06 | ) | | | (0.99 | ) | | | 0.02 | | | | 1.77 | | | | — | | | | 1.79 | | | | 15.01 | | | | (6.49 | ) | | | 0.74 | | | | 0.74 | † | | | 0.74 | † | | | 0.42 | † | | | 181,986 | | | | 126 | |
12-31-06 | | | 16.53 | | | | 0.04 | • | | | 2.18 | | | | 2.22 | | | | 0.05 | | | | 0.91 | | | | — | | | | 0.96 | | | | 17.79 | | | | 13.48 | | | | 0.74 | | | | 0.74 | † | | | 0.74 | † | | | 0.25 | † | | | 204,246 | | | | 93 | |
| (1) | | Total return is calculated assuming reinvestment of all dividends and capital gain distributions at net asset value and does not reflect the effect of insurance contract charges. |
| (2) | | Expense ratios reflect operating expenses of a Portfolio. Expenses before reductions/additions do not reflect amounts reimbursed by the Investment Adviser and/or Distributor or reductions from brokerage commission recapture arrangements or other expense offset arrangements and do not represent the amount paid by a Portfolio during periods when reimbursements or reductions occur. Expenses net of fee waivers reflect expenses after reimbursement by the Investment Adviser and/or Distributor but prior to reductions from brokerage commission recapture arrangements or other expense offset arrangements. Expenses net of all reductions/additions represent the net expenses paid by a Portfolio. Net investment income (loss) is net of all such additions or reductions. |
| · | | Calculated using average number of shares outstanding throughout the period. |
| † | | Impact of waiving the advisory fee for the ING Institutional Prime Money Market Fund holding has less than 0.005% impact on the expense ratio and net investment income or loss ratio (Note 4). |
| †† | | There was no impact on total return due to payment by affiliate in 2007. |
See Accompanying Notes to Financial Statements
17
NOTES TO FINANCIAL STATEMENTSASOF DECEMBER 31, 2010
NOTE 1 — ORGANIZATION
Organization. ING Variable Portfolios, Inc. (the “Company”) is registered under the Investment Company Act of 1940, as amended (“1940 Act” or “Act”) as an open-end management investment company.
ING Variable Portfolios, Inc. is a company incorporated under the laws of Maryland on June 4, 1996. There are eighteen active separate investment series that comprise the Company. The three series (each a “Portfolio”, collectively the “Portfolios”) that are in this report are: ING Index Plus LargeCap Portfolio (“Index Plus LargeCap”), ING Index Plus MidCap Portfolio (“Index Plus MidCap”), and ING Index Plus SmallCap Portfolio (“Index Plus SmallCap”).
The Company is authorized to offer four share classes of the Portfolios, referred to as Class ADV, Class I, Class S and Service 2 Class (“Class S2”); however the Portfolios do not currently offer all classes. Each class has equal rights as to class and voting privileges. The classes differ principally in the applicable distribution and shareholder service fees. Shareholders of each class also bear certain expenses that pertain to that particular class. All shareholders bear the common expenses of the Portfolios and earn income and realized gains/losses from the Portfolios pro rata based on the average daily net assets of each class, without distinction between share classes. Expenses that are specific to a Portfolio or a class are charged directly to that Portfolio or class. Other operating expenses shared by several Portfolios are generally allocated among those Portfolios based on average net assets. Dividends are determined separately for each class based on income and expenses allocable to each class. Realized gain distributions are allocated to each class pro rata based on the shares outstanding of each class on the date of distribution. Differences in per share dividend rates generally result from differences in separate class expenses, including distribution and shareholder service fees, if applicable.
Shares of the Portfolios may be offered to separate accounts of insurance companies as investment options under variable annuity contracts and variable life insurance policies (“Variable Contracts”). Shares may also be offered to qualified pension and retirement plans outside the Variable Contract and to certain investment advisers and their affiliates. Class I shares may be made available to other investment companies, including other series of the Company under fund-of-funds arrangements.
Participating insurance companies and other designated organizations are authorized to receive purchase orders on each Portfolio’s behalf.
ING Investments, LLC serves as the investment adviser (“ING Investments” or the “Investment Adviser”) to the Portfolios. ING Investment Management Co. serves as the sub-adviser (“ING IM” or the “Sub-Adviser”) to the Portfolios. ING Funds Services, LLC serves as the administrator (“IFS” or the “Administrator”) for the Portfolios. ING Investments Distributor, LLC (“IID” or the “Distributor”) serves as the principal underwriter to the Portfolios.
The Investment Adviser, the Sub-Adviser, IFS and IID are indirect, wholly-owned subsidiaries of ING Groep N.V. (“ING Groep”). ING Groep is a global financial institution of Dutch origin offering banking, investments, life insurance and retirement services.
ING Groep has adopted a formal restructuring plan that was approved by the European Commission in November 2009 under which the ING life insurance businesses, including the retirement services and investment management businesses, which include the Investment Adviser and its affiliates, would be divested by ING Groep by the end of 2013. While there can be no assurance that it will be carried out, the restructuring plan presents certain risks, including uncertainty about the effect on the businesses of the ING entities that service the Portfolios and potential termination of the Portfolios’ existing advisory agreement, which may trigger the need for shareholder approval of new agreements.
NOTE 2 — SIGNIFICANT ACCOUNTING POLICIES
The following significant accounting policies are consistently followed by the Portfolios in the preparation of their financial statements. Such policies are in conformity with U.S. generally accepted accounting principles for investment companies.
A. Security Valuation. All investments in securities are recorded at their estimated fair value, as described below. Investments in equity securities traded on a national securities exchange are valued at the last reported sale price. Securities reported by NASDAQ are valued at the NASDAQ official closing prices. Securities traded on an exchange or NASDAQ for which there has been no sale and securities traded in the over-the-counter-market are valued at the mean between the last reported bid and ask prices. All investments quoted in foreign currencies will be valued daily in U.S. dollars on the basis of the foreign currency exchange rates
18
NOTES TO FINANCIAL STATEMENTSASOF DECEMBER 31, 2010 (CONTINUED)
NOTE 2 — SIGNIFICANT ACCOUNTING POLICIES (continued)
prevailing at that time. Debt securities acquired with more than 60 days to maturity are valued using matrix pricing methods determined by an independent pricing service which takes into consideration such factors as yields, maturities, liquidity, ratings and traded prices in similar or identical securities. Investments in securities of sufficient credit quality, maturing in 60 days or less are valued at amortized cost which approximates fair value. Investments in open-end mutual funds are valued at net asset value.
Securities for which valuations are not readily available from an independent pricing service may be valued by brokers which use prices provided by market makers or estimates of fair market value obtained from yield data relating to investments or securities with similar characteristics. U.S. government obligations are valued by using market quotations or independent pricing services that use prices provided by market-makers or estimates of market values obtained from yield data relating to instruments or securities with similar characteristics.
Securities and assets for which market quotations are not readily available (which may include certain restricted securities which are subject to limitations as to their sale) are valued at their fair values, as defined by the 1940 Act, and as determined in good faith by or under the supervision of the Portfolios’ Board of Directors (“Board”), in accordance with methods that are specifically authorized by the Board. Securities traded on exchanges, including foreign exchanges, which close earlier than the time that a Portfolio calculates its net asset value (“NAV”) may also be valued at their fair values, as defined by the 1940 Act, and as determined in good faith by or under the supervision of the Board, in accordance with methods that are specifically authorized by the Board. All such valuations are made in accordance with valuation procedures of the Portfolios (the “Valuation Procedures”) which have been approved by the Board. The valuation techniques applied in any specific instance are set forth in the Valuation Procedures and may vary from case to case. With respect to a restricted security, for example, consideration is generally given to the cost of the investment, the market value of any unrestricted securities of the same class at the time of valuation, the potential expiration of restrictions on the security, the existence of any registration rights, the costs to the Portfolios related to registration of the security, as well as factors relevant to the issuer itself.
Consideration may also be given to the price and extent of any public trading in similar securities of the issuer or comparable companies’ securities. The value of a foreign security traded on an exchange outside the United States is generally based on its price on the principal foreign exchange where it trades as of the time a Portfolio determines its NAV or if the foreign exchange closes prior to the time a Portfolio determines its NAV, the most recent closing price of the foreign security on its principal exchange. Trading in certain non-U.S. securities may not take place on all days on which the New York Stock Exchange (“NYSE”) is open. Further, trading takes place in various foreign markets on days on which the NYSE is not open. Consequently, the calculation of a Portfolio’s NAV may not take place contemporaneously with the determination of the prices of securities held by a Portfolio in foreign securities markets. Further, the value of a Portfolio’s assets may be significantly affected by foreign trading on days when a shareholder cannot purchase or redeem shares of a Portfolio. In calculating a Portfolio’s NAV, foreign securities denominated in foreign currency are converted to U.S. dollar equivalents. If an event occurs after the time at which the market for foreign securities held by a Portfolio closes but before the time that a Portfolio’s NAV is calculated, such event may cause the closing price on the foreign exchange to not represent a readily available reliable market value quotation for such securities at the time a Portfolio determines its NAV. In such a case, a Portfolio will use the fair value of such securities as determined under a Portfolio’s valuation procedures. Events after the close of trading on a foreign market that could require a Portfolio to fair value some or all of its foreign securities include, among others, securities trading in the U.S. and other markets, corporate announcements, natural and other disasters, and political and other events. Among other elements of analysis in the determination of a security’s fair value, the Board has authorized the use of one or more independent research services to assist with such determinations. An independent research service may use statistical analyses and quantitative models to help determine fair value as of the time a Portfolio calculates its NAV. There can be no assurance that such models accurately reflect the behavior of the applicable markets or the effect of the behavior of such markets on the fair value of securities, or that such markets will continue to behave in a fashion that is consistent with such models. Unlike the closing price of a security on an exchange, fair value determinations employ elements of
19
NOTES TO FINANCIAL STATEMENTSASOF DECEMBER 31, 2010 (CONTINUED)
NOTE 2 — SIGNIFICANT ACCOUNTING POLICIES (continued)
judgment. Consequently, the fair value assigned to a security may not represent the actual value that a Portfolio could obtain if it were to sell the security at the time of the close of the NYSE. Pursuant to procedures adopted by the Board, a Portfolio is not obligated to use the fair valuations suggested by any research service, and valuation recommendations provided by such research services may be overridden if other events have occurred or if other fair valuations are determined in good faith to be more accurate. Unless an event is such that it causes a Portfolio to determine that the closing prices for one or more securities do not represent readily available reliable market value quotations at the time the Portfolio determines its NAV, events that occur between the time of the close of the foreign market on which they are traded and the close of regular trading on the NYSE will not be reflected in a Portfolio’s NAV.
Fair value is defined as the price that the Portfolio would receive to sell an asset or pay to transfer a liability in an orderly transaction between market participants at the measurement date. Each investment asset or liability of the Portfolio is assigned a level at measurement date based on the significance and source of the inputs to its valuation. Quoted prices in active markets for identical securities are classified as “Level 1,” inputs other than quoted prices for an asset or liability that are observable are classified as “Level 2” and unobservable inputs, including the sub-adviser’s judgment about the assumptions that a market participant would use in pricing an asset or liability are classified as “Level 3.” The inputs used for valuing securities are not necessarily an indication of the risks associated with investing in those securities. Short-term securities of sufficient credit quality which are valued at amortized cost, which approximates fair value, are generally considered to be Level 2 securities under applicable accounting rules. A table summarizing each Portfolio’s investments under these levels of classification is included following the Summary Portfolio of Investments.
For the year ended December 31, 2010, there have been no significant changes to the fair valuation methodologies.
B. Security Transactions and Revenue Recognition. Securities transactions are accounted for on the trade date. Realized gains and losses are reported on the basis of identified cost of securities sold. Interest
income is recorded on an accrual basis. Dividend income is recorded on the ex-dividend date, or for certain foreign securities, when the information becomes available to the Portfolios. Premium amortization and discount accretion are determined by the effective yield method.
C. Foreign Currency Translation. The books and records of the Portfolios are maintained in U.S. dollars. Any foreign currency amounts are translated into U.S. dollars on the following basis:
| | (1) | Market value of investment securities, other assets and liabilities — at the exchange rates prevailing at the end of the day. |
| | (2) | Purchases and sales of investment securities, income and expenses — at the rates of exchange prevailing on the respective dates of such transactions. |
Although the net assets and the market values are presented at the foreign exchange rates at the end of the day, the Portfolios do not isolate the portion of the results of operations resulting from changes in foreign exchange rates on investments from the fluctuations arising from changes in market prices of securities held. Such fluctuations are included with the net realized and unrealized gains or losses from investments. For securities, which are subject to foreign withholding tax upon disposition, liabilities are recorded on the Statements of Assets and Liabilities for the estimated tax withholding based on the securities’ current market value. Upon disposition, realized gains or losses on such securities are recorded net of foreign withholding tax.
Reported net realized foreign exchange gains or losses arise from sales of foreign currencies, currency gains or losses realized between the trade and settlement dates on securities transactions, the difference between the amounts of dividends, interest, and foreign withholding taxes recorded on a Portfolio’s books, and the U.S. dollar equivalent of the amounts actually received or paid. Net unrealized foreign exchange gains and losses arise from changes in the value of assets and liabilities other than investments in securities at fiscal year end, resulting from changes in the exchange rate. Foreign security and currency transactions may involve certain considerations and risks not typically associated with investing in U.S. companies and U.S. Government securities. These risks include, but are not limited to, revaluation of currencies and future adverse political and economic developments which could cause
20
NOTES TO FINANCIAL STATEMENTSASOF DECEMBER 31, 2010 (CONTINUED)
NOTE 2 — SIGNIFICANT ACCOUNTING POLICIES (continued)
securities and their markets to be less liquid and prices more volatile than those of comparable U.S. companies and U.S. Government securities.
D. Distributions to Shareholders. The Portfolios record distributions to their shareholders on the ex- dividend date. Dividends from net investment income and capital gains, if any, are declared and paid annually by the Portfolios. The Portfolios may make distributions on a more frequent basis to comply with the distribution requirements of the Internal Revenue Code. The characteristics of income and gains to be distributed are determined in accordance with income tax regulations, which may differ from U.S. generally accepted accounting principles for investment companies.
E. Federal Income Taxes. It is the policy of each Portfolio to comply with subchapter M of the Internal Revenue Code and related excise tax provisions applicable to regulated investment companies and to distribute substantially all of its net investment income and any net realized capital gains to their shareholders. Therefore, no federal income tax provision is required. Management has considered the sustainability of the Portfolios’ tax positions taken on federal income tax returns for all open tax years in making this determination. No capital gain distributions shall be made until any capital loss carryforwards have been fully utilized or expire.
F. Use of Estimates. The preparation of financial statements in conformity with U.S. generally accepted accounting principles requires management to make estimates and assumptions that affect the reported amounts of assets and liabilities and disclosure of contingent assets and liabilities at the date of the financial statements and the reported amounts of increases and decreases in net assets from operations during the reporting period. Actual results could differ from those estimates.
G. Risk Exposures and the use of Derivative Instruments. Each Portfolio’s investment objectives permit it to enter into various types of derivatives contracts, including, but not limited to, futures contracts, forward foreign currency exchange contracts, credit default swaps, interest rate swaps, total return swaps, and purchased and written options. In doing so, the Portfolio will employ strategies in differing combinations to permit it to increase or decrease the level of risk, or change the
level or types of exposure to market risk factors. This may allow the Portfolio to pursue its objectives more quickly, and efficiently than if it were to make direct purchases or sales of securities capable of affecting a similar response to market factors.
Market Risk Factors. In pursuit of its investment objectives, a Portfolio may seek to use derivatives to increase or decrease its exposure to the following market risk factors:
Credit Risk. Credit risk relates to the ability of the issuer to meet interest and principal payments, or both, as they come due. In general, lower-grade, higher-yield bonds are subject to credit risk to a greater extent than lower-yield, higher-quality bonds.
Equity Risk. Equity risk relates to the change in value of equity securities as they relate to increases or decreases in the general market.
Foreign Exchange Rate Risk. Foreign exchange rate risk relates to the change in U.S. dollar value of a security held that is denominated in a foreign currency. The U.S. dollar value of a foreign currency denominated security will decrease as the dollar appreciates against the currency, while the U.S. dollar value will increase as the dollar depreciates against the currency.
Interest Rate Risk. Interest rate risk refers to the fluctuations in value of fixed-income securities resulting from the inverse relationship between price and yield. For example, an increase in general interest rates will tend to reduce the market value of already issued fixed-income investments, and a decline in general interest rates will tend to increase their value. In addition, debt securities with longer durations, which tend to have higher yields, are subject to potentially greater fluctuations in value from changes in interest rates than obligations with shorter durations.
Risks of Investing in Derivatives. Each Portfolio’s use of derivatives can result in losses due to unanticipated changes in the market risk factors and the overall market. In instances where a Portfolio is using derivatives to decrease, or hedge, exposures to market risk factors for securities held by a Portfolio, there are also risks that those derivatives may not perform as expected resulting in losses for the combined or hedged positions.
The use of these strategies involves certain special risks, including a possible imperfect correlation, or even no correlation, between price movements of
21
NOTES TO FINANCIAL STATEMENTSASOF DECEMBER 31, 2010 (CONTINUED)
NOTE 2 — SIGNIFICANT ACCOUNTING POLICIES (continued)
derivative instruments and price movements of related investments. While some strategies involving derivative instruments can reduce the risk of loss, they can also reduce the opportunity for gain or even result in losses by offsetting favorable price movements in related investments or otherwise, due to the possible inability of a Portfolio to purchase or sell a portfolio security at a time that otherwise would be favorable or the possible need to sell a portfolio security at a disadvantageous time because the Portfolio is required to maintain asset coverage or offsetting positions in connection with transactions in derivative instruments. Additional associated risks from investing in derivatives also exist and potentially could have significant effects on the valuation of the derivative and a Portfolio. Associated risks are not the risks that a Portfolio is attempting to increase or decrease exposure to, per their investment objectives, but are the additional risks from investing in derivatives. Examples of these associated risks are liquidity risk, which is the risk that a Portfolio will not be able to sell the derivative in the open market in a timely manner, and counterparty credit risk, which is the risk that the counterparty will not fulfill its obligation to a Portfolio. Associated risks can be different for each type of derivative and are discussed by each derivative type in the following notes.
H. Foreign Currency Transactions and Futures Contracts. Each Portfolio may enter into foreign currency exchange transactions to convert to and from different foreign currencies and to and from the U.S. dollar in connection with the planned purchases or sales of securities. When entering into a currency forward contract, a Portfolio agrees to receive or deliver a fixed quantity of foreign currency for an agreed-upon price on an agreed upon date. The Portfolios either enter into these transactions on a spot basis at the spot rate prevailing in the foreign currency exchange market or use forward foreign currency contracts to purchase or sell foreign currencies. When the contract is fulfilled or closed, gains or losses are realized. Until then, the gain or loss is included in unrealized appreciation or depreciation. Risks may arise upon entering into forward contracts from the potential inability of counterparties to meet the terms of their forward contracts and from unanticipated movements in the value of foreign currencies relative to the U.S. dollar.
Each Portfolio may enter into futures contracts involving foreign currency, interest rates, securities and security indices. A futures contract is a commitment to buy or sell a specific amount of a financial instrument at a negotiated price on a stipulated future date. Each Portfolio may buy and sell futures contracts. Futures contracts traded on a commodities or futures exchange will be valued at the final settlement price or official closing price on the principal exchange as reported by such principal exchange at its trading session ending at, or most recently prior to, the time when the Portfolio’s assets are valued.
Upon entering into a futures contract, each Portfolio is required to deposit either cash or securities (initial margin) in an amount equal to a certain percentage of the contract value. Subsequent payments (variation margin) are made or received by the Portfolio each day. The variation margin payments are equal to the daily changes in the contract value and are recorded as unrealized gains and losses. Open futures contracts are reported on a table following each Summary Portfolio of Investments. Securities held in collateralized accounts to cover initial margin requirements on open futures contracts are footnoted in the Summary Portfolio of Investments. Cash collateral held by the broker to cover initial margin requirements on open futures contracts are noted in each Portfolio’s Statement of Assets and Liabilities. The net change in unrealized appreciation and depreciation is reported in each Portfolio’s Statement of Operations. Realized gains (losses) are reported in each Portfolio’s Statement of Operations at the closing or expiration of futures contracts.
Futures contracts are exposed to the market risk factor of the underlying financial instrument. During the year ended December 31, 2010, each Portfolio has purchased futures contracts on various equity indices to “equitize” cash. Futures contracts are purchased to provide immediate market exposure proportionate to the size of the Portfolio’s respective cash flows and residual cash balances in order to decrease potential tracking error if the cash remained uninvested in the market. Additional associated risks of entering into futures contracts include the possibility that there may be an illiquid market where the Portfolios are unable to liquidate the contract or enter into an offsetting position and, if used for hedging purposes, the risk that the price of the contract will correlate imperfectly with the prices of the Portfolios’ securities. With futures, there is minimal counterparty
22
NOTES TO FINANCIAL STATEMENTSASOF DECEMBER 31, 2010 (CONTINUED)
NOTE 2 — SIGNIFICANT ACCOUNTING POLICIES (continued)
credit risk to the Portfolios since futures are exchange traded and the exchange’s clearinghouse, as counterparty to all exchange traded futures, guarantees the futures against default.
During the year ended December 31, 2010, Index Plus LargeCap, Index Plus MidCap, and Index Plus SmallCap had average market values on futures contracts purchased of notional $14,136,211, $18,970,478 and $8,637,232, respectively.
I. Securities Lending. Each Portfolio has the option to temporarily loan up to 33 1/3% of its total assets to brokers, dealers or other financial institutions in exchange for a negotiated lender’s fee. The borrower is required to fully collateralize the loans with cash or U.S. Government securities. Generally, in the event of counterparty default, each Portfolio has the right to use collateral to offset losses incurred. There would be potential loss to a Portfolio in the event the Portfolio is delayed or prevented from exercising its right to dispose of the collateral. Each Portfolio bears the risk of loss with respect to the investment of collateral. Engaging in securities lending could have a leveraging effect, which may intensify the credit, market and other risks associated with investing in a Portfolio.
J. Restricted Securities. Each Portfolio may invest in restricted securities, which include those sold under Rule 144A of the Securities Act of 1933 (“1933 Act”) or securities offered pursuant to Section 4(2) of the 1933 Act, and/or are subject to legal or contractual restrictions on resale and may not be publicly sold without registration under the 1933 Act. Restricted securities are valued using market quotations when readily available. In the absence of market quotations, the securities are valued based upon their fair value, as defined in the Act, determined under procedures approved by the Board.
K. Indemnifications. In the normal course of business, the Company may enter into contracts that provide certain indemnifications. The Company’s maximum exposure under these arrangements is dependent on future claims that may be made against the Portfolios and, therefore, cannot be estimated; however, based on experience, management considers risk of loss from such claims remote.
NOTE 3 — INVESTMENT TRANSACTIONS
For the year ended December 31, 2010, the cost of purchases and the proceeds from the sale of securities, excluding short-term securities, were as follows:
| | | | | | | | |
| | | Purchases | | | Sales | |
Index Plus LargeCap | | $ | 1,232,902,816 | | | $ | 1,366,438,721 | |
Index Plus MidCap | | | 1,031,648,679 | | | | 1,116,487,288 | |
Index Plus SmallCap | | | 465,359,421 | | | | 500,096,940 | |
NOTE 4 — INVESTMENT MANAGEMENT AND ADMINISTRATIVE FEES
The Portfolios entered into an investment management agreement (“Investment Management Agreement”) with the Investment Adviser. The Investment Management Agreement compensates the Investment Adviser with a fee, computed daily and payable monthly, based on the average daily net assets of each Portfolio, at the following annual rates:
| | | | |
Index Plus LargeCap | | | 0.35 | % |
Index Plus MidCap | | | 0.40 | % |
Index Plus SmallCap | | | 0.40 | % |
The Investment Adviser entered into a sub-advisory agreement with ING IM. Subject to such policies as the Board or the Investment Adviser may determine, ING IM manages the Portfolios’ assets in accordance with the Portfolios’ investment objectives, policies, and limitations.
During the period ING Portfolios were permitted to invest end-of-day cash balances into ING Institutional Prime Money Market Fund. Investment management fees paid by the Portfolios were reduced by an amount equal to the management fees paid indirectly to the ING Institutional Prime Money Market Fund with respect to assets invested by the Portfolios. For the year ended December 31, 2010, the Investment Adviser for Index Plus LargeCap, Index Plus MidCap and Index Plus SmallCap waived $6,000, $7,919, and $4,926 of such management fees, respectively. These fees are not subject to recoupment.
Effective December 20, 2010, ING Institutional Prime Money Market Fund was liquidated. As a result of this liquidation, the Portfolios will no longer invest end-of-day cash balances into ING Institutional Prime Money Market Fund.
Pursuant to the Administration Agreement, IFS acts as administrator and provides certain administrative and shareholder services necessary for Portfolio operations and is responsible for the supervision of other service providers. IFS is entitled to receive from each Portfolio a
23
NOTES TO FINANCIAL STATEMENTSASOF DECEMBER 31, 2010 (CONTINUED)
NOTE 4 — INVESTMENT MANAGEMENT AND ADMINISTRATIVE FEES (continued)
fee at an annual rate of 0.055% on the first $5 billion of daily net assets and 0.03% thereafter.
In placing equity security transactions, the Investment Adviser or Sub-Adviser is required to use its best efforts to choose a broker capable of providing brokerage services necessary to obtain the best execution for each transaction. Subject to this requirement, the Investment Adviser or Sub-Adviser may allocate equity security transactions through certain designated broker-dealers. Some of these broker-dealers participate in commission recapture programs that have been established for the benefit of the Portfolios. Under these programs, the participating broker-dealers will return to a Portfolio a portion of the brokerage commissions (in the form of a credit to a Portfolio) paid to the broker-dealers to pay certain expenses of a Portfolio. These commission recapture payments benefit the Portfolios and not the Investment Adviser or Sub-Adviser. Any amount credited to a Portfolio is reflected as brokerage commission recapture in the Statements of Operations.
NOTE 5 — DISTRIBUTION FEES
Class S shares of the Portfolios have adopted a Shareholder Services and Distribution Plan pursuant to Rule 12b-1 under the 1940 Act (the “12b-1 Plans”), whereby the Distributor is compensated by each Portfolio for expenses incurred for shareholder servicing and/or the distribution of each Portfolio’s Class S shares. Pursuant to the 12b-1 Plans, the Distributor is entitled to a payment each month to compensate for expenses incurred in the distribution and promotion of each Portfolio’s S shares, including expenses incurred in printing prospectuses and reports used for sales purposes, expenses incurred in preparing and printing sales literature and other such distribution related expenses, including any distribution or shareholder servicing fees paid to securities dealers who have executed a distribution agreement with the Distributor. Under the 12b-1 Plans, Class S shares of the Portfolios pay the Distributor a fee calculated at an annual rate of 0.25% of average daily net assets.
NOTE 6 — OTHER TRANSACTIONS WITH AFFILIATED AND RELATED PARTIES
At December 31, 2010, the Portfolios had the following amounts recorded as payable to affiliates on the accompanying Statements of Assets and Liabilities (see Notes 4 and 5):
| | | | | | | | | | | | | | | | |
Portfolio | | Accrued
Investment
Management
Fees | | | Accrued
Administrative
Fees | | | Accrued
Shareholder
Service and
Distribution
Fees | | | Total | |
Index Plus LargeCap | | $ | 236,701 | | | $ | 37,248 | | | $ | 36,153 | | | $ | 310,102 | |
Index Plus MidCap | | | 234,973 | | | | 32,349 | | | | 30,950 | | | | 298,272 | |
Index Plus SmallCap | | | 109,718 | | | | 15,113 | | | | 23,414 | | | | 148,245 | |
At December 31, 2010, the following indirect, wholly-owned subsidiaries of ING Groep owned more than 5% of the following Portfolios:
| | | | | | |
Subsidiary | | Portfolio | | Percentage | |
ING Life Insurance and Annuity Company | | Index Plus LargeCap | | | 75.55 | % |
| | Index Plus MidCap | | | 75.70 | % |
| | Index Plus SmallCap | | | 59.84 | % |
ING USA Annuity and Life Insurance Company | | Index Plus LargeCap | | | 20.22 | % |
| | Index Plus MidCap | | | 19.21 | % |
| | Index Plus SmallCap | | | 31.26 | % |
Control is defined by the 1940 Act as the beneficial ownership, either directly or through one or more controlled companies, of more than 25% of the voting securities of a company. The 1940 Act defines affiliates as companies that are under common control. Therefore, because the Portfolios have a common owner that owns over 25% of the outstanding securities of the Portfolios, they may be deemed to be affiliates of each other. Investment activities of these shareholders could have a material impact on the Portfolios.
The Company has adopted a Deferred Compensation Plan (“Policy”), which allows eligible non-affiliated directors as described in the Policy to defer the receipt of all or a portion of the directors’ fees payable. Amounts deferred are treated as though invested in various “Notional” funds advised by ING Investments until distribution in accordance with the Policy.
24
NOTES TO FINANCIAL STATEMENTSASOF DECEMBER 31, 2010 (CONTINUED)
NOTE 7 — EXPENSE LIMITATION AGREEMENT
ING Investments entered into written expense limitation agreements (“Expense Limitation Agreement”) with each of the Portfolios whereby the Investment Adviser has agreed to limit expenses, excluding interest, taxes, brokerage commissions and extraordinary expenses (and acquired fund fees and expenses) to the levels listed below:
| | | | | | | | |
| | | Class I | | | Class S | |
Index Plus LargeCap | | | 0.55 | % | | | 0.80 | % |
Index Plus MidCap | | | 0.60 | % | | | 0.85 | % |
Index Plus SmallCap | | | 0.60 | % | | | 0.85 | % |
The Investment Adviser may at a later date recoup from a Portfolio for management fees waived and other expenses assumed by the Investment Adviser during the previous 36 months, but only if, after such recoupment, the Portfolio’s expense ratio does not exceed the percentage described above. Waived and reimbursed fees and any recoupment by the Investment Adviser of such waived and reimbursed fees are reflected on the accompanying Statements of Operations for each Portfolio. Amounts payable by the Investment Adviser are reflected on the accompanying Statements of Assets and Liabilities for each Portfolio.
As of December 31, 2010, the Portfolios did not have any amount of waived or reimbursed fees that would be subject to possible recoupment by the Investment Adviser.
The Expense Limitation Agreement is contractual and shall renew automatically for one-year terms unless ING Investments provides written notice of the termination of an Expense Limitation Agreement within 90 days of the end of the then current term.
NOTE 8 — LINE OF CREDIT
All of the Portfolios included in this report, in addition to certain other funds managed by the Investment Adviser, have entered into an unsecured committed revolving line of credit agreement (the “Credit Agreement”) with The Bank of New York Mellon for an aggregate amount of $100,000,000. The proceeds may be used to: (1) temporarily finance the purchase or sale of securities; or (2) finance the redemption of shares of an investor in the funds. During the period, the funds to which the line of credit is available paid a commitment fee equal to 0.15% per annum, and beginning December 15, 2010, 0.10% per annum on the daily unused portion of the committed line amount.
Generally, borrowings under the Credit Agreement accrue interest at the federal funds rate plus a specified margin. Repayments generally must be made within 60 days after the date of a revolving credit advance. Each Portfolio utilized the line of credit during the year ended December 31, 2010:
| | | | | | | | | | | | |
| | | Days
Utilized | | | Approximate
Average Daily
Balance | | | Approximate
Weighted
Average
Interest Rate | |
Index Plus LargeCap | | | 19 | | | $ | 1,382,105 | | | | 1.43 | % |
Index Plus MidCap | | | 5 | | | | 963,000 | | | | 1.43 | % |
Index Plus SmallCap | | | 3 | | | | 1,110,000 | | | | 1.44 | % |
25
NOTES TO FINANCIAL STATEMENTSASOF DECEMBER 31, 2010 (CONTINUED)
NOTE 9 — CAPITAL SHARES
Transactions in capital shares and dollars were as follows:
| | | | | | | | | | | | | | | | | | | | | | | | | | | | | | | | | | | | |
| | | Shares
sold | | | Reinvestment
of
distributions | | | Shares
redeemed | | | Net increase
(decrease) in
shares
outstanding | | | | | | Shares
sold | | | Reinvestment
of
distributions | | | Shares
redeemed | | | Net increase
(decrease) | |
Year or period ended | | # | | | # | | | # | | | # | | | | | | ($) | | | ($) | | | ($) | | | ($) | |
Index Plus LargeCap | | | | | | | | | | | | | | | | | | | | | | | | | |
Class I | | | | | | | | | | | | | | | | | | | | | | | | | | | | | | | | | | | | |
12-31-10 | | | 506,634 | | | | 970,136 | | | | (10,672,742 | ) | | | (9,195,972 | ) | | | | | | | 6,423,891 | | | | 12,854,302 | | | | (134,298,981 | ) | | | (115,020,788 | ) |
12-31-09 | | | 1,901,733 | | | | 2,226,025 | | | | (14,739,250 | ) | | | (10,611,492 | ) | | | | | | | 19,828,585 | | | | 21,659,223 | | | | (159,673,773 | ) | | | (118,185,965 | ) |
Class S | | | | | | | | | | | | | | | | | | | | | | | | | | | | | | | | | | | | |
12-31-10 | | | 104,266 | | | | 229,848 | | | | (2,875,682 | ) | | | (2,541,568 | ) | | | | | | | 1,297,881 | | | | 3,027,104 | | | | (36,014,272 | ) | | | (31,689,287 | ) |
12-31-09 | | | 182,243 | | | | 521,314 | | | | (3,587,044 | ) | | | (2,883,487 | ) | | | | | | | 1,964,005 | | | | 5,041,109 | | | | (37,548,784 | ) | | | (30,543,670 | ) |
Index Plus MidCap | | | | | | | | | | | | | | | | | | | | | | | | | |
Class I | | | | | | | | | | | | | | | | | | | | | | | | | | | | | | | | | | | | |
12-31-10 | | | 1,433,282 | | | | 391,190 | | | | (6,245,122 | ) | | | (4,420,650 | ) | | | | | | | 19,449,571 | | | | 5,687,907 | | | | (83,962,222 | ) | | | (58,824,744 | ) |
12-31-09 | | | 1,794,782 | | | | 816,590 | | | | (7,787,873 | ) | | | (5,176,501 | ) | | | | | | | 18,783,391 | | | | 8,141,405 | | | | (83,961,505 | ) | | | (57,036,709 | ) |
Class S | | | | | | | | | | | | | | | | | | | | | | | | | | | | | | | | | | | | |
12-31-10 | | | 156,089 | | | | 84,236 | | | | (1,716,479 | ) | | | (1,476,154 | ) | | | | | | | 2,133,886 | | | | 1,213,000 | | | | (23,233,662 | ) | | | (19,886,776 | ) |
12-31-09 | | | 209,847 | | | | 177,669 | | | | (2,116,638 | ) | | | (1,729,122 | ) | | | | | | | 2,158,858 | | | | 1,755,366 | | | | (21,840,899 | ) | | | (17,926,675 | ) |
Index Plus SmallCap | | | | | | | | | | | | | | | | | | | | | | | | | |
Class I | | | | | | | | | | | | | | | | | | | | | | | | | | | | | | | | | | | | |
12-31-10 | | | 1,306,344 | | | | 108,942 | | | | (3,237,150 | ) | | | (1,821,864 | ) | | | | | | | 15,977,251 | | | | 1,452,197 | | | | (39,015,835 | ) | | | (21,586,387 | ) |
12-31-09 | | | 1,533,744 | | | | 407,422 | | | | (6,267,474 | ) | | | (4,326,308 | ) | | | | | | | 14,112,360 | | | | 3,679,023 | | | | (61,589,392 | ) | | | (43,798,009 | ) |
Class S | | | | | | | | | | | | | | | | | | | | | | | | | | | | | | | | | | | | |
12-31-10 | | | 92,089 | | | | 39,891 | | | | (1,312,494 | ) | | | (1,180,514 | ) | | | | | | | 1,114,292 | | | | 526,966 | | | | (16,058,742 | ) | | | (14,417,484 | ) |
12-31-09 | | | 276,428 | | | | 155,931 | | | | (1,662,052 | ) | | | (1,229,693 | ) | | | | | | | 2,621,157 | | | | 1,395,586 | | | | (15,636,561 | ) | | | (11,619,818 | ) |
NOTE 10 — SECURITIES LENDING
Under an agreement with The Bank of New York Mellon (“BNY”), the Portfolios may lend their securities to approved brokers, dealers and other financial institutions. Loans are collateralized by cash and U.S. government securities. The collateral is equal to at least 105% of the market value of non-U.S. securities loaned and 102% of the market value of U.S. securities loaned. The market value of the loaned securities is determined at the close of business of the Portfolios at their last sale price or official closing price on the principal exchange or system on which they are traded and any additional collateral is delivered to the Portfolios on the next business day. The cash collateral received is invested in approved investments as defined in the Securities Lending Agreement with BNY (the “Agreement”). The Portfolios bear the risk of loss with respect to the investment of collateral. Currently, the cash collateral is invested in the BNY Mellon Overnight Government Fund (formerly, The BNY Institutional Cash Reserves Fund — Series A) and the BNY Institutional Cash Reserves Fund — Series B (“BICR — Series B”), each
a series within the BNY Institutional Cash Reserves Trust (collectively, the “BICR Fund”). BNY serves as investment manager, custodian and operational trustee of the BICR Fund. As of December 31, 2010, and throughout the period covered by this report, BICR — Series B held certain defaulted securities issued by Lehman Brothers Holdings, Inc. (the “Lehman Securities”). The Lehman Securities have market values significantly below amortized cost. On May 22, 2009, the Portfolios agreed to the terms of a capital support agreement (the “Capital Support Agreement”) extended by The Bank of New York Mellon Corporation (“BNYC”), an affiliated company of BNY, for the Lehman Securities held by BICR — Series B. Under the terms of the Capital Support Agreement, BNYC will support the value of the Lehman Securities up to 80% of the par value (the remaining 20% of the par value represents an unrealized loss to the Funds) and subject, in part, to the Portfolios’ continued participation in the BNY securities lending program through September 15, 2011. At September 15, 2011, if the Portfolios have complied with the requirements under the Capital
26
NOTES TO FINANCIAL STATEMENTSASOF DECEMBER 31, 2010 (CONTINUED)
NOTE 10 — SECURITIES LENDING (continued)
Support Agreement to continue to participate in the BNY securities lending program and if such securities have not otherwise been sold, the Portfolios will have the right to sell the defaulted securities to BNYC at a price equal to 80% of par value. The recorded value of each Portfolio’s investment in BICR — Series B includes the value of the underlying securities held by BICR — Series B and the estimated value of the support to be provided by BNYC. The investment in the BNY Mellon Overnight Government Fund and in BICR — Series B are included in the Summary Portfolio of Investments under Securities Lending Collateral and the unrealized loss on BICR — Series B is included in Net Unrealized Depreciation on the Statements of Assets and Liabilities.
Generally, in the event of counterparty default, the Portfolios have the right to use the collateral to offset losses incurred. The Agreement contains certain guarantees by BNY in the event of counterparty default and/or a borrower’s failure to return a loaned security; however, there would be a potential loss to the Portfolios in the event the Portfolios are delayed or prevented from exercising their right to dispose of the collateral. Engaging in securities lending could have a leveraging effect, which may intensify the credit, market and other risks associated with investing in a Portfolio. At December 31, 2010, the following Portfolios had securities on loan with the following market values:
| | | | | | | | |
| | | Value of
Securities
Loaned | | | Cash
Collateral
Received* | |
Index Plus LargeCap | | $ | 5,314,402 | | | $ | 5,468,190 | |
Index Plus MidCap | | | 13,801,824 | | | | 14,185,923 | |
Index Plus SmallCap | | | 12,886,658 | | | | 13,224,488 | |
| * | | Cash collateral received was invested in the BICR Fund, the fair value of which is presented in the respective Portfolio’s Summary Portfolio of Investments. |
NOTE 11 — FEDERAL INCOME TAXES
The amount of distributions from net investment income and net realized capital gains are determined in accordance with federal income tax regulations, which may differ from U.S. generally accepted accounting principles for investment companies. These book/tax differences may be either temporary or permanent. Permanent differences are reclassified within the capital accounts based on their federal tax-basis treatment; temporary differences are not reclassified. Key differences include the treatment of short-term capital gains, foreign currency transactions, and wash sale deferrals. Distributions in excess of net investment income and/or net realized capital gains for tax purposes are reported as return of capital.
The following permanent tax differences have been reclassified as of December 31, 2010:
| | | | | | | | |
| | | Undistributed Net Investment Income | | | Accumulated
Net Realized
Gains/(Losses) | |
Index Plus LargeCap | | $ | 146,254 | | | $ | (146,254 | ) |
Index Plus MidCap | | | 1,753 | | | | (1,753 | ) |
Index Plus SmallCap | | | (386,634 | ) | | | 386,634 | |
Dividends paid by the Portfolios from net investment income and distributions of net realized short-term capital gains are, for federal income tax purposes, taxable as ordinary income to shareholders.
The tax composition of dividends and distributions to shareholders was as follows:
| | | | | | | | |
| | | Year Ended December 31, 2010 Ordinary Income | | | Year Ended December 31, 2009 Ordinary Income | |
Index Plus LargeCap | | $ | 15,881,406 | | | $ | 26,700,332 | |
Index Plus MidCap | | | 6,900,907 | | | | 9,896,771 | |
Index Plus SmallCap | | | 1,979,163 | | | | 5,074,609 | |
The tax-basis components of distributable earnings and the expiration dates of the capital loss carryforwards which may be used to offset future realized capital gains for federal income tax purposes as of December 31, 2010 were:
| | | | | | | | | | | | | | | | |
| | | Undistributed Ordinary Income | | | Unrealized Appreciation/ (Depreciation) | | | Capital Loss Carryforwards | | | Expiration Dates | |
Index Plus LargeCap | | $ | 13,756,731 | | | $ | 78,936,318 | | | $ | (275,548,117 | ) | | | 2016 | |
| | | | | | | | | | | (95,016,629 | ) | | | 2017 | |
| | | | | | | | | | | | | | | | |
| | | | | | | | | | $ | (370,564,746 | ) | | | | |
| | | | | | | | | | | | | | | | |
Index Plus MidCap | | | 5,146,093 | | | | 92,512,757 | | | | (73,699,453 | ) | | | 2016 | |
| | | | | | | | | | | (128,673,815 | ) | | | 2017 | |
| | | | | | | | | | | | | | | | |
| | | | | | | | | | $ | (202,373,268 | ) | | | | |
| | | | | | | | | | | | | | | | |
Index Plus SmallCap | | | 2,327,592 | | | | 40,444,222 | | | | (70,659,453 | ) | | | 2016 | |
| | | | | | | | | | | (76,170,156 | ) | | | 2017 | |
| | | | | | | | | | | | | | | | |
| | | | | | | | | | $ | (146,829,609 | ) | | | | |
| | | | | | | | | | | | | | | | |
The Regulated Investment Company Modernization Act of 2010 (the "Act") was enacted on December 22, 2010. The Act makes changes to several tax rules impacting the Portfolios. In general, the provisions of the Act will be effective for the Portfolios’ fiscal year ending December 31, 2011. Although the Act provides several benefits, including the unlimited carryforward of future capital losses, there may be a greater likelihood that all or a portion of each Portfolio’s pre-enactment capital loss carryforwards may expire without being utilized due to the fact that post-enactment capital losses get utilized before pre-enactment capital loss carryforwards. Relevant information regarding the impact of the Act on the Portfolios, if any, will be contained within the Federal Income Taxes section of the notes to financial statements for the fiscal year ending December 31, 2011.
27
NOTES TO FINANCIAL STATEMENTSASOF DECEMBER 31, 2010 (CONTINUED)
NOTE 11 — FEDERAL INCOME TAXES (continued)
The Portfolios’ major tax jurisdictions are federal and Arizona. The earliest tax year that remains subject to examination by these jurisdictions is 2006.
As of December 31, 2010, no provisions for income tax would be required in the Portfolios’ financial statements as a result of tax positions taken on federal and state income tax returns for open tax years. The Portfolios’ federal and state income and federal excise tax returns for tax years for which the applicable
statutes of limitations have not expired are subject to examination by the Internal Revenue Service and state department of revenue.
NOTE 12 — SUBSEQUENT EVENTS
The Portfolios have evaluated events occurring after the Statements of Assets and Liabilities date (subsequent events) to determine whether any subsequent events necessitated adjustment to or disclosure in the financial statements. No such subsequent events were identified.
28
| | |
| ING INDEX PLUS LARGECAP PORTFOLIO | | SUMMARY PORTFOLIO OF INVESTMENTS ASOF DECEMBER 31, 2010 |
| | | | | | | | | | | | | | | | |
| Shares | | | | | | | | Value | | | Percent of Net Assets | |
| | | | | | | | | | | | | | | | |
| | |
| | COMMON STOCK: 95.8% | | | | | | | | |
| | | | | | | | Consumer Discretionary: 10.2% | | | | | | | | |
| | 110,350 | | | | @ | | | DIRECTV | | $ | 4,406,276 | | | | 0.5 | |
| | 122,700 | | | | | | | McDonald’s Corp. | | | 9,418,452 | | | | 1.2 | |
| | 94,600 | | | | | | | Yum! Brands, Inc. | | | 4,640,130 | | | | 0.6 | |
| | | | | | | | | Other Securities | | | 63,431,963 | | | | 7.9 | |
| | | | | | | | | | | 81,896,821 | | | | 10.2 | |
| | | | | | | | Consumer Staples: 10.2% | | | | | | | | |
| | 279,400 | | | | | | | Altria Group, Inc. | | | 6,878,828 | | | | 0.9 | |
| | 102,656 | | | | | | | Coca-Cola Co. | | | 6,751,685 | | | | 0.8 | |
| | 67,700 | | | | | | | PepsiCo, Inc. | | | 4,422,841 | | | | 0.5 | |
| | 106,217 | | | | | | | Philip Morris International, Inc. | | | 6,216,881 | | | | 0.8 | |
| | 96,592 | | | | | | | Procter & Gamble Co. | | | 6,213,763 | | | | 0.8 | |
| | | | | | | | | Other Securities | | | 51,372,865 | | | | 6.4 | |
| | | | | | | | | | | 81,856,863 | | | | 10.2 | |
| | | | | | | | Energy: 11.9% | | | | | | | | |
| | 198,158 | | | | | | | Chevron Corp. | | | 18,081,918 | | | | 2.3 | |
| | 158,800 | | | | | | | ConocoPhillips | | | 10,814,284 | | | | 1.3 | |
| | 242,654 | | | | | | | ExxonMobil Corp. | | | 17,742,860 | | | | 2.2 | |
| | 54,554 | | | | | | | Schlumberger Ltd. | | | 4,555,259 | | | | 0.6 | |
| | | | | | | | | Other Securities | | | 43,919,291 | | | | 5.5 | |
| | | | | | | | | | | 95,113,612 | | | | 11.9 | |
| | | | | | | | Financials: 12.8% | | | | | | | | |
| | 125,400 | | | | | | | American Express Co. | | | 5,382,168 | | | | 0.7 | |
| | 393,350 | | | | | | | Bank of America Corp. | | | 5,247,289 | | | | 0.6 | |
| | 85,100 | | | | @ | | | Berkshire Hathaway, Inc. | | | 6,817,361 | | | | 0.8 | |
| | 1,801,900 | | | | @ | | | Citigroup, Inc. | | | 8,522,987 | | | | 1.1 | |
| | 158,651 | | | | | | | JPMorgan Chase & Co. | | | 6,729,975 | | | | 0.8 | |
| | 115,600 | | | | | | | PNC Financial Services Group, Inc. | | | 7,019,232 | | | | 0.9 | |
| | 77,100 | | | | | | | Prudential Financial, Inc. | | | 4,526,541 | | | | 0.6 | |
| | 154,533 | | | | | | | US Bancorp. | | | 4,167,755 | | | | 0.5 | |
| | 227,685 | | | | | | | Wells Fargo & Co. | | | 7,055,958 | | | | 0.9 | |
| | | | | | | | | Other Securities | | | 47,033,733 | | | | 5.9 | |
| | | | | | | | | | | 102,502,999 | | | | 12.8 | |
| | | | | | | | | | | | | | | | |
| Shares | | | | | | | | Value | | | Percent of Net Assets | |
| | | | | | | | | | | | | | | | |
| | | | | | | | Health Care: 11.3% | | | | | | | | |
| | 149,434 | | | | | | | Abbott Laboratories | | $ | 7,159,383 | | | | 0.9 | |
| | 233,800 | | | | | | | Bristol-Myers Squibb Co. | | | 6,191,024 | | | | 0.8 | |
| | 121,023 | | | | | | | Johnson & Johnson | | | 7,485,273 | | | | 0.9 | |
| | 243,662 | | | | | | | Merck & Co., Inc. | | | 8,781,578 | | | | 1.1 | |
| | 484,862 | | | | | | | Pfizer, Inc. | | | 8,489,934 | | | | 1.0 | |
| | | | | | | | | Other Securities | | | 52,794,355 | | | | 6.6 | |
| | | | | | | | | | | 90,901,547 | | | | 11.3 | |
| | | | | | | | Industrials: 10.8% | | | | | | | | |
| | 97,600 | | | | | | | 3M Co. | | | 8,422,880 | | | | 1.0 | |
| | 54,400 | | | | | | | Deere & Co. | | | 4,517,920 | | | | 0.6 | |
| | 567,494 | | | | | | | General Electric Co. | | | 10,379,465 | | | | 1.3 | |
| | 67,800 | | | | | | | United Parcel Service, Inc. - Class B | | | 4,920,924 | | | | 0.6 | |
| | 76,697 | | | | | | | United Technologies Corp. | | | 6,037,588 | | | | 0.8 | |
| | | | | | | | | Other Securities | | | 52,279,839 | | | | 6.5 | |
| | | | | | | | | | | 86,558,616 | | | | 10.8 | |
| | | | | | | | Information Technology: 19.1% | | | | | | | | |
| | 129,200 | | | | | | | Altera Corp. | | | 4,596,936 | | | | 0.6 | |
| | 66,593 | | | | @ | | | Apple, Inc. | | | 21,480,238 | | | | 2.7 | |
| | 304,970 | | | | @ | | | Cisco Systems, Inc. | | | 6,169,543 | | | | 0.8 | |
| | 89,700 | | | | @ | | | Cognizant Technology Solutions Corp. | | | 6,574,113 | | | | 0.8 | |
| | 322,450 | | | | @ | | | EMC Corp. | | | 7,384,105 | | | | 0.9 | |
| | 10,780 | | | | @ | | | Google, Inc. - Class A | | | 6,402,997 | | | | 0.8 | |
| | 285,110 | | | | | | | Intel Corp. | | | 5,995,863 | | | | 0.8 | |
| | 55,769 | | | | | | | International Business Machines Corp. | | | 8,184,658 | | | | 1.0 | |
| | 98,500 | | | | @ | | | Intuit, Inc. | | | 4,856,050 | | | | 0.6 | |
| | 339,316 | | | | | | | Microsoft Corp. | | | 9,473,703 | | | | 1.2 | |
| | 163,626 | | | | | | | Oracle Corp. | | | 5,121,494 | | | | 0.6 | |
| | | | | | | | | Other Securities | | | 66,786,708 | | | | 8.3 | |
| | | | | | | | | | | 153,026,408 | | | | 19.1 | |
See Accompanying Notes to Financial Statements
29
| | |
| ING INDEX PLUS LARGECAP PORTFOLIO | | SUMMARY PORTFOLIO OF INVESTMENTS ASOF DECEMBER 31, 2010 (CONTINUED) |
| | | | | | | | | | | | | | | | |
| Shares | | | | | | | | Value | | | Percent of Net Assets | |
| | | | | | | | | | | | | | | | |
| |
| | COMMON STOCK: (continued) | | | | | |
| | | | | | | | Materials: 2.8% | | | | | | | | |
| | 106,000 | | | | | | | EI Du Pont de Nemours & Co. | | $ | 5,287,280 | | | | 0.6 | |
| | | | | | | | | Other Securities | | | 17,411,278 | | | | 2.2 | |
| | | | | | | | | | | 22,698,558 | | | | 2.8 | |
| | | | | | | | Telecommunication Services: 3.5% | | | | | | | | |
| | 302,556 | | | | | | | AT&T, Inc. | | | 8,889,095 | | | | 1.1 | |
| | 571,500 | | | | | | | Qwest Communications International, Inc. | | | 4,349,115 | | | | 0.5 | |
| | 150,116 | | | | | | | Verizon Communications, Inc. | | | 5,371,150 | | | | 0.7 | |
| | | | | | | | | Other Securities | | | 9,420,991 | | | | 1.2 | |
| | | | | | | | | | | 28,030,351 | | | | 3.5 | |
| | | | | | | | Utilities: 3.2% | | | | | | | | |
| | | | | | | | | Other Securities | | | 26,067,182 | | | | 3.2 | |
| | | | | | | | Total Common Stock (Cost $ 685,435,508) | | | 768,652,957 | | | | 95.8 | |
| | | | | | | | | | | | | | | | |
| |
| | REAL ESTATE INVESTMENT TRUSTS: 2.9% | | | | | |
| | | | | | | | Financials: 2.9% | | | | | | | | |
| | 92,500 | | | | | | | Equity Residential | | | 4,805,375 | | | | 0.6 | |
| | 48,700 | | | | | | | Public Storage, Inc. | | | 4,939,154 | | | | 0.6 | |
| | 55,520 | | | | | | | Simon Property Group, Inc. | | | 5,523,685 | | | | 0.7 | |
| | | | | | | | | Other Securities | | | 8,436,598 | | | | 1.0 | |
| | | | | | | | Total Real Estate Investment Trusts (Cost $ 22,022,255) | | | 23,704,812 | | | | 2.9 | |
| | | | | | | | | | | | | | | | |
| | | | | | | | Total Long-Term Investments (Cost $ 707,457,763) | | | 792,357,769 | | | | 98.7 | |
| | | | | | | | | | | | | | | | |
| | | | | | | | | | | | | | | | |
| | |
| | SHORT-TERM INVESTMENTS: 1.8% | | | | | | | | |
| | | | | | | | Mutual Funds: 1.2% | | | | | | | | |
| | 9,629,000 | | | | | | | Blackrock Liquidity Funds TempFund Portfolio - Class I | | | 9,629,000 | | | | 1.2 | |
| | | | | | | | Total Mutual Funds (Cost $ 9,629,000) | | | 9,629,000 | | | | 1.2 | |
| | | | | | | | | | | | | | | | |
| | | | | | | | | | | | | | | | |
| | | | | | | | | | | | | | | | |
| Shares | | | | | | | | Value | | | Percent of Net Assets | |
| | | | | | | | | | | | | | | | |
| | | | | | | | Securities Lending Collateralcc: 0.6% | | | | | | | | |
| | 3,859,387 | | | | | | | BNY Mellon Overnight Government Fund(1) | | $ | 3,859,387 | | | | 0.5 | |
| | 801,608,803 | | | | R | | | BNY Institutional Cash Reserves Fund, Series B(1)(2) | | | 1,287,042 | | | | 0.1 | |
| | | | | | | | Total Securities Lending Collateral (Cost $ 5,468,190) | | | 5,146,429 | | | | 0.6 | |
| | | | | | | | | | | | | | | | |
| | | | | | | | Total Short-Term Investments (Cost $ 15,097,190) | | | 14,775,429 | | | | 1.8 | |
| | | | | | | | | | | | | | | | |
| | | | | | | | Total Investments in Securities (Cost $ 722,554,953)* | | $ | 807,133,198 | | | | 100.5 | |
| | | | | | | | Other Assets and Liabilities - Net | | | (4,399,027 | ) | | | (0.5 | ) |
| | | | | | | | | | | | | | | | |
| | | | | | | | Net Assets | | $ | 802,734,171 | | | | 100.0 | |
| | | | | | | | | | | | | | | | |
“Other Securities” represents issues not identified as the top 50 holdings in terms of market value and issues or issuers not exceeding 1% of net assets individually or in aggregate respectively as of December 31, 2010.
The following footnotes apply to either the individual securities noted or one or more of the securities aggregated and listed as a single line item.
| @ | Non-income producing security |
| cc | Securities purchased with cash collateral for securities loaned. |
| (1) | Collateral received from brokers for securities lending was invested in these short-term investments. |
| (2) | On September 12, 2008, BNY established a separate sleeve of the Institutional Cash Reserves Fund (Series B) to hold certain Lehman Brothers defaulted debt obligations. The Portfolio’s position in Series B is being fair valued daily. Please see the accompanying Notes to Financial Statements for additional details on securities lending. |
| * | Cost for federal income tax purposes is $728,196,880. |
| | | | |
Net unrealized appreciation consists of: | | | | |
Gross Unrealized Appreciation | | $ | 90,400,990 | |
Gross Unrealized Depreciation | | | (11,464,672 | ) |
| | | | |
Net Unrealized Appreciation | | $ | 78,936,318 | |
| | | | |
See Accompanying Notes to Financial Statements
30
| | |
| ING INDEX PLUS LARGECAP PORTFOLIO | | SUMMARY PORTFOLIO OF INVESTMENTS ASOF DECEMBER 31, 2010 (CONTINUED) |
Fair Value Measurements^
The following is a summary of the fair valuations according to the inputs used as of December 31, 2010 in valuing the Portfolio’s assets and liabilities:
| | | | | | | | | | | | | | | | |
| | | Quoted Prices
in Active Markets
for Identical Investments
(Level 1) | | | Other
Observable
Inputs
(Level 2) | | | Significant
Unobservable
Inputs
(Level 3) | | | Fair Value at 12/31/2010 | |
Asset Table | | | | | | | | | | | | | | | | |
Investments, at value | | | | | | | | | | | | | | | | |
Common Stock* | | $ | 768,652,957 | | | $ | — | | | $ | — | | | $ | 768,652,957 | |
Real Estate Investment Trusts | | | 23,704,812 | | | | — | | | | — | | | | 23,704,812 | |
Short-Term Investments | | | 13,488,387 | | | | — | | | | 1,287,042 | | | | 14,775,429 | |
| | | | | | | | | | | | | | | | |
Total Investments, at value | | $ | 805,846,156 | | | $ | — | | | $ | 1,287,042 | | | $ | 807,133,198 | |
| | | | | | | | | | | | | | | | |
Other Financial Instruments+: | | | | | | | | | | | | | | | | |
Futures | | | 299,515 | | | | — | | | | — | | | | 299,515 | |
| | | | | | | | | | | | | | | | |
Total Assets | | $ | 806,145,671 | | | $ | — | | | $ | 1,287,042 | | | $ | 807,432,713 | |
| | | | | | | | | | | | | | | | |
See Accompanying Notes to Financial Statements
31
| | |
| ING INDEX PLUS LARGECAP PORTFOLIO | | SUMMARY PORTFOLIO OF INVESTMENTS ASOF DECEMBER 31, 2010 (CONTINUED) |
The following is a reconciliation of the fair valuations using significant unobservable inputs (Level 3) for the Portfolio’s assets and liabilities during the period ended December 31, 2010:
| | | | | | | | | | | | | | | | | | | | | | | | | | | | | | | | | | | | |
| | | Beginning
Balance
12/31/2009 | | | Purchases | | | Sales | | | Accrued
Discounts/
(Premiums) | | | Total
Realized
Gain/(Loss) | | | Total
Unrealized
Appreciation/
(Depreciation) | | | Transfers
Into
Level 3 | | | Transfers
Out of
Level 3 | | | Ending
Balance
12/31/2010 | |
Asset Table | | | | | | | | | | | | | | | | | | | | | | | | | | | | | | | | | | | | |
Investments, at value | | | | | | | | | | | | | | | | | | | | | | | | | | | | | | | | | | | | |
Short-Term Investments | | | 1,287,042 | | | | — | | | | — | | | | — | | | | — | | | | — | | | | — | | | | — | | | | 1,287,042 | |
| | | | | | | | | | | | | | | | | | | | | | | | | | | | | | | | | | | | |
Total Investments, at value | | $ | 1,287,042 | | | $ | — | | | $ | — | | | $ | — | | | $ | — | | | $ | — | | | $ | — | | | $ | — | | | $ | 1,287,042 | |
| | | | | | | | | | | | | | | | | | | | | | | | | | | | | | | | | | | | |
As of December 31, 2010, total change in unrealized gain (loss) on Level 3 securities still held at period end and included in the change in net assets was $0.
| ^ | See Note 2, “Significant Accounting Policies” in the Notes to Financial Statements for additional information. |
| ‘+ | Other Financial Instruments are derivatives not reflected in the Summary Portfolio of Investments and may include open forward foreign currency contracts, futures, swaps, and written options. |
| | Forward foreign currency contracts and futures are reported at their unrealized gain/loss at measurement date which represents the amount due to/from the Portfolio. Swaps and written options are reported at their market value at measurement date. |
| | Transfers in or out of Level 3 represents either the beginning value (for transfers in), or the ending value (for transfers out) of any security or derivative instrument where a change in the pricing level occurred from the beginning to the end of the period. It is the policy of the Portfolio to recognize transfers at the end of the reporting period. |
| * | For further breakdown of Common Stock by Industry type, please refer to the Portfolio of Investments. |
ING Index Plus LargeCap Portfolio Open Futures Contracts on December 31, 2010:
| | | | | | | | | | | | | | | | |
Contract Description | | Number
of Contracts | | | Expiration Date | | | Notional Value | | | Unrealized
Appreciation | |
Long Contracts | | | | | | | | | | | | | | | | |
S&P 500 E-Mini | | | 180 | | | | 03/18/11 | | | $ | 11,277,000 | | | $ | 299,515 | |
| | | | | | | | | | | | | | | | |
| | | | | | | | | | $ | 11,277,000 | | | $ | 299,515 | |
| | | | | | | | | | | | | | | | |
A summary of derivative instruments by primary risk exposure is outlined in the following tables.
The fair value of derivative instruments as of December 31, 2010 was as follows:
| | | | | | | | |
Derivatives not accounted for as hedging
instruments | | Location on Statement of Assets and Liabilities | | | Fair Value | |
Asset Derivatives | | | | | | | | |
Equity contracts | | | Net Assets - Unrealized appreciation* | | | $ | 299,515 | |
| | | | | | | | |
Total Asset Derivatives | | | | | | $ | 299,515 | |
| | | | | | | | |
* Includes cumulative appreciation/depreciation of futures contracts as reported in the table following the Summary Portfolio of Investments.
The effect of derivative instruments on the Portfolio’s Statement of Operations for the year ended December 31, 2010 was as follows:
| | | | |
Derivatives not accounted for as hedging
instruments | | Amount of Realized Gain or (Loss) on
Derivatives Recognized in Income | |
| | | Futures | |
Equity contracts | | $ | 1,154,969 | |
| | | | |
Total | | $ | 1,154,969 | |
| | | | |
| |
Derivatives not accounted for as hedging
instruments | | Change in Unrealized Appreciation or (Depreciation)
on Derivatives Recognized in Income | |
| | | Futures | |
Equity contracts | | $ | 255,791 | |
| | | | |
Total | | $ | 255,791 | |
| | | | |
See Accompanying Notes to Financial Statements
32
| | |
| ING INDEX PLUS MIDCAP PORTFOLIO | | SUMMARY PORTFOLIO OF INVESTMENTS ASOF DECEMBER 31, 2010 |
| | | | | | | | | | | | | | | | |
| Shares | | | | | | | | Value | | | Percent
of Net
Assets | |
| | | | | | | | | | | | | | | | |
| |
| | COMMON STOCK: 86.1% | | | | | |
| | | | | | | | Consumer Discretionary: 14.0% | | | | | | | | |
| | 88,494 | | | | | | | Advance Auto Parts, Inc. | | $ | 5,853,878 | | | | 0.8 | |
| | 122,661 | | | | @ | | | BorgWarner, Inc. | | | 8,875,750 | | | | 1.3 | |
| | 31,347 | | | | @ | | | Chipotle Mexican Grill, Inc. | | | 6,666,253 | | | | 1.0 | |
| | 141,051 | | | | @, L | | | Dollar Tree, Inc. | | | 7,910,132 | | | | 1.1 | |
| | 59,299 | | | | @ | | | Fossil, Inc. | | | 4,179,394 | | | | 0.6 | |
| | 46,300 | | | | @ | | | Panera Bread Co. | | | 4,686,023 | | | | 0.7 | |
| | 107,200 | | | | | | | Tractor Supply Co. | | | 5,198,128 | | | | 0.7 | |
| | 70,400 | | | | @, L | | | Under Armour, Inc. | | | 3,860,736 | | | | 0.6 | |
| | | | | | | | | Other Securities | | | 49,698,739 | | | | 7.2 | |
| | | | | | | | | | | 96,929,033 | | | | 14.0 | |
| | | | | | | | Consumer Staples: 3.5% | | | | | | | | |
| | 96,000 | | | | | | | Corn Products International, Inc. | | | 4,416,000 | | | | 0.6 | |
| | 67,064 | | | | @, L | | | Energizer Holdings, Inc. | | | 4,888,966 | | | | 0.7 | |
| | | | | | | | | Other Securities | | | 15,129,301 | | | | 2.2 | |
| | | | | | | | | | | 24,434,267 | | | | 3.5 | |
| | | | | | | | Energy: 5.3% | | | | | | | | |
| | 129,069 | | | | | | | Arch Coal, Inc. | | | 4,525,159 | | | | 0.7 | |
| | 38,873 | | | | | | | Cimarex Energy Co. | | | 3,441,427 | | | | 0.5 | |
| | 55,400 | | | | @ | | | Dril-Quip, Inc. | | | 4,305,688 | | | | 0.6 | |
| | 123,300 | | | | @ | | | Superior Energy Services | | | 4,314,267 | | | | 0.6 | |
| | | | | | | | | Other Securities | | | 20,358,624 | | | | 2.9 | |
| | | | | | | | | | | 36,945,165 | | | | 5.3 | |
| | | | | | | | Financials: 8.6% | | | | | | | | |
| | 58,189 | | | | | | | Jones Lang LaSalle, Inc. | | | 4,883,221 | | | | 0.7 | |
| | | | | | | | | Other Securities | | | 54,907,376 | | | | 7.9 | |
| | | | | | | | | | | 59,790,597 | | | | 8.6 | |
| | | | | | | | Health Care: 10.9% | | | | | | | | |
| | 172,900 | | | | @ | | | Allscripts Healthcare Solutions, Inc. | | | 3,331,783 | | | | 0.5 | |
| | 49,349 | | | | | | | Beckman Coulter, Inc. | | | 3,712,525 | | | | 0.5 | |
| | 77,452 | | | | @ | | | Edwards Lifesciences Corp. | | | 6,261,220 | | | | 0.9 | |
| | 30,824 | | | | @ | | | Mettler Toledo International, Inc. | | | 4,660,897 | | | | 0.7 | |
| | 105,180 | | | | | | | Perrigo Co. | | | 6,661,049 | | | | 1.0 | |
| | | | | | | | | Other Securities | | | 50,894,970 | | | | 7.3 | |
| | | | | | | | | | | 75,522,444 | | | | 10.9 | |
| | | | | | | | | | | | | | | | |
| Shares | | | | | | | | Value | | | Percent
of Net
Assets | |
| | | | | | | | | | | | | | | | |
| | | | | | | | Industrials: 16.2% | | | | | | | | |
| | 55,000 | | | | | | | Gardner Denver, Inc. | | $ | 3,785,100 | | | | 0.6 | |
| | 116,300 | | | | | | | IDEX Corp. | | | 4,549,656 | | | | 0.7 | |
| | 88,532 | | | | | | | Joy Global, Inc. | | | 7,680,151 | | | | 1.1 | |
| | 41,200 | | | | | | | Nordson Corp. | | | 3,785,456 | | | | 0.6 | |
| | 69,257 | | | | | | | SPX Corp. | | | 4,951,183 | | | | 0.7 | |
| | 71,128 | | | | @ | | | Thomas & Betts Corp. | | | 3,435,482 | | | | 0.5 | |
| | 107,974 | | | | | | | Timken Co. | | | 5,153,599 | | | | 0.7 | |
| | | | | | | | | Other Securities | | | 78,775,477 | | | | 11.3 | |
| | | | | | | | | | | 112,116,104 | | | | 16.2 | |
| | | | | | | | Information Technology: 14.9% | | | | | | | | |
| | 60,500 | | | | | | | Factset Research Systems, Inc. | | | 5,672,480 | | | | 0.8 | |
| | 124,168 | | | | @ | | | Micros Systems, Inc. | | | 5,446,008 | | | | 0.8 | |
| | 156,600 | | | | @ | | | Parametric Technology Corp. | | | 3,528,198 | | | | 0.5 | |
| | 100,542 | | | | @ | | | Rovi Corp. | | | 6,234,609 | | | | 0.9 | |
| | 193,200 | | | | @ | | | Skyworks Solutions, Inc. | | | 5,531,316 | | | | 0.8 | |
| | 80,300 | | | | | | | Solera Holdings, Inc. | | | 4,120,996 | | | | 0.6 | |
| | | | | | | | | Other Securities | | | 73,088,396 | | | | 10.5 | |
| | | | | | | | | | | 103,622,003 | | | | 14.9 | |
| | | | | | | | Materials: 6.5% | | | | | | | | |
| | 72,400 | | | | | | | Aptargroup, Inc. | | | 3,444,068 | | | | 0.5 | |
| | 101,000 | | | | | | | Cabot Corp. | | | 3,802,650 | | | | 0.5 | |
| | 68,253 | | | | | | | Lubrizol Corp. | | | 7,294,881 | | | | 1.0 | |
| | 116,092 | | | | | | | Sonoco Products Co. | | | 3,908,818 | | | | 0.6 | |
| | | | | | | | | Other Securities | | | 26,792,379 | | | | 3.9 | |
| | | | | | | | | | | 45,242,796 | | | | 6.5 | |
| | | | | | | | Telecommunication Services: 0.7% | | | | | | | | |
| | | | | | | | | Other Securities | | | 4,904,655 | | | | 0.7 | |
| | | | | | | | | | | | | | | | |
| | | | | | | | Utilities: 5.5% | | | | | | | | |
| | 121,200 | | | | | | | Alliant Energy Corp. | | | 4,456,524 | | | | 0.6 | |
| | 90,980 | | | | | | | OGE Energy Corp. | | | 4,143,229 | | | | 0.6 | |
| | 140,600 | | | | | | | Vectren Corp. | | | 3,568,428 | | | | 0.5 | |
| | | | | | | | | Other Securities | | | 26,282,444 | | | | 3.8 | |
| | | | | | | | | | | 38,450,625 | | | | 5.5 | |
| | | | | | | | Total Common Stock (Cost $ 510,735,945) | | | 597,957,689 | | | | 86.1 | |
| | | | | | | | | | | | | | | | |
| | | | | | | | | | | | | | | | |
See Accompanying Notes to Financial Statements
33
| | |
| ING INDEX PLUS MIDCAP PORTFOLIO | | SUMMARY PORTFOLIO OF INVESTMENTS ASOF DECEMBER 31, 2010 (CONTINUED) |
| | | | | | | | | | | | | | | | |
| Shares | | | | | | | | Value | | | Percent
of Net
Assets | |
| | | | | | | | | | | | | | | | |
| |
| | REAL ESTATE INVESTMENT TRUSTS: 10.0% | | | | | |
| | | | | | | | Financials: 10.0% | | | | | | | | |
| | 134,210 | | | | | | | AMB Property Corp. | | | 4,255,799 | | | | 0.6 | |
| | 80,036 | | | | | | | BRE Properties, Inc. | | | 3,481,566 | | | | 0.5 | |
| | 71,487 | | | | | | | Camden Property Trust | | | 3,858,868 | | | | 0.6 | |
| | 40,705 | | | | | | | Essex Property Trust, Inc. | | | 4,649,325 | | | | 0.7 | |
| | 67,200 | | | | | | | Federal Realty Investment Trust | | | 5,236,896 | | | | 0.7 | |
| | 136,625 | | | | | | | Macerich Co. | | | 6,471,926 | | | | 0.9 | |
| | 143,500 | | | | | | | Realty Income Corp. | | | 4,907,700 | | | | 0.7 | |
| | 78,600 | | | | | | | SL Green Realty Corp. | | | 5,306,286 | | | | 0.8 | |
| | 143,200 | | | | | | | UDR, Inc. | | | 3,368,064 | | | | 0.5 | |
| | | | | | | | | Other Securities | | $ | 27,736,911 | | | | 4.0 | |
| | | | | | | | Total Real Estate Investment Trusts
(Cost $ 60,785,357) | | | 69,273,341 | | | | 10.0 | |
| | | | | | | | | | | | | | | | |
| | | | | | | | Total Long-Term Investments
(Cost $ 571,521,302) | | | 667,231,030 | | | | 96.1 | |
| | | | | | | | | | | | | | | | |
| | | | | | | | | | | | | | | | |
| | |
| | SHORT-TERM INVESTMENTS: 6.1% | | | | | | | | |
| | | | | | | | Mutual Funds: 4.1% | | | | | | | | |
| | 28,675,000 | | | | | | | Blackrock Liquidity Funds TempFund Portfolio - Class I | | | 28,675,000 | | | | 4.1 | |
| | | | | | | | Total Mutual Funds
(Cost $ 28,675,000) | | | 28,675,000 | | | | 4.1 | |
| | | | | | | | | | | | | | | | |
| | | | | | | | Securities Lending Collateralcc: 2.0% | | | | | | | | |
| | 11,334,731 | | | | | | | BNY Mellon Overnight Government Fund(1) | | | 11,334,731 | | | | 1.7 | |
| | 2,851,192 | | | | R | | | BNY Institutional Cash Reserves Fund, Series B(1)(2) | | | 2,280,954 | | | | 0.3 | |
| | | | | | | | Total Securities Lending Collateral (Cost $ 14,185,923) | | | 13,615,685 | | | | 2.0 | |
| | | | | | | | | | | | | | | | |
| | | | | | | | Total Short-Term Investments (Cost $ 42,860,923) | | | 42,290,685 | | | | 6.1 | |
| | | | | | | | | | | | | | | | |
| | | | | | | | Total Investments in Securities (Cost $ 614,382,225)* | | $ | 709,521,715 | | | | 102.2 | |
| | | | | | | | | | | | | | | | |
| | | | | | | | Other Assets and Liabilities - Net | | | (15,046,949 | ) | | | (2.2 | ) |
| | | | | | | | | | | | | | | | |
| | | | | | | | Net Assets | | $ | 694,474,766 | | | | 100.0 | |
| | | | | | | | | | | | | | | | |
“Other Securities” represents issues not identified as the top 50 holdings in terms of market value and issues or issuers not exceeding 1% of net assets individually or in aggregate respectively as of December 31, 2010.
The following footnotes apply to either the individual securities noted or one or more of the securities aggregated and listed as a single line item.
| @ | Non-income producing security |
| cc | Securities purchased with cash collateral for securities loaned. |
| (1) | Collateral received from brokers for securities lending was invested in these short-term investments. |
| (2) | On September 12, 2008, BNY established a separate sleeve of the Institutional Cash Reserves Fund (Series B) to hold certain Lehman Brothers defaulted debt obligations. The Portfolio’s position in Series B is being fair valued daily. Please see the accompanying Notes to Financial Statements for additional details on securities lending. |
| L | Loaned security, a portion or all of the security is on loan at December 31, 2010. |
| * | Cost for federal income tax purposes is $617,008,958. |
| | | | |
Net unrealized appreciation consists of: | | | | |
Gross Unrealized Appreciation | | $ | 99,469,850 | |
Gross Unrealized Depreciation | | | (6,957,093 | ) |
| | | | |
Net Unrealized Appreciation | | $ | 92,512,757 | |
| | | | |
See Accompanying Notes to Financial Statements
34
| | |
| ING INDEX PLUS MIDCAP PORTFOLIO | | SUMMARY PORTFOLIO OF INVESTMENTS ASOF DECEMBER 31, 2010 (CONTINUED) |
Fair Value Measurements^
The following is a summary of the fair valuations according to the inputs used as of December 31, 2010 in valuing the Portfolio’s assets and liabilities:
| | | | | | | | | | | | | | | | |
| | | Quoted Prices
in Active Markets
for Identical Investments
(Level 1) | | | Other
Observable
Inputs
(Level 2) | | | Significant
Unobservable
Inputs
(Level 3) | | | Fair Value at 12/31/2010 | |
Asset Table | | | | | | | | | | | | | | | | |
Investments, at value | | | | | | | | | | | | | | | | |
Common Stock* | | $ | 597,957,689 | | | $ | — | | | $ | — | | | $ | 597,957,689 | |
Real Estate Investment Trusts | | | 69,273,341 | | | | — | | | | — | | | | 69,273,341 | |
Short-Term Investments | | | 40,009,731 | | | | — | | | | 2,280,954 | | | | 42,290,685 | |
| | | | | | | | | | | | | | | | |
Total Investments, at value | | $ | 707,240,761 | | | $ | — | | | $ | 2,280,954 | | | $ | 709,521,715 | |
| | | | | | | | | | | | | | | | |
Other Financial Instruments+: | | | | | | | | | | | | | | | | |
Futures | | | 284,037 | | | | — | | | | — | | | | 284,037 | |
| | | | | | | | | | | | | | | | |
Total Assets | | $ | 707,524,798 | | | $ | — | | | $ | 2,280,954 | | | $ | 709,805,752 | |
| | | | | | | | | | | | | | | | |
The following is a reconciliation of the fair valuations using significant unobservable inputs (Level 3) for the Portfolio’s assets and liabilities during the period ended December 31, 2010:
| | | | | | | | | | | | | | | | | | | | | | | | | | | | | | | | | | | | |
| | | Beginning
Balance
12/31/2009 | | | Purchases | | | Sales | | | Accrued
Discounts/
(Premiums) | | | Total
Realized
Gain/(Loss) | | | Total
Unrealized
Appreciation/
(Depreciation) | | | Transfers
Into
Level 3 | | | Transfers
Out of
Level 3 | | | Ending
Balance
12/31/2010 | |
Asset Table | | | | | | | | | | | | | | | | | | | | | | | | | | | | | | | | | | | | |
Investments, at value | | | | | | | | | | | | | | | | | | | | | | | | | | | | | | | | | | | | |
Short-Term Investments | | | 2,280,954 | | | | — | | | | — | | | | — | | | | — | | | | — | | | | — | | | | — | | | | 2,280,954 | |
| | | | | | | | | | | | | | | | | | | | | | | | | | | | | | | | | | | | |
Total Investments, at value | | $ | 2,280,954 | | | $ | — | | | $ | — | | | $ | — | | | $ | — | | | $ | — | | | $ | — | | | $ | — | | | $ | 2,280,954 | |
| | | | | | | | | | | | | | | | | | | | | | | | | | | | | | | | | | | | |
As of December 31, 2010, total change in unrealized gain (loss) on Level 3 securities still held at period end and included in the change in net assets was $0.
| ^ | See Note 2, “Significant Accounting Policies” in the Notes to Financial Statements for additional information. |
| ‘+ | Other Financial Instruments are derivatives not reflected in the Portfolio of Investments and may include open forward foreign currency contracts, futures, swaps, and written options. Forward foreign currency contracts and futures are reported at their unrealized gain/loss at measurement date which represents the amount due to/from the Portfolio. Swaps and written options are reported at their market value at measurement date. |
| | Transfers in or out of Level 3 represents either the beginning value (for transfers in), or the ending value (for transfers out) of any security or derivative instrument where a change in the pricing level occurred from the beginning to the end of the period. It is the policy of the Portfolio to recognize transfers at the end of the reporting period. |
| * | For further breakdown of Common Stock by Industry type, please refer to the Portfolio of Investments. |
ING Index Plus MidCap Portfolio Open Futures Contracts on December 31, 2010:
| | | | | | | | | | | | | | | | |
Contract Description | | Number
of Contracts | | | Expiration Date | | | Notional Value | | | Unrealized
Appreciation | |
Long Contracts | | | | | | | | | | | | | | | | |
S&P Mid 400 E-Mini | | | 340 | | | | 03/18/11 | | | $ | 30,780,200 | | | $ | 284,037 | |
| | | | | | | | | | | | | | | | |
| | | | | | | | | | $ | 30,780,200 | | | $ | 284,037 | |
| | | | | | | | | | | | | | | | |
A summary of derivative instruments by primary risk exposure is outlined in the following tables.
The fair value of derivative instruments as of December 31, 2010 was as follows:
| | | | | | | | |
Derivatives not accounted for as hedging
instruments | | Location on Statement of Assets and Liabilities | | | Fair Value | |
Asset Derivatives | | | | | | | | |
Equity contracts | | | Net Assets - Unrealized appreciation* | | | $ | 284,037 | |
| | | | | | | | |
Total Asset Derivatives | | | | | | $ | 284,037 | |
| | | | | | | | |
See Accompanying Notes to Financial Statements
35
| | |
| ING INDEX PLUS MIDCAP PORTFOLIO | | SUMMARY PORTFOLIO OF INVESTMENTS ASOF DECEMBER 31, 2010 (CONTINUED) |
* Includes cumulative appreciation/depreciation of futures contracts as reported in the table following the Summary Portfolio of Investments.
The effect of derivative instruments on the Portfolio’s Statement of Operations for the year ended December 31, 2010 was as follows:
| | | | |
Derivatives not accounted for as hedging
instruments | | Amount of Realized Gain or (Loss) on
Derivatives Recognized in Income | |
| | | Futures | |
Equity contracts | | $ | 3,004,707 | |
| | | | |
Total | | $ | 3,004,707 | |
| | | | |
| |
Derivatives not accounted for as hedging
instruments | | Change in Unrealized Appreciation or (Depreciation)
on Derivatives Recognized in Income | |
| | | Futures | |
Equity contracts | | $ | (69,850 | ) |
| | | | |
Total | | $ | (69,850 | ) |
| | | | |
See Accompanying Notes to Financial Statements
36
| | |
| ING INDEX PLUS SMALLCAP PORTFOLIO | | SUMMARY PORTFOLIO OF INVESTMENTS ASOF DECEMBER 31, 2010 |
| | | | | | | | | | | | | | | | |
| Shares | | | | | | | | Value | | | Percent
of Net
Assets | |
| | | | | | | | | | | | | | | | |
| |
| | COMMON STOCK: 89.5% | | | | | |
| | | | | Consumer Discretionary: 14.3% | | | | | |
| | 25,694 | | | | @ | | | Childrens Place Retail Stores, Inc. | | | 1,275,450 | | | | 0.4 | |
| | 27,131 | | | | @, L | | | Jo-Ann Stores, Inc. | | | 1,633,829 | | | | 0.5 | |
| | 117,924 | | | | @ | | | Live Nation, Inc. | | | 1,346,692 | | | | 0.4 | |
| | | | | | | | | Other Securities | | | 42,027,998 | | | | 13.0 | |
| | | | | | | | | | | 46,283,969 | | | | 14.3 | |
| | | | | Consumer Staples: 3.3% | |
| | 34,993 | | | | | | | Casey’s General Stores, Inc. | | | 1,487,552 | | | | 0.5 | |
| | 32,468 | | | | @ | | | TreeHouse Foods, Inc. | | | 1,658,790 | | | | 0.5 | |
| | | | | | | | | Other Securities | | | 7,558,947 | | | | 2.3 | |
| | | | | | | | | | | 10,705,289 | | | | 3.3 | |
| | | | | | | | Energy: 5.2% | | | | | | | | |
| | 12,846 | | | | | | | CARBO Ceramics, Inc. | | | 1,330,075 | | | | 0.4 | |
| | 30,440 | | | | | | | Holly Corp. | | | 1,241,039 | | | | 0.4 | |
| | 23,696 | | | | | | | Lufkin Industries, Inc. | | | 1,478,393 | | | | 0.5 | |
| | 26,862 | | | | @ | | | Oil States International, Inc. | | | 1,721,586 | | | | 0.5 | |
| | 35,579 | | | | | | | World Fuel Services Corp. | | | 1,286,537 | | | | 0.4 | |
| | | | | | | | | Other Securities | | | 9,874,902 | | | | 3.0 | |
| | | | | | | | | | | 16,932,532 | | | | 5.2 | |
| | | | | | | | Financials: 10.3% | | | | | | | | |
| | 48,060 | | | | @ | | | Ezcorp, Inc. | | | 1,303,868 | | | | 0.4 | |
| | 17,128 | | | | @ | | | Portfolio Recovery Associates, Inc. | | | 1,288,026 | | | | 0.4 | |
| | 27,292 | | | | @ | | | ProAssurance Corp. | | | 1,653,895 | | | | 0.5 | |
| | 25,138 | | | | @ | | | Signature Bank | | | 1,256,900 | | | | 0.4 | |
| | 20,759 | | | | @ | | | Stifel Financial Corp. | | | 1,287,888 | | | | 0.4 | |
| | 136,151 | | | | | | | Susquehanna Bancshares, Inc. | | | 1,317,942 | | | | 0.4 | |
| | | | | | | | | Other Securities | | | 25,283,064 | | | | 7.8 | |
| | | | | | | | | | | 33,391,583 | | | | 10.3 | |
| | | | | | | | Health Care: 12.5% | | | | | | | | |
| | 66,813 | | | | @ | | | American Medical Systems Holdings, Inc. | | | 1,260,093 | | | | 0.4 | |
| | 30,109 | | | | @ | | | AMERIGROUP Corp. | | | 1,322,387 | | | | 0.4 | |
| | 34,030 | | | | | | | Cooper Cos., Inc. | | | 1,917,250 | | | | 0.6 | |
| | 20,900 | | | | @ | | | HMS Holdings Corp. | | | 1,353,693 | | | | 0.4 | |
| | 17,688 | | | | | | | Quality Systems, Inc. | | | 1,234,976 | | | | 0.4 | |
| | 56,970 | | | | @ | | | Regeneron Pharmaceuticals, Inc. | | | 1,870,325 | | | | 0.6 | |
| | 33,670 | | | | @ | | | Salix Pharmaceuticals Ltd. | | | 1,581,143 | | | | 0.5 | |
| | | | | | | | | Other Securities | | | 29,942,363 | | | | 9.2 | |
| | | | | | | | | | | 40,482,230 | | | | 12.5 | |
| | | | | | | | | | | | | | | | |
| Shares | | | | | | | | Value | | | Percent
of Net
Assets | |
| | | | | | | | | | | | | | | | |
| | | | | | | | Industrials: 16.4% | | | | | | | | |
| | 66,787 | | | | | | | Actuant Corp. | | | 1,777,870 | | | | 0.5 | |
| | 33,600 | | | | | | | AO Smith Corp. | | | 1,279,488 | | | | 0.4 | |
| | 47,286 | | | | @ | | | EMCOR Group, Inc. | | | 1,370,348 | | | | 0.4 | |
| | 17,719 | | | | @ | | | Esterline Technologies Corp. | | | 1,215,346 | | | | 0.4 | |
| | 50,169 | | | | @ | | | Geo Group, Inc. | | | 1,237,168 | | | | 0.4 | |
| | 32,723 | | | | | | | Kaydon Corp. | | | 1,332,481 | | | | 0.4 | |
| | 37,450 | | | | @ | | | Moog, Inc. | | | 1,490,510 | | | | 0.5 | |
| | 38,559 | | | | @ | | | Old Dominion Freight Line | | | 1,233,502 | | | | 0.4 | |
| | 40,240 | | | | | | | Simpson Manufacturing Co., Inc. | | | 1,243,818 | | | | 0.4 | |
| | 31,190 | | | | @ | | | Teledyne Technologies, Inc. | | | 1,371,424 | | | | 0.4 | |
| | 27,688 | | | | | | | Toro Co. | | | 1,706,688 | | | | 0.5 | |
| | | | | | | | | Other Securities | | | 37,907,155 | | | | 11.7 | |
| | | | | | | | | | | 53,165,798 | | | | 16.4 | |
| | | | | | | | Information Technology: 18.7% | | | | | | | | |
| | 71,369 | | | | @ | | | Cypress Semiconductor Corp. | | | 1,326,036 | | | | 0.4 | |
| | 42,994 | | | | @ | | | JDA Software Group, Inc. | | | 1,203,832 | | | | 0.4 | |
| | 52,848 | | | | @ | | | Microsemi Corp. | | | 1,210,219 | | | | 0.4 | |
| | 57,294 | | | | @ | | | Varian Semiconductor Equipment Associates, Inc. | | | 2,118,159 | | | | 0.6 | |
| | 39,391 | | | | @ | | | Viasat, Inc. | | | 1,749,354 | | | | 0.5 | |
| | | | | | | | | Other Securities | | | 53,216,400 | | | | 16.4 | |
| | | | | | | | | | | 60,824,000 | | | | 18.7 | |
| | | | | | | | Materials: 4.4% | | | | | | | | |
| | | | | | | | | Other Securities | | | 14,268,656 | | | | 4.4 | |
| | | | | | | | | | | | | | | | |
| | | | | | | | Telecommunication Services: 0.8% | | | | | | | | |
| | | | | | | | | Other Securities | | | 2,661,148 | | | | 0.8 | |
| | | | | | | | | | | | | | | | |
| | | | | | | | Utilities: 3.6% | | | | | | | | |
| | 53,637 | | | | | | | Avista Corp. | | | 1,207,905 | | | | 0.4 | |
| | 44,149 | | | | | | | Piedmont Natural Gas Co. | | | 1,234,406 | | | | 0.4 | |
| | | | | | | | | Other Securities | | | 9,320,509 | | | | 2.8 | |
| | | | | | | | | | | 11,762,820 | | | | 3.6 | |
| | | | | | | | Total Common Stock (Cost $ 251,335,400) | | | 290,478,025 | | | | 89.5 | |
| | | | | | | | | | | | | | | | |
See Accompanying Notes to Financial Statements
37
| | |
| ING INDEX PLUS SMALLCAP PORTFOLIO | | SUMMARY PORTFOLIO OF INVESTMENTS ASOF DECEMBER 31, 2010 (CONTINUED) |
| | | | | | | | | | | | | | | | |
| Shares | | | | | | | | Value | | | Percent
of Net
Assets | |
| | | | | | | | | | | | | | | | |
|
| | REAL ESTATE INVESTMENT TRUSTS: 7.4% | |
| | | | | | | | Financials: 7.4% | | | | | | | | |
| | 117,638 | | | | | | | BioMed Realty Trust, Inc. | | | 2,193,949 | | | | 0.7 | |
| | 84,164 | | | | | | | Extra Space Storage, Inc. | | | 1,464,454 | | | | 0.4 | |
| | 57,298 | | | | | | | Healthcare Realty Trust, Inc. | | | 1,212,999 | | | | 0.4 | |
| | 27,292 | | | | | | | Home Properties, Inc. | | | 1,514,433 | | | | 0.4 | |
| | 58,099 | | | | | | | LaSalle Hotel Properties | | | 1,533,814 | | | | 0.5 | |
| | 24,422 | | | | | | | Mid-America Apartment Communities, Inc. | | | 1,550,553 | | | | 0.5 | |
| | 70,091 | | | | L | | | National Retail Properties, Inc. | | | 1,857,412 | | | | 0.6 | |
| | 35,554 | | | | | | | Tanger Factory Outlet Centers, Inc. | | | 1,820,009 | | | | 0.5 | |
| | | | | | | | | Other Securities | | | 10,989,945 | | | | 3.4 | |
| | | | | | | | Total Real Estate Investment Trusts (Cost $ 21,853,858) | | | 24,137,568 | | | | 7.4 | |
| | | | | | | | Total Long-Term Investments (Cost $ 273,189,258) | | | 314,615,593 | | | | 96.9 | |
|
| | SHORT-TERM INVESTMENTS: 7.6% | |
| | | | | | | | Mutual Funds: 3.6% | | | | | | | | |
| | 11,828,000 | | | | | | | Blackrock Liquidity Funds TempFund Portfolio - Class I | | | 11,828,000 | | | | 3.6 | |
| | | | | | | | Total Mutual Funds (Cost $ 11,828,000) | | | 11,828,000 | | | | 3.6 | |
| | | | | | | | Securities Lending Collateralcc: 4.0% | | | | | | | | |
| | 11,795,222 | | | | | | | BNY Mellon Overnight Government Fund(1) | | | 11,795,222 | | | | 3.6 | |
| | 1,429,266 | | | | R | | | BNY Institutional Cash Reserves Fund, Series B(1)(2) | | | 1,143,413 | | | | 0.4 | |
| | | | | | | | Total Securities Lending Collateral (Cost $ 13,224,488) | | | 12,938,635 | | | | 4.0 | |
| | | | | | | | | | | | | | | | |
| | | | | | | | Total Short-Term Investments (Cost $ 25,052,488) | | | 24,766,635 | | | | 7.6 | |
| | | | | | | | | | | | | | | | |
| | | | | | | | Total Investments in Securities (Cost $ 298,241,746)* | | $ | 339,382,228 | | | | 104.5 | |
| | | | | | | | | | | | | | | | |
| | | | | | | | Other Assets and Liabilities - Net | | | (14,651,872 | ) | | | (4.5 | ) |
| | | | | | | | | | | | | | | | |
| | | | | | | | Net Assets | | $ | 324,730,356 | | | | 100.0 | |
| | | | | | | | | | | | | | | | |
“Other Securities” represents issues not identified as the top 50 holdings in terms of market value and issues or issuers not exceeding 1% of net assets individually or in aggregate respectively as of December 31, 2010.
The following footnotes apply to either the individual securities noted or one or more of the securities aggregated and listed as a single line item.
| @ | Non-income producing security |
| cc | Securities purchased with cash collateral for securities loaned. |
| (1) | Collateral received from brokers for securities lending was invested in these short-term investments. |
| (2) | On September 12, 2008, BNY established a separate sleeve of the Institutional Cash Reserves Fund (Series B) to hold certain Lehman Brothers defaulted debt obligations. The Portfolio’s position in Series B is being fair valued daily. Please see the accompanying Notes to Financial Statements for additional details on securities lending. |
| L | Loaned security, a portion or all of the security is on loan at December 31, 2010. |
| * | Cost for federal income tax purposes is $298,938,006. |
| | | | |
Net unrealized appreciation consists of: | | | | |
Gross Unrealized Appreciation | | $ | 43,984,535 | |
Gross Unrealized Depreciation | | | (3,540,313 | ) |
| | | | |
Net Unrealized Appreciation | | $ | 40,444,222 | |
| | | | |
See Accompanying Notes to Financial Statements
38
| | |
| ING INDEX PLUS SMALLCAP PORTFOLIO | | SUMMARY PORTFOLIO OF INVESTMENTS ASOF DECEMBER 31, 2010 (CONTINUED) |
Fair Value Measurements^
The following is a summary of the fair valuations according to the inputs used as of December 31, 2010 in valuing the Portfolio’s assets and liabilities:
| | | | | | | | | | | | | | | | |
| | | Quoted Prices in Active Markets for Identical Investments (Level 1) | | | Other Observable Inputs (Level 2) | | | Significant Unobservable Inputs (Level 3) | | | Fair Value at 12/31/2010 | |
Asset Table | | | | | | | | | | | | | | | | |
Investments, at value | | | | | | | | | | | | | | | | |
Common Stock* | | $ | 290,478,025 | | | $ | — | | | $ | — | | | $ | 290,478,025 | |
Real Estate Investment Trusts | | | 24,137,568 | | | | — | | | | — | | | | 24,137,568 | |
Short-Term Investments | | | 23,623,222 | | | | — | | | | 1,143,413 | | | | 24,766,635 | |
| | | | | | | | | | | | | | | | |
Total Investments, at value | | $ | 338,238,815 | | | $ | — | | | $ | 1,143,413 | | | $ | 339,382,228 | |
| | | | | | | | | | | | | | | | |
Other Financial Instruments+: | | | | | | | | | | | | | | | | |
Futures | | | 124,853 | | | | — | | | | — | | | | 124,853 | |
| | | | | | | | | | | | | | | | |
Total Assets | | $ | 338,363,668 | | | $ | — | | | $ | 1,143,413 | | | $ | 339,507,081 | |
| | | | | | | | | | | | | | | | |
The following is a reconciliation of the fair valuations using significant unobservable inputs (Level 3) for the Portfolio’s assets and liabilities during the period ended December 31, 2010:
| | | | | | | | | | | | | | | | | | | | | | | | | | | | | | | | | | | | |
| | | Beginning
Balance
12/31/2009 | | | Purchases | | | Sales | | | Accrued
Discounts/
(Premiums) | | | Total
Realized
Gain/(Loss) | | | Total
Unrealized
Appreciation/
(Depreciation) | | | Transfers
Into
Level 3 | | | Transfers
Out of
Level 3 | | | Ending
Balance
12/31/2010 | |
Asset Table | | | | | | | | | | | | | | | | | | | | | | | | | | | | | | | | | | | | |
Investments, at value | | | | | | | | | | | | | | | | | | | | | | | | | | | | | | | | | | | | |
Short-Term Investments | | | 1,143,413 | | | | — | | | | — | | | | — | | | | — | | | | — | | | | — | | | | — | | | | 1,143,413 | |
| | | | | | | | | | | | | | | | | | | | | | | | | | | | | | | | | | | | |
Total Investments, at value | | $ | 1,143,413 | | | $ | — | | | $ | — | | | $ | — | | | $ | — | | | $ | — | | | $ | — | | | $ | — | | | $ | 1,143,413 | |
| | | | | | | | | | | | | | | | | | | | | | | | | | | | | | | | | | | | |
As of December 31, 2010, total change in unrealized gain (loss) on Level 3 securities still held at period end and included in the change in net assets was $0.
| ^ | See Note 2, “Significant Accounting Policies” in the Notes to Financial Statements for additional information. |
| ‘+ | Other Financial Instruments are derivatives not reflected in the Summary Portfolio of Investments and may include open forward foreign currency contracts, futures, swaps, and written options. Forward foreign currency contracts and futures are reported at their unrealized gain/loss at measurement date which represents the amount due to/from the Portfolio. Swaps and written options are reported at their market value at measurement date. |
| | Transfers in or out of Level 3 represents either the beginning value (for transfers in), or the ending value (for transfers out) of any security or derivative instrument where a change in the pricing level occurred from the beginning to the end of the period. It is the policy of the Portfolio to recognize transfers at the end of the reporting period. |
| * | For further breakdown of Common Stock by Industry type, please refer to the Portfolio of Investments. |
ING Index Plus SmallCap Portfolio Open Futures Contracts on December 31, 2010:
| | | | | | | | | | | | | | | | |
Contract Description | | Number
of Contracts | | | Expiration Date | | | Notional Value | | | Unrealized
Appreciation | |
Long Contracts | | | | | | | | | | | | | | | | |
Russell 2000® Mini Index | | | 163 | | | | 03/18/11 | | | $ | 12,751,490 | | | $ | 124,853 | |
| | | | | | | | | | | | | | | | |
| | | | | | | | | | $ | 12,751,490 | | | $ | 124,853 | |
| | | | | | | | | | | | | | | | |
A summary of derivative instruments by primary risk exposure is outlined in the following tables.
The fair value of derivative instruments as of December 31, 2010 was as follows:
| | | | | | | | |
Derivatives not accounted for as hedging
instruments | | Location on Statement of Assets and Liabilities | | | Fair Value | |
Asset Derivatives | | | | | | | | |
Equity contracts | | | Net Assets - Unrealized appreciation* | | | $ | 124,853 | |
| | | | | | | | |
Total Asset Derivatives | | | | | | $ | 124,853 | |
| | | | | | | | |
| * | Includes cumulative appreciation/depreciation of futures contracts as reported in the table following the Summary Portfolio of Investments. |
See Accompanying Notes to Financial Statements
39
| | |
| ING INDEX PLUS SMALLCAP PORTFOLIO | | SUMMARY PORTFOLIO OF INVESTMENTS ASOF DECEMBER 31, 2010 (CONTINUED) |
The effect of derivative instruments on the Portfolio’s Statement of Operations for the year ended December 31, 2010 was as follows:
| | | | |
Derivatives not accounted for as hedging
instruments | | Amount of Realized Gain or (Loss) on Derivatives Recognized in Income | |
| | | Futures | |
Equity contracts | | $ | 1,633,196 | |
| | | | |
Total | | $ | 1,633,196 | |
| | | | |
| |
Derivatives not accounted for as hedging
instruments | | Change in Unrealized Appreciation or (Depreciation) on Derivatives Recognized in Income | |
| | | Futures | |
Equity contracts | | $ | (160,834 | ) |
| | | | |
Total | | $ | (160,834 | ) |
| | | | |
See Accompanying Notes to Financial Statements
40
TAX INFORMATION (UNAUDITED)
Dividends paid during the year ended December 31, 2010 were as follows:
| | | | | | |
Portfolio Name | | Type | | Per Share Amount | |
| | |
ING Index Plus LargeCap Portfolio | | | | | | |
Class I | | NII | | $ | 0.2515 | |
Class S | | NII | | $ | 0.2202 | |
| | |
ING Index Plus MidCap Portfolio | | | | | | |
Class I | | NII | | $ | 0.1458 | |
Class S | | NII | | $ | 0.1162 | |
| | |
ING Index Plus SmallCap Portfolio | | | | | | |
Class I | | NII | | $ | 0.0868 | |
Class S | | NII | | $ | 0.0606 | |
NII - Net investment income
Of the ordinary distributions made during the year ended December 31, 2010, the following percentages qualify for the dividends received deduction (DRD) available to corporate shareholders:
| | | | |
| |
ING Index Plus LargeCap Portfolio | | | 100.00 | % |
| |
ING Index Plus MidCap Portfolio | | | 100.00 | % |
| |
ING Index Plus SmallCap Portfolio | | | 100.00 | % |
Above figures may differ from those cited elsewhere in this report due to differences in the calculation of income and gains under U.S. generally accepted accounting principles (book) purposes and Internal Revenue Service (tax) purposes.
Shareholders are strongly advised to consult their own tax advisers with respect to the tax consequences of their investments in the Portfolios. In January, shareholders, excluding corporate shareholders, receive an IRS 1099-DIV regarding the federal tax status of the dividends and distributions they received in the calendar year.
41
DIRECTOR AND OFFICER INFORMATION (UNAUDITED)
The business and affairs of the Company are managed under the direction of the Board. A Director who is not an interested person of the Company, as defined in the 1940 Act, is an independent director (“Non-Interested Director”). The Directors and Officers of the Company are listed below. The Statement of Additional Information includes additional information about directors of the Company and is available, without charge, upon request at (800) 992-0180.
| | | | | | | | | | |
Name, Address and Age | | Position(s)
held with the
Company | | Term of Office
and Length of
Time Served(1) | | Principal Occupation(s)
During the Past 5 Years* | | Number of
Funds
in Fund
Complex
Overseen
by Director(2) | | Other Directorships
Held by Director |
| | | | | |
| Independent Directors: | | | | | | | | | | |
| | | | | |
Albert E. DePrince, Jr. 7337 E. Doubletree Ranch Rd. Suite 100 Scottsdale, Arizona 85258 Age:69 | | Director | | June 1998 - Present | | Professor of Economics and Finance, Middle Tennessee State University (August 1991 - Present). Formerly, Director of Business and Economics Research Center, Middle Tennessee State University (1999 - 2002); Chief Economist, Marine Midland Bank (1987 - 1990); Various Management Positions, Marine Midland Bank (1978 - 1990). Ph.D. in Economics Published numerous scholarly papers and journal articles in the areas of financial markets, financial institutions, corporate finance and monetary policy. | | 37 | | Academy of Economics and Finance (February 2002- Present). |
| | | | | |
Sidney Koch 7337 E. Doubletree Ranch Rd. Suite 100 Scottsdale, Arizona 85258 Age:75 | | Director | | April 1994 - Present | | Retired. Self-Employed Consultant (June 2000 - Present). Formerly, Senior Adviser, Hambro America, Inc. (1993 - 2000); Executive Vice President of Investment Banking, Daiwa Securities America, Inc. (1986 - 1993). | | 37 | | None. |
| | | | | |
Corine T. Norgaard 7337 E. Doubletree Ranch Rd. Suite 100 Scottsdale, Arizona 85258 Age: 73 | | Director | | June 1991 - Present | | President and Owner, Retirement Options, LLC, a training provider for retirement coaches (August 2009 - Present) Formerly, President, Thompson Enterprises (September 2004 - September 2005); Dean of the Barney School of Business, University of Hartford (August 1996 - June 2004), Various other academic positions (1969 - 1993). Certified Public Accountant Ph. D in Accounting and Business | | 37 | | MassMutual Corporate Investors and MassMutual Participation Investors (April 1997 - Present); MassMutual Premier Funds (20 funds), Chair of Audit Committee (December 2004 - Present); and MML Series Investment Funds II (8 funds), Chair of Audit Committee (December 2005 - Present). |
| | | | | |
Joseph E. Obermeyer 7337 E. Doubletree Ranch Rd. Suite 100 Scottsdale, Arizona 85258 Age: 53 | | Director | | January 2003 - Present | | President, Obermeyer & Associates, Inc., a provider of financial and economic consulting services (November 1999 - Present). Formerly, Senior Manager, Arthur Anderson LLP (1995 - 1999); Senior Manager, Coopers & Lybrand, LLP (1993 - 1995); Manager, Price Waterhouse (1988 - 1993); Second Vice President, Smith Barney (1985 - 1988); Consultant, Arthur Anderson & Co. (1984 - 1985). | | 37 | | None. |
42
DIRECTOR AND OFFICER INFORMATION (UNAUDITED) (CONTINUED)
| | | | | | | | | | |
Name, Address and Age | | Position(s)
held with the
Company | | Term of Office
and Length of
Time Served(1) | | Principal Occupation(s)
During the Past 5 Years* | | Number of
Funds
in Fund
Complex
Overseen
by Director(2) | | Other Directorships
Held by Director |
| | | | | |
Russell Jones 7337 E. Doubletree Ranch Rd. Suite 100 Scottsdale, Arizona 85258 Age: 66 | | Director | | December 2007 - Present | | Retired. Formerly, Senior Vice President, Chief Investment Officer and Treasurer, and other various positions including Principal Investor Relations Officer, Principal Public Relations Officer, and Corporate Parent Treasurer, Kaman Corporation, an aerospace and industrial distribution manufacturer (April 1973 - March 2008). President, Hartford Area Business Economists (1986 - 1987) and Corporate Loan Officer and Credit Analyst, Hartford National Bank (1966 - 1973). Certified AARP Tax Counselor (2011) | | 37 | | Independent Director, CIGNA Mutual Founds (8 funds), Chair of Contracts Committee (1995 - 2005). |
| | | | |
| Directors who are “Interested Persons”(4) | | | | | | | | |
| | | | | |
Shaun Mathews(3)(4) 7337 E. Doubletree Ranch Rd. Suite 100 Scottsdale, Arizona 85258 Age: 55 | | Director | | December 2007 - Present | | President and Chief Executive Officer, ING Investments, LLC(5) (November 2006 - Present). Formerly, Head of ING Mutual Funds and Investment Products (November 2004 - November 2006). | | 175 | | ING Retirement Holdings, Inc. (September 1998 - Present); ING Services Holding Company, Inc. (May 2000 - Present); ING Financial Advisers, LLC (April 2002 - Present); Southland Life Insurance Company (June 2002 - Present); ING Capital Corporation, LLC and ING Investments Distributor, LLC(6) (December 2005 - Present); ING Funds Services, LLC(7), ING Investments, LLC(5) and ING Pilgrim Funding, Inc. (March 2006 - Present); and Directed Services LLC (December 2006 - Present)(8). |
| * | | The information reported includes the principle occupation during the last five years for each Director and other information relating to the professional experience, attributes and skills relevant to each Director’s qualifications to serve as Director. |
| (1) | | Directors serve until their successors are duly elected and qualified. |
| (2) | | For the purposes of this table (except for Mr. Mathews), “Fund Complex” means the following investment companies: ING Series Fund, Inc.; ING Strategic Allocation Portfolios, Inc.; ING Variable Funds; ING Variable Portfolios, Inc.; ING Balanced Portfolio, Inc.; ING Intermediate Bond Portfolio; and ING Money Market Portfolio. |
| (3) | | For Mr. Mathews, the Fund Complex also includes the following investment companies: ING Asia Pacific High Dividend Equity Income Fund, ING Emerging Markets High Dividend Equity Fund; ING Emerging Markets Local Bond Fund; ING Equity Trust; ING Funds Trust; ING Global Equity Dividend and Premium Opportunity Fund; ING Global Advantage and Premium Opportunity Fund; ING Infrastructure, Industrials, and Materials Fund; ING International High Dividend Equity Income Fund; ING Investors Trust; ING Mayflower Trust; ING Mutual Funds; ING Partners, Inc.; ING Prime Rate Trust; ING Risk Managed Natural Resources Fund; ING Senior Income Fund; ING Separate Portfolios Trust; ING Variable Insurance Trust; and ING Variable Products Trust. |
| (4) | | “Interested person,” as defined in the 1940 Act, by virtue of this Director’s/Trustee’s affiliation with any of the Funds, ING or any of ING’s affiliates. |
| (5) | | ING Investments, LLC was previously named ING Pilgrim Investments, LLC. ING Pilgrim Investments, LLC is the successor in interest to ING Pilgrim Investments, Inc., which was previously known as Pilgrim Investments, Inc. and before that was known as Pilgrim America Investments, Inc. |
| (6) | | ING Investments Distributor, LLC was previously named ING Funds Distributor, LLC. ING Funds Distributor, LLC is the successor in interest to ING Funds Distributor, Inc., which was previously known as ING Pilgrim Securities, Inc., and before that, was known as Pilgrim Securities, Inc., and before that was known as Pilgrim America Securities, Inc. |
| (7) | | ING Funds Services, LLC was previously named ING Pilgrim Group, LLC. ING Pilgrim Group, LLC is the successor in interest to ING Pilgrim Group, Inc., which was previously known as Pilgrim Group, Inc. and before that was known as Pilgrim America Group, Inc. |
| (8) | | Directed Services LLC is the successor in interest to Directed Services, Inc. |
43
DIRECTOR AND OFFICER INFORMATION (UNAUDITED) (CONTINUED)
| | | | | | |
Name, Address and Age | | Position(s) Held With Company | | Term of Office and Length of Time Served(1) | | Principal Occupation(s) - During the Past 5 Years |
| | | |
Shaun P. Mathews(5) 7337 East Doubletree Ranch Rd. Suite 100 Scottsdale, Arizona 85258 Age: 55 | | President and Chief Executive Officer | | December 2006 - Present | | President and Chief Executive Officer, ING Investments, LLC (November 2006 - Present). Formerly, Head of ING Mutual Funds and Investment Products (November 2004 - November 2006). |
| | | |
Michael J. Roland 7337 East Doubletree Ranch Rd. Suite 100 Scottsdale, Arizona 85258 Age: 52 | | Executive Vice President | | April 2002 - Present | | Executive Vice President and Chief Operating Officer, ING Investments, LLC(2) and ING Funds Services, LLC(3) (January 207 - Present). Formerly, Executive Vice President, Head of Product Management (January 2005 - January 2007). |
| | | |
Stanley D. Vyner 230 Park Avenue New York, New York 10169 Age: 60 | | Executive Vice President | | March 2002 - Present | | Executive Vice President, ING Investments, LLC(2) (July 2000 - Present) and Chief Investment Risk Officer, ING Investments, LLC(2) (January 2003 - Present). |
| | | |
Joseph M. O’Donnell 7337 East Doubletree Ranch Rd. Suite 100 Scottsdale, Arizona 85258 Age: 56 | | Executive Vice President and Chief Compliance Officer | | March 2006 - Present November 2004 - Present | | Chief Compliance Officer of the ING Funds (November 2004 Present); Executive Vice President of the ING Funds (March 2006 - Present); Chief Compliance Officer of ING Investments, LLC(2) (March 2006 - July 2008 and October 2009- Present); and Investment Advisor Chief Compliance Officer, Directed Services LLC(6) (March 2006 - July 2008 and October 2009- Present). Formerly, Investment Advisor Chief Compliance Officer, ING Life Insurance and Annuity Company (March 2006 - December 2006). |
| | | |
Todd Modic 7337 East Doubletree Ranch Rd. Suite 100 Scottsdale, Arizona 85258 Age: 43 | | Senior Vice President, Chief/Principal Financial Officer and Assistant Secretary | | March 2005 - Present | | Senior Vice President, ING Funds Services, LLC(3) (March 2005 - Present). |
| | | |
Kimberly A. Anderson 7337 East Doubletree Ranch Rd. Suite 100 Scottsdale, Arizona 85258 Age: 46 | | Senior Vice President | | December 2003 - Present | | Senior Vice President, ING Investments, LLC(2) (October 2003 - Present). |
| | | |
Robert Terris 7337 East Doubletree Ranch Rd. Suite 100 Scottsdale, Arizona 85258 Age: 40 | | Senior Vice President | | June 2006 - Present | | Senior Vice President, Head of Division Operations, ING Funds Services, LLC(3) (May 2006 - Present). Formerly, Vice President of Administration, ING Funds Services, LLC(3) (October 2001 - May 2006). |
| | | |
Robyn L. Ichilov 7337 East Doubletree Ranch Rd. Suite 100 Scottsdale, Arizona 85258 Age: 43 | | Vice President and Treasurer | | March 2002 - Present | | Vice President and Treasurer, ING Funds Services, LLC(3) (November 1995 - Present) and ING Investments, LLC(2) (August 1997 - Present). |
| | | |
Lauren D. Bensinger 7337 East Doubletree Ranch Rd. Suite 100 Scottsdale, Arizona 85258 Age: 56 | | Vice President | | March 2003 - Present | | Vice President, ING Investments, LLC(2) and ING Funds Services, LLC(3) (February 1996 - Present); Director of Compliance, ING Investments, LLC(2) (October 2004 - Present); and Vice President and Money Laundering Reporting Officer, ING Investments Distributor, LLC(4) (April 2010 - Present). Formerly, Chief Compliance Officer, ING Investments Distributor, LLC(4) (August 1995 - April 2010). |
| | | |
William Evans 10 State House Square Hartford, Connecticut 06103 Age: 38 | | Vice President | | September 2007 - Present | | Senior Vice President (March 2010 - Present) and Head of Manager Research and Selection Group (April 2007 - Present). Formerly, Vice President, U.S. Mutual Funds and Investment Products (May 2005 - April 2007). |
| | | |
Maria M. Anderson 7337 East Doubletree Ranch Rd. Suite 100 Scottsdale, Arizona 85258 Age: 52 | | Vice President | | September 2004 - Present | | Vice President, ING Funds Services, LLC(3) (September 2004 - Present). |
44
DIRECTOR AND OFFICER INFORMATION (UNAUDITED) (CONTINUED)
| | | | | | |
Name, Address and Age | | Position(s) Held With Company | | Term of Office and Length of Time Served(1) | | Principal Occupation(s) - During the Past 5 Years |
| | | |
Denise Lewis 7337 East Doubletree Ranch Rd. Suite 100 Scottsdale, Arizona 85258 Age: 47 | | Vice President | | April 2007 - Present | | Vice President, ING Funds Services, LLC (December 2006 - Present). Formerly, Senior Vice President, UMB Investment Services Group, LLC (November 2003 - December 2006). |
| | | |
Kimberly K. Springer 7337 East Doubletree Ranch Rd. Suite 100 Scottsdale, Arizona 85258 Age: 53 | | Vice President | | March 2006 - Present | | Vice President, ING Investment Management -ING Funds (March 2010 - Present); Vice President, ING Funds Services, LLC(3) (March 2006 - Present) and Managing Paralegal, Registration Statements (June 2003 - Present). Formerly, Assistant Vice President, ING Funds Services, LLC(3) (August 2004 - March 2006). |
| | | |
Craig Wheeler 7337 East Doubletree Ranch Rd. Suite 100 Scottsdale, Arizona 85258 Age: 41 | | Assistant Vice President | | June 2008 - Present | | Assistant Vice President - Director of Tax, ING Funds Services (March 2008 - Present). Formerly, Tax Manager, ING Funds Services (March 2005 - March 2008). |
| | | |
Huey P. Falgout, Jr. 7337 East Doubletree Ranch Rd. Suite 100 Scottsdale, Arizona 85258 Age: 47 | | Assistant Secretary | | September 2003 - Present | | Senior Vice President and Chief Counsel, ING Investment Management -ING Funds (March 2010- Present). Formerly, Chief Counsel, ING Americas, U.S. Legal Services (October 2003 - March 2010). |
| | | |
Theresa K. Kelety 7337 East Doubletree Ranch Rd. Suite 100 Scottsdale, Arizona 85258 Age: 47 | | Secretary | | September 2003 - Present | | Vice President and Senior Counsel, ING Investment Management - ING Funds (March 2010-Present). Formerly, Senior Counsel, ING Americas, U.S. Legal Services (April 2008 - March 2010) and Counsel, ING Americas, U.S. Legal Services (April 2003 - April 2008). |
| | | |
Kathleen Nichols 7337 East Doubletree Ranch Rd. Suite 100 Scottsdale, Arizona 85258 Age: 35 | | Assistant Secretary | | June 2008 - Present | | Vice President and Counsel, ING Investment Management - ING Funds (March 2010 - Present). Formerly, Counsel, ING Americas, U.S. Legal Services (February 2008 - March 2010) and Associate, Ropes & Gray LLP (September 2005 - February 2008) |
| | | |
Paul Caldarelli 7337 East Doubletree Ranch Rd. Suite 100 Scottsdale, Arizona 85258 Age: 59 | | Assistant Secretary | | August 2010 - Present | | Vice President and Senior Counsel, ING Investment Management -ING Funds (March 2010-Present). Formerly, Senior Counsel, ING Americas, U.S. Legal Services (April 2008 - March 2010) and Counsel, ING Americas, U.S. Legal Services (May 2005 - April 2008). |
| (1) | | The officers hold office until the next annual meeting of the Trustees and until their successors shall have been elected and qualified. |
| (2) | | ING Investments, LLC was previously named ING Pilgrim Investments, LLC. ING Pilgrim Investments, LLC is the successor in interest to ING Pilgrim Investments, Inc., which was previously known as Pilgrim Investments, Inc. and before that was known as Pilgrim America Investments, Inc. |
| (3) | | ING Funds Services, LLC was previously named ING Pilgrim Group, LLC. ING Pilgrim Group, LLC is the successor in interest to ING Pilgrim Group, Inc., which was previously known as Pilgrim Group, Inc. and before that was known as Pilgrim America Group, Inc. |
| (4) | | ING Investments Distributor, LLC was previously named ING Funds Distributor, LLC. ING Funds Distributor, LLC is the successor in interest to ING Funds Distributor, Inc., which was previously known as ING Pilgrim Securities, Inc., and before that, was known as Pilgrim Securities, Inc., and before that was known as Pilgrim America Securities, Inc. |
| (5) | | Mr. Mathews commenced services as CEO and President of the ING Funds on November 11, 2006. |
| (6) | | Directed Services LLC is the successor in interest to Directed Services, Inc. |
45
ADVISORY CONTRACT APPROVAL DISCUSSION (UNAUDITED)
BOARD CONSIDERATION AND APPROVAL OF INVESTMENT ADVISORY AND SUB-ADVISORY AGREEMENTS
The Investment Company Act of 1940, as amended (the “1940 Act”), provides, in substance, that each investment advisory agreement and sub-advisory agreement for a mutual fund will terminate automatically after the initial term of the agreement (which term may not exceed two years), unless continuation of the agreement is approved annually by the Board of Trustees or Directors, as the case may be (the “Board”) of the fund, including a majority of the Trustees/Directors who have no direct or indirect interest in the agreement and who are not “interested persons” of the fund (the “Independent Trustees”). Consistent with this requirement of the 1940 Act, the Board of ING Balanced Portfolio, Inc., ING Strategic Allocation Portfolios, Inc., ING Intermediate Bond Portfolio, ING Money Market Portfolio, ING Variable Funds, ING Variable Portfolios, Inc. and ING Series Fund, Inc., with respect to each portfolio series thereof (each, a “Fund” and, collectively, the “Funds”) has established a process for considering on an annual basis approval of the continuation of the investment management agreement for each Fund (the “Advisory Agreement”) with ING Investments, LLC (the “Adviser”) and the sub-advisory agreement for each Fund (collectively, the “Sub-Advisory Agreements”) with each sub-adviser of the Funds (the “Sub-Advisers”). Set forth below is a description of the process followed by the Board in considering approval of the continuation of each Advisory and Sub-Advisory Agreement (collectively, the “Agreements”), together with an explanation of many of the factors considered and related conclusions reached by the Board in voting to approve the continuation of each Agreement for an additional one-year period commencing January 1, 2011, followed by specific considerations with respect to each Fund covered by this report (each, a “Portfolio”).
Overview of the Review Process
At a meeting of the Board held on December 15, 2010, the Board, including all of the Independent Trustees, voted to approve continuation of each of the existing Agreements for the Funds. Prior to voting such approvals, the Board received the affirmative recommendation of the Contracts Committee of the Board, which is a Committee of the Board comprised of all of the Independent Trustees and exclusively of the Independent Trustees. The Contracts Committee recommended approval of the Agreements after
completing an extensive review of information requested by the Committee from the Adviser and each Sub-Adviser, including the following: (1) comparative performance data for each Fund for various time periods; (2) comparative data regarding management fees, including data regarding the fees charged by the Adviser and Sub-Advisers for managing other mutual funds and institutional accounts using investment strategies and techniques similar to those used in managing the Funds; (3) comparative data regarding the total expenses of each Fund; (4) copies of each form of Advisory Agreement and Sub-Advisory Agreement; (5) copies of the codes of ethics of the Adviser and each Sub-Adviser, together with information relating to the manner in which each code is administered; (6) financial statements of the Adviser and each Sub-Adviser; (7) profitability analyses for the Adviser and each Sub-Adviser with respect to each Fund, and all Funds as a group; (8) descriptions of the qualifications of the investment personnel responsible for managing each Fund, the structure of their compensation and their responsibilities with respect to managing other accounts or mutual funds; (9) descriptions of the services provided to the Funds, including the investment strategies and techniques used by each Sub-Adviser in managing the Funds; (10) data relating to portfolio turnover and brokerage practices, including practices with respect to the acquisition of research through “soft dollar” benefits received in connection with the Funds’ brokerage; (11) descriptions of the policies and procedures of the various service providers of the Funds for protecting the privacy of shareholder information; (12) information relating to projected sales and redemptions of Fund shares and business plans relating to the Adviser’s mutual fund platform; (13) descriptions of the business continuity and disaster recovery plans of the Adviser and each Sub-Adviser; (14) descriptions of various compliance programs of the Adviser and Sub-Advisers, including the Adviser’s programs for monitoring and enforcing compliance with the Funds’ policies with respect to market-timing, late trading and selective portfolio disclosure; (15) independent reports analyzing the quality of the trade execution services performed by Sub-Advisers for the Funds; and (16) other information relevant to an evaluation of the nature, extent and quality of the services provided by the Adviser and each Sub-Adviser in response to a series of detailed questions posed by Goodwin Procter LLP, legal counsel for the Independent Trustees (“Independent Counsel”) on behalf of the Independent Trustees.
46
ADVISORY CONTRACT APPROVAL DISCUSSION (UNAUDITED) (CONTINUED)
The Contracts Committee began the formal review process in August 2010 when it met separately with Independent Counsel to review the information to be requested from management and the methodology to be used in determining the selected peer groups for comparing performance and expenses (the “Peer Group Methodology”). Prior to the August meeting, the Contracts Committee engaged an independent consultant (the “Independent Consultant”) to evaluate, and make recommendations with respect to, the Peer Group Methodology. The Independent Consultant’s findings were reported to the Contracts Committee at the August meeting and incorporated into the Peer Group Methodology approved by the Board. The Contracts Committee then held meetings on October 19-20, 2010 and December 13-14, 2010, during which the Independent Trustees, meeting separately with Independent Counsel, reviewed and evaluated the information described above. As part of the review process, the Contracts Committee also met with representatives from the Adviser and/or the Sub-Advisers to discuss the information provided to the Committee. The Contracts Committee also considered information that had been provided by the Adviser and Sub-Advisers throughout the year at other meetings of the Contracts Committee, the Audit Committee, the Compliance Committee and the full Board.
The Independent Trustees were assisted by Independent Counsel, throughout the contract review process. The Independent Trustees relied upon the advice of Independent Counsel and their own business judgment in determining the material factors to be considered in evaluating each Advisory and Sub-Advisory Agreement and the weight to be given to each such factor. The conclusions reached by the Independent Trustees were based on a comprehensive evaluation of all of the information provided and were not the result of any one factor. Moreover, each Independent Trustee may have afforded different weight to the various factors in reaching his or her conclusions with respect to each Advisory and Sub-Advisory Agreement.
Nature, Extent and Quality of Services
In considering whether to approve the Advisory and Sub-Advisory Agreements for the Funds for the year commencing January 1, 2011, the Board evaluated the nature, extent and quality of services provided to the Funds by the Adviser and Sub-Advisers. The Board considered the investment management and related services provided by the Adviser and Sub-Advisers,
including the quantity and quality of the resources available to provide such services. Among other things, the Board considered the qualifications of the individuals responsible for performing various investment related services.
The Board also considered the quality of the compliance programs of the Adviser and each Sub-Adviser, including the manner in which the Adviser and each Sub-Adviser monitor for compliance with the investment policies and restrictions of a Fund and with the Codes of Ethics of the Funds, the Adviser and the Sub-Advisers with respect to personal trading by employees with access to portfolio information. The Board also considered the actions taken by the Adviser and Sub-Advisers to establish and maintain effective disaster recovery and business continuity plans.
The Board considered the actions taken by the Adviser and its affiliated companies to administer the Funds’ policies and procedures for voting proxies, valuing the Funds’ assets, selective disclosure of portfolio holdings and preventing late-trading and frequent trading of Fund shares.
The Board also took into account the efforts of the Adviser and its affiliated companies to reduce the expenses of the Funds. With respect to those Funds that are sub-advised by an affiliate of the Adviser, the Board specifically noted that, in recent years, the Adviser and its affiliated companies have significantly reduced the Funds’ brokerage costs and portfolio turnover rates, as well as the quantity of research acquired through the use of soft dollars from the Funds’ brokerage. The Board also noted the efforts of the Adviser to optimize the number of Funds in the ING complex of mutual funds and to standardize the asset management characteristics and policies across the ING mutual fund platform. The Board considered information provided by management with respect to the progress made within ING Groep to establish an integrated global asset management firm (the “Global Transition”), including information with respect to any benefits to the Funds and their shareholders as a result of operational efficiencies achieved through the Global Transition. The Board also considered the benefits that shareholders of the Funds realize because the Funds are part of the larger ING family of mutual funds, including, in most cases, the ability of shareholders to exchange or transfer investments within the same class of shares among a wide variety of mutual funds without incurring additional sales charges. In that regard, the Board considered the potential impacts of any divestiture of its insurance business, which includes
47
ADVISORY CONTRACT APPROVAL DISCUSSION (UNAUDITED) (CONTINUED)
the investment management businesses, by ING Groep or significant change in structure of the investment management business, if any, on the services provided to the Funds by the Adviser and Sub-Advisers. The Board also considered the actions that have been taken by management to retain key investment management personnel in light of such a potential divestiture.
The Board also considered the Adviser’s responsiveness and recommendations for Board action and other steps taken in response to the extraordinary dislocations experienced in the capital markets in recent years, including sustained periods of high volatility, credit disruption and government intervention. In particular, the Board considered the Adviser’s efforts and expertise with respect to each of the following matters as they relate to the Funds: (i) negotiating and maintaining the availability of bank loan facilities and other sources of credit used to satisfy liquidity needs; (ii) establishing the fair value of securities and other instruments held in investment portfolios during periods of market volatility and issuer-specific disruptions; (iii) negotiating and maintaining credit support from the Funds’ securities lending agent with respect to certain defaulted securities held indirectly by the Funds as collateral for securities on loan; and (iv) the ongoing monitoring of investment management processes and risk controls.
The Board’s approval of the Advisory and Sub-Advisory Agreements was informed by certain information provided by the Adviser and the applicable Sub-Advisers with respect to certain actions to be taken to correct underperformance and lack of scale with respect to certain Funds as indicated in the Portfolio-by-Portfolio analysis below.
The Board concluded that the nature, extent and quality of advisory and related services provided by the Adviser and each of the Sub-Advisers, taken as a whole, are consistent with the terms of the respective Advisory and Sub-Advisory Agreements and justify the fees paid by the Funds for such services.
Fund Performance
The Board reviewed each Fund’s investment performance over various time periods on an absolute basis and relative to the performance of (i) one or more appropriate benchmark indexes (such as the S&P 500 Composite Stock Price Index), (ii) a group of similarly managed mutual funds identified by Lipper, Inc. and/or Morningstar, Inc., and (iii) similarly managed mutual funds within a specified peer group based upon the
Peer Group Methodology approved by the Contracts Committee (each, a “Selected Peer Group”). The Board reviewed comparative performance data for the most recent calendar quarter, year-to-date, one-, three-, five- and ten-year periods, where applicable, ending June 30, 2010 and the most recent calendar quarter, year-to-date, one-, three-, and five-year periods ending September 30, 2010. In considering the performance of the Funds, the Board noted the instability of the markets and periods of high volatility during the prior two years and the response of the Adviser and each Sub-Adviser to such volatility. Summaries of selected portions of the performance information reviewed by the Board, together with the Board’s conclusions regarding the performance of each Portfolio, are set forth below under “Portfolio-by-Portfolio Analysis.”
Management Fees, Sub-Advisory Fees and Expenses
Consideration was given to the contractual investment advisory fee rates, inclusive of administrative fee rates, payable by the Funds to the Adviser and its affiliated companies (referred to collectively as “management fees”) and the contractual sub-advisory fee rates payable by the Adviser to each Sub-Adviser for sub-advisory services. As part of its review, the Board considered each Fund’s management fee and total expense ratio, as compared to its Selected Peer Group, both before and after giving effect to any undertaking by the Adviser to waive fees and/or limit the total expenses of a Fund. In addition, the Trustees received information regarding the fees charged by each Sub-Adviser to similarly-managed institutional accounts and other mutual funds, if any, and the comparability (or lack thereof) of the services provided by the Sub-Adviser in managing such accounts and other mutual funds to the services provided in managing the Funds. With respect to the Funds sub-advised by an affiliate of the Adviser, the Board evaluated the reasonableness of the total fees received by the Adviser and its affiliate in the aggregate under the Advisory and Sub-Advisory Agreements. With respect to those Funds sub-advised by a Sub-Adviser that is not affiliated with the Adviser, the Board considered the reasonableness of the fees payable to the Sub-Adviser by the Adviser in light of the ability of the Adviser to negotiate such fees on an arm’s-length basis. Summaries of selected portions of the fee and expense information reviewed with respect to each Portfolio are set forth below under “Portfolio-by-Portfolio Analysis.” After reviewing the foregoing information, and in light of the nature, extent and quality of the services
48
ADVISORY CONTRACT APPROVAL DISCUSSION (UNAUDITED) (CONTINUED)
provided by the Adviser and each Sub-Adviser, the Board concluded with respect to each Fund that the management fee charged to the Fund for advisory, sub-advisory and related services is fair and reasonable and that the total expense ratio of the Fund is reasonable.
Profitability
The Board considered information relating to revenues, expenses, and profits realized by the Adviser and each Sub-Adviser attributable to performing advisory, sub-advisory and administrative services for the Funds. With respect to Funds sub-advised by an unaffiliated Sub-Adviser, the Board did not consider the profitability of the Sub-Adviser to be a material factor because the Board believes that the Adviser negotiates sub-advisory fees with the unaffiliated Sub-Adviser on an arm’s-length basis. The Board reviewed profitability data for the Adviser and its affiliated companies, including the distributor of the Funds, relating to (i) each Fund separately, (ii) all Funds as a group, (iii) all “retail” Funds as a group, and (iv) all variable insurance product Funds as a group, in each case for the one-year periods ended December 31, 2009 and December 31, 2008 and the nine-month period ended September 30, 2010. With respect to the Adviser and its affiliates, such information was prepared in accordance with a methodology approved by the Contracts Committee. The Board considered the profitability of the Adviser and its affiliated companies attributable to managing and operating each Fund both with and without the profitability of the distributor of the Funds and both before and after giving effect to any expenses incurred by the Adviser or any affiliated company in making revenue sharing or other payments to third parties, including affiliated insurance companies, for distribution and administrative services. With respect to Funds sub-advised by an affiliate of the Adviser, the Board considered the total profits derived by the Adviser and its affiliate in the aggregate attributable to managing and operating each Fund. The Board also considered other direct or indirect benefits that the Adviser and Sub-Advisers, and any affiliated companies thereof, derive from their relationships with the Funds, including the receipt by certain affiliates of the Adviser, of fees relating to the offering of bundled financial products, such as annuity contracts, and the receipt by Sub-Advisers of “soft dollar” benefits from the Funds’ brokerage. The Board concluded that, in light of the nature, extent and quality of the services provided, the profits realized by the Adviser and its affiliated companies, individually and taken as a whole, with
respect to providing advisory, sub-advisory and administrative services for each Fund are reasonable.
Economies of Scale
In considering the reasonableness of the management fee of each Fund, the Board considered the extent to which economies of scale can be expected to be realized by a Fund’s Adviser and its affiliated companies, on the one hand, and by the Fund, on the other hand, as the assets of the Fund increase. The Board noted that the advisory fee schedule for certain Funds includes breakpoints such that, as the assets of the Fund increase, the Fund’s management fee will decrease as a percentage of the Fund’s total assets. The Board recognized the inherent difficulties in measuring precisely the impact of any economies of scale being realized by the Adviser and its affiliated companies with respect to their management of any one or more Funds. In an effort to determine the extent to which economies of scale, if any, will be realized by the Adviser and its affiliated companies as the assets of the Funds grow, the Board considered the profitability data described above relating to the Adviser and its affiliated companies in light of changes in the assets of the Funds over various time periods. The Board noted that the total assets under management of many of the Funds have decreased during the past several years and concluded that the economies of scale realized by the Adviser and its affiliated companies from managing the Funds have not increased with respect to such Funds. The Board also reviewed information regarding the expense ratio of each Fund in light of changes in the assets of the Funds over various time periods, noting that, as the assets of a Fund increase, the fixed expenses of the Fund, as a percentage of the total assets of the Fund, can be expected to decrease. The Board considered such expense information in light of projections provided by the Adviser with respect to the future growth of assets of the Funds. The Board also considered the extent to which economies of scale have been, or are expected to be, realized as a result of the Global Transition. Based upon the foregoing, the Board concluded that the economies of scale being realized by the Adviser and its affiliated companies do not mandate the implementation of breakpoints or additional breakpoints, as the case may be, with respect to any Fund at this time except as otherwise indicated with respect to any specific Portfolio in the Portfolio-by-Portfolio analysis.
49
ADVISORY CONTRACT APPROVAL DISCUSSION (UNAUDITED) (CONTINUED)
Portfolio-by-Portfolio Analysis
In deciding to approve the continuation of each Advisory and Sub-Advisory Agreement for an additional one-year period beginning January 1, 2011, the Board took into account the specific data and factors identified below relating to the performance, fees and expenses of each Fund and actions being taken by the Adviser or Sub-Adviser, as the case may be, with respect to these matters. Except as otherwise indicated, the performance data described below for each Portfolio is for periods ended September 30, 2010 and the management fees and expense data described below are as of June 30, 2010.
ING Index Plus LargeCap Portfolio
In evaluating the investment performance of ING Index Plus LargeCap Portfolio, the Board noted that: (1) the Portfolio outperformed its Morningstar category median for the most recent calendar quarter, year-to-date and one-year periods, but underperformed for the three-year and five-year period; (2) the Portfolio outperformed its benchmark index for the most recent calendar quarter and year-to-date periods but underperformed for the other periods presented; and (3) the Portfolio is ranked in its Morningstar category in the second quintile for the most recent calendar quarter, year-to-date and one-year periods, and the fourth quintile for the three-year and five-year periods. The Board noted that, consistent with representations made to the Board in December 2009, the Sub-Adviser implemented an enhanced quantitative model in the first part of 2010 and that in connection therewith the Sub-Adviser made certain changes to the portfolio management team. The Board concluded that appropriate actions are being taken to improve performance and that additional time is needed to evaluate the effectiveness of these actions.
In assessing the reasonableness of the management fee and expense ratio for ING Index Plus LargeCap Portfolio, the Board noted that the management fee for the Portfolio is below the median and average management fees of the funds in its Selected Peer Group and that the expense ratio for the Portfolio is below the median and average expense ratios of the funds in its Selected Peer Group.
ING Index Plus MidCap Portfolio
In evaluating the investment performance of ING Index Plus MidCap Portfolio, the Board noted that: (1) the Portfolio outperformed its Morningstar category
median for the one-year period but underperformed for the most recent calendar quarter, year-to-date, three-year and five-year periods; (2) the Portfolio underperformed its benchmark index for each period presented; and (3) the Portfolio is ranked in its Morningstar category in the third quintile for all periods presented. The Board noted that, consistent with representations made to the Board in December 2009, the Sub-Adviser implemented an enhanced quantitative model in the first part of 2010 and that in connection therewith the Sub-Adviser made certain changes to the portfolio management team. The Board concluded that appropriate actions are being taken to improve performance and that additional time is needed to evaluate the effectiveness of these actions.
In assessing the reasonableness of the management fee and expense ratio for ING Index Plus MidCap Portfolio, the Board noted that the management fee for the Portfolio is below the median and average management fees of the funds in its Selected Peer Group and that the expense ratio for the Portfolio is below the median and average expense ratios of the funds in its Selected Peer Group.
ING Index Plus SmallCap Portfolio
In evaluating the investment performance of ING Index Plus SmallCap Portfolio, the Board noted that: (1) the Portfolio underperformed its Morningstar category median and benchmark index for each period presented; and (2) the Portfolio is ranked in its Morningstar category in the fifth quintile for the most recent calendar quarter and year-to-date period, and in the fourth quintile for the one-year, three-year and five-year periods. The Board noted that, consistent with representations made to the Board in December 2009, the Sub-Adviser implemented an enhanced quantitative model in the first part of 2010 and that in connection therewith the Sub-Adviser made certain changes to the portfolio management team. The Board concluded that appropriate actions are being taken to improve performance and that additional time is needed to evaluate the effectiveness of these actions.
In assessing the reasonableness of the management fee and expense ratio for ING Index Plus SmallCap Portfolio, the Board noted that the management fee for the Portfolio is below the median and average management fees of the funds in its Selected Peer Group, and that the expense ratio for the Portfolio is below the median and average expense ratios of the funds in its Selected Peer Group.
50
Investment Adviser
ING Investments, LLC
7337 East Doubletree Ranch Road, Suite 100
Scottsdale, Arizona 85258
Administrator
ING Funds Services, LLC
7337 East Doubletree Ranch Road, Suite 100
Scottsdale, Arizona 85258
Distributor
ING Investments Distributor, LLC
7337 East Doubletree Ranch Road, Suite 100
Scottsdale, Arizona 85258
Transfer Agent
BNY Mellon Investment Servicing (U.S.) Inc
301 Bellevue Parkway
Wilmington, Delaware 19809
Independent Registered Public
Accounting Firm
KPMG LLP
Two Financial Center
60 South Street
Boston, Massachusetts 02111
Custodian
The Bank of New York Mellon
One Wall Street
New York, New York 10286
Legal Counsel
Goodwin Procter LLP
Exchange Place
53 State Street
Boston, Massachusetts 02109
Before investing, carefully consider the investment objectives, risks, charges and expenses of the variable universal life insurance policy or variable annuity contract and the underlying variable investment options. This and other information is contained in the prospectus for the variable universal life policy or variable annuity contract and the underlying variable investment options. Obtain these prospectuses from your agent/registered representative and read them carefully before investing.
| | | | |
 | | VAR-AJP | | (1210 021811) |
Annual Report
December 31, 2010
Classes ADV, I, S, and S2
ING Variable Products Index Funds
Domestic Equity Index Portfolios
n ING RussellTM Large Cap Index Portfolio
n ING RussellTM Large Cap Growth Index Portfolio
n ING RussellTM Large Cap Value Index Portfolio
n ING RussellTM Mid Cap Index Portfolio
n ING RussellTM Mid Cap Growth Index Portfolio
n ING RussellTM Small Cap Index Portfolio
Fixed-Income Index Portfolio
n ING U.S. Bond Index Portfolio
International/Global Equity Index Portfolios
n ING Euro STOXX 50® Index Portfolio
(formerly, ING Dow Jones Euro STOXX 50® Index Portfolio)
n ING FTSE 100 Index® Portfolio
n ING Hang Seng Index Portfolio
n ING International Index Portfolio
n ING Japan TOPIX Index Portfolio
(formerly, ING Japan Equity Index Portfolio)
n ING WisdomTreeSM Global High-Yielding Equity Index Portfolio
This report is submitted for general information to shareholders of the ING Funds. It is not authorized for distribution to prospective shareholders unless accompanied or preceded by a prospectus which includes details regarding the funds’ investment objectives, risks, charges, expenses and other information. This information should be read carefully. |
MUTUAL FUNDS |  |
|
TABLE OF CONTENTS
| President’s Letter | | | | | 2 | |
| Market Perspective | | | | | 3 | |
| Portfolio Managers’ Reports | | | | | 6 | |
| Shareholder Expense Examples | | | | | 32 | |
| Report of Independent Registered Public Accounting Firm | | | | | 34 | |
| Statements of Assets and Liabilities | | | | | 35 | |
| Statements of Operations | | | | | 43 | |
| Statements of Changes in Net Assets | | | | | 47 | |
| Financial Highlights | | | | | 54 | |
| Notes to Financial Statements | | | | | 59 | |
| Summary Portfolios of Investments | | | | | 80 | |
| Tax Information | | | | | 126 | |
| Director and Officer Information | | | | | 128 | |
| Advisory Contract Approval Discussion | | | | | 133 | |
PROXY VOTING INFORMATION
A description of the policies and procedures that the Portfolios use to determine how to vote proxies related to portfolio securities is available: (1) without charge, upon request by calling Shareholder Services toll-free at (800) 992-0180; (2) on the ING Funds’ website at www.ingfunds.com; and (3) on the U.S. Securities and Exchange Commission’s (“SEC”) website at www.sec.gov. Information regarding how the Portfolios voted proxies related to portfolio securities during the most recent 12-month period ended June 30 is available without charge on the ING Funds’ website at www.ingfunds.com and on the SEC’s website at www.sec.gov.
QUARTERLY PORTFOLIO HOLDINGS
The Portfolios file their complete schedule of portfolio holdings with the SEC for the first and third quarters of each fiscal year on Form N-Q. This report contains a summary portfolio of investments for certain Portfolios. The Portfolios’ Forms N-Q are available on the SEC’s website at www.sec.gov. The Portfolios’ Forms N-Q may be reviewed and copied at the SEC’s Public Reference Room in Washington, DC, and information on the operation of the Public Reference Room may be obtained by calling (800) SEC-0330. The Portfolios’ Forms N-Q, as well as a complete portfolio of investments, are available without charge upon request from the Portfolios by calling Shareholder Services toll-free at (800) 992-0180.
PRESIDENT’S LETTER
Dear Shareholder,
On January 25, 2011, President Obama delivered his second State of the Union address. He called on Americans to put aside partisan differences and harness the nation’s creativity to adapt and thrive in a rapidly changing global economy. The president’s challenge is timely: the United States is approaching a nexus of intermediate- and long-term concerns, and the choices we make over the next two years could determine the nation’s competitiveness in the global economy for decades to come.
There are reasons to be optimistic — the International Monetary Fund (“IMF”) predicts the U.S. economy will grow about 3% in 2011. China and India are expected to grow at about 9% and even the euro zone appears to be recovering from crisis; this growth, however, is being accompanied by mounting inflation pressures in certain regions, suggesting that many economies are expanding at unsustainable rates.
As I write this, the World Economic Forum is getting underway in Davos, Switzerland, and there are numerous concerns to deal with. Chief among them are the still-present risk of sovereign debt defaults in the euro zone; high unemployment and banking problems in the advanced economies; and inflationary pressures in emerging markets, especially with regard to food, fuel and commodities.
As we’ve noted before, uncertainty is a defining characteristic of our age and, in our opinion, is likely to remain so beyond this year. How should you respond within your investment portfolio? Remember that the most important consideration is your long-term goals, not the outlook for 2011. With investment hazards and opportunities everywhere, we believe it makes sense to cast as broad a net as possible around the globe. In our opinion, you want your portfolio to be well diversified so that it is not harmed too much by the trouble spots, and has some exposure to positive trends.
As always, we believe the best approach is a well-diversified portfolio and a well-defined investment plan. As we’ve noted many times before, it’s important to discuss any proposed changes thoroughly with your advisor before taking any action. Thank you for your continued confidence in ING Funds. We look forward to serving your investment needs in the future.
Shaun Mathews
President and Chief Executive Officer
ING Funds
January 26, 2011
The views expressed in the President’s Letter reflect those of the President as of the date of the letter. Any such views are subject to change at any time based upon market or other conditions and ING Funds disclaims any responsibility to update such views. These views may not be relied on as investment advice and because investment decisions for an ING Fund are based on numerous factors, may not be relied on as an indication of investment intent on behalf of any ING Fund. Reference to specific company securities should not be construed as recommendations or investment advice. Consider the fund’s investment objectives, risks, and charges and expenses carefully before investing. The prospectus contains this information and other information about the fund.
International investing poses special risks including currency fluctuation, economic and political risks not found in investments that are solely domestic.
2
MARKET PERSPECTIVE: YEAR ENDED DECEMBER 31, 2010
In our semi-annual report we described how, after a 13-month advance through mid-April, a confluence of local and world issues sent global equities, in the form of the MSCI World IndexSM measured in local currencies, including net reinvested dividends (“MSCI” for regions discussed below), reeling to a loss for the first half of the fiscal year. In the second half of the year, the MSCI World IndexSM bounced back and for 2010 returned 10.01%. (The MSCI World IndexSM returned 11.76% for the one year ended December 31, 2010, measured in U.S. dollars.) By year end, investor sentiment had turned distinctly positive, despite the grave concerns that remained.
It was a bumpy ride. Markets from stocks to bonds to currencies were continually buffeted by news and events relating to three main themes: the stuttering U.S. economic recovery, the sovereign debt crisis in the Eurozone and growth dynamics in China.
In the U.S., quarterly gross domestic product (“GDP”) growth decelerated from 2.7% (annualized) in the first quarter of 2010 to 1.7% in the second, before recovering to 2.6% in the third. But attention was focused more on employment and housing. The 18-month recession which ended in June of 2009 had cost some 8.7 million jobs. But since then, the unemployment rate had been stuck between 9.4% and 10.1%, barely dented by private sector new jobs averaging 107,000 per month as 2010 ended.
The other weakening link was housing. Sales of new and existing homes collapsed after the expiry in April of a program of tax credits for home buyers and languished thereafter. House prices (based on the S&P/Case-Shiller 20-City Composite Home Price Index), having shown annual increases from February, resumed a downward trend in October with the index still 30% below the peak recorded in April 2006.
To be sure, there were some grounds for optimism as 2010 drew to a close. Consumer spending had risen for five straight months. Investment in equipment and software was growing at double-digit annual percentage rates. On December 30, new unemployment claims were reported below 400,000 for the first time since July 2008. The Federal Reserve in November announced a second round of quantitative easing and would buy $600 billion in Treasury notes and bonds. The mixed mid-term election results forced a “compromise” stimulus package worth an estimated $858 billion for 2011. In combination, these two measures increased the attractiveness of riskier asset classes like equities at the expense of high grade bonds, which sold off.
In the Eurozone, after default was narrowly averted on Greece’s maturing bonds, the creation in May of a European Financial Stabilization “mechanism”, funded with up to €750 billion seemed to calm nerves for a while. But in October, attention turned to Ireland, where the Irish government had injected huge sums into local banks, rendering its own fiscal position untenable. The November 29, 2010 European Union/International Monetary Fund bail-out worth €67.5 billion left markets unimpressed. Suddenly it was May again with downgrades, soaring yields on peripheral Eurozone bonds, fears of contagion, falling stock markets and doubts about the viability of the euro itself. The European Central Bank aggressively bought sovereign bonds and the mood settled. But with Spain’s banks needing to refinance e85 billion of debt in 2011, the issue remains unresolved.
Investors watched nervously as China, the source of much of the world’s growth, wrestled with inflation, which reached 5.1% in November, and a housing bubble. The authorities tightened mortgage requirements, raised banks’ reserve ratio requirements six times in 2010 and interest rates twice in the last quarter. More interest rate increases seem inevitable.
In U.S. fixed income markets, the Barclays Capital U.S. Aggregate Bond Index of investment grade bonds returned 6.54% in 2010. A slight balance towards risk aversion in the first half gave way to improved risk appetite in the second. For the whole year, the Barclays Capital U.S. Treasury index returned 5.87%, underperforming the Barclays Capital Corporate Investment Grade Bond Index with a return of 9.00%, but both fell well short of the Barclays Capital High Yield Bond — 2% Issuer Constrained Composite Index which gained 14.94% for the one year period.
U.S. equities, represented by the S&P 500® Index including dividends, rose 15.06% in 2010, including its best September, a return of 8.92%, since 1939 and best December, a return of 6.68%, since 1991. Prices were supported by strong earnings reports, with operating earnings per share for S&P 500® companies recording four straight quarters of annual growth. Equities also benefited from improved risk appetite through the quantitative easing initiative and stimulus package referred to above.
In currencies, the worst of the gloom about the Eurozone in early June was replaced by renewed pessimism about the dollar in a stalling economy, before markets were seized by another bout of Eurozone angst. For the year, the dollar gained 8.15% against the euro and 2.95% against the pound, but lost 11.59% to the yen, which was sold in the market by the Bank of Japan after breaching 15-year high levels.
In international markets, the MSCI Japan® Index returned just 0.57% for the year after a strong last quarter, as quarterly GDP growth bounced back to 1.1% and the yen retreated from multi-year peaks. The tone of the market was generally poor with household spending fragile and consumer prices down for 21 months. The MSCI Europe ex UK® Index returned 4.84%, with Germany up 15.97% and Portugal, Italy, Ireland, Greece and Spain all falling. This broadly reflected the two-tier economy that has developed, with economic statistics favoring more soundly based countries at the expense of the peripherals. The MSCI UK® Index advanced 12.18%, despite the prospect of severe public spending cuts intended to eliminate an 11% budget deficit. Supporting sentiment was resilient, if perhaps temporary, quarterly GDP growth averaging 0.9% in the second half of the year.
Parentheses denote a negative number.
All indices are unmanaged and investors cannot invest directly in an index. Past performance does not guarantee future results. The performance quoted represents past performance. Investment return and principal value of an investment will fluctuate, and shares, when redeemed, may be worth more or less than their original cost. The Portfolios’ performance is subject to change since the period’s end and may be lower or higher than the performance data shown. Please call (800) 992-0180 or log on to www.ingfunds.com to obtain performance data current to the most recent month end.
Market Perspective reflects the views of ING’s Chief Investment Risk Officer only through the end of the period, and is subject to change based on market and other conditions.
3
BENCHMARK DESCRIPTIONS
| Index | | | | Description |
|---|
MSCI World IndexSM | | | | An unmanaged index that measures the performance of over 1,400 securities listed on exchanges in the U.S., Europe, Canada, Australia, New Zealand and the Far East. |
| S&P/Case-Shiller 20-City Composite Home Price Index | | | | A composite index of the home price index for the top 20 Metropolitan Statistical Areas in the United States. The index is published monthly by Standard & Poor’s. |
| Barclays Capital U.S. Aggregate Bond Index | | | | An unmanaged index of publicly issued investment grade U.S. Government, mortgage-backed, asset-backed and corporate debt securities. |
| Barclays Capital U.S. Treasury Index | | | | An unmanaged index that includes public obligations of the U.S. Treasury. Treasury bills, certain special issues, such as state and local government series bonds (SLGs), as well as U.S. Treasury TIPS and STRIPS, are excluded. |
| Barclays Capital Corporate Investment Grade Bond Index | | | | The corporate component of the Barclays Capital U.S. Credit Index. The U.S. Credit Index includes publicly-issued U.S. corporate and specified foreign debentures and secured notes that meet the specified maturity, liquidity, and quality requirements. The index includes both corporate and non-corporate sectors. The corporate sectors are industrial, utility and finance, which includes both U.S. and non-U.S. corporations. |
| Barclays Capital High Yield Bond — 2% Issuer Constrained Composite Index | | | | An unmanaged index that includes all fixed income securities having a maximum quality rating of Ba1, a minimum amount outstanding of $150 million, and at least one year to maturity. |
| S&P 500® Index | | | | An unmanaged index that measures the performance of securities of approximately 500 large-capitalization companies whose securities are traded on major U.S. stock markets. |
| MSCI Japan® Index | | | | A free float-adjusted market capitalization index that is designed to measure developed market equity performance in Japan. |
| MSCI Europe ex UK® Index | | | | A free float-adjusted market capitalization index that is designed to measure developed market equity performance in Europe, excluding the UK. |
| MSCI UK® Index | | | | A free float-adjusted market capitalization index that is designed to measure developed market equity performance in the UK. |
| Russell Top 200® Index | | | | An unmanaged index used to measure stock market performance composed of companies with a weighted average market value of approximately $630 million. |
| Russell Top 200® Growth Index | | | | Measures the performance of the especially large cap segment of the U.S. equity universe represented by stocks in the largest 200 by market cap that exhibit growth characteristics. It includes Russell Top 200® Index companies with higher price-to-book ratios and higher forecasted growth values. |
| Russell Top 200® Value Index | | | | Measures the performance of the especially large cap segment of the U.S. equity universe represented by stocks in the largest 200 by market cap that exhibit value characteristics. It includes Russell Top 200® Index companies with lower price-to-book ratios and lower forecasted growth values. |
| Russell Midcap® Index | | | | An unmanaged index that measures the performance of the 800 smallest companies in the Russell 1000® Index, which represents approximately 26% of the total market capitalization of the Russell 1000® Index. |
| Russell Midcap® Growth Index | | | | An unmanaged index that measures the performance of those companies included in the Russell Midcap® Index with relatively higher price-to-book ratios and higher forecasted growth values. |
| Russell 2000® Index | | | | An unmanaged index that measures the performance of securities of small U.S. companies. |
4
BENCHMARK DESCRIPTIONS (CONTINUED)
| Index | | | | Description |
|---|
| EURO STOXX 50® Index | | | | Covers 50 stocks from 12 Eurozone countries: Austria, Belgium, Finland, France, Germany, Greece, Ireland, Italy, Luxembourg, the Netherlands, Portugal and Spain. |
| FTSE 100 Index® | | | | A share index of the 100 most highly capitalized U.K. companies listed on the London Stock Exchange. |
| Hang Seng Index | | | | A free float-adjusted market capitalization-weighted stock market index in Hong Kong. |
| MSCI Europe, Australasia and Far East® Index | | | | An unmanaged index that measures the performance of securities listed on exchanges in Europe, Austalasia and the Far East. It includes the reinvestment of dividends net of withholding taxes, but does not reflect fees, brokerage commissions or other expenses of investing. |
| TOPIX Index | | | | A composite index for the Tokyo Stock Exchange tracking all domestic stocks from the first section of the exchange. |
WisdomTreeSM Global High-Yielding Equity Index | | | | A fundamentally weighted index that measures the performance of high dividend-yielding companies selected from the Wisdom Tree Global Dividend Index, which measures the performance of dividend-paying companies in the U.S., developed and emerging markets. |
5
ING RUSSELLTM LARGE CAP INDEX PORTFOLIO | | PORTFOLIO MANAGERS’ REPORT |
Industry Allocation
as of December 31, 2010
(as a percent of net assets) |
| Information Technology | | | | | 19.2 | % |
| Financials | | | | | 14.3 | % |
| Energy | | | | | 12.4 | % |
| Health Care | | | | | 11.7 | % |
| Consumer Staples | | | | | 10.8 | % |
| Industrials | | | | | 10.0 | % |
| Consumer Discretionary | | | | | 9.2 | % |
| Telecommunication Services | | | | | 3.3 | % |
| Materials | | | | | 3.2 | % |
| Utilities | | | | | 2.1 | % |
| Other Assets and Liabilities — Net* | | | | | 3.8 | % |
| Net Assets | | | | | 100.0 | % |
* Includes short-term investments related to Blackrock Liquidity Funds TempFund Portfolio — Class I and securities lending collateral. |
| |
Portfolio holdings are subject to change daily. |
ING RussellTM Large Cap Index Portfolio (the “Portfolio”) seeks investment results (before fees and expenses) that correspond to the total return of the Russell Top 200® Index. The Portfolio is managed by Vincent Costa, Portfolio Manager of ING Investment Management Co. (“ING IM”) — the Sub-Adviser.
Performance: For the year ended December 31, 2010, the Portfolio’s Class S shares provided a total return of 12.00% compared to the Russell Top 200® Index, which returned 12.47% for the same period.
Portfolio Specifics*: The Portfolio employs a “passive management” approach designed to track the performance of the Russell Top 200® Index. The Portfolio attempts to track the Russell Top 200® Index by investing all, or substantially all, of its assets in stocks that make up the Russell Top 200® Index. The Portfolio may not always hold all of the same securities as the Russell Top 200® Index.
All sectors of the benchmark posted positive returns in 2010, led by industrials and consumer discretionary. Utilities and health care were the poorest performers for the year.
Current Outlook & Strategy: In our opinion, the base-case scenario for 2011 is that the global economy continues to muddle through an unclear and ever-shifting environment. We believe the divergence between developed and emerging economies will continue, with the former continuing to rebuild while the latter increases its influence on the global stage. However, in our opinion, while the economic expansion is unlikely to feel strong to observers — particularly given recent experiences of more robust post-recession growth — it will be enough to grow earnings and to keep default rates for corporate borrowers low, supporting a variety of risky assets.
As such, we believe 2011 will be a positive year for equities, with performance driven by earnings growth, attractive valuations, abundant liquidity and a pickup in corporate spending. Top Ten Holdings*
as of December 31, 2010
(as a percent of net assets) |
| ExxonMobil Corp. | | | | | 3.9 | % |
| Apple, Inc. | | | | | 3.1 | % |
| Microsoft Corp. | | | | | 2.2 | % |
| General Electric Co. | | | | | 2.1 | % |
| International Business Machines Corp. | | | | | 2.0 | % |
| Procter & Gamble Co. | | | | | 2.0 | % |
| Chevron Corp. | | | | | 1.9 | % |
| AT&T, Inc. | | | | | 1.8 | % |
| Johnson & Johnson | | | | | 1.8 | % |
| JPMorgan Chase & Co. | | | | | 1.8 | % |
* Excludes short-term investments related to Blackrock Liquidity Funds TempFund Portfolio — Class I. |
| |
Portfolio holdings are subject to change daily. |
| * | | Please note that this discussion refers to the Portfolio’s gross performance versus the benchmark. Returns presented in the preceding paragraph refer to the Portfolio’s performance net of expenses. The benchmark does not incur expenses. An investor cannot invest directly in the benchmark. |
Portfolio holdings and characteristics are subject to change and may not be representative of current holdings and characteristics. The outlook for this Portfolio may differ from that presented for other ING Funds. Performance for the different classes of shares will vary based on differences in fees associated with each class.
PORTFOLIO MANAGERS’ REPORT | | ING RUSSELLTM LARGE CAP INDEX PORTFOLIO |
Average Annual Total Returns for the Periods Ended December 31, 2010
|
|
|---|
| | | | 1 Year
| | Since Inception
of Classes ADV, I and S
March 10, 2008
| | Since Inception
of Class S2
February 27, 2009
|
|---|
| |
| Class ADV | | | | | 11.74 | % | | | (0.06 | )% | | | — | |
| Class I | | | | | 12.19 | % | | | 0.44 | % | | | — | |
| Class S | | | | | 12.00 | % | | | 0.23 | % | | | — | |
| Class S2 | | | | | 11.60 | % | | | — | | | | 31.94 | % |
| Russell Top 200® Index | | | | | 12.47 | % | | | (0.68 | )%(1) | | | 33.75 | %(2) |
Based on a $10,000 initial investment, the graph and table above illustrate the total return of ING RussellTM Large Cap Index Portfolio against the index indicated. An index has no cash in its portfolio, imposes no sales charges and incurs no operating expenses. An investor cannot invest directly in an Index. The Portfolio’s performance is shown without the imposition of any expenses or charges which are, or may be, imposed under your annuity contract. Total returns would have been lower if such expenses or charges were included.
The performance graph and table do not reflect the deduction of taxes that a shareholder will pay on portfolio distributions or the redemption of portfolio shares.
The performance shown may include the effect of fee waivers and/ or expense reimbursements by the Investment Adviser and/or other service providers, which have the effect of increasing total return. Had all fees and expenses been considered, the total returns would have been lower.
The performance update illustrates performance for a variable investment option available through a variable annuity contract. The performance shown indicates past performance and is not a projection or prediction of future results. Actual investment returns and principal value will fluctuate so that shares and/or units, at redemption, may be worth more or less than their original cost. Please call (800) 992-0180 to get performance through the most recent month end.
It is important to note that the Portfolio has a limited operating history. Performance over a longer period of time may be more meaningful than short-term performance.
This report contains statements that may be “forward-looking” statements. Actual results may differ materially from those projected in the “forward-looking” statements.
The views expressed in this report reflect those of the portfolio managers, only through the end of the period as stated on the cover. The portfolio managers’ views are subject to change at any time based on market and other conditions.
Portfolio holdings are subject to change daily.
(1) | | Since inception performance for the index is shown from March 1, 2008. |
(2) | | Since inception performance for the index is shown from March 1, 2009. |
7
ING RUSSELLTM LARGE CAP GROWTH INDEX PORTFOLIO | | PORTFOLIO MANAGERS’ REPORT |
Industry Allocation
as of December 31, 2010
(as a percent of net assets) |
| Information Technology | | | | | 33.5 | % |
| Energy | | | | | 12.7 | % |
| Consumer Discretionary | | | | | 12.5 | % |
| Industrials | | | | | 12.1 | % |
| Consumer Staples | | | | | 11.1 | % |
| Health Care | | | | | 8.6 | % |
| Materials | | | | | 4.6 | % |
| Financials | | | | | 3.7 | % |
| Telecommunication Services | | | | | 0.4 | % |
| Other Assets and Liabilities — Net* | | | | | 0.8 | % |
| Net Assets | | | | | 100.0 | % |
* Includes short-term investments related to Blackrock Liquidity Funds TempFund Portfolio — Class I and securities lending collateral. |
| |
Portfolio holdings are subject to change daily. |
ING RussellTM Large Cap Growth Index Portfolio (the “Portfolio”) seeks investment results (before fees and expenses) that correspond to the total return of the Russell Top 200® Growth Index. The Portfolio is managed by Vincent Costa, Portfolio Manager of ING Investment Management Co. (“ING IM”) — the Sub-Adviser.
Performance: For the year ended December 31, 2010, the Portfolio’s Class S shares provided a total return of 12.47% compared to the Russell Top 200® Growth Index, which returned 13.21% for the same period.
Portfolio Specifics*: The Portfolio employs a “passive management” approach designed to track the performance of the Russell Top 200® Growth Index. The Portfolio attempts to track the Russell Top 200® Growth Index by investing all, or substantially all, of its assets in stocks that make up the Russell Top 200® Growth Index. The Portfolio may not always hold all of the same securities as the Russell Top 200® Growth Index.
Utilities was the only sector of the benchmark unable to generate a positive return for 2010; the sector consists of only two names — Exelon Corp. and NextEra Energy, Inc. — both of which saw negative returns for the year. Healthcare also struggled; flattish for the year, the sector was a drag on the benchmark’s return given its large weighting. The benchmark was led by the consumer discretionary and industrials sectors.
Current Outlook & Strategy: We believe the base-case scenario for 2011 is that the global economy continues to muddle through an unclear and ever-shifting environment. We believe the divergence between developed and emerging economies will continue, with the former continuing to rebuild while the latter increases its influence on the global stage. However, in our opinion, while the economic expansion is unlikely to feel strong to observers — particularly given recent experiences of more robust post-recession growth — it will be enough to grow earnings and to keep default rates for corporate borrowers low, supporting a variety of risky assets.
As such, we believe 2011 will be a positive year for equities, with performance driven by earnings growth, attractive valuations, abundant liquidity and a pickup in corporate spending. Top Ten Holdings
as of December 31, 2010
(as a percent of net assets) |
| ExxonMobil Corp. | | | | | 7.2 | % |
| Apple, Inc. | | | | | 6.2 | % |
| International Business Machines Corp. | | | | | 3.9 | % |
| Google, Inc. — Class A | | | | | 3.0 | % |
| Microsoft Corp. | | | | | 3.0 | % |
| Oracle Corp. | | | | | 2.5 | % |
| Cisco Systems, Inc. | | | | | 2.4 | % |
| Coca-Cola Co. | | | | | 2.2 | % |
| Schlumberger Ltd. | | | | | 2.1 | % |
| Hewlett-Packard Co. | | | | | 2.1 | % |
| |
Portfolio holdings are subject to change daily. |
| * | | Please note that this discussion refers to the Portfolio’s gross performance versus the benchmark. Returns presented in the preceding paragraph refer to the Portfolio’s performance net of expenses. The benchmark does not incur expenses. An investor cannot invest directly in the benchmark. |
Portfolio holdings and characteristics are subject to change and may not be representative of current holdings and characteristics. The outlook for this Portfolio may differ from that presented for other ING Funds. Performance for the different classes of shares will vary based on differences in fees associated with each class.
8
PORTFOLIO MANAGERS’ REPORT | | ING RUSSELLTM LARGE CAP GROWTH INDEX PORTFOLIO |
Average Annual Total Returns for the Periods Ended December 31, 2010
|
|
|---|
| | | | 1 Year
| | Since Inception
of Classes ADV, I and S
May 1, 2009
|
|---|
| |
| Class ADV | | | | | 12.18 | % | | | 24.27 | % |
| Class I | | | | | 12.80 | % | | | 24.86 | % |
| Class S | | | | | 12.47 | % | | | 24.52 | % |
| Russell Top 200® Growth Index | | | | | 13.21 | % | | | 26.04 | % |
Based on a $10,000 initial investment, the graph and table above illustrate the total return of ING RussellTM Large Cap Growth Index Portfolio against the index indicated. An index has no cash in its portfolio, imposes no sales charges and incurs no operating expenses. An investor cannot invest directly in an Index. The Portfolio’s performance is shown without the imposition of any expenses or charges which are, or may be, imposed under your annuity contract. Total returns would have been lower if such expenses or charges were included.
The performance graph and table do not reflect the deduction of taxes that a shareholder will pay on portfolio distributions or the redemption of portfolio shares.
The performance shown may include the effect of fee waivers and/ or expense reimbursements by the Investment Adviser and/or other service providers, which have the effect of increasing total return. Had all fees and expenses been considered, the total returns would have been lower.
The performance update illustrates performance for a variable investment option available through a variable annuity contract. The performance shown indicates past performance and is not a projection or prediction of future results. Actual investment returns and principal value will fluctuate so that shares and/or units, at redemption, may be worth more or less than their original cost. Please call (800) 992-0180 to get performance through the most recent month end.
It is important to note that the Portfolio has a limited operating history. Performance over a longer period of time may be more meaningful than short-term performance.
This report contains statements that may be “forward-looking” statements. Actual results may differ materially from those projected in the “forward-looking” statements.
The views expressed in this report reflect those of the portfolio managers, only through the end of the period as stated on the cover. The portfolio managers’ views are subject to change at any time based on market and other conditions.
Portfolio holdings are subject to change daily.
9
ING RUSSELLTM LARGE CAP VALUE INDEX PORTFOLIO | | PORTFOLIO MANAGERS’ REPORT |
Industry Allocation
as of December 31, 2010
(as a percent of net assets) |
| Financials | | | | | 26.7 | % |
| Health Care | | | | | 15.8 | % |
| Energy | | | | | 13.0 | % |
| Consumer Staples | | | | | 11.2 | % |
| Industrials | | | | | 8.4 | % |
| Telecommunication Services | | | | | 6.5 | % |
| Consumer Discretionary | | | | | 6.2 | % |
| Information Technology | | | | | 5.1 | % |
| Utilities | | | | | 4.4 | % |
| Materials | | | | | 2.0 | % |
| Other Assets and Liabilities — Net* | | | | | 0.7 | % |
| Net Assets | | | | | 100.0 | % |
* Includes short-term investments related to Blackrock Liquidity Funds TempFund Portfolio — Class I. |
| |
Portfolio holdings are subject to change daily. |
ING RussellTM Large Cap Value Index Portfolio (the “Portfolio”) seeks investment results (before fees and expenses) that correspond to the total return of the Russell Top 200® Value Index. The Portfolio is managed by Vincent Costa, Portfolio Manager of ING Investment Management Co. (“ING IM”) — the Sub-Adviser.
Performance: For the year ended December 31, 2010, the Portfolio’s Class S shares provided a total return of 11.13% compared to the Russell Top 200® Value Index, which returned 11.69% for the same period.
Portfolio Specifics*: The Portfolio employs a “passive management” approach designed to track the performance of the Russell Top 200® Value Index. The Portfolio attempts to track the Russell Top 200® Value Index by investing all, or substantially all, of its assets in stocks that make up the Russell Top 200® Value Index. The Portfolio may not always hold all of the same securities as the Russell Top 200® Value Index.
All sectors of the benchmark saw positive returns for the year. Industrials (led by Deere & Co. and Union Pacific Corp.) and energy (led by ConocoPhillips and Hess Corp.) were the top-performing sectors. Conversely, utilities delivered lackluster returns due to exposure to such stocks as FirstEnergy Corp. and Exelon Corp. Healthcare also posted weak returns, dragged down by such names as Boston Scientific Corp. and Zimmer Holdings, Inc.
Current Outlook & Strategy: In our opinion, the base-case scenario for 2011 is that the global economy continues to muddle through an unclear and ever-shifting environment. We believe the divergence between developed and emerging economies will continue, with the former continuing to rebuild while the latter increases its influence on the global stage. However, in our opinion, while the economic expansion is unlikely to feel strong to observers — particularly given recent experiences of more robust post-recession growth — it will be enough to grow earnings and to keep default rates for corporate borrowers low, supporting a variety of risky assets.
As such, we believe 2011 will be a positive year for equities, with performance driven by earnings growth, attractive valuations, abundant liquidity and a pickup in corporate spending. Top Ten Holdings
as of December 31, 2010
(as a percent of net assets) |
| Procter & Gamble Co. | | | | | 3.9 | % |
| AT&T, Inc. | | | | | 3.9 | % |
| Chevron Corp. | | | | | 3.9 | % |
| JPMorgan Chase & Co. | | | | | 3.8 | % |
| Wells Fargo & Co. | | | | | 3.4 | % |
| General Electric Co. | | | | | 3.4 | % |
| Johnson & Johnson | | | | | 3.3 | % |
| Pfizer, Inc. | | | | | 3.2 | % |
| Berkshire Hathaway, Inc. | | | | | 3.2 | % |
| Bank of America Corp. | | | | | 3.0 | % |
| | ||||||
Portfolio holdings are subject to change daily. |
| * | | Please note that this discussion refers to the Portfolio’s gross performance versus the benchmark. Returns presented in the preceding paragraph refer to the Portfolio’s performance net of expenses. The benchmark does not incur expenses. An investor cannot invest directly in the benchmark. |
Portfolio holdings and characteristics are subject to change and may not be representative of current holdings and characteristics. The outlook for this Portfolio may differ from that presented for other ING Funds. Performance for the different classes of shares will vary based on differences in fees associated with each class.
10
PORTFOLIO MANAGERS’ REPORT | | ING RUSSELLTM LARGE CAP VALUE INDEX PORTFOLIO |
Average Annual Total Returns for the Periods Ended December 31, 2010
|
|
|---|
| | | | 1 Year
| | Since Inception
of Classes ADV, I and S
May 1, 2009
|
|---|
| |
| Class ADV | | | | | 10.86 | % | | | 22.24 | % |
| Class I | | | | | 11.38 | % | | | 22.81 | % |
| Class S | | | | | 11.13 | % | | | 22.59 | % |
| Russell Top 200® Value Index | | | | | 11.69 | % | | | 23.93 | % |
Based on a $10,000 initial investment, the graph and table above illustrate the total return of ING RussellTM Large Cap Value Index Portfolio against the index indicated. An index has no cash in its portfolio, imposes no sales charges and incurs no operating expenses. An investor cannot invest directly in an Index. The Portfolio’s performance is shown without the imposition of any expenses or charges which are, or may be, imposed under your annuity contract. Total returns would have been lower if such expenses or charges were included.
The performance graph and table do not reflect the deduction of taxes that a shareholder will pay on portfolio distributions or the redemption of portfolio shares.
The performance shown may include the effect of fee waivers and/ or expense reimbursements by the Investment Adviser and/or other service providers, which have the effect of increasing total return. Had all fees and expenses been considered, the total returns would have been lower.
The performance update illustrates performance for a variable investment option available through a variable annuity contract. The performance shown indicates past performance and is not a projection or prediction of future results. Actual investment returns and principal value will fluctuate so that shares and/or units, at redemption, may be worth more or less than their original cost. Please call (800) 992-0180 to get performance through the most recent month end.
It is important to note that the Portfolio has a limited operating history. Performance over a longer period of time may be more meaningful than short-term performance.
This report contains statements that may be “forward-looking” statements. Actual results may differ materially from those projected in the “forward-looking” statements.
The views expressed in this report reflect those of the portfolio managers, only through the end of the period as stated on the cover. The portfolio managers’ views are subject to change at any time based on market and other conditions.
Portfolio holdings are subject to change daily.
11
ING RUSSELLTM MID CAP INDEX PORTFOLIO | | PORTFOLIO MANAGERS’ REPORT |
Industry Allocation
as of December 31, 2010
(as a percent of net assets) |
| Financials | | | | | 18.3 | % |
| Consumer Discretionary | | | | | 15.0 | % |
| Information Technology | | | | | 14.3 | % |
| Industrials | | | | | 12.8 | % |
| Health Care | | | | | 8.8 | % |
| Energy | | | | | 8.6 | % |
| Utilities | | | | | 6.2 | % |
| Materials | | | | | 6.0 | % |
| Consumer Staples | | | | | 5.9 | % |
| Telecommunication Services | | | | | 2.0 | % |
| Other Assets and Liabilities — Net* | | | | | 2.1 | % |
| Net Assets | | | | | 100.0 | % |
* Includes short-term investments related to Blackrock Liquidity Funds TempFund Portfolio — Class I and securities lending collateral. |
| |
Portfolio holdings are subject to change daily. |
ING RussellTM Mid Cap Index Portfolio (the “Portfolio”) seeks investment results (before fees and expenses) that correspond to the total return of the Russell Midcap® Index. The Portfolio is managed by Vincent Costa, Portfolio Manager of ING Investment Management Co. (“ING IM”) — the Sub-Adviser.
Performance: For the year ended December 31, 2010, the Portfolio’s Class S shares provided a total return of 24.88% compared to the Russell Midcap® Index, which returned 25.47% for the same period.
Portfolio Specifics*: The Portfolio employs a “passive management” approach designed to track the performance of the Russell Midcap® Index. The Portfolio attempts to track the Russell Midcap® Index by investing all, or substantially all, of its assets in stocks that make up the Russell Midcap® Index. The Portfolio may not always hold all of the same securities as the Russell Midcap® Index.
All sectors of the benchmark saw positive returns for the year. Consumer discretionary (led by Johnson Controls, Inc. and Carnival Corp.) and financials (led by U.S. Bancorp and Citigroup, Inc.) were the top-performing sectors. Performance in utilities was more restrained, as names like Firstenergy Corp. and Exelon Corp. detracted.
Current Outlook & Strategy: In our opinion, the base-case scenario for 2011 is that the global economy continues to muddle through an unclear and ever-shifting environment. We believe the divergence between developed and emerging economies will continue, with the former continuing to rebuild while the latter increases its influence on the global stage. However, in our opinion, while the economic expansion is unlikely to feel strong to observers — particularly given recent experiences of more robust post-recession growth — it will be enough to grow earnings and to keep default rates for corporate borrowers low, supporting a variety of risky assets.
As such, we believe 2011 will be a positive year for equities, with performance driven by earnings growth, attractive valuations, abundant liquidity and a pickup in corporate spending. Top Ten Holdings*
as of December 31, 2010
(as a percent of net assets) |
| Cummins, Inc. | | | | | 0.6 | % |
| Priceline.com, Inc. | | | | | 0.5 | % |
| NetApp, Inc. | | | | | 0.5 | % |
| Peabody Energy Corp. | | | | | 0.4 | % |
| Eaton Corp. | | | | | 0.4 | % |
| Weatherford International Ltd. | | | | | 0.4 | % |
| Coach, Inc. | | | | | 0.4 | % |
| T. Rowe Price Group, Inc. | | | | | 0.4 | % |
| Spectra Energy Corp. | | | | | 0.4 | % |
| Xerox Corp. | | | | | 0.4 | % |
* Excludes short-term investments related to Blackrock Liquidity Funds TempFund Portfolio — Class I and securities lending collateral. |
| |
Portfolio holdings are subject to change daily. |
| * | | Please note that this discussion refers to the Portfolio’s gross performance versus the benchmark. Returns presented in the preceding paragraph refer to the Portfolio’s performance net of expenses. The benchmark does not incur expenses. An investor cannot invest directly in the benchmark. |
Portfolio holdings and characteristics are subject to change and may not be representative of current holdings and characteristics. The outlook for this Portfolio may differ from that presented for other ING Funds. Performance for the different classes of shares will vary based on differences in fees associated with each class.
12
PORTFOLIO MANAGERS’ REPORT | | ING RUSSELLTM MID CAP INDEX PORTFOLIO |
Average Annual Total Returns for the Periods Ended December 31, 2010
|
|
|---|
| | | | 1 Year
| | Since Inception
of Classes ADV, I and S
March 10, 2008
| | Since Inception
of Class S2
February 27, 2009
|
|---|
| |
| Class ADV | | | | | 24.48 | % | | | 5.54 | % | | | — | |
| Class I | | | | | 25.22 | % | | | 6.07 | % | | | — | |
| Class S | | | | | 24.88 | % | | | 5.77 | % | | | — | |
| Class S2 | | | | | 24.49 | % | | | — | | | | 49.09 | % |
| Russell Midcap® Index | | | | | 25.47 | % | | | 4.40 | %(1) | | | 50.42 | %(2) |
Based on a $10,000 initial investment, the graph and table above illustrate the total return of ING RussellTM Mid Cap Index Portfolio against the index indicated. An index has no cash in its portfolio, imposes no sales charges and incurs no operating expenses. An investor cannot invest directly in an Index. The Portfolio’s performance is shown without the imposition of any expenses or charges which are, or may be, imposed under your annuity contract. Total returns would have been lower if such expenses or charges were included.
The performance graph and table do not reflect the deduction of taxes that a shareholder will pay on portfolio distributions or the redemption of portfolio shares.
The performance shown may include the effect of fee waivers and/or expense reimbursements by the Investment Adviser and/or other service providers, which have the effect of increasing total return. Had all fees and expenses been considered, the total returns would have been lower.
The performance update illustrates performance for a variable investment option available through a variable annuity contract. The performance shown indicates past performance and is not a projection or prediction of future results. Actual investment returns and principal value will fluctuate so that shares and/or units, at redemption, may be worth more or less than their original cost. Please call (800) 992-0180 to get performance through the most recent month end.
It is important to note that the Portfolio has a limited operating history. Performance over a longer period of time may be more meaningful than short-term performance.
This report contains statements that may be “forward-looking” statements. Actual results may differ materially from those projected in the “forward-looking” statements.
The views expressed in this report reflect those of the portfolio managers, only through the end of the period as stated on the cover. The portfolio managers’ views are subject to change at any time based on market and other conditions.
Portfolio holdings are subject to change daily.
(1) | | Since inception performance for the index is shown from March 1, 2008. |
(2) | | Since inception performance for the index is shown from March 1, 2009. |
13
ING RUSSELLTM MID CAP GROWTH INDEX PORTFOLIO | | PORTFOLIO MANAGERS’ REPORT |
Industry Allocation
as of December 31, 2010
(as a percent of net assets) |
| Information Technology | | | | | 22.0 | % |
| Consumer Discretionary | | | | | 18.9 | % |
| Industrials | | | | | 15.1 | % |
| Health Care | | | | | 12.2 | % |
| Financials | | | | | 6.6 | % |
| Materials | | | | | 6.5 | % |
| Energy | | | | | 5.7 | % |
| Consumer Staples | | | | | 4.8 | % |
| Telecommunication Services | | | | | 1.8 | % |
| Utilities | | | | | 0.3 | % |
| Other Assets and Liabilities — Net* | | | | | 6.1 | % |
| Net Assets | | | | | 100.0 | % |
* Includes short-term investments related to Blackrock Liquidity Funds TempFund Portfolio — Class I and securities lending collateral. |
| |
Portfolio holdings are subject to change daily. |
ING RussellTM Mid Cap Growth Index Portfolio (the “Portfolio”) seeks investment results (before fees and expenses) that correspond to the total return of the Russell Midcap® Growth Index. The Portfolio is managed by Vincent Costa, Portfolio Manager of ING Investment Management Co. (“ING IM”) — the Sub-Adviser.
Performance: For the year ended December 31, 2010, the Portfolio’s Class S shares provided a total return of 25.85% compared to the Russell Midcap® Growth Index, which returned 26.38% for the same period.
Portfolio Specifics*: The Portfolio employs a “passive management” approach designed to track the performance of the Russell Midcap® Growth Index. The Portfolio attempts to track the Russell Midcap® Growth Index by investing all, or substantially all, of its assets in stocks that make up the Russell Midcap® Growth Index. The Portfolio may not always hold all of the same securities as the Russell Midcap® Growth Index.
Of the ten sectors in the benchmark, nine saw positive returns for the year, led by consumer discretionary and industrials. Within consumer discretionary, the automobiles and retailing industries were strong, while capital goods and transportation contributed significantly to the success of industrials. Utilities was the only negative sector, as stocks such as AES Corp. and Ormat Technologies, Inc. were down sharply.
Current Outlook & Strategy: We believe the base-case scenario for 2011 is that the global economy continues to muddle through an unclear and ever-shifting environment. We believe the divergence between developed and emerging economies will continue, with the former continuing to rebuild while the latter increases its influence on the global stage. However, in our opinion, while the economic expansion is unlikely to feel strong to observers — particularly given recent experiences of more robust post-recession growth — it will be enough to grow earnings and to keep default rates for corporate borrowers low, supporting a variety of risky assets.
As such, we believe 2011 will be a positive year for equities, with performance driven by earnings growth, attractive valuations, abundant liquidity and a pickup in corporate spending. Top Ten Holdings*
as of December 31, 2010
(as a percent of net assets) |
| Cummins, Inc. | | | | | 1.1 | % |
| Priceline.com, Inc. | | | | | 0.9 | % |
| NetApp, Inc. | | | | | 0.9 | % |
| Coach, Inc. | | | | | 0.8 | % |
| T. Rowe Price Group, Inc. | | | | | 0.8 | % |
| Salesforce.com, Inc. | | | | | 0.8 | % |
| Agilent Technologies, Inc. | | | | | 0.7 | % |
| Intuit, Inc. | | | | | 0.7 | % |
| Marsh & McLennan Cos., Inc. | | | | | 0.7 | % |
| CH Robinson Worldwide, Inc. | | | | | 0.7 | % |
* Excludes short-term investments related to Blackrock Liquidity Funds TempFund Portfolio — Class I and securities lending collateral. |
| |
Portfolio holdings are subject to change daily. |
| * | | Please note that this discussion refers to the Portfolio’s gross performance versus the benchmark. Returns presented in the preceding paragraph refer to the Portfolio’s performance net of expenses. The benchmark does not incur expenses. An investor cannot invest directly in the benchmark. |
Portfolio holdings and characteristics are subject to change and may not be representative of current holdings and characteristics. The outlook for this Portfolio may differ from that presented for other ING Funds. Performance for the different classes of shares will vary based on differences in fees associated with each class.
14
PORTFOLIO MANAGERS’ REPORT | | ING RUSSELLTM MID CAP GROWTH INDEX PORTFOLIO |
Average Annual Total Returns for the Periods Ended December 31, 2010
|
|
|---|
| | | | 1 Year
| | Since Inception
of Classes ADV, I, S and S2
May 1, 2009
|
|---|
| |
| Class ADV | | | | | 25.52 | % | | | 34.79 | % |
| Class I | | | | | 26.22 | % | | | 35.42 | % |
| Class S | | | | | 25.85 | % | | | 35.12 | % |
| Class S2 | | | | | 25.71 | % | | | 34.91 | % |
| Russell Midcap® Growth Index | | | | | 26.38 | % | | | 36.28 | % |
Based on a $10,000 initial investment, the graph and table above illustrate the total return of ING RussellTM MidCap Growth Index Portfolio against the index indicated. An index has no cash in its portfolio, imposes no sales charges and incurs no operating expenses. An investor cannot invest directly in an Index. The Portfolio’s performance is shown without the imposition of any expenses or charges which are, or may be, imposed under your annuity contract. Total returns would have been lower if such expenses or charges were included.
The performance graph and table do not reflect the deduction of taxes that a shareholder will pay on portfolio distributions or the redemption of portfolio shares.
The performance shown may include the effect of fee waivers and/or expense reimbursements by the Investment Adviser and/or other service providers, which have the effect of increasing total return. Had all fees and expenses been considered, the total returns would have been lower.
The performance update illustrates performance for a variable investment option available through a variable annuity contract. The performance shown indicates past performance and is not a projection or prediction of future results. Actual investment returns and principal value will fluctuate so that shares and/or units, at redemption, may be worth more or less than their original cost. Please call (800) 992-0180 to get performance through the most recent month end.
It is important to note that the Portfolio has a limited operating history. Performance over a longer period of time may be more meaningful than short-term performance.
This report contains statements that may be “forward-looking” statements. Actual results may differ materially from those projected in the “forward-looking” statements.
The views expressed in this report reflect those of the portfolio managers, only through the end of the period as stated on the cover. The portfolio managers’ views are subject to change at any time based on market and other conditions.
Portfolio holdings are subject to change daily.
15
ING RUSSELLTM SMALL CAP INDEX PORTFOLIO | | PORTFOLIO MANAGERS’ REPORT |
Industry Allocation
as of December 31, 2010
(as a percent of net assets) |
| Financials | | | | | 20.1 | % |
| Information Technology | | | | | 18.2 | % |
| Industrials | | | | | 15.9 | % |
| Consumer Discretionary | | | | | 13.7 | % |
| Health Care | | | | | 11.9 | % |
| Energy | | | | | 6.1 | % |
| Materials | | | | | 5.6 | % |
| Utilities | | | | | 3.1 | % |
| Consumer Staples | | | | | 3.0 | % |
| Telecommunication Services | | | | | 1.0 | % |
| Closed-End Funds | | | | | 0.0 | % |
| Other Assets and Liabilities — Net* | | | | | 1.4 | % |
| Net Assets | | | | | 100.0 | % |
* Includes short-term investments related to Blackrock Liquidity Funds TempFund Portfolio — Class I and securities lending collateral. |
| |
Portfolio holdings are subject to change daily. |
ING RussellTM Small Cap Index Portfolio (the “Portfolio”) seeks investment results (before fees and expenses) that correspond to the total return of the Russell 2000® Index. The Portfolio is managed by Vincent Costa, Portfolio Manager of ING Investment Management Co. (“ING IM”) — the Sub-Adviser.
Performance: For the year ended December 31, 2010, the Portfolio’s Class S shares provided a total return of 26.07% compared to the Russell 2000® Index, which returned 26.85% for the same period.
Portfolio Specifics*: The Portfolio employs a “passive management” approach designed to track the performance of the Russell 2000® Index. The Portfolio attempts to track the Russell 2000® Index by investing all, or substantially all, of its assets in stocks that make up the Russell 2000® Index. The Portfolio may not always hold all of the same securities as the Russell 2000® Index.
All sectors saw positive returns for the year. Information technology and industrials led the outperformance returning +34% and +30%, respectively. Within information technology, computer peripherals and software were the best performing industries. Within industrials, machinery and electrical equipment posted stellar returns. Utilities and telecommunications stocks were the smallest contributors, despite their double-digit returns, exemplifying the benchmark’s strength.
Current Outlook & Strategy: As we close the chapter on another year, we are pleased with the progress and amazed at the stark differences in the overall environment compared with a mere 12 months ago. We believe economic depression worries have abated, stock markets around the world have rallied and signs of an early upswing are plentiful.
We remain cautiously optimistic, however, particularly regarding the outlook for the developed world as we forecast past mid-year. As growth from the inventory cycle and government stimulus fades, we will continue to confront issues that will ultimately shape the direction and magnitude of the recovery. We believe employment is the key driver of a sustained recovery; additionally, credit creation must provide the fuel for growth.
Top Ten Holdings*
as of December 31, 2010
(as a percent of net assets) |
| Riverbed Technology, Inc. | | | | | 0.4 | % |
| Verifone Holdings, Inc. | | | | | 0.3 | % |
| TIBCO Software, Inc. | | | | | 0.3 | % |
| Rackspace Hosting, Inc. | | | | | 0.3 | % |
| Brigham Exploration Co. | | | | | 0.3 | % |
| Deckers Outdoor Corp. | | | | | 0.3 | % |
| Nordson Corp. | | | | | 0.3 | % |
| Sotheby’s | | | | | 0.3 | % |
| Baldor Electric Co. | | | | | 0.3 | % |
| Solutia, Inc. | | | | | 0.3 | % |
* Excludes short-term investments related to Blackrock Liquidity Funds TempFund Portfolio — Class I and securities lending collateral. |
| |
Portfolio holdings are subject to change daily. |
| * | | Please note that this discussion refers to the Portfolio’s gross performance versus the benchmark. Returns presented in the preceding paragraph refer to the Portfolio’s performance net of expenses. The benchmark does not incur expenses. An investor cannot invest directly in the benchmark. |
Portfolio holdings and characteristics are subject to change and may not be representative of current holdings and characteristics. The outlook for this Portfolio may differ from that presented for other ING Funds. Performance for the different classes of shares will vary based on differences in fees associated with each class.
16
PORTFOLIO MANAGERS’ REPORT | | ING RUSSELLTM SMALL CAP INDEX PORTFOLIO |
Average Annual Total Returns for the Periods Ended December 31, 2010
|
|
|---|
| | | | 1 Year
| | Since Inception
of Classes ADV, I and S
March 10, 2008
| | Since Inception
of Class S2
February 27, 2009
|
|---|
| |
| Class ADV | | | | | 25.77 | % | | | 7.87 | % | | | — | |
| Class I | | | | | 26.43 | % | | | 8.37 | % | | | — | |
| Class S | | | | | 26.07 | % | | | 8.06 | % | | | — | |
| Class S2 | | | | | 25.81 | % | | | — | | | | 46.98 | % |
| Russell 2000® Index | | | | | 26.85 | % | | | 6.35 | %(1) | | | 48.56 | %(2) |
Based on a $10,000 initial investment, the graph and table above illustrate the total return of ING RussellTM Small Cap Index Portfolio against the index indicated. An index has no cash in its portfolio, imposes no sales charges and incurs no operating expenses. An investor cannot invest directly in an Index. The Portfolio’s performance is shown without the imposition of any expenses or charges which are, or may be, imposed under your annuity contract. Total returns would have been lower if such expenses or charges were included.
The performance graph and table do not reflect the deduction of taxes that a shareholder will pay on portfolio distributions or the redemption of portfolio shares.
The performance shown may include the effect of fee waivers and/or expense reimbursements by the Investment Adviser and/or other service providers, which have the effect of increasing total return. Had all fees and expenses been considered, the total returns would have been lower.
The performance update illustrates performance for a variable investment option available through a variable annuity contract. The performance shown indicates past performance and is not a projection or prediction of future results. Actual investment returns and principal value will fluctuate so that shares and/or units, at redemption, may be worth more or less than their original cost. Please call (800) 992-0180 to get performance through the most recent month end.
It is important to note that the Portfolio has a limited operating history. Performance over a longer period of time may be more meaningful than short-term performance.
This report contains statements that may be “forward-looking” statements. Actual results may differ materially from those projected in the “forward-looking” statements.
The views expressed in this report reflect those of the portfolio manager, only through the end of the period as stated on the cover. The portfolio manager’s views are subject to change at any time based on market and other conditions.
Portfolio holdings are subject to change daily.
(1) | | Since inception performance for the index is shown from March 1, 2008. |
(2) | | Since inception performance for the index is shown from March 1, 2009. |
17
ING U.S. BOND INDEX PORTFOLIO | | PORTFOLIO MANAGERS’ REPORT |
Industry Allocation
as of December 31, 2010
(as a percent of net assets) |
| U.S. Government Agency Obligations | | | | | 39.0 | % |
| U.S. Treasury Obligations | | | | | 32.6 | % |
| Corporate Bonds/Notes | | | | | 23.4 | % |
| Collateralized Mortgage Obligations | | | | | 3.0 | % |
| Municipal Bonds | | | | | 0.2 | % |
| Other Bonds | | | | | 0.2 | % |
| Other Assets and Liabilities — Net* | | | | | 1.6 | % |
| Net Assets | | | | | 100.0 | % |
* Includes short-term investments related to Blackrock Liquidity Funds TempFund Portfolio — Class I, securities lending collateral, U.S. government agency obligation and U.S. Treasury Bill. |
| |
Portfolio holdings are subject to change daily. |
ING U.S. Bond Index Portfolio (the “Portfolio”) seeks investment results (before fees and expenses) that correspond to the total return of the Barclays Capital U.S. Aggregate Bond Index. The Portfolio is managed by Andrew A. Johnson, Managing Director, and Tracy L. Gage, Senior Vice President, of Neuberger Berman Fixed Income LLC — the Sub-Adviser.
Performance: For the year ended December 31, 2010, the Portfolio’s Class I shares provided a total return of 6.14% compared to the Barclays Capital U.S. Aggregate Bond Index, which returned 6.54% for the same period.
Portfolio Specifics*: In 2010, the fixed income markets took another step toward eradicating the harsh memory of the 2008 credit crisis. Even though market volatility and increased risk aversion returned at times, for the year as a whole, a number of spread sectors (non-Treasuries) again outperformed equal duration Treasuries, while others produced strong absolute results. Supporting the credit markets were signs that the economy was gaining enough momentum to avert a double-dip recession, as well as continued policy accommodation by the Federal Reserve. Additionally, benign inflation, better than expected corporate profits and generally strong demand from investors seeking to generate incremental yield boosted the credit markets.
While the U.S. economy continued to expand in 2010, the pace of the recovery was less robust than previous periods exiting a severe recession. This was due, in part, to continued high unemployment and ongoing strains in the housing market. During the first quarter of 2010, the Commerce Department reported that gross domestic product (“GDP”) growth was 3.7%. While this was less than the previous quarter’s 5.0% expansion, it represented a solid reading. However, the economy then grew 1.7% and 2.6% in the second and third quarters, respectively. While the initial estimate for fourth quarter GDP will not be released until late January 2011, the economy is expected to have grown for a sixth consecutive quarter.
Keeping with the mandate, throughout the fiscal year we employ a risk-constrained investment strategy that maintains a neutral duration position, yield curve structure, and sector structure relative to the benchmark. However, we do have discretion to seek added value through issue selection. Examples of corporate bond holdings that benefited results during the year were Citigroup, Inc. and Kraft Food, Inc. In contrast, Anadarko and Arcelor Mittal detracted from performance. Top Ten Holdings*
as of December 31, 2010
(as a percent of net assets) |
| U.S. Treasury Note, 1.375%, due 03/15/13 | | | | | 3.0 | % |
| U.S. Treasury Note, 1.875%, due 04/30/14 | | | | | 3.0 | % |
| U.S. Treasury Note, 2.375%, due 03/31/16 | | | | | 2.9 | % |
| U.S. Treasury Note, 1.375%, due 05/15/12 | | | | | 2.3 | % |
| U.S. Treasury Note, 0.500%, due 10/15/13 | | | | | 2.3 | % |
| U.S. Treasury Note, 3.500%, due 02/15/39 | | | | | 1.9 | % |
| U.S. Treasury Note, 1.125%, due 01/15/12 | | | | | 1.6 | % |
Federal National Mortgage Association, 4.000%,
due 08/25/40 | | | | | 1.5 | % |
Federal National Mortgage Association, 4.500%,
due 01/25/39 | | | | | 1.5 | % |
Federal National Mortgage Association, 5.000%,
due 01/13/40 | | | | | 1.4 | % |
* Excludes short-term investments related to Blackrock Liquidity Funds TempFund Portfolio — Class I, securities lending collateral, U.S. government agency obligation and U.S. Treasury Bill. |
| |
Portfolio holdings are subject to change daily. |
Current Strategy and Outlook: We believe that the economy has enough momentum to avoid a double-dip recession and that relatively low interest rates will help the economy continue its recovery. Low rates should also help corporations enjoy low borrowing costs and may spur an increase in home refinancing, which would put extra money in consumers’ pockets. In addition, we believe the “shadow” stimulus of the extension of the Bush-era tax cuts and payroll tax deduction could serve to support consumer spending, which accounts for roughly 70% of GDP. While we believe we will see positive growth in 2011, it could remain below average versus other periods coming out of a severe economic downturn. Against a backdrop of positive economic growth and low inflation, our outlook is for the spread sectors to continue to outperform equal-duration Treasuries in 2011. We also envision spread narrowing amid an environment characterized by overall strong investor demand. That said, our view is that spread sector excess returns versus Treasuries are not likely to be as large as during the past two years.
| * | | Please note that this discussion refers to the Portfolio’s gross performance versus the benchmark. Returns presented in the preceding paragraph refer to the Portfolio’s performance net of expenses. The benchmark does not incur expenses. An investor cannot invest directly in the benchmark. |
Portfolio holdings and characteristics are subject to change and may not be representative of current holdings and characteristics. The outlook for this Portfolio may differ from that presented for other ING Funds. Performance for the different classes of shares will vary based on differences in fees associated with each class.
18
PORTFOLIO MANAGERS’ REPORT | | ING U.S. BOND INDEX PORTFOLIO |
Average Annual Total Returns for the Periods Ended December 31, 2010
|
|
|---|
| | | | 1 Year
| | Since Inception
of Class I
March 7, 2008
| | Since Inception
of Classes ADV and S
March 10, 2008
| | Since Inception
of Class S2
February 27, 2009
|
|---|
| |
| Class ADV | | | | | 5.58 | % | | | — | | | | 5.03 | % | | | — | |
| Class I | | | | | 6.14 | % | | | 5.55 | % | | | — | | | | — | |
| Class S | | | | | 5.89 | % | | | — | | | | 5.24 | % | | | — | |
| Class S2 | | | | | 5.78 | % | | | — | | | | — | | | | 6.81 | % |
| Barclays Capital U.S. Aggregate Bond Index | | | | | 6.54 | % | | | 5.59 | %(1) | | | 5.59 | %(1) | | | 7.56%(2 | ) |
Based on a $10,000 initial investment, the graph and table above illustrate the total return of ING U.S. Bond Index Portfolio against the index indicated. An index has no cash in its portfolio, imposes no sales charges and incurs no operating expenses. An investor cannot invest directly in an index. The Portfolio’s performance is shown without the imposition of any expenses or charges which are, or may be, imposed under your annuity contract. Total returns would have been lower if such expenses or charges were included.
The performance graph and table do not reflect the deduction of taxes that a shareholder will pay on portfolio distributions or the redemption of portfolio shares.
The performance shown may include the effect of fee waivers and/or expense reimbursements by the Investment Adviser and/or other service providers, which have the effect of increasing total return. Had all fees and expenses been considered, the total returns would have been lower.
The performance update illustrates performance for a variable investment option available through a variable annuity contract. The performance shown indicates past performance and is not a projection or prediction of future results. Actual investment returns and principal value will fluctuate so that shares and/or units, at redemption, may be worth more or less than their original cost. Please call (800) 992-0180 to get performance through the most recent month end.
It is important to note that the Portfolio has a limited operating history. Performance over a longer period of time may be more meaningful than short-term performance.
This report contains statements that may be “forward-looking” statements. Actual results may differ materially from those projected in the “forward-looking” statements.
The views expressed in this report reflect those of the portfolio managers, only through the end of the period as stated on the cover. The portfolio managers’ views are subject to change at any time based on market and other conditions.
Portfolio holdings are subject to change daily.
(1) | | Since inception performance for the index is shown from March 1, 2008. |
(2) | | Since inception performance for the index is shown from March 1, 2009. |
19
ING EURO STOXX 50® INDEX PORTFOLIO | | PORTFOLIO MANAGERS’ REPORT |
Industry Allocation
as of December 31, 2010
(as a percent of net assets) |
| Financials | | | | | 26.7 | % |
| Industrials | | | | | 11.2 | % |
| Utilities | | | | | 9.4 | % |
| Energy | | | | | 9.0 | % |
| Telecommunication Services | | | | | 8.6 | % |
| Consumer Staples | | | | | 8.4 | % |
| Consumer Discretionary | | | | | 7.6 | % |
| Materials | | | | | 7.5 | % |
| Health Care | | | | | 6.3 | % |
| Information Technology | | | | | 4.1 | % |
| Other Assets and Liabilities — Net* | | | | | 1.2 | % |
| Net Assets | | | | | 100.0 | % |
* Includes short-term investments related to securities lending collateral. |
| |
Portfolio holdings are subject to change daily. |
ING EURO STOXX 50® Index Portfolio (the “Portfolio”) seeks investment results (before fees and expenses) that correspond to the total return of the EURO STOXX 50® Index. The Portfolio is managed by Vincent Costa, Portfolio Manager of ING Investment Management Co. (“ING IM”) — the Sub-Adviser.
Performance*: For the year ended December 31, 2010, the Portfolio’s Class I shares provided a total return of (8.64)% compared to the EURO STOXX 50® Index, which returned (9.13)% for the same period.
Portfolio Specifics**: The Portfolio employs a “passive management” approach designed to track the performance of the EURO STOXX 50® Index. The Portfolio attempts to track the EURO STOXX 50® Index by investing all, or substantially all, of its assets in stocks that make up the EURO STOXX 50® Index. The Portfolio may not always hold all of the same securities as the EURO STOXX 50® Index.
Of the benchmark’s ten sectors, six experienced negative returns in 2010. Financials, the largest sector within the benchmark, was the worst performer, dragged down by stocks such as Banco Santander, S.A. and Banco Bilboa Vizcaya Argentaria. Utilities followed closely behind financials, with names such as E.ON AG and RWE AG underperforming significantly. While industrials and consumer discretionary posted impressive returns, they were not enough to bring the index into positive territory for the year.
Current Outlook and Strategy: We believe the base-case scenario for 2011 is that the global economy continues to muddle through an unclear and ever-shifting environment. We believe the divergence between developed and emerging economies will continue, with the former continuing to rebuild while the latter increases its influence on the global stage. However, in our opinion, while the economic expansion is unlikely to feel strong to observers — particularly given recent experiences of more robust post-recession growth — it will be enough to grow earnings and to keep default rates for corporate borrowers low, supporting a variety of risky assets.
As such, we believe 2011 will be a positive year for equities, with performance driven by earnings growth, attractive valuations, abundant liquidity and a pickup in corporate spending. Top Ten Holdings
as of December 31, 2010
(as a percent of net assets) |
| Total S.A. | | | | | 5.5 | % |
| Siemens AG | | | | | 5.1 | % |
| Telefonica S.A. | | | | | 4.2 | % |
| Banco Santander Central Hispano S.A. | | | | | 4.1 | % |
| BASF AG | | | | | 3.5 | % |
| Sanofi-Aventis | | | | | 3.4 | % |
| BNP Paribas | | | | | 3.0 | % |
| Bayer AG | | | | | 2.9 | % |
| E.ON AG | | | | | 2.9 | % |
| DaimlerChrysler AG | | | | | 2.9 | %�� |
Portfolio holdings are subject to change daily.
|
| * | | The Portfolio’s return may at times appear to diverge from the return of its benchmark index more than would be expected. These divergences may, in part, be the result of fair-value pricing adjustments to certain foreign securities as well as other pricing policies. In accordance with the Portfolio’s Valuation Policy, fair-value pricing adjustments may be used to address pricing discrepancies that arise due to time-zone differences. Foreign securities may trade on exchanges that close many hours before the Portfolio’s closing share price is calculated in the United States, generally at 4 p.m., Eastern Time. In the hours between the foreign close and the U.S. close, the value of these foreign securities may change — because of company specific announcements or marketwide developments. Such price changes are not immediately reflected in international index values. Fair-value pricing takes such changes into account in calculating the Portfolio’s daily net asset value (“NAV”), so that the NAV doesn’t include “stale” prices. The result can be a temporary divergence between the return of the Portfolio and that of its benchmark index. The Portfolio also translates local prices to USD using foreign exchange rates at the time the NAV is calculated whereas the index does not.
|
| ** | | Please note that this discussion refers to the Portfolio’s gross performance versus the benchmark. Returns presented in the preceding paragraph refer to the Portfolio’s performance net of expenses. The benchmark does not incur expenses. An investor cannot invest directly in the benchmark. |
Portfolio holdings and characteristics are subject to change and may not be representative of current holdings and characteristics. The outlook for this Portfolio may differ from that presented for other ING Funds. Performance for the different classes of shares will vary based on differences in fees associated with each class.
20
PORTFOLIO MANAGERS’ REPORT | | ING EURO STOXX 50® INDEX PORTFOLIO |
Average Annual Total Returns for the Periods Ended December 31, 2010
|
|
|---|
| | | | 1 Year
| | Since Inception
of Classes ADV and I
August 17, 2009
|
|---|
| |
| Class ADV | | | | | (9.13 | )% | | | 4.11 | % |
| Class I | | | | | (8.64 | )% | | | 4.71 | % |
| EURO STOXX 50® Index | | | | | (9.13 | )% | | | 1.81 | % |
Based on a $10,000 initial investment, the graph and table above illustrate the total return of ING Dow Jones Euro STOXX 50® Index Portfolio against the index indicated. An index has no cash in its portfolio, imposes no sales charges and incurs no operating expenses. An investor cannot invest directly in an Index. The Portfolio’s performance is shown without the imposition of any expenses or charges which are, or may be, imposed under your annuity contract. Total returns would have been lower if such expenses or charges were included.
The performance graph and table do not reflect the deduction of taxes that a shareholder will pay on portfolio distributions or the redemption of portfolio shares.
The performance shown include the effect of fee waivers and/or expense reimbursements by the Investment Adviser and/or other service providers, which have the effect of increasing total return. Had all fees and expenses been considered, the total returns would have been lower.
The performance update illustrate performance for a variable investment option available through a variable annuity contract. The performance shown indicates past performance and is not a projection or prediction of future results. Actual investment returns and principal value will fluctuate so that shares and/or units, at redemption, may be worth more or less than their original cost. Please call (800) 992-0180 to get performance through the most recent month end.
It is important to note that the Portfolio has a limited operating history. Performance over a longer period of time may be more meaningful than short-term performance.
This report contains statements that may be “forward-looking” statements. Actual results may differ materially from those projected in the “forward-looking” statements.
The views expressed in this report reflect those of the portfolio managers, only through the end of the period as stated on the cover. The portfolio managers’ views are subject to change at any time based on market and other conditions.
Portfolio holdings are subject to change daily.
21
ING FTSE 100 INDEX® PORTFOLIO | | PORTFOLIO MANAGERS’ REPORT |
Industry Allocation
as of December 31, 2010
(as a percent of net assets) |
| Financials | | | | | 20.0 | % |
| Energy | | | | | 18.8 | % |
| Materials | | | | | 15.5 | % |
| Consumer Staples | | | | | 14.7 | % |
| Health Care | | | | | 7.8 | % |
| Telecommunication Services | | | | | 6.8 | % |
| Consumer Discretionary | | | | | 5.4 | % |
| Industrials | | | | | 4.8 | % |
| Utilities | | | | | 4.0 | % |
| Information Technology | | | | | 0.8 | % |
| Closed-End Funds | | | | | 0.1 | % |
| Other Assets and Liabilities — Net* | | | | | 1.3 | % |
| Net Assets | | | | | 100.0 | % |
* Includes short-term investments related to securities lending collateral. |
| |
Portfolio holdings are subject to change daily. |
ING FTSE 100 Index® Portfolio (the “Portfolio”) seeks investment results (before fees and expenses) that correspond to the total return of the FTSE 100 Index®. The Portfolio is managed by Vincent Costa, Portfolio Manager of ING Investment Management Co. (“ING IM”) — the Sub-Adviser.
Performance*: For the year ended December 31, 2010, the Portfolio’s Class I shares provided a total return of 9.43% compared to the FTSE 100 Index®, which returned 9.19% for the same period.
Portfolio Specifics**: The Portfolio employs a “passive management” approach designed to track the performance of the FTSE 100 Index®. The Portfolio attempts to track the FTSE 100 Index® by investing all, or substantially all, of its assets in stocks that make up the FTSE 100 Index®. The Portfolio may not always hold all of the same securities as the FTSE 100 Index®.
All sectors posted a positive return for the year. Information technology led the way on an absolute basis, while the materials sector was the largest contributor to the benchmark’s return, followed closely by staples and telecom. Energy, which accounts for nearly 20% of the benchmark, struggled and was the lowest contributing sector within the index. Healthcare was similarly challenged.
Current Outlook and Strategy: We believe the base-case scenario for 2011 is that the global economy continues to muddle through an unclear and ever-shifting environment. We believe the divergence between developed and emerging economies will continue, with the former continuing to rebuild while the latter increases its influence on the global stage. However, in our opinion, while the economic expansion is unlikely to feel strong to observers — particularly given recent experiences of more robust post-recession growth — it will be enough to grow earnings and to keep default rates for corporate borrowers low, supporting a variety of risky assets.
As such, we believe 2011 will be a positive year for equities, with performance driven by earnings growth, attractive valuations, abundant liquidity and a pickup in corporate spending. Top Ten Holdings
as of December 31, 2010
(as a percent of net assets) |
| HSBC Holdings PLC | | | | | 7.4 | % |
| BP PLC | | | | | 5.7 | % |
| Vodafone Group PLC | | | | | 5.7 | % |
| Royal Dutch Shell PLC — Class A | | | | | 4.9 | % |
| Rio Tinto PLC | | | | | 4.5 | % |
| GlaxoSmithKline PLC | | | | | 4.2 | % |
| Royal Dutch Shell PLC — Class B | | | | | 3.7 | % |
| BHP Billiton PLC | | | | | 3.6 | % |
| British American Tobacco PLC | | | | | 3.2 | % |
| Anglo American PLC | | | | | 2.8 | % |
Portfolio holdings are subject to change daily.
|
| * | | The Portfolio’s return may at times appear to diverge from the return of its benchmark index more than would be expected. These divergences may, in part, be the result of fair-value pricing adjustments to certain foreign securities as well as other pricing policies. In accordance with the Portfolio’s Valuation Policy, fair-value pricing adjustments may be used to address pricing discrepancies that arise due to time-zone differences. Foreign securities may trade on exchanges that close many hours before the Portfolio’s closing share price is calculated in the United States, generally at 4 p.m., Eastern Time. In the hours between the foreign close and the U.S. close, the value of these foreign securities may change — because of company specific announcements or marketwide developments. Such price changes are not immediately reflected in international index values. Fair-value pricing takes such changes into account in calculating the Portfolio’s daily net asset value (“NAV”), so that the NAV doesn’t include “stale” prices. The result can be a temporary divergence between the return of the Portfolio and that of its benchmark index. The Portfolio also translates local prices to USD using foreign exchange rates at the time the NAV is calculated whereas the index does not.
|
| ** | | Please note that this discussion refers to the Portfolio’s gross performance versus the benchmark. Returns presented in the preceding paragraph refer to the Portfolio’s performance net of expenses. The benchmark does not incur expenses. An investor cannot invest directly in the benchmark. |
Portfolio holdings and characteristics are subject to change and may not be representative of current holdings and characteristics. The outlook for this Portfolio may differ from that presented for other ING Funds. Performance for the different classes of shares will vary based on differences in fees associated with each class.
22
PORTFOLIO MANAGERS’ REPORT | | ING FTSE 100 INDEX® PORTFOLIO |
Average Annual Total Returns for the Period Ended December 31, 2010
|
|
|---|
| | | | 1 Year
| | Since Inception
of Classes ADV and I
August 17, 2009
|
|---|
| |
| Class ADV | | | | | 8.87 | % | | | 18.53 | % |
| Class I | | | | | 9.43 | % | | | 19.06 | % |
| FTSE 100 Index® | | | | | 9.19 | % | | | 14.88 | % |
Based on a $10,000 initial investment, the graph and table above illustrate the total return of ING FTSE 100 Index® Portfolio against the index indicated. An index has no cash in its portfolio, imposes no sales charges and incurs no operating expenses. An investor cannot invest directly in an Index. The Portfolio’s performance is shown without the imposition of any expenses or charges which are, or may be, imposed under your annuity contract. Total returns would have been lower if such expenses or charges were included.
The performance graph and table do not reflect the deduction of taxes that a shareholder will pay on portfolio distributions or the redemption of portfolio shares.
The performance shown include the effect of fee waivers and/or expense reimbursements by the Investment Adviser and/or other service providers, which have the effect of increasing total return. Had all fees and expenses been considered, the total returns would have been lower.
The performance update illustrate performance for a variable investment option available through a variable annuity contract. The performance shown indicates past performance and is not a projection or prediction of future results. Actual investment returns and principal value will fluctuate so that shares and/or units, at redemption, may be worth more or less than their original cost. Please call (800) 992-0180 to get performance through the most recent month end.
It is important to note that the Portfolio has a limited operating history. Performance over a longer period of time may be more meaningful than short-term performance.
This report contains statements-that may be “forward-looking” statements. Actual results may differ materially from those projected in the “forward-looking” statements.
The views expressed in this report reflect those of the portfolio managers, only through the end of the period as stated on the cover. The portfolio managers’ views are subject to change at any time based on market and other conditions.
Portfolio holdings are subject to change daily.
23
ING HANG SENG INDEX PORTFOLIO | | PORTFOLIO MANAGERS’ REPORT |
Country Allocation
as of December 31, 2010
(as a percent of net assets) |
| Hong Kong | | | | | 47.3 | % |
| China | | | | | 34.2 | % |
| United Kingdom | | | | | 14.5 | % |
| Other Assets and Liabilities — Net* | | | | | 4.0 | % |
| Net Assets | | | | | 100.0 | % |
* Includes short-term investments related to Blackrock Liquidity Funds TempFund Portfolio — Class I. |
| |
Portfolio holdings are subject to change daily. |
ING Hang Seng Index Portfolio (the “Portfolio”) seeks investment results (before fees and expenses) that correspond to the total return of the Hang Seng Index. The Portfolio is managed by Vincent Costa, Portfolio Manager of ING Investment Management Co. (“ING IM”) — the Sub-Adviser.
Performance*: For the year ended December 31, 2010, the Portfolio’s Class S shares provided a total return of 7.53% compared to the Hang Seng Index, which returned 8.30% for the same period.
Portfolio Specifics**: The Portfolio employs a “passive management” approach designed to track the performance of the Hang Seng Index. The Portfolio attempts to track the Hang Seng Index by investing all, or substantially all, of its assets in stocks that make up the Hang Seng Index. The Portfolio may not always hold all of the same securities as the Hang Seng Index.
Eight out of the ten sectors posted positive returns. Financials and energy led the way contributing over 5% to the benchmark’s return. Some financials, representing 57% of the benchmark’s weight, showed significant strength, such as Bank of China Hong Kong Ltd., Swire Pacific Ltd. and Wharf (Holdings) Ltd. Within energy — the second largest weighting in the benchmark — stocks such as China National Offshore Oil Corp. and PetroChina Co, helped results. Conversely, information technology and materials posted negative returns as companies such as Foxconn International Holdings, Ltd. and Aluminum Corp. underperformed.
Current Outlook and Strategy: We believe the base-case scenario for 2011 is that the global economy continues to muddle through an unclear and ever-shifting environment. We believe the divergence between developed and emerging economies will continue, with the former continuing to rebuild while the latter increases its influence on the global stage. However, in our opinion, while the economic expansion is unlikely to feel strong to observers — particularly given recent experiences of more robust post-recession growth — it will be enough to grow earnings and to keep default rates for corporate borrowers low, supporting a variety of risky assets.
We believe 2011 will be a positive year for equities, with performance driven by earnings growth, attractive valuations, abundant liquidity and an increase in corporate spending. Top Ten Holdings
as of December 31, 2010
(as a percent of net assets) |
| HSBC Holdings PLC | | | | | 14.5 | % |
| China Mobile Ltd. | | | | | 7.4 | % |
| China Construction Bank | | | | | 6.7 | % |
| CNOOC Ltd. | | | | | 5.3 | % |
| Industrial and Commercial Bank of China Ltd. | | | | | 5.2 | % |
| Bank of China Ltd. | | | | | 4.1 | % |
| China Life Insurance Co., Ltd. | | | | | 3.7 | % |
| PetroChina Co., Ltd. | | | | | 3.4 | % |
| Sun Hung Kai Properties Ltd. | | | | | 3.2 | % |
| Hong Kong Exchanges and Clearing Ltd. | | | | | 2.9 | % |
Portfolio holdings are subject to change daily.
|
| * | | The Portfolio’s return may at times appear to diverge from the return of its benchmark index more than would be expected. These divergences may, in part, be the result of fair-value pricing adjustments to certain foreign securities as well as other pricing policies. In accordance with the Portfolio’s Valuation Policy, fair-value pricing adjustments may be used to address pricing discrepancies that arise due to time-zone differences. Foreign securities may trade on exchanges that close many hours before the Portfolio’s closing share price is calculated in the United States, generally at 4 p.m., Eastern Time. In the hours between the foreign close and the U.S. close, the value of these foreign securities may change — because of company specific announcements or marketwide developments. Such price changes are not immediately reflected in international index values. Fair-value pricing takes such changes into account in calculating the Portfolio’s daily net asset value (“NAV”), so that the NAV doesn’t include “stale” prices. The result can be a temporary divergence between the return of the Portfolio and that of its benchmark index. The Portfolio also translates local prices to USD using foreign exchange rates at the time the NAV is calculated whereas the index does not.
|
| ** | | Please note that this discussion refers to the Portfolio’s gross performance versus the benchmark. Returns presented in the preceding paragraph refer to the Portfolio’s performance net of expenses. The benchmark does not incur expenses. An investor cannot invest directly in the benchmark. |
Portfolio holdings and characteristics are subject to change and may not be representative of current holdings and characteristics. The outlook for this Portfolio may differ from that presented for other ING Funds. Performance for the different classes of shares will vary based on differences in fees associated with each class.
24
PORTFOLIO MANAGERS’ REPORT | | ING HANG SENG INDEX PORTFOLIO |
Average Annual Total Returns for the Periods Ended December 31, 2010
|
|
|---|
| | | | 1 Year
| | Since Inception
of Class S
May 1, 2009
| | Since Inception
of Classes ADV, I and S2
May 4, 2009
|
|---|
| |
| Class ADV | | | | | 7.30 | % | | | — | | | | 22.60 | % |
| Class I | | | | | 7.76 | % | | | — | | | | 23.16 | % |
| Class S | | | | | 7.53 | % | | | 22.76 | % | | | — | |
| Hang Seng Index | | | | | 8.30 | % | | | 30.74 | % | | | 30.74 | % |
Based on a $10,000 initial investment, the graph and table above illustrate the total return of ING Hang Seng Index Portfolio against the index indicated. An index has no cash in its portfolio, imposes no sales charges and incurs no operating expenses. An investor cannot invest directly in an Index. The Portfolio’s performance is shown without the imposition of any expenses or charges which are, or may be, imposed under your annuity contract. Total returns would have been lower if such expenses or charges were included.
The performance graph and table do not reflect the deduction of taxes that a shareholder will pay on portfolio distributions or the redemption of portfolio shares.
The performance shown include the effect of fee waivers and/or expense reimbursements by the Investment Adviser and/or other service providers, which have the effect of increasing total return. Had all fees and expenses been considered, the total returns would have been lower.
The performance update illustrate performance for a variable investment option available through a variable annuity contract. The performance shown indicates past performance and is not a projection or prediction of future results. Actual investment returns and principal value will fluctuate so that shares and/or units, at redemption, may be worth more or less than their original cost. Please call (800) 992-0180 to get performance through the most recent month end.
It is important to note that the Portfolio has a limited operating history. Performance over a longer period of time may be more meaningful than short-term performance.
This report contains statements-that may be “forward-looking” statements. Actual results may differ materially from those projected in the “forward-looking” statements.
The views expressed in this report reflect those of the portfolio managers, only through the end of the period as stated on the cover. The portfolio managers’ views are subject to change at any time based on market and other conditions.
Portfolio holdings are subject to change daily.
25
ING INTERNATIONAL INDEX PORTFOLIO | | PORTFOLIO MANAGERS’ REPORT |
Country Allocation
as of December 31, 2010
(as a percent of net assets) |
| Japan | | | | | 21.4 | % |
| United Kingdom | | | | | 18.3 | % |
| France | | | | | 8.8 | % |
| Australia | | | | | 8.5 | % |
| Switzerland | | | | | 8.3 | % |
| Germany | | | | | 7.9 | % |
| Netherlands | | | | | 4.5 | % |
| Spain | | | | | 3.2 | % |
| Sweden | | | | | 3.2 | % |
| Hong Kong | | | | | 2.7 | % |
| Italy | | | | | 2.5 | % |
| Singapore | | | | | 1.6 | % |
Countries between 0.9%–1.1%(1) | | | | | 3.0 | % |
Countries less than 0.9%(2) | | | | | 3.3 | % |
| Other Assets and Liabilities — Net* | | | | | 2.8 | % |
| Net Assets | | | | | 100.0 | % |
* Includes short-term investments related to Blackrock Liquidity Funds TempFund Portfolio — Class I and securities lending collateral. |
| (1) Includes three countries, which each represents 0.9%–1.1% of net assets. |
| (2) Includes seventeen countries, which each represents less than 0.9% of net assets. |
| |
Portfolio holdings are subject to change daily. |
ING International Index Portfolio (the “Portfolio”) seeks investment results (before fees and expenses) that correspond to the total return of a widely accepted international index. The Portfolio is managed by Vincent Costa, Portfolio Manager of ING Investment Management Co. (“ING IM”) — the Sub-Adviser.
Performance*: For the year ended December 31, 2010, the Portfolio’s Class S shares provided a total return of 7.63% compared to the MSCI Europe, Australasia and Far East® (“MSCI EAFE®”) Index, which returned 7.75% for the same period.
Portfolio Specifics**: The Portfolio employs a “passive management” approach designed to track the performance of the MSCI EAFE® Index. The Portfolio attempts to track the MSCI EAFE® Index by investing all, or substantially all, of its assets in stocks that make up the MSCI EAFE® Index. The Portfolio may not always hold all of the same securities as the MSCI EAFE® Index.
Of the benchmark’s ten sectors, all but utilities and financials saw positive returns for the year. Industrials and consumer discretionary were the top-performing sectors. On a country level, Sweden, Denmark and Hong Kong posted the best performances, while Greece, Spain and Ireland were the least successful.
Current Outlook and Strategy: We believe the base-case scenario for 2011 is that the global economy continues to muddle through an unclear and ever-shifting environment. We believe the divergence between developed and emerging economies will continue, with the former continuing to rebuild while the latter increases its influence on the global stage. However, in our opinion, while the economic expansion is unlikely to feel strong to observers — particularly given recent experiences of more robust post-recession growth — it will be enough to grow earnings and to keep default rates for corporate borrowers low, supporting a variety of risky assets.
As such, we believe 2011 will be a positive year for equities, with performance driven by earnings growth, attractive valuations, abundant liquidity and a pickup in corporate spending. Top Ten Holdings*
as of December 31, 2010
(as a percent of net assets) |
| Nestle S.A. | | | | | 1.8 | % |
| HSBC Holdings PLC | | | | | 1.6 | % |
| BHP Billiton Ltd. | | | | | 1.4 | % |
| BP PLC | | | | | 1.2 | % |
| Vodafone Group PLC | | | | | 1.2 | % |
| Novartis AG | | | | | 1.1 | % |
| Royal Dutch Shell PLC — Class A | | | | | 1.1 | % |
| Total S.A. | | | | | 1.0 | % |
| Toyota Motor Corp. | | | | | 1.0 | % |
| Roche Holding AG — Genusschein | | | | | 0.9 | % |
* Excludes short-term investments related to securities lending collateral. |
| |
Portfolio holdings are subject to change daily. |
| * | | The Portfolio’s return may at times appear to diverge from the return of its benchmark index more than would be expected. These divergences may, in part, be the result of fair-value pricing adjustments to certain foreign securities as well as other pricing policies. In accordance with the Portfolio’s Valuation Policy, fair-value pricing adjustments may be used to address pricing discrepancies that arise due to time-zone differences. Foreign securities may trade on exchanges that close many hours before the Portfolio’s closing share price is calculated in the United States, generally at 4 p.m., Eastern Time. In the hours between the foreign close and the U.S. close, the value of these foreign securities may change — because of company specific announcements or marketwide developments. Such price changes are not immediately reflected in international index values. Fair-value pricing takes such changes into account in calculating the Portfolio’s daily net asset value (“NAV”), so that the NAV doesn’t include “stale” prices. The result can be a temporary divergence between the return of the Portfolio and that of its benchmark index. The Portfolio also translates local prices to USD using foreign exchange rates at the time the NAV is calculated whereas the index does not.
|
| ** | | Please note that this discussion refers to the Portfolio’s gross performance versus the benchmark. Returns presented in the preceding paragraph refer to the Portfolio’s performance net of expenses. The benchmark does not incur expenses. An investor cannot invest directly in the benchmark. |
Portfolio holdings and characteristics are subject to change and may not be representative of current holdings and characteristics. The outlook for this Fund may differ from that presented for other ING Funds. Performance for the different classes of shares will vary based on differences in fees associated with each class.
26
PORTFOLIO MANAGERS’ REPORT | | ING INTERNATIONAL INDEX PORTFOLIO |
Average Annual Total Returns for the Periods Ended December 31, 2010
|
|
|---|
| | | | 1 Year
| | Since Inception
of Classes ADV, I and S
March 10, 2008
| | Since Inception
of Class S2
February 27, 2009
|
|---|
| |
| Class ADV | | | | | 7.32 | % | | | (4.12 | )% | | | — | |
| Class I | | | | | 7.84 | % | | | (3.62 | )% | | | — | |
| Class S | | | | | 7.63 | % | | | (3.88 | )% | | | — | |
| Class S2 | | | | | 7.44 | % | | | — | | | | 35.20 | % |
| MSCI EAFE® Index | | | | | 7.75 | % | | | (4.67 | )%(1) | | | 35.88 | %(2) |
Based on a $10,000 initial investment, the graph and table above illustrate the total return of ING International Index Portfolio against the index indicated. An index has no cash in its portfolio, imposes no sales charges and incurs no operating expenses. An investor cannot invest directly in an Index. The Portfolio’s performance is shown without the imposition of any expenses or charges which are, or may be, imposed under your annuity contract. Total returns would have been lower if such expenses or charges were included.
The performance graph and table do not reflect the deduction of taxes that a shareholder will pay on portfolio distributions or the redemption of portfolio shares.
The performance shown include the effect of fee waivers and/or expense reimbursements by the Investment Adviser and/or other service providers, which have the effect of increasing total return. Had all fees and expenses been considered, the total returns would have been lower.
The performance update illustrate performance for a variable investment option available through a variable annuity contract. The performance shown indicates past performance and is not a projection or prediction of future results. Actual investment returns and principal value will fluctuate so that shares and/or units, at redemption, may be worth more or less than their original cost. Please call (800) 992-0180 to get performance through the most recent month end.
It is important to note that the Portfolio has a limited operating history. Performance over a longer period of time may be more meaningful than short-term performance.
This report contains statements-that may be “forward-looking” statements. Actual results may differ materially from those projected in the “forward-looking” statements.
The views expressed in this report reflect those of the portfolio managers, only through the end of the period as stated on the cover. The portfolio managers’ views are subject to change at any time based on market and other conditions.
Portfolio holdings are subject to change daily.
(1) | | Since inception performance for the index is shown from March 1, 2008. |
(2) | | Since inception performance for the index is shown from March 1, 2009. |
27
ING JAPAN TOPIX INDEX PORTFOLIO | | PORTFOLIO MANAGERS’ REPORT |
Country Allocation
as of December 31, 2010
(as a percent of net assets) |
| Industrials | | | | | 20.9 | % |
| Consumer Discretionary | | | | | 18.9 | % |
| Financials | | | | | 17.0 | % |
| Information Technology | | | | | 13.1 | % |
| Materials | | | | | 8.3 | % |
| Consumer Staples | | | | | 5.8 | % |
| Health Care | | | | | 5.3 | % |
| Utilities | | | | | 4.7 | % |
| Telecommunication Services | | | | | 3.7 | % |
| Energy | | | | | 1.4 | % |
| Other Assets and Liabilities — Net* | | | | | 0.9 | % |
| Net Assets | | | | | 100.0 | % |
* Includes short-term investments related to securities lending collateral. |
| |
Portfolio holdings are subject to change daily. |
ING Japan TOPIX Index Portfolio (the “Portfolio”) seeks investment results (before fees and expenses) that correspond to the total return of the Tokyo Stock Price Index® (“TOPIX Index”). The Portfolio is managed by Vincent Costa, Portfolio Manager of ING Investment Management Co. (“ING IM”) — the Sub-Adviser.
Performance*: For the year ended December 31, 2010, the Portfolio’s Class I shares provided a total return of 14.13% compared to the TOPIX Index, which returned 15.89% for the same period.
Portfolio Specifics**: The Portfolio employs a “passive management” approach designed to track the performance of the TOPIX Index. The Portfolio attempts to track the TOPIX Index by investing all, or substantially all, of its assets in stocks that make up the TOPIX Index. The Portfolio may not always hold all of the same securities as the TOPIX Index.
All sectors of the benchmark saw positive returns for the year, led by industrials and information technology. Although telecom stocks also posted strong performance, the sector’s small benchmark weighting resulted in a diminished contribution to return. Utilities struggled for the period, as did energy.
Current Outlook and Strategy: We believe the base-case scenario for 2011 is that the global economy continues to muddle through an unclear and ever-shifting environment. We believe the divergence between developed and emerging economies will continue, with the former continuing to rebuild while the latter increases its influence on the global stage. However, in our opinion, while the economic expansion is unlikely to feel strong to observers — particularly given recent experiences of more robust post-recession growth — it will be enough to grow earnings and to keep default rates for corporate borrowers low, supporting a variety of risky assets.
As such, we believe 2011 will be a positive year for equities, with performance driven by earnings growth, attractive valuations, abundant liquidity and a pickup in corporate spending. Top Ten Holdings*
as of December 31, 2010
(as a percent of net assets) |
| Toyota Motor Corp. | | | | | 3.4 | % |
| Mitsubishi UFJ Financial Group, Inc. | | | | | 2.7 | % |
| Honda Motor Co., Ltd. | | | | | 2.2 | % |
| Canon, Inc. | | | | | 2.1 | % |
| Sumitomo Mitsui Financial Group, Inc. | | | | | 1.7 | % |
| Mizuho Financial Group, Inc. | | | | | 1.5 | % |
| Mitsubishi Corp. | | | | | 1.4 | % |
| Sony Corp. | | | | | 1.3 | % |
| Takeda Pharmaceutical Co., Ltd. | | | | | 1.3 | % |
| Tokyo Electric Power Co., Inc. | | | | | 1.2 | % |
* Excludes short-term investments related to securities lending collateral. |
| |
Portfolio holdings are subject to change daily. |
| * | | The Portfolio’s return may at times appear to diverge from the return of its benchmark index more than would be expected. These divergences may, in part, be the result of fair-value pricing adjustments to certain foreign securities as well as other pricing policies. In accordance with the Portfolio’s Valuation Policy, fair-value pricing adjustments may be used to address pricing discrepancies that arise due to time-zone differences. Foreign securities may trade on exchanges that close many hours before the Portfolio’s closing share price is calculated in the United States, generally at 4 p.m., Eastern Time. In the hours between the foreign close and the U.S. close, the value of these foreign securities may change — because of company specific announcements or marketwide developments. Such price changes are not immediately reflected in international index values. Fair-value pricing takes such changes into account in calculating the Portfolio’s daily net asset value (“NAV”), so that the NAV doesn’t include “stale” prices. The result can be a temporary divergence between the return of the Portfolio and that of its benchmark index. The Portfolio also translates local prices to USD using foreign exchange rates at the time the NAV is calculated whereas the index does not.
|
| ** | | Please note that this discussion refers to the Portfolio’s gross performance versus the benchmark. Returns presented in the preceding paragraph refer to the Portfolio’s performance net of expenses. The benchmark does not incur expenses. An investor cannot invest directly in the benchmark. |
Portfolio holdings and characteristics are subject to change and may not be representative of current holdings and characteristics. The outlook for this Portfolio may differ from that presented for other ING Funds. Performance for the different classes of shares will vary based on differences in fees associated with each class.
28
PORTFOLIO MANAGERS’ REPORT | | ING JAPAN TOPIX INDEX PORTFOLIO |
Average Annual Total Returns for the Periods Ended December 31, 2010
|
|
|---|
| | | | 1 Year
| | Since Inception
of Classes ADV and I
August 17, 2009
|
|---|
| |
| Class ADV | | | | | 13.63 | % | | | 8.15 | % |
| Class I | | | | | 14.13 | % | | | 8.66 | % |
| Tokyo Stock Price Index® (TOPIX) | | | | | 15.89 | % | | | 6.89 | % |
Based on a $10,000 initial investment, the graph and table above illustrate the total return of ING Japan TOPIX Index Portfolio against the index indicated. An index has no cash in its portfolio, imposes no sales charges and incurs no operating expenses. An investor cannot invest directly in an Index. The Portfolio’s performance is shown without the imposition of any expenses or charges which are, or may be, imposed under your annuity contract. Total returns would have been lower if such expenses or charges were included.
The performance graph and table do not reflect the deduction of taxes that a shareholder will pay on portfolio distributions or the redemption of portfolio shares.
The performance shown include the effect of fee waivers and/or expense reimbursements by the Investment Adviser and/or other service providers, which have the effect of increasing total return. Had all fees and expenses been considered, the total returns would have been lower.
The performance update illustrate performance for a variable investment option available through a variable annuity contract. The performance shown indicates past performance and is not a projection or prediction of future results. Actual investment returns and principal value will fluctuate so that shares and/or units, at redemption, may be worth more or less than their original cost. Please call (800) 992-0180 to get performance through the most recent month end.
It is important to note that the Portfolio has a limited operating history. Performance over a longer period of time may be more meaningful than short-term performance.
This report contains statements-that may be “forward-looking” statements. Actual results may differ materially from those projected in the “forward-looking” statements.
The views expressed in this report reflect those of the portfolio managers, only through the end of the period as stated on the cover. The portfolio managers’ views are subject to change at any time based on market and other conditions.
Portfolio holdings are subject to change daily.
29
ING WISDOMTREESM GLOBAL HIGH-YIELDING EQUITY INDEX PORTFOLIO | | PORTFOLIO MANAGERS’ REPORT |
Country Allocation
as of December 31, 2010
(as a percent of net assets) |
| United States | | | | | 19.9 | % |
| France | | | | | 12.6 | % |
| United Kingdom | | | | | 11.1 | % |
| Australia | | | | | 9.3 | % |
| Spain | | | | | 5.8 | % |
| Canada | | | | | 5.0 | % |
| Germany | | | | | 4.0 | % |
| Italy | | | | | 3.5 | % |
| Switzerland | | | | | 3.4 | % |
| Hong Kong | | | | | 2.6 | % |
| Netherlands | | | | | 2.4 | % |
| Brazil | | | | | 2.3 | % |
Countries between 0.8%–2.0%(1) | | | | | 8.4 | % |
Countries less than 0.8%(2) | | | | | 9.0 | % |
| Other Assets and Liabilities — Net | | | | | 0.7 | % |
| Net Assets | | | | | 100.0 | % |
| |
(1) Includes six countries, which each represents 0.8%–2.0% of net assets. |
(2) Includes twenty four countries, which each represents less than 0.8% of net assets. |
| |
Portfolio holdings are subject to change daily. |
| |
| |
ING WisdomTreeSM Global High-Yielding Equity Index Portfolio (the “Portfolio”) seeks investment returns that closely correspond to the price and yield performance (before fees and expenses) of the WisdomTreeSM Global High-Yielding Equity Index. The Portfolio is managed by Vincent Costa, Portfolio Manager of ING Investment Management Co. (“ING IM”) — the Sub-Adviser.
Performance*: For the year ended December 31, 2010, the Portfolio’s Class S shares provided a total return of 5.86% compared to the WisdomTreeSM Global High-Yielding Equity Index, which returned 6.52% for the same period.
Portfolio Specifics**: The Portfolio employs a “passive management” approach designed to track the performance of the WisdomTreeSM Global High-Yielding Equity Index. The Portfolio attempts to track the WisdomTreeSM Global High-Yielding Equity Index by investing all, or substantially all, of its assets in stocks that make up the WisdomTreeSM Global High-Yielding Equity Index. The Portfolio may not always hold all of the same securities as the WisdomTreeSM Global High-Yielding Equity Index.
Eight out of the ten sectors saw positive returns for the year. The strength in materials, industrials and consumer staples sectors led the way returning in excess of +20%. Conversely, energy and utilities posted negative returns for the year. This was followed closely behind by healthcare which returned 0.9%. On a country level, Mexico, Thailand and Chile were the highest returning sectors posting returns in excess of +50%. Greece, Spain, Ireland and Portugal (referred to as PIGS during the sovereign debt crisis) were the worst performing countries.
Current Outlook & Strategy: As we close the chapter on another year, we are pleased with the progress and amazed at the stark differences in the overall environment compared with a mere 12 months ago. We believe economic depression worries have abated, stock markets around the world have rallied and signs of an early upswing are plentiful.
We remain cautiously optimistic, however, particularly regarding the outlook for the developed world as we forecast past mid-year. As growth from the inventory cycle and government stimulus fades, we believe we will continue to confront issues that will ultimately shape the direction and magnitude of the recovery. We believe employment is the key driver of a sustained recovery; additionally, credit creation must provide the fuel for growth. Top Ten Holdings
as of December 31, 2010
(as a percent of net assets) |
| AT&T, Inc. | | | | | 2.2 | % |
| Total S.A. | | | | | 2.0 | % |
| Vodafone Group PLC | | | | | 1.8 | % |
| Telefonica S.A. | | | | | 1.6 | % |
| France Telecom S.A. | | | | | 1.4 | % |
| HSBC Holdings PLC | | | | | 1.3 | % |
| China Mobile Ltd. | | | | | 1.3 | % |
| Gaz de France | | | | | 1.3 | % |
| Chevron Corp. | | | | | 1.3 | % |
| Verizon Communications, Inc. | | | | | 1.2 | % |
Portfolio holdings are subject to change daily.
|
| * | | The Portfolio’s return may at times appear to diverge from the return of its benchmark index more than would be expected. These divergences may, in part, be the result of fair-value pricing adjustments to certain foreign securities as well as other pricing policies. In accordance with the Portfolio’s Valuation Policy, fair-value pricing adjustments may be used to address pricing discrepancies that arise due to time-zone differences. Foreign securities may trade on exchanges that close many hours before the Portfolio’s closing share price is calculated in the United States, generally at 4 p.m., Eastern Time. In the hours between the foreign close and the U.S. close, the value of these foreign securities may change — because of company specific announcements or marketwide developments. Such price changes are not immediately reflected in international index values. Fair-value pricing takes such changes into account in calculating the Portfolio’s daily net asset value (“NAV”), so that the NAV doesn’t include “stale” prices. The result can be a temporary divergence between the return of the Portfolio and that of its benchmark index. The Portfolio also translates local prices to USD using foreign exchange rates at the time the NAV is calculated whereas the index does not.
|
| ** | | Please note that this discussion refers to the Portfolio’s gross performance versus the benchmark. Returns presented in the preceding paragraph refer to the Portfolio’s performance net of expenses. The benchmark does not incur expenses. An investor cannot invest directly in the benchmark. |
Portfolio holdings and characteristics are subject to change and may not be representative of current holdings and characteristics. The outlook for this Portfolio may differ from that presented for other ING Funds. Performance for the different classes of shares will vary based on differences in fees associated with each class.
30
PORTFOLIO MANAGERS’ REPORT | | ING WISDOMTREESM GLOBAL HIGH-YIELDING EQUITY INDEX PORTFOLIO |
Average Annual Total Returns for the Period Ended December 31, 2010
|
|
|---|
| | | | 1 Year
| | Since Inception
of Classes ADV and S
January 28, 2008
|
|---|
| |
| Class ADV | | | | | 5.80 | % | | | (5.58 | )% |
| Class I | | | | | 3.85 | % | | | (6.16 | )% |
| Class S | | | | | 5.86 | % | | | (5.35 | )% |
WisdomTree SM Global High-Yielding Equity Index | | | | | 6.52 | % | | | (4.28 | )% (1) |
Based on a $10,000 initial investment, the graph and table above illustrate the total return of ING WisdomTreeSM Global High-Yielding Equity Index Portfolio against the index indicated. An index has no cash in its portfolio, imposes no sales charges and incurs no operating expenses. An investor cannot invest directly in an Index. The Portfolio’s performance is shown without the imposition of any expenses or charges which are, or may be, imposed under your annuity contract. Total returns would have been lower if such expenses or charges were included.
The performance graph and table do not reflect the deduction of taxes that a shareholder will pay on portfolio distributions or the redemption of portfolio shares.
The performance shown may include the effect of fee waivers and/ or expense reimbursements by the Investment Adviser and/or other service providers, which have the effect of increasing total return. Had all fees and expenses been considered, the total returns would have been lower.
The performance update illustrates performance for a variable investment option available through a variable annuity contract. The performance shown indicates past performance and is not a projection or prediction of future results. Actual investment returns and principal value will fluctuate so that shares and/or units, at redemption, may be worth more or less than their original cost. Please call (800) 992-0180 to get performance through the most recent month end.
It is important to note that the Portfolio has a limited operating history. Performance over a longer period of time may be more meaningful than short-term performance.
This report contains statements that may be “forward-looking” statements. Actual results may differ materially from those projected in the “forward-looking” statements.
The views expressed in this report reflect those of the portfolio managers, only through the end of the period as stated on the cover. The portfolio managers’ views are subject to change at any time based on market and other conditions.
Portfolio holdings are subject to change daily.
(1) | | Since inception performance for the index is shown from February 1, 2008. |
31
SHAREHOLDER EXPENSE EXAMPLES (UNAUDITED)
As a shareholder of a Portfolio, you incur two types of costs: (1) transaction costs, including redemption fees and exchange fees; and (2) ongoing costs, including management fees, distribution and/or service (12b-1) fees, and other Portfolio expenses. These Examples are intended to help you understand your ongoing costs (in dollars) of investing in a Portfolio and to compare these costs with the ongoing costs of investing in other mutual funds.
The Examples are based on an investment of $1,000 invested at the beginning of the period and held for the entire period from July 1, 2010 to December 31, 2010. The Portfolios’ expenses are shown without the imposition of any charges which are, or may be, imposed under your variable annuity contract, variable life insurance policy, qualified pension or retirement plan. Expenses would have been higher if such charges were included.
Actual Expenses
The left section of the table shown below, “Actual Portfolio Return,” provides information about actual account values and actual expenses. You may use the information in this section, together with the amount you invested, to estimate the expenses that you paid over the period. Simply divide your account value by $1,000 (for example, an $8,600 account value divided by $1,000 = 8.6), then multiply the result by the number in the first section under the heading entitled “Expenses Paid During the Period” to estimate the expenses you paid on your account during this period.
Hypothetical Example for Comparison Purposes
The right section of the table shown below, “Hypothetical (5% return before expenses),” provides information about hypothetical account values and hypothetical expenses based on a Portfolio’s actual expense ratio and an assumed rate of return of 5% per year before expenses, which is not a Portfolio’s actual return. The hypothetical account values and expenses may not be used to estimate the actual ending account balance or expenses you paid for the period. You may use this information to compare the ongoing costs of investing in a Portfolio and other mutual funds. To do so, compare this 5% hypothetical example with the 5% hypothetical examples that appear in the shareholder reports of the other mutual funds.
Please note that the expenses shown in the table are meant to highlight your ongoing costs only and do not reflect any transactional costs, such as redemption fees or exchange fees. Therefore, the hypothetical lines of the table are useful in comparing ongoing costs only, and will not help you determine the relative total costs of owning different mutual funds. In addition, if these transactional costs were included, your costs would have been higher.
| | | | Actual Portfolio Return
| | Hypothetical (5% return before expenses)
| |
|---|
| | | | Beginning
Account
Value
July 1,
2010
| | Ending
Account
Value
December 31,
2010
| | Annualized
Expense
Ratio
| | Expenses Paid
During the
Period Ended
December 31,
2010*
| | Beginning
Account
Value
July 1,
2010
| | Ending
Account
Value
December 31,
2010
| | Annualized
Expense
Ratio
| | Expenses Paid
During the
Period Ended
December 31,
2010*
|
|---|
ING RussellTM Large Cap Index Portfolio |
| Class ADV | | | | $ | 1,000.00 | | | $ | 1,218.80 | | | | 0.87 | % | | $ | 4.87 | | | $ | 1,000.00 | | | $ | 1,020.82 | | | | 0.87 | % | | $ | 4.43 | |
| Class I | | | | | 1,000.00 | | | | 1,222.20 | | | | 0.37 | | | | 2.07 | | | | 1,000.00 | | | | 1,023.34 | | | | 0.37 | | | | 1.89 | |
| Class S | | | | | 1,000.00 | | | | 1,220.30 | | | | 0.62 | | | | 3.47 | | | | 1,000.00 | | | | 1,022.08 | | | | 0.62 | | | | 3.16 | |
| Class S2 | | | | | 1,000.00 | | | | 1,218.60 | | | | 0.77 | | | | 4.31 | | | | 1,000.00 | | | | 1,021.32 | | | | 0.77 | | | | 3.92 | |
ING RussellTM Large Cap Growth Index Portfolio |
| Class ADV | | | | | 1,000.00 | | | | 1,241.30 | | | | 0.98 | | | | 5.54 | | | | 1,000.00 | | | | 1,020.27 | | | | 0.98 | | | | 4.99 | |
| Class I | | | | | 1,000.00 | | | | 1,244.80 | | | | 0.48 | | | | 2.72 | | | | 1,000.00 | | | | 1,022.79 | | | | 0.48 | | | | 2.45 | |
| Class S | | | | | 1,000.00 | | | | 1,243.70 | | | | 0.73 | | | | 4.13 | | | | 1,000.00 | | | | 1,021.53 | | | | 0.73 | | | | 3.72 | |
ING RussellTM Large Cap Value Index Portfolio |
| Class ADV | | | | | 1,000.00 | | | | 1,194.10 | | | | 1.01 | | | | 5.59 | | | | 1,000.00 | | | | 1,020.11 | | | | 1.01 | | | | 5.14 | |
| Class I | | | | | 1,000.00 | | | | 1,197.10 | | | | 0.51 | | | | 2.82 | | | | 1,000.00 | | | | 1,022.63 | | | | 0.51 | | | | 2.60 | |
| Class S | | | | | 1,000.00 | | | | 1,196.60 | | | | 0.76 | | | | 4.21 | | | | 1,000.00 | | | | 1,021.37 | | | | 0.76 | | | | 3.87 | |
| * | | Expenses are equal to each Portfolio’s respective annualized expense ratios multiplied by the average account value over the period, multiplied by 184/365 to reflect the most recent fiscal half-year. |
32
SHAREHOLDER EXPENSE EXAMPLES (UNAUDITED) (CONTINUED)
| | | | Actual Portfolio Return
| | Hypothetical (5% return before expenses)
| |
|---|
| | | | Beginning
Account
Value
July 1,
2010
| | Ending
Account
Value
December 31,
2010
| | Annualized
Expense
Ratio
| | Expenses Paid
During the
Period Ended
December 31,
2010*
| | Beginning
Account
Value
July 1,
2010
| | Ending
Account
Value
December 31,
2010
| | Annualized
Expense
Ratio
| | Expenses Paid
During the
Period Ended
December 31,
2010*
|
|---|
ING RussellTM Mid Cap Index Portfolio |
| Class ADV | | | | $ | 1,000.00 | | | $ | 1,276.50 | | | | 0.93 | % | | $ | 5.34 | | | $ | 1,000.00 | | | $ | 1,020.52 | | | | 0.93 | % | | $ | 4.74 | |
| Class I | | | | | 1,000.00 | | | | 1,279.90 | | | | 0.43 | | | | 2.47 | | | | 1,000.00 | | | | 1,023.04 | | | | 0.43 | | | | 2.19 | |
| Class S | | | | | 1,000.00 | | | | 1,277.80 | | | | 0.68 | | | | 3.90 | | | | 1,000.00 | | | | 1,021.78 | | | | 0.68 | | | | 3.47 | |
| Class S2 | | | | | 1,000.00 | | | | 1,275.60 | | | | 0.83 | | | | 4.76 | | | | 1,000.00 | | | | 1,021.02 | | | | 0.83 | | | | 4.23 | |
ING RussellTM Mid Cap Growth Index Portfolio |
| Class ADV | | | | | 1,000.00 | | | | 1,303.70 | | | | 0.99 | | | | 5.75 | | | | 1,000.00 | | | | 1,020.21 | | | | 0.99 | | | | 5.04 | |
| Class I | | | | | 1,000.00 | | | | 1,306.70 | | | | 0.49 | | | | 2.85 | | | | 1,000.00 | | | | 1,022.74 | | | | 0.49 | | | | 2.50 | |
| Class S | | | | | 1,000.00 | | | | 1,304.80 | | | | 0.74 | | | | 4.30 | | | | 1,000.00 | | | | 1,021.48 | | | | 0.74 | | | | 3.77 | |
| Class S2 | | | | | 1,000.00 | | | | 1,303.50 | | | | 0.89 | | | | 5.17 | | | | 1,000.00 | | | | 1,020.72 | | | | 0.89 | | | | 4.53 | |
ING RussellTM Small Cap Index Portfolio |
| Class ADV | | | | | 1,000.00 | | | | 1,289.60 | | | | 0.95 | | | | 5.48 | | | | 1,000.00 | | | | 1,020.42 | | | | 0.95 | | | | 4.84 | |
| Class I | | | | | 1,000.00 | | | | 1,292.10 | | | | 0.45 | | | | 2.60 | | | | 1,000.00 | | | | 1,022.94 | | | | 0.45 | | | | 2.29 | |
| Class S | | | | | 1,000.00 | | | | 1,290.20 | | | | 0.70 | | | | 4.04 | | | | 1,000.00 | | | | 1,021.68 | | | | 0.70 | | | | 3.57 | |
| Class S2 | | | | | 1,000.00 | | | | 1,289.00 | | | | 0.85 | | | | 4.90 | | | | 1,000.00 | | | | 1,020.92 | | | | 0.85 | | | | 4.33 | |
ING U.S. Bond Index Portfolio |
| Class ADV | | | | | 1,000.00 | | | | 1,007.80 | | | | 0.95 | | | | 4.81 | | | | 1,000.00 | | | | 1,020.42 | | | | 0.95 | | | | 4.84 | |
| Class I | | | | | 1,000.00 | | | | 1,011.20 | | | | 0.45 | | | | 2.28 | | | | 1,000.00 | | | | 1,022.94 | | | | 0.45 | | | | 2.29 | |
| Class S | | | | | 1,000.00 | | | | 1,009.30 | | | | 0.70 | | | | 3.55 | | | | 1,000.00 | | | | 1,021.68 | | | | 0.70 | | | | 3.57 | |
| Class S2 | | | | | 1,000.00 | | | | 1,008.50 | | | | 0.85 | | | | 4.30 | | | | 1,000.00 | | | | 1,020.92 | | | | 0.85 | | | | 4.33 | |
ING Euro STOXX 50® Index Portfolio |
| Class ADV | | | | | 1,000.00 | | | | 1,205.70 | | | | 0.90 | | | | 5.00 | | | | 1,000.00 | | | | 1,020.67 | | | | 0.90 | | | | 4.58 | |
| Class I | | | | | 1,000.00 | | | | 1,209.40 | | | | 0.40 | | | | 2.23 | | | | 1,000.00 | | | | 1,023.19 | | | | 0.40 | | | | 2.04 | |
ING FTSE 100 Index® Portfolio |
| Class ADV | | | | | 1,000.00 | | | | 1,279.50 | | | | 0.89 | | | | 5.11 | | | | 1,000.00 | | | | 1,020.72 | | | | 0.89 | | | | 4.53 | |
| Class I | | | | | 1,000.00 | | | | 1,282.70 | | | | 0.39 | | | | 2.24 | | | | 1,000.00 | | | | 1,023.24 | | | | 0.39 | | | | 1.99 | |
ING Hang Seng Index Portfolio |
| Class ADV | | | | | 1,000.00 | | | | 1,160.20 | | | | 1.24 | | | | 6.75 | | | | 1,000.00 | | | | 1,018.95 | | | | 1.24 | | | | 6.31 | |
| Class I | | | | | 1,000.00 | | | | 1,162.30 | | | | 0.74 | | | | 4.03 | | | | 1,000.00 | | | | 1,021.48 | | | | 0.74 | | | | 3.77 | |
| Class S | | | | | 1,000.00 | | | | 1,161.80 | | | | 0.99 | | | | 5.39 | | | | 1,000.00 | | | | 1,020.21 | | | | 0.99 | | | | 5.04 | |
ING International Index Portfolio |
| Class ADV | | | | | 1,000.00 | | | | 1,245.60 | | | | 0.99 | | | | 5.60 | | | | 1,000.00 | | | | 1,020.21 | | | | 0.99 | | | | 5.04 | |
| Class I | | | | | 1,000.00 | | | | 1,248.50 | | | | 0.50 | | | | 2.83 | | | | 1,000.00 | | | | 1,022.68 | | | | 0.50 | | | | 2.55 | |
| Class S | | | | | 1,000.00 | | | | 1,248.50 | | | | 0.75 | | | | 4.25 | | | | 1,000.00 | | | | 1,021.42 | | | | 0.75 | | | | 3.82 | |
| Class S2 | | | | | 1,000.00 | | | | 1,247.40 | | | | 0.90 | | | | 5.10 | | | | 1,000.00 | | | | 1,020.67 | | | | 0.90 | | | | 4.58 | |
ING Japan TOPIX Index Portfolio |
| Class ADV | | | | | 1,000.00 | | | | 1,175.50 | | | | 0.92 | | | | 5.04 | | | | 1,000.00 | | | | 1,020.57 | | | | 0.92 | | | | 4.69 | |
| Class I | | | | | 1,000.00 | | | | 1,177.90 | | | | 0.42 | | | | 2.31 | | | | 1,000.00 | | | | 1,023.09 | | | | 0.42 | | | | 2.14 | |
ING WisdomTreeSM Global High-Yielding Equity Index Portfolio |
| Class ADV | | | | | 1,000.00 | | | | 1,223.80 | | | | 1.34 | | | | 7.51 | | | | 1,000.00 | | | | 1,018.45 | | | | 1.34 | | | | 6.82 | |
| Class I | | | | | 1,000.00 | | | | 1,213.50 | | | | 0.84 | | | | 4.69 | | | | 1,000.00 | | | | 1,020.97 | | | | 0.84 | | | | 4.28 | |
| Class S | | | | | 1,000.00 | | | | 1,224.60 | | | | 1.09 | | | | 6.11 | | | | 1,000.00 | | | | 1,019.71 | | | | 1.09 | | | | 5.55 | |
| * | | Expenses are equal to each Portfolio’s respective annualized expense ratios multiplied by the average account value over the period, multiplied by 184/365 to reflect the most recent fiscal half-year. |
33
REPORT OF INDEPENDENT REGISTERED PUBLIC ACCOUNTING FIRM
The Shareholders and Board of Directors
ING Variable Portfolios, Inc.
We have audited the accompanying statements of assets and liabilities, including the portfolio of investments or summary portfolios of investments as indicated, of ING RussellTM Large Cap Index Portfolio, ING RussellTM Large Cap Growth Index Portfolio, ING RussellTM Large Cap Value Index Portfolio, ING RussellTM Mid Cap Index Portfolio, ING RussellTM Mid Cap Growth Index Portfolio, ING RussellTM Small Cap Index Portfolio, ING U.S. Bond Index Portfolio, ING Euro STOXX 50® Index Portfolio (formerly, ING Dow Jones Euro STOXX 50® Index Portfolio), ING FTSE 100 Index® Portfolio, ING Hang Seng Index Portfolio, ING International Index Portfolio, ING Japan TOPIX Index Portfolio (formerly, ING Japan Equity Index Portfolio), and ING WisdomTreeSM Global High-Yielding Equity Index Portfolio, each a series of the ING Variable Portfolios, Inc., as of December 31, 2010, and the related statements of operations for the year then ended, the statements of changes in net assets for each of the years or periods in the two-year period then ended, and the financial highlights for each of the years or periods in the two-year period then ended. These financial statements and financial highlights are the responsibility of management. Our responsibility is to express an opinion on these financial statements and financial highlights based on our audits.
We conducted our audits in accordance with the standards of the Public Company Accounting Oversight Board (United States). Those standards require that we plan and perform the audit to obtain reasonable assurance about whether the financial statements and financial highlights are free of material misstatement. An audit includes examining, on a test basis, evidence supporting the amounts and disclosures in the financial statements. Our procedures included confirmation of securities owned as of December 31, 2010, by correspondence with the custodian, transfer agent, and brokers, or by other appropriate auditing procedures when replies from brokers were not received. An audit also includes assessing the accounting principles used and significant estimates made by management, as well as evaluating the overall financial statement presentation. We believe that our audits provide a reasonable basis for our opinion.
In our opinion, the financial statements and financial highlights referred to above present fairly, in all material respects, the financial position of the aforementioned portfolios as of December 31, 2010, and the results of their operations, the changes in their net assets, and the financial highlights for the periods specified in the first paragraph above, in conformity with U.S. generally accepted accounting principles.
Boston, Massachusetts
February 21, 2011
34
STATEMENTS OF ASSETS AND LIABILITIES AS OF DECEMBER 31, 2010
| | | | ING
RussellTM Large
Cap Index
Portfolio
| | ING
RussellTM Large Cap
Growth Index
Portfolio
| | ING
RussellTM Large Cap
Value Index
Portfolio
| | ING
RussellTM Mid
Cap Index
Portfolio
|
|---|
ASSETS: | | | | | | | | | | | | | | | | | | |
| Investments in securities at value+* | | | | $ | 774,926,034 | | | $ | 384,289,818 | | | $ | 88,477,250 | | | $ | 1,534,239,916 | |
| Short-term investments** | | | | | 37,370,778 | | | | 8,874,186 | | | | 532,000 | | | | 71,836,016 | |
| Cash | | | | | 523,125 | | | | 881 | | | | 700 | | | | — | |
| Cash collateral for futures | | | | | 2,212,255 | | | | 261,075 | | | | 57,496 | | | | 2,045,970 | |
| Receivables: | | | | | | | | | | | | | | | | | | |
| Investment securities sold | | | | | — | | | | — | | | | — | | | | 85,308 | |
| Fund shares sold | | | | | 672,893 | | | | 450 | | | | 53,497 | | | | 228,857 | |
| Dividends and interest | | | | | 925,418 | | | | 361,332 | | | | 129,176 | | | | 1,684,000 | |
| Prepaid expenses | | | | | 13,601 | | | | 6,464 | | | | 1,514 | | | | 25,700 | |
| Reimbursement due from manager | | | | | — | | | | — | | | | — | | | | 39,487 | |
| Total assets | | | | | 816,644,104 | | | | 393,794,206 | | | | 89,251,633 | | | | 1,610,185,254 | |
| |
LIABILITIES: | | | | | | | | | | | | | | | | | | |
| Payable for fund shares redeemed | | | | | 1,081,304 | | | | 364,147 | | | | 26,178 | | | | 2,090,257 | |
| Payable upon receipt of securities loaned | | | | | 9,681,365 | | | | 5,772,314 | | | | — | | | | 40,808,784 | |
| Payable to affiliates | | | | | 335,816 | | | | 178,821 | | | | 42,315 | | | | 589,678 | |
| Payable to custodian due to bank overdraft | | | | | — | | | | — | | | | — | | | | 84,665 | |
| Payable for directors fees | | | | | 3,751 | | | | 1,833 | | | | 412 | | | | 7,180 | |
| Other accrued expenses and liabilities | | | | | 197,804 | | | | 52,984 | | | | 64,740 | | | | 149,916 | |
| Total liabilities | | | | | 11,300,040 | | | | 6,370,099 | | | | 133,645 | | | | 43,730,480 | |
NET ASSETS | | | | $ | 805,344,064 | | | $ | 387,424,107 | | | $ | 89,117,988 | | | $ | 1,566,454,774 | |
| |
NET ASSETS WERE COMPRISED OF: | | | | | | | | | | | | | | | | | | |
| Paid-in capital | | | | $ | 872,709,665 | | | $ | 490,328,781 | | | $ | 88,367,343 | | | $ | 1,115,968,723 | |
| Undistributed net investment income | | | | | 11,150,027 | | | | 4,392,640 | | | | 1,401,730 | | | | 19,396,304 | |
| Accumulated net realized loss | | | | | (305,518,925 | ) | | | (201,350,489 | ) | | | (23,907,754 | ) | | | 1,043,048 | |
| Net unrealized appreciation | | | | | 227,003,297 | | | | 94,053,175 | | | | 23,256,669 | | | | 430,046,699 | |
NET ASSETS | | | | $ | 805,344,064 | | | $ | 387,424,107 | | | $ | 89,117,988 | | | $ | 1,566,454,774 | |
| | | | | | | | | | | | | | | | | | |
| +Including securities loaned at value | | | | $ | 9,403,056 | | | $ | 5,638,239 | | | $ | — | | | $ | 39,883,827 | |
| *Cost of investments in securities | | | | $ | 548,647,629 | | | $ | 290,203,157 | | | $ | 65,237,521 | | | $ | 1,104,631,879 | |
| **Cost of short-term investments | | | | $ | 37,475,365 | | | $ | 9,120,314 | | | $ | 532,000 | | | $ | 71,889,784 | |
See Accompanying Notes to Financial Statements
35
STATEMENTS OF ASSETS AND LIABILITIES AS OF DECEMBER 31, 2010 (CONTINUED)
| | | | ING
RussellTM Large
Cap Index
Portfolio
| | ING
RussellTM Large Cap
Growth Index
Portfolio
| | ING
RussellTM Large Cap
Value Index
Portfolio
| | ING
RussellTM Mid
Cap Index
Portfolio
|
|---|
Class ADV: | | | | | | | | | | | | | | | | | | |
| Net assets | | | | $ | 10,160,856 | | | $ | 241,729 | | | $ | 26,604 | | | $ | 13,988,291 | |
| Shares authorized | | | | | 100,000,000 | | | | 100,000,000 | | | | 100,000,000 | | | | 100,000,000 | |
| Par value | | | | $ | 0.001 | | | $ | 0.001 | | | $ | 0.001 | | | $ | 0.001 | |
| Shares outstanding | | | | | 1,060,798 | | | | 16,906 | | | | 2,124 | | | | 1,221,792 | |
| Net asset value and redemption price per share | | | | $ | 9.58 | | | $ | 14.30 | | | $ | 12.52 | | | $ | 11.45 | |
| |
Class I: | | | | | | | | | | | | | | | | | | |
| Net assets | | | | $ | 340,889,137 | | | $ | 239,910,399 | | | $ | 45,589,508 | | | $ | 1,389,675,932 | |
| Shares authorized | | | | | 400,000,000 | | | | 100,000,000 | | | | 100,000,000 | | | | 300,000,000 | |
| Par value | | | | $ | 0.001 | | | $ | 0.001 | | | $ | 0.001 | | | $ | 0.001 | |
| Shares outstanding | | | | | 35,222,326 | | | | 16,672,574 | | | | 3,618,511 | | | | 120,151,157 | |
| Net asset value and redemption price per share | | | | $ | 9.68 | | | $ | 14.39 | | | $ | 12.60 | | | $ | 11.57 | |
| |
Class S: | | | | | | | | | | | | | | | | | | |
| Net assets | | | | $ | 454,246,184 | | | $ | 147,271,979 | | | $ | 43,501,876 | | | $ | 162,362,156 | |
| Shares authorized | | | | | 100,000,000 | | | | 100,000,000 | | | | 100,000,000 | | | | 100,000,000 | |
| Par value | | | | $ | 0.001 | | | $ | 0.001 | | | $ | 0.001 | | | $ | 0.001 | |
| Shares outstanding | | | | | 47,140,332 | | | | 10,270,793 | | | | 3,461,395 | | | | 14,120,347 | |
| Net asset value and redemption price per share | | | | $ | 9.64 | | | $ | 14.34 | | | $ | 12.57 | | | $ | 11.50 | |
| |
Class S2: | | | | | | | | | | | | | | | | | | |
| Net assets | | | | $ | 47,887 | | | | n/a | | | | n/a | | | $ | 428,395 | |
| Shares authorized | | | | | 100,000,000 | | | | n/a | | | | n/a | | | | 100,000,000 | |
| Par value | | | | $ | 0.001 | | | | n/a | | | | n/a | | | $ | 0.001 | |
| Shares outstanding | | | | | 4,880 | | | | n/a | | | | n/a | | | | 37,304 | |
| Net asset value and redemption price per share | | | | $ | 9.81 | | | | n/a | | | | n/a | | | $ | 11.48 | |
See Accompanying Notes to Financial Statements
36
STATEMENTS OF ASSETS AND LIABILITIES AS OF DECEMBER 31, 2010
| | | | ING
RussellTM Mid Cap
Growth Index
Portfolio
| | ING
RussellTM Small
Cap Index
Portfolio
| | ING
U.S. Bond
Index
Portfolio
| | ING
Euro
STOXX 50® Index
Portfolio
|
|---|
ASSETS: | | | | | | | | | | | | | | | | | | |
| Investments in securities at value+* | | | | $ | 319,309,542 | | | $ | 759,001,170 | | | $ | 3,845,320,713 | | | $ | 852,557,637 | |
| Investments in affiliates** | | | | | — | | | | — | | | | — | | | | 15,404,117 | |
| Short-term investments*** | | | | | 30,535,994 | | | | 51,855,007 | | | | 835,381,069 | | | | 12,736,572 | |
| Cash | | | | | 961 | | | | 1,605 | | | | — | | | | 7,383,586 | |
| Cash collateral for futures | | | | | 1,380,090 | | | | 654,360 | | | | — | | | | 3,798,082 | |
| Foreign currencies at value**** | | | | | — | | | | 136,054 | | | | — | | | | — | |
| Foreign cash collateral for futures***** | | | | | — | | | | — | | | | — | | | | 1,663,091 | |
| Receivables: | | | | | | | | | | | | | | | | | | |
| Investment securities sold | | | | | — | | | | 105,770 | | | | 9,315,740 | | | | 3,290,383 | |
| Investment securities sold on a delayed-delivery or when-issued basis | | | | | — | | | | — | | | | 20,746,173 | | | | — | |
| Fund shares sold | | | | | 24,381 | | | | 265,705 | | | | 3,327,764 | | | | 117,668 | |
| Dividends and interest | | | | | 180,688 | | | | 793,594 | | | | 22,951,164 | | | | 80,050 | |
| Unrealized appreciation on forward foreign currency contracts | | | | | — | | | | — | | | | — | | | | 510,989 | |
| Prepaid expenses | | | | | 5,111 | | | | 12,261 | | | | 66,886 | | | | 14,719 | |
| Reimbursement due from manager | | | | | — | | | | 15,975 | | | | 10,166 | | | | — | |
| Total assets | | | | | 351,436,767 | | | | 812,841,501 | | | | 4,737,119,675 | | | | 897,556,894 | |
| |
LIABILITIES: | | | | | | | | | | | | | | | | | | |
| Payable for investment securities purchased | | | | | — | | | | — | | | | 196,290,427 | | | | — | |
| Payable for investment securities purchased on a delayed-delivery or when-issued basis | | | | | — | | | | — | | | | 509,309,844 | | | | — | |
| Payable for fund shares redeemed | | | | | 2,217,749 | | | | 2,378,167 | | | | 486,702 | | | | 175,449 | |
| Payable upon receipt of securities loaned | | | | | 8,812,566 | | | | 40,435,473 | | | | 121,022,135 | | | | 12,736,572 | |
| Unrealized depreciation on forward foreign currency contracts | | | | | — | | | | — | | | | — | | | | 457,356 | |
| Payable to affiliates | | | | | 198,016 | | | | 330,153 | | | | 1,396,120 | | | | 272,002 | |
| Payable to custodian due to foreign currency overdraft****** | | | | | — | | | | — | | | | — | | | | 5,114,134 | |
| Payable for directors fees | | | | | 1,451 | | | | 3,452 | | | | 18,291 | | | | 4,081 | |
| Other accrued expenses and liabilities | | | | | 57,088 | | | | 78,762 | | | | 495,279 | | | | 182,061 | |
| Total liabilities | | | | | 11,286,870 | | | | 43,226,007 | | | | 829,018,798 | | | | 18,941,655 | |
NET ASSETS | | | | $ | 340,149,897 | | | $ | 769,615,494 | | | $ | 3,908,100,877 | | | $ | 878,615,239 | |
| |
NET ASSETS WERE COMPRISED OF: | | | | | | | | | | | | | | | | | | |
| Paid-in capital | | | | $ | 417,755,310 | | | $ | 592,611,040 | | | $ | 3,781,738,520 | | | $ | 878,189,412 | |
| Undistributed (distributions in excess of) net investment income | | | | | 1,336,446 | | | | 6,281,112 | | | | 1,366,051 | | | | 24,410,025 | |
| Accumulated net realized gain (loss) | | | | | (177,407,903 | ) | | | (10,035,711 | ) | | | 62,518,932 | | | | (11,397,880 | ) |
| Net unrealized appreciation or depreciation | | | | | 98,466,044 | | | | 180,759,053 | | | | 62,477,374 | | | | (12,586,318 | ) |
NET ASSETS | | | | $ | 340,149,897 | | | $ | 769,615,494 | | | $ | 3,908,100,877 | | | $ | 878,615,239 | |
| | | | | | | | | | | | | | | | | | |
| +Including securities loaned at value | | | | $ | 8,613,721 | | | $ | 39,204,684 | | | $ | 119,877,995 | | | $ | 12,122,310 | |
| *Cost of investments in securities | | | | $ | 220,975,188 | | | $ | 578,463,004 | | | $ | 3,782,911,020 | | | $ | 867,085,095 | |
| **Cost of investments in affiliates | | | | $ | — | | | $ | — | | | $ | — | | | $ | 13,349,503 | |
| ***Cost of short-term investments | | | | $ | 30,751,566 | | | $ | 51,955,473 | | | $ | 835,313,388 | | | $ | 12,736,572 | |
| ****Cost of foreign currencies | | | | $ | — | | | $ | 142,147 | | | $ | — | | | $ | — | |
| *****Cost of foreign cash collateral for futures | | | | $ | — | | | $ | — | | | $ | — | | | $ | 1,663,091 | |
| ******Cost of foreign currency overdraft | | | | $ | — | | | $ | — | | | $ | — | | | $ | 5,114,134 | |
See Accompanying Notes to Financial Statements
37
STATEMENTS OF ASSETS AND LIABILITIES AS OF DECEMBER 31, 2010 (CONTINUED)
| | | | ING
RussellTM Mid Cap
Growth Index
Portfolio
| | ING
RussellTM Small
Cap Index
Portfolio
| | ING
U.S. Bond
Index
Portfolio
| | ING
Euro
STOXX 50® Index
Portfolio
|
|---|
Class ADV: | | | | | | | | | | | | | | | | | | |
| Net assets | | | | $ | 4,903 | | | $ | 13,050,971 | | | $ | 3,713,887 | | | $ | 4,936,646 | |
| Shares authorized | | | | | 100,000,000 | | | | 100,000,000 | | | | 100,000,000 | | | | 100,000,000 | |
| Par value | | | | $ | 0.001 | | | $ | 0.001 | | | $ | 0.001 | | | $ | 0.001 | |
| Shares outstanding | | | | | 301 | | | | 1,069,869 | | | | 346,674 | | | | 470,414 | |
| Net asset value and redemption price per share | | | | $ | 16.29 | | | $ | 12.20 | | | $ | 10.71 | | | $ | 10.49 | |
| |
Class I: | | | | | | | | | | | | | | | | | | |
| Net assets | | | | $ | 12,615,218 | | | $ | 550,464,905 | | | $ | 3,655,180,826 | | | $ | 873,678,593 | |
| Shares authorized | | | | | 100,000,000 | | | | 100,000,000 | | | | 100,000,000 | | | | 200,000,000 | |
| Par value | | | | $ | 0.001 | | | $ | 0.001 | | | $ | 0.001 | | | $ | 0.001 | |
| Shares outstanding | | | | | 770,382 | | | | 44,596,547 | | | | 340,491,133 | | | | 82,670,429 | |
| Net asset value and redemption price per share | | | | $ | 16.38 | | | $ | 12.34 | | | $ | 10.74 | | | $ | 10.57 | |
| |
Class S: | | | | | | | | | | | | | | | | | | |
| Net assets | | | | $ | 325,748,684 | | | $ | 205,956,389 | | | $ | 249,202,946 | | | | n/a | |
| Shares authorized | | | | | 100,000,000 | | | | 100,000,000 | | | | 100,000,000 | | | | n/a | |
| Par value | | | | $ | 0.001 | | | $ | 0.001 | | | $ | 0.001 | | | | n/a | |
| Shares outstanding | | | | | 19,941,799 | | | | 16,780,820 | | | | 23,267,723 | | | | n/a | |
| Net asset value and redemption price per share | | | | $ | 16.33 | | | $ | 12.27 | | | $ | 10.71 | | | | n/a | |
| |
Class S2: | | | | | | | | | | | | | | | | | | |
| Net assets | | | | $ | 1,781,092 | | | $ | 143,229 | | | $ | 3,218 | | | | n/a | |
| Shares authorized | | | | | 100,000,000 | | | | 100,000,000 | | | | 100,000,000 | | | | n/a | |
| Par value | | | | $ | 0.001 | | | $ | 0.001 | | | $ | 0.001 | | | | n/a | |
| Shares outstanding | | | | | 109,238 | | | | 11,719 | | | | 300 | | | | n/a | |
| Net asset value and redemption price per share | | | | $ | 16.30 | | | $ | 12.22 | | | $ | 10.72 | | | | n/a | |
See Accompanying Notes to Financial Statements
38
STATEMENTS OF ASSETS AND LIABILITIES AS OF DECEMBER 31, 2010
| | | | ING
FTSE 100
Index®
Portfolio
| | ING
Hang Seng
Index
Portfolio
| | ING
International
Index
Portfolio
|
|---|
ASSETS: | | | | | | �� | | | | | | | | |
| Investments in securities at value+* | | | | $ | 660,483,813 | | | $ | 214,026,027 | | | $ | 355,011,202 | |
| Investments in affiliates** | | | | | — | | | | — | | | | 1,228,824 | |
| Short-term investments*** | | | | | 3,137,068 | | | | 6,261,000 | | | | 6,660,296 | |
| Cash | | | | | 3,031 | | | | 125 | | | | 218 | |
| Cash collateral for futures | | | | | 4,460,793 | | | | 1,199,585 | | | | 2,317,021 | |
| Foreign currencies at value**** | | | | | 1,560,699 | | | | 887,966 | | | | 5,814,913 | |
| Foreign cash collateral for futures***** | | | | | 2,367,037 | | | | 373,607 | | | | 601,556 | |
| Receivables: | | | | | | | | | | | | | | |
| Fund shares sold | | | | | 57,632 | | | | 299,767 | | | | 490,923 | |
| Dividends and interest | | | | | 1,943,356 | | | | 219,282 | | | | 604,422 | |
| Unrealized appreciation on forward foreign currency contracts | | | | | 73,990 | | | | — | | | | 119,287 | |
| Prepaid expenses | | | | | 11,264 | | | | 3,041 | | | | 6,234 | |
| Reimbursement due from manager | | | | | — | | | | — | | | | 13,040 | |
| Total assets | | | | | 674,098,683 | | | | 223,270,400 | | | | 372,867,936 | |
| |
LIABILITIES: | | | | | | | | | | | | | | |
| Payable for fund shares redeemed | | | | | 137,134 | | | | 32,971 | | | | 534,288 | |
| Payable upon receipt of securities loaned | | | | | 3,137,068 | | | | — | | | | 4,903,841 | |
| Unrealized depreciation on forward foreign currency contracts | | | | | 533,959 | | | | — | | | | 425,919 | |
| Payable to affiliates | | | | | 206,019 | | | | 129,518 | | | | 171,406 | |
| Payable for directors fees | | | | | 3,116 | | | | 833 | | | | 1,677 | |
| Other accrued expenses and liabilities | | | | | 116,624 | | | | 130,487 | | | | 170,361 | |
| Payable for borrowings against line of credit | | | | | 1,040,000 | | | | — | | | | — | |
| Total liabilities | | | | | 5,173,920 | | | | 293,809 | | | | 6,207,492 | |
NET ASSETS | | | | $ | 668,924,763 | | | $ | 222,976,591 | | | $ | 366,660,444 | |
| |
NET ASSETS WERE COMPRISED OF: | | | | | | | | | | | | | | |
| Paid-in capital | | | | $ | 551,787,113 | | | $ | 203,847,101 | | | $ | 440,825,951 | |
| Undistributed net investment income | | | | | 16,480,679 | | | | 4,337,456 | | | | 8,813,114 | |
| Accumulated net realized gain (loss) | | | | | 6,313,696 | | | | (3,203,146 | ) | | | (172,764,557 | ) |
| Net unrealized appreciation | | | | | 94,343,275 | | | | 17,995,180 | | | | 89,785,936 | |
NET ASSETS | | | | $ | 668,924,763 | | | $ | 222,976,591 | | | $ | 366,660,444 | |
| | | | | | | | | | | | | | |
| +Including securities loaned at value | | | | $ | 2,976,648 | | | $ | — | | | $ | 4,657,779 | |
| *Cost of investments in securities | | | | $ | 565,798,653 | | | $ | 196,078,372 | | | $ | 265,393,068 | |
| **Cost of investments in affiliates | | | | $ | — | | | $ | — | | | $ | 940,126 | |
| ***Cost of short-term investments | | | | $ | 3,137,068 | | | $ | 6,261,000 | | | $ | 6,667,841 | |
| ****Cost of foreign currencies | | | | $ | 1,547,302 | | | $ | 890,897 | | | $ | 5,690,171 | |
| *****Cost of foreign cash collateral for futures | | | | $ | 2,350,200 | | | $ | 373,348 | | | $ | 595,196 | |
See Accompanying Notes to Financial Statements
39
STATEMENTS OF ASSETS AND LIABILITIES AS OF DECEMBER 31, 2010 (CONTINUED)
| | | | ING
FTSE 100
Index®
Portfolio
| | ING
Hang Seng
Index
Portfolio
| | ING
International
Index
Portfolio
|
|---|
Class ADV: | | | | | | | | | | | | | | |
| Net assets | | | | $ | 3,733,825 | | | $ | 1,146,631 | | | $ | 2,904,499 | |
| Shares authorized | | | | | 100,000,000 | | | | 100,000,000 | | | | 100,000,000 | |
| Par value | | | | $ | 0.001 | | | $ | 0.001 | | | $ | 0.001 | |
| Shares outstanding | | | | | 299,782 | | | | 82,025 | | | | 342,953 | |
| Net asset value and redemption price per share | | | | $ | 12.46 | | | $ | 13.98 | | | $ | 8.47 | |
| |
Class I: | | | | | | | | | | | | | | |
| Net assets | | | | $ | 665,190,938 | | | $ | 137,226,532 | | | $ | 256,722,851 | |
| Shares authorized | | | | | 100,000,000 | | | | 100,000,000 | | | | 200,000,000 | |
| Par value | | | | $ | 0.001 | | | $ | 0.001 | | | $ | 0.001 | |
| Shares outstanding | | | | | 53,082,640 | | | | 9,772,074 | | | | 30,065,660 | |
| Net asset value and redemption price per share | | | | $ | 12.53 | | | $ | 14.04 | | | $ | 8.54 | |
| |
Class S: | | | | | | | | | | | | | | |
| Net assets | | | | | n/a | | | $ | 84,603,428 | | | $ | 107,028,035 | |
| Shares authorized | | | | | n/a | | | | 100,000,000 | | | | 100,000,000 | |
| Par value | | | | | n/a | | | $ | 0.001 | | | $ | 0.001 | |
| Shares outstanding | | | | | n/a | | | | 6,044,797 | | | | 12,610,218 | |
| Net asset value and redemption price per share | | | | | n/a | | | $ | 14.00 | | | $ | 8.49 | |
| |
Class S2: | | | | | | | | | | | | | | |
| Net assets | | | | | n/a | | | | n/a | | | $ | 5,059 | |
| Shares authorized | | | | | n/a | | | | n/a | | | | 100,000,000 | |
| Par value | | | | | n/a | | | | n/a | | | $ | 0.001 | |
| Shares outstanding | | | | | n/a | | | | n/a | | | | 594 | |
| Net asset value and redemption price per share | | | | | n/a | | | | n/a | | | $ | 8.52 | |
See Accompanying Notes to Financial Statements
40
STATEMENTS OF ASSETS AND LIABILITIES AS OF DECEMBER 31, 2010
| | | | ING
Japan TOPIX
Index
Portfolio
| | ING
WisdomTreeSM Global
High-Yielding Equity Index
Portfolio
| |
|---|
ASSETS: | | | | | | | | | | | |
| Investments in securities at value+* | | | | $ | 409,682,915 | | | $ | 205,493,048 | | |
| Short-term investments** | | | | | 27,020,064 | | | | — | | |
| Cash | | | | | 4,567 | | | | 48,310 | | |
| Cash collateral for futures | | | | | 1,660,298 | | | | — | | |
| Foreign currencies at value*** | | | | | 4,176,124 | | | | 374,182 | | |
| Foreign cash collateral for futures**** | | | | | 155,469 | | | | — | | |
| Receivables: | | | | | | | | | | | |
| Investment securities sold | | | | | 10,286,225 | | | | 280,747 | | |
| Fund shares sold | | | | | 34,847 | | | | 594,216 | | |
| Dividends and interest | | | | | 366,264 | | | | 552,254 | | |
| Unrealized appreciation on forward foreign currency contracts | | | | | 19,646 | | | | — | | |
| Prepaid expenses | | | | | 9,193 | | | | 3,620 | | |
| Reimbursement due from manager | | | | | — | | | | 15,848 | | |
| Total assets | | | | | 453,415,612 | | | | 207,362,225 | | |
| |
LIABILITIES: | | | | | | | | | | | |
| Payable for investment securities purchased | | | | | 96,741 | | | | 196 | | |
| Payable for fund shares redeemed | | | | | 89,784 | | | | 10,524 | | |
| Payable upon receipt of securities loaned | | | | | 27,020,064 | | | | — | | |
| Payable to affiliates | | | | | 127,841 | | | | 140,237 | | |
| Payable for directors fees | | | | | 2,428 | | | | 1,013 | | |
| Other accrued expenses and liabilities | | | | | 119,869 | | | | 213,680 | | |
| Payable for borrowings against line of credit | | | | | 12,675,000 | | | | 85,000 | | |
| Total liabilities | | | | | 40,131,727 | | | | 450,650 | | |
NET ASSETS | | | | $ | 413,283,885 | | | $ | 206,911,575 | | |
| |
NET ASSETS WERE COMPRISED OF: | | | | | | | | | | | |
| Paid-in capital | | | | $ | 353,497,666 | | | $ | 237,662,413 | | |
| Undistributed net investment income | | | | | 8,210,613 | | | | 6,106,422 | | |
| Accumulated net realized gain (loss) | | | | | 1,221,559 | | | | (50,313,150 | ) | |
| Net unrealized appreciation | | | | | 50,354,047 | | | | 13,455,890 | | |
NET ASSETS | | | | $ | 413,283,885 | | | $ | 206,911,575 | | |
| | | | | | | | | | | |
| +Including securities loaned at value | | | | $ | 25,688,242 | | | $ | — | | |
| *Cost of investments in securities | | | | $ | 359,633,969 | | | $ | 192,062,522 | | |
| **Cost of short-term investments | | | | $ | 27,020,064 | | | $ | — | | |
| ***Cost of foreign currencies | | | | $ | 4,048,944 | | | $ | 362,188 | | |
| ****Cost of foreign cash collateral for futures | | | | $ | 150,693 | | | $ | — | | |
See Accompanying Notes to Financial Statements
41
STATEMENTS OF ASSETS AND LIABILITIES AS OF DECEMBER 31, 2010 (CONTINUED)
| | | | ING
Japan TOPIX
Index
Portfolio
| | ING
WisdomTreeSM Global
High-Yielding Equity Index
Portfolio
| |
|---|
Class ADV: | | | | | | | | | | | |
| Net assets | | | | $ | 8,580,463 | | | $ | 695,312 | | |
| Shares authorized | | | | | 100,000,000 | | | | 100,000,000 | | |
| Par value | | | | $ | 0.001 | | | $ | 0.001 | | |
| Shares outstanding | | | | | 771,642 | | | | 87,689 | | |
| Net asset value and redemption price per share | | | | $ | 11.12 | | | $ | 7.93 | | |
| |
Class I: | | | | | | | | | | | |
| Net assets | | | | $ | 404,703,422 | | | $ | 8 | | |
| Shares authorized | | | | | 100,000,000 | | | | 100,000,000 | | |
| Par value | | | | $ | 0.001 | | | $ | 0.001 | | |
| Shares outstanding | | | | | 36,153,104 | | | | 1 | | |
| Net asset value and redemption price per share | | | | $ | 11.19 | | | $ | 7.73 | | |
| |
Class S: | | | | | | | | | | | |
| Net assets | | | | | n/a | | | $ | 206,216,255 | | |
| Shares authorized | | | | | n/a | | | | 100,000,000 | | |
| Par value | | | | | n/a | | | $ | 0.001 | | |
| Shares outstanding | | | | | n/a | | | | 25,893,083 | | |
| Net asset value and redemption price per share | | | | | n/a | | | $ | 7.96 | | |
See Accompanying Notes to Financial Statements
42
STATEMENTS OF OPERATIONS FOR THE YEAR ENDED DECEMBER 31, 2010
| | | | ING
RussellTM Large
Cap Index
Portfolio
| | ING
RussellTM Large Cap
Growth Index
Portfolio
| | ING
RussellTM Large Cap
Value Index
Portfolio
| | ING
RussellTM Mid
Cap Index
Portfolio
|
|---|
INVESTMENT INCOME: | | | | | | | | | | | | | | | | | | |
Dividends, net of foreign taxes withheld*(1) | | | | $ | 15,079,165 | | | $ | 6,501,887 | | | $ | 1,920,265 | | | $ | 26,628,926 | |
| Interest | | | | | — | | | | — | | | | — | | | | 34 | |
| Securities lending income, net | | | | | 15,216 | | | | 10,170 | | | | 280 | | | | 508,038 | |
| Total investment income | | | | | 15,094,381 | | | | 6,512,057 | | | | 1,920,545 | | | | 27,136,998 | |
| |
EXPENSES: | | | | | | | | | | | | | | | | | | |
| Investment management fees | | | | | 1,875,543 | | | | 1,649,617 | | | | 370,600 | | | | 4,451,908 | |
| Distribution and service fees: | | | | | | | | | | | | | | | | | | |
| Class ADV | | | | | 40,596 | | | | 870 | | | | 126 | | | | 34,010 | |
| Class S | | | | | 1,092,040 | | | | 344,623 | | | | 92,424 | | | | 322,192 | |
| Class S2 | | | | | 72 | | | | 6 | | | | 6 | | | | 368 | |
| Transfer agent fees | | | | | 995 | | | | 821 | | | | 461 | | | | 2,442 | |
| Administrative service fees | | | | | 750,212 | | | | 366,577 | | | | 82,354 | | | | 1,436,077 | |
| Shareholder reporting expense | | | | | 87,257 | | | | 15,847 | | | | 20,020 | | | | 106,973 | |
| Professional fees | | | | | 37,640 | | | | 28,250 | | | | 14,147 | | | | 130,746 | |
| Custody and accounting expense | | | | | 78,405 | | | | 38,046 | | | | 5,058 | | | | 187,322 | |
| Directors fees | | | | | 38,730 | | | | 18,149 | | | | 3,962 | | | | 74,139 | |
| Miscellaneous expense | | | | | 70,504 | | | | 22,133 | | | | 9,484 | | | | 71,815 | |
| Interest expense | | | | | 686 | | | | 246 | | | | 19 | | | | 2,417 | |
| Total expenses | | | | | 4,072,680 | | | | 2,485,185 | | | | 598,661 | | | | 6,820,409 | |
| Net waived and reimbursed fees | | | | | (160,170 | ) | | | (369,285 | ) | | | (83,292 | ) | | | (276,518 | ) |
| Brokerage commission recapture | | | | | — | | | | (11,085 | ) | | | — | | | | — | |
| Net expenses | | | | | 3,912,510 | | | | 2,104,815 | | | | 515,369 | | | | 6,543,891 | |
| Net investment income | | | | | 11,181,871 | | | | 4,407,242 | | | | 1,405,176 | | | | 20,593,107 | |
| |
REALIZED AND UNREALIZED GAIN (LOSS): | | | | | | | | | | | | | | | | | | |
| Net realized gain (loss) on: | | | | | | | | | | | | | | | | | | |
| Investments | | | | | (913,981 | ) | | | 10,877,869 | | | | 3,129,924 | | | | 2,557,685 | |
| Foreign currency related transactions | | | | | — | | | | 260 | | | | — | | | | — | |
| Futures | | | | | 4,387,334 | | | | 309,783 | | | | 94,778 | | | | 10,034,784 | |
| Net realized gain | | | | | 3,473,353 | | | | 11,187,912 | | | | 3,224,702 | | | | 12,592,469 | |
| Net change in unrealized appreciation or depreciation on: | | | | | | | | | | | | | | | | | | |
| Investments | | | | | 73,192,257 | | | | 27,849,675 | | | | 3,689,147 | | | | 296,024,417 | |
| Foreign currency related transactions | | | | | — | | | | (390 | ) | | | — | | | | — | |
| Futures | | | | | 539,665 | | | | 241,054 | | | | 25,803 | | | | (238,178 | ) |
| Net change in unrealized appreciation or depreciation | | | | | 73,731,922 | | | | 28,090,339 | | | | 3,714,950 | | | | 295,786,239 | |
| Net realized and unrealized gain | | | | | 77,205,275 | | | | 39,278,251 | | | | 6,939,652 | | | | 308,378,708 | |
Increase in net assets resulting from operations | | | | $ | 88,387,146 | | | $ | 43,685,493 | | | $ | 8,344,828 | | | $ | 328,971,815 | |
| | | | | | | | | | | | | | | | | | |
| *Foreign taxes withheld | | | | $ | — | | | $ | — | | | $ | 318 | | | $ | 2,056 | |
(1)Dividends from affiliates | | | | $ | 38,780 | | | $ | 5,041 | | | $ | 1,894 | | | $ | 47,680 | |
See Accompanying Notes to Financial Statements
43
STATEMENTS OF OPERATIONS FOR THE YEAR ENDED DECEMBER 31, 2010
| | | | ING
RussellTM Mid Cap
Growth Index
Portfolio
| | ING
RussellTM Small
Cap Index
Portfolio
| | ING
U.S. Bond
Index
Portfolio
| | ING
Euro
STOXX 50® Index
Portfolio
|
|---|
INVESTMENT INCOME: | | | | | | | | | | | | | | | | | | |
Dividends, net of foreign taxes withheld*(1) | | | | $ | 3,450,144 | | | $ | 9,594,123 | | | $ | 399,761 | | | $ | 25,094,425 | |
| Interest | | | | | — | | | | 26 | | | | 102,264,076 | | | | 4,941 | |
| Securities lending income, net | | | | | 77,558 | | | | 991,594 | | | | 44,399 | | | | 2,608,545 | |
| Total investment income | | | | | 3,527,702 | | | | 10,585,743 | | | | 102,708,236 | | | | 27,707,911 | |
| |
EXPENSES: | | | | | | | | | | | | | | | | | | |
| Investment management fees | | | | | 1,306,272 | | | | 2,278,406 | | | | 11,706,188 | | | | 4,897,262 | |
| Distribution and service fees: | | | | | | | | | | | | | | | | | | |
| Class ADV | | | | | 22 | | | | 29,100 | | | | 12,132 | | | | 12,832 | |
| Class S | | | | | 696,454 | | | | 411,327 | | | | 660,792 | | | | — | |
| Class S2 | | | | | 7,928 | | | | 176 | | | | 16 | | | | — | |
| Transfer agent fees | | | | | 763 | | | | 1,126 | | | | 4,857 | | | | 1,155 | |
| Administrative service fees | | | | | 290,279 | | | | 690,419 | | | | 3,658,159 | | | | 816,200 | |
| Shareholder reporting expense | | | | | 10,602 | | | | 41,941 | | | | 311,068 | | | | 39,546 | |
| Professional fees | | | | | 26,140 | | | | 52,921 | | | | 324,120 | | | | 68,191 | |
| Custody and accounting expense | | | | | 37,361 | | | | 100,241 | | | | 483,373 | | | | 211,846 | |
| Directors fees | | | | | 13,842 | | | | 32,541 | | | | 178,056 | | | | 34,580 | |
| Miscellaneous expense | | | | | 21,869 | | | | 37,848 | | | | 173,213 | | | | 56,428 | |
| Interest expense | �� | | | | 461 | | | | 195 | | | | 1,047 | | | | 2,659 | |
| Total expenses | | | | | 2,411,993 | | | | 3,676,241 | | | | 17,513,021 | | | | 6,140,699 | |
| Net waived and reimbursed fees | | | | | (296,112 | ) | | | (127,193 | ) | | | (348,934 | ) | | | (2,856,716 | ) |
| Net expenses | | | | | 2,115,881 | | | | 3,549,048 | | | | 17,164,087 | | | | 3,283,983 | |
| Net investment income | | | | | 1,411,821 | | | | 7,036,695 | | | | 85,544,149 | | | | 24,423,928 | |
| |
REALIZED AND UNREALIZED GAIN (LOSS): | | | | | | | | | | | | | | | | | | |
| Net realized gain (loss) on: | | | | | | | | | | | | | | | | | | |
| Investments | | | | | 12,937,752 | | | | 1,722,800 | | | | 76,097,875 | | | | (9,465,316 | ) |
| Foreign currency related transactions | | | | | — | | | | — | | | | — | | | | 412,525 | |
| Futures | | | | | 1,598,492 | | | | 3,979,692 | | | | — | | | | 816,483 | |
| Net realized gain (loss) | | | | | 14,536,244 | | | | 5,702,492 | | | | 76,097,875 | | | | (8,236,308 | ) |
| Net change in unrealized appreciation or depreciation on: | | | | | | | | | | | | | | | | | | |
| Investments | | | | | 51,782,338 | | | | 152,014,496 | | | | 53,895,514 | | | | (59,678,423 | ) |
| Foreign currency related transactions | | | | | — | | | | (4,897 | ) | | | — | | | | 84,304 | |
| Futures | | | | | 392,315 | | | | (1,274,716 | ) | | | — | | | | (567,920 | ) |
| Net change in unrealized appreciation or depreciation | | | | | 52,174,653 | | | | 150,734,883 | | | | 53,895,514 | | | | (60,162,039 | ) |
| Net realized and unrealized gain (loss) | | | | | 66,710,897 | | | | 156,437,375 | | | | 129,993,389 | | | | (68,398,347 | ) |
Increase (decrease) in net assets resulting from operations | | | | $ | 68,122,718 | | | $ | 163,474,070 | | | $ | 215,537,538 | | | $ | (43,974,419 | ) |
| | | | | | | | | | | | | | | | | | |
| *Foreign taxes withheld | | | | $ | 901 | | | $ | 318 | | | $ | — | | | $ | 4,225,332 | |
(1)Dividends from affiliates | | | | $ | 7,180 | | | $ | 42,409 | | | $ | 393,919 | | | $ | — | |
See Accompanying Notes to Financial Statements
44
STATEMENTS OF OPERATIONS FOR THE YEAR ENDED DECEMBER 31, 2010
| | | | ING
FTSE 100
Index®
Portfolio
| | ING
Hang Seng
Index
Portfolio
| | ING
International
Index
Portfolio
| |
|---|
INVESTMENT INCOME: | | | | | | | | | | | | | | | |
Dividends, net of foreign taxes withheld*(1) | | | | $ | 19,419,541 | | | $ | 4,407,005 | | | $ | 9,089,868 | | |
| Interest, net of foreign taxes withheld* | | | | | 371 | | | | — | | | | 2,749 | | |
| Securities lending income, net | | | | | 82,997 | | | | — | | | | 371,665 | | |
| Total investment income | | | | | 19,502,909 | | | | 4,407,005 | | | | 9,464,282 | | |
| |
EXPENSES: | | | | | | | | | | | | | | | |
| Investment management fees | | | | | 3,738,766 | | | | 999,220 | | | | 1,274,194 | | |
| Distribution and service fees: | | | | | | | | | | | | | | | |
| Class ADV | | | | | 10,230 | | | | 2,126 | | | | 10,384 | | |
| Class S | | | | | — | | | | 153,185 | | | | 244,308 | | |
| Class S2 | | | | | — | | | | 6 | | | | 22 | | |
| Transfer agent fees | | | | | 966 | | | | 377 | | | | 994 | | |
| Administrative service fees | | | | | 623,120 | | | | 166,535 | | | | 335,310 | | |
| Shareholder reporting expense | | | | | 30,581 | | | | 8,056 | | | | 18,304 | | |
| Professional fees | | | | | 42,971 | | | | 22,606 | | | | 31,217 | | |
| Custody and accounting expense | | | | | 77,179 | | | | 111,523 | | | | 203,096 | | |
| Directors fees | | | | | 27,602 | | | | 6,476 | | | | 16,312 | | |
| Miscellaneous expense | | | | | 66,112 | | | | 18,648 | | | | 29,550 | | |
| Interest expense | | | | | 1,598 | | | | 588 | | | | 2,556 | | |
| Licensing fees | | | | | — | | | | 66,615 | | | | — | | |
| Total expenses | | | | | 4,619,125 | | | | 1,555,961 | | | | 2,166,247 | | |
| Net waived and reimbursed fees | | | | | (2,180,931 | ) | | | (169,222 | ) | | | (228,838 | ) | |
| Net expenses | | | | | 2,438,194 | | | | 1,386,739 | | | | 1,937,409 | | |
| Net investment income | | | | | 17,064,715 | | | | 3,020,266 | | | | 7,526,873 | | |
| |
REALIZED AND UNREALIZED GAIN (LOSS): | | | | | | | | | | | | | | | |
| Net realized gain (loss) on: | | | | | | | | | | | | | | | |
| Investments | | | | | 3,866,538 | | | | (1,060,929 | ) | | | (3,863,224 | ) | |
| Foreign currency related transactions | | | | | (505,115 | ) | | | (24,292 | ) | | | 890,961 | | |
| Futures | | | | | 3,943,536 | | | | 134,861 | | | | 1,610,647 | | |
| Net realized gain (loss) | | | | | 7,304,959 | | | | (950,360 | ) | | | (1,361,616 | ) | |
| Net change in unrealized appreciation or depreciation on: | | | | | | | | | | | | | | | |
| Investments | | | | | 40,610,743 | | | | 8,949,988 | | | | 18,822,384 | | |
| Foreign currency related transactions | | | | | (485,690 | ) | | | 4,510 | | | | (128,989 | ) | |
| Futures | | | | | (162,541 | ) | | | (810,454 | ) | | | (196,309 | ) | |
| Net change in unrealized appreciation or depreciation | | | | | 39,962,512 | | | | 8,144,044 | | | | 18,497,086 | | |
| Net realized and unrealized gain | | | | | 47,267,471 | | | | 7,193,684 | | | | 17,135,470 | | |
Increase in net assets resulting from operations | | | | $ | 64,332,186 | | | $ | 10,213,950 | | | $ | 24,662,343 | | |
| | | | | | | | | | | | | | | |
| *Foreign taxes withheld | | | | $ | 325,650 | | | $ | 244,479 | | | $ | 796,123 | | |
(1)Dividends from affiliates | | | | $ | — | | | $ | 5,142 | | | $ | 7,921 | | |
See Accompanying Notes to Financial Statements
45
STATEMENTS OF OPERATIONS FOR THE YEAR ENDED DECEMBER 31, 2010
| | | | ING
Japan TOPIX
Index
Portfolio
| | ING
WisdomTreeSM Global
High-Yielding Equity Index
Portfolio
| |
|---|
INVESTMENT INCOME: | | | | | | | | | | | |
Dividends, net of foreign taxes withheld*(1) | | | | $ | 8,654,538 | | | $ | 8,747,961 | | |
| Interest, net of foreign taxes withheld* | | | | | — | | | | 24,350 | | |
| Securities lending income, net | | | | | 121,889 | | | | — | | |
| Total investment income | | | | | 8,776,427 | | | | 8,772,311 | | |
| |
EXPENSES: | | | | | | | | | | | |
| Investment management fees | | | | | 2,913,408 | | | | 932,326 | | |
| Distribution and service fees: | | | | | | | | | | | |
| Class ADV | | | | | 22,232 | | | | 1,416 | | |
| Class S | | | | | — | | | | 505,991 | | |
| Transfer agent fees | | | | | 703 | | | | 302 | | |
| Administrative service fees | | | | | 485,562 | | | | 202,678 | | |
| Shareholder reporting expense | | | | | 23,644 | | | | 16,246 | | |
| Professional fees | | | | | 46,157 | | | | 30,356 | | |
| Custody and accounting expense | | | | | 167,313 | | | | 178,979 | | |
| Directors fees | | | | | 22,344 | | | | 7,726 | | |
| Miscellaneous expense | | | | | 25,691 | | | | 15,260 | | |
| Interest expense | | | | | 3,656 | | | | 4,617 | | |
| Licensing fees | | | | | 48,562 | | | | 374,827 | | |
| Total expenses | | | | | 3,759,272 | | | | 2,270,724 | | |
| Net waived and reimbursed fees | | | | | (1,699,476 | ) | | | (53,520 | ) | |
| Net expenses | | | | | 2,059,796 | | | | 2,217,204 | | |
| Net investment income | | | | | 6,716,631 | | | | 6,555,107 | | |
| |
REALIZED AND UNREALIZED GAIN (LOSS): | | | | | | | | | | | |
| Net realized gain (loss) on: | | | | | | | | | | | |
| Investments | | | | | 3,246,206 | | | | (6,214,116 | ) | |
| Foreign currency related transactions | | | | | 1,482,663 | | | | (225,081 | ) | |
| Futures | | | | | (304,953 | ) | | | — | | |
| Net realized gain (loss) | | | | | 4,423,916 | | | | (6,439,197 | ) | |
| Net change in unrealized appreciation or depreciation on: | | | | | | | | | | | |
| Investments | | | | | 46,943,749 | | | | 9,461,381 | | |
| Foreign currency related transactions | | | | | 1,020,326 | | | | 28,966 | | |
| Futures | | | | | (79,177 | ) | | | — | | |
| Net change in unrealized appreciation or depreciation | | | | | 47,884,898 | | | | 9,490,347 | | |
| Net realized and unrealized gain | | | | | 52,308,814 | | | | 3,051,150 | | |
Increase in net assets resulting from operations | | | | $ | 59,025,445 | | | $ | 9,606,257 | | |
| | | | | | | | | | | |
| *Foreign taxes withheld | | | | $ | 651,015 | | | $ | 707,409 | | |
(1)Dividends from affiliates | | | | $ | — | | | $ | 334 | | |
See Accompanying Notes to Financial Statements
46
STATEMENTS OF CHANGES IN NET ASSETS
| | | | ING RussellTM
Large Cap Index Portfolio
| | ING RussellTM
Large Cap Growth Index Portfolio
| |
|---|
| | | | Year Ended
December 31,
2010
| | Year Ended
December 31,
2009
| | Year Ended
December 31,
2010
| | May 1, 2009(1)
to December 31,
2009
|
|---|
FROM OPERATIONS: | | | | | | | | | | | | | | | | | | |
| Net investment income | | | | $ | 11,181,871 | | | $ | 24,662,986 | | | $ | 4,407,242 | | | $ | 2,341,493 | |
| Net realized gain (loss) | | | | | 3,473,353 | | | | (162,120,812 | ) | | | 11,187,912 | | | | 4,289,147 | |
| Net change in unrealized appreciation or depreciation | | | | | 73,731,922 | | | | 452,068,751 | | | | 28,090,339 | | | | 55,670,733 | |
| Increase in net assets resulting from operations | | | | | 88,387,146 | | | | 314,610,925 | | | | 43,685,493 | | | | 62,301,373 | |
| |
FROM DISTRIBUTIONS TO SHAREHOLDERS: | | | | | | | | | | | | | | | | | | |
| Net investment income: | | | | | | | | | | | | | | | | | | |
| Class ADV | | | | | (257,832 | ) | | | — | | | | (865 | ) | | | — | |
| Class I | | | | | (9,567,028 | ) | | | (165,344 | ) | | | (1,566,141 | ) | | | — | |
| Class S | | | | | (14,948,772 | ) | | | — | | | | (786,063 | ) | | | — | |
| Total distributions | | | | | (24,773,632 | ) | | | (165,344 | ) | | | (2,353,069 | ) | | | — | |
| |
FROM CAPITAL SHARE TRANSACTIONS: | | | | | | | | | | | | | | | | | | |
| Net proceeds from sale of shares | | | | | 261,969,413 | | | | 542,647,701 | | | | 17,327,316 | | | | 19,710,765 | |
| Proceeds from shares issued in merger (Note 11) | | | | | — | | | | 338,584,266 | | | | — | | | | 347,508,383 | |
| Reinvestment of distributions | | | | | 24,773,632 | | | | 165,344 | | | | 2,353,069 | | | | — | |
| | | | | | 286,743,045 | | | | 881,397,311 | | | | 19,680,385 | | | | 367,219,148 | |
| Cost of shares redeemed | | | | | (244,093,332 | ) | | | (1,584,400,945 | ) | | | (59,853,547 | ) | | | (43,255,676 | ) |
| Net increase (decrease) in net assets resulting from capital share transactions | | | | | 42,649,713 | | | | (703,003,634 | ) | | | (40,173,162 | ) | | | 323,963,472 | |
| Net increase (decrease) in net assets | | | | | 106,263,227 | | | | (388,558,053 | ) | | | 1,159,262 | | | | 386,264,845 | |
| |
NET ASSETS: | | | | | | | | | | | | | | | | | | |
| Beginning of year or period | | | | | 699,080,837 | | | | 1,087,638,890 | | | | 386,264,845 | | | | — | |
| End of year or period | | | | $ | 805,344,064 | | | $ | 699,080,837 | | | $ | 387,424,107 | | | $ | 386,264,845 | |
| Undistributed net investment income at end of year or period | | | | $ | 11,150,027 | | | $ | 24,770,372 | | | $ | 4,392,640 | | | $ | 2,352,938 | |
| |
| | | | | | | | | | | | | | | | | | |
(1) Commencement of operations | | | | | | | | | | | | | | | | | | |
See Accompanying Notes to Financial Statements
47
STATEMENTS OF CHANGES IN NET ASSETS
| | | | ING RussellTM
Large Cap Value Index Portfolio
| | ING RussellTM
Mid Cap Index Portfolio
| |
|---|
| | | | Year Ended
December 31,
2010
| | May 1, 2009(1)
to December 31,
2009
| | Year Ended
December 31,
2010
| | Year Ended
December 31,
2009
|
|---|
FROM OPERATIONS: | | | | | | | | | | | | | | | | | | |
| Net investment income | | | | $ | 1,405,176 | | | $ | 1,292,653 | | | $ | 20,593,107 | | | $ | 8,546,365 | |
| Net realized gain | | | | | 3,224,702 | | | | 13,065,944 | | | | 12,592,469 | | | | 1,185,596 | |
| Net change in unrealized appreciation or depreciation | | | | | 3,714,950 | | | | 13,758,273 | | | | 295,786,239 | | | | 197,950,530 | |
| Increase in net assets resulting from operations | | | | | 8,344,828 | | | | 28,116,870 | | | | 328,971,815 | | | | 207,682,491 | |
| |
FROM DISTRIBUTIONS TO SHAREHOLDERS: | | | | | | | | | | | | | | | | | | |
| Net investment income: | | | | | | | | | | | | | | | | | | |
| Class ADV | | | | | (362 | ) | | | — | | | | (22,950 | ) | | | — | |
| Class I | | | | | (713,610 | ) | | | — | | | | (7,484,652 | ) | | | — | |
| Class S | | | | | (582,509 | ) | | | — | | | | (660,052 | ) | | | — | |
| Class S2 | | | | | — | | | | — | | | | (17 | ) | | | — | |
| Net realized gains: | | | | | | | | | | | | | | | | | | |
| Class ADV | | | | | (2,640 | ) | | | — | | | | — | | | | — | |
| Class I | | | | | (4,550,849 | ) | | | — | | | | — | | | | — | |
| Class S | | | | | (3,925,238 | ) | | | — | | | | — | | | | — | |
| Total distributions | | | | | (9,775,208 | ) | | | — | | | | (8,167,671 | ) | | | — | |
| |
FROM CAPITAL SHARE TRANSACTIONS: | | | | | | | | | | | | | | | | | | |
| Net proceeds from sale of shares | | | | | 22,353,661 | | | | 85,200,637 | | | | 234,910,249 | | | | 1,145,942,535 | |
| Proceeds from shares issued in merger (Note 11) | | | | | — | | | | 67,668,566 | | | | — | | | | — | |
| Reinvestment of distributions | | | | | 9,775,208 | | | | — | | | | 8,167,671 | | | | — | |
| | | | | | 32,128,869 | | | | 152,869,203 | | | | 243,077,920 | | | | 1,145,942,535 | |
| Cost of shares redeemed | | | | | (19,940,092 | ) | | | (102,626,482 | ) | | | (388,576,394 | ) | | | (105,364,635 | ) |
| Net increase (decrease) in net assets resulting from capital share transactions | | | | | 12,188,777 | | | | 50,242,721 | | | | (145,498,474 | ) | | | 1,040,577,900 | |
| Net increase in net assets | | | | | 10,758,397 | | | | 78,359,591 | | | | 175,305,670 | | | | 1,248,260,391 | |
| |
NET ASSETS: | | | | | | | | | | | | | | | | | | |
| Beginning of year or period | | | | | 78,359,591 | | | | — | | | | 1,391,149,104 | | | | 142,888,713 | |
| End of year or period | | | | $ | 89,117,988 | | | $ | 78,359,591 | | | $ | 1,566,454,774 | | | $ | 1,391,149,104 | |
| Undistributed net investment income at end of year or period | | | | $ | 1,401,730 | | | $ | 1,296,386 | | | $ | 19,396,304 | | | $ | 8,156,981 | |
| |
| | | | | | | | | | | | | | | | | | |
(1) Commencement of operations | | | | | | | | | | | | | | | | | | |
See Accompanying Notes to Financial Statements
48
STATEMENTS OF CHANGES IN NET ASSETS
| | | | ING RussellTM
Mid Cap Growth Index Portfolio
| | ING RussellTM
Small Cap Index Portfolio
| |
|---|
| | | | Year Ended
December 31,
2010
| | May 1, 2009(1)
to December 31,
2009
| | Year Ended
December 31,
2010
| | Year Ended
December 31,
2009
|
|---|
FROM OPERATIONS: | | | | | | | | | | | | | | | | | | |
| Net investment income | | | | $ | 1,411,821 | | | $ | 949,308 | | | $ | 7,036,695 | | | $ | 3,892,357 | |
| Net realized gain (loss) | | | | | 14,536,244 | | | | 6,694,078 | | | | 5,702,492 | | | | (4,708,224 | ) |
| Net change in unrealized appreciation or depreciation | | | | | 52,174,653 | | | | 39,654,660 | | | | 150,734,883 | | | | 92,790,045 | |
| Increase in net assets resulting from operations | | | | | 68,122,718 | | | | 47,298,046 | | | | 163,474,070 | | | | 91,974,178 | |
| |
FROM DISTRIBUTIONS TO SHAREHOLDERS: | | | | | | | | | | | | | | | | | | |
| Net investment income: | | | | | | | | | | | | | | | | | | |
| Class ADV | | | | | (5 | ) | | | — | �� | | | (20,300 | ) | | | — | |
| Class I | | | | | (38,679 | ) | | | — | | | | (2,825,269 | ) | | | — | |
| Class S | | | | | (879,428 | ) | | | — | | | | (748,070 | ) | | | — | |
| Class S2 | | | | | (3,454 | ) | | | — | | | | (16 | ) | | | — | |
| Net realized gains: | | | | | | | | | | | | | | | | | | |
| Class ADV | | | | | (39 | ) | | | — | | | | — | | | | — | |
| Class I | | | | | (95,096 | ) | | | — | | | | — | | | | — | |
| Class S | | | | | (2,641,053 | ) | | | — | | | | — | | | | — | |
| Class S2 | | | | | (14,387 | ) | | | — | | | | — | | | | — | |
| Total distributions | | | | | (3,672,141 | ) | | | — | | | | (3,593,655 | ) | | | — | |
| |
FROM CAPITAL SHARE TRANSACTIONS: | | | | | | | | | | | | | | | | | | |
| Net proceeds from sale of shares | | | | | 48,215,986 | | | | 89,958,204 | | | | 209,545,227 | | | | 434,704,003 | |
| Proceeds from shares issued in merger (Note 11) | | | | | — | | | | 258,969,254 | | | | — | | | | — | |
| Reinvestment of distributions | | | | | 3,672,104 | | | | — | | | | 3,593,655 | | | | — | |
| | | | | | 51,888,090 | | | | 348,927,458 | | | | 213,138,882 | | | | 434,704,003 | |
| Cost of shares redeemed | | | | | (59,231,817 | ) | | | (113,182,457 | ) | | | (256,693,662 | ) | | | (81,428,146 | ) |
| Net increase (decrease) in net assets resulting from capital share transactions | | | | | (7,343,727 | ) | | | 235,745,001 | | | | (43,554,780 | ) | | | 353,275,857 | |
| Net increase in net assets | | | | | 57,106,850 | | | | 283,043,047 | | | | 116,325,635 | | | | 445,250,035 | |
| |
NET ASSETS: | | | | | | | | | | | | | | | | | | |
| Beginning of year or period | | | | | 283,043,047 | | | | — | | | | 653,289,859 | | | | 208,039,824 | |
| End of year or period | | | | $ | 340,149,897 | | | $ | 283,043,047 | | | $ | 769,615,494 | | | $ | 653,289,859 | |
| Undistributed net investment income at end of year or period | | | | $ | 1,336,446 | | | $ | 920,176 | | | $ | 6,281,112 | | | $ | 3,592,162 | |
| |
| | | | | | | | | | | | | | | | | | |
(1) Commencement of operations | | | | | | | | | | | | | | | | | | |
See Accompanying Notes to Financial Statements
49
STATEMENTS OF CHANGES IN NET ASSETS
| | | | ING U.S. Bond Index Portfolio
| | ING Euro STOXX 50® Index Portfolio
| |
|---|
| | | | Year Ended
December 31,
2010
| | Year Ended
December 31,
2009
| | Year Ended
December 31,
2010
| | August 17, 2009(1)
to December 31,
2009
|
|---|
FROM OPERATIONS: | | | | | | | | | | | | | | | | | | |
| Net investment income | | | | $ | 85,544,149 | | | $ | 41,873,605 | | | $ | 24,423,928 | | | $ | 3,074,323 | |
| Net realized gain (loss) | | | | | 76,097,875 | | | | 22,491,062 | | | | (8,236,308 | ) | | | (225,781 | ) |
| Net change in unrealized appreciation or depreciation | | | | | 53,895,514 | | | | 6,164,114 | | | | (60,162,039 | ) | | | 47,575,721 | |
| Increase (decrease) in net assets resulting from operations | | | | | 215,537,538 | | | | 70,528,781 | | | | (43,974,419 | ) | | | 50,424,263 | |
| |
FROM DISTRIBUTIONS TO SHAREHOLDERS: | | | | | | | | | | | | | | | | | | |
| Net investment income: | | | | | | | | | | | | | | | | | | |
| Class ADV | | | | | (56,943 | ) | | | (18,473 | ) | | | (6,194 | ) | | | — | |
| Class I | | | | | (89,035,675 | ) | | | (38,439,046 | ) | | | (4,233,833 | ) | | | — | |
| Class S | | | | | (6,342,097 | ) | | | (5,483,822 | ) | | | — | | | | — | |
| Class S2 | | | | | (74 | ) | | | (62 | ) | | | — | | | | — | |
| Net realized gains: | | | | | | | | | | | | | | | | | | |
| Class ADV | | | | | — | | | | (10,333 | ) | | | (2,814 | ) | | | — | |
| Class I | | | | | — | | | | (22,054,333 | ) | | | (1,799,379 | ) | | | — | |
| Class S | | | | | — | | | | (2,134,021 | ) | | | — | | | | — | |
| Class S2 | | | | | — | | | | (25 | ) | | | — | | | | — | |
| Total distributions | | | | | (95,434,789 | ) | | | (68,140,115 | ) | | | (6,042,220 | ) | | | — | |
| |
FROM CAPITAL SHARE TRANSACTIONS: | | | | | | | | | | | | | | | | | | |
| Net proceeds from sale of shares | | | | | 1,473,991,378 | | | | 3,775,474,669 | | | | 354,207,901 | | | | 789,837,216 | |
| Reinvestment of distributions | | | | | 95,434,715 | | | | 68,140,027 | | | | 6,042,220 | | | | — | |
| | | | | | 1,569,426,093 | | | | 3,843,614,696 | | | | 360,250,121 | | | | 789,837,216 | |
| Cost of shares redeemed | | | | | (1,549,891,295 | ) | | | (365,581,551 | ) | | | (256,421,413 | ) | | | (15,458,309 | ) |
| Net increase in net assets resulting from capital share transactions | | | | | 19,534,798 | | | | 3,478,033,145 | | | | 103,828,708 | | | | 774,378,907 | |
| Net increase in net assets | | | | | 139,637,547 | | | | 3,480,421,811 | | | | 53,812,069 | | | | 824,803,170 | |
| |
NET ASSETS: | | | | | | | | | | | | | | | | | | |
| Beginning of year or period | | | | | 3,768,463,330 | | | | 288,041,519 | | | | 824,803,170 | | | | — | |
| End of year or period | | | | $ | 3,908,100,877 | | | $ | 3,768,463,330 | | | $ | 878,615,239 | | | $ | 824,803,170 | |
| Undistributed net investment income at end of year or period | | | | $ | 1,366,051 | | | $ | 594,774 | | | $ | 24,410,025 | | | $ | 3,817,054 | |
| |
| | | | | | | | | | | | | | | | | | |
(1) Commencement of operations | | | | | | | | | | | | | | | | | | |
See Accompanying Notes to Financial Statements
50
STATEMENTS OF CHANGES IN NET ASSETS
| | | | ING FTSE 100 Index® Portfolio
| | ING Hang Seng Index Portfolio
| |
|---|
| | | | Year Ended
December 31,
2010
| | August 17, 2009(1)
to December 31,
2009
| | Year Ended
December 31,
2010
| | May 1, 2009(1)
to December 31,
2009
|
|---|
FROM OPERATIONS: | | | | | | | | | | | | | | | | | | |
| Net investment income | | | | $ | 17,064,715 | | | $ | 3,919,867 | | | $ | 3,020,266 | | | $ | 232,940 | |
| Net realized gain (loss) | | | | | 7,304,959 | | | | 2,989,939 | | | | (950,360 | ) | | | (424,283 | ) |
| Net change in unrealized appreciation or depreciation | | | | | 39,962,512 | | | | 54,380,763 | | | | 8,144,044 | | | | 9,851,136 | |
| Increase in net assets resulting from operations | | | | | 64,332,186 | | | | 61,290,569 | | | | 10,213,950 | | | | 9,659,793 | |
| |
FROM DISTRIBUTIONS TO SHAREHOLDERS: | | | | | | | | | | | | | | | | | | |
| Net investment income: | | | | | | | | | | | | | | | | | | |
| Class ADV | | | | | (6,380 | ) | | | — | | | | (3 | ) | | | (5 | ) |
| Class I | | | | | (4,260,839 | ) | | | — | | | | (84,227 | ) | | | (474,675 | ) |
| Class S | | | | | — | | | | — | | | | (35,938 | ) | | | (166,106 | ) |
| Class S2 | | | | | — | | | | — | | | | (3 | ) | | | (8 | ) |
| Net realized gains: | | | | | | | | | | | | | | | | | | |
| Class ADV | | | | | (7,278 | ) | | | — | | | | — | | | | — | |
| Class I | | | | | (4,221,321 | ) | | | — | | | | — | | | | — | |
| Return of capital: | | | | | | | | | | | | | | | | | | |
| Class ADV | | | | | — | | | | — | | | | — | | | | (4 | ) |
| Class I | | | | | — | | | | — | | | | — | | | | (92,931 | ) |
| Class S | | | | | — | | | | — | | | | — | | | | (39,566 | ) |
| Class S2 | | | | | — | | | | — | | | | — | | | | (4 | ) |
| Total distributions | | | | | (8,495,818 | ) | | | — | | | | (120,171 | ) | | | (773,299 | ) |
| |
FROM CAPITAL SHARE TRANSACTIONS: | | | | | | | | | | | | | | | | | | |
| Net proceeds from sale of shares | | | | | 142,986,249 | | | | 590,860,918 | | | | 111,215,984 | | | | 146,588,902 | |
| Reinvestment of distributions | | | | | 8,495,818 | | | | — | | | | 120,165 | | | | 773,278 | |
| | | | | | 151,482,067 | | | | 590,860,918 | | | | 111,336,149 | | | | 147,362,180 | |
| Cost of shares redeemed | | | | | (159,038,732 | ) | | | (31,506,427 | ) | | | (43,497,582 | ) | | | (11,204,429 | ) |
| Net increase (decrease) in net assets resulting from capital share transactions | | | | | (7,556,665 | ) | | | 559,354,491 | | | | 67,838,567 | | | | 136,157,751 | |
| Net increase in net assets | | | | | 48,279,703 | | | | 620,645,060 | | | | 77,932,346 | | | | 145,044,245 | |
| |
NET ASSETS: | | | | | | | | | | | | | | | | | | |
| Beginning of year or period | | | | | 620,645,060 | | | | — | | | | 145,044,245 | | | | — | |
| End of year or period | | | | $ | 668,924,763 | | | $ | 620,645,060 | | | $ | 222,976,591 | | | $ | 145,044,245 | |
| Undistributed net investment income at end of year or period | | | | $ | 16,480,679 | | | $ | 3,993,358 | | | $ | 4,337,456 | | | $ | — | |
| |
| | | | | | | | | | | | | | | | | | |
(1) Commencement of operations | | | | | | | | | | | | | | | | | | |
See Accompanying Notes to Financial Statements
51
STATEMENTS OF CHANGES IN NET ASSETS
| | | | ING International Index Portfolio
| | ING Japan TOPIX Index Portfolio
| |
|---|
| | | | Year Ended
December 31,
2010
| | Year Ended
December 31,
2009
| | Year Ended
December 31,
2010
| | August 17, 2009(1)
to December 31,
2009
|
|---|
FROM OPERATIONS: | | | | | | | | | | | | | | | | | | |
| Net investment income | | | | $ | 7,526,873 | | | $ | 9,875,183 | | | $ | 6,716,631 | | | $ | 405,264 | |
| Net realized gain (loss) | | | | | (1,361,616 | ) | | | (85,081,239 | ) | | | 4,423,916 | | | | (1,321,900 | ) |
| Net change in unrealized appreciation or depreciation | | | | | 18,497,086 | | | | 204,886,381 | | | | 47,884,898 | | | | 2,469,149 | |
| Increase in net assets resulting from operations | | | | | 24,662,343 | | | | 129,680,325 | | | | 59,025,445 | | | | 1,552,513 | |
| |
FROM DISTRIBUTIONS TO SHAREHOLDERS: | | | | | | | | | | | | | | | | | | |
| Net investment income: | | | | | | | | | | | | | | | | | | |
| Class ADV | | | | | (63,107 | ) | | | — | | | | (2,683 | ) | | | — | |
| Class I | | | | | (8,402,417 | ) | | | — | | | | (552,840 | ) | | | — | |
| Class S | | | | | (3,695,507 | ) | | | — | | | | — | | | | — | |
| Class S2 | | | | | (153 | ) | | | — | | | | — | | | | — | |
| Net realized gains: | | | | | | | | | | | | | | | | | | |
| Class ADV | | | | | — | | | | — | | | | (1,328 | ) | | | — | |
| Class I | | | | | — | | | | — | | | | (244,619 | ) | | | — | |
| Total distributions | | | | | (12,161,184 | ) | | | — | | | | (801,470 | ) | | | — | |
| |
FROM CAPITAL SHARE TRANSACTIONS: | | | | | | | | | | | | | | | | | | |
| Net proceeds from sale of shares | | | | | 126,127,350 | | | | 410,829,490 | | | | 43,544,903 | | | | 512,781,574 | |
| Proceeds from shares issued in merger (Note 11) | | | | | — | | | | 191,779,327 | | | | — | | | | — | |
| Reinvestment of distributions | | | | | 12,161,031 | | | | — | | | | 801,470 | | | | — | |
| | | | | | 138,288,381 | | | | 602,608,817 | | | | 44,346,373 | | | | 512,781,574 | |
| Cost of shares redeemed | | | | | (114,314,343 | ) | | | (646,865,190 | ) | | | (194,057,177 | ) | | | (9,563,373 | ) |
| Net increase (decrease) in net assets resulting from capital share transactions | | | | | 23,974,038 | | | | (44,256,373 | ) | | | (149,710,804 | ) | | | 503,218,201 | |
| Net increase (decrease) in net assets | | | | | 36,475,197 | | | | 85,423,952 | | | | (91,486,829 | ) | | | 504,770,714 | |
| |
NET ASSETS: | | | | | | | | | | | | | | | | | | |
| Beginning of year or period | | | | | 330,185,247 | | | | 244,761,295 | | | | 504,770,714 | | | | — | |
| End of year or period | | | | $ | 366,660,444 | | | $ | 330,185,247 | | | $ | 413,283,885 | | | $ | 504,770,714 | |
| Undistributed net investment income at end of year or period | | | | $ | 8,813,114 | | | $ | 12,160,093 | | | $ | 8,210,613 | | | $ | 33,616 | |
| |
| | | | | | | | | | | | | | | | | | |
(1) Commencement of operations | | | | | | | | | | | | | | | | | | |
See Accompanying Notes to Financial Statements
52
STATEMENTS OF CHANGES IN NET ASSETS
| | | | ING WisdomTreeSM Global
High-Yielding Equity Index Portfolio
| |
|---|
| | | | Year Ended
December 31,
2010
| | Year Ended
December 31,
2009
|
|---|
FROM OPERATIONS: | | | | | | | | | | |
| Net investment income | | | | $ | 6,555,107 | | | $ | 6,591,023 | |
| Net realized loss | | | | | (6,439,197 | ) | | | (29,765,722 | ) |
| Net change in unrealized appreciation or depreciation | | | | | 9,490,347 | | | | 73,983,894 | |
| Increase in net assets resulting from operations | | | | | 9,606,257 | | | | 50,809,195 | |
| |
FROM DISTRIBUTIONS TO SHAREHOLDERS: | | | | | | | | | | |
| Net investment income: | | | | | | | | | | |
| Class ADV | | | | | (5,049 | ) | | | — | |
| Class S | | | | | (7,061,976 | ) | | | — | |
| Total distributions | | | | | (7,067,025 | ) | | | — | |
| |
FROM CAPITAL SHARE TRANSACTIONS: | | | | | | | | | | |
| Net proceeds from sale of shares | | | | | 20,356,040 | | | | 54,024,114 | |
| Reinvestment of distributions | | | | | 7,067,025 | | | | — | |
| | | | | | 27,423,065 | | | | 54,024,114 | |
| Cost of shares redeemed | | | | | (42,308,692 | ) | | | (34,321,365 | ) |
| Net increase (decrease) in net assets resulting from capital share transactions | | | | | (14,885,627 | ) | | | 19,702,749 | |
| Net increase (decrease) in net assets | | | | | (12,346,395 | ) | | | 70,511,944 | |
| |
NET ASSETS: | | | | | | | | | | |
| Beginning of year | | | | | 219,257,970 | | | | 148,746,026 | |
| End of year | | | | $ | 206,911,575 | | | $ | 219,257,970 | |
| Undistributed net investment income at end of year | | | | $ | 6,106,422 | | | $ | 7,066,880 | |
See Accompanying Notes to Financial Statements
53
FINANCIAL HIGHLIGHTS
Selected data for a share of beneficial interest outstanding throughout each year or period.
| | | | | | Income (loss)
from
investment
operations
|
| | | Less distributions
|
| | | | | | | Ratios to average net assets
| | Supplemental
data
| |
|---|
| | | | | | | | | | | | | | | | | | | | | | | | | | | | | | | | | | |
|---|
| | | | Net asset
value,
beginning
of year
or
period
|
| Net
investment
income
(loss)
|
| Net
realized
and
unrealized
gain
(loss)
|
| Total from
investment
operations
|
| From net
investment
income
|
| From
net
realized
gains
|
| From
return
of
capital
|
| Total
distributions
|
| Net
asset
value,
end of
year
or
period
|
| Total
Return(1)
|
| Expenses
before
reductions/
additions(2)(3)
|
| Expenses
net of fee
waivers
and/or
recoupments,
if any(2)(3)
|
| Expenses
net of all
reductions/
additions(2)(3)
|
| Net
investment
income
(loss)(2)(3)
|
| Net
assets,
end of
year
or
period
|
| Portfolio
turnover
rate
|
|---|
Year or
period ended
|
| ($)
|
| ($)
|
| ($)
|
| ($)
|
| ($)
|
| ($)
|
| ($)
|
| ($)
|
| ($)
|
| (%)
|
| (%)
|
| (%)
|
| (%)
|
| (%)
|
| ($000’s)
|
| (%)
|
|---|
ING RussellTM Large Cap Index Portfolio |
Class ADV | | | | | | | | | | | | | | | | | | | | | | | | | | | | | | | | | | | | | | | | | | | | | | | | | | | | | | | | | | | | | | | | | | |
| 12-31-10 | | | | | 8.85 | | | | 0.10 | • | | | 0.93 | | | | 1.03 | | | | 0.30 | | | | — | | | | — | | | | 0.30 | | | | 9.58 | | | | 11.74 | | | | 0.89 | | | | 0.87 | † | | | 0.87 | † | | | 1.15 | † | | | 10,161 | | | | 11 | |
| 12-31-09 | | | | | 7.19 | | | | 0.10 | • | | | 1.56 | | | | 1.66 | | | | — | | | | — | | | | — | | | | — | | | | 8.85 | | | | 23.09 | | | | 0.90 | | | | 0.87 | † | | | 0.87 | † | | | 1.31 | † | | | 6,835 | | | | 44 | |
03-10-08(4)–12-31-08 | | | 10.00 | | | | 0.13 | • | | | (2.87 | ) | | | (2.74 | ) | | | 0.07 | | | | — | | | | — | | | | 0.07 | | | | 7.19 | | | | (27.42 | ) | | | 0.89 | | | | 0.87 | † | | | 0.87 | † | | | 1.98 | † | | | 1,135 | | | | 8 | |
Class I | | | | | | | | | | | | | | | | | | | | | | | | | | | | | | | | | | | | | | | | | | | | | | | | | | | | | | | | | | | | | | | | | | |
| 12-31-10 | | | | | 8.92 | | | | 0.15 | • | | | 0.92 | | | | 1.07 | | | | 0.31 | | | | — | | | | — | | | | 0.31 | | | | 9.68 | | | | 12.19 | | | | 0.39 | | | | 0.37 | † | | | 0.37 | † | | | 1.64 | † | | | 340,889 | | | | 11 | |
| 12-31-09 | | | | | 7.21 | | | | 0.15 | • | | | 1.56 | | | | 1.71 | | | | 0.00 | ** | | | — | | | | — | | | | 0.00 | ** | | | 8.92 | | | | 23.73 | | | | 0.40 | | | | 0.37 | † | | | 0.37 | † | | | 2.02 | † | | | 251,504 | | | | 44 | |
03-10-08(4)–12-31-08 | | | 10.00 | | | | 0.17 | • | | | (2.88 | ) | | | (2.71 | ) | | | 0.08 | | | | — | | | | — | | | | 0.08 | | | | 7.21 | | | | (27.06 | ) | | | 0.39 | | | | 0.37 | † | | | 0.37 | † | | | 2.31 | † | | | 1,057,974 | | | | 8 | |
Class S | | | | | | | | | | | | | | | | | | | | | | | | | | | | | | | | | | | | | | | | | | | | | | | | | | | | | | | | | | | | | | | | | | |
| 12-31-10 | | | | | 8.89 | | | | 0.12 | • | | | 0.93 | | | | 1.05 | | | | 0.30 | | | | — | | | | — | | | | 0.30 | | | | 9.64 | | | | 12.00 | | | | 0.64 | | | | 0.62 | † | | | 0.62 | † | | | 1.39 | † | | | 454,246 | | | | 11 | |
| 12-31-09 | | | | | 7.20 | | | | 0.12 | • | | | 1.57 | | | | 1.69 | | | | — | | | | — | | | | — | | | | — | | | | 8.89 | | | | 23.47 | | | | 0.65 | | | | 0.62 | † | | | 0.62 | † | | | 1.51 | † | | | 440,738 | | | | 44 | |
03-10-08(4)–12-31-08 | | | 10.00 | | | | 0.14 | • | | | (2.87 | ) | | | (2.73 | ) | | | 0.07 | | | | — | | | | — | | | | 0.07 | | | | 7.20 | | | | (27.23 | ) | | | 0.64 | | | | 0.62 | † | | | 0.62 | † | | | 2.19 | † | | | 28,529 | | | | 8 | |
Class S2 | | | | | | | | | | | | | | | | | | | | | | | | | | | | | | | | | | | | | | | | | | | | | | | | | | | | | | | | | | | | | | | | | | |
| 12-31-10 | | | | | 8.79 | | | | 0.11 | • | | | 0.91 | | | | 1.02 | | | | — | | | | — | | | | — | | | | — | | | | 9.81 | | | | 11.60 | | | | 0.89 | | | | 0.77 | † | | | 0.77 | † | | | 1.17 | † | | | 48 | | | | 11 | |
02-27-09(4)–12-31-09 | | | 5.89 | | | | (0.00 | )•,** | | | 2.90 | | | | 2.90 | | | | 0.00 | ** | | | — | | | | — | | | | 0.00 | ** | | | 8.79 | | | | 49.26 | | | | 0.90 | | | | 0.77 | † | | | 0.77 | † | | | (0.06 | )† | | | 4 | | | | 44 | |
ING RussellTM Large Cap Growth Index Portfolio |
Class ADV | | | | | | | | | | | | | | | | | | | | | | | | | | | | | | | | | | | | | | | | | | | | | | | | | | | | | | | | | | | | | | | | | | |
| 12-31-10 | | | | | 12.81 | | | | 0.10 | • | | | 1.46 | | | | 1.56 | | | | 0.07 | | | | — | | | | — | | | | 0.07 | | | | 14.30 | | | | 12.18 | | | | 1.08 | | | | 0.98 | † | | | 0.98 | † | | | 0.81 | † | | | 242 | | | | 23 | |
05-01-09(4)–12-31-09 | | | 10.00 | | | | 0.07 | • | | | 2.74 | | | | 2.81 | | | | — | | | | — | | | | — | | | | — | | | | 12.81 | | | | 28.10 | | | | 1.12 | | | | 1.02 | † | | | 0.98 | † | | | 0.87 | † | | | 151 | | | | 5 | |
Class I | | | | | | | | | | | | | | | | | | | | | | | | | | | | | | | | | | | | | | | | | | | | | | | | | | | | | | | | | | | | | | | | | | |
| 12-31-10 | | | | | 12.84 | | | | 0.17 | • | | | 1.47 | | | | 1.64 | | | | 0.09 | | | | — | | | | — | | | | 0.09 | | | | 14.39 | | | | 12.80 | | | | 0.58 | | | | 0.48 | † | | | 0.48 | † | | | 1.30 | † | | | 239,910 | | | | 23 | |
05-01-09(4)–12-31-09 | | | 10.00 | | | | 0.08 | | | | 2.76 | | | | 2.84 | | | | — | | | | — | | | | — | | | | — | | | | 12.84 | | | | 28.40 | | | | 0.62 | | | | 0.52 | † | | | 0.48 | † | | | 1.45 | † | | | 241,608 | | | | 5 | |
Class S | | | | | | | | | | | | | | | | | | | | | | | | | | | | | | | | | | | | | | | | | | | | | | | | | | | | | | | | | | | | | | | | | | |
| 12-31-10 | | | | | 12.82 | | | | 0.13 | • | | | 1.46 | | | | 1.59 | | | | 0.07 | | | | — | | | | — | | | | 0.07 | | | | 14.34 | | | | 12.47 | | | | 0.83 | | | | 0.73 | † | | | 0.73 | † | | | 1.05 | † | | | 147,272 | | | | 23 | |
05-01-09(4)–12-31-09 | | | 10.00 | | | | 0.07 | | | | 2.75 | | | | 2.82 | | | | — | | | | — | | | | — | | | | — | | | | 12.82 | | | | 28.20 | | | | 0.87 | | | | 0.77 | † | | | 0.73 | † | | | 1.19 | † | | | 144,502 | | | | 5 | |
ING RussellTM Large Cap Value Index Portfolio |
Class ADV | | | | | | | | | | | | | | | | | | | | | | | | | | | | | | | | | | | | | | | | | | | | | | | | | | | | | | | | | | | | | | | | | | |
| 12-31-10 | | | | | 12.61 | | | | 0.16 | • | | | 1.18 | | | | 1.34 | | | | 0.17 | | | | 1.26 | | | | — | | | | 1.43 | | | | 12.52 | | | | 10.86 | | | | 1.11 | | | | 1.01 | † | | | 1.01 | † | | | 1.30 | † | | | 27 | | | | 30 | |
05-01-09(4)–12-31-09 | | | 10.00 | | | | 0.10 | • | | | 2.51 | | | | 2.61 | | | | — | | | | — | | | �� | — | | | | — | | | | 12.61 | | | | 26.10 | | | | 1.17 | | | | 1.06 | † | | | 1.06 | † | | | 1.30 | † | | | 26 | | | | 87 | |
Class I | | | | | | | | | | | | | | | | | | | | | | | | | | | | | | | | | | | | | | | | | | | | | | | | | | | | | | | | | | | | | | | | | | |
| 12-31-10 | | | | | 12.65 | | | | 0.22 | • | | | 1.19 | | | | 1.41 | | | | 0.20 | | | | 1.26 | | | | — | | | | 1.46 | | | | 12.60 | | | | 11.38 | | | | 0.61 | | | | 0.51 | † | | | 0.51 | † | | | 1.81 | † | | | 45,590 | | | | 30 | |
05-01-09(4)–12-31-09 | | | 10.00 | | | | 0.15 | • | | | 2.50 | | | | 2.65 | | | | — | | | | — | | | | — | | | | — | | | | 12.65 | | | | 26.50 | | | | 0.67 | | | | 0.56 | † | | | 0.56 | † | | | 1.89 | † | | | 48,211 | | | | 87 | |
See Accompanying Notes to Financial Statements
54
FINANCIAL HIGHLIGHTS (CONTINUED)
Selected data for a share of beneficial interest outstanding throughout each year or period.
| | | | | | Income (loss)
from
investment
operations
|
| | | Less distributions
|
| | | | | | | Ratios to average net assets
| | Supplemental
data
| |
|---|
| | | | | | | | | | | | | | | | | | | | | | | | | | | | | | | | | | |
|---|
| | | | Net
asset
value,
beginning
of year
or
period
|
| Net
investment
income
(loss)
|
| Net
realized
and
unrealized
gain
(loss)
|
| Total from
investment
operations
|
| From net
investment
income
|
| From
net
realized
gains
|
| From
return
of
capital
|
| Total
distributions
|
| Net
asset
value,
end of
year
or
period
|
| Total
Return(1)
|
| Expenses
before
reductions/
additions(2)(3)
|
| Expenses
net of fee
waivers
and/or
recoupments,
if any(2)(3)
|
| Expenses
net of
all
reductions/
additions(2)(3)
|
| Net
investment
income
(loss)(2)(3)
|
| Net
assets,
end of
year
or
period
|
| Portfolio
turnover
rate
|
|---|
Year or
period ended
|
| ($)
|
| ($)
|
| ($)
|
| ($)
|
| ($)
|
| ($)
|
| ($)
|
| ($)
|
| ($)
|
| (%)
|
| (%)
|
| (%)
|
| (%)
|
| (%)
|
| ($000’s)
|
| (%)
|
|---|
ING RussellTM Large Cap Value Index Portfolio (continued) |
Class S | | | | | | | | | | | | | | | | | | | | | | | | | | | | | | | | | | | | | | | | | | | | | | | | | | | | | | | | | | | | | | | | | | |
| 12-31-10 | | | | | 12.64 | | | | 0.19 | • | | | 1.19 | | | | 1.38 | | | | 0.19 | | | | 1.26 | | | | — | | | | 1.45 | | | | 12.57 | | | | 11.13 | | | | 0.86 | | | | 0.76 | † | | | 0.76 | † | | | 1.58 | † | | | 43,502 | | | | 30 | |
05-01-09(4)–12-31-09 | | | 10.00 | | | | 0.12 | • | | | 2.52 | | | | 2.64 | | | | — | | | | — | | | | — | | | | — | | | | 12.64 | | | | 26.40 | | | | 0.92 | | | | 0.81 | † | | | 0.81 | † | | | 1.51 | † | | | 30,119 | | | | 87 | |
ING RussellTM Mid Cap Index Portfolio |
Class ADV | | | | | | | | | | | | | | | | | | | | | | | | | | | | | | | | | | | | | | | | | | | | | | | | | | | | | | | | | | | | | | | | | | |
| 12-31-10 | | | | | 9.24 | | | | 0.11 | • | | | 2.15 | | | | 2.26 | | | | 0.05 | | | | — | | | | — | | | | 0.05 | | | | 11.45 | | | | 24.48 | | | | 0.95 | | | | 0.93 | † | | | 0.93 | † | | | 1.08 | † | | | 13,988 | | | | 8 | |
| 12-31-09 | | | | | 6.63 | | | | 0.10 | • | | | 2.51 | | | | 2.61 | | | | — | | | | — | | | | — | | | | — | | | | 9.24 | | | | 39.37 | | | | 0.93 | | | | 0.93 | † | | | 0.93 | † | | | 1.18 | † | | | 2,856 | | | | 7 | |
03-10-08(4)–12-31-08 | | | 10.00 | | | | 0.08 | • | | | (3.37 | ) | | | (3.29 | ) | | | 0.07 | | | | — | | | | 0.01 | | | | 0.08 | | | | 6.63 | | | | (32.92 | ) | | | 1.01 | | | | 0.93 | † | | | 0.93 | † | | | 1.00 | † | | | 61 | | | | 30 | |
Class I | | | | | | | | | | | | | | | | | | | | | | | | | | | | | | | | | | | | | | | | | | | | | | | | | | | | | | | | | | | | | | | | | | |
| 12-31-10 | | | | | 9.29 | | | | 0.15 | • | | | 2.19 | | | | 2.34 | | | | 0.06 | | | | — | | | | — | | | | 0.06 | | | | 11.57 | | | | 25.22 | | | | 0.45 | | | | 0.43 | † | | | 0.43 | † | | | 1.46 | † | | | 1,389,676 | | | | 8 | |
| 12-31-09 | | | | | 6.63 | | | | 0.13 | • | | | 2.53 | | | | 2.66 | | | | — | | | | — | | | | — | | | | — | | | | 9.29 | | | | 40.12 | | | | 0.43 | | | | 0.43 | † | | | 0.43 | † | | | 1.59 | † | | | 1,285,223 | | | | 7 | |
03-10-08(4)–12-31-08 | | | 10.00 | | | | 0.13 | • | | | (3.41 | ) | | | (3.28 | ) | | | 0.08 | | | | — | | | | 0.01 | | | | 0.09 | | | | 6.63 | | | | (32.74 | ) | | | 0.51 | | | | 0.43 | † | | | 0.43 | † | | | 1.74 | † | | | 117,525 | | | | 30 | |
Class S | | | | | | | | | | | | | | | | | | | | | | | | | | | | | | | | | | | | | | | | | | | | | | | | | | | | | | | | | | | | | | | | | | |
| 12-31-10 | | | | | 9.25 | | | | 0.12 | • | | | 2.18 | | | | 2.30 | | | | 0.05 | | | | — | | | | — | | | | 0.05 | | | | 11.50 | | | | 24.88 | | | | 0.70 | | | | 0.68 | † | | | 0.68 | † | | | 1.22 | † | | | 162,362 | | | | 8 | |
| 12-31-09 | | | | | 6.62 | | | | 0.10 | • | | | 2.53 | | | | 2.63 | | | | — | | | | — | | | | — | | | | — | | | | 9.25 | | | | 39.73 | | | | 0.68 | | | | 0.68 | † | | | 0.68 | † | | | 1.33 | † | | | 103,065 | | | | 7 | |
03-10-08(4)–12-31-08 | | | 10.00 | | | | 0.12 | • | | | (3.41 | ) | | | (3.29 | ) | | | 0.08 | | | | — | | | | 0.01 | | | | 0.09 | | | | 6.62 | | | | (32.90 | ) | | | 0.76 | | | | 0.68 | † | | | 0.68 | † | | | 1.85 | † | | | 25,303 | | | | 30 | |
Class S2 | | | | | | | | | | | | | | | | | | | | | | | | | | | | | | | | | | | | | | | | | | | | | | | | | | | | | | | | | | | | | | | | | | |
| 12-31-10 | | | | | 9.25 | | | | 0.16 | • | | | 2.10 | | | | 2.26 | | | | 0.03 | | | | — | | | | — | | | | 0.03 | | | | 11.48 | | | | 24.49 | | | | 0.95 | | | | 0.83 | † | | | 0.83 | † | | | 1.49 | † | | | 428 | | | | 8 | |
02-27-09(4)–12-31-09 | | | | | 5.52 | | | | 0.08 | | | | 3.65 | | | | 3.73 | | | | — | | | | — | | | | — | | | | — | | | | 9.25 | | | | 67.57 | | | | 0.93 | | | | 0.83 | † | | | 0.83 | † | | | 1.19 | † | | | 5 | | | | 7 | |
ING RussellTM Mid Cap Growth Index Portfolio |
Class ADV | | | | | | | | | | | | | | | | | | | | | | | | | | | | | | | | | | | | | | | | | | | | | | | | | | | | | | | | | | | | | | | | | | |
| 12-31-10 | | | | | 13.11 | | | | 0.03 | | | | 3.30 | | | | 3.33 | | | | 0.02 | | | | 0.13 | | | | — | | | | 0.15 | | | | 16.29 | | | | 25.52 | | | | 1.09 | | | | 0.99 | † | | | 0.99 | † | | | 0.23 | † | | | 5 | | | | 25 | |
05-01-09(4)–12-31-09 | | | | | 10.00 | | | | 0.02 | | | | 3.09 | | | | 3.11 | | | | — | | | | — | | | | — | | | | — | | | | 13.11 | | | | 31.10 | | | | 1.14 | | | | 1.04 | † | | | 1.04 | † | | | 0.30 | † | | | 4 | | | | 42 | |
Class I | | | | | | | | | | | | | | | | | | | | | | | | | | | | | | | | | | | | | | | | | | | | | | | | | | | | | | | | | | | | | | | | | | |
| 12-31-10 | | | | | 13.14 | | | | 0.10 | | | | 3.32 | | | | 3.42 | | | | 0.05 | | | | 0.13 | | | | — | | | | 0.18 | | | | 16.38 | | | | 26.22 | | | | 0.59 | | | | 0.49 | † | | | 0.49 | † | | | 0.73 | † | | | 12,615 | | | | 25 | |
05-01-09(4)–12-31-09 | | | | | 10.00 | | | | 0.05 | • | | | 3.09 | | | | 3.14 | | | | — | | | | — | | | | — | | | | — | | | | 13.14 | | | | 31.40 | | | | 0.64 | | | | 0.54 | † | | | 0.54 | † | | | 0.72 | † | | | 9,644 | | | | 42 | |
Class S | | | | | | | | | | | | | | | | | | | | | | | | | | | | | | | | | | | | | | | | | | | | | | | | | | | | | | | | | | | | | | | | | | |
| 12-31-10 | | | | | 13.13 | | | | 0.07 | | | | 3.30 | | | | 3.37 | | | | 0.04 | | | | 0.13 | | | | — | | | | 0.17 | | | | 16.33 | | | | 25.85 | | | | 0.84 | | | | 0.74 | † | | | 0.74 | † | | | 0.48 | † | | | 325,749 | | | | 25 | |
05-01-09(4)–12-31-09 | | | | | 10.00 | | | | 0.06 | • | | | 3.07 | | | | 3.13 | | | | — | | | | — | | | | — | | | | — | | | | 13.13 | | | | 31.30 | | | | 0.89 | | | | 0.79 | † | | | 0.79 | † | | | 0.67 | † | | | 271,776 | | | | 42 | |
Class S2 | | | | | | | | | | | | | | | | | | | | | | | | | | | | | | | | | | | | | | | | | | | | | | | | | | | | | | | | | | | | | | | | | | |
| 12-31-10 | | | | | 13.11 | | | | 0.05 | | | | 3.30 | | | | 3.35 | | | | 0.03 | | | | 0.13 | | | | — | | | | 0.16 | | | | 16.30 | | | | 25.71 | | | | 1.09 | | | | 0.89 | † | | | 0.89 | † | | | 0.32 | † | | | 1,781 | | | | 25 | |
05-01-09(4)–12-31-09 | | | | | 10.00 | | | | 0.02 | | | | 3.09 | | | | 3.11 | | | | — | | | | — | | | | — | | | | — | | | | 13.11 | | | | 31.10 | | | | 1.14 | | | | 0.94 | † | | | 0.94 | † | | | 0.47 | † | | | 1,619 | | | | 42 | |
See Accompanying Notes to Financial Statements
55
FINANCIAL HIGHLIGHTS (CONTINUED)
Selected data for a share of beneficial interest outstanding throughout each year or period.
| | | | | | Income (loss)
from
investment
operations
|
| | | Less distributions
|
| | | | | | | Ratios to average net assets
| | Supplemental
data
| |
|---|
| | | | | | | | | | | | | | | | | | | | | | | | | | | | | | | | | | |
|---|
| | | | Net
asset
value,
beginning
of year
or
period
|
| Net
investment
income
(loss)
|
| Net
realized
and
unrealized
gain
(loss)
|
| Total from
investment
operations
|
| From net
investment
income
|
| From
net
realized
gains
|
| From
return
of
capital
|
| Total
distributions
|
| Net
asset
value,
end of
year
or
period
|
| Total
Return(1)
|
| Expenses
before
reductions/
additions(2)(3)
|
| Expenses
net
of fee
waivers
and/or
recoupments,
if any(2)(3)
|
| Expenses
net of
all
reductions/
additions(2)(3)
|
| Net
investment
income
(loss)(2)(3)
|
| Net
assets,
end of
year or
period
|
| Portfolio
turnover
rate
|
|---|
Year or
period ended
|
| ($)
|
| ($)
|
| ($)
|
| ($)
|
| ($)
|
| ($)
|
| ($)
|
| ($)
|
| ($)
|
| (%)
|
| (%)
|
| (%)
|
| (%)
|
| (%)
|
| ($000’s)
|
| (%)
|
|---|
ING RussellTM Small Cap Index Portfolio |
Class ADV | | | | | | | | | | | | | | | | | | | | | | | | | | | | | | | | | | | | | | | | | | | | | | | | | | | | | | | | | | | | | | | | | | |
| 12-31-10 | | | | | 9.74 | | | | 0.08 | • | | | 2.43 | | | | 2.51 | | | | 0.05 | | | | — | | | | — | | | | 0.05 | | | | 12.20 | | | | 25.77 | | | | 0.97 | | | | 0.95 | † | | | 0.95 | † | | | 0.73 | † | | | 13,051 | | | | 23 | |
| 12-31-09 | | | | | 7.72 | | | | 0.06 | • | | | 1.96 | | | | 2.02 | | | | — | | | | — | | | | — | | | | — | | | | 9.74 | | | | 26.17 | | | | 0.97 | | | | 0.95 | † | | | 0.95 | † | | | 0.74 | † | | | 1,972 | | | | 16 | |
03-10-08(4)–12-31-08 | | | 10.00 | | | | 0.11 | • | | | (2.32 | ) | | | (2.21 | ) | | | 0.06 | | | | — | | | | 0.01 | | | | 0.07 | | | | 7.72 | | | | (22.02 | ) | | | 1.27 | | | | 1.17 | † | | | 1.17 | † | | | 1.74 | † | | | 571 | | | | 35 | |
Class I | | | | | | | | | | | | | | | | | | | | | | | | | | | | | | | | | | | | | | | | | | | | | | | | | | | | | | | | | | | | | | | | | | |
| 12-31-10 | | | | | 9.81 | | | | 0.11 | • | | | 2.48 | | | | 2.59 | | | | 0.06 | | | | — | | | | — | | | | 0.06 | | | | 12.34 | | | | 26.43 | | | | 0.47 | | | | 0.45 | † | | | 0.45 | † | | | 1.08 | † | | | 550,465 | | | | 23 | |
| 12-31-09 | | | | | 7.75 | | | | 0.10 | • | | | 1.96 | | | | 2.06 | | | | — | | | | — | | | | — | | | | — | | | | 9.81 | | | | 26.58 | | | | 0.47 | | | | 0.45 | † | | | 0.45 | † | | | 1.23 | † | | | 514,616 | | | | 16 | |
03-10-08(4)–12-31-08 | | | 10.00 | | | | 0.12 | • | | | (2.29 | ) | | | (2.17 | ) | | | 0.07 | | | | — | | | | 0.01 | | | | 0.08 | | | | 7.75 | | | | (21.68 | ) | | | 0.53 | | | | 0.45 | † | | | 0.45 | † | | | 1.49 | † | | | 132,762 | | | | 35 | |
Class S | | | | | | | | | | | | | | | | | | | | | | | | | | | | | | | | | | | | | | | | | | | | | | | | | | | | | | | | | | | | | | | | | | |
| 12-31-10 | | | | | 9.77 | | | | 0.09 | • | | | 2.45 | | | | 2.54 | | | | 0.04 | | | | — | | | | — | | | | 0.04 | | | | 12.27 | | | | 26.07 | | | | 0.72 | | | | 0.70 | † | | | 0.70 | † | | | 0.85 | † | | | 205,956 | | | | 23 | |
| 12-31-09 | | | | | 7.73 | | | | 0.07 | | | | 1.97 | | | | 2.04 | | | | — | | | | — | | | | — | | | | — | | | | 9.77 | | | | 26.39 | | | | 0.72 | | | | 0.70 | † | | | 0.70 | † | | | 0.95 | † | | | 136,697 | | | | 16 | |
03-10-08(4)–12-31-08 | | | 10.00 | | | | 0.12 | • | | | (2.32 | ) | | | (2.20 | ) | | | 0.06 | | | | — | | | | 0.01 | | | | 0.07 | | | | 7.73 | | | | (21.95 | ) | | | 0.78 | | | | 0.70 | † | | | 0.70 | † | | | 1.71 | † | | | 74,707 | | | | 35 | |
Class S2 | | | | | | | | | | | | | | | | | | | | | | | | | | | | | | | | | | | | | | | | | | | | | | | | | | | | | | | | | | | | | | | | | | |
| 12-31-10 | | | | | 9.74 | | | | 0.12 | • | | | 2.39 | | | | 2.51 | | | | 0.03 | | | | — | | | | — | | | | 0.03 | | | | 12.22 | | | | 25.81 | | | | 0.97 | | | | 0.85 | † | | | 0.85 | † | | | 1.07 | † | | | 143 | | | | 23 | |
02-27-09(4)–12-31-09 | | | 6.03 | | | | 0.06 | | | | 3.65 | | | | 3.71 | | | | — | | | | — | | | | — | | | | — | | | | 9.74 | | | | 61.53 | | | | 0.97 | | | | 0.85 | † | | | 0.85 | † | | | 0.83 | † | | | 5 | | | | 16 | |
ING U.S. Bond Index Portfolio |
Class ADV | | | | | | | | | | | | | | | | | | | | | | | | | | | | | | | | | | | | | | | | | | | | | | | | | | | | | | | | | | | | | | | | | | |
| 12-31-10 | | | | | 10.37 | | | | 0.20 | • | | | 0.38 | | | | 0.58 | | | | 0.24 | | | | — | | | | — | | | | 0.24 | | | | 10.71 | | | | 5.58 | | | | 0.96 | | | | 0.95 | † | | | 0.95 | † | | | 1.82 | † | | | 3,714 | | | | 279 | |
| 12-31-09 | | | | | 10.12 | | | | 0.23 | • | | | 0.30 | | | | 0.53 | | | | 0.20 | | | | 0.08 | | | | — | | | | 0.28 | | | | 10.37 | | | | 5.29 | | | | 0.94 | | | | 0.94 | † | | | 0.94 | † | | | 2.27 | † | | | 1,432 | | | | 380 | |
03-10-08(4)–12-31-08 | | | 10.00 | | | | 0.25 | | | | 0.07 | | | | 0.32 | | | | 0.18 | | | | 0.02 | | | | — | | | | 0.20 | | | | 10.12 | | | | 3.26 | | | | 1.01 | | | | 0.95 | † | | | 0.95 | † | | | 2.95 | † | | | 143 | | | | 360 | |
Class I | | | | | | | | | | | | | | | | | | | | | | | | | | | | | | | | | | | | | | | | | | | | | | | | | | | | | | | | | | | | | | | | | | |
| 12-31-10 | | | | | 10.39 | | | | 0.25 | • | | | 0.38 | | | | 0.63 | | | | 0.28 | | | | — | | | | — | | | | 0.28 | | | | 10.74 | | | | 6.14 | | | | 0.46 | | | | 0.45 | † | | | 0.45 | † | | | 2.36 | † | | | 3,655,181 | | | | 279 | |
| 12-31-09 | | | | | 10.12 | | | | 0.28 | • | | | 0.31 | | | | 0.59 | | | | 0.24 | | | | 0.08 | | | | — | | | | 0.32 | | | | 10.39 | | | | 5.88 | | | | 0.44 | | | | 0.44 | † | | | 0.44 | † | | | 2.66 | † | | | 3,501,280 | | | | 380 | |
03-07-08(4)–12-31-08 | | | 10.00 | | | | 0.28 | • | | | 0.08 | | | | 0.36 | | | | 0.22 | | | | 0.02 | | | | — | | | | 0.24 | | | | 10.12 | | | | 3.61 | | | | 0.51 | | | | 0.45 | † | | | 0.45 | † | | | 3.42 | † | | | 107,276 | | | | 360 | |
Class S | | | | | | | | | | | | | | | | | | | | | | | | | | | | | | | | | | | | | | | | | | | | | | | | | | | | | | | | | | | | | | | | | | |
| 12-31-10 | | | | | 10.36 | | | | 0.23 | • | | | 0.38 | | | | 0.61 | | | | 0.26 | | | | — | | | | — | | | | 0.26 | | | | 10.71 | | | | 5.89 | | | | 0.71 | | | | 0.70 | † | | | 0.70 | † | | | 2.10 | † | | | 249,203 | | | | 279 | |
| 12-31-09 | | | | | 10.10 | | | | 0.26 | | | | 0.29 | | | | 0.55 | | | | 0.21 | | | | 0.08 | | | | — | | | | 0.29 | | | | 10.36 | | | | 5.54 | | | | 0.69 | | | | 0.69 | † | | | 0.69 | † | | | 2.59 | † | | | 265,749 | | | | 380 | |
03-10-08(4)–12-31-08 | | | 10.00 | | | | 0.27 | • | | | 0.06 | | | | 0.33 | | | | 0.21 | | | | 0.02 | | | | — | | | | 0.23 | | | | 10.10 | | | | 3.29 | | | | 0.76 | | | | 0.70 | † | | | 0.70 | † | | | 3.42 | † | | | 180,622 | | | | 360 | |
Class S2 | | | | | | | | | | | | | | | | | | | | | | | | | | | | | | | | | | | | | | | | | | | | | | | | | | | | | | | | | | | | | | | | | | |
| 12-31-10 | | | | | 10.37 | | | | 0.21 | • | | | 0.39 | | | | 0.60 | | | | 0.25 | | | | — | | | | — | | | | 0.25 | | | | 10.72 | | | | 5.78 | | | | 0.96 | | | | 0.85 | † | | | 0.85 | † | | | 1.97 | † | | | 3 | | | | 279 | |
02-27-09(4)–12-31-09 | | | 9.99 | | | | 0.20 | | | | 0.47 | | | | 0.67 | | | | 0.21 | | | | 0.08 | | | | — | | | | 0.29 | | | | 10.37 | | | | 6.74 | | | | 0.94 | | | | 0.84 | † | | | 0.84 | † | | | 2.42 | † | | | 3 | | | | 380 | |
See Accompanying Notes to Financial Statements
56
FINANCIAL HIGHLIGHTS (CONTINUED)
Selected data for a share of beneficial interest outstanding throughout each year or period.
| | | | | | Income (loss)
from
investment
operations
|
| | | Less distributions
|
| | | | | | | | | Ratios to average net assets
| | Supplemental
data
| |
|---|
| | | | | | | | | | | | | | | | | | | | | | | | | | | | | | | | | | | | |
|---|
| | | | Net
asset
value,
beginning
of year
or
period
|
| Net
investment
income
(loss)
|
| Net
realized
and
unrealized
gain
(loss)
|
| Total from
investment
operations
|
| From net
investment
income
|
| From
net
realized
gains
|
| From
return
of
capital
|
| Total
distributions
|
| Payment
by
affiliate
($)
|
| Net
asset
value,
end of
year
or
period
|
| Total
Return(1)
|
| Expenses
before
reductions/
additions(2)(3)
|
| Expenses
net
of fee
waivers
and/or
recoupments,
if any(2)(3)
|
| Expenses
net of
all
reductions/
additions(2)(3)
|
| Net
investment
income
(loss)(2)(3)
|
| Net
assets,
end of
year
or
period
|
| Portfolio
turnover
rate
|
|---|
Year or
period ended
|
| ($)
|
| ($)
|
| ($)
|
| ($)
|
| ($)
|
| ($)
|
| ($)
|
| ($)
|
| ($)
|
| (%)
|
| (%)
|
| (%)
|
| (%)
|
| (%)
|
| %
|
| ($000’s)
|
| (%)
|
|---|
ING Euro STOXX 50® Index Portfolio |
Class ADV | | | | | | | | | | | | | | | | | | | | | | | | | | | | | | | | | | | | | | | | | | | | | | | | | | | | | | | | | | | | | | | | | | | | | | |
| 12-31-10 | | | | | 11.63 | | | | 0.18 | • | | | (1.25 | ) | | | (1.07 | ) | | | 0.05 | | | | 0.02 | | | | — | | | | 0.07 | | | | — | | | | 10.49 | | | | (9.13 | ) | | | 1.25 | | | | 0.90 | | | | 0.90 | | | | 1.79 | | | | 4,937 | | | | 27 | |
08-17-09(4)–12-31-09 | | | 10.00 | | | | 0.06 | • | | | 1.57 | | | | 1.63 | | | | — | | | | — | | | | — | | | | — | | | | — | | | | 11.63 | | | | 16.30 | | | | 1.32 | | | | 0.97 | | | | 0.97 | | | | 1.29 | | | | 665 | | | | 1 | |
Class I | | | | | | | | | | | | | | | | | | | | | | | | | | | | | | | | | | | | | | | | | | | | | | | | | | | | | | | | | | | | | | | | | | | | | | |
| 12-31-10 | | | | | 11.66 | | | | 0.31 | • | | | (1.32 | ) | | | (1.01 | ) | | | 0.06 | | | | 0.02 | | | | — | | | | 0.08 | | | | — | | | | 10.57 | | | | (8.64 | ) | | | 0.75 | | | | 0.40 | | | | 0.40 | | | | 3.00 | | | | 873,679 | | | | 27 | |
08-17-09(4)–12-31-09 | | | 10.00 | | | | 0.07 | • | | | 1.59 | | | | 1.66 | | | | — | | | | — | | | | — | | | | — | | | | — | | | | 11.66 | | | | 16.60 | | | | 0.82 | | | | 0.47 | | | | 0.47 | | | | 1.42 | | | | 824,138 | | | | 1 | |
ING FTSE 100 Index® Portfolio |
Class ADV | | | | | | | | | | | | | | | | | | | | | | | | | | | | | | | | | | | | | | | | | | | | | | | | | | | | | | | | | | | | | | | | | | | | | | |
| 12-31-10 | | | | | 11.60 | | | | 0.22 | • | | | 0.79 | | | | 1.01 | | | | 0.07 | | | | 0.08 | | | | — | | | | 0.15 | | | | — | | | | 12.46 | | | | 8.87 | | | | 1.24 | | | | 0.89 | | | | 0.89 | | | | 1.88 | | | | 3,734 | | | | 14 | |
08-17-09(4)–12-31-09 | | | 10.00 | | | | 0.06 | • | | | 1.54 | | | | 1.60 | | | | — | | | | — | | | | — | | | | — | | | | 0.00 | ** | | | 11.60 | | | | 16.00 | (a) | | | 1.33 | | | | 0.98 | | | | 0.98 | | | | 1.25 | | | | 759 | | | | 8 | |
Class I | | | | | | | | | | | | | | | | | | | | | | | | | | | | | | | | | | | | | | | | | | | | | | | | | | | | | | | | | | | | | | | | | | | | | | |
| 12-31-10 | | | | | 11.61 | | | | 0.31 | • | | | 0.77 | | | | 1.08 | | | | 0.08 | | | | 0.08 | | | | — | | | | 0.16 | | | | — | | | | 12.53 | | | | 9.43 | | | | 0.74 | | | | 0.39 | | | | 0.39 | | | | 2.74 | | | | 665,191 | | | | 14 | |
08-17-09(4)–12-31-09 | | | 10.00 | | | | 0.11 | • | | | 1.45 | | | | 1.56 | | | | — | | | | — | | | | — | | | | — | | | | 0.05 | | | | 11.61 | | | | 16.10 | (a) | | | 0.83 | | | | 0.48 | | | | 0.48 | | | | 2.38 | | | | 619,886 | | | | 8 | |
ING Hang Seng Index Portfolio |
Class ADV | | | | | | | | | | | | | | | | | | | | | | | | | | | | | | | | | | | | | | | | | | | | | | | | | | | | | | | | | | | | | | | | | | | | | | |
| 12-31-10 | | | | | 13.04 | | | | 0.16 | • | | | 0.79 | | | | 0.95 | | | | 0.01 | | | | — | | | | — | | | | 0.01 | | | | — | | | | 13.98 | | | | 7.30 | | | | 1.34 | | | | 1.24 | † | | | 1.24 | † | | | 1.22 | † | | | 1,147 | | | | 9 | |
05-04-09(4)–12-31-09 | | | 10.00 | | | | 0.13 | • | | | 2.94 | | | | 3.07 | | | | 0.02 | | | | — | | | | 0.01 | | | | 0.03 | | | | — | | | | 13.04 | | | | 30.72 | | | | 1.39 | | | | 1.28 | † | | | 1.28 | † | | | 1.58 | † | | | 4 | | | | 3 | |
Class I | | | | | | | | | | | | | | | | | | | | | | | | | | | | | | | | | | | | | | | | | | | | | | | | | | | | | | | | | | | | | | | | | | | | | | |
| 12-31-10 | | | | | 13.04 | | | | 0.25 | • | | | 0.76 | | | | 1.01 | | | | 0.01 | | | | — | | | | — | | | | 0.01 | | | | — | | | | 14.04 | | | | 7.76 | | | | 0.84 | | | | 0.74 | † | | | 0.74 | † | | | 1.92 | † | | | 137,227 | | | | 9 | |
05-04-09(4)–12-31-09 | | | 10.00 | | | | 0.04 | • | | | 3.07 | | | | 3.11 | | | | 0.06 | | | | — | | | | 0.01 | | | | 0.07 | | | | — | | | | 13.04 | | | | 31.14 | | | | 0.89 | | | | 0.78 | † | | | 0.78 | † | | | 0.48 | † | | | 101,683 | | | | 3 | |
Class S | | | | | | | | | | | | | | | | | | | | | | | | | | | | | | | | | | | | | | | | | | | | | | | | | | | | | | | | | | | | | | | | | | | | | | |
| 12-31-10 | | | | | 13.03 | | | | 0.21 | • | | | 0.77 | | | | 0.98 | | | | 0.01 | | | | — | | | | — | | | | 0.01 | | | | — | | | | 14.00 | | | | 7.53 | | | | 1.09 | | | | 0.99 | † | | | 0.99 | † | | | 1.63 | † | | | 84,603 | | | | 9 | |
05-01-09(4)–12-31-09 | | | 10.00 | | | | 0.06 | • | | | 3.03 | | | | 3.09 | | | | 0.05 | | | | — | | | | 0.01 | | | | 0.06 | | | | — | | | | 13.03 | | | | 30.93 | | | | 1.14 | | | | 1.03 | † | | | 1.03 | † | | | 0.71 | † | | | 43,353 | | | | 3 | |
ING International Index Portfolio |
Class ADV | | | | | | | | | | | | | | | | | | | | | | | | | | | | | | | | | | | | | | | | | | | | | | | | | | | | | | | | | | | | | | | | | | | | | | |
| 12-31-10 | | | | | 8.17 | | | | 0.13 | • | | | 0.44 | | | | 0.57 | | | | 0.27 | | | | — | | | | — | | | | 0.27 | | | | — | | | | 8.47 | | | | 7.32 | | | | 1.07 | | | | 0.99 | † | | | 0.99 | † | | | 1.71 | † | | | 2,904 | | | | 20 | |
| 12-31-09 | | | | | 6.43 | | | | 0.09 | • | | | 1.65 | | | | 1.74 | | | | — | | | | — | | | | — | | | | — | | | | — | | | | 8.17 | | | | 27.06 | | | | 1.08 | | | | 0.99 | † | | | 0.99 | † | | | 1.13 | † | | | 1,641 | | | | 92 | |
03-10-08(4)–12-31-08 | | | 10.00 | | | | 0.20 | • | | | (3.69 | ) | | | (3.49 | ) | | | 0.08 | | | | — | | | | — | | | | 0.08 | | | | — | | | | 6.43 | | | | (34.85 | ) | | | 1.17 | | | | 1.00 | † | | | 1.00 | † | | | 2.87 | † | | | 2 | | | | 22 | |
Class I | | | | | | | | | | | | | | | | | | | | | | | | | | | | | | | | | | | | | | | | | | | | | | | | | | | | | | | | | | | | | | | | | | | | | | |
| 12-31-10 | | | | | 8.21 | | | | 0.18 | • | | | 0.44 | | | | 0.62 | | | | 0.29 | | | | — | | | | — | | | | 0.29 | | | | — | | | | 8.54 | | | | 7.84 | | | | 0.57 | | | | 0.50 | † | | | 0.50 | † | | | 2.31 | † | | | 256,723 | | | | 20 | |
| 12-31-09 | | | | | 6.41 | | | | 0.18 | • | | | 1.62 | | | | 1.80 | | | | — | | | | — | | | | — | | | | — | | | | — | | | | 8.21 | | | | 28.08 | | | | 0.58 | | | | 0.50 | † | | | 0.50 | † | | | 2.54 | † | | | 216,453 | | | | 92 | |
03-10-08(4)–12-31-08 | | | 10.00 | | | | 0.17 | • | | | (3.65 | ) | | | (3.48 | ) | | | 0.11 | | | | — | | | | — | | | | 0.11 | | | | — | | | | 6.41 | | | | (34.73 | ) | | | 0.67 | | | | 0.50 | † | | | 0.50 | † | | | 2.56 | † | | | 237,777 | | | | 22 | |
See Accompanying Notes to Financial Statements
57
FINANCIAL HIGHLIGHTS (CONTINUED)
Selected data for a share of beneficial interest outstanding throughout each year or period.
| | | | | | Income (loss)
from
investment
operations
|
| | | Less distributions
|
| | | | | | | Ratios to average net assets
| | Supplemental
data
| |
|---|
| | | | | | | | | | | | | | | | | | | | | | | | | | | | | | | | | | |
|---|
| | | | Net
asset
value,
beginning
of year
or
period
|
| Net
investment
income
(loss)
|
| Net
realized
and
unrealized
gain
(loss)
|
| Total from
investment
operations
|
| From net
investment
income
|
| From
net
realized
gains
|
| From
return
of
capital
|
| Total
distributions
|
| Net
asset
value,
end of
year
or
period
|
| Total
Return(1)
|
| Expenses
before
reductions/
additions(2)(3)
|
| Expenses
net
of fee
waivers
and/or
recoupments,
if any(2)(3)
|
| Expenses
net of
all
reductions/
additions(2)(3)
|
| Net
investment
income
(loss)(2)(3)
|
| Net
assets,
end of
year
or
period
|
| Portfolio
turnover
rate
|
|---|
Year or
period ended
|
| ($)
|
| ($)
|
| ($)
|
| ($)
|
| ($)
|
| ($)
|
| ($)
|
| ($)
|
| ($)
|
| (%)
|
| (%)
|
| (%)
|
| (%)
|
| (%)
|
| ($000’s)
|
| (%)
|
|---|
ING International Index Portfolio (continued) |
Class S | | | | | | | | | | | | | | | | | | | | | | | | | | | | | | | | | | | | | | | | | | | | | | | | | | | | | | | | | | | | | | | | | | |
| 12-31-10 | | | | | 8.17 | | | | 0.16 | • | | | 0.44 | | | | 0.60 | | | | 0.28 | | | | — | | | | — | | | | 0.28 | | | | 8.49 | | | | 7.63 | | | | 0.82 | | | | 0.75 | † | | | 0.75 | † | | | 2.09 | † | | | 107,028 | | | | 20 | |
| 12-31-09 | | | | | 6.41 | | | | 0.11 | • | | | 1.65 | | | | 1.76 | | | | — | | | | — | | | | — | | | | — | | | | 8.17 | | | | 27.46 | | | | 0.83 | | | | 0.75 | † | | | 0.75 | † | | | 1.51 | † | | | 112,086 | | | | 92 | |
03-10-08(4)–12-31-08 | | | 10.00 | | | | 0.12 | • | | | (3.60 | ) | | | (3.48 | ) | | | 0.11 | | | | — | | | | — | | | | 0.11 | | | | 6.41 | | | | (34.79 | ) | | | 0.92 | | | | 0.75 | † | | | 0.75 | † | | | 1.93 | † | | | 6,983 | | | | 22 | |
Class S2 | | | | | | | | | | | | | | | | | | | | | | | | | | | | | | | | | | | | | | | | | | | | | | | | | | | | | | | | | | | | | | | | | | |
| 12-31-10 | | | | | 8.19 | | | | 0.15 | • | | | 0.44 | | | | 0.59 | | | | 0.26 | | | | — | | | | — | | | | 0.26 | | | | 8.52 | | | | 7.44 | | | | 1.07 | | | | 0.90 | † | | | 0.90 | † | | | 1.91 | † | | | 5 | | | | 20 | |
02-27-09(4)–12-31-09 | | | 5.05 | | | | 0.10 | • | | | 3.04 | | | | 3.14 | | | | — | | | | — | | | | — | | | | — | | | | 8.19 | | | | 62.18 | | | | 1.08 | | | | 0.90 | † | | | 0.90 | † | | | 1.69 | † | | | 5 | | | | 92 | |
ING Japan TOPIX Index Portfolio |
Class ADV | | | | | | | | | | | | | | | | | | | | | | | | | | | | | | | | | | | | | | | | | | | | | | | | | | | | | | | | | | | | | | | | | | |
| 12-31-10 | | | | | 9.80 | | | | 0.09 | • | | | 1.25 | | | | 1.34 | | | | 0.01 | | | | 0.01 | | | | — | | | | 0.02 | | | | 11.12 | | | | 13.63 | | | | 1.27 | | | | 0.92 | | | | 0.92 | | | | 0.94 | | | | 8,580 | | | | 9 | |
08-17-09(4)–12-31-09 | | | 10.00 | | | | (0.04 | )• | | | (0.16 | ) | | | (0.20 | ) | | | — | | | | — | | | | — | | | | — | | | | 9.80 | | | | (2.00 | ) | | | 1.29 | | | | 0.94 | | | | 0.94 | | | | (1.02 | ) | | | 327 | | | | 5 | |
Class I | | | | | | | | | | | | | | | | | | | | | | | | | | | | | | | | | | | | | | | | | | | | | | | | | | | | | | | | | | | | | | | | | | |
| 12-31-10 | | | | | 9.82 | | | | 0.14 | • | | | 1.25 | | | | 1.39 | | | | 0.01 | | | | 0.01 | | | | — | | | | 0.02 | | | | 11.19 | | | | 14.13 | | | | 0.77 | | | | 0.42 | | | | 0.42 | | | | 1.39 | | | | 404,703 | | | | 9 | |
08-17-09(4)–12-31-09 | | | 10.00 | | | | 0.01 | | | | (0.19 | ) | | | (0.18 | ) | | | — | | | | — | | | | — | | | | — | | | | 9.82 | | | | (1.80 | ) | | | 0.79 | | | | 0.44 | | | | 0.44 | | | | 0.31 | | | | 504,443 | | | | 5 | |
ING WisdomTreeSM Global High-Yielding Equity Index Portfolio |
Class ADV | | | | | | > | | | | > | | | | > | | | | > | | | | > | | | | > | | | | > | | | | > | | | | > | | | | > | | | | > | | | | > | | | | > | | | | > | | | | > | | | | > |
| 12-31-10 | | | | | 7.76 | | | | 0.20 | • | | | 0.24 | | | | 0.44 | | | | 0.27 | | | | — | | | | — | | | | 0.27 | | | | 7.93 | | | | 5.80 | | | | 1.37 | | | | 1.34 | † | | | 1.34 | † | | | 2.67 | † | | | 695 | | | | 47 | |
| 12-31-09 | | | | | 5.99 | | | | 0.22 | | | | 1.55 | | | | 1.77 | | | | — | | | | — | | | | — | | | | — | | | | 7.76 | | | | 29.55 | | | | 1.31 | | | | 1.29 | † | | | 1.29 | † | | | 3.40 | † | | | 1 | | | | 66 | |
01-28-08(4)–12-31-08 | | | 10.00 | | | | 0.34 | • | | | (4.18 | ) | | | (3.84 | ) | | | 0.17 | | | | — | | | | — | | | | 0.17 | | | | 5.99 | | | | (38.33 | ) | | | 1.66 | | | | 1.20 | † | | | 1.20 | † | | | 4.28 | † | | | 1 | | | | 128 | |
Class I | | | | | | | | | | | | | | | | | | | | | | | | | | | | | | | | | | | | | | | | | | | | | | | | | | | | | | | | | | | | | | | | | | |
| 12-31-10 | | | | | 7.71 | | | | 0.06 | • | | | 0.23 | | | | 0.29 | | | | 0.27 | | | | — | | | | — | | | | 0.27 | | | | 7.73 | | | | 3.85 | | | | 0.87 | | | | 0.84 | † | | | 0.84 | † | | | 0.78 | † | | | 0 | * | | | 47 | |
| 12-31-09 | | | | | 5.97 | | | | (0.05 | ) | | | 1.79 | | | | 1.74 | | | | — | | | | — | | | | — | | | | — | | | | 7.71 | | | | 29.15 | | | | 0.81 | | | | 0.79 | † | | | 0.79 | † | | | (0.79 | )† | | | 0 | * | | | 66 | |
01-28-08(4)–12-31-08 | | | 10.00 | | | | 0.41 | • | | | (4.23 | ) | | | (3.82 | ) | | | 0.21 | | | | — | | | | — | | | | 0.21 | | | | 5.97 | | | | (38.10 | ) | | | 1.16 | | | | 0.70 | † | | | 0.70 | † | | | 4.92 | † | | | 0 | * | | | 128 | |
Class S | | | | | | | | | | | | | | | | | | | | | | | | | | | | | | | | | | | | | | | | | | | | | | | | | | | | | | | | | | | | | | | | | | |
| 12-31-10 | | | | | 7.77 | | | | 0.24 | • | | | 0.20 | | | | 0.44 | | | | 0.25 | | | | — | | | | — | | | | 0.25 | | | | 7.96 | | | | 5.86 | | | | 1.12 | | | | 1.09 | † | | | 1.09 | † | | | 3.23 | † | | | 206,216 | | | | 47 | |
| 12-31-09 | | | | | 5.98 | | | | 0.23 | | | | 1.56 | | | | 1.79 | | | | — | | | | — | | | | — | | | | — | | | | 7.77 | | | | 29.93 | | | | 1.06 | | | | 1.04 | † | | | 1.04 | † | | | 3.74 | † | | | 219,257 | | | | 66 | |
01-28-08(4)–12-31-08 | | | 10.00 | | | | 0.31 | • | | | (4.13 | ) | | | (3.82 | ) | | | 0.20 | | | | — | | | | — | | | | 0.20 | | | | 5.98 | | | | (38.10 | ) | | | 1.41 | | | | 0.89 | † | | | 0.89 | † | | | 4.23 | † | | | 148,745 | | | | 128 | |
(1) | | Total return is calculated assuming reinvestment of all dividends, capital gain distributions and return of capital distributions, if any, at net asset value and does not reflect the effect of insurance contract charges. Total return for periods less than one year is not annualized. |
(2) | | Annualized for periods less than one year. |
(3) | | Expense ratios reflect operating expenses of a Portfolio. Expenses before reductions/additions do not reflect amounts reimbursed by the Investment Adviser and/or Distributor or reductions from brokerage commission recapture arrangements or other expense offset arrangements and do not represent the amount paid by a Portfolio during periods when reimbursements or reductions occur. Expenses net of fee waivers reflect expenses after reimbursement by the Investment Adviser and/or Distributor but prior to reductions from brokerage commission recapture arrangements or other expense offset arrangements. Expenses net of all reductions/additions represent the net expenses paid by a Portfolio. Net investment income (loss) is net of all such additions or reductions. |
(4) | | Commencement of operations. |
• | | Calculated using average number of shares outstanding throughout the period. |
| † | | Impact of waiving the advisory fee for the ING Institutional Prime Money Market Fund holding has less than 0.005% impact on the expense ratios and net investment income or loss ratio (Note 4). |
| * | | Amount is less than $500. |
| ** | | Amount is less than $0.005 or more than $(0.005). |
(a) | | Excluding a payment by affiliate in the period ended December 31, 2009, FTSE 100 Index® total return would have been 15.08% and 15.18% on classes ADV and I, respectively. |
See Accompanying Notes to Financial Statements
58
NOTES TO FINANCIAL STATEMENTS AS OF DECEMBER 31, 2010
NOTE 1 — ORGANIZATION
Organization. ING Variable Portfolios, Inc. (the “Company” or “Registrant”) is registered under the Investment Company Act of 1940, as amended (“1940 Act” or “Act”) as an open-end diversified management investment company.
The Company was incorporated under the laws of Maryland on June 4, 1996. There are eighteen active separate investment series that comprise the Company. The thirteen portfolios (each a “Portfolio”, collectively the “Portfolios”) that are in this report are: ING RussellTM Large Cap Index Portfolio (“RussellTM Large Cap Index”), ING RussellTM Large Cap Growth Index Portfolio (“RussellTM Large Cap Growth Index”), ING RussellTM Large Cap Value Index Portfolio (“RussellTM Large Cap Value Index”), ING RussellTM Mid Cap Index Portfolio (“RussellTM Mid Cap Index”), ING RussellTM Mid Cap Growth Index Portfolio (“RussellTM Mid Cap Growth Index”), ING RussellTM Small Cap Index Portfolio (“RussellTM Small Cap Index”), ING U.S. Bond Index Portfolio (“U.S. Bond Index”), ING Euro STOXX 50® Index Portfolio (“Euro STOXX 50® Index”), ING FTSE 100 Index® Portfolio (“FTSE 100 Index®”), ING Hang Seng Index Portfolio (“Hang Seng Index”), ING International Index Portfolio (“International Index”), ING Japan TOPIX Index Portfolio (“Japan TOPIX Index”), and ING WisdomTreeSM Global High-Yielding Equity Index Portfolio (“WisdomTreeSM Index”).
The Company is authorized to offer four share classes of the Portfolios, referred to as Adviser Class (“Class ADV”), Class I, Class S and Service 2 Class (“Class S2”); however, not all Portfolios currently offer all classes. Each class has equal rights as to class and voting privileges. The classes differ principally in the applicable distribution and shareholder service fees. Shareholders of each class also bear certain expenses that pertain to that particular class. All shareholders bear the common expenses of the Portfolios and earn income and realized gains/losses from the Portfolios pro rata based on the average daily net assets of each class, without distinction between share classes. Expenses that are specific to a Portfolio or a class are charged directly to that Portfolio or class. Other operating expenses shared by several Portfolios are generally allocated among those Portfolios based on average net assets. Dividends are determined separately for each class based on income and expenses allocable to each class. Realized gain distributions are allocated to each class pro rata based on the shares outstanding of each class on the date of distribution. Differences in per share dividend rates generally result from differences in separate class expenses, including distribution and shareholder service fees, if applicable.
Shares of the Portfolios may be offered to separate accounts of insurance companies as investment options under variable annuity contracts and variable life insurance policies. Shares may also be offered to qualified pension and retirement plans outside the variable contract and to certain investment advisers and their affiliates. Class I shares may be made available to other investment companies, including series of the companies under fund-of-funds arrangements.
Participating insurance companies and other designated organizations are authorized to receive purchase orders on each Portfolio’s behalf.
ING Investments, LLC serves as the investment adviser (“ING Investments” or the “Investment Adviser”) to the Portfolios. ING Investment Management Co. (“ING IM”) serves as the sub-adviser to each of the Portfolios except U.S. Bond Index. ING Funds Services, LLC serves as the administrator (“IFS” or the “Administrator”) for the Portfolios. ING Investments Distributor, LLC (“IID” or the “Distributor”) serves as the principal underwriter to the Portfolios.
The Investment Adviser, ING IM, IFS and IID are indirect, wholly-owned subsidiaries of ING Groep N.V. (“ING Groep”). ING Groep is a global financial institution of Dutch origin offering banking, investments, life insurance and retirement services.
ING Groep has adopted a formal restructuring plan that was approved by the European Commission in November 2009 under which the ING life insurance businesses, including the retirement services and investment management businesses, which include the Investment Adviser and its affiliates, would be divested by ING Groep by the end of 2013. While there can be no assurance that it will be carried out, the restructuring plan presents certain risks, including uncertainty about the effect on the businesses of the ING entities that service the Portfolios and potential termination of the Portfolios’ existing advisory agreement, which may trigger the need for shareholder approval of new agreements.
NOTE 2 — SIGNIFICANT ACCOUNTING POLICIES
The following significant accounting policies are consistently followed by the Portfolios in the preparation of their financial statements. Such policies are in conformity with U.S. generally accepted accounting principles for investment companies.
59
NOTES TO FINANCIAL STATEMENTS AS OF DECEMBER 31, 2010 (CONTINUED)
NOTE 2 — SIGNIFICANT ACCOUNTING POLICIES (continued)
A. Security Valuation. All investments in securities are recorded at their estimated fair value, as described below. Investments in equity securities traded on a national securities exchange are valued at the last reported sale price. Securities reported by NASDAQ are valued at the NASDAQ official closing prices. Securities traded on an exchange or NASDAQ for which there has been no sale and securities traded in the over-the-counter-market are valued at the mean between the last reported bid and ask prices. All investments quoted in foreign currencies will be valued daily in U.S. dollars on the basis of the foreign currency exchange rates prevailing at that time. Debt securities are valued at prices obtained from independent services or from one or more dealers making markets in the securities and may be adjusted based on the Portfolios’ valuation procedures. U.S. government obligations are valued by using market quotations or independent pricing services that use prices provided by market- makers or estimates of market values obtained from yield data relating to instruments or securities with similar characteristics. Investments in open-end mutual funds are valued at net asset value. Investments in securities of sufficient credit quality maturing in 60 days or less are valued at amortized cost which approximates fair value.
Securities and assets for which market quotations are not readily available (which may include certain restricted securities, which are subject to limitations as to their sale) are valued at their fair values, as defined by the 1940 Act, and as determined in good faith by or under the supervision of the Portfolios’ Board of Directors (“Board”), in accordance with methods that are specifically authorized by the Board. Securities traded on exchanges, including foreign exchanges, which close earlier than the time that a Portfolio calculates its net asset value (“NAV”) may also be valued at their fair values, as defined by the 1940 Act, and as determined in good faith by or under the supervision of the Board, in accordance with methods that are specifically authorized by the Board. All such fair valuations are made in accordance with the valuation procedures of the Portfolios (the “Valuation Procedures”) which have been approved by the Board. The valuation techniques applied in any specific instance are set forth in the Valuation Procedures and may vary from case to case. With respect to a restricted security, for example, consideration is generally given to the cost of the investment, the market value of any unrestricted securities of the same class at the time of valuation, the potential expiration of restrictions on the security, the existence of any registration rights, the costs to the Portfolios related to registration of the security, as well as factors relevant to the issuer itself. Consideration may also be given to the price and extent of any public trading in similar securities of the issuer or comparable companies’ securities. The value of a foreign security traded on an exchange outside the United States is generally based on its price on the principal foreign exchange where it trades as of the time a Portfolio determines its NAV or if the foreign exchange closes prior to the time a Portfolio determines its NAV, the most recent closing price of the foreign security on its principal exchange. Trading in certain non-U.S. securities may not take place on all days on which the New York Stock Exchange (“NYSE”) is open. Further, trading takes place in various foreign markets on days on which the NYSE is not open. Consequently, the calculation of a Portfolio’s NAV may not take place contemporaneously with the determination of the prices of securities held by a Portfolio in foreign securities markets. Further, the value of a Portfolio’s assets may be significantly affected by foreign trading on days when a shareholder cannot purchase or redeem shares of a Portfolio. In calculating a Portfolio’s NAV, foreign securities denominated in foreign currency are converted to U.S. dollar equivalents. If an event occurs after the time at which the market for foreign securities held by a Portfolio closes but before the time that a Portfolio’s NAV is calculated, such event may cause the closing price on the foreign exchange to not represent a readily available reliable market value quotation for such securities at the time a Portfolio determines its NAV. In such a case, a Portfolio will use the fair value of such securities as determined under a Portfolio’s valuation procedures. Events after the close of trading on a foreign market that could require a Portfolio to fair value some or all of its foreign securities include, among others, securities trading in the U.S. and other markets, corporate announcements, natural and other disasters, and political and other events. Among other elements of analysis in the determination of a security’s fair value, the Board has authorized the use of one or more independent research services to assist with such determinations. An independent research service may use statistical analyses and quantitative models to help determine fair value as of the time a Portfolio calculates its NAV.
There can be no assurance that such models accurately reflect the behavior of the applicable markets or the effect of the behavior of such markets on the fair value of securities, or that such markets will continue to behave in a fashion that is consistent with such models. Unlike the closing price of a security on an exchange, fair value determinations employ elements of judgment. Consequently, the fair value assigned to a security may not represent the actual value that a Portfolio could obtain if it were to sell the security at
60
NOTES TO FINANCIAL STATEMENTS AS OF DECEMBER 31, 2010 (CONTINUED)
NOTE 2 — SIGNIFICANT ACCOUNTING POLICIES (continued)
the time of the close of the NYSE. Pursuant to procedures adopted by the Board, a Portfolio is not obligated to use the fair valuations suggested by any research service, and valuation recommendations provided by such research services may be overridden if other events have occurred or if other fair valuations are determined in good faith to be more accurate. Unless an event is such that it causes a Portfolio to determine that the closing prices for one or more securities do not represent readily available reliable market value quotations at the time a Portfolio determines its NAV, events that occur between the time of the close of the foreign market on which they are traded and the close of regular trading on the NYSE will not be reflected in a Portfolio’s NAV.
Fair value is defined as the price that the Portfolios would receive to sell an asset or pay to transfer a liability in an orderly transaction between market participants at the measurement date. Each investment asset or liability of the Portfolios is assigned a level at measurement date based on the significance and source of the inputs to its valuation. Quoted prices in active markets for identical securities as classified as “Level 1,” inputs other than quoted prices for an asset or liability that are observable are classified as “Level 2” and unobservable inputs, including the adviser’s or sub-adviser’s judgment about the assumptions that a market participant would use in pricing an asset or liability are classified as “Level 3.” The inputs used for valuing securities are not necessarily an indication of the risks associated with investing in those securities. Short-term securities of sufficient credit quality which are valued at amortized cost, which approximates fair value, are generally considered to be Level 2 securities under applicable accounting rules. A table summarizing the Portfolios’ investments under these levels of classification is included following the Summary Portfolios of Investments.
For the year ended December 31, 2010, there have been no significant changes to the fair valuation methodologies.
B. Security Transactions and Revenue Recognition. Securities transactions are accounted for on the trade date. Realized gains and losses are reported on the basis of identified cost of securities sold. Interest income is recorded on an accrual basis. Dividend income is recorded on the ex-dividend date, or for certain foreign securities, when the information becomes available to the Portfolios. Premium amortization and discount accretion are determined by the effective yield method.
C. Foreign Currency Translation. The books and records of the Portfolios are maintained in U.S. dollars. Any foreign currency amounts are translated into U.S. dollars on the following basis:
| (1) | | Market value of investment securities, other assets and liabilities — at the exchange rates prevailing at the end of the day. |
| (2) | | Purchases and sales of investment securities, income and expenses — at the rates of exchange prevailing on the respective dates of such transactions. |
Although the net assets and the market values are presented at the foreign exchange rates at the end of the day, the Portfolios do not isolate the portion of the results of operations resulting from changes in foreign exchange rates on investments from the fluctuations arising from changes in market prices of securities held. Such fluctuations are included with the net realized and unrealized gains or losses from investments. For securities, which are subject to foreign withholding tax upon disposition, liabilities are recorded on the Statements of Assets and Liabilities for the estimated tax withholding based on the securities’ current market value. Upon disposition, realized gains or losses on such securities are recorded net of foreign withholding tax.
Reported net realized foreign exchange gains or losses arise from sales of foreign currencies, currency gains or losses realized between the trade and settlement dates on securities transactions, the difference between the amounts of dividends, interest, and foreign withholding taxes recorded on a Portfolio’s books, and the U.S. dollar equivalent of the amounts actually received or paid. Net unrealized foreign exchange gains and losses arise from changes in the value of assets and liabilities other than investments in securities at fiscal year end, resulting from changes in the exchange rate. Foreign security and currency transactions may involve certain considerations and risks not typically associated with investing in U.S. companies and U.S. government securities. These risks include, but are not limited to, revaluation of currencies and future adverse political and economic developments, which could cause securities and their markets to be less liquid and prices more volatile than those of comparable U.S. companies and U.S. government securities.
D. Distributions to Shareholders. The Portfolios record distributions to their shareholders on the ex-dividend date. All Portfolios (except U.S. Bond Index) declare and pay dividends annually. U.S. Bond Index declares and pays dividends quarterly. The Portfolios may make
61
NOTES TO FINANCIAL STATEMENTS AS OF DECEMBER 31, 2010 (CONTINUED)
NOTE 2 — SIGNIFICANT ACCOUNTING POLICIES (continued)
distributions on a more frequent basis to comply with the distribution requirements of the Internal Revenue Code. The characteristics of income and gains to be distributed are determined in accordance with income tax regulations, which may differ from U.S. generally accepted accounting principles for investment companies.
E. Federal Income Taxes. It is the policy of the Portfolios to comply with the requirements of subchapter M of the Internal Revenue Code that are applicable to regulated investment companies and to distribute substantially all of their net investment income and any net realized capital gains to their shareholders. Therefore, a federal income tax or excise tax provision is not required. Management has considered the sustainability of the Portfolios’ tax positions taken on federal income tax returns for all open tax years in making this determination. No capital gain distributions shall be made until the capital loss carryforwards have been fully utilized or expire.
F. Use of Estimates. The preparation of financial statements in conformity with U.S. generally accepted accounting principles requires management to make estimates and assumptions that affect the reported amounts of assets and liabilities and disclosure of contingent assets and liabilities at the date of the financial statements and the reported amounts of increases and decreases in net assets from operations during the reporting period. Actual results could differ from those estimates.
G. Risk Exposures and the use of Derivative Instruments. Each Portfolio’s investment objectives permit it to enter into various types of derivatives contracts, including, but not limited to, futures
contracts, forward foreign currency exchange contracts, credit default swaps, interest rate swaps, total return swaps, and purchased and written options. In doing so, the Portfolio will employ strategies in differing combinations to permit it to increase or decrease the level of risk, or change the level or types of exposure to market risk factors. This may allow the Portfolio to pursue its objectives more quickly, and efficiently than if it were to make direct purchases or sales of securities capable of affecting a similar response to market factors.
Market Risk Factors. In pursuit of its investment objectives, a Portfolio may seek to use derivatives to increase or decrease its exposure to the following market risk factors:
Credit Risk. Credit risk relates to the ability of the issuer to meet interest and principal payments, or both, as they come due. In general, lower-grade, higher-yield bonds are subject to credit risk to a greater extent than lower-yield, higher-quality bonds.
Equity Risk. Equity risk relates to the change in value of equity securities as they relate to increases or decreases in the general market.
Foreign Exchange Rate Risk. Foreign exchange rate risk relates to the change in U.S. dollar value of a security held that is denominated in a foreign currency. The U.S. dollar value of a foreign currency denominated security will decrease as the dollar appreciates against the currency, while the U.S. dollar value will increase as the dollar depreciates against the currency.
Interest Rate Risk. Interest rate risk refers to the fluctuations in value of fixed-income securities resulting from the inverse relationship between price and yield. For example, an increase in general interest rates will tend to reduce the market value of already issued fixed-income investments, and a decline in general interest rates will tend to increase their value. In addition, debt securities with longer durations, which tend to have higher yields, are subject to potentially greater fluctuations in value from changes in interest rates than obligations with shorter durations.
Risks of Investing in Derivatives. Each Portfolio’s use of derivatives can result in losses due to unanticipated changes in the market risk factors and the overall market. In instances where a Portfolio is using derivatives to decrease, or hedge, exposures to market risk factors for securities held by a Portfolio, there are also risks that those derivatives may not perform as expected resulting in losses for the combined or hedged positions.
The use of these strategies involves certain special risks, including a possible imperfect correlation, or even no correlation, between price movements of derivative instruments and price movements of related investments. While some strategies involving derivative instruments can reduce the risk of loss, they can also reduce the opportunity for gain or even result in losses by offsetting favorable price movements in related investments or otherwise, due to the possible inability of a Portfolio to purchase or sell a portfolio security at a time that otherwise would be favorable or the possible need to sell a portfolio security at a disadvantageous time because the Portfolio is required to maintain asset coverage or offsetting positions in
62
NOTES TO FINANCIAL STATEMENTS AS OF DECEMBER 31, 2010 (CONTINUED)
NOTE 2 — SIGNIFICANT ACCOUNTING POLICIES (continued)
connection with transactions in derivative instruments. Additional associated risks from investing in derivatives also exist and potentially could have significant effects on the valuation of the derivative and a Portfolio. Associated risks are not the risks that a Portfolio is attempting to increase or decrease exposure to, per their investment objectives, but are the additional risks from investing in derivatives. Examples of these associated risks are liquidity risk, which is the risk that a Portfolio will not be able to sell the derivative in the open market in a timely manner, and counterparty credit risk, which is the risk that the counterparty will not fulfill its obligation to a Portfolio. Associated risks can be different for each type of derivative and are discussed by each derivative type in the following notes.
H. Forward Foreign Currency Contracts. Certain Portfolios may enter into forward foreign currency contracts primarily to hedge against foreign currency exchange rate risks on their non-U.S. dollar denominated investment securities. When entering into a forward foreign currency contract, a Portfolio agrees to receive or deliver a fixed quantity of foreign currency for an agreed-upon price on an agreed future date. These contracts are valued daily and a Portfolio’s net equity therein, representing unrealized gain or loss on the contracts as measured by the difference between the forward foreign exchange rates at the dates of entry into the contracts and the forward rates at the reporting date, is included in the Statements of Assets and Liabilities. Realized and unrealized gains and losses are included in the Statements of Operations. These instruments involve market and/ or credit risk in excess of the amount recognized in the Statements of Assets and Liabilities. Risks arise from the possible inability of counterparties to meet the terms of their contracts and from movement in currency and securities values and interest rates. Open forward foreign currency contracts are presented following the respective Summary Portfolio of Investments.
For the year ended December 31, 2010, certain Portfolios have entered into forward foreign currency contracts with the obligation to buy and sell specified foreign currencies in the future at a currently negotiated forward rate in order to increase or decrease exposure to foreign exchange rate risk. The Portfolios uses forward foreign currency contracts to enhance potential gain, hedge against anticipated currency exchange rates, gain exposure to foreign currencies and to maintain diversity and liquidity of the portfolio.
During the year ended December 31, 2010, the following Portfolios had average contract amounts on forward foreign currency contracts to buy and sell as disclosed below:
| | | | Buy
| | Sell
|
|---|
| Euro STOXX 50® Index | | | | $ | 12,051,668 | | | $ | 4,240,920 | |
| FTSE 100 Index® | | | | | 10,982,106 | | | | 5,491,821 | |
| International Index | | | | | 7,232,521 | | | | 3,472,526 | |
| Japan TOPIX Index | | | | | 12,578,355 | | | | 5,514,151 | |
For the year ended December 31, 2010, the above Portfolios used forward foreign currency contracts to protect its non-U.S. dollar denominated holdings from adverse currency movements and to gain exposure to currencies for the purposes of risk management or enhanced return. Please refer to the table following the Summary Portfolio of Investments for open forward foreign currency contract at December 31, 2010.
I. Futures Contracts. Each Portfolio may enter into futures contracts involving foreign currency, interest rates, securities and security indices. A futures contract is a commitment to buy or sell a specific amount of a financial instrument at a negotiated price on a stipulated future date. Each Portfolio may buy and sell futures contracts. Futures contracts traded on a commodities or futures exchange will be valued at the final settlement price or official closing price on the principal exchange as reported by such principal exchange at its trading session ending at, or most recently prior to, the time when the Portfolios assets are valued.
Upon entering into a futures contract, each Portfolio is required to deposit either cash or securities (initial margin) in an amount equal to a certain percentage of the contract value. Subsequent payments (variation margin) are made or received by the Portfolio each day. The variation margin payments are equal to the daily changes in the contract value and are recorded as unrealized gains and losses. Open futures contracts are reported on a table following each Summary Portfolio of Investments. Securities held in collateralized accounts to cover initial margin requirements on open futures contracts are footnoted in the Summary Portfolio of Investments. Cash collateral held by the broker to cover initial margin requirements on open futures contracts are noted in each Portfolio’s Statement of Assets and Liabilities. The net change in unrealized appreciation and depreciation is reported in each Portfolio’s Statement of Operations. Realized gains (losses) are reported in each Portfolio’s Statement of Operations at the closing or expiration of futures contracts.
Futures contracts are exposed to the market risk factor of the underlying financial instrument. During the year
63
NOTES TO FINANCIAL STATEMENTS AS OF DECEMBER 31, 2010 (CONTINUED)
NOTE 2 — SIGNIFICANT ACCOUNTING POLICIES (continued)
ended December 31, 2010, the below Portfolios have purchased futures contracts on various equity indices to “equitize” cash. Futures contracts are purchased to provide immediate market exposure proportionate to the size of the Portfolio’s respective cash flows and residual cash balances in order to decrease potential tracking error if the cash remained uninvested in the market. Additional associated risks of entering into futures contracts include the possibility that there may be an illiquid market where the Portfolios are unable to liquidate the contract or enter into an offsetting position and, if used for hedging purposes, the risk that the price of the contract will correlate imperfectly with the prices of the Portfolios’ securities. With futures, there is minimal counterparty credit risk to the Portfolios since futures are exchange traded and the exchange’s clearinghouse, as counterparty to all exchange traded futures, guarantees the futures against default.
During the year ended December 31, 2010, the Portfolios had average notional values on futures contracts purchased as disclosed below:
RussellTM Large Cap Index | | | | $ | 30,208,032 | |
RussellTM Large Cap Growth Index | | | | | 4,239,676 | |
RussellTM Large Cap Value Index | | | | | 1,340,030 | |
RussellTM Mid Cap Index | | | | | 27,213,888 | |
RussellTM Mid Cap Growth Index | | | | | 9,421,022 | |
RussellTM Small Cap Index | | | | | 23,658,656 | |
| Euro STOXX 50® Index | | | | | 14,814,356 | |
| FTSE 100 Index® | | | | | 18,657,098 | |
| Hang Seng Index | | | | | 9,165,707 | |
| International Index | | | | | 13,561,019 | |
| Japan TOPIX Index | | | | | 16,365,091 | |
J. Securities Lending. Each Portfolio (except WisdomTreeSM Index) has the option to temporarily loan up to 33-1/3% of its total assets to brokers, dealers or other financial institutions in exchange for a negotiated lender’s fee. The borrower is required to fully collateralize the loans with cash or U.S. government securities. Generally, in the event of counterparty default, a Portfolio has the right to use collateral to offset losses incurred. There would be potential loss to a Portfolio in the event a Portfolio is delayed or prevented from exercising its right to dispose of the collateral. A Portfolio bears the risk of loss with respect to the investment of collateral. Engaging in securities lending could have a leveraging effect, which may intensify the credit, market and other risks associated with investing in a Portfolio.
K. Restricted Securities. The Portfolios may invest in restricted securities, which include those sold under Rule 144A of the Securities Act of 1933 (“1933 Act”) or securities offered pursuant to Section 4(2) of the 1933 Act, and/or are subject to legal or contractual restrictions on resale and may not be publicly sold without registration under the 1933 Act. Restricted securities are valued using market quotations when readily available. In the absence of market quotations, the securities are valued based upon their fair value, as defined by the Act, determined under procedures approved by the Board.
L. Delayed-Delivery Transactions. Each Portfolio may purchase or sell securities on a when-issued or forward commitment basis. The price of the underlying securities and date when the securities will be delivered and paid for are fixed at the time the transaction is negotiated. The market value of such securities is identified in each Portfolio’s Summary Portfolio of Investments. Losses may arise due to changes in the market value of the securities or from the inability of counterparties to meet the terms of the contract. In connection with such purchases, the Portfolios are required to identify liquid assets sufficient to cover the purchase price.
M. Indemnifications. In the normal course of business, the Company may enter into contracts that provide certain indemnifications. The Company’s maximum exposure under these arrangements is dependent on future claims that may be made against the Portfolios and, therefore, cannot be estimated; however, based on experience, management considers the risk of loss from such claims remote.
NOTE 3 — INVESTMENT TRANSACTIONS
For the year ended December 31, 2010, the cost of purchases and the proceeds from the sales of securities, excluding short-term securities and U.S. government securities, were as follows:
| | | | Purchases
| | Sales
|
|---|
RussellTM Large Cap Index | | | | $ | 122,088,428 | | | $ | 78,193,647 | |
RussellTM Large Cap Growth Index | | | | | 83,924,495 | | | | 120,069,301 | |
RussellTM Largecap Value Index | | | | | 28,877,534 | | | | 24,142,230 | |
RussellTM Mid Cap Index | | | | | 114,705,695 | | | | 250,479,994 | |
RussellTM Midcap Growth Index | | | | | 71,092,499 | | | | 95,626,508 | |
RussellTM Small Cap Index | | | | | 148,224,891 | | | | 155,006,149 | |
| U.S. Bond Index | | | | | 675,546,464 | | | | 734,243,963 | |
Euro STOXX 50® Index | | | | | 340,058,485 | | | | 211,370,696 | |
FTSE 100 Index® | | | | | 97,020,600 | | | | 82,267,814 | |
| Hang Seng Index | | | | | 99,353,433 | | | | 13,838,754 | |
| International Index | | | | | 90,064,383 | | | | 64,787,952 | |
| Japan TOPIX Index | | | | | 41,741,751 | | | | 160,908,642 | |
WisdomTreeSM Index | | | | | 93,201,445 | | | | 110,507,586 | |
U.S. government securities not included above were as follows:
| | | | Purchases
| | Sales
|
|---|
| U.S. Bond Index | | | | $ | 9,363,677,718 | | | $ | 9,173,090,022 | |
64
NOTES TO FINANCIAL STATEMENTS AS OF DECEMBER 31, 2010 (CONTINUED)
NOTE 4 — INVESTMENT MANAGEMENT, ADMINISTRATIVE AND LICENSING FEES
The Portfolios entered into investment management agreements (“Investment Management Agreements”) with the Investment Adviser. The Investment Management Agreements compensate the Investment Adviser with a fee, computed daily and payable monthly, based on the average daily net assets of each Portfolio, at the following annual rates:
RussellTM Large Cap Index | | | | | 0.25 | % |
RussellTM Large Cap Growth Index(1) | | | | | 0.45 | % |
RussellTM Large Cap Value Index(1) | | | | | 0.45 | % |
RussellTM Mid Cap Index | | | | | 0.31 | % |
RussellTM Mid Cap Growth Index(1) | | | | | 0.45 | % |
RussellTM Small Cap Index | | | | | 0.33 | % |
| U.S. Bond Index | | | | | 0.32 | % |
Euro STOXX 50® Index(2) | | | | | 0.60 | % |
FTSE 100 Index®(2) | | | | | 0.60 | % |
Hang Seng Index(1) | | | | | 0.60 | % |
| International Index | | | | | 0.38 | % |
Japan TOPIX Index(2) | | | | | 0.60 | % |
WisdomTreeSM Index | | | | | 0.46 | % |
(1) | | Pursuant to a side agreement, ING Investments has agreed to waive 0.10% of each Portfolio’s advisory fee through May 1, 2011. Any fees waived or reimbursed are not eligible for recoupment. |
(2) | | Pursuant to a side agreement, ING Investments has agreed to waive 0.25% of each Portfolio’s advisory fee through August 5, 2012. This side agreement will only renew if ING Investments elects to renew it. Any fees waived or reimbursed are not eligible for recoupment. |
The Investment Adviser entered into sub-advisory agreements with ING IM. ING IM acts as sub-adviser to all Portfolios except for U.S. Bond Index. Subject to such policies as the Board or the Investment Adviser may determine, ING IM manages the Portfolios’ assets in accordance with the Portfolios’ investment objectives, policies, and limitations.
Neuberger Berman Fixed Income LLC serves as sub-adviser to U.S. Bond Index pursuant to a Sub-Advisory Agreement effective May 4, 2009.
During the period, the Portfolios were permitted to invest end-of-day cash balances into ING Institutional Prime Money Market Fund. Investment management fees paid by the Portfolios were reduced by an amount equal to the management fees paid indirectly to ING Institutional Prime Money Market Fund with respect to assets invested by the Portfolios.
For the year ended December 31, 2010, the Investment Adviser waived the following amounts, which are not subject to recoupment:
RussellTM Large Cap Index | | | | $ | 17,789 | |
RussellTM Large Cap Growth Index | | | | | 2,707 | |
RussellTM Large Cap Value Index | | | | | 937 | |
RussellTM Mid Cap Index | | | | | 21,002 | |
RussellTM Mid Cap Growth Index | | | | | 4,248 | |
RussellTM Small Cap Index | | | | | 19,324 | |
| U.S. Bond Index | | | | | 190,654 | |
| Hang Seng Index | | | | | 2,686 | |
| International Index | | | | | 3,437 | |
WisdomTreeSM Index | | | | | 162 | |
Effective December 20, 2010, ING Institutional Prime Money Market Fund was liquidated. As a result of this liquidation, the Portfolios will no longer invest end-of day cash balances into ING Institutional Prime Money Market Fund.
IFS, an indirect, wholly-owned subsidiary of ING Groep, acts as administrator to the Portfolios and provides certain administrative and shareholder services necessary for Portfolio operations and is responsible for the supervision of other service providers. IFS is entitled to receive from each Portfolio a fee at an annual rate of 0.10% of daily net assets. Pursuant to a side agreement, IFS has agreed to waive 0.10% of Euro STOXX 50® Index, FTSE 100 Index® and Japan TOPIX Index administrative fee through August 5, 2012.
Russell Investment Group receives an annual licensing fee for the Russell Global Large Cap® Index, Russell Top 200® Index, Russell Top 200® Growth Index, Russell Top 200® Value Index, the Russell Midcap® Index, Russell Midcap® Growth Index and the Russell 2000® Index. WisdomTreeSM Index pays an annual licensing fee to WisdomTree Investments, Inc. Hang Seng Data Services Limited receives an estimated annual licensing fee for the Hang Seng Index. STOXX Limited, Zurich, Switzerland and/or Dow Jones & Company, Inc.; FTSE International Limited; and Tokyo Stock Exchange, Inc. receive an annual licensing fee for Euro STOXX 50® Index, FTSE 100 Index® and Japan TOPIX Index, respectively.
In placing equity security transactions, the Investment Adviser or each sub-adviser is required to use its best efforts to choose a broker capable of providing brokerage services necessary to obtain the best execution for each transaction. Subject to this requirement, the Investment Adviser or each sub-adviser may allocate equity security transactions through certain designated broker-dealers. Some of these broker-dealers participate in commission recapture programs that have been established for the benefit of the Portfolios. Under these programs, the participating broker-dealers will return to a Portfolio a portion of the brokerage commissions (in the form of a credit to a Portfolio) paid to the broker-dealers to pay certain expenses of a Portfolio. These commission recapture payments benefit the Portfolios and not the Investment Adviser or each sub-adviser. Any amount credited to a Portfolio is reflected as brokerage commission recapture in the Statements of Operations.
65
NOTES TO FINANCIAL STATEMENTS AS OF DECEMBER 31, 2010 (CONTINUED)
NOTE 5 — DISTRIBUTION AND SERVICE FEES
Class ADV and Class S2 shares of the respective Portfolios are subject to a Shareholder Service and Distribution Plan (the “Plan”). Under the Plan, the Distributor is paid an annual shareholder service fee at the rate of 0.25% and an annual distribution fee at the rate of 0.25%(1) of the average daily net assets attributable to its Class ADV and Class S2 shares. The Distributor has contractually agreed to waive a portion of its fee equal to 0.10% of the average daily net assets attributable to the distribution fee paid by Class S2 of the respective Portfolios, so that the actual fee paid by a Portfolio is an annual rate of 0.15%. The expense waiver will continue through at least May 1, 2011.
Class S shares of the Portfolios have adopted a Shareholder Services and Distribution Plan pursuant to Rule 12b-1 under the 1940 Act (the “12b-1 Plans”), whereby the Distributor is compensated by each Portfolio for expenses incurred for shareholder servicing and/or distribution of each Portfolio’s shares. Pursuant to the 12b-1 Plans, the Distributor is entitled to a payment each month to compensate for expenses incurred in the distribution and promotion of each Portfolio’s shares, including expenses incurred in printing prospectuses and reports used for sales purposes, expenses incurred in preparing and printing sales literature and other such distribution related expenses, including any distribution or shareholder servicing fees paid to securities dealers who have executed a distribution agreement with the Distributor. Under the 12b-1 Plans, Class S shares of the Portfolios pay the Distributor a fee calculated at an annual rate of 0.25% of average daily net assets.
(1) | | Effective May 1, 2009, IFD has agreed to waive 0.01% of the distribution fee for Class ADV shares of International Index through May 1, 2011. |
NOTE 6 — OTHER TRANSACTIONS WITH AFFILIATED AND RELATED PARTIES
At December 31, 2010, the Portfolios had the following amounts recorded as payable to affiliates on the accompanying Statements of Assets and Liabilities (see Notes 4 and 5):
Portfolio
| | | | Accrued
Investment
Management Fees
| | Accrued
Administrative Fees
| | Accrued
Shareholder
Service and
Distribution Fees
| | Total
|
|---|
RussellTM Large Cap Index | | | | $ | 169,139 | | | $ | 67,140 | | | $ | 99,537 | | | $ | 335,816 | |
RussellTM Large Cap Growth Index | | | | | 114,744 | | | | 32,841 | | | | 31,236 | | | | 178,821 | |
RussellTM Large Cap Value Index | | | | | 25,913 | | | | 7,409 | | | | 8,993 | | | | 42,315 | |
RussellTM Mid Cap Index | | | | | 416,086 | | | | 134,465 | | | | 39,127 | | | | 589,678 | |
RussellTM Mid Cap Growth Index | | | | | 99,888 | | | | 28,700 | | | | 69,428 | | | | 198,016 | |
RussellTM Small Cap Index | | | | | 216,864 | | | | 65,854 | | | | 47,435 | | | | 330,153 | |
| U.S. Bond Index | | | | | 1,021,620 | | | | 319,674 | | | | 54,826 | | | | 1,396,120 | |
Euro STOXX 50® Index | | | | | 269,866 | | | | — | | | | 2,136 | | | | 272,002 | |
FTSE 100® Index | | | | | 204,407 | | | | — | | | | 1,612 | | | | 206,019 | |
| Hang Seng Index | | | | | 92,518 | | | | 18,556 | | | | 18,444 | | | | 129,518 | |
| International Index | | | | | 116,979 | | | | 30,815 | | | | 23,612 | | | | 171,406 | |
| Japan TOPIX Index | | | | | 124,327 | | | | — | | | | 3,514 | | | | 127,841 | |
WisdomTreeSM Index | | | | | 79,561 | | | | 17,296 | | | | 43,380 | | | | 140,237 | |
The Company has adopted a Deferred Compensation Plan (the “Policy”), which allows eligible non-affiliated directors as described in the Policy to defer the receipt of all or a portion of the directors’ fees payable. Amounts defined are treated as though invested in various “notional” funds advised by ING Investments until distribution in accordance with the Policy.
At December 31, 2010, the following ING Portfolios or indirect, wholly owned subsidiaries of ING Groep owned more than 5% of the following Portfolios:
Subsidiary
| | | | Fund
| | Percentage
|
|---|
| ING Index Solution 2015 Portfolio — | | | | RussellTM Large Cap Index | | | 5.79 | % |
| |
| ING Index Solution 2025 Portfolio — | | | | RussellTM Large Cap Index | | | 9.46 | % |
| | | | | International Index | | | 9.29 | % |
| |
| ING Index Solution 2035 Portfolio — | | | | RussellTM Large Cap Index | | | 6.62 | % |
| | | | | International Index | | | 8.24 | % |
| |
| ING Index Solution 2045 Portfolio — | | | | International Index | | | 5.90 | % |
66
NOTES TO FINANCIAL STATEMENTS AS OF DECEMBER 31, 2010 (CONTINUED)
NOTE 6 — OTHER TRANSACTIONS WITH AFFILIATED AND RELATED PARTIES (continued)
Subsidiary
| | | | Fund
| | Percentage
|
|---|
| ING Life Insurance & Annuity Company — | | | | RussellTM Large Cap Index | | | 13.60 | % |
| | | | | RussellTM Large Cap Growth Index | | | 9.63 | % |
| | | | | RussellTM Large Cap Value Index | | | 15.03 | % |
| | | | | RussellTM Mid Cap Index | | | 6.10 | % |
| | | | | RussellTM Small Cap Index | | | 11.03 | % |
| | | | | International Index | | | 16.90 | % |
| |
| ING Retirement Conservative Portfolio — | | | | U.S. Bond Index | | | 6.19 | % |
| |
| ING Retirement Growth Portfolio — | | | | RussellTM Mid Cap Index | | | 42.77 | % |
| | | | | RussellTM Small Cap Index | | | 37.00 | % |
| | | | | U.S. Bond Index | | | 31.02 | % |
| | | | | Euro STOXX 50® Index | | | 52.60 | % |
| | | | | FTSE 100 Index® | | | 52.59 | % |
| | | | | Hang Seng Index | | | 32.43 | % |
| | | | | Japan TOPIX Index | | | 52.08 | % |
| |
| ING Retirement Moderate Growth Portfolio — | | | | RussellTM Mid Cap Index | | | 25.39 | % |
| | | | | RussellTM Small Cap Index | | | 17.09 | % |
| | | | | U.S. Bond Index | | | 30.08 | % |
| | | | | Euro STOXX 50® Index | | | 30.20 | % |
| | | | | FTSE 100 Index® | | | 30.22 | % |
| | | | | Hang Seng Index | | | 18.71 | % |
| | | | | Japan TOPIX Index | | | 29.25 | % |
| |
| ING Retirement Moderate Portfolio — | | | | RussellTM Mid Cap Index | | | 9.84 | % |
| | | | | U.S. Bond Index | | | 18.49 | % |
| | | | | Euro STOXX 50® Index | | | 14.70 | % |
| | | | | FTSE 100 Index® | | | 14.69 | % |
| | | | | Hang Seng Index | | | 9.14 | % |
| | | | | Japan TOPIX Index | | | 14.68 | % |
| |
| ING USA Annuity and Life Insurance Company — | | | | RussellTM Large Cap Index | | | 49.15 | % |
| | | | | RussellTM Large Cap Growth Index | | | 37.92 | % |
| | | | | RussellTM Large Cap Value Index | | | 39.99 | % |
| | | | | RussellTM Mid Cap Index | | | 7.84 | % |
| | | | | RussellTM Mid Cap Growth Index | | | 92.22 | % |
| | | | | RussellTM Small Cap Index | | | 22.95 | % |
| | | | | U.S. Bond Index | | | 5.92 | % |
| | | | | Hang Seng Index | | | 36.74 | % |
| | | | | International Index | | | 17.95 | % |
| | | | | WisdomTreeSM Index | | | 97.38 | % |
| |
| ING Strategic Allocation Moderate Portfolio — | | | | International Index | | | 8.73 | % |
| |
| ING Strategic Allocation Growth Portfolio — | | | | International Index | | | 11.36 | % |
| Reliastar Life Insurance Company — | | | | RussellTM Large Cap Growth Index | | | 38.65 | % |
| | | | | RussellTM Large Cap Value Index | | | 33.30 | % |
| |
| Security Life Insurance Company — | | | | RussellTM Large Cap Growth Index | | | 13.40 | % |
| | | | | RussellTM Large Cap Value Index | | | 9.96 | % |
| | | | | International Index | | | 7.28 | % |
Control is defined by the 1940 Act as the beneficial ownership, either directly or through one or more controlled companies, of more than 25% of the voting securities of a company. The 1940 Act defines affiliates as companies that are under common control. Therefore, because certain Portfolios have a common owner that owns over 25% of the outstanding securities of the Portfolios, they may be deemed to be affiliates of each other. Investment activities of these shareholders could have a material impact on the Portfolios.
These security purchases were related to the initial subscriptions of shares of the portfolio by affiliated ING Portfolios.
NOTE 7 — OTHER ACCRUED EXPENSES AND LIABILITIES
At December 31, 2010, the following portfolios had the following payables included in Other Accrued Expenses and Liabilities on the Statements of Assets and Liabilities that exceed 5% of total liabilities.
67
NOTES TO FINANCIAL STATEMENTS AS OF DECEMBER 31, 2010 (CONTINUED)
NOTE 7 — OTHER ACCRUED EXPENSES AND LIABILITIES (continued)
Portfolio
| | | | Accrued Expenses
| | Amount
|
|---|
RussellTM Large Cap Value Index | | | | Audit | | $ | 11,988 | |
| | | | | Postage | | | 37,687 | |
| Hang Seng Index | | | | Custody | | | 39,101 | |
| | | | | License Fee | | | 66,615 | |
WisdomTreeSM Index | | | | Custody | | | 83,685 | |
| | | | | License Fee | | | 95,751 | |
NOTE 8 — EXPENSE LIMITATION AGREEMENTS
ING Investments entered into written expense limitation agreements (“Expense Limitation Agreements”) with each of the following Portfolios whereby the Investment Adviser has agreed to limit expenses, excluding interest expense, taxes, brokerage commissions and extraordinary expenses (and acquired fund fees and expenses) to the levels listed below:
| | | | Class ADV
| | Class I
| | Class S
| | Class S2
|
|---|
RussellTM Large Cap Index | | | | 0.87% | | 0.37% | | 0.62% | | 0.77% |
RussellTM Large Cap Growth Index(1) | | | | N/A | | N/A | | N/A | | N/A |
RussellTM Large Cap Value Index(1) | | | | N/A | | N/A | | N/A | | N/A |
RussellTM Mid Cap Index | | | | 0.93% | | 0.43% | | 0.68% | | 0.83% |
RussellTM Small Cap Index | | | | 0.95% | | 0.45% | | 0.70% | | 0.85% |
| U.S. Bond Index | | | | 0.95% | | 0.45% | | 0.70% | | 0.85% |
| International Index | | | | 1.00% | | 0.50% | | 0.75% | | 0.90% |
WisdomTreeSM Index | | | | 1.34% | | 0.84% | | 1.09% | | N/A |
(1) | | Effective March 15, 2010, pursuant to a side agreement, the Investment Adviser has agreed to waive all or a portion of the advisory fee so that the expense limits are 1.00%, 0.50%, and 0.75% for Class ADV, Class I, and Class S, respectively. The expense limits will continue until at least May 1, 2011. The amount waived are not eligible for recoupment. |
The Investment Adviser may at a later date recoup from a Portfolio management fees waived and other expenses assumed by the Investment Adviser during the previous 36 months, but only if, after such recoupment, the Portfolio’s expense ratio does not exceed the percentage described above. Waived and reimbursed fees net of any recoupment by the Investment Adviser of such waived and reimbursed fees are reflected on the accompanying Statements of Operations. Amounts payable by the Investment Manager are reflected on the accompanying Statements of Assets and Liabilities for each Portfolio.
As of December 31, 2010, the amount of waived and reimbursed fees that are subject to recoupment by the Investment Adviser, and the related expiration dates are as follows:
| | | | December 31,
| |
|---|
| | | | 2011
| | 2012
| | 2013
| | Total
|
|---|
RussellTM Large Cap Index | | | | $ | 79,602 | | | $ | 314,893 | | | $ | 142,366 | | | $ | 536,861 | |
RussellTM Mid Cap Index | | | | | 77,850 | | | | — | | | | 255,442 | | | $ | 333,292 | |
RussellTM Small Cap Index | | | | | 97,613 | | | | 67,172 | | | | 107,834 | | | $ | 272,619 | |
| U.S. Bond Index | | | | | — | | | | — | | | | 158,277 | | | $ | 158,277 | |
| International Index | | | | | 303,727 | | | | 316,824 | | | | 225,189 | | | $ | 845,740 | |
WisdomTreeSM Index | | | | | 527,898 | | | | 4,266 | | | | 53,357 | | | $ | 585,521 | |
The Expense Limitation Agreements are contractual and shall renew automatically for one-year terms unless ING Investments provides written notice of the termination of an Expense Limitation Agreement within 90 days of the end of the then current term.
NOTE 9 — LINE OF CREDIT
The Portfolios included in this report, in addition to certain other funds managed by the Investment Adviser, have entered into an unsecured committed revolving line of credit agreement with The Bank of New York Mellon (the “Credit Agreement”) for an aggregate amount of $100,000,000. The proceeds may be used to: (1) temporarily finance the purchase or sale of securities; or (2) finance the redemption of shares of an investor in the funds. During the period, the funds to which the line of credit is available paid a commitment fee equal to 0.15% per annum, and beginning December 15, 2010, 0.10% per annum on the daily unused portion of the committed line amount.
Generally, borrowings under the credit agreement accrue interest at the federal funds rate plus a specified margin. Repayments generally must be made within 60 days after the date of a revolving credit advance.
The following Portfolios utilized the line of credit during the year December 31, 2010:
| | | | Days
Utilized
| | Approximate
Average Daily
Balance
| | Approximate
Weighted
Average
Interest Rate
|
|---|
RussellTM Large Cap Index | | | | | 8 | | | $ | 2,187,500 | | | | 1.43 | % |
RussellTM Large Cap Growth Index | | | | | 7 | | | | 895,714 | | | | 1.43 | % |
RussellTM Large Cap Value Index | | | | | 1 | | | | 500,000 | | | | 1.37 | % |
RussellTM Mid Cap Index | | | | | 14 | | | | 4,469,286 | | | | 1.41 | % |
RussellTM Mid Cap Growth Index | | | | | 11 | | | | 1,062,727 | | | | 1.44 | % |
RussellTM Small Cap Index | | | | | 4 | | | | 1,253,750 | | | | 1.42 | % |
| U.S. Bond Index | | | | | 13 | | | | 2,069,231 | | | | 1.42 | % |
| Euro STOXX 50® Index | | | | | 44 | | | | 1,542,273 | | | | 1.43 | % |
FTSE 100 Index®(1) | | | | | 27 | | | | 1,510,370 | | | | 1.43 | % |
68
NOTES TO FINANCIAL STATEMENTS AS OF DECEMBER 31, 2010 (CONTINUED)
NOTE 9 — LINE OF CREDIT (continued)
| | | | Days
Utilized
| | Approximate
Average Daily
Balance
| | Approximate
Weighted
Average
Interest Rate
|
|---|
| Hang Seng Index | | | | | 6 | | | $ | 2,503,333 | | | | 1.43 | % |
| International Index | | | | | 20 | | | | 3,262,500 | | | | 1.43 | % |
Japan TOPIX Index(2) | | | | | 47 | | | | 1,985,426 | | | | 1.43 | % |
WisdomTreeSM Index(3) | | | | | 101 | | | | 1,166,743 | | | | 1.43 | % |
(1) | | At December 31, 2010, FTSE 100 Index® had an outstanding balance of $1,040,000. |
(2) | | At December 31, 2010, Japan TOPIX Index had an outstanding balance of $12,675,000. |
(3) | | At December 31, 2010, WisdomTreeSM had an outstanding balance of $85,000. |
NOTE 10 — CAPITAL SHARES
Transactions in capital shares and dollars were as follows:
| | | | Shares
sold
| | Shares
issued in
merger
| | Reinvestment
of
distributions
| | Shares
redeemed
| | Net increase
(decrease)
in shares
outstanding
| | Shares
sold
| | Shares
issued in
merger
| | Reinvestment
of
distributions
| | Shares
redeemed
| | Net increase
(decrease)
|
|---|
Year or
period ended
| | | | #
| | #
| | #
| | #
| | #
| | ($)
| | ($)
| | ($)
| | ($)
| | ($)
|
|---|
RussellTM Large Cap Index | | | | | | | | | | | | | | | | | | | | | | | | | | | | | | | | | | | | | | | | | | |
Class ADV | | | | | | | | | | | | | | | | | | | | | | | | | | | | | | | | | | | | | | | | | | |
| 12-31-10 | | | | | 414,121 | | | | — | | | | 28,178 | | | | (153,442 | ) | | | 288,857 | | | | 3,694,127 | | | | — | | | | 257,832 | | | | (1,337,599 | ) | | | 2,614,360 | |
| 12-31-09 | | | | | 806,534 | | | | 4,241 | | | | — | | | | (196,747 | ) | | | 614,028 | | | | 6,323,688 | | | | 31,814 | | | | — | | | | (1,484,041 | ) | | | 4,871,461 | |
Class I | | | | | | | | | | | | | | | | | | | | | | | | | | | | | | | | | | | | | | | | | | |
| 12-31-10 | | | | | 23,008,813 | | | | — | | | | 1,037,639 | | | | (17,034,097 | ) | | | 7,012,355 | | | | 204,988,712 | | | | — | | | | 9,567,029 | | | | (154,161,523 | ) | | | 60,394,218 | |
| 12-31-09 | | | | | 62,786,467 | | | | 4,588,187 | | | | 23,688 | | | | (185,978,175 | ) | | | (118,579,833 | ) | | | 448,379,285 | | | | 34,604,407 | | | | 165,344 | | | | (1,532,492,745 | ) | | | (1,049,343,709 | ) |
Class S | | | | | | | | | | | | | | | | | | | | | | | | | | | | | | | | | | | | | | | | | | |
| 12-31-10 | | | | | 5,962,922 | | | | — | | | | 1,626,635 | | | | (10,021,357 | ) | | | (2,431,800 | ) | | | 53,240,324 | | | | — | | | | 14,948,771 | | | | (88,587,310 | ) | | | (20,398,215 | ) |
| 12-31-09 | | | | | 11,628,590 | | | | 40,051,489 | | | | — | | | | (6,070,653 | ) | | | 45,609,426 | | | | 87,941,728 | | | | 301,387,793 | | | | — | | | | (47,759,460 | ) | | | 341,570,061 | |
Class S2 | | | | | | | | | | | | | | | | | | | | | | | | | | | | | | | | | | | | | | | | | | |
| 12-31-10 | | | | | 5,097 | | | | — | | | | — | | | | (726 | ) | | | 4,371 | | | | 46,250 | | | | — | | | | — | | | | (6,900 | ) | | | 39,350 | |
02-27-09(1)–
12-31-09 | | | | | 509 | | | | 340,871 | | | | — | | | | (340,871 | ) | | | 509 | | | | 3,000 | | | | 2,560,252 | | | | — | | | | (2,664,699 | ) | | | (101,447 | ) |
| |
RussellTM Large Cap Growth Index | | | | | | | | | | | | | | | | | | | | | | | | | | | | | | | | | | | | | | | | | | |
Class ADV | | | | | | | | | | | | | | | | | | | | | | | | | | | | | | | | | | | | | | | | | | |
| 12-31-10 | | | | | 5,374 | | | | — | | | | 65 | | | | (302 | ) | | | 5,137 | | | | 72,751 | | | | — | | | | 865 | | | | (3,927 | ) | | | 69,689 | |
| 12-31-09 | | | | | 16,613 | | | | 611 | | | | — | | | | (5,455 | ) | | | 11,769 | | | | 188,157 | | | | 6,649 | | | | — | | | | (64,819 | ) | | | 129,987 | |
Class I | | | | | | | | | | | | | | | | | | | | | | | | | | | | | | | | | | | | | | | | | | |
| 12-31-10 | | | | | 425,642 | | | | — | | | | 117,051 | | | | (2,681,659 | ) | | | (2,138,966 | ) | | | 5,675,196 | | | | — | | | | 1,566,141 | | | | (34,728,995 | ) | | | (27,487,658 | ) |
05-01-09(1)–
12-31-09 | | | | | 1,216,490 | | | | 20,076,130 | | | | — | | | | (2,481,080 | ) | | | 18,811,540 | | | | 12,474,891 | | | | 218,739,904 | | | | — | | | | (29,281,691 | ) | | | 201,933,104 | |
Class S | | | | | | | | | | | | | | | | | | | | | | | | | | | | | | | | | | | | | | | | | | |
| 12-31-10 | | | | | 888,295 | | | | — | | | | 58,837 | | | | (1,950,848 | ) | | | (1,003,716 | ) | | | 11,579,369 | | | | — | | | | 786,063 | | | | (25,116,613 | ) | | | (12,751,181 | ) |
05-01-09(1)–
12-31-09 | | | | | 614,401 | | | | 11,828,343 | | | | — | | | | (1,168,235 | ) | | | 11,274,509 | | | | 7,044,707 | | | | 128,752,323 | | | | — | | | | (13,899,229 | ) | | | 121,897,801 | |
Class S2(2) | | | | | | | | | | | | | | | | | | | | | | | | | | | | | | | | | | | | | | | | | | |
| 12-31-10 | | | | | — | | | | — | | | | — | | | | (301 | ) | | | (301 | ) | | | — | | | | — | | | | — | | | | (4,012 | ) | | | (4,012 | ) |
| 12-31-09 | | | | | 301 | | | | 873 | | | | — | | | | (873 | ) | | | 301 | | | | 3,010 | | | | 9,507 | | | | — | | | | (9,937 | ) | | | 2,580 | |
RussellTM Large Cap Value Index | | | | | | | | | | | | | | | | | | | | | | | | | | | | | | | | | | | | | | | | | | |
Class ADV | | | | | | | | | | | | | | | | | | | | | | | | | | | | | | | | | | | | | | | | | | |
| 12-31-10 | | | | | 140 | | | | — | | | | 243 | | | | (304 | ) | | | 79 | | | | 1,651 | | | | — | | | | 3,003 | | | | (3,447 | ) | | | 1,207 | |
| 12-31-09 | | | | | 679 | | | | 1,369 | | | | — | | | | (3 | ) | | | 2,045 | | | | 7,765 | | | | 14,607 | | | | — | | | | (35 | ) | | | 22,337 | |
(1) | | Commencement of operations. |
(2) | | Class S2 liquidated on April 6th, 2010. |
69
NOTES TO FINANCIAL STATEMENTS AS OF DECEMBER 31, 2010 (CONTINUED)
NOTE 10 — CAPITAL SHARES (continued)
| | | | Shares
sold
| | Shares
issued in
merger
| | Reinvestment
of
distributions
| | Shares
redeemed
| | Net increase
(decrease)
in shares
outstanding
| | Shares
sold
| | Shares
issued in
merger
| | Reinvestment
of
distributions
| | Shares
redeemed
| | Net increase
(decrease)
|
|---|
Year or
period ended
| | | | #
| | #
| | #
| | #
| | #
| | ($)
| | ($)
| | ($)
| | ($)
| | ($)
|
|---|
RussellTM Large Cap Value Index (continued) | | | | | | | | | | | | | | | | | | | | | | | | | | | | | | | | | | | | | | | | | | |
Class I | | | | | | | | | | | | | | | | | | | | | | | | | | | | | | | | | | | | | | | | | | |
| 12-31-10 | | | | | 128,320 | | | | — | | | | 426,510 | | | | (748,194 | ) | | | (193,364 | ) | | | 2,218,830 | | | | — | | | | 5,264,458 | | | | (9,686,101 | ) | | | (2,202,813 | ) |
05-01-09(1)–
12-31-09 | | | | | 7,831,148 | | | | 4,132,743 | | | | — | | | | (8,152,016 | ) | | | 3,811,875 | | | | 78,584,488 | | | | 44,149,107 | | | | — | | | | (97,998,349 | ) | | | 24,735,246 | |
Class S | | | | | | | | | | | | | | | | | | | | | | | | | | | | | | | | | | | | | | | | | | |
| 12-31-10 | | | | | 1,575,994 | | | | — | | | | 365,497 | | | | (862,961 | ) | | | 1,078,530 | | | | 20,133,180 | | | | — | | | | 4,507,747 | | | | (10,246,485 | ) | | | 14,394,442 | |
05-01-09(1)–
12-31-09 | | | | | 563,705 | | | | 2,136,666 | | | | — | | | | (317,506 | ) | | | 2,382,865 | | | | 6,605,374 | | | | 22,824,118 | | | | — | | | | (3,911,847 | ) | | | 25,517,645 | |
| |
Class S2(2) | | | | | | | | | | | | | | | | | | | | | | | | | | | | | | | | | | | | | | | | | | |
| 12-31-10 | | | | | — | | | | — | | | | — | | | | (302 | ) | | | (302 | ) | | | — | | | | — | | | | — | | | | (4,059 | ) | | | (4,059 | ) |
| 12-31-09 | | | | | 302 | | | | 63,768 | | | | — | | | | (63,768 | ) | | | 302 | | | | 3,010 | | | | 680,734 | | | | — | | | | (716,251 | ) | | | (32,507 | ) |
RussellTM Mid Cap Index | | | | | | | | | | | | | | | | | | | | | | | | | | | | | | | | | | | | | | | | | | |
Class ADV | | | | | | | | | | | | | | | | | | | | | | | | | | | | | | | | | | | | | | | | | | |
| 12-31-10 | | | | | 1,036,256 | | | | — | | | | 2,186 | | | | (125,809 | ) | | | 912,633 | | | | 10,384,932 | | | | — | | | | 22,950 | | | | (1,249,931 | ) | | | 9,157,951 | |
| 12-31-09 | | | | | 345,657 | | | | — | | | | — | | | | (45,719 | ) | | | 299,938 | | | | 2,764,740 | | | | — | | | | — | | | | (376,576 | ) | | | 2,388,164 | |
Class I | | | | | | | | | | | | | | | | | | | | | | | | | | | | | | | | | | | | | | | | | | |
| 12-31-10 | | | | | 14,543,762 | | | | — | | | | 707,434 | | | | (33,382,969 | ) | | | (18,131,773 | ) | | | 145,526,084 | | | | — | | | | 7,484,652 | | | | (340,030,006 | ) | | | (187,019,270 | ) |
| 12-31-09 | | | | | 130,965,857 | | | | — | | | | — | | | | (10,398,627 | ) | | | 120,567,230 | | | | 1,068,640,028 | | | | — | | | | — | | | | (86,000,868 | ) | | | 982,639,160 | |
Class S | | | | | | | | | | | | | | | | | | | | | | | | | | | | | | | | | | | | | | | | | | |
| 12-31-10 | | | | | 7,791,525 | | | | — | | | | 62,683 | | | | (4,870,570 | ) | | | 2,983,638 | | | | 78,577,298 | | | | — | | | | 660,052 | | | | (47,262,542 | ) | | | 31,974,808 | |
| 12-31-09 | | | | | 9,687,362 | | | | — | | | | — | | | | (2,370,486 | ) | | | 7,316,876 | | | | 74,534,767 | | | | — | | | | — | | | | (18,987,191 | ) | | | 55,547,576 | |
Class S2 | | | | | | | | | | | | | | | | | | | | | | | | | | | | | | | | | | | | | | | | | | |
| 12-31-10 | | | | | 39,939 | | | | — | | | | — | | | | (3,178 | ) | | | 36,761 | | | | 421,935 | | | | — | | | | 17 | | | | (33,915 | ) | | | 388,037 | |
02-27-09(1)–
12-31-09 | | | | | 543 | | | | — | | | | — | | | | — | | | | 543 | | | | 3,000 | | | | — | | | | — | | | | — | | | | 3,000 | |
RussellTM Mid Cap Growth Index | | | | | | | | | | | | | | | | | | | | | | | | | | | | | | | | | | | | | | | | | | |
Class ADV | | | | | | | | | | | | | | | | | | | | | | | | | | | | | | | | | | | | | | | | | | |
| 12-31-10 | | | | | — | | | | — | | | | — | | | | — | | | | — | | | | — | | | | — | | | | — | | | | — | | | | — | |
| 12-31-09 | | | | | 301 | | | | 49 | | | | — | | | | (49 | ) | | | 301 | | | | 3,019 | | | | 568 | | | | — | | | | (568 | ) | | | 3,019 | |
Class I | | | | | | | | | | | | | | | | | | | | | | | | | | | | | | | | | | | | | | | | | | |
| 12-31-10 | | | | | 289,894 | | | | — | | | | 9,125 | | | | (262,807 | ) | | | 36,212 | | | | 4,117,689 | | | | — | | | | 133,775 | | | | (3,511,520 | ) | | | 739,944 | |
05-01-09(1)–
12-31-09 | | | | | 6,959,392 | | | | 749,246 | | | | — | | | | (6,974,468 | ) | | | 734,170 | | | | 69,974,278 | | | | 8,711,574 | | | | — | | | | (84,119,269 | ) | | | (5,433,417 | ) |
Class S | | | | | | | | | | | | | | | | | | | | | | | | | | | | | | | | | | | | | | | | | | |
| 12-31-10 | | | | | 2,993,074 | | | | — | | | | 240,342 | | | | (3,992,739 | ) | | | (759,323 | ) | | | 43,713,303 | | | | — | | | | 3,520,481 | | | | (55,118,984 | ) | | | (7,885,200 | ) |
05-01-09(1)–
12-31-09 | | | | | 1,699,533 | | | | 20,506,400 | | | | — | | | | (1,504,811 | ) | | | 20,701,122 | | | | 19,853,904 | | | | 238,275,925 | | | | — | | | | (18,376,097 | ) | | | 239,753,732 | |
Class S2 | | | | | | | | | | | | | | | | | | | | | | | | | | | | | | | | | | | | | | | | | | |
| 12-31-10 | | | | | 27,897 | | | | — | | | | 1,215 | | | | (43,314 | ) | | | (14,202 | ) | | | 384,994 | | | | — | | | | 17,848 | | | | (601,313 | ) | | | (198,471 | ) |
05-01-09(1)–
12-31-09 | | | | | 10,810 | | | | 1,031,614 | | | | — | | | | (918,984 | ) | | | 123,440 | | | | 127,003 | | | | 11,981,187 | | | | — | | | | (10,686,523 | ) | | | 1,421,667 | |
RussellTM Small Cap Index | | | | | | | | | | | | | | | | | | | | | | | | | | | | | | | | | | | | | | | | | | |
Class ADV | | | | | | | | | | | | | | | | | | | | | | | | | | | | | | | | | | | | | | | | | | |
| 12-31-10 | | | | | 972,141 | | | | — | | | | 1,787 | | | | (106,562 | ) | | | 867,366 | | | | 10,434,489 | | | | — | | | | 20,300 | | | | (1,084,530 | ) | | | 9,370,259 | |
| 12-31-09 | | | | | 219,133 | | | | — | | | | — | | | | (90,593 | ) | | | 128,540 | | | | 1,867,253 | | | | — | | | | — | | | | (688,445 | ) | | | 1,178,808 | |
Class I | | | | | | | | | | | | | | | | | | | | | | | | | | | | | | | | | | | | | | | | | | |
| 12-31-10 | | | | | 8,561,166 | | | | — | | | | 246,748 | | | | (16,661,129 | ) | | | (7,853,215 | ) | | | 87,448,044 | | | | — | | | | 2,825,269 | | | | (178,839,019 | ) | | | (88,565,706 | ) |
| 12-31-09 | | | | | 41,361,021 | | | | — | | | | — | | | | (6,049,796 | ) | | | 35,311,225 | | | | 366,013,223 | | | | — | | | | — | | | | (49,792,368 | ) | | | 316,220,855 | |
Class S | | | | | | | | | | | | | | | | | | | | | | | | | | | | | | | | | | | | | | | | | | |
| 12-31-10 | | | | | 10,262,131 | | | | — | | | | 65,563 | | | | (7,539,422 | ) | | | 2,788,272 | | | | 111,533,698 | | | | — | | | | 748,070 | | | | (76,761,204 | ) | | | 35,520,564 | |
| 12-31-09 | | | | | 8,260,134 | | | | — | | | | — | | | | (3,926,562 | ) | | | 4,333,572 | | | | 66,820,527 | | | | — | | | | — | | | | (30,947,333 | ) | | | 35,873,194 | |
(1) | | Commencement of operations. |
(2) | | Class S2 liquidated on April 6th, 2010. |
70
NOTES TO FINANCIAL STATEMENTS AS OF DECEMBER 31, 2010 (CONTINUED)
NOTE 10 — CAPITAL SHARES (continued)
| | | | Shares
sold
| | Shares
issued in
merger
| | Reinvestment
of
distributions
| | Shares
redeemed
| | Net increase
(decrease)
in shares
outstanding
| | Shares
sold
| | Shares
issued in
merger
| | Reinvestment
of
distributions
| | Shares
redeemed
| | Net increase
(decrease)
|
|---|
Year or
period ended
| | | | #
| | #
| | #
| | #
| | #
| | ($)
| | ($)
| | ($)
| | ($)
| | ($)
|
|---|
RussellTM Small Cap Index (continued) | | | | | | | | | | | | | | | | | | | | | | | | | | | | | | | | | | | | | | | | | | |
Class S2 |
| 12-31-10 | | | | | 11,990 | | | | — | | | | — | | | | (769 | ) | | | 11,221 | | | | 128,996 | | | | — | | | | 16 | | | | (8,909 | ) | | | 120,103 | |
02-27-09(1)–
12-31-09 | | | | | 498 | | | | — | | | | — | | | | — | | | | 498 | | | | 3,000 | | | | — | | | | — | | | | — | | | | 3,000 | |
U.S. Bond Index | | | | | | | | | | | | | | | | | | | | | | | | | | | | | | | | | | | | | | | | | | |
Class ADV | | | | | | | | | | | | | | | | | | | | | | | | | | | | | | | | | | | | | | | | | | |
| 12-31-10 | | | | | 276,734 | | | | — | | | | 5,307 | | | | (73,412 | ) | | | 208,629 | | | | 2,972,868 | | | | — | | | | 56,943 | | | | (791,465 | ) | | | 2,238,346 | |
| 12-31-09 | | | | | 130,420 | | | | — | | | | 2,788 | | | | (9,326 | ) | | | 123,882 | | | | 1,341,135 | | | | — | | | | 28,806 | | | | (97,126 | ) | | | 1,272,815 | |
Class I | | | | | | | | | | | | | | | | | | | | | | | | | | | | | | | | | | | | | | | | | | |
| 12-31-10 | | | | | 128,706,238 | | | | — | | | | 8,305,836 | | | | (133,552,746 | ) | | | 3,459,328 | | | | 1,385,363,309 | | | | — | | | | 89,035,675 | | | | (1,431,713,570 | ) | | | 42,685,414 | |
| 12-31-09 | | | | | 345,687,876 | | | | — | | | | 5,826,836 | | | | (25,079,835 | ) | | | 326,434,877 | | | | 3,598,173,962 | | | | — | | | | 60,493,379 | | | | (259,243,878 | ) | | | 3,399,423,463 | |
Class S | | | | | | | | | | | | | | | | | | | | | | | | | | | | | | | | | | | | | | | | | | |
| 12-31-10 | | | | | 7,990,147 | | | | — | | | | 592,646 | | | | (10,954,733 | ) | | | (2,371,940 | ) | | | 85,655,201 | | | | — | | | | 6,342,097 | | | | (117,386,260 | ) | | | (25,388,962 | ) |
| 12-31-09 | | | | | 17,319,716 | | | | — | | | | 740,722 | | | | (10,300,686 | ) | | | 7,759,752 | | | | 175,956,572 | | | | — | | | | 7,617,842 | | | | (106,240,547 | ) | | | 77,333,867 | |
Class S2 | | | | | | | | | | | | | | | | | | | | | | | | | | | | | | | | | | | | | | | | | | |
| 12-31-10 | | | | | — | | | | — | | | | — | | | | — | | | | — | | | | — | | | | — | | | | — | | | | — | | | | — | |
02-27-09(1)–
12-31-09 | | | | | 300 | | | | — | | | | — | | | | — | | | | 300 | | | | 3,000 | | | | — | | | | — | | | | — | | | | 3,000 | |
Euro STOXX 50® Index | | | | | | | | | | | | | | | | | | | | | | | | | | | | | | | | | | | | | | | | | | |
Class ADV | | | | | | | | | | | | | | | | | | | | | | | | | | | | | | | | | | | | | | | | | | |
| 12-31-10 | | | | | 826,094 | | | | — | | | | 885 | | | | (413,777 | ) | | | 413,202 | | | | 8,585,151 | | | | — | | | | 9,008 | | | | (4,306,902 | ) | | | 4,287,257 | |
| 12-31-09 | | | | | 105,791 | | | | — | | | | — | | | | (48,579 | ) | | | 57,212 | | | | 1,227,774 | | | | — | | | | — | | | | (575,345 | ) | | | 652,429 | |
Class I | | | | | | | | | | | | | | | | | | | | | | | | | | | | | | | | | | | | | | | | | | |
| 12-31-10 | | | | | 36,016,444 | | | | — | | | | 590,334 | | | | (24,639,080 | ) | | | 11,967,698 | | | | 345,622,750 | | | | — | | | | 6,033,212 | | | | (252,114,511 | ) | | | 99,541,451 | |
08-17-09(1)–
12-31-09 | | | | | 71,988,441 | | | | — | | | | — | | | | (1,285,710 | ) | | | 70,702,731 | | | | 788,609,442 | | | | — | | | | — | | | | (14,882,964 | ) | | | 773,726,478 | |
FTSE 100 Index® | | | | | | | | | | | | | | | | | | | | | | | | | | | | | | | | | | | | | | | | | | |
Class ADV | | | | | | | | | | | | | | | | | | | | | | | | | | | | | | | | | | | | | | | | | | |
| 12-31-10 | | | | | 605,094 | | | | — | | | | 1,210 | | | | (371,928 | ) | | | 234,376 | | | | 6,901,056 | | | | — | | | | 13,658 | | | | (4,298,076 | ) | | | 2,616,638 | |
08-17-09(1)–
12-31-09 | | | | | 66,278 | | | | — | | | | — | | | | (872 | ) | | | 65,406 | | | | 760,973 | | | | — | | | | — | | | | (10,105 | ) | | | 750,868 | |
Class I | | | | | | | | | | | | | | | | | | | | | | | | | | | | | | | | | | | | | | | | | | |
| 12-31-10 | | | | | 12,679,519 | | | | — | | | | 752,201 | | | | (13,724,336 | ) | | | (292,616 | ) | | | 136,085,193 | | | | — | | | | 8,482,160 | | | | (154,740,656 | ) | | | (10,173,303 | ) |
08-17-09(1)–
12-31-09 | | | | | 56,119,922 | | | | — | | | | — | | | | (2,744,666 | ) | | | 53,375,256 | | | | 590,099,945 | | | | — | | | | — | | | | (31,496,322 | ) | | | 558,603,623 | |
Hang Seng Index | | | | | | | | | | | | | | | | | | | | | | | | | | | | | | | | | | | | | | | | | | |
Class ADV | | | | | | | | | | | | | | | | | | | | | | | | | | | | | | | | | | | | | | | | | | |
| 12-31-10 | | | | | 86,450 | | | | — | | | | — | | | | (4,726 | ) | | | 81,724 | | | | 1,148,219 | | | | — | | | | — | | | | (63,958 | ) | | | 1,084,261 | |
| 12-31-09 | | | | | 301 | | | | — | | | | — | | | | — | | | | 301 | | | | 3,042 | | | | — | | | | — | | | | (32 | ) | | | 3,010 | |
Class I | | | | | | | | | | | | | | | | | | | | | | | | | | | | | | | | | | | | | | | | | | |
| 12-31-10 | | | | | 3,765,114 | | | | — | | | | 6,390 | | | | (1,798,181 | ) | | | 1,973,323 | | | | 52,358,970 | | | | — | | | | 84,227 | | | | (22,960,904 | ) | | | 29,482,293 | |
05-04-09(1)–
12-31-09 | | | | | 7,993,900 | | | | — | | | | 44,069 | | | | (239,218 | ) | | | 7,798,751 | | | | 98,384,835 | | | | — | | | | 567,606 | | | | (3,198,232 | ) | | | 95,754,209 | |
Class S | | | | | | | | | | | | | | | | | | | | | | | | | | | | | | | | | | | | | | | | | | |
| 12-31-10 | | | | | 4,344,485 | | | | — | | | | 2,729 | | | | (1,630,049 | ) | | | 2,717,165 | | | | 57,708,795 | | | | — | | | | 35,938 | | | | (20,468,801 | ) | | | 37,275,932 | |
05-01-09(1)–
12-31-09 | | | | | 3,968,953 | | | | — | | | | 15,981 | | | | (657,302 | ) | | | 3,327,632 | | | | 48,197,983 | | | | — | | | | 205,672 | | | | (8,006,133 | ) | | | 40,397,522 | |
Class S2(2) | | | | | | | | | | | | | | | | | | | | | | | | | | | | | | | | | | | | | | | | | | |
| 12-31-10 | | | | | — | | | | — | | | | — | | | | (301 | ) | | | (301 | ) | | | — | | | | — | | | | — | | | | (3,919 | ) | | | (3,919 | ) |
| 12-31-09 | | | | | 301 | | | | — | | | | — | | | | — | | | | 301 | | | | 3,042 | | | | — | | | | — | | | | (32 | ) | | | 3,010 | |
(1) | | Commencement of operations. |
(2) | | Class S2 liquidated on April 6th, 2010. |
71
NOTES TO FINANCIAL STATEMENTS AS OF DECEMBER 31, 2010 (CONTINUED)
NOTE 10 — CAPITAL SHARES (continued)
| | | | Shares
sold
| | Shares
issued in
merger
| | Reinvestment
of
distributions
| | Shares
redeemed
| | Net increase
(decrease)
in shares
outstanding
| | Shares
sold
| | Shares
issued in
merger
| | Reinvestment
of
distributions
| | Shares
redeemed
| | Net increase
(decrease)
|
|---|
Year or
period ended
| | | | #
| | #
| | #
| | #
| | #
| | ($)
| | ($)
| | ($)
| | ($)
| | ($)
|
|---|
International Index | | | | | | | | | | | | | | | | | | | | | | | | | | | | | | | | | | | | | | | | | | |
Class ADV | | | | | | | | | | | | | | | | | | | | | | | | | | | | | | | | | | | | | | | | | | |
| 12-31-10 | | | | | 199,172 | | | | — | | | | 8,101 | | | | (65,189 | ) | | | 142,084 | | | | 1,561,830 | | | | — | | | | 63,107 | | | | (513,377 | ) | | | 1,111,560 | |
| 12-31-09 | | | | | 248,746 | | | | 57 | | | | — | | | | (48,236 | ) | | | 200,567 | | | | 1,844,721 | | | | 431 | | | | — | | | | (356,115 | ) | | | 1,489,037 | |
Class I | | | | | | | | | | | | | | | | | | | | | | | | | | | | | | | | | | | | | | | | | | |
| 12-31-10 | | | | | 11,035,638 | | | | — | | | | 1,073,106 | | | | (8,409,448 | ) | | | 3,699,296 | | | | 86,477,478 | | | | — | | | | 8,402,417 | | | | (65,819,798 | ) | | | 29,060,097 | |
| 12-31-09 | | | | | 53,902,474 | | | | 17,733,250 | | | | — | | | | (82,349,501 | ) | | | (10,713,777 | ) | | | 356,197,706 | | | | 133,423,290 | | | | — | | | | (628,485,056 | ) | | | (138,864,060 | ) |
Class S | | | | | | | | | | | | | | | | | | | | | | | | | | | | | | | | | | | | | | | | | | |
| 12-31-10 | | | | | 4,759,642 | | | | — | | | | 474,391 | | | | (6,339,277 | ) | | | (1,105,244 | ) | | | 38,088,042 | | | | — | | | | 3,695,507 | | | | (47,981,168 | ) | | | (6,197,619 | ) |
| 12-31-09 | | | | | 7,302,500 | | | | 7,735,608 | | | | — | | | | (2,412,729 | ) | | | 12,625,379 | | | | 52,784,062 | | | | 58,026,786 | | | | — | | | | (17,695,203 | ) | | | 93,115,645 | |
Class S2 | | | | | | | | | | | | | | | | | | | | | | | | | | | | | | | | | | | | | | | | | | |
| 12-31-10 | | | | | — | | | | — | | | | — | | | | — | | | | — | | | | — | | | | — | | | | — | | | | — | | | | — | |
02-27-09(1)–
12-31-09 | | | | | 594 | | | | 43,721 | | | | — | | | | (43,721 | ) | | | 594 | | | | 3,001 | | | | 328,820 | | | | — | | | | (328,816 | ) | | | 3,005 | |
| |
Japan TOPIX Index | | | | | | | | | | | | | | | | | | | | | | | | | | | | | | | | | | | | | | | | | | |
Class ADV | | | | | | | | | | | | | | | | | | | | | | | | | | | | | | | | | | | | | | | | | | |
| 12-31-10 | | | | | 1,077,186 | | | | — | | | | 381 | | | | (339,309 | ) | | | 738,258 | | | | 11,029,666 | | | | — | | | | 4,011 | | | | (3,441,687 | ) | | | 7,591,990 | |
| 12-31-09 | | | | | 69,758 | | | | — | | | | — | | | | (36,374 | ) | | | 33,384 | | | | 680,753 | | | | — | | | | — | | | | (345,245 | ) | | | 335,508 | |
Class I | | | | | | | | | | | | | | | | | | | | | | | | | | | | | | | | | | | | | | | | | | |
| 12-31-10 | | | | | 3,293,180 | | | | — | | | | 75,517 | | | | (18,566,445 | ) | | | (15,197,748 | ) | | | 32,515,237 | | | | — | | | | 797,459 | | | | (190,615,490 | ) | | | (157,302,794 | ) |
08-17-09(1)–
12-31-09 | | | | | 52,289,149 | | | | — | | | | — | | | | (938,297 | ) | | | 51,350,852 | | | | 512,100,821 | | | | — | | | | — | | | | (9,218,128 | ) | | | 502,882,693 | |
| |
WisdomTreeSM Index | | | | | | | | | | | | | | | | | | | | | | | | | | | | | | | | | | | | | | | | | | |
Class ADV | | | | | | | | | | | | | | | | | | | | | | | | | | | | | | | | | | | | | | | | | | |
| 12-31-10 | | | | | 93,011 | | | | — | | | | 672 | | | | (6,094 | ) | | | 87,589 | | | | 694,384 | | | | — | | | | 5,049 | | | | (44,598 | ) | | | 654,835 | |
| 12-31-09 | | | | | — | | | | — | | | | — | | | | (1 | ) | | | (1 | ) | | | — | | | | — | | | | — | | | | (7 | ) | | | (7 | ) |
Class S | | | | | | | | | | | | | | | | | | | | | | | | | | | | | | | | | | | | | | | | | | |
| 12-31-10 | | | | | 2,610,270 | | | | — | | | | 937,845 | | | | (5,890,819 | ) | | | (2,342,704 | ) | | | 19,661,656 | | | | — | | | | 7,061,976 | | | | (42,264,094 | ) | | | (15,540,462 | ) |
| 12-31-09 | | | | | 8,835,660 | | | | — | | | | — | | | | (5,471,472 | ) | | | 3,364,188 | | | | 54,024,114 | | | | — | | | | — | | | | (34,321,358 | ) | | | 19,702,756 | |
(1) | | Commencement of operations. |
NOTE 11 — REORGANIZATIONS
On July 18, 2009, RussellTM Large Cap Index (“Acquiring Portfolio”) acquired all of the net assets of ING Neuberger Berman Partners Portfolio and ING Oppenheimer Main Street Portfolio (each an “Acquired Portfolio”), each an open-end investment company in a tax-free reorganization in exchange for shares of the Acquiring Portfolio, pursuant to a plan of reorganization approved by the shareholders of each Acquired Portfolio on June 30, 2009. The primary purposes of the transaction were to lower the overall gross and net expense ratios and combine comparable investment objectives, policies, restrictions, management and portfolio holdings of the Acquiring and Acquired Portfolios. For financial reporting purposes, assets received and shares issued by the Acquiring Portfolio were recorded at fair value; however, the cost basis of the investments received from each Acquired Portfolio were carried forward to align ongoing reporting of the Acquiring Portfolio’s realized and unrealized gains and losses with amounts distributable to shareholders for tax purposes.
Assuming the acquisition had been completed on January 1, 2009, the beginning of the annual reporting period of the Acquiring Portfolio, the Acquiring Portfolio’s pro forma results of operations for the year ended December 31, 2009, are as follows:
| Net investment income | | | | $ | 28,281,123 | |
| Net realized and unrealized gain on investments | | | | | 344,654,494 | |
| Net increase in net assets resulting from operations | | | | | 372,935,617 | |
72
NOTES TO FINANCIAL STATEMENTS AS OF DECEMBER 31, 2010 (CONTINUED)
NOTE 11 — REORGANIZATIONS (continued)
Because the combined investment portfolios have been managed as a single integrated portfolio since the acquisition was completed, it is not practicable to separate the amounts of revenue and earnings of each Acquired Portfolio that have been included in the Acquiring Portfolio’s statement of operations since July 18, 2009. Net assets and unrealized appreciation or depreciation as of the reorganization date were as follows:
Acquiring
Portfolio
| | | | Acquired
Portfolio
| | Total net assets of
Acquired Portfolio
(000s)
| | Total net assets of
Acquiring Portfolio
(000s)
| | Acquired Capital
Loss Carryforwards
(000s)
| | Acquired Portfolio
Unrealized
Appreciation
/Depreciation (000s)
| | Conversion
Ratio
|
|---|
RussellTM Large
| | | | ING Neuberger | | | | | | | | | | | | | | | | | | | | |
Cap Index
| | | | Berman Partners | | | | | | | | | | | | | | | | | | | | |
| | | | | Portfolio | | $98,193 | | $1,476,058 | | $212,812 | | $7,655 | | 0.8211 |
| |
RussellTM Large
| | | | ING Oppenheimer | | | | | | | | | | | | | | | | | | | | |
Cap Index
| | | | Main Street | | | | | | | | | | | | | | | | | | | | |
| | | | | Portfolio | | 240,391 | | 1,476,058 | | 250,799 | | (22,324) | | 1.7401 |
The net assets of RussellTM Large Cap Index after the acquisition were $1,814,641,770.
On July 18, 2009, RussellTM Large Cap Growth Index (“Acquiring Portfolio”) acquired all of the net assets of ING Van Kampen Capital Growth Portfolio (“Acquired Portfolio”), an open-end investment company in a tax-free reorganization in exchange for shares of the Acquiring Portfolio, pursuant to a plan of reorganization approved by the Acquired Portfolio’s shareholders on June 30, 2009. The primary purposes of the transaction were to lower the overall gross and net expense ratios and combine comparable investment objectives, policies, restrictions, management and portfolio holdings of the Acquiring and Acquired Portfolios. For financial reporting purposes, assets received and shares issued by the Acquiring Portfolio were recorded at fair value; however, the cost basis of the investments received from the Acquired Portfolio were carried forward to align ongoing reporting of the Acquiring Portfolio’s realized and unrealized gains and losses with amounts distributable to shareholders for tax purposes.
Assuming the acquisition had been completed on May 1, 2009, the commencement of operations of the Acquiring Portfolio, the Acquiring Portfolio’s pro forma results of operations for the period ended July 18, 2009, are as follows:
| Net investment income | | | | $ | 3,032,181 | |
| Net realized and unrealized gain on investments | | | | | 130,016,761 | |
| Net increase in net assets resulting from operations | | | | | 133,048,942 | |
Because the combined investment portfolios have been managed as a single integrated portfolio since the acquisition was completed, it is not practicable to separate the amounts of revenue and earnings of the Acquired Portfolio that have been included in the Acquiring Portfolio’s statement of operations since December 31, 2009. Net assets and unrealized appreciation as of the reorganization date were as follows:
Acquiring
Portfolio
| | | | Acquired
Portfolio
| | Total net assets of
Acquired Portfolio
(000s)
| | Total net assets of
Acquiring Portfolio
(000s)
| | Acquired Capital
Loss Carryforwards
(000s)
| | Acquired Portfolio
Unrealized
Appreciation (000s)
| | Conversion
Ratio
|
|---|
RussellTM Large | | | | ING Van Kampen | | | | | | | | | | | | | | | | | | | | |
| Cap Growth Index | | | | Capital Growth | | | | | | | | | | | | | | | | | | | | |
| | | | | Portfolio | | $347,508 | | $11,972 | | $216,706 | | $10,292 | | 0.7854 |
The net assets of RussellTM Large Cap Growth Index after the acquisition were $359,480,763.
On July 18, 2009, RussellTM Large Cap Value Index (“Acquiring Portfolio”) acquired all of the net assets of ING JPMorgan Value Opportunities Portfolio (“Acquired Portfolio”), an open-end investment company in a tax-free reorganization in exchange for shares of the Acquiring Portfolio, pursuant to a plan of reorganization approved by the Acquired Portfolio’s shareholders on June 30, 2009. The primary purposes of the transaction were to lower the overall gross and net expense ratios and combine comparable investment objectives, policies, restrictions, management and portfolio holdings of the Acquiring and Acquired Portfolios. For financial reporting purposes, assets received and shares issued by the Acquiring Portfolio were recorded at fair value; however, the cost basis of the investments received from the Acquired Portfolio were carried forward to align ongoing reporting of the Acquiring Portfolio’s realized and unrealized gains and losses with amounts distributable to shareholders for tax purposes.
73
NOTES TO FINANCIAL STATEMENTS AS OF DECEMBER 31, 2010 (CONTINUED)
NOTE 11 — REORGANIZATIONS (continued)
Assuming the acquisition had been completed on May 1, 2009, the commencement of operations of the Acquiring Portfolio, the Acquiring Portfolio’s pro forma results of operations for the period ended July 18, 2009, are as follows:
| Net investment income | | | | $ | 4,765,695 | |
| Net realized and unrealized gain on investments | | | | | 32,216,471 | |
| Net increase in net assets resulting from operations | | | | | 36,982,166 | |
Because the combined investment portfolios have been managed as a single integrated portfolio since the acquisition was completed, it is not practicable to separate the amounts of revenue and earnings of the Acquired Portfolio that have been included in the Acquiring Portfolio’s statement of operations since December 31, 2009. Net assets and unrealized appreciation as of the reorganization date were as follows:
Acquiring
Portfolio
| | | | Acquired
Portfolio
| | Total net assets of
Acquired Portfolio
(000s)
| | Total net assets of
Acquiring Portfolio
(000s)
| | Acquired Capital
Loss Carryforwards
(000s)
| | Acquired Portfolio
Unrealized
Appreciation (000s)
| | Conversion
Ratio
|
|---|
RussellTM Large | | | | ING JPMorgan | | | | | | | | | | | | | | | | | | | | |
| Cap Value | | | | Value Opportunities | | | | | | | | | | | | | | | | | | | | |
| Index | | | | Portfolio | | $67,669 | | $82,581 | | $156,678 | | $5,783 | | 0.5686 |
The net assets of RussellTM Large Cap Value Index after the acquisition were $150,249,586.
On August 8, 2009, RussellTM Mid Cap Growth Index (“Acquiring Portfolio”) acquired all of the net assets of ING AllianceBernstein MidCap Growth Portfolio (“Acquired Portfolio”), an open-end investment company in a tax-free reorganization in exchange for shares of the Acquiring Portfolio, pursuant to a plan of reorganization approved by the Acquired Portfolio’s shareholders on August 3, 2009. The primary purposes of the transaction were to lower the overall gross and net expense ratios increase the potential for long-term viability, and lower the volatility of the Acquiring Portfolio. For financial reporting purposes, assets received and shares issued by the Acquiring Portfolio were recorded at fair value; however, the cost basis of the investments received from the Acquired Portfolio were carried forward to align ongoing reporting of the Acquiring Portfolio’s realized and unrealized gains and losses with amounts distributable to shareholders for tax purposes.
Assuming the acquisition had been completed on May 1, 2009, the commencement of operations of the Acquiring Portfolio, the Acquiring Portfolio’s pro forma results of operations for the period ended August 8, 2009, are as follows:
| Net investment income | | | | $ | 478,573 | |
| Net realized and unrealized gain on investments | | | | | 100,999,107 | |
| Net increase in net assets resulting from operations | | | | | 101,477,680 | |
Because the combined investment portfolios have been managed as a single integrated portfolio since the acquisition was completed, it is not practicable to separate the amounts of revenue and earnings of the Acquired Portfolio that have been included in the Acquiring Portfolio’s statement of operations since August 8, 2009. Net assets and unrealized appreciation as of the reorganization date were as follows:
Acquiring
Portfolio
| | | | Acquired
Portfolio
| | Total net assets of
Acquired Portfolio
(000s)
| | Total net assets of
Acquiring Portfolio
(000s)
| | Acquired Capital
Loss Carryforwards
(000s)
| | Acquired Portfolio
Unrealized
Appreciation (000s)
| | Conversion
Ratio
|
|---|
RussellTM Mid Cap | | | | ING AllianceBernstein | | | | | | | | | | | | | | | | | | | | |
| Growth Index | | | | MidCap Growth | | | | | | | | | | | | | | | | | | | | |
| | | | | Portfolio | | $258,969 | | $80,459 | | $194,482 | | $6,637 | | 0.7951 |
The net assets of RussellTM Mid Cap Growth Index after the acquisition were $339,428,299.
On August 8, 2009, International Index (“Acquiring Portfolio”) acquired all of the net assets of ING Index Plus International Equity Portfolio (“Acquired Portfolio”), an open-end investment company in a tax-free reorganization in exchange for shares of the Acquiring Portfolio, pursuant to a plan of reorganization approved by the Acquired Portfolio’s shareholders on August 3, 2009. The primary purposes of the transaction were to lower the overall gross and net expense ratios and combine comparable investment objectives, policies, restrictions, management and
74
NOTES TO FINANCIAL STATEMENTS AS OF DECEMBER 31, 2010 (CONTINUED)
NOTE 11 — REORGANIZATIONS (continued)
portfolio holdings of the Acquiring and Acquired Portfolios. For financial reporting purposes, assets received and shares issued by the Acquiring Portfolio were recorded at fair value; however, the cost basis of the investments received from the Acquired Portfolio were carried forward to align ongoing reporting of the Acquiring Portfolio’s realized and unrealized gains and losses with amounts distributable to shareholders for tax purposes.
Assuming the acquisition had been completed on January 1, 2009, the beginning of the annual reporting period of the Acquiring Portfolio, the Acquiring Portfolio’s pro forma results of operations for the year ended August 8, 2009, are as follows:
| Net investment income | | | | $ | 13,436,267 | |
| Net realized and unrealized gain on investments | | | | | 146,080,980 | |
| Net increase in net assets resulting from operations | | | | | 159,517,247 | |
Because the combined investment portfolios have been managed as a single integrated portfolio since the acquisition was completed, it is not practicable to separate the amounts of revenue and earnings of the Acquired Portfolio that have been included in the Acquiring Portfolio’s statement of operations since December 31, 2009. Net assets and unrealized appreciation as of the reorganization date were as follows:
Acquiring
Portfolio
| | | | Acquired
Portfolio
| | Total net assets of
Acquired Portfolio
(000s)
| | Total net assets of
Acquiring Portfolio
(000s)
| | Acquired Capital
Loss Carryforwards
(000s)
| | Acquired Portfolio
Unrealized
Appreciation (000s)
| | Conversion
Ratio
|
|---|
| International Index | | | | ING Index Plus | | | | | | | | | | | | | | | | | | | | |
| | | | | International Equity | | | | | | | | | | | | | | | | | | | | |
| | | | | Portfolio | | $191,779 | | $603,641 | | $153,932 | | $4,808 | | 0.7661 |
The net assets of International Index after the acquisition were $795,419,970.
NOTE 12 — SECURITIES LENDING
Under an agreement with The Bank of New York Mellon (“BNY”), the Portfolios may lend their securities to approved brokers, dealers and other financial institutions. Loans are collateralized by cash and U.S. government securities. The collateral is equal to at least 105% of the market value of non-U.S. securities loaned and 102% of the market value of U.S. securities loaned. The market value of the loaned securities is determined at the close of business of the Portfolios at their last sale price or official closing price on the principal exchange or system on which they are traded and any additional collateral is delivered to the Portfolios on the next business day. The cash collateral received is invested in approved investments as defined in the Securities Lending Agreement with BNY (the “Agreement”). The Portfolios bear the risk of loss with respect to the investment of collateral. Currently, the cash collateral is invested in the BNY Mellon Overnight Government Fund (formerly, The BNY Institutional Cash Reserves Fund — Series A) and the BNY Institutional Cash Reserves Fund—Series B (“BICR — Series B”), each a series within the BNY Institutional Cash Reserves Trust (collectively, the “BICR Fund”). BNY serves as investment manager, custodian and operational trustee of the BICR Fund. As of December 31, 2010, and throughout the period covered by this report, BICR — Series B held certain defaulted securities issued by Lehman Brothers Holdings, Inc. (the “Lehman Securities”). The Lehman Securities have market values significantly below amortized cost. On May 22, 2009, the Portfolios agreed to the terms of a capital support agreement (the “Capital Support Agreement”) extended by The Bank of New York Mellon Corporation (“BNYC”), an affiliated company of BNY, for the Lehman Securities held by BICR — Series B. Under the terms of the Capital Support Agreement, BNYC will support the value of the Lehman Securities up to 80% of the par value (the remaining 20% of the par value represents an unrealized loss to the Portfolios) and subject, in part, to the Portfolios’ continued participation in the BNY securities lending program through September 15, 2011. At September 15, 2011, if the Portfolios have complied with the requirements under the Capital Support Agreement to continue to participate in the BNY securities lending program and if such securities have not otherwise been sold, the Portfolios will have the right to sell the defaulted securities to BNYC at a price equal to 80% of par value. The recorded value of each Portfolio’s investment in BICR — Series B includes the value of the underlying securities held by BICR — Series B and the estimated value of the support to be provided by BNYC. The investments in the BNY Mellon Overnight Government Fund and in BICR — Series B are included in the Summary Portfolio of Investments under Securities Lending Collateral and the unrealized loss on BICR — Series B is included in Net Unrealized Depreciation on the Statements of Assets and Liabilities.
75
NOTES TO FINANCIAL STATEMENTS AS OF DECEMBER 31, 2010 (CONTINUED)
NOTE 12 — SECURITIES LENDING (continued)
Generally, in the event of counterparty default, the Portfolios have the right to use the collateral to offset losses incurred. The Agreement contains certain guarantees by BNY in the event of counterparty default and/or a borrower’s failure to return a loaned security; however, there would be a potential loss to the Portfolios in the event the Portfolios are delayed or prevented from exercising their right to dispose of the collateral. Engaging in securities lending could have a leveraging effect, which may intensify the credit, market and other risks associated with investing in the Portfolios. At December 31, 2010, the following Portfolios had securities on loan with the following market values:
| | | | Value of
Securities
Loaned
| | Cash
Collateral
Received*
|
|---|
RussellTM Large Cap Index | | | | $ | 9,403,056 | | | $ | 9,681,365 | |
RussellTM Large Cap Growth Index | | | | | 5,638,239 | | | | 5,772,314 | |
RussellTM Mid Cap Index | | | | | 39,883,827 | | | | 40,808,784 | |
RussellTM Mid Cap Growth Index | | | | | 8,613,721 | | | | 8,812,566 | |
RussellTM Small Cap Index | | | | | 39,204,684 | | | | 40,435,473 | |
| U.S. Bond Index | | | | | 119,877,995 | | | | 121,022,135 | |
| Euro STOXX 50® Index | | | | | 12,122,310 | | | | 12,736,572 | |
| FTSE 100 Index® | | | | | 2,976,648 | | | | 3,137,068 | |
| International Index | | | | | 4,657,779 | | | | 4,903,841 | |
| Japan TOPIX Index | | | | | 25,688,242 | | | | 27,020,064 | |
| * | | Cash collateral received was invested in the BICR Fund, the fair value of which is presented in the respective Portfolios’ Summary Portfolio of Investments |
NOTE 13 — CONCENTRATION OF INVESTMENT RISKS
All mutual funds involve risk — some more than others — and there is always the chance that you could lose money or not earn as much as you hope. A Portfolio’s risk profile is largely a factor of the principal securities in which it invests and investment techniques that it uses. For more information regarding the types of securities and investment techniques that may be used by each Portfolio and their corresponding risks, see the Portfolios’ most recent Prospectus and/or the Statement of Additional Information.
Foreign Securities (Euro STOXX 50® Index, FTSE 100 Index®, International Index and Japan TOPIX Index). Investments in foreign securities may entail risks not present in domestic investments. Since securities in which the Portfolios may invest are denominated in foreign currencies, changes in the relationship of these foreign currencies to the U.S. dollar can significantly affect the value of the investments and earnings of the Portfolios. Foreign investments may also subject the Portfolios to foreign government exchange restrictions, expropriation, taxation or other political, social or economic developments, as well as changes vis-a-vis the U.S. dollar from movements in currency, and changes in security value and interest rate, all of which could affect the market and/or credit risk of the Portfolios’ investments.
Emerging Markets Investments (Hang Seng Index and WisdomTreeSM Index). Because of less developed markets and economies and, in some countries, less mature governments and governmental institutions, the risks of investing in foreign securities can be intensified in the case of investments in issuers domiciled or doing substantial business in emerging market countries.
Non-Diversified (RussellTM Large Cap Growth Index, RussellTM Large Cap Value Index, RussellTM Mid Cap Growth Index, Euro STOXX 50® Index, FTSE 100 Index®, Heng Seng Index and Japan TOPIX Index). The Portfolios are classified as non-diversified investment companies under the 1940 Act, which means that each Portfolio is not limited by the 1940 Act in the proportion of assets that they may invest in the obligations of a single issuer. Declines in the value of that single company can significantly impact the value of a Portfolio. The investment of a large percentage of a Portfolio’s assets in the securities of a small number of issuers may cause a Portfolio’s share price to fluctuate more than that of a diversified investment company. Conversely, even though classified as non-diversified, a Portfolio may actually maintain a portfolio that is diversified with a large number of issuers. In such an event, a Portfolio would benefit less from appreciation in a single corporate issuer than if it had greater exposure to that issuer.
Investment by Funds-of-Funds (RussellTM Mid Cap Index, RussellTM Small Cap Index, Euro STOXX 50® Index, FTSE 100 Index®, Hang Seng Index, International Index, Japan TOPIX Index and U.S. Bond Index). As an underlying fund (“Underlying Fund”) of a fund-of-fund, shares of each Portfolio may be purchased by other investment companies. In some cases, an Underlying Fund may experience large inflows or redemptions due to allocations or rebalancings. While it is impossible to predict the overall impact of these transactions over time, there could be adverse effects on portfolio management. The Investment Adviser will monitor transactions by each Underlying Fund and will attempt to minimize any adverse effects of the Underlying Funds and the fund-of-fund as a result of these transactions. So long as an Underlying Fund accepts investments by other investment companies, it will not purchase securities of other investment companies, except to the extent permitted by the 1940 Act or under the terms of an exemptive order granted by the SEC.
76
NOTES TO FINANCIAL STATEMENTS AS OF DECEMBER 31, 2010 (CONTINUED)
NOTE 14 — FEDERAL INCOME TAXES
The amount of distributions from net investment income and net realized capital gains are determined in accordance with federal income tax regulations, which may differ from U.S. generally accepted accounting principles for investment companies. These book/tax differences may be either temporary or permanent. Permanent differences are reclassified within the capital accounts based on their federal tax-basis treatment; temporary differences are not reclassified. Key differences include the treatment of short-term capital gains, foreign currency transactions, income from passive foreign investment companies (PFICs), paydown gains, and wash sale deferrals. Distributions in excess of net investment income and/or net realized capital gains for tax purposes are reported as return of capital.
The following permanent tax differences have been reclassified as of December 31, 2010:
| | | | Undistributed Net
Investment Income
| | Accumulated
Net Realized
Gains / (Losses)
| |
|---|
RussellTM Large Cap Index | | | | $ | (28,584 | ) | | $ | 28,584 | | | | | |
RussellTM Large Cap Growth Index | | | | | (14,471 | ) | | | 14,471 | | | | | |
RussellTM Large Cap Value Index | | | | | (3,351 | ) | | | 3,351 | | | | | |
RussellTM Mid Cap Index | | | | | (1,186,113 | ) | | | 1,186,113 | | | | | |
RussellTM Mid Cap Growth Index | | | | | (73,985 | ) | | | 73,985 | | | | | |
RussellTM Small Cap Index | | | | | (754,090 | ) | | | 754,090 | | | | | |
U.S. Bond Index(1) | | | | | 10,661,917 | | | | (10,661,917 | ) | | | | |
| Euro STOXX 50® Index | | | | | 409,070 | | | | (409,070 | ) | | | | |
| FTSE 100 Index® | | | | | (310,175 | ) | | | 310,175 | | | | | |
| Hang Seng Index | | | | | 1,437,361 | | | | (1,437,361 | ) | | | | |
| International Index | | | | | 1,287,332 | | | | (1,287,332 | ) | | | | |
| Japan TOPIX Index | | | | | 2,015,889 | | | | (2,015,889 | ) | | | | |
WisdomTreeSM Index | | | | | (448,540 | ) | | | 448,540 | | | | | |
(1) | | $10,644,956 relates to paydown gains. |
Dividends paid by the Portfolios from net investment income and distributions of net realized short-term capital gains are, for federal income tax purposes, taxable as ordinary income to shareholders.
The tax composition of dividends and distributions to shareholders was as follows:
| | | | Year Ended December 31, 2010
| | Year Ended December 31, 2009
| |
|---|
| | | | Ordinary
Income
| | Long-Term
Capital Gains
| | Ordinary
Income
| | Long-Term
Capital Gains
| | Return of
Capital
|
|---|
RussellTM Large Cap Index | | | | $ | 24,773,632 | | | $ | — | | | $ | 165,344 | | | $ | — | | | $ | — | |
RussellTM Large Cap Growth Index | | | | | 2,353,069 | | | | — | | | | — | | | | — | | | | — | |
RussellTM Large Cap Value Index | | | | | 9,775,208 | | | | — | | | | — | | | | — | | | | — | |
RussellTM Mid Cap Index | | | | | 8,167,671 | | | | — | | | | — | | | | — | | | | — | |
RussellTM Mid Cap Growth Index | | | | | 3,473,752 | | | | 198,389 | | | | — | | | | — | | | | — | |
RussellTM Small Cap Index | | | | | 3,593,655 | | | | — | | | | — | | | | — | | | | — | |
| U.S. Bond Index | | | | | 95,434,789 | | | | — | | | | 67,537,388 | | | | 602,727 | | | | — | |
| Euro STOXX 50® Index | | | | | 6,042,220 | | | | — | | | | — | | | | — | | | | — | |
| FTSE 100 Index® | | | | | 8,495,818 | | | | — | | | | — | | | | — | | | | — | |
| Hang Seng Index | | | | | 120,171 | | | | — | | | | 640,794 | | | | — | | | | 132,505 | |
| International Index | | | | | 12,161,184 | | | | — | | | | — | | | | — | | | | — | |
| Japan TOPIX Index | | | | | 801,470 | | | | — | | | | — | | | | — | | | | — | |
WisdomTreeSM Index | | | | | 7,067,025 | | | | — | | | | — | | | | — | | | | — | |
The tax-basis components of distributable earnings and the expiration dates of the capital loss carryforwards which may be used to offset future realized capital gains for federal income tax purposes as of December 31, 2010 were:
| | | | Undistributed
Ordinary
Income
| | Undistributed
Long-Term
Capital Gains
| | Unrealized
Appreciation/
(Depreciation)
| | Post-October
Currency Loss
Deferred
| | Post-October
PFIC Loss
Deferred
| | Capital Loss
Carryforwards
| | Expiration
Dates
|
|---|
RussellTM Large Cap Index | | | | $ | 11,150,027 | | | $ | — | | | $ | 194,293,257 | | | $ | — | | | $ | — | | | $ | (13,186,377 | ) | | | 2014 | |
| | | | | | | | | | | | | | | | | | | | | | | | | | (57,290,675 | ) | | | 2015 | |
| | | | | | | | | | | | | | | | | | | | | | | | | | (68,083,593 | ) | | | 2016 | |
| | | | | | | | | | | | | | | | | | | | | | | | | | (125,559,316 | ) | | | 2017 | |
| | | | | | | | | | | | | | | | | | | | | | | | | | (8,688,924 | ) | | | 2018 | |
| | | | | | | | | | | | | | | | | | | | | | | | | $ | (272,808,885 | )* | | | | |
77
NOTES TO FINANCIAL STATEMENTS AS OF DECEMBER 31, 2010 (CONTINUED)
NOTE 14 — FEDERAL INCOME TAXES (continued)
| | | | Undistributed
Ordinary
Income
| | Undistributed
Long-Term
Capital Gains
| | Unrealized
Appreciation/
(Depreciation)
| | Post-October
Currency Loss
Deferred
| | Capital Loss
Carryforwards
| | Expiration
Dates
|
|---|
RussellTM Large Cap Growth Index | | | | | 4,392,640 | | | | — | | | | 93,759,347 | | | | — | | | | (36,661,692 | ) | | | 2014 | |
| | | | | | | | | | | | | | | | | | | | | | (20,625,387 | ) | | | 2015 | |
| | | | | | | | | | | | | | | | | | | | | | (143,769,582 | ) | | | 2016 | |
| | | | | | | | | | | | | | | | | | | | | $ | (201,056,661 | )* | | | | |
RussellTM Large Cap Value Index | | | | | 1,401,730 | | | | — | | | | 19,191,429 | | | | — | | | | (16,743,152 | ) | | | 2015 | |
| | | | | | | | | | | | | | | | | | | | | | (3,099,362 | ) | | | 2016 | |
| | | | | | | | | | | | | | | | | | | | | $ | (19,842,514 | )* | | | | |
RussellTM Mid Cap Index | | | | | 31,732,055 | | | | — | | | | 418,753,996 | | | | — | | | | — | | | | — | |
RussellTM Mid Cap Growth Index | | | | | 1,336,446 | | | | — | | | | 97,199,479 | | | | — | | | | (34,008,245 | ) | | | 2015 | |
| | | | | | | | | | | | | | | | | | | | | | (142,133,093 | ) | | | 2016 | |
| | | | | | | | | | | | | | | | | | | | | $ | (176,141,338 | ) | | | | |
RussellTM Small Cap Index | | | | | 6,281,112 | | | | — | | | | 178,466,651 | | | | — | | | | (4,345,449 | ) | | | 2016 | |
| | | | | | | | | | | | | | | | | | | | | | (3,397,860 | ) | | | 2017 | |
| | | | | | | | | | | | | | | | | | | | | $ | (7,743,309 | ) | | | | |
| U.S. Bond Index | | | | | 53,269,748 | | | | 12,763,318 | | | | 60,329,291 | | | | — | | | | — | | | | — | |
| Euro STOXX 50® Index | | | | | 25,024,194 | | | | — | | | | (23,232,360 | ) | | | (560,537 | ) | | | (805,470 | ) | | | 2018 | |
| FTSE 100 Index® | | | | | 20,442,544 | | | | 4,481,853 | | | | 92,942,991 | | | | (729,738 | ) | | | — | | | | — | |
| Hang Seng Index | | | | | 4,337,456 | | | | — | | | | 15,351,823 | | | | — | | | | (348,360 | ) | | | 2017 | |
| | | | | | | | | | | | | | | | | | | | | | (211,429 | ) | | | 2018 | |
| | | | | | | | | | | | | | | | | | | | | $ | (559,789 | ) | | | | |
| International Index | | | | | 8,506,483 | | | | — | | | | 80,399,727 | | | | — | | | | (54,964,494 | ) | | | 2015 | |
| | | | | | | | | | | | �� | | | | | | | | | | (14,301,357 | ) | | | 2016 | |
| | | | | | | | | | | | | | | | | | | | | | (91,978,946 | ) | | | 2017 | |
| | | | | | | | | | | | | | | | | | | | | | (1,826,920 | ) | | | 2018 | |
| | | | | | | | | | | | | | | | | | | | | $ | (163,071,717 | )* | | | | |
| Japan TOPIX Index | | | | | 8,391,615 | | | | 3,672,057 | | | | 47,980,644 | | | | (258,097 | ) | | | — | | | | — | |
WisdomTreeSM Index | | | | | 6,106,226 | | | | — | | | | 10,175,956 | | | | — | | | | (9,648,239 | ) | | | 2016 | |
| | | | | | | | | | | | | | | | | | | | | | (30,688,288 | ) | | | 2017 | |
| | | | | | | | | | | | | | | | | | | | | | (6,696,493 | ) | | | 2018 | |
| | | | | | | | | | | | | | | | | | | | | $ | (47,033,020 | ) | | | | |
| * | | Utilization of these capital losses is subject to annual limitations under Section 382 of the Internal Revenue Code. Amounts and years of expiration may be adjusted to reflect future gain/loss activity to comply with the limitation rules. |
The Regulated Investment Company Modernization Act of 2010 (the ″Act″) was enacted on December 22, 2010. The Act makes changes to several tax rules impacting the Portfolios. In general, the provisions of the Act will be effective for the Portfolios’ fiscal year ending December 31, 2011. Although the Act provides several benefits, including the unlimited carryforward of future capital losses, there may be a greater likelihood that all or a portion of each Portfolio’s pre-enactment capital loss carryforwards may expire without being utilized due to the fact that post-enactment capital losses get utilized before pre-enactment capital loss carryforwards. Relevant information regarding the impact of the Act on the Portfolios, if any, will be contained within the Federal Income Taxes section of the notes to financial statements for the fiscal year ending December 31, 2011.
The Portfolios’ major tax jurisdictions are federal and Arizona. The earliest tax year that remains subject to examination by these jurisdictions is 2008.
As of December 31, 2010, no provisions for income tax would be required in the Portfolios’ financial statements as a result of tax positions taken on federal and state income tax returns for open tax years. The Portfolios’ federal and state income and federal excise tax returns for tax years for which the applicable statutes of limitations have not expired are subject to examination by the Internal Revenue Service and state department of revenue.
78
NOTES TO FINANCIAL STATEMENTS AS OF DECEMBER 31, 2010 (CONTINUED)
NOTE 15 — SUBSEQUENT EVENTS
The Portfolios have evaluated events occurring after the Statements of Assets and Liabilities date (subsequent events) to determine whether any subsequent events necessitated adjustment to or disclosure in the financial statements. No such subsequent events were identified.
79
ING RUSSELLTM LARGE CAP
INDEX PORTFOLIO |
| SUMMARY PORTFOLIO OF INVESTMENTS
AS OF DECEMBER 31, 2010 |
Shares
|
|
|
|
|
|
|
| Value
|
| Percent
of Net
Assets
|
|---|
| |
COMMON STOCK: 95.8%
|
| | | | | | | Consumer Discretionary: 9.2% |
| 29,600 | | | | @ | | Amazon.com, Inc. | | $ | 5,328,000 | | | | 0.7 | |
| 238,050 | | | | | | Comcast Corp. — Class A | | | 5,229,959 | | | | 0.6 | |
| 282,300 | | | | @, L | | Ford Motor Co. | | | 4,739,817 | | | | 0.6 | |
| 143,300 | | | | | | Home Depot, Inc. | | | 5,024,098 | | | | 0.6 | |
| 91,000 | | | | | | McDonald’s Corp. | | | 6,985,160 | | | | 0.9 | |
| 165,700 | | | | | | Walt Disney Co. | | | 6,215,407 | | | | 0.8 | |
| | | | | | | Other Securities | | | 40,434,493 | | | | 5.0 | |
| | | | | | | | | | 73,956,934 | | | | 9.2 | |
| |
| | | | | | | |
| 176,250 | | | | | | Altria Group, Inc. | | | 4,339,275 | | | | 0.5 | |
| 178,250 | | | | | | Coca-Cola Co. | | | 11,723,503 | | | | 1.5 | |
| 115,150 | | | | | | CVS Caremark Corp. | | | 4,003,766 | | | | 0.5 | |
| 135,750 | | | | | | Kraft Foods, Inc. | | | 4,277,483 | | | | 0.5 | |
| 136,500 | | | | | | PepsiCo, Inc. | | | 8,917,545 | | | | 1.1 | |
| 156,800 | | | | | | Philip Morris International, Inc. | | | 9,177,504 | | | | 1.1 | |
| 243,732 | | | | | | Procter & Gamble Co. | | | 15,679,280 | | | | 2.0 | |
| 165,750 | | | | | | Wal-Mart Stores, Inc. | | | 8,938,898 | | | | 1.1 | |
| | | | | | | Other Securities | | | 19,964,158 | | | | 2.5 | |
| | | | | | | | | | 87,021,412 | | | | 10.8 | |
| |
| | | | | | | |
| 170,094 | | | | | | Chevron Corp. | | | 15,521,078 | | | | 1.9 | |
| 126,000 | | | | | | ConocoPhillips | | | 8,580,600 | | | | 1.1 | |
| 433,403 | | | | | | ExxonMobil Corp. | | | 31,690,427 | | | | 3.9 | |
| 68,750 | | | | | | Occidental Petroleum Corp. | | | 6,744,375 | | | | 0.8 | |
| 115,650 | | | | | | Schlumberger Ltd. | | | 9,656,775 | | | | 1.2 | |
| | | | | | | Other Securities | | | 27,779,033 | | | | 3.5 | |
| | | | | | | | | | 99,972,288 | | | | 12.4 | |
| |
| | | | | | | |
| 849,243 | | | | | | Bank of America Corp. | | | 11,328,902 | | | | 1.4 | |
| 146,400 | | | | @ | | Berkshire Hathaway, Inc. — Class B | | | 11,728,104 | | | | 1.5 | |
| 1,790,450 | | | | @ | | Citigroup, Inc. | | | 8,468,829 | | | | 1.1 | |
| 43,500 | | | | | | Goldman Sachs Group, Inc. | | | 7,314,960 | | | | 0.9 | |
| 336,685 | | | | | | JPMorgan Chase & Co. | | | 14,282,178 | | | | 1.8 | |
| 162,300 | | | | | | US Bancorp. | | | 4,377,231 | | | | 0.5 | |
| 411,971 | | | | | | Wells Fargo & Co. | | | 12,766,981 | | | | 1.6 | |
| | | | | | | Other Securities | | | 41,246,004 | | | | 5.1 | |
| | | | | | | | | | 111,513,189 | | | | 13.9 | |
| |
| | | | | | | |
| 130,600 | | | | | | Abbott Laboratories | | | 6,257,046 | | | | 0.8 | |
| 81,100 | | | | @ | | Amgen, Inc. | | | 4,452,390 | | | | 0.5 | |
| 233,500 | | | | | | Johnson & Johnson | | | 14,441,975 | | | | 1.8 | |
| 263,885 | | | | | | Merck & Co., Inc. | | | 9,510,415 | | | | 1.2 | |
| 682,739 | | | | | | Pfizer, Inc. | | | 11,954,760 | | | | 1.5 | |
| | | | | | | Other Securities | | | 47,487,450 | | | | 5.9 | |
| | | | | | | | | | 94,104,036 | | | | 11.7 | |
| |
COMMON STOCK: (continued)
|
| | | | | | | |
| 60,300 | | | | | | 3M Co. | | $ | 5,203,890 | | | | 0.6 | |
| 64,300 | | | | | | Boeing Co. | | | 4,196,218 | | | | 0.5 | |
| 53,150 | | | | | | Caterpillar, Inc. | | | 4,978,029 | | | | 0.6 | |
| 903,650 | | | | | | General Electric Co. | | | 16,527,740 | | | | 2.1 | |
| 60,350 | | | | | | United Parcel Service, Inc. — Class B | | | 4,380,203 | | | | 0.5 | |
| 78,900 | | | | | | United Technologies Corp. | | | 6,211,008 | | | | 0.8 | |
| | | | | | | Other Securities | | | 39,279,193 | | | | 4.9 | |
| | | | | | | | | | 80,776,281 | | | | 10.0 | |
| |
| | | | | | | Information Technology: 19.2% |
| 77,100 | | | | @ | | Apple, Inc. | | | 24,869,376 | | | | 3.1 | |
| 483,400 | | | | @ | | Cisco Systems, Inc. | | | 9,779,182 | | | | 1.2 | |
| 20,700 | | | | @ | | Google, Inc. — Class A | | | 12,295,179 | | | | 1.5 | |
| 198,500 | | | | | | Hewlett-Packard Co. | | | 8,356,850 | | | | 1.0 | |
| 470,900 | | | | | | Intel Corp. | | | 9,903,027 | | | | 1.2 | |
| 108,550 | | | | | | International Business Machines Corp. | | | 15,930,798 | | | | 2.0 | |
| 648,280 | | | | | | Microsoft Corp. | | | 18,099,978 | | | | 2.2 | |
| 322,445 | | | | | | Oracle Corp. | | | 10,092,529 | | | | 1.3 | |
| 138,900 | | | | | | Qualcomm, Inc. | | | 6,874,161 | | | | 0.9 | |
| | | | | | | Other Securities | | | 38,595,164 | | | | 4.8 | |
| | | | | | | | | | 154,796,244 | | | | 19.2 | |
| |
| | | | | | | |
| 39,250 | | | | | | Freeport-McMoRan Copper & Gold, Inc. | | | 4,713,533 | | | | 0.6 | |
| | | | | | | Other Securities | | | 21,373,092 | | | | 2.6 | |
| | | | | | | | | | 26,086,625 | | | | 3.2 | |
| |
| | | | | | | Telecommunication Services: 3.3% |
| 500,100 | | | | | | AT&T, Inc. | | | 14,692,938 | | | | 1.8 | |
| 239,350 | | | | | | Verizon Communications, Inc. | | | 8,563,943 | | | | 1.1 | |
| | | | | | | Other Securities | | | 2,913,331 | | | | 0.4 | |
| | | | | | | | | | 26,170,212 | | | | 3.3 | |
| | | | | | | |
| | | | | | | Other Securities | | | 16,817,776 | | | | 2.1 | |
| |
| | | | | | | Total Common Stock | | | | | | | | |
| | | | | | | (Cost $546,153,597) | | | 771,214,997 | | | | 95.8 | |
| |
REAL ESTATE INVESTMENT TRUSTS: 0.4% |
| | | | | | | |
| | | | | | | Other Securities | | | 3,711,037 | | | | 0.4 | |
| |
| | | | | | | Total Real Estate Investment Trusts | | | | | | | | |
| | | | | | | (Cost $2,494,032) | | | 3,711,037 | | | | 0.4 | |
| |
| | | | | | | Total Long-Term Investments | | | | | | | | |
| | | | | | | (Cost $548,647,629) | | | 774,926,034 | | | | 96.2 | |
See Accompanying Notes to Financial Statements
80
ING RUSSELLTM LARGE CAP
INDEX PORTFOLIO |
| SUMMARY PORTFOLIO OF INVESTMENTS
AS OF DECEMBER 31, 2010 (CONTINUED) |
Shares
|
|
|
|
|
|
|
| Value
|
| Percent
of Net
Assets
|
|---|
| |
SHORT-TERM INVESTMENTS: 4.7% |
| | | | | | | |
| 27,794,000 | | | | | | Blackrock Liquidity Funds TempFund Portfolio — Class I | | $ | 27,794,000 | | | | 3.5 | |
| |
| | | | | | | Total Mutual Funds | | | | | | | | |
| | | | | | | (Cost $27,794,000) | | | 27,794,000 | | | | 3.5 | |
| |
| | | | | | | Securities Lending Collateralcc: 1.2% |
| 9,158,429 | | | | | | BNY Mellon Overnight Government Fund(1) | | | 9,158,429 | | | | 1.1 | |
| 522,936 | | | | R | | BNY Institutional Cash Reserves Fund, Series B(1)(2) | | | 418,349 | | | | 0.1 | |
| |
| | | | | | | Total Securities Lending Collateral | | | | | | | | |
| | | | | | | (Cost $9,681,365) | | | 9,576,778 | | | | 1.2 | |
| |
| | | | | | | Total Short-Term Investments | | | | | | | | |
| | | | | | | (Cost $37,475,365) | | | 37,370,778 | | | | 4.7 | |
| | | | | | | Total Investments in Securities | | | | | | | | |
| | | | | | | (Cost $586,122,994)* | | $ | 812,296,812 | | | | 100.9 | |
| | | | | | | Other Assets and Liabilities — Net | | | (6,952,748 | ) | | | (0.9 | ) |
| | | | | | | Net Assets | | $ | 805,344,064 | | | | 100.0 | |
“Other Securities” represents issues not identified as the top 50 holdings in terms of market value and issues or issuers not exceeding 1% of net assets individually or in aggregate respectively as of December 31, 2010.
The following footnotes apply to either the individual securities noted or one or more of the securities aggregated and listed as a single line item.
| @ | | Non-income producing security |
| cc | | Securities purchased with cash collateral for securities loaned. |
| (1) | | Collateral received from brokers for securities lending was invested in these short-term investments. |
| (2) | | On September 12, 2008, BNY established a separate sleeve of the Institutional Cash Reserves Fund (Series B) to hold certain Lehman Brothers defaulted debt obligations. The Portfolio’s position in Series B is being fair valued daily. Please see the accompanying Notes to Financial Statements for additional details on securities lending. |
| L | | Loaned security, a portion or all of the security is on loan at December 31, 2010. |
| * | | Cost for federal income tax purposes is $618,003,555. |
| Net unrealized appreciation consists of: | | | | | | |
| Gross Unrealized Appreciation | | | | $ | 227,886,066 | |
| Gross Unrealized Depreciation | | | | | (33,592,809 | ) |
| Net Unrealized Appreciation | | | | $ | 194,293,257 | |
Fair Value Measurementsˆ
The following is a summary of the fair valuations according to the inputs used as of December 31, 2010 in valuing the Portfolio’s assets and liabilities:
| | | | Quoted Prices in
Active Markets for
Identical Investments
(Level 1)
| | Other
Observable
Inputs
(Level 2)
| | Significant
Unobservable
Inputs
(Level 3)
| | Fair Value
at
12/31/2010
|
|---|
Asset Table | | | | | | | | | | | | | | | | | | |
Investments, at value | | | | | | | | | | | | | | | | | | |
| Common Stock* | | | | $ | 771,214,997 | | | $ | — | | | $ | — | | | $ | 771,214,997 | |
| Real Estate Investment Trusts | | | | | 3,711,037 | | | | — | | | | — | | | | 3,711,037 | |
| Short-Term Investments | | | | | 36,952,429 | | | | — | | | | 418,349 | | | | 37,370,778 | |
| Total Investments, at value | | | | $ | 811,878,463 | | | $ | — | | | $ | 418,349 | | | $ | 812,296,812 | |
Other Financial Instruments+: | | | | | | | | | | | | | | | | | | |
| Futures | | | | | 829,479 | | | | — | | | | — | | | | 829,479 | |
| Total Assets | | | | $ | 812,707,942 | | | $ | — | | | $ | 418,349 | | | $ | 813,126,291 | |
See Accompanying Notes to Financial Statements
81
ING RUSSELLTM LARGE CAP
INDEX PORTFOLIO |
| SUMMARY PORTFOLIO OF INVESTMENTS
AS OF DECEMBER 31, 2010 (CONTINUED) |
The following is a reconciliation of the fair valuations using significant unobservable inputs (Level 3) for the Portfolio’s assets and liabilities during the period ended December 31, 2010:
| | | | Beginning
Balance
12/31/2009
| | Purchases
| | Sales
| | Accrued
Discounts/
(Premiums)
| | Total
Realized
Gain/(Loss)
| | Total Unrealized
Appreciation/
(Depreciation)
| | Transfers
Into
Level 3
| | Transfers
Out of
Level 3
| | Ending
Balance
12/31/2010
|
|---|
Asset Table | | | | | | | | | | | | | | | | | | | | | | | | | | | | | | | | | | | | | | |
Investments, at value | | | | | | | | | | | | | | | | | | | | | | | | | | | | | | | | | | | | | | |
| Short-Term Investments | | | | $ | 418,349 | | | $ | — | | | $ | — | | | $ | — | | | $ | — | | | $ | — | | | $ | — | | | $ | — | | | $ | 418,349 | |
| Total Investments, at value | | | | $ | 418,349 | | | $ | — | | | $ | — | | | $ | — | | | $ | — | | | $ | — | | | $ | — | | | $ | — | | | $ | 418,349 | |
As of December 31, 2010, total change in unrealized gain (loss) on Level 3 securities still held at period end and included in the change in net assets was $0.
| ˆ | | See Note 2, “Significant Accounting Policies” in the Notes to Financial Statements for additional information. |
| + | | Other Financial Instruments are derivatives not reflected in the Summary Portfolio of Investments and may include open forward foreign currency contracts, futures, swaps, and written options. Forward foreign currency contracts and futures are reported at their unrealized gain/loss at measurement date which represents the amount due to/from the Portfolio. Swaps and written options are reported at their market value at measurement date. |
Transfers in or out of Level 3 represents either the beginning value (for transfers in), or the ending value (for transfers out) of any security or derivative instrument where a change in the pricing level occurred from the beginning to the end of the period. It is the policy of the Portfolio to recognize transfers at the end of the reporting period.
| * | | For further breakdown of Common Stock by Industry type, please refer to the Portfolio of Investments. |
ING RussellTM Large Cap Index Portfolio Open Futures Contracts on December 31, 2010:
Contract Description
| | | | Number
of Contracts
| | Expiration Date
| | Notional Value
| | Unrealized
Appreciation
|
|---|
Long Contracts | | | | | | | | | | | | | | | | | | |
| S&P 500 E-Mini | | | | | 483 | | | | 03/18/11 | | | $ | 30,259,950 | | | $ | 829,479 | |
| | | | | | | | | | | | | $ | 30,259,950 | | | $ | 829,479 | |
A summary of derivative instruments by primary risk exposure is outlined in the following tables.
The fair value of derivative instruments as of December 31, 2010 was as follows:
Derivatives not accounted for as
hedging instruments
| | | | Location on Statement
of Assets and Liabilities
| | Fair Value
|
|---|
Asset Derivatives | | | | | | | | | | |
| Equity contracts | | | | Net Assets — Unrealized appreciation* | | $ | 829,479 | |
Total Asset Derivatives | | | | | | $ | 829,479 | |
| * | | Includes cumulative appreciation/depreciation of futures contracts as reported in the table following the Summary Portfolio of Investments. |
The effect of derivative instruments on the Portfolio’s Statement of Operations for the year ended December 31, 2010 was as follows:
| | | | Amount of Realized Gain or (Loss) on Derivatives Recognized in Income
|
|---|
Derivatives not accounted for as
hedging instruments
| | | | Futures
|
|---|
| Equity contracts | | | | $ | 4,387,334 | |
Total | | | | $ | 4,387,334 | |
| | | | Change in Unrealized Appreciation or (Depreciation)
on Derivatives Recognized in Income
|
|---|
Derivatives not accounted for as
hedging instruments
| | | | Futures
|
|---|
| Equity contracts | | | | $ | 539,665 | |
Total | | | | $ | 539,665 | |
See Accompanying Notes to Financial Statements
82
ING RUSSELLTM LARGE CAP
GROWTH INDEX PORTFOLIO |
| SUMMARY PORTFOLIO OF INVESTMENTS
AS OF DECEMBER 31, 2010 |
Shares
|
|
|
|
|
|
|
| Value
|
| Percent
of Net
Assets
|
|---|
| |
COMMON STOCK: 98.5% |
| | | | | | | Consumer Discretionary: 12.5% |
| 28,571 | | | | @ | | Amazon.com, Inc. | | $ | 5,142,780 | | | | 1.3 | |
| 69,220 | | | | @ | | DIRECTV | | | 2,763,955 | | | | 0.7 | |
| 271,300 | | | | @, L | | Ford Motor Co. | | | 4,555,127 | | | | 1.2 | |
| 137,830 | | | | | | Home Depot, Inc. | | | 4,832,320 | | | | 1.3 | |
| 87,480 | | | | | | McDonald’s Corp. | | | 6,714,965 | | | | 1.7 | |
| 29,230 | | | | | | Nike, Inc. | | | 2,496,827 | | | | 0.6 | |
| 59,880 | | | | | | Target Corp. | | | 3,600,584 | | | | 0.9 | |
| | | | | | | Other Securities | | | 18,399,773 | | | | 4.8 | |
| | | | | | | | | | 48,506,331 | | | | 12.5 | |
| |
| | | | | | | |
| 98,830 | | | | | | Altria Group, Inc. | | | 2,433,195 | | | | 0.6 | |
| 127,930 | | | | | | Coca-Cola Co. | | | 8,413,956 | | | | 2.2 | |
| 33,440 | | | | | | Colgate-Palmolive Co. | | | 2,687,573 | | | | 0.7 | |
| 35,850 | | | | | | Costco Wholesale Corp. | | | 2,588,729 | | | | 0.7 | |
| 75,480 | | | | | | PepsiCo, Inc. | | | 4,931,108 | | | | 1.3 | |
| 126,880 | | | | | | Philip Morris International, Inc. | | | 7,426,286 | | | | 1.9 | |
| 70,600 | | | | | | Walgreen Co. | | | 2,750,576 | | | | 0.7 | |
| 96,770 | | | | | | Wal-Mart Stores, Inc. | | | 5,218,806 | | | | 1.3 | |
| | | | | | | Other Securities | | | 6,702,142 | | | | 1.7 | |
| | | | | | | | | | 43,152,371 | | | | 11.1 | |
| |
| | | | | | | |
| 46,300 | | | | | | ConocoPhillips | | | 3,153,030 | | | | 0.8 | |
| 381,910 | | | | | | ExxonMobil Corp. | | | 27,925,254 | | | | 7.2 | |
| 73,600 | | | | | | Halliburton Co. | | | 3,005,088 | | | | 0.8 | |
| 97,850 | | | | | | Schlumberger Ltd. | | | 8,170,475 | | | | 2.1 | |
| | | | | | | Other Securities | | | 6,748,751 | | | | 1.8 | |
| | | | | | | | | | 49,002,598 | | | | 12.7 | |
| |
| | | | | | | |
| 85,354 | | | | | | American Express Co. | | | 3,663,394 | | | | 0.9 | |
| | | | | | | Other Securities | | | 7,930,464 | | | | 2.1 | |
| | | | | | | | | | 11,593,858 | | | | 3.0 | |
| |
| | | | | | | |
| 113,170 | | | | | | Abbott Laboratories | | | 5,421,975 | | | | 1.4 | |
| 44,540 | | | | @ | | Express Scripts, Inc. | | | 2,407,387 | | | | 0.6 | |
| 69,580 | | | | @ | | Gilead Sciences, Inc. | | | 2,521,579 | | | | 0.7 | |
| 68,890 | | | | | | Medtronic, Inc. | | | 2,555,130 | | | | 0.7 | |
| | | | | | | Other Securities | | | 20,262,085 | | | | 5.2 | |
| | | | | | | | | | 33,168,156 | | | | 8.6 | |
| |
| | | | | | | |
| 58,060 | | | | | | 3M Co. | | | 5,010,578 | | | | 1.3 | |
| 50,010 | | | | | | Boeing Co. | | | 3,263,653 | | | | 0.8 | |
| 51,030 | | | | | | Caterpillar, Inc. | | | 4,779,470 | | | | 1.2 | |
| 32,660 | | | | | | Deere & Co. | | | 2,712,413 | | | | 0.7 | |
| 61,280 | | | | | | Emerson Electric Co. | | | 3,503,378 | | | | 0.9 | |
| 201,500 | | | | | | General Electric Co. | | | 3,685,435 | | | | 1.0 | |
| 62,300 | | | | | | Honeywell International, Inc. | | | 3,311,868 | | | | 0.9 | |
| |
COMMON STOCK: (continued)
|
| | | | | | | |
| 58,170 | | | | | | United Parcel Service, Inc. — Class B | | $ | 4,221,979 | | | | 1.1 | |
| 69,360 | | | | | | United Technologies Corp. | | | 5,460,019 | | | | 1.4 | |
| | | | | | | Other Securities | | | 10,880,594 | | | | 2.8 | |
| | | | | | | | | | 46,829,387 | | | | 12.1 | |
| |
| | | | | | | Information Technology: 33.5% |
| 49,700 | | | | | | Accenture PLC | | | 2,409,953 | | | | 0.6 | |
| 74,175 | | | | @ | | Apple, Inc. | | | 23,925,888 | | | | 6.2 | |
| 464,623 | | | | @ | | Cisco Systems, Inc. | | | 9,399,323 | | | | 2.4 | |
| 167,220 | | | | @ | | EMC Corp. | | | 3,829,338 | | | | 1.0 | |
| 19,827 | | | | @ | | Google, Inc. — Class A | | | 11,776,643 | | | | 3.0 | |
| 190,930 | | | | | | Hewlett-Packard Co. | | | 8,038,153 | | | | 2.1 | |
| 309,690 | | | | | | Intel Corp. | | | 6,512,781 | | | | 1.7 | |
| 104,300 | | | | | | International Business Machines Corp. | | | 15,307,068 | | | | 3.9 | |
| 416,800 | | | | | | Microsoft Corp. | | | 11,637,056 | | | | 3.0 | |
| 309,980 | | | | | | Oracle Corp. | | | 9,702,374 | | | | 2.5 | |
| 133,457 | | | | | | Qualcomm, Inc. | | | 6,604,787 | | | | 1.7 | |
| 37,975 | | | | | | Visa, Inc. | | | 2,672,681 | | | | 0.7 | |
| | | | | | | Other Securities | | | 18,070,718 | | | | 4.7 | |
| | | | | | | | | | 129,886,763 | | | | 33.5 | |
| |
| | | | | | | |
| 37,990 | | | | | | Freeport-McMoRan Copper & Gold, Inc. | | | 4,562,219 | | | | 1.2 | |
| 44,485 | | | | | | Monsanto Co. | | | 3,097,935 | | | | 0.8 | |
| 38,760 | | | | | | Newmont Mining Corp. | | | 2,381,027 | | | | 0.6 | |
| 24,850 | | | | | | Praxair, Inc. | | | 2,372,430 | | | | 0.6 | |
| | | | | | | Other Securities | | | 5,283,372 | | | | 1.4 | |
| | | | | | | | | | 17,696,983 | | | | 4.6 | |
| |
| | | | | | | Telecommunication Services: 0.4% |
| | | | | | | Other Securities | | | 1,736,137 | | | | 0.4 | |
| |
| | | | | | | Total Common Stock | | | | | | | | |
| | | | | | | (Cost $288,150,940) | | | 381,572,584 | | | | 98.5 | |
| |
REAL ESTATE INVESTMENT TRUSTS: 0.7% |
| | | | | | | |
| | | | | | | Other Securities | | | 2,717,234 | | | | 0.7 | |
| |
| | | | | | | Total Real Estate Investment Trusts | | | | | | | | |
| | | | | | | (Cost $2,052,217) | | | 2,717,234 | | | | 0.7 | |
| |
| | | | | | | Total Long-Term Investments | | | | | | | | |
| | | | | | | (Cost $290,203,157) | | | 384,289,818 | | | | 99.2 | |
| |
SHORT-TERM INVESTMENTS: 2.3% |
| | | | | | | |
| 3,348,000 | | | | | | Blackrock Liquidity Funds TempFund Portfolio — Class I | | | 3,348,000 | | | | 0.9 | |
| |
| | | | | | | Total Mutual Funds | | | | | | | | |
| | | | | | | (Cost $3,348,000) | | | 3,348,000 | | | | 0.9 | |
See Accompanying Notes to Financial Statements
83
ING RUSSELLTM LARGE CAP
GROWTH INDEX PORTFOLIO |
| SUMMARY PORTFOLIO OF INVESTMENTS
AS OF DECEMBER 31, 2010 (CONTINUED) |
Shares
|
|
|
|
|
|
|
| Value
|
| Percent
of Net
Assets
|
|---|
| |
SHORT-TERM INVESTMENTS: (continued) |
| | | | | | | Securities Lending Collateralcc: 1.4% |
| 4,541,676 | | | | | | BNY Mellon Overnight Government Fund(1) | | $ | 4,541,676 | | | | 1.2 | |
| 1,230,638 | | | | R | | BNY Institutional Cash Reserves Fund, Series B(1)(2) | | | 984,510 | | | | 0.2 | |
| |
| | | | | | | Total Securities Lending Collateral | | | | | | | | |
| | | | | | | (Cost $5,772,314) | | | 5,526,186 | | | | 1.4 | |
| |
| | | | | | | Total Short-Term Investments | | | | | | | | |
| | | | | | | (Cost $9,120,314) | | | 8,874,186 | | | | 2.3 | |
| |
| | | | | | | Total Investments in Securities | | | | | | | | |
| | | | | | | (Cost $299,323,471)* | | $ | 393,164,004 | | | | 101.5 | |
| | | | | | | Other Assets and Liabilities — Net | | | (5,739,897 | ) | | | (1.5 | ) |
| | | | | | | Net Assets | | $ | 387,424,107 | | | | 100.0 | |
“Other Securities” represents issues not identified as the top 50 holdings in terms of market value and issues or issuers not exceeding 1% of net assets individually or in aggregate respectively as of December 31, 2010.
The following footnotes apply to either the individual securities noted or one or more of the securities aggregated and listed as a single line item.
| @ | | Non-income producing security |
| cc | | Securities purchased with cash collateral for securities loaned. |
| (1) | | Collateral received from brokers for securities lending was invested in these short-term investments. |
| (2) | | On September 12, 2008, BNY established a separate sleeve of the Institutional Cash Reserves Fund (Series B) to hold certain Lehman Brothers defaulted debt obligations. The Portfolio’s position in Series B is being fair valued daily. Please see the accompanying Notes to Financial Statements for additional details on securities lending. |
| L | | Loaned security, a portion or all of the security is on loan at December 31, 2010. |
| * | | Cost for federal income tax purposes is $299,404,657. |
| Net unrealized appreciation consists of: | | | | | | |
| Gross Unrealized Appreciation | | | | $ | 97,598,329 | |
| Gross Unrealized Depreciation | | | | | (3,838,982 | ) |
| Net Unrealized Appreciation | | | | $ | 93,759,347 | |
Fair Value Measurementsˆ
The following is a summary of the fair valuations according to the inputs used as of December 31, 2010 in valuing the Portfolio’s assets and liabilities:
| | | | Quoted Prices in
Active Markets for
Identical Investments
(Level 1)
| | Other
Observable
Inputs
(Level 2)
| | Significant
Unobservable
Inputs
(Level 3)
| | Fair Value
at
12/31/2010
|
|---|
Asset Table | | | | | | | | | | | | | | | | | | |
Investments, at value | | | | | | | | | | | | | | | | | | |
| Common Stock* | | | | $ | 381,572,584 | | | $ | — | | | $ | — | | | $ | 381,572,584 | |
| Real Estate Investment Trusts | | | | | 2,717,234 | | | | — | | | | — | | | | 2,717,234 | |
| Short-Term Investments | | | | | 7,889,676 | | | | — | | | | 984,510 | | | | 8,874,186 | |
| Total Investments, at value | | | | $ | 392,179,494 | | | $ | — | | | $ | 984,510 | | | $ | 393,164,004 | |
Other Financial Instruments+: | | | | | | | | | | | | | | | | | | |
| Futures | | | | | 212,642 | | | | — | | | | — | | | | 212,642 | |
| Total Assets | | | | $ | 392,392,136 | | | $ | — | | | $ | 984,510 | | | $ | 393,376,646 | |
The following is a reconciliation of the fair valuations using significant unobservable inputs (Level 3) for the Portfolio’s assets and liabilities during the period ended December 31, 2010:
| | | | Beginning
Balance
12/31/2009
| | Purchases
| | Sales
| | Accrued
Discounts/
(Premiums)
| | Total
Realized
Gain/(Loss)
| | Total Unrealized
Appreciation/
(Depreciation)
| | Transfers
Into
Level 3
| | Transfers
Out of
Level 3
| | Ending
Balance
12/31/2010
|
|---|
Asset Table | | | | | | | | | | | | | | | | | | | | | | | | | | | | | | | | | | | | | | |
Investments, at value | | | | | | | | | | | | | | | | | | | | | | | | | | | | | | | | | | | | | | |
| Short-Term Investments | | | | $ | 984,510 | | | $ | — | | | $ | — | | | $ | — | | | $ | — | | | $ | — | | | $ | — | | | $ | — | | | $ | 984,510 | |
| Total Investments, at value | | | | $ | 984,510 | | | $ | — | | | $ | — | | | $ | — | | | $ | — | | | $ | — | | | $ | — | | | $ | — | | | $ | 984,510 | |
As of December 31, 2010, total change in unrealized gain (loss) on Level 3 securities still held at period end and included in the change in net assets was $0.
| ˆ | | See Note 2, “Significant Accounting Policies” in the Notes to Financial Statements for additional information. |
| + | | Other Financial Instruments are derivatives not reflected in the Summary Portfolio of Investments and may include open forward foreign currency contracts, futures, swaps, and written options. Forward foreign currency contracts and futures are reported at their unrealized gain/loss at measurement date which represents the amount due to/from the Portfolio. Swaps and written options are reported at their market value at measurement date. |
See Accompanying Notes to Financial Statements
84
ING RUSSELLTM LARGE CAP
GROWTH INDEX PORTFOLIO |
| SUMMARY PORTFOLIO OF INVESTMENTS
AS OF DECEMBER 31, 2010 (CONTINUED) |
Transfers in or out of Level 3 represents either the beginning value (for transfers in), or the ending value (for transfers out) of any security or derivative instrument where a change in the pricing level occurred from the beginning to the end of the period. It is the policy of the Portfolio to recognize transfers at the end of the reporting period.
| * | | For further breakdown of Common Stock by Industry type, please refer to the Portfolio of Investments. |
ING RussellTM Large Cap Growth Index Portfolio Open Futures Contracts on December 31, 2010:
Contract Description
| | | | Number
of Contracts
| | Expiration Date
| | Notional Value
| | Unrealized
Appreciation
|
|---|
Long Contracts | | | | | | | | | | | | | | | | | | |
| S&P 500 E-Mini | | | | | 59 | | | | 03/18/11 | | | $ | 3,696,350 | | | $ | 212,642 | |
| | | | | | | | | | | | | $ | 3,696,350 | | | $ | 212,642 | |
A summary of derivative instruments by primary risk exposure is outlined in the following tables.
The fair value of derivative instruments as of December 31, 2010 was as follows:
Derivatives not accounted for as
hedging instruments
| | | | Location on Statement
of Assets and Liabilities
| | Fair Value
|
|---|
Asset Derivatives
| | | |
|---|
| Equity contracts | | | | Net Assets — Unrealized appreciation* | | $ | 212,642 | |
Total Asset Derivatives | | | | | | $ | 212,642 | |
| * | | Includes cumulative appreciation/depreciation of futures contracts as reported in the table following the Summary Portfolio of Investments. |
The effect of derivative instruments on the Portfolio’s Statement of Operations for the year ended December 31, 2010 was as follows:
| | | | Amount of Realized Gain or (Loss) on Derivatives Recognized in Income
|
|---|
Derivatives not accounted for as
hedging instruments
| | | | Futures
|
|---|
| Equity contracts | | | | $ | 309,783 | |
Total | | | | $ | 309,783 | |
| |
| | | | | Change in Unrealized Appreciation or (Depreciation)
on Derivatives Recognized in Income
|
| |
Derivatives not accounted for as
hedging instruments
| | | | Futures |
| Equity contracts | | | | $ | 241,054 | |
Total | | | | $ | 241,054 | |
See Accompanying Notes to Financial Statements
85
ING RUSSELLTM LARGE CAP
VALUE INDEX PORTFOLIO |
| SUMMARY PORTFOLIO OF INVESTMENTS
AS OF DECEMBER 31, 2010 |
Shares
|
|
|
|
|
|
|
| Value
|
| Percent
of Net
Assets
|
|---|
| |
COMMON STOCK: 99.0% |
| | | | | | | Consumer Discretionary: 6.2% |
| 56,750 | | | | | | Comcast Corp. — Class A | | $ | 1,246,798 | | | | 1.4 | |
| 36,500 | | | | | | News Corp. — Class A | | | 531,440 | | | | 0.6 | |
| 18,248 | | | | | | Time Warner, Inc. | | | 587,038 | | | | 0.6 | |
| 39,505 | | | | | | Walt Disney Co. | | | 1,481,833 | | | | 1.7 | |
| | | | | | | Other Securities | | | 1,683,211 | | | | 1.9 | |
| | | | | | | | | | 5,530,320 | | | | 6.2 | |
| |
| | | | | | | |
| 10,795 | | | | | | Coca-Cola Co. | | | 709,987 | | | | 0.8 | |
| 24,335 | | | | | | CVS Caremark Corp. | | | 846,128 | | | | 1.0 | |
| 32,400 | | | | | | Kraft Foods, Inc. | | | 1,020,924 | | | | 1.1 | |
| 13,800 | | | | | | PepsiCo, Inc. | | | 901,554 | | | | 1.0 | |
| 54,585 | | | | | | Procter & Gamble Co. | | | 3,511,453 | | | | 3.9 | |
| 15,500 | | | | | | Wal-Mart Stores, Inc. | | | 835,915 | | | | 0.9 | |
| | | | | | | Other Securities | | | 2,195,766 | | | | 2.5 | |
| | | | | | | | | | 10,021,727 | | | | 11.2 | |
| |
| | | | | | | |
| 9,985 | | | | | | Anadarko Petroleum Corp. | | | 760,458 | | | | 0.9 | |
| 7,660 | | | | | | Apache Corp. | | | 913,302 | | | | 1.0 | |
| 38,285 | | | | | | Chevron Corp. | | | 3,493,506 | | | | 3.9 | |
| 18,500 | | | | | | ConocoPhillips | | | 1,259,850 | | | | 1.4 | |
| 9,010 | | | | | | Devon Energy Corp. | | | 707,375 | | | | 0.8 | |
| 8,318 | | | | | | ExxonMobil Corp. | | | 608,212 | | | | 0.7 | |
| 8,400 | | | | | | National Oilwell Varco, Inc. | | | 564,900 | | | | 0.6 | |
| 13,030 | | | | | | Occidental Petroleum Corp. | | | 1,278,243 | | | | 1.5 | |
| | | | | | | Other Securities | | | 1,982,694 | | | | 2.2 | |
| | | | | | | | | | 11,568,540 | | | | 13.0 | |
| |
| | | | | | | |
| 202,293 | | | | | | Bank of America Corp. | | | 2,698,589 | | | | 3.0 | |
| 24,400 | | | | | | Bank of New York Mellon Corp. | | | 736,880 | | | | 0.8 | |
| 34,900 | | | | @ | | Berkshire Hathaway, Inc. — Class B | | | 2,795,839 | | | | 3.2 | |
| 426,550 | | | | @ | | Citigroup, Inc. | | | 2,017,582 | | | | 2.3 | |
| 10,400 | | | | | | Goldman Sachs Group, Inc. | | | 1,748,864 | | | | 2.0 | |
| 80,150 | | | | | | JPMorgan Chase & Co. | | | 3,399,963 | | | | 3.8 | |
| 20,215 | | | | | | Morgan Stanley | | | 550,050 | | | | 0.6 | |
| 10,650 | | | | | | PNC Financial Services Group, Inc. | | | 646,668 | | | | 0.7 | |
| 9,380 | | | | | | Prudential Financial, Inc. | | | 550,700 | | | | 0.6 | |
| 38,610 | | | | | | US Bancorp. | | | 1,041,312 | | | | 1.2 | |
| 98,146 | | | | | | Wells Fargo & Co. | | | 3,041,545 | | | | 3.4 | |
| | | | | | | Other Securities | | | 4,265,398 | | | | 4.8 | |
| | | | | | | | | | 23,493,390 | | | | 26.4 | |
| |
| |
COMMON STOCK: (continued)
|
| | | | | | | |
| 19,300 | | | | @ | | Amgen, Inc. | | $ | 1,059,570 | | | | 1.2 | |
| 34,650 | | | | | | Bristol-Myers Squibb Co. | | | 917,532 | | | | 1.0 | |
| 15,800 | | | | | | Eli Lilly & Co. | | | 553,632 | | | | 0.6 | |
| 47,250 | | | | | | Johnson & Johnson | | | 2,922,413 | | | | 3.3 | |
| 62,900 | | | | | | Merck & Co., Inc. | | | 2,266,916 | | | | 2.6 | |
| 162,607 | | | | | | Pfizer, Inc. | | | 2,847,249 | | | | 3.2 | |
| 22,900 | | | | | | UnitedHealth Group, Inc. | | | 826,919 | | | | 0.9 | |
| | | | | | | Other Securities | | | 2,676,334 | | | | 3.0 | |
| | | | | | | | | | 14,070,565 | | | | 15.8 | |
| | | | | | | |
| 7,780 | | | | | | CSX Corp. | | | 502,666 | | | | 0.6 | |
| 165,305 | | | | | | General Electric Co. | | | 3,023,428 | | | | 3.4 | |
| 8,890 | | | | | | Union Pacific Corp. | | | 823,747 | | | | 0.9 | |
| | | | | | | Other Securities | | | 3,141,004 | | | | 3.5 | |
| | | | | | | | | | 7,490,845 | | | | 8.4 | |
| | | | | | | Information Technology: 5.1% |
| 27,565 | | | | | | Corning, Inc. | | | 532,556 | | | | 0.6 | |
| 35,400 | | | | | | Intel Corp. | | | 744,462 | | | | 0.8 | |
| 51,100 | | | | | | Microsoft Corp. | | | 1,426,712 | | | | 1.6 | |
| | | | | | | Other Securities | | | 1,869,220 | | | | 2.1 | |
| | | | | | | | | | 4,572,950 | | | | 5.1 | |
| | | | | | | |
| 23,260 | | | | | | Dow Chemical Co. | | | 794,096 | | | | 0.9 | |
| 11,960 | | | | | | EI Du Pont de Nemours & Co. | | | 596,565 | | | | 0.6 | |
| | | | | | | Other Securities | | | 426,425 | | | | 0.5 | |
| | | | | | | | | | 1,817,086 | | | | 2.0 | |
| | | | | | | Telecommunication Services: 6.5% |
| 119,100 | | | | | | AT&T, Inc. | | | 3,499,151 | | | | 3.9 | |
| 56,995 | | | | | | Verizon Communications, Inc. | | | 2,039,281 | | | | 2.3 | |
| | | | | | | Other Securities | | | 251,051 | | | | 0.3 | |
| | | | | | | | | | 5,789,483 | | | | 6.5 | |
| | | | | | | |
| 12,050 | | | | | | Dominion Resources, Inc. | | | 514,776 | | | | 0.6 | |
| 13,315 | | | | | | Exelon Corp. | | | 554,437 | | | | 0.6 | |
| 16,600 | | | | | | Southern Co. | | | 634,618 | | | | 0.7 | |
| | | | | | | Other Securities | | | 2,203,235 | | | | 2.5 | |
| | | | | | | | | | 3,907,066 | | | | 4.4 | |
| | | | | | | Total Common Stock | | | | | | | | |
| | | | | | | (Cost $65,122,209) | | | 88,261,972 | | | | 99.0 | |
| |
REAL ESTATE INVESTMENT TRUSTS: 0.3% |
| | | | | | | |
| | | | | | | Other Securities | | | 215,278 | | | | 0.3 | |
| |
| | | | | | | Total Real Estate Investment Trusts | | | | | | | | |
| | | | | | | (Cost $115,312) | | | 215,278 | | | | 0.3 | |
| |
| | | | | | | Total Long-Term Investments | | | | | | | | |
| | | | | | | (Cost $65,237,521) | | | 88,477,250 | | | | 99.3 | |
See Accompanying Notes to Financial Statements
86
ING RUSSELLTM LARGE CAP
VALUE INDEX PORTFOLIO |
| SUMMARY PORTFOLIO OF INVESTMENTS
AS OF DECEMBER 31, 2010 (CONTINUED) |
Shares
|
|
|
|
|
|
|
| Value
|
| Percent
of Net
Assets
|
|---|
| |
SHORT-TERM INVESTMENTS: 0.6% |
| | | | | | | |
| 532,000 | | | | | | Blackrock Liquidity Funds TempFund Portfolio — Class I | | $ | 532,000 | | | | 0.6 | |
| |
| | | | | | | Total Short-Term Investments | | | | | | | | |
| | | | | | | (Cost $532,000) | | | 532,000 | | | | 0.6 | |
| |
| | | | | | | Total Investments in Securities | | | | | | | | |
| | | | | | | (Cost $65,769,521)* | | $ | 89,009,250 | | | | 99.9 | |
| | | | | | | Other Assets and Liabilities — Net | | | 108,738 | | | | 0.1 | |
| | | | | | | Net Assets | | $ | 89,117,988 | | | | 100.0 | |
“Other Securities” represents issues not identified as the top 50 holdings in terms of market value and issues or issuers not exceeding 1% of net assets individually or in aggregate respectively as of December 31, 2010.
The following footnotes apply to either the individual securities noted or one or more of the securities aggregated and listed as a single line item.
| @ | | Non-income producing security |
| * | | Cost for federal income tax purposes is $69,817,821. |
| Net unrealized appreciation consists of: | | | | | | |
| Gross Unrealized Appreciation | | | | $ | 19,394,679 | |
| Gross Unrealized Depreciation | | | | | (203,250 | ) |
| Net Unrealized Appreciation | | | | $ | 19,191,429 | |
Fair Value Measurementsˆ
The following is a summary of the fair valuations according to the inputs used as of December 31, 2010 in valuing the Portfolio’s assets and liabilities:
| | | | Quoted Prices in
Active Markets for
Identical Investments
(Level 1)
| | Other
Observable
Inputs
(Level 2)
| | Significant
Unobservable
Inputs
(Level 3)
| | Fair Value
at
12/31/2010
|
|---|
Asset Table | | | | | | | | | | | | | | | | | | |
Investments, at value | | | | | | | | | | | | | | | | | | |
| Common Stock* | | | | $ | 88,261,972 | | | $ | — | | | $ | — | | | $ | 88,261,972 | |
| Real Estate Investment Trusts | | | | | 215,278 | | | | — | | | | — | | | | 215,278 | |
| Short-Term Investments | | | | | 532,000 | | | | — | | | | — | | | | 532,000 | |
| Total Investments, at value | | | | $ | 89,009,250 | | | $ | — | | | $ | — | | | $ | 89,009,250 | |
Other Financial Instruments+: | | | | | | | | | | | | | | | | | | |
| Futures | | | | | 16,940 | | | | — | | | | — | | | | 16,940 | |
| Total Assets | | | | $ | 89,026,190 | | | $ | — | | | $ | — | | | $ | 89,026,190 | |
| ˆ | | See Note 2, “Significant Accounting Policies” in the Notes to Financial Statements for additional information. |
| + | | Other Financial Instruments are derivatives not reflected in the Summary Portfolio of Investments and may include open forward foreign currency contracts, futures, swaps, and written options. |
Forward foreign currency contracts and futures are reported at their unrealized gain/loss at measurement date which represents the amount due to/from the Portfolio. Swaps and written options are reported at their market value at measurement date.
| * | | For further breakdown of Common Stock by Industry type, please refer to the Portfolio of Investments. |
ING RussellTM Large Cap Value Index Portfolio Open Futures Contracts on December 31, 2010:
Contract Description
| | | | Number
of Contracts
| | Expiration Date
| | Notional Value
| | Unrealized
Appreciation
|
|---|
Long Contracts | | | | | | | | | | | | | | | | | | |
| S&P 500 E-Mini | | | | | 11 | | | | 03/18/11 | | | $ | 689,150 | | | $ | 16,940 | |
| | | | | | | | | | | | | $ | 689,150 | | | $ | 16,940 | |
See Accompanying Notes to Financial Statements
87
ING RUSSELLTM LARGE CAP
VALUE INDEX PORTFOLIO |
| SUMMARY PORTFOLIO OF INVESTMENTS
AS OF DECEMBER 31, 2010 (CONTINUED) |
A summary of derivative instruments by primary risk exposure is outlined in the following tables.
The fair value of derivative instruments as of December 31, 2010 was as follows:
Derivatives not accounted for as
hedging instruments
| | | | Location on Statement
of Assets and Liabilities
| | Fair Value
|
|---|
Asset Derivatives | | | | | | | | | | |
| Equity contracts | | | | Net Assets — Unrealized appreciation* | | $ | 16,940 | |
Total Asset Derivatives | | | | | | $ | 16,940 | |
| * | | Includes cumulative appreciation/depreciation of futures contracts as reported in the table following the Summary Portfolio of Investments. |
The effect of derivative instruments on the Portfolio’s Statement of Operations for the year ended December 31, 2010 was as follows:
| | | | Amount of Realized Gain or (Loss) on Derivatives Recognized in Income
|
|---|
Derivatives not accounted for as
hedging instruments
| | | | Futures
|
|---|
| Equity contracts | | | | $ | 94,778 | |
Total | | | | $ | 94,778 | |
| | | | Change in Unrealized Appreciation or (Depreciation)
on Derivatives Recognized in Income
|
|---|
Derivatives not accounted for as
hedging instruments
| | | | Futures
|
|---|
| Equity contracts | | | | $ | 25,803 | |
Total | | | | $ | 25,803 | |
See Accompanying Notes to Financial Statements
88
ING RUSSELLTM MID CAP
INDEX PORTFOLIO |
| SUMMARY PORTFOLIO OF INVESTMENTS
AS OF DECEMBER 31, 2010 |
Shares
|
|
|
|
|
|
|
| Value
|
| Percent
of Net
Assets
|
|---|
| |
COMMON STOCK: 92.2% |
| | | | | | | Consumer Discretionary: 15.0% |
| 102,450 | | | | @ | | Bed Bath & Beyond, Inc. | | $ | 5,035,418 | | | | 0.3 | |
| 264,600 | | | | | | CBS Corp. — Class B | | | 5,040,630 | | | | 0.3 | |
| 118,700 | | | | | | Coach, Inc. | | | 6,565,297 | | | | 0.4 | |
| 110,600 | | | | @ | | Discovery Communications, Inc. — Class A | | | 4,612,020 | | | | 0.3 | |
| 18,450 | | | | @ | | Priceline.com, Inc. | | | 7,371,698 | | | | 0.5 | |
| | | | | | | Other Securities | | | 206,855,205 | | | | 13.2 | |
| | | | | | | | | | 235,480,268 | | | | 15.0 | |
| |
| | | | | | | |
| 166,750 | | | | | | Avon Products, Inc. | | | 4,845,755 | | | | 0.3 | |
| 123,000 | | | | | | HJ Heinz Co. | | | 6,083,580 | | | | 0.4 | |
| 59,450 | | | | | | Lorillard, Inc. | | | 4,878,467 | | | | 0.3 | |
| 79,600 | | | | | | Mead Johnson Nutrition Co. | | | 4,955,100 | | | | 0.3 | |
| | | | | | | Other Securities | | | 71,416,152 | | | | 4.6 | |
| | | | | | | | | | 92,179,054 | | | | 5.9 | |
| |
| | | | | | | |
| 95,000 | | | | @ | | Cameron International Corp. | | | 4,819,350 | | | | 0.3 | |
| 74,450 | | | | | | Murphy Oil Corp. | | | 5,550,248 | | | | 0.4 | |
| 67,950 | | | | | | Noble Energy, Inc. | | | 5,849,136 | | | | 0.4 | |
| 104,600 | | | | | | Peabody Energy Corp. | | | 6,692,308 | | | | 0.4 | |
| 252,100 | | | | | | Spectra Energy Corp. | | | 6,299,979 | | | | 0.4 | |
| 220,000 | | | | | | Valero Energy Corp. | | | 5,086,400 | | | | 0.3 | |
| 288,000 | | | | @ | | Weatherford International Ltd. | | | 6,566,400 | | | | 0.4 | |
| | | | | | | Other Securities | | | 94,384,769 | | | | 6.0 | |
| | | | | | | | | | 135,248,590 | | | | 8.6 | |
| |
| | | | | | | |
| 100,200 | | | | | | Ameriprise Financial, Inc. | | | 5,766,510 | | | | 0.4 | |
| 127,834 | | | | | | AON Corp. | | | 5,881,642 | | | | 0.4 | |
| 210,650 | | | | | | Marsh & McLennan Cos., Inc. | | | 5,759,171 | | | | 0.4 | |
| 260,800 | | | | | | Progressive Corp. | | | 5,182,096 | | | | 0.3 | |
| 194,500 | | | | | | SunTrust Bank | | | 5,739,695 | | | | 0.4 | |
| 100,950 | | | | | | T. Rowe Price Group, Inc. | | | 6,515,313 | | | | 0.4 | |
| | | | | | | Other Securities | | | 161,626,025 | | | | 10.3 | |
| | | | | | | | | | 196,470,452 | | | | 12.6 | |
| |
| | | | | | | |
| 135,500 | | | | @ | | Agilent Technologies, Inc. | | | 5,613,764 | | | | 0.4 | |
| | | | | | | Other Securities | | | 132,459,534 | | | | 8.4 | |
| | | | | | | | | | 138,073,298 | | | | 8.8 | |
| |
| | | | | | | |
| 64,550 | | | | | | CH Robinson Worldwide, Inc. | | | 5,176,265 | | | | 0.3 | |
| 78,000 | | | | | | Cummins, Inc. | | | 8,580,780 | | | | 0.6 | |
| 65,250 | | | | | | Eaton Corp. | | | 6,623,528 | | | | 0.4 | |
| 69,450 | | | | | | Fluor Corp. | | | 4,601,757 | | | | 0.3 | |
| 125,300 | | | | | | Ingersoll-Rand PLC | | | 5,900,377 | | | | 0.4 | |
| |
COMMON STOCK: (continued) |
| | | | | | | |
| 62,600 | | | | | | Parker Hannifin Corp. | | $ | 5,402,380 | | | | 0.3 | |
| | | | | | | Other Securities | | | 164,847,527 | | | | 10.5 | |
| | | | | | | | | | 201,132,614 | | | | 12.8 | |
| |
| | | | | | | Information Technology: 14.3% |
| 72,350 | | | | @ | | Citrix Systems, Inc. | | | 4,949,464 | | | | 0.3 | |
| 109,150 | | | | @ | | Intuit, Inc. | | | 5,381,095 | | | | 0.3 | |
| 134,050 | | | | @ | | NetApp, Inc. | | | 7,367,300 | | | | 0.5 | |
| 44,550 | | | | @ | | Salesforce.com, Inc. | | | 5,880,600 | | | | 0.4 | |
| 261,500 | | | | | | Western Union Co. | | | 4,856,055 | | | | 0.3 | |
| 536,517 | | | | | | Xerox Corp. | | | 6,180,676 | | | | 0.4 | |
| | | | | | | Other Securities | | | 188,801,731 | | | | 12.1 | |
| | | | | | | | | | 223,416,921 | | | | 14.3 | |
| |
| | | | | | | |
| 90,850 | | | | | | Ecolab, Inc. | | | 4,580,657 | | | | 0.3 | |
| 169,950 | | | | | | International Paper Co. | | | 4,629,438 | | | | 0.3 | |
| 64,750 | | | | | | PPG Industries, Inc. | | | 5,443,533 | | | | 0.4 | |
| | | | | | | Other Securities | | | 78,534,628 | | | | 5.0 | |
| | | | | | | | | | 93,188,256 | | | | 6.0 | |
| |
| | | | | | | Telecommunication Services: 2.0% |
| 116,935 | | | | L | | CenturyTel, Inc. | | | 5,398,889 | | | | 0.4 | |
| 113,000 | | | | @ | | Crown Castle International Corp. | | | 4,952,790 | | | | 0.3 | |
| 675,500 | | | | | | Qwest Communications International, Inc. | | | 5,140,555 | | | | 0.3 | |
| | | | | | | Other Securities | | | 16,084,240 | | | | 1.0 | |
| | | | | | | | | | 31,576,474 | | | | 2.0 | |
| | | | | | | |
| 109,750 | | | | | | Consolidated Edison, Inc. | | | 5,440,308 | | | | 0.4 | |
| 126,700 | | | | | | Edison International | | | 4,890,620 | | | | 0.3 | |
| 181,400 | | | | | | PPL Corp. | | | 4,774,448 | | | | 0.3 | |
| 111,700 | | | | | | Progress Energy, Inc. | | | 4,856,716 | | | | 0.3 | |
| 96,250 | | | | | | Sempra Energy | | | 5,051,200 | | | | 0.3 | |
| | | | | | | Other Securities | | | 72,306,117 | | | | 4.6 | |
| | | | | | | | | | 97,319,409 | | | | 6.2 | |
| |
| | | | | | | Total Common Stock | | | | | | | | |
| | | | | | | (Cost $1,038,795,576) | | | 1,444,085,336 | | | | 92.2 | |
| |
REAL ESTATE INVESTMENT TRUSTS: 5.7% |
| | | | | | | |
| 54,150 | | | | | | Boston Properties, Inc. | | | 4,662,315 | | | | 0.3 | |
| 110,150 | | | | | | Equity Residential | | | 5,722,293 | | | | 0.4 | |
| 62,850 | | | | | | Vornado Realty Trust | | | 5,237,291 | | | | 0.3 | |
| | | | | | | Other Securities | | | 74,532,681 | | | | 4.7 | |
| |
| | | | | | | Total Real Estate Investment Trusts | | | | | | | | |
| | | | | | | (Cost $65,836,303) | | | 90,154,580 | | | | 5.7 | |
| |
| | | | | | | Total Long-Term Investments | | | | | | | | |
| | | | | | | (Cost $1,104,631,879) | | | 1,534,239,916 | | | | 97.9 | |
See Accompanying Notes to Financial Statements
89
ING RUSSELLTM MID CAP
INDEX PORTFOLIO |
| SUMMARY PORTFOLIO OF INVESTMENTS
AS OF DECEMBER 31, 2010 (CONTINUED) |
Shares
|
|
|
|
|
|
|
| Value
|
| Percent
of Net
Assets
|
|---|
| |
SHORT-TERM INVESTMENTS: 4.6% |
| | | | | | | |
| 31,081,000 | | | | | | Blackrock Liquidity Funds TempFund Portfolio — Class I | | $ | 31,081,000 | | | | 2.0 | |
| |
| | | | | | | Total Mutual Funds | | | | | | | | |
| | | | | | | (Cost $31,081,000) | | | 31,081,000 | | | | 2.0 | |
| |
| | | | | | | Securities Lending Collateralcc: 2.6% |
| 40,539,943 | | | | | | BNY Mellon Overnight Government Fund(1) | | | 40,539,943 | | | | 2.6 | |
| 268,841 | | | | R | | BNY Institutional Cash Reserves Fund, Series B(1)(2) | | | 215,073 | | | | 0.0 | |
| |
| | | | | | | Total Securities Lending Collateral | | | | | | | | |
| | | | | | | (Cost $40,808,784) | | | 40,755,016 | | | | 2.6 | |
| |
| | | | | | | Total Short-Term Investments | | | | | | | | |
| | | | | | | (Cost $71,889,784) | | | 71,836,016 | | | | 4.6 | |
| |
| | | | | | | Total Investments in Securities | | | | | | | | |
| | | | | | | (Cost $1,176,521,663)* | | $ | 1,606,075,932 | | | | 102.5 | |
| | | | | | | Other Assets and Liabilities — Net | | | (39,621,158 | ) | | | (2.5 | ) |
| | | | | | | Net Assets | | $ | 1,566,454,774 | | | | 100.0 | |
“Other Securities” represents issues not identified as the top 50 holdings in terms of market value and issues or issuers not exceeding 1% of net assets individually or in aggregate respectively as of December 31, 2010.
The following footnotes apply to either the individual securities noted or one or more of the securities aggregated and listed as a single line item.
| @ | | Non-income producing security |
| cc | | Securities purchased with cash collateral for securities loaned. |
| (1) | | Collateral received from brokers for securities lending was invested in these short-term investments. |
| (2) | | On September 12, 2008, BNY established a separate sleeve of the Institutional Cash Reserves Fund (Series B) to hold certain Lehman Brothers defaulted debt obligations. The Portfolio’s position in Series B is being fair valued daily. Please see the accompanying Notes to Financial Statements for additional details on securities lending. |
| L | | Loaned security, a portion or all of the security is on loan at December 31, 2010. |
| * | | Cost for federal income tax purposes is $1,187,321,936. |
| Net unrealized appreciation consists of: | | | | | | |
| Gross Unrealized Appreciation | | | | $ | 434,955,637 | |
| Gross Unrealized Depreciation | | | | | (16,201,641 | ) |
| Net Unrealized Appreciation | | | | $ | 418,753,996 | |
Fair Value Measurementsˆ
The following is a summary of the fair valuations according to the inputs used as of December 31, 2010 in valuing the Portfolio’s assets and liabilities:
| | | | Quoted Prices
in Active Markets
for Identical Investments
(Level 1)
| | Other
Observable
Inputs
(Level 2)
| | Significant
Unobservable
Inputs
(Level 3)
| | Fair Value
at
12/31/2010
|
|---|
Asset Table | | | | | | | | | | | | | | | | | | |
Investments, at value | | | | | | | | | | | | | | | | | | |
| Common Stock* | | | | $ | 1,444,085,336 | | | $ | — | | | $ | — | | | $ | 1,444,085,336 | |
| Real Estate Investment Trusts | | | | | 90,154,580 | | | | — | | | | — | | | | 90,154,580 | |
| Short-Term Investments | | | | | 71,620,943 | | | | — | | | | 215,073 | | | | 71,836,016 | |
| Total Investments, at value | | | | $ | 1,605,860,859 | | | $ | — | | | $ | 215,073 | | | $ | 1,606,075,932 | |
Other Financial Instruments+: | | | | | | | | | | | | | | | | | | |
| Futures | | | | | 492,430 | | | | — | | | | — | | | | 492,430 | |
| Total Assets | | | | $ | 1,606,353,289 | | | $ | — | | | $ | 215,073 | | | $ | 1,606,568,362 | |
The following is a reconciliation of the fair valuations using significant unobservable inputs (Level 3) for the Portfolio’s assets and liabilities during the period ended December 31, 2010:
| | | | Beginning
Balance
12/31/2009
| | Purchases
| | Sales
| | Accrued
Discounts/
(Premiums)
| | Total
Realized
Gain/(Loss)
| | Total Unrealized
Appreciation/
(Depreciation)
| | Transfers
Into
Level 3
| | Transfers
Out of
Level 3
| | Ending
Balance
12/31/2010
|
|---|
Asset Table | | | | | | | | | | | | | | | | | | | | | | | | | | | | | | | | | | | | | | |
Investments, at value | | | | | | | | | | | | | | | | | | | | | | | | | | | | | | | | | | | | | | |
| Short-Term Investments | | | | $ | 215,073 | | | $ | — | | | $ | — | | | $ | — | | | $ | — | | | $ | — | | | $ | — | | | $ | — | | | $ | 215,073 | |
| Total Investments, at value | | | | $ | 215,073 | | | $ | — | | | $ | — | | | $ | — | | | $ | — | | | $ | — | | | $ | — | | | $ | — | | | $ | 215,073 | |
As of December 31, 2010, total change in unrealized gain (loss) on Level 3 securities still held at period end and included in the change in net assets was $0.
| ˆ | | See Note 2, “Significant Accounting Policies” in the Notes to Financial Statements for additional information. |
See Accompanying Notes to Financial Statements
90
ING RUSSELLTM MID CAP
INDEX PORTFOLIO |
| SUMMARY PORTFOLIO OF INVESTMENTS
AS OF DECEMBER 31, 2010 (CONTINUED) |
| + | | Other Financial Instruments are derivatives not reflected in the Summary Portfolio of Investments and may include open forward foreign currency contracts, futures, swaps, and written options. |
Forward foreign currency contracts and futures are reported at their unrealized gain/loss at measurement date which represents the amount due to/from the Portfolio. Swaps and written options are reported at their market value at measurement date.
Transfers in or out of Level 3 represents either the beginning value (for transfers in), or the ending value (for transfers out) of any security or derivative instrument where a change in the pricing level occurred from the beginning to the end of the period. It is the policy of the Portfolio to recognize transfers at the end of the reporting period.
| * | | For further breakdown of Common Stock by Industry type, please refer to the Portfolio of Investments. |
ING RussellTM Mid Cap Index Portfolio Open Futures Contracts on December 31, 2010:
Contract Description
| | | | Number
of Contracts
| | Expiration Date
| | Notional Value
| | Unrealized
Appreciation
|
|---|
Long Contracts
| | | | | | | | | | | | | | | | | | |
| S&P Mid 400 E-Mini | | | | | 381 | | | | 03/18/11 | | | $ | 34,491,930 | | | $ | 492,430 | |
| | | | | | | | | | | | | $ | 34,491,930 | | | $ | 492,430 | |
A summary of derivative instruments by primary risk exposure is outlined in the following tables.
The fair value of derivative instruments as of December 31, 2010 was as follows:
Derivatives not accounted for as
hedging instruments
| | | | Location on Statement
of Assets and Liabilities
| | Fair Value
|
|---|
Asset Derivatives
| | | | | | | | | | |
| Equity contracts | | | | Net Assets — Unrealized appreciation*
| | $ | 492,430 | |
Total Asset Derivatives | | | | | | $ | 492,430 | |
| * | | Includes cumulative appreciation/depreciation of futures contracts as reported in the table following the Summary Portfolio of Investments. |
The effect of derivative instruments on the Portfolio’s Statement of Operations for the year ended December 31, 2010 was as follows:
| | | | Amount of Realized Gain or (Loss) on Derivatives Recognized in Income
|
|---|
Derivatives not accounted for as
hedging instruments
| | | | Futures
|
|---|
| Equity contracts | | | | $ | 10,034,784 | |
Total | | | | $ | 10,034,784 | |
| | | | Change in Unrealized Appreciation or (Depreciation)
on Derivatives Recognized in Income
|
|---|
Derivatives not accounted for as
hedging instruments
| | | | Futures
|
|---|
| Equity contracts | | | | $ | (238,178 | ) |
Total | | | | $ | (238,178 | ) |
See Accompanying Notes to Financial Statements
91
ING RUSSELLTM MID CAP GROWTH
INDEX PORTFOLIO |
| SUMMARY PORTFOLIO OF INVESTMENTS
AS OF DECEMBER 31, 2010 |
Shares
|
|
|
|
|
|
|
| Value
|
| Percent
of Net
Assets
|
|---|
| |
COMMON STOCK: 92.7% |
| | | | | | | Consumer Discretionary: 18.9% |
| 44,180 | | | | @ | | Bed Bath & Beyond, Inc. | | $ | 2,171,447 | | | | 0.7 | |
| 51,140 | | | | | | Coach, Inc. | | | 2,828,553 | | | | 0.8 | |
| 34,800 | | | | @ | | Discovery Communications, Inc. — Class A | | | 1,451,160 | | | | 0.4 | |
| 45,520 | | | | | | Marriott International, Inc. | | | 1,890,901 | | | | 0.6 | |
| 7,960 | | | | @ | | Priceline.com, Inc. | | | 3,180,418 | | | | 0.9 | |
| 31,820 | | | | | | Starwood Hotels & Resorts Worldwide, Inc. | | | 1,934,020 | | | | 0.6 | |
| | | | | | | Other Securities | | | 50,756,322 | | | | 14.9 | |
| | | | | | | | | | 64,212,821 | | | | 18.9 | |
| |
| | | | | | | |
| 71,820 | | | | | | Avon Products, Inc. | | | 2,087,089 | | | | 0.6 | |
| 18,480 | | | | | | Estee Lauder Cos., Inc. | | | 1,491,336 | | | | 0.5 | |
| | | | | | | Other Securities | | | 12,641,813 | | | | 3.7 | |
| | | | | | | | | | 16,220,238 | | | | 4.8 | |
| |
| | | | | | | |
| 16,900 | | | | @ | | Concho Resources, Inc. | | | 1,481,623 | | | | 0.4 | |
| 20,340 | | | | @ | | FMC Technologies, Inc. | | | 1,808,429 | | | | 0.5 | |
| | | | | | | Other Securities | | | 16,269,145 | | | | 4.8 | |
| | | | | | | | | | 19,559,197 | | | | 5.7 | |
| | | | | | | |
| 12,420 | | | | @ | | IntercontinentalExchange, Inc. | | | 1,479,843 | | | | 0.4 | |
| 83,700 | | | | | | Marsh & McLennan Cos., Inc. | | | 2,288,358 | | | | 0.7 | |
| 43,500 | | | | | | T. Rowe Price Group, Inc. | | | 2,807,490 | | | | 0.8 | |
| | | | | | | Other Securities | | | 11,972,926 | | | | 3.5 | |
| | | | | | | | | | 18,548,617 | | | | 5.4 | |
| |
| | | | | | | |
| 58,360 | | | | @ | | Agilent Technologies, Inc. | | | 2,417,855 | | | | 0.7 | |
| 47,360 | | | | | | AmerisourceBergen Corp. | | | 1,615,923 | | | | 0.5 | |
| 15,960 | | | | | | CR Bard, Inc. | | | 1,464,649 | | | | 0.4 | |
| 19,040 | | | | @ | | Edwards Lifesciences Corp. | | | 1,539,194 | | | | 0.4 | |
| 27,780 | | | | @ | | Hospira, Inc. | | | 1,547,068 | | | | 0.5 | |
| 6,580 | | | | @ | | Intuitive Surgical, Inc. | | | 1,695,995 | | | | 0.5 | |
| 17,540 | | | | @ | | Laboratory Corp. of America Holdings | | | 1,542,117 | | | | 0.5 | |
| 20,740 | | | | @ | | Varian Medical Systems, Inc. | | | 1,436,867 | | | | 0.4 | |
| | | | | | | Other Securities | | | 28,223,376 | | | | 8.3 | |
| | | | | | | | | | 41,483,044 | | | | 12.2 | |
| |
| | | | | | | |
| 27,840 | | | | | | CH Robinson Worldwide, Inc. | | | 2,232,490 | | | | 0.7 | |
| 28,100 | | | | @ | | Cooper Industries PLC | | | 1,637,949 | | | | 0.5 | |
| 33,680 | | | | | | Cummins, Inc. | | | 3,705,137 | | | | 1.1 | |
| 132,480 | | | | @ | | Delta Airlines, Inc. | | | 1,669,248 | | | | 0.5 | |
| 35,720 | | | | | | Expeditors International Washington, Inc. | | | 1,950,312 | | | | 0.6 | |
| 17,240 | | | | | | Joy Global, Inc. | | | 1,495,570 | | | | 0.4 | |
| |
COMMON STOCK: (continued) |
| | | | | | | |
| 23,960 | | | | | | Rockwell Automation, Inc. | | $ | 1,718,172 | | | | 0.5 | |
| 10,380 | | | | | | WW Grainger, Inc. | | | 1,433,582 | | | | 0.4 | |
| | | | | | | Other Securities | | | 35,514,537 | | | | 10.4 | |
| | | | | | | | | | 51,356,997 | | | | 15.1 | |
| |
| | | | | | | Information Technology: 22.0% |
| 50,560 | | | | | | Altera Corp. | | | 1,798,925 | | | | 0.5 | |
| 29,140 | | | | | | Amphenol Corp. | | | 1,538,009 | | | | 0.5 | |
| 50,000 | | | | | | Analog Devices, Inc. | | | 1,883,500 | | | | 0.6 | |
| 38,420 | | | | @ | | Autodesk, Inc. | | | 1,467,644 | | | | 0.4 | |
| 30,440 | | | | @ | | BMC Software, Inc. | | | 1,434,942 | | | | 0.4 | |
| 31,180 | | | | @ | | Citrix Systems, Inc. | | | 2,133,024 | | | | 0.6 | |
| 13,480 | | | | @ | | F5 Networks, Inc. | | | 1,754,557 | | | | 0.5 | |
| 47,020 | | | | @ | | Intuit, Inc. | | | 2,318,086 | | | | 0.7 | |
| 90,780 | | | | @ | | Marvell Technology Group Ltd. | | | 1,683,969 | | | | 0.5 | |
| 57,760 | | | | @ | | NetApp, Inc. | | | 3,174,485 | | | | 0.9 | |
| 95,920 | | | | @ | | Nvidia Corp. | | | 1,477,168 | | | | 0.4 | |
| 54,100 | | | | | | Paychex, Inc. | | | 1,672,231 | | | | 0.5 | |
| 31,645 | | | | @ | | Red Hat, Inc. | | | 1,444,594 | | | | 0.4 | |
| 19,240 | | | | @ | | Salesforce.com, Inc. | | | 2,539,680 | | | | 0.8 | |
| 38,580 | | | | @ | | Sandisk Corp. | | | 1,923,599 | | | | 0.6 | |
| 112,700 | | | | | | Western Union Co. | | | 2,092,839 | | | | 0.6 | |
| | | | | | | Other Securities | | | 44,505,781 | | | | 13.1 | |
| | | | | | | | | | 74,843,033 | | | | 22.0 | |
| |
| | | | | | | |
| 22,760 | | | | | | Cliffs Natural Resources, Inc. | | | 1,775,508 | | | | 0.5 | |
| 39,120 | | | | | | Ecolab, Inc. | | | 1,972,430 | | | | 0.6 | |
| 57,000 | | | | | | International Paper Co. | | | 1,552,680 | | | | 0.5 | |
| | | | | | | Other Securities | | | 16,716,234 | | | | 4.9 | |
| | | | | | | | | | 22,016,852 | | | | 6.5 | |
| |
| | | | | | | Telecommunication Services: 1.8% |
| 48,660 | | | | @ | | Crown Castle International Corp. | | | 2,132,768 | | | | 0.6 | |
| | | | | | | Other Securities | | | 3,854,036 | | | | 1.2 | |
| | | | | | | | | | 5,986,804 | | | | 1.8 | |
| |
| | | | | | | |
| | | | | | | Other Securities | | | 905,797 | | | | 0.3 | |
| | | | | | | Total Common Stock | | | | | | | | |
| | | | | | | (Cost $217,419,894) | | | 315,133,400 | | | | 92.7 | |
| |
REAL ESTATE INVESTMENT TRUSTS: 1.2% |
| | | | | | | |
| | | | | | | Other Securities | | | 4,176,142 | | | | 1.2 | |
| |
| | | | | | | Total Real Estate Investment Trusts | | | | | | | | |
| | | | | | | (Cost $3,555,294) | | | 4,176,142 | | | | 1.2 | |
| |
| | | | | | | Total Long-Term Investments | | | | | | | | |
| | | | | | | (Cost $220,975,188) | | | 319,309,542 | | | | 93.9 | |
See Accompanying Notes to Financial Statements
92
ING RUSSELLTM MID CAP GROWTH
INDEX PORTFOLIO |
| SUMMARY PORTFOLIO OF INVESTMENTS
AS OF DECEMBER 31, 2010 (CONTINUED) |
Shares
|
|
|
|
|
|
|
| Value
|
| Percent
of Net
Assets
|
|---|
| |
SHORT-TERM INVESTMENTS: 9.0% |
| | | | | | | |
| 21,939,000 | | | | | | Blackrock Liquidity Funds TempFund Portfolio — Class I | | $ | 21,939,000 | | | | 6.5 | |
| |
| | | | | | | Total Mutual Funds | | | | | | | | |
| | | | | | | (Cost $21,939,000) | | | 21,939,000 | | | | 6.5 | |
| |
| | | | | | | Securities Lending Collateralcc: 2.5% |
| 7,734,707 | | | | | | BNY Mellon Overnight Government Fund(1) | | | 7,734,707 | | | | 2.3 | |
| 1,077,859 | | | | R | | BNY Institutional Cash Reserves Fund, Series B(1)(2) | | | 862,287 | | | | 0.2 | |
| |
| | | | | | | Total Securities Lending Collateral | | | | | | | | |
| | | | | | | (Cost $8,812,566) | | | 8,596,994 | | | | 2.5 | |
| |
| | | | | | | Total Short-Term Investments | | | | | | | | |
| | | | | | | (Cost $30,751,566) | | | 30,535,994 | | | | 9.0 | |
| |
| | | | | | | Total Investments in Securities | | | | | | | | |
| | | | | | | (Cost $251,726,754)* | | $ | 349,845,536 | | | | 102.9 | |
| | | | | | | Other Assets and Liabilities — Net | | | (9,695,639 | ) | | | (2.9 | ) |
| | | | | | | Net Assets | | $ | 340,149,897 | | | | 100.0 | |
“Other Securities” represents issues not identified as the top 50 holdings in terms of market value and issues or issuers not exceeding 1% of net assets individually or in aggregate respectively as of December 31, 2010.
The following footnotes apply to either the individual securities noted or one or more of the securities aggregated and listed as a single line item.
| @ | | Non-income producing security |
| cc | | Securities purchased with cash collateral for securities loaned. |
| (1) | | Collateral received from brokers for securities lending was invested in these short-term investments. |
| (2) | | On September 12, 2008, BNY established a separate sleeve of the Institutional Cash Reserves Fund (Series B) to hold certain Lehman Brothers defaulted debt obligations. The Portfolio’s position in Series B is being fair valued daily. Please see the accompanying Notes to Financial Statements for additional details on securities lending. |
| * | | Cost for federal income tax purposes is $252,646,057. |
| Net unrealized appreciation consists of: | | | | | | |
| Gross Unrealized Appreciation | | | | $ | 100,187,558 | |
| Gross Unrealized Depreciation | | | | | (2,988,079 | ) |
| Net Unrealized Appreciation | | | | $ | 97,199,479 | |
Fair Value Measurementsˆ
The following is a summary of the fair valuations according to the inputs used as of December 31, 2010 in valuing the Portfolio’s assets and liabilities:
| | | | Quoted Prices
in Active Markets
for Identical Investments
(Level 1)
| | Other
Observable
Inputs
(Level 2)
| | Significant
Unobservable
Inputs
(Level 3)
| | Fair Value
at
12/31/2010
|
|---|
Asset Table | | | | | | | | | | | | | | | | | | |
Investments, at value | | | | | | | | | | | | | | | | | | |
| Common Stock* | | | | $ | 315,133,400 | | | $ | — | | | $ | — | | | $ | 315,133,400 | |
| Real Estate Investment Trusts | | | | | 4,176,142 | | | | — | | | | — | | | | 4,176,142 | |
| Short-Term Investments | | | | | 29,673,707 | | | | — | | | | 862,287 | | | | 30,535,994 | |
| Total Investments, at value | | | | $ | 348,983,249 | | | $ | — | | | $ | 862,287 | | | $ | 349,845,536 | |
Other Financial Instruments+: | | | | | | | | | | | | | | | | | | |
| Futures | | | | | 347,262 | | | | — | | | | — | | | | 347,262 | |
| Total Assets | | | | $ | 349,330,511 | | | $ | — | | | $ | 862,287 | | | $ | 350,192,798 | |
The following is a reconciliation of the fair valuations using significant unobservable inputs (Level 3) for the Portfolio’s assets and liabilities during the period ended December 31, 2010:
| | | | Beginning
Balance
12/31/2009
| | Purchases
| | Sales
| | Accrued
Discounts/
(Premiums)
| | Total
Realized
Gain/(Loss)
| | Total Unrealized
Appreciation/
(Depreciation)
| | Transfers
Into
Level 3
| | Transfers
Out of
Level 3
| | Ending
Balance
12/31/2010
|
|---|
Asset Table | | | | | | | | | | | | | | | | | | | | | | | | | | | | | | | | | | | | | | |
Investments, at value | | | | | | | | | | | | | | | | | | | | | | | | | | | | | | | | | | | | | | |
| Short-Term Investments | | | | $ | 862,287 | | | $ | — | | | $ | — | | | $ | — | | | $ | — | | | $ | — | | | $ | — | | | $ | — | | | $ | 862,287 | |
| Total Investments, at value | | | | $ | 862,287 | | | $ | — | | | $ | — | | | $ | — | | | $ | — | | | $ | — | | | $ | — | | | $ | — | | | $ | 862,287 | |
As of December 31, 2010, total change in unrealized gain (loss) on Level 3 securities still held at period end and included in the change in net assets was $0.
| ˆ | | See Note 2, “Significant Accounting Policies” in the Notes to Financial Statements for additional information. |
See Accompanying Notes to Financial Statements
93
ING RUSSELLTM MID CAP GROWTH
INDEX PORTFOLIO |
| SUMMARY PORTFOLIO OF INVESTMENTS
AS OF DECEMBER 31, 2010 (CONTINUED) |
| + | | Other Financial Instruments are derivatives not reflected in the Summary Portfolio of Investments and may include open forward foreign currency contracts, futures, swaps, and written options. Forward foreign currency contracts and futures are reported at their unrealized gain/loss at measurement date which represents the amount due to/from the Portfolio. Swaps and written options are reported at their market value at measurement date. |
Transfers in or out of Level 3 represents either the beginning value (for transfers in), or the ending value (for transfers out) of any security or derivative instrument where a change in the pricing level occurred from the beginning to the end of the period. It is the policy of the Portfolio to recognize transfers at the end of the reporting period.
| * | | For further breakdown of Common Stock by Industry type, please refer to the Portfolio of Investments. |
ING RussellTM Mid Cap Growth Index Portfolio Open Futures Contracts on December 31, 2010:
Contract Description
| | | | Number
of Contracts
| | Expiration Date
| | Notional Value
| | Unrealized
Appreciation
|
|---|
Long Contracts | | | | | | | | | | | | | | | | | | |
| S&P Mid 400 E-Mini | | | | | 257 | | | | 03/18/11 | | | $ | 23,266,210 | | | $ | 347,262 | |
| | | | | | | | | | | | | $ | 23,266,210 | | | $ | 347,262 | |
A summary of derivative instruments by primary risk exposure is outlined in the following tables.
The fair value of derivative instruments as of December 31, 2010 was as follows:
Derivatives not accounted for as
hedging instruments
| | | | Location on Statement
of Assets and Liabilities
| | Fair Value
|
|---|
Asset Derivatives | | | | | | | | | | |
| Equity contracts | | | | Net Assets — Unrealized appreciation*
| | $ | 347,262 | |
Total Asset Derivatives | | | | | | $ | 347,262 | |
| * | | Includes cumulative appreciation/depreciation of futures contracts as reported in the table following the Summary Portfolio of Investments. |
The effect of derivative instruments on the Portfolio’s Statement of Operations for the year ended December 31, 2010 was as follows:
| | | | Amount of Realized Gain or (Loss) on Derivatives Recognized in Income
|
|---|
Derivatives not accounted for as
hedging instruments
| | | | Futures
|
|---|
| Equity contracts | | | | $ | 1,598,492 | |
Total | | | | $ | 1,598,492 | |
| | | | Change in Unrealized Appreciation or (Depreciation)
on Derivatives Recognized in Income
|
|---|
Derivatives not accounted for as
hedging instruments
| | | | Futures
|
|---|
| Equity contracts | | | | $ | 392,315 | |
Total | | | | $ | 392,315 | |
See Accompanying Notes to Financial Statements
94
ING RUSSELLTM SMALL CAP
INDEX PORTFOLIO |
| SUMMARY PORTFOLIO OF INVESTMENTS
AS OF DECEMBER 31, 2010 |
Shares
|
|
|
|
|
|
|
| Value
|
| Percent
of Net
Assets
|
|---|
| |
COMMON STOCK: 91.7% |
| | | | | | | Consumer Discretionary: 13.7% |
| 98,410 | | | | @ | | Dana Holding Corp. | | $ | 1,693,636 | | | | 0.2 | |
| 27,600 | | | | @ | | Deckers Outdoor Corp. | | | 2,200,824 | | | | 0.3 | |
| 21,700 | | | | | | Polaris Industries, Inc. | | | 1,693,034 | | | | 0.2 | |
| 48,840 | | | | | | Rent-A-Center, Inc. | | | 1,576,555 | | | | 0.2 | |
| 47,280 | | | | | | Sotheby’s | | | 2,127,600 | | | | 0.3 | |
| 42,460 | | | | @ | | Tenneco, Inc. | | | 1,747,654 | | | | 0.2 | |
| 30,680 | | | | @ | | Warnaco Group, Inc. | | | 1,689,548 | | | | 0.2 | |
| | | | | | | Other Securities | | | 92,644,401 | | | | 12.1 | |
| | | | | | | | | | 105,373,252 | | | | 13.7 | |
| |
| | | | | | | |
| | | | | | | Other Securities | | | 23,275,820 | | | | 3.0 | |
| |
| | | | | | | |
| 36,870 | | | | | | Berry Petroleum Co. | | | 1,611,219 | | | | 0.2 | |
| 83,380 | | | | @ | | Brigham Exploration Co. | | | 2,271,271 | | | | 0.3 | |
| 61,540 | | | | @ | | Complete Production Services, Inc. | | | 1,818,507 | | | | 0.2 | |
| 23,520 | | | | @ | | Dril-Quip, Inc. | | | 1,827,974 | | | | 0.3 | |
| 42,840 | | | | | | World Fuel Services Corp. | | | 1,549,094 | | | | 0.2 | |
| | | | | | | Other Securities | | | 37,995,763 | | | | 4.9 | |
| | | | | | | | | | 47,073,828 | | | | 6.1 | |
| |
| | | | | | | |
| 235,390 | | | | @ | | American Capital Ltd. | | | 1,779,548 | | | | 0.2 | |
| 76,114 | | | | | | FirstMerit Corp. | | | 1,506,296 | | | | 0.2 | |
| 29,160 | | | | @ | | SVB Financial Group | | | 1,546,938 | | | | 0.2 | |
| | | | | | | Other Securities | | | 96,612,896 | | | | 12.6 | |
| | | | | | | | | | 101,445,678 | | | | 13.2 | |
| |
| | | | | | | |
| 37,250 | | | | @ | | AMERIGROUP Corp. | | | 1,636,020 | | | | 0.2 | |
| 43,910 | | | | @, L | | Onyx Pharmaceuticals, Inc. | | | 1,618,962 | | | | 0.2 | |
| 39,030 | | | | @ | | Salix Pharmaceuticals Ltd. | | | 1,832,849 | | | | 0.2 | |
| | | | | | | Other Securities | | | 86,568,514 | | | | 11.3 | |
| | | | | | | | | | 91,656,345 | | | | 11.9 | |
| |
| | | | | | | |
| 31,450 | | | | | | Acuity Brands, Inc. | | | 1,813,722 | | | | 0.2 | |
| 32,240 | | | | | | Baldor Electric Co. | | | 2,032,410 | | | | 0.3 | |
| 36,230 | | | | | | Clarcor, Inc. | | | 1,553,905 | | | | 0.2 | |
| 83,210 | | | | @ | | GrafTech International Ltd. | | | 1,650,886 | | | | 0.2 | |
| 23,760 | | | | | | Nordson Corp. | | | 2,183,069 | | | | 0.3 | |
| 44,680 | | | | | | Woodward Governor Co. | | | 1,678,181 | | | | 0.2 | |
| | | | | | | Other Securities | | | 111,277,690 | | | | 14.5 | |
| | | | | | | | | | 122,189,863 | | | | 15.9 | |
| |
| | | | | | | Information Technology: 18.2% |
| 31,550 | | | | @ | | Acme Packet, Inc. | | | 1,677,198 | | | | 0.2 | |
| 43,240 | | | | | | Adtran, Inc. | | | 1,565,720 | | | | 0.2 | |
| 64,990 | | | | @ | | Ariba, Inc. | | | 1,526,615 | | | | 0.2 | |
| 51,800 | | | | @ | | Finisar Corp. | | | 1,537,942 | | | | 0.2 | |
| 60,930 | | | | | | Jack Henry & Associates, Inc. | | | 1,776,110 | | | | 0.2 | |
| |
COMMON STOCK: (continued) |
| | | | | | | Information Technology: (continued) |
| 82,910 | | | | @ | | Parametric Technology Corp. | | $ | 1,867,962 | | | | 0.3 | |
| 73,210 | | | | @ | | Rackspace Hosting, Inc. | | | 2,299,526 | | | | 0.3 | |
| 90,460 | | | | @ | | Riverbed Technology, Inc. | | | 3,181,478 | | | | 0.4 | |
| 119,800 | | | | @ | | TIBCO Software, Inc. | | | 2,361,181 | | | | 0.3 | |
| 61,430 | | | | @ | | Verifone Holdings, Inc. | | | 2,368,741 | | | | 0.3 | |
| | | | | | | Other Securities | | | 119,589,944 | | | | 15.6 | |
| | | | | | | | | | 139,752,417 | | | | 18.2 | |
| |
| | | | | | | |
| 58,180 | | | | @ | | Coeur d’Alene Mines Corp. | | | 1,589,478 | | | | 0.2 | |
| 165,000 | | | | @, L | | Hecla Mining Co. | | | 1,857,900 | | | | 0.2 | |
| 27,790 | | | | | | Rock-Tenn Co. | | | 1,499,271 | | | | 0.2 | |
| 84,360 | | | | @ | | Solutia, Inc. | | | 1,947,029 | | | | 0.3 | |
| 107,800 | | | | @ | | Thompson Creek Metals Co., Inc. | | | 1,586,816 | | | | 0.2 | |
| 50,360 | | | | @ | | WR Grace & Co. | | | 1,769,147 | | | | 0.2 | |
| | | | | | | Other Securities | | | 33,138,518 | | | | 4.3 | |
| | | | | | | | | | 43,388,159 | | | | 5.6 | |
| |
| | | | | | | Telecommunication Services: 1.0% |
| 51,630 | | | | @ | | Syniverse Holdings, Inc. | | | 1,592,786 | | | | 0.2 | |
| | | | | | | Other Securities | | | 6,153,086 | | | | 0.8 | |
| | | | | | | | | | 7,745,872 | | | | 1.0 | |
| |
| | | | | | | |
| 31,900 | | | | | | Nicor, Inc. | | | 1,592,448 | | | | 0.2 | |
| | | | | | | Other Securities | | | 22,513,824 | | | | 2.9 | |
| | | | | | | | | | 24,106,272 | | | | 3.1 | |
| |
| | | | | | | Total Common Stock | | | | | | | | |
| | | | | | | (Cost $535,310,982) | | | 706,007,506 | | | | 91.7 | |
| |
REAL ESTATE INVESTMENT TRUSTS: 6.9% |
| | | | | | | |
| 92,490 | | | | | | BioMed Realty Trust, Inc. | | | 1,724,939 | | | | 0.3 | |
| 96,870 | | | | | | CBL & Associates Properties, Inc. | | | 1,695,225 | | | | 0.2 | |
| 33,210 | | | | | | Entertainment Properties Trust | | | 1,535,963 | | | | 0.2 | |
| 49,600 | | | | | | Highwoods Properties, Inc. | | | 1,579,760 | | | | 0.2 | |
| 27,350 | | | | | | Home Properties, Inc. | | | 1,517,652 | | | | 0.2 | |
| 208,420 | | | | | | MFA Mortgage Investments, Inc. | | | 1,700,707 | | | | 0.2 | |
| 57,220 | | | | L | | National Retail Properties, Inc. | | | 1,516,330 | | | | 0.2 | |
| | | | | | | Other Securities | | | 41,563,339 | | | | 5.4 | |
| |
| | | | | | | Total Real Estate Investment Trusts | | | | | | | | |
| | | | | | | (Cost $43,011,174) | | | 52,833,915 | | | | 6.9 | |
| |
MUTUAL FUNDS: 0.0% |
| | | | | | | |
| | | | | | | Other Securities | | | 159,749 | | | | 0.0 | |
| |
| | | | | | | Total Mutual Funds | | | | | | | | |
| | | | | | | (Cost $125,680) | | | 159,749 | | | | 0.0 | |
See Accompanying Notes to Financial Statements
95
ING RUSSELLTM SMALL CAP
INDEX PORTFOLIO |
| SUMMARY PORTFOLIO OF INVESTMENTS
AS OF DECEMBER 31, 2010 (CONTINUED) |
Principal
Amount
|
|
|
|
|
|
|
| Value
|
| Percent
of Net
Assets
|
|---|
| |
CORPORATE BONDS/NOTES: 0.0% |
| | | | | | | |
| | | | | | | Other Securities | | $ | — | | | | 0.0 | |
| |
| | | | | | | Total Corporate Bonds/Notes | | | | | | | | |
| | | | | | | (Cost $15,168) | | | — | | | | 0.0 | |
| |
| | | | | | | Total Long-Term Investments | | | | | | | | |
| | | | | | | (Cost $578,463,004) | | | 759,001,170 | | | | 98.6 | |
Shares
|
|
|
|
|
|
|
| Value
|
| Percent
of Net
Assets
|
|---|
| |
SHORT-TERM INVESTMENTS: 6.8% |
| | | | | | | |
| 11,520,000 | | | | | | Blackrock Liquidity Funds TempFund Portfolio — Class I | | | 11,520,000 | | | | 1.5 | |
| |
| | | | | | | Total Mutual Funds | | | | | | | | |
| | | | | | | (Cost $11,520,000) | | | 11,520,000 | | | | 1.5 | |
| |
| | | | | | | Securities Lending Collateralcc: 5.3% |
| 39,933,147 | | | | | | BNY Mellon Overnight Government Fund(1) | | | 39,933,147 | | | | 5.2 | |
| 502,326 | | | | R | | BNY Institutional Cash Reserves Fund, Series B(1)(2) | | | 401,860 | | | | 0.1 | |
| |
SHORT-TERM INVESTMENTS: (continued) |
| | | | | | | Securities Lending Collateralcc: (continued) |
| |
| | | | | | | Total Securities Lending Collateral | | | | | | | | |
| | | | | | | (Cost $40,435,473) | | $ | 40,335,007 | | | | 5.3 | |
| |
| | | | | | | Total Short-Term Investments | | | | | | | | |
| | | | | | | (Cost $51,955,473) | | | 51,855,007 | | | | 6.8 | |
| |
| | | | | | | Total Investments in Securities | | | | | | | | |
| | | | | | | (Cost $630,418,477)* | | $ | 810,856,177 | | | | 105.4 | |
| | | | | | | Other Assets and Liabilities — Net | | | (41,240,683 | ) | | | (5.4 | ) |
| | | | | | | Net Assets | | $ | 769,615,494 | | | | 100.0 | |
“Other Securities” represents issues not identified as the top 50 holdings in terms of market value and issues or issuers not exceeding 1% of net assets individually or in aggregate respectively as of December 31, 2010.
The following footnotes apply to either the individual securities noted or one or more of the securities aggregated and listed as a single line item.
| @ | | Non-income producing security |
| cc | | Securities purchased with cash collateral for securities loaned. |
| (1) | | Collateral received from brokers for securities lending was invested in these short-term investments. |
| (2) | | On September 12, 2008, BNY established a separate sleeve of the Institutional Cash Reserves Fund (Series B) to hold certain Lehman Brothers defaulted debt obligations. The Portfolio’s position in Series B is being fair valued daily. Please see the accompanying Notes to Financial Statements for additional details on securities lending. |
| L | | Loaned security, a portion or all of the security is on loan at December 31, 2010. |
| * | | Cost for federal income tax purposes is $632,383,433. |
| Net unrealized appreciation consists of: | | | | | | |
| Gross Unrealized Appreciation | | | | $ | 202,455,730 | |
| Gross Unrealized Depreciation | | | | | (23,982,986 | ) |
| Net Unrealized Appreciation | | | | $ | 178,472,744 | |
See Accompanying Notes to Financial Statements
96
ING RUSSELLTM SMALL CAP
INDEX PORTFOLIO |
| SUMMARY PORTFOLIO OF INVESTMENTS
AS OF DECEMBER 31, 2010 (CONTINUED) |
Fair Value Measurementsˆ
The following is a summary of the fair valuations according to the inputs used as of December 31, 2010 in valuing the Portfolio’s assets and liabilities:
| | | | Quoted Prices
in Active Markets
for Identical Investments
(Level 1)
| | Other
Observable
Inputs
(Level 2)
| | Significant
Unobservable
Inputs
(Level 3)
| | Fair Value
at
12/31/2010
|
|---|
Asset Table | | | | | | | | | | | | | | | | | | |
Investments, at value | | | | | | | | | | | | | | | | | | |
| Common Stock | | | | | | | | | | | | | | | | | | |
| Consumer Discretionary | | | | $ | 105,362,952 | | | $ | — | | | $ | 10,300 | | | $ | 105,373,252 | |
| Consumer Staples | | | | | 23,275,820 | | | | — | | | | — | | | | 23,275,820 | |
| Energy | | | | | 47,073,828 | | | | — | | | | — | | | | 47,073,828 | |
| Financials | | | | | 101,445,678 | | | | — | | | | — | | | | 101,445,678 | |
| Health Care | | | | | 91,656,345 | | | | — | | | | — | | | | 91,656,345 | |
| Industrials | | | | | 122,189,863 | | | | — | | | | — | | | | 122,189,863 | |
| Information Technology | | | | | 139,752,417 | | | | — | | | | — | | | | 139,752,417 | |
| Materials | | | | | 43,388,159 | | | | — | | | | — | | | | 43,388,159 | |
| Telecommunication Services | | | | | 7,745,872 | | | | — | | | | — | | | | 7,745,872 | |
| Utilities | | | | | 24,106,272 | | | | — | | | | — | | | | 24,106,272 | |
| Total Common Stock | | | | | 705,997,206 | | | | — | | | | 10,300 | | | | 706,007,506 | |
| Real Estate Investment Trusts | | | | | 52,833,915 | | | | — | | | | — | | | | 52,833,915 | |
| Mutual Funds | | | | | 159,749 | | | | — | | | | — | | | | 159,749 | |
| Short-Term Investments | | | | | 51,453,147 | | | | — | | | | 401,860 | | | | 51,855,007 | |
| Total Investments, at value | | | | $ | 810,444,017 | | | $ | — | | | $ | 412,160 | | | $ | 810,856,177 | |
Other Financial Instruments+: | | | | | | | | | | | | | | | | | | |
| Futures | | | | | 327,446 | | | | — | | | | — | | | | 327,446 | |
| Total Assets | | | | $ | 810,771,463 | | | $ | — | | | $ | 412,160 | | | $ | 811,183,623 | |
The following is a reconciliation of the fair valuations using significant unobservable inputs (Level 3) for the Portfolio’s assets and liabilities during the period ended December 31, 2010:
| | | | Beginning
Balance
12/31/2009
| | Purchases
| | Sales
| | Accrued
Discounts/
(Premiums)
| | Total
Realized
Gain/(Loss)
| | Total Unrealized
Appreciation/
(Depreciation)
| | Transfers
Into
Level 3
| | Transfers
Out of
Level 3
| | Ending
Balance
12/31/2010
|
|---|
Asset Table | | | | | | | | | | | | | | | | | | | | | | | | | | | | | | | | | | | | | | |
Investments, at value | | | | | | | | | | | | | | | | | | | | | | | | | | | | | | | | | | | | | | |
| Common Stock | | | | $ | — | | | $ | — | | | $ | — | | | $ | — | | | $ | — | | | $ | — | | | $ | 10,300 | | | $ | — | | | $ | 10,300 | |
| Short-Term Investments | | | | | 401,860 | | | | — | | | | — | | | | — | | | | — | | | | — | | | | — | | | | — | | | | 401,860 | |
| Total Investments, at value | | | | $ | 401,860 | | | $ | — | | | $ | — | | | $ | — | | | $ | — | | | $ | — | | | $ | 10,300 | | | $ | — | | | $ | 412,160 | |
As of December 31, 2010, total change in unrealized gain (loss) on Level 3 securities still held at period end and included in the change in net assets was $0.
| ˆ | | See Note 2, “Significant Accounting Policies” in the Notes to Financial Statements for additional information. |
| + | | Other Financial Instruments are derivatives not reflected in the Summary Portfolio of Investments and may include open forward foreign currency contracts, futures, swaps, and written options. |
Forward foreign currency contracts and futures are reported at their unrealized gain/loss at measurement date which represents the amount due to/from the Portfolio. Swaps and written options are reported at their market value at measurement date.
Transfers in or out of Level 3 represents either the beginning value (for transfers in), or the ending value (for transfers out) of any security or derivative instrument where a change in the pricing level occurred from the beginning to the end of the period. It is the policy of the Portfolio to recognize transfers at the end of the reporting period.
ING RussellTM Small Cap Index Portfolio Open Futures Contracts on December 31, 2010:
Contract Description
| | | | Number
of Contracts
| | Expiration Date
| | Notional Value
| | Unrealized
Appreciation
|
|---|
Long Contracts | | | | | | | | | | | | | | | | | | |
| Russell 2000® Mini Index | | | | | 164 | | | | 03/18/11 | | | $ | 12,829,720 | | | $ | 327,446 | |
| | | | | | | | | | | | | $ | 12,829,720 | | | $ | 327,446 | |
See Accompanying Notes to Financial Statements
97
ING RUSSELLTM SMALL CAP
INDEX PORTFOLIO |
| SUMMARY PORTFOLIO OF INVESTMENTS
AS OF DECEMBER 31, 2010 (CONTINUED) |
A summary of derivative instruments by primary risk exposure is outlined in the following tables.
The fair value of derivative instruments as of December 31, 2010 was as follows:
Derivatives not accounted for as
hedging instruments
| | | | Location on Statement
of Assets and Liabilities
| | Fair Value
|
|---|
Asset Derivatives
| | | | | | | | | | |
| Equity contracts | | | | Net Assets — Unrealized appreciation*
| | $ | 327,446 | |
Total Asset Derivatives | | | | | | $ | 327,446 | |
| * | | Includes cumulative appreciation/depreciation of futures contracts as reported in the table following the Summary Portfolio of Investments. |
The effect of derivative instruments on the Portfolio’s Statement of Operations for the year ended December 31, 2010 was as follows:
| | | | Amount of Realized Gain or (Loss) on Derivatives Recognized in Income
|
|---|
Derivatives not accounted for as
hedging instruments
| | | | Futures
|
|---|
| Equity contracts | | | | $ | 3,979,692 | |
Total | | | | $ | 3,979,692 | |
| | | | Change in Unrealized Appreciation or (Depreciation)
on Derivatives Recognized in Income
|
|---|
Derivatives not accounted for as
hedging instruments
| | | | Futures
|
|---|
| Equity contracts | | | | $ | (1,274,716 | ) |
Total | | | | $ | (1,274,716 | ) |
See Accompanying Notes to Financial Statements
98
ING U.S. BOND INDEX PORTFOLIO |
| SUMMARY PORTFOLIO OF INVESTMENTS
AS OF DECEMBER 31, 2010 |
Principal
Amount
|
|
|
|
|
|
|
| Value
|
| Percent
of Net Assets
|
|---|
| |
CORPORATE BONDS/NOTES: 23.4% |
| | | | | | | Consumer Discretionary: 2.2% |
| $ 10,585,000 | | | | | | Comcast Corp., 6.300%–6.500%, due 11/15/17–11/15/35 | | $ | 11,840,685 | | | | 0.3 | |
| 9,000,000 | | | | # | | NBC Universal, Inc., 3.650%, due 04/30/15 | | | 9,240,435 | | | | 0.2 | |
| 12,805,000 | | | | | | Time Warner Cable, Inc., 5.850%–6.550%, due 05/01/17–05/01/37 | | | 14,133,075 | | | | 0.4 | |
| 9,520,000 | | | | | | Time Warner, Inc., 4.875%–6.500%, due 11/15/16–11/15/36 | | | 10,251,149 | | | | 0.3 | |
| | | | | | | Other Securities | | | 41,438,384 | | | | 1.0 | |
| | | | | | | | | | 86,903,728 | | | | 2.2 | |
| | | | | | | | | | | | | | | |
| | | | | | | |
| 5,600,000 | | | | # | | Anheuser-Busch InBev Worldwide, Inc., 7.200%, due 01/15/14 | | | 6,408,550 | | | | 0.2 | |
| 575,000 | | | | | | Anheuser-Busch InBev Worldwide, Inc., 5.375%, due 01/15/20 | | | 624,185 | | | | | |
| 4,815,000 | | | | # | | Erac USA Finance Co., 7.000%, due 10/15/37 | | | 5,201,192 | | | | 0.1 | |
| 12,725,000 | | | | | | Kraft Foods, Inc., 6.125%–6.500%, due 02/01/18–02/09/40 | | | 14,412,788 | | | | 0.4 | |
| 10,000,000 | | | | # | | Woolworths Ltd., 2.550%, due 09/22/15 | | | 9,887,480 | | | | 0.3 | |
| | | | | | | Other Securities | | | 35,946,172 | | | | 0.9 | |
| | | | | | | | | | 72,480,367 | | | | 1.9 | |
| | | | | | | | | | | | | | | |
| | | | | | | |
| 8,000,000 | | | | | | Williams Partners L.P., 3.800%, due 02/15/15 | | | 8,275,072 | | | | 0.2 | |
| | | | | | | Other Securities | | | 43,858,621 | | | | 1.1 | |
| | | | | | | | | | 52,133,693 | | | | 1.3 | |
| | | | | | | | | | | | | | | |
| | | | | | | |
| 8,455,000 | | | | # | | Abbey National Treasury Services PLC/London, 3.875%, due 11/10/14 | | | 8,385,787 | | | | 0.2 | |
| 8,425,000 | | | | | | American Express Co., 7.000%, due 03/19/18 | | | 9,827,400 | | | | 0.2 | |
| 18,630,000 | | | | | | Bank of America Corp., 5.650%–6.500%, due 08/01/16–05/01/18 | | | 19,929,630 | | | | 0.5 | |
| 7,050,000 | | | | # | | Bank of Tokyo-Mitsubishi UFJ Ltd., 1.600%, due 09/11/13 | | | 7,027,849 | | | | 0.2 | |
| 3,750,000 | | | | # | | BG Energy Capital PLC, 4.000%, due 12/09/20 | | | 3,690,128 | | | | 0.1 | |
| 35,465,000 | | | | | | Citigroup, Inc., 2.125%–8.125%, due 04/30/12–07/15/39 | | | 37,074,436 | | | | 0.9 | |
| 21,450,000 | | | | L | | European Investment Bank, 1.750%–2.375%, due 09/14/12–03/14/14 | | | 21,949,409 | | | | 0.6 | |
| 24,500,000 | | | | | | General Electric Capital Corp., 5.250%–6.750%, due 10/19/12–01/14/38 | | | 26,691,927 | | | | 0.7 | |
| |
CORPORATE BONDS/NOTES: (continued) |
| | | | | | | |
| $ 19,195,000 | | | | | | Goldman Sachs Group, Inc., 3.250%, due 06/15/12 | | $ | 19,933,297 | | | | 1.3 | |
| 27,790,000 | | | | | | Goldman Sachs Group, Inc., 4.750%–6.750%, due 07/15/13–10/01/37 | | | 29,823,506 | | | | | |
| 2,300,000 | | | | # | | Harley-Davidson Funding Corp., 6.800%, due 06/15/18 | | | 2,426,275 | | | | 0.1 | |
| 5,017,000 | | | | # | | HSBC Finance Corp., 6.676%, due 01/15/21 | | | 5,077,776 | | | | 0.1 | |
| 8,225,000 | | | | #, L | | Hyundai Capital America, 3.750%, due 04/06/16 | | | 8,087,511 | | | | 0.2 | |
| 25,795,000 | | | | | | JPMorgan Chase & Co., 2.125%–5.500%, due 10/01/12–10/15/40 | | | 27,161,744 | | | | 0.7 | |
| 17,585,000 | | | | | | Kreditanstalt fuer Wiederaufbau, 2.000%, due 01/17/12 | | | 17,845,715 | | | | 0.5 | |
| 10,075,000 | | | | | | Merrill Lynch & Co., Inc., 5.450%–6.220%, due 02/05/13–09/15/26 | | | 9,937,428 | | | | 0.2 | |
| 6,995,000 | | | | | | Metlife, Inc., 6.750%, due 06/01/16 | | | 8,123,287 | | | | 0.2 | |
| 21,150,000 | | | | | | Morgan Stanley, 5.375%–6.625%, due 10/15/15–04/01/18 | | | 22,639,611 | | | | 0.6 | |
| 7,095,000 | | | | | | PNC Funding Corp., 3.625%, due 02/08/15 | | | 7,342,857 | | | | 0.2 | |
| 7,695,000 | | | | | | Prudential Financial, Inc., 3.875%–6.200%, due 01/14/15–11/15/40 | | | 8,056,011 | | | | 0.2 | |
| 7,100,000 | | | | | | Simon Property Group LP, 5.250%, due 12/01/16 | | | 7,669,328 | | | | 0.2 | |
| 11,275,000 | | | | # | | WEA Finance, LLC / WT Finance Aust Pty Ltd., 7.500%, due 06/02/14 | | | 12,806,416 | | | | 0.3 | |
| 21,860,000 | | | | L | | Wells Fargo & Co., 3.625%–4.375%, due 01/31/13–04/15/15 | | | 22,835,643 | | | | 0.6 | |
| | | | | | | Other Securities | | | 66,570,257 | | | | 1.7 | |
| | | | | | | | | | 410,913,228 | | | | 10.5 | |
| | | | | | | | | | | | | | | |
| | | | | | | |
| 10,550,000 | | | | | | CareFusion Corp., 4.125%, due 08/01/12 | | | 10,995,949 | | | | 0.3 | |
| | | | | | | Other Securities | | | 29,585,475 | | | | 0.7 | |
| | | | | | | | | | 40,581,424 | | | | 1.0 | |
| | | | | | | | | | | | | | | |
| | | | | | | |
| 7,253,913 | | | | | | Continental Airlines, Inc., 7.250%, due 11/10/19 | | | 8,088,113 | | | | 0.2 | |
| | | | | | | Other Securities | | | 48,770,710 | | | | 1.3 | |
| | | | | | | | | | 56,858,823 | | | | 1.5 | |
| | | | | | | | | | | | | | | |
| | | | | | | Information Technology: 0.5% |
| 10,820,000 | | | | | | Xerox Corp., 5.500%–6.750%, due 05/15/12–12/15/39 | | | 11,433,760 | | | | 0.3 | |
See Accompanying Notes to Financial Statements
99
ING U.S. BOND INDEX PORTFOLIO |
| SUMMARY PORTFOLIO OF INVESTMENTS
AS OF DECEMBER 31, 2010 (CONTINUED) |
Principal
Amount
|
|
|
|
|
|
|
| Value
|
| Percent
of Net Assets
|
|---|
| |
CORPORATE BONDS/NOTES: (continued) |
| | | | | | | Information Technology: (continued) |
| | | | | | | Other Securities | | $ | 10,081,384 | | | | 0.2 | |
| | | | | | | | | | 21,515,144 | | | | 0.5 | |
| | | | | | | | | | | | | | | |
| | | | | | | |
| $ 11,115,000 | | | | | | ArcelorMittal, 5.250%–6.125%, due 06/01/18–08/05/20 | | | 11,563,298 | | | | 0.3 | |
| 7,355,000 | | | | | | Dow Chemical Co., 8.550%, due 05/15/19 | | | 9,232,070 | | | | 0.2 | |
| 7,190,000 | | | | | | Rio Tinto Finance USA Ltd., 6.500%, due 07/15/18 | | | 8,395,173 | | | | 0.2 | |
| | | | | | | Other Securities | | | 14,766,309 | | | | 0.4 | |
| | | | | | | | | | 43,956,850 | | | | 1.1 | |
| | | | | | | | | | | | | | | |
| | | | | | | Telecommunication Services: 1.8% |
| 14,070,000 | | | | | | AT&T, Inc., 2.500%–6.500%, due 08/15/15–09/01/37 | | | 14,548,205 | | | | 0.4 | |
| 7,095,000 | | | | | | Deutsche Telekom International Finance BV, 5.750%, due 03/23/16 | | | 7,955,347 | | | | 0.2 | |
| 6,775,000 | | | | | | France Telecom S.A., 4.375%, due 07/08/14 | | | 7,244,806 | | | | 0.2 | |
| 12,665,000 | | | | | | Verizon Communications, Inc., 6.350%–7.750%, due 04/01/19–12/01/30 | | | 14,899,903 | | | | 0.4 | |
| | | | | | | Other Securities | | | 24,514,439 | | | | 0.6 | |
| | | | | | | | | | 69,162,700 | | | | 1.8 | |
| | | | | | | | | | | | | | | |
| | | | | | | |
| 5,005,000 | | | | # | | Kentucky Utilities Co., 5.125%, due 11/01/40 | | | 4,928,659 | | | | 0.2 | |
| 8,485,000 | | | | | | Public Service Co. of Colorado, 3.200%, due 11/15/20 | | | 8,017,027 | | | | 0.2 | |
| 12,575,000 | | | | | | Southern Co., 2.375%, due 09/15/15 | | | 12,392,424 | | | | 0.3 | |
| | | | | | | Other Securities | | | 36,159,247 | | | | 0.9 | |
| | | | | | | | | | 61,497,357 | | | | 1.6 | |
| | | | | | | Total Corporate Bonds/Notes
(Cost $887,908,422) | | | 916,003,314 | | | | 23.4 | |
| |
U.S. GOVERNMENT AGENCY OBLIGATIONS: 39.0% |
| | | | | | | Federal Home Loan Bank: 0.1% |
| | | | | | | Other Securities | | | 5,894,024 | | | | 0.1 | |
| | | | | | | | | |
| | | | | | | Federal Home Loan Mortgage Corporation##: 10.9% |
| 34,085,000 | | | | | | 0.625%, due 12/28/12 | | | 34,039,667 | | | | | |
| 25,660,000 | | | | | | 1.625%, due 04/15/13 | | | 26,124,420 | | | | | |
| 32,040,000 | | | | W | | 4.000%, due 08/15/40 | | | 31,814,727 | | | | | |
| 36,245,000 | | | | W | | 4.500%, due 02/15/40 | | | 37,151,125 | | | | | |
| 48,072,991 | | | | | | 4.500%, due 04/01/23–08/01/40 | | | 49,325,142 | | | | | |
| 24,260,000 | | | | W | | 5.000%, due 01/15/39 | | | 25,446,460 | | | | | |
| 54,216,120 | | | | | | 5.000%, due 03/01/34–08/01/40 | | | 57,128,070 | | | | | |
| 64,522,889 | | | | | | 5.500%, due 09/01/34–05/01/40 | | | 69,045,143 | | | | | |
| |
U.S. GOVERNMENT AGENCY OBLIGATIONS: (continued) |
| | | | | | | Federal Home Loan Mortgage Corporation##: (continued) |
| $32,518,815 | | | | | | 6.000%, due 04/01/28–05/01/40 | | $ | 35,281,810 | | | | | |
| 55,264,604 | | | | W, L | | 1.400%–6.750%, due 07/26/13–01/15/39 | | | 59,644,596 | | | | | |
| | | | | | | | | | 425,001,160 | | | | 10.9 | |
| |
| | | | | | | Federal National Mortgage Association##: 24.3% |
| 24,935,000 | | | | | | 1.000%, due 09/23/13 | | | 24,913,955 | | | | | |
| 32,205,000 | | | | | | 2.750%, due 03/13/14 | | | 33,686,849 | | | | | |
| 81,265,000 | | | | W | | 4.000%, due 01/25/24–08/25/40 | | | 81,599,588 | | | | | |
| 28,051,182 | | | | | | 4.000%, due 07/01/13–12/01/25 | | | 28,965,739 | | | | | |
| 59,330,000 | | | | W | | 4.500%, due 01/25/24–01/25/39 | | | 60,965,332 | | | | | |
| 130,561,882 | | | | | | 4.500%, due 01/01/14–10/01/40 | | | 135,092,070 | | | | | |
| 53,350,000 | | | | W | | 5.000%, due 01/25/24–01/13/40 | | | 56,115,859 | | | | | |
| 124,890,998 | | | | | | 5.000%, due 02/01/14–07/01/40 | | | 131,985,389 | | | | | |
| 18,480,000 | | | | | | 5.375%, due 06/12/17 | | | 21,306,941 | | | | | |
| 56,800,000 | | | | W | | 5.500%, due 01/25/24–01/25/39 | | | 60,993,944 | | | | | |
| 98,763,705 | | | | | | 5.500%, due 04/01/11–07/01/40 | | | 106,020,004 | | | | | |
| 64,454,317 | | | | | | 6.000%, due 06/01/11–11/01/39 | | | 70,203,309 | | | | | |
| 27,219,931 | | | | | | 6.500%, due 04/01/30–09/01/39 | | | 30,297,536 | | | | | |
| 104,740,000 | | | | W, L | | 0.375%–7.125%, due 12/28/12–01/15/33 | | | 108,884,176 | | | | | |
| | | | | | | | | | 951,030,691 | | | | 24.3 | |
| | | | | | | | | | | | | | | |
| | | | | | | Government National Mortgage Association: 3.7% |
| 18,245,000 | | | | W | | 4.000%, due 01/15/40 | | | 18,373,281 | | | | | |
| 45,610,000 | | | | | | 4.500%, due 01/20/40 | | | 47,363,157 | | | | | |
| 23,418,153 | | | | | | 5.000%, due 10/15/37–05/15/40 | | | 24,917,186 | | | | | |
| 25,077,608 | | | | | | 5.500%, due 09/15/33–11/20/39 | | | 26,965,914 | | | | | |
| 24,102,811 | | | | W | | 5.500%–7.000%, due 10/15/36–01/15/39 | | | 26,372,573 | | | | | |
| | | | | | | | | | 143,992,111 | | | | 3.7 | |
| | | | | | | | | | | | | | | |
| | | | | | | Other U.S. Agency Obligations: 0.0% |
| | | | | | | Other Securities | | | 97,619 | | | | 0.0 | |
| |
| | | | | | | Total U.S. Government Agency Obligations | | | | | | | | |
| | | | | | | (Cost $1,510,665,237) | | | 1,526,015,605 | | | | 39.0 | |
| |
U.S. TREASURY OBLIGATIONS: 32.6% |
| | | | | | | U.S. Treasury Notes: 32.6% |
| 89,000,000 | | | | | | 0.500%, due 10/15/13 | | | 88,019,665 | | | | | |
| 63,145,000 | | | | | | 1.125%, due 01/15/12 | | | 63,660,516 | | | | | |
| 276,460,000 | | | | | | 1.375%, due 05/15/12–03/15/13 | | | 280,424,689 | | | | | |
| 112,875,000 | | | | | | 1.875%, due 04/30/14 | | | 115,458,822 | | | | | |
| 220,455,000 | | | | | | 2.375%, due 08/31/14–07/31/17 | | | 225,360,189 | | | | | |
See Accompanying Notes to Financial Statements
100
ING U.S. BOND INDEX PORTFOLIO |
| SUMMARY PORTFOLIO OF INVESTMENTS
AS OF DECEMBER 31, 2010 (CONTINUED) |
Principal
Amount
|
|
|
|
|
|
|
| Value
|
| Percent
of Net Assets
|
|---|
| |
U.S. TREASURY OBLIGATIONS: (continued) |
| | | | | | | U.S. Treasury Notes: (continued) |
| $40,720,000 | | | | | | 2.500%, due 03/31/15 | | $ | 42,154,810 | | | | | |
| 25,290,000 | | | | | | 2.625%, due 02/29/16–11/15/20 | | | 25,338,484 | | | | | |
| 50,745,000 | | | | | | 2.750%, due 02/15/19 | | | 50,098,813 | | | | | |
| 59,200,000 | | | | | | 3.125%, due 04/30/17–05/15/19 | | | 60,854,646 | | | | | |
| 40,930,000 | | | | | | 3.375%, due 11/15/19 | | | 41,790,185 | | | | | |
| 115,035,000 | | | | | | 3.500%, due 02/15/18–02/15/39 | | | 104,989,815 | | | | | |
| 39,370,000 | | | | | | 3.750%, due 11/15/18 | | | 41,882,908 | | | | | |
| 29,745,000 | | | | | | 4.375%, due 02/15/38 | | | 30,065,681 | | | | | |
| 23,315,000 | | | | | | 6.500%, due 11/15/26 | | | 30,269,422 | | | | | |
| 63,105,000 | | | | L | | 1.000%–8.875%, due 07/15/13–05/15/39 | | | 71,659,652 | | | | | |
| |
| | | | | | | Total U.S. Treasury Obligations | | | | | | | | |
| | | | | | | (Cost $1,273,657,308) | | | 1,272,028,297 | | | | 32.6 | |
| |
COLLATERALIZED MORTGAGE OBLIGATIONS: 3.0% |
| 14,360,000 | | | | | | Banc of America Commercial Mortgage, Inc., 5.414%–5.889%, due 07/10/44–06/10/49 | | | 15,299,461 | | | | 0.4 | |
| 12,000,000 | | | | | | Bear Stearns Commercial Mortgage Securities, 5.331%, due 02/11/44 | | | 12,341,011 | | | | 0.3 | |
| 7,700,000 | | | | | | Citigroup Commercial Mortgage Trust, 5.698%, due 12/10/49 | | | 8,243,202 | | | | 0.2 | |
| 2,725,055 | | | | | | Continental Airlines, Inc., 5.983%, due 04/19/22 | | | 2,874,933 | | | | 0.1 | |
| 26,662,829 | | | | | | JPMorgan Chase Commercial Mortgage Securities Corp., 4.871%–6.125%, due 01/12/38–02/15/51 | | | 28,213,220 | | | | 0.7 | |
| 8,874,000 | | | | | | Wachovia Bank Commercial Mortgage Trust, 5.313%–5.509%, due 01/15/45–11/15/48 | | | 9,261,566 | | | | 0.3 | |
| | | | | | | Other Securities | | | 39,510,912 | | | | 1.0 | |
| |
| | | | | | | Total Collateralized Mortgage Obligations | | | | | | | | |
| | | | | | | (Cost $95,467,244) | | | 115,744,305 | | | | 3.0 | |
| |
MUNICIPAL BONDS: 0.2%
|
| | | | | | | |
| | | | | | | Other Securities | | | 2,710,789 | | | | 0.1 | |
| | | | | | | | | | | | | | | |
| | | | | | | |
| | | | | | | Other Securities | | | 4,422,528 | | | | 0.1 | |
| |
| | | | | | | Total Municipal Bonds | | | | | | | | |
| | | | | | | (Cost $7,166,891) | | | 7,133,317 | | | | 0.2 | |
| |
OTHER BONDS: 0.2% |
| | | | | | | Foreign Government Bonds: 0.2% |
| 7,650,000 | | | | | | Mexico Government International Bond, 6.375%, due 01/16/13 | | | 8,395,875 | | | | 0.2 | |
| |
OTHER BONDS: (continued) |
| | | | | | | Foreign Government Bonds: (continued) |
| | | | | | | Total Other Bonds | | | | | | | | |
| | | | | | | (Cost $8,045,918) | | $ | 8,395,875 | | | | 0.2 | |
| | | | | | | Total Long-Term Investments | | | | | | | | |
| | | | | | | (Cost $3,782,911,020) | | | 3,845,320,713 | | | | 98.4 | |
Shares
|
|
|
|
|
| Value
|
| Percent
of Net Assets
|
|---|
| |
SHORT-TERM INVESTMENTS: 21.4% |
| | | | | |
| 236,703,455 | | | | Blackrock Liquidity Funds TempFund Portfolio — Class I | | | 236,703,455 | | | | 6.1 | |
| | | | | Total Mutual Funds | | | | | | | | |
| | | | | (Cost $236,703,455) | | | 236,703,455 | | | | 6.1 | |
Principal
Amount
|
|
|
|
|
|
| Value
|
| Percent
of Net Assets
|
|---|
| | | | | | U.S. Government Agency Obligations: 3.2% |
| 50,000,000 | | | Z | | Federal Home Loan Mortgage Corporation, 0.120%, due 05/10/11 | | | 49,978,850 | | | | 3.2 | |
| 75,000,000 | | | Z | | Federal Home Loan Mortgage Corporation, 0.120%, due 05/26/11 | | | 74,964,225 | | | | | |
| | | | | | Total U.S. Government Agency Obligations | | | | | | | | |
| | | | | | (Cost $124,911,583) | | | 124,943,075 | | | | 3.2 | |
| | | | | | | | | | | | | | |
| | | | | | U.S. Treasury Bills: 9.0% |
| 45,000,000 | | | | | 0.120%, due 04/21/11 | | | 44,983,125 | | | | | |
| 68,000,000 | | | | | 0.130%, due 05/12/11 | | | 67,967,088 | | | | | |
| 40,000,000 | | | | | 0.140%, due 06/02/11 | | | 39,975,840 | | | | | |
| 50,000,000 | | | | | 0.170%, due 06/30/11 | | | 49,956,750 | | | | | |
| 75,000,000 | | | | | 0.180%, due 07/28/11 | | | 74,919,750 | | | | | |
| 75,000,000 | | | L | | 0.180%, due 08/25/11 | | | 74,909,851 | | | | | |
| | | | | | Total U.S. Treasury Bills | | | | | | | | |
| | | | | | (Cost $352,676,215) | | | 352,712,404 | | | | 9.0 | |
Shares
|
|
|
|
|
|
| Value
|
| Percent
of Net Assets
|
|---|
| | | | | | Securities Lending Collateralcc: 3.1% |
| 121,022,135 | | | | | BNY Mellon Overnight Government Fund(1) | | | 121,022,135 | | | | 3.1 | |
| | | | | | Total Securities Lending Collateral | | | | | | | | |
| | | | | | (Cost $121,022,135) | | | 121,022,135 | | | | 3.1 | |
| | | | | | Total Short-Term Investments | | | | | | | | |
| | | | | | (Cost $835,313,388) | | | 835,381,069 | | | | 21.4 | |
| | | | | | Total Investments in Securities | | | | | | | | |
| | | | | | (Cost $4,618,224,408)* | | $ | 4,680,701,782 | | | | 119.8 | |
| | | | | | Other Assets and Liabilities — Net | | | (772,600,905 | ) | | | (19.8 | ) |
| | | | | | Net Assets | | $ | 3,908,100,877 | | | | 100.0 | |
See Accompanying Notes to Financial Statements
101
ING U.S. BOND INDEX PORTFOLIO |
| SUMMARY PORTFOLIO OF INVESTMENTS
AS OF DECEMBER 31, 2010 (CONTINUED) |
“Other Securities” represents issues not identified as the top 50 holdings in terms of market value and issues or issuers not exceeding 1% of net assets individually or in aggregate respectively as of December 31, 2010.
The following footnotes apply to either the individual securities noted or one or more of the securities aggregated and listed as a single line item.
| # | | Securities with purchases pursuant to Rule 144A or section 4(2), under the Securities Act of 1933 and may not be resold subject to that rule except to qualified institutional buyers. Unless otherwise noted, these securities have been determined to be liquid under the guidelines established by the Funds’ Board of Directors/Trustees. |
| cc | | Securities purchased with cash collateral for securities loaned. |
| (1) | | Collateral received from brokers for securities lending was invested in these short-term investments. |
| ## | | On September 7, 2008, the Federal Housing Finance Agency placed the Federal National Mortgage Association and the Federal Home Loan Mortgage Corporation into conservatorship and the U.S. Treasury guaranteed the debt issued by those organizations. |
| W | | Settlement is on a when-issued or delayed-delivery basis. |
| L | | Loaned security, a portion or all of the security is on loan at December 31, 2010. |
| Z | | Indicates Zero Coupon Bond; rate shown reflects current effective yield. |
| * | | Cost for federal income tax purposes is $4,620,372,491. |
| Net unrealized appreciation consists of: | | | | | | |
| Gross Unrealized Appreciation | | | | $ | 81,728,234 | |
| Gross Unrealized Depreciation | | | | | (21,398,943 | ) |
| Net Unrealized Appreciation | | | | $ | 60,329,291 | |
The following is a summary of the fair valuations according to the inputs used as of December 31, 2010 in valuing the Portfolio’s assets and liabilities:
| | | | Quoted Prices
in Active Markets
for Identical Investments
(Level 1)
| | Other
Observable
Inputs
(Level 2)
| | Significant
Unobservable
Inputs
(Level 3)
| | Fair Value
at
12/31/2010
|
|---|
Asset Table | | | | | | | | | | | | | | | | | | |
Investments, at value | | | | | | | | | | | | | | | | | | |
| Corporate Bonds/Notes | | | | $ | — | | | $ | 916,003,314 | | | $ | — | | | $ | 916,003,314 | |
| U.S. Government Agency Obligations | | | | | — | | | | 1,526,015,605 | | | | — | | | | 1,526,015,605 | |
| U.S. Treasury Obligations | | | | | — | | | | 1,272,028,297 | | | | — | | | | 1,272,028,297 | |
| Collateralized Mortgage Obligations | | | | | — | | | | 115,744,305 | | | | — | | | | 115,744,305 | |
| Municipal Bonds | | | | | — | | | | 7,133,317 | | | | — | | | | 7,133,317 | |
| Other Bonds | | | | | — | | | | 8,395,875 | | | | — | | | | 8,395,875 | |
| Short-Term Investments | | | | | 357,725,590 | | | | 477,655,479 | | | | — | | | | 835,381,069 | |
| Total Investments, at value | | | | $ | 357,725,590 | | | $ | 4,322,976,192 | | | $ | — | | | $ | 4,680,701,782 | |
| ˆ | | See Note 2, “Significant Accounting Policies” in the Notes to Financial Statements for additional information. |
See Accompanying Notes to Financial Statements
102
ING EURO STOXX 50® INDEX PORTFOLIO |
| PORTFOLIO OF INVESTMENTS
AS OF DECEMBER 31, 2010 |
Shares
|
|
|
|
|
|
|
| Value
|
| Percent
of Net Assets
|
|---|
| |
COMMON STOCK: 98.0%
|
| | | | | | | Consumer Discretionary: 7.6% |
| 135,265 | | | | | | Bayerische Motoren Werke AG | | $ | 10,657,128 | | | | 1.2 | |
| 375,087 | | | | @ | | DaimlerChrysler AG | | | 25,380,226 | | | | 2.9 | |
| 105,331 | | | | | | LVMH Moet Hennessy Louis Vuitton S.A. | | | 17,348,509 | | | | 2.0 | |
| 505,559 | | | | | | Vivendi | | | 13,661,042 | | | | 1.5 | |
| | | | | | | | | | 67,046,905 | | | | 7.6 | |
| | | | | | | | | | | | | | | |
| | | | | | | |
| 304,107 | | | | | | Anheuser-Busch InBev NV | | | 17,376,425 | | | | 2.0 | |
| 249,160 | | | | | | Carrefour S.A. | | | 10,273,504 | | | | 1.2 | |
| 250,514 | | | | | | Groupe Danone | | | 15,751,603 | | | | 1.8 | |
| 97,466 | | | | | | L’Oreal S.A. | | | 10,837,417 | | | | 1.2 | |
| 634,913 | | | | | | Unilever NV | | | 19,807,759 | | | | 2.2 | |
| | | | | | | | | | 74,046,708 | | | | 8.4 | |
| | | | | | | | | | | | | | | |
| | | | | | | |
| 996,351 | | | | | | ENI S.p.A. | | | 21,837,437 | | | | 2.5 | |
| 323,464 | | | | | | Repsol YPF S.A. | | | 9,058,162 | | | | 1.0 | |
| 907,927 | | | | | | Total S.A. | | | 48,358,488 | | | | 5.5 | |
| | | | | | | | | | 79,254,087 | | | | 9.0 | |
| | | | | | | | | | | | | | | |
| | | | | | | |
| 190,338 | | | | | | Allianz AG | | | 22,615,143 | | | | 2.6 | |
| 546,278 | | | | | | Assicurazioni Generali S.p.A. | | | 10,400,937 | | | | 1.2 | |
| 758,561 | | | | | | AXA S.A. | | | 12,626,581 | | | | 1.4 | |
| 1,838,897 | | | | L | | Banco Bilbao Vizcaya Argentaria S.A. | | | 18,740,713 | | | | 2.1 | |
| 3,398,841 | | | | | | Banco Santander Central Hispano S.A. | | | 36,217,457 | | | | 4.1 | |
| 408,183 | | | | | | BNP Paribas | | | 25,995,791 | | | | 3.0 | |
| 434,545 | | | | | | Credit Agricole S.A. | | | 5,525,557 | | | | 0.6 | |
| 391,854 | | | | | | Deutsche Bank AG | | | 20,492,393 | | | | 2.3 | |
| 82,052 | | | | | | Deutsche Boerse AG | | | 5,669,061 | | | | 0.7 | |
| 1,578,979 | | | | @, ** | | ING Groep NV | | | 15,404,117 | | | | 1.8 | |
| 4,366,120 | | | | | | Intesa Sanpaolo S.p.A. | | | 11,869,909 | | | | 1.4 | |
| 71,196 | | | | | | Muenchener Rueckversicherungs AG | | | 10,782,971 | | | | 1.2 | |
| 302,483 | | | | | | Societe Generale | | | 16,275,653 | | | | 1.9 | |
| 6,945,807 | | | | | | UniCredito Italiano S.p.A. | | | 14,399,817 | | | | 1.6 | |
| | | | | | | | | | 227,016,100 | | | | 25.9 | |
| | | | | | | | | | | | | | | |
| | | | | | | |
| 347,957 | | | | | | Bayer AG | | | 25,793,132 | | | | 2.9 | |
| 457,537 | | | | | | Sanofi-Aventis | | | 29,333,061 | | | | 3.4 | |
| | | | | | | | | | 55,126,193 | | | | 6.3 | |
| | | | | | | | | | | | | | | |
| | | | | | | |
| 84,177 | | | | | | Alstom | | | 4,034,704 | | | | 0.5 | |
| 177,291 | | | | | | Cie de Saint-Gobain | | | 9,131,473 | | | | 1.0 | |
| 403,177 | | | | | | Koninklijke Philips Electronics NV | | | 12,360,332 | | | | 1.4 | |
| 110,434 | | | | | | Schneider Electric S.A. | | | 16,558,038 | | | | 1.9 | |
| 363,206 | | | | | | Siemens AG | | | 44,992,013 | | | | 5.1 | |
| |
COMMON STOCK: (continued) |
| | | | | | | |
| 213,153 | | | | | | Vinci S.A. | | $ | 11,599,299 | | | | 1.3 | |
| | | | | | | | | | 98,675,859 | | | | 11.2 | |
| | | | | | | | | | | | | | | |
| | | | | | | Information Technology: 4.1% |
| 1,531,183 | | | | | | Nokia OYJ | | | 15,861,252 | | | | 1.8 | |
| 388,941 | | | | | | SAP AG | | | 19,837,027 | | | | 2.3 | |
| | | | | | | | | | 35,698,279 | | | | 4.1 | |
| | | | | | | | | | | | | | | |
| | | | | | | |
| 115,045 | | | | | | Air Liquide | | | 14,566,358 | | | | 1.7 | |
| 355,588 | | | | @ | | ArcelorMittal | | | 13,532,506 | | | | 1.6 | |
| 22,103 | | | | | | ArcelorMittal | | | 841,167 | | | | | |
| 386,741 | | | | | | BASF AG | | | 30,863,086 | | | | 3.5 | |
| 293,491 | | | | | | CRH PLC | | | 6,094,092 | | | | 0.7 | |
| | | | | | | | | | 65,897,209 | | | | 7.5 | |
| | | | | | | | | | | | | | | |
| | | | | | | Telecommunication Services: 8.6% |
| 1,253,568 | | | | | | Deutsche Telekom AG | | | 16,160,010 | | | | 1.9 | |
| 780,360 | | | | | | France Telecom S.A. | | | 16,329,703 | | | | 1.9 | |
| 4,242,719 | | | | | | Telecom Italia S.p.A. | | | 5,504,740 | | | | 0.6 | |
| 1,627,207 | | | | | | Telefonica S.A. | | | 37,149,204 | | | | 4.2 | |
| | | | | | | | | | 75,143,657 | | | | 8.6 | |
| | | | | | | | | | | | | | | |
| | | | | | | |
| 841,963 | | | | | | E.ON AG | | | 25,712,578 | | | | 2.9 | |
| 2,605,654 | | | | | | Enel S.p.A. | | | 13,057,059 | | | | 1.5 | |
| 544,975 | | | | | | Gaz de France | | | 19,572,872 | | | | 2.2 | |
| 1,638,904 | | | | | | Iberdrola S.A. | | | 12,707,427 | | | | 1.5 | |
| 173,986 | | | | | | RWE AG | | | 11,620,499 | | | | 1.3 | |
| | | | | | | | | | 82,670,435 | | | | 9.4 | |
| |
| | | | | | | Total Common Stock | | | | | | | | |
| | | | | | | (Cost $874,190,988) | | | 860,575,432 | | | | 98.0 | |
| |
REAL ESTATE INVESTMENT TRUSTS: 0.8% |
| | | | | | | |
| 37,305 | | | | @ | | Unibail | | | 7,386,322 | | | | 0.8 | |
| |
| | | | | | | Total Real Estate Investment Trusts | | | | | | | | |
| | | | | | | (Cost $6,243,610) | | | 7,386,322 | | | | 0.8 | |
| |
| | | | | | | Total Long-Term Investments | | | | | | | | |
| | | | | | | (Cost $880,434,598) | | | 867,961,754 | | | | 98.8 | |
| |
SHORT-TERM INVESTMENTS: 1.4% |
| | | | | | | Securities Lending Collateralcc: 1.4% |
| 12,736,572 | | | | | | BNY Mellon Overnight Government Fund(1) | | | 12,736,572 | | | | 1.4 | |
| | | | | | | Total Short-Term Investments | | | | | | | | |
| | | | | | | (Cost $12,736,572) | | | 12,736,572 | | | | 1.4 | |
| |
| | | | | | | Total Investments in Securities | | | | | | | | |
| | | | | | | (Cost $893,171,170)* | | $ | 880,698,326 | | | | 100.2 | |
| | | | | | | Other Assets and Liabilities — Net | | | (2,083,087 | ) | | | (0.2 | ) |
| | | | | | | Net Assets | | $ | 878,615,239 | | | | 100.0 | |
See Accompanying Notes to Financial Statements
103
ING EURO STOXX 50® INDEX PORTFOLIO |
| PORTFOLIO OF INVESTMENTS
AS OF DECEMBER 31, 2010 (CONTINUED) |
| @ | | Non-income producing security |
| cc | | Securities purchased with cash collateral for securities loaned. |
| (1) | | Collateral received from brokers for securities lending was invested in these short-term investments. |
| L | | Loaned security, a portion or all of the security is on loan at December 31, 2010. |
| ** | | Investment in affiliate |
| * | | Cost for federal income tax purposes is $903,763,580. |
| Net unrealized depreciation consists of: | | | | | | |
| Gross Unrealized Appreciation | | | | $ | 66,382,927 | |
| Gross Unrealized Depreciation | | | | | (89,448,181 | ) |
| Net Unrealized Depreciation | | | | $ | (23,065,254 | ) |
The following is a summary of the fair valuations according to the inputs used as of December 31, 2010 in valuing the Portfolio’s assets and liabilities:
| | | | Quoted Prices
in Active Markets
for Identical Investments
(Level 1)
| | Other
Observable
Inputs#
(Level 2)
| | Significant
Unobservable
Inputs
(Level 3)
| | Fair Value
at
12/31/2010
|
|---|
Asset Table | | | | | | | | | | | | | | | | | | |
Investments, at value | | | | | | | | | | | | | | | | | | |
| Common Stock* | | | | $ | — | | | $ | 860,575,432 | | | $ | — | | | $ | 860,575,432 | |
| Real Estate Investment Trusts | | | | | — | | | | 7,386,322 | | | | — | | | | 7,386,322 | |
| Short-Term Investments | | | | | 12,736,572 | | | | — | | | | — | | | | 12,736,572 | |
| Total Investments, at value | | | | $ | 12,736,572 | | | $ | 867,961,754 | | | $ | — | | | $ | 880,698,326 | |
Other Financial Instruments+: | | | | | | | | | | | | | | | | | | |
| Forward foreign currency contracts | | | | | — | | | | 510,989 | | | | — | | | | 510,989 | |
| Total Assets | | | | $ | 12,736,572 | | | $ | 868,472,743 | | | $ | — | | | $ | 881,209,315 | |
Liabilities Table | | | | | | | | | | | | | | | | | | |
Other Financial Instruments+: | | | | | | | | | | | | | | | | | | |
| Forward foreign currency contracts | | | | $ | — | | | $ | (457,356 | ) | | $ | — | | | $ | (457,356 | ) |
| Futures | | | | | (178,982 | ) | | | — | | | | — | | | | (178,982 | ) |
| Total Liabilities | | | | $ | (178,982 | ) | | $ | (457,356 | ) | | $ | — | | | $ | (636,338 | ) |
| ˆ | | See Note 2, “Significant Accounting Policies” in the Notes to Financial Statements for additional information. |
| + | | Other Financial Instruments are derivatives not reflected in the Summary Portfolio of Investments and may include open forward foreign currency contracts, futures, swaps, and written options. Forward foreign currency contracts and futures are reported at their unrealized gain/loss at measurement date which represents the amount due to/from the Portfolio. Swaps and written options are reported at their market value at measurement date. |
| * | | For further breakdown of Common Stock by Industry type, please refer to the Portfolio of Investments. |
| # | | The earlier close of the foreign markets gives rise to the possibility that significant events, including broad market moves, may have occurred in the interim and may materially affect the value of those securities. To account for this, the Portfolio may frequently value many of its foreign equity securities using fair value prices based on third party vendor modeling tools to the extent available. Accordingly, a significant portion of the Portfolio’s investments are categorized as Level 2 investments. |
ING Euro STOXX 50® Index Portfolio Open Futures Contracts on December 31, 2010:
Contract Description
| | | | Number
of Contracts
| | Expiration Date
| | Notional Value
| | Unrealized
Depreciation
|
|---|
Long Contracts | | | | | | | | | | | | | | | | | | |
| Euro STOXX 50® | | | | | 317 | | | | 03/18/11 | | | $ | 11,835,661 | | | $ | (178,982 | ) |
| | | | | | | | | | | | | $ | 11,835,661 | | | $ | (178,982 | ) |
See Accompanying Notes to Financial Statements
104
ING EURO STOXX 50® INDEX PORTFOLIO |
| PORTFOLIO OF INVESTMENTS
AS OF DECEMBER 31, 2010 (CONTINUED) |
At December 31, 2010 the following forward foreign currency contracts were outstanding for the ING Euro STOXX 50® Index Portfolio:
Counterparty
| | | | Currency
| | | | Buy/Sell
| | Settlement
Date
| | In Exchange For
| | Fair Value
| | Unrealized
Appreciation
(Depreciation)
|
|---|
| BEST Direct Securities, LLC | | | | EU Euro | | | | | | | | | | | | | | | | | | | | | | | | |
| | | | | EUR | | 15,000,000 | | BUY | | 1/28/11 | | $ | 19,556,039 | | | $ | 20,043,633 | | | $ | 487,594 | |
| JPMorgan Chase & Co. | | | | EU Euro | | | | | | | | | | | | | | | | | | | | | | | | |
| | | | | EUR | | 3,400,000 | | BUY | | 1/28/11 | | | 4,683,153 | | | | 4,543,223 | | | | (139,930 | ) |
| The Bank of New York Mellon Corporation | | | | EU Euro | | | | | | | | | | | | | | | | | | | | | | | | |
| | | | | EUR | | 4,000,000 | | BUY | | 1/28/11 | | | 5,604,000 | | | | 5,344,969 | | | | (259,031 | ) |
| | | | | | | | | | | | | | | | | | | | | $ | 88,633 | |
| Brown Brothers Harriman & Co. | | | | EU Euro | | | | | | | | | | | | | | | | | | | | | | | | |
| | | | | EUR | | 3,000,000 | | SELL | | 1/28/11 | | $ | 4,014,246 | | | $ | 4,008,727 | | | $ | 5,519 | |
| JPMorgan Chase & Co. | | | | EU Euro | | | | | | | | | | | | | | | | | | | | | | | | |
| | | | | EUR | | 1,400,000 | | SELL | | 1/28/11 | | | 1,888,615 | | | | 1,870,739 | | | | 17,876 | |
| The Bank of New York Mellon Corporation | | | | EU Euro | | | | | | | | | | | | | | | | | | | | | | | | |
| | | | | EUR | | 7,000,000 | | SELL | | 1/28/11 | | | 9,295,300 | | | | 9,353,695 | | | | (58,395 | ) |
| | | | | | | | | | | | | | | | | | | | | $ | (35,000 | ) |
A summary of derivative instruments by primary risk exposure is outlined in the following tables.
The fair value of derivative instruments as of December 31, 2010 was as follows:
Derivatives not accounted for as
hedging instruments
| | | | Location on Statement
of Assets and Liabilities
| | Fair Value
|
|---|
Asset Derivatives | | | | | | | | | | |
| Foreign exchange contracts | | | | Unrealized appreciation on forward foreign currency contracts | | $ | 510,989 | |
Total Asset Derivatives | | | | | | $ | 510,989 | |
Liability Derivatives | | | | | | | | | | |
| Foreign exchange contracts | | | | Unrealized depreciation on forward foreign currency contracts | | $ | 457,356 | |
| Equity contracts | | | | Net Assets — Unrealized depreciation* | | | 178,982 | |
Total Liability Derivatives | | | | | | $ | 636,338 | |
| * | | Includes cumulative appreciation/depreciation of futures contracts as reported in the table following the Summary Portfolio of Investments. |
The effect of derivative instruments on the Portfolio’s Statement of Operations for the year ended December 31, 2010 was as follows:
| | | | Amount of Realized Gain or (Loss) on Derivatives Recognized in Income
| |
|---|
Derivatives not accounted for as
hedging instruments
| | | | Foreign currency
related transactions*
| | Futures
| | Total
|
|---|
| Equity contracts | | | | $ | — | | | $ | 816,483 | | | $ | 816,483 | |
| Foreign exchange contracts | | | | | 1,165,213 | | | | — | | | | 1,165,213 | |
Total | | | | $ | 1,165,213 | | | $ | 816,483 | | | $ | 1,981,696 | |
| | | | Change in Unrealized Appreciation or (Depreciation)
on Derivatives Recognized in Income
| |
|---|
Derivatives not accounted for as
hedging instruments
| | | | Foreign currency
related transactions*
| | Futures
| | Total
|
|---|
| Equity contracts | | | | $ | — | | | $ | (567,920 | ) | | $ | (567,920 | ) |
| Foreign exchange contracts | | | | | 53,633 | | | | — | | | | 53,633 | |
Total | | | | $ | 53,633 | | | $ | (567,920 | ) | | $ | (514,287 | ) |
| * | | Amounts recognized for forward foreign currency contracts are included in net realized gain (loss) on foreign currency related transactions and net change in unrealized appreciation or depreciation on foreign currency related transactions. |
See Accompanying Notes to Financial Statements
105
ING FTSE 100 INDEX® PORTFOLIO |
| SUMMARY PORTFOLIO OF INVESTMENTS
AS OF DECEMBER 31, 2010 |
Shares
|
|
|
|
|
|
|
| Value
|
| Percent
of Net Assets
|
|---|
| |
COMMON STOCK: 97.6% |
| | | | | | | Consumer Discretionary: 5.4% |
| 361,442 | | | | L | | British Sky Broadcasting PLC | | $ | 4,147,510 | | | | 0.6 | |
| 58,437 | | | | | | Carnival PLC | | | 2,718,042 | | | | 0.4 | |
| 516,737 | | | | | | Compass Group PLC | | | 4,689,858 | | | | 0.7 | |
| 644,002 | | | | | | Kingfisher PLC | | | 2,653,103 | | | | 0.4 | |
| 436,183 | | | | | | Marks & Spencer Group PLC | | | 2,515,244 | | | | 0.4 | |
| 221,191 | | | | | | Pearson PLC | | | 3,485,772 | | | | 0.5 | |
| 333,327 | | | | | | Reed Elsevier PLC | | | 2,815,608 | | | | 0.4 | |
| 346,009 | | | | | | WPP PLC | | | 4,277,559 | | | | 0.7 | |
| | | | | | | Other Securities | | | 8,652,099 | | | | 1.3 | |
| | | | | | | | | | 35,954,795 | | | | 5.4 | |
| | | | | | | | | | | | | | | |
| | | | | | | |
| 548,923 | | | | | | British American Tobacco PLC | | | 21,114,854 | | | | 3.2 | |
| 692,489 | | | | | | Diageo PLC | | | 12,830,435 | | | | 1.9 | |
| 279,526 | | | | | | Imperial Tobacco Group PLC | | | 8,592,516 | | | | 1.3 | |
| 507,889 | | | | | | J Sainsbury PLC | | | 2,983,776 | | | | 0.4 | |
| 199,290 | | | | | | Reckitt Benckiser PLC | | | 10,963,880 | | | | 1.6 | |
| 323,631 | | | | | | SABMiller PLC | | | 11,401,220 | | | | 1.7 | |
| 2,186,335 | | | | | | Tesco PLC | | | 14,497,624 | | | | 2.2 | |
| 359,604 | | | | | | Unilever PLC | | | 11,045,638 | | | | 1.6 | |
| 730,397 | | | | | | WM Morrison Supermarkets PLC | | | 3,051,631 | | | | 0.5 | |
| | | | | | | Other Securities | | | 2,010,007 | | | | 0.3 | |
| | | | | | | | | | 98,491,581 | | | | 14.7 | |
| | | | | | | | | | | | | | | |
| | | | | | | |
| 926,324 | | | | | | BG Group PLC | | | 18,790,674 | | | | 2.8 | |
| 5,180,547 | | | | | | BP PLC | | | 38,185,461 | | | | 5.7 | |
| 384,207 | | | | @ | | Cairn Energy PLC | | | 2,522,364 | | | | 0.4 | |
| 975,308 | | | | | | Royal Dutch Shell PLC — Class A | | | 32,563,957 | | | | 8.6 | |
| 746,962 | | | | | | Royal Dutch Shell PLC — Class B | | | 24,735,297 | | | | | |
| 243,251 | | | | | | Tullow Oil PLC | | | 4,803,595 | | | | 0.7 | |
| | | | | | | Other Securities | | | 4,383,215 | | | | 0.6 | |
| | | | | | | | | | 125,984,563 | | | | 18.8 | |
| | | | | | | | | | | | | | | |
| | | | | | | |
| 771,306 | | | | | | Aviva PLC | | | 4,741,100 | | | | 0.7 | |
| 3,342,045 | | | | | | Barclays PLC | | | 13,812,275 | | | | 2.1 | |
| 4,841,177 | | | | | | HSBC Holdings PLC | | | 49,477,372 | | | | 7.4 | |
| 11,042,463 | | | | @ | | Lloyds TSB Group PLC | | | 11,399,131 | | | | 1.7 | |
| 1,492,011 | | | | | | Old Mutual PLC | | | 2,873,173 | | | | 0.4 | |
| 693,864 | | | | | | Prudential PLC | | | 7,248,927 | | | | 1.1 | |
| 4,781,246 | | | | @ | | Royal Bank of Scotland Group PLC | | | 2,936,240 | | | | 0.4 | |
| 641,248 | | | | | | Standard Chartered PLC | | | 17,310,865 | | | | 2.6 | |
| | | | | | | Other Securities | | | 17,376,863 | | | | 2.6 | |
| | | | | | | | | | 127,175,946 | | | | 19.0 | |
| | | | | | | | | | | | | | | |
| |
COMMON STOCK: (continued) |
| | | | | | | |
| 388,526 | | | | | | AstraZeneca PLC | | $ | 17,706,827 | | | | 2.6 | |
| 1,440,790 | | | | | | GlaxoSmithKline PLC | | | 27,940,966 | | | | 4.2 | |
| 153,785 | | | | | | Shire PLC | | | 3,708,078 | | | | 0.6 | |
| 244,057 | | | | | | Smith & Nephew PLC | | | 2,576,960 | | | | 0.4 | |
| | | | | | | | | | 51,932,831 | | | | 7.8 | |
| | | | | | | | | | | | | | | |
| | | | | | | |
| 936,853 | | | | | | BAE Systems PLC | | | 4,825,526 | | | | 0.7 | |
| 280,519 | | | | | | Experian Group Ltd. | | | 3,493,914 | | | | 0.5 | |
| 509,147 | | | | @ | | Rolls-Royce Group PLC | | | 4,960,736 | | | | 0.8 | |
| 32,585,408 | | | | @ | | Rolls-Royce Group PLC — C Shares | | | 50,804 | | | | | |
| 77,617 | | | | @ | | Wolseley PLC | | | 2,484,683 | | | | 0.4 | |
| | | | | | | Other Securities | | | 16,087,087 | | | | 2.4 | |
| | | | | | | | | | 31,902,750 | | | | 4.8 | |
| | | | | | | | | | | | | | | |
| | | | | | | Information Technology: 0.8% |
| 360,120 | | | | | | ARM Holdings PLC | | | 2,457,894 | | | | 0.4 | |
| | | | | | | Other Securities | | | 3,089,389 | | | | 0.4 | |
| | | | | | | | | | 5,547,283 | | | | 0.8 | |
| | | | | | | | | | | | | | | |
| | | | | | | |
| 364,554 | | | | | | Anglo American PLC | | | 19,070,747 | | | | 2.8 | |
| 108,420 | | | | | | Antofagasta PLC | | | 2,743,353 | | | | 0.4 | |
| 606,789 | | | | | | BHP Billiton PLC | | | 24,412,138 | | | | 3.6 | |
| 419,905 | | | | | | Rio Tinto PLC | | | 29,931,395 | | | | 4.5 | |
| 609,847 | | | | | | Xstrata PLC | | | 14,451,026 | | | | 2.2 | |
| | | | | | | Other Securities | | | 13,429,877 | | | | 2.0 | |
| | | | | | | | | | 104,038,536 | | | | 15.5 | |
| | | | | | | | | | | | | | | |
| | | | | | | Telecommunication Services: 6.8% |
| 2,126,096 | | | | | | BT Group PLC | | | 6,038,544 | | | | 0.9 | |
| 14,469,722 | | | | | | Vodafone Group PLC | | | 37,985,031 | | | | 5.7 | |
| | | | | | | Other Securities | | | 1,320,537 | | | | 0.2 | |
| | | | | | | | | | 45,344,112 | | | | 6.8 | |
| | | | | | | | | | | | | | | |
| | | | | | | |
| 1,416,486 | | | | | | Centrica PLC | | | 7,339,233 | | | | 1.1 | |
| 417,553 | | | | | | International Power PLC | | | 2,859,565 | | | | 0.4 | |
| 951,879 | | | | | | National Grid PLC | | | 8,227,314 | | | | 1.3 | |
| 253,055 | | | | | | Scottish & Southern Energy PLC | | | 4,833,905 | | | | 0.7 | |
| | | | | | | Other Securities | | | 3,214,173 | | | | 0.5 | |
| | | | | | | | | | 26,474,190 | | | | 4.0 | |
| |
| | | | | | | Total Common Stock | | | | | | | | |
| | | | | | | (Cost $558,992,659) | | | 652,846,587 | | | | 97.6 | |
| |
REAL ESTATE INVESTMENT TRUSTS: 1.0% |
| | | | | | | |
| | | | | | | Other Securities | | | 6,581,693 | | | | 1.0 | |
| |
| | | | | | | Total Real Estate Investment Trusts | | | | | | | | |
| | | | | | | (Cost $5,927,637) | | | 6,581,693 | | | | 1.0 | |
See Accompanying Notes to Financial Statements
106
ING FTSE 100 INDEX® PORTFOLIO |
| SUMMARY PORTFOLIO OF INVESTMENTS
AS OF DECEMBER 31, 2010 (CONTINUED) |
Shares
|
|
|
|
|
|
|
| Value
|
| Percent
of Net Assets
|
|---|
| |
MUTUAL FUNDS: 0.1% |
| | | | | | | |
| | | | | | | Other Securities | | $ | 1,055,533 | | | | 0.1 | |
| |
| | | | | | | Total Mutual Funds | | | | | | | | |
| | | | | | | (Cost $878,357) | | | 1,055,533 | | | | 0.1 | |
| |
| | | | | | | Total Long-Term Investments | | | | | | | | |
| | | | | | | (Cost $565,798,653) | | | 660,483,813 | | | | 98.7 | |
| |
SHORT-TERM INVESTMENTS: 0.5% |
| | | | | | | Securities Lending Collateralcc: 0.5% |
| 3,137,068 | | | | | | BNY Mellon Overnight Government Fund(1) | | | 3,137,068 | | | | 0.5 | |
| |
| | | | | | | Total Short-Term Investments | | | | | | | | |
| | | | | | | (Cost $3,137,068) | | | 3,137,068 | | | | 0.5 | |
| |
| | | | | | | Total Investments in Securities | | | | | | | | |
| | | | | | | (Cost $568,935,721)* | | $ | 663,620,881 | | | | 99.2 | |
| | | | | | | Other Assets and Liabilities — Net | | | 5,303,882 | | | | 0.8 | |
| | | | | | | Net Assets | | $ | 668,924,763 | | | | 100.0 | |
“Other Securities” represents issues not identified as the top 50 holdings in terms of market value and issues or issuers not exceeding 1% of net assets individually or in aggregate respectively as of December 31, 2010.
The following footnotes apply to either the individual securities noted or one or more of the securities aggregated and listed as a single line item.
| @ | | Non-income producing security |
| cc | | Securities purchased with cash collateral for securities loaned. |
| (1) | | Collateral received from brokers for securities lending was invested in these short-term investments. |
| L | | Loaned security, a portion or all of the security is on loan at December 31, 2010. |
| * | | Cost for federal income tax purposes is $570,681,939. |
| Net unrealized appreciation consists of: | | | | | | |
| Gross Unrealized Appreciation | | | | $ | 107,258,390 | |
| Gross Unrealized Depreciation | | | | | (14,319,448 | ) |
| Net Unrealized Appreciation | | | | $ | 92,938,942 | |
Fair Value Measurementsˆ
The following is a summary of the fair valuations according to the inputs used as of December 31, 2010 in valuing the Portfolio’s assets and liabilities:
| | | | Quoted Prices
in Active Markets
for Identical Investments
(Level 1)
| | Other
Observable
Inputs#
(Level 2)
| | Significant
Unobservable
Inputs
(Level 3)
| | Fair Value
at
12/31/2010
|
|---|
Asset Table | | | | | | | | | | | | | | | | | | |
Investments, at value | | | | | | | | | | | | | | | | | | |
| Common Stock | | | | | | | | | | | | | | | | | | |
| Consumer Discretionary | | | | $ | 4,147,510 | | | $ | 31,807,285 | | | $ | — | | | $ | 35,954,795 | |
| Consumer Staples | | | | | — | | | | 98,491,581 | | | | — | | | | 98,491,581 | |
| Energy | | | | | — | | | | 125,984,563 | | | | — | | | | 125,984,563 | |
| Financials | | | | | — | | | | 127,175,946 | | | | — | | | | 127,175,946 | |
| Health Care | | | | | — | | | | 51,932,831 | | | | — | | | | 51,932,831 | |
| Industrials | | | | | — | | | | 31,902,750 | | | | — | | | | 31,902,750 | |
| Information Technology | | | | | — | | | | 5,547,283 | | | | — | | | | 5,547,283 | |
| Materials | | | | | — | | | | 104,038,536 | | | | — | | | | 104,038,536 | |
| Telecommunication Services | | | | | — | | | | 45,344,112 | | | | — | | | | 45,344,112 | |
| Utilities | | | | | — | | | | 26,474,190 | | | | — | | | | 26,474,190 | |
| Total Common Stock | | | | | 4,147,510 | | | | 648,699,077 | | | | — | | | | 652,846,587 | |
| Real Estate Investment Trusts | | | | | — | | | | 6,581,693 | | | | — | | | | 6,581,693 | |
| Mutual Funds | | | | | 1,055,533 | | | | — | | | | — | | | | 1,055,533 | |
| Short-Term Investments | | | | | 3,137,068 | | | | — | | | | — | | | | 3,137,068 | |
| Total Investments, at value | | | | $ | 8,340,111 | | | $ | 655,280,770 | | | $ | — | | | $ | 663,620,881 | |
Other Financial Instruments+: | | | | | | | | | | | | | | | | | | |
| Forward foreign currency contracts | | | | | — | | | | 73,990 | | | | — | | | | 73,990 | |
| Futures | | | | | 114,035 | | | | — | | | | — | | | | 114,035 | |
| Total Assets | | | | $ | 8,454,146 | | | $ | 655,354,760 | | | $ | - | | | $ | 663,808,906 | |
Liabilities Table | | | | | | | | | | | | | | | | | | |
Other Financial Instruments+: | | | | | | | | | | | | | | | | | | |
| Forward foreign currency contracts | | | | $ | — | | | $ | (533,959 | ) | | $ | — | | | $ | (533,959 | ) |
| Total Liabilities | | | | $ | — | | | $ | (533,959 | ) | | $ | — | | | $ | (533,959 | ) |
See Accompanying Notes to Financial Statements
107
ING FTSE 100 INDEX® PORTFOLIO |
| SUMMARY PORTFOLIO OF INVESTMENTS
AS OF DECEMBER 31, 2010 (CONTINUED) |
| ˆ | | See Note 2, “Significant Accounting Policies” in the Notes to Financial Statements for additional information. |
| + | | Other Financial Instruments are derivatives not reflected in the Summary Portfolio of Investments and may include open forward foreign currency contracts, futures, swaps, and written options. Forward foreign currency contracts and futures are reported at their unrealized gain/loss at measurement date which represents the amount due to/from the Portfolio. Swaps and written options are reported at their market value at measurement date. |
| # | | The earlier close of the foreign markets gives rise to the possibility that significant events, including broad market moves, may have occurred in the interim and may materially affect the value of those securities. To account for this, the Portfolio may frequently value many of its foreign equity securities using fair value prices based on third party vendor modeling tools to the extent available. Accordingly, a significant portion of the Portfolio’s investments are categorized as Level 2 investments. |
ING FTSE 100 Index® Portfolio Open Futures Contracts on December 31, 2010:
Contract Description
| | | | Number
of Contracts
| | Expiration Date
| | Notional Value
| | Unrealized
Appreciation
|
|---|
Long Contracts | | | | | | | | | | | | | | | | | | |
| FTSE 100 Index | | | | | 118 | | | | 03/18/11 | | | $ | 10,841,503 | | | $ | 114,035 | |
| | | | | | | | | | | | | $ | 10,841,503 | | | $ | 114,035 | |
At December 31, 2010 the following forward foreign currency contracts were outstanding for the ING FTSE 100 Index® Portfolio:
Counterparty
| | | | Currency
| | | | Buy/Sell
| | Settlement
Date
| | In Exchange For
| | Fair Value
| | Unrealized
Appreciation
(Depreciation)
|
|---|
| JPMorgan Chase & Co. | | | | British Pound | | | | | | | | | | | | | | | | | | | | | | | | |
| | | | | GBP | | 4,000,000 | | BUY | | 1/28/11 | | $ | 6,311,452 | | | $ | 6,234,997 | | | $ | (76,455 | ) |
| JPMorgan Chase & Co. | | | | British Pound | | | | | | | | | | | | | | | | | | | | | | | | |
| | | | | GBP | | 5,000,000 | | BUY | | 1/28/11 | | | 7,783,410 | | | | 7,793,746 | | | | 10,336 | |
| The Bank of New York Mellon Corporation | | | | British Pound | | | | | | | | | | | | | | | | | | | | | | | | |
| | | | | GBP | | 5,000,000 | | BUY | | 1/28/11 | | | 7,989,310 | | | | 7,793,746 | | | | (195,564 | ) |
| The Bank of New York Mellon Corporation | | | | British Pound | | | | | | | | | | | | | | | | | | | | | | | | |
| | | | | GBP | | 6,000,000 | | BUY | | 1/28/11 | | | 9,342,600 | | | | 9,352,496 | | | | 9,896 | |
| | | | | | | | | | | | | | | | | | | | | $ | (251,787 | ) |
| JPMorgan Chase & Co. | | | | British Pound | | | | | | | | | | | | | | | | | | | | | | | | |
| | | | | GBP | | 1,000,000 | | SELL | | 1/28/11 | | $ | 1,612,507 | | | $ | 1,558,749 | | | $ | 53,758 | |
| The Bank of New York Mellon Corporation | | | | British Pound | | | | | | | | | | | | | | | | | | | | | | | | |
| | | | | GBP | | 13,000,000 | | SELL | | 1/28/11 | | | 20,001,800 | | | | 20,263,740 | | | | (261,940 | ) |
| | | | | | | | | | | | | | | | | | | | | $ | (208,182 | ) |
A summary of derivative instruments by primary risk exposure is outlined in the following tables.
The fair value of derivative instruments as of December 31, 2010 was as follows:
Derivatives not accounted for as
hedging instruments
| | | | Location on Statement
of Assets and Liabilities
| | Fair Value
|
|---|
Asset Derivatives | | | | | | | | | | |
| Foreign exchange contracts | | | | Unrealized appreciation on forward foreign currency contracts | | $ | 73,990 | |
| Equity contracts | | | | Net Assets — Unrealized Appreciation* | | | 114,035 | |
Total Asset Derivatives | | | | | | $ | 188,025 | |
Liability Derivatives | | | | | | | | | | |
| Foreign exchange contracts | | | | Unrealized depreciation on forward foreign currency contracts | | $ | 533,959 | |
Total Liability Derivatives | | | | | | $ | 533,959 | |
| * | | Includes cumulative appreciation/depreciation of futures contracts as reported in the table following the Summary Portfolio of Investments. |
See Accompanying Notes to Financial Statements
108
ING FTSE 100 INDEX® PORTFOLIO |
| SUMMARY PORTFOLIO OF INVESTMENTS
AS OF DECEMBER 31, 2010 (CONTINUED) |
The effect of derivative instruments on the Portfolio’s Statement of Operations for the year ended December 31, 2010 was as follows:
| | | | Amount of Realized Gain or (Loss) on Derivatives Recognized in Income
| |
|---|
Derivatives not accounted for as
hedging instruments
| | | | Foreign currency
related transactions*
| | Futures
| | Total
|
|---|
| Equity contracts | | | | $ | — | | | $ | 3,943,536 | | | $ | 3,943,536 | |
| Foreign exchange contracts | | | | | 767,184 | | | | — | | | | 767,184 | |
Total | | | | $ | 767,184 | | | $ | 3,943,536 | | | $ | 4,710,720 | |
| | | | Change in Unrealized Appreciation or (Depreciation)
on Derivatives Recognized in Income
| |
|---|
Derivatives not accounted for as
hedging instruments
| | | | Foreign currency
related transactions*
| | Futures
| | Total
|
|---|
| Equity contracts | | | | $ | — | | | $ | (162,541 | ) | | $ | (162,541 | ) |
| Foreign exchange contracts | | | | | (459,969 | ) | | | — | | | | (459,969 | ) |
Total | | | | $ | (459,969 | ) | | $ | (162,541 | ) | | $ | (622,510 | ) |
| * | | Amounts recognized for forward foreign currency contracts are included in net realized gain (loss) on foreign currency related transactions and net change in unrealized appreciation or depreciation on foreign currency related transactions. |
See Accompanying Notes to Financial Statements
109
ING HANG SENG INDEX PORTFOLIO |
| PORTFOLIO OF INVESTMENTS
AS OF DECEMBER 31, 2010 |
Shares
|
|
|
|
|
|
|
| Value
|
| Percent
of Net
Assets
|
|---|
| |
COMMON STOCK: 96.0% |
| | | | | | | |
| 1,089,728 | | | | @ | | Aluminum Corp. of China Ltd. | | $ | 993,166 | | | | 0.4 | |
| 17,320,746 | | | | | | Bank of China Ltd. | | | 9,131,096 | | | | 4.1 | |
| 1,831,047 | | | | | | Bank of Communications Co., Ltd. | | | 1,842,697 | | | | 0.8 | |
| 1,134,000 | | | | | | China Coal Energy Co. — Class H | | | 1,768,834 | | | | 0.8 | |
| 16,599,107 | | | | | | China Construction Bank | | | 14,870,261 | | | | 6.7 | |
| 2,054,911 | | | | | | China Life Insurance Co., Ltd. | | | 8,366,804 | | | | 3.7 | |
| 4,634,337 | | | | | | China Petroleum & Chemical Corp. | | | 4,434,080 | | | | 2.0 | |
| 938,841 | | | | | | China Shenhua Energy Co., Ltd. | | | 3,934,624 | | | | 1.8 | |
| 592,261 | | | | @ | | Foxconn International Holdings Ltd. | | | 413,421 | | | | 0.2 | |
| 15,581,340 | | | | | | Industrial and Commercial Bank of China Ltd. | | | 11,599,547 | | | | 5.2 | |
| 5,826,604 | | | | | | PetroChina Co., Ltd. | | | 7,652,786 | | | | 3.4 | |
| 473,716 | | | | | | Ping An Insurance Group Co. of China Ltd. | | | 5,287,460 | | | | 2.4 | |
| 277,675 | | | | | | Tencent Holdings Ltd. | | | 6,028,170 | | | | 2.7 | |
| | | | | | | | | | 76,322,946 | | | | 34.2 | |
| |
| | | | | | | |
| 451,184 | | | | | | Bank of East Asia Ltd. | | | 1,888,007 | | | | 0.8 | |
| 1,281,000 | | | | | | Belle International Holdings | | | 2,163,751 | | | | 1.0 | |
| 1,022,129 | | | | | | BOC Hong Kong Holdings Ltd. | | | 3,475,775 | | | | 1.6 | |
| 325,818 | | | | | | Cathay Pacific Airways Ltd. | | | 898,774 | | | | 0.4 | |
| 383,739 | | | | | | Cheung Kong Holdings Ltd. | | | 5,913,985 | | | | 2.7 | |
| 302,285 | | | | | | China Merchants Holdings International Co., Ltd. | | | 1,193,248 | | | | 0.5 | |
| 1,662,601 | | | | | | China Mobile Ltd. | | | 16,484,457 | | | | 7.4 | |
| 1,128,991 | | | | | | China Overseas Land & Investment Ltd. | | | 2,087,243 | | | | 0.9 | |
| 331,286 | | | | | | China Resources Enterprise | | | 1,356,621 | | | | 0.6 | |
| 556,000 | | | | | | China Resources Land Ltd. | | | 1,015,418 | | | | 0.5 | |
| 519,654 | | | | | | China Resources Power Holdings Co. | | | 940,563 | | | | 0.4 | |
| 1,301,110 | | | | | | China Unicom Ltd. | | | 1,858,861 | | | | 0.8 | |
| 352,811 | | | | | | Citic Pacific Ltd. | | | 916,288 | | | | 0.4 | |
| 498,431 | | | | | | CLP Holdings Ltd. | | | 4,047,128 | | | | 1.8 | |
| 4,934,714 | | | | | | CNOOC Ltd. | | | 11,746,236 | | | | 5.3 | |
| 448,697 | | | | | | Cosco Pacific Ltd. | | | 780,901 | | | | 0.3 | |
| 337,979 | | | | | | Esprit Holdings Ltd. | | | 1,607,733 | | | | 0.7 | |
| 575,706 | | | | | | Hang Lung Properties Ltd. | | | 2,690,863 | | | | 1.2 | |
| 211,243 | | | | | | Hang Seng Bank Ltd. | | | 3,470,793 | | | | 1.6 | |
| 299,024 | | | | | | Henderson Land Development Co., Ltd. | | | 2,036,839 | | | | 0.9 | |
| 1,190,144 | | | | | | Hong Kong & China Gas | | | 2,804,357 | | | | 1.3 | |
| |
COMMON STOCK: (continued) |
| | | | | | | |
| 282,841 | | | | | | Hong Kong Exchanges and Clearing Ltd. | | $ | 6,412,761 | | | | 2.9 | |
| 383,322 | | | | | | HongKong Electric Holdings | | | 2,416,475 | | | | 1.1 | |
| 588,464 | | | | | | Hutchison Whampoa Ltd. | | | 6,053,704 | | | | 2.7 | |
| 685,514 | | | | | | Li & Fung Ltd. | | | 3,977,371 | | | | 1.8 | |
| 398,143 | | | �� | | | MTR Corp. | | | 1,448,854 | | | | 0.6 | |
| 649,176 | | | | | | New World Development Ltd. | | | 1,217,983 | | | | 0.5 | |
| 676,241 | | | | | | Sino Land Co. | | | 1,263,575 | | | | 0.6 | |
| 425,555 | | | | | | Sun Hung Kai Properties Ltd. | | | 7,060,640 | | | | 3.2 | |
| 200,091 | | | | | | Swire Pacific Ltd. | | | 3,287,502 | | | | 1.5 | |
| 380,637 | | | | | | Wharf Holdings Ltd. | | | 2,926,506 | | | | 1.3 | |
| | | | | | | | | | 105,443,212 | | | | 47.3 | |
| |
| | | | | | | |
| 3,159,179 | | | | | | HSBC Holdings PLC | | | 32,259,869 | | | | 14.5 | |
| |
| | | | | | | Total Common Stock | | | | | | | | |
| | | | | | | (Cost $196,078,372) | | | 214,026,027 | | | | 96.0 | |
| |
SHORT-TERM INVESTMENTS: 2.8% |
| | | | | | | |
| 6,261,000 | | | | | | Blackrock Liquidity Funds TempFund Portfolio — Class I | | | 6,261,000 | | | | 2.8 | |
| |
| | | | | | | Total Short-Term Investments | | | | | | | | |
| | | | | | | (Cost $6,261,000) | | | 6,261,000 | | | | 2.8 | |
| |
| | | | | | | Total Investments in Securities | | | | | | | | |
| | | | | | | (Cost $202,339,372)* | | $ | 220,287,027 | | | | 98.8 | |
| | | | | | | Other Assets and Liabilities — Net | | | 2,689,564 | | | | 1.2 | |
| | | | | | | Net Assets | | $ | 222,976,591 | | | | 100.0 | |
| @ | | Non-income producing security |
| * | | Cost for federal income tax purposes is $204,982,729. |
| Net unrealized appreciation consists of: | | | | | | |
| Gross Unrealized Appreciation | | | | $ | 18,662,444 | |
| Gross Unrealized Depreciation | | | | | (3,358,146 | ) |
| Net Unrealized Appreciation | | | | $ | 15,304,298 | |
Industry
| | | | Percentage of
Net Assets
|
|---|
| Consumer Discretionary | | | | | 3.5 | % |
| Consumer Staples | | | | | 0.6 | |
| Energy | | | | | 13.2 | |
| Financials | | | | | 57.5 | |
| Industrials | | | | | 5.1 | |
| Information Technology | | | | | 2.9 | |
| Materials | | | | | 0.4 | |
| Telecommunication Services | | | | | 8.2 | |
| Utilities | | | | | 4.6 | |
| Short-Term Investments | | | | | 2.8 | |
| Other Assets and Liabilities — Net | | | | | 1.2 | |
Net Assets | | | | | 100.0 | % |
See Accompanying Notes to Financial Statements
110
ING HANG SENG INDEX PORTFOLIO |
| PORTFOLIO OF INVESTMENTS
AS OF DECEMBER 31, 2010 (CONTINUED) |
Fair Value Measurementsˆ
The following is a summary of the fair valuations according to the inputs used as of December 31, 2010 in valuing the Portfolio’s assets and liabilities:
| | | | Quoted Prices
in Active Markets
for Identical Investments
(Level 1)
| | Other
Observable
Inputs#
(Level 2)
| | Significant
Unobservable
Inputs
(Level 3)
| | Fair Value
at
12/31/2010
|
|---|
Asset Table | | | | | | | | | | | | | | | | | | |
Investments, at value | | | | | | | | | | | | | | | | | | |
| Common Stock | | | | | | | | | | | | | | | | | | |
| China | | | | $ | — | | | $ | 76,322,946 | | | $ | — | | | $ | 76,322,946 | |
| Hong Kong | | | | | 2,416,475 | | | | 103,026,737 | | | | — | | | | 105,443,212 | |
| United Kingdom | | | | | — | | | | 32,259,869 | | | | — | | | | 32,259,869 | |
| Total Common Stock | | | | | 2,416,475 | | | | 211,609,552 | | | | — | | | | 214,026,027 | |
| Short-Term Investments | | | | | 6,261,000 | | | | — | | | | — | | | | 6,261,000 | |
| Total Investments, at value | | | | $ | 8,677,475 | | | $ | 211,609,552 | | | $ | — | | | $ | 220,287,027 | |
Other Financial Instruments+: | | | | | | | | | | | | | | | | | | |
| Futures | | | | | 50,197 | | | | — | | | | — | | | | 50,197 | |
| Total Assets | | | | $ | 8,727,672 | | | $ | 211,609,552 | | | $ | — | | | $ | 220,337,224 | |
| ˆ | | See Note 2, “Significant Accounting Policies” in the Notes to Financial Statements for additional information. |
| + | | Other Financial Instruments are derivatives not reflected in the Summary Portfolio of Investments and may include open forward foreign currency contracts, futures, swaps, and written options. |
Forward foreign currency contracts and futures are reported at their unrealized gain/loss at measurement date which represents the amount due to/from the Portfolio. Swaps and written options are reported at their market value at measurement date.
| # | | The earlier close of the foreign markets gives rise to the possibility that significant events, including broad market moves, may have occurred in the interim and may materially affect the value of those securities. To account for this, the Portfolio may frequently value many of its foreign equity securities using fair value prices based on third party vendor modeling tools to the extent available. Accordingly, a significant portion of the Portfolio’s investments are categorized as Level 2 investments. |
ING Hang Seng Index Portfolio Open Futures Contracts on December 31, 2010:
Contract Description
| | | | Number
of Contracts
| | Expiration Date
| | Notional Value
| | Unrealized
Appreciation
|
|---|
Long Contracts | | | | | | | | | | | | | | | | | | |
| Hang Seng Index | | | | | 59 | | | | 01/28/11 | | | $ | 8,736,749 | | | $ | 50,197 | |
| | | | | | | | | | | | | $ | 8,736,749 | | | $ | 50,197 | |
A summary of derivative instruments by primary risk exposure is outlined in the following tables.
The fair value of derivative instruments as of December 31, 2010 was as follows:
Derivatives not accounted for as
hedging instruments
| | | | Location on Statement
of Assets and Liabilities
| | Fair Value
|
|---|
Asset Derivatives | | | | | | | | | | |
| Equity contracts | | | | Net Assets — Unrealized appreciation*
| | $ | 50,197 | |
Total Asset Derivatives | | | | | | $ | 50,197 | |
| * | | Includes cumulative appreciation/depreciation of futures contracts as reported in the table following the Summary Portfolio of Investments. |
See Accompanying Notes to Financial Statements
111
ING HANG SENG INDEX PORTFOLIO |
| PORTFOLIO OF INVESTMENTS
AS OF DECEMBER 31, 2010 (CONTINUED) |
The effect of derivative instruments on the Portfolio’s Statement of Operations for the year ended December 31, 2010 was as follows:
| | | | Amount of Realized Gain or (Loss) on Derivatives Recognized in Income
|
|---|
Derivatives not accounted for as
hedging instruments
| | | | Futures
|
|---|
| Equity contracts | | | | $ | 134,861 | |
Total | | | | $ | 134,861 | |
| |
| | | | | Change in Unrealized Appreciation or (Depreciation)
on Derivatives Recognized in Income |
Derivatives not accounted for as
hedging instruments
| | | | Futures |
| Equity contracts | | | | $ | (810,454 | ) |
Total | | | | $ | (810,454 | ) |
See Accompanying Notes to Financial Statements
112
ING INTERNATIONAL INDEX PORTFOLIO |
| SUMMARY PORTFOLIO OF INVESTMENTS
AS OF DECEMBER 31, 2010 |
Shares
|
|
|
|
|
|
|
| Value
|
| Percent of
Net Assets
|
|---|
| |
COMMON STOCK: 95.4% |
| | | | | | | |
| 85,261 | | | | | | Australia & New Zealand Banking Group Ltd. | | $ | 2,036,466 | | | | 0.5 | |
| 110,459 | | | | | | BHP Billiton Ltd. | | | 5,136,458 | | | | 1.4 | |
| 50,054 | | | | | | Commonwealth Bank of Australia | | | 2,600,828 | | | | 0.7 | |
| 68,978 | | | | | | National Australia Bank Ltd. | | | 1,673,511 | | | | 0.5 | |
| 99,107 | | | | | | Westpac Banking Corp. | | | 2,251,501 | | | | 0.6 | |
| | | | | | | Other Securities | | | 15,608,948 | | | | 4.3 | |
| | | | | | | | | | 29,307,712 | | | | 8.0 | |
| |
| | | | | | | |
| | | | | | | Other Securities | | | 1,228,918 | | | | 0.3 | |
| |
| | | | | | | |
| | | | | | | Other Securities | | | 3,250,216 | | | | 0.9 | |
| |
| | | | | | | |
| | | | | | | Other Securities | | | 311,897 | | | | 0.1 | |
| |
| | | | | | | |
| | | | | | | Other Securities | | | 70,832 | | | | 0.0 | |
| |
| | | | | | | |
| | | | | | | Other Securities | | | 95,270 | | | | 0.0 | |
| |
| | | | | | | |
| 13,582 | | | | | | Novo-Nordisk A/S | | | 1,530,210 | | | | 0.4 | |
| | | | | | | Other Securities | | | 2,103,351 | | | | 0.6 | |
| | | | | | | | | | 3,633,561 | | | | 1.0 | |
| |
| | | | | | | |
| | | | | | | Other Securities | | | 3,920,976 | | | | 1.1 | |
| |
| | | | | | | |
| 30,458 | | | | | | BNP Paribas | | | 1,939,767 | | | | 0.5 | |
| 40,915 | | | | | | Gaz de France | | | 1,469,469 | | | | 0.4 | |
| 34,423 | | | | | | Sanofi-Aventis | | | 2,206,886 | | | | 0.6 | |
| 68,332 | | | | | | Total S.A. | | | 3,639,535 | | | | 1.0 | |
| | | | | | | Other Securities | | | 21,846,831 | | | | 6.0 | |
| | | | | | | | | | 31,102,488 | | | | 8.5 | |
| |
| | | | | | | |
| 14,787 | | | | | | Allianz AG | | | 1,756,928 | | | | 0.5 | |
| 29,617 | | | | | | BASF AG | | | 2,363,525 | | | | 0.6 | |
| 26,663 | | | | | | Bayer AG | | | 1,976,458 | | | | 0.5 | |
| 29,528 | | | | @ | | DaimlerChrysler AG | | | 1,998,009 | | | | 0.6 | |
| 30,506 | | | | | | Deutsche Bank AG | | | 1,595,341 | | | | 0.4 | |
| 60,568 | | | | | | E.ON AG | | | 1,849,677 | | | | 0.5 | |
| 26,835 | | | | | | Siemens AG | | | 3,324,176 | | | | 0.9 | |
| | | | | | | Other Securities | | | 12,737,553 | | | | 3.5 | |
| | | | | | | | | | 27,601,667 | | | | 7.5 | |
| |
| | | | | | | |
| | | | | | | Other Securities | | | 748,775 | | | | 0.2 | |
| |
COMMON STOCK: (continued) |
| | | | | | | |
| | | | | | | Other Securities | | $ | 152,542 | | | | 0.0 | |
| |
| | | | | | | |
| | | | | | | Other Securities | | | 9,567,621 | | | | 2.6 | |
| |
| | | | | | | |
| | | | | | | Other Securities | | | 860,495 | | | | 0.2 | |
| |
| | | | | | | |
| 31,794 | | | | | | Teva Pharmaceutical Industries Ltd. | | | 1,654,827 | | | | 0.5 | |
| | | | | | | Other Securities | | | 1,132,709 | | | | 0.3 | |
| | | | | | | | | | 2,787,536 | | | | 0.8 | |
| |
| | | | | | | |
| 84,115 | | | | | | ENI S.p.A. | | | 1,843,583 | | | | 0.5 | |
| | | | | | | Other Securities | | | 7,128,294 | | | | 2.0 | |
| | | | | | | | | | 8,971,877 | | | | 2.5 | |
| |
| | | | | | | |
| 36,800 | | | | L | | Canon, Inc. | | | 1,890,242 | | | | 0.5 | |
| 52,800 | | | | | | Honda Motor Co., Ltd. | | | 2,083,952 | | | | 0.6 | |
| 423,021 | | | | | | Mitsubishi UFJ Financial Group, Inc. | | | 2,280,980 | | | | 0.6 | |
| 44,700 | | | | | | Sumitomo Mitsui Financial Group, Inc. | | | 1,582,699 | | | | 0.4 | |
| 91,489 | | | | | | Toyota Motor Corp. | | | 3,601,780 | | | | 1.0 | |
| | | | | | | Other Securities | | | 66,405,153 | | | | 18.1 | |
| | | | | | | | | | 77,844,806 | | | | 21.2 | |
| |
| | | | | | | |
| | | | | | | Other Securities | | | 134,564 | | | | 0.0 | |
| |
| | | | | | | |
| | | | | | | Other Securities | | | 1,635,447 | | | | 0.5 | |
| |
| | | | | | | |
| | | | | | | Other Securities | | | 324,287 | | | | 0.1 | |
| |
| | | | | | | |
| | | | | | | Other Securities | | | 356,854 | | | | 0.1 | |
| |
| | | | | | | |
| | | | | | | Other Securities | | | 101,902 | | | | 0.0 | |
| |
| | | | | | | |
| | | | | | | Other Securities | | | 168,413 | | | | 0.0 | |
| |
| | | | | | | |
| 125,959 | | | | @, ** | | ING Groep NV | | | 1,228,824 | | | | 0.4 | |
| 119,912 | | | | | | Royal Dutch Shell PLC — Class A | | | 4,003,668 | | | | 1.9 | |
| 92,545 | | | | | | Royal Dutch Shell PLC — Class B | | | 3,064,584 | | | | | |
| 57,258 | | | | | | Unilever NV | | | 1,786,312 | | | | 0.5 | |
| | | | | | | Other Securities | | | 6,324,522 | | | | 1.7 | |
| | | | | | | | | | 16,407,910 | | | | 4.5 | |
| |
See Accompanying Notes to Financial Statements
113
ING INTERNATIONAL INDEX PORTFOLIO |
| SUMMARY PORTFOLIO OF INVESTMENTS
AS OF DECEMBER 31, 2010 (CONTINUED) |
Shares
|
|
|
|
|
|
|
| Value
|
| Percent of
Net Assets
|
|---|
| |
COMMON STOCK: (continued) |
| | | | | | | |
| | | | | | | Other Securities | | $ | 251,943 | | | | 0.1 | |
| |
| | | | | | | |
| | | | | | | Other Securities | | | 2,668,960 | | | | 0.7 | |
| |
| | | | | | | |
| | | | | | | Other Securities | | | 856,308 | | | | 0.2 | |
| |
| | | | | | | |
| | | | | | | Other Securities | | | 5,359,600 | | | | 1.5 | |
| |
| | | | | | | |
| 272,958 | | | | | | Banco Santander Central Hispano S.A. | | | 2,908,593 | | | | 0.8 | |
| 136,375 | | | | @ | | Telefonica S.A. | | | 3,113,447 | | | | 0.9 | |
| | | | | | | Other Securities | | | 5,652,995 | | | | 1.5 | |
| | | | | | | | | | 11,675,035 | | | | 3.2 | |
| |
| | | | | | | |
| | | | | | | Other Securities | | | 11,543,913 | | | | 3.2 | |
| |
| | | | | | | |
| 74,359 | | | | @ | | ABB Ltd. | | | 1,660,281 | | | | 0.5 | |
| 36,710 | | | | | | Credit Suisse Group | | | 1,478,493 | | | | 0.4 | |
| 112,281 | | | | | �� | Nestle S.A. | | | 6,577,833 | | | | 1.8 | |
| 69,427 | | | | | | Novartis AG | | | 4,086,863 | | | | 1.1 | |
| 23,158 | | | | | | Roche Holding AG — Genusschein | | | 3,394,797 | | | | 0.9 | |
| 117,832 | | | | @ | | UBS AG — Reg | | | 1,934,644 | | | | 0.5 | |
| 66,441 | | | | | | Xstrata PLC | | | 1,574,396 | | | | 0.4 | |
| | | | | | | Other Securities | | | 9,754,734 | | | | 2.7 | |
| | | | | | | | | | 30,462,041 | | | | 8.3 | |
| |
| | | | | | | |
| 42,158 | | | | | | Anglo American PLC | | | 2,205,392 | | | | 0.6 | |
| 46,300 | | | | | | AstraZeneca PLC | | | 2,110,093 | | | | 0.6 | |
| 367,981 | | | | | | Barclays PLC | | | 1,520,822 | | | | 0.4 | |
| 107,918 | | | | | | BG Group PLC | | | 2,189,139 | | | | 0.6 | |
| 69,966 | | | | | | BHP Billiton PLC | | | 2,814,849 | | | | 0.8 | |
| 600,381 | | | | | | BP PLC | | | 4,425,360 | | | | 1.2 | |
| 63,139 | | | | | | British American Tobacco PLC | | | 2,428,703 | | | | 0.6 | |
| 82,863 | | | | | | Diageo PLC | | | 1,535,286 | | | | 0.4 | |
| 170,727 | | | | | | GlaxoSmithKline PLC | | | 3,310,876 | | | | 0.9 | |
| 572,603 | | | | | | HSBC Holdings PLC | | | 5,852,067 | | | | 1.6 | |
| 47,095 | | | | | | Rio Tinto PLC | | | 3,356,995 | | | | 0.9 | |
| 76,678 | | | | | | Standard Chartered PLC | | | 2,069,967 | | | | 0.6 | |
| 266,225 | | | | | | Tesco PLC | | | 1,765,342 | | | | 0.5 | |
| |
COMMON STOCK: (continued) |
| | | | | | | United Kingdom: (continued) |
| 1,685,280 | | | | | | Vodafone Group PLC | | $ | 4,424,094 | | | | 1.2 | |
| | | | | | | Other Securities | | | 26,432,027 | | | | 7.2 | |
| | | | | | | | | | 66,441,012 | | | | 18.1 | |
| |
| | | | | | | Total Common Stock | | | | | | | | |
| | | | | | | (Cost $261,701,852) | | | 349,845,378 | | | | 95.4 | |
| |
REAL ESTATE INVESTMENT TRUSTS: 1.4% |
| | | | | | | |
| | | | | | | Other Securities | | | 1,840,063 | | | | 0.5 | |
| |
| | | | | | | |
| | | | | | | Other Securities | | | 1,046,585 | | | | 0.3 | |
| |
| | | | | | | |
| | | | | | | Other Securities | | | 243,201 | | | | 0.1 | |
| |
| | | | | | | |
| | | | | | | Other Securities | | | 549,296 | | | | 0.2 | |
| |
| | | | | | | |
| | | | | | | Other Securities | | | 91,690 | | | | 0.0 | |
| |
| | | | | | | |
| | | | | | | Other Securities | | | 209,369 | | | | 0.1 | |
| |
| | | | | | | |
| | | | | | | Other Securities | | | 866,165 | | | | 0.2 | |
| |
| | | | | | | Total Real Estate Investment Trusts | | | | | | | | |
| | | | | | | (Cost $3,723,404) | | | 4,846,369 | | | | 1.4 | |
| |
PREFERRED STOCK: 0.4% |
| | | | | | | |
| | | | | | | Other Securities | | | 1,527,881 | | | | 0.4 | |
| |
| | | | | | | Total Preferred Stock | | | | | | | | |
| | | | | | | (Cost $878,253) | | | 1,527,881 | | | | 0.4 | |
| |
RIGHTS: 0.0% |
| | | | | | | |
| | | | | | | Other Securities | | | — | | | | 0.0 | |
| |
| | | | | | | Total Rights | | | | | | | | |
| | | | | | | (Cost $—) | | | — | | | | 0.0 | |
| |
WARRANTS: 0.0% |
| | | | | | | |
| | | | | | | Other Securities | | | 442 | | | | 0.0 | |
| | | | | | | |
| | | | | | | Other Securities | | | 3,202 | | | | 0.0 | |
| |
| | | | | | | Total Warrants | | | | | | | | |
| | | | | | | (Cost $1,997) | | | 3,644 | | | | 0.0 | |
See Accompanying Notes to Financial Statements
114
ING INTERNATIONAL INDEX PORTFOLIO |
| SUMMARY PORTFOLIO OF INVESTMENTS
AS OF DECEMBER 31, 2010 (CONTINUED) |
Principal
Amount
|
|
|
|
|
|
|
| Value
|
| Percent
of Net
Assets
|
|---|
| |
CORPORATE BONDS/NOTES: 0.0% |
| | | | | | | |
| | | | | | | Other Securities | | $ | 16,754 | | | | 0.0 | |
| |
| | | | | | | Total Corporate Bonds/Notes | | | | | | | | |
| | | | | | | (Cost $27,688) | | | 16,754 | | | | 0.0 | |
| |
| | | | | | | Total Long-Term Investments | | | | | | | | |
| | | | | | | (Cost $266,333,194) | | | 356,240,026 | | | | 97.2 | |
| |
SHORT-TERM INVESTMENTS: 1.8% |
| | | | | | | |
| $1,764,000 | | | | | | Blackrock Liquidity Funds TempFund Portfolio — Class I | | | 1,764,000 | | | | 0.5 | |
| |
| | | | | | | Total Mutual Funds | | | | | | | | |
| | | | | | | (Cost $1,764,000) | | | 1,764,000 | | | | 0.5 | |
| |
| | | | | | | Securities Lending Collateralcc: 1.3% |
| 4,866,114 | | | | | | BNY Mellon Overnight Government Fund(1) | | | 4,866,114 | | | | 1.3 | |
| 37,727 | | | | R | | BNY Institutional Cash Reserves Fund, Series B(1)(2) | | | 30,182 | | | | 0.0 | |
| |
| | | | | | | Total Securities Lending Collateral | | | | | | | | |
| | | | | | | (Cost $4,903,841) | | | 4,896,296 | | | | 1.3 | |
| |
| | | | | | | Total Short-Term Investments | | | | | | | | |
| | | | | | | (Cost $6,667,841) | | | 6,660,296 | | | | 1.8 | |
| |
| | | | | | | Total Investments in Securities | | | | | | | | |
| | | | | | | (Cost $273,001,035)* | | $ | 362,900,322 | | | | 99.0 | |
| | | | | | | Other Assets and Liabilities — Net | | | 3,760,122 | | | | 1.0 | |
| | | | | | | Net Assets | | $ | 366,660,444 | | | | 100.0 | |
“Other Securities” represents issues not identified as the top 50 holdings in terms of market value and issues or issuers not exceeding 1% of net assets individually or in aggregate respectively as of December 31, 2010.
The following footnotes apply to either the individual securities noted or one or more of the securities aggregated and listed as a single line item.
| @ | | Non-income producing security |
| cc | | Securities purchased with cash collateral for securities loaned. |
| (1) | | Collateral received from brokers for securities lending was invested in these short-term investments. |
| (2) | | On September 12, 2008, BNY established a separate sleeve of the Institutional Cash Reserves Fund (Series B) to hold certain Lehman Brothers defaulted debt obligations. The Portfolio’s position in Series B is being fair valued daily. Please see the accompanying Notes to Financial Statements for additional details on securities lending. |
| L | | Loaned security, a portion or all of the security is on loan at December 31, 2010. |
| ** | | Investment in affiliate |
| * | | Cost for federal income tax purposes is $282,663,917. |
| Net unrealized appreciation consists of: | | | | | | |
| Gross Unrealized Appreciation | | | | $ | 84,081,499 | |
| Gross Unrealized Depreciation | | | | | (3,845,094 | ) |
| Net Unrealized Appreciation | | | | $ | 80,236,405 | |
Industry
| | | | Percentage of
Net Assets
|
|---|
| Consumer Discretionary | | | | | 10.2 | % |
| Consumer Staples | | | | | 9.8 | |
| Energy | | | | | 7.7 | |
| Financials | | | | | 23.1 | |
| Health Care | | | | | 7.9 | |
| Industrials | | | | | 12.3 | |
| Information Technology | | | | | 4.8 | |
| Materials | | | | | 11.2 | |
| Telecommunication Services | | | | | 5.3 | |
| Utilities | | | | | 4.9 | |
| Short-Term Investments | | | | | 1.8 | |
| Other Assets and Liabilities — Net | | | | | 1.0 | |
Net Assets | | | | | 100.0 | % |
Fair Value Measurementsˆ
The following is a summary of the fair valuations according to the inputs used as of December 31, 2010 in valuing the Portfolio’s assets and liabilities:
| | | | Quoted Prices in
Active Markets for
Identical Investments
(Level 1)
| | Other
Observable
Inputs#
(Level 2)
| | Significant
Unobservable
Inputs
(Level 3)
| | Fair Value
at
12/31/2010
|
|---|
Asset Table | | | | | | | | | | | | | | | | | | |
Investments, at value | | | | | | | | | | | | | | | | | | |
| Common Stock | | | | | | | | | | | | | | | | | | |
| Australia | | | | $ | 483,960 | | | $ | 28,823,752 | | | $ | — | | | $ | 29,307,712 | |
| Austria | | | | | — | | | | 1,228,918 | | | | — | | | | 1,228,918 | |
| Belgium | | | | | — | | | | 3,250,216 | | | | — | | | | 3,250,216 | |
| Bermuda | | | | | — | | | | 311,897 | | | | — | | | | 311,897 | |
| China | | | | | — | | | | 70,832 | | | | — | | | | 70,832 | |
| Cyprus | | | | | — | | | | 95,270 | | | | — | | | | 95,270 | |
| Denmark | | | | | — | | | | 3,633,561 | | | | — | | | | 3,633,561 | |
| Finland | | | | | — | | | | 3,920,976 | | | | — | | | | 3,920,976 | |
| France | | | | | 108,113 | | | | 30,994,375 | | | | — | | | | 31,102,488 | |
See Accompanying Notes to Financial Statements
115
ING INTERNATIONAL INDEX PORTFOLIO |
| SUMMARY PORTFOLIO OF INVESTMENTS
AS OF DECEMBER 31, 2010 (CONTINUED) |
| | | | Quoted Prices in
Active Markets for
Identical Investments
(Level 1)
| | Other
Observable
Inputs#
(Level 2)
| | Significant
Unobservable
Inputs
(Level 3)
| | Fair Value
at
12/31/2010
|
|---|
| Common Stock (continued) | | | | | | | | | | | | | | | | | | |
| Germany | | | | $ | 262,798 | | | $ | 27,338,869 | | | $ | — | | | $ | 27,601,667 | |
| Greece | | | | | — | | | | 748,775 | | | | — | | | | 748,775 | |
| Guernsey | | | | | — | | | | 152,542 | | | | — | | | | 152,542 | |
| Hong Kong | | | | | 985,103 | | | | 8,582,518 | | | | — | | | | 9,567,621 | |
| Ireland | | | | | 113,560 | | | | 746,935 | | | | — | | | | 860,495 | |
| Israel | | | | | — | | | | 2,787,536 | | | | — | | | | 2,787,536 | |
| Italy | | | | | 98,663 | | | | 8,873,214 | | | | — | | | | 8,971,877 | |
| Japan | | | | | — | | | | 77,844,806 | | | | — | | | | 77,844,806 | |
| Kazakhstan | | | | | — | | | | 134,564 | | | | — | | | | 134,564 | |
| Luxembourg | | | | | — | | | | 1,635,447 | | | | — | | | | 1,635,447 | |
| Macau | | | | | — | | | | 324,287 | | | | — | | | | 324,287 | |
| Malaysia | | | | | — | | | | 356,854 | | | | — | | | | 356,854 | |
| Mauritius | | | | | — | | | | 101,902 | | | | — | | | | 101,902 | |
| Mexico | | | | | — | | | | 168,413 | | | | — | | | | 168,413 | |
| Netherlands | | | | | — | | | | 16,407,910 | | | | — | | | | 16,407,910 | |
| New Zealand | | | | | — | | | | 251,943 | | | | — | | | | 251,943 | |
| Norway | | | | | — | | | | 2,668,960 | | | | — | | | | 2,668,960 | |
| Portugal | | | | | — | | | | 856,308 | | | | — | | | | 856,308 | |
| Singapore | | | | | 90,382 | | | | 5,269,218 | | | | — | | | | 5,359,600 | |
| Spain | | | | | 210,404 | | | | 11,464,631 | | | | — | | | | 11,675,035 | |
| Sweden | | | | | 7,750 | | | | 11,536,163 | | | | — | | | | 11,543,913 | |
| Switzerland | | | | | 146,974 | | | | 30,315,067 | | | | — | | | | 30,462,041 | |
| United Kingdom | | | | | 469,230 | | | | 65,971,782 | | | | — | | | | 66,441,012 | |
| Total Common Stock | | | | | 2,976,937 | | | | 346,868,441 | | | | — | | | | 349,845,378 | |
| Real Estate Investment Trusts | | | | | 184,385 | | | | 4,661,984 | | | | — | | | | 4,846,369 | |
| Preferred Stock | | | | | — | | | | 1,527,881 | | | | — | | | | 1,527,881 | |
| Warrants | | | | | 3,644 | | | | — | | | | — | | | | 3,644 | |
| Corporate Bonds/Notes | | | | | — | | | | — | | | | 16,754 | | | | 16,754 | |
| Short-Term Investments | | | | | 6,630,114 | | | | — | | | | 30,182 | | | | 6,660,296 | |
| Total Investments, at value | | | | $ | 9,795,080 | | | $ | 353,058,306 | | | $ | 46,936 | | | $ | 362,900,322 | |
Other Financial Instruments+: | | | | | | | | | | | | | | | | | | |
| Forward foreign currency contracts | | | | | — | | | | 119,287 | | | | — | | | | 119,287 | |
| Futures | | | | | 31,885 | | | | — | | | | — | | | | 31,885 | |
| Total Assets | | | | $ | 9,826,965 | | | $ | 353,177,593 | | | $ | 46,936 | | | $ | 363,051,494 | |
Liabilities Table | | | | | | | | | | | | | | | | | | |
Other Financial Instruments+: | | | | | | | | | | | | | | | | | | |
| Forward foreign currency contracts | | | | $ | — | | | $ | (425,919 | ) | | $ | — | | | $ | (425,919 | ) |
| Total Liabilities | | | | $ | — | | | $ | (425,919 | ) | | $ | — | | | $ | (425,919 | ) |
The following is a reconciliation of the fair valuations using significant unobservable inputs (Level 3) for the Portfolio’s assets and liabilities during the period ended December 31, 2010:
| | | | Beginning
Balance
12/31/2009
| | Purchases
| | Sales
| | Accrued
Discounts/
(Premiums)
| | Total
Realized
Gain/(Loss)
| | Total Unrealized
Appreciation/
(Depreciation)
| | Transfers
Into
Level 3
| | Transfers
Out of
Level 3
| | Ending
Balance
12/31/2010
|
|---|
Asset Table | | | | | | | | | | | | | | | | | | | | | | | | | | | | | | | | | | | | | | |
Investments, at value | | | | | | | | | | | | | | | | | | | | | | | | | | | | | | | | | | | | | | |
| Rights | | | | | 1 | | | | — | | | | — | | | | — | | | | — | | | | (1 | ) | | | — | | | | — | | | | — | |
| Corporate Bonds/Notes | | | | | — | | | | — | | | | — | | | | — | | | | — | | | | — | | | | 16,754 | | | | — | | | | 16,754 | |
| Short-Term Investments | | | | | 30,182 | | | | — | | | | — | | | | — | | | | — | | | | — | | | | — | | | | — | | | | 30,182 | |
| Total Investments, at value | | | | $ | 30,183 | | | $ | — | | | $ | — | | | $ | — | | | $ | — | | | $ | (1 | ) | | $ | 16,754 | | | $ | — | | | $ | 46,936 | |
As of December 31, 2010, total change in unrealized gain (loss) on Level 3 securities still held at period end and included in the change in net assets was $1.
| ˆ | | See Note 2, “Significant Accounting Policies” in the Notes to Financial Statements for additional information. |
See Accompanying Notes to Financial Statements
116
ING INTERNATIONAL INDEX PORTFOLIO |
| SUMMARY PORTFOLIO OF INVESTMENTS
AS OF DECEMBER 31, 2010 (CONTINUED) |
| + | | Other Financial Instruments are derivatives not reflected in the Summary Portfolio of Investments and may include open forward foreign currency contracts, futures, swaps, and written options. Forward foreign currency contracts and futures are reported at their unrealized gain/loss at measurement date which represents the amount due to/from the Portfolio. Swaps and written options are reported at their market value at measurement date. |
Transfers in or out of Level 3 represents either the beginning value (for transfers in), or the ending value (for transfers out) of any security or derivative instrument where a change in the pricing level occurred from the beginning to the end of the period. It is the policy of the Portfolio to recognize transfers at the end of the reporting period.
| # | | The earlier close of the foreign markets gives rise to the possibility that significant events, including broad market moves, may have occurred in the interim and may materially affect the value of those securities. To account for this, the Portfolio may frequently value many of its foreign equity securities using fair value prices based on third party vendor modeling tools to the extent available. Accordingly, a significant portion of the Portfolio’s investments are categorized as Level 2 investments. |
ING International Index Portfolio Open Futures Contracts on December 31, 2010:
Contract Description
| | | | Number
of Contracts
| | Expiration Date
| | Notional Value
| | Unrealized
Appreciation/
(Depreciation)
|
|---|
Long Contracts
| | | | | | | | | | | | | | | | | | |
| Euro STOXX 50® | | | | | 95 | | | | 03/18/11 | | | $ | 3,546,965 | | | $ | (52,998 | ) |
| FTSE 100 Index | | | | | 31 | | | | 03/18/11 | | | | 2,848,191 | | | | 29,958 | |
| Tokyo Price Index (TOPIX) | | | | | 25 | | | | 03/10/11 | | | | 2,758,960 | | | | 66,799 | |
| ASX SPI 200® Index | | | | | 11 | | | | 03/17/11 | | | | 1,330,405 | | | | (11,874 | ) |
| | | | | | | | | | | | | $ | 10,484,521 | | | $ | 31,885 | |
At December 31, 2010 the following forward foreign currency contracts were outstanding for the ING International Index Portfolio:
Counterparty
| | | | Currency
| |
| | Buy/Sell
| | Settlement
Date
| | In Exchange For
| | Fair Value
| | Unrealized
Appreciation
(Depreciation)
|
|---|
| Brown Brothers Harriman & Co. | | | | EU Euro | | | | | | | | | | | | | | | | | | | | | | | | |
| | | | | EUR | | 1,300,000 | | BUY | | 1/28/11 | | $ | 1,830,976 | | | $ | 1,737,115 | | | $ | (93,861 | ) |
| Brown Brothers Harriman & Co. | | | | EU Euro | | | | | | | | | | | | | | | | | | | | | | | | |
| | | | | EUR | | 400,000 | | BUY | | 1/28/11 | | | 539,780 | | | | 534,497 | | | | (5,283 | ) |
| Credit Suisse First Boston | | | | Australian Dollar | | | | | | | | | | | | | | | | | | | | | | | | |
| | | | | AUD | | 400,000 | | BUY | | 1/28/11 | | | 383,910 | | | | 407,563 | | | | 23,653 | |
| Credit Suisse First Boston | | | | British Pound | | | | | | | | | | | | | | | | | | | | | | | | |
| | | | | GBP | | 800,000 | | BUY | | 1/28/11 | | | 1,262,290 | | | | 1,246,999 | | | | (15,291 | ) |
| Credit Suisse First Boston | | | | Japanese Yen | | | | | | | | | | | | | | | | | | | | | | | | |
| | | | | JPY | | 110,000,000 | | BUY | | 1/28/11 | | | 1,358,177 | | | | 1,355,295 | | | | (2,882 | ) |
| Credit Suisse First Boston | | | | Japanese Yen | | | | | | | | | | | | | | | | | | | | | | | | |
| | | | | JPY | | 50,000,000 | | BUY | | 1/28/11 | | | 600,453 | | | | 616,043 | | | | 15,590 | |
| JPMorgan Chase & Co. | | | | Australian Dollar | | | | | | | | | | | | | | | | | | | | | | | | |
| | | | | AUD | | 300,000 | | BUY | | 1/28/11 | | | 301,990 | | | | 305,673 | | | | 3,683 | |
| JPMorgan Chase & Co. | | | | EU Euro | | | | | | | | | | | | | | | | | | | | | | | | |
| | | | | EUR | | 2,500,000 | | BUY | | 1/28/11 | | | 3,443,496 | | | | 3,340,605 | | | | (102,891 | ) |
| JPMorgan Chase & Co. | | | | British Pound | | | | | | | | | | | | | | | | | | | | | | | | |
| | | | | GBP | | 800,000 | | BUY | | 1/28/11 | | | 1,297,366 | | | | 1,246,999 | | | | (50,367 | ) |
| JPMorgan Chase & Co. | | | | British Pound | | | | | | | | | | | | | | | | | | | | | | | | |
| | | | | GBP | | 500,000 | | BUY | | 1/28/11 | | | 794,542 | | | | 779,375 | | | | (15,167 | ) |
| The Bank of New York Mellon Corporation | | | | Japanese Yen | | | | | | | | | | | | | | | | | | | | | | | | |
| | | | | JPY | | 200,000,000 | | BUY | | 1/28/11 | | | 2,454,349 | | | | 2,464,172 | | | | 9,823 | |
| | | | | | | | | | | | | | | | | | | | | $ | (232,993 | ) |
| The Bank of New York Mellon Corporation | | | | EU Euro | | | | | | | | | | | | | | | | | | | | | | | | |
| | | | | EUR | | 1,000,000 | | SELL | | 1/28/11 | | $ | 1,388,025 | | | $ | 1,336,242 | | | $ | 51,783 | |
| The Bank of New York Mellon Corporation | | | | British Pound | | | | | | | | | | | | | | | | | | | | | | | | |
| | | | | GBP | | 300,000 | | SELL | | 1/28/11 | | | 479,347 | | | | 467,625 | | | | 11,722 | |
| The Bank of New York Mellon Corporation | | | | Japanese Yen | | | | | | | | | | | | | | | | | | | | | | | | |
| | | | | JPY | | 30,000,000 | | SELL | | 1/28/11 | | | 372,659 | | | | 369,626 | | | | 3,033 | |
| The Bank of New York Mellon Corporation | | | | Japanese Yen | | | | | | | | | | | | | | | | | | | | | | | | |
| | | | | JPY | | 200,000,000 | | SELL | | 1/28/11 | | | 2,388,630 | | | | 2,464,172 | | | | (75,542 | ) |
| The Bank of New York Mellon Corporation | | | | British Pound | | | | | | | | | | | | | | | | | | | | | | | | |
| | | | | GBP | | 1,200,000 | | SELL | | 1/28/11 | | | 1,868,400 | | | | 1,870,499 | | | | (2,099 | ) |
| The Bank of New York Mellon Corporation | | | | EU Euro | | | | | | | | | | | | | | | | | | | | | | | | |
| | | | | EUR | | 1,800,000 | | SELL | | 1/28/11 | | | 2,342,700 | | | | 2,405,236 | | | | (62,536 | ) |
| | | | | | | | | | | | | | | | | | | | | $ | (73,639 | ) |
See Accompanying Notes to Financial Statements
117
ING INTERNATIONAL INDEX PORTFOLIO |
| SUMMARY PORTFOLIO OF INVESTMENTS
AS OF DECEMBER 31, 2010 (CONTINUED) |
A summary of derivative instruments by primary risk exposure is outlined in the following tables.
The fair value of derivative instruments as of December 31, 2010 was as follows:
Derivatives not accounted for as
hedging instruments
| | | | Location on Statement
of Assets and Liabilities
| | Fair Value
|
|---|
Asset Derivatives | | | | | | | | | | |
| Foreign exchange contracts | | | | Unrealized appreciation on forward foreign currency contracts | | $ | 119,287 | |
| Equity contracts | | | | Net Assets — Unrealized appreciation* | | | 96,757 | |
Total Asset Derivatives | | | | | | $ | 216,044 | |
Liability Derivatives | | | | | | | | | | |
| Foreign exchange contracts | | | | Unrealized depreciation on forward foreign currency contracts | | $ | 425,919 | |
| Equity contracts | | | | Net Assets — Unrealized depreciation* | | | 64,872 | |
Total Liability Derivatives | | | | | | $ | 490,791 | |
| * | | Includes cumulative appreciation/depreciation of futures contracts as reported in the table following the Summary Portfolio of Investments. |
The effect of derivative instruments on the Portfolio’s Statement of Operations for the year ended December 31, 2010 was as follows:
| | | | Amount of Realized Gain or (Loss) on Derivatives Recognized in Income
| |
|---|
Derivatives not accounted for as
hedging instruments
| | | | Foreign currency
related transactions**
| | Futures
| | Total
|
|---|
| Equity contracts | | | | $ | — | | | $ | 1,610,647 | | | $ | 1,610,647 | |
| Foreign exchange contracts | | | | | 835,950 | | | | — | | | | 835,950 | |
Total | | | | $ | 835,950 | | | $ | 1,610,647 | | | $ | 2,446,597 | |
| | | | Change in Unrealized Appreciation or (Depreciation)
on Derivatives Recognized in Income
| |
|---|
Derivatives not accounted for as
hedging instruments
| | | | Foreign currency
related transactions**
| | Futures
| | Total
|
|---|
| Equity contracts | | | | $ | — | | | $ | (196,309 | ) | | $ | (196,309 | ) |
| Foreign exchange contracts | | | | | (306,632 | ) | | | — | | | | (306,632 | ) |
Total | | | | $ | (306,632 | ) | | $ | (196,309 | ) | | $ | (502,941 | ) |
| ** | | Amounts recognized for forward foreign currency contracts are included in net realized gain (loss) on foreign currency related transactions and net change in unrealized appreciation or depreciation on foreign currency related transactions. |
See Accompanying Notes to Financial Statements
118
ING JAPAN TOPIX INDEX PORTFOLIO |
| SUMMARY PORTFOLIO OF INVESTMENTS
AS OF DECEMBER 31, 2010 |
Shares
|
|
|
|
|
|
|
| Value
|
| Percent
of Net
Assets
|
|---|
| |
COMMON STOCK: 99.1% |
| | | | | | | Consumer Discretionary: 18.9% |
| 60,300 | | | | | | Denso Corp. | | $ | 2,073,046 | | | | 0.5 | |
| 229,100 | | | | | | Honda Motor Co., Ltd. | | | 9,042,299 | | | | 2.2 | |
| 346,300 | | | | | | Nissan Motor Co., Ltd. | | | 3,275,947 | | | | 0.8 | |
| 266,800 | | | | | | Panasonic Corp. | | | 3,766,896 | | | | 0.9 | |
| 153,400 | | | | | | Sony Corp. | | | 5,486,298 | | | | 1.3 | |
| 351,600 | | | | | | Toyota Motor Corp. | | | 13,841,945 | | | | 3.4 | |
| | | | | | | Other Securities | | | 40,580,121 | | | | 9.8 | |
| | | | | | | | | | 78,066,552 | | | | 18.9 | |
| |
| | | | | | | |
| 641 | | | | | | Japan Tobacco, Inc. | | | 2,366,938 | | | | 0.6 | |
| 78,100 | | | | | | Kao Corp. | | | 2,098,944 | | | | 0.5 | |
| 131,000 | | | | @ | | Kirin Brewery Co., Ltd. | | | 1,832,173 | | | | 0.4 | |
| 112,500 | | | | | | Seven & I Holdings Co., Ltd. | | | 2,992,966 | | | | 0.7 | |
| | | | | | | Other Securities | | | 14,902,208 | | | | 3.6 | |
| | | | | | | | | | 24,193,229 | | | | 5.8 | |
| |
| | | | | | | |
| 308,010 | | | | | | JX Holdings, Inc. | | | 2,084,314 | | | | 0.5 | |
| | | | | | | Other Securities | | | 3,815,881 | | | | 0.9 | |
| | | | | | | | | | 5,900,195 | | | | 1.4 | |
| |
| | | | | | | |
| 1,144 | | | | | | Dai-ichi Life Insurance Co., Ltd. | | | 1,851,418 | | | | 0.5 | |
| 189,000 | | | | | | Mitsubishi Estate Co., Ltd. | | | 3,492,949 | | | | 0.8 | |
| 2,041,900 | | | | | | Mitsubishi UFJ Financial Group, Inc. | | | 11,010,155 | | | | 2.7 | |
| 128,000 | | | | | | Mitsui Fudosan Co., Ltd. | | | 2,543,818 | | | | 0.6 | |
| 80,111 | | | | | | Mitsui Sumitomo Insurance Group Holdings, Inc. | | | 1,999,786 | | | | 0.5 | |
| 3,288,500 | | | | | | Mizuho Financial Group, Inc. | | | 6,168,814 | | | | 1.5 | |
| 567,400 | | | | | | Nomura Holdings, Inc. | | | 3,600,195 | | | | 0.9 | |
| 203,900 | | | | | | Sumitomo Mitsui Financial Group, Inc. | | | 7,219,514 | | | | 1.7 | |
| 102,200 | | | | | | Tokio Marine Holdings, Inc. | | | 3,036,102 | | | | 0.7 | |
| | | | | | | Other Securities | | | 29,382,468 | | | | 7.1 | |
| | | | | | | | | | 70,305,219 | | | | 17.0 | |
| |
| | | | | | | |
| 62,500 | | | | | | Astellas Pharma, Inc. | | | 2,375,339 | | | | 0.6 | |
| 94,200 | | | | | | Daiichi Sankyo Co., Ltd. | | | 2,057,421 | | | | 0.5 | |
| 106,100 | | | | | | Takeda Pharmaceutical Co., Ltd. | | | 5,212,251 | | | | 1.3 | |
| | | | | | | Other Securities | | | 12,212,014 | | | | 2.9 | |
| | | | | | | | | | 21,857,025 | | | | 5.3 | |
| |
| | | | | | | |
| 238 | | | | | | Central Japan Railway Co. | | | 1,989,544 | | | | 0.5 | |
| 47,400 | | | | | | East Japan Railway Co. | | | 3,075,749 | | | | 0.7 | |
| |
COMMON STOCK: (continued) |
| | | | | | | |
| 28,100 | | | | | | Fanuc Ltd. | | $ | 4,295,263 | | | | 1.0 | |
| 187,700 | | | | | | Itochu Corp. | | | 1,891,217 | | | | 0.5 | |
| 135,400 | | | | | | Komatsu Ltd. | | | 4,075,115 | | | | 1.0 | |
| 215,900 | | | | | | Mitsubishi Corp. | | | 5,818,881 | | | | 1.4 | |
| 274,000 | | | | | | Mitsubishi Electric Corp. | | | 2,863,100 | | | | 0.7 | |
| 232,600 | | | | | | Mitsui & Co., Ltd. | | | 3,827,180 | | | | 0.9 | |
| 148,200 | | | | | | Sumitomo Corp. | | | 2,086,252 | | | | 0.5 | |
| | | | | | | Other Securities | | | 56,413,280 | | | | 13.7 | |
| | | | | | | | | | 86,335,581 | | | | 20.9 | |
| |
| | | | | | | Information Technology: 13.1% |
| 169,966 | | | | L | | Canon, Inc. | | | 8,730,351 | | | | 2.1 | |
| 62,300 | | | | | | Fuji Photo Film Co., Ltd. | | | 2,243,964 | | | | 0.6 | |
| 263,000 | | | | | | Fujitsu Ltd. | | | 1,822,156 | | | | 0.4 | |
| 632,146 | | | | | | Hitachi Ltd. | | | 3,356,170 | | | | 0.8 | |
| 23,100 | | | | | | Kyocera Corp. | | | 2,346,902 | | | | 0.6 | |
| 30,000 | | | | | | Murata Manufacturing Co., Ltd. | | | 2,094,169 | | | | 0.5 | |
| 15,600 | | | | | | Nintendo Co., Ltd. | | | 4,554,447 | | | | 1.1 | |
| 541,000 | | | | | | Toshiba Corp. | | | 2,936,161 | | | | 0.7 | |
| | | | | | | Other Securities | | | 25,892,745 | | | | 6.3 | |
| | | | | | | | | | 53,977,065 | | | | 13.1 | |
| |
| | | | | | | |
| 67,600 | | | | | | JFE Holdings, Inc. | | | 2,343,850 | | | | 0.5 | |
| 774,000 | | | | | | Nippon Steel Corp. | | | 2,772,822 | | | | 0.7 | |
| 47,200 | | | | | | Shin-Etsu Chemical Co., Ltd. | | | 2,543,918 | | | | 0.6 | |
| | | | | | | Other Securities | | | 26,834,155 | | | | 6.5 | |
| | | | | | | | | | 34,494,745 | | | | 8.3 | |
| |
| | | | | | | Telecommunication Services: 3.7% |
| 423 | | | | | | KDDI Corp. | | | 2,439,331 | | | | 0.6 | |
| 105,500 | | | | | | Nippon Telegraph & Telephone Corp. | | | 4,804,239 | | | | 1.2 | |
| 2,238 | | | | | | NTT DoCoMo, Inc. | | | 3,897,715 | | | | 0.9 | |
| 119,400 | | | | | | Softbank Corp. | | | 4,116,966 | | | | 1.0 | |
| | | | | | | Other Securities | | | 29,838 | | | | 0.0 | |
| | | | | | | | | | 15,288,089 | | | | 3.7 | |
| |
| | | | | | | |
| 84,400 | | | | | | Chubu Electric Power Co., Inc. | | | 2,071,877 | | | | 0.5 | |
| 111,800 | | | | | | Kansai Electric Power Co., Inc. | | | 2,756,855 | | | | 0.7 | |
| 198,300 | | | | | | Tokyo Electric Power Co., Inc. | | | 4,835,060 | | | | 1.2 | |
| | | | | | | Other Securities | | | 9,601,423 | | | | 2.3 | |
| | | | | | | | | | 19,265,215 | | | | 4.7 | |
| |
| | | | | | | Total Common Stock | | | | | | | | |
| | | | | | | (Cost $359,633,969) | | | 409,682,915 | | | | 99.1 | |
See Accompanying Notes to Financial Statements
119
ING JAPAN TOPIX INDEX PORTFOLIO |
| SUMMARY PORTFOLIO OF INVESTMENTS
AS OF DECEMBER 31, 2010 (CONTINUED) |
Shares
|
|
|
|
|
|
|
| Value
|
| Percent
of Net
Assets
|
|---|
| |
SHORT-TERM INVESTMENTS: 6.6% |
| | | | | | | Securities Lending Collateralcc: 6.6% |
| 27,020,064 | | | | | | BNY Mellon Overnight Government Fund(1) | | $ | 27,020,064 | | | | 6.6 | |
| |
| | | | | | | Total Short-Term Investments | | | | | | | | |
| | | | | | | (Cost $27,020,064) | | | 27,020,064 | | | | 6.6 | |
| |
| | | | | | | Total Investments in Securities | | | | | | | | |
| | | | | | | (Cost $386,654,033)* | | $ | 436,702,979 | | | | 105.7 | |
| | | | | | | Other Assets and Liabilities — Net | | | (23,419,094 | ) | | | (5.7 | ) |
| | | | | | | Net Assets | | $ | 413,283,885 | | | | 100.0 | |
“Other Securities” represents issues not identified as the top 50 holdings in terms of market value and issues or issuers not exceeding 1% of net assets individually or in aggregate respectively as of December 31, 2010.
The following footnotes apply to either the individual securities noted or one or more of the securities aggregated and listed as a single line item.
| @ | | Non-income producing security |
| cc | | Securities purchased with cash collateral for securities loaned. |
| (1) | | Collateral received from brokers for securities lending was invested in these short-term investments. |
| L | | Loaned security, a portion or all of the security is on loan at December 31, 2010. |
| * | | Cost for federal income tax purposes is $389,104,531. |
| Net unrealized appreciation consists of: | | | | | | |
| Gross Unrealized Appreciation | | | | $ | 54,564,000 | |
| Gross Unrealized Depreciation | | | | | (6,965,552 | ) |
| Net Unrealized Appreciation | | | | $ | 47,598,448 | |
Fair Value Measurementsˆ
The following is a summary of the fair valuations according to the inputs used as of December 31, 2010 in valuing the Portfolio’s assets and liabilities:
| | | | Quoted Prices in
Active Markets for
Identical Investments
(Level 1)
| | Other
Observable
Inputs#
(Level 2)
| | Significant
Unobservable
Inputs
(Level 3)
| | Fair Value
at
12/31/2010
|
|---|
Asset Table | | | | | | | | | | | | | | | | | | |
Investments, at value | | | | | | | | | | | | | | | | | | |
| Common Stock | | | | | | | | | | | | | | | | | | |
| Consumer Discretionary | | | | $ | 90,004 | | | $ | 77,976,548 | | | $ | — | | | $ | 78,066,552 | |
| Consumer Staples | | | | | 40,302 | | | | 24,152,927 | | | | — | | | | 24,193,229 | |
| Energy | | | | | — | | | | 5,900,195 | | | | — | | | | 5,900,195 | |
| Financials | | | | | 4,028 | | | | 70,301,191 | | | | — | | | | 70,305,219 | |
| Health Care | | | | | — | | | | 21,857,025 | | | | — | | | | 21,857,025 | |
| Industrials | | | | | 240,657 | | | | 86,094,924 | | | | — | | | | 86,335,581 | |
| Information Technology | | | | | — | | | | 53,977,065 | | | | — | | | | 53,977,065 | |
| Materials | | | | | — | | | | 34,494,745 | | | | — | | | | 34,494,745 | |
| Telecommunication Services | | | | | — | | | | 15,288,089 | | | | — | | | | 15,288,089 | |
| Utilities | | | | | — | | | | 19,265,215 | | | | — | | | | 19,265,215 | |
| Total Common Stock | | | | | 374,991 | | | | 409,307,924 | | | | — | | | | 409,682,915 | |
| Short-Term Investments | | | | | 27,020,064 | | | | — | | | | — | | | | 27,020,064 | |
| Total Investments, at value | | | | $ | 27,395,055 | | | $ | 409,307,924 | | | $ | — | | | $ | 436,702,979 | |
Other Financial Instruments+: | | | | | | | | | | | | | | | | | | |
| Forward foreign currency contracts | | | | | — | | | | 19,646 | | | | — | | | | 19,646 | |
| Futures | | | | | 192,442 | | | | — | | | | — | | | | 192,442 | |
| Total Assets | | | | $ | 27,587,497 | | | $ | 409,327,570 | | | $ | - | | | $ | 436,915,067 | |
The following is a reconciliation of the fair valuations using significant unobservable inputs (Level 3) for the Portfolio’s assets and liabilities during the period ended December 31, 2010:
| | | | Beginning
Balance
12/31/2009
| | Purchases
| | Sales
| | Accrued
Discounts/
(Premiums)
| | Total
Realized
Gain/(Loss)
| | Total Unrealized
Appreciation/
(Depreciation)
| | Transfers
Into
Level 3
| | Transfers
Out of
Level 3
| | Ending
Balance
12/31/2010
|
|---|
Asset Table | | | | | | | | | | | | | | | | | | | | | | | | | | | | | | | | | | | | | | |
Investments, at value | | | | | | | | | | | | | | | | | | | | | | | | | | | | | | | | | | | | | | |
| Common Stock | | | | $ | 17,716 | | | $ | — | | | $ | — | | | $ | — | | | $ | — | | | $ | — | | | $ | — | | | $ | (17,716 | ) | | $ | — | |
| Total Investments, at value | | | | $ | 17,716 | | | $ | — | | | $ | — | | | $ | — | | | $ | — | | | $ | — | | | $ | — | | | $ | (17,716 | ) | | $ | — | |
As of December 31, 2010, total change in unrealized gain (loss) on Level 3 securities still held at period end and included in the change in net assets was $0.
See Accompanying Notes to Financial Statements
120
ING JAPAN TOPIX INDEX PORTFOLIO |
| SUMMARY PORTFOLIO OF INVESTMENTS
AS OF DECEMBER 31, 2010 (CONTINUED) |
| ˆ | | See Note 2, “Significant Accounting Policies” in the Notes to Financial Statements for additional information. |
| + | | Other Financial Instruments are derivatives not reflected in the Summary Portfolio of Investments and may include open forward foreign currency contracts, futures, swaps, and written options. Forward foreign currency contracts and futures are reported at their unrealized gain/loss at measurement date which represents the amount due to/from the Portfolio. Swaps and written options are reported at their market value at measurement date. |
Transfers in or out of Level 3 represents either the beginning value (for transfers in), or the ending value (for transfers out) of any security or derivative instrument where a change in the pricing level occurred from the beginning to the end of the period. It is the policy of the Portfolio to recognize transfers at the end of the reporting period.
| # | | The earlier close of the foreign markets gives rise to the possibility that significant events, including broad market moves, may have occurred in the interim and may materially affect the value of those securities. To account for this, the Portfolio may frequently value many of its foreign equity securities using fair value prices based on third party vendor modeling tools to the extent available. Accordingly, a significant portion of the Portfolio’s investments are categorized as Level 2 investments. |
ING Japan TOPIX Index Portfolio Open Futures Contracts on December 31, 2010:
Contract Description
| | | | Number
of Contracts
| | Expiration Date
| | Notional Value
| | Unrealized
Appreciation
|
|---|
Long Contracts | | | | | | | | | | | | | | | | | | |
| Tokyo Price Index (TOPIX) | | | | | 75 | | | | 03/10/11 | | | $ | 8,276,881 | | | $ | 192,442 | |
| | | | | | | | | | | | | $ | 8,276,881 | | | $ | 192,442 | |
At December 31, 2010 the following forward foreign currency contracts were outstanding for the ING Japan TOPIX Index Portfolio:
Counterparty
| | | | Currency
| |
| | Buy/Sell
| | Settlement
Date
| | In Exchange
For
| | Fair Value
| | Unrealized
Appreciation
(Depreciation)
|
|---|
| The Bank of New York Mellon Corporation | | | | Japanese Yen | | | | | | | | | | | | | | | | | | | | | | | | |
| | | | | JPY | | 400,000,000 | | BUY | | 1/28/11 | | $ | 4,908,698 | | | $ | 4,928,344 | | | $ | 19,646 | |
| | | | | | | | | | | | | | | | | | | | | $ | 19,646 | |
A summary of derivative instruments by primary risk exposure is outlined in the following tables.
The fair value of derivative instruments as of December 31, 2010 was as follows:
Derivatives not accounted for as
hedging instruments
| | | | Location on Statement
of Assets and Liabilities
| | Fair Value
|
|---|
Asset Derivatives | | | | | | | | | | |
| Foreign exchange contracts | | | | Unrealized appreciation on forward foreign currency contracts | | $ | 19,646 | |
| Equity contracts | | | | Net Assets — Unrealized Appreciation* | | | 192,442 | |
Total Asset Derivatives | | | | | | $ | 212,088 | |
| * | | Includes cumulative appreciation/depreciation of futures contracts as reported in the table following the Summary Portfolio of Investments. |
The effect of derivative instruments on the Portfolio’s Statement of Operations for the year ended December 31, 2010 was as follows:
| | | | Amount of Realized Gain or (Loss) on Derivatives Recognized in Income
| |
|---|
Derivatives not accounted for as
hedging instruments
| | | | Foreign currency
related transactions*
| | Futures
| | Total
|
|---|
| Equity contracts | | | | $ | — | | | $ | (304,953 | ) | | $ | (304,953 | ) |
| Foreign exchange contracts | | | | | 1,353,159 | | | | — | | | | 1,353,159 | |
Total | | | | $ | 1,353,159 | | | $ | (304,953 | ) | | $ | 1,048,206 | |
| | | | Change in Unrealized Appreciation or (Depreciation)
on Derivatives Recognized in Income
| |
|---|
Derivatives not accounted for as
hedging instruments
| | | | Foreign currency
related transactions** | | Futures | | Total |
|---|
| Equity contracts | | | | $ | — | | | $ | (79,177 | ) | | $ | (79,177 | ) |
| Foreign exchange contracts | | | | | 19,646 | | | | — | | | | 19,646 | |
Total | | | | $ | 19,646 | | | $ | (79,177 | ) | | $ | (59,531 | ) |
| * | | Amounts recognized for forward foreign currency contracts are included in net realized gain (loss) on foreign currency related transactions and net change in unrealized appreciation or depreciation on foreign currency related transactions. |
See Accompanying Notes to Financial Statements
121
ING WISDOMTREESM GLOBAL
HIGH-YIELDING EQUITY INDEX PORTFOLIO |
| SUMMARY PORTFOLIO OF INVESTMENTS
AS OF DECEMBER 31, 2010 |
Shares
|
|
|
|
|
|
|
| Value
|
| Percent
of Net
Assets
|
|---|
| |
COMMON STOCK: 97.2% |
| | | | | | | |
| 68,764 | | | | | | Australia & New Zealand Banking Group Ltd. | | $ | 1,642,434 | | | | 0.8 | |
| 46,804 | | | | | | BHP Billiton Ltd. | | | 2,176,435 | | | | 1.0 | |
| 37,321 | | | | | | Commonwealth Bank of Australia | | | 1,939,215 | | | | 0.9 | |
| 64,659 | | | | | | National Australia Bank Ltd. | | | 1,568,725 | | | | 0.8 | |
| 624,215 | | | | | | Telstra Corp., Ltd. | | | 1,780,832 | | | | 0.9 | |
| 92,967 | | | | | | Westpac Banking Corp. | | | 2,112,013 | | | | 1.0 | |
| | | | | | | Other Securities | | | 8,019,994 | | | | 3.9 | |
| | | | | | | | | | 19,239,648 | | | | 9.3 | |
| |
| | | | | | | |
| | | | | | | Other Securities | | | 877,763 | | | | 0.4 | |
| |
| | | | | | | |
| | | | | | | Other Securities | | | 920,309 | | | | 0.4 | |
| |
| | | | | | | |
| 62,500 | | | | | | Banco do Brasil S.A. | | | 1,182,982 | | | | 0.6 | |
| | | | | | | Other Securities | | | 3,485,175 | | | | 1.7 | |
| | | | | | | | | | 4,668,157 | | | | 2.3 | |
| |
| | | | | | | |
| 21,056 | | | | | | Royal Bank of Canada | | | 1,107,965 | | | | 0.6 | |
| | | | | | | Other Securities | | | 8,947,038 | | | | 4.3 | |
| | | | | | | | | | 10,055,003 | | | | 4.9 | |
| |
| | | | | | | |
| | | | | | | Other Securities | | | 1,174,125 | | | | 0.6 | |
| |
| | | | | | | |
| | | | | | | Other Securities | | | 804,251 | | | | 0.4 | |
| |
| | | | | | | |
| | | | | | | Other Securities | | | 1,167,265 | | | | 0.6 | |
| |
| | | | | | | |
| | | | | | | Other Securities | | | 70,788 | | | | 0.0 | |
| |
| | | | | | | |
| | | | | | | Other Securities | | | 2,734,252 | | | | 1.3 | |
| |
| | | | | | | |
| 18,388 | | | | | | BNP Paribas | | | 1,171,069 | | | | 0.6 | |
| 34,416 | | | | | | Electricite de France SA | | | 1,413,382 | | | | 0.7 | |
| 144,403 | | | | | | France Telecom S.A. | | | 3,021,757 | | | | 1.4 | |
| 75,107 | | | | | | Gaz de France | | | 2,697,481 | | | | 1.3 | |
| 32,218 | | | | | | Sanofi-Aventis | | | 2,065,522 | | | | 1.0 | |
| 76,488 | | | | | | Total S.A. | | | 4,073,944 | | | | 2.0 | |
| 51,752 | | | | | | Vivendi | | | 1,398,425 | | | | 0.7 | |
| | | | | | | Other Securities | | | 9,785,057 | | | | 4.7 | |
| | | | | | | | | | 25,626,637 | | | | 12.4 | |
| |
| |
COMMON STOCK: (continued) |
| | | | | | | |
| 9,460 | | | | | | Allianz AG | | $ | 1,123,997 | | | | 0.5 | |
| 15,309 | | | | | | BASF AG | | | 1,221,704 | | | | 0.6 | |
| 152,887 | | | | | | Deutsche Telekom AG | | | 1,970,899 | | | | 0.9 | |
| 46,371 | | | | | | E.ON AG | | | 1,416,117 | | | | 0.7 | |
| 14,516 | | | | | | RWE AG | | | 969,521 | | | | 0.5 | |
| | | | | | | Other Securities | | | 1,560,088 | | | | 0.8 | |
| | | | | | | | | | 8,262,326 | | | | 4.0 | |
| |
| | | | | | | |
| | | | | | | Other Securities | | | 1,142,638 | | | | 0.6 | |
| |
| | | | | | | |
| 276,000 | | | | | | China Mobile Ltd. | | | 2,736,502 | | | | 1.3 | |
| | | | | | | Other Securities | | | 2,591,022 | | | | 1.3 | |
| | | | | | | | | | 5,327,524 | | | | 2.6 | |
| |
| | | | | | | |
| | | | | | | Other Securities | | | 154,348 | | | | 0.1 | |
| |
| | | | | | | |
| | | | | | | Other Securities | | | 478,371 | | | | 0.2 | |
| |
| | | | | | | |
| | | | | | | Other Securities | | | 197,019 | | | | 0.1 | |
| |
| | | | | | | |
| | | | | | | Other Securities | | | 1,014,817 | | | | 0.5 | |
| |
| | | | | | | |
| 421,619 | | | | | | Enel S.p.A. | | | 2,112,753 | | | | 1.0 | |
| 109,888 | | | | | | ENI S.p.A. | | | 2,408,461 | | | | 1.2 | |
| | | | | | | Other Securities | | | 2,795,232 | | | | 1.3 | |
| | | | | | | | | | 7,316,446 | | | | 3.5 | |
| |
| | | | | | | |
| 662 | | | | | | NTT DoCoMo, Inc. | | | 1,152,943 | | | | 0.5 | |
| | | | | | | Other Securities | | | 2,616,783 | | | | 1.3 | |
| | | | | | | | | | 3,769,726 | | | | 1.8 | |
| |
| | | | | | | |
| | | | | | | Other Securities | | | 1,397,209 | | | | 0.7 | |
| |
| | | | | | | |
| | | | | | | Other Securities | | | 641,142 | | | | 0.3 | |
| |
| | | | | | | |
| 72,915 | | | | | | Royal Dutch Shell PLC — Class B | | | 2,414,546 | | | | 1.2 | |
| | | | | | | Other Securities | | | 2,507,502 | | | | 1.2 | |
| | | | | | | | | | 4,922,048 | | | | 2.4 | |
| |
| | | | | | | |
| | | | | | | Other Securities | | | 259,145 | | | | 0.1 | |
| |
See Accompanying Notes to Financial Statements
122
ING WISDOMTREESM GLOBAL
HIGH-YIELDING EQUITY INDEX PORTFOLIO |
| SUMMARY PORTFOLIO OF INVESTMENTS
AS OF DECEMBER 31, 2010 (CONTINUED) |
Shares
|
|
|
|
|
|
|
| Value
|
| Percent
of Net
Assets
|
|---|
| |
COMMON STOCK: (continued) |
| | | | | | | |
| 56,620 | | | | | | Statoil ASA | | $ | 1,348,578 | | | | 0.6 | |
| | | | | | | Other Securities | | | 359,010 | | | | 0.2 | |
| | | | | | | | | | 1,707,588 | | | | 0.8 | |
| |
| | | | | | | |
| | | | | | | Other Securities | | | 452,626 | | | | 0.2 | |
| |
| | | | | | | |
| | | | | | | Other Securities | | | 840,004 | | | | 0.4 | |
| |
| | | | | | | |
| | | | | | | Other Securities | | | 875,187 | | | | 0.4 | |
| |
| | | | | | | |
| | | | | | | Other Securities | | | 779,124 | | | | 0.4 | |
| |
| | | | | | | |
| | | | | | | Other Securities | | | 2,089,705 | | | | 1.0 | |
| |
| | | | | | | |
| | | | | | | Other Securities | | | 1,370,585 | | | | 0.7 | |
| |
| | | | | | | |
| | | | | | | Other Securities | | | 896,522 | | | | 0.4 | |
| |
| | | | | | | |
| 103,204 | | | | | | Banco Bilbao Vizcaya Argentaria S.A. | | | 1,051,781 | | | | 0.5 | |
| 240,483 | | | | | | Banco Santander Central Hispano S.A. | | | 2,562,545 | | | | 1.3 | |
| 8,748 | | | | | | Banco Santander S.A. | | | 93,954 | | | | | |
| 144,946 | | | | | | Iberdrola S.A. | | | 1,123,855 | | | | 0.5 | |
| 144,802 | | | | | | Telefonica S.A. | | | 3,305,836 | | | | 1.6 | |
| | | | | | | Other Securities | | | 3,836,567 | | | | 1.9 | |
| | | | | | | | | | 11,974,538 | | | | 5.8 | |
| |
| | | | | | | |
| | | | | | | Other Securities | | | 3,110,851 | | | | 1.5 | |
| |
| | | | | | | |
| 42,718 | | | | | | Novartis AG | | | 2,514,621 | | | | 1.2 | |
| 10,860 | | | | | | Roche Holding AG — Genusschein | | | 1,591,998 | | | | 0.8 | |
| 3,948 | | | | | | Zurich Financial Services AG | | | 1,022,401 | | | | 0.5 | |
| | | | | | | Other Securities | | | 1,854,116 | | | | 0.9 | |
| | | | | | | | | | 6,983,136 | | | | 3.4 | |
| |
| | | | | | | |
| 513,427 | | | | | | Taiwan Semiconductor Manufacturing Co., Ltd. | | | 1,249,835 | | | | 0.6 | |
| | | | | | | Other Securities | | | 2,810,633 | | | | 1.4 | |
| | | | | | | | | | 4,060,468 | | | | 2.0 | |
| |
| | | | | | | |
| | | | | | | Other Securities | | | 655,929 | | | | 0.3 | |
| |
| |
COMMON STOCK: (continued) |
| | | | | | | |
| | | | | | | Other Securities | | $ | 1,503,528 | | | | 0.7 | |
| |
| | | | | | | |
| 31,809 | | | | | | AstraZeneca PLC | | | 1,449,675 | | | | 0.7 | |
| 40,597 | | | | | | British American Tobacco PLC | | | 1,561,603 | | | | 0.8 | |
| 124,731 | | | | | | GlaxoSmithKline PLC | | | 2,418,885 | | | | 1.2 | |
| 272,919 | | | | | | HSBC Holdings PLC | | | 2,789,263 | | | | 1.3 | |
| 1,429,239 | | | | | | Vodafone Group PLC | | | 3,751,951 | | | | 1.8 | |
| | | | | | | Other Securities | | | 10,840,236 | | | | 5.2 | |
| | | | | | | | | | 22,811,613 | | | | 11.0 | |
| |
| | | | | | | |
| 58,450 | | | | | | Altria Group, Inc. | | | 1,439,039 | | | | 0.7 | |
| 154,050 | | | | | | AT&T, Inc. | | | 4,525,980 | | | | 2.2 | |
| 37,700 | | | | | | Bristol-Myers Squibb Co. | | | 998,296 | | | | 0.5 | |
| 29,300 | | | | | | Chevron Corp. | | | 2,673,625 | | | | 1.3 | |
| 21,300 | | | | | | ConocoPhillips | | | 1,450,530 | | | | 0.7 | |
| 15,800 | | | | | | McDonald’s Corp. | | | 1,212,808 | | | | 0.6 | |
| 44,600 | | | | | | Merck & Co., Inc. | | | 1,607,384 | | | | 0.8 | |
| 138,400 | | | | | | Pfizer, Inc. | | | 2,423,384 | | | | 1.2 | |
| 39,200 | | | | | | Philip Morris International, Inc. | | | 2,294,376 | | | | 1.1 | |
| 72,600 | | | | | | Verizon Communications, Inc. | | | 2,597,628 | | | | 1.2 | |
| | | | | | | Other Securities | | | 17,503,140 | | | | 8.4 | |
| | | | | | | | | | 38,726,190 | | | | 18.7 | |
| |
| | | | | | | Total Common Stock | | | | | | | | |
| | | | | | | (Cost $188,223,627) | | | 201,058,551 | | | | 97.2 | |
| |
REAL ESTATE INVESTMENT TRUSTS: 1.4% |
| | | | | | | |
| | | | | | | Other Securities | | | 206,835 | | | | 0.1 | |
| |
| | | | | | | |
| | | | | | | Other Securities | | | 326,373 | | | | 0.2 | |
| |
| | | | | | | |
| | | | | | | Other Securities | | | 257,028 | | | | 0.1 | |
| |
| | | | | | | |
| | | | | | | Other Securities | | | 2,141,973 | | | | 1.0 | |
| |
| | | | | | | Total Real Estate Investment Trusts | | | | | | | | |
| | | | | | | (Cost $2,365,577) | | | 2,932,209 | | | | 1.4 | |
| |
EXCHANGE-TRADED FUNDS: 0.7% |
| | | | | | | |
| 16,400 | | | | | | iShares MSCI EAFE Index Fund | | | 954,972 | | | | 0.4 | |
| |
| | | | | | | |
| 3,700 | | | | | | iShares MSCI Emerging Markets Index Fund | | | 176,194 | | | | 0.1 | |
| |
See Accompanying Notes to Financial Statements
123
ING WISDOMTREESM GLOBAL
HIGH-YIELDING EQUITY INDEX PORTFOLIO |
| SUMMARY PORTFOLIO OF INVESTMENTS
AS OF DECEMBER 31, 2010 (CONTINUED) |
Shares
|
|
|
|
|
|
|
| Value
|
| Percent
of Net
Assets
|
|---|
| |
EXCHANGE-TRADED FUNDS: (continued |
| | | | | | | |
| 6,200 | | | | | | iShares S&P 500 Value Index Fund | | $ | 369,458 | | | | 0.2 | |
| |
| | | | | | | Total Exchange-Traded Funds | | | | | | | | |
| | | | | | | (Cost $1,472,092) | | | 1,500,624 | | | | 0.7 | |
| |
WARRANTS: 0.0% |
| | | | | | | |
| | | | | | | Other Securities | | | 1,469 | | | | 0.0 | |
| |
| | | | | | | |
| | | | | | | Other Securities | | | 195 | | | | 0.0 | |
| |
| | | | | | | Total Warrants | | | | | | | | |
| | | | | | | (Cost $1,226) | | | 1,664 | | | | 0.0 | |
| |
| | | | | | | Total Investments in Securities | | | | | | | | |
| | | | | | | (Cost $192,062,522)* | | $ | 205,493,048 | | | | 99.3 | |
| | | | | | | Other Assets and Liabilities — Net | | | 1,418,527 | | | | 0.7 | |
| | | | | | | Net Assets | | $ | 206,911,575 | | | | 100.0 | |
“Other Securities” represents issues not identified as the top 50 holdings in terms of market value and issues or issuers not exceeding 1% of net assets individually or in aggregate respectively as of December 31, 2010.
The following footnotes apply to either the individual securities noted or one or more of the securities aggregated and listed as a single line item.
| @ | | Non-income producing security |
| * | | Cost for federal income tax purposes is $195,342,652. |
| Net unrealized appreciation consists of: | | | | | | |
| Gross Unrealized Appreciation | | | | $ | 23,447,117 | |
| Gross Unrealized Depreciation | | | | | (13,296,721 | ) |
| Net Unrealized Appreciation | | | | $ | 10,150,396 | |
Industry
| | | | Percentage of
Net Assets
|
|---|
| Consumer Discretionary | | | | | 4.3 | % |
| Consumer Staples | | | | | 8.9 | |
| Energy | | | | | 11.0 | |
| Financials | | | | | 22.3 | |
| Health Care | | | | | 9.1 | |
| Industrials | | | | | 4.9 | |
| Information Technology | | | | | 2.2 | |
| Materials | | | | | 5.2 | |
| Telecommunication Services | | | | | 18.2 | |
| Utilities | | | | | 12.5 | |
| Other Long-Term Investments | | | | | 0.7 | |
| Other Assets and Liabilities — Net | | | | | 0.7 | |
Net Assets | | | | | 100.0 | % |
Fair Value Measurementsˆ
The following is a summary of the fair valuations according to the inputs used as of December 31, 2010 in valuing the Portfolio’s assets and liabilities:
| | | | Quoted Prices
in Active Markets
for Identical Investments
(Level 1)
| | Other
Observable
Inputs#
(Level 2)
| | Significant
Unobservable
Inputs
(Level 3)
| | Fair Value
at
12/31/2010
|
|---|
Asset Table | | | | | | | | | | | | | | | | | | |
Investments, at value | | | | | | | | | | | | | | | | | | |
| Common Stock | | | | | | | | | | | | | | | | | | |
| Australia | | | | $ | 324,494 | | | $ | 18,915,154 | | | $ | — | | | $ | 19,239,648 | |
| Austria | | | | | — | | | | 877,763 | | | | — | | | | 877,763 | |
| Belgium | | | | | — | | | | 920,309 | | | | — | | | | 920,309 | |
| Brazil | | | | | 4,668,157 | | | | — | | | | — | | | | 4,668,157 | |
| Canada | | | | | 10,055,003 | | | | — | | | | — | | | | 10,055,003 | |
| Chile | | | | | 1,174,125 | | | | — | | | | — | | | | 1,174,125 | |
| China | | | | | — | | | | 804,251 | | | | — | | | | 804,251 | |
| Czech Republic | | | | | — | | | | 1,167,265 | | | | — | | | | 1,167,265 | |
| Denmark | | | | | — | | | | 70,788 | | | | — | | | | 70,788 | |
| Finland | | | | | — | | | | 2,734,252 | | | | — | | | | 2,734,252 | |
| France | | | | | — | | | | 25,626,637 | | | | — | | | | 25,626,637 | |
| Germany | | | | | — | | | | 8,262,326 | | | | — | | | | 8,262,326 | |
| Greece | | | | | — | | | | 1,142,638 | | | | — | | | | 1,142,638 | |
| Hong Kong | | | | | 267,921 | | | | 5,059,603 | | | | — | | | | 5,327,524 | |
| Hungary | | | | | — | | | | 154,348 | | | | — | | | | 154,348 | |
| Indonesia | | | | | 255,441 | | | | 222,930 | | | | — | | | | 478,371 | |
| Ireland | | | | | — | | | | 197,019 | | | | — | | | | 197,019 | |
| Israel | | | | | — | | | | 1,014,817 | | | | — | | | | 1,014,817 | |
| Italy | | | | | — | | | | 7,316,446 | | | | — | | | | 7,316,446 | |
| Japan | | | | | — | | | | 3,769,726 | | | | — | | | | 3,769,726 | |
| Malaysia | | | | | 233,754 | | | | 1,163,455 | | | | — | | | | 1,397,209 | |
See Accompanying Notes to Financial Statements
124
ING WISDOMTREESM GLOBAL
HIGH-YIELDING EQUITY INDEX PORTFOLIO |
| SUMMARY PORTFOLIO OF INVESTMENTS
AS OF DECEMBER 31, 2010 (CONTINUED) |
| | | | Quoted Prices
in Active Markets
for Identical Investments
(Level 1)
| | Other
Observable
Inputs#
(Level 2)
| | Significant
Unobservable
Inputs
(Level 3)
| | Fair Value
at
12/31/2010
|
|---|
| Common Stock (continued) | | | | | | | | | | | | | | | | | | |
| Mexico | | | | $ | 641,142 | | | $ | — | | | $ | — | | | $ | 641,142 | |
| Netherlands | | | | | — | | | | 4,922,048 | | | | — | | | | 4,922,048 | |
| New Zealand | | | | | — | | | | 259,145 | | | | — | | | | 259,145 | |
| Norway | | | | | — | | | | 1,707,588 | | | | — | | | | 1,707,588 | |
| Philippines | | | | | — | | | | 452,626 | | | | — | | | | 452,626 | |
| Poland | | | | | — | | | | 840,004 | | | | — | | | | 840,004 | |
| Portugal | | | | | — | | | | 875,187 | | | | — | | | | 875,187 | |
| Russia | | | | | 583,644 | | | | 195,480 | | | | — | | | | 779,124 | |
| Singapore | | | | | — | | | | 2,089,705 | | | | — | | | | 2,089,705 | |
| South Africa | | | | | — | | | | 1,370,585 | | | | — | | | | 1,370,585 | |
| South Korea | | | | | — | | | | 896,522 | | | | — | | | | 896,522 | |
| Spain | | | | | 412,793 | | | | 11,561,745 | | | | — | | | | 11,974,538 | |
| Sweden | | | | | — | | | | 3,110,851 | | | | — | | | | 3,110,851 | |
| Switzerland | | | | | 35,917 | | | | 6,947,219 | | | | — | | | | 6,983,136 | |
| Taiwan | | | | | — | | | | 4,060,468 | | | | — | | | | 4,060,468 | |
| Thailand | | | | | — | | | | 655,929 | | | | — | | | | 655,929 | |
| Turkey | | | | | — | | | | 1,503,528 | | | | — | | | | 1,503,528 | |
| United Kingdom | | | | | 263,303 | | | | 22,548,310 | | | | — | | | | 22,811,613 | |
| United States | | | | | 38,726,190 | | | | — | | | | — | | | | 38,726,190 | |
| Total Common Stock | | | | | 57,641,884 | | | | 143,416,667 | | | | — | | | | 201,058,551 | |
| Real Estate Investment Trusts | | | | | 2,348,808 | | | | 583,401 | | | | — | | | | 2,932,209 | |
| Exchange-Traded Funds | | | | | 1,500,624 | | | | — | | | | — | | | | 1,500,624 | |
| Warrants | | | | | 1,664 | | | | — | | | | — | | | | 1,664 | |
| Total Investments, at value | | | | $ | 61,492,980 | | | $ | 144,000,068 | | | $ | — | | | $ | 205,493,048 | |
| ˆ | | See Note 2, “Significant Accounting Policies” in the Notes to Financial Statements for additional information. |
| # | | The earlier close of the foreign markets gives rise to the possibility that significant events, including broad market moves, may have occurred in the interim and may materially affect the value of those securities. To account for this, the Portfolio may frequently value many of its foreign equity securities using fair value prices based on third party vendor modeling tools to the extent available. Accordingly, a significant portion of the Portfolio’s investments are categorized as Level 2 investments. |
See Accompanying Notes to Financial Statements
125
TAX INFORMATION (UNAUDITED)
Dividends paid during the year ended December 31, 2010 were as follows:
Portfolio Name
| | | | Type
| | Per Share Amount
|
|---|
ING RussellTM Large Cap Index Portfolio | | | | | | | | | | |
| Class ADV | | | | | NII | | | $ | 0.2950 | |
| Class I | | | | | NII | | | $ | 0.3120 | |
| Class S | | | | | NII | | | $ | 0.3021 | |
| Class S2 | | | | | NII | | | $ | — | |
ING RussellTM Large Cap Growth Index Portfolio | | | | | | | | | | |
| Class ADV | | | | | NII | | | $ | 0.0651 | |
| Class I | | | | | NII | | | $ | 0.0874 | |
| Class S | | | | | NII | | | $ | 0.0728 | |
ING RussellTM Large Cap Value Index Portfolio | | | | | | | | | | |
| Class ADV | | | | | NII | | | $ | 0.1728 | |
| Class I | | | | | NII | | | $ | 0.1976 | |
| Class S | | | | | NII | | | $ | 0.1873 | |
| All Classes | | | | | STCG | | | $ | 1.2594 | |
ING RussellTM Mid Cap Index Portfolio | | | | | | | | | | |
| Class ADV | | | | | NII | | | $ | 0.0477 | |
| Class I | | | | | NII | | | $ | 0.0577 | |
| Class S | | | | | NII | | | $ | 0.0469 | |
| Class S2 | | | | | NII | | | $ | 0.0321 | |
ING RussellTM Mid Cap Growth Index Portfolio | | | | | | | | | | |
| Class ADV | | | | | NII | | | $ | 0.0181 | |
| Class I | | | | | NII | | | $ | 0.0532 | |
| Class S | | | | | NII | | | $ | 0.0434 | |
| Class S2 | | | | | NII | | | $ | 0.0313 | |
| All Classes | | | | | STCG | | | $ | 0.1210 | |
| All Classes | | | | | LTCG | | | $ | 0.0094 | |
ING RussellTM Small Cap Index Portfolio | | | | | | | | | | |
| Class ADV | | | | | NII | | | $ | 0.0466 | |
| Class I | | | | | NII | | | $ | 0.0579 | |
| Class S | | | | | NII | | | $ | 0.0435 | |
| Class S2 | | | | | NII | | | $ | 0.0312 | |
| ING U.S. Bond Index Portfolio | | | | | | | | | | |
| Class ADV | | | | | NII | | | $ | 0.2360 | |
| Class I | | | | | NII | | | $ | 0.2848 | |
| Class S | | | | | NII | | | $ | 0.2580 | |
| Class S2 | | | | | NII | | | $ | 0.2467 | |
| ING Euro STOXX 50® Index Portfolio | | | | | | | | | | |
| Class ADV | | | | | NII | | | $ | 0.0524 | |
| Class I | | | | | NII | | | $ | 0.0560 | |
| All Classes | | | | | STCG | | | $ | 0.0238 | |
| ING FTSE 100 Index Portfolio | | | | | | | | | | |
| Class ADV | | | | | NII | | | $ | 0.0737 | |
| Class I | | | | | NII | | | $ | 0.0791 | |
| All Classes | | | | | STCG | | | $ | 0.0784 | |
| ING Hang Seng Index Portfolio | | | | | | | | | | |
| Class ADV | | | | | NII | | | $ | 0.0108 | |
| Class I | | | | | NII | | | $ | 0.0108 | |
| Class S | | | | | NII | | | $ | 0.0108 | |
| Class S2 | | | | | NII | | | $ | 0.0108 | |
| ING International Index Portfolio | | | | | | | | | | |
| Class ADV | | | | | NII | | | $ | 0.2742 | |
| Class I | | | | | NII | | | $ | 0.2876 | |
| Class S | | | | | NII | | | $ | 0.2785 | |
| Class S2 | | | | | NII | | | $ | 0.2568 | |
| ING Japan TOPIX Index Portfolio | | | | | | | | | | |
| Class ADV | | | | | NII | | | $ | 0.0101 | |
| Class I | | | | | NII | | | $ | 0.0113 | |
| All Classes | | | | | STCG | | | $ | 0.0050 | |
ING WisdomTreeSM Global High-Yielding Equity Index Portfolio | | | | | | | | | | |
| Class ADV | | | | | NII | | | $ | 0.2655 | |
| Class I | | | | | NII | | | $ | 0.2656 | |
| Class S | | | | | NII | | | $ | 0.2510 | |
NII — Net investment income
STCG — Short-term capital gain
LTCG — Long-term capital gain
Of the ordinary distributions made during the year ended December 31, 2010, the following percentages qualify for the dividends received deduction (DRD) available to corporate shareholders:
ING RussellTM Large Cap Index Portfolio | | | | | 100.00 | % |
ING RussellTM Large Cap Growth Index Portfolio | | | | | 100.00 | % |
ING RussellTM Large Cap Value Index Portfolio | | | | | 17.75 | % |
ING RussellTM Mid Cap Index Portfolio | | | | | 99.96 | % |
ING RussellTM Mid Cap Growth Index Portfolio | | | | | 50.19 | % |
ING RussellTM Small Cap Index Portfolio | | | | | 100.00 | % |
ING WisdomTreeSM Global High-Yielding Equity Index Portfolio | | | | | 24.25 | % |
Pursuant to Section 853 of the Internal Revenue Code, the Portfolios designate the following amounts as foreign taxes paid for the year ended December 31, 2010. Foreign taxes paid for purposes of Section 853 may be less than actual foreign taxes paid for financial statement purposes.
| | | | Creditable
Foreign Taxes
Paid
| | Per Share
Amount
| | Portion of Ordinary Income
Distribution Derived from
Foreign Sourced Income*
|
|---|
| ING Euro STOXX 50® Index Portfolio | | | | $ | 4,195,344 | | | $ | 0.0505 | | | | 90.13 | % |
| ING Hang Seng Index Portfolio | | | | $ | 145,802 | | | $ | 0.0092 | | | | 76.32 | % |
| ING International Index Portfolio | | | | $ | 753,237 | | | $ | 0.0175 | | | | 85.45 | % |
| ING Japan TOPIX Index Portfolio | | | | $ | 651,015 | | | $ | 0.0176 | | | | 83.81 | % |
ING WisdomTreeSM Global High-Yielding Equity Index Portfolio | | | | $ | 654,374 | | | $ | 0.0253 | | | | 81.47 | % |
| * | | None of the Portfolios listed above derived any income from ineligible foreign sources as defined under Section 901(j) of the Internal Revenue Code. |
Foreign taxes paid or withheld should be included in taxable income with an offsetting deduction from gross income or as a credit for taxes paid to foreign governments. Shareholders are strongly advised to consult their own tax advisors regarding the appropriate treatment of foreign taxes paid.
126
TAX INFORMATION (UNAUDITED) (CONTINUED)
Above figures may differ from those cited elsewhere in this report due to differences in the calculation of income and gains under U.S. generally accepted accounting principles (book) purposes and Internal Revenue Service (tax) purposes.
Shareholders are strongly advised to consult their own tax advisers with respect to the tax consequences of their investments in the Portfolios. In January, shareholders, excluding corporate shareholders, receive an IRS 1099-DIV regarding the federal tax status of the dividends and distributions they received in the calendar year.
127
DIRECTOR AND OFFICER INFORMATION (UNAUDITED)
The business and affairs of the Company are managed under the direction of the Board. A Director who is not an interested person of the Company, as defined in the 1940 Act, is an independent director (“Non-Interested Director”). The Directors and Officers of the Company are listed below. The Statement of Additional Information includes additional information about directors of the Company and is available, without charge, upon request at (800) 992-0180.
Name, Address and Age
| | | | Position(s)
held with the
Company
| | Term of Office
and Length of
Time Served(1)
| | Principal
Occupation(s)
During the Past 5 Years(2)
| | Number of
Funds in
Fund Complex
Overseen by
Director(3)
| | Other
Directorships
Held by
Director
|
|---|
| |
Independent Directors: | | | | | | | | | | | | | | | | | | | | |
| |
Albert E. DePrince, Jr.
7337 E. Doubletree Ranch Rd.
Suite 100
Scottsdale, Arizona 85258
Age: 69 | | | | Director | | June 1998– Present | | Professor of Economics and Finance, Middle Tennessee State University (August 1991–Present). Formerly, Director of Business and Economics Research Center, Middle Tennessee State University (1999–2002); Chief Economist, Marine Midland Bank (1987–1990); Various Management Positions, Marine Midland Bank (1978–1990). Ph.D. in Economics Published numerous scholarly papers and journal articles in the areas of financial markets, financial institutions, corporate finance and monetary policy. | | 37 | | Academy of Economics and Finance (February 2002– Present). |
| |
Sidney Koch
7337 E. Doubletree Ranch Rd.
Suite 100
Scottsdale, Arizona 85258
Age: 75 | | | | Director | | April 1994– Present | | Retired. Self-Employed Consultant (June 2000– Present). Formerly, Senior Adviser,
Hambro America, Inc. (1993–2000); Executive Vice President of Investment Banking, Daiwa Securities America, Inc. (1986–1993). | | 37 | | None.
|
| |
Corine T. Norgaard
7337 E. Doubletree Ranch Rd.
Suite 100
Scottsdale, Arizona 85258
Age: 73 | | | | Director | | June 1991– Present | | President and Owner, Retirement Options, LLC, a training provider for retirement coaches (August 2009–Present) Formerly, President, Thompson Enterprises (September 2004– September 2005); Dean of the Barney School of Business, University of Hartford (August 1996–June 2004). Various other academic positions (1969–1993). Certified Public Accountant
Ph. D in Accounting and Business. | | 37 | | MassMutual Corporate Investors and MassMutual Participation Investors (April 1997–Present); MassMutual Premier Funds (20 funds), Chair of Audit Committee (December 2004–Present); and MML Series Investment Funds II (8 funds), Chair of Audit Committee (December 2005–Present). |
128
DIRECTOR AND OFFICER INFORMATION (UNAUDITED) (CONTINUED)
Name, Address and Age
| | | | Position(s)
held with the
Company
| | Term of Office
and Length of
Time Served(1)
| | Principal
Occupation(s)
During the Past 5 Years(2)
| | Number of
Funds in
Fund Complex
Overseen by
Director(3)
| | Other
Directorships
Held by
Director
|
|---|
| |
Joseph E. Obermeyer
7337 E. Doubletree Ranch Rd.
Suite 100
Scottsdale, Arizona 85258
Age: 53 | | | | Director | | January 2003– Present | | President, Obermeyer & Associates, Inc., a provider of financial and economic consulting services (November 1999– Present). Formerly, Senior Manager, Arthur Anderson LLP (1995–1999); Senior Manager, Coopers & Lybrand, LLP (1993–1995); Manager, Price Waterhouse (1988–1993); Second Vice President, Smith Barney (1985–1988); Consultant, Arthur Anderson & Co. (1984–1985). | | 37 | | None.
|
| |
Russell Jones
7337 E. Doubletree Ranch Rd.
Suite 100
Scottsdale, Arizona 85258
Age: 66 | | | | Director | | December 2007–
Present | | Retired. Formerly, Senior Vice President, Chief Investment Officer and Treasurer, and other various positions including Principal Investor Relations Officer, Principal Public Relations Officer, and Corporate Parent Treasurer, Kaman Corporation, an aerospace and industrial distribution manufacturer (April 1973–March 2008). President, Hartford Area Business Economists (1986–1987) and Corporate Loan Officer and Credit Analyst, Hartford National Bank (1966–1973). Certified AARP Tax Counselor (2011). | | 37 | | Independent Director, CIGNA Mutual Funds (8 funds), Chair of Contracts Committee (1995–2005). |
129
DIRECTOR AND OFFICER INFORMATION (UNAUDITED) (CONTINUED)
Name, Address and Age
| | | | Position(s)
held with the
Company
| | Term of Office
and Length of
Time Served(1)
| | Principal
Occupation(s)
During the Past 5 Years(2)
| | Number of
Funds in
Fund Complex
Overseen by
Director(3)
| | Other
Directorships
Held by
Director
|
|---|
| |
Directors who are “Interested Persons”(5) | | | | | | | | | | | | | | | |
| |
Shaun Mathews(4)(5)
7337 E. Doubletree Ranch Rd.
Suite 100
Scottsdale, Arizona 85258
Age: 55 | | | | Director | | December 2007–
Present | | President and Chief Executive Officer, ING Investments, LLC(6) (November 2006– Present). Formerly, Head of ING Mutual Funds and Investment Products (November 2004–November 2006). | | 175 | | ING Retirement Holdings, Inc. (September 1998–Present); ING Services Holding Company, Inc. (May 2000–Present); ING Financial Advisers, LLC (April 2002–Present); Southland Life Insurance Company (June 2002–Present); ING Capital Corporation, LLC and ING Investments Distributor, LLC(7) (December 2005–Present); ING Funds Services, LLC(8), ING Investments, LLC(6)and ING Pilgrim Funding, Inc. (March 2006–Present); and Directed Services LLC (December 2006– Present)(9). |
(1) | | Directors serve until their successors are duly elected and qualified. |
(2) | | The information reported includes the principle occupation during the last five years for each Director and other information relating to the professional experience, attributes and skills relevant to each Director’s qualifications to serve as Director. |
(3) | | For the purposes of this table (except for Mr. Mathews), “Fund Complex” means the following investment companies: ING Series Fund, Inc.; ING Strategic Allocation Portfolios, Inc.; ING Variable Funds; ING Variable Portfolios, Inc.; ING Balanced Portfolio, Inc.; ING Intermediate Bond Portfolio; and ING Money Market Portfolio. |
(4) | | For Mr. Mathews, the Fund Complex also includes the following investment companies: ING Asia Pacific High Dividend Equity Income Fund, ING Emerging Markets High Dividend Equity Fund; ING Emerging Markets Local Bond Fund; ING Equity Trust; ING Funds Trust; ING Global Equity Dividend and Premium Opportunity Fund; ING Global Advantage and Premium Opportunity Fund; ING Infrastructure, Industrials, and Materials Fund; ING International High Dividend Equity Income Fund; ING Investors Trust; ING Mayflower Trust; ING Mutual Funds; ING Partners, Inc.; ING Prime Rate Trust; ING Risk Managed Natural Resources Fund; ING Senior Income Fund; ING Separate Portfolios Trust; ING Variable Insurance Trust; and ING Variable Products Trust. |
(5) | | “Interested person,” as defined in the 1940 Act, by virtue of this Director’s/Trustee’s affiliation with any of the Funds, ING or any of ING’s affiliates. |
(6) | | ING Investments, LLC was previously named ING Pilgrim Investments, LLC. ING Pilgrim Investments, LLC is the successor in interest to ING Pilgrim Investments, Inc., which was previously known as Pilgrim Investments, Inc. and before that was known as Pilgrim America Investments, Inc. |
(7) | | ING Investments Distributor, LLC was previously named ING Funds Distributor, LLC. ING Funds Distributor, LLC is the successor in interest to ING Funds Distributor, Inc., which was previously known as ING Pilgrim Securities, Inc., and before that, was known as Pilgrim Securities, Inc., and before that was known as Pilgrim America Securities, Inc. |
(8) | | ING Funds Services, LLC was previously named ING Pilgrim Group, LLC. ING Pilgrim Group, LLC is the successor in interest to ING Pilgrim Group, Inc., which was previously known as Pilgrim Group, Inc. and before that was known as Pilgrim America Group, Inc. |
(9) | | Directed Services LLC is the successor in interest to Directed Services, Inc. |
130
DIRECTOR AND OFFICER INFORMATION (UNAUDITED) (CONTINUED)
Name, Address and Age
| | | | Position(s) Held
With Company
| | Term of Office
and Length of
Time Served(1)
| | Principal Occupation(s)—
During the Past 5 Years
|
|---|
| |
Shaun P. Mathews(5)
7337 East Doubletree Ranch Rd.
Suite 100
Scottsdale, Arizona 85258
Age: 55 | | | | President and Chief Executive Officer | | December 2006–Present | | President and Chief Executive Officer, ING Investments, LLC (November 2006–Present). Formerly, Head of ING Mutual Funds and Investment Products (November 2004–November 2006). |
| |
Michael J. Roland
7337 East Doubletree Ranch Rd.
Suite 100
Scottsdale, Arizona 85258
Age: 52 | | | | Executive Vice President | | April 2002–Present | | Executive Vice President and Chief Operating Officer, ING Investments, LLC(2) and ING Funds Services, LLC(3) (January 2007–Present). Formerly, Executive Vice President, Head of Product Management (January 2005–January 2007). |
| |
Stanley D. Vyner
230 Park Avenue
New York, New York 10169
Age: 60 | | | | Executive Vice President | | March 2002–Present | | Executive Vice President, ING Investments, LLC(2) (July 2000–Present) and Chief Investment Risk Officer, ING Investments, LLC(2) (January 2003–Present). |
| |
Joseph M. O’Donnell
7337 East Doubletree Ranch Rd.
Suite 100
Scottsdale, Arizona 85258
Age: 56 | | | | Executive Vice President and Chief Compliance Officer | | March 2006–Present
November 2004–Present | | Chief Compliance Officer of the ING Funds (November 2004–Present); Executive Vice President of the ING Funds (March 2006–Present); Chief Compliance Officer of ING Investments, LLC(2) (March 2006–July 2008 and October 2009–Present); and Investment Advisor Chief Compliance Officer, Directed Services LLC(6) (March 2006–July 2008 and October 2009–Present). Formerly, Investment Advisor Chief Compliance Officer, ING Life Insurance and Annuity Company (March 2006–December 2006). |
| |
Todd Modic
7337 East Doubletree Ranch Rd.
Suite 100
Scottsdale, Arizona 85258
Age: 43 | | | | Senior Vice President, Chief/Principal Financial Officer and Assistant Secretary | | March 2005–Present | | Senior Vice President, ING Funds Services, LLC(3) (March 2005–Present). |
| |
Kimberly A. Anderson
7337 East Doubletree Ranch Rd.
Suite 100
Scottsdale, Arizona 85258
Age: 46 | | | | Senior Vice President | | December 2003–Present | | Senior Vice President, ING Investments, LLC(2) (October 2003–Present). |
| |
Robert Terris
7337 East Doubletree Ranch Rd.
Suite 100
Scottsdale, Arizona 85258
Age: 40 | | | | Senior Vice President | | June 2006–Present | | Senior Vice President, Head of Division Operations, ING Funds Services, LLC(3) (May 2006–Present). Formerly, Vice President of Administration, ING Funds Services, LLC(3) (October 2001–May 2006). |
| |
Robyn L. Ichilov
7337 East Doubletree Ranch Rd.
Suite 100
Scottsdale, Arizona 85258
Age: 43 | | | | Vice President and Treasurer | | March 2002–Present | | Vice President and Treasurer, ING Funds Services, LLC(3) (November 1995–Present) and ING Investments, LLC(2) (August 1997–Present). |
| |
Lauren D. Bensinger
7337 East Doubletree Ranch Rd.
Suite 100
Scottsdale, Arizona 85258
Age: 56 | | | | Vice President | | March 2003–Present | | Vice President, ING Investments, LLC(2) and ING Funds Services, LLC(3) (February 1996– Present); Director of Compliance, ING Investments, LLC(2) (October 2004–Present); and Vice President and Money Laundering Reporting Officer, ING Investments Distributor, LLC(4) (April 2010–Present). Formerly, Chief Compliance Officer, ING Investments Distributor, LLC(4) (August 1995–April 2010). |
| |
William Evans
10 State House Square
Hartford, Connecticut 06103
Age: 38 | | | | Vice President | | September 2007–Present | | Senior Vice President (March 2010–Present) and Head of Manager Research and Selection Group (April 2007–Present). Formerly, Vice President, U.S. Mutual Funds and Investment Products (May 2005–April 2007). |
| |
Maria M. Anderson
7337 East Doubletree Ranch Rd.
Suite 100
Scottsdale, Arizona 85258
Age: 52 | | | | Vice President | | September 2004–Present | | Vice President, ING Funds Services, LLC(3) (September 2004–Present). |
131
DIRECTOR AND OFFICER INFORMATION (UNAUDITED) (CONTINUED)
Name, Address and Age
| | | | Position(s) Held
With Company
| | Term of Office
and Length of
Time Served(1)
| | Principal Occupation(s)—
During the Past 5 Years
|
|---|
| |
Denise Lewis
7337 East Doubletree Ranch Rd.
Suite 100
Scottsdale, Arizona 85258
Age: 47 | | | | Vice President | | April 2007–Present | | Vice President, ING Funds Services, LLC (December 2006–Present). Formerly, Senior Vice President, UMB Investment Services Group, LLC (November 2003–December 2006). |
| |
Kimberly K. Springer
7337 East Doubletree Ranch Rd.
Suite 100
Scottsdale, Arizona 85258
Age: 53 | | | | Vice President | | March 2006–Present | | Vice President, ING Investment Management — ING Funds (March 2010–Present); Vice President, ING Funds Services, LLC(3) (March 2006–Present) and Managing Paralegal, Registration Statements (June 2003–Present). Formerly, Assistant Vice President, ING Funds Services, LLC(3) (August 2004–March 2006). |
| |
Craig Wheeler
7337 East Doubletree Ranch Rd.
Suite 100
Scottsdale, Arizona 85258
Age: 41 | | | | Assistant Vice President | | June 2008–Present | | Assistant Vice President — Director of Tax, ING Funds Services (March 2008–Present). Formerly, Tax Manager, ING Funds Services (March 2005–March 2008). |
| |
Huey P. Falgout, Jr.
7337 East Doubletree Ranch Rd.
Suite 100
Scottsdale, Arizona 85258
Age: 47 | | | | Assistant Secretary | | September 2003–Present | | Senior Vice President and Chief Counsel, ING Investment Management — ING Funds (March 2010–Present). Formerly, Chief Counsel, ING Americas, U.S. Legal Services (October 2003–March 2010). |
| |
Theresa K. Kelety
7337 East Doubletree Ranch Rd.
Suite 100
Scottsdale, Arizona 85258
Age: 47 | | | | Secretary | | September 2003–Present | | Vice President and Senior Counsel, ING Investment Management — ING Funds (March 2010–Present). Formerly, Senior Counsel, ING Americas, U.S. Legal Services (April 2008–March 2010) and Counsel, ING Americas, U.S. Legal Services (April 2003–April 2008). |
| |
Kathleen Nichols
7337 East Doubletree Ranch Rd.
Suite 100
Scottsdale, Arizona 85258
Age: 35 | | | | Assistant Secretary | | June 2008–Present | | Vice President and Counsel, ING Investment Management — ING Funds (March 2010–Present). Formerly, Counsel, ING Americas, U.S. Legal Services (February 2008–March 2010) and Associate, Ropes & Gray LLP (September 2005–February 2008). |
| |
Paul Caldarelli
7337 East Doubletree Ranch Rd.
Suite 100
Scottsdale, Arizona 85258
Age: 59 | | | | Assistant Secretary | | August 2010–Present | | Vice President and Senior Counsel, ING Investment Management — ING Funds (March 2010–Present). Formerly, Senior Counsel, ING Americas, U.S. Legal Services (April 2008–March 2010) and Counsel, ING Americas, U.S. Legal Services (May 2005–April 2008). |
(1) | | The officers hold office until the next annual meeting of the Trustees and until their successors shall have been elected and qualified. |
(2) | | ING Investments, LLC was previously named ING Pilgrim Investments, LLC. ING Pilgrim Investments, LLC is the successor in interest to ING Pilgrim Investments, Inc., which was previously known as Pilgrim Investments, Inc. and before that was known as Pilgrim America Investments, Inc. |
(3) | | ING Funds Services, LLC was previously named ING Pilgrim Group, LLC. ING Pilgrim Group, LLC is the successor in interest to ING Pilgrim Group, Inc., which was previously known as Pilgrim Group, Inc. and before that was known as Pilgrim America Group, Inc. |
(4) | | ING Investments Distributor, LLC was previously named ING Funds Distributor, LLC. ING Funds Distributor, LLC is the successor in interest to ING Funds Distributor, Inc., which was previously known as ING Pilgrim Securities, Inc., and before that, was known as Pilgrim Securities, Inc., and before that was known as Pilgrim America Securities, Inc. |
(5) | | Mr. Mathews commenced services as CEO and President of the ING Funds on November 11, 2006. |
(6) | | Directed Services LLC is the successor in interest to Directed Services, Inc. |
132
ADVISORY CONTRACT APPROVAL DISCUSSION (UNAUDITED)
BOARD CONSIDERATION AND APPROVAL OF INVESTMENT ADVISORY AND SUB-ADVISORY AGREEMENTS
The Investment Company Act of 1940, as amended (the “1940 Act”), provides, in substance, that each investment advisory agreement and sub-advisory agreement for a mutual fund will terminate automatically after the initial term of the agreement (which term may not exceed two years), unless continuation of the agreement is approved annually by the Board of Trustees or Directors, as the case may be (the “Board”) of the fund, including a majority of the Trustees/Directors who have no direct or indirect interest in the agreement and who are not “interested persons” of the fund (the “Independent Trustees”). Consistent with this requirement of the 1940 Act, the Board of ING Balanced Portfolio, Inc., ING Strategic Allocation Portfolios, Inc., ING Intermediate Bond Portfolio, ING Money Market Portfolio, ING Variable Funds, ING Variable Portfolios, Inc. and ING Series Fund, Inc., with respect to each portfolio series thereof (each, a “Fund” and, collectively, the “Funds”) has established a process for considering on an annual basis approval of the continuation of the investment management agreement for each Fund (the “Advisory Agreement”) with ING Investments, LLC (the “Adviser”) and the sub-advisory agreement for each Fund (collectively, the “Sub-Advisory Agreements”) with each sub-adviser of the Funds (the “Sub-Advisers”). Set forth below is a description of the process followed by the Board in considering approval of the continuation of each Advisory and Sub-Advisory Agreement (collectively, the “Agreements”), together with an explanation of many of the factors considered and related conclusions reached by the Board in voting to approve the continuation of each Agreement for an additional one-year period commencing January 1, 2011, followed by specific considerations with respect to each Fund covered by this report (each a “Portfolio”).
Overview of the Review Process
At a meeting of the Board held on December 15, 2010, the Board, including all of the Independent Trustees, voted to approve continuation of each of the existing Agreements for the Funds. Prior to voting such approvals, the Board received the affirmative recommendation of the Contracts Committee of the Board, which is a Committee of the Board comprised of all of the Independent Trustees and exclusively of the Independent Trustees. The Contracts Committee recommended approval of the Agreements after completing an extensive review of information requested by the Committee from the Adviser and each Sub-Adviser, including the following: (1) comparative performance data for each Fund for various time periods; (2) comparative data regarding management fees, including data regarding the fees charged by the Adviser and Sub-Advisers for managing other mutual funds and institutional accounts using investment strategies and techniques similar to those used in managing the Funds; (3) comparative data regarding the total expenses of each Fund; (4) copies of each form of Advisory Agreement and Sub-Advisory Agreement; (5) copies of the codes of ethics of the Adviser and each Sub-Adviser, together with information relating to the manner in which each code is administered; (6) financial statements of the Adviser and each Sub-Adviser; (7) profitability analyses for the Adviser and each Sub-Adviser with respect to each Fund, and all Funds as a group; (8) descriptions of the qualifications of the investment personnel responsible for managing each Fund, the structure of their compensation and their responsibilities with respect to managing other accounts or mutual funds; (9) descriptions of the services provided to the Funds, including the investment strategies and techniques used by each Sub-Adviser in managing the Funds; (10) data relating to portfolio turnover and brokerage practices, including practices with respect to the acquisition of research through “soft dollar” benefits received in connection with the Funds’ brokerage; (11) descriptions of the policies and procedures of the various service providers of the Funds for protecting the privacy of shareholder information; (12) information relating to projected sales and redemptions of Fund shares and business plans relating to the Adviser’s mutual fund platform; (13) descriptions of the business continuity and disaster recovery plans of the Adviser and each Sub-Adviser; (14) descriptions of various compliance programs of the Adviser and Sub-Advisers, including the Adviser’s programs for monitoring and enforcing compliance with the Funds’ policies with respect to market-timing, late trading and selective portfolio disclosure; (15) independent reports analyzing the quality of the trade execution services performed by Sub-Advisers for the Funds; and (16) other information relevant to an evaluation of the nature, extent and quality of the services provided by the Adviser and each Sub-Adviser in response to a series of detailed questions posed by Goodwin Procter LLP, legal counsel for the Independent Trustees (“Independent Counsel”) on behalf of the Independent Trustees.
The Contracts Committee began the formal review process in August 2010 when it met separately with Independent Counsel to review the information to be requested from management and the methodology to be used in determining the selected peer groups for comparing performance and expenses (the “Peer
133
ADVISORY CONTRACT APPROVAL DISCUSSION (UNAUDITED) (CONTINUED)
Group Methodology”). Prior to the August meeting, the Contracts Committee engaged an independent consultant (the “Independent Consultant”) to evaluate, and make recommendations with respect to, the Peer Group Methodology. The Independent Consultant’s findings were reported to the Contracts Committee at the August meeting and incorporated into the Peer Group Methodology approved by the Board. The Contracts Committee then held meetings on October 19-20, 2010 and December 13-14, 2010, during which the Independent Trustees, meeting separately with Independent Counsel, reviewed and evaluated the information described above. As part of the review process, the Contracts Committee also met with representatives from the Adviser and/or the Sub-Advisers to discuss the information provided to the Committee. The Contracts Committee also considered information that had been provided by the Adviser and Sub-Advisers throughout the year at other meetings of the Contracts Committee, the Audit Committee, the Compliance Committee and the full Board.
The Independent Trustees were assisted by Independent Counsel, throughout the contract review process. The Independent Trustees relied upon the advice of Independent Counsel and their own business judgment in determining the material factors to be considered in evaluating each Advisory and Sub-Advisory Agreement and the weight to be given to each such factor. The conclusions reached by the Independent Trustees were based on a comprehensive evaluation of all of the information provided and were not the result of any one factor. Moreover, each Independent Trustee may have afforded different weight to the various factors in reaching his or her conclusions with respect to each Advisory and Sub-Advisory Agreement.
Nature, Extent and Quality of Services
In considering whether to approve the Advisory and Sub-Advisory Agreements for the Funds for the year commencing January 1, 2011, the Board evaluated the nature, extent and quality of services provided to the Funds by the Adviser and Sub-Advisers. The Board considered the investment management and related services provided by the Adviser and Sub-Advisers, including the quantity and quality of the resources available to provide such services. Among other things, the Board considered the qualifications of the individuals responsible for performing various investment related services.
The Board also considered the quality of the compliance programs of the Adviser and each Sub-Adviser, including the manner in which the Adviser and each Sub-Adviser monitor for compliance with the investment policies and restrictions of a Fund and with the Codes of Ethics of the Funds, the Adviser and the Sub-Advisers with respect to personal trading by employees with access to portfolio information. The Board also considered the actions taken by the Adviser and Sub-Advisers to establish and maintain effective disaster recovery and business continuity plans.
The Board considered the actions taken by the Adviser and its affiliated companies to administer the Funds’ policies and procedures for voting proxies, valuing the Funds’ assets, selective disclosure of portfolio holdings and preventing late-trading and frequent trading of Fund shares.
The Board also took into account the efforts of the Adviser and its affiliated companies to reduce the expenses of the Funds. With respect to those Funds that are sub-advised by an affiliate of the Adviser, the Board specifically noted that, in recent years, the Adviser and its affiliated companies have significantly reduced the Funds’ brokerage costs and portfolio turnover rates, as well as the quantity of research acquired through the use of soft dollars from the Funds’ brokerage. The Board also noted the efforts of the Adviser to optimize the number of Funds in the ING complex of mutual funds and to standardize the asset management characteristics and policies across the ING mutual fund platform. The Board considered information provided by management with respect to the progress made within ING Groep to establish an integrated global asset management firm (the “Global Transition”), including information with respect to any benefits to the Funds and their shareholders as a result of operational efficiencies achieved through the Global Transition. The Board also considered the benefits that shareholders of the Funds realize because the Funds are part of the larger ING family of mutual funds, including, in most cases, the ability of shareholders to exchange or transfer investments within the same class of shares among a wide variety of mutual funds without incurring additional sales charges. In that regard, the Board considered the potential impacts of any divestiture of its insurance business, which includes the investment management businesses, by ING Groep or significant change in structure of the investment management business, if any, on the services provided to the Funds by the Adviser and Sub-Advisers. The Board also considered the actions that have been taken by management to retain key investment management personnel in light of such a potential divestiture.
The Board also considered the Adviser’s responsiveness and recommendations for Board action and other steps taken in response to the extraordinary dislocations experienced in the capital markets in recent years,
134
ADVISORY CONTRACT APPROVAL DISCUSSION (UNAUDITED) (CONTINUED)
including sustained periods of high volatility, credit disruption and government intervention. In particular, the Board considered the Adviser’s efforts and expertise with respect to each of the following matters as they relate to the Funds: (i) negotiating and maintaining the availability of bank loan facilities and other sources of credit used to satisfy liquidity needs; (ii) establishing the fair value of securities and other instruments held in investment portfolios during periods of market volatility and issuer-specific disruptions; (iii) negotiating and maintaining credit support from the Funds’ securities lending agent with respect to certain defaulted securities held indirectly by the Funds as collateral for securities on loan; and (iv) the ongoing monitoring of investment management processes and risk controls.
The Board’s approval of the Advisory and Sub-Advisory Agreements was informed by certain information provided by the Adviser and the applicable Sub-Advisers with respect to certain actions to be taken to correct underperformance and lack of scale with respect to certain Funds as indicated in the Portfolio-by-Portfolio analysis below.
The Board concluded that the nature, extent and quality of advisory and related services provided by the Adviser and each of the Sub-Advisers, taken as a whole, are consistent with the terms of the respective Advisory and Sub-Advisory Agreements and justify the fees paid by the Funds for such services.
Fund Performance
The Board reviewed each Fund’s investment performance over various time periods on an absolute basis and relative to the performance of (i) one or more appropriate benchmark indexes (such as the S&P 500 Composite Stock Price Index), (ii) a group of similarly managed mutual funds identified by Lipper, Inc. and/or Morningstar, Inc., and (iii) similarly managed mutual funds within a specified peer group based upon the Peer Group Methodology approved by the Contracts Committee (each, a “Selected Peer Group”). The Board reviewed comparative performance data for the most recent calendar quarter, year-to-date, one-, three-, five- and ten-year periods, where applicable, ending June 30, 2010 and the most recent calendar quarter, year-to-date, one-, three-, and five-year periods ending September 30, 2010. In considering the performance of the Funds, the Board noted the instability of the markets and periods of high volatility during the prior two years and the response of the Adviser and each Sub-Adviser to such volatility. Summaries of selected portions of the performance information reviewed by the Board, together with the Board’s conclusions regarding the performance of each Portfolio, are set forth below under “Portfolio-by-Portfolio Analysis.”
Management Fees, Sub-Advisory Fees and Expenses
Consideration was given to the contractual investment advisory fee rates, inclusive of administrative fee rates, payable by the Funds to the Adviser and its affiliated companies (referred to collectively as “management fees”) and the contractual sub-advisory fee rates payable by the Adviser to each Sub-Adviser for sub-advisory services. As part of its review, the Board considered each Fund’s management fee and total expense ratio, as compared to its Selected Peer Group, both before and after giving effect to any undertaking by the Adviser to waive fees and/or limit the total expenses of a Fund. In addition, the Trustees received information regarding the fees charged by each Sub-Adviser to similarly-managed institutional accounts and other mutual funds, if any, and the comparability (or lack thereof) of the services provided by the Sub-Adviser in managing such accounts and other mutual funds to the services provided in managing the Funds. With respect to the Funds sub-advised by an affiliate of the Adviser, the Board evaluated the reasonableness of the total fees received by the Adviser and its affiliate in the aggregate under the Advisory and Sub-Advisory Agreements. With respect to those Funds sub-advised by a Sub-Adviser that is not affiliated with the Adviser, the Board considered the reasonableness of the fees payable to the Sub-Adviser by the Adviser in light of the ability of the Adviser to negotiate such fees on an arm’s-length basis. Summaries of selected portions of the fee and expense information reviewed with respect to each Portfolio are set forth below under “Portfolio-by-Portfolio Analysis.” After reviewing the foregoing information, and in light of the nature, extent and quality of the services provided by the Adviser and each Sub-Adviser, the Board concluded with respect to each Fund that the management fee charged to the Fund for advisory, sub-advisory and related services is fair and reasonable and that the total expense ratio of the Fund is reasonable.
Profitability
The Board considered information relating to revenues, expenses, and profits realized by the Adviser and each Sub-Adviser attributable to performing advisory, sub-advisory and administrative services for the Funds. With respect to Funds sub-advised by an unaffiliated Sub-Adviser, the Board did not consider the profitability of the Sub-Adviser to be a material factor because the Board believes that the Adviser negotiates sub-advisory fees with the unaffiliated Sub-Adviser on an arm’s-length basis. The Board reviewed
135
ADVISORY CONTRACT APPROVAL DISCUSSION (UNAUDITED) (CONTINUED)
profitability data for the Adviser and its affiliated companies, including the distributor of the Funds, relating to (i) each Fund separately, (ii) all Funds as a group, (iii) all “retail” Funds as a group, and (iv) all variable insurance product Funds as a group, in each case for the one-year periods ended December 31, 2009 and December 31, 2008 and the nine-month period ended September 30, 2010. With respect to the Adviser and its affiliates, such information was prepared in accordance with a methodology approved by the Contracts Committee. The Board considered the profitability of the Adviser and its affiliated companies attributable to managing and operating each Fund both with and without the profitability of the distributor of the Funds and both before and after giving effect to any expenses incurred by the Adviser or any affiliated company in making revenue sharing or other payments to third parties, including affiliated insurance companies, for distribution and administrative services. With respect to Funds sub-advised by an affiliate of the Adviser, the Board considered the total profits derived by the Adviser and its affiliate in the aggregate attributable to managing and operating each Fund. The Board also considered other direct or indirect benefits that the Adviser and Sub-Advisers, and any affiliated companies thereof, derive from their relationships with the Funds, including the receipt by certain affiliates of the Adviser, of fees relating to the offering of bundled financial products, such as annuity contracts, and the receipt by Sub-Advisers of “soft dollar” benefits from the Funds’ brokerage. The Board concluded that, in light of the nature, extent and quality of the services provided, the profits realized by the Adviser and its affiliated companies, individually and taken as a whole, with respect to providing advisory, sub-advisory and administrative services for each Fund are reasonable.
Economies of Scale
In considering the reasonableness of the management fee of each Fund, the Board considered the extent to which economies of scale can be expected to be realized by a Fund’s Adviser and its affiliated companies, on the one hand, and by the Fund, on the other hand, as the assets of the Fund increase. The Board noted that the advisory fee schedule for certain Funds includes breakpoints such that, as the assets of the Fund increase, the Fund’s management fee will decrease as a percentage of the Fund’s total assets. The Board recognized the inherent difficulties in measuring precisely the impact of any economies of scale being realized by the Adviser and its affiliated companies with respect to their management of any one or more Funds. In an effort to determine the extent to which economies of scale, if any, will be realized by the Adviser and its affiliated companies as the assets of the Funds grow, the Board considered the profitability data described above relating to the Adviser and its affiliated companies in light of changes in the assets of the Funds over various time periods. The Board noted that the total assets under management of many of the Funds have decreased during the past several years and concluded that the economies of scale realized by the Adviser and its affiliated companies from managing the Funds have not increased with respect to such Funds. The Board also reviewed information regarding the expense ratio of each Fund in light of changes in the assets of the Funds over various time periods, noting that, as the assets of a Fund increase, the fixed expenses of the Fund, as a percentage of the total assets of the Fund, can be expected to decrease. The Board considered such expense information in light of projections provided by the Adviser with respect to the future growth of assets of the Funds. The Board also considered the extent to which economies of scale have been, or are expected to be, realized as a result of the Global Transition. Based upon the foregoing, the Board concluded that the economies of scale being realized by the Adviser and its affiliated companies do not mandate the implementation of breakpoints or additional breakpoints, as the case may be, with respect to any Fund at this time except as otherwise indicated with respect to any specific Portfolio in the Portfolio-by-Portfolio analysis.
Portfolio-by-Portfolio Analysis
In deciding to approve the continuation of each Advisory and Sub-Advisory Agreement for an additional one-year period beginning January 1, 2011, the Board took into account the specific data and factors identified below relating to the performance, fees and expenses of each Fund and actions being taken by the Adviser or Sub-Adviser, as the case may be, with respect to these matters. Except as otherwise indicated, the performance data described below for each Portfolio is for periods ended September 30, 2010 and the management fees and expense data described below are as of June 30, 2010.
ING International Index Portfolio
In evaluating the investment performance of ING International Index Portfolio, the Board noted that the Portfolio’s investment objective is to track the performance of the MSCI EAFE Index and that when the performance of the index is adjusted for expenses, the Portfolio’s performance has corresponded to the performance of the index. The Board concluded that the performance of the Portfolio has been satisfactory.
136
ADVISORY CONTRACT APPROVAL DISCUSSION (UNAUDITED) (CONTINUED)
In assessing the reasonableness of the management fee and expense ratio for ING International Index Portfolio, the Board noted that the management fee for the Portfolio is above the median and average management fees of the funds in its Selected Peer Group and that the expense ratio for the Portfolio is above the median and below the average expense ratios of the funds in its Selected Peer Group.
ING Euro STOXX 50 Index Portfolio
In evaluating the investment performance of ING Euro STOXX 50 Index Portfolio, the Board noted that the Portfolio’s investment objective is to track the performance of the Dow Jones EURO STOXX Index and that when the performance of the index is adjusted for expenses, the Portfolio’s performance has corresponded to the performance of the index. The Board concluded that the performance of the Portfolio has been satisfactory.
In assessing the reasonableness of the management fee and expense ratio for ING Euro STOXX 50 Index Portfolio, the Board noted that the management fee for the Portfolio is above the median and average management fees of the funds in its Selected Peer Group and that the expense ratio for the Portfolio is above the median and below the average expense ratios of the funds in its Selected Peer Group.
ING FTSE 100 Index Portfolio
In evaluating the investment performance of ING FTSE 100 Index Portfolio, the Board noted that the Portfolio’s investment objective is to track the performance of the FTSE 100 Index and that when the performance of the index is adjusted for expenses, the Portfolio’s performance has corresponded to the performance of the index. The Board concluded that the performance of the Portfolio has been satisfactory.
In assessing the reasonableness of the management fee and expense ratio for ING FTSE 100 Index Portfolio, the Board noted that the management fee for the Portfolio is below the median and average management fees of the funds in its Selected Peer Group and that the expense ratio for the Portfolio is below the median and the average expense ratios of the funds in its Selected Peer Group.
ING Hang Seng Index Portfolio
In evaluating the investment performance of ING Hang Seng Index Portfolio, the Board noted that the Portfolio’s investment objective is to track the performance of the Hang Seng Index and that when the performance of the index is adjusted for expenses, the Portfolio’s performance has corresponded to the performance of the index. The Board concluded that the performance of the Portfolio has been satisfactory.
In assessing the reasonableness of the management fee and expense ratio for ING Hang Seng Index Portfolio, the Board noted that the management fee for the Portfolio is above the median and average management fees of the funds in its Selected Peer Group and that the expense ratio for the Portfolio is below the median and the average expense ratios of the funds in its Selected Peer Group.
ING Japan TOPIX Index Portfolio
In evaluating the investment performance of ING Japan TOPIX Index Portfolio, the Board noted that the Portfolio’s investment objective is to track the performance of the Tokyo Stock Price Index and that when the performance of the index is adjusted for expenses, the Portfolio’s performance has corresponded to the performance of the index. The Board concluded that the performance of the Portfolio has been satisfactory.
In assessing the reasonableness of the management fee and expense ratio for ING Japan TOPIX Index Portfolio, the Board noted that the management fee for the Portfolio is below the median and average management fees of the funds in its Selected Peer Group and that the expense ratio for the Portfolio is below the median and the average expense ratios of the funds in its Selected Peer Group.
ING Russell Large Cap Index Portfolio
In evaluating the investment performance of ING Russell Large Cap Index Portfolio, the Board noted that the Portfolio’s investment objective is to track the performance of the Russell Top 200 Index and that when the performance of the index is adjusted for expenses, the performance of the Portfolio has corresponded to the performance of the index. The Board concluded that the performance of the Portfolio has been satisfactory.
In assessing the reasonableness of the management fee and expense ratio for ING Russell Large Cap Index Portfolio, the Board noted that the management fee for the Portfolio is above the median and average management fees of the funds in its Selected Peer Group and that the expense ratio for the Portfolio is above the median and average expense ratios of the funds in its Selected Peer Group.
ING Russell Mid Cap Index Portfolio
In evaluating the investment performance of ING Russell Mid Cap Index Portfolio, the Board noted that the Portfolio’s investment objective is to track the
137
ADVISORY CONTRACT APPROVAL DISCUSSION (UNAUDITED) (CONTINUED)
performance of the Russell Midcap Index and that when the performance of the index is adjusted for expenses, the performance of the Portfolio has corresponded to the performance of the index. The Board concluded that the performance of the Portfolio has been satisfactory.
In assessing the reasonableness of the management fee and expense ratio for ING Russell Mid Cap Index Portfolio, the Board noted that the management fee for the Portfolio is above the median and average management fees of the funds in its Selected Peer Group and that the expense ratio for the Portfolio is above the median and below the average expense ratios of the funds in its Selected Peer Group.
ING Russell Small Cap Index Portfolio
In evaluating the investment performance of ING Russell Small Cap Index Portfolio, the Board noted that the Portfolio’s investment objective is to track the performance of the Russell 2000 Index and that when the performance of the index is adjusted for expenses, the performance of the Portfolio has corresponded to the performance of the index. The Board concluded that the performance of the Portfolio has been satisfactory.
In assessing the reasonableness of the management fee and expense ratio for ING Russell Small Cap Index Portfolio, the Board noted that the management fee for the Portfolio is above the median and average management fees of the funds in its Selected Peer Group and that the expense ratio for the Portfolio is below the median and above the average expense ratios of the funds in its Selected Peer Group.
ING Russell Large Cap Growth Index Portfolio
In evaluating the investment performance of ING Russell Large Cap Growth Index Portfolio, the Board noted that the Portfolio’s investment objective is to track the performance of the Russell Top 200 Growth Index and that when the performance of the index is adjusted for expenses, the performance of the Portfolio has corresponded to the performance of the index. The Board concluded that the performance of the Portfolio has been satisfactory.
In assessing the reasonableness of the management fee and expense ratio for ING Russell Large Cap Growth Index Portfolio, the Board noted that the management fee for the Portfolio is above the median and average management fees of the funds in its Selected Peer Group and that the expense ratio for the Portfolio is above the median and average expense ratios of the funds in its Selected Peer Group.
ING Russell Large Cap Value Index Portfolio
In evaluating the investment performance of ING Russell Large Cap Value Index Portfolio, the Board noted that the Portfolio’s investment objective is to track the performance of the Russell Top 200 Value Index and that when the performance of the index is adjusted for expenses, the performance of the Portfolio has corresponded to the performance of the index. The Board concluded that the performance of the Portfolio has been satisfactory.
In assessing the reasonableness of the management fee and expense ratio for ING Russell Large Cap Value Index Portfolio, the Board noted that the management fee for the Portfolio is above the median and average management fees of the funds in its Selected Peer Group and that the expense ratio for the Portfolio is above the median and average expense ratios of the funds in its Selected Peer Group.
ING Russell Mid Cap Growth Index Portfolio
In evaluating the investment performance of ING Russell Mid Cap Growth Index Portfolio, the Board noted that the Portfolio’s investment objective is to track the performance of the Russell Midcap Growth Index and that when the performance of the index is adjusted for expenses, the performance of the Portfolio has corresponded to the performance of the index. The Board concluded that the performance of the Portfolio has been satisfactory.
In assessing the reasonableness of the management fee and expense ratio for ING Russell Large Cap Value Index Portfolio, the Board noted that the management fee for the Portfolio is above the median and average management fees of the funds in its Selected Peer Group and that the expense ratio for the Portfolio is above the median and average expense ratios of the funds in its Selected Peer Group.
ING WisdomTree Global High-Yielding Equity Index Portfolio
In evaluating the investment performance of ING WisdomTree Global High-Yielding Equity Index Portfolio, the Board noted that the Portfolio’s investment objective is to track the performance of WisdomTree Global High-Yielding Equity Index and that when the performance of the index is adjusted for expenses, the performance of the Portfolio has corresponded to the performance of the index. The Board concluded that the performance of the Portfolio has been satisfactory.
In assessing the reasonableness of the management fee and expense ratio for ING WisdomTree Global
138
ADVISORY CONTRACT APPROVAL DISCUSSION (UNAUDITED) (CONTINUED)
High-Yielding Equity Index Portfolio, the Board noted that the management fee for the Portfolio is above the median and average management fees of the funds in its Selected Peer Group and that the expense ratio for the Portfolio is above the median and average expense ratios of the funds in its Selected Peer Group.
ING U.S. Bond Index Portfolio
In evaluating the investment performance of ING U.S. Bond Index Portfolio, the Board noted that the Portfolio’s investment objective is to track the performance of Barclay’s Capital U.S. Aggregate Bond Index and that when the performance of the index is adjusted for expenses, the performance of the Portfolio has corresponded to the performance of the index.
In assessing the reasonableness of the management fee and expense ratio for ING U.S. Bond Index Portfolio, the Board noted that the management fee for the Portfolio is above the median and average management fees of the funds in its Selected Peer Group and that the expense ratio for the Portfolio is above the median and average expense ratios of the funds in its Selected Peer Group. The Board further noted that, at the request of the Contracts Committee, the Adviser agreed to amend the advisory fee schedule to add breakpoints that will result in a sharing of economies of scale attributable to recent increases in the assets of the Portfolio.
139
(THIS PAGE INTENTIONALLY LEFT BLANK)
(THIS PAGE INTENTIONALLY LEFT BLANK)
Investment Adviser
ING Investments, LLC
7337 East Doubletree Ranch Road, Suite 100
Scottsdale, Arizona 85258
Administrator
ING Funds Services, LLC
7337 East Doubletree Ranch Road, Suite 100
Scottsdale, Arizona 85258
Distributor
ING Investments Distributor, LLC
7337 East Doubletree Ranch Road, Suite 100
Scottsdale, Arizona 85258
Transfer Agent
BNY Mellon Investment Servicing (U.S.) Inc.
301 Bellevue Parkway
Wilmington, Delaware 19809
Independent Registered Public Accounting Firm
KPMG LLP
Two Financial Center
60 South Street
Boston, Massachusetts 02111
Custodian
The Bank of New York Mellon
One Wall Street
New York, New York 10286
Legal Counsel
Goodwin Procter LLP
Exchange Place
53 State Street
Boston, Massachusetts 02109
Before investing, carefully consider the investment objectives, risks, charges and expenses of the variable annuity contract and the underlying variable investment options. This and other information is contained in the prospectus for the variable annuity contract and the underlying variable investment options. Obtain these prospectuses from your agent/registered representative and read them carefully before investing.
| | VPAR-AVIPALL (1210-021811) |
Item 2. Code of Ethics.
As of the end of the period covered by this report, Registrant had adopted a code of ethics, as defined in Item 2 of Form N-CSR, that applies to the Registrant’s principal executive officer and principal financial officer. There were no amendments to the Code during the period covered by the report. The Registrant did not grant any waivers, including implicit waivers, from any provisions of the Code during the period covered by this report. The code of ethics is filed herewith pursuant to Item 10(a)(1), Exhibit 99.CODE ETH.
Item 3. Audit Committee Financial Expert.
The Board of Trustees has determined that Corine Norgaard and Joseph Obermeyer are each audit committee financial experts, as defined in Item 3 of Form N-CSR. Ms. Norgaard and Mr. Obermeyer are both “independent” for purposes of Item 3 of Form N-CSR.
Item 4. Principal Accountant Fees and Services.
(a) Audit Fees: The aggregate fees billed for each of the last two fiscal years for professional services rendered by KPMG LLP (“KPMG”), the principal accountant for the audit of the registrant’s annual financial statements, for services that are normally provided by the accountant in connection with statutory and regulatory filings or engagements for those fiscal years were $337,214 for year ended December 31, 2010 and $284,596 for year ended December 31, 2009.
(b) Audit-Related Fees: The aggregate fees billed in each of the last two fiscal years for assurance and related services by KPMG that are reasonably related to the performance of the audit of the registrant’s financial statements and are not reported under paragraph (a) of this Item were $38,700 for year ended December 31, 2010 and $47,905 for year ended December 31, 2009.
(c) Tax Fees: The aggregate fees billed in each of the last two fiscal years for professional services rendered by KPMG for tax compliance, tax advice, and tax planning were $57,022 in the year ended December 31, 2010 and $103,801 in the year ended December 31, 2009. Such services included review of excise distribution calculations (if applicable), preparation of the Funds’ federal, state and excise tax returns, tax services related to mergers and routine consulting.
(d) All Other Fees: The aggregate fees billed in each of the last two fiscal years for products and services provided by KPMG, other than the services reported in paragraphs (a) through (c) of this Item were $10,000 in the year ended December 31, 2010 and $7,500 in the year ended December 31, 2009.
(e) (1) Audit Committee Pre-Approval Policies and Procedures
2
AUDIT AND NON-AUDIT SERVICES
PRE-APPROVAL POLICY
I. Statement of Principles
Under the Sarbanes-Oxley Act of 2002 (the “Act”), the Audit Committee of the Board of Directors or Trustees (the “Committee”) of the ING Funds (each a “Fund,” collectively, the “Funds”) set out under Paragraph I on Exhibit A to this Audit and Non-Audit Services Pre-Approval Policy (“Policy”) is responsible for the oversight of the work of the Funds’ independent auditors. As part of its responsibilities, the Committee must pre-approve the audit and non-audit services performed by the auditors in order to assure that the provision of these services does not impair the auditors’ independence from the Funds. The Committee has adopted, and the Board has ratified, this Policy, which sets out the procedures and conditions under which the services of the independent auditors may be pre-approved.
Under Securities and Exchange Commission (“SEC”) rules promulgated in accordance with the Act, the Funds’ may establish two different approaches to pre-approving audit and non-audit services. The Committee may approve services without consideration of specific case-by-case services (“general pre-approval”) or it may pre-approve specific services (“specific pre-approval”). The Committee believes that the combination of these approaches contemplated in this Policy results in an effective and efficient method for pre-approving audit and non-audit services to be performed by the Funds’ independent auditors. Under this Policy, services that are not of a type that may receive general pre-approval require specific pre-approval by the Committee. Any proposed services that exceed pre-approved cost levels or budgeted amounts will also require the Committee’s specific pre-approval.
For both types of approval, the Committee considers whether the subject services are consistent with the SEC’s rules on auditor independence and that such services are compatible with maintaining the auditors’ independence. The Committee also considers whether a particular audit firm is in the best position to provide effective and efficient services to the Funds. Reasons that the auditors are in the best position include the auditors’ familiarity with the Funds’ business, personnel, culture, accounting systems, risk profile, and other factors, and whether the services will enhance the Funds’ ability to manage and control risk or improve audit quality. Such factors will be considered as a whole, with no one factor being determinative.
The appendices attached to this Policy describe the audit, audit-related, tax-related, and other services that have the Committee’s general pre-approval. For any service that has been approved through general pre-approval, the general pre-approval will remain in place for a period 12 months from the date of pre-approval, unless the Committee determines that a different period is appropriate. The Committee will annually review and pre-approve the services that may be provided by the independent auditors without specific pre-approval. The Committee will revise the list of services subject to general pre-approval as appropriate. This Policy does not serve as a delegation to Fund management of the Committee’s duty to pre-approve services performed by the Funds’ independent auditors.
3
II. Audit Services
The annual audit services engagement terms and fees are subject to the Committee’s specific pre-approval. Audit services are those services that are normally provided by auditors in connection with statutory and regulatory filings or engagements or those that generally only independent auditors can reasonably provide. They include the Funds’ annual financial statement audit and procedures that the independent auditors must perform in order to form an opinion on the Funds’ financial statements (e.g., information systems and procedural reviews and testing). The Committee will monitor the audit services engagement and approve any changes in terms, conditions or fees deemed by the Committee to be necessary or appropriate.
The Committee may grant general pre-approval to other audit services, such as statutory audits and services associated with SEC registration statements, periodic reports and other documents filed with the SEC or issued in connection with securities offerings.
The Committee has pre-approved the audit services listed on Appendix A. The Committee must specifically approve all audit services not listed on Appendix A.
III. Audit-related Services
Audit-related services are assurance and related services that are reasonably related to the performance of the audit or the review of the Funds’ financial statements or are traditionally performed by the independent auditors. The Committee believes that the provision of audit-related services will not impair the independent auditors’ independence, and therefore may grant pre-approval to audit-related services. Audit-related services include accounting consultations related to accounting, financial reporting or disclosure matters not classified as “audit services;” assistance with understanding and implementing new accounting and financial reporting guidance from rulemaking authorities; agreed-upon or expanded audit procedures relating to accounting and/or billing records required to respond to or comply with financial, accounting or regulatory reporting matters; and assistance with internal control reporting requirements under Form N-SAR or Form N-CSR.
The Committee has pre-approved the audit-related services listed on Appendix B. The Committee must specifically approve all audit-related services not listed on Appendix B.
IV. Tax Services
The Committee believes the independent auditors can provide tax services to the Funds, including tax compliance, tax planning, and tax advice, without compromising the auditors’ independence. Therefore, the Committee may grant general pre-approval with respect to tax services historically provided by the Funds’ independent auditors that do not, in the Committee’s view, impair auditor independence and that are consistent with the SEC’s rules on auditor independence.
The Committee will not grant pre-approval if the independent auditors initially recommends a transaction the sole business purpose of which is tax avoidance and the tax treatment of which may
4
not be supported in the Internal Revenue Code and related regulations. The Committee may consult outside counsel to determine that tax planning and reporting positions are consistent with this Policy.
The Committee has pre-approved the tax-related services listed on Appendix C. The Committee must specifically approve all tax-related services not listed on Appendix C.
V. Other Services
The Committee believes it may grant approval of non-audit services that are permissible services for independent auditors to a Fund. The Committee has determined to grant general pre-approval to other services that it believes are routine and recurring, do not impair auditor independence, and are consistent with SEC rules on auditor independence.
The Committee has pre-approved the non-audit services listed on Appendix D. The Committee must specifically approve all non-audit services not listed on Appendix D.
A list of the SEC’s prohibited non-audit services is attached to this Policy as Appendix E. The SEC’s rules and relevant guidance should be consulted to determine the precise definitions of these impermissible services and the applicability of exceptions to certain of the SEC’s prohibitions.
VI. Pre-approval of Fee levels and Budgeted Amounts
The Committee will annually establish pre-approval fee levels or budgeted amounts for audit, audit-related, tax and non-audit services to be provided to the Funds by the independent auditors. Any proposed services exceeding these levels or amounts require the Committee’s specific pre-approval. The Committee considers fees for audit and non-audit services when deciding whether to pre-approve services. The Committee may determine, for a pre-approval period of 12 months, the appropriate ratio between the total amount of fees for the Fund’s audit, audit-related, and tax services (including fees for services provided to Fund affiliates that are subject to pre-approval), and the total amount of fees for certain permissible non-audit services for the Fund classified as other services (including any such services provided to Fund affiliates that are subject to pre-approval).
VII. Procedures
Requests or applications for services to be provided by the independent auditors will be submitted to management. If management determines that the services do not fall within those services generally pre-approved by the Committee and set out in the appendices to these procedures, management will submit the services to the Committee or its delagee. Any such submission will include a detailed description of the services to be rendered.
Notwithstanding this paragraph, the Committee will, on quarterly basis, receive from the independent auditors a list of services provided to date by the auditors during Pre-Approval Period.
5
VIII. Delegation
The Committee may delegate pre-approval authority to one or more of the Committee’s members. Any member or members to whom such pre-approval authority is delegated must report any pre-approval decisions, including any pre-approved services, to the Committee at its next scheduled meeting. The Committee will identify any member to whom pre-approval authority is delegated in writing. The member will retain such authority for a period of 12 months from the date of pre-approval unless the Committee determines that a different period is appropriate. The period of delegated authority may be terminated by the Committee or at the option of the member.
IX. Additional Requirements
The Committee will take any measures the Committee deems necessary or appropriate to oversee the work of the independent auditors and to assure the auditors’ independence from the Funds. This may include reviewing a formal written statement from the independent auditors delineating all relationships between the auditors and the Funds, consistent with Independence Standards Board No. 1, and discussing with the auditors their methods and procedures for ensuring independence.
Effective April 23, 2008, the KPMG LLP (“KPMG”) audit team for the ING Funds accepted the global responsibility for monitoring the auditor independence for KPMG relative to the ING Funds. Using a proprietary system called Sentinel, the audit team is able to identify and manage potential conflicts of interest across the member firms of the KPMG International Network and prevent the provision of prohibited services to the ING entities that would impair KPMG independence with the respect to the ING Funds. In addition to receiving pre-approval from the ING Funds Audit Committee for services provided to the ING Funds and for services for ING entities in the Investment Company Complex, the audit team has developed a process for periodic notification via email to the ING Funds’ Audit Committee Chairpersons regarding requests to provide services to ING Groep NV and its affiliates from KPMG offices worldwide. Additionally, KPMG provides a quarterly summary of the fees for services that have commenced for ING Groep NV and Affiliates at each Audit Committee Meeting.
Date last approved: September 22, 2010
6
Appendix A
Pre-Approved Audit Services for the Pre-Approval Period September 22, 2010 through December 31, 2011
Service
| | The Fund(s) | | Fee Range |
Statutory audits or financial audits (including tax services associated with audit services) | | Ö | | As presented to Audit Committee(1) |
Services associated with SEC registration statements, periodic reports and other documents filed with the SEC or other documents issued in connection with securities offerings (e.g., consents), and assistance in responding to SEC comment letters. | | Ö | | Not to exceed $9,750 per filing |
Consultations by Fund management with respect to accounting or disclosure treatment of transactions or events and/or the actual or potential effect of final or proposed rules, standards or interpretations by the SEC, Financial Accounting Standards Board, or other regulatory or standard setting bodies. | | Ö | | Not to exceed $8,000 during the Pre-Approval Period |
(1) For new Funds launched during the Pre-Approval Period, the fee ranges pre-approved will be the same as those for existing Funds, pro-rated in accordance with inception dates as provided in KPMG’s Proposal or any Engagement Letter covering the period at issue. Fees in the Engagement Letter will be controlling.
7
Appendix B
Pre-Approved Audit-Related Services for the Pre-Approval Period September 22, 2010 through December 31, 2011
Service
| | The
Fund(s) | | Fund Affiliates | | Fee Range |
Services related to Fund mergers (Excluding tax services — See Appendix C for tax services associated with fund mergers) | | Ö | | Ö | | Not to exceed $10,000 per merger |
Consultations by Fund management with respect to accounting or disclosure treatment of transactions or events and/or the actual or potential effect of final or proposed rules, standards or interpretations by the SEC, Financial Accounting Standards Board, or other regulatory or standard setting bodies. [Note: Under SEC rules some consultations may be “audit” services and others may be “audit-related” services.] | | Ö | | | | Not to exceed $5,000 per occurrence during the Pre-Approval Period |
Review of the Funds’ semi-annual financial statements | | Ö | | | | Not to exceed $2,400 per set of financial statements per fund |
Reports to regulatory or government agencies related to the annual engagement | | Ö | | | | Up to $5,000 per occurrence during the Pre-Approval Period |
Regulatory compliance assistance | | Ö | | Ö | | Not to exceed $5,000 per quarter |
Training courses | | | | Ö | | Not to exceed $2,000 per course |
8
Appendix C
Pre-Approved Tax Services for the Pre-Approval Period September 22, 2010 through December 31, 2011
Service
| | The Fund(s) | | Fund
Affiliates | | Fee Range |
Preparation of federal and state income tax returns and federal excise tax returns for the Funds including assistance and review with excise tax distributions. | | Ö | | | | As presented to Audit Committee(2) |
Review of IRC Sections 851(b) and 817(h) diversification testing on a real-time basis | | Ö | | | | As presented to Audit Committee(2) |
Assistance and advice regarding year-end reporting for 1099’s | | Ö | | | | As presented to Audit Committee(2) |
Tax assistance and advice regarding statutory, regulatory or administrative developments | | Ö | | Ö | | Not to exceed $5,000 in aggregate for the Funds or for the Funds’ investment adviser during the Pre-Approval Period |
Tax training courses | | | | Ö | | Not to exceed $2,000 per course during the Pre-Approval Period |
(2) For new Funds launched during the Pre-Approval Period, the fee ranges pre-approved will be the same as those for existing Funds, as provided in KPMG’s Proposal or any Engagement Letter covering the period at issue. Fees in the Engagement Letter will be controlling.
9
Service
| | The Fund(s) | | Fund
Affiliates | | Fee Range |
Tax services associated with Fund mergers | | Ö | | Ö | | Not to exceed $4,000 per fund per merger during the Pre-Approval Period |
Other tax-related assistance and consultation, including, without limitation, assistance in evaluating derivative financial instruments and international tax issues, qualification and distribution issues, and similar routine tax consultations | | Ö | | | | Not to exceed $50,000 during the Pre-Approval Period |
10
Appendix D
Pre-Approved Other Services for the Pre-Approval Period September 22, 2010 through December 31, 2011
Service
| | The Fund(s) | | Fund Affiliates | | Fee Range |
Agreed-upon procedures for Class B share 12b-1 programs | | | | Ö | | Not to exceed $60,000 during the Pre-Approval Period |
Security counts performed pursuant to Rule 17f-2 of the 1940 Act (i.e., counts for Funds holding securities with affiliated sub-custodians)
(Cost to be split 50% the funds and 50% ING Investments, LLC) | | Ö | | Ö | | Not to exceed $5,000 per Fund during the Pre-Approval Period |
11
Appendix E
Prohibited Non-Audit Services
Dated: 2010 and 2011
· Bookkeeping or other services related to the accounting records or financial statements of the Funds
· Financial information systems design and implementation
· Appraisal or valuation services, fairness opinions, or contribution-in-kind reports
· Actuarial services
· Internal audit outsourcing services
· Management functions
· Human resources
· Broker-dealer, investment adviser, or investment banking services
· Legal services
· Expert services unrelated to the audit
· Any other service that the Public Company Accounting Oversight Board determines, by regulation, is impermissible
12
EXHIBIT A
ING BALANCED PORTFOLIO, INC.
ING STRATEGIC ALLOCATION PORTFOLIOS, INC.
ING INTERMEDIATE BOND PORTFOLIO
ING MONEY MARKET PORTFOLIO
ING VARIABLE FUNDS
ING VARIABLE PORTFOLIOS, INC.
ING SERIES FUND, INC.
13
(e) (2) Percentage of services referred to in 4(b) — (4)(d) that were approved by the audit committee
100% of the services were approved by the audit committee.
(f) Percentage of hours expended attributable to work performed by other than full time employees of KPMG if greater than 50%.
Not applicable.
(g) Non-Audit Fees: The non-audit fees billed by the registrant’s accountant for services rendered to the registrant, and rendered to the registrant’s investment adviser, and any entity controlling, controlled by, or under common control with the adviser that provides ongoing services to the registrant for each of the last two fiscal years of the registrant were $1,220,728 for year ended December 31, 2010 and $2,106,219 for year ended December 31, 2009.
(h) Principal Accountants Independence: The Registrant’s Audit committee has considered whether the provision of non-audit services that were rendered to the registrant’s investment adviser and any entity controlling, controlled by, or under common control with the investment adviser that provides ongoing services to the registrant that were not pre-approved pursuant to Rule 2-01(c)(7)(ii) of Regulation S-X is compatible with maintaining KPMG’s independence.
Item 5. Audit Committee of Listed Registrants.
Not applicable.
14
Item 6. Schedule of Investments
Summary schedule is included as part of the report to shareholders filed under Item 1 of this Form, if applicable.
Report of Independent Registered Public Accounting Firm
The Shareholders and Board of Directors
ING Variable Portfolios, Inc.
We have audited, in accordance with the standards of the Public Company Accounting Oversight Board (United States), the statements of assets and liabilities, including the summary portfolios of investments, of ING BlackRock Science and Technology Opportunities Portfolio, ING FTSE 100 Index® Portfolio, ING Index Plus LargeCap Portfolio, ING Index Plus MidCap Portfolio, ING Index Plus SmallCap Portfolio, ING International Index Portfolio, ING Japan TOPIX Index Portfolio (formerly, ING Japan Equity Index Portfolio), ING RussellTM Large Cap Growth Index Portfolio, ING RussellTM Large Cap Index Portfolio, ING RussellTM Large Cap Value Index Portfolio, ING RussellTM Mid Cap Growth Index Portfolio, ING RussellTM Mid Cap Index Portfolio, ING RussellTM Small Cap Index Portfolio, ING Small Company Portfolio, ING U.S. Bond Index Portfolio, and ING WisdomTreeSM Global High-Yielding Equity Index Portfolio, each a series of the ING Variable Portfolios, Inc., as of December 31, 2010, and the related statements of operations for the year then ended, the statements of changes in net assets for each of the years or periods in the two-year period then ended, and the financial highlights for each of the years or periods in the five-year period then ended and have issued our unqualified reports thereon dated February 18, 2011, February 21, 2011, and February 24, 2011 (which reports and financial statements are included in Item 1 of this Certified Shareholder Report on Form N-CSR). In connection with our audits of the aforementioned financial statements and financial highlights, we also audited the related portfolios of investments included in Item 6 of this Form N-CSR. The portfolios of investments are the responsibility of management. Our responsibility is to express an opinion on the portfolios of investments based on our audits.
In our opinion, the portfolios of investments, when considered in relation to the basic financial statements taken as a whole, present fairly, in all material respects, the information set forth therein.
| 
|
| |
| |
Boston, Massachusetts | |
March 7, 2011 | |
| PORTFOLIO OF INVESTMENTS |
ING BlackRock Science and Technology Opportunities Portfolio | as of December 31, 2010 |
Shares | | | | | | Value | |
| | | | | | | |
COMMON STOCK: 96.7% | | | |
| | | | Consumer Discretionary: 2.2% | | | |
28,500 | | @ | | Amazon.com, Inc. | | $ | 5,130,000 | |
65,400 | | | | Panasonic Corp. | | 923,369 | |
6,900 | | @ | | Priceline.com, Inc. | | 2,756,895 | |
| | | | | | 8,810,264 | |
| | | | Health Care: 4.4% | | | |
85,900 | | @ | | Agilent Technologies, Inc. | | 3,558,837 | |
292,300 | | @ | | Boston Scientific Corp. | | 2,212,711 | |
24,100 | | @ | | Genzyme Corp. | | 1,715,920 | |
79,800 | | | | Medtronic, Inc. | | 2,959,782 | |
54,700 | | | | Novartis AG | | 3,219,949 | |
107,200 | | | | Pfizer, Inc. | | 1,877,072 | |
40,400 | | @ | | Thermo Fisher Scientific, Inc. | | 2,236,544 | |
| | | | | | 17,780,815 | |
| | | | Industrials: 0.6% | | | |
137,900 | | L | | Asahi Glass Co., Ltd. | | 1,603,754 | |
7,800 | | | | Nidec Corp. | | 786,506 | |
| | | | | | 2,390,260 | |
| | | | Information Technology: 87.1% | | | |
46,800 | | | | Accenture PLC | | 2,269,332 | |
43,800 | | @ | | ACI Worldwide, Inc. | | 1,176,906 | |
50,900 | | @ | | Acme Packet, Inc. | | 2,705,844 | |
45,200 | | @ | | Akamai Technologies, Inc. | | 2,126,660 | |
55,900 | | | | Altera Corp. | | 1,988,922 | |
52,200 | | @ | | Amdocs Ltd. | | 1,433,934 | |
65,500 | | | | Amphenol Corp. | | 3,457,090 | |
40,800 | | @ | | Anaren, Inc. | | 850,680 | |
105,100 | | @ | | Apple, Inc. | | 33,901,056 | |
291,800 | | | | Applied Materials, Inc. | | 4,099,790 | |
128,500 | | @ | | Applied Micro Circuits Corp. | | 1,372,380 | |
150,700 | | @ | | Ariba, Inc. | | 3,539,943 | |
359,500 | | | | ARM Holdings PLC | | 2,453,663 | |
47,300 | | @ | | Arrow Electronics, Inc. | | 1,620,025 | |
84,700 | | L | | ASM Pacific Technology | | 1,069,706 | |
36,300 | | @ | | Atheros Communications, Inc. | | 1,303,896 | |
216,070 | | @ | | AU Optronics Corp. ADR | | 2,251,449 | |
50,200 | | @ | | Autodesk, Inc. | | 1,917,640 | |
67,200 | | | | Automatic Data Processing, Inc. | | 3,110,016 | |
57,600 | | | | Avago Technologies Ltd. | | 1,639,872 | |
24,800 | | @ | | Baidu.com ADR | | 2,393,944 | |
100,100 | | @ | | BMC Software, Inc. | | 4,718,714 | |
133,800 | | | | Broadcom Corp. | | 5,826,990 | |
117,900 | | | | CA, Inc. | | 2,881,476 | |
63,100 | | @ | | Camelot Information Systems, Inc. ADR | | 1,509,352 | |
72,000 | | @ | | Cavium Networks, Inc. | | 2,712,960 | |
49,400 | | @ | | Check Point Software Technologies | | 2,285,244 | |
38,700 | | @, L | | Chinacache International ADR | | 804,960 | |
377,600 | | @ | | Cisco Systems, Inc. | | 7,638,848 | |
91,900 | | @ | | Citrix Systems, Inc. | | 6,286,879 | |
91,700 | | @ | | Cognizant Technology Solutions Corp. | | 6,720,693 | |
72,500 | | @ | | Compellent Technologies, Inc. | | 2,000,275 | |
244,800 | | @ | | Compuware Corp. | | 2,856,816 | |
164,300 | | @ | | Convergys Corp. | | 2,163,831 | |
101,500 | | | | Corning, Inc. | | 1,960,980 | |
228,900 | | @ | | eBay, Inc. | | 6,370,287 | |
395,300 | | @ | | EMC Corp. | | 9,052,370 | |
78,300 | | @ | | F5 Networks, Inc. | | 10,191,529 | |
41,800 | | @ | | Fabrinet | | 898,700 | |
60,800 | | @ | | Finisar Corp. | | 1,805,152 | |
53,800 | | @ | | Fortinet, Inc. | | 1,740,430 | |
20,110 | | @ | | Google, Inc. - Class A | | 11,944,737 | |
154,200 | | | | Hewlett-Packard Co. | | 6,491,820 | |
413,800 | | | | Hitachi Ltd. | | 2,196,934 | |
96,800 | | @ | | Hynix Semiconductor, Inc. | | 2,042,218 | |
279,100 | | | | Intel Corp. | | 5,869,473 | |
93,300 | | | | International Business Machines Corp. | | 13,692,708 | |
116,600 | | @ | | IntraLinks Holdings, Inc. | | 2,181,586 | |
79,700 | | @ | | Intuit, Inc. | | 3,929,210 | |
145,700 | | @ | | JDS Uniphase Corp. | | 2,109,736 | |
143,900 | | @ | | Juniper Networks, Inc. | | 5,312,788 | |
64,700 | | | | KLA-Tencor Corp. | | 2,500,008 | |
85,000 | | @ | | Lam Research Corp. | | 4,401,300 | |
288,200 | | @ | | Marvell Technology Group Ltd. | | 5,346,110 | |
50,400 | | @ | | McAfee, Inc. | | 2,334,024 | |
173,500 | | @ | | MEMC Electronic Materials, Inc. | | 1,953,610 | |
| | | | | | | | |
197,400 | | @ | | Micron Technology, Inc. | | 1,583,148 | |
330,000 | | | | Microsoft Corp. | | 9,213,600 | |
251,100 | | @ | | Motorola, Inc. | | 2,277,477 | |
77,400 | | @ | | NetApp, Inc. | | 4,253,904 | |
35,600 | | @ | | Netlogic Microsystems, Inc. | | 1,118,196 | |
103,900 | | L | | Nokia OYJ ADR | | 1,072,248 | |
128,600 | | @ | | Novellus Systems, Inc. | | 4,156,352 | |
267,100 | | | | Oracle Corp. | | 8,360,230 | |
214,800 | | @ | | PMC - Sierra, Inc. | | 1,845,132 | |
92,900 | | @ | | Polycom, Inc. | | 3,621,242 | |
83,400 | | @ | | Progress Software Corp. | | 3,529,488 | |
63,700 | | @ | | QLogic Corp. | | 1,084,174 | |
194,780 | | | | Qualcomm, Inc. | | 9,639,662 | |
70,400 | | @ | | Rackspace Hosting, Inc. | | 2,211,264 | |
51,700 | | @ | | Radware Ltd. | | 1,939,267 | |
71,200 | | @ | | RDA Microelectronics, Inc. ADR | | 1,038,096 | |
124,400 | | @ | | Red Hat, Inc. | | 5,678,860 | |
27,200 | | @ | | Research In Motion Ltd. | | 1,581,136 | |
30 | | @ | | Rovi Corp. | | 1,860 | |
17,300 | | @ | | Salesforce.com, Inc. | | 2,283,600 | |
3,000 | | | | Samsung Electronics Co., Ltd. | | 2,505,409 | |
50,700 | | @ | | Sandisk Corp. | | 2,527,902 | |
54,300 | | L | | SAP AG ADR | | 2,748,123 | |
134,000 | | L | | Shinko Electric Industries | | 1,494,998 | |
237,200 | | L | | Siliconware Precision Industries Co. ADR | | 1,411,340 | |
4,300 | | @, L | | SouFun Holdings Ltd. ADR | | 307,536 | |
26,700 | | @ | | Sourcefire, Inc. | | 692,331 | |
97,300 | | @, L | | STEC, Inc. | | 1,717,345 | |
128,900 | | @ | | Symantec Corp. | | 2,157,786 | |
142,300 | | | | Taiwan Semiconductor Manufacturing Co., Ltd. ADR | | 1,784,442 | |
90,200 | | @ | | Taleo Corp. | | 2,494,030 | |
150,000 | | | | Tellabs, Inc. | | 1,017,000 | |
84,700 | | @ | | Teradata Corp. | | 3,486,252 | |
174,500 | | @ | | Teradyne, Inc. | | 2,449,980 | |
221,500 | | | | Texas Instruments, Inc. | | 7,198,750 | |
134,700 | | @ | | Triquint Semiconductor, Inc. | | 1,574,643 | |
99,100 | | @ | | VeriSign, Inc. | | 3,237,597 | |
90,000 | | @ | | Vishay Intertechnology, Inc. | | 1,321,200 | |
29,900 | | @ | | VMware, Inc. | | 2,658,409 | |
113,400 | | | | Western Union Co. | | 2,105,838 | |
288,700 | | | | Xerox Corp. | | 3,325,824 | |
47,800 | | | | Xilinx, Inc. | | 1,385,244 | |
250,200 | | @ | | Yahoo!, Inc. | | 4,160,826 | |
| | | | | | 349,667,237 | |
| | | | Telecommunication Services: 2.4% | | | |
73,600 | | @ | | American Tower Corp. | | 3,800,704 | |
112,600 | | | | AT&T, Inc. | | 3,308,188 | |
174,700 | | | | VimpelCom Ltd. ADR | | 2,627,488 | |
| | | | | | 9,736,380 | |
| | | | Total Common Stock (Cost $291,010,051) | | 388,384,956 | |
| | | |
SHORT-TERM INVESTMENTS: 5.4% | | | |
| | | | Mutual Funds: 3.6% | | | |
14,344,364 | | | | Blackrock Liquidity Funds TempFund Portfolio - Class I | | 14,344,364 | |
| | | | | | | |
| | | | Total Mutual Funds (Cost $14,344,364) | | 14,344,364 | |
| | | | | | | |
| | | | Securities Lending Collateral(cc): 1.8% | | | |
6,905,608 | | | | BNY Mellon Overnight Government Fund (1) | | 6,905,608 | |
396,801 | | R | | BNY Institutional Cash Reserves Fund, Series B (1)(2) | | 317,441 | |
| | | | | | | |
| | | | Total Securities Lending Collateral (Cost $7,302,409) | | 7,223,049 | |
| | | | | | | |
| | | | Total Short-Term Investments (Cost $21,646,773) | | 21,567,413 | |
| | | | | | | |
| | | | Total Investments in Securities (Cost $312,656,824)* | 102.1 | % | $ | 409,952,369 | |
| | | | Other Assets and Liabilities - Net | (2.1 | ) | (8,390,227 | ) |
| | | | Net Assets | 100.0 | % | $ | 401,562,142 | |
| | | | |
|
| | @ | | Non-income producing security |
| | ADR | | American Depositary Receipt |
| | (cc) | | Securities purchased with cash collateral for securities loaned. |
| | (1) | | Collateral received from brokers for securities lending was invested in these short-term investments. |
| | (2) | | On September 12, 2008, BNY established a separate sleeve of the Institutional Cash Reserves Fund (Series B) to hold certain Lehman Brothers defaulted debt obligations. The Portfolio’s position in Series B is being fair valued daily. Please see the accompanying Notes to Financial Statements for additional details on securities lending. |
| | R | | Restricted security |
| | L | | Loaned security, a portion or all of the security is on loan at December 31, 2010. |
| PORTFOLIO OF INVESTMENTS |
ING Euro STOXX 50® Index Portfolio | as of December 31, 2010 |
Shares | | | | | | Value | |
| | | | | | | |
COMMON STOCK: 98.0% | | | |
| | | | Consumer Discretionary: 7.6% | | | |
135,265 | | | | Bayerische Motoren Werke AG | | $ | 10,657,128 | |
375,087 | | @ | | DaimlerChrysler AG | | 25,380,226 | |
105,331 | | | | LVMH Moet Hennessy Louis Vuitton S.A. | | 17,348,509 | |
505,559 | | | | Vivendi | | 13,661,042 | |
| | | | | | 67,046,905 | |
| | | | Consumer Staples: 8.4% | | | |
304,107 | | | | Anheuser-Busch InBev NV | | 17,376,425 | |
249,160 | | | | Carrefour S.A. | | 10,273,504 | |
250,514 | | | | Groupe Danone | | 15,751,603 | |
97,466 | | | | L’Oreal S.A. | | 10,837,417 | |
634,913 | | | | Unilever NV | | 19,807,759 | |
| | | | | | 74,046,708 | |
| | | | Energy: 9.0% | | | |
996,351 | | | | ENI S.p.A. | | 21,837,437 | |
323,464 | | | | Repsol YPF S.A. | | 9,058,162 | |
907,927 | | | | Total S.A. | | 48,358,488 | |
| | | | | | 79,254,087 | |
| | | | Financials: 25.9% | | | |
190,338 | | | | Allianz AG | | 22,615,143 | |
546,278 | | | | Assicurazioni Generali S.p.A. | | 10,400,937 | |
758,561 | | | | AXA S.A. | | 12,626,581 | |
1,838,897 | | L | | Banco Bilbao Vizcaya Argentaria S.A. | | 18,740,713 | |
3,398,841 | | | | Banco Santander Central Hispano S.A. | | 36,217,457 | |
408,183 | | | | BNP Paribas | | 25,995,791 | |
434,545 | | | | Credit Agricole S.A. | | 5,525,557 | |
391,854 | | | | Deutsche Bank AG | | 20,492,393 | |
82,052 | | | | Deutsche Boerse AG | | 5,669,061 | |
1,578,979 | | @, ** | | ING Groep NV | | 15,404,117 | |
4,366,120 | | | | Intesa Sanpaolo S.p.A. | | 11,869,909 | |
71,196 | | | | Muenchener Rueckversicherungs AG | | 10,782,971 | |
302,483 | | | | Societe Generale | | 16,275,653 | |
6,945,807 | | | | UniCredito Italiano S.p.A. | | 14,399,817 | |
| | | | | | 227,016,100 | |
| | | | Health Care: 6.3% | | | |
347,957 | | | | Bayer AG | | 25,793,132 | |
457,537 | | | | Sanofi-Aventis | | 29,333,061 | |
| | | | | | 55,126,193 | |
| | | | Industrials: 11.2% | | | |
84,177 | | | | Alstom | | 4,034,704 | |
177,291 | | | | Cie de Saint-Gobain | | 9,131,473 | |
403,177 | | | | Koninklijke Philips Electronics NV | | 12,360,332 | |
110,434 | | | | Schneider Electric S.A. | | 16,558,038 | |
363,206 | | | | Siemens AG | | 44,992,013 | |
213,153 | | | | Vinci S.A. | | 11,599,299 | |
| | | | | | 98,675,859 | |
| | | | Information Technology: 4.1% | | | |
1,531,183 | | | | Nokia OYJ | | 15,861,252 | |
388,941 | | | | SAP AG | | 19,837,027 | |
| | | | | | 35,698,279 | |
| | | | Materials: 7.5% | | | |
115,045 | | | | Air Liquide | | 14,566,358 | |
355,588 | | @ | | ArcelorMittal | | 13,532,506 | |
22,103 | | | | ArcelorMittal | | 841,167 | |
386,741 | | | | BASF AG | | 30,863,086 | |
51,341 | | | | CRH PLC | | 1,071,179 | |
242,150 | | | | CRH PLC | | 5,022,913 | |
| | | | | | 65,897,209 | |
| | | | Telecommunication Services: 8.6% | | | |
1,253,568 | | | | Deutsche Telekom AG | | 16,160,010 | |
780,360 | | | | France Telecom S.A. | | 16,329,703 | |
4,242,719 | | | | Telecom Italia S.p.A. | | 5,504,740 | |
1,627,207 | | @ | | Telefonica S.A. | | 37,149,204 | |
| | | | | | 75,143,657 | |
| | | | Utilities: 9.4% | | | |
841,963 | | | | E.ON AG | | 25,712,578 | |
2,605,654 | | | | Enel S.p.A. | | 13,057,059 | |
544,975 | | | | Gaz de France | | 19,572,872 | |
1,638,904 | | | | Iberdrola S.A. | | 12,707,427 | |
173,986 | | | | RWE AG | | 11,620,499 | |
| | | | | | 82,670,435 | |
| | | | Total Common Stock (Cost $874,190,988) | | 860,575,432 | |
| | | | | | | | |
REAL ESTATE INVESTMENT TRUSTS: 0.8% | | | |
| | | | Financials: 0.8% | | | |
37,305 | | @ | | Unibail | | 7,386,322 | |
| | | | | | | |
| | | | Total Real Estate Investment Trusts (Cost $6,243,610) | | 7,386,322 | |
| | | | | | | |
| | | | Total Long-Term Investments (Cost $880,434,598) | | 867,961,754 | |
| | | | | | | |
SHORT-TERM INVESTMENTS: 1.4% | | | |
| | | | Securities Lending Collateral(cc): 1.4% | | | |
12,736,572 | | | | BNY Mellon Overnight Government Fund (1) | | 12,736,572 | |
| | | | | | | |
| | | | Total Short-Term Investments (Cost $12,736,572) | | 12,736,572 | |
| | | | | | | |
| | | | Total Investments in Securities (Cost $893,171,170)* | 100.2 | % | $ | 880,698,326 | |
| | | | Other Assets and Liabilities - Net | (0.2 | ) | (2,083,087 | ) |
| | | | Net Assets | 100.0 | % | $ | 878,615,239 | |
| | | | |
|
| | @ | | Non-income producing security |
| | (cc) | | Securities purchased with cash collateral for securities loaned. |
| | (1) | | Collateral received from brokers for securities lending was invested in these short-term investments. |
| | L | | Loaned security, a portion or all of the security is on loan at December 31, 2010. |
| | ** | | Investment in affiliate |
| PORTFOLIO OF INVESTMENTS |
ING FTSE 100 Index® Portfolio | as of December 31, 2010 |
Shares | | | | | | Value | |
| | | |
COMMON STOCK: 97.6% | | | |
| | | | Consumer Discretionary: 5.4% | | | |
361,442 | | L | | British Sky Broadcasting PLC | | $ | 4,147,510 | |
118,937 | | | | Burberry Group PLC | | 2,090,307 | |
58,437 | | | | Carnival PLC | | 2,718,042 | |
516,737 | | | | Compass Group PLC | | 4,689,858 | |
436,179 | | | | GKN PLC | | 1,513,987 | |
78,669 | | | | Intercontinental Hotels Group PLC | | 1,536,712 | |
644,002 | | | | Kingfisher PLC | | 2,653,103 | |
436,183 | | | | Marks & Spencer Group PLC | | 2,515,244 | |
50,737 | | | | Next PLC | | 1,567,000 | |
221,191 | | | | Pearson PLC | | 3,485,772 | |
333,327 | | | | Reed Elsevier PLC | | 2,815,608 | |
153,692 | | | | TUI Travel PLC | | 592,284 | |
48,310 | | | | Whitbread PLC | | 1,351,809 | |
346,009 | | | | WPP PLC | | 4,277,559 | |
| | | | | | 35,954,795 | |
| | | | Consumer Staples: 14.7% | | | |
108,876 | | | | Associated British Foods PLC | | 2,010,007 | |
548,923 | | | | British American Tobacco PLC | | 21,114,854 | |
692,489 | | | | Diageo PLC | | 12,830,435 | |
279,526 | | | | Imperial Tobacco Group PLC | | 8,592,516 | |
507,889 | | | | J Sainsbury PLC | | 2,983,776 | |
199,290 | | | | Reckitt Benckiser PLC | | 10,963,880 | |
323,631 | | | | SABMiller PLC | | 11,401,220 | |
2,186,335 | | | | Tesco PLC | | 14,497,624 | |
359,604 | | | | Unilever PLC | | 11,045,638 | |
730,397 | | | | WM Morrison Supermarkets PLC | | 3,051,631 | |
| | | | | | 98,491,581 | |
| | | | Energy: 18.8% | | | |
91,150 | | | | Amec PLC | | 1,639,236 | |
926,324 | | | | BG Group PLC | | 18,790,674 | |
5,180,547 | | | | BP PLC | | 38,185,461 | |
384,207 | | @ | | Cairn Energy PLC | | 2,522,364 | |
107,477 | | @ | | Essar Energy PLC | | 975,520 | |
71,174 | | | | Petrofac Ltd. | | 1,768,459 | |
975,308 | | | | Royal Dutch Shell PLC - Class A | | 32,563,957 | |
746,962 | | | | Royal Dutch Shell PLC - Class B | | 24,735,297 | |
243,251 | | | | Tullow Oil PLC | | 4,803,595 | |
| | | | | | 125,984,563 | |
| | | | Financials: 19.0% | | | |
264,931 | | | | 3i Group PLC | | 1,361,031 | |
55,323 | | | | Admiral Group PLC | | 1,308,521 | |
771,306 | | | | Aviva PLC | | 4,741,100 | |
3,342,045 | | | | Barclays PLC | | 13,812,275 | |
4,841,177 | | | | HSBC Holdings PLC | | 49,477,372 | |
182,527 | | | | ICAP PLC | | 1,526,204 | |
147,688 | | | | Investec PLC | | 1,216,693 | |
1,611,543 | | | | Legal & General Group PLC | | 2,440,744 | |
11,042,463 | | @ | | Lloyds TSB Group PLC | | 11,399,131 | |
514,297 | | | | Man Group PLC | | 2,384,736 | |
1,492,011 | | | | Old Mutual PLC | | 2,873,173 | |
693,864 | | | | Prudential PLC | | 7,248,927 | |
397,964 | | | | Resolution Ltd. | | 1,455,999 | |
948,328 | | | | Royal & Sun Alliance Insurance Group | | 1,853,996 | |
4,781,246 | | @ | | Royal Bank of Scotland Group PLC | | 2,936,240 | |
46,607 | | | | Schroders PLC | | 1,351,529 | |
16,577 | | | | Schroders PLC - Non Voting | | 379,079 | |
641,248 | | | | Standard Chartered PLC | | 17,310,865 | |
621,294 | | L | | Standard Life PLC | | 2,098,331 | |
| | | | | | 127,175,946 | |
| | | | Health Care: 7.8% | | | |
388,526 | | | | AstraZeneca PLC | | 17,706,827 | |
1,440,790 | | | | GlaxoSmithKline PLC | | 27,940,966 | |
153,785 | | | | Shire PLC | | 3,708,078 | |
244,057 | | | | Smith & Nephew PLC | | 2,576,960 | |
| | | | | | 51,932,831 | |
| | | | Industrials: 4.8% | | | |
75,267 | | | | Aggreko PLC | | 1,741,640 | |
936,853 | | | | BAE Systems PLC | | 4,825,526 | |
316,169 | | @ | | British Airways PLC | | 1,347,673 | |
90,215 | | | | Bunzl PLC | | 1,012,962 | |
168,585 | | | | Capita Group PLC | | 1,833,448 | |
280,519 | | | | Experian Group Ltd. | | 3,493,914 | |
| | | | | | | | |
387,164 | | | | Group 4 Securicor PLC | | 1,535,873 | |
90,763 | | | | IMI PLC | | 1,339,755 | |
43,637 | | | | Intertek Group PLC | | 1,206,545 | |
221,766 | | | | Invensys PLC | | 1,225,645 | |
509,147 | | @ | | Rolls-Royce Group PLC | | 4,960,736 | |
32,585,408 | | @ | | Rolls-Royce Group PLC | | 50,804 | |
134,439 | | | | Serco Group PLC | | 1,167,065 | |
106,608 | | | | Smiths Group PLC | | 2,072,420 | |
57,736 | | | | Weir Group PLC | | 1,604,061 | |
77,617 | | @ | | Wolseley PLC | | 2,484,683 | |
| | | | | | 31,902,750 | |
| | | | Information Technology: 0.8% | | | |
360,120 | | | | ARM Holdings PLC | | 2,457,894 | |
65,994 | | @ | | Autonomy Corp. PLC | | 1,552,585 | |
359,785 | | | | Sage Group PLC | | 1,536,804 | |
| | | | | | 5,547,283 | |
| | | | Materials: 15.5% | | | |
33,825 | | | | African Barrick Gold Ltd. | | 322,057 | |
364,554 | | | | Anglo American PLC | | 19,070,747 | |
108,420 | | | | Antofagasta PLC | | 2,743,353 | |
606,789 | | | | BHP Billiton PLC | | 24,412,138 | |
106,216 | | | | Eurasian Natural Resources Corp. | | 1,746,656 | |
59,153 | | | | Fresnillo PLC | | 1,547,879 | |
59,023 | | | | Johnson Matthey PLC | | 1,880,464 | |
58,864 | | | | Kazakhmys PLC | | 1,494,228 | |
55,594 | | @ | | Lonmin PLC | | 1,711,308 | |
24,742 | | | | Randgold Resources Ltd. | | 2,040,281 | |
240,659 | | | | Rexam PLC | | 1,249,827 | |
419,905 | | | | Rio Tinto PLC | | 29,931,395 | |
36,429 | | L | | Vedanta Resources PLC | | 1,437,177 | |
609,847 | | | | Xstrata PLC | | 14,451,026 | |
| | | | | | 104,038,536 | |
| | | | Telecommunication Services: 6.8% | | | |
2,126,096 | | | | BT Group PLC | | 6,038,544 | |
125,562 | | | | Inmarsat PLC | | 1,320,537 | |
14,469,722 | | | | Vodafone Group PLC | | 37,985,031 | |
| | | | | | 45,344,112 | |
| | | | Utilities: 4.0% | | | |
1,416,486 | | | | Centrica PLC | | 7,339,233 | |
417,553 | | | | International Power PLC | | 2,859,565 | |
951,879 | | | | National Grid PLC | | 8,227,314 | |
253,055 | | | | Scottish & Southern Energy PLC | | 4,833,905 | |
64,757 | | | | Severn Trent PLC | | 1,497,164 | |
185,589 | | | | United Utilities Group PLC | | 1,717,009 | |
| | | | | | 26,474,190 | |
| | | | Total Common Stock (Cost $558,992,659) | | 652,846,587 | |
| | | | | | | |
REAL ESTATE INVESTMENT TRUSTS: 1.0% | | | |
| | | | Financials: 1.0% | | | |
240,188 | | | | British Land Co. PLC | | 1,971,575 | |
172,773 | | | | Capital Shopping Centres Group PLC | | 1,126,923 | |
194,540 | | | | Hammerson PLC | | 1,267,787 | |
210,021 | | | | Land Securities Group PLC | | 2,215,408 | |
| | | | | | | |
| | | | Total Real Estate Investment Trusts (Cost $5,927,637) | | 6,581,693 | |
| | | | | | | |
MUTUAL FUNDS: 0.1% | | | |
| | | | Closed-End Funds: 0.1% | | | |
181,750 | | | | Alliance Trust PLC | | 1,055,533 | |
| | | | | | | |
| | | | Total Mutual Funds (Cost $878,357) | | 1,055,533 | |
| | | | | | | |
| | | | Total Long-Term Investments (Cost $565,798,653) | | 660,483,813 | |
| | | | | | | |
SHORT-TERM INVESTMENTS: 0.5% | | | |
| | | | Securities Lending Collateral(cc): 0.5% | | | |
3,137,068 | | | | BNY Mellon Overnight Government Fund (1) | | 3,137,068 | |
| | | | | | | |
| | | | Total Short-Term Investments (Cost $3,137,068) | | 3,137,068 | |
| | | | | | | |
| | | | Total Investments in Securities (Cost $568,935,721)* | 99.2 | % | $ | 663,620,881 | |
| | | | Other Assets and Liabilities - Net | 0.8 | | 5,303,882 | |
| | | | Net Assets | 100.0 | % | $ | 668,924,763 | |
| | @ | | Non-income producing security |
| | (cc) | | Securities purchased with cash collateral for securities loaned. |
| | (1) | | Collateral received from brokers for securities lending was invested in these short-term investments. |
| | L | | Loaned security, a portion or all of the security is on loan at December 31, 2010. |
| PORTFOLIO OF INVESTMENTS |
ING Hang Seng Index Portfolio | as of December 31, 2010 |
Shares | | | | | | Value | |
| | | | | | | |
COMMON STOCK: 96.0% | | | |
| | | | China: 34.2% | | | |
1,089,728 | | @ | | Aluminum Corp. of China Ltd. | | $ | 993,166 | |
17,320,746 | | | | Bank of China Ltd. | | 9,131,096 | |
1,831,047 | | | | Bank of Communications Co., Ltd. | | 1,842,697 | |
1,134,000 | | | | China Coal Energy Co. - Class H | | 1,768,834 | |
16,599,107 | | | | China Construction Bank | | 14,870,261 | |
2,054,911 | | | | China Life Insurance Co., Ltd. | | 8,366,804 | |
4,634,337 | | | | China Petroleum & Chemical Corp. | | 4,434,080 | |
938,841 | | | | China Shenhua Energy Co., Ltd. | | 3,934,624 | |
592,261 | | @ | | Foxconn International Holdings Ltd. | | 413,421 | |
15,581,340 | | | | Industrial and Commercial Bank of China Ltd. | | 11,599,547 | |
5,826,604 | | | | PetroChina Co., Ltd. | | 7,652,786 | |
473,716 | | | | Ping An Insurance Group Co. of China Ltd. | | 5,287,460 | |
277,675 | | | | Tencent Holdings Ltd. | | 6,028,170 | |
| | | | | | 76,322,946 | |
| | | | Hong Kong: 47.3% | | | |
451,184 | | | | Bank of East Asia Ltd. | | 1,888,007 | |
1,281,000 | | | | Belle International Holdings | | 2,163,751 | |
1,022,129 | | | | BOC Hong Kong Holdings Ltd. | | 3,475,775 | |
325,818 | | | | Cathay Pacific Airways Ltd. | | 898,774 | |
383,739 | | | | Cheung Kong Holdings Ltd. | | 5,913,985 | |
302,285 | | | | China Merchants Holdings International Co., Ltd. | | 1,193,248 | |
1,662,601 | | | | China Mobile Ltd. | | 16,484,457 | |
1,128,991 | | | | China Overseas Land & Investment Ltd. | | 2,087,243 | |
331,286 | | | | China Resources Enterprise | | 1,356,621 | |
556,000 | | | | China Resources Land Ltd. | | 1,015,418 | |
519,654 | | | | China Resources Power Holdings Co. | | 940,563 | |
1,301,110 | | | | China Unicom Ltd. | | 1,858,861 | |
352,811 | | | | Citic Pacific Ltd. | | 916,288 | |
498,431 | | | | CLP Holdings Ltd. | | 4,047,128 | |
4,934,714 | | | | CNOOC Ltd. | | 11,746,236 | |
448,697 | | | | Cosco Pacific Ltd. | | 780,901 | |
337,979 | | | | Esprit Holdings Ltd. | | 1,607,733 | |
575,706 | | | | Hang Lung Properties Ltd. | | 2,690,863 | |
211,243 | | | | Hang Seng Bank Ltd. | | 3,470,793 | |
299,024 | | | | Henderson Land Development Co., Ltd. | | 2,036,839 | |
1,190,144 | | | | Hong Kong & China Gas | | 2,804,357 | |
282,841 | | | | Hong Kong Exchanges and Clearing Ltd. | | 6,412,761 | |
383,322 | | | | HongKong Electric Holdings | | 2,416,475 | |
588,464 | | | | Hutchison Whampoa Ltd. | | 6,053,704 | |
685,514 | | | | Li & Fung Ltd. | | 3,977,371 | |
398,143 | | | | MTR Corp. | | 1,448,854 | |
649,176 | | | | New World Development Ltd. | | 1,217,983 | |
676,241 | | | | Sino Land Co. | | 1,263,575 | |
425,555 | | | | Sun Hung Kai Properties Ltd. | | 7,060,640 | |
200,091 | | | | Swire Pacific Ltd. | | 3,287,502 | |
380,637 | | | | Wharf Holdings Ltd. | | 2,926,506 | |
| | | | | | 105,443,212 | |
| | | | United Kingdom: 14.5% | | | |
3,159,179 | | | | HSBC Holdings PLC | | 32,259,869 | |
| | | | | | 32,259,869 | |
| | | | Total Common Stock (Cost $196,078,372) | | 214,026,027 | |
| | | | | | | |
SHORT-TERM INVESTMENTS: 2.8% | | | |
| | | | Mutual Funds: 2.8% | | | |
6,261,000 | | | | Blackrock Liquidity Funds TempFund Portfolio - Class I | | 6,261,000 | |
| | | | | | | |
| | | | Total Short-Term Investments (Cost $6,261,000) | | 6,261,000 | |
| | | | | | | |
| | | | Total Investments in Securities (Cost $202,339,372)* | 98.8 | % | $ | 220,287,027 | |
| | | | Other Assets and Liabilities - Net | 1.2 | | 2,689,564 | |
| | | | Net Assets | 100.0 | % | $ | 222,976,591 | |
| | | | | | | |
|
| | @ | | Non-income producing security | | | |
| | | | | | | | | | |
| | PORTFOLIO OF INVESTMENTS |
ING Index Plus LargeCap Portfolio | | as of December 31, 2010 |
Shares | | | | | | Value | |
| | | |
COMMON STOCK: 95.8% | | | |
| | | | Consumer Discretionary: 10.2% | | | |
11,800 | | @ | | Amazon.com, Inc. | | $ | 2,124,000 | |
14,500 | | @ | | Apollo Group, Inc. - Class A | | 572,605 | |
11,100 | | @ | | Autozone, Inc. | | 3,025,749 | |
7,900 | | @ | | Bed Bath & Beyond, Inc. | | 388,285 | |
10,300 | | | | Best Buy Co., Inc. | | 353,187 | |
13,000 | | @ | | Big Lots, Inc. | | 395,980 | |
17,800 | | @ | | Carmax, Inc. | | 567,464 | |
16,500 | | | | Carnival Corp. | | 760,815 | |
20,300 | | | | CBS Corp. - Class B | | 386,715 | |
16,800 | | | | Coach, Inc. | | 929,208 | |
81,330 | | | | Comcast Corp. — Class A | | 1,786,820 | |
45,200 | | | | D.R. Horton, Inc. | | 539,236 | |
4,200 | | | | Darden Restaurants, Inc. | | 195,048 | |
110,350 | | @ | | DIRECTV | | 4,406,276 | |
51,400 | | @ | | Discovery Communications, Inc. - Class A | | 2,143,380 | |
19,400 | | | | Expedia, Inc. | | 486,746 | |
11,200 | | | | Family Dollar Stores, Inc. | | 556,752 | |
144,400 | | @ | | Ford Motor Co. | | 2,424,476 | |
4,600 | | | | Fortune Brands, Inc. | | 277,150 | |
31,931 | | | | Gap, Inc. | | 706,952 | |
12,500 | | | | Genuine Parts Co. | | 641,750 | |
38,100 | | @ | | Goodyear Tire & Rubber Co. | | 451,485 | |
12,100 | | | | H&R Block, Inc. | | 144,111 | |
4,600 | | | | Harley-Davidson, Inc. | | 159,482 | |
13,200 | | @ | | Harman International Industries, Inc. | | 611,160 | |
52,800 | | | | Hasbro, Inc. | | 2,491,104 | |
50,200 | | | | Home Depot, Inc. | | 1,760,012 | |
9,600 | | | | International Game Technology | | 169,824 | |
46,100 | | @ | | Interpublic Group of Cos., Inc. | | 489,582 | |
7,100 | | | | JC Penney Co., Inc. | | 229,401 | |
24,100 | | | | Johnson Controls, Inc. | | 920,620 | |
9,200 | | @ | | Kohl’s Corp. | | 499,928 | |
93,700 | | | | Limited Brands, Inc. | | 2,879,401 | |
42,700 | | | | Lowe’s Cos., Inc. | | 1,070,916 | |
28,400 | | | | Macy’s, Inc. | | 718,520 | |
7,700 | | | | Marriott International, Inc. | | 319,858 | |
19,400 | | | | Mattel, Inc. | | 493,342 | |
122,700 | | | | McDonald’s Corp. | | 9,418,452 | |
9,400 | | | | McGraw-Hill Cos., Inc. | | 342,254 | |
10,600 | | L | | Meredith Corp. | | 367,290 | |
8,700 | | | | Newell Rubbermaid, Inc. | | 158,166 | |
109,600 | | | | News Corp. - Class A | | 1,595,776 | |
48,200 | | | | Nike, Inc. | | 4,117,244 | |
5,000 | | | | Nordstrom, Inc. | | 211,900 | |
9,200 | | | | Omnicom Group | | 421,360 | |
4,100 | | @ | | O’Reilly Automotive, Inc. | | 247,722 | |
3,400 | | | | Polo Ralph Lauren Corp. | | 377,128 | |
1,400 | | @ | | Priceline.com, Inc. | | 559,370 | |
19,000 | | | | RadioShack Corp. | | 351,310 | |
9,400 | | | | Ross Stores, Inc. | | 594,550 | |
9,800 | | | | Scripps Networks Interactive - Class A | | 507,150 | |
29,300 | | | | Stanley Black & Decker, Inc. | | 1,959,291 | |
28,700 | | | | Staples, Inc. | | 653,499 | |
78,700 | | | | Starbucks Corp. | | 2,528,631 | |
5,700 | | | | Starwood Hotels & Resorts Worldwide, Inc. | | 346,446 | |
22,034 | | | | Target Corp. | | 1,324,904 | |
50,700 | | | | Tiffany & Co. | | 3,157,089 | |
62,900 | | | | Time Warner Cable, Inc. | | 4,153,287 | |
29,200 | | | | Time Warner, Inc. | | 939,364 | |
20,800 | | | | TJX Cos., Inc. | | 923,312 | |
15,100 | | @ | | Urban Outfitters, Inc. | | 540,731 | |
9,400 | | | | VF Corp. | | 810,092 | |
18,200 | | | | Viacom - Class B | | 720,902 | |
60,700 | | | | Walt Disney Co. | | 2,276,857 | |
2,200 | | | | Whirlpool Corp. | | 195,426 | |
5,400 | | | | Wyndham Worldwide Corp. | | 161,784 | |
2,100 | | | | Wynn Resorts Ltd. | | 218,064 | |
94,600 | | | | Yum! Brands, Inc. | | 4,640,130 | |
| | | | | | 81,896,821 | |
| | | | Consumer Staples: 10.2% | | | |
279,400 | | | | Altria Group, Inc. | | 6,878,828 | |
58,786 | | | | Archer-Daniels-Midland Co. | | 1,768,283 | |
| | | | | | | | |
93,800 | | | | Avon Products, Inc. | | 2,725,828 | |
10,839 | | | | Brown-Forman Corp. | | 754,611 | |
16,981 | | | | Campbell Soup Co. | | 590,090 | |
4,200 | | | | Clorox Co. | | 265,776 | |
102,656 | | | | Coca-Cola Co. | | 6,751,685 | |
102,100 | | | | Coca-Cola Enterprises, Inc. | | 2,555,563 | |
12,200 | | | | Colgate-Palmolive Co. | | 980,514 | |
142,700 | | @ | | Constellation Brands, Inc. | | 3,160,805 | |
10,900 | | | | Costco Wholesale Corp. | | 787,089 | |
35,700 | | | | CVS Caremark Corp. | | 1,241,289 | |
47,100 | | @ | | Dean Foods Co. | | 416,364 | |
21,027 | | | | Dr Pepper Snapple Group, Inc. | | 739,309 | |
37,100 | | | | Estee Lauder Cos., Inc. | | 2,993,970 | |
15,500 | | | | General Mills, Inc. | | 551,645 | |
11,100 | | | | Hershey Co. | | 523,365 | |
53,300 | | | | HJ Heinz Co. | | 2,636,218 | |
44,000 | | | | Hormel Foods Corp. | | 2,255,440 | |
4,500 | | | | Kellogg Co. | | 229,860 | |
10,026 | | | | Kimberly-Clark Corp. | | 632,039 | |
75,000 | | | | Kraft Foods, Inc. | | 2,363,250 | |
33,500 | | | | Kroger Co. | | 749,060 | |
4,600 | | | | Lorillard, Inc. | | 377,476 | |
35,100 | | | | McCormick & Co., Inc. | | 1,633,203 | |
65,800 | | | | Mead Johnson Nutrition Co. | | 4,096,050 | |
12,700 | | | | Molson Coors Brewing Co. | | 637,413 | |
67,700 | | | | PepsiCo, Inc. | | 4,422,841 | |
106,217 | | | | Philip Morris International, Inc. | | 6,216,881 | |
96,592 | | | | Procter & Gamble Co. | | 6,213,763 | |
108,516 | | | | Reynolds American, Inc. | | 3,539,792 | |
25,400 | | | | Safeway, Inc. | | 571,246 | |
49,500 | | | | Sara Lee Corp. | | 866,745 | |
36,200 | | | | Supervalu, Inc. | | 348,606 | |
60,000 | | | | Sysco Corp. | | 1,764,000 | |
31,500 | | | | Tyson Foods, Inc. | | 542,430 | |
93,700 | | | | Walgreen Co. | | 3,650,552 | |
63,852 | | | | Wal-Mart Stores, Inc. | | 3,443,538 | |
19,400 | | @ | | Whole Foods Market, Inc. | | 981,446 | |
| | | | | | 81,856,863 | |
| | | | Energy: 11.9% | | | |
17,200 | | | | Anadarko Petroleum Corp. | | 1,309,952 | |
13,300 | | | | Apache Corp. | | 1,585,759 | |
59,900 | | | | Baker Hughes, Inc. | | 3,424,483 | |
15,700 | | | | Cabot Oil & Gas Corp. | | 594,245 | |
59,500 | | @ | | Cameron International Corp. | | 3,018,435 | |
19,500 | | | | Chesapeake Energy Corp. | | 505,245 | |
198,158 | | | | Chevron Corp. | | 18,081,918 | |
158,800 | | | | ConocoPhillips | | 10,814,284 | |
6,700 | | | | Consol Energy, Inc. | | 326,558 | |
31,500 | | @ | | Denbury Resources, Inc. | | 601,335 | |
15,500 | | | | Devon Energy Corp. | | 1,216,905 | |
41,600 | | | | Diamond Offshore Drilling | | 2,781,792 | |
224,600 | | | | El Paso Corp. | | 3,090,496 | |
8,600 | | | | EOG Resources, Inc. | | 786,126 | |
13,900 | | | | EQT Corp. | | 623,276 | |
242,654 | | | | ExxonMobil Corp. | | 17,742,860 | |
43,500 | | @ | | FMC Technologies, Inc. | | 3,867,585 | |
22,900 | | | | Halliburton Co. | | 935,007 | |
10,500 | | | | Helmerich & Payne, Inc. | | 509,040 | |
8,700 | | | | Hess Corp. | | 665,898 | |
25,700 | | | | Marathon Oil Corp. | | 951,671 | |
5,700 | | | | Murphy Oil Corp. | | 424,935 | |
23,700 | | @ | | Nabors Industries Ltd. | | 556,002 | |
12,504 | | | | National Oilwell Varco, Inc. | | 840,894 | |
11,600 | | | | Noble Energy, Inc. | | 998,528 | |
33,500 | | | | Occidental Petroleum Corp. | | 3,286,350 | |
8,000 | | | | Peabody Energy Corp. | | 511,840 | |
8,500 | | | | Pioneer Natural Resources Co. | | 737,970 | |
17,700 | | | | QEP Resources, Inc. | | 642,687 | |
13,800 | | | | Range Resources Corp. | | 620,724 | |
12,100 | | @ | | Rowan Cos., Inc. | | 422,411 | |
54,554 | | | | Schlumberger Ltd. | | 4,555,259 | |
24,700 | | @ | | Southwestern Energy Co. | | 924,521 | |
84,200 | | | | Spectra Energy Corp. | | 2,104,158 | |
35,300 | | | | Sunoco, Inc. | | 1,422,943 | |
16,900 | | | | Valero Energy Corp. | | 390,728 | |
131,100 | | | | Williams Cos., Inc. | | 3,240,792 | |
| | | | | | 95,113,612 | |
| | | | Financials: 12.8% | | | |
58,000 | | | | ACE Ltd. | | 3,610,500 | |
17,295 | | | | Aflac, Inc. | | 975,957 | |
16,100 | | | | Allstate Corp. | | 513,268 | |
125,400 | | | | American Express Co. | | 5,382,168 | |
4,000 | | @, L | | American International Group, Inc. | | 230,480 | |
56,400 | | | | Ameriprise Financial, Inc. | | 3,245,820 | |
24,800 | | | | AON Corp. | | 1,141,048 | |
73,000 | | | | Assurant, Inc. | | 2,811,960 | |
393,350 | | | | Bank of America Corp. | | 5,247,289 | |
36,300 | | | | Bank of New York Mellon Corp. | | 1,096,260 | |
20,700 | | | | BB&T Corp. | | 544,203 | |
85,100 | | @ | | Berkshire Hathaway, Inc. | | 6,817,361 | |
13,600 | | | | Capital One Financial Corp. | | 578,816 | |
26,900 | | @ | | CB Richard Ellis Group, Inc. | | 550,912 | |
29,300 | | | | Charles Schwab Corp. | | 501,323 | |
9,800 | | | | Chubb Corp. | | 584,472 | |
5,100 | | | | Cincinnati Financial Corp. | | 161,619 | |
1,801,900 | | @ | | Citigroup, Inc. | | 8,522,987 | |
1,952 | | | | CME Group, Inc. | | 628,056 | |
4,100 | | | | Comerica, Inc. | | 173,184 | |
37,200 | | | | Discover Financial Services | | 689,316 | |
25,300 | | @ | | E*Trade Financial Corp. | | 404,800 | |
15,800 | | L | | Federated Investors, Inc. | | 413,486 | |
52,772 | | | | Fifth Third Bancorp. | | 774,693 | |
4,400 | | | | Franklin Resources, Inc. | | 489,324 | |
14,600 | | @ | | Genworth Financial, Inc. | | 191,844 | |
18,728 | | | | Goldman Sachs Group, Inc. | | 3,149,300 | |
13,300 | | | | Hartford Financial Services Group, Inc. | | 352,317 | |
47,000 | | | | Hudson City Bancorp., Inc. | | 598,780 | |
80,000 | | | | Huntington Bancshares, Inc. | | 549,600 | |
2,200 | | @ | | IntercontinentalExchange, Inc. | | 262,130 | |
31,400 | | @ | | Invesco Ltd. | | 755,484 | |
32,600 | | | | Janus Capital Group, Inc. | | 422,822 | |
158,651 | | | | JPMorgan Chase & Co. | | 6,729,975 | |
71,300 | | | | Keycorp | | 631,005 | |
9,000 | | | | Lincoln National Corp. | | 250,290 | |
24,200 | | | | Loews Corp. | | 941,622 | |
1,800 | | | | M&T Bank Corp. | | 156,690 | |
37,700 | | | | Marsh & McLennan Cos., Inc. | | 1,030,718 | |
96,300 | | | | Marshall & Ilsley Corp. | | 666,396 | |
33,900 | | | | Metlife, Inc. | | 1,506,516 | |
47,800 | | | | Morgan Stanley | | 1,300,638 | |
114,300 | | @ | | Nasdaq Stock Market, Inc. | | 2,710,053 | |
14,800 | | | | Northern Trust Corp. | | 820,068 | |
7,800 | | | | NYSE Euronext | | 233,844 | |
41,900 | | | | People’s United Financial, Inc. | | 587,019 | |
115,600 | | | | PNC Financial Services Group, Inc. | | 7,019,232 | |
22,800 | | | | Principal Financial Group, Inc. | | 742,368 | |
20,000 | | | | Progressive Corp. | | 397,400 | |
77,100 | | | | Prudential Financial, Inc. | | 4,526,541 | |
95,600 | | | | Regions Financial Corp. | | 669,200 | |
63,447 | | | | State Street Corp. | | 2,940,134 | |
14,900 | | | | SunTrust Bank | | 439,699 | |
20,800 | | | | T. Rowe Price Group, Inc. | | 1,342,432 | |
30,800 | | | | Torchmark Corp. | | 1,839,992 | |
17,269 | | | | Travelers Cos., Inc. | | 962,056 | |
9,961 | | | | UnumProvident Corp. | | 241,255 | |
154,533 | | | | US Bancorp. | | 4,167,755 | |
227,685 | | | | Wells Fargo & Co. | | 7,055,958 | |
10,200 | | | | XL Group PLC | | 222,564 | |
| | | | | | 102,502,999 | |
| | | | Health Care: 11.3% | | | |
149,434 | | | | Abbott Laboratories | | 7,159,383 | |
22,800 | | | | Aetna, Inc. | | 695,628 | |
92,000 | | @ | | Agilent Technologies, Inc. | | 3,811,560 | |
19,300 | | | | Allergan, Inc. | | 1,325,331 | |
82,108 | | | | AmerisourceBergen Corp. | | 2,801,525 | |
35,035 | | @ | | Amgen, Inc. | | 1,923,422 | |
26,100 | | | | Baxter International, Inc. | | 1,321,182 | |
9,100 | | | | Becton Dickinson & Co. | | 769,132 | |
52,500 | | @ | | Biogen Idec, Inc. | | 3,520,125 | |
124,900 | | @ | | Boston Scientific Corp. | | 945,493 | |
233,800 | | | | Bristol-Myers Squibb Co. | | 6,191,024 | |
96,400 | | | | Cardinal Health, Inc. | | 3,693,084 | |
28,800 | | @ | | CareFusion Corp. | | 740,160 | |
13,800 | | @ | | Celgene Corp. | | 816,132 | |
7,800 | | @ | | Cephalon, Inc. | | 481,416 | |
1,900 | | @ | | Cerner Corp. | | 180,006 | |
8,300 | | | | Cigna Corp. | | 304,278 | |
20,800 | | @ | | Coventry Health Care, Inc. | | 549,120 | |
2,800 | | | | CR Bard, Inc. | | 256,956 | |
10,600 | | @ | | DaVita, Inc. | | 736,594 | |
4,800 | | | | Densply International, Inc. | | 164,016 | |
75,200 | | | | Eli Lilly & Co. | | 2,635,008 | |
21,900 | | @ | | Express Scripts, Inc. | | 1,183,695 | |
84,700 | | @ | | Forest Laboratories, Inc. | | 2,708,706 | |
8,000 | | @ | | Genzyme Corp. | | 569,600 | |
24,400 | | @ | | Gilead Sciences, Inc. | | 884,256 | |
48,400 | | @ | | Hospira, Inc. | | 2,695,396 | |
4,867 | | @ | | Humana, Inc. | | 266,420 | |
3,500 | | @ | | Intuitive Surgical, Inc. | | 902,125 | |
121,023 | | | | Johnson & Johnson | | 7,485,273 | |
9,700 | | @ | | Laboratory Corp. of America Holdings | | 852,824 | |
16,100 | | @ | | Life Technologies Corp. | | 893,550 | |
8,072 | | | | McKesson Corp. | | 568,107 | |
17,800 | | @ | | Medco Health Solutions, Inc. | | 1,090,606 | |
49,500 | | | | Medtronic, Inc. | | 1,835,955 | |
243,662 | | | | Merck & Co., Inc. | | 8,781,578 | |
9,200 | | @ | | Mylan Laboratories | | 194,396 | |
22,700 | | | | PerkinElmer, Inc. | | 586,114 | |
484,862 | | | | Pfizer, Inc. | | 8,489,934 | |
15,000 | | | | Quest Diagnostics | | 809,550 | |
28,300 | | @ | | St. Jude Medical, Inc. | | 1,209,825 | |
13,300 | | | | Stryker Corp. | | 714,210 | |
84,500 | | @ | | Tenet Healthcare Corp. | | 565,305 | |
15,229 | | @ | | Thermo Fisher Scientific, Inc. | | 843,077 | |
47,338 | | | | UnitedHealth Group, Inc. | | 1,709,375 | |
27,500 | | @ | | Varian Medical Systems, Inc. | | 1,905,200 | |
9,278 | | @ | | Waters Corp. | | 720,993 | |
3,000 | | @ | | Watson Pharmaceuticals, Inc. | | 154,950 | |
16,400 | | @ | | WellPoint, Inc. | | 932,504 | |
6,100 | | @ | | Zimmer Holdings, Inc. | | 327,448 | |
| | | | | | 90,901,547 | |
| | | | Industrials: 10.8% | | | |
97,600 | | | | 3M Co. | | 8,422,880 | |
13,400 | | | | Avery Dennison Corp. | | 567,356 | |
63,100 | | | | Boeing Co. | | 4,117,906 | |
23,100 | | | | Caterpillar, Inc. | | 2,163,546 | |
2,900 | | | | CH Robinson Worldwide, Inc. | | 232,551 | |
36,000 | | | | CSX Corp. | | 2,325,960 | |
12,400 | | | | Cummins, Inc. | | 1,364,124 | |
15,700 | | | | Danaher Corp. | | 740,569 | |
54,400 | | | | Deere & Co. | | 4,517,920 | |
15,100 | | | | Dover Corp. | | 882,595 | |
7,100 | | | | Dun & Bradstreet Corp. | | 582,839 | |
19,700 | | | | Eaton Corp. | | 1,999,747 | |
72,159 | | | | Emerson Electric Co. | | 4,125,330 | |
14,600 | | | | Equifax, Inc. | | 519,760 | |
12,300 | | | | Expeditors International Washington, Inc. | | 671,580 | |
3,900 | | L | | Fastenal Co. | | 233,649 | |
7,200 | | | | FedEx Corp. | | 669,672 | |
5,000 | | | | Flowserve Corp. | | 596,100 | |
5,300 | | | | Fluor Corp. | | 351,178 | |
9,200 | | | | General Dynamics Corp. | | 652,832 | |
567,494 | | | | General Electric Co. | | 10,379,465 | |
21,900 | | | | Goodrich Corp. | | 1,928,733 | |
19,800 | | | | Honeywell International, Inc. | | 1,052,568 | |
15,900 | | | | Illinois Tool Works, Inc. | | 849,060 | |
7,400 | | | | Ingersoll-Rand PLC | | 348,466 | |
22,200 | | | | Iron Mountain, Inc. | | 555,222 | |
12,541 | | L | | ITT Corp. | | 653,512 | |
3,500 | | | | L-3 Communications Holdings, Inc. | | 246,715 | |
6,532 | | | | Lockheed Martin Corp. | | 456,652 | |
37,900 | | | | Masco Corp. | | 479,814 | |
21,800 | | | | Norfolk Southern Corp. | | 1,369,476 | |
6,500 | | | | Northrop Grumman Corp. | | 421,070 | |
16,800 | | | | Paccar, Inc. | | 964,656 | |
12,200 | | | | Pall Corp. | | 604,876 | |
20,500 | | | | Parker Hannifin Corp. | | 1,769,150 | |
7,900 | | | | Precision Castparts Corp. | | 1,099,759 | |
25,700 | | @ | | Quanta Services, Inc. | | 511,944 | |
8,100 | | | | Raytheon Co. | | 375,354 | |
23,300 | | | | Republic Services, Inc. | | 695,738 | |
18,900 | | | | Robert Half International, Inc. | | 578,340 | |
29,300 | | | | Rockwell Automation, Inc. | | 2,101,103 | |
10,500 | | | | Rockwell Collins, Inc. | | 611,730 | |
35,200 | | | | Roper Industries, Inc. | | 2,690,336 | |
12,200 | | | | Ryder System, Inc. | | 642,208 | |
44,500 | | | | Southwest Airlines Co. | | 577,610 | |
25,600 | | @ | | Stericycle, Inc. | | 2,071,552 | |
25,500 | | | | Textron, Inc. | | 602,820 | |
15,000 | | | | Tyco International Ltd. | | 621,600 | |
26,800 | | | | Union Pacific Corp. | | 2,483,288 | |
67,800 | | | | United Parcel Service, Inc. - Class B | | 4,920,924 | |
76,697 | | | | United Technologies Corp. | | 6,037,588 | |
14,400 | | | | Waste Management, Inc. | | 530,928 | |
11,500 | | | | WW Grainger, Inc. | | 1,588,265 | |
| | | | | | 86,558,616 | |
| | | | Information Technology: 19.1% | | | |
15,700 | | @ | | Adobe Systems, Inc. | | 483,246 | |
20,500 | | @ | | Advanced Micro Devices, Inc. | | 167,690 | |
64,700 | | @ | | Akamai Technologies, Inc. | | 3,044,135 | |
129,200 | | | | Altera Corp. | | 4,596,936 | |
58,700 | | | | Amphenol Corp. | | 3,098,186 | |
8,900 | | | | Analog Devices, Inc. | | 335,263 | |
66,593 | | @ | | Apple, Inc. | | 21,480,238 | |
82,500 | | | | Applied Materials, Inc. | | 1,159,125 | |
6,900 | | @ | | Autodesk, Inc. | | 263,580 | |
15,000 | | | | Automatic Data Processing, Inc. | | 694,200 | |
13,700 | | @ | | BMC Software, Inc. | | 645,818 | |
16,600 | | | | Broadcom Corp. | | 722,930 | |
83,362 | | | | CA, Inc. | | 2,037,367 | |
304,970 | | @ | | Cisco Systems, Inc. | | 6,169,543 | |
35,900 | | @ | | Citrix Systems, Inc. | | 2,455,919 | |
89,700 | | @ | | Cognizant Technology Solutions Corp. | | 6,574,113 | |
4,600 | | | | Computer Sciences Corp. | | 228,160 | |
38,500 | | @ | | Compuware Corp. | | 449,295 | |
46,700 | | | | Corning, Inc. | | 902,244 | |
51,500 | | @ | | Dell, Inc. | | 697,825 | |
34,007 | | @ | | eBay, Inc. | | 946,415 | |
206,400 | | @ | | Electronic Arts, Inc. | | 3,380,832 | |
322,450 | | @ | | EMC Corp. | | 7,384,105 | |
7,600 | | | | Fidelity National Information Services, Inc. | | 208,164 | |
1,500 | | @, L | | First Solar, Inc. | | 195,210 | |
3,172 | | @ | | Fiserv, Inc. | | 185,752 | |
10,780 | | @ | | Google, Inc. - Class A | | 6,402,997 | |
15,235 | | | | Harris Corp. | | 690,146 | |
93,776 | | | | Hewlett-Packard Co. | | 3,947,970 | |
285,110 | | | | Intel Corp. | | 5,995,863 | |
55,769 | | | | International Business Machines Corp. | | 8,184,658 | |
98,500 | | @ | | Intuit, Inc. | | 4,856,050 | |
25,300 | | | | Jabil Circuit, Inc. | | 508,277 | |
46,200 | | @ | | JDS Uniphase Corp. | | 668,976 | |
20,200 | | @ | | Juniper Networks, Inc. | | 745,784 | |
5,100 | | | | KLA-Tencor Corp. | | 197,064 | |
11,200 | | @ | | Lexmark International, Inc. | | 389,984 | |
120,300 | | | | Linear Technology Corp. | | 4,161,177 | |
97,300 | | @ | | LSI Logic Corp. | | 582,827 | |
2,900 | | | | Mastercard, Inc. | | 649,919 | |
4,700 | | @ | | McAfee, Inc. | | 217,657 | |
42,600 | | @ | | MEMC Electronic Materials, Inc. | | 479,676 | |
75,600 | | L | | Microchip Technology, Inc. | | 2,586,276 | |
94,600 | | @ | | Micron Technology, Inc. | | 758,692 | |
339,316 | | | | Microsoft Corp. | | 9,473,703 | |
18,000 | | | | Molex, Inc. | | 408,960 | |
19,600 | | @ | | Monster Worldwide, Inc. | | 463,148 | |
170,300 | | @ | | Motorola, Inc. | | 1,544,621 | |
19,705 | | @ | | NetApp, Inc. | | 1,082,987 | |
70,000 | | @ | | Novell, Inc. | | 414,400 | |
70,600 | | @ | | Novellus Systems, Inc. | | 2,281,792 | |
17,100 | | @ | | Nvidia Corp. | | 263,340 | |
163,626 | | | | Oracle Corp. | | 5,121,494 | |
9,600 | | | | Paychex, Inc. | | 296,736 | |
20,700 | | @ | | QLogic Corp. | | 352,314 | |
81,916 | | | | Qualcomm, Inc. | | 4,054,023 | |
76,300 | | @ | | Red Hat, Inc. | | 3,483,095 | |
24,700 | | @ | | Salesforce.com, Inc. | | 3,260,400 | |
6,900 | | @ | | Sandisk Corp. | | 344,034 | |
23,900 | | @ | | Symantec Corp. | | 400,086 | |
79,400 | | | | Tellabs, Inc. | | 538,332 | |
14,112 | | @ | | Teradata Corp. | | 580,850 | |
33,600 | | @ | | Teradyne, Inc. | | 471,744 | |
48,500 | | | | Texas Instruments, Inc. | | 1,576,250 | |
24,500 | | | | Total System Services, Inc. | | 376,810 | |
78,700 | | @ | | VeriSign, Inc. | | 2,571,129 | |
16,400 | | | | Visa, Inc. | | 1,154,232 | |
6,900 | | @ | | Western Digital Corp. | | 233,910 | |
20,100 | | | | Western Union Co. | | 373,257 | |
41,200 | | | | Xerox Corp. | | 474,624 | |
5,400 | | | | Xilinx, Inc. | | 156,492 | |
44,700 | | @ | | Yahoo!, Inc. | | 743,361 | |
| | | | | | 153,026,408 | |
| | | | Materials: 2.8% | | | |
6,300 | | | | Air Products & Chemicals, Inc. | | 572,985 | |
24,300 | | | | Airgas, Inc. | | 1,517,778 | |
27,200 | | | | AK Steel Holding Corp. | | 445,264 | |
52,100 | | | | Alcoa, Inc. | | 801,819 | |
4,000 | | | | Cliffs Natural Resources, Inc. | | 312,040 | |
26,500 | | | | Dow Chemical Co. | | 904,710 | |
13,200 | | | | Ecolab, Inc. | | 665,544 | |
106,000 | | | | EI Du Pont de Nemours & Co. | | 5,287,280 | |
15,900 | | | | FMC Corp. | | 1,270,251 | |
11,300 | | | | Freeport-McMoRan Copper & Gold, Inc. | | 1,357,017 | |
36,900 | | | | International Flavors & Fragrances, Inc. | | 2,051,271 | |
13,031 | | | | International Paper Co. | | 354,964 | |
17,000 | | | | MeadWestvaco Corp. | | 444,720 | |
12,100 | | | | Monsanto Co. | | 842,644 | |
62,800 | | | | Newmont Mining Corp. | | 3,857,804 | |
5,400 | | | | Nucor Corp. | | 236,628 | |
3,000 | | | | PPG Industries, Inc. | | 252,210 | |
7,100 | | | | Praxair, Inc. | | 677,837 | |
19,800 | | | | Sealed Air Corp. | | 503,910 | |
19,900 | | @ | | Titanium Metals Corp. | | 341,882 | |
| | | | | | 22,698,558 | |
| | | | Telecommunication Services: 3.5% | | | |
51,100 | | @ | | American Tower Corp. | | 2,638,804 | |
302,556 | | | | AT&T, Inc. | | 8,889,095 | |
58,200 | | L | | CenturyTel, Inc. | | 2,687,094 | |
88,028 | | | | Frontier Communications Corp. | | 856,512 | |
44,900 | | @ | | MetroPCS Communications, Inc. | | 567,087 | |
571,500 | | | | Qwest Communications International, Inc. | | 4,349,115 | |
227,200 | | @ | | Sprint Nextel Corp. | | 961,056 | |
150,116 | | | | Verizon Communications, Inc. | | 5,371,150 | |
122,700 | | | | Windstream Corp. | | 1,710,438 | |
| | | | | | 28,030,351 | |
| | | | Utilities: 3.2% | | | |
50,500 | | @ | | AES Corp. | | 615,090 | |
6,500 | | | | Allegheny Energy, Inc. | | 157,560 | |
7,100 | | | | Ameren Corp. | | 200,149 | |
18,500 | | | | American Electric Power Co., Inc. | | 665,630 | |
106,800 | | | | CenterPoint Energy, Inc. | | 1,678,896 | |
107,500 | | | | CMS Energy Corp. | | 1,999,500 | |
65,500 | | | | Consolidated Edison, Inc. | | 3,246,835 | |
17,800 | | | | Constellation Energy Group, Inc. | | 545,214 | |
21,500 | | | | Dominion Resources, Inc. | | 918,480 | |
16,167 | | | | DTE Energy Co. | | 732,688 | |
58,000 | | | | Duke Energy Corp. | | 1,032,980 | |
9,700 | | | | Edison International | | 374,420 | |
5,700 | | | | Entergy Corp. | | 403,731 | |
28,800 | | | | Exelon Corp. | | 1,199,232 | |
9,100 | | L | | FirstEnergy Corp. | | 336,882 | |
18,400 | | | | NextEra Energy, Inc. | | 956,616 | |
8,400 | | | | Nicor, Inc. | | 419,328 | |
68,500 | | | | Northeast Utilities | | 2,183,780 | |
24,800 | | @ | | NRG Energy, Inc. | | 484,592 | |
16,700 | | | | Pacific Gas & Electric Co. | | 798,928 | |
8,100 | | | | Pepco Holdings, Inc. | | 147,825 | |
49,700 | | | | Pinnacle West Capital Corp. | | 2,060,065 | |
14,000 | | | | PPL Corp. | | 368,480 | |
8,600 | | | | Progress Energy, Inc. | | 373,928 | |
15,100 | | | | Public Service Enterprise Group, Inc. | | 480,331 | |
12,700 | | | | SCANA Corp. | | 515,620 | |
7,422 | | | | Sempra Energy | | 389,507 | |
36,000 | | | | Southern Co. | | 1,376,280 | |
9,500 | | | | Wisconsin Energy Corp. | | 559,170 | |
35,900 | | | | Xcel Energy, Inc. | | 845,445 | |
| | | | | | 26,067,182 | |
| | | | Total Common Stock
(Cost $685,435,508) | | 768,652,957 | |
| | | | | | | |
REAL ESTATE INVESTMENT TRUSTS: 2.9% | | | |
| | | | Financials: 2.9% | | | |
15,400 | | | | Apartment Investment & Management Co. | | 397,936 | |
9,973 | | | | AvalonBay Communities, Inc. | | 1,122,461 | |
7,433 | | | | Boston Properties, Inc. | | 639,981 | |
92,500 | | | | Equity Residential | | 4,805,375 | |
23,200 | | | | HCP, Inc. | | 853,528 | |
19,386 | | | | Health Care Real Estate Investment Trust, Inc. | | 923,549 | |
52,900 | | | | Host Hotels & Resorts, Inc. | | 945,323 | |
33,500 | | | | Kimco Realty Corp. | | 604,340 | |
41,400 | | | | Prologis | | 597,816 | |
48,700 | | | | Public Storage, Inc. | | 4,939,154 | |
55,520 | | | | Simon Property Group, Inc. | | 5,523,685 | |
27,703 | | | | Ventas, Inc. | | 1,453,853 | |
9,343 | | | | Vornado Realty Trust | | 778,552 | |
6,300 | | | | Weyerhaeuser Co. | | 119,259 | |
| | | | | | | |
| | | | Total Real Estate Investment Trusts
(Cost $22,022,255) | | 23,704,812 | |
| | | | | | | |
| | | | Total Long-Term Investments
(Cost $707,457,763) | | 792,357,769 | |
| | | | | | | |
SHORT-TERM INVESTMENTS: 1.8% | | | |
| | | | Mutual Funds: 1.2% | | | |
9,629,000 | | | | Blackrock Liquidity Funds TempFund Portfolio - Class I | | 9,629,000 | |
| | | | | | | |
| | | | Total Mutual Funds
(Cost $9,629,000) | | 9,629,000 | |
| | | | | | | |
| | | | Securities Lending Collateral(cc): 0.6% | | | |
3,859,387 | | | | BNY Mellon Overnight Government Fund (1) | | 3,859,387 | |
1,608,803 | | R | | BNY Institutional Cash Reserves Fund, Series B (1)(2) | | 1,287,042 | |
| | | | | | | |
| | | | Total Securities Lending Collateral
(Cost $5,468,190) | | 5,146,429 | |
| | | | | | | |
| | | | Total Short-Term Investments
(Cost $15,097,190) | | 14,775,429 | |
| | | | | | | |
| | | | Total Investments in Securities
(Cost $722,554,953) * | 100.5 | % | | $ | 807,133,198 | |
| | | | Other Assets and Liabilities - Net | (0.5 | ) | | (4,399,027 | ) |
| | | | Net Assets | 100.0 | % | | $ | 802,734,171 | |
| | @ | | Non-income producing security |
| | (cc) | | Securities purchased with cash collateral for securities loaned. |
| | (1) | | Collateral received from brokers for securities lending was invested in these short-term investments. |
| | (2) | | On September 12, 2008, BNY established a separate sleeve of the Institutional Cash Reserves Fund (Series B) to hold certain Lehman Brothers defaulted debt obligations. The Portfolio’s position in Series B is being fair valued daily. Please see the accompanying Notes to Financial Statements for additional details on securities lending. |
| | R | | Restricted security |
| | L | | Loaned security, a portion or all of the security is on loan at December 31, 2010. |
| | PORTFOLIO OF INVESTMENTS |
ING Index Plus MidCap Portfolio | | as of December 31, 2010 |
Shares | | | | | | Value | |
| | | |
COMMON STOCK: 86.1% | | | |
| | | | Consumer Discretionary: 14.0% | | | |
25,200 | | L | | Aaron’s, Inc. | | $ | 513,828 | |
88,494 | | | | Advance Auto Parts, Inc. | | 5,853,878 | |
62,260 | | @ | | Aeropostale, Inc. | | 1,534,086 | |
46,450 | | | | American Eagle Outfitters | | 679,564 | |
15,600 | | | | American Greetings Corp. | | 345,696 | |
24,800 | | @ | | AnnTaylor Stores Corp. | | 679,272 | |
16,173 | | @ | | Bally Technologies, Inc. | | 682,339 | |
122,661 | | @ | | BorgWarner, Inc. | | 8,875,750 | |
28,799 | | | | Brinker International, Inc. | | 601,323 | |
62,257 | | @, L | | Career Education Corp. | | 1,290,588 | |
42,500 | | @ | | Cheesecake Factory | | 1,303,050 | |
53,735 | | | | Chico’s FAS, Inc. | | 646,432 | |
31,347 | | @ | | Chipotle Mexican Grill, Inc. | | 6,666,253 | |
40,200 | | @ | | Deckers Outdoor Corp. | | 3,205,548 | |
23,600 | | @ | | Dick’s Sporting Goods, Inc. | | 885,000 | |
141,051 | | @, L | | Dollar Tree, Inc. | | 7,910,132 | |
21,600 | | @ | | DreamWorks Animation SKG, Inc. | | 636,552 | |
55,067 | | @ | | Dress Barn, Inc. | | 1,454,870 | |
44,600 | | | | Foot Locker, Inc. | | 875,052 | |
59,299 | | @ | | Fossil, Inc. | | 4,179,394 | |
42,568 | | | | Gentex Corp. | | 1,258,310 | |
17,017 | | | | Guess ?, Inc. | | 805,244 | |
27,600 | | @ | | Hanesbrands, Inc. | | 701,040 | |
2,040 | | @, L | | ITT Educational Services, Inc. | | 129,928 | |
42,983 | | @ | | J Crew Group, Inc. | | 1,854,287 | |
34,503 | | | | John Wiley & Sons, Inc. | | 1,560,916 | |
38,860 | | @ | | Lamar Advertising Co. | | 1,548,182 | |
14,000 | | @ | | Life Time Fitness, Inc. | | 573,860 | |
39,500 | | @ | | LKQ Corp. | | 897,440 | |
23,063 | | @, L | | Mohawk Industries, Inc. | | 1,309,056 | |
2,101 | | @ | | NVR, Inc. | | 1,451,833 | |
46,300 | | @ | | Panera Bread Co. | | 4,686,023 | |
67,725 | | | | Petsmart, Inc. | | 2,696,810 | |
19,962 | | | | Phillips-Van Heusen | | 1,257,806 | |
22,400 | | | | Polaris Industries, Inc. | | 1,747,648 | |
56,700 | | | | Regis Corp. | | 941,220 | |
20,700 | | | | Rent-A-Center, Inc. | | 668,196 | |
105,998 | | @, L | | Saks, Inc. | | 1,134,179 | |
27,400 | | | | Scholastic Corp. | | 809,396 | |
79,695 | | | | Service Corp. International | | 657,484 | |
38,445 | | | | Sotheby’s | | 1,730,025 | |
4,300 | | | | Strayer Education, Inc. | | 654,546 | |
15,700 | | | | Thor Industries, Inc. | | 533,172 | |
36,300 | | @ | | Timberland Co. | | 892,617 | |
42,200 | | @ | | Toll Brothers, Inc. | | 801,800 | |
107,200 | | | | Tractor Supply Co. | | 5,198,128 | |
37,549 | | | | Tupperware Corp. | | 1,789,961 | |
70,400 | | @, L | | Under Armour, Inc. | | 3,860,736 | |
30,350 | | @ | | Warnaco Group, Inc. | | 1,671,375 | |
277,342 | | | | Wendy’s/Arby’s Group, Inc. - Class A | | 1,281,320 | |
62,889 | | | | Williams-Sonoma, Inc. | | 2,244,508 | |
16,874 | | @ | | WMS Industries, Inc. | | 763,380 | |
| | | | | | 96,929,033 | |
| | | | Consumer Staples: 3.5% | | | |
79,700 | | | | Alberto-Culver Co. | | 2,952,088 | |
13,800 | | @ | | BJ’s Wholesale Club, Inc. | | 661,020 | |
38,778 | | | | Church & Dwight Co., Inc. | | 2,676,458 | |
96,000 | | | | Corn Products International, Inc. | | 4,416,000 | |
67,064 | | @, L | | Energizer Holdings, Inc. | | 4,888,966 | |
23,200 | | | | Flowers Foods, Inc. | | 624,312 | |
58,564 | | @ | | Green Mountain Coffee Roasters, Inc. | | 1,924,413 | |
22,452 | | @ | | Hansen Natural Corp. | | 1,173,791 | |
14,100 | | | | Lancaster Colony Corp. | | 806,520 | |
13,432 | | @ | | Ralcorp Holdings, Inc. | | 873,214 | |
13,400 | | | | Ruddick Corp. | | 493,656 | |
88,443 | | @ | | Smithfield Foods, Inc. | | 1,824,579 | |
27,500 | | | | Universal Corp. | | 1,119,250 | |
| | | | | | 24,434,267 | |
| | | | Energy: 5.3% | | | |
129,069 | | | | Arch Coal, Inc. | | 4,525,159 | |
39,736 | | @, L | | Atwood Oceanics, Inc. | | 1,484,934 | |
17,276 | | @ | | Bill Barrett Corp. | | 710,562 | |
38,873 | | | | Cimarex Energy Co. | | 3,441,427 | |
| | | | | | | | |
32,400 | | @ | | Comstock Resources, Inc. | | 795,744 | |
55,400 | | @ | | Dril-Quip, Inc. | | 4,305,688 | |
50,240 | | @, L | | Exterran Holdings, Inc. | | 1,203,248 | |
34,213 | | @ | | Forest Oil Corp. | | 1,299,068 | |
32,600 | | @ | | Frontier Oil Corp. | | 587,126 | |
202,000 | | @ | | Helix Energy Solutions Group, Inc. | | 2,452,280 | |
14,266 | | @ | | Oceaneering International, Inc. | | 1,050,406 | |
20,700 | | @ | | Patriot Coal Corp. | | 400,959 | |
40,400 | | | | Patterson-UTI Energy, Inc. | | 870,620 | |
78,771 | | @ | | Plains Exploration & Production Co. | | 2,531,700 | |
88,060 | | @ | | Pride International, Inc. | | 2,905,980 | |
16,794 | | @ | | Quicksilver Resources, Inc. | | 247,544 | |
64,664 | | | | Southern Union Co. | | 1,556,462 | |
123,300 | | @ | | Superior Energy Services | | 4,314,267 | |
14,518 | | | | Tidewater, Inc. | | 781,649 | |
31,849 | | @ | | Unit Corp. | | 1,480,342 | |
| | | | | | 36,945,165 | |
| | | | Financials: 8.6% | | | |
33,472 | | @ | | Affiliated Managers Group, Inc. | | 3,321,092 | |
51,300 | | | | American Financial Group, Inc. | | 1,656,477 | |
100,500 | | | | Apollo Investment Corp. | | 1,112,535 | |
58,800 | | | | Arthur J. Gallagher & Co. | | 1,709,904 | |
52,800 | | | | Associated Banc-Corp. | | 799,920 | |
64,800 | | | | Bank of Hawaii Corp. | | 3,059,208 | |
30,600 | | | | Brown & Brown, Inc. | | 732,564 | |
122,500 | | | | Cathay General Bancorp. | | 2,045,750 | |
13,500 | | | | City National Corp. | | 828,360 | |
21,644 | | | | Commerce Bancshares, Inc. | | 859,916 | |
18,461 | | | | Cullen/Frost Bankers, Inc. | | 1,128,336 | |
67,854 | | | | Eaton Vance Corp. | | 2,051,226 | |
27,574 | | | | Everest Re Group Ltd. | | 2,338,827 | |
130,600 | | | | Fidelity National Title Group, Inc. | | 1,786,608 | |
34,900 | | | | First American Financial Corp. | | 521,406 | |
62,800 | | L | | First Niagara Financial Group, Inc. | | 877,944 | |
34,300 | | | | FirstMerit Corp. | | 678,797 | |
63,301 | | | | Fulton Financial Corp. | | 654,532 | |
6,900 | | | | Greenhill & Co., Inc. | | 563,592 | |
28,355 | | | | Hanover Insurance Group, Inc. | | 1,324,746 | |
63,224 | | | | HCC Insurance Holdings, Inc. | | 1,829,703 | |
57,964 | | | | Jefferies Group, Inc. | | 1,543,581 | |
58,189 | | | | Jones Lang LaSalle, Inc. | | 4,883,221 | |
27,800 | | | | Mercury General Corp. | | 1,195,678 | |
64,537 | | @ | | MSCI, Inc. - Class A | | 2,514,362 | |
147,897 | | | | New York Community Bancorp., Inc. | | 2,787,858 | |
32,147 | | | | NewAlliance Bancshares, Inc. | | 481,562 | |
90,900 | | | | Old Republic International Corp. | | 1,238,967 | |
12,700 | | | | Prosperity Bancshares, Inc. | | 498,856 | |
24,996 | | | | Protective Life Corp. | | 665,893 | |
26,535 | | | | Raymond James Financial, Inc. | | 867,695 | |
39,943 | | | | Reinsurance Group of America, Inc. | | 2,145,339 | |
85,692 | | | | SEI Investments Co. | | 2,038,613 | |
3,434 | | | | Stancorp Financial Group, Inc. | | 155,011 | |
12,400 | | @ | | SVB Financial Group | | 657,820 | |
249,504 | | L | | Synovus Financial Corp. | | 658,691 | |
43,000 | | | | TCF Financial Corp. | | 636,830 | |
34,515 | | | | Transatlantic Holdings, Inc. | | 1,781,664 | |
19,964 | | | | Trustmark Corp. | | 495,906 | |
40,996 | | | | Unitrin, Inc. | | 1,006,042 | |
49,700 | | | | Valley National Bancorp. | | 710,710 | |
22,600 | | | | Waddell & Reed Financial, Inc. | | 797,554 | |
37,900 | | | | Washington Federal, Inc. | | 641,268 | |
7,900 | | | | Westamerica Bancorp. | | 438,213 | |
39,000 | | | | WR Berkley Corp. | | 1,067,820 | |
| | | | | | 59,790,597 | |
| | | | Health Care: 10.9% | | | |
172,900 | | @ | | Allscripts Healthcare Solutions, Inc. | | 3,331,783 | |
49,349 | | | | Beckman Coulter, Inc. | | 3,712,525 | |
5,585 | | @ | | Bio-Rad Laboratories, Inc. | | 580,002 | |
17,500 | | @ | | Charles River Laboratories International, Inc. | | 621,950 | |
57,762 | | @ | | Community Health Systems, Inc. | | 2,158,566 | |
6,218 | | @ | | Covance, Inc. | | 319,667 | |
77,452 | | @ | | Edwards Lifesciences Corp. | | 6,261,220 | |
90,179 | | @ | | Endo Pharmaceuticals Holdings, Inc. | | 3,220,292 | |
13,400 | | @ | | Gen-Probe, Inc. | | 781,890 | |
174,285 | | @ | | Health Management Associates, Inc. | | 1,662,679 | |
107,698 | | @ | | Health Net, Inc. | | 2,939,078 | |
47,996 | | @ | | Henry Schein, Inc. | | 2,946,474 | |
61,183 | | | | Hill-Rom Holdings, Inc. | | 2,408,775 | |
105,006 | | @ | | Hologic, Inc. | | 1,976,213 | |
26,006 | | @, L | | Idexx Laboratories, Inc. | | 1,800,135 | |
24,548 | | @ | | Immucor, Inc. | | 486,787 | |
19,331 | | @ | | Kinetic Concepts, Inc. | | 809,582 | |
16,900 | | @ | | LifePoint Hospitals, Inc. | | 621,075 | |
63,197 | | | | Lincare Holdings, Inc. | | 1,695,576 | |
48,400 | | @ | | Masimo Corp. | | 1,406,988 | |
18,989 | | | | Medicis Pharmaceutical Corp. | | 508,715 | |
28,800 | | @ | | Mednax, Inc. | | 1,937,952 | |
30,824 | | @ | | Mettler Toledo International, Inc. | | 4,660,897 | |
75,966 | | | | Omnicare, Inc. | | 1,928,777 | |
47,900 | | | | Owens & Minor, Inc. | | 1,409,697 | |
105,180 | | | | Perrigo Co. | | 6,661,049 | |
29,275 | | | | Pharmaceutical Product Development, Inc. | | 794,524 | |
77,446 | | @, L | | Resmed, Inc. | | 2,682,729 | |
41,231 | | | | Steris Corp. | | 1,503,282 | |
43,037 | | | | Techne Corp. | | 2,826,240 | |
28,400 | | | | Teleflex, Inc. | | 1,528,204 | |
48,862 | | @ | | Thoratec Corp. | | 1,383,772 | |
19,565 | | @ | | United Therapeutics Corp. | | 1,236,899 | |
49,559 | | | | Universal Health Services, Inc. | | 2,151,852 | |
26,300 | | @ | | VCA Antech, Inc. | | 612,527 | |
70,950 | | @ | | Vertex Pharmaceuticals, Inc. | | 2,485,379 | |
48,600 | | @ | | WellCare Health Plans, Inc. | | 1,468,692 | |
| | | | | | 75,522,444 | |
| | | | Industrials: 16.2% | | | |
38,200 | | | | Acuity Brands, Inc. | | 2,202,994 | |
72,000 | | @ | | Aecom Technology Corp. | | 2,013,840 | |
27,100 | | @ | | AGCO Corp. | | 1,372,886 | |
51,137 | | @ | | Alaska Air Group, Inc. | | 2,898,957 | |
47,100 | | | | Alexander & Baldwin, Inc. | | 1,885,413 | |
5,059 | | @ | | Alliant Techsystems, Inc. | | 376,541 | |
52,650 | | | | Ametek, Inc. | | 2,066,513 | |
12,500 | | | | Baldor Electric Co. | | 788,000 | |
31,414 | | @ | | BE Aerospace, Inc. | | 1,163,260 | |
45,700 | | | | Brink’s Co. | | 1,228,416 | |
27,789 | | | | Bucyrus International, Inc. | | 2,484,337 | |
17,943 | | | | Carlisle Cos., Inc. | | 713,055 | |
16,000 | | @ | | Clean Harbors, Inc. | | 1,345,280 | |
17,138 | | | | Con-way, Inc. | | 626,737 | |
46,746 | | @ | | Copart, Inc. | | 1,745,963 | |
10,600 | | | | Corporate Executive Board Co. | | 398,030 | |
71,347 | | @ | | Corrections Corp. of America | | 1,787,956 | |
59,015 | | | | Crane Co. | | 2,423,746 | |
48,100 | | | | Deluxe Corp. | | 1,107,262 | |
21,612 | | | | Donaldson Co., Inc. | | 1,259,547 | |
37,132 | | @ | | FTI Consulting, Inc. | | 1,384,281 | |
55,000 | | | | Gardner Denver, Inc. | | 3,785,100 | |
34,900 | | | | GATX Corp. | | 1,231,272 | |
17,300 | | | | Graco, Inc. | | 682,485 | |
61,527 | | | | Harsco Corp. | | 1,742,445 | |
19,900 | | | | Herman Miller, Inc. | | 503,470 | |
4,794 | | | | HNI, Corp. | | 149,573 | |
50,978 | | | | Hubbell, Inc. | | 3,065,307 | |
116,300 | | | | IDEX Corp. | | 4,549,656 | |
28,521 | | | | JB Hunt Transport Services, Inc. | | 1,163,942 | |
93,300 | | @, L | | JetBlue Airways Corp. | | 616,713 | |
88,532 | | | | Joy Global, Inc. | | 7,680,151 | |
54,559 | | @, L | | Kansas City Southern | | 2,611,194 | |
48,770 | | | | KBR, Inc. | | 1,486,022 | |
80,500 | | | | Kennametal, Inc. | | 3,176,530 | |
30,300 | | @ | | Kirby Corp. | | 1,334,715 | |
14,853 | | | | Landstar System, Inc. | | 608,082 | |
33,400 | | | | Lennox International, Inc. | | 1,579,486 | |
46,500 | | | | Lincoln Electric Holdings, Inc. | | 3,035,055 | |
25,249 | | | | Manpower, Inc. | | 1,584,627 | |
27,300 | | | | MSC Industrial Direct Co. | | 1,766,037 | |
54,800 | | @ | | Navigant Consulting, Inc. | | 504,160 | |
41,200 | | | | Nordson Corp. | | 3,785,456 | |
53,900 | | @ | | Oshkosh Truck Corp. | | 1,899,436 | |
32,070 | | | | Pentair, Inc. | | 1,170,876 | |
26,604 | | | | Regal-Beloit Corp. | | 1,776,083 | |
40,503 | | | | Rollins, Inc. | | 799,934 | |
54,661 | | @ | | Shaw Group, Inc. | | 1,871,046 | |
69,257 | | | | SPX Corp. | | 4,951,183 | |
30,668 | | @ | | Terex Corp. | | 951,935 | |
71,128 | | @ | | Thomas & Betts Corp. | | 3,435,482 | |
107,974 | | | | Timken Co. | | 5,153,599 | |
30,900 | | | | Towers Watson & Co. | | 1,608,654 | |
59,700 | | | | Trinity Industries, Inc. | | 1,588,617 | |
131,300 | | @ | | United Rentals, Inc. | | 2,987,075 | |
34,164 | | @ | | URS Corp. | | 1,421,564 | |
5,600 | | | | Valmont Industries, Inc. | | 496,888 | |
12,571 | | | | Wabtec Corp. | | 664,880 | |
82,300 | | | | Waste Connections, Inc. | | 2,265,719 | |
7,700 | | | | Watsco, Inc. | | 485,716 | |
17,916 | | | | Woodward Governor Co. | | 672,925 | |
| | | | | | 112,116,104 | |
| | | | Information Technology: 14.9% | | | |
70,800 | | @ | | Acxiom Corp. | | 1,214,220 | |
22,548 | | | | Adtran, Inc. | | 816,463 | |
54,500 | | @ | | Advent Software, Inc. | | 3,156,640 | |
16,141 | | @, L | | Alliance Data Systems Corp. | | 1,146,495 | |
24,485 | | @ | | Ansys, Inc. | | 1,274,934 | |
30,200 | | @ | | AOL, Inc. | | 716,042 | |
87,329 | | @ | | Arrow Electronics, Inc. | | 2,991,018 | |
226,971 | | @ | | Atmel Corp. | | 2,796,283 | |
61,597 | | @ | | Avnet, Inc. | | 2,034,549 | |
81,563 | | | | Broadridge Financial Solutions ADR | | 1,788,677 | |
171,769 | | @ | | Cadence Design Systems, Inc. | | 1,418,812 | |
32,177 | | @, L | | Ciena Corp. | | 677,326 | |
25,085 | | @ | | CommScope, Inc. | | 783,154 | |
38,140 | | @ | | Convergys Corp. | | 502,304 | |
32,200 | | | | CoreLogic, Inc. | | 596,344 | |
36,565 | | @, L | | Cree, Inc. | | 2,409,268 | |
42,523 | | | | Diebold, Inc. | | 1,362,862 | |
43,320 | | @, L | | Digital River, Inc. | | 1,491,074 | |
28,805 | | | | DST Systems, Inc. | | 1,277,502 | |
14,284 | | @ | | Equinix, Inc. | | 1,160,718 | |
60,500 | | | | Factset Research Systems, Inc. | | 5,672,480 | |
152,600 | | @ | | Fairchild Semiconductor International, Inc. | | 2,382,086 | |
46,600 | | @ | | Gartner, Inc. | | 1,547,120 | |
26,080 | | | | Global Payments, Inc. | | 1,205,157 | |
28,127 | | @ | | Informatica Corp. | | 1,238,432 | |
45,509 | | @ | | Ingram Micro, Inc. | | 868,767 | |
21,700 | | @ | | International Rectifier Corp. | | 644,273 | |
41,200 | | | | Intersil Corp. | | 629,124 | |
27,300 | | @ | | Itron, Inc. | | 1,513,785 | |
25,100 | | | | Jack Henry & Associates, Inc. | | 731,665 | |
63,700 | | @ | | Lam Research Corp. | | 3,298,386 | |
58,300 | | | | Lender Processing Services, Inc. | | 1,721,016 | |
41,600 | | @ | | Mentor Graphics Corp. | | 499,200 | |
124,168 | | @ | | Micros Systems, Inc. | | 5,446,008 | |
41,100 | | | | National Instruments Corp. | | 1,547,004 | |
45,800 | | @ | | NCR Corp. | | 703,946 | |
53,611 | | @ | | NeuStar, Inc. | | 1,396,567 | |
156,600 | | @ | | Parametric Technology Corp. | | 3,528,198 | |
36,085 | | | | Plantronics, Inc. | | 1,343,084 | |
22,696 | | @ | | Polycom, Inc. | | 884,690 | |
117,838 | | @ | | Quest Software, Inc. | | 3,268,826 | |
24,000 | | @, L | | Rackspace Hosting, Inc. | | 753,840 | |
178,127 | | @ | | RF Micro Devices, Inc. | | 1,309,233 | |
77,200 | | @ | | Riverbed Technolgoy, Inc. | | 2,715,124 | |
100,542 | | @ | | Rovi Corp. | | 6,234,609 | |
65,300 | | @ | | Semtech Corp. | | 1,478,392 | |
32,900 | | @, L | | Silicon Laboratories, Inc. | | 1,514,058 | |
193,200 | | @ | | Skyworks Solutions, Inc. | | 5,531,316 | |
80,300 | | | | Solera Holdings, Inc. | | 4,120,996 | |
40,800 | | @ | | SRA International, Inc. | | 834,360 | |
86,800 | | @ | | Synopsys, Inc. | | 2,335,788 | |
13,133 | | @ | | Tech Data Corp. | | 578,115 | |
123,400 | | @ | | TIBCO Software, Inc. | | 2,432,214 | |
33,907 | | @ | | Trimble Navigation Ltd. | | 1,353,907 | |
21,600 | | @ | | Valueclick, Inc. | | 346,248 | |
119,964 | | @ | | Vishay Intertechnology, Inc. | | 1,761,072 | |
16,800 | | @ | | Zebra Technologies Corp. | | 638,232 | |
| | | | | | 103,622,003 | |
| | | | Materials: 6.5% | | | |
48,200 | | | | Albemarle Corp. | | 2,688,596 | |
72,400 | | | | Aptargroup, Inc. | | 3,444,068 | |
24,734 | | | | Ashland, Inc. | | 1,257,971 | |
101,000 | | | | Cabot Corp. | | 3,802,650 | |
13,200 | | | | Carpenter Technology Corp. | | 531,168 | |
35,700 | | | | Commercial Metals Co. | | 592,263 | |
41,754 | | | | Cytec Industries, Inc. | | 2,215,467 | |
9,100 | | | | Greif, Inc. - Class A | | 563,290 | |
11,800 | | @ | | Intrepid Potash, Inc. | | 440,022 | |
68,253 | | | | Lubrizol Corp. | | 7,294,881 | |
14,082 | | L | | Martin Marietta Materials, Inc. | | 1,298,924 | |
5,400 | | | | Minerals Technologies, Inc. | | 353,214 | |
8,800 | | | | NewMarket Corp. | | 1,085,656 | |
68,700 | | | | Olin Corp. | | 1,409,724 | |
43,394 | | | | Packaging Corp. of America | | 1,121,301 | |
23,211 | | | | Reliance Steel & Aluminum Co. | | 1,186,082 | |
27,900 | | | | Rock-Tenn Co. | | 1,505,205 | |
35,038 | | | | RPM International, Inc. | | 774,340 | |
27,800 | | | | Scotts Miracle-Gro Co. | | 1,411,406 | |
69,700 | | | | Sensient Technologies Corp. | | 2,560,081 | |
16,800 | | | | Silgan Holdings, Inc. | | 601,608 | |
116,092 | | | | Sonoco Products Co. | | 3,908,818 | |
69,628 | | | | Steel Dynamics, Inc. | | 1,274,192 | |
73,383 | | | | Temple-Inland, Inc. | | 1,558,655 | |
57,599 | | | | Valspar Corp. | | 1,986,014 | |
20,500 | | | | Worthington Industries | | 377,200 | |
| | | | | | 45,242,796 | |
| | | | Telecommunication Services: 0.7% | | | |
62,400 | | @ | | Syniverse Holdings, Inc. | | 1,925,040 | |
50,200 | | | | Telephone & Data Systems, Inc. | | 1,834,810 | |
67,144 | | @ | | TW Telecom, Inc. | | 1,144,805 | |
| | | | | | 4,904,655 | |
| | | | Utilities: 5.5% | | | |
18,713 | | | | AGL Resources, Inc. | | 670,861 | |
121,200 | | | | Alliant Energy Corp. | | 4,456,524 | |
62,900 | | | | Aqua America, Inc. | | 1,413,992 | |
26,200 | | | | Atmos Energy Corp. | | 817,440 | |
42,289 | | | | Black Hills Corp. | | 1,268,670 | |
62,500 | | | | Cleco Corp. | | 1,922,500 | |
70,667 | | | | DPL, Inc. | | 1,816,849 | |
42,200 | | | | Energen Corp. | | 2,036,572 | |
89,500 | | | | Great Plains Energy, Inc. | | 1,735,405 | |
69,222 | | | | Hawaiian Electric Industries | | 1,577,569 | |
57,526 | | | | Idacorp, Inc. | | 2,127,311 | |
88,800 | | | | MDU Resources Group, Inc. | | 1,799,976 | |
39,744 | | | | National Fuel Gas Co. | | 2,608,001 | |
51,000 | | | | NSTAR | | 2,151,690 | |
52,999 | | | | NV Energy, Inc. | | 744,636 | |
90,980 | | | | OGE Energy Corp. | | 4,143,229 | |
47,000 | | | | Questar Corp. | | 818,270 | |
22,553 | | | | UGI Corp. | | 712,224 | |
140,600 | | | | Vectren Corp. | | 3,568,428 | |
30,600 | | | | Westar Energy, Inc. | | 769,896 | |
36,080 | | | | WGL Holdings, Inc. | | 1,290,582 | |
| | | | | | 38,450,625 | |
| | | | Total Common Stock
(Cost $510,735,945) | | 597,957,689 | |
| | | | | | | |
REAL ESTATE INVESTMENT TRUSTS: 10.0% | | | |
| | | | Financials: 10.0% | | | |
35,191 | | | | Alexandria Real Estate Equities, Inc. | | 2,578,093 | |
134,210 | | | | AMB Property Corp. | | 4,255,799 | |
80,036 | | | | BRE Properties, Inc. | | 3,481,566 | |
71,487 | | | | Camden Property Trust | | 3,858,868 | |
28,900 | | | | Corporate Office Properties Trust SBI MD | | 1,010,055 | |
336 | | | | Cousins Properties, Inc. | | 2,802 | |
208,631 | | | | Duke Realty Corp. | | 2,599,542 | |
55,600 | | | | Equity One, Inc. | | 1,010,808 | |
40,705 | | | | Essex Property Trust, Inc. | | 4,649,325 | |
67,200 | | | | Federal Realty Investment Trust | | 5,236,896 | |
45,880 | | | | Highwoods Properties, Inc. | | 1,461,278 | |
80,600 | | | | Hospitality Properties Trust | | 1,857,024 | |
68,147 | | | | Liberty Property Trust | | 2,175,252 | |
136,625 | | | | Macerich Co. | | 6,471,926 | |
50,275 | | | | Mack-Cali Realty Corp. | | 1,662,092 | |
65,800 | | | | Nationwide Health Properties, Inc. | | 2,393,804 | |
137,600 | | | | Omega Healthcare Investors, Inc. | | 3,087,744 | |
36,500 | | | | Potlatch Corp. | | 1,188,075 | |
19,716 | | | | Rayonier, Inc. | | 1,035,484 | |
143,500 | | | | Realty Income Corp. | | 4,907,700 | |
55,700 | | | | Regency Centers Corp. | | 2,352,768 | |
66,977 | | | | Senior Housing Properties Trust | | 1,469,475 | |
78,600 | | | | SL Green Realty Corp. | | 5,306,286 | |
143,200 | | | | UDR, Inc. | | 3,368,064 | |
77,972 | | | | Weingarten Realty Investors | | 1,852,615 | |
| | | | | | | |
| | | | Total Real Estate Investment Trusts
(Cost $60,785,357) | | 69,273,341 | |
| | | | | | | |
| | | | Total Long-Term Investments
(Cost $571,521,302) | | 667,231,030 | |
| | | | | | | |
SHORT-TERM INVESTMENTS: 6.1% | | | |
| | | | Mutual Funds: 4.1% | | | |
28,675,000 | | | | Blackrock Liquidity Funds TempFund Portfolio - Class I | | 28,675,000 | |
| | | | | | | |
| | | | Total Mutual Funds
(Cost $28,675,000) | | 28,675,000 | |
| | | | Securities Lending Collateral(cc): 2.0% | | | |
11,334,731 | | | | BNY Mellon Overnight Government Fund (1) | | 11,334,731 | |
2,851,192 | | R | | BNY Institutional Cash Reserves Fund, Series B (1)(2) | | 2,280,954 | |
| | | | | | | |
| | | | Total Securities Lending Collateral
(Cost $14,185,923) | | 13,615,685 | |
| | | | | | | |
| | | | Total Short-Term Investments
(Cost $42,860,923) | | 42,290,685 | |
| | | | | | | |
| | | | Total Investments in Securities
(Cost $614,382,225) * | 102.2 | % | | $ | 709,521,715 | |
| | | | Other Assets and Liabilities - Net | (2.2 | ) | | (15,046,949 | ) |
| | | | Net Assets | 100.0 | % | | $ | 694,474,766 | |
| | @ | | Non-income producing security |
| | ADR | | American Depositary Receipt |
| | (cc) | | Securities purchased with cash collateral for securities loaned. |
| | (1) | | Collateral received from brokers for securities lending was invested in these short-term investments. |
| | (2) | | On September 12, 2008, BNY established a separate sleeve of the Institutional Cash Reserves Fund (Series B) to hold certain Lehman Brothers defaulted debt obligations. The Portfolio’s position in Series B is being fair valued daily. Please see the accompanying Notes to Financial Statements for additional details on securities lending. |
| | R | | Restricted security |
| | L | | Loaned security, a portion or all of the security is on loan at December 31, 2010. |
| PORTFOLIO OF INVESTMENTS |
ING Index Plus SmallCap Portfolio | as of December 31, 2010 |
Shares | | | | | | Value | |
| | | |
COMMON STOCK: 89.5% | | | |
| | | | Consumer Discretionary: 14.3% | | | |
6,300 | | @ | | American Public Education, Inc. | | $ | 234,612 | |
21,557 | | | | Arbitron, Inc. | | 895,047 | |
9,817 | | L | | Big 5 Sporting Goods Corp. | | 149,906 | |
1,321 | | @ | | Biglari Holdings, Inc. | | 541,887 | |
14,200 | | @ | | BJ’s Restaurants, Inc. | | 503,106 | |
8,600 | | @ | | Blue Nile, Inc. | | 490,716 | |
3,900 | | | | Blyth, Inc. | | 134,472 | |
40,100 | | | | Brown Shoe Co., Inc. | | 558,593 | |
55,589 | | | | Brunswick Corp. | | 1,041,738 | |
7,610 | | | | Buckle, Inc. | | 287,430 | |
14,600 | | @ | | Buffalo Wild Wings, Inc. | | 640,210 | |
41,026 | | @, L | | Cabela’s, Inc. | | 892,316 | |
28,422 | | @ | | California Pizza Kitchen, Inc. | | 491,132 | |
43,200 | | L | | Callaway Golf Co. | | 348,624 | |
16,049 | | @, L | | Capella Education Co. | | 1,068,542 | |
27,137 | | @ | | Carter’s, Inc. | | 800,813 | |
12,939 | | | | Cato Corp. | | 354,658 | |
14,800 | | @ | | CEC Entertainment, Inc. | | 574,684 | |
25,694 | | @ | | Childrens Place Retail Stores, Inc. | | 1,275,450 | |
47,900 | | | | Christopher & Banks Corp. | | 294,585 | |
19,652 | | @ | | Coinstar, Inc. | | 1,109,159 | |
10,704 | | | | Cracker Barrel Old Country Store | | 586,258 | |
40,408 | | @ | | CROCS, Inc. | | 691,785 | |
5,749 | | @ | | DineEquity, Inc. | | 283,886 | |
10,971 | | @ | | Drew Industries, Inc. | | 249,261 | |
29,100 | | | | Ethan Allen Interiors, Inc. | | 582,291 | |
56,742 | | | | Finish Line | | 975,395 | |
50,112 | | | | Fred’s, Inc. | | 689,541 | |
20,810 | | @ | | Genesco, Inc. | | 780,167 | |
12,873 | | L | | Group 1 Automotive, Inc. | | 537,576 | |
20,996 | | @ | | Helen of Troy Ltd. | | 624,421 | |
5,876 | | @ | | Hibbett Sporting Goods, Inc. | | 216,824 | |
39,194 | | L | | Hillenbrand, Inc. | | 815,627 | |
8,300 | | | | HOT Topic, Inc. | | 52,041 | |
37,796 | | @, L | | HSN, Inc. | | 1,158,069 | |
27,346 | | @ | | Iconix Brand Group, Inc. | | 528,051 | |
52,600 | | @ | | Interval Leisure Group, Inc. | | 848,964 | |
16,600 | | @ | | Jack in the Box, Inc. | | 350,758 | |
13,614 | | @ | | Jakks Pacific, Inc. | | 248,047 | |
27,131 | | @, L | | Jo-Ann Stores, Inc. | | 1,633,829 | |
21,683 | | @ | | JoS. A Bank Clothiers, Inc. | | 874,259 | |
4,700 | | @ | | Kirkland’s, Inc. | | 65,941 | |
28,475 | | @ | | K-Swiss, Inc. | | 355,083 | |
50,994 | | @ | | La-Z-Boy, Inc. | | 459,966 | |
117,924 | | @ | | Live Nation, Inc. | | 1,346,692 | |
53,549 | | @, L | | Liz Claiborne, Inc. | | 383,411 | |
19,100 | | @, L | | Lumber Liquidators | | 475,781 | |
33,700 | | @ | | Maidenform Brands, Inc. | | 801,049 | |
7,600 | | | | Marcus Corp. | | 100,852 | |
31,696 | | | | Men’s Wearhouse, Inc. | | 791,766 | |
18,100 | | @ | | Meritage Homes Corp. | | 401,820 | |
19,047 | | | | Monro Muffler, Inc. | | 658,836 | |
8,969 | | | | Nutri/System, Inc. | | 188,618 | |
29,102 | | @ | | OfficeMax, Inc. | | 515,105 | |
17,400 | | | | Oxford Industries, Inc. | | 445,614 | |
21,598 | | @ | | Papa John’s International, Inc. | | 598,265 | |
6,500 | | @ | | Peet’s Coffee & Tea, Inc. | | 271,310 | |
20,682 | | | | PEP Boys-Manny Moe & Jack | | 277,759 | |
2,100 | | @ | | Perry Ellis International, Inc. | | 57,687 | |
15,300 | | L | | PetMed Express, Inc. | | 272,493 | |
17,100 | | L | | PF Chang’s China Bistro, Inc. | | 828,666 | |
62,572 | | @ | | Pinnacle Entertainment, Inc. | | 877,259 | |
19,262 | | | | Pool Corp. | | 434,165 | |
6,925 | | @ | | Pre-Paid Legal Services, Inc. | | 417,231 | |
123,780 | | @ | | Quiksilver, Inc. | | 627,565 | |
10,682 | | @ | | RC2 Corp. | | 232,547 | |
14,500 | | @ | | Red Robin Gourmet Burgers, Inc. | | 311,315 | |
28,412 | | @ | | Ruby Tuesday, Inc. | | 371,061 | |
6,400 | | @ | | Ruth’s Chris Steak House | | 29,632 | |
38,150 | | @ | | Shuffle Master, Inc. | | 436,818 | |
35,021 | | @ | | Skechers USA, Inc. | | 700,420 | |
18,020 | | | | Sonic Automotive, Inc. | | 238,585 | |
37,300 | | @ | | Sonic Corp. | | 377,476 | |
| | | | | | | | |
42,006 | | | | Stage Stores, Inc. | | 728,384 | |
17,500 | | | | Standard Motor Products, Inc. | | 239,750 | |
68,500 | | @ | | Standard-Pacific Corp. | | 315,100 | |
18,200 | | @ | | Steven Madden Ltd. | | 759,304 | |
14,968 | | | | Sturm Ruger & Co., Inc. | | 228,861 | |
12,500 | | | | Superior Industries International | | 265,250 | |
29,105 | | @ | | Texas Roadhouse, Inc. | | 499,733 | |
24,262 | | @ | | True Religion Apparel, Inc. | | 540,072 | |
7,700 | | @ | | Tuesday Morning Corp. | | 40,656 | |
12,230 | | @ | | Universal Electronics, Inc. | | 346,965 | |
12,400 | | @, L | | Universal Technical Institute, Inc. | | 273,048 | |
14,900 | | @ | | Volcom, Inc. | | 281,163 | |
24,700 | | @ | | Winnebago Industries | | 375,440 | |
31,503 | | | | Wolverine World Wide, Inc. | | 1,004,316 | |
56,700 | | @, L | | Zale Corp. | | 241,542 | |
14,100 | | @, L | | Zumiez, Inc. | | 378,867 | |
| | | | | | 46,283,969 | |
| | | | Consumer Staples: 3.3% | | | |
50,000 | | @ | | Alliance One International, Inc. | | 212,000 | |
13,110 | | | | Andersons, Inc. | | 476,549 | |
7,085 | | @ | | Boston Beer Co., Inc. | | 673,713 | |
6,700 | | | | Calavo Growers, Inc. | | 154,435 | |
6,474 | | | | Cal-Maine Foods, Inc. | | 204,449 | |
34,993 | | | | Casey’s General Stores, Inc. | | 1,487,552 | |
23,075 | | @ | | Central Garden & Pet Co. | | 227,981 | |
33,753 | | @ | | Darling International, Inc. | | 448,240 | |
13,527 | | L | | Diamond Foods, Inc. | | 719,366 | |
33,239 | | @ | | Hain Celestial Group, Inc. | | 899,447 | |
6,051 | | | | J&J Snack Foods Corp. | | 291,900 | |
24,700 | | @ | | Medifast, Inc. | | 713,336 | |
15,602 | | | | Nash Finch Co. | | 663,241 | |
8,252 | | | | Sanderson Farms, Inc. | | 323,066 | |
29,386 | | | | Snyders-Lance, Inc. | | 688,808 | |
2,400 | | | | Spartan Stores, Inc. | | 40,680 | |
32,468 | | @ | | TreeHouse Foods, Inc. | | 1,658,790 | |
17,571 | | @ | | United Natural Foods, Inc. | | 644,504 | |
4,400 | | | | WD-40 Co. | | 177,232 | |
| | | | | | 10,705,289 | |
| | | | Energy: 5.2% | | | |
17,000 | | @ | | Basic Energy Services, Inc. | | 280,160 | |
21,227 | | @ | | Bristow Group, Inc. | | 1,005,098 | |
12,846 | | | | CARBO Ceramics, Inc. | | 1,330,075 | |
5,900 | | @ | | Contango Oil & Gas Co. | | 341,787 | |
3,100 | | | | Gulf Island Fabrication, Inc. | | 87,358 | |
12,600 | | @ | | Gulfport Energy Corp. | | 272,790 | |
30,440 | | | | Holly Corp. | | 1,241,039 | |
27,800 | | @ | | Hornbeck Offshore Services, Inc. | | 580,464 | |
107,487 | | @ | | ION Geophysical Corp. | | 911,490 | |
23,696 | | | | Lufkin Industries, Inc. | | 1,478,393 | |
40,800 | | @ | | Matrix Service Co. | | 496,944 | |
26,862 | | @ | | Oil States International, Inc. | | 1,721,586 | |
59,568 | | | | Penn Virginia Corp. | | 1,001,934 | |
19,824 | | @ | | Petroleum Development Corp. | | 836,771 | |
22,499 | | @ | | Petroquest Energy, Inc. | | 169,417 | |
74,238 | | @ | | Pioneer Drilling Co. | | 654,037 | |
10,896 | | @ | | SEACOR Holdings, Inc. | | 1,101,477 | |
47,800 | | @, L | | Seahawk Drilling, Inc. | | 427,810 | |
14,782 | | @ | | Stone Energy Corp. | | 329,491 | |
21,746 | | @ | | Swift Energy Co. | | 851,356 | |
44,357 | | @ | | Tetra Technologies, Inc. | | 526,518 | |
35,579 | | | | World Fuel Services Corp. | | 1,286,537 | |
| | | | | | 16,932,532 | |
| | | | Financials: 10.3% | | | |
6,712 | | @ | | Amerisafe, Inc. | | 117,460 | |
11,253 | | | | Bank of the Ozarks, Inc. | | 487,818 | |
90,700 | | | | Boston Private Financial Holdings, Inc. | | 594,085 | |
20,740 | | | | Brookline Bancorp., Inc. | | 225,029 | |
22,991 | | | | Cash America International, Inc. | | 849,058 | |
8,400 | | | | City Holding Co. | | 304,332 | |
32,558 | | | | Columbia Banking System, Inc. | | 685,671 | |
22,067 | | | | Community Bank System, Inc. | | 612,801 | |
30,940 | | | | Delphi Financial Group | | 892,310 | |
15,000 | | | | Dime Community Bancshares | | 218,850 | |
6,250 | | @ | | eHealth, Inc. | | 88,688 | |
18,700 | | L | | Employers Holdings, Inc. | | 326,876 | |
48,060 | | @ | | Ezcorp, Inc. | | 1,303,868 | |
26,426 | | @ | | First Cash Financial Services, Inc. | | 818,942 | |
44,700 | | | | First Commonwealth Financial Corp. | | 316,476 | |
57,269 | | | | First Financial Bancorp. | | 1,058,331 | |
18,250 | | L | | First Financial Bankshares, Inc. | | 934,035 | |
66,181 | | | | First Midwest Bancorp., Inc. | | 762,405 | |
25,094 | | @ | | Forestar Real Estate Group, Inc. | | 484,314 | |
58,200 | | | | Glacier Bancorp., Inc. | | 879,402 | |
10,475 | | L | | Hancock Holding Co. | | 365,159 | |
26,700 | | | | Home Bancshares, Inc. | | 588,201 | |
29,442 | | | | Horace Mann Educators Corp. | | 531,134 | |
7,310 | | | | Independent Bank Corp. | | 197,736 | |
6,365 | | | | Infinity Property & Casualty Corp. | | 393,357 | |
18,200 | | @, L | | Interactive Brokers Group, Inc. | | 324,324 | |
18,000 | | @ | | Investment Technology Group, Inc. | | 294,660 | |
10,000 | | @, L | | LaBranche & Co., Inc. | | 36,000 | |
52,230 | | @, L | | National Financial Partners Corp. | | 699,882 | |
55,100 | | | | National Penn Bancshares, Inc. | | 442,453 | |
7,300 | | @ | | Navigators Group, Inc. | | 367,555 | |
17,308 | | | | NBT Bancorp., Inc. | | 417,988 | |
44,000 | | | | Old National Bancorp. | | 523,160 | |
15,617 | | @ | | OptionsXpress Holdings, Inc. | | 244,718 | |
37,800 | | @ | | Pinnacle Financial Partners, Inc. | | 513,324 | |
7,417 | | @ | | Piper Jaffray Cos. | | 259,669 | |
17,128 | | @ | | Portfolio Recovery Associates, Inc. | | 1,288,026 | |
25,421 | | | | PrivateBancorp, Inc. | | 365,554 | |
27,292 | | @ | | ProAssurance Corp. | | 1,653,895 | |
12,300 | | | | Provident Financial Services, Inc. | | 186,099 | |
5,600 | | | | RLI Corp. | | 294,392 | |
9,400 | | | | S&T Bancorp, Inc. | | 212,346 | |
11,144 | | | | Safety Insurance Group, Inc. | | 530,120 | |
23,500 | | | | Selective Insurance Group | | 426,525 | |
25,138 | | @ | | Signature Bank | | 1,256,900 | |
4,939 | | | | Simmons First National Corp. | | 140,762 | |
12,660 | | | | Sterling Bancorp. | | 132,550 | |
48,100 | | | | Sterling Bancshares, Inc. | | 337,662 | |
20,759 | | @ | | Stifel Financial Corp. | | 1,287,888 | |
136,151 | | | | Susquehanna Bancshares, Inc. | | 1,317,942 | |
25,600 | | | | SWS Group, Inc. | | 129,280 | |
38,558 | | | | Tower Group, Inc. | | 986,314 | |
21,655 | | | | Trustco Bank Corp. | | 137,293 | |
19,191 | | | | UMB Financial Corp. | | 794,891 | |
68,127 | | | | Umpqua Holdings Corp. | | 829,787 | |
26,508 | | | | United Bankshares, Inc. | | 774,034 | |
27,100 | | @ | | United Community Banks, Inc. | | 52,845 | |
6,478 | | | | United Fire & Casualty Co. | | 144,589 | |
42,347 | | | | Whitney Holding Corp. | | 599,210 | |
25,186 | | L | | Wintrust Financial Corp. | | 831,894 | |
9,862 | | @, L | | World Acceptance, Corp. | | 520,714 | |
| | | | | | 33,391,583 | |
| | | | Health Care: 12.5% | | | |
9,300 | | @ | | Abaxism, Inc. | | 249,705 | |
37,500 | | @ | | Affymetrix, Inc. | | 188,625 | |
5,600 | | @ | | Air Methods Corp. | | 315,112 | |
40,187 | | @ | | Align Technology, Inc. | | 785,254 | |
18,345 | | @ | | Amedisys, Inc. | | 614,558 | |
66,813 | | @ | | American Medical Systems Holdings, Inc. | | 1,260,093 | |
30,109 | | @ | | AMERIGROUP Corp. | | 1,322,387 | |
36,700 | | @ | | AMN Healthcare Services, Inc. | | 225,338 | |
9,243 | | @ | | Amsurg Corp. | | 193,641 | |
3,500 | | | | Analogic Corp. | | 173,285 | |
28,700 | | @, L | | Bio-Reference Labs, Inc. | | 636,566 | |
8,600 | | | | Cantel Medical Corp. | | 201,240 | |
25,529 | | @ | | Catalyst Health Solutions, Inc. | | 1,186,843 | |
36,906 | | @ | | Centene Corp. | | 935,198 | |
7,400 | | | | Chemed Corp. | | 469,974 | |
7,400 | | | | Computer Programs & Systems, Inc. | | 346,616 | |
25,400 | | @ | | Conmed Corp. | | 671,322 | |
34,030 | | | | Cooper Cos., Inc. | | 1,917,250 | |
13,300 | | @ | | Corvel Corp. | | 643,055 | |
42,247 | | @ | | Cubist Pharmaceuticals, Inc. | | 904,086 | |
31,940 | | @ | | Cyberonics | | 990,779 | |
7,112 | | @ | | Dionex Corp. | | 839,287 | |
10,300 | | @ | | Emergent Biosolutions, Inc. | | 241,638 | |
10,800 | | | | Ensign Group, Inc. | | 268,596 | |
44,348 | | @ | | eResearch Technology, Inc. | | 325,958 | |
8,019 | | @ | | Genoptix, Inc. | | 152,521 | |
38,279 | | @ | | Gentiva Health Services, Inc. | | 1,018,221 | |
9,700 | | @ | | Greatbatch, Inc. | | 234,255 | |
16,512 | | @ | | Haemonetics Corp. | | 1,043,228 | |
15,000 | | @ | | Hanger Orthopedic Group, Inc. | | 317,850 | |
25,270 | | @ | | Healthspring, Inc. | | 670,413 | |
30,800 | | @ | | Healthways, Inc. | | 343,728 | |
10,700 | | @ | | Hi-Tech Pharmacal Co., Inc. | | 266,965 | |
20,900 | | @ | | HMS Holdings Corp. | �� | 1,353,693 | |
10,900 | | @, L | | ICU Medical, Inc. | | 397,850 | |
13,400 | | @ | | Integra LifeSciences Holdings Corp. | | 633,820 | |
27,238 | | | | Invacare Corp. | | 821,498 | |
7,200 | | @ | | IPC The Hospitalist Co., Inc. | | 280,872 | |
3,000 | | @ | | Kendle International, Inc. | | 32,670 | |
6,070 | | @, L | | Kensey Nash Corp. | | 168,928 | |
7,500 | | | | Landauer, Inc. | | 449,775 | |
20,440 | | @ | | LHC Group, Inc. | | 613,200 | |
22,060 | | @ | | Magellan Health Services, Inc. | | 1,042,997 | |
29,392 | | @ | | Martek Biosciences Corp. | | 919,970 | |
17,100 | | | | Meridian Bioscience, Inc. | | 396,036 | |
36,128 | | @ | | Merit Medical Systems, Inc. | | 571,906 | |
13,555 | | @ | | Molina Healthcare, Inc. | | 377,507 | |
10,449 | | @ | | MWI Veterinary Supply, Inc. | | 659,854 | |
33,712 | | @ | | Natus Medical, Inc. | | 478,036 | |
10,821 | | @ | | Neogen Corp. | | 443,986 | |
12,157 | | @ | | Omnicell, Inc. | | 175,669 | |
15,238 | | @ | | Par Pharmaceutical Cos., Inc. | | 586,815 | |
54,807 | | @ | | Parexel International Corp. | | 1,163,553 | |
13,600 | | @ | | PharMerica Corp. | | 155,720 | |
30,802 | | @, L | | PSS World Medical, Inc. | | 696,125 | |
17,688 | | | | Quality Systems, Inc. | | 1,234,976 | |
56,970 | | @ | | Regeneron Pharmaceuticals, Inc. | | 1,870,325 | |
25,812 | | @ | | RehabCare Group, Inc. | | 611,744 | |
33,670 | | @ | | Salix Pharmaceuticals Ltd. | | 1,581,143 | |
75,856 | | @, L | | Savient Pharmaceuticals, Inc. | | 845,036 | |
4,700 | | @ | | SurModics, Inc. | | 55,789 | |
40,817 | | @ | | Symmetry Medical, Inc. | | 377,557 | |
28,605 | | @ | | Viropharma, Inc. | | 495,439 | |
15,503 | | | | West Pharmaceutical Services, Inc. | | 638,724 | |
10,675 | | @ | | Zoll Medical Corp. | | 397,430 | |
| | | | | | 40,482,230 | |
| | | | Industrials: 16.4% | | | |
1,100 | | | | AAON, Inc. | | 31,031 | |
15,595 | | @ | | AAR Corp. | | 428,395 | |
43,276 | | | | ABM Industries, Inc. | | 1,138,159 | |
66,787 | | | | Actuant Corp. | | 1,777,870 | |
9,138 | | | | Administaff, Inc. | | 267,743 | |
7,195 | | @ | | Aerovironment, Inc. | | 193,042 | |
24,700 | | | | Albany International Corp. | | 585,142 | |
4,222 | | @, L | | Allegiant Travel Co. | | 207,891 | |
2,958 | | | | American Science & Engineering, Inc. | | 252,110 | |
33,600 | | | | AO Smith Corp. | | 1,279,488 | |
16,787 | | | | Apogee Enterprises, Inc. | | 226,121 | |
29,624 | | | | Applied Industrial Technologies, Inc. | | 962,188 | |
5,821 | | | | Applied Signal Technology, Inc. | | 220,558 | |
17,337 | | | | Arkansas Best Corp. | | 475,381 | |
7,463 | | @ | | Astec Industries, Inc. | | 241,876 | |
14,800 | | | | AZZ, Inc. | | 592,148 | |
12,300 | | L | | Badger Meter, Inc. | | 543,906 | |
27,538 | | | | Barnes Group, Inc. | | 569,210 | |
15,378 | | | | Belden CDT, Inc. | | 566,218 | |
36,837 | | | | Brady Corp. | | 1,201,255 | |
56,031 | | | | Briggs & Stratton Corp. | | 1,103,250 | |
4,600 | | | | Cascade Corp. | | 217,488 | |
15,076 | | @ | | Ceradyne, Inc. | | 475,346 | |
12,300 | | | | CIRCOR International, Inc. | | 520,044 | |
20,989 | | | | Clarcor, Inc. | | 900,218 | |
12,800 | | | | Comfort Systems USA, Inc. | | 168,576 | |
6,083 | | @ | | Consolidated Graphics, Inc. | | 294,600 | |
13,263 | | | | Cubic Corp. | | 625,350 | |
25,462 | | | | Curtiss-Wright Corp. | | 845,338 | |
24,200 | | @ | | Dolan Media Co. | | 336,864 | |
21,104 | | @ | | Dycom Industries, Inc. | | 311,284 | |
47,286 | | @ | | EMCOR Group, Inc. | | 1,370,348 | |
13,800 | | | | Encore Wire Corp. | | 346,104 | |
18,900 | | @ | | EnPro Industries, Inc. | | 785,484 | |
10,300 | | | | ESCO Technologies, Inc. | | 389,752 | |
17,719 | | @ | | Esterline Technologies Corp. | | 1,215,346 | |
22,800 | | @ | | Exponent, Inc. | | 855,684 | |
39,800 | | | | Federal Signal Corp. | | 273,028 | |
24,113 | | | | Forward Air Corp. | | 684,327 | |
11,400 | | | | G&K Services, Inc. | | 352,374 | |
24,880 | | @ | | Gencorp, Inc. | | 128,630 | |
50,169 | | @ | | Geo Group, Inc. | | 1,237,168 | |
19,200 | | @ | | Gibraltar Industries, Inc. | | 260,544 | |
41,978 | | @ | | Griffon Corp. | | 534,800 | |
45,294 | | | | Healthcare Services Group | | 736,933 | |
60,717 | | | | Heartland Express, Inc. | | 972,686 | |
19,600 | | | | Heidrick & Struggles International, Inc. | | 561,540 | |
12,545 | | @ | | HUB Group, Inc. | | 440,831 | |
10,896 | | @ | | II-VI, Inc. | | 505,139 | |
30,800 | | @ | | Insituform Technologies, Inc. | | 816,508 | |
68,340 | | | | Interface, Inc. | | 1,069,521 | |
25,571 | | | | John Bean Technologies Corp. | | 514,744 | |
10,735 | | | | Kaman Corp. | | 312,066 | |
32,723 | | | | Kaydon Corp. | | 1,332,481 | |
14,000 | | @ | | Kelly Services, Inc. | | 263,200 | |
41,240 | | | | Knight Transportation, Inc. | | 783,560 | |
5,747 | | L | | Lindsay Manufacturing Co. | | 341,544 | |
15,800 | | @ | | Mobile Mini, Inc. | | 311,102 | |
37,450 | | @ | | Moog, Inc. | | 1,490,510 | |
28,155 | | | | Mueller Industries, Inc. | | 920,669 | |
4,929 | | | | National Presto Industries, Inc. | | 640,819 | |
38,559 | | @ | | Old Dominion Freight Line | | 1,233,502 | |
4,200 | | @ | | On Assignment, Inc. | | 34,230 | |
20,927 | | @ | | Orbital Sciences Corp. | | 358,480 | |
12,800 | | @ | | Orion Marine Group, Inc. | | 148,480 | |
5,400 | | @ | | Powell Industries, Inc. | | 177,552 | |
20,988 | | | | Quanex Building Products Corp. | | 398,142 | |
13,426 | | L | | Robbins & Myers, Inc. | | 480,382 | |
10,397 | | @ | | School Specialty, Inc. | | 144,830 | |
26,662 | | @ | | SFN Group, Inc. | | 260,221 | |
40,240 | | | | Simpson Manufacturing Co., Inc. | | 1,243,818 | |
21,375 | | | | Skywest, Inc. | | 333,878 | |
23,035 | | | | Standex International Corp. | | 688,977 | |
33,763 | | @ | | SYKES Enterprises, Inc. | | 684,038 | |
31,190 | | @ | | Teledyne Technologies, Inc. | | 1,371,424 | |
39,394 | | @ | | Tetra Tech, Inc. | | 987,214 | |
27,688 | | | | Toro Co. | | 1,706,688 | |
9,800 | | | | Tredegar Corp. | | 189,924 | |
8,267 | | | | Triumph Group, Inc. | | 739,152 | |
18,599 | | @ | | TrueBlue, Inc. | | 334,596 | |
11,809 | | | | Unifirst Corp. | | 650,085 | |
15,415 | | @ | | United Stationers, Inc. | | 983,631 | |
16,938 | | | | Universal Forest Products, Inc. | | 658,888 | |
9,600 | | | | Viad Corp. | | 244,512 | |
18,900 | | | | Vicor Corp. | | 309,960 | |
21,800 | | | | Watts Water Technologies, Inc. | | 797,662 | |
| | | | | | 53,165,798 | |
| | | | Information Technology: 18.7% | | | |
40,212 | | @ | | Advanced Energy Industries, Inc. | | 548,492 | |
17,824 | | @ | | Anixter International, Inc. | | 1,064,628 | |
43,722 | | @ | | Arris Group, Inc. | | 490,561 | |
17,600 | | @ | | ATMI, Inc. | | 350,944 | |
8,512 | | @ | | Avid Technology, Inc. | | 148,620 | |
47,230 | | @ | | Benchmark Electronics, Inc. | | 857,697 | |
14,412 | | | | Black Box Corp. | | 551,835 | |
28,200 | | | | Blackbaud, Inc. | | 730,380 | |
25,654 | | @ | | Blue Coat Systems, Inc. | | 766,285 | |
8,700 | | @ | | Bottomline Technologies, Inc. | | 188,877 | |
26,114 | | @ | | Brightpoint, Inc. | | 227,975 | |
31,903 | | @ | | Brooks Automation, Inc. | | 289,360 | |
21,594 | | @ | | Cabot Microelectronics Corp. | | 895,071 | |
22,500 | | @ | | CACI International, Inc. | | 1,201,500 | |
6,900 | | @ | | Ceva, Inc. | | 141,450 | |
43,882 | | @ | | Checkpoint Systems, Inc. | | 901,775 | |
8,600 | | @ | | Ciber, Inc. | | 40,248 | |
33,457 | | | | Cognex Corp. | | 984,305 | |
9,300 | | | | Cohu, Inc. | | 154,194 | |
24,520 | | @ | | Commvault Systems, Inc. | | 701,762 | |
10,900 | | @, L | | Compellent Technologies, Inc. | | 300,731 | |
24,800 | | @ | | comScore, Inc. | | 553,288 | |
24,679 | | | | Comtech Telecommunications | | 684,349 | |
23,970 | | @ | | CSG Systems International | | 453,992 | |
31,799 | | | | CTS Corp. | | 351,697 | |
21,200 | | @ | | Cymer, Inc. | | 955,484 | |
71,369 | | @ | | Cypress Semiconductor Corp. | | 1,326,036 | |
18,972 | | | | Daktronics, Inc. | | 302,034 | |
21,775 | | @ | | DealerTrack Holdings, Inc. | | 437,024 | |
21,600 | | @ | | DG FastChannel, Inc. | | 623,808 | |
13,800 | | @ | | Diodes, Inc. | | 372,462 | |
12,869 | | @ | | DTS, Inc. | | 631,224 | |
32,300 | | @, L | | Ebix, Inc. | | 764,541 | |
7,261 | | @ | | Electro Scientific Industries, Inc. | | 116,394 | |
9,000 | | @ | | EMS Technologies, Inc. | | 178,020 | |
22,200 | | @ | | Epicor Software Corp. | | 224,220 | |
35,500 | | | | EPIQ Systems, Inc. | | 487,415 | |
4,900 | | @ | | Exar Corp. | | 34,202 | |
8,600 | | @ | | Faro Technologies, Inc. | | 282,424 | |
29,700 | | @ | | FEI Co. | | 784,377 | |
13,600 | | @ | | Forrester Research, Inc. | | 479,944 | |
95,026 | | @ | | Harmonic, Inc. | | 814,373 | |
15,214 | | | | Heartland Payment Systems, Inc. | | 234,600 | |
12,500 | | @ | | Hittite Microwave Corp. | | 763,000 | |
8,100 | | | | iGate Corp. | | 159,651 | |
45,800 | | @ | | Infospace, Inc. | | 380,140 | |
39,861 | | @ | | Insight Enterprises, Inc. | | 524,571 | |
25,158 | | @ | | Intermec, Inc. | | 318,500 | |
15,496 | | @ | | j2 Global Communications, Inc. | | 448,609 | |
42,994 | | @ | | JDA Software Group, Inc. | | 1,203,832 | |
62,600 | | @ | | Kulicke & Soffa Industries, Inc. | | 450,720 | |
17,100 | | @ | | Liquidity Services, Inc. | | 240,255 | |
14,800 | | | | Littelfuse, Inc. | | 696,488 | |
8,300 | | @ | | LogMeIn, Inc. | | 368,022 | |
10,302 | | @ | | Manhattan Associates, Inc. | | 314,623 | |
6,005 | | | | MAXIMUS, Inc. | | 393,808 | |
8,300 | | @, L | | Mercury Computer Systems, Inc. | | 152,554 | |
35,827 | | | | Methode Electronics, Inc. | | 464,676 | |
45,009 | | | | Micrel, Inc. | | 584,667 | |
52,848 | | @ | | Microsemi Corp. | | 1,210,219 | |
2,900 | | @ | | MicroStrategy, Inc. | | 247,863 | |
21,679 | | @ | | MKS Instruments, Inc. | | 530,919 | |
42,900 | | @ | | Monolithic Power Systems, Inc. | | 708,708 | |
11,700 | | | | MTS Systems Corp. | | 438,282 | |
13,590 | | @ | | Netgear, Inc. | | 457,711 | |
35,880 | | @ | | Netscout Systems, Inc. | | 825,599 | |
18,522 | | @ | | Newport Corp. | | 321,727 | |
47,900 | | @ | | Novatel Wireless, Inc. | | 457,445 | |
17,200 | | @ | | Oplink Communications, Inc. | | 317,684 | |
19,300 | | @ | | OSI Systems, Inc. | | 701,748 | |
22,825 | | | | Park Electrochemical Corp. | | 684,750 | |
14,378 | | @ | | Perficient, Inc. | | 179,725 | |
18,600 | | @ | | Pericom Semiconductor Corp. | | 204,228 | |
30,044 | | @ | | Plexus Corp. | | 929,561 | |
5,400 | | L | | Power Integrations, Inc. | | 216,756 | |
19,500 | | @ | | Progress Software Corp. | | 825,240 | |
39,400 | | | | Pulse Electronics Corp. | | 209,608 | |
27,278 | | @ | | Radiant Systems, Inc. | | 533,830 | |
57,703 | | @, L | | Radisys Corp. | | 513,557 | |
15,700 | | @ | | RightNow Technologies, Inc. | | 371,619 | |
7,700 | | @ | | Rofin-Sinar Technologies, Inc. | | 272,888 | |
16,400 | | @ | | Rogers Corp. | | 627,300 | |
38,810 | | @ | | Rudolph Technologies, Inc. | | 319,406 | |
17,000 | | @ | | Scansource, Inc. | | 542,300 | |
16,156 | | @, L | | Sigma Designs, Inc. | | 228,931 | |
36,700 | | @ | | Smith Micro Software, Inc. | | 577,658 | |
56,200 | | @ | | Sonic Solutions, Inc. | | 843,000 | |
35,300 | | @ | | Sourcefire, Inc. | | 915,329 | |
49,392 | | @ | | Stamps.com, Inc. | | 654,444 | |
19,300 | | @ | | Standard Microsystems Corp. | | 556,419 | |
9,600 | | @, L | | Stratasys, Inc. | | 313,344 | |
4,100 | | @ | | Supertex, Inc. | | 99,138 | |
22,026 | | @, L | | Synaptics, Inc. | | 647,124 | |
16,452 | | @ | | SYNNEX Corp. | | 513,302 | |
43,889 | | @ | | Take-Two Interactive Software, Inc. | | 537,201 | |
43,432 | | @ | | Taleo Corp. | | 1,200,895 | |
24,810 | | @ | | Tekelec | | 295,487 | |
16,115 | | @ | | TeleTech Holdings, Inc. | | 331,808 | |
19,073 | | @ | | Tessera Technologies, Inc. | | 422,467 | |
98,317 | | @ | | THQ, Inc. | | 595,801 | |
52,105 | | @ | | Tollgrade Communications, Inc. | | 483,534 | |
56,499 | | @ | | Triquint Semiconductor, Inc. | | 660,473 | |
62,612 | | @ | | TTM Technologies, Inc. | | 933,545 | |
16,008 | | @ | | Tyler Technologies, Inc. | | 332,326 | |
14,400 | | @ | | Ultratech, Inc. | | 286,272 | |
37,075 | | | | United Online, Inc. | | 244,695 | |
57,294 | | @ | | Varian Semiconductor Equipment Associates, Inc. | | 2,118,159 | |
23,718 | | @, L | | Veeco Instruments, Inc. | | 1,018,925 | |
39,391 | | @ | | Viasat, Inc. | | 1,749,354 | |
15,300 | | @ | | Volterra Semiconductor Corp. | | 354,348 | |
28,000 | | @ | | Websense, Inc. | | 567,000 | |
13,079 | | @ | | Wright Express Corp. | | 601,634 | |
| | | | | | 60,824,000 | |
| | | | Materials: 4.4% | | | |
5,069 | | | | A Schulman, Inc. | | 116,029 | |
29,885 | | | | Amcol International Corp. | | 926,435 | |
28,400 | | | | Arch Chemicals, Inc. | | 1,077,212 | |
19,386 | | | | Balchem Corp. | | 655,441 | |
15,096 | | @ | | Brush Engineered Materials, Inc. | | 583,309 | |
29,700 | | | | Buckeye Technologies, Inc. | | 623,997 | |
47,035 | | @ | | Calgon Carbon Corp. | | 711,169 | |
47,307 | | @ | | Century Aluminum Co. | | 734,678 | |
5,008 | | @ | | Clearwater Paper Corp. | | 392,126 | |
7,500 | | | | Deltic Timber Corp. | | 422,550 | |
24,300 | | | | Eagle Materials, Inc. | | 686,475 | |
32,062 | | | | HB Fuller Co. | | 657,912 | |
12,400 | | @ | | Headwaters, Inc. | | 56,792 | |
4,700 | | | | Kaiser Aluminum Corp. | | 235,423 | |
10,500 | | @ | | KapStone Paper and Packaging Corp. | | 160,650 | |
12,400 | | @ | | LSB Industries, Inc. | | 300,824 | |
18,900 | | | | Myers Industries, Inc. | | 184,086 | |
11,200 | | | | Neenah Paper, Inc. | | 220,416 | |
7,500 | | | | Olympic Steel, Inc. | | 215,100 | |
11,587 | | @ | | OM Group, Inc. | | 446,215 | |
69,958 | | @ | | PolyOne Corp. | | 873,775 | |
8,972 | | | | Quaker Chemical Corp. | | 373,863 | |
19,400 | | @ | | RTI International Metals, Inc. | | 523,412 | |
15,297 | | | | Schweitzer-Mauduit International, Inc. | | 962,487 | |
7,974 | | | | Stepan Co. | | 608,177 | |
12,700 | | | | Texas Industries, Inc. | | 581,406 | |
56,200 | | | | Wausau Paper Corp. | | 483,882 | |
22,878 | | | | Zep, Inc. | | 454,815 | |
| | | | | | 14,268,656 | |
| | | | Telecommunication Services: 0.8% | | | |
10,500 | | | | Atlantic Tele-Network, Inc. | | 402,570 | |
14,790 | | @ | | Cbeyond, Inc. | | 225,991 | |
62,700 | | @, L | | General Communication, Inc. | | 793,782 | |
12,600 | | @ | | Neutral Tandem, Inc. | | 181,944 | |
8,558 | | | | NTELOS Holdings Corp. | | 163,030 | |
50,300 | | | | USA Mobility, Inc. | | 893,831 | |
| | | | | | 2,661,148 | |
| | | | Utilities: 3.6% | | | |
19,000 | | | | Allete, Inc. | | 707,940 | |
18,700 | | | | American States Water Co. | | 644,589 | |
53,637 | | | | Avista Corp. | | 1,207,905 | |
5,400 | | | | Central Vermont Public Service Corp. | | 118,044 | |
13,626 | | | | CH Energy Group, Inc. | | 666,175 | |
21,747 | | @ | | El Paso Electric Co. | | 598,695 | |
13,902 | | | | Laclede Group, Inc. | | 507,979 | |
14,840 | | | | New Jersey Resources Corp. | | 639,752 | |
19,500 | | | | Northwest Natural Gas Co. | | 906,165 | |
34,700 | | | | NorthWestern Corp. | | 1,000,401 | |
44,149 | | | | Piedmont Natural Gas Co. | | 1,234,406 | |
20,900 | | | | South Jersey Industries, Inc. | | 1,103,938 | |
32,216 | | | | Southwest Gas Corp. | | 1,181,361 | |
18,500 | | | | UIL Holdings Corp. | | 554,260 | |
19,286 | | | | Unisource Energy Corp. | | 691,210 | |
| | | | | | 11,762,820 | |
| | | | Total Common Stock
(Cost $251,335,400) | | 290,478,025 | |
| | | | | | | |
REAL ESTATE INVESTMENT TRUSTS: 7.4% | | | |
| | | | Financials: 7.4% | | | |
16,998 | | | | Acadia Realty Trust | | 310,044 | |
117,638 | | | | BioMed Realty Trust, Inc. | | 2,193,949 | |
26,100 | | | | Cedar Shopping Centers, Inc. | | 164,169 | |
28,420 | | | | Colonial Properties Trust | | 512,981 | |
69,489 | | @, L | | DiamondRock Hospitality Co. | | 833,868 | |
10,906 | | | | EastGroup Properties, Inc. | | 461,542 | |
22,958 | | | | Entertainment Properties Trust | | 1,061,808 | |
84,164 | | | | Extra Space Storage, Inc. | | 1,464,454 | |
49,592 | | | | Franklin Street Properties Corp. | | 706,686 | |
57,298 | | | | Healthcare Realty Trust, Inc. | | 1,212,999 | |
27,292 | | | | Home Properties, Inc. | | 1,514,433 | |
33,400 | | | | Inland Real Estate Corp. | | 293,920 | |
28,626 | | | | Kilroy Realty Corp. | | 1,043,990 | |
78,500 | | | | Kite Realty Group Trust | | 424,685 | |
58,099 | | | | LaSalle Hotel Properties | | 1,533,814 | |
120,282 | | | | Lexington Realty Trust | | 956,242 | |
11,631 | | | | LTC Properties, Inc. | | 326,598 | |
51,059 | | | | Medical Properties Trust, Inc. | | 552,969 | |
24,422 | | | | Mid-America Apartment Communities, Inc. | | 1,550,553 | |
70,091 | | L | | National Retail Properties, Inc. | | 1,857,412 | |
8,804 | | | | Parkway Properties, Inc. | | 154,246 | |
20,018 | | | | Pennsylvania Real Estate Investment Trust | | 290,862 | |
19,521 | | | | Post Properties, Inc. | | 708,612 | |
18,690 | | | | PS Business Parks, Inc. | | 1,041,407 | |
18,444 | | | | Sovran Self Storage, Inc. | | 678,924 | |
35,554 | | | | Tanger Factory Outlet Centers, Inc. | | 1,820,009 | |
4,300 | | | | Universal Health Realty Income Trust | | 157,079 | |
15,903 | | | | Urstadt Biddle Properties, Inc. | | 309,313 | |
| | | | | | | |
| | | | Total Real Estate Investment Trusts
(Cost $21,853,858) | | 24,137,568 | |
| | | | | | | |
| | | | Total Long-Term Investments
(Cost $273,189,258) | | 314,615,593 | |
SHORT-TERM INVESTMENTS: 7.6% | | | |
| | | | Mutual Funds: 3.6% | | | |
11,828,000 | | | | Blackrock Liquidity Funds TempFund Portfolio - Class I | | 11,828,000 | |
| | | | | | | |
| | | | Total Mutual Funds
(Cost $11,828,000) | | 11,828,000 | |
| | | | | | | |
| | | | Securities Lending Collateral(cc): 4.0% | | | |
11,795,222 | | | | BNY Mellon Overnight Government Fund (1) | | 11,795,222 | |
1,429,266 | | R | | BNY Institutional Cash Reserves Fund, Series B (1)(2) | | 1,143,413 | |
| | | | | | | |
| | | | Total Securities Lending Collateral
(Cost $13,224,488) | | 12,938,635 | |
| | | | | | | |
| | | | Total Short-Term Investments
(Cost $25,052,488) | | 24,766,635 | |
| | | | | | | |
| | | | Total Investments in Securities
(Cost $298,241,746)* | 104.5 | % | $ | 339,382,228 | |
| | | | Other Assets and Liabilities - Net | (4.5 | ) | (14,651,872 | ) |
| | | | Net Assets | 100.0 | % | $ | 324,730,356 | |
| | @ | | Non-income producing security |
| | (cc) | | Securities purchased with cash collateral for securities loaned. |
| | (1) | | Collateral received from brokers for securities lending was invested in these short-term investments. |
| | (2) | | On September 12, 2008, BNY established a separate sleeve of the Institutional Cash Reserves Fund (Series B) to hold certain Lehman Brothers defaulted debt obligations. The Portfolio’s position in Series B is being fair valued daily. Please see the accompanying Notes to Financial Statements for additional details on securities lending. |
| | R | | Restricted security |
| | L | | Loaned security, a portion or all of the security is on loan at December 31, 2010. |
| | PORTFOLIO OF INVESTMENTS |
ING International Index Portfolio | | as of December 31, 2010 |
Shares | | | | | | Value | |
| | | | | | | |
COMMON STOCK: 95.4% | | | | | |
| | | | Australia: 8.0% | | | |
14,659 | | | | AGL Energy Ltd. | | $ | 228,520 | |
68,411 | | | | Alumina Ltd. | | 173,907 | |
43,133 | | | | Amcor Ltd. | | 297,831 | |
69,315 | | | | AMP Ltd. | | 375,068 | |
71,933 | | @ | | Asciano Group | | 117,430 | |
5,318 | | | | ASX Ltd. | | 204,991 | |
85,261 | | | | Australia & New Zealand Banking Group Ltd. | | 2,036,466 | |
30,889 | | | | AXA Asia Pacific Holdings Ltd. | | 199,474 | |
9,486 | | | | Bendigo Bank Ltd. | | 96,604 | |
110,459 | | | | BHP Billiton Ltd. | | 5,136,458 | |
10,652 | | | | Billabong International Ltd. | | 88,827 | |
57,016 | | | | BlueScope Steel Ltd. | | 131,039 | |
48,471 | | | | Brambles Ltd. | | 353,067 | |
21,206 | | | | Coca-Cola Amatil Ltd. | | 235,807 | |
1,697 | | | | Cochlear Ltd. | | 139,696 | |
50,054 | | | | Commonwealth Bank of Australia | | 2,600,828 | |
13,895 | | | | Computershare Ltd. | | 153,151 | |
18,385 | | | | Crown Ltd. | | 155,272 | |
19,817 | | | | CSL Ltd. | | 735,650 | |
41,545 | | @ | | Fortescue Metals Group Ltd. | | 278,491 | |
51,905 | | | | Foster’s Group Ltd. | | 301,738 | |
51,523 | | | | Incitec Pivot Ltd. | | 208,873 | |
73,514 | | | | Insurance Australia Group | | 291,967 | |
85,596 | | L | | John Fairfax Holdings Ltd. | | 122,739 | |
4,678 | | | | Leighton Holdings Ltd. | | 147,445 | |
12,501 | | | | Lend Lease Corp., Ltd. | | 110,379 | |
8,775 | | | | MacArthur Coal Ltd. | | 115,218 | |
9,927 | | | | Macquarie Group Ltd. | | 375,643 | |
68,978 | | | | National Australia Bank Ltd. | | 1,673,511 | |
24,180 | | | | Newcrest Mining Ltd. | | 1,002,951 | |
40,666 | | | | OneSteel Ltd. | | 107,730 | |
11,300 | | | | Orica Ltd. | | 288,179 | |
28,749 | | | | Origin Energy Ltd. | | 490,182 | |
100,029 | | | | Oz Minerals Ltd. | | 176,668 | |
23,377 | | @ | | Paladin Resources Ltd. | | 117,823 | |
38,943 | | @ | | Qantas Airways Ltd. | | 101,173 | |
33,671 | | | | QBE Insurance Group Ltd. | | 625,306 | |
41,341 | | @ | | QR National Ltd. | | 116,280 | |
14,246 | | | | Rio Tinto Ltd. | | 1,247,478 | |
25,919 | | | | Santos Ltd. | | 348,963 | |
8,119 | | | | Sims Group Ltd. | | 178,584 | |
11,730 | | | | Sonic Healthcare Ltd. | | 139,440 | |
41,752 | | | | Suncorp Group Ltd. | | 367,680 | |
15,130 | | | | TABCORP Holdings Ltd. | | 110,015 | |
39,875 | | | | Tattersall’s Ltd. | | 105,293 | |
148,941 | | | | Telstra Corp., Ltd. | | 424,916 | |
27,278 | | | | Toll Holdings Ltd. | | 160,071 | |
45,704 | | | | Transurban Group | | 239,940 | |
34,324 | | | | Wesfarmers Ltd. | | 1,124,427 | |
8,570 | | | | Wesfarmers Ltd. - Price Protected Shares | | 283,478 | |
99,107 | | | | Westpac Banking Corp. | | 2,251,501 | |
19,686 | | | | Woodside Petroleum Ltd. | | 857,533 | |
40,927 | | | | Woolworths Ltd. | | 1,130,192 | |
8,245 | | | | WorleyParsons Ltd. | | 225,819 | |
| | | | | | 29,307,712 | |
| | | | Austria: 0.3% | | | |
6,923 | | | | Erste Bank der Oesterreichischen Sparkassen AG | | 326,745 | |
35,869 | | @, L | | Immofinanz Immobilien Anlagen AG | | 153,309 | |
5,258 | | | | OMV AG | | 219,131 | |
1,689 | | | | Raiffeisen International Bank Holding AG | | 93,038 | |
10,734 | | | | Telekom Austria AG | | 151,295 | |
2,391 | | | | Verbund AG | | 89,341 | |
4,099 | | | | Voestalpine AG | | 196,059 | |
| | | | | | 1,228,918 | |
| | | | Belgium: 0.9% | | | |
72,353 | | | | Ageas | | 165,371 | |
23,047 | | | | Anheuser-Busch InBev NV | | 1,316,887 | |
863 | | | | Bekaert SA | | 99,032 | |
5,292 | | L | | Belgacom S.A. | | 177,796 | |
1,873 | | | | Cie Nationale a Portefeuille | | 91,652 | |
2,913 | | | | Colruyt S.A. | | 148,136 | |
2,934 | | | | Delhaize Group | | 216,979 | |
20,127 | | @ | | Dexia S.A. | | 69,925 | |
3,220 | | | | Groupe Bruxelles Lambert S.A. | | 270,926 | |
5,033 | | @ | | KBC Groep NV | | 171,489 | |
1,556 | | | | Solvay S.A. | | 165,914 | |
| | | | | | | | |
4,139 | | | | UCB S.A. | | 142,125 | |
4,110 | | | | Umicore | | 213,984 | |
| | | | | | 3,250,216 | |
| | | | Bermuda: 0.1% | | | |
9,143 | | | | SeaDrill Ltd. ADR | | 311,897 | |
| | | | | | 311,897 | |
| | | | China: 0.0% | | | |
101,473 | | @ | | Foxconn International Holdings Ltd. | | 70,832 | |
| | | | | | 70,832 | |
| | | | Cyprus: 0.0% | | | |
15,407 | | | | Bank of Cyprus Public Co., Ltd. | | 53,175 | |
12,038 | | | | Bank of Cyprus Public Co., Ltd. | | 42,095 | |
| | | | | | 95,270 | |
| | | | Denmark: 1.0% | | | |
32 | | | | AP Moller - Maersk A/S - Class A | | 281,918 | |
50 | | | | AP Moller - Maersk A/S - Class B | | 452,682 | |
3,248 | | | | Carlsberg A/S | | 326,020 | |
15,225 | | @ | | Danske Bank A/S | | 390,451 | |
6,923 | | | | DSV A/S | | 153,461 | |
13,582 | | | | Novo-Nordisk A/S | | 1,530,210 | |
1,462 | | | | Novozymes A/S | | 203,997 | |
1,673 | | | | TrygVesta A/S | | 77,152 | |
6,873 | | @ | | Vestas Wind Systems A/S | | 217,670 | |
| | | | | | 3,633,561 | |
| | | | Finland: 1.1% | | | |
14,101 | | | | Fortum OYJ | | 425,335 | |
1,825 | | | | Kesko OYJ | | 85,283 | |
6,136 | | | | Kone OYJ | | 340,808 | |
4,315 | | | | Metso OYJ | | 241,384 | |
5,725 | | | | Neste Oil OYJ | | 91,543 | |
121,549 | | | | Nokia OYJ | | 1,259,104 | |
3,504 | | | | Nokian Renkaat OYJ | | 128,747 | |
6,946 | | | | Outokumpu OYJ | | 128,756 | |
4,356 | | | | Rautaruukki OYJ | | 102,286 | |
13,808 | | | | Sampo OYJ | | 369,221 | |
18,324 | | | | Stora Enso OYJ (Euro Denominated Security) | | 188,574 | |
18,281 | | | | UPM-Kymmene OYJ | | 324,083 | |
3,095 | | | | Wartsila OYJ | | 235,852 | |
| | | | | | 3,920,976 | |
| | | | France: 8.5% | | | |
4,388 | | | | Accor S.A. | | 195,562 | |
1,311 | | | | Aeroports de Paris | | 103,615 | |
4,783 | | @ | | Air France-KLM | | 87,312 | |
9,185 | | | | Air Liquide | | 1,162,954 | |
81,266 | | @ | | Alcatel S.A. | | 237,746 | |
6,512 | | | | Alstom | | 312,128 | |
55,280 | | | | AXA S.A. | | 920,160 | |
30,458 | | | | BNP Paribas | | 1,939,767 | |
6,835 | | | | Bouygues S.A. | | 294,989 | |
1,623 | | | | Bureau Veritas S.A. | | 123,166 | |
4,726 | | | | Capgemini S.A. | | 220,939 | |
18,461 | | | | Carrefour S.A. | | 761,194 | |
1,850 | | | | Casino Guichard Perrachon S.A. | | 180,512 | |
1,987 | | | | Christian Dior S.A. | | 284,209 | |
13,603 | | | | Cie de Saint-Gobain | | 700,630 | |
4,234 | | @ | | Cie Generale de Geophysique-Veritas | | 129,252 | |
5,515 | | | | Cie Generale des Etablissements Michelin | | 395,898 | |
6,767 | | | | Cie Generale D’Optique Essilor International S.A. | | 436,004 | |
6,239 | | | | CNP Assurances | | 112,608 | |
31,290 | | | | Credit Agricole S.A. | | 397,875 | |
2,105 | | | | Dassault Systemes S.A. | | 158,909 | |
4,567 | | @ | | Edenred | | 108,113 | |
7,819 | | | | Electricite de France SA | | 321,107 | |
261 | | | | Eramet SLN | | 89,565 | |
3,628 | | | | Eutelsat Communications | | 132,870 | |
58,231 | | | | France Telecom S.A. | | 1,218,534 | |
40,915 | | | | Gaz de France | | 1,469,469 | |
19,547 | | | | Groupe Danone | | 1,229,059 | |
12,681 | | | | Groupe Eurotunnel S.A. | | 111,596 | |
669 | | | | Hermes International | | 140,278 | |
1,493 | | | | Imerys S.A. | | 99,654 | |
6,588 | | | | Lafarge S.A. | | 413,573 | |
3,419 | | | | Lagardere SCA | | 140,964 | |
3,806 | | | | Legrand S.A. | | 155,247 | |
8,038 | | | | L’Oreal S.A. | | 893,759 | |
8,501 | | | | LVMH Moet Hennessy Louis Vuitton S.A. | | 1,400,155 | |
35,686 | | @ | | Natixis | | 166,931 | |
1,405 | | | | Neopost S.A. | | 122,528 | |
6,479 | | | | Pernod-Ricard S.A. | | 609,863 | |
4,251 | | @ | | Peugeot S.A. | | 161,525 | |
2,409 | | | | PPR | | 383,541 | |
3,858 | | | | Publicis Groupe | | 201,316 | |
6,382 | | @ | | Renault S.A. | | 371,511 | |
4,915 | | | | Safran S.A. | | 174,229 | |
34,423 | | | | Sanofi-Aventis | | 2,206,886 | |
8,193 | | | | Schneider Electric S.A. | | 1,228,426 | |
5,497 | | | | Scor S.A. | | 139,698 | |
1,186 | | | | Societe BIC S.A. | | 101,960 | |
20,524 | | | | Societe Generale | | 1,104,331 | |
6,624 | | | | Societe Television Francaise (T.F.1) | | 115,153 | |
2,438 | | | | Sodexho Alliance S.A. | | 168,233 | |
6,961 | | | | Suez Environnement S.A. | | 143,808 | |
3,251 | | | | Technip S.A. | | 300,501 | |
3,328 | | | | Thales S.A. | | 116,570 | |
68,332 | | | | Total S.A. | | 3,639,535 | |
3,812 | | | | Vallourec | | 400,790 | |
11,825 | | | | Veolia Environnement | | 346,134 | |
14,891 | | | | Vinci S.A. | | 810,334 | |
37,352 | | | | Vivendi | | 1,009,313 | |
| | | | | | 31,102,488 | |
| | | | Germany: 7.5% | | | |
6,651 | | | | Adidas AG | | 432,642 | |
14,787 | | | | Allianz AG | | 1,756,928 | |
29,617 | | | | BASF AG | | 2,363,525 | |
26,663 | | | | Bayer AG | | 1,976,458 | |
11,043 | | | | Bayerische Motoren Werke AG | | 870,045 | |
2,904 | | | | Beiersdorf AG | | 161,144 | |
997 | | @ | | Brenntag AG | | 101,654 | |
3,253 | | | | Celesio AG | | 81,066 | |
22,240 | | @, L | | Commerzbank AG | | 165,573 | |
1,584 | | @ | | Continental AG | | 125,825 | |
29,528 | | @ | | DaimlerChrysler AG | | 1,998,009 | |
30,506 | | | | Deutsche Bank AG | | 1,595,341 | |
5,763 | | | | Deutsche Boerse AG | | 398,172 | |
8,798 | | @ | | Deutsche Lufthansa AG | | 191,381 | |
28,658 | | | | Deutsche Post AG | | 486,189 | |
91,634 | | | | Deutsche Telekom AG | | 1,181,273 | |
60,568 | | | | E.ON AG | | 1,849,677 | |
1,698 | | | | Fresenius AG | | 142,487 | |
6,238 | | | | Fresenius Medical Care AG & Co. KGaA | | 358,642 | |
4,095 | | | | GEA Group AG | | 118,339 | |
2,390 | | | | Hannover Rueckversicheru - Reg | | 128,211 | |
3,827 | | | | HeidelbergCement AG | | 240,194 | |
5,124 | | | | Henkel KGaA | | 264,190 | |
6,281 | | | | Henkel KGaA - Vorzug | | 389,433 | |
938 | | | | Hochtief AG | | 79,516 | |
34,303 | | @ | | Infineon Technologies AG | | 319,748 | |
4,175 | | | | K+S AG | | 314,679 | |
1,874 | | @ | | Kabel Deutschland Holding AG | | 87,879 | |
2,196 | | | | Lanxess | | 172,666 | |
5,144 | | | | Linde AG | | 778,181 | |
3,719 | | | | MAN AG | | 442,955 | |
1,529 | | | | Merck KGaA | | 122,412 | |
4,526 | | | | Metro AG | | 326,672 | |
6,006 | | | | Muenchener Rueckversicherungs AG | | 909,637 | |
13,857 | | | | RWE AG | | 925,507 | |
2,057 | | | | Salzgitter AG | | 159,035 | |
28,204 | | | | SAP AG | | 1,438,479 | |
26,835 | | | | Siemens AG | | 3,324,176 | |
10,229 | | | | ThyssenKrupp AG | | 424,962 | |
1,903 | | | | Volkswagen AG | | 269,923 | |
739 | | | | Wacker Chemie AG | | 128,842 | |
| | | | | | 27,601,667 | |
| | | | Greece: 0.2% | | | |
16,636 | | @ | | Alpha Bank AE | | 84,572 | |
6,267 | | | | Coca-Cola Hellenic Bottling Co. S.A. | | 162,360 | |
9,009 | | | | Hellenic Telecommunications Organization S.A. | | 73,944 | |
31,930 | | @ | | National Bank of Greece S.A. | | 259,794 | |
9,716 | | | | OPAP S.A. | | 168,105 | |
| | | | | | 748,775 | |
| | | | Guernsey: 0.0% | | | |
41,694 | | | | Resolution Ltd. | | 152,542 | |
| | | | | | 152,542 | |
| | | | Hong Kong: 2.6% | | | |
246,600 | | @ | | AIA Group Ltd. | | 693,214 | |
47,605 | | | | Bank of East Asia Ltd. | | 199,206 | |
103,410 | | | | BOC Hong Kong Holdings Ltd. | | 351,648 | |
42,053 | | | | Cathay Pacific Airways Ltd. | | 116,004 | |
47,383 | | | | Cheung Kong Holdings Ltd. | | 730,242 | |
22,236 | | | | Cheung Kong Infrastructure Holdings Ltd. | | 101,804 | |
64,603 | | | | CLP Holdings Ltd. | | 524,559 | |
33,479 | | | | Esprit Holdings Ltd. | | 159,256 | |
24,617 | | | | Hang Lung Group Ltd. | | 161,738 | |
58,682 | | | | Hang Lung Properties Ltd. | | 274,281 | |
21,273 | | | | Hang Seng Bank Ltd. | | 349,523 | |
35,656 | | | | Henderson Land Development Co., Ltd. | | 242,875 | |
136,647 | | | | Hong Kong & China Gas | | 321,984 | |
33,454 | | | | Hong Kong Exchanges and Clearing Ltd. | | 758,492 | |
46,302 | | | | HongKong Electric Holdings | | 291,889 | |
17,000 | | | | Hopewell Holdings | | 53,347 | |
74,615 | | | | Hutchison Whampoa Ltd. | | 767,587 | |
28,318 | | | | Kerry Properties Ltd. | | 147,432 | |
74,361 | | | | Li & Fung Ltd. | | 431,445 | |
59,658 | | | | MTR Corp. | | 217,097 | |
85,235 | | | | New World Development Ltd. | | 159,918 | |
116,727 | | | | Noble Group Ltd. | | 197,296 | |
60,063 | | | | NWS Holdings Ltd. | | 91,157 | |
51,331 | | | | Shangri-La Asia Ltd. | | 139,250 | |
77,858 | | | | Sino Land Co. | | 145,480 | |
63,292 | | | | SJM Holdings Ltd. | | 100,403 | |
47,915 | | | | Sun Hung Kai Properties Ltd. | | 794,987 | |
22,579 | | | | Swire Pacific Ltd. | | 370,974 | |
41,264 | | | | Wharf Holdings Ltd. | | 317,256 | |
30,882 | | | | Wheelock & Co., Ltd. | | 124,875 | |
8,318 | | | | Wing Hang Bank Ltd. | | 114,978 | |
32,643 | | | | Yue Yuen Industrial Holdings | | 117,424 | |
| | | | | | 9,567,621 | |
| | | | Ireland: 0.2% | | | |
207,339 | | @ | | Bank of Ireland - London Exchange | | 108,237 | |
461 | | | | CRH PLC | | 9,618 | |
21,283 | | | | CRH PLC | | 441,473 | |
16,472 | | @ | | Elan Corp. PLC | | 92,872 | |
13,662 | | @ | | James Hardie Industries SE | | 94,735 | |
3,061 | | | | Kerry Group PLC | | 102,138 | |
343 | | | | Kerry Group PLC | | 11,422 | |
| | | | | | 860,495 | |
| | | | Israel: 0.8% | | | |
33,792 | | @ | | Bank Hapoalim BM | | 175,931 | |
31,884 | | | | Bank Leumi Le-Israel BM | | 163,433 | |
71,596 | | | | Bezeq Israeli Telecommunication Corp., Ltd. | | 217,968 | |
243 | | | | Delek Group Ltd. | | 62,654 | |
1,670 | | | | Elbit Systems Ltd. | | 89,124 | |
14,921 | | | | Israel Chemicals Ltd. | | 255,548 | |
82 | | @ | | Israel Corp., Ltd. | | 99,489 | |
1,968 | | @ | | NICE Systems Ltd. | | 68,562 | |
31,794 | | | | Teva Phaemaceutical Industries Ltd. | | 1,654,827 | |
| | | | | | 2,787,536 | |
| | | | Italy: 2.5% | | | |
9,954 | | | | Altantia S.p.A. | | 203,272 | |
40,566 | | | | Assicurazioni Generali S.p.A. | | 772,362 | |
23,056 | | L | | Banco Popolare Scarl | | 104,653 | |
46,700 | | @ | | Enel Green Power SpA | | 98,663 | |
221,115 | | | | Enel S.p.A. | | 1,108,018 | |
84,115 | | | | ENI S.p.A. | | 1,843,583 | |
24,383 | | | | Fiat S.p.A | | 504,268 | |
14,402 | | | | Finmeccanica S.p.A. | | 163,855 | |
252,040 | | | | Intesa Sanpaolo S.p.A. | | 685,206 | |
4,593 | | | | Luxottica Group S.p.A. | | 140,407 | |
20,532 | | | | Mediaset S.p.A. | | 124,346 | |
20,729 | | | | Mediobanca S.p.A. | | 184,896 | |
46,086 | | | | Parmalat S.p.A | | 126,417 | |
13,587 | | | | Pirelli & C S.p.A. | | 109,950 | |
7,692 | | | | Prysmian S.p.A. | | 131,092 | |
8,055 | | | | Saipem S.p.A. | | 397,701 | |
51,032 | | | | Snam Rete Gas S.p.A. | | 254,127 | |
339,008 | | | | Telecom Italia S.p.A. | | 439,848 | |
299,779 | | | | Telecom Italia S.p.A. RNC | | 326,277 | |
45,570 | | L | | Terna S.p.A | | 192,598 | |
435,349 | | | | UniCredito Italiano S.p.A. | | 902,551 | |
17,983 | | | | Unione di Banche Italiane SCPA | | 157,787 | |
| | | | | | 8,971,877 | |
| | | | Japan: 21.2% | | | |
2,300 | | | | ABC-Mart, Inc. | | 81,922 | |
5,300 | | | | Advantest Corp. | | 119,160 | |
21,500 | | | | Aeon Co., Ltd. | | 268,283 | |
6,500 | | | | Aisin Seiki Co., Ltd. | | 229,037 | |
20,000 | | | | Ajinomoto Co., Inc. | | 207,761 | |
2,100 | | | | Alfresa Holdings Corp. | | 93,060 | |
28,000 | | | | All Nippon Airways Co., Ltd. | | 104,201 | |
30,000 | | | | Aozora Bank Ltd. | | 61,878 | |
11,100 | | | | Asahi Breweries Ltd. | | 214,237 | |
31,000 | | L | | Asahi Glass Co., Ltd. | | 360,525 | |
37,000 | | | | Asahi Kasei Corp. | | 240,672 | |
15,200 | | | | Astellas Pharma, Inc. | | 577,683 | |
17,000 | | | | Bank of Kyoto Ltd. | | 160,692 | |
40,000 | | | | Bank of Yokohama Ltd. | | 206,263 | |
3,100 | | | | Benesse Corp. | | 142,631 | |
19,624 | | | | Bridgestone Corp. | | 377,742 | |
10,400 | | | | Brother Industries Ltd. | | 153,493 | |
4,800 | | | | Canon Sales Co., Inc. | | 68,182 | |
36,800 | | L | | Canon, Inc. | | 1,890,242 | |
14,000 | | | | Casio Computer Co., Ltd. | | 112,368 | |
55 | | | | Central Japan Railway Co. | | 459,768 | |
24,000 | | | | Chiba Bank Ltd. | | 155,621 | |
8,000 | | | | Chiyoda Corp. | | 79,236 | |
21,800 | | | | Chubu Electric Power Co., Inc. | | 535,153 | |
8,700 | | | | Chugai Pharmaceutical Co., Ltd. | | 159,301 | |
10,000 | | | | Chugoku Bank Ltd. | | 120,668 | |
8,444 | | | | Chugoku Electric Power Co., Inc. | | 171,382 | |
43,000 | | | | Chuo Mitsui Trust Holdings, Inc. | | 177,630 | |
7,300 | | | | Credit Saison Co., Ltd. | | 119,134 | |
18,000 | | | | Dai Nippon Printing Co., Ltd. | | 244,139 | |
15,000 | | | | Daido Steel Co., Ltd. | | 87,823 | |
244 | | | | Dai-ichi Life Insurance Co., Ltd. | | 394,883 | |
22,200 | | | | Daiichi Sankyo Co., Ltd. | | 484,870 | |
7,500 | | | | Daikin Industries Ltd. | | 264,942 | |
3,073 | | | | Daito Trust Construction Co., Ltd. | | 210,016 | |
14,000 | | | | Daiwa House Industry Co., Ltd. | | 171,495 | |
57,000 | | | | Daiwa Securities Group, Inc. | | 292,388 | |
3,500 | | | | Dena Co., Ltd. | | 125,394 | |
19,000 | | | | Denki Kagaku Kogyo K K | | 89,959 | |
15,700 | | | | Denso Corp. | | 539,748 | |
5,700 | | | | Dentsu, Inc. | | 176,114 | |
11,402 | | | | East Japan Railway Co. | | 739,867 | |
8,500 | | L | | Eisai Co., Ltd. | | 307,082 | |
3,100 | | | | Electric Power Development Co. | | 97,085 | |
8,600 | | @, L | | Elpida Memory, Inc. | | 99,467 | |
3,700 | | | | FamilyMart Co., Ltd. | | 139,204 | |
6,500 | | | | Fanuc Ltd. | | 993,566 | |
1,800 | | | | Fast Retailing Co., Ltd. | | 285,519 | |
21,000 | | | | Fuji Heavy Industries Ltd. | | 161,948 | |
15,400 | | | | Fuji Photo Film Co., Ltd. | | 554,688 | |
57,000 | | | | Fujitsu Ltd. | | 394,916 | |
36,000 | | | | Fukuoka Financial Group, Inc. | | 155,827 | |
26,000 | | | | Furukawa Electric Co., Ltd. | | 116,355 | |
5,200 | | | | Gree, Inc. | | 65,951 | |
16,000 | | | | Gunma Bank Ltd. | | 87,580 | |
23,000 | | | | Hachijuni Bank Ltd. | | 128,150 | |
32,000 | | | | Hankyu Hanshin Holdings, Inc. | | 148,309 | |
900 | | | | Hirose Electric Co., Ltd. | | 101,135 | |
31,000 | | | | Hiroshima Bank Ltd. | | 130,376 | |
5,800 | | L | | Hitachi Construction Machinery Co., Ltd. | | 138,431 | |
3,600 | | | | Hitachi High-Technologies Corp. | | 83,883 | |
150,000 | | | | Hitachi Ltd. | | 796,375 | |
4,100 | | | | Hokkaido Electric Power Co., Inc. | | 83,725 | |
5,700 | | | | Hokuriku Electric Power Co. | | 139,960 | |
52,800 | | | | Honda Motor Co., Ltd. | | 2,083,952 | |
12,600 | | | | Hoya Corp. | | 304,658 | |
4,800 | | | | Ibiden Co., Ltd. | | 150,568 | |
79 | | | | Inpex Holdings, Inc. | | 461,312 | |
11,200 | | | | Isetan Mitsukoshi Holdings Ltd. | | 129,807 | |
44,000 | | | | Ishikawajima - Harima Heavy Industries Co., Ltd. | | 97,687 | |
38,000 | | | | Isuzu Motors Ltd. | | 171,711 | |
48,200 | | | | Itochu Corp. | | 485,651 | |
14,401 | | | | Iyo Bank Ltd. | | 114,893 | |
18,000 | | | | J Front Retailing Co., Ltd. | | 98,091 | |
15,000 | | | | Japan Steel Works Ltd. | | 156,227 | |
160 | | | | Japan Tobacco, Inc. | | 590,811 | |
16,000 | | | | JFE Holdings, Inc. | | 554,757 | |
8,000 | | | | JGC Corp. | | 173,389 | |
37,000 | | | | Joyo Bank Ltd. | | 162,183 | |
8,900 | | | | JS Group Corp. | | 195,228 | |
7,300 | | | | JSR Corp. | | 135,496 | |
8,500 | | | | JTEKT Corp. | | 99,735 | |
83 | | | | Jupiter Telecommunications Co. | | 87,074 | |
76,300 | | | | JX Holdings, Inc. | | 516,325 | |
32,000 | | | | Kajima Corp. | | 84,850 | |
17,000 | | | | Kamigumi Co., Ltd. | | 142,279 | |
27,000 | | | | Kansai Electric Power Co., Inc. | | 665,788 | |
17,917 | | | | Kao Corp. | | 481,521 | |
51,000 | | | | Kawasaki Heavy Industries Ltd. | | 170,923 | |
31,000 | | | | Kawasaki Kisen Kaisha Ltd. | | 134,966 | |
93 | | | | KDDI Corp. | | 536,307 | |
15,000 | | | | Keihin Electric Express Railway Co., Ltd. | | 132,302 | |
17,000 | | | | Keio Corp. | | 115,791 | |
15,000 | | | | Keisei Electric Railway Co., Ltd. | | 99,842 | |
1,370 | | | | Keyence Corp. | | 395,293 | |
48,000 | | L | | Kintetsu Corp. | | 149,986 | |
26,000 | | @ | | Kirin Brewery Co., Ltd. | | 363,637 | |
91,000 | | | | Kobe Steel Ltd. | | 229,933 | |
31,400 | | | | Komatsu Ltd. | | 945,042 | |
10,500 | | | | Konica Minolta Holdings, Inc. | | 108,521 | |
41,000 | | | | Kubota Corp. | | 386,266 | |
8,700 | | | | Kuraray Co., Ltd. | | 124,192 | |
4,500 | | | | Kurita Water Industries Ltd. | | 141,264 | |
5,400 | | | | Kyocera Corp. | | 548,626 | |
15,200 | | | | Kyushu Electric Power Co., Inc. | | 340,297 | |
3,500 | | | | Lawson, Inc. | | 172,784 | |
3,100 | | | | Makita Corp. | | 126,145 | |
55,000 | | | | Marubeni Corp. | | 385,043 | |
56,000 | | | | Mazda Motor Corp. | | 159,737 | |
3,148 | | | | McDonald’s Holdings Co. Japan Ltd. | | 78,877 | |
2,500 | | | | MEIJI Holdings Co., Ltd. | | 112,816 | |
39,500 | | | | Mitsubishi Chemical Holdings Corp. | | 266,817 | |
44,000 | | | | Mitsubishi Corp. | | 1,185,877 | |
66,000 | | | | Mitsubishi Electric Corp. | | 689,652 | |
42,000 | | | | Mitsubishi Estate Co., Ltd. | | 776,211 | |
19,000 | | | | Mitsubishi Gas Chemical Co., Inc. | | 134,387 | |
89,000 | | | | Mitsubishi Heavy Industries Ltd. | | 333,171 | |
53,000 | | | | Mitsubishi Materials Corp. | | 168,423 | |
116,255 | | @ | | Mitsubishi Motors Corp. | | 168,443 | |
8,000 | | | | Mitsubishi Tanabe Pharma Corp. | | 134,859 | |
423,021 | | | | Mitsubishi UFJ Financial Group, Inc. | | 2,280,980 | |
56,807 | | | | Mitsui & Co., Ltd. | | 934,697 | |
43,000 | | | | Mitsui Chemicals, Inc. | | 153,304 | |
30,000 | | | | Mitsui Engineering & Shipbuilding Co., Ltd. | | 79,102 | |
27,919 | | | | Mitsui Fudosan Co., Ltd. | | 554,851 | |
28,000 | | | | Mitsui Mining & Smelting Co., Ltd. | | 92,089 | |
38,000 | | | | Mitsui OSK Lines Ltd. | | 257,493 | |
17,669 | | | | Mitsui Sumitomo Insurance Group Holdings, Inc. | | 441,066 | |
4,200 | | | | Mitsumi Electric Co., Ltd. | | 76,755 | |
673,692 | | | | Mizuho Financial Group, Inc. | | 1,263,762 | |
30,000 | | | | Mizuho Securities Co., Ltd. | | 85,546 | |
7,000 | | | | Murata Manufacturing Co., Ltd. | | 488,639 | |
6,800 | | | | Nabtesco Corp. | | 144,582 | |
82,000 | | | | NEC Corp. | | 245,344 | |
8,000 | | | | NGK Insulators Ltd. | | 129,952 | |
3,300 | | | | Nidec Corp. | | 332,753 | |
12,400 | | | | Nikon Corp. | | 250,316 | |
3,200 | | | | Nintendo Co., Ltd. | | 934,246 | |
12,000 | | | | Nippon Electric Glass Co., Ltd. | | 172,247 | |
41,000 | | | | Nippon Express Co., Ltd. | | 184,126 | |
7,000 | | | | Nippon Meat Packers, Inc. | | 91,211 | |
5,600 | | | | Nippon Paper Group, Inc. | | 146,590 | |
42,000 | | | | Nippon Sheet Glass Co., Ltd. | | 112,654 | |
181,000 | | | | Nippon Steel Corp. | | 648,425 | |
17,400 | | | | Nippon Telegraph & Telephone Corp. | | 792,358 | |
54,000 | | | | Nippon Yusen KK | | 237,739 | |
80,700 | | | | Nissan Motor Co., Ltd. | | 763,410 | |
7,000 | | | | Nisshin Seifun Group, Inc. | | 88,612 | |
1,550 | | | | Nitori Co., Ltd. | | 135,446 | |
5,900 | | | | Nitto Denko Corp. | | 276,715 | |
47,306 | | @ | | NKSJ Holdings, Inc. | | 347,024 | |
4,700 | | | | NOK Corp. | | 97,423 | |
117,000 | | | | Nomura Holdings, Inc. | | 742,374 | |
14,000 | | | | NSK Ltd. | | 125,907 | |
51 | | | | NTT Data Corp. | | 175,879 | |
523 | | | | NTT DoCoMo, Inc. | | 910,860 | |
16,000 | | | | Obayashi Corp. | | 73,451 | |
480 | | | | Obic Co., Ltd. | | 98,577 | |
19,000 | | | | Odakyu Electric Railway Co., Ltd. | | 176,603 | |
33,000 | | | | OJI Paper Co., Ltd. | | 159,258 | |
8,400 | | | | Olympus Corp. | | 252,925 | |
6,300 | | | | Omron Corp. | | 166,028 | |
3,900 | | | | Ono Pharmaceutical Co., Ltd. | | 181,864 | |
1,900 | | | | Oracle Corp. Japan | | 93,138 | |
1,400 | | | | Oriental Land Co., Ltd. | | 129,489 | |
3,190 | | | | ORIX Corp. | | 312,541 | |
81,000 | | | | Osaka Gas Co., Ltd. | | 313,991 | |
67,300 | | | | Panasonic Corp. | | 950,195 | |
247 | | | | Rakuten, Inc. | | 206,702 | |
19,800 | | L | | Resona Holdings, Inc. | | 118,022 | |
22,000 | | | | Ricoh Co., Ltd. | | 320,782 | |
2,300 | | | | Rinnai Corp. | | 140,211 | |
2,500 | | | | Rohm Co., Ltd. | | 162,582 | |
2,200 | | | | Sankyo Co., Ltd. | | 123,955 | |
6,300 | | | | Secom Co., Ltd. | | 297,680 | |
7,500 | | | | Sega Sammy Holdings, Inc. | | 142,242 | |
5,200 | | | | Seiko Epson Corp. | | 94,403 | |
15,000 | | | | Sekisui Chemical Co., Ltd. | | 107,315 | |
19,000 | | | | Sekisui House Ltd. | | 191,454 | |
25,600 | | | | Seven & I Holdings Co., Ltd. | | 681,066 | |
33,000 | | | | Sharp Corp. | | 338,642 | |
6,000 | | | | Shikoku Electric Power Co. | | 176,239 | |
1,200 | | | | Shimamura Co., Ltd. | | 111,071 | |
1,800 | | | | Shimano, Inc. | | 91,250 | |
14,586 | | | | Shin-Etsu Chemical Co., Ltd. | | 786,135 | |
12,400 | | | | Shionogi & Co., Ltd. | | 244,366 | |
11,400 | | | | Shiseido Co., Ltd. | | 248,250 | |
21,000 | | | | Shizuoka Bank Ltd. | | 193,093 | |
58,000 | | L | | Showa Denko KK | | 130,119 | |
1,700 | | | | SMC Corp. | | 290,099 | |
26,800 | | | | Softbank Corp. | | 924,076 | |
32,800 | | | | Sony Corp. | | 1,173,081 | |
24 | | | | Sony Financial Holdings, Inc. | | 96,656 | |
6,200 | | | | Sumco Corp. | | 88,284 | |
51,000 | | | | Sumitomo Chemical Co., Ltd. | | 250,359 | |
37,500 | | L | | Sumitomo Corp. | | 527,898 | |
25,700 | | | | Sumitomo Electric Industries Ltd. | | 355,153 | |
17,000 | | | | Sumitomo Heavy Industries | | 108,738 | |
130,000 | | | | Sumitomo Metal Industries Ltd. | | 318,696 | |
20,000 | | | | Sumitomo Metal Mining Co., Ltd. | | 348,363 | |
44,700 | | | | Sumitomo Mitsui Financial Group, Inc. | | 1,582,699 | |
13,000 | | | | Sumitomo Realty & Development Co., Ltd. | | 309,265 | |
12,100 | | | | Sumitomo Rubber Industries, Inc. | | 125,858 | |
43,000 | | | | Sumitomo Trust & Banking Co., Ltd. | | 269,380 | |
4,300 | | | | Suzuken Co., Ltd. | | 131,109 | |
12,500 | | | | Suzuki Motor Corp. | | 306,860 | |
8,900 | | | | T&D Holdings, Inc. | | 224,510 | |
25,400 | | | | Takeda Pharmaceutical Co., Ltd. | | 1,247,796 | |
3,800 | | | | TDK Corp. | | 263,098 | |
39,000 | | | | Teijin Ltd. | | 166,042 | |
7,100 | | | | Terumo Corp. | | 398,220 | |
5,200 | | | | THK Co., Ltd. | | 118,939 | |
22,000 | | L | | Tobu Railway Co., Ltd. | | 123,382 | |
7,800 | | | | Toho Co., Ltd. | | 125,065 | |
13,700 | | L | | Tohoku Electric Power Co., Inc. | | 305,021 | |
23,850 | | | | Tokio Marine Holdings, Inc. | | 708,523 | |
16,000 | | | | Tokuyama Corp. | | 82,468 | |
43,000 | | | | Tokyo Electric Power Co., Inc. | | 1,048,450 | |
6,400 | | | | Tokyo Electron Ltd. | | 402,952 | |
73,079 | | | | Tokyo Gas Co., Ltd. | | 323,613 | |
39,000 | | | | Tokyu Corp. | | 178,407 | |
27,000 | | | | Tokyu Land Corp. | | 135,112 | |
14,000 | | L | | TonenGeneral Sekiyu KK | | 152,757 | |
18,000 | | | | Toppan Printing Co., Ltd. | | 163,806 | |
48,000 | | | | Toray Industries, Inc. | | 286,153 | |
137,000 | | | | Toshiba Corp. | | 743,538 | |
5,400 | | | | Toyo Seikan Kaisha Ltd. | | 102,299 | |
4,000 | | | | Toyo Suisan Kaisha Ltd. | | 88,811 | |
4,100 | | | | Toyoda Gosei Co., Ltd. | | 95,926 | |
4,000 | | | | Toyota Boshoku Corp. | | 70,326 | |
5,300 | | | | Toyota Industries Corp. | | 163,978 | |
91,489 | | | | Toyota Motor Corp. | | 3,601,780 | |
8,500 | | | | Toyota Tsusho Corp. | | 148,847 | |
3,500 | | | | Trend Micro, Inc. | | 114,982 | |
3,600 | | | | Tsumura & Co. | | 116,310 | |
43,000 | | | | Ube Industries Ltd. | | 128,760 | |
3,600 | | | | Uni-Charm Corp. | | 142,954 | |
10,100 | | | | UNY Co., Ltd. | | 101,716 | |
63 | | | | West Japan Railway Co. | | 235,148 | |
545 | | | | Yahoo! Japan Corp. | | 210,657 | |
2,800 | | | | Yakult Honsha Co., Ltd. | | 80,502 | |
2,430 | | | | Yamada Denki Co., Ltd. | | 165,316 | |
8,600 | | @ | | Yamaha Motor Co., Ltd. | | 139,559 | |
16,800 | | | | Yamato Holdings Co., Ltd. | | 238,319 | |
15,000 | | | | Yaskawa Electric Corp. | | 141,239 | |
13,300 | | | | Yokogawa Electric Corp. | | 105,317 | |
| | | | | | 77,844,806 | |
| | | | Kazakhstan: 0.0% | | | |
8,183 | | | | Eurasian Natural Resources Corp. | | 134,564 | |
| | | | | | 134,564 | |
| | | | Luxembourg: 0.5% | | | |
26,842 | | | | ArcelorMittal | | 1,021,518 | |
9,363 | | | | SES S.A. | | 222,957 | |
15,942 | | | | Tenaris S.A. | | 390,972 | |
| | | | | | 1,635,447 | |
| | | | Macau: 0.1% | | | |
84,800 | | @ | | Sands China Ltd. | | 186,418 | |
61,600 | | @ | | Wynn Macau Ltd. | | 137,869 | |
| | | | | | 324,287 | |
| | | | Malaysia: 0.1% | | | |
208,600 | | @ | | Genting International PLC | | 356,854 | |
| | | | | | 356,854 | |
| | | | Mauritius: 0.0% | | | |
11,227 | | @ | | Essar Energy PLC | | 101,902 | |
| | | | | | 101,902 | |
| | | | Mexico: 0.0% | | | |
6,436 | | | | Fresnillo PLC | | 168,413 | |
| | | | | | 168,413 | |
| | | | Netherlands: 4.5% | | | |
51,958 | | @ | | Aegon NV | | 318,072 | |
7,572 | | | | Akzo Nobel NV | | 471,110 | |
14,280 | | | | ASML Holding NV | | 547,669 | |
5,702 | | | | Delta Lloyd NV | | 114,993 | |
13,564 | | @ | | European Aeronautic Defence and Space Co. NV | | 316,517 | |
1,897 | | | | Fugro NV | | 156,191 | |
3,270 | | | | Heineken Holding NV | | 142,211 | |
7,678 | | | | Heineken NV | | 376,581 | |
125,959 | | @, ** | | ING Groep NV | | 1,228,824 | |
38,913 | | | | Koninklijke Ahold NV | | 514,050 | |
2,420 | | | | Koninklijke Boskalis Westminster NV | | 115,547 | |
4,805 | | | | Koninklijke DSM NV | | 273,900 | |
51,126 | | | | Koninklijke KPN NV | | 746,742 | |
30,872 | | | | Koninklijke Philips Electronics NV | | 946,453 | |
2,135 | | | | Koninklijke Vopak NV | | 100,937 | |
6,462 | | @ | | Qiagen NV | | 126,829 | |
3,243 | | @ | | Randstad Holdings NV | | 171,390 | |
21,594 | | | | Reed Elsevier NV | | 267,341 | |
119,912 | | | | Royal Dutch Shell PLC - Class A | | 4,003,668 | |
92,545 | | | | Royal Dutch Shell PLC - Class B | | 3,064,584 | |
5,160 | | | | SBM Offshore NV | | 115,773 | |
10,895 | | | | TNT NV | | 288,127 | |
57,258 | | | | Unilever NV | | 1,786,312 | |
9,762 | | | | Wolters Kluwer NV | | 214,089 | |
| | | | | | 16,407,910 | |
| | | | New Zealand: 0.1% | | | |
19,254 | | | | Fletcher Building Ltd. | | 114,773 | |
81,598 | | | | Telecom Corp. of New Zealand Ltd. | | 137,170 | |
| | | | | | 251,943 | |
| | | | Norway: 0.7% | | | |
4,470 | | | | Aker Kvaerner ASA | | 76,261 | |
31,244 | | | | DnB NOR ASA | | 439,542 | |
30,066 | | | | Norsk Hydro ASA | | 221,459 | |
21,228 | | | | Orkla ASA | | 207,067 | |
25,891 | | @ | | Renewable Energy Corp. A/S | | 79,515 | |
37,323 | | | | Statoil ASA | | 888,961 | |
26,235 | | | | Telenor ASA | | 427,508 | |
5,646 | | | | Yara International ASA | | 328,647 | |
| | | | | | 2,668,960 | |
| | | | Portugal: 0.2% | | | |
31,604 | | | | Banco Espirito Santo S.A. | | 121,539 | |
14,194 | | | | Cimpor Cimentos de Portugal SG | | 96,176 | |
52,595 | | | | Energias de Portugal S.A. | | 175,121 | |
6,397 | | | | Galp Energia SGPS S.A. | | 122,682 | |
9,232 | | | | Jeronimo Martins | | 140,764 | |
17,523 | | | | Portugal Telecom SGPS S.A. | | 200,026 | |
| | | | | | 856,308 | |
| | | | Singapore: 1.5% | | | |
76,000 | | | | CapitaLand Ltd. | | 219,831 | |
78,000 | | | | CapitaMalls Asia Ltd. | | 117,954 | |
18,000 | | | | City Developments Ltd. | | 176,413 | |
71,000 | | | | ComfortDelgro Corp., Ltd. | | 85,743 | |
58,000 | | | | DBS Group Holdings Ltd. | | 647,370 | |
29,000 | | | | Fraser and Neave Ltd. | | 144,771 | |
53,700 | | @ | | Global Logistic Properties Ltd. | | 90,382 | |
4,000 | | | | Jardine Cycle & Carriage Ltd. | | 114,054 | |
36,000 | | | | Keppel Corp., Ltd. | | 317,649 | |
25,000 | | | | Keppel Land Ltd. | | 93,608 | |
48,000 | | | | Olam International Ltd. | | 117,558 | |
74,608 | | | | Oversea-Chinese Banking Corp. | | 574,404 | |
50,000 | | | | SembCorp Industries Ltd. | | 200,152 | |
37,000 | | | | SembCorp Marine Ltd. | | 154,786 | |
15,000 | | | | Singapore Airlines Ltd. | | 178,987 | |
31,000 | | | | Singapore Exchange Ltd. | | 203,307 | |
57,000 | | L | | Singapore Press Holdings Ltd. | | 176,960 | |
78,000 | | | | Singapore Technologies Engineering Ltd. | | 207,842 | |
258,000 | | | | Singapore Telecommunications Ltd. | | 613,096 | |
40,000 | | | | United Overseas Bank Ltd. | | 567,639 | |
24,000 | | | | United Overseas Land Ltd. | | 88,926 | |
61,000 | | | | Wilmar International Ltd. | | 268,168 | |
| | | | | | 5,359,600 | |
| | | | Spain: 3.2% | | | |
10,319 | | | | Abertis Infraestructuras S.A. | | 186,294 | |
1,530 | | | | Acciona S.A. | | 108,602 | |
4,489 | | L | | ACS Actividades de Construccion y Servicios S.A. | | 210,404 | |
5,351 | | @ | | Amadeus IT Holding S.A. | | 112,453 | |
140,329 | | | | Banco Bilbao Vizcaya Argentaria S.A. | | 1,430,132 | |
34,134 | | L | | Banco De Sabadell S.A. | | 134,560 | |
15,299 | | L | | Banco de Valencia S.A. | | 67,245 | |
26,314 | | L | | Banco Popular Espanol S.A. | | 135,684 | |
272,958 | | | | Banco Santander Central Hispano S.A. | | 2,908,593 | |
25,277 | | L | | Criteria Caixacorp S.A. | | 135,004 | |
15,353 | | @ | | EDP Renovaveis S.A. | | 89,030 | |
5,144 | | L | | Enagas | | 102,882 | |
17,924 | | | | Ferrovial SA | | 178,998 | |
7,946 | | | | Gas Natural SDG S.A. | | 122,408 | |
32,494 | | | | Iberdrola Renovables | | 115,483 | |
126,456 | | | | Iberdrola S.A. | | 980,491 | |
26,726 | | @ | | Iberia Lineas Aereas de Espana | | 114,680 | |
7,532 | | | | Inditex S.A. | | 563,797 | |
3,391 | | | | Red Electrica de Espana | | 159,857 | |
25,175 | | | | Repsol YPF S.A. | | 704,991 | |
136,375 | | @ | | Telefonica S.A. | | 3,113,447 | |
| | | | | | 11,675,035 | |
| | | | Sweden: 3.2% | | | |
11,280 | | | | Alfa Laval AB | | 238,155 | |
7,594 | | | | Assa Abloy AB | | 214,217 | |
21,266 | | | | Atlas Copco AB - Class A | | 536,828 | |
16,874 | | | | Atlas Copco AB - Class B | | 381,982 | |
8,834 | | | | Boliden AB | | 179,983 | |
1,676 | | @ | | CDON Group AB | | 7,750 | |
6,933 | | | | Electrolux AB | | 196,743 | |
8,633 | | | | Getinge AB | | 180,729 | |
33,712 | | | | Hennes & Mauritz AB | | 1,122,780 | |
8,062 | | | | Hexagon AB | | 173,149 | |
3,567 | | | | Holmen AB | | 117,423 | |
11,903 | | | | Husqvarna AB - B Shares | | 99,460 | |
11,975 | | | | Investor AB | | 256,244 | |
6,566 | | | | Kinnevik Investment AB | | 133,718 | |
2,514 | | | | Millicom International Cellular S.A. | | 241,308 | |
1,676 | | | | Modern Times Group AB | | 111,038 | |
108,334 | | | | Nordea Bank AB | | 1,177,899 | |
4,712 | | L | | Ratos AB | | 174,214 | |
34,394 | | | | Sandvik AB | | 671,094 | |
10,465 | | | | Scania AB - B Shares | | 240,895 | |
10,716 | | | | Securitas AB | | 125,484 | |
41,527 | | | | Skandinaviska Enskilda Banken AB | | 346,718 | |
13,783 | | | | Skanska AB | | 273,244 | |
11,057 | | | | SKF AB - B Shares | | 315,530 | |
7,550 | | | | SSAB Svenskt Staal AB - Class A | | 127,249 | |
16,265 | | | | Svenska Cellulosa AB - B Shares | | 256,806 | |
16,754 | | | | Svenska Handelsbanken AB | | 535,550 | |
25,308 | | @ | | Swedbank AB | | 353,890 | |
6,337 | | | | Swedish Match AB | | 183,635 | |
10,075 | | | | Tele2 AB - B Shares | | 209,032 | |
98,119 | | | | Telefonaktiebolaget LM Ericsson | | 1,137,083 | |
76,031 | | | | TeliaSonera AB | | 603,584 | |
35,224 | | @ | | Volvo AB - B Shares | | 620,499 | |
| | | | | | 11,543,913 | |
| | | | Switzerland: 8.3% | | | |
74,359 | | @ | | ABB Ltd. | | 1,660,281 | |
2,684 | | @ | | Actelion Ltd. - Reg | | 146,974 | |
3,429 | | | | Adecco S.A. | | 224,872 | |
2,302 | | @ | | Aryzta AG | | 106,335 | |
1,548 | | | | Baloise Holding AG | | 150,582 | |
17,832 | | | | Compagnie Financiere Richemont S.A. | | 1,048,590 | |
36,710 | | | | Credit Suisse Group | | 1,478,493 | |
1,330 | | | | Geberit AG - Reg | | 307,526 | |
263 | | | | Givaudan | | 283,910 | |
7,868 | | | | Holcim Ltd. | | 595,391 | |
6,473 | | | | Julius Baer Group Ltd. | | 303,086 | |
1,768 | | | | Kuehne & Nagel International AG | | 245,980 | |
19 | | | | Lindt & Spruengli AG | | 57,356 | |
4 | | | | Lindt & Spruengli AG - REG | | 128,733 | |
7,282 | | @, L | | Logitech International S.A. | | 138,467 | |
1,400 | | | | Lonza Group AG | | 112,217 | |
112,281 | | | | Nestle S.A. | | 6,577,833 | |
69,427 | | | | Novartis AG | | 4,086,863 | |
23,158 | | | | Roche Holding AG - Genusschein | | 3,394,797 | |
1,572 | | | | Schindler Holding AG | | 185,961 | |
170 | | | | SGS S.A. | | 285,323 | |
75 | | | | Sika AG | | 164,643 | |
2,005 | | | | Sonova Holding AG - Reg | | 258,457 | |
20,314 | | | | STMicroelectronics NV | | 211,254 | |
1,075 | | | | Swatch Group AG - BR | | 479,311 | |
2,424 | | | | Swatch Group AG - Reg | | 195,589 | |
803 | | @ | | Swiss Life Holding | | 115,819 | |
11,957 | | | | Swiss Reinsurance | | 641,455 | |
685 | | | | Swisscom AG | | 301,117 | |
2,986 | | | | Syngenta AG | | 875,298 | |
1,531 | | | | Synthes, Inc. | | 206,650 | |
9,716 | | @ | | Transocean Ltd. | | 669,323 | |
117,832 | | @ | | UBS AG - Reg | | 1,934,644 | |
66,441 | | | | Xstrata PLC | | 1,574,396 | |
5,076 | | | | Zurich Financial Services AG | | 1,314,515 | |
| | | | | | 30,462,041 | |
| | | | United Kingdom: 18.1% | | | |
35,029 | | | | 3i Group PLC | | 179,955 | |
5,871 | | | | Admiral Group PLC | | 138,863 | |
8,841 | | | | Aggreko PLC | | 204,576 | |
9,649 | | | | Amec PLC | | 173,527 | |
42,158 | | | | Anglo American PLC | | 2,205,392 | |
12,382 | | | | Antofagasta PLC | | 313,302 | |
42,079 | | | | ARM Holdings PLC | | 287,198 | |
9,521 | | | | Associated British Foods PLC | | 175,771 | |
46,300 | | | | AstraZeneca PLC | | 2,110,093 | |
7,311 | | @ | | Autonomy Corp. PLC | | 172,000 | |
88,827 | | | | Aviva PLC | | 546,006 | |
15,204 | | | | Babcock International Group | | 135,490 | |
117,389 | | | | BAE Systems PLC | | 604,645 | |
28,408 | | | | Balfour Beatty PLC | | 138,910 | |
367,981 | | | | Barclays PLC | | 1,520,822 | |
107,918 | | | | BG Group PLC | | 2,189,139 | |
69,966 | | | | BHP Billiton PLC | | 2,814,849 | |
600,381 | | | | BP PLC | | 4,425,360 | |
24,999 | | @ | | British Airways PLC | | 106,558 | |
63,139 | | | | British American Tobacco PLC | | 2,428,703 | |
34,259 | | L | | British Sky Broadcasting PLC | | 393,119 | |
264,175 | | | | BT Group PLC | | 750,311 | |
11,115 | | | | Bunzl PLC | | 124,803 | |
14,788 | | | | Burberry Group PLC | | 259,898 | |
74,304 | | | | Cable & Wireless Worldwide PLC | | 76,111 | |
40,812 | | @ | | Cairn Energy PLC | | 267,936 | |
19,326 | | | | Capita Group PLC | | 210,180 | |
4,699 | | | | Carnival PLC | | 218,562 | |
172,574 | | | | Centrica PLC | | 894,157 | |
22,188 | | | | Cobham PLC | | 70,551 | |
62,885 | | | | Compass Group PLC | | 570,739 | |
82,863 | | | | Diageo PLC | | 1,535,286 | |
30,623 | | | | Experian Group Ltd. | | 381,415 | |
14,074 | | | | Firstgroup PLC | | 87,568 | |
170,727 | | | | GlaxoSmithKline PLC | | 3,310,876 | |
41,124 | | | | Group 4 Securicor PLC | | 163,138 | |
25,537 | | | | Home Retail Group | | 75,463 | |
572,603 | | | | HSBC Holdings PLC | | 5,852,067 | |
13,652 | | | | ICAP PLC | | 114,152 | |
33,158 | | | | Imperial Tobacco Group PLC | | 1,019,264 | |
13,071 | | | | Inmarsat PLC | | 137,468 | |
8,487 | | | | Intercontinental Hotels Group PLC | | 165,784 | |
50,013 | | | | International Power PLC | | 342,508 | |
4,391 | | | | Intertek Group PLC | | 121,409 | |
31,204 | | | | Invensys PLC | | 172,457 | |
17,101 | | | | Investec PLC | | 140,883 | |
109,456 | | @ | | ITV PLC | | 120,017 | |
33,857 | | | | J Sainsbury PLC | | 198,905 | |
6,862 | | | | Johnson Matthey PLC | | 218,622 | |
7,240 | | | | Kazakhmys PLC | | 183,783 | |
83,844 | | | | Kingfisher PLC | | 345,413 | |
185,951 | | | | Legal & General Group PLC | | 281,630 | |
1,326,831 | | @ | | Lloyds TSB Group PLC | | 1,369,687 | |
5,532 | | @ | | Lonmin PLC | | 170,287 | |
60,990 | | | | Man Group PLC | | 282,804 | |
47,999 | | | | Marks & Spencer Group PLC | | 276,786 | |
115,843 | | | | National Grid PLC | | 1,001,258 | |
6,225 | | | | Next PLC | | 192,258 | |
166,392 | | | | Old Mutual PLC | | 320,422 | |
27,007 | | | | Pearson PLC | | 425,606 | |
5,607 | | | | Petrofac Ltd. | | 139,317 | |
84,243 | | | | Prudential PLC | | 880,102 | |
2,703 | | | | Randgold Resources Ltd. | | 222,895 | |
20,181 | | | | Reckitt Benckiser PLC | | 1,110,252 | |
45,615 | | | | Reed Elsevier PLC | | 385,309 | |
36,678 | | | | Rexam PLC | | 190,482 | |
47,095 | | | | Rio Tinto PLC | | 3,356,995 | |
63,242 | | @ | | Rolls-Royce Group PLC | | 616,181 | |
4,047,424 | | @ | | Rolls-Royce Group PLC | | 6,310 | |
108,844 | | | | Royal & Sun Alliance Insurance Group | | 212,792 | |
587,638 | | @ | | Royal Bank of Scotland Group PLC | | 360,878 | |
30,591 | | | | SABMiller PLC | | 1,077,693 | |
44,484 | | | | Sage Group PLC | | 190,011 | |
2,972 | | | | Schroders PLC | | 86,183 | |
29,969 | | | | Scottish & Southern Energy PLC | | 572,474 | |
17,247 | | | | Serco Group PLC | | 149,721 | |
6,997 | | | | Severn Trent PLC | | 161,769 | |
16,735 | | | | Shire PLC | | 403,516 | |
26,944 | | | | Smith & Nephew PLC | | 284,498 | |
11,911 | | | | Smiths Group PLC | | 231,545 | |
76,678 | | | | Standard Chartered PLC | | 2,069,967 | |
69,460 | | | | Standard Life PLC | | 234,591 | |
266,225 | | | | Tesco PLC | | 1,765,342 | |
25,940 | | | | Thomas Cook Group PLC | | 76,786 | |
25,492 | | | | Tullow Oil PLC | | 503,403 | |
46,102 | | | | Unilever PLC | | 1,416,074 | |
20,700 | | | | United Utilities Group PLC | | 191,510 | |
3,712 | | L | | Vedanta Resources PLC | | 146,444 | |
1,685,280 | | | | Vodafone Group PLC | | 4,424,094 | |
5,667 | | | | Weir Group PLC | | 157,444 | |
5,494 | | | | Whitbread PLC | | 153,733 | |
58,157 | | | | WM Morrison Supermarkets PLC | | 242,983 | |
7,000 | | @ | | Wolseley PLC | | 224,085 | |
38,899 | | | | WPP PLC | | 480,891 | |
| | | | | | 66,441,012 | |
| | | | Total Common Stock
(Cost $261,701,852) | | 349,845,378 | |
| | | | | | | |
REAL ESTATE INVESTMENT TRUSTS: 1.4% | | | |
| | | | Australia: 0.5% | | | |
52,369 | | | | CFS Retail Property Trust | | 94,237 | |
119,689 | | | | Dexus Property Group | | 97,296 | |
229,033 | | | | Goodman Group | | 152,211 | |
56,269 | | | | GPT Group | | 169,431 | |
874,585 | | @ | | GPT Group | | — | |
126,066 | | | | Mirvac Group | | 158,174 | |
80,692 | | | | Stockland | | 297,229 | |
70,146 | | | | Westfield Group | | 687,100 | |
70,146 | | @ | | Westfield Retail Trust | | 184,385 | |
| | | | | | 1,840,063 | |
| | | | France: 0.3% | | | |
1,296 | | | | Fonciere Des Regions | | 125,431 | |
1,111 | | | | Gecina S.A. | | 122,312 | |
992 | | | | ICADE | | 101,295 | |
3,196 | | | | Klepierre | | 115,432 | |
2,940 | | @ | | Unibail | | 582,115 | |
| | | | | | 1,046,585 | |
| | | | Hong Kong: 0.1% | | | |
78,327 | | | | Link Real Estate Investment Trust | | 243,201 | |
| | | | | | 243,201 | |
| | | | Japan: 0.2% | | | |
16 | | | | Japan Real Estate Investment Corp. | | 165,754 | |
62 | | | | Japan Retail Fund Investment Corp. | | 118,565 | |
16 | | L | | Nippon Building Fund, Inc. | | 163,973 | |
14 | | | | Nomura Real Estate Office Fund, Inc. | | 101,004 | |
| | | | | | 549,296 | |
| | | | Netherlands: 0.0% | | | |
1,428 | | | | Corio NV | | 91,690 | |
| | | | | | 91,690 | |
| | | | Singapore: 0.1% | | | |
60,000 | | | | Ascendas Real Estate Investment Trust | | 96,820 | |
74,000 | | | | CapitaMall Trust | | 112,549 | |
| | | | | | 209,369 | |
| | | | United Kingdom: 0.2% | | | |
24,633 | | | | British Land Co. PLC | | 202,199 | |
17,304 | | | | Capital Shopping Centres Group PLC | | 112,866 | |
21,706 | | | | Hammerson PLC | | 141,455 | |
24,151 | | | | Land Securities Group PLC | | 254,757 | |
34,591 | | | | Segro PLC | | 154,888 | |
| | | | | | 866,165 | |
| | | | Total Real Estate Investment Trusts
(Cost $3,723,404) | | 4,846,369 | |
| | | | | | | |
PREFERRED STOCK: 0.4% | | | |
| | | |
| | | | Germany: 0.4% | | | |
3,259 | | | | Fresenius AG | | 279,215 | |
3,098 | | | | Porsche AG | | 247,458 | |
3,228 | | | | ProSieben SAT.1 Media AG | | 96,890 | |
5,562 | | | | Volkswagen AG | | 904,318 | |
| | | | | | | |
| | | | Total Preferred Stock
(Cost $878,253) | | 1,527,881 | |
| | | | | | | |
RIGHTS: 0.0% | | | |
| | | | Austria: 0.0% | | | |
15,860 | | R, X | | Immoeast AG | | — | |
| | | | Total Rights
(Cost $-) | | — | |
WARRANTS: 0.0% | | | | | |
| | | | Italy: 0.0% | | | |
44,800 | | | | Mediobanca S.p.A. | | 329 | |
26,395 | | | | Unione di Banche Italiane SCPA | | 113 | |
| | | | | | 442 | |
| | | | Singapore: 0.0% | | | |
17,122 | | | | Golden Agri-Resources Ltd. | | 3,202 | |
| | | | | | 3,202 | |
| | | | Total Warrants
(Cost $1,997) | | 3,644 | |
| | | | | | | |
Principal Amount | | | | | | | |
| | | | | | | |
CORPORATE BONDS/NOTES: 0.0% | | | |
| | | | Italy: 0.0% | | | |
$ | 19,900 | | | | Banca Popolare di Milano Scrl, 6.750%, due 06/01/13 | | $ | 16,754 | |
| | | | | | | |
| | | | Total Corporate Bonds/Notes
(Cost $27,688) | | 16,754 | |
| | | | | | | |
| | | | Total Long-Term Investments
(Cost $266,333,194) | | 356,240,026 | |
| | | | | | | |
SHORT-TERM INVESTMENTS: 1.8% | | | |
| | | | Mutual Funds: 0.5% | | | |
$ | 1,764,000 | | | | Blackrock Liquidity Funds TempFund Portfolio - Class I | | 1,764,000 | |
| | | | | | | |
| | | | Total Mutual Funds
(Cost $1,764,000) | | 1,764,000 | |
| | | | | | | |
| | | | Securities Lending Collateral(cc): 1.3% | | | |
4,866,114 | | | | BNY Mellon Overnight Government Fund (1) | | 4,866,114 | |
37,727 | | R | | BNY Institutional Cash Reserves Fund, Series B (1)(2) | | 30,182 | |
| | | | | | | |
| | | | Total Securities Lending Collateral (Cost $ 4,903,841) | | 4,896,296 | |
| | | | | | | |
| | | | Total Short-Term Investments (Cost $ 6,667,841) | | 6,660,296 | |
| | | | | | | |
| | | | Total Investments in Securities (Cost $ 273,001,035)* | 99.0 | % | $ | 362,900,322 | |
| | | | Other Assets and Liabilities - Net | 1.0 | | 3,760,122 | |
| | | | Net Assets | 100.0 | % | $ | 366,660,444 | |
| | @ | | Non-income producing security |
| | ADR | | American Depositary Receipt |
| | (cc) | | Securities purchased with cash collateral for securities loaned. |
| | (1) | | Collateral received from brokers for securities lending was invested in these short-term investments. |
| | (2) | | On September 12, 2008, BNY established a separate sleeve of the Institutional Cash Reserves Fund (Series B) to hold certain Lehman Brothers defaulted debt obligations. The Portfolio’s position in Series B is being fair valued daily. Please see the accompanying Notes to Financial Statements for additional details on securities lending. |
| | R | | Restricted security |
| | L | | Loaned security, a portion or all of the security is on loan at December 31, 2010. |
| | ** | | Investment in affiliate |
| | X | | Fair value determined by ING Funds Valuation Committee appointed by the Funds’ Board of Directors/Trustees. |
| PORTFOLIO OF INVESTMENTS |
ING Japan TOPIX Index Portfolio | as of December 31, 2010 |
Shares | | | | | | Value | |
| | |
COMMON STOCK: 99.1% | | |
| | | | Consumer Discretionary: 18.9% | | | |
3,100 | | | | ABC-Mart, Inc. | | $ | 110,417 | |
59 | | | | Accordia Golf Co., Ltd. | | 57,151 | |
1,000 | | | | Aeon Fantasy Co., Ltd. | | 11,794 | |
16,000 | | | | Aichi Machine Industry Co., Ltd. | | 64,720 | |
5,300 | | | | Aigan Co., Ltd. | | 28,956 | |
3,900 | | | | Aisan Industry Co., Ltd. | | 34,990 | |
23,500 | | | | Aisin Seiki Co., Ltd. | | 828,058 | |
6,200 | | | | Akebono Brake Industry Co., Ltd. | | 39,806 | |
3,200 | | | | Alpen Co., Ltd. | | 56,907 | |
4,000 | | | | Alpha Corp. | | 42,328 | |
5,500 | | | | Alpine Electronics, Inc. | | 77,996 | |
11 | | | | Amiyaki Tei Co., Ltd. | | 34,599 | |
400 | | | | Amuse, Inc. | | 4,775 | |
1,500 | | | | AOKI Holdings, Inc. | | 27,075 | |
3,600 | | | | Aoyama Trading Co., Ltd. | | 64,901 | |
4,300 | | | | Arc Land Sakamoto Co., Ltd. | | 52,681 | |
5,500 | | | | Arnest One Corp. | | 70,467 | |
3,000 | | | | Asahi Co., Ltd. | | 40,575 | |
24,000 | | @ | | Asahi TEC Corp. | | 9,722 | |
5,000 | | | | Asatsu-DK, Inc. | | 136,021 | |
26,000 | | | | Asics Corp. | | 332,789 | |
1,800 | | | | ASKUL Corp. | | 37,431 | |
3,100 | | | | Autobacs Seven Co., Ltd. | | 121,526 | |
1,800 | | | | Avex Group Holdings, Inc. | | 26,278 | |
8,700 | | | | Belluna Co., Ltd. | | 48,169 | |
9,500 | | | | Benesse Corp. | | 437,096 | |
3,000 | | | | Best Denki Co., Ltd. | | 9,745 | |
38 | | | | BIC Camera, Inc. | | 15,728 | |
87,900 | | | | Bridgestone Corp. | | 1,691,985 | |
18,000 | | | | Calsonic Kansei Corp. | | 71,556 | |
37 | | L | | Can Do Co., Ltd. | | 31,964 | |
7,600 | | | | Canon Sales Co., Inc. | | 107,955 | |
28,100 | | | | Casio Computer Co., Ltd. | | 225,539 | |
1,700 | | | | Central Sports Co., Ltd. | | 18,677 | |
1,800 | | @ | | CHI Group Co., Ltd. | | 6,239 | |
5,000 | | | | Chiyoda Co., Ltd. | | 66,209 | |
3,200 | | | | Chofu Seisakusho Co., Ltd. | | 72,961 | |
12,000 | | | | Chori Co., Ltd. | | 14,869 | |
2,000 | | | | Chuo Spring Co., Ltd. | | 7,742 | |
32,000 | | @, L | | Clarion Co., Ltd. | | 61,633 | |
1,300 | | | | Cleanup Corp. | | 8,870 | |
11,500 | | | | Colowide Co., Ltd. | | 64,550 | |
4,000 | | | | Combi Corp. | | 48,628 | |
1,500 | | | | Corona Corp. | | 14,504 | |
14,800 | | L | | Culture Convenience Club Co., Ltd. | | 86,901 | |
3,000 | | | | Daido Metal Co., Ltd. | | 23,049 | |
6,600 | | | | Daidoh Ltd. | | 58,605 | |
17,100 | | @ | | Daiei, Inc. | | 67,361 | |
30,000 | | | | Daihatsu Motor Co., Ltd. | | 458,962 | |
1,900 | | | | Daikoku Denki Co., Ltd. | | 24,236 | |
800 | | | | Dainichi Co., Ltd. | | 5,617 | |
3,000 | | | | Daisyo Corp. | | 37,477 | |
29,000 | | @ | | Daito Woolen Spinning & Weaving Co., Ltd. | | 25,261 | |
1,500 | | | | Daiyu Eight Co., Ltd. | | 9,847 | |
3,900 | | | | DCM Japan Holdings Co., Ltd. | | 24,500 | |
11,300 | | | | Dena Co., Ltd. | | 404,843 | |
60,300 | | | | Denso Corp. | | 2,073,046 | |
27,900 | | | | Dentsu, Inc. | | 862,033 | |
11,000 | | | | Descente Ltd. | | 59,231 | |
4,300 | | | | Don Quijote Co., Ltd. | | 130,841 | |
2,000 | | | | Doshisha Co., Ltd. | | 46,664 | |
4,700 | | | | Doutor Nichires Holdings Co., Ltd. | | 63,992 | |
6,000 | | | | Dynic Corp. | | 11,049 | |
6,000 | | | | Eagle Industry Co., Ltd. | | 62,808 | |
5,000 | | @ | | Econach Co., Ltd. | | 1,964 | |
13,500 | | | | EDION Corp. | | 120,816 | |
2,500 | | | | Exedy Corp. | | 80,836 | |
3,800 | | | | F&A Aqua Holdings, Inc. | | 37,588 | |
6,300 | | | | Fast Retailing Co., Ltd. | | 999,315 | |
2,900 | | | | FCC Co., Ltd. | | 67,355 | |
2,000 | | | | Felissimo Corp. | | 25,349 | |
3,200 | | | | Foster Electric Co., Ltd. | | 94,354 | |
| | | | | | | | |
7,000 | | | | France Bed Holdings Co., Ltd. | | 9,541 | |
2,600 | | | | F-Tech, Inc. | | 45,910 | |
3,100 | | | | Fuji Co., Ltd. | | 64,899 | |
91,000 | | | | Fuji Heavy Industries Ltd. | | 701,773 | |
5,000 | | @ | | Fuji Kiko Co., Ltd. | | 16,918 | |
12,000 | | | | Fuji Kyuko Co., Ltd. | | 61,287 | |
273 | | | | Fuji Television Network, Inc. | | 430,063 | |
31,000 | | | | Fujibo Holdings, Inc. | | 53,281 | |
1,000 | | | | Fujikura Rubber Ltd. | | 4,271 | |
14,000 | | | | Fujita Kanko, Inc. | | 64,571 | |
12,000 | | | | Fujitsu General Ltd. | | 72,050 | |
1,500 | | | | Funai Electric Co., Ltd. | | 52,059 | |
2,000 | | | | Furukawa Battery Co., Ltd. | | 13,015 | |
13,100 | | @ | | Futaba Industrial Co., Ltd. | | 94,568 | |
10,000 | | | | Gakken Holdings Co., Ltd. | | 21,921 | |
4,400 | | | | Genki Sushi Co., Ltd. | | 51,981 | |
21 | | | | Geo Co., Ltd. | | 23,866 | |
5,000 | | | | GLOBERIDE, Inc. | | 6,022 | |
8,000 | | @ | | Goldwin, Inc. | | 20,640 | |
9,000 | | | | Gourmet Kineya Co., Ltd. | | 50,391 | |
32,000 | | @ | | GSI Creos Corp. | | 45,220 | |
1,000 | | | | Gulliver International Co. | | 47,320 | |
11,000 | | | | Gunze Ltd. | | 46,323 | |
7,000 | | | | H2O Retailing Corp. | | 50,956 | |
4,530 | | | | Hakuhodo DY Holdings, Inc. | | 258,698 | |
5,300 | | | | Hakuyosha Co., Ltd. | | 14,730 | |
2,300 | | | | Happinet Corp. | | 30,546 | |
2,600 | | | | Hard Off Corp. Co., Ltd. | | 13,368 | |
1,800 | | | | Haruyama Trading Co., Ltd. | | 9,651 | |
191,000 | | @ | | Haseko Corp. | | 168,775 | |
2,500 | | | | Heiwa Corp. | | 36,170 | |
3,000 | | | | Hiday Hidaka Corp. | | 52,370 | |
4,000 | | | | Hikari Tsushin, Inc. | | 87,054 | |
3,400 | | | | HIS Co., Ltd. | | 84,435 | |
7,600 | | @ | | Hitachi Koki Co., Ltd. | | 71,238 | |
229,100 | | | | Honda Motor Co., Ltd. | | 9,042,299 | |
5,800 | | | | Honeys Co., Ltd. | | 68,208 | |
189 | | @ | | Hoosiers Corp. | | 92,072 | |
1,900 | | | | Horipro, Inc. | | 16,436 | |
900 | | | | House of Rose Co., Ltd. | | 13,832 | |
2,200 | | | | Hurxley Corp. | | 13,541 | |
1,700 | | | | Ichibanya Co., Ltd. | | 49,144 | |
6,000 | | | | Ichikawa Co., Ltd. | | 11,188 | |
11,000 | | | | Ichikoh Industries Ltd. | | 29,373 | |
20 | | | | Ikyu Corp. | | 9,784 | |
8,400 | | @ | | Image Holdings Co., Ltd. | | 27,678 | |
3,700 | | | | Imasen Electric Industrial | | 55,472 | |
2,100 | | | | Intage, Inc. | | 44,136 | |
48,800 | | | | Isetan Mitsukoshi Holdings Ltd. | | 565,590 | |
166,000 | | | | Isuzu Motors Ltd. | | 750,107 | |
7,200 | | | | Izumi Co., Ltd. | | 105,876 | |
6,000 | | @ | | Izutsuya Co., Ltd. | | 4,488 | |
67,000 | | | | J Front Retailing Co., Ltd. | | 365,118 | |
67,000 | | @ | | Janome Sewing Machine Co., Ltd. | | 59,221 | |
2,000 | | | | Japan Vilene Co., Ltd. | | 10,295 | |
10,000 | | | | Japan Wool Textile Co., Ltd. | | 81,394 | |
2,700 | | | | Joban Kosan Co., Ltd. | | 3,920 | |
6,000 | | | | Joshin Denki Co., Ltd. | | 58,361 | |
7,670 | | @, L | | JVC Kenwood Holdings, Inc. | | 26,368 | |
2,900 | | | | Kadokawa Group Holdings, Inc. | | 75,745 | |
5,200 | | | | Kanto Auto Works Ltd. | | 44,749 | |
2,500 | | | | Kappa Create Co., Ltd. | | 60,128 | |
10,000 | | | | Kasai Kogyo Co., Ltd. | | 55,581 | |
3,000 | | | | Kawai Musical Instruments Manufacturing Co., Ltd. | | 6,775 | |
7,000 | | @ | | Kawashima Selkon Textiles Co., Ltd. | | 5,934 | |
18,000 | | | | Kayaba Industry Co., Ltd. | | 137,383 | |
6,300 | | | | Keihin Corp. | | 141,291 | |
10,300 | | L | | Keiyo Co., Ltd. | | 52,714 | |
6,200 | | | | Kimoto Co., Ltd. | | 62,745 | |
42,000 | | @ | | Kinki Nippon Tourist Co., Ltd. | | 36,625 | |
12,000 | | | | Kinugawa Rubber Industrial Co., Ltd. | | 59,714 | |
3,100 | | | | Kisoji Co., Ltd. | | 65,861 | |
4,100 | | | | Kohnan Shoji Co., Ltd. | | 51,678 | |
15,000 | | | | Koito Manufacturing Co., Ltd. | | 233,194 | |
9,200 | | | | Kojima Co., Ltd. | | 53,621 | |
12,000 | | | | Komatsu Seiren Co., Ltd. | | 49,232 | |
3,500 | | | | Komeri Co., Ltd. | | 80,145 | |
3,200 | | | | Kourakuen Corp. | | 47,417 | |
6,460 | | | | K’S Holdings Corp. | | 175,359 | |
1,300 | | | | Kura Corp. | | 20,355 | |
15,000 | | | | Kurabo Industries Ltd. | | 27,095 | |
800 | | | | Kuraudia Co., Ltd. | | 11,446 | |
3,200 | | | | Kyoritsu Maintenance Co., Ltd. | | 54,366 | |
167,900 | | @ | | LAND Co., Ltd. | | 43,262 | |
2,600 | | | | LEC, Inc. | | 46,745 | |
18,200 | | @ | | Look, Inc. | | 29,650 | |
500 | | | | Marche Corp. | | 4,261 | |
2,000 | | | | Mars Engineering Corp. | | 35,260 | |
28,300 | | | | Marui Co., Ltd. | | 229,778 | |
8,900 | | | | Matsuya Co., Ltd. | | 63,064 | |
2,900 | | | | Matsuya Foods Co., Ltd. | | 48,639 | |
223,000 | | | | Mazda Motor Corp. | | 636,097 | |
1,700 | | | | Megane TOP Co., Ltd. | | 17,555 | |
5,200 | | | | Meiko Network Japan Co., Ltd. | | 43,670 | |
1,800 | | | | Meiwa Estate Co., Ltd. | | 14,253 | |
3,300 | | @ | | Misawa Homes Co., Ltd. | | 15,199 | |
6,000 | | @ | | Mitsuba Corp. | | 51,695 | |
571,000 | | @ | | Mitsubishi Motors Corp. | | 827,326 | |
2,000 | | | | Mitsui Home Co., Ltd. | | 10,568 | |
5,000 | | | | Mizuno Corp. | | 25,680 | |
4,100 | | | | MOS Food Services, Inc. | | 76,167 | |
12,300 | | | | Mr Max Corp. | | 43,816 | |
3,300 | | | | Musashi Seimitsu Industry Co., Ltd. | | 81,846 | |
4,000 | | @ | | Naigai Co., Ltd. | | 2,312 | |
3,700 | | | | Nakayamafuku Co., Ltd. | | 27,146 | |
29,800 | | | | Namco Bandai Holdings, Inc. | | 319,423 | |
28,000 | | | | NGK Spark Plug Co., Ltd. | | 427,887 | |
22,000 | | | | NHK Spring Co., Ltd. | | 238,446 | |
13,000 | | | | Nice Holdings, Inc. | | 28,564 | |
2,600 | | | | Nidec-Tosok Corp. | | 30,844 | |
5,400 | | | | Nifco, Inc. | | 145,891 | |
4,300 | | | | Nihon Eslead Corp. | | 44,558 | |
8,800 | | | | Nihon Tokushu Toryo Co., Ltd. | | 37,294 | |
1,000 | | | | Nikkato Corp. | | 4,801 | |
50,000 | | | | Nikon Corp. | | 1,009,337 | |
133,000 | | @ | | Nippon Columbia Co. Ltd. | | 68,547 | |
1,700 | | | | Nippon Felt Co., Ltd. | | 8,681 | |
8,000 | | @ | | Nippon Piston Ring Co., Ltd. | | 22,946 | |
2,940 | | | | Nippon Television Network Corp. | | 461,092 | |
6,500 | | | | Nishimatsuya Chain Co., Ltd. | | 62,957 | |
346,300 | | | | Nissan Motor Co., Ltd. | | 3,275,947 | |
6,000 | | | | Nissan Shatai Co., Ltd. | | 52,185 | |
33,000 | | | | Nissei Build Kogyo Co., Ltd. | | 21,035 | |
10,600 | | | | Nissen Holdings Co., Ltd. | | 54,180 | |
20,000 | | | | Nisshinbo Industries, Inc. | | 218,306 | |
6,200 | | | | Nissin Kogyo Co., Ltd. | | 115,303 | |
5,450 | | | | Nitori Co., Ltd. | | 476,244 | |
12,000 | | | | Nitto Seimo Co., Ltd. | | 13,698 | |
14,100 | | | | NOK Corp. | | 292,270 | |
4,600 | | | | Noritsu Koki Co., Ltd. | | 29,218 | |
4,300 | | | | Ohashi Technica, Inc. | | 31,423 | |
17,000 | | | | Onward Kashiyama Co., Ltd. | | 146,871 | |
7,900 | | | | Oriental Land Co., Ltd. | | 730,688 | |
12,000 | | | | Pacific Industrial Co., Ltd. | | 65,837 | |
1,500 | | | | Pal Co., Ltd. | | 54,233 | |
2,900 | | | | Paltac Corp. | | 51,691 | |
3,000 | | | | PanaHome Corp. | | 18,905 | |
266,800 | | | | Panasonic Corp. | | 3,766,896 | |
7,700 | | | | Parco Co., Ltd. | | 69,754 | |
6,600 | | | | Paris Miki Holdings, Inc. | | 65,476 | |
84 | | | | PGM Holdings K K | | 58,083 | |
2,700 | | @ | | PIA Corp. | | 26,502 | |
2,500 | | | | Piolax, Inc. | | 54,106 | |
42,500 | | | | Pioneer Corp. | | 175,025 | |
2,200 | | | | Point, Inc. | | 96,369 | |
15,000 | | @ | | Press Kogyo Co., Ltd. | | 71,614 | |
3,100 | | | | Renaissance, Inc. | | 11,326 | |
8,000 | | @ | | Renown, Inc. | | 20,211 | |
6,000 | | | | Resort Solution Co., Ltd. | | 11,740 | |
4,900 | | | | Resorttrust, Inc. | | 82,589 | |
9,600 | | | | Right On Co., Ltd. | | 54,855 | |
10,000 | | | | Riken Corp. | | 44,343 | |
4,000 | | | | Ringer Hut Co., Ltd. | | 50,411 | |
4,800 | | | | Rinnai Corp. | | 292,614 | |
892 | | | | Riso Kyoiku Co., Ltd. | | 49,951 | |
1,800 | | | | Roland Corp. | | 22,333 | |
12,300 | | | | Round One Corp. | | 75,917 | |
5,400 | | | | Royal Holdings Co., Ltd. | | 56,199 | |
3,000 | | | | Ryohin Keikaku Co., Ltd. | | 124,112 | |
7,000 | | @ | | Sagami Chain Co., Ltd. | | 44,262 | |
10,000 | | @ | | Sagami Co., Ltd. | | 14,862 | |
3,600 | | | | Saizeriya Co., Ltd. | | 72,709 | |
15,000 | | | | Sakai Ovex Co., Ltd. | | 22,466 | |
1,100 | | | | San Holdings, Inc. | | 17,984 | |
17,000 | | | | Sanden Corp. | | 67,482 | |
1,600 | | | | Sanei-International Co., Ltd. | | 20,399 | |
5,300 | | | | Sangetsu Co., Ltd. | | 124,091 | |
7,200 | | | | Sankyo Co., Ltd. | | 405,672 | |
22,200 | | | | Sankyo Seiko Co., Ltd. | | 79,695 | |
1,300 | | | | Sanoh Industrial Co., Ltd. | | 11,828 | |
6,100 | | | | Sanrio Co., Ltd. | | 142,539 | |
424,000 | | @ | | Sansui Electric Co., Ltd. | | 10,445 | |
222,000 | | @ | | Sanyo Electric Co., Ltd. | | 360,240 | |
14,000 | | | | Sanyo Shokai Ltd. | | 54,713 | |
15,200 | | | | Scroll Corp. | | 65,114 | |
28,400 | | | | Sega Sammy Holdings, Inc. | | 538,625 | |
17,000 | | | | Seiko Holdings Corp. | | 62,759 | |
2,300 | | | | Seiren Co., Ltd. | | 16,394 | |
54,000 | | | | Sekisui Chemical Co., Ltd. | | 386,333 | |
90,000 | | | | Sekisui House Ltd. | | 906,886 | |
7,900 | | | | Senshukai Co., Ltd. | | 48,360 | |
123,000 | | | | Sharp Corp. | | 1,262,210 | |
9,000 | | | | Shikibo Ltd. | | 13,034 | |
5,100 | | | | Shimachu Co., Ltd. | | 119,031 | |
2,900 | | | | Shimamura Co., Ltd. | | 268,422 | |
11,600 | | | | Shimano, Inc. | | 588,055 | |
3,000 | | | | Shimojima Co., Ltd. | | 41,590 | |
4,800 | | | | Shingakukai Co., Ltd. | | 18,519 | |
4,000 | | | | Shinyei Kaisha | | 7,422 | |
6,000 | | | | Shiroki Corp. | | 21,841 | |
3,300 | | | | Shobunsha Publications, Inc. | | 24,683 | |
17,000 | | | | Shochiku Co., Ltd. | | 109,555 | |
5,700 | | | | Showa Corp. | | 43,357 | |
2,300 | | | | Shuei Yobiko Co., Ltd. | | 10,604 | |
243,000 | | @ | | Silver Seiko Ltd. | | 2,993 | |
6,600 | | | | SK Japan Co., Ltd. | | 23,531 | |
63 | | | | Sky Perfect Jsat Corp. | | 24,302 | |
153,400 | | | | Sony Corp. | | 5,486,298 | |
100 | | | | SPK Corp. | | 1,429 | |
30 | | | | SRI Sports Ltd. | | 33,109 | |
400 | | | | St. Marc Holdings Co., Ltd. | | 16,601 | |
17,500 | | | | Stanley Electric Co., Ltd. | | 325,419 | |
4,500 | | | | Studio Alice Co., Ltd. | | 42,483 | |
28,000 | | | | Suminoe Textile Co., Ltd. | | 53,566 | |
16,200 | | | | Sumitomo Forestry Co., Ltd. | | 141,846 | |
21,600 | | | | Sumitomo Rubber Industries, Inc. | | 224,671 | |
57,400 | | | | Suzuki Motor Corp. | | 1,409,102 | |
16,000 | | @ | | SxL Corp. | | 9,802 | |
16,000 | | | | T RAD Co., Ltd. | | 65,581 | |
2,500 | | | | Tac Co., Ltd. | | 10,461 | |
4,200 | | | | Tachi-S Co., Ltd. | | 68,520 | |
57 | | | | Tact Home Co., Ltd. | | 66,524 | |
5,700 | | | | Taiho Kogyo Co., Ltd. | | 51,737 | |
4,600 | | | | Takamatsu Construction Group Co., Ltd. | | 61,960 | |
33,000 | | | | Takashimaya Co., Ltd. | | 281,852 | |
4,400 | | | | Takata Corp. | | 129,569 | |
598 | | | | Take And Give Needs Co., Ltd. | | 59,086 | |
1,000 | | | | Takihyo Co., Ltd. | | 5,004 | |
4,200 | | | | Tamron Co., Ltd. | | 86,974 | |
6,000 | | @ | | Tasaki Shinju Co., Ltd. | | 5,233 | |
500 | | | | Taya Co., Ltd. | | 4,182 | |
13,000 | | | | TBK Co., Ltd. | | 65,469 | |
1,000 | | | | Teikoku Piston Ring Co., Ltd. | | 10,105 | |
7,000 | | | | Teikoku Sen-I Co., Ltd. | | 43,491 | |
15 | | | | T-Gaia Corp. | | 26,645 | |
27,000 | | | | Toabo Corp. | | 23,544 | |
6,000 | | | | Toei Co., Ltd. | | 28,965 | |
18,700 | | | | Toho Co., Ltd. | | 299,834 | |
38,000 | | | | Tokai Kanko Co., Ltd. | | 11,668 | |
7,200 | | | | Tokai Rika Co., Ltd. | | 135,671 | |
1,900 | | | | Tokai Rubber Industries, Inc. | | 26,169 | |
6,000 | | | | Tokai Senko KK | | 5,806 | |
420 | | | | Token Corp. | | 15,768 | |
13,900 | | | | Tokyo Broadcasting System, Inc. | | 196,805 | |
15,000 | | | | Tokyo Dome Corp. | | 40,685 | |
2,400 | | | | Tokyo Individualized Educational Institute, Inc. | | 7,049 | |
3,000 | | | | Tokyo Style Co., Ltd. | | 23,511 | |
7,000 | | | | Tokyotokeiba Co., Ltd. | | 10,676 | |
7,800 | | | | Tomy Co., Ltd. | | 65,863 | |
6,000 | | @ | | Tonichi Carlife Group, Inc. | | 6,328 | |
10,000 | | | | Topre Corp. | | 75,833 | |
1,000 | | | | Totenko Co., Ltd. | | 1,660 | |
4,300 | | | | Touei Housing Corp. | | 72,998 | |
4,900 | | | | Tow Co., Ltd. | | 28,498 | |
19,000 | | | | Toyo Tire & Rubber Co., Ltd. | | 45,676 | |
91,000 | | | | Toyobo Co., Ltd. | | 162,130 | |
8,300 | | | | Toyoda Gosei Co., Ltd. | | 194,191 | |
3,000 | | | | Toyota Auto Body Co., Ltd. | | 55,860 | |
10,300 | | | | Toyota Boshoku Corp. | | 181,089 | |
26,100 | | | | Toyota Industries Corp. | | 807,516 | |
351,600 | | | | Toyota Motor Corp. | | 13,841,945 | |
5,800 | | | | TS Tech Co., Ltd. | | 112,079 | |
12,000 | | @ | | Tsukamoto Corp. Co., Ltd. | | 12,811 | |
57 | | | | TV Asahi Corp. | | 98,999 | |
3,000 | | @ | | Tv Tokyo Holdings Corp. | | 43,860 | |
2,900 | | | | Unipres Corp. | | 57,586 | |
49,000 | | @ | | Unitika Ltd. | | 44,485 | |
3,100 | | | | U-Shin Ltd. | | 28,067 | |
3,470 | | | | USS Co., Ltd. | | 283,168 | |
15,000 | | | | Wacoal Holdings Corp. | | 214,919 | |
100 | | @ | | Warehouse Co., Ltd. | | 364 | |
2,700 | | | | Watabe Wedding Corp. | | 29,812 | |
3,300 | | | | WATAMI Co., Ltd. | | 66,628 | |
3,300 | | | | Xebio Co., Ltd. | | 71,218 | |
13,020 | | | | Yamada Denki Co., Ltd. | | 885,766 | |
19,200 | | | | Yamaha Corp. | | 237,040 | |
42,800 | | @ | | Yamaha Motor Co., Ltd. | | 694,547 | |
35,000 | | | | Yamatane Corp. | | 46,459 | |
6,700 | | | | Yamato International, Inc. | | 30,801 | |
1,500 | | | | Yellow Hat Ltd. | | 15,076 | |
1,500 | | | | Yokohama Reito Co., Ltd. | | 10,265 | |
33,000 | | | | Yokohama Rubber Co., Ltd. | | 169,967 | |
14,000 | | | | Yomiuri Land Co., Ltd. | | 46,962 | |
1,300 | | | | Yorozu Corp. | | 23,252 | |
35 | | | | Yoshinoya D&C Co., Ltd. | | 43,773 | |
4,600 | | | | Zenrin Co., Ltd. | | 51,212 | |
3,900 | | | | Zensho Co., Ltd. | | 38,838 | |
| | | | | | 78,066,552 | |
| | | | Consumer Staples: 5.8% | | | |
94,600 | | L | | Aeon Co., Ltd. | | 1,180,447 | |
1,800 | | @ | | Aeon Hokkaido Corp. | | 6,683 | |
1,500 | | | | Ain Pharmaciez, Inc. | | 52,603 | |
83,000 | | | | Ajinomoto Co., Inc. | | 862,210 | |
700 | | | | Arcs Co., Ltd. | | 10,851 | |
3,400 | | | | Ariake Japan Co., Ltd. | | 57,467 | |
54,500 | | | | Asahi Breweries Ltd. | | 1,051,885 | |
3,900 | | | | Belc Co., Ltd. | | 45,675 | |
1,200 | | | | Cawachi Ltd. | | 24,691 | |
7,000 | | | | CFS Corp. | | 38,798 | |
3,500 | | | | Chubu Shiryo Co., Ltd. | | 23,864 | |
3,800 | | | | Circle K Sunkus Co., Ltd. | | 60,863 | |
4,300 | | | | Coca-Cola Central Japan Co., Ltd. | | 57,390 | |
9,700 | | | | Coca-Cola West Holdings Co., Ltd. | | 175,583 | |
1,420 | | | | Cocokara Fine Holdings, Inc. | | 30,059 | |
1,500 | | | | Cosmos Pharmaceutical Corp. | | 57,402 | |
2,300 | | | | Create SD Holdings | | 50,664 | |
34 | | | | Dr Ci:Labo Co., Ltd. | | 132,200 | |
2,000 | | | | Dydo Drinco, Inc. | | 76,826 | |
1,800 | | | | Echo Trading Co., Ltd. | | 18,394 | |
2,800 | | | | Eco’s Co., Ltd. | | 15,042 | |
8,000 | | | | Ezaki Glico Co., Ltd. | | 94,045 | |
9,500 | | | | FamilyMart Co., Ltd. | | 357,414 | |
4,900 | | | | Fancl Corp. | | 73,451 | |
7,300 | | | | Fuji Oil Co., Ltd. | | 106,399 | |
4,000 | | | | Fujicco Co., Ltd. | | 49,107 | |
3,000 | | @ | | Fujiya Co., Ltd. | | 5,896 | |
3,900 | | | | Harashin Narus Holdings Co., Ltd. | | 53,873 | |
15,000 | | @ | | Hayashikane Sangyo Co., Ltd. | | 15,470 | |
1,300 | | | | Heiwado Co., Ltd. | | 17,188 | |
3,000 | | | | Hohsui Corp. | | 3,834 | |
3,100 | | | | Hokuto Corp. | | 71,958 | |
8,100 | | | | House Foods Corp. | | 129,778 | |
2,000 | | | | Inageya Co., Ltd. | | 21,810 | |
9,800 | | | | Ito En Ltd. | | 162,719 | |
1,800 | | | | Itochu-Shokuhin Co., Ltd. | | 63,322 | |
18,000 | | | | Itoham Foods, Inc. | | 64,638 | |
13,000 | | | | Izumiya Co., Ltd. | | 51,306 | |
641 | | | | Japan Tobacco, Inc. | | 2,366,938 | |
15,000 | | | | J-Oil Mills, Inc. | | 46,974 | |
10,300 | | | | Kagome Co., Ltd. | | 189,399 | |
78,100 | | | | Kao Corp. | | 2,098,944 | |
6,200 | | | | Kasumi Co., Ltd. | | 34,459 | |
2,100 | | | | Kato Sangyo Co., Ltd. | | 35,117 | |
16,500 | | | | Kewpie Corp. | | 209,091 | |
2,500 | | | | KEY Coffee, Inc. | | 44,688 | |
31,000 | | | | Kikkoman Corp. | | 346,409 | |
131,000 | | @ | | Kirin Brewery Co., Ltd. | | 1,832,173 | |
900 | | | | Kirindo Co., Ltd. | | 4,407 | |
4,000 | | | | Kobayashi Pharmaceutical Co., Ltd. | | 185,584 | |
4,800 | | | | Kose Corp. | | 123,968 | |
15,000 | | | | Kyodo Shiryo Co., Ltd. | | 18,452 | |
9,600 | | | | Lawson, Inc. | | 473,921 | |
2,900 | | | | Life Corp. | | 43,587 | |
24,000 | | | | Lion Corp. | | 130,773 | |
900 | | | | Mandom Corp. | | 24,345 | |
15,000 | | | | Marudai Food Co., Ltd. | | 48,880 | |
6,000 | | | | Maruetsu, Inc. | | 24,331 | |
42,000 | | | | Maruha Nichiro Holdings, Inc. | | 69,755 | |
3,900 | | | | Matsumotokiyoshi Holdings Co., Ltd. | | 84,516 | |
5,400 | | | | Megmilk Snow Brand Co., Ltd. | | 99,751 | |
10,300 | | | | MEIJI Holdings Co., Ltd. | | 464,803 | |
1,300 | | | | Meito Sangyo Co., Ltd. | | 17,356 | |
5,700 | | | | Mikuni Coca-Cola Bottling Co., Ltd. | | 51,744 | |
660 | | | | Milbon Co., Ltd. | | 17,349 | |
1,600 | | | | Ministop Co., Ltd. | | 27,693 | |
17,000 | | | | Mitsui Sugar Co., Ltd. | | 64,374 | |
13,000 | | | | Miyoshi Oil & Fat Co., Ltd. | | 20,924 | |
28,000 | | | | Morinaga & Co., Ltd. | | 65,790 | |
30,000 | | | | Morinaga Milk Industry Co., Ltd. | | 126,978 | |
15,000 | | | | Morozoff Ltd. | | 50,388 | |
1,000 | | | | Nagatanien Co., Ltd. | | 10,562 | |
3,000 | | | | Nakamuraya Co., Ltd. | | 14,345 | |
3,900 | | | | Natori Co., Ltd. | | 39,618 | |
40,000 | | | | Nichirei Corp. | | 184,227 | |
1,290 | | | | Nihon Chouzai Co., Ltd. | | 52,992 | |
15,000 | | | | Nippon Beet Sugar Manufacturing Co., Ltd. | | 35,446 | |
13,000 | | | | Nippon Flour Mills Co., Ltd. | | 64,276 | |
5,000 | | @ | | Nippon Formula Feed Manufacturing Co., Ltd. | | 6,208 | |
24,000 | | | | Nippon Meat Packers, Inc. | | 312,722 | |
34,500 | | | | Nippon Suisan Kaisha Ltd. | | 108,530 | |
10,000 | | | | Nisshin Oillio Group Ltd. | | 50,660 | |
27,000 | | | | Nisshin Seifun Group, Inc. | | 341,790 | |
10,000 | | L | | Nissin Food Products Co., Ltd. | | 357,889 | |
18,000 | | | | Oenon Holdings, Inc. | | 44,682 | |
1,000 | | | | OIE Sangyo Co., Ltd. | | 10,183 | |
4,000 | | | | Okuwa Co., Ltd. | | 41,758 | |
4,300 | | | | Olympic Corp. | | 32,893 | |
2,000 | | | | Pigeon Corp. | | 67,903 | |
3,200 | | | | Poplar Co., Ltd. | | 20,224 | |
10,000 | | | | Prima Meat Packers Ltd. | | 11,182 | |
3,100 | | | | Rock Field Co., Ltd. | | 48,622 | |
2,800 | | | | Ryoshoku Ltd. | | 62,215 | |
5,500 | | | | S Foods, Inc. | | 47,094 | |
3,000 | | | | Sakata Seed Corp. | | 40,437 | |
1,500 | | | | San-A Co., Ltd. | | 58,728 | |
45,000 | | | | Sapporo Holdings Ltd. | | 203,258 | |
112,500 | | | | Seven & I Holdings Co., Ltd. | | 2,992,966 | |
49,100 | | L | | Shiseido Co., Ltd. | | 1,069,218 | |
9,000 | | | | Showa Sangyo Co., Ltd. | | 26,339 | |
900 | | | | Sogo Medical Co., Ltd. | | 28,672 | |
6,000 | | | | Starzen Co., Ltd. | | 17,489 | |
4,400 | | | | Sugi Pharmacy Co., Ltd. | | 105,814 | |
4,100 | | | | Sundrug Co., Ltd. | | 119,252 | |
33,000 | | | | Takara Holdings, Inc. | | 193,683 | |
6,000 | | | | Tobu Store Co., Ltd. | | 17,867 | |
12,000 | | | | Toho Co., Ltd./Hyogo | | 45,948 | |
26,000 | | | | Tohto Suisan Co., Ltd. | | 42,139 | |
5,500 | | | | Torigoe Co., Ltd. | | 50,334 | |
3,000 | | | | Toyo Sugar Refining Co., Ltd. | | 3,830 | |
14,000 | | | | Toyo Suisan Kaisha Ltd. | | 310,839 | |
1,700 | | | | Tsuruha Holdings, Inc. | | 80,962 | |
300 | | @ | | Unicafe, Inc. | | 1,504 | |
16,600 | | | | Uni-Charm Corp. | | 659,176 | |
3,800 | | | | Unihair Co. Ltd. | | 50,848 | |
1,200 | | | | Universe Co., Ltd. | | 18,047 | |
18,800 | | | | UNY Co., Ltd. | | 189,333 | |
2,400 | | | | Valor Co., Ltd. | | 20,679 | |
4,200 | | | | Warabeya Nichiyo Co., Ltd. | | 54,684 | |
4,400 | | | | Yaizu Suisankagaku Industry Co., Ltd. | | 46,009 | |
18,200 | | | | Yakult Honsha Co., Ltd. | | 523,265 | |
500 | | | | Yamaya Corp. | | 4,559 | |
23,000 | | | | Yamazaki Baking Co., Ltd. | | 276,946 | |
2,900 | | | | Yamazawa Co., Ltd. | | 41,658 | |
1,200 | | | | Yaoko Co., Ltd. | | 36,604 | |
4,000 | | | | Yomeishu Seizo Co., Ltd. | | 39,023 | |
5,000 | | | | Yonekyu Corp. | | 41,432 | |
| | | | | | 24,193,229 | |
| | | | Energy: 1.4% | | | |
11,400 | | | | AOC Holdings, Inc. | | 77,546 | |
61,000 | | | | Cosmo Oil Co., Ltd. | | 199,212 | |
50,000 | | @ | | Fuji Kosan Co., Ltd. | | 45,902 | |
2,800 | | | | Idemitsu Kosan Co., Ltd. | | 296,705 | |
312 | | | | Inpex Holdings, Inc. | | 1,821,890 | |
6,700 | | | | Itochu Enex Co., Ltd. | | 36,221 | |
300 | | | | Japan Drilling Co., Ltd. | | 10,264 | |
3,000 | | | | Japan Oil Transportation Co., Ltd. | | 7,121 | |
5,300 | | | | Japan Petroleum Exploration Co. | | 200,988 | |
308,010 | | | | JX Holdings, Inc. | | 2,084,314 | |
13,000 | | | | Kyoei Tanker Co., Ltd. | | 24,742 | |
6,100 | | | | Mitsuuroko Co., Ltd. | | 37,240 | |
3,800 | | | | Modec, Inc. | | 67,213 | |
4,400 | | | | Nippon Gas Co., Ltd. | | 60,764 | |
5,000 | | | | Sala Corp. | | 27,421 | |
4,000 | | | | San-Ai Oil Co., Ltd. | | 19,643 | |
7,100 | | | | Shinko Plantech Co., Ltd. | | 65,389 | |
27,600 | | L | | Showa Shell Sekiyu KK | | 252,172 | |
12,000 | | | | Sinanen Co., Ltd. | | 55,150 | |
44,000 | | L | | TonenGeneral Sekiyu KK | | 480,093 | |
17,000 | | | | Toyo Kanetsu K K | | 30,205 | |
| | | | | | 5,900,195 | |
| | | | Financials: 17.0% | | | |
44,000 | | | | 77 Bank Ltd. | | 232,443 | |
6,490 | | L | | Acom Co., Ltd. | | 79,652 | |
10,300 | | | | Aeon Credit Service Co., Ltd. | | 144,931 | |
11,900 | | | | Aeon Mall Co., Ltd. | | 318,332 | |
1,300 | | | | Aichi Bank Ltd. | | 80,664 | |
67,150 | | @, L | | Aiful Corp. | | 61,628 | |
11,000 | | | | Airport Facilities Co., Ltd. | | 47,851 | |
25,000 | | | | Akita Bank Ltd. | | 74,094 | |
29,000 | | | | Aomori Bank Ltd. | | 79,943 | |
114,000 | | | | Aozora Bank Ltd. | | 235,135 | |
23,000 | | | | Awa Bank Ltd. | | 138,485 | |
1,800 | | | | Bank of Iwate Ltd. | | 86,148 | |
51,000 | | | | Bank of Kyoto Ltd. | | 482,075 | |
28,000 | | | | Bank of Nagoya Ltd. | | 90,125 | |
1,900 | | | | Bank of Okinawa Ltd. | | 73,586 | |
23,000 | | | | Bank of Saga Ltd. | | 65,065 | |
185,000 | | | | Bank of Yokohama Ltd. | | 953,967 | |
35,900 | | @ | | Cedyna Financial Corp. | | 68,201 | |
6,100 | | | | Century Leasing System, Inc. | | 98,828 | |
104,000 | | | | Chiba Bank Ltd. | | 674,358 | |
6,200 | | @ | | Chiba Kogyo Bank Ltd. | | 37,060 | |
23,000 | | | | Chugoku Bank Ltd. | | 277,536 | |
18,000 | | | | Chukyo Bank Ltd. | | 47,124 | |
161,000 | | | | Chuo Mitsui Trust Holdings, Inc. | | 665,080 | |
21,300 | | | | Credit Saison Co., Ltd. | | 347,609 | |
7,100 | | | | Daibiru Corp. | | 58,235 | |
1,144 | | | | Dai-ichi Life Insurance Co., Ltd. | | 1,851,418 | |
7,100 | | | | Daiko Clearing Services Corp. | | 27,227 | |
47,000 | | @, L | | Daikyo, Inc. | | 95,091 | |
23,000 | | | | Daisan Bank Ltd. | | 59,115 | |
25,000 | | | | Daishi Bank Ltd. | | 77,088 | |
20,000 | | | | Daito Bank Ltd. | | 14,988 | |
12,600 | | | | Daito Trust Construction Co., Ltd. | | 861,115 | |
83,000 | | | | Daiwa House Industry Co., Ltd. | | 1,016,722 | |
266,000 | | | | Daiwa Securities Group, Inc. | | 1,364,476 | |
23,000 | | | | Ehime Bank Ltd. | | 61,112 | |
24,000 | | | | Eighteenth Bank Ltd. | | 66,850 | |
25,500 | | | | FIDEA Holdings Co., Ltd. | | 64,894 | |
201 | | @ | | Fidec Corp. | | 31,588 | |
21,000 | | | | Fuji Fire & Marine Insurance Co. | | 28,552 | |
27,000 | | | | Fukui Bank Ltd. | | 83,393 | |
114,000 | | | | Fukuoka Financial Group, Inc. | | 493,453 | |
13,000 | | | | Fukushima Bank Ltd. | | 7,815 | |
1,900 | | | | Fuyo General Lease Co., Ltd. | | 62,093 | |
2,720 | | | | Goldcrest Co., Ltd. | | 70,874 | |
55,000 | | | | Gunma Bank Ltd. | | 301,057 | |
53,000 | | | | Hachijuni Bank Ltd. | | 295,302 | |
27,000 | | | | Heiwa Real Estate Co., Ltd. | | 84,747 | |
35,000 | | | | Higashi-Nippon Bank Ltd. | | 76,505 | |
22,000 | | | | Higo Bank Ltd. | | 113,738 | |
65,000 | | | | Hiroshima Bank Ltd. | | 273,369 | |
5,800 | | | | Hitachi Capital Corp. | | 89,318 | |
34,000 | | | | Hokkoku Bank Ltd. | | 117,991 | |
42,000 | | | | Hokkoku Bank Ltd. | | 86,608 | |
182,000 | | | | Hokugin Financial Group, Inc. | | 368,964 | |
8,600 | | | | Hulic Co., Ltd. | | 70,721 | |
25,000 | | | | Hyakugo Bank Ltd. | | 107,547 | |
33,000 | | | | Hyakujushi Bank Ltd. | | 121,112 | |
4,600 | | | | IBJ Leasing Co., Ltd. | | 115,482 | |
8,600 | | | | Ichiyoshi Securities Co., Ltd. | | 64,911 | |
1,400 | | | | Iida Home Max | | 15,143 | |
6,100 | | | | Iwai Securities Co., Ltd. | | 43,410 | |
30,000 | | | | Iyo Bank Ltd. | | 239,343 | |
26,000 | | | | Jaccs Co., Ltd. | | 73,329 | |
3,500 | | | | Jafco Co., Ltd. | | 101,191 | |
69,000 | | | | Japan Asia Investment Co., Ltd. | | 48,194 | |
11,800 | | | | Japan Securities Finance Co., Ltd. | | 86,173 | |
98,000 | | | | Joyo Bank Ltd. | | 429,567 | |
39,000 | | | | Juroku Bank Ltd. | | 124,780 | |
17,500 | | | | kabu.com Securities Co., Ltd. | | 78,351 | |
18,000 | | | | Kagoshima Bank Ltd. | | 120,169 | |
33,000 | | | | Kansai Urban Banking Corp. | | 51,848 | |
9,100 | | | | Keihanshin Real Estate Co., Ltd. | | 43,945 | |
23,000 | | | | Keiyo Bank Ltd. | | 113,628 | |
329 | | @ | | Kenedix, Inc. | | 99,759 | |
2,000 | | | | Kita-Nippon Bank Ltd. | | 47,986 | |
110,000 | | | | Kiyo Holdings, Inc. | | 153,183 | |
3,000 | | | | Kosei Securities Co., Ltd. | | 3,271 | |
7,100 | | | | Kyokuto Securities Co., Ltd. | | 61,306 | |
89 | | | | Land Business Co., Ltd. | | 20,669 | |
15,300 | | L | | Leopalace21 Corp. | | 29,394 | |
11,500 | | | | Marusan Securities Co., Ltd. | | 68,558 | |
16,400 | | | | Matsui Securities Co., Ltd. | | 116,164 | |
25,000 | | | | Michinoku Bank Ltd. | | 48,240 | |
20,000 | | | | Mie Bank Ltd. | | 54,763 | |
13,000 | | | | Minato Bank Ltd. | | 22,216 | |
5,000 | | | | Mito Securities Co., Ltd. | | 8,688 | |
189,000 | | | | Mitsubishi Estate Co., Ltd. | | 3,492,949 | |
2,041,900 | | | | Mitsubishi UFJ Financial Group, Inc. | | 11,010,155 | |
6,920 | | | | Mitsubishi UFJ Lease & Finance Co., Ltd. | | 273,137 | |
128,000 | | | | Mitsui Fudosan Co., Ltd. | | 2,543,818 | |
80,111 | | | | Mitsui Sumitomo Insurance Group Holdings, Inc. | | 1,999,786 | |
23,000 | | | | Miyazaki Bank Ltd. | | 61,043 | |
3,288,500 | | | | Mizuho Financial Group, Inc. | | 6,168,814 | |
73,000 | | | | Mizuho Investors Securities Co., Ltd. | | 78,872 | |
73,000 | | | | Mizuho Securities Co., Ltd. | | 208,161 | |
213,000 | | | | Mizuho Trust & Banking Co., Ltd. | | 219,405 | |
207 | | | | Monex Beans Holdings, Inc. | | 61,009 | |
1,800 | | | | Musashino Bank Ltd. | | 54,395 | |
20,000 | | | | Nagano Bank Ltd. | | 38,381 | |
26,000 | | | | Nanto Bank Ltd. | | 129,969 | |
32,700 | | @ | | NIS Group Co., Ltd. | | 4,028 | |
85,000 | | | | Nishi-Nippon City Bank Ltd. | | 257,092 | |
2,300 | | | | Nisshin Fudosan Co. | | 18,631 | |
215,600 | | @ | | NKSJ Holdings, Inc. | | 1,581,581 | |
567,400 | | | | Nomura Holdings, Inc. | | 3,600,195 | |
11,300 | | | | Nomura Real Estate Holdings, Inc. | | 205,041 | |
204 | | | | NTT Urban Development Corp. | | 200,262 | |
18,000 | | | | Ogaki Kyoritsu Bank Ltd. | | 56,823 | |
20,000 | | | | Oita Bank Ltd. | | 71,545 | |
14,000 | | | | Okasan Securities Group, Inc. | | 57,472 | |
13,970 | | | | ORIX Corp. | | 1,368,713 | |
12,400 | | | | Osaka Securities Finance Co., Ltd. | | 25,764 | |
3,000 | | | | Pocket Card Co., Ltd. | | 8,998 | |
10,650 | | | | Promise Co., Ltd. | | 60,809 | |
86,800 | | L | | Resona Holdings, Inc. | | 517,387 | |
500 | | | | Ricoh Leasing Co., Ltd. | | 13,706 | |
17,000 | | | | San-In Godo Bank Ltd. | | 122,241 | |
3,500 | | | | Sankei Building Co., Ltd. | | 20,858 | |
27,100 | | | | Sapporo Hokuyo Holdings, Inc. | | 126,631 | |
72,250 | | | | Senshu Ikeda Holdings, Inc. | | 102,902 | |
26,000 | | | | Shiga Bank Ltd. | | 141,153 | |
24,000 | | | | Shikoku Bank Ltd. | | 74,494 | |
1,500 | | | | Shimizu Bank Ltd. | | 64,682 | |
159,000 | | | | Shinsei Bank Ltd. | | 206,938 | |
87,000 | | L | | Shizuoka Bank Ltd. | | 799,958 | |
3,700 | | | | Shoei Co., Ltd./Chiyoda-ku | | 33,699 | |
3,291 | | | | Softbank Investment Corp. | | 496,289 | |
114 | | | | Sony Financial Holdings, Inc. | | 459,116 | |
203,900 | | | | Sumitomo Mitsui Financial Group, Inc. | | 7,219,514 | |
1,380 | | | | Sumitomo Real Estate Sales | | 71,143 | |
64,000 | | | | Sumitomo Realty & Development Co., Ltd. | | 1,522,536 | |
240,000 | | | | Sumitomo Trust & Banking Co., Ltd. | | 1,503,516 | |
207 | | @ | | Sun Frontier Fudousan Co., Ltd. | | 29,278 | |
741 | | | | Suncity Co., Ltd. | | 23,126 | |
31,000 | | | | Suruga Bank Ltd. | | 287,656 | |
48,900 | | | | T&D Holdings, Inc. | | 1,233,545 | |
6,600 | | | | Takara Leben Co., Ltd. | | 59,614 | |
13,800 | | | | TOC Co., Ltd. | | 58,981 | |
16,000 | | | | Tochigi Bank Ltd. | | 75,661 | |
26,000 | | | | Toho Bank Ltd. | | 81,079 | |
25,000 | | | | Tohoku Bank Ltd. | | 41,240 | |
30,000 | | | | Tokai Tokyo Financial Holdings | | 113,331 | |
102,200 | | | | Tokio Marine Holdings, Inc. | | 3,036,102 | |
9,000 | | | | Tokyo Rakutenchi Co., Ltd. | | 32,984 | |
55,000 | | | | Tokyo Tatemono Co., Ltd. | | 253,499 | |
9,300 | | | | Tokyo Tatemono Real Estate Sales Co., Ltd. | | 31,510 | |
34,000 | | | | Tokyo Theatres Co., Inc. | | 49,778 | |
4,100 | | | | Tokyo Tomin Bank Ltd. | | 58,432 | |
56,000 | | | | Tokyu Land Corp. | | 280,233 | |
5,300 | | | | Tokyu Livable, Inc. | | 63,298 | |
20,000 | | | | Tomato Bank Ltd. | | 37,636 | |
17,700 | | @ | | TOMONY Holdings, Inc. | | 69,267 | |
18,000 | | | | Tottori Bank Ltd. | | 38,195 | |
60,000 | | | | Towa Bank Ltd. | | 56,758 | |
25,000 | | | | Toyo Securities Co., Ltd. | | 43,235 | |
7,700 | | | | Tsukuba Bank Ltd. | | 26,825 | |
2,400 | | | | Yachiyo Bank Ltd. | | 62,937 | |
17,000 | | | | Yamagata Bank Ltd. | | 78,521 | |
20,000 | | | | Yamaguchi Financial Group, Inc. | | 201,425 | |
18,000 | | | | Yamanashi Chuo Bank Ltd. | | 80,803 | |
| | | | | | 70,305,219 | |
| | | | Health Care: 5.3% | | | |
7,300 | | L | | Alfresa Holdings Corp. | | 323,495 | |
1,500 | | | | As One Corp. | | 30,840 | |
11,000 | | | | ASKA Pharmaceutical Co., Ltd. | | 82,865 | |
62,500 | | | | Astellas Pharma, Inc. | | 2,375,339 | |
2,300 | | | | BML, Inc. | | 64,377 | |
30,000 | | L | | Chugai Pharmaceutical Co., Ltd. | | 549,315 | |
70 | | | | CMIC Co., Ltd. | | 19,992 | |
1,500 | | | | Create Medic Co., Ltd. | | 15,670 | |
94,200 | | | | Daiichi Sankyo Co., Ltd. | | 2,057,421 | |
21,300 | | | | Dainippon Sumitomo Pharma Co., Ltd. | | 193,201 | |
1,300 | | | | Eiken Chemical Co., Ltd. | | 15,176 | |
35,000 | | L | | Eisai Co., Ltd. | | 1,264,455 | |
7 | | | | EPS Co., Ltd. | | 17,097 | |
3,100 | | | | Falco Biosystems Ltd. | | 25,897 | |
1,000 | | | | Fuso Pharmaceutical Industries Ltd. | | 3,061 | |
8,300 | | | | Hisamitsu Pharmaceutical Co., Inc. | | 348,845 | |
5,000 | | | | Hitachi Medical Corp. | | 49,286 | |
1,500 | | | | Hogy Medical Co., Ltd. | | 72,900 | |
307 | | @ | | I’rom Holdings Co., Ltd. | | 8,686 | |
2,800 | | | | Japan Medical Dynamic Marketing, Inc. | | 6,744 | |
20,000 | | | | Jeol Ltd. | | 69,979 | |
7,000 | | | | Kaken Pharmaceutical Co., Ltd. | | 84,903 | |
6,700 | | | | Kissei Pharmaceutical Co., Ltd. | | 131,563 | |
7,000 | | | | Kyorin Co., Ltd. | | 122,037 | |
35,000 | | L | | Kyowa Hakko Kogyo Co., Ltd. | | 359,449 | |
12 | | | | M3, Inc. | | 60,219 | |
32,200 | | | | Mediceo Paltac Holdings Co., Ltd. | | 354,320 | |
7,800 | | | | Miraca Holdings, Inc. | | 313,112 | |
25,000 | | | | Mitsubishi Tanabe Pharma Corp. | | 421,434 | |
8,000 | | | | Mochida Pharmaceutical Co., Ltd. | | 85,613 | |
2,500 | | | | Nagaileben Co., Ltd. | | 66,912 | |
6,500 | | | | Nichii Gakkan Co. | | 57,216 | |
6,300 | | | | Nihon Kohden Corp. | | 135,489 | |
10,000 | | | | Nikkiso Co., Ltd. | | 84,332 | |
13,000 | | | | Nippon Chemiphar Co., Ltd. | | 44,636 | |
4,000 | | | | Nippon Shinyaku Co., Ltd. | | 57,208 | |
3,900 | | | | Nipro Corp. | | 78,035 | |
4,200 | | | | Nissui Pharmaceutical Co., Ltd. | | 35,725 | |
33,900 | | L | | Olympus Corp. | | 1,020,734 | |
15,700 | | | | Ono Pharmaceutical Co., Ltd. | | 732,119 | |
1,500 | | | | Paramount Bed Co., Ltd. | | 41,084 | |
14,000 | | | | Rohto Pharmaceutical Co., Ltd. | | 163,617 | |
9,800 | | | | Santen Pharmaceutical Co., Ltd. | | 339,768 | |
1,800 | | | | Sawai Pharmaceutical Co., Ltd. | | 147,081 | |
5,500 | | | | Seikagaku Corp. | | 61,468 | |
8,500 | | | | Shin Nippon Biomedical Laboratories Ltd. | | 40,324 | |
44,800 | | | | Shionogi & Co., Ltd. | | 882,870 | |
5,300 | | | | Ship Healthcare Holdings, Inc. | | 69,338 | |
11,400 | | | | Suzuken Co., Ltd. | | 347,591 | |
4,900 | | | | Sysmex Corp. | | 338,901 | |
2,600 | | L | | Taiko Pharmaceutical Co., Ltd. | | 37,507 | |
24,000 | | | | Taisho Pharmaceutical Co., Ltd. | | 524,543 | |
106,100 | | | | Takeda Pharmaceutical Co., Ltd. | | 5,212,251 | |
21,400 | | | | Terumo Corp. | | 1,200,268 | |
8,500 | | | | Toho Pharmaceutical Co., Ltd. | | 116,076 | |
2,900 | | | | Torii Pharmaceutical Co., Ltd. | | 62,798 | |
1,000 | | | | Towa Pharmaceutical Co., Ltd. | | 55,475 | |
7,800 | | | | Tsumura & Co. | | 252,005 | |
7,000 | | | | Vital KSK Holdings, Inc. | | 60,907 | |
5,000 | | | | Wakamoto Pharmaceutical Co., Ltd. | | 14,731 | |
4,000 | | | | ZERIA Pharmaceutical Co., Ltd. | | 48,725 | |
| | | | | | 21,857,025 | |
| | | | Industrials: 20.9% | | | |
3,000 | | @ | | A&A Material Corp. | | 1,910 | |
4,300 | | | | Advan Co., Ltd. | | 33,121 | |
7,000 | | @ | | Advanex, Inc. | | 8,254 | |
3,400 | | | | Aeon Delight Co., Ltd. | | 66,775 | |
9,200 | | | | Aica Kogyo Co., Ltd. | | 107,990 | |
11,600 | | | | Aichi Corp. | | 49,724 | |
2,100 | | | | Aida Engineering Ltd. | | 9,567 | |
1,200 | | | | Airtech Japan Ltd. | | 5,967 | |
363,000 | | | | All Nippon Airways Co., Ltd. | | 1,350,892 | |
43,000 | | | | Amada Co., Ltd. | | 348,476 | |
12,000 | | | | Amano Corp. | | 115,948 | |
4,000 | | | | Anest Iwata Corp. | | 16,307 | |
43,700 | | @ | | Arrk Corp. | | 64,222 | |
2,500 | | | | Art Corp. | | 39,521 | |
3,000 | | | | Asahi Diamond Industrial Co., Ltd. | | 56,890 | |
135,000 | | L | | Asahi Glass Co., Ltd. | | 1,570,028 | |
5,700 | | | | Asahi Holdings, Inc. | | 120,269 | |
4,600 | | | | Asahi Kogyosha Co., Ltd. | | 19,405 | |
17,000 | | @ | | Asanuma Corp. | | 11,292 | |
1,500 | | | | Asunaro Aoki Construction Co., Ltd. | | 6,302 | |
4,000 | | | | Bando Chemical Industries Ltd. | | 15,864 | |
10,000 | | | | Bunka Shutter Co., Ltd. | | 26,280 | |
258,200 | | @ | | C&I Holdings | | 16,002 | |
26,000 | | | | Central Glass Co., Ltd. | | 120,519 | |
238 | | | | Central Japan Railway Co. | | 1,989,544 | |
900 | | | | Central Security Patrols Co., Ltd. | | 9,360 | |
21,000 | | | | Chiyoda Corp. | | 207,993 | |
3,700 | | | | Chiyoda Integre Co., Ltd. | | 52,691 | |
6,300 | | | | Chudenko Corp. | | 75,055 | |
10,000 | | | | Chugai Ro Co., Ltd. | | 36,720 | |
9,100 | | | | CKD Corp. | | 77,631 | |
11,400 | | | | COMSYS Holdings Corp. | | 121,095 | |
4,900 | | | | Cosel Co., Ltd. | | 72,352 | |
5,000 | | | | CTI Engineering Co., Ltd. | | 27,910 | |
86,000 | | L | | Dai Nippon Printing Co., Ltd. | | 1,166,443 | |
6,000 | | | | Dai-Dan Co., Ltd. | | 30,318 | |
6,000 | | | | Daido Kogyo Co., Ltd. | | 11,929 | |
13,500 | | | | Daifuku Co., Ltd. | | 94,156 | |
18,000 | | | | Daihen Corp. | | 87,419 | |
13,000 | | | | Daiho Corp. | | 11,491 | |
24,000 | | | | Daiichi Chuo KK | | 59,990 | |
7,000 | | | | Daiichi Jitsugyo Co., Ltd. | | 28,113 | |
29,800 | | | | Daikin Industries Ltd. | | 1,052,703 | |
300 | | | | Daiohs Corp. | | 1,737 | |
1,400 | | | | Daiseki Co., Ltd. | | 29,105 | |
3,000 | | @ | | Daisue Construction Co., Ltd. | | 1,475 | |
20,000 | | @ | | Danto Holdings Corp. | | 20,374 | |
1,800 | | | | Denyo Co., Ltd. | | 14,822 | |
2,000 | | @ | | Dijet Industrial Co., Ltd. | | 2,607 | |
17 | | | | Dream Incubator, Inc. | | 12,847 | |
8,300 | | | | Duskin Co., Ltd. | | 156,586 | |
47,400 | | | | East Japan Railway Co. | | 3,075,749 | |
53,000 | | | | Ebara Corp. | | 259,332 | |
200 | | | | Ebara Jitsugyo Co., Ltd. | | 3,017 | |
42,000 | | @ | | Enshu Ltd. | | 43,202 | |
28,100 | | | | Fanuc Ltd. | | 4,295,263 | |
17,400 | | | | Fudo Tetra Corp. | | 11,109 | |
63,000 | | | | Fuji Electric Holdings Co., Ltd. | | 195,234 | |
45,000 | | | | Fujikura Ltd. | | 226,351 | |
15,000 | | | | Fujitec Co., Ltd. | | 76,199 | |
1,500 | | | | Fukushima Industries Corp. | | 17,145 | |
18,000 | | | | Fukuyama Transporting Co., Ltd. | | 95,529 | |
132 | | @ | | FULLCAST Holdings Co., Ltd. | | 32,598 | |
6,300 | | | | Funai Consulting Co., Ltd. | | 40,053 | |
18,000 | | | | Furukawa Co., Ltd. | | 21,211 | |
93,000 | | | | Furukawa Electric Co., Ltd. | | 416,193 | |
3,100 | | | | Futaba Corp. | | 60,213 | |
2,100 | | | | Gakujo Co., Ltd. | | 7,566 | |
7,800 | | | | Glory Ltd. | | 191,986 | |
54,000 | | | | GS Yuasa Corp. | | 372,328 | |
400 | | | | Hamakyorex Co., Ltd. | | 12,186 | |
191,000 | | | | Hankyu Hanshin Holdings, Inc. | | 885,222 | |
24,000 | | | | Hanwa Co., Ltd. | | 110,052 | |
43,100 | | | | Hazama Corp. | | 35,981 | |
1,300 | | | | Helios Techno Holdings Co., Ltd. | | 3,588 | |
6,100 | | | | Hibiya Engineering Ltd. | | 57,612 | |
28,000 | | | | Hino Motors Ltd. | | 150,949 | |
2,200 | | | | Hirakawa Hewtech Corp. | | 19,316 | |
6,000 | | | | Hisaka Works Ltd. | | 78,958 | |
12,000 | | | | Hitachi Cable Ltd. | | 32,989 | |
13,400 | | L | | Hitachi Construction Machinery Co., Ltd. | | 319,824 | |
1,100 | | | | Hitachi Tool Engineering Ltd. | | 12,477 | |
4,400 | | | | Hitachi Transport System Ltd. | | 67,984 | |
120,500 | | | | Hitachi Zosen Corp. | | 182,085 | |
5,400 | | | | Hoshizaki Electric Co., Ltd. | | 99,921 | |
8,000 | | | | Hosokawa Micron Corp. | | 33,370 | |
15,000 | | | | Howa Machinery Ltd. | | 14,363 | |
7,600 | | | | Ichinen Holdings Co., Ltd. | | 39,071 | |
1,500 | | | | Idec Corp. | | 14,057 | |
13,800 | | | | Iino Kaiun Kaisha Ltd. | | 62,025 | |
3,300 | | | | Inaba Denki Sangyo Co., Ltd. | | 93,222 | |
4,700 | | | | Inaba Seisakusho Co., Ltd. | | 51,004 | |
3,000 | | | | Inabata & Co., Ltd. | | 18,169 | |
8,200 | | | | Inui Steamship Co., Ltd. | | 48,627 | |
28,000 | | @ | | Iseki & Co., Ltd. | | 73,456 | |
2,000 | | | | Ishii Iron Works Co., Ltd. | | 3,755 | |
4,000 | | @ | | Ishikawa Seisakusho Ltd. | | 3,878 | |
182,000 | | | | Ishikawajima - Harima Heavy Industries Co., Ltd. | | 404,070 | |
187,700 | | | | Itochu Corp. | | 1,891,217 | |
700 | | | | Itoki Corp. | | 1,887 | |
8,000 | | | | Iwasaki Electric Co., Ltd. | | 14,601 | |
30,000 | | | | Iwatani International Corp. | | 90,355 | |
400 | | | | Jalux, Inc. | | 3,357 | |
7,400 | | | | Japan Airport Terminal Co., Ltd. | | 113,926 | |
20,000 | | | | Japan Pulp & Paper Co., Ltd. | | 71,193 | |
45,000 | | | | Japan Steel Works Ltd. | | 468,681 | |
13,000 | | | | Japan Transcity Corp. | | 45,037 | |
17,000 | | | | JFE Shoji Holdings, Inc. | | 79,002 | |
31,000 | | | | JGC Corp. | | 671,882 | |
6,000 | | | | JK Holdings Co., Ltd. | | 30,075 | |
36,350 | | | | JS Group Corp. | | 797,364 | |
31,000 | | | | JTEKT Corp. | | 363,740 | |
33,000 | | @, L | | Juki Corp. | | 58,226 | |
151,000 | | | | Kajima Corp. | | 400,385 | |
31,000 | | | | Kamigumi Co., Ltd. | | 259,451 | |
4,000 | | | | Kanaden Corp. | | 24,218 | |
6,000 | | | | Kanagawa Chuo Kotsu Co., Ltd. | | 29,612 | |
4,000 | | | | Kandenko Co., Ltd. | | 26,804 | |
72,000 | | @ | | Kanematsu Corp. | | 68,890 | |
6,800 | | @ | | Kanematsu-NNK Corp. | | 10,758 | |
5,300 | | | | Katakura Industries Co., Ltd. | | 54,326 | |
24,000 | | | | Kato Works Co., Ltd. | | 52,926 | |
2,100 | | | | Kawada Technologies, Inc. | | 37,933 | |
221,000 | | | | Kawasaki Heavy Industries Ltd. | | 740,668 | |
86,000 | | | | Kawasaki Kisen Kaisha Ltd. | | 374,422 | |
62,000 | | | | Keihan Electric Railway Co., Ltd. | | 257,076 | |
74,000 | | | | Keihin Electric Express Railway Co., Ltd. | | 652,688 | |
74,000 | | | | Keio Corp. | | 504,030 | |
45,000 | | | | Keisei Electric Railway Co., Ltd. | | 299,525 | |
6,800 | | | | Kimura Chemical Plants Co., Ltd. | | 51,111 | |
400 | | | | Kimura Unity Co., Ltd. | | 3,386 | |
20,000 | | | | Kinden Corp. | | 184,301 | |
4,000 | | | | King Jim Co., Ltd. | | 27,376 | |
7,000 | | | | Kinki Sharyo Co., Ltd. | | 37,405 | |
254,000 | | L | | Kintetsu Corp. | | 793,674 | |
2,500 | | | | Kintetsu World Express, Inc. | | 71,168 | |
6,000 | | @ | | Kitagawa Iron Works Co., Ltd. | | 10,235 | |
12,000 | | | | Kitano Construction Corp. | | 29,936 | |
4,500 | | | | Kitazawa Sangyo Co., Ltd. | | 9,449 | |
13,300 | | | | Kitz Corp. | | 62,938 | |
12,400 | | | | Kokuyo Co., Ltd. | | 106,919 | |
22,950 | | | | Komai Tekko, Inc. | | 54,100 | |
135,400 | | | | Komatsu Ltd. | | 4,075,115 | |
4,300 | | | | Komatsu Wall Industry Co., Ltd. | | 40,630 | |
1,400 | | | | Komori Corp. | | 16,529 | |
7,100 | | @ | | Kosaido Co., Ltd. | | 11,082 | |
2,600 | | | | KRS Corp. | | 27,503 | |
121,000 | | | | Kubota Corp. | | 1,139,954 | |
14,000 | | @ | | Kumagai Gumi Co., Ltd. | | 10,298 | |
16,600 | | | | Kurita Water Industries Ltd. | | 521,108 | |
1,000 | | | | Kuroda Electric Co., Ltd. | | 13,981 | |
3,000 | | | | Kyodo Printing Co., Ltd. | | 7,080 | |
7,000 | | | | Kyoei Sangyo Co., Ltd./Tokyo | | 14,855 | |
1,800 | | | | Kyokuto Kaihatsu Kogyo Co., Ltd. | | 7,537 | |
12,200 | | | | Kyowa Exeo Corp. | | 125,427 | |
10,000 | | | | Kyudenko Corp. | | 63,982 | |
4,300 | | | | Mabuchi Motor Co., Ltd. | | 221,036 | |
12,000 | | | | Maeda Corp. | | 37,582 | |
9,000 | | | | Maeda Road Construction Co., Ltd. | | 71,825 | |
3,000 | | @ | | Maezawa Industries, Inc. | | 5,918 | |
5,400 | | | | Maezawa Kasei Industries Co., Ltd. | | 49,240 | |
2,500 | | | | Maezawa Kyuso Industries Co., Ltd. | | 30,773 | |
13,000 | | @ | | Makino Milling Machine Co. | | 106,567 | |
18,400 | | | | Makita Corp. | | 748,731 | |
3,000 | | | | Marubeni Construction Material Lease Co., Ltd. | | 3,575 | |
236,000 | | | | Marubeni Corp. | | 1,652,186 | |
2,900 | | | | Maruwn Corp. | | 7,775 | |
6,000 | | | | Maruyama Manufacturing Co., Inc. | | 12,152 | |
17,000 | | | | Maruzen Showa Unyu Co., Ltd. | | 55,296 | |
1,800 | | | | Matsuda Sangyo Co., Ltd. | | 32,295 | |
4,000 | | | | Matsui Construction Co., Ltd. | | 15,185 | |
2,000 | | | | Max Co., Ltd. | | 23,616 | |
28,000 | | | | Meidensha Corp. | | 131,838 | |
1,900 | | | | Meiji Shipping Co., Ltd. | | 7,565 | |
1,700 | | | | Meitec Corp. | | 36,261 | |
2,800 | | | | Meito Transportation Co., Ltd. | | 22,925 | |
5,700 | | @ | | Meiwa Corp. | | 16,854 | |
44,000 | | | | Minebea Co., Ltd. | | 276,020 | |
9,310 | | @ | | Mirait Holdings Corp. | | 65,591 | |
7,000 | | | | MISUMI Group, Inc. | | 173,683 | |
215,900 | | | | Mitsubishi Corp. | | 5,818,881 | |
274,000 | | | | Mitsubishi Electric Corp. | | 2,863,100 | |
451,000 | | | | Mitsubishi Heavy Industries Ltd. | | 1,688,314 | |
23,000 | | | | Mitsubishi Kakoki Kaisha Ltd. | | 50,223 | |
20,000 | | | | Mitsubishi Logistics Corp. | | 265,018 | |
3,100 | | | | Mitsubishi Pencil Co., Ltd. | | 51,872 | |
10,000 | | | | Mitsuboshi Belting Co., Ltd. | | 57,953 | |
232,600 | | | | Mitsui & Co., Ltd. | | 3,827,180 | |
106,000 | | L | | Mitsui Engineering & Shipbuilding Co., Ltd. | | 279,492 | |
27,000 | | | | Mitsui Matsushima Co., Ltd. | | 56,973 | |
137,000 | | | | Mitsui OSK Lines Ltd. | | 928,331 | |
4,000 | | | | Mitsui-Soko Co., Ltd. | | 16,633 | |
10,000 | | | | Mitsumura Printing Co., Ltd. | | 35,437 | |
5,100 | | | | Miura Co., Ltd. | | 135,844 | |
1,800 | | | | Miyachi Corp. | | 14,836 | |
7,000 | | @ | | Miyaji Engineering Group, Inc. | | 7,049 | |
2,100 | | @ | | Miyakoshi Corp. | | 9,045 | |
600 | | | | MonotaRO Co., Ltd. | | 5,808 | |
15,300 | | L | | Mori Seiki Co., Ltd. | | 180,572 | |
8,000 | | | | Morita Holdings Corp. | | 49,751 | |
2,800 | | | | Moshi Moshi Hotline, Inc. | | 73,410 | |
11,600 | | | | Nabtesco Corp. | | 246,640 | |
3,000 | | | | NAC Co., Ltd. | | 38,379 | |
31,000 | | | | Nachi-Fujikoshi Corp. | | 103,762 | |
16,000 | | | | Nagase & Co., Ltd. | | 206,527 | |
99,000 | | | | Nagoya Railroad Co., Ltd. | | 269,272 | |
2,500 | | | | Nakano Corp. | | 6,994 | |
59,000 | | L | | Nankai Electric Railway Co., Ltd. | | 238,199 | |
4,800 | | | | NEC Networks & System Integration Corp. | | 62,186 | |
36,000 | | | | NGK Insulators Ltd. | | 584,785 | |
10,000 | | | | Nichias Corp. | | 51,713 | |
1,800 | | | | Nichiden Corp. | | 53,642 | |
5,200 | | | | Nichiha Corp. | | 42,347 | |
9,000 | | | | Nichireki Co., Ltd. | | 34,995 | |
12,900 | | | | Nidec Corp. | | 1,300,760 | |
13 | | | | Nihon M&A Center, Inc. | | 55,935 | |
950 | | | | Nihon Trim Co., Ltd. | | 21,157 | |
4,000 | | | | Nikko Co., Ltd. | | 14,559 | |
10,000 | | | | Nippo Corp. | | 69,518 | |
18,000 | | | | Nippon Carbon Co., Ltd. | | 58,291 | |
38,300 | | | | Nippon Conveyor Co., Ltd. | | 35,744 | |
6,000 | | | | Nippon Densetsu Kogyo Co., Ltd. | | 57,785 | |
113,000 | | | | Nippon Express Co., Ltd. | | 507,470 | |
2,000 | | | | Nippon Filcon Co., Ltd./Tokyo | | 9,882 | |
2,900 | | | | Nippon Kanzai Co., Ltd. | | 47,904 | |
12,000 | | | | Nippon Koei Co., Ltd. | | 35,991 | |
8,000 | | | | Nippon Konpo Unyu Soko Co., Ltd. | | 97,149 | |
1,800 | | | | Nippon Kucho Service Co., Ltd. | | 16,126 | |
1,000 | | | | Nippon Road Co., Ltd. | | 2,384 | |
2,000 | | | | Nippon Seisen Co., Ltd. | | 10,705 | |
6,000 | | | | Nippon Sharyo Ltd. | | 29,129 | |
125,000 | | | | Nippon Sheet Glass Co., Ltd. | | 335,281 | |
15,000 | | | | Nippon Steel Trading Co., Ltd. | | 46,025 | |
6,000 | | | | Nippon Thompson Co., Ltd. | | 48,217 | |
221,880 | | | | Nippon Yusen KK | | 976,841 | |
15,000 | | | | Nippon Yusoki Co., Ltd. | | 38,581 | |
56,000 | | | | Nishimatsu Construction Co., Ltd. | | 72,771 | |
37,000 | | | | Nishi-Nippon Railroad Co., Ltd. | | 154,804 | |
8,000 | | @ | | Nissei Plastic Industrial Co., Ltd. | | 26,040 | |
5,400 | | | | Nissha Printing Co., Ltd. | | 142,774 | |
18,000 | | | | Nissin Corp. | | 45,891 | |
4,000 | | | | Nissin Electric Co., Ltd. | | 24,144 | |
4,000 | | | | Nitta Corp. | | 78,381 | |
18,000 | | | | Nitto Boseki Co., Ltd. | | 45,255 | |
2,900 | | | | Nitto Kogyo Corp. | | 32,735 | |
1,000 | | | | Nitto Kohki Co., Ltd. | | 25,941 | |
4,000 | | | | Nitto Seiko Co., Ltd. | | 13,138 | |
15,000 | | | | Nomura Co., Ltd. | | 53,032 | |
4,000 | | | | Noritake Co., Ltd. | | 14,258 | |
5,300 | | | | Noritz Corp. | | 93,400 | |
18,000 | | | | NS United Kaiun Kaisha Ltd. | | 44,772 | |
65,000 | | | | NSK Ltd. | | 584,568 | |
67,000 | | | | NTN Corp. | | 353,586 | |
5,400 | | | | Obara Corp. | | 57,084 | |
98,000 | | | | Obayashi Corp. | | 449,889 | |
3,000 | | | | Obayashi Road Corp. | | 5,669 | |
91,000 | | L | | Odakyu Electric Railway Co., Ltd. | | 845,836 | |
1,800 | | | | Oiles Corp. | | 33,238 | |
10,000 | | | | Okamura Corp. | | 63,114 | |
11,000 | | @ | | OKK Corp. | | 16,739 | |
20,000 | | @ | | Okuma Corp. | | 151,794 | |
30,000 | | | | Okumura Corp. | | 113,963 | |
13,000 | | | | O-M Ltd. | | 51,698 | |
1,500 | | | | Onoken Co., Ltd. | | 13,710 | |
8,000 | | | | Organo Corp. | | 61,185 | |
7,700 | | | | OSG Corp. | | 92,738 | |
5,400 | | | | Oyo Corp. | | 44,862 | |
27,000 | | | | Panasonic Electric Works Co., Ltd. | | 351,976 | |
9,800 | | | | Park24 Co., Ltd. | | 104,631 | |
6,000 | | | | Pasco Corp. | | 17,013 | |
60 | | | | Pasona Group, Inc. | | 44,743 | |
4,000 | | @ | | Pegasus Sewing Machine Manufacturing Co., Ltd. | | 10,974 | |
21,500 | | | | Penta-Ocean Construction Co., Ltd. | | 36,401 | |
41 | | | | Pilot Corp. | | 72,456 | |
4,200 | | | | Pronexus, Inc. | | 22,826 | |
2,100 | | @ | | PS Mitsubishi Construction Co., Ltd. | | 5,935 | |
6,000 | | | | Raito Kogyo Co., Ltd. | | 14,825 | |
18,000 | | @ | | Rasa Industries Ltd. | | 21,839 | |
6,200 | | | | Rheon Automatic Machinery Co., Ltd. | | 15,398 | |
8,000 | | @ | | Ryobi Ltd. | | 36,473 | |
15,000 | | | | Sakai Heavy Industries Ltd. | | 26,915 | |
1,200 | | | | Sakai Moving Service Co., Ltd. | | 25,959 | |
16,000 | | @ | | Sakurada Co., Ltd. | | 3,338 | |
8,600 | | @ | | Sanix, Inc. | | 20,571 | |
3,000 | | | | Sanki Engineering Co., Ltd. | | 20,576 | |
18,000 | | | | Sanko Metal Industrial Co., Ltd. | | 38,202 | |
35,000 | | | | Sankyu, Inc. | | 158,530 | |
30,000 | | | | Sanwa Shutter Corp. | | 94,422 | |
2,000 | | | | Sanyo Industries Ltd. | | 2,505 | |
27,000 | | | | Sasebo Heavy Industries Co., Ltd. | | 55,081 | |
8,000 | | @ | | Sata Construction Co., Ltd. | | 3,441 | |
1,300 | | | | Sato Corp. | | 17,176 | |
1,800 | | | | Sato Shoji Corp. | | 11,106 | |
1,000 | | | | Sawafuji Electric Co., Ltd. | | 2,409 | |
29,600 | | | | Secom Co., Ltd. | | 1,398,624 | |
3,000 | | | | Seibu Electric Industry Co., Ltd. | | 12,770 | |
8,000 | | | | Seika Corp. | | 20,435 | |
43,000 | | @ | | Seikitokyu Kogyo Co., Ltd. | | 26,411 | |
15,000 | | | | Seino Holdings Co., Ltd. | | 102,782 | |
2,000 | | | | Sekisui Jushi Corp. | | 20,386 | |
18,000 | | | | Senko Co., Ltd. | | 64,180 | |
13,000 | | | | Shibusawa Warehouse Co., Ltd. | | 45,810 | |
5,000 | | | | Shibuya Kogyo Co., Ltd. | | 50,027 | |
4,300 | | | | Shima Seiki Manufacturing Ltd. | | 103,310 | |
92,000 | | | | Shimizu Corp. | | 391,908 | |
1,900 | | | | Shin Nippon Air Technologies Co., Ltd. | | 11,437 | |
7,000 | | | | Shin-Keisei Electric Railway Co., Ltd. | | 29,370 | |
6,000 | | | | Shin-Kobe Electric Machinery Co., Ltd. | | 72,265 | |
6,000 | | | | Shinmaywa Industries Ltd. | | 25,881 | |
16,400 | | | | Shinnihon Corp. | | 42,670 | |
19,000 | | | | Shinsho Corp. | | 47,116 | |
2,500 | | | | Shinwa Co., Ltd./Nagoya | | 30,192 | |
3,200 | | | | SHO-BOND Holdings Co., Ltd. | | 67,390 | |
19,000 | | | | Sinfonia Technology Co. | | 48,912 | |
2,600 | | | | Sintokogio Ltd. | | 24,633 | |
8,700 | | | | SMC Corp. | | 1,484,623 | |
2,000 | | | | Soda Nikka Co., Ltd. | | 8,494 | |
10,900 | | | | Sohgo Security Services Co., Ltd. | | 128,872 | |
183,900 | | | | Sojitz Corp. | | 402,118 | |
43,000 | | L | | Sotetsu Holdings, Inc. | | 142,468 | |
6,000 | | | | Subaru Enterprise Co., Ltd. | | 18,101 | |
2,800 | | | | Sugimoto & Co., Ltd. | | 25,107 | |
6,000 | | | | Sumikin Bussan Corp. | | 14,449 | |
44,500 | | @ | | Sumiseki Holdings, Inc. | | 43,638 | |
148,200 | | | | Sumitomo Corp. | | 2,086,252 | |
1,100 | | | | Sumitomo Densetsu Co., Ltd. | | 4,662 | |
101,700 | | | | Sumitomo Electric Industries Ltd. | | 1,405,411 | |
74,700 | | | | Sumitomo Heavy Industries | | 477,806 | |
11,100 | | @ | | Sumitomo Mitsui Construction Co., Ltd. | | 8,860 | |
7,000 | | | | Sumitomo Precision Products | | 34,094 | |
20,000 | | | | Sumitomo Warehouse Co., Ltd. | | 105,039 | |
61,000 | | @ | | SWCC Showa Holdings Co., Ltd. | | 70,292 | |
15,000 | | | | Tadano Ltd. | | 80,425 | |
1,000 | | | | Taihei Dengyo Kaisha Ltd. | | 8,171 | |
7,000 | | | | Taihei Kogyo Co., Ltd. | | 32,759 | |
43,000 | | | | Taiheiyo Kouhatsu, Inc. | | 35,734 | |
1,000 | | | | Taikisha Ltd. | | 17,690 | |
143,500 | | | | Taisei Corp. | | 334,601 | |
1,000 | | | | Takano Co., Ltd. | | 5,651 | |
5,000 | | | | Takaoka Electric Manufacturing Co., Ltd. | | 26,279 | |
4,100 | | | | Takara Printing Co., Ltd. | | 32,989 | |
14,000 | | | | Takara Standard Co., Ltd. | | 94,666 | |
6,700 | | | | Takasago Thermal Engineering Co., Ltd. | | 55,980 | |
23,000 | | | | Takashima & Co., Ltd. | | 37,227 | |
9,000 | | @ | | Takuma Co., Ltd. | | 24,940 | |
1,700 | | | | Tanaka Co., Ltd./Tokyo | | 6,599 | |
1,000 | | @ | | Tanseisha Co., Ltd. | | 3,545 | |
1,000 | | | | Tatsuta Electric Wire and Cable Co., Ltd. | | 3,042 | |
2,200 | | | | Teikoku Electric Manufacturing Co., Ltd. | | 48,068 | |
11,000 | | @ | | Tekken Corp. | | 10,802 | |
4,600 | | | | Temp Holdings Co., Ltd. | | 42,514 | |
18,900 | | | | THK Co., Ltd. | | 432,296 | |
6,000 | | | | Toa Corp. | | 7,002 | |
15,000 | | | | TOA Road Corp. | | 23,599 | |
21,500 | | @ | | Tobishima Corp. | | 6,345 | |
121,000 | | L | | Tobu Railway Co., Ltd. | | 678,603 | |
3,100 | | | | Tocalo Co., Ltd. | | 59,586 | |
30,000 | | | | Toda Corp. | | 111,182 | |
9,000 | | | | Toenec Corp. | | 51,462 | |
2,000 | | | | Tokyo Energy & Systems, Inc. | | 12,847 | |
11,000 | | | | TOKYO KEIKI INC. | | 16,941 | |
600 | | | | Tokyu Community Corp. | | 17,830 | |
6,500 | | | | Tokyu Construction Co., Ltd. | | 19,641 | |
156,000 | | | | Tokyu Corp. | | 713,627 | |
19,000 | | | | Toli Corp. | | 32,867 | |
4,500 | | | | Tomoe Corp. | | 14,315 | |
15,000 | | | | Tonami Holdings Co., Ltd. | | 28,594 | |
9,000 | | | | Toppan Forms Co., Ltd. | | 92,114 | |
77,000 | | L | | Toppan Printing Co., Ltd. | | 700,726 | |
4,000 | | | | Torishima Pump Manufacturing Co., Ltd. | | 84,006 | |
17,000 | | | | Toshiba Machine Co., Ltd. | | 85,640 | |
2,000 | | | | Toshiba Plant Systems & Services Corp. | | 28,641 | |
15,000 | | | | Tosho Printing Co., Ltd. | | 24,303 | |
8,000 | | | | Totetsu Kogyo Co., Ltd. | | 56,730 | |
42,000 | | | | Toto Ltd. | | 303,528 | |
7,500 | | @ | | Totoku Electric Co., Ltd. | | 7,353 | |
92,000 | | | | Toyo Construction Co., Ltd. | | 49,711 | |
5,000 | | | | Toyo Electric Manufacturing Co., Ltd. | | 28,898 | |
18,000 | | | | Toyo Engineering Corp. | | 69,651 | |
6,000 | | | | Toyo Logistics Co., Ltd. | | 13,507 | |
1,000 | | | | Toyo Machinery & Metal Co., Ltd. | | 3,216 | |
1,000 | | | | Toyo Tanso Co., Ltd. | | 59,009 | |
6,000 | | | | Toyo Wharf & Warehouse Co., Ltd. | | 9,682 | |
30,800 | | | | Toyota Tsusho Corp. | | 539,350 | |
4,500 | | | | Trusco Nakayama Corp. | | 75,365 | |
15,000 | | | | Tsubakimoto Chain Co. | | 79,559 | |
7,000 | | | | Tsubakimoto Kogyo Co., Ltd. | | 18,982 | |
25,000 | | @, L | | Tsudakoma Corp. | | 47,812 | |
6,000 | | L | | Tsugami Corp. | | 42,377 | |
4,000 | | | | Tsukishima Kikai Co., Ltd. | | 29,604 | |
6,000 | | | | Tsurumi Manufacturing Co., Ltd. | | 40,589 | |
13,000 | | | | Uchida Yoko Co., Ltd. | | 47,916 | |
6,100 | | | | Ueki Corp. | | 9,430 | |
1,800 | | | | Union Tool Co. | | 51,657 | |
14,000 | | | | Ushio, Inc. | | 265,832 | |
3,700 | | | | Utoc Corp. | | 10,984 | |
82,000 | | @ | | Wakachiku Construction Co., Ltd. | | 45,282 | |
2,600 | | | | Weathernews, Inc. | | 50,242 | |
265 | | | | West Japan Railway Co. | | 989,113 | |
7,000 | | | | Yahagi Construction Co., Ltd. | | 40,871 | |
3,000 | | | | YAMABIKO Corp. | | 31,465 | |
6,000 | | | | Yamato Corp. | | 22,351 | |
58,400 | | | | Yamato Holdings Co., Ltd. | | 828,441 | |
4,300 | | | | Yamazen Corp. | | 22,966 | |
4,700 | | | | Yasuda Warehouse Co., Ltd. | | 28,074 | |
7,000 | | | | Yondenko Corp. | | 29,116 | |
13,000 | | | | Yuasa Trading Co., Ltd. | | 12,904 | |
4,000 | | | | Yuken Kogyo Co., Ltd. | | 8,181 | |
4,000 | | | | Yurtec Corp. | | 15,877 | |
2,100 | | | | Yusen Air & Sea Service Co., Ltd. | | 30,494 | |
2,400 | | | | Yushin Precision Equipment Co., Ltd. | | 47,188 | |
| | | | | | 86,335,581 | |
| | | | Information Technology: 13.1% | | | |
4,800 | | | | A&D Co., Ltd. | | 20,729 | |
18,600 | | | | Advantest Corp. | | 418,188 | |
800 | | | | Agrex, Inc. | | 8,054 | |
12,900 | | | | Ai Holdings Corp. | | 47,426 | |
2,000 | | | | Aichi Tokei Denki Co., Ltd. | | 5,485 | |
3,100 | | | | Aiphone Co., Ltd. | | 50,283 | |
2,000 | | | | Alpha Systems, Inc. | | 36,098 | |
21,600 | | | | Alps Electric Co., Ltd. | | 249,282 | |
1,000 | | | | Anritsu Corp. | | 8,218 | |
500 | | | | Argo Graphics, Inc. | | 6,419 | |
1,000 | | | | Arisawa Manufacturing Co., Ltd. | | 5,510 | |
2,000 | | | | Asahi Net, Inc. | | 7,775 | |
2,125 | | | | Axell Corp. | | 58,141 | |
36,300 | | | | Brother Industries Ltd. | | 535,748 | |
5,500 | | | | CAC Corp. | | 42,369 | |
1,600 | | | | Canon Electronics, Inc. | | 45,050 | |
169,966 | | L | | Canon, Inc. | | 8,730,351 | |
6,300 | | | | Capcom Co., Ltd. | | 101,035 | |
39,400 | | | | Citizen Watch Co., Ltd. | | 270,342 | |
4,400 | | | | CMK Corp. | | 24,973 | |
1,600 | | | | Computer Engineering & Consulting Ltd. | | 8,238 | |
4,300 | | | | Computer Institute of Japan Ltd. | | 14,587 | |
3,000 | | | | Cresco Ltd. | | 19,636 | |
15,000 | | @ | | CSK Corp. | | 68,484 | |
100 | | | | Cybernet Systems Co., Ltd. | | 28,334 | |
33 | | | | Cybozu, Inc. | | 9,512 | |
32,000 | | @ | | Dainippon Screen Manufacturing Co., Ltd. | | 226,281 | |
1,100 | | | | Daito Electron Co., Ltd. | | 9,010 | |
15,000 | | | | Daiwabo Holdings Co., Ltd. | | 39,269 | |
2,000 | | | | Denki Kogyo Co., Ltd. | | 9,776 | |
3,100 | | | | Disco Corp. | | 187,115 | |
900 | | | | DTS Corp. | | 11,128 | |
12 | | | | Dwango Co., Ltd. | | 25,266 | |
146 | | | | eAccess Ltd. | | 87,903 | |
1,600 | | | | Eizo Nanao Corp. | | 37,436 | |
1,000 | | | | Elematec Corp. | | 14,141 | |
24,500 | | @, L | | Elpida Memory, Inc. | | 283,366 | |
4,200 | | | | Enplas Corp. | | 66,716 | |
1,600 | | | | ESPEC Corp. | | 12,937 | |
1,400 | | | | Excel Co., Ltd. | | 17,533 | |
178 | | | | Faith, Inc. | | 21,559 | |
62,300 | | | | Fuji Photo Film Co., Ltd. | | 2,243,964 | |
400 | | | | Fuji Soft, Inc. | | 6,896 | |
263,000 | | | | Fujitsu Ltd. | | 1,822,156 | |
104 | | | | Future Architect, Inc. | | 44,290 | |
13,300 | | | | GMO internet, Inc. | | 66,564 | |
12 | | | | GMO Payment Gateway, Inc. | | 29,479 | |
36 | | L | | Gourmet Navigator, Inc. | | 51,803 | |
4,800 | | | | Gree, Inc. | | 60,878 | |
9,100 | | | | Hamamatsu Photonics KK | | 331,726 | |
2,300 | | | | Hioki EE Corp. | | 47,740 | |
4,400 | | | | Hirose Electric Co., Ltd. | | 494,438 | |
800 | | | | Hitachi Business Solution Co., Ltd. | | 7,865 | |
10,300 | | | | Hitachi High-Technologies Corp. | | 239,997 | |
7,000 | | | | Hitachi Kokusai Electric, Inc. | | 69,284 | |
632,146 | | | | Hitachi Ltd. | | 3,356,170 | |
7,000 | | | | Hochiki Corp. | | 36,772 | |
15,000 | | | | Hokuriku Electric Industry Co., Ltd. | | 29,821 | |
3,900 | | | | Horiba Ltd. | | 110,228 | |
6,200 | | | | Hosiden Corp. | | 72,709 | |
62,300 | | | | Hoya Corp. | | 1,506,364 | |
17,600 | | | | Ibiden Co., Ltd. | | 552,083 | |
3,200 | | | | Icom, Inc. | | 87,556 | |
43,000 | | @ | | Ikegami Tsushinki Co., Ltd. | | 31,647 | |
8,300 | | | | Ines Corp. | | 67,467 | |
1,000 | | | | I-Net Corp. | | 5,831 | |
6,100 | | | | Information Services International-Dentsu Ltd. | | 43,909 | |
26 | | | | Internet Initiative Japan, Inc. | | 73,546 | |
11,900 | | | | IT Holdings Corp. | | 157,906 | |
10,000 | | | | Itfor, Inc. | | 34,085 | |
2,100 | | | | Itochu Techno-Solutions Corp. | | 78,563 | |
13,000 | | @ | | Iwatsu Electric Co., Ltd. | | 10,535 | |
6,000 | | | | Japan Aviation Electronics Industry Ltd. | | 47,623 | |
6,700 | | | | Japan Cash Machine Co., Ltd. | | 55,998 | |
5,400 | | | | Japan Digital Laboratory Co. | | 61,281 | |
2,000 | | | | Japan Radio Co., Ltd. | | 5,947 | |
6,400 | | | | Jastec Co., Ltd. | | 37,553 | |
4,400 | | | | JBCC Holdings, Inc. | | 28,197 | |
5,400 | | | | JBIS Holdings, Inc. | | 22,282 | |
600 | | | | Kaga Electronics Co., Ltd. | | 7,653 | |
21 | | | | Kakaku.com, Inc. | | 124,635 | |
6,200 | | | | Keyence Corp. | | 1,788,917 | |
1,100 | | | | Koa Corp. | | 14,042 | |
11,624 | | | | Konami Corp. | | 245,931 | |
74,500 | | | | Konica Minolta Holdings, Inc. | | 769,985 | |
23,100 | | | | Kyocera Corp. | | 2,346,902 | |
700 | | | | Macnica, Inc. | | 17,484 | |
6,000 | | | | Macromill, Inc. | | 67,349 | |
7,400 | | | | Marubun Corp. | | 43,433 | |
1,000 | | | | Maruwa Co., Ltd./Aichi | | 29,487 | |
4,600 | | | | Maspro Denkoh Corp. | | 41,168 | |
4,100 | | | | Megachips Corp. | | 82,724 | |
1,500 | | | | Melco Holdings, Inc. | | 52,290 | |
2,500 | | | | Mimasu Semiconductor Industry Co., Ltd. | | 28,926 | |
4,900 | | @ | | Mitsui High-Tec, Inc. | | 28,801 | |
10,400 | | | | Mitsumi Electric Co., Ltd. | | 190,060 | |
700 | | @ | | Moritex Corp. | | 4,230 | |
30,000 | | | | Murata Manufacturing Co., Ltd. | | 2,094,169 | |
6,200 | | @ | | Mutoh Holdings Co., Ltd. | | 14,462 | |
3,300 | | | | Nagano Keiki Co., Ltd. | | 30,661 | |
341,000 | | | | NEC Corp. | | 1,020,272 | |
1,800 | | | | NEC Fielding Ltd. | | 52,569 | |
64 | | | | Net One systems Co., Ltd. | | 94,504 | |
9,000 | | | | New Japan Radio Co., Ltd. | | 27,081 | |
6,300 | | | | Nichicon Corp. | | 88,613 | |
7,500 | | | | Nidec Copal Electronics Corp. | | 60,043 | |
4,000 | | | | Nidec Sankyo Corp. | | 32,648 | |
3,600 | | | | Nihon Dempa Kogyo Co., Ltd. | | 68,208 | |
1,700 | | | | Nihon Unisys Ltd. | | 13,570 | |
15,600 | | | | Nintendo Co., Ltd. | | 4,554,447 | |
3,000 | | | | Nippon Ceramic Co., Ltd. | | 53,207 | |
18,000 | | @ | | Nippon Chemi-Con Corp. | | 91,474 | |
61,000 | | | | Nippon Electric Glass Co., Ltd. | | 875,588 | |
400 | | | | Nippon Systemware Co., Ltd. | | 1,830 | |
7,000 | | | | Nohmi Bosai Ltd. | | 45,523 | |
13,500 | | | | Nomura Research Institute Ltd. | | 299,905 | |
3,800 | | | | NSD CO., Ltd. | | 44,830 | |
197 | | | | NTT Data Corp. | | 679,374 | |
1,100 | | | | OBIC Business Consultants Ltd. | | 58,754 | |
920 | | | | Obic Co., Ltd. | | 188,939 | |
500 | | | | Oizumi Corp. | | 2,010 | |
900 | | | | Okaya Electric Industries Co., Ltd. | | 3,808 | |
113,000 | | @ | | Oki Electric Industry Ltd. | | 97,043 | |
29,800 | | | | Omron Corp. | | 785,339 | |
600 | | | | Optex Co., Ltd. | | 8,889 | |
4,300 | | | | Oracle Corp. Japan | | 210,786 | |
3,000 | | | | Osaki Electric Co., Ltd. | | 25,964 | |
1,600 | | | | Otsuka Corp. | | 108,868 | |
200 | | | | Panasonic Electric Works Information systems Co., Ltd. | | 5,425 | |
1,500 | | @ | | Pixela Corp. | | 4,734 | |
8,100 | | @, L | | Renesas Electronics Corp. | | 80,624 | |
80,000 | | | | Ricoh Co., Ltd. | | 1,166,481 | |
3,900 | | | | Riso Kagaku Corp. | | 68,594 | |
14,300 | | | | Rohm Co., Ltd. | | 929,967 | |
3,400 | | | | Roland DG Corp. | | 54,849 | |
4,300 | | | | Ryosan Co., Ltd. | | 111,131 | |
4,700 | | | | Ryoyo Electro Corp. | | 54,605 | |
13,000 | | | | Sanken Electric Co., Ltd. | | 57,031 | |
1,800 | | | | Sanshin Electronics Co., Ltd. | | 14,896 | |
5,700 | | | | Satori Electric Co., Ltd. | | 41,338 | |
6,000 | | | | Saxa Holdings, Inc. | | 11,328 | |
19,300 | | | | Seiko Epson Corp. | | 350,381 | |
30,000 | | | | Shimadzu Corp. | | 232,370 | |
6,000 | | | | Shindengen Electric Manufacturing Co., Ltd. | | 30,116 | |
2,400 | | | | Shinkawa Ltd. | | 24,500 | |
7,400 | | L | | Shinko Electric Industries | | 82,560 | |
4,300 | | | | Shinko Shoji Co., Ltd. | | 35,779 | |
1,200 | | | | Siix Corp. | | 14,058 | |
31 | | | | Simplex Technology, Inc. | | 13,270 | |
15,000 | | | | SMK Corp. | | 82,263 | |
25 | | @ | | Softbrain Co., Ltd. | | 1,784 | |
25 | | | | So-net Entertainment Corp. | | 74,973 | |
4,400 | | | | Soshin Electric Co., Ltd. | | 32,866 | |
42 | | @ | | Sourcenext Corp. | | 11,257 | |
5,800 | | | | Square Enix Co., Ltd. | | 102,589 | |
2,700 | | | | Star Micronics Co., Ltd. | | 29,230 | |
17,800 | | | | Sumco Corp. | | 253,462 | |
4,200 | | | | Sumisho Computer Systems Corp. | | 75,112 | |
300 | | | | Sun-Wa Technos Corp. | | 2,515 | |
400 | | | | Suzuden Corp. | | 2,567 | |
39 | | | | SystemPro Co., Ltd. | | 41,389 | |
5,400 | | | | Tachibana Eletech Co., Ltd. | | 45,367 | |
14,000 | | | | Taiyo Yuden Co., Ltd. | | 212,781 | |
7,000 | | | | Tamura Corp. | | 21,278 | |
200 | | | | TDC Software Engineering, Inc. | | 1,922 | |
14,400 | | | | TDK Corp. | | 997,003 | |
25,000 | | @ | | Teac Corp. | | 13,172 | |
8,000 | | | | TECMO KOEI HOLDINGS CO., Ltd. | | 62,764 | |
2,700 | | L | | TKC Corp. | | 57,088 | |
6,000 | | @ | | Toko, Inc. | | 11,611 | |
800 | | | | Tokyo Denpa Co., Ltd. | | 6,024 | |
21,500 | | | | Tokyo Electron Ltd. | | 1,353,666 | |
3,700 | | | | Tokyo Seimitsu Co., Ltd. | | 57,513 | |
300 | | | | Tomen Devices Corp. | | 6,954 | |
3,400 | | | | Tomen Electronics Corp. | | 49,918 | |
11,700 | | | | Topcon Corp. | | 71,841 | |
300 | | | | Tose Co., Ltd. | | 1,968 | |
541,000 | | | | Toshiba Corp. | | 2,936,161 | |
13,000 | | | | Toshiba Tec Corp. | | 62,760 | |
500 | | | | Toukei Computer Co., Ltd. | | 7,132 | |
7,000 | | | | Towa Corp. | | 50,882 | |
5,400 | | | | Toyo Corp./Chuo-ku | | 57,725 | |
1,900 | | | | Trans Cosmos, Inc. | | 18,747 | |
11,400 | | | | Trend Micro, Inc. | | 374,512 | |
2,300 | | | | UKC Holdings Corp. | | 29,265 | |
4,900 | | | | Ulvac, Inc. | | 127,458 | |
21,000 | | @ | | Uniden Corp. | | 64,594 | |
62 | | | | Wacom Co., Ltd. | | 98,047 | |
6,400 | | | | Y.A.C. Co., Ltd. | | 46,899 | |
2,034 | | | | Yahoo! Japan Corp. | | 786,197 | |
10,700 | | L | | Yamaichi Electronics Co., Ltd. | | 53,129 | |
5,500 | | | | Yamatake Corp. | | 129,828 | |
32,000 | | | | Yaskawa Electric Corp. | | 301,310 | |
28,000 | | | | Yokogawa Electric Corp. | | 221,719 | |
3,900 | | | | Yokowo Co., Ltd. | | 27,535 | |
| | | | | | 53,977,065 | |
| | | | Materials: 8.3% | | | |
10,000 | | | | Achilles Corp. | | 14,501 | |
11,400 | | | | ADEKA Corp. | | 125,674 | |
8,000 | | | | Aichi Steel Corp. | | 54,661 | |
18,000 | | | | Air Water, Inc. | | 229,253 | |
15,000 | | | | Araya Industrial Co., Ltd. | | 24,860 | |
170,000 | | | | Asahi Kasei Corp. | | 1,105,791 | |
19,000 | | | | Asahi Organic Chemicals Industry Co., Ltd. | | 50,278 | |
7,000 | | | | Chuetsu Pulp & Paper Co., Ltd. | | 12,653 | |
6,000 | | | | Chugoku Marine Paints Ltd. | | 50,806 | |
9,000 | | | | Chugokukogyo Co., Ltd. | | 10,149 | |
2,000 | | | | Co-Op Chemical Co., Ltd. | | 2,534 | |
28,000 | | | | Dai Nippon Toryo Co., Ltd. | | 35,083 | |
39,000 | | | | Daicel Chemical Industries Ltd. | | 283,800 | |
49,000 | | | | Daido Steel Co., Ltd. | | 286,889 | |
4,000 | | | | Dai-Ichi Kogyo Seiyaku Co., Ltd. | | 12,424 | |
22,000 | | | | Daiken Corp. | | 57,985 | |
10,000 | | @ | | Daiki Aluminium Industry Co., Ltd. | | 31,072 | |
4,000 | | | | Dainichiseika Color & Chemicals Manufacturing Co., Ltd. | | 21,830 | |
72,000 | | | | Dainippon Ink & Chemicals | | 160,480 | |
12,000 | | | | Daio Paper Corp. | | 86,127 | |
18,000 | | | | Daiso Co., Ltd. | | 54,154 | |
12,900 | | | | DC Co., Ltd. | | 25,217 | |
65,000 | | | | Denki Kagaku Kogyo K K | | 307,755 | |
35,000 | | | | Dowa Holdings Co., Ltd. | | 228,659 | |
2,100 | | | | Earth Chemical Co., Ltd. | | 71,375 | |
700 | | | | Ebara-Udylite Co., Ltd. | | 14,670 | |
1,500 | | | | FP Corp. | | 83,007 | |
3,400 | | | | Fuji Seal International, Inc. | | 78,439 | |
8,600 | | | | Fujikura Kasei Co., Ltd. | | 59,059 | |
1,400 | | | | Fujimi, Inc. | | 21,442 | |
2,100 | | | | Fujimori Kogyo Co., Ltd. | | 31,600 | |
18,000 | | | | Furukawa-Sky Aluminum Corp. | | 52,321 | |
31,000 | | | | Godo Steel Ltd. | | 65,690 | |
17,000 | | | | Gun-Ei Chemical Industry Co., Ltd. | | 47,647 | |
1,400 | | L | | Hakudo Co., Ltd. | | 15,345 | |
6,000 | | | | Harima Chemicals, Inc. | | 38,000 | |
13,500 | | | | Hitachi Chemical Co., Ltd. | | 278,228 | |
19,000 | | | | Hitachi Metals Ltd. | | 227,135 | |
9,000 | | | | Hodogaya Chemical Co., Ltd. | | 36,200 | |
15,000 | | | | Hokkan Holdings Ltd. | | 45,120 | |
19,000 | | | | Hokuetsu Kishu Paper Co., Ltd. | | 107,996 | |
5,700 | | @ | | Hokushin Co., Ltd. | | 7,432 | |
4,000 | | | | Ihara Chemical Industry Co., Ltd. | | 12,817 | |
72,000 | | @ | | Ishihara Sangyo Kaisha Ltd. | | 74,268 | |
1,800 | | | | Japan Carlit Co., Ltd. | | 10,284 | |
2 | | | | Japan Pure Chemical Co., Ltd. | | 6,363 | |
67,600 | | | | JFE Holdings, Inc. | | 2,343,850 | |
2,800 | | | | JSP Corp. | | 41,132 | |
23,800 | | | | JSR Corp. | | 441,753 | |
40,000 | | | | Kaneka Corp. | | 276,366 | |
29,000 | | | | Kansai Paint Co., Ltd. | | 280,014 | |
7,000 | | | | Kanto Denka Kogyo Co., Ltd. | | 56,064 | |
2,000 | | | | Koatsu Gas Kogyo Co., Ltd. | | 12,241 | |
399,000 | | | | Kobe Steel Ltd. | | 1,008,167 | |
900 | | | | Kohsoku Corp. | | 8,287 | |
4,200 | | | | Konishi Co., Ltd. | | 50,560 | |
14,000 | | | | Krosaki Harima Corp. | | 56,761 | |
4,000 | | | | Kumiai Chemical Industry Co., Ltd. | | 13,413 | |
42,400 | | | | Kuraray Co., Ltd. | | 605,256 | |
18,000 | | | | Kureha Corp. | | 108,324 | |
15,000 | | @ | | Kurimoto Ltd. | | 19,514 | |
3,500 | | | | Kyoei Steel Ltd. | | 56,901 | |
4,300 | | | | Lintec Corp. | | 113,557 | |
10,000 | | | | Maruichi Steel Tube Ltd. | | 212,043 | |
4,700 | | | | MEC Co., Ltd./Japan | | 23,049 | |
177,600 | | | | Mitsubishi Chemical Holdings Corp. | | 1,199,664 | |
47,000 | | | | Mitsubishi Gas Chemical Co., Inc. | | 332,431 | |
183,520 | | | | Mitsubishi Materials Corp. | | 583,188 | |
67,000 | | | | Mitsubishi Paper Mills Ltd. | | 79,803 | |
12,000 | | | | Mitsubishi Steel Manufacturing Co., Ltd. | | 36,328 | |
115,000 | | | | Mitsui Chemicals, Inc. | | 410,000 | |
91,000 | | | | Mitsui Mining & Smelting Co., Ltd. | | 299,290 | |
5,000 | | | | Nakabayashi Co., Ltd. | | 11,249 | |
7,000 | | | | Nakayama Steel Works Ltd. | | 9,094 | |
3,200 | | | | Neturen Co., Ltd. | | 26,786 | |
2,000 | | | | Nihon Nohyaku Co., Ltd. | | 10,545 | |
7,000 | | | | Nihon Parkerizing Co., Ltd. | | 100,595 | |
20,000 | | | | Nihon Yamamura Glass Co., Ltd. | | 54,799 | |
10,000 | | @ | | Nippon Carbide Industries Co., Inc. | | 28,179 | |
11,000 | | | | Nippon Chemical Industrial Co., Ltd. | | 28,039 | |
3,000 | | | | Nippon Chutetsukan KK | | 4,454 | |
32,000 | | | | Nippon Coke & Engineering Co., Ltd. | | 63,217 | |
5,000 | | | | Nippon Concrete Industries Co., Ltd. | | 9,075 | |
11,000 | | | | Nippon Denko Co., Ltd. | | 86,906 | |
5,200 | | | | Nippon Fine Chemical Co., Ltd. | | 33,889 | |
4,000 | | | | Nippon Kasei Chemical Co., Ltd. | | 9,425 | |
25,000 | | | | Nippon Kayaku Co., Ltd. | | 263,560 | |
23,000 | | | | Nippon Kinzoku Co., Ltd. | | 44,589 | |
19,000 | | | | Nippon Koshuha Steel Co., Ltd. | | 22,834 | |
40,000 | | @ | | Nippon Light Metal Co., Ltd. | | 74,188 | |
39,000 | | | | Nippon Metal Industry Co., Ltd. | | 51,151 | |
30,000 | | | | Nippon Paint Co., Ltd. | | 229,342 | |
14,429 | | | | Nippon Paper Group, Inc. | | 377,705 | |
11,000 | | | | Nippon Pillar Packing Co., Ltd. | | 81,357 | |
23,000 | | | | Nippon Shokubai Co., Ltd. | | 237,162 | |
16,000 | | | | Nippon Soda Co., Ltd. | | 76,093 | |
774,000 | | | | Nippon Steel Corp. | | 2,772,822 | |
6,000 | | | | Nippon Synthetic Chemical Industry Co., Ltd. | | 40,051 | |
6,000 | | | | Nippon Valqua Industries Ltd. | | 18,219 | |
18,500 | | | | Nippon Yakin Kogyo Co., Ltd. | | 54,471 | |
21,700 | | | | Nissan Chemical Industries Ltd. | | 279,984 | |
115,000 | | | | Nisshin Steel Co., Ltd. | | 255,244 | |
4,000 | | | | Nittetsu Mining Co., Ltd. | | 20,086 | |
24,000 | | | | Nitto Denko Corp. | | 1,125,619 | |
11,000 | | | | NOF Corp. | | 53,666 | |
1,400 | | | | Ohara, Inc. | | 19,389 | |
130,000 | | L | | OJI Paper Co., Ltd. | | 627,382 | |
3,500 | | | | Okabe Co., Ltd. | | 15,899 | |
14,000 | | | | Okamoto Industries, Inc. | | 57,880 | |
11,000 | | @ | | Okura Industrial Co., Ltd. | | 31,751 | |
3,400 | | | | Osaka Steel Co., Ltd. | | 60,351 | |
3,200 | | | | OSAKA Titanium Technologies Co. | | 150,434 | |
19,000 | | | | Pacific Metals Co., Ltd. | | 160,772 | |
2,800 | | | | Pack Corp. | | 49,843 | |
22,000 | | | | Rengo Co., Ltd. | | 148,906 | |
4,000 | | | | Sakata INX Corp. | | 20,083 | |
10,000 | | | | Sanyo Chemical Industries Ltd. | | 83,221 | |
16,000 | | | | Sanyo Special Steel Co., Ltd. | | 96,194 | |
4,000 | | | | Sekisui Plastics Co., Ltd. | | 18,002 | |
6,000 | | | | Shinagawa Refractories Co., Ltd. | | 17,730 | |
47,200 | | | | Shin-Etsu Chemical Co., Ltd. | | 2,543,918 | |
6,300 | | | | Shin-Etsu Polymer Co., Ltd. | | 39,259 | |
197,000 | | L | | Showa Denko KK | | 441,956 | |
3,900 | | | | ST Corp. | | 44,997 | |
1,400 | | | | Stella Chemifa Corp. | | 65,582 | |
28,000 | | | | Sumitomo Bakelite Co., Ltd. | | 164,323 | |
204,000 | | | | Sumitomo Chemical Co., Ltd. | | 1,001,436 | |
48,000 | | @ | | Sumitomo Light Metal Industries Ltd. | | 57,741 | |
527,000 | | | | Sumitomo Metal Industries Ltd. | | 1,291,944 | |
78,000 | | | | Sumitomo Metal Mining Co., Ltd. | | 1,358,614 | |
60,000 | | | | Sumitomo Osaka Cement Co., Ltd. | | 135,418 | |
7,900 | | | | Sumitomo Pipe & Tube Co., Ltd. | | 56,461 | |
10,000 | | | | Sumitomo Seika Chemicals Co., Ltd. | | 43,224 | |
3,900 | | | | T Hasegawa Co., Ltd. | | 66,200 | |
135,000 | | | | Taiheiyo Cement Corp. | | 172,279 | |
1,900 | | | | Taisei Lamick Co., Ltd. | | 52,179 | |
46,000 | | | | Taiyo Nippon Sanso Corp. | | 404,932 | |
12,000 | | | | Takasago International Corp. | | 71,588 | |
15,000 | | | | Takiron Co., Ltd. | | 51,379 | |
7,000 | | | | Tayca Corp. | | 24,748 | |
114,000 | | | | Teijin Ltd. | | 485,355 | |
3,800 | | | | Tenma Corp. | | 41,844 | |
15,000 | | @ | | Titan Kogyo KK | | 59,243 | |
17,000 | | | | Toagosei Co., Ltd. | | 79,326 | |
3,000 | | | | Toda Kogyo Corp. | | 31,122 | |
5,100 | | | | Toho Titanium Co., Ltd. | | 122,696 | |
17,000 | | | | Toho Zinc Co., Ltd. | | 90,179 | |
8,000 | | @ | | Tohpe Corp. | | 7,266 | |
29,000 | | | | Tokai Carbon Co., Ltd. | | 179,577 | |
27,000 | | | | Tokushu Tokai Holdings Co., Ltd. | | 62,303 | |
42,000 | | | | Tokuyama Corp. | | 216,478 | |
5,400 | | | | Tokyo Ohka Kogyo Co., Ltd. | | 115,735 | |
21,000 | | | | Tokyo Rope Manufacturing Co., Ltd. | | 69,787 | |
12,400 | | | | Tokyo Steel Manufacturing Co., Ltd. | | 134,715 | |
18,000 | | | | Tokyo Tekko Co., Ltd. | | 47,285 | |
16,000 | | | | Tomoegawa Co., Ltd. | | 43,243 | |
20,000 | | | | Tomoku Co., Ltd. | | 56,005 | |
27,000 | | | | Topy Industries Ltd. | | 71,609 | |
212,000 | | | | Toray Industries, Inc. | | 1,263,843 | |
58,000 | | L | | Tosoh Corp. | | 187,825 | |
23,000 | | | | Toyo Ink Manufacturing Co., Ltd. | | 112,648 | |
6,000 | | | | Toyo Kohan Co., Ltd. | | 36,843 | |
23,400 | | | | Toyo Seikan Kaisha Ltd. | | 443,296 | |
5,000 | | | | TYK Corp. | | 12,651 | |
146,000 | | | | Ube Industries Ltd. | | 437,186 | |
6,000 | | | | Wood One Co., Ltd. | | 19,723 | |
6,600 | | | | Yamato Kogyo Co., Ltd. | | 198,433 | |
18,000 | | | | Yodogawa Steel Works Ltd. | | 83,523 | |
4,000 | | | | Yushiro Chemical Industry Co., Ltd. | | 59,168 | |
24,000 | | | | Zeon Corp. | | 200,399 | |
| | | | | | 34,494,745 | |
| | | | Telecommunication Services: 3.7% | | | |
1,639 | | @ | | Invoice, Inc. | | 29,838 | |
423 | | | | KDDI Corp. | | 2,439,331 | |
105,500 | | | | Nippon Telegraph & Telephone Corp. | | 4,804,239 | |
2,238 | | | | NTT DoCoMo, Inc. | | 3,897,715 | |
119,400 | | | | Softbank Corp. | | 4,116,966 | |
| | | | | | 15,288,089 | |
| | | | Utilities: 4.7% | | | |
84,400 | | | | Chubu Electric Power Co., Inc. | | 2,071,877 | |
41,600 | | L | | Chugoku Electric Power Co., Inc. | | 844,325 | |
20,300 | | | | Electric Power Development Co. | | 635,751 | |
25,300 | | | | Hokkaido Electric Power Co., Inc. | | 516,645 | |
15,000 | | | | Hokkaido Gas Co., Ltd. | | 44,496 | |
29,200 | | | | Hokuriku Electric Power Co. | | 716,987 | |
111,800 | | | | Kansai Electric Power Co., Inc. | | 2,756,855 | |
58,600 | | | | Kyushu Electric Power Co., Inc. | | 1,311,936 | |
1,300 | | | | Okinawa Electric Power Co., Inc. | | 64,748 | |
273,000 | | | | Osaka Gas Co., Ltd. | | 1,058,267 | |
15,000 | | | | Saibu Gas Co., Ltd. | | 39,159 | |
28,600 | | L | | Shikoku Electric Power Co. | | 840,072 | |
9,000 | | | | Shizuoka Gas Co., Ltd. | | 53,746 | |
67,000 | | | | Toho Gas Co., Ltd. | | 334,461 | |
69,200 | | L | | Tohoku Electric Power Co., Inc. | | 1,540,688 | |
10,000 | | | | Tokai Corp. | | 41,394 | |
198,300 | | | | Tokyo Electric Power Co., Inc. | | 4,835,060 | |
352,000 | | | | Tokyo Gas Co., Ltd. | | 1,558,748 | |
| | | | | | 19,265,215 | |
| | | | Total Common Stock (Cost $359,633,969) | | 409,682,915 | |
| | | | | | | |
SHORT-TERM INVESTMENTS: 6.6% | | | |
| | | | Securities Lending Collateral(cc): 6.6% | | | |
27,020,064 | | | | BNY Mellon Overnight Government Fund (1) | | 27,020,064 | |
| | | | | | | |
| | | | Total Short-Term Investments (Cost $27,020,064) | | 27,020,064 | |
| | | | | | | |
| | | | Total Investments in Securities
(Cost $386,654,033) * | 105.7 | % | $ | 436,702,979 | |
| | | | Other Assets and Liabilities - Net | (5.7 | ) | (23,419,094 | ) |
| | | | Net Assets | 100.0 | % | $ | 413,283,885 | |
| | @ | | Non-income producing security |
| | (cc) | | Securities purchased with cash collateral for securities loaned. |
| | (1) | | Collateral received from brokers for securities lending was invested in these short-term investments. |
| | L | | Loaned security, a portion or all of the security is on loan at December 31, 2010. |
| PORTFOLIO OF INVESTMENTS |
ING RussellTM Large Cap Growth Index Portfolio | as of December 31, 2010 |
Shares | | | | | | Value | |
| | | | | | | |
COMMON STOCK: 98.5% | | | |
| | | | Consumer Discretionary: 12.5% | | | |
28,571 | | @ | | Amazon.com, Inc. | | $ | 5,142,780 | |
27,810 | | | | Best Buy Co., Inc. | | 953,605 | |
13,560 | | | | Carnival Corp. | | 625,252 | |
69,220 | | @ | | DIRECTV | | 2,763,955 | |
271,300 | | @, L | | Ford Motor Co. | | 4,555,127 | |
34,030 | | | | Gap, Inc. | | 753,424 | |
137,830 | | | | Home Depot, Inc. | | 4,832,320 | |
51,550 | | | | Johnson Controls, Inc. | | 1,969,210 | |
18,880 | | @ | | Kohl’s Corp. | | 1,025,939 | |
26,300 | | @, L | | Las Vegas Sands Corp. | | 1,208,485 | |
89,500 | | | | Lowe’s Cos., Inc. | | 2,244,660 | |
87,480 | | | | McDonald’s Corp. | | 6,714,965 | |
39,700 | | | | News Corp. - Class A | | 578,032 | |
29,230 | | | | Nike, Inc. | | 2,496,827 | |
20,600 | | | | Omnicom Group | | 943,480 | |
60,690 | | | | Staples, Inc. | | 1,381,911 | |
60,574 | | | | Starbucks Corp. | | 1,946,243 | |
59,880 | | | | Target Corp. | | 3,600,584 | |
10,100 | | | | Thomson Reuters Corp. | | 376,427 | |
19,500 | | | | Time Warner, Inc. | | 627,315 | |
34,000 | | | | TJX Cos., Inc. | | 1,509,260 | |
9,900 | | | | Viacom - Class B | | 392,139 | |
38,010 | | | | Yum! Brands, Inc. | | 1,864,391 | |
| | | | | | 48,506,331 | |
| | | | Consumer Staples: 11.1% | | | |
98,830 | | | | Altria Group, Inc. | | 2,433,195 | |
127,930 | | | | Coca-Cola Co. | | 8,413,956 | |
33,440 | | | | Colgate-Palmolive Co. | | 2,687,573 | |
35,850 | | | | Costco Wholesale Corp. | | 2,588,729 | |
12,570 | | | | CVS Caremark Corp. | | 437,059 | |
32,820 | | | | General Mills, Inc. | | 1,168,064 | |
19,080 | | | | Kellogg Co. | | 974,606 | |
26,740 | | | | Kimberly-Clark Corp. | | 1,685,690 | |
3,030 | | | | Kroger Co. | | 67,751 | |
75,480 | | | | PepsiCo, Inc. | | 4,931,108 | |
126,880 | | | | Philip Morris International, Inc. | | 7,426,286 | |
14,340 | | | | Procter & Gamble Co. | | 922,492 | |
49,200 | | | | Sysco Corp. | | 1,446,480 | |
70,600 | | | | Walgreen Co. | | 2,750,576 | |
96,770 | | | | Wal-Mart Stores, Inc. | | 5,218,806 | |
| | | | | | 43,152,371 | |
| | | | Energy: 12.7% | | | |
9,800 | | | | Baker Hughes, Inc. | | 560,266 | |
8,800 | | | | Chevron Corp. | | 803,000 | |
46,300 | | | | ConocoPhillips | | 3,153,030 | |
20,600 | | | | EOG Resources, Inc. | | 1,883,046 | |
381,910 | | | | ExxonMobil Corp. | | 27,925,254 | |
73,600 | | | | Halliburton Co. | | 3,005,088 | |
15,800 | | | | Marathon Oil Corp. | | 585,074 | |
13,700 | | | | Occidental Petroleum Corp. | | 1,343,970 | |
97,850 | | | | Schlumberger Ltd. | | 8,170,475 | |
28,827 | | @ | | Southwestern Energy Co. | | 1,078,995 | |
20,000 | | | | Williams Cos., Inc. | | 494,400 | |
| | | | | | 49,002,598 | |
| | | | Financials: 3.0% | | | |
4,300 | | | | ACE Ltd. | | 267,675 | |
36,090 | | | | Aflac, Inc. | | 2,036,559 | |
85,354 | | | | American Express Co. | | 3,663,394 | |
2,320 | | | | Blackrock, Inc. | | 442,146 | |
82,240 | | | | Charles Schwab Corp. | | 1,407,126 | |
12,400 | | | | Franklin Resources, Inc. | | 1,379,004 | |
15,300 | | | | Metlife, Inc. | | 679,932 | |
36,980 | | | | Morgan Stanley | | 1,006,226 | |
8,020 | | | | Northern Trust Corp. | | 444,388 | |
4,800 | | | | Travelers Cos., Inc. | | 267,408 | |
| | | | | | 11,593,858 | |
| | | | Health Care: 8.6% | | | |
113,170 | | | | Abbott Laboratories | | 5,421,975 | |
5,800 | | | | Alcon, Inc. | | 947,720 | |
24,649 | | | | Allergan, Inc. | | 1,692,647 | |
40,450 | | | | Baxter International, Inc. | | 2,047,579 | |
19,400 | | | | Becton Dickinson & Co. | | 1,639,688 | |
| | | | | | | | |
10,400 | | | | Cardinal Health, Inc. | | 398,424 | |
37,420 | | @ | | Celgene Corp. | | 2,213,019 | |
40,800 | | | | Covidien PLC | | 1,862,928 | |
19,390 | | | | Eli Lilly & Co. | | 679,426 | |
44,540 | | @ | | Express Scripts, Inc. | | 2,407,387 | |
16,930 | | @ | | Genzyme Corp. | | 1,205,416 | |
69,580 | | @ | | Gilead Sciences, Inc. | | 2,521,579 | |
33,620 | | | | Johnson & Johnson | | 2,079,397 | |
9,770 | | | | McKesson Corp. | | 687,613 | |
36,540 | | @ | | Medco Health Solutions, Inc. | | 2,238,806 | |
68,890 | | | | Medtronic, Inc. | | 2,555,130 | |
27,180 | | @ | | St. Jude Medical, Inc. | | 1,161,945 | |
26,210 | | | | Stryker Corp. | | 1,407,477 | |
| | | | | | 33,168,156 | |
| | | | Industrials: 12.1% | | | |
58,060 | | | | 3M Co. | | 5,010,578 | |
50,010 | | | | Boeing Co. | | 3,263,653 | |
51,030 | | | | Caterpillar, Inc. | | 4,779,470 | |
40,000 | | | | Danaher Corp. | | 1,886,800 | |
32,660 | | | | Deere & Co. | | 2,712,413 | |
61,280 | | | | Emerson Electric Co. | | 3,503,378 | |
16,900 | | | | FedEx Corp. | | 1,571,869 | |
201,500 | | | | General Electric Co. | | 3,685,435 | |
62,300 | | | | Honeywell International, Inc. | | 3,311,868 | |
35,900 | | | | Illinois Tool Works, Inc. | | 1,917,060 | |
20,120 | | | | Lockheed Martin Corp. | | 1,406,589 | |
30,320 | | | | Paccar, Inc. | | 1,740,974 | |
11,600 | | | | Precision Castparts Corp. | | 1,614,836 | |
6,200 | | | | Tyco International Ltd. | | 256,928 | |
5,240 | | | | Union Pacific Corp. | | 485,538 | |
58,170 | | | | United Parcel Service, Inc. - Class B | | 4,221,979 | |
69,360 | | | | United Technologies Corp. | | 5,460,019 | |
| | | | | | 46,829,387 | |
| | | | Information Technology: 33.5% | | | |
49,700 | | | | Accenture PLC | | 2,409,953 | |
11,750 | | | | Activision Blizzard, Inc. | | 146,171 | |
43,810 | | @ | | Adobe Systems, Inc. | | 1,348,472 | |
74,175 | | @ | | Apple, Inc. | | 23,925,888 | |
111,800 | | | | Applied Materials, Inc. | | 1,570,790 | |
40,980 | | | | Automatic Data Processing, Inc. | | 1,896,554 | |
41,320 | | | | Broadcom Corp. | | 1,799,486 | |
464,623 | | @ | | Cisco Systems, Inc. | | 9,399,323 | |
24,300 | | @ | | Cognizant Technology Solutions Corp. | | 1,780,947 | |
16,220 | | | | Corning, Inc. | | 313,370 | |
138,580 | | @ | | Dell, Inc. | | 1,877,759 | |
36,361 | | @ | | eBay, Inc. | | 1,011,927 | |
167,220 | | @ | | EMC Corp. | | 3,829,338 | |
19,827 | | @ | | Google, Inc. - Class A | | 11,776,643 | |
190,930 | | | | Hewlett-Packard Co. | | 8,038,153 | |
309,690 | | | | Intel Corp. | | 6,512,781 | |
104,300 | | | | International Business Machines Corp. | | 15,307,068 | |
43,810 | | @ | | Juniper Networks, Inc. | | 1,617,465 | |
7,815 | | | | Mastercard, Inc. | | 1,751,420 | |
416,800 | | | | Microsoft Corp. | | 11,637,056 | |
309,980 | | | | Oracle Corp. | | 9,702,374 | |
133,457 | | | | Qualcomm, Inc. | | 6,604,787 | |
6,250 | | @ | | Symantec Corp. | | 104,625 | |
45,990 | | | | Texas Instruments, Inc. | | 1,494,675 | |
37,975 | | | | Visa, Inc. | | 2,672,681 | |
6,161 | | @ | | VMware, Inc. | | 547,775 | |
48,664 | | @ | | Yahoo!, Inc. | | 809,282 | |
| | | | | | 129,886,763 | |
| | | | Materials: 4.6% | | | |
17,740 | | | | Air Products & Chemicals, Inc. | | 1,613,453 | |
12,350 | | | | Alcoa, Inc. | | 190,067 | |
26,040 | | | | EI Du Pont de Nemours & Co. | | 1,298,875 | |
37,990 | | | | Freeport-McMoRan Copper & Gold, Inc. | | 4,562,219 | |
44,485 | | | | Monsanto Co. | | 3,097,935 | |
13,090 | | | | Mosaic Co. | | 999,552 | |
38,760 | | | | Newmont Mining Corp. | | 2,381,027 | |
11,300 | | | | Nucor Corp. | | 495,166 | |
24,850 | | | | Praxair, Inc. | | 2,372,430 | |
14,080 | | | | Southern Copper Corp. | | 686,259 | |
| | | | | | 17,696,983 | |
| | | | Telecommunication Services: 0.4% | | | |
33,620 | | @ | | American Tower Corp. | | 1,736,137 | |
| | | | | | 1,736,137 | |
| | | | Total Common Stock
(Cost $288,150,940) | | 381,572,584 | |
REAL ESTATE INVESTMENT TRUSTS: 0.7% | | | |
| | | | Financials: 0.7% | | | |
10,600 | | | | Public Storage, Inc. | | 1,075,052 | |
16,506 | | | | Simon Property Group, Inc. | | 1,642,182 | |
| | | | | | | |
| | | | Total Real Estate Investment Trusts
(Cost $2,052,217) | | 2,717,234 | |
| | | | | | | |
| | | | Total Long-Term Investments
(Cost $290,203,157) | | 384,289,818 | |
| | | | | | | |
SHORT-TERM INVESTMENTS: 2.3% | | | |
| | | | Mutual Funds: 0.9% | | | |
3,348,000 | | | | Blackrock Liquidity Funds TempFund Portfolio - Class I | | 3,348,000 | |
| | | | | | | |
| | | | Total Mutual Funds
(Cost $3,348,000) | | 3,348,000 | |
| | | | | | | |
| | | | Securities Lending Collateral(cc): 1.4% | | | |
4,541,676 | | | | BNY Mellon Overnight Government Fund (1) | | 4,541,676 | |
1,230,638 | | R | | BNY Institutional Cash Reserves Fund, Series B (1)(2) | | 984,510 | |
| | | | | | | |
| | | | Total Securities Lending Collateral
(Cost $5,772,314) | | 5,526,186 | |
| | | | | | | |
| | | | Total Short-Term Investments
(Cost $9,120,314) | | 8,874,186 | |
| | | | | | | | |
| | | | Total Investments in Securities
(Cost $299,323,471) * | 101.5 | % | $ | 393,164,004 | |
| | | | Other Assets and Liabilities - Net | (1.5 | ) | (5,739,897 | ) |
| | | | Net Assets | 100.0 | % | $ | 387,424,107 | |
| | @ | | Non-income producing security |
| | (cc) | | Securities purchased with cash collateral for securities loaned. |
| | (1) | | Collateral received from brokers for securities lending was invested in these short-term investments. |
| | (2) | | On September 12, 2008, BNY established a separate sleeve of the Institutional Cash Reserves Fund (Series B) to hold certain Lehman Brothers defaulted debt obligations. The Portfolio’s position in Series B is being fair valued daily. Please see the accompanying Notes to Financial Statements for additional details on securities lending. |
| | R | | Restricted security |
| | L | | Loaned security, a portion or all of the security is on loan at December 31, 2010. |
| | PORTFOLIO OF INVESTMENTS |
ING RussellTM Large Cap Index Portfolio | | as of December 31, 2010 |
Shares | | | | | | Value | |
| | | | | | | |
COMMON STOCK: 95.8% | | | |
| | | | Consumer Discretionary: 9.2% | | | |
29,600 | | @ | | Amazon.com, Inc. | | $ | 5,328,000 | |
30,150 | | | | Best Buy Co., Inc. | | 1,033,844 | |
38,300 | | | | Carnival Corp. | | 1,766,013 | |
238,050 | | | | Comcast Corp. — Class A | | 5,229,959 | |
69,057 | | @ | | DIRECTV | | 2,757,446 | |
282,300 | | @, L | | Ford Motor Co. | | 4,739,817 | |
40,200 | | | | Gap, Inc. | | 890,028 | |
143,300 | | | | Home Depot, Inc. | | 5,024,098 | |
56,900 | | | | Johnson Controls, Inc. | | 2,173,580 | |
26,800 | | @ | | Kohl’s Corp. | | 1,456,312 | |
27,700 | | @, L | | Las Vegas Sands Corp. | | 1,272,815 | |
122,150 | | | | Lowe’s Cos., Inc. | | 3,063,522 | |
91,000 | | | | McDonald’s Corp. | | 6,985,160 | |
193,450 | | | | News Corp. - Class A | | 2,816,632 | |
30,500 | | | | Nike, Inc. | | 2,605,310 | |
26,850 | | | | Omnicom Group | | 1,229,730 | |
63,850 | | | | Staples, Inc. | | 1,453,865 | |
65,300 | | | | Starbucks Corp. | | 2,098,089 | |
62,400 | | | | Target Corp. | | 3,752,112 | |
32,700 | | | | Thomson Reuters Corp. | | 1,218,729 | |
30,993 | | | | Time Warner Cable, Inc. | | 2,046,468 | |
96,483 | | | | Time Warner, Inc. | | 3,103,858 | |
35,700 | | | | TJX Cos., Inc. | | 1,584,723 | |
53,150 | | | | Viacom - Class B | | 2,105,272 | |
165,700 | | | | Walt Disney Co. | | 6,215,407 | |
40,900 | | | | Yum! Brands, Inc. | | 2,006,145 | |
| | | | | | 73,956,934 | |
| | | | Consumer Staples: 10.8% | | | |
176,250 | | | | Altria Group, Inc. | | 4,339,275 | |
56,250 | | | | Archer-Daniels-Midland Co. | | 1,692,000 | |
178,250 | | | | Coca-Cola Co. | | 11,723,503 | |
41,550 | | | | Colgate-Palmolive Co. | | 3,339,374 | |
37,250 | | | | Costco Wholesale Corp. | | 2,689,823 | |
115,150 | | | | CVS Caremark Corp. | | 4,003,766 | |
58,100 | | | | General Mills, Inc. | | 2,067,779 | |
22,600 | | | | Kellogg Co. | | 1,154,408 | |
35,000 | | | | Kimberly-Clark Corp. | | 2,206,400 | |
135,750 | | | | Kraft Foods, Inc. | | 4,277,483 | |
56,450 | | | | Kroger Co. | | 1,262,222 | |
136,500 | | | | PepsiCo, Inc. | | 8,917,545 | |
156,800 | | | | Philip Morris International, Inc. | | 9,177,504 | |
243,732 | | | | Procter & Gamble Co. | | 15,679,280 | |
29,300 | | | | Reynolds American, Inc. | | 955,766 | |
51,850 | | | | Sysco Corp. | | 1,524,390 | |
78,850 | | | | Walgreen Co. | | 3,071,996 | |
165,750 | | | | Wal-Mart Stores, Inc. | | 8,938,898 | |
| | | | | | 87,021,412 | |
| | | | Energy: 12.4% | | | |
41,900 | | | | Anadarko Petroleum Corp. | | 3,191,104 | |
31,950 | | | | Apache Corp. | | 3,809,399 | |
37,500 | | | | Baker Hughes, Inc. | | 2,143,875 | |
56,900 | | | | Chesapeake Energy Corp. | | 1,474,279 | |
170,094 | | | | Chevron Corp. | | 15,521,078 | |
126,000 | | | | ConocoPhillips | | 8,580,600 | |
37,800 | | | | Devon Energy Corp. | | 2,967,678 | |
22,150 | | | | EOG Resources, Inc. | | 2,024,732 | |
433,403 | | | | ExxonMobil Corp. | | 31,690,427 | |
76,650 | | | | Halliburton Co. | | 3,129,620 | |
25,550 | | | | Hess Corp. | | 1,955,597 | |
62,150 | | | | Marathon Oil Corp. | | 2,301,415 | |
35,450 | | | | National Oilwell Varco, Inc. | | 2,384,013 | |
68,750 | | | | Occidental Petroleum Corp. | | 6,744,375 | |
115,650 | | | | Schlumberger Ltd. | | 9,656,775 | |
30,300 | | @ | | Southwestern Energy Co. | | 1,134,129 | |
51,100 | | | | Williams Cos., Inc. | | 1,263,192 | |
| | | | | | 99,972,288 | |
| | | | Financials: 13.9% | | | |
29,700 | | | | ACE Ltd. | | 1,848,825 | |
39,700 | | | | Aflac, Inc. | | 2,240,271 | |
47,100 | | | | Allstate Corp. | | 1,501,548 | |
88,800 | | | | American Express Co. | | 3,811,296 | |
849,243 | | | | Bank of America Corp. | | 11,328,902 | |
102,650 | | | | Bank of New York Mellon Corp. | | 3,100,030 | |
| | | | | | | | |
60,600 | | | | BB&T Corp. | | 1,593,174 | |
146,400 | | @ | | Berkshire Hathaway, Inc. | | 11,728,104 | |
7,450 | | | | Blackrock, Inc. | | 1,419,821 | |
40,000 | | | | Capital One Financial Corp. | | 1,702,400 | |
86,600 | | | | Charles Schwab Corp. | | 1,481,726 | |
27,350 | | | | Chubb Corp. | | 1,631,154 | |
1,790,450 | | @ | | Citigroup, Inc. | | 8,468,829 | |
5,800 | | | | CME Group, Inc. | | 1,866,150 | |
13,050 | | | | Franklin Resources, Inc. | | 1,451,291 | |
43,500 | | | | Goldman Sachs Group, Inc. | | 7,314,960 | |
336,685 | | | | JPMorgan Chase & Co. | | 14,282,178 | |
27,567 | | | | Loews Corp. | | 1,072,632 | |
55,000 | | | | Metlife, Inc. | | 2,444,200 | |
126,750 | | | | Morgan Stanley | | 3,448,868 | |
21,100 | | | | Northern Trust Corp. | | 1,169,151 | |
44,550 | | | | PNC Financial Services Group, Inc. | | 2,705,076 | |
40,650 | | | | Prudential Financial, Inc. | | 2,386,562 | |
43,850 | | | | State Street Corp. | | 2,032,009 | |
42,000 | | | | Travelers Cos., Inc. | | 2,339,820 | |
162,300 | | | | US Bancorp. | | 4,377,231 | |
411,971 | | | | Wells Fargo & Co. | | 12,766,981 | |
| | | | | | 111,513,189 | |
| | | | Health Care: 11.7% | | | |
130,600 | | | | Abbott Laboratories | | 6,257,046 | |
37,150 | | | | Aetna, Inc. | | 1,133,447 | |
6,100 | | | | Alcon, Inc. | | 996,740 | |
26,600 | | | | Allergan, Inc. | | 1,826,622 | |
81,100 | | @ | | Amgen, Inc. | | 4,452,390 | |
50,600 | | | | Baxter International, Inc. | | 2,561,372 | |
20,400 | | | | Becton Dickinson & Co. | | 1,724,208 | |
21,100 | | @ | | Biogen Idec, Inc. | | 1,414,755 | |
145,600 | | | | Bristol-Myers Squibb Co. | | 3,855,488 | |
31,650 | | | | Cardinal Health, Inc. | | 1,212,512 | |
39,050 | | @ | | Celgene Corp. | | 2,309,417 | |
43,900 | | | | Covidien PLC | | 2,004,474 | |
86,100 | | | | Eli Lilly & Co. | | 3,016,944 | |
46,400 | | @ | | Express Scripts, Inc. | | 2,507,920 | |
23,350 | | @ | | Genzyme Corp. | | 1,662,520 | |
73,300 | | @ | | Gilead Sciences, Inc. | | 2,656,392 | |
233,500 | | | | Johnson & Johnson | | 14,441,975 | |
23,750 | | | | McKesson Corp. | | 1,671,525 | |
38,750 | | @ | | Medco Health Solutions, Inc. | | 2,374,213 | |
93,300 | | | | Medtronic, Inc. | | 3,460,497 | |
263,885 | | | | Merck & Co., Inc. | | 9,510,415 | |
682,739 | | | | Pfizer, Inc. | | 11,954,760 | |
28,600 | | @ | | St. Jude Medical, Inc. | | 1,222,650 | |
27,650 | | | | Stryker Corp. | | 1,484,805 | |
35,900 | | @ | | Thermo Fisher Scientific, Inc. | | 1,987,424 | |
96,150 | | | | UnitedHealth Group, Inc. | | 3,471,977 | |
34,800 | | @ | | WellPoint, Inc. | | 1,978,728 | |
17,750 | | @ | | Zimmer Holdings, Inc. | | 952,820 | |
| | | | | | 94,104,036 | |
| | | | Industrials: 10.0% | | | |
60,300 | | | | 3M Co. | | 5,203,890 | |
64,300 | | | | Boeing Co. | | 4,196,218 | |
53,150 | | | | Caterpillar, Inc. | | 4,978,029 | |
34,150 | | | | CSX Corp. | | 2,206,432 | |
46,600 | | | | Danaher Corp. | | 2,198,122 | |
36,000 | | | | Deere & Co. | | 2,989,800 | |
63,800 | | | | Emerson Electric Co. | | 3,647,446 | |
26,550 | | | | FedEx Corp. | | 2,469,416 | |
30,250 | | | | General Dynamics Corp. | | 2,146,540 | |
903,650 | | | | General Electric Co. | | 16,527,740 | |
64,900 | | | | Honeywell International, Inc. | | 3,450,084 | |
38,550 | | | | Illinois Tool Works, Inc. | | 2,058,570 | |
27,050 | | | | Lockheed Martin Corp. | | 1,891,066 | |
32,400 | | | | Norfolk Southern Corp. | | 2,035,368 | |
26,350 | | | | Northrop Grumman Corp. | | 1,706,953 | |
31,950 | | L | | Paccar, Inc. | | 1,834,569 | |
12,400 | | | | Precision Castparts Corp. | | 1,726,204 | |
33,350 | | | | Raytheon Co. | | 1,545,439 | |
44,700 | | | | Tyco International Ltd. | | 1,852,368 | |
42,750 | | | | Union Pacific Corp. | | 3,961,215 | |
60,350 | | | | United Parcel Service, Inc. - Class B | | 4,380,203 | |
78,900 | | | | United Technologies Corp. | | 6,211,008 | |
42,300 | | | | Waste Management, Inc. | | 1,559,601 | |
| | | | | | 80,776,281 | |
| | | | Information Technology: 19.2% | | | |
51,700 | | | | Accenture PLC | | 2,506,932 | |
45,300 | | | | Activision Blizzard, Inc. | | 563,532 | |
46,150 | | @ | | Adobe Systems, Inc. | | 1,420,497 | |
77,100 | | @ | | Apple, Inc. | | 24,869,376 | |
117,600 | | | | Applied Materials, Inc. | | 1,652,280 | |
44,000 | | | | Automatic Data Processing, Inc. | | 2,036,320 | |
43,400 | | | | Broadcom Corp. | | 1,890,070 | |
483,400 | | @ | | Cisco Systems, Inc. | | 9,779,182 | |
26,200 | | @ | | Cognizant Technology Solutions Corp. | | 1,920,198 | |
132,050 | | | | Corning, Inc. | | 2,551,206 | |
148,900 | | @ | | Dell, Inc. | | 2,017,595 | |
97,400 | | @ | | eBay, Inc. | | 2,710,642 | |
174,050 | | @, L | | EMC Corp. | | 3,985,745 | |
20,700 | | @ | | Google, Inc. - Class A | | 12,295,179 | |
198,500 | | | | Hewlett-Packard Co. | | 8,356,850 | |
470,900 | | | | Intel Corp. | | 9,903,027 | |
108,550 | | | | International Business Machines Corp. | | 15,930,798 | |
46,100 | | @ | | Juniper Networks, Inc. | | 1,702,012 | |
8,450 | | | | Mastercard, Inc. | | 1,893,730 | |
648,280 | | | | Microsoft Corp. | | 18,099,978 | |
203,400 | | @ | | Motorola, Inc. | | 1,844,838 | |
322,445 | | | | Oracle Corp. | | 10,092,529 | |
138,900 | | | | Qualcomm, Inc. | | 6,874,161 | |
69,900 | | @, L | | Symantec Corp. | | 1,170,126 | |
103,400 | | | | Texas Instruments, Inc. | | 3,360,500 | |
39,550 | | | | Visa, Inc. | | 2,783,529 | |
6,400 | | @, L | | VMware, Inc. | | 569,024 | |
121,250 | | @ | | Yahoo!, Inc. | | 2,016,388 | |
| | | | | | 154,796,244 | |
| | | | Materials: 3.2% | | | |
18,600 | | | | Air Products & Chemicals, Inc. | | 1,691,670 | |
89,450 | | | | Alcoa, Inc. | | 1,376,636 | |
97,800 | | | | Dow Chemical Co. | | 3,338,892 | |
76,750 | | | | EI Du Pont de Nemours & Co. | | 3,828,290 | |
39,250 | | | | Freeport-McMoRan Copper & Gold, Inc. | | 4,713,533 | |
46,200 | | | | Monsanto Co. | | 3,217,368 | |
13,800 | | | | Mosaic Co. | | 1,053,768 | |
40,250 | | | | Newmont Mining Corp. | | 2,472,558 | |
27,600 | | | | Nucor Corp. | | 1,209,432 | |
25,800 | | | | Praxair, Inc. | | 2,463,126 | |
14,800 | | | | Southern Copper Corp. | | 721,352 | |
| | | | | | 26,086,625 | |
| | | | Telecommunication Services: 3.3% | | | |
35,300 | | @ | | American Tower Corp. | | 1,822,892 | |
500,100 | | | | AT&T, Inc. | | 14,692,938 | |
257,787 | | @, L | | Sprint Nextel Corp. | | 1,090,439 | |
239,350 | | | | Verizon Communications, Inc. | | 8,563,943 | |
| | | | | | 26,170,212 | |
| | | | Utilities: 2.1% | | | |
41,900 | | | | American Electric Power Co., Inc. | | 1,507,562 | |
52,250 | | | | Dominion Resources, Inc. | | 2,232,120 | |
114,950 | | | | Duke Energy Corp. | | 2,047,260 | |
16,600 | | | | Entergy Corp. | | 1,175,778 | |
55,900 | | | | Exelon Corp. | | 2,327,676 | |
36,350 | | | | NextEra Energy, Inc. | | 1,889,837 | |
32,600 | | | | Pacific Gas & Electric Co. | | 1,559,584 | |
44,250 | | | | Public Service Enterprise Group, Inc. | | 1,407,593 | |
69,850 | | | | Southern Co. | | 2,670,366 | |
| | | | | | 16,817,776 | |
| | | | Total Common Stock
(Cost $546,153,597) | | 771,214,997 | |
| | | | | | | |
REAL ESTATE INVESTMENT TRUSTS: 0.4% | | | |
| | | | Financials: 0.4% | | | |
12,300 | | L | | Public Storage, Inc. | | 1,247,466 | |
24,762 | | | | Simon Property Group, Inc. | | 2,463,571 | |
| | | | | | | |
| | | | Total Real Estate Investment Trusts
(Cost $2,494,032) | | 3,711,037 | |
| | | | | | | |
| | | | Total Long-Term Investments
(Cost $548,647,629) | | 774,926,034 | |
| | | | | | | |
SHORT-TERM INVESTMENTS: 4.7% | | | |
| | | | Mutual Funds: 3.5% | | | |
27,794,000 | | | | Blackrock Liquidity Funds TempFund Portfolio - Class I | | 27,794,000 | |
| | | | | | | |
| | | | Total Mutual Funds
(Cost $27,794,000) | | 27,794,000 | |
| | | | | | | |
| | | | Securities Lending Collateral(cc): 1.2% | | | |
9,158,429 | | | | BNY Mellon Overnight Government Fund (1) | | 9,158,429 | |
522,936 | | R | | BNY Institutional Cash Reserves Fund, Series B (1)(2) | | 418,349 | |
| | | | Total Securities Lending Collateral
(Cost $9,681,365) | | 9,576,778 | |
| | | | | | | |
| | | | Total Short-Term Investments
(Cost $37,475,365) | | 37,370,778 | |
| | | | | | | |
| | | | Total Investments in Securities
(Cost $586,122,994) * | 100.9 | % | $ | 812,296,812 | |
| | | | Other Assets and Liabilities - Net | (0.9 | ) | (6,952,748 | ) |
| | | | Net Assets | 100.0 | % | $ | 805,344,064 | |
| | @ | | Non-income producing security |
| | (cc) | | Securities purchased with cash collateral for securities loaned. |
| | (1) | | Collateral received from brokers for securities lending was invested in these short-term investments. |
| | (2) | | On September 12, 2008, BNY established a separate sleeve of the Institutional Cash Reserves Fund (Series B) to hold certain Lehman Brothers defaulted debt obligations. The Portfolio’s position in Series B is being fair valued daily. Please see the accompanying Notes to Financial Statements for additional details on securities lending. |
| | R | | Restricted security |
| | L | | Loaned security, a portion or all of the security is on loan at December 31, 2010. All or a portion of this security has been identified by the Fund to cover future collateral requirements for applicable futures, options, swaps, foreign currency contracts and/or when-issued or delayed-delivery securities. |
| PORTFOLIO OF INVESTMENTS |
ING RussellTM Large Cap Value Index Portfolio | as of December 31, 2010 |
Shares | | | | | | Value | |
| | | | | | | |
COMMON STOCK: 99.0% | | | |
| | | | Consumer Discretionary: 6.2% | | | |
5,500 | | | | Carnival Corp. | | $ | 253,605 | |
56,750 | | | | Comcast Corp. — Class A | | 1,246,798 | |
1,000 | | | | Gap, Inc. | | 22,140 | |
835 | | | | Johnson Controls, Inc. | | 31,897 | |
1,650 | | @ | | Kohl’s Corp. | | 89,661 | |
7,000 | | | | Lowe’s Cos., Inc. | | 175,560 | |
36,500 | | | | News Corp. - Class A | | 531,440 | |
1,200 | | | | Omnicom Group | | 54,960 | |
5,100 | | | | Thomson Reuters Corp. | | 190,077 | |
7,226 | | | | Time Warner Cable, Inc. | | 477,133 | |
18,248 | | | | Time Warner, Inc. | | 587,038 | |
9,800 | | | | Viacom - Class B | | 388,178 | |
39,505 | | | | Walt Disney Co. | | 1,481,833 | |
| | | | | | 5,530,320 | |
| | | | Consumer Staples: 11.2% | | | |
17,600 | | | | Altria Group, Inc. | | 433,312 | |
12,950 | | | | Archer-Daniels-Midland Co. | | 389,536 | |
10,795 | | | | Coca-Cola Co. | | 709,987 | |
1,600 | | | | Colgate-Palmolive Co. | | 128,592 | |
24,335 | | | | CVS Caremark Corp. | | 846,128 | |
5,460 | | | | General Mills, Inc. | | 194,321 | |
600 | | | | Kellogg Co. | | 30,648 | |
1,750 | | | | Kimberly-Clark Corp. | | 110,320 | |
32,400 | | | | Kraft Foods, Inc. | | 1,020,924 | |
12,300 | | | | Kroger Co. | | 275,028 | |
13,800 | | | | PepsiCo, Inc. | | 901,554 | |
5,900 | | | | Philip Morris International, Inc. | | 345,327 | |
54,585 | | | | Procter & Gamble Co. | | 3,511,453 | |
6,700 | | | | Reynolds American, Inc. | | 218,554 | |
1,800 | | | | Walgreen Co. | | 70,128 | |
15,500 | | | | Wal-Mart Stores, Inc. | | 835,915 | |
| | | | | | 10,021,727 | |
| | | | Energy: 13.0% | | | |
9,985 | | | | Anadarko Petroleum Corp. | | 760,458 | |
7,660 | | | | Apache Corp. | | 913,302 | |
6,300 | | | | Baker Hughes, Inc. | | 360,171 | |
13,050 | | | | Chesapeake Energy Corp. | | 338,126 | |
38,285 | | | | Chevron Corp. | | 3,493,506 | |
18,500 | | | | ConocoPhillips | | 1,259,850 | |
9,010 | | | | Devon Energy Corp. | | 707,375 | |
8,318 | | | | ExxonMobil Corp. | | 608,212 | |
5,890 | | | | Hess Corp. | | 450,821 | |
10,450 | | | | Marathon Oil Corp. | | 386,964 | |
8,400 | | | | National Oilwell Varco, Inc. | | 564,900 | |
13,030 | | | | Occidental Petroleum Corp. | | 1,278,243 | |
3,300 | | | | Schlumberger Ltd. | | 275,550 | |
6,920 | | | | Williams Cos., Inc. | | 171,062 | |
| | | | | | 11,568,540 | |
| | | | Financials: 26.4% | | | |
5,800 | | | | ACE Ltd. | | 361,050 | |
500 | | | | Aflac, Inc. | | 28,215 | |
10,900 | | | | Allstate Corp. | | 347,492 | |
202,293 | | | | Bank of America Corp. | | 2,698,589 | |
24,400 | | | | Bank of New York Mellon Corp. | | 736,880 | |
13,940 | | | | BB&T Corp. | | 366,483 | |
34,900 | | @ | | Berkshire Hathaway, Inc. | | 2,795,839 | |
1,150 | | | | Blackrock, Inc. | | 219,167 | |
9,200 | | | | Capital One Financial Corp. | | 391,552 | |
6,300 | | | | Chubb Corp. | | 375,732 | |
426,550 | | @ | | Citigroup, Inc. | | 2,017,582 | |
1,350 | | | | CME Group, Inc. | | 434,363 | |
10,400 | | | | Goldman Sachs Group, Inc. | | 1,748,864 | |
80,150 | | | | JPMorgan Chase & Co. | | 3,399,963 | |
6,400 | | | | Loews Corp. | | 249,024 | |
8,700 | | | | Metlife, Inc. | | 386,628 | |
20,215 | | | | Morgan Stanley | | 550,050 | |
2,900 | | | | Northern Trust Corp. | | 160,689 | |
10,650 | | | | PNC Financial Services Group, Inc. | | 646,668 | |
9,380 | | | | Prudential Financial, Inc. | | 550,700 | |
| | | | | | | | |
10,120 | | | | State Street Corp. | | 468,961 | |
8,545 | | | | Travelers Cos., Inc. | | 476,042 | |
38,610 | | | | US Bancorp. | | 1,041,312 | |
98,146 | | | | Wells Fargo & Co. | | 3,041,545 | |
| | | | | | 23,493,390 | |
| | | | Health Care: 15.8% | | | |
3,000 | | | | Abbott Laboratories | | 143,730 | |
8,530 | | | | Aetna, Inc. | | 260,250 | |
19,300 | | @ | | Amgen, Inc. | | 1,059,570 | |
2,000 | | | | Baxter International, Inc. | | 101,240 | |
5,100 | | @ | | Biogen Idec, Inc. | | 341,955 | |
34,650 | | | | Bristol-Myers Squibb Co. | | 917,532 | |
4,830 | | | | Cardinal Health, Inc. | | 185,037 | |
15,800 | | | | Eli Lilly & Co. | | 553,632 | |
1,300 | | @ | | Genzyme Corp. | | 92,560 | |
47,250 | | | | Johnson & Johnson | | 2,922,413 | |
3,060 | | | | McKesson Corp. | | 215,363 | |
5,100 | | | | Medtronic, Inc. | | 189,159 | |
62,900 | | | | Merck & Co., Inc. | | 2,266,916 | |
162,607 | | | | Pfizer, Inc. | | 2,847,249 | |
8,250 | | @ | | Thermo Fisher Scientific, Inc. | | 456,720 | |
22,900 | | | | UnitedHealth Group, Inc. | | 826,919 | |
8,270 | | @ | | WellPoint, Inc. | | 470,232 | |
4,100 | | @ | | Zimmer Holdings, Inc. | | 220,088 | |
| | | | | | 14,070,565 | |
| | | | Industrials: 8.4% | | | |
2,850 | | | | Boeing Co. | | 185,991 | |
7,780 | | | | CSX Corp. | | 502,666 | |
800 | | | | Danaher Corp. | | 37,736 | |
450 | | | | Deere & Co. | | 37,373 | |
2,250 | | | | FedEx Corp. | | 209,273 | |
7,000 | | | | General Dynamics Corp. | | 496,720 | |
165,305 | | | | General Electric Co. | | 3,023,428 | |
1,400 | | | | Lockheed Martin Corp. | | 97,874 | |
7,475 | | | | Norfolk Southern Corp. | | 469,580 | |
6,100 | | | | Northrop Grumman Corp. | | 395,158 | |
7,650 | | | | Raytheon Co. | | 354,501 | |
8,800 | | | | Tyco International Ltd. | | 364,672 | |
8,890 | | | | Union Pacific Corp. | | 823,747 | |
1,685 | | | | United Technologies Corp. | | 132,643 | |
9,750 | | | | Waste Management, Inc. | | 359,483 | |
| | | | | | 7,490,845 | |
| | | | Information Technology: 5.1% | | | |
7,650 | | | | Activision Blizzard, Inc. | | 95,166 | |
27,565 | | | | Corning, Inc. | | 532,556 | |
14,350 | | @ | | eBay, Inc. | | 399,361 | |
35,400 | | | | Intel Corp. | | 744,462 | |
51,100 | | | | Microsoft Corp. | | 1,426,712 | |
46,900 | | @ | | Motorola, Inc. | | 425,383 | |
14,600 | | @ | | Symantec Corp. | | 244,404 | |
13,400 | | | | Texas Instruments, Inc. | | 435,500 | |
16,200 | | @ | | Yahoo!, Inc. | | 269,406 | |
| | | | | | 4,572,950 | |
| | | | Materials: 2.0% | | | |
17,600 | | | | Alcoa, Inc. | | 270,864 | |
23,260 | | | | Dow Chemical Co. | | 794,096 | |
11,960 | | | | EI Du Pont de Nemours & Co. | | 596,565 | |
3,550 | | | | Nucor Corp. | | 155,561 | |
| | | | | | 1,817,086 | |
| | | | Telecommunication Services: 6.5% | | | |
119,100 | | | | AT&T, Inc. | | 3,499,151 | |
59,350 | | @ | | Sprint Nextel Corp. | | 251,051 | |
56,995 | | | | Verizon Communications, Inc. | | 2,039,281 | |
| | | | | | 5,789,483 | |
| | | | Utilities: 4.4% | | | |
9,690 | | | | American Electric Power Co., Inc. | | 348,646 | |
12,050 | | | | Dominion Resources, Inc. | | 514,776 | |
26,500 | | | | Duke Energy Corp. | | 471,965 | |
3,750 | | | | Entergy Corp. | | 265,613 | |
13,315 | | | | Exelon Corp. | | 554,437 | |
8,300 | | | | NextEra Energy, Inc. | | 431,517 | |
7,540 | | | | Pacific Gas & Electric Co. | | 360,714 | |
10,210 | | | | Public Service Enterprise Group, Inc. | | 324,780 | |
16,600 | | | | Southern Co. | | 634,618 | |
| | | | | | 3,907,066 | |
| | | | Total Common Stock
(Cost $65,122,209) | | 88,261,972 | |
REAL ESTATE INVESTMENT TRUSTS: 0.3% | | | |
| | | | Financials: 0.3% | | | |
300 | | | | Public Storage, Inc. | | 30,426 | |
1,858 | | | | Simon Property Group, Inc. | | 184,852 | |
| | | | | | | |
| | | | Total Real Estate Investment Trusts
(Cost $115,312) | | 215,278 | |
| | | | | | | |
| | | | Total Long-Term Investments
(Cost $65,237,521) | | 88,477,250 | |
| | | | | | | |
SHORT-TERM INVESTMENTS: 0.6% | | | |
| | | | Mutual Funds: 0.6% | | | |
532,000 | | | | Blackrock Liquidity Funds TempFund Portfolio - Class I | | 532,000 | |
| | | | | | | |
| | | | Total Short-Term Investments
(Cost $532,000) | | 532,000 | |
| | | | | | | |
| | | | Total Investments in Securities
(Cost $65,769,521) * | 99.9 | % | $ | 89,009,250 | |
| | | | Other Assets and Liabilities - Net | 0.1 | | 108,738 | |
| | | | Net Assets | 100.0 | % | $ | 89,117,988 | |
| | @ | | Non-income producing security |
| | PORTFOLIO OF INVESTMENTS |
ING RussellTM Mid Cap Growth Index Portfolio | | as of December 31, 2010 |
Shares | | | | | | Value | |
| | | | | |
COMMON STOCK: 92.7% | | | | | |
| | | | Consumer Discretionary: 18.9% | | | |
7,100 | | | | Aaron’s, Inc. | | $ | 144,769 | |
11,740 | | | | Abercrombie & Fitch Co. | | 676,576 | |
14,700 | | | | Advance Auto Parts, Inc. | | 972,405 | |
16,310 | | @ | | Aeropostale, Inc. | | 401,878 | |
8,980 | | | | American Eagle Outfitters | | 131,377 | |
21,700 | | @ | | Apollo Group, Inc. - Class A | | 856,933 | |
5,100 | | | | Autoliv, Inc. | | 402,594 | |
4,280 | | @, L | | Autonation, Inc. | | 120,696 | |
4,640 | | @ | | Autozone, Inc. | | 1,264,818 | |
9,600 | | @ | | Bally Technologies, Inc. | | 405,024 | |
44,180 | | @ | | Bed Bath & Beyond, Inc. | | 2,171,447 | |
14,160 | | @ | | Big Lots, Inc. | | 431,314 | |
18,240 | | @ | | BorgWarner, Inc. | | 1,319,846 | |
15,600 | | | | Brinker International, Inc. | | 325,728 | |
11,440 | | @, L | | Career Education Corp. | | 237,151 | |
37,500 | | @ | | Carmax, Inc. | | 1,195,500 | |
14,100 | | | | CBS Corp. - Class B | | 268,605 | |
31,140 | | | | Chico’s FAS, Inc. | | 374,614 | |
5,320 | | @ | | Chipotle Mexican Grill, Inc. | | 1,131,351 | |
340 | | | | Choice Hotels International, Inc. | | 13,012 | |
51,140 | | | | Coach, Inc. | | 2,828,553 | |
23,540 | | | | Darden Restaurants, Inc. | | 1,093,198 | |
11,140 | | | | DeVry, Inc. | | 534,497 | |
15,660 | | @ | | Dick’s Sporting Goods, Inc. | | 587,250 | |
34,800 | | @ | | Discovery Communications, Inc. - Class A | | 1,451,160 | |
12,200 | | @ | | Dollar General Corp. | | 374,174 | |
21,330 | | @ | | Dollar Tree, Inc. | | 1,196,186 | |
12,900 | | @ | | DreamWorks Animation SKG, Inc. | | 380,163 | |
4,200 | | @, L | | Education Management Corp. | | 76,020 | |
14,780 | | | | Expedia, Inc. | | 370,830 | |
22,660 | | | | Family Dollar Stores, Inc. | | 1,126,429 | |
820 | | @ | | Federal Mogul Corp. | | 16,933 | |
3,200 | | | | Fortune Brands, Inc. | | 192,800 | |
9,200 | | @ | | Fossil, Inc. | | 648,416 | |
1,180 | | L | | Garmin Ltd. | | 36,568 | |
24,320 | | | | Gentex Corp. | | 718,899 | |
42,400 | | @ | | Goodyear Tire & Rubber Co. | | 502,440 | |
11,280 | | | | Guess ?, Inc. | | 533,770 | |
23,760 | | | | H&R Block, Inc. | | 282,982 | |
16,640 | | @ | | Hanesbrands, Inc. | | 422,656 | |
39,500 | | | | Harley-Davidson, Inc. | | 1,369,465 | |
5,780 | | @ | | Harman International Industries, Inc. | | 267,614 | |
21,920 | | | | Hasbro, Inc. | | 1,034,186 | |
10,900 | | | | Hillenbrand, Inc. | | 226,829 | |
50,020 | | | | International Game Technology | | 884,854 | |
1,800 | | | | International Speedway Corp. | | 47,106 | |
82,000 | | @ | | Interpublic Group of Cos., Inc. | | 870,840 | |
5,990 | | @ | | ITT Educational Services, Inc. | | 381,503 | |
9,600 | | @ | | J Crew Group, Inc. | | 414,144 | |
13,400 | | | | JC Penney Co., Inc. | | 432,954 | |
7,280 | | | | John Wiley & Sons, Inc. | | 329,347 | |
2,100 | | @ | | Lamar Advertising Co. | | 83,664 | |
2,400 | | @ | | Lear Corp. | | 236,904 | |
15,280 | | | | Leggett & Platt, Inc. | | 347,773 | |
44,820 | | | | Limited Brands, Inc. | | 1,377,319 | |
24,960 | | @ | | LKQ Corp. | | 567,091 | |
7,300 | | | | Macy’s, Inc. | | 184,690 | |
3,400 | | @ | | Madison Square Garden, Inc. | | 87,652 | |
45,520 | | | | Marriott International, Inc. | | 1,890,901 | |
35,460 | | | | Mattel, Inc. | | 901,748 | |
37,120 | | | | McGraw-Hill Cos., Inc. | | 1,351,539 | |
2,700 | | | | Meredith Corp. | | 93,555 | |
7,680 | | @, L | | MGM Resorts International | | 114,048 | |
1,200 | | @ | | Mohawk Industries, Inc. | | 68,112 | |
3,860 | | | | Morningstar, Inc. | | 204,889 | |
6,920 | | @ | | NetFlix, Inc. | | 1,215,844 | |
28,020 | | | | Nordstrom, Inc. | | 1,187,488 | |
1,040 | | @ | | NVR, Inc. | | 718,661 | |
4,860 | | @ | | Office Depot, Inc. | | 26,244 | |
23,140 | | @ | | O’Reilly Automotive, Inc. | | 1,398,119 | |
5,380 | | @ | | Panera Bread Co. | | 544,510 | |
19,800 | | | | Petsmart, Inc. | | 788,436 | |
9,840 | | | | Phillips-Van Heusen | | 620,018 | |
| | | | | | | | |
9,360 | | | | Polo Ralph Lauren Corp. | | 1,038,211 | |
7,960 | | @ | | Priceline.com, Inc. | | 3,180,418 | |
3,260 | | | | Regal Entertainment Group | | 38,272 | |
20,560 | | | | Ross Stores, Inc. | | 1,300,420 | |
8,920 | | @ | | Royal Caribbean Cruises Ltd. | | 419,240 | |
15,640 | | | | Scripps Networks Interactive - Class A | | 809,370 | |
651,600 | | @ | | Sirius XM Radio, Inc. | | 1,068,624 | |
31,820 | | | | Starwood Hotels & Resorts Worldwide, Inc. | | 1,934,020 | |
2,380 | | L | | Strayer Education, Inc. | | 362,284 | |
12,600 | | @ | | Tempur-Pedic International, Inc. | | 504,756 | |
5,820 | | | | Thor Industries, Inc. | | 197,647 | |
21,240 | | | | Tiffany & Co. | | 1,322,615 | |
12,600 | | | | Tractor Supply Co. | | 610,974 | |
9,260 | | @, L | | TRW Automotive Holdings Corp. | | 488,002 | |
11,000 | | | | Tupperware Corp. | | 524,370 | |
20,460 | | @ | | Urban Outfitters, Inc. | | 732,673 | |
5,820 | | | | Weight Watchers International, Inc. | | 218,192 | |
22,080 | | | | Wendy’s/Arby’s Group, Inc. - Class A | | 102,010 | |
5,600 | | | | Whirlpool Corp. | | 497,448 | |
16,760 | | | | Williams-Sonoma, Inc. | | 598,164 | |
10,140 | | @ | | WMS Industries, Inc. | | 458,734 | |
12,700 | | | | Wynn Resorts Ltd. | | 1,318,768 | |
| | | | | | 64,212,821 | |
| | | | Consumer Staples: 4.8% | | | |
3,340 | | | | Alberto-Culver Co. | | 123,714 | |
71,820 | | | | Avon Products, Inc. | | 2,087,089 | |
740 | | @ | | BJ’s Wholesale Club, Inc. | | 35,446 | |
13,400 | | | | Brown-Forman Corp. | | 932,908 | |
18,440 | | | | Campbell Soup Co. | | 640,790 | |
11,880 | | | | Church & Dwight Co., Inc. | | 819,958 | |
22,260 | | | | Clorox Co. | | 1,408,613 | |
34,080 | | | | Coca-Cola Enterprises, Inc. | | 853,022 | |
7,800 | | | | ConAgra Foods, Inc. | | 176,124 | |
13,100 | | | | Dr Pepper Snapple Group, Inc. | | 460,596 | |
18,480 | | | | Estee Lauder Cos., Inc. | | 1,491,336 | |
4,940 | | | | Flowers Foods, Inc. | | 132,935 | |
19,280 | | @ | | Green Mountain Coffee Roasters, Inc. | | 633,541 | |
9,760 | | @ | | Hansen Natural Corp. | | 510,253 | |
10,480 | | | | Herbalife Ltd. | | 716,518 | |
15,020 | | | | Hershey Co. | | 708,193 | |
21,740 | | | | HJ Heinz Co. | | 1,075,260 | |
11,540 | | | | McCormick & Co., Inc. | | 536,956 | |
4,880 | | | | Mead Johnson Nutrition Co. | | 303,780 | |
79,060 | | | | Sara Lee Corp. | | 1,384,341 | |
23,500 | | @ | | Whole Foods Market, Inc. | | 1,188,865 | |
| | | | | | 16,220,238 | |
| | | | Energy: 5.7% | | | |
2,770 | | @ | | Alpha Natural Resources, Inc. | | 166,283 | |
20,000 | | | | Arch Coal, Inc. | | 701,200 | |
10,000 | | @ | | Atlas Energy, Inc. | | 439,700 | |
2,000 | | @ | | Atwood Oceanics, Inc. | | 74,740 | |
23,360 | | @ | | Cameron International Corp. | | 1,185,053 | |
14,100 | | | | Cimarex Energy Co. | | 1,248,273 | |
16,900 | | @ | | Concho Resources, Inc. | | 1,481,623 | |
18,100 | | | | Consol Energy, Inc. | | 882,194 | |
4,840 | | @ | | Continental Resources, Inc. | | 284,834 | |
7,800 | | @, L | | Core Laboratories NV | | 694,590 | |
3,860 | | L | | Diamond Offshore Drilling | | 258,118 | |
12,960 | | @ | | Dresser-Rand Group, Inc. | | 551,966 | |
22,560 | | | | El Paso Corp. | | 310,426 | |
23,220 | | | | EQT Corp. | | 1,041,185 | |
25,580 | | | | EXCO Resources, Inc. | | 496,764 | |
1,100 | | @ | | Exterran Holdings, Inc. | | 26,345 | |
20,340 | | @ | | FMC Technologies, Inc. | | 1,808,429 | |
12,600 | | @ | | Forest Oil Corp. | | 478,422 | |
7,400 | | L | | Frontline Ltd. | | 187,738 | |
5,300 | | | | Holly Corp. | | 216,081 | |
31,880 | | @ | | McDermott International, Inc. | | 659,597 | |
3,900 | | | | Murphy Oil Corp. | | 290,745 | |
19,900 | | @ | | Nabors Industries Ltd. | | 466,854 | |
600 | | @ | | Oil States International, Inc. | | 38,454 | |
37,440 | | @ | | PetroHawk Energy Corp. | | 683,280 | |
12,140 | | @ | | Pride International, Inc. | | 400,620 | |
1,320 | | @ | | Quicksilver Resources, Inc. | | 19,457 | |
26,740 | | | | Range Resources Corp. | | 1,202,765 | |
2,540 | | @ | | Rowan Cos., Inc. | | 88,671 | |
36,800 | | @ | | SandRidge Energy, Inc. | | 269,376 | |
7,500 | | | | SM Energy Co. | | 441,975 | |
1,000 | | @ | | Superior Energy Services | | 34,990 | |
25,500 | | @ | | Ultra Petroleum Corp. | | 1,218,135 | |
50,000 | | @ | | Weatherford International Ltd. | | 1,140,000 | |
600 | | @ | | Whiting Petroleum Corp. | | 70,314 | |
| | | | | | 19,559,197 | |
| | | | Financials: 5.4% | | | |
8,180 | | @ | | Affiliated Managers Group, Inc. | | 811,620 | |
9,020 | | | | Ameriprise Financial, Inc. | | 519,101 | |
9,924 | | | | AON Corp. | | 456,603 | |
500 | | @ | | Arch Capital Group Ltd. | | 44,025 | |
4,540 | | | | Arthur J. Gallagher & Co. | | 132,023 | |
6,240 | | | | Axis Capital Holdings Ltd. | | 223,891 | |
2,700 | | | | Bank of Hawaii Corp. | | 127,467 | |
10,560 | | | | Brown & Brown, Inc. | | 252,806 | |
498 | | | | Capitol Federal Financial, Inc. | | 5,931 | |
47,820 | | @ | | CB Richard Ellis Group, Inc. | | 979,354 | |
20,560 | | | | Eaton Vance Corp. | | 621,529 | |
820 | | | | Endurance Specialty Holdings Ltd. | | 37,777 | |
3,580 | | | | Erie Indemnity Co. | | 234,383 | |
10,560 | | L | | Federated Investors, Inc. | | 276,355 | |
15,780 | | @ | | Genworth Financial, Inc. | | 207,349 | |
5,100 | | | | Greenhill & Co., Inc. | | 416,568 | |
6,500 | | | | Hartford Financial Services Group, Inc. | | 172,185 | |
3,471 | | @ | | Howard Hughes Corp. | | 188,892 | |
6,960 | | | | Hudson City Bancorp., Inc. | | 88,670 | |
1,800 | | @ | | Interactive Brokers Group, Inc. | | 32,076 | |
12,420 | | @ | | IntercontinentalExchange, Inc. | | 1,479,843 | |
23,040 | | @ | | Invesco Ltd. | | 554,342 | |
2,900 | | | | Janus Capital Group, Inc. | | 37,613 | |
7,300 | | | | Jones Lang LaSalle, Inc. | | 612,616 | |
16,100 | | | | Lazard Ltd. | | 635,789 | |
83,700 | | | | Marsh & McLennan Cos., Inc. | | 2,288,358 | |
34,380 | | | | Moody’s Corp. | | 912,445 | |
19,220 | | @ | | MSCI, Inc. - Class A | | 748,811 | |
2,360 | | @ | | Nasdaq Stock Market, Inc. | | 55,956 | |
9,880 | | | | NYSE Euronext | | 296,202 | |
26,100 | | | | SEI Investments Co. | | 620,919 | |
14,560 | | @, L | | St Joe Co. | | 318,136 | |
43,500 | | | | T. Rowe Price Group, Inc. | | 2,807,490 | |
40,640 | | | | TD Ameritrade Holding Corp. | | 771,754 | |
1,600 | | @ | | Validus Holdings Ltd. | | 48,976 | |
15,040 | | | | Waddell & Reed Financial, Inc. | | 530,762 | |
| | | | | | 18,548,617 | |
| | | | Health Care: 12.2% | | | |
58,360 | | @ | | Agilent Technologies, Inc. | | 2,417,855 | |
4,320 | | @ | | Alere, Inc. | | 158,112 | |
15,040 | | @ | | Alexion Pharmaceuticals, Inc. | | 1,211,472 | |
20,040 | | @ | | Allscripts Healthcare Solutions, Inc. | | 386,171 | |
47,360 | | | | AmerisourceBergen Corp. | | 1,615,923 | |
25,020 | | @ | | Amylin Pharmaceuticals, Inc. | | 368,044 | |
17,720 | | @ | | BioMarin Pharmaceuticals, Inc. | | 477,200 | |
2,000 | | @ | | Brookdale Senior Living, Inc. | | 42,820 | |
6,900 | | @ | | CareFusion Corp. | | 177,330 | |
11,560 | | @ | | Cerner Corp. | | 1,095,194 | |
2,720 | | @ | | Charles River Laboratories International, Inc. | | 96,669 | |
11,480 | | @ | | Community Health Systems, Inc. | | 429,008 | |
1,500 | | | | Cooper Cos., Inc. | | 84,510 | |
11,240 | | @ | | Covance, Inc. | | 577,848 | |
15,960 | | | | CR Bard, Inc. | | 1,464,649 | |
17,420 | | @ | | DaVita, Inc. | | 1,210,516 | |
23,420 | | @ | | Dendreon Corp. | | 817,826 | |
24,580 | | | | Densply International, Inc. | | 839,899 | |
19,040 | | @ | | Edwards Lifesciences Corp. | | 1,539,194 | |
4,600 | | @ | | Emdeon, Inc. | | 62,284 | |
5,200 | | @ | | Emergency Medical Services Corp. | | 335,972 | |
8,640 | | @ | | Gen-Probe, Inc. | | 504,144 | |
43,720 | | @ | | Health Management Associates, Inc. | | 417,089 | |
15,300 | | @ | | Henry Schein, Inc. | | 939,267 | |
9,320 | | | | Hill-Rom Holdings, Inc. | | 366,928 | |
27,780 | | @ | | Hospira, Inc. | | 1,547,068 | |
31,400 | | @ | | Human Genome Sciences, Inc. | | 750,146 | |
10,040 | | @, L | | Idexx Laboratories, Inc. | | 694,969 | |
20,380 | | @, L | | Illumina, Inc. | | 1,290,869 | |
6,580 | | @ | | Intuitive Surgical, Inc. | | 1,695,995 | |
920 | | @ | | Kinetic Concepts, Inc. | | 38,530 | |
17,540 | | @ | | Laboratory Corp. of America Holdings | | 1,542,117 | |
21,720 | | @ | | Life Technologies Corp. | | 1,205,460 | |
17,360 | | | | Lincare Holdings, Inc. | | 465,769 | |
7,740 | | @ | | Mednax, Inc. | | 520,825 | |
5,620 | | @ | | Mettler Toledo International, Inc. | | 849,800 | |
60,000 | | @ | | Mylan Laboratories | | 1,267,800 | |
17,100 | | @ | | Myriad Genetics, Inc. | | 390,564 | |
2,060 | | | | Omnicare, Inc. | | 52,303 | |
17,800 | | | | Patterson Cos., Inc. | | 545,214 | |
9,320 | | | | PerkinElmer, Inc. | | 240,642 | |
13,520 | | | | Perrigo Co. | | 856,222 | |
18,420 | | | | Pharmaceutical Product Development, Inc. | | 499,919 | |
21,680 | | | | Quest Diagnostics | | 1,170,070 | |
11,300 | | @ | | Regeneron Pharmaceuticals, Inc. | | 370,979 | |
25,360 | | @ | | Resmed, Inc. | | 878,470 | |
10,600 | | @ | | SXC Health Solutions Corp. | | 454,316 | |
8,900 | | @ | | Talecris Biotherapeutics Holdings Corp. | | 207,370 | |
6,520 | | | | Techne Corp. | | 428,168 | |
1,100 | | | | Teleflex, Inc. | | 59,191 | |
61,060 | | @ | | Tenet Healthcare Corp. | | 408,491 | |
10,000 | | @ | | Thoratec Corp. | | 283,200 | |
8,660 | | @ | | United Therapeutics Corp. | | 547,485 | |
1,100 | | | | Universal Health Services, Inc. | | 47,762 | |
20,740 | | @ | | Varian Medical Systems, Inc. | | 1,436,867 | |
15,020 | | @ | | VCA Antech, Inc. | | 349,816 | |
33,940 | | @ | | Vertex Pharmaceuticals, Inc. | | 1,188,918 | |
15,700 | | @ | | Warner Chilcott PLC | | 354,192 | |
15,540 | | @ | | Waters Corp. | | 1,207,613 | |
| | | | | | 41,483,044 | |
| | | | Industrials: 15.1% | | | |
5,410 | | @ | | Aecom Technology Corp. | | 151,318 | |
5,380 | | @ | | Alliant Techsystems, Inc. | | 400,433 | |
26,700 | | | | Ametek, Inc. | | 1,047,975 | |
18,760 | | @ | | AMR Corp. | | 146,140 | |
280 | | @ | | Armstrong World Industries, Inc. | | 12,040 | |
1,060 | | | | Avery Dennison Corp. | | 44,880 | |
15,940 | | @ | | Babcock & Wilcox Co. | | 407,905 | |
12,600 | | | | Bucyrus International, Inc. | | 1,126,440 | |
720 | | | | Carlisle Cos., Inc. | | 28,613 | |
27,840 | | | | CH Robinson Worldwide, Inc. | | 2,232,490 | |
7,100 | | @ | | Chicago Bridge & Iron Co. NV | | 233,590 | |
800 | | @ | | CNH Global NV | | 38,192 | |
740 | | | | Con-way, Inc. | | 27,062 | |
28,100 | | @ | | Cooper Industries PLC | | 1,637,949 | |
3,440 | | | | Copa Holdings S.A. | | 202,410 | |
12,580 | | @ | | Copart, Inc. | | 469,863 | |
3,520 | | @ | | Corrections Corp. of America | | 88,211 | |
1,300 | | @ | | Covanta Holding Corp. | | 22,347 | |
33,680 | | | | Cummins, Inc. | | 3,705,137 | |
132,480 | | @ | | Delta Airlines, Inc. | | 1,669,248 | |
13,460 | | | | Donaldson Co., Inc. | | 784,449 | |
19,760 | | | | Dover Corp. | | 1,154,972 | |
8,780 | | | | Dun & Bradstreet Corp. | | 720,750 | |
7,600 | | | | Eaton Corp. | | 771,476 | |
35,720 | | | | Expeditors International Washington, Inc. | | 1,950,312 | |
22,240 | | L | | Fastenal Co. | | 1,332,398 | |
8,000 | | | | Flowserve Corp. | | 953,760 | |
1,840 | | | | Fluor Corp. | | 121,918 | |
6,580 | | @ | | FTI Consulting, Inc. | | 245,302 | |
8,600 | | | | Gardner Denver, Inc. | | 591,852 | |
2,200 | | | | GATX Corp. | | 77,616 | |
3,300 | | @ | | General Cable Corp. | | 115,797 | |
6,120 | | | | Goodrich Corp. | | 538,988 | |
10,600 | | | | Graco, Inc. | | 418,170 | |
1,060 | | | | Harsco Corp. | | 30,019 | |
28,800 | | @ | | Hertz Global Holdings, Inc. | | 417,312 | |
4,220 | | | | Hubbell, Inc. | | 253,749 | |
11,700 | | | | IDEX Corp. | | 457,704 | |
8,500 | | @ | | IHS, Inc. | | 683,315 | |
30,600 | | | | Iron Mountain, Inc. | | 765,306 | |
13,140 | | @ | | Jacobs Engineering Group, Inc. | | 602,469 | |
15,960 | | | | JB Hunt Transport Services, Inc. | | 651,328 | |
17,240 | | | | Joy Global, Inc. | | 1,495,570 | |
10,560 | | @ | | Kansas City Southern | | 505,402 | |
700 | | @ | | KAR Holdings, Inc. | | 9,660 | |
1,600 | | | | KBR, Inc. | | 48,752 | |
10,700 | | | | Kennametal, Inc. | | 422,222 | |
640 | | @ | | Kirby Corp. | | 28,192 | |
8,780 | | | | Landstar System, Inc. | | 359,453 | |
8,160 | | | | Lennox International, Inc. | | 385,886 | |
7,400 | | | | Lincoln Electric Holdings, Inc. | | 482,998 | |
22,900 | | | | Manitowoc Co., Inc. | | 300,219 | |
18,760 | | | | Masco Corp. | | 237,502 | |
7,580 | | | | MSC Industrial Direct Co. | | 490,350 | |
12,420 | | @ | | Navistar International Corp. | | 719,242 | |
15,700 | | @ | | Oshkosh Truck Corp. | | 553,268 | |
11,100 | | @ | | Owens Corning, Inc. | | 345,765 | |
19,600 | | | | Pall Corp. | | 971,768 | |
8,000 | | | | Parker Hannifin Corp. | | 690,400 | |
9,000 | | | | Pentair, Inc. | | 328,590 | |
25,900 | | | | Pitney Bowes, Inc. | | 626,262 | |
5,600 | | | | Regal-Beloit Corp. | | 373,856 | |
17,000 | | | | Republic Services, Inc. | | 507,620 | |
26,220 | | | | Robert Half International, Inc. | | 802,332 | |
23,960 | | | | Rockwell Automation, Inc. | | 1,718,172 | |
13,900 | | | | Rockwell Collins, Inc. | | 809,814 | |
15,740 | | | | Roper Industries, Inc. | | 1,203,008 | |
1,900 | | | | RR Donnelley & Sons Co. | | 33,193 | |
4,900 | | | | Ryder System, Inc. | | 257,936 | |
8,520 | | @ | | Shaw Group, Inc. | | 291,640 | |
17,320 | | | | Southwest Airlines Co. | | 224,814 | |
2,800 | | @ | | Spirit Aerosystems Holdings, Inc. | | 58,268 | |
1,700 | | | | SPX Corp. | | 121,533 | |
14,220 | | @ | | Stericycle, Inc. | | 1,150,682 | |
24,600 | | | | Textron, Inc. | | 581,544 | |
1,620 | | @ | | Thomas & Betts Corp. | | 78,246 | |
11,100 | | | | Timken Co. | | 529,803 | |
5,900 | | | | Toro Co. | | 363,676 | |
1,100 | | | | Towers Watson & Co. | | 57,266 | |
8,560 | | @ | | TransDigm Group, Inc. | | 616,406 | |
47,593 | | @ | | United Continental Holdings, Inc. | | 1,133,665 | |
4,800 | | @, L | | USG Corp. | | 80,784 | |
14,880 | | | | UTI Worldwide, Inc. | | 315,456 | |
3,860 | | | | Valmont Industries, Inc. | | 342,498 | |
18,000 | | @ | | Verisk Analytics, Inc. | | 613,440 | |
11,260 | | @ | | WABCO Holdings, Inc. | | 686,072 | |
1,300 | | | | Wabtec Corp. | | 68,757 | |
16,110 | | | | Waste Connections, Inc. | | 443,508 | |
2,400 | | @ | | Wesco International, Inc. | | 126,720 | |
10,380 | | | | WW Grainger, Inc. | | 1,433,582 | |
| | | | | | 51,356,997 | |
| | | | Information Technology: 22.0% | | | |
40,120 | | @ | | Advanced Micro Devices, Inc. | | 328,182 | |
29,940 | | @ | | Akamai Technologies, Inc. | | 1,408,677 | |
9,280 | | @, L | | Alliance Data Systems Corp. | | 659,158 | |
50,560 | | | | Altera Corp. | | 1,798,925 | |
10,080 | | @ | | Amdocs Ltd. | | 276,898 | |
29,140 | | | | Amphenol Corp. | | 1,538,009 | |
50,000 | | | | Analog Devices, Inc. | | 1,883,500 | |
15,760 | | @ | | Ansys, Inc. | | 820,623 | |
2,280 | | @ | | Arrow Electronics, Inc. | | 78,090 | |
12,200 | | @ | | Atheros Communications, Inc. | | 438,224 | |
71,900 | | @ | | Atmel Corp. | | 885,808 | |
38,420 | | @ | | Autodesk, Inc. | | 1,467,644 | |
18,500 | | | | Avago Technologies Ltd. | | 526,695 | |
680 | | | | AVX Corp. | | 10,492 | |
30,440 | | @ | | BMC Software, Inc. | | 1,434,942 | |
21,680 | | | | Broadridge Financial Solutions ADR | | 475,442 | |
53,100 | | | | CA, Inc. | | 1,297,764 | |
47,120 | | @ | | Cadence Design Systems, Inc. | | 389,211 | |
16,120 | | @, L | | Ciena Corp. | | 339,326 | |
31,180 | | @ | | Citrix Systems, Inc. | | 2,133,024 | |
22,200 | | @ | | Compuware Corp. | | 259,074 | |
18,040 | | @ | | Cree, Inc. | | 1,188,656 | |
28,620 | | @ | | Cypress Semiconductor Corp. | | 531,760 | |
2,500 | | | | Diebold, Inc. | | 80,125 | |
9,320 | | @ | | Dolby Laboratories, Inc. | | 621,644 | |
6,220 | | | | DST Systems, Inc. | | 275,857 | |
51,940 | | @ | | Electronic Arts, Inc. | | 850,777 | |
7,580 | | @ | | Equinix, Inc. | | 615,951 | |
13,480 | | @ | | F5 Networks, Inc. | | 1,754,557 | |
8,140 | | | | Factset Research Systems, Inc. | | 763,206 | |
9,300 | | @, L | | First Solar, Inc. | | 1,210,302 | |
17,060 | | @ | | Fiserv, Inc. | | 999,034 | |
25,680 | | @ | | Flir Systems, Inc. | | 763,980 | |
12,800 | | @ | | Gartner, Inc. | | 424,960 | |
11,520 | | @ | | Genpact Ltd. | | 175,104 | |
14,280 | | | | Global Payments, Inc. | | 659,879 | |
21,820 | | | | Harris Corp. | | 988,446 | |
6,240 | | @ | | IAC/InterActiveCorp | | 179,088 | |
16,000 | | @ | | Informatica Corp. | | 704,480 | |
1,700 | | @ | | Ingram Micro, Inc. | | 32,453 | |
7,340 | | | | Intersil Corp. | | 112,082 | |
47,020 | | @ | | Intuit, Inc. | | 2,318,086 | |
6,540 | | @ | | Itron, Inc. | | 362,643 | |
22,220 | | | | Jabil Circuit, Inc. | | 446,400 | |
37,640 | | @ | | JDS Uniphase Corp. | | 545,027 | |
1,600 | | | | KLA-Tencor Corp. | | 61,824 | |
21,180 | | @ | | Lam Research Corp. | | 1,096,700 | |
16,580 | | | | Lender Processing Services, Inc. | | 489,442 | |
37,540 | | | | Linear Technology Corp. | | 1,298,509 | |
90,780 | | @ | | Marvell Technology Group Ltd. | | 1,683,969 | |
50,680 | | | | Maxim Integrated Products | | 1,197,062 | |
26,180 | | @ | | McAfee, Inc. | | 1,212,396 | |
16,580 | | @ | | MEMC Electronic Materials, Inc. | | 186,691 | |
30,900 | | | | Microchip Technology, Inc. | | 1,057,089 | |
13,980 | | @ | | Micros Systems, Inc. | | 613,163 | |
10,860 | | @ | | Monster Worldwide, Inc. | | 256,622 | |
10,060 | | | | National Instruments Corp. | | 378,658 | |
37,720 | | | | National Semiconductor Corp. | | 519,027 | |
27,980 | | @ | | NCR Corp. | | 430,053 | |
57,760 | | @ | | NetApp, Inc. | | 3,174,485 | |
13,060 | | @ | | NeuStar, Inc. | | 340,213 | |
14,820 | | @ | | Novellus Systems, Inc. | | 478,982 | |
39,700 | | @ | | Nuance Communications, Inc. | | 721,746 | |
95,920 | | @ | | Nvidia Corp. | | 1,477,168 | |
75,020 | | @ | | ON Semiconductor Corp. | | 741,198 | |
54,100 | | | | Paychex, Inc. | | 1,672,231 | |
2,100 | | @ | | PMC - Sierra, Inc. | | 18,039 | |
14,900 | | @ | | Polycom, Inc. | | 580,802 | |
19,420 | | @ | | QLogic Corp. | | 330,528 | |
18,260 | | @ | | Rambus, Inc. | | 373,965 | |
31,645 | | @ | | Red Hat, Inc. | | 1,444,594 | |
17,080 | | @ | | Rovi Corp. | | 1,059,131 | |
51,860 | | @ | | SAIC, Inc. | | 822,500 | |
19,240 | | @ | | Salesforce.com, Inc. | | 2,539,680 | |
38,580 | | @ | | Sandisk Corp. | | 1,923,599 | |
61,400 | | @ | | Seagate Technology, Inc. | | 922,842 | |
7,978 | | @ | | Silicon Laboratories, Inc. | | 367,148 | |
30,900 | | @ | | Skyworks Solutions, Inc. | | 884,667 | |
12,200 | | | | Solera Holdings, Inc. | | 626,104 | |
6,640 | | @, L | | Sunpower Corp. - Class A | | 85,191 | |
1,600 | | @ | | Synopsys, Inc. | | 43,056 | |
27,940 | | @ | | Teradata Corp. | | 1,150,010 | |
31,440 | | @ | | Teradyne, Inc. | | 441,418 | |
21,180 | | @ | | Trimble Navigation Ltd. | | 845,717 | |
13,000 | | @ | | Varian Semiconductor Equipment Associates, Inc. | | 480,610 | |
30,580 | | @ | | VeriSign, Inc. | | 999,049 | |
7,600 | | @ | | VistaPrint NV | | 349,600 | |
9,372 | | @ | | WebMD Health Corp. | | 478,534 | |
9,200 | | @ | | Western Digital Corp. | | 311,880 | |
112,700 | | | | Western Union Co. | | 2,092,839 | |
45,300 | | | | Xilinx, Inc. | | 1,312,794 | |
5,720 | | @ | | Zebra Technologies Corp. | | 217,303 | |
| | | | | | 74,843,033 | |
| | | | Materials: 6.5% | | | |
14,000 | | | | Airgas, Inc. | | 874,440 | |
2,900 | | | | AK Steel Holding Corp. | | 47,473 | |
15,280 | | | | Albemarle Corp. | | 852,318 | |
16,500 | | | | Allegheny Technologies, Inc. | | 910,470 | |
1,180 | | | | Ashland, Inc. | | 60,015 | |
3,420 | | | | Ball Corp. | | 232,731 | |
7,700 | | | | Carpenter Technology Corp. | | 309,848 | |
26,280 | | | | Celanese Corp. | | 1,081,948 | |
8,631 | | | | CF Industries Holdings, Inc. | | 1,166,480 | |
22,760 | | | | Cliffs Natural Resources, Inc. | | 1,775,508 | |
5,680 | | | | Compass Minerals International, Inc. | | 507,054 | |
27,200 | | @ | | Crown Holdings, Inc. | | 907,936 | |
7,640 | | | | Eagle Materials, Inc. | | 215,830 | |
2,600 | | | | Eastman Chemical Co. | | 218,608 | |
39,120 | | | | Ecolab, Inc. | | 1,972,430 | |
8,660 | | | | FMC Corp. | | 691,847 | |
13,840 | | | | International Flavors & Fragrances, Inc. | | 769,366 | |
57,000 | | | | International Paper Co. | | 1,552,680 | |
11,440 | | | | Lubrizol Corp. | | 1,222,707 | |
7,900 | | L | | Martin Marietta Materials, Inc. | | 728,696 | |
22,580 | | | | Nalco Holding Co. | | 721,205 | |
8,940 | | @ | | Owens-Illinois, Inc. | | 274,458 | |
4,800 | | | | PPG Industries, Inc. | | 403,536 | |
1,500 | | | | Reliance Steel & Aluminum Co. | | 76,650 | |
1,280 | | | | Royal Gold, Inc. | | 69,926 | |
11,320 | | | | RPM International, Inc. | | 250,172 | |
820 | | | | Schnitzer Steel Industries, Inc. | | 54,440 | |
7,980 | | | | Scotts Miracle-Gro Co. | | 405,145 | |
9,520 | | | | Sherwin-Williams Co. | | 797,300 | |
18,820 | | | | Sigma-Aldrich Corp. | | 1,252,659 | |
3,500 | | | | Temple-Inland, Inc. | | 74,340 | |
14,900 | | @ | | Titanium Metals Corp. | | 255,982 | |
4,700 | | L | | United States Steel Corp. | | 274,574 | |
1,800 | | | | Valspar Corp. | | 62,064 | |
7,400 | | | | Walter Industries, Inc. | | 946,016 | |
| | | | | | 22,016,852 | |
| | | | Telecommunication Services: 1.8% | | | |
20,200 | | @, L | | Clearwire Corp. | | 104,030 | |
48,660 | | @ | | Crown Castle International Corp. | | 2,132,768 | |
66,020 | | | | Frontier Communications Corp. | | 642,375 | |
111,500 | | @ | | Level 3 Communications, Inc. | | 109,270 | |
20,920 | | @ | | MetroPCS Communications, Inc. | | 264,220 | |
22,180 | | @ | | NII Holdings, Inc. | | 990,559 | |
19,660 | | @ | | SBA Communications Corp. | | 804,880 | |
26,440 | | @ | | TW Telecom, Inc. | | 450,802 | |
35,000 | | | | Windstream Corp. | | 487,900 | |
| | | | | | 5,986,804 | |
| | | | Utilities: 0.3% | | | |
28,360 | | @ | | Calpine Corp. | | 378,322 | |
7,680 | | | | ITC Holdings Corp. | | 476,006 | |
1,740 | | | | Ormat Technologies, Inc. | | 51,469 | |
| | | | | | 905,797 | |
| | | | Total Common Stock
(Cost $217,419,894) | | 315,133,400 | |
| | | | | | | |
REAL ESTATE INVESTMENT TRUSTS: 1.2% | | | |
| | | | Financials: 1.2% | | | |
2,700 | | | | AMB Property Corp. | | 85,617 | |
10,100 | | | | Apartment Investment & Management Co. | | 260,984 | |
13,820 | | L | | Digital Realty Trust, Inc. | | 712,283 | |
3,200 | | | | Equity Residential | | 166,240 | |
2,000 | | | | Essex Property Trust, Inc. | | 228,440 | |
6,440 | | | | Federal Realty Investment Trust | | 501,869 | |
53,700 | | | | General Growth Properties, Inc. | | 831,276 | |
12,080 | | | | Plum Creek Timber Co., Inc. | | 452,396 | |
5,200 | | | | Prologis | | 75,088 | |
4,200 | | | | Rayonier, Inc. | | 220,584 | |
1,900 | | | | UDR, Inc. | | 44,688 | |
7,400 | | | | Ventas, Inc. | | 388,352 | |
2,500 | | | | Vornado Realty Trust | | 208,325 | |
| | | | | | | |
| | | | Total Real Estate Investment Trusts (Cost $3,555,294) | | 4,176,142 | |
| | | | | | | |
| | | | Total Long-Term Investments (Cost $220,975,188) | | 319,309,542 | |
| | | | | | | |
SHORT-TERM INVESTMENTS: 9.0% | | | |
| | | | Mutual Funds: 6.5% | | | |
21,939,000 | | | | Blackrock Liquidity Funds TempFund Portfolio - Class I | | 21,939,000 | |
| | | | | | | |
| | | | Total Mutual Funds (Cost $21,939,000) | | 21,939,000 | |
| | | | | | | |
| | | | Securities Lending Collateral(cc): 2.5% | | | |
7,734,707 | | | | BNY Mellon Overnight Government Fund (1) | | 7,734,707 | |
1,077,859 | | R | | BNY Institutional Cash Reserves Fund, Series B (1)(2) | | 862,287 | |
| | | | | | | |
| | | | Total Securities Lending Collateral (Cost $8,812,566) | | 8,596,994 | |
| | | | | | | |
| | | | Total Short-Term Investments (Cost $30,751,566) | | 30,535,994 | |
| | | | | | | |
| | | | Total Investments in Securities (Cost $251,726,754) * | 102.9 | % | $ | 349,845,536 | |
| | | | Other Assets and Liabilities - Net | (2.9 | ) | (9,695,639 | ) |
| | | | Net Assets | 100.0 | % | $ | 340,149,897 | |
| | @ | | Non-income producing security | |
| | ADR | | American Depositary Receipt | |
| | (cc) | | Securities purchased with cash collateral for securities loaned. | |
| | (1) | | Collateral received from brokers for securities lending was invested in these short-term investments. | |
| | (2) | | On September 12, 2008, BNY established a separate sleeve of the Institutional Cash Reserves Fund (Series B) to hold certain Lehman Brothers defaulted debt obligations. The Portfolio’s position in Series B is being fair valued daily. Please see the accompanying Notes to Financial Statements for additional details on securities lending. | |
| | R | | Restricted security | |
| | L | | Loaned security, a portion or all of the security is on loan at December 31, 2010. | |
| | PORTFOLIO OF INVESTMENTS |
ING RussellTM Mid Cap Index Portfolio | | as of December 31, 2010 |
Shares | | | | | | Value | |
| | | | | | | |
COMMON STOCK: 92.2% | | | |
| | | | Consumer Discretionary: 15.0% | | | |
28,150 | | | | Aaron’s, Inc. | | $ | 573,979 | |
34,350 | | | | Abercrombie & Fitch Co. | | 1,979,591 | |
34,200 | | | | Advance Auto Parts, Inc. | | 2,262,330 | |
36,350 | | ‘@ | | Aeropostale, Inc. | | 895,664 | |
81,350 | | | | American Eagle Outfitters | | 1,190,151 | |
50,450 | | ‘@ | | Apollo Group, Inc. - Class A | | 1,992,271 | |
33,200 | | | | Autoliv, Inc. | | 2,620,808 | |
28,250 | | ‘@, L | | Autonation, Inc. | | 796,650 | |
10,850 | | ‘@ | | Autozone, Inc. | | 2,957,602 | |
21,500 | | ‘@ | | Bally Technologies, Inc. | | 907,085 | |
102,450 | | ‘@ | | Bed Bath & Beyond, Inc. | | 5,035,418 | |
31,600 | | ‘@ | | Big Lots, Inc. | | 962,536 | |
45,850 | | ‘@ | | BorgWarner, Inc. | | 3,317,706 | |
39,950 | | | | Brinker International, Inc. | | 834,156 | |
91,600 | | | | Cablevision Systems Corp. | | 3,099,744 | |
25,400 | | ‘@, L | | Career Education Corp. | | 526,542 | |
87,000 | | ‘@ | | Carmax, Inc. | | 2,773,560 | |
264,600 | | | | CBS Corp. - Class B | | 5,040,630 | |
14,700 | | ‘@ | | Central European Media Enterprises Ltd. | | 299,145 | |
69,400 | | | | Chico’s FAS, Inc. | | 834,882 | |
12,300 | | ‘@ | | Chipotle Mexican Grill, Inc. | | 2,615,718 | |
10,800 | | | | Choice Hotels International, Inc. | | 413,316 | |
15,750 | | ‘@ | | Clear Channel Outdoor Holdings, Inc. | | 221,130 | |
118,700 | | | | Coach, Inc. | | 6,565,297 | |
108,400 | | | | D.R. Horton, Inc. | | 1,293,212 | |
54,650 | | | | Darden Restaurants, Inc. | | 2,537,946 | |
24,700 | | | | DeVry, Inc. | | 1,185,106 | |
34,850 | | ‘@ | | Dick’s Sporting Goods, Inc. | | 1,306,875 | |
110,600 | | ‘@ | | Discovery Communications, Inc. - Class A | | 4,612,020 | |
77,900 | | ‘@ | | Dish Network Corp. | | 1,531,514 | |
27,200 | | ‘@ | | Dollar General Corp. | | 834,224 | |
51,750 | | ‘@ | | Dollar Tree, Inc. | | 2,902,140 | |
28,800 | | ‘@ | | DreamWorks Animation SKG, Inc. | | 848,736 | |
16,600 | | ‘@, L | | Education Management Corp. | | 300,460 | |
79,750 | | | | Expedia, Inc. | | 2,000,928 | |
52,550 | | | | Family Dollar Stores, Inc. | | 2,612,261 | |
7,650 | | ‘@ | | Federal Mogul Corp. | | 157,973 | |
60,900 | | | | Foot Locker, Inc. | | 1,194,858 | |
59,300 | | | | Fortune Brands, Inc. | | 3,572,825 | |
20,500 | | ‘@ | | Fossil, Inc. | | 1,444,840 | |
59,450 | | ‘@ | | GameStop Corp. | | 1,360,216 | |
92,650 | | | | Gannett Co., Inc. | | 1,398,089 | |
43,650 | | L | | Garmin Ltd. | | 1,352,714 | |
54,300 | | | | Gentex Corp. | | 1,605,108 | |
61,850 | | | | Genuine Parts Co. | | 3,175,379 | |
94,450 | | ‘@ | | Goodyear Tire & Rubber Co. | | 1,119,233 | |
25,100 | | | | Guess ?, Inc. | | 1,187,732 | |
128,100 | | | | H&R Block, Inc. | | 1,525,671 | |
37,200 | | ‘@ | | Hanesbrands, Inc. | | 944,880 | |
91,700 | | | | Harley-Davidson, Inc. | | 3,179,239 | |
27,100 | | ‘@ | | Harman International Industries, Inc. | | 1,254,730 | |
50,750 | | | | Hasbro, Inc. | | 2,394,385 | |
24,300 | | | | Hillenbrand, Inc. | | 505,683 | |
16,900 | | ‘@ | | Hyatt Hotels Corp. | | 773,344 | |
116,000 | | | | International Game Technology | | 2,052,040 | |
11,600 | | | | International Speedway Corp. | | 303,572 | |
190,350 | | ‘@ | | Interpublic Group of Cos., Inc. | | 2,021,517 | |
13,450 | | ‘@ | | ITT Educational Services, Inc. | | 856,631 | |
21,400 | | ‘@ | | J Crew Group, Inc. | | 923,196 | |
35,800 | | | | Jarden Corp. | | 1,105,146 | |
91,900 | | | | JC Penney Co., Inc. | | 2,969,289 | |
17,450 | | | | John Wiley & Sons, Inc. | | 789,438 | |
29,900 | | | | KB Home | | 403,351 | |
22,400 | | ‘@ | | Lamar Advertising Co. | | 892,416 | |
18,200 | | ‘@ | | Lear Corp. | | 1,796,522 | |
57,650 | | | | Leggett & Platt, Inc. | | 1,312,114 | |
61,950 | | | | Lennar Corp. | | 1,161,563 | |
98,900 | | ‘@, L | | Liberty Global, Inc. | | 3,499,082 | |
31,150 | | ‘@ | | Liberty Media Corp. - Capital Shares A | | 1,948,744 | |
232,400 | | ‘@ | | Liberty Media Corp. - Interactive - Class A | | 3,664,948 | |
20,000 | | ‘@ | | Liberty Media Corp. - Starz | | 1,329,600 | |
103,950 | | | | Limited Brands, Inc. | | 3,194,384 | |
55,550 | | ‘@ | | LKQ Corp. | | 1,262,096 | |
164,150 | | | | Macy’s, Inc. | | 4,152,995 | |
23,475 | | ‘@ | | Madison Square Garden, Inc. | | 605,186 | |
105,625 | | | | Marriott International, Inc. | | 4,387,663 | |
141,950 | | | | Mattel, Inc. | | 3,609,789 | |
122,750 | | | | McGraw-Hill Cos., Inc. | | 4,469,328 | |
14,700 | | | | MDC Holdings, Inc. | | 422,919 | |
13,950 | | | | Meredith Corp. | | 483,368 | |
106,550 | | ‘@, L | | MGM Resorts International | | 1,582,268 | |
21,800 | | ‘@ | | Mohawk Industries, Inc. | | 1,237,368 | |
8,600 | | | | Morningstar, Inc. | | 456,488 | |
15,600 | | ‘@ | | NetFlix, Inc. | | 2,740,920 | |
52,700 | | ‘@ | | New York Times Co. | | 516,460 | |
108,200 | | | | Newell Rubbermaid, Inc. | | 1,967,076 | |
65,050 | | | | Nordstrom, Inc. | | 2,756,819 | |
2,320 | | ‘@ | | NVR, Inc. | | 1,603,166 | |
107,050 | | ‘@ | | Office Depot, Inc. | | 578,070 | |
53,750 | | ‘@ | | O’Reilly Automotive, Inc. | | 3,247,575 | |
11,950 | | ‘@ | | Panera Bread Co. | | 1,209,460 | |
26,400 | | ‘@ | | Penn National Gaming, Inc. | | 927,960 | |
| | | | | | | | |
46,050 | | | | Petsmart, Inc. | | 1,833,711 | |
22,000 | | | | Phillips-Van Heusen | | 1,386,220 | |
21,700 | | | | Polo Ralph Lauren Corp. | | 2,406,964 | |
18,450 | | ‘@ | | Priceline.com, Inc. | | 7,371,698 | |
131,090 | | ‘@ | | Pulte Homes, Inc. | | 985,797 | |
48,750 | | | | RadioShack Corp. | | 901,388 | |
31,400 | | | | Regal Entertainment Group | | 368,636 | |
47,550 | | | | Ross Stores, Inc. | | 3,007,538 | |
51,250 | | ‘@ | | Royal Caribbean Cruises Ltd. | | 2,408,750 | |
34,850 | | | | Scripps Networks Interactive - Class A | | 1,803,488 | |
17,600 | | ‘@, L | | Sears Holding Corp. | | 1,298,000 | |
99,200 | | | | Service Corp. International | | 818,400 | |
33,250 | | ‘@ | | Signet Jewelers Ltd. | | 1,443,050 | |
1,512,100 | | ‘@, L | | Sirius XM Radio, Inc. | | 2,479,844 | |
62,377 | | | | Stanley Black & Decker, Inc. | | 4,171,150 | |
73,750 | | | | Starwood Hotels & Resorts Worldwide, Inc. | | 4,482,525 | |
5,500 | | L | | Strayer Education, Inc. | | 837,210 | |
28,100 | | ‘@ | | Tempur-Pedic International, Inc. | | 1,125,686 | |
13,100 | | | | Thor Industries, Inc. | | 444,876 | |
49,150 | | | | Tiffany & Co. | | 3,060,571 | |
56,250 | | ‘@ | | Toll Brothers, Inc. | | 1,068,750 | |
28,200 | | | | Tractor Supply Co. | | 1,367,418 | |
30,550 | | ‘@ | | TRW Automotive Holdings Corp. | | 1,609,985 | |
24,500 | | | | Tupperware Corp. | | 1,167,915 | |
47,450 | | ‘@ | | Urban Outfitters, Inc. | | 1,699,185 | |
34,250 | | | | VF Corp. | | 2,951,665 | |
129,200 | | | | Virgin Media, Inc. | | 3,519,408 | |
2,320 | | L | | Washington Post | | 1,019,640 | |
13,000 | | | | Weight Watchers International, Inc. | | 487,370 | |
128,100 | | | | Wendy’s/Arby’s Group, Inc. - Class A | | 591,822 | |
29,200 | | | | Whirlpool Corp. | | 2,593,836 | |
37,500 | | | | Williams-Sonoma, Inc. | | 1,338,375 | |
22,600 | | ‘@ | | WMS Industries, Inc. | | 1,022,424 | |
69,950 | | | | Wyndham Worldwide Corp. | | 2,095,702 | |
29,300 | | | | Wynn Resorts Ltd. | | 3,042,512 | |
| | | | | | 235,480,268 | |
| | | | Consumer Staples: 5.9% | | | |
33,350 | | | | Alberto-Culver Co. | | 1,235,284 | |
166,750 | | | | Avon Products, Inc. | | 4,845,755 | |
20,900 | | ‘@ | | BJ’s Wholesale Club, Inc. | | 1,001,110 | |
41,312 | | | | Brown-Forman Corp. | | 2,876,141 | |
56,050 | | ‘@ | | Bunge Ltd. | | 3,672,396 | |
71,500 | | | | Campbell Soup Co. | | 2,484,625 | |
27,550 | | ‘@ | | Central European Distribution Corp. | | 630,895 | |
27,650 | | | | Church & Dwight Co., Inc. | | 1,908,403 | |
54,750 | | | | Clorox Co. | | 3,464,580 | |
124,000 | | | | Coca-Cola Enterprises, Inc. | | 3,103,720 | |
173,300 | | | | ConAgra Foods, Inc. | | 3,913,114 | |
71,350 | | ‘@ | | Constellation Brands, Inc. | | 1,580,403 | |
29,300 | | | | Corn Products International, Inc. | | 1,347,800 | |
70,650 | | ‘@ | | Dean Foods Co. | | 624,546 | |
77,250 | | | | Del Monte Foods Co. | | 1,452,300 | |
95,650 | | | | Dr Pepper Snapple Group, Inc. | | 3,363,054 | |
27,300 | | ‘@ | | Energizer Holdings, Inc. | | 1,990,170 | |
42,950 | | | | Estee Lauder Cos., Inc. | | 3,466,065 | |
29,600 | | | | Flowers Foods, Inc. | | 796,536 | |
43,000 | | ‘@ | | Green Mountain Coffee Roasters, Inc. | | 1,412,980 | |
25,700 | | ‘@ | | Hansen Natural Corp. | | 1,343,596 | |
23,300 | | | | Herbalife Ltd. | | 1,593,021 | |
59,800 | | | | Hershey Co. | | 2,819,570 | |
123,000 | | | | HJ Heinz Co. | | 6,083,580 | |
26,900 | | | | Hormel Foods Corp. | | 1,378,894 | |
46,350 | | | | JM Smucker Co. | | 3,042,878 | |
59,450 | | | | Lorillard, Inc. | | 4,878,467 | |
51,550 | | | | McCormick & Co., Inc. | | 2,398,622 | |
79,600 | | | | Mead Johnson Nutrition Co. | | 4,955,100 | |
51,250 | | | | Molson Coors Brewing Co. | | 2,572,238 | |
21,300 | | ‘@ | | Ralcorp Holdings, Inc. | | 1,384,713 | |
151,200 | | | | Safeway, Inc. | | 3,400,488 | |
257,250 | | | | Sara Lee Corp. | | 4,504,448 | |
53,550 | | ‘@ | | Smithfield Foods, Inc. | | 1,104,737 | |
82,550 | | | | Supervalu, Inc. | | 794,957 | |
116,100 | | | | Tyson Foods, Inc. | | 1,999,242 | |
54,450 | | ‘@ | | Whole Foods Market, Inc. | | 2,754,626 | |
| | | | | | 92,179,054 | |
| | | | Energy: 8.6% | | | |
47,091 | | ‘@ | | Alpha Natural Resources, Inc. | | 2,826,873 | |
63,200 | | | | Arch Coal, Inc. | | 2,215,792 | |
30,500 | | ‘@ | | Atlas Energy, Inc. | | 1,341,085 | |
21,800 | | ‘@ | | Atwood Oceanics, Inc. | | 814,666 | |
40,450 | | | | Cabot Oil & Gas Corp. | | 1,531,033 | |
95,000 | | ‘@ | | Cameron International Corp. | | 4,819,350 | |
32,650 | | | | Cimarex Energy Co. | | 2,890,505 | |
28,500 | | ‘@ | | Cobalt International Energy, Inc. | | 347,985 | |
18,400 | | ‘@ | | Comstock Resources, Inc. | | 451,904 | |
37,400 | | ‘@ | | Concho Resources, Inc. | | 3,278,858 | |
87,850 | | | | Consol Energy, Inc. | | 4,281,809 | |
12,000 | | ‘@ | | Continental Resources, Inc. | | 706,200 | |
17,300 | | ‘@ | | Core Laboratories NV | | 1,540,565 | |
155,325 | | ‘@ | | Denbury Resources, Inc. | | 2,965,154 | |
26,800 | | | | Diamond Offshore Drilling | | 1,792,116 | |
32,050 | | ‘@ | | Dresser-Rand Group, Inc. | | 1,365,010 | |
273,800 | | | | El Paso Corp. | | 3,767,488 | |
57,850 | | | | EQT Corp. | | 2,593,994 | |
57,100 | | | | EXCO Resources, Inc. | | 1,108,882 | |
24,500 | | ‘@ | | Exterran Holdings, Inc. | | 586,775 | |
47,250 | | ‘@ | | FMC Technologies, Inc. | | 4,200,998 | |
43,700 | | ‘@ | | Forest Oil Corp. | | 1,659,289 | |
41,150 | | ‘@ | | Frontier Oil Corp. | | 741,112 | |
20,050 | | | | Frontline Ltd. | | 508,669 | |
36,550 | | | | Helmerich & Payne, Inc. | | 1,771,944 | |
17,250 | | | | Holly Corp. | | 703,283 | |
40,000 | | | | Massey Energy Co. | | 2,146,000 | |
89,950 | | ‘@ | | McDermott International, Inc. | | 1,861,066 | |
74,450 | | | | Murphy Oil Corp. | | 5,550,248 | |
110,900 | | ‘@ | | Nabors Industries Ltd. | | 2,601,714 | |
51,850 | | ‘@ | | Newfield Exploration Co. | | 3,738,904 | |
67,950 | | | | Noble Energy, Inc. | | 5,849,136 | |
21,400 | | ‘@ | | Oceaneering International, Inc. | | 1,575,682 | |
19,550 | | ‘@ | | Oil States International, Inc. | | 1,252,960 | |
59,900 | | | | Patterson-UTI Energy, Inc. | | 1,290,845 | |
104,600 | | | | Peabody Energy Corp. | | 6,692,308 | |
117,600 | | ‘@ | | PetroHawk Energy Corp. | | 2,146,200 | |
45,150 | | | | Pioneer Natural Resources Co. | | 3,919,923 | |
54,450 | | ‘@ | | Plains Exploration & Production Co. | | 1,750,023 | |
68,400 | | ‘@ | | Pride International, Inc. | | 2,257,200 | |
68,150 | | | | QEP Resources, Inc. | | 2,474,527 | |
45,950 | | ‘@ | | Quicksilver Resources, Inc. | | 677,303 | |
62,000 | | | | Range Resources Corp. | | 2,788,760 | |
44,550 | | ‘@ | | Rowan Cos., Inc. | | 1,555,241 | |
140,250 | | ‘@ | | SandRidge Energy, Inc. | | 1,026,630 | |
8,800 | | ‘@ | | SEACOR Holdings, Inc. | | 889,592 | |
24,400 | | | | SM Energy Co. | | 1,437,892 | |
48,350 | | | | Southern Union Co. | | 1,163,785 | |
252,100 | | | | Spectra Energy Corp. | | 6,299,979 | |
46,950 | | | | Sunoco, Inc. | | 1,892,555 | |
30,600 | | ‘@ | | Superior Energy Services | | 1,070,694 | |
16,550 | | | | Teekay Shipping Corp. | | 547,474 | |
54,950 | | ‘@ | | Tesoro Corp. | | 1,018,773 | |
20,200 | | | | Tidewater, Inc. | | 1,087,568 | |
59,200 | | ‘@ | | Ultra Petroleum Corp. | | 2,827,984 | |
15,650 | | ‘@ | | Unit Corp. | | 727,412 | |
220,000 | | | | Valero Energy Corp. | | 5,086,400 | |
288,000 | | ‘@ | | Weatherford International Ltd. | | 6,566,400 | |
22,750 | | ‘@ | | Whiting Petroleum Corp. | | 2,666,073 | |
| | | | | | 135,248,590 | |
| | | | Financials: 12.6% | | | |
17,250 | | ‘@ | | Affiliated Managers Group, Inc. | | 1,711,545 | |
2,570 | | ‘@ | | Alleghany Corp. | | 787,371 | |
19,650 | | ‘@ | | Allied World Assurance Co. | | 1,167,996 | |
33,400 | | | | American Financial Group, Inc. | | 1,078,486 | |
46,950 | | ‘@, L | | American International Group, Inc. | | 2,705,259 | |
2,700 | | | | American National Insurance | | 231,174 | |
100,200 | | | | Ameriprise Financial, Inc. | | 5,766,510 | |
127,834 | | | | AON Corp. | | 5,881,642 | |
20,350 | | ‘@ | | Arch Capital Group Ltd. | | 1,791,818 | |
74,500 | | | | Ares Capital Corp. | | 1,227,760 | |
40,300 | | | | Arthur J. Gallagher & Co. | | 1,171,924 | |
30,100 | | | | Aspen Insurance Holdings Ltd. | | 861,462 | |
67,350 | | | | Associated Banc-Corp. | | 1,020,353 | |
43,450 | | | | Assurant, Inc. | | 1,673,694 | |
71,800 | | | | Assured Guaranty Ltd. | | 1,270,860 | |
49,300 | | | | Axis Capital Holdings Ltd. | | 1,768,884 | |
32,450 | | L | | Bancorpsouth, Inc. | | 517,578 | |
18,700 | | | | Bank of Hawaii Corp. | | 882,827 | |
9,750 | | | | BOK Financial Corp. | | 520,650 | |
43,950 | | | | Brown & Brown, Inc. | | 1,052,163 | |
125,450 | | | | CapitalSource, Inc. | | 890,695 | |
17,496 | | | | Capitol Federal Financial, Inc. | | 208,377 | |
110,850 | | ‘@ | | CB Richard Ellis Group, Inc. | | 2,270,208 | |
56,850 | | | | Cincinnati Financial Corp. | | 1,801,577 | |
77,800 | | ‘@ | | CIT Group, Inc. | | 3,664,380 | |
17,650 | | | | City National Corp. | | 1,083,004 | |
10,250 | | ‘@ | | CNA Financial Corp. | | 277,263 | |
68,600 | | | | Comerica, Inc. | | 2,897,664 | |
29,655 | | | | Commerce Bancshares, Inc. | | 1,178,193 | |
20,400 | | | | Cullen/Frost Bankers, Inc. | | 1,246,848 | |
211,650 | | | | Discover Financial Services | | 3,921,875 | |
85,500 | | ‘@ | | E*Trade Financial Corp. | | 1,368,000 | |
57,600 | | | | East-West Bancorp., Inc. | | 1,126,080 | |
45,950 | | | | Eaton Vance Corp. | | 1,389,069 | |
17,800 | | | | Endurance Specialty Holdings Ltd. | | 820,046 | |
11,100 | | | | Erie Indemnity Co. | | 726,717 | |
22,900 | | | | Everest Re Group Ltd. | | 1,942,378 | |
34,650 | | L | | Federated Investors, Inc. | | 906,791 | |
89,350 | | | | Fidelity National Title Group, Inc. | | 1,222,308 | |
309,350 | | | | Fifth Third Bancorp. | | 4,541,258 | |
2,100 | | | | First Citizens BancShares, Inc. | | 397,005 | |
91,959 | | ‘@ | | First Horizon National Corp. | | 1,083,277 | |
81,300 | | L | | First Niagara Financial Group, Inc. | | 1,136,574 | |
49,600 | | ‘@, L | | Forest City Enterprises, Inc. | | 827,824 | |
77,050 | | | | Fulton Financial Corp. | | 796,697 | |
190,200 | | ‘@ | | Genworth Financial, Inc. | | 2,499,228 | |
11,500 | | | | Greenhill & Co., Inc. | | 939,320 | |
17,400 | | | | Hanover Insurance Group, Inc. | | 812,928 | |
172,800 | | | | Hartford Financial Services Group, Inc. | | 4,577,472 | |
44,750 | | | | HCC Insurance Holdings, Inc. | | 1,295,065 | |
9,406 | | ‘@ | | Howard Hughes Corp. | | 511,875 | |
183,800 | | | | Hudson City Bancorp., Inc. | | 2,341,612 | |
278,900 | | | | Huntington Bancshares, Inc. | | 1,916,043 | |
14,000 | | ‘@ | | Interactive Brokers Group, Inc. | | 249,480 | |
28,700 | | ‘@ | | IntercontinentalExchange, Inc. | | 3,419,605 | |
169,700 | | ‘@ | | Invesco Ltd. | | 4,082,982 | |
71,450 | | | | Janus Capital Group, Inc. | | 926,707 | |
45,350 | | | | Jefferies Group, Inc. | | 1,207,671 | |
16,400 | | | | Jones Lang LaSalle, Inc. | | 1,376,288 | |
342,050 | | | | Keycorp | | 3,027,143 | |
35,700 | | | | Lazard Ltd. | | 1,409,793 | |
63,650 | | | | Legg Mason, Inc. | | 2,308,586 | |
75,850 | | | | Leucadia National Corp. | | 2,213,303 | |
117,750 | | | | Lincoln National Corp. | | 3,274,628 | |
28,600 | | | | M&T Bank Corp. | | 2,489,630 | |
3,780 | | ‘@ | | Markel Corp. | | 1,429,331 | |
210,650 | | | | Marsh & McLennan Cos., Inc. | | 5,759,171 | |
205,150 | | | | Marshall & Ilsley Corp. | | 1,419,638 | |
59,650 | | ‘@, L | | MBIA, Inc. | | 715,204 | |
10,350 | | | | Mercury General Corp. | | 445,154 | |
79,850 | | | | Moody’s Corp. | | 2,119,219 | |
42,950 | | ‘@ | | MSCI, Inc. - Class A | | 1,673,332 | |
52,750 | | ‘@ | | Nasdaq Stock Market, Inc. | | 1,250,703 | |
169,400 | | | | New York Community Bancorp., Inc. | | 3,193,190 | |
101,600 | | | | NYSE Euronext | | 3,045,968 | |
93,800 | | | | Old Republic International Corp. | | 1,278,494 | |
8,950 | | ‘@ | | OneBeacon Insurance Group Ltd. | | 135,682 | |
30,500 | | | | PartnerRe Ltd. | | 2,450,675 | |
144,550 | | | | People’s United Financial, Inc. | | 2,025,146 | |
343,900 | | ‘@ | | Popular, Inc. | | 1,079,846 | |
124,450 | | | | Principal Financial Group, Inc. | | 4,052,092 | |
260,800 | | | | Progressive Corp. | | 5,182,096 | |
33,300 | | | | Protective Life Corp. | | 887,112 | |
38,600 | | | | Raymond James Financial, Inc. | | 1,262,220 | |
463,850 | | | | Regions Financial Corp. | | 3,246,950 | |
28,400 | | | | Reinsurance Group of America, Inc. | | 1,525,364 | |
22,500 | | | | RenaissanceRe Holdings Ltd. | | 1,433,025 | |
58,150 | | | | SEI Investments Co. | | 1,383,389 | |
189,100 | | ‘@ | | SLM Corp. | | 2,380,769 | |
36,000 | | ‘@, L | | St Joe Co. | | 786,600 | |
18,450 | | | | Stancorp Financial Group, Inc. | | 832,833 | |
194,500 | | | | SunTrust Bank | | 5,739,695 | |
13,500 | | | | Symetra Financial Corp. | | 184,950 | |
304,700 | | | | Synovus Financial Corp. | | 804,408 | |
100,950 | | | | T. Rowe Price Group, Inc. | | 6,515,313 | |
55,250 | | | | TCF Financial Corp. | | 818,253 | |
90,750 | | | | TD Ameritrade Holding Corp. | | 1,723,343 | |
31,150 | | | | TFS Financial Corp. | | 280,973 | |
32,100 | | | | Torchmark Corp. | | 1,917,654 | |
24,950 | | | | Transatlantic Holdings, Inc. | | 1,287,919 | |
19,850 | | | | Unitrin, Inc. | | 487,119 | |
129,450 | | | | UnumProvident Corp. | | 3,135,279 | |
31,900 | | ‘@ | | Validus Holdings Ltd. | | 976,459 | |
62,642 | | | | Valley National Bancorp. | | 895,781 | |
33,650 | | | | Waddell & Reed Financial, Inc. | | 1,187,509 | |
43,750 | | | | Washington Federal, Inc. | | 740,250 | |
500 | | | | Wesco Financial Corp. | | 184,205 | |
2,930 | | ‘@ | | White Mountains Insurance Group Ltd. | | 983,308 | |
35,450 | | | | Wilmington Trust Corp. | | 153,853 | |
49,400 | | | | WR Berkley Corp. | | 1,352,572 | |
133,100 | | | | XL Group PLC | | 2,904,242 | |
62,350 | | | | Zions Bancorp. | | 1,510,741 | |
| | | | | | 196,470,452 | |
| | | | Health Care: 8.8% | | | |
135,500 | | ‘@ | | Agilent Technologies, Inc. | | 5,613,764 | |
32,700 | | ‘@ | | Alere, Inc. | | 1,196,820 | |
34,900 | | ‘@ | | Alexion Pharmaceuticals, Inc. | | 2,811,195 | |
39,600 | | ‘@ | | Allscripts Healthcare Solutions, Inc. | | 763,092 | |
109,900 | | | | AmerisourceBergen Corp. | | 3,749,788 | |
55,850 | | ‘@ | | Amylin Pharmaceuticals, Inc. | | 821,554 | |
27,300 | | | | Beckman Coulter, Inc. | | 2,053,779 | |
39,550 | | ‘@ | | BioMarin Pharmaceuticals, Inc. | | 1,065,082 | |
7,600 | | ‘@ | | Bio-Rad Laboratories, Inc. | | 789,260 | |
590,000 | | ‘@ | | Boston Scientific Corp. | | 4,466,300 | |
33,300 | | ‘@ | | Brookdale Senior Living, Inc. | | 712,953 | |
70,300 | | ‘@ | | CareFusion Corp. | | 1,806,710 | |
29,200 | | ‘@ | | Cephalon, Inc. | | 1,802,224 | |
26,800 | | ‘@ | | Cerner Corp. | | 2,539,032 | |
25,700 | | ‘@ | | Charles River Laboratories International, Inc. | | 913,378 | |
107,600 | | | | Cigna Corp. | | 3,944,616 | |
36,850 | | ‘@ | | Community Health Systems, Inc. | | 1,377,085 | |
17,650 | | | | Cooper Cos., Inc. | | 994,401 | |
25,100 | | ‘@ | | Covance, Inc. | | 1,290,391 | |
57,600 | | ‘@ | | Coventry Health Care, Inc. | | 1,520,640 | |
36,950 | | | | CR Bard, Inc. | | 3,390,902 | |
40,350 | | ‘@ | | DaVita, Inc. | | 2,803,922 | |
52,600 | | ‘@ | | Dendreon Corp. | | 1,836,792 | |
57,000 | | | | Densply International, Inc. | | 1,947,690 | |
44,100 | | ‘@ | | Edwards Lifesciences Corp. | | 3,565,044 | |
11,100 | | ‘@ | | Emdeon, Inc. | | 150,294 | |
11,600 | | ‘@ | | Emergency Medical Services Corp. | | 749,476 | |
45,250 | | ‘@ | | Endo Pharmaceuticals Holdings, Inc. | | 1,615,878 | |
117,700 | | ‘@ | | Forest Laboratories, Inc. | | 3,764,046 | |
19,300 | | ‘@ | | Gen-Probe, Inc. | | 1,126,155 | |
97,450 | | ‘@ | | Health Management Associates, Inc. | | 929,673 | |
38,750 | | ‘@ | | Health Net, Inc. | | 1,057,488 | |
35,600 | | ‘@ | | Henry Schein, Inc. | | 2,185,484 | |
24,500 | | | | Hill-Rom Holdings, Inc. | | 964,565 | |
100,750 | | ‘@ | | Hologic, Inc. | | 1,896,115 | |
64,550 | | ‘@ | | Hospira, Inc. | | 3,594,790 | |
72,900 | | ‘@ | | Human Genome Sciences, Inc. | | 1,741,581 | |
66,200 | | ‘@ | | Humana, Inc. | | 3,623,788 | |
22,400 | | ‘@, L | | Idexx Laboratories, Inc. | | 1,550,528 | |
47,350 | | ‘@ | | Illumina, Inc. | | 2,999,149 | |
15,250 | | ‘@ | | Intuitive Surgical, Inc. | | 3,930,688 | |
24,400 | | ‘@ | | Kinetic Concepts, Inc. | | 1,021,872 | |
97,150 | | ‘@ | | King Pharmaceuticals, Inc. | | 1,364,958 | |
40,600 | | ‘@ | | Laboratory Corp. of America Holdings | | 3,569,552 | |
71,061 | | ‘@ | | Life Technologies Corp. | | 3,943,886 | |
21,500 | | ‘@ | | LifePoint Hospitals, Inc. | | 790,125 | |
38,700 | | | | Lincare Holdings, Inc. | | 1,038,321 | |
18,350 | | ‘@ | | Mednax, Inc. | | 1,234,772 | |
13,100 | | ‘@ | | Mettler Toledo International, Inc. | | 1,980,851 | |
155,600 | | ‘@ | | Mylan Laboratories | | 3,287,828 | |
38,100 | | ‘@ | | Myriad Genetics, Inc. | | 870,204 | |
46,850 | | | | Omnicare, Inc. | | 1,189,522 | |
39,650 | | | | Patterson Cos., Inc. | | 1,214,480 | |
45,850 | | | | PerkinElmer, Inc. | | 1,183,847 | |
31,500 | | | | Perrigo Co. | | 1,994,895 | |
41,050 | | | | Pharmaceutical Product Development, Inc. | | 1,114,097 | |
58,050 | | | | Quest Diagnostics | | 3,132,959 | |
25,200 | | ‘@ | | Regeneron Pharmaceuticals, Inc. | | 827,316 | |
59,000 | | ‘@, L | | Resmed, Inc. | | 2,043,760 | |
23,800 | | ‘@ | | SXC Health Solutions Corp. | | 1,020,068 | |
20,000 | | ‘@ | | Talecris Biotherapeutics Holdings Corp. | | 466,000 | |
14,450 | | | | Techne Corp. | | 948,932 | |
15,550 | | | | Teleflex, Inc. | | 836,746 | |
188,450 | | ‘@ | | Tenet Healthcare Corp. | | 1,260,731 | |
22,300 | | ‘@ | | Thoratec Corp. | | 631,536 | |
19,300 | | ‘@ | | United Therapeutics Corp. | | 1,220,146 | |
35,000 | | | | Universal Health Services, Inc. | | 1,519,700 | |
48,050 | | ‘@ | | Varian Medical Systems, Inc. | | 3,328,904 | |
33,450 | | ‘@ | | VCA Antech, Inc. | | 779,051 | |
78,700 | | ‘@ | | Vertex Pharmaceuticals, Inc. | | 2,756,861 | |
35,100 | | ‘@ | | Warner Chilcott PLC | | 791,856 | |
36,150 | | ‘@ | | Waters Corp. | | 2,809,217 | |
43,450 | | ‘@ | | Watson Pharmaceuticals, Inc. | | 2,244,193 | |
| | | | | | 138,073,298 | |
| | | | Industrials: 12.8% | | | |
39,450 | | ‘@ | | Aecom Technology Corp. | | 1,103,417 | |
36,200 | | ‘@ | | AGCO Corp. | | 1,833,892 | |
16,050 | | | | Alexander & Baldwin, Inc. | | 642,482 | |
12,900 | | ‘@ | | Alliant Techsystems, Inc. | | 960,147 | |
61,975 | | | | Ametek, Inc. | | 2,432,519 | |
129,500 | | ‘@ | | AMR Corp. | | 1,008,805 | |
7,800 | | ‘@ | | Armstrong World Industries, Inc. | | 335,400 | |
43,050 | | | | Avery Dennison Corp. | | 1,822,737 | |
44,975 | | ‘@ | | Babcock & Wilcox Co. | | 1,150,910 | |
37,350 | | ‘@ | | BE Aerospace, Inc. | | 1,383,071 | |
29,200 | | | | Bucyrus International, Inc. | | 2,610,480 | |
23,700 | | | | Carlisle Cos., Inc. | | 941,838 | |
64,550 | | | | CH Robinson Worldwide, Inc. | | 5,176,265 | |
39,400 | | ‘@ | | Chicago Bridge & Iron Co. NV | | 1,296,260 | |
51,650 | | | | Cintas Corp. | | 1,444,134 | |
9,900 | | ‘@ | | CNH Global NV | | 472,626 | |
20,950 | | | | Con-way, Inc. | | 766,142 | |
65,200 | | ‘@ | | Cooper Industries PLC | | 3,800,508 | |
11,900 | | | | Copa Holdings S.A. | | 700,196 | |
28,100 | | ‘@ | | Copart, Inc. | | 1,049,535 | |
44,250 | | ‘@ | | Corrections Corp. of America | | 1,108,905 | |
50,450 | | ‘@ | | Covanta Holding Corp. | | 867,236 | |
19,200 | | | | Crane Co. | | 788,544 | |
78,000 | | | | Cummins, Inc. | | 8,580,780 | |
307,262 | | ‘@ | | Delta Airlines, Inc. | | 3,871,501 | |
30,000 | | | | Donaldson Co., Inc. | | 1,748,400 | |
72,650 | | | | Dover Corp. | | 4,246,393 | |
19,600 | | | | Dun & Bradstreet Corp. | | 1,608,964 | |
65,250 | | | | Eaton Corp. | | 6,623,528 | |
49,250 | | | | Equifax, Inc. | | 1,753,300 | |
82,850 | | | | Expeditors International Washington, Inc. | | 4,523,610 | |
51,450 | | L | | Fastenal Co. | | 3,082,370 | |
21,800 | | | | Flowserve Corp. | | 2,598,996 | |
69,450 | | | | Fluor Corp. | | 4,601,757 | |
18,250 | | ‘@ | | FTI Consulting, Inc. | | 680,360 | |
20,400 | | | | Gardner Denver, Inc. | | 1,403,928 | |
17,950 | | | | GATX Corp. | | 633,276 | |
20,300 | | ‘@ | | General Cable Corp. | | 712,327 | |
48,750 | | | | Goodrich Corp. | | 4,293,413 | |
23,600 | | | | Graco, Inc. | | 931,020 | |
31,350 | | | | Harsco Corp. | | 887,832 | |
75,250 | | ‘@ | | Hertz Global Holdings, Inc. | | 1,090,373 | |
23,400 | | | | Hubbell, Inc. | | 1,407,042 | |
31,650 | | | | IDEX Corp. | | 1,238,148 | |
18,850 | | ‘@ | | IHS, Inc. | | 1,515,352 | |
125,300 | | | | Ingersoll-Rand PLC | | 5,900,377 | |
71,050 | | | | Iron Mountain, Inc. | | 1,776,961 | |
71,350 | | | | ITT Corp. | | 3,718,049 | |
48,650 | | ‘@ | | Jacobs Engineering Group, Inc. | | 2,230,603 | |
35,500 | | | | JB Hunt Transport Services, Inc. | | 1,448,755 | |
40,050 | | | | Joy Global, Inc. | | 3,474,338 | |
39,800 | | ‘@ | | Kansas City Southern | | 1,904,828 | |
10,800 | | ‘@ | | KAR Holdings, Inc. | | 149,040 | |
62,400 | | | | KBR, Inc. | | 1,901,328 | |
31,900 | | | | Kennametal, Inc. | | 1,258,774 | |
21,000 | | ‘@ | | Kirby Corp. | | 925,050 | |
45,050 | | | | L-3 Communications Holdings, Inc. | | 3,175,575 | |
19,500 | | | | Landstar System, Inc. | | 798,330 | |
18,250 | | | | Lennox International, Inc. | | 863,043 | |
16,650 | | | | Lincoln Electric Holdings, Inc. | | 1,086,746 | |
51,150 | | | | Manitowoc Co., Inc. | | 670,577 | |
31,900 | | | | Manpower, Inc. | | 2,002,044 | |
139,600 | | | | Masco Corp. | | 1,767,336 | |
16,950 | | | | MSC Industrial Direct Co. | | 1,096,496 | |
27,700 | | ‘@ | | Navistar International Corp. | | 1,604,107 | |
35,000 | | ‘@ | | Oshkosh Truck Corp. | | 1,233,400 | |
44,400 | | ‘@ | | Owens Corning, Inc. | | 1,383,060 | |
45,550 | | | | Pall Corp. | | 2,258,369 | |
62,600 | | | | Parker Hannifin Corp. | | 5,402,380 | |
38,450 | | | | Pentair, Inc. | | 1,403,810 | |
80,750 | | | | Pitney Bowes, Inc. | | 1,952,535 | |
81,850 | | ‘@ | | Quanta Services, Inc. | | 1,630,452 | |
15,000 | | | | Regal-Beloit Corp. | | 1,001,400 | |
126,410 | | | | Republic Services, Inc. | | 3,774,603 | |
58,300 | | | | Robert Half International, Inc. | | 1,783,980 | |
55,500 | | | | Rockwell Automation, Inc. | | 3,979,905 | |
61,250 | | | | Rockwell Collins, Inc. | | 3,568,425 | |
36,500 | | | | Roper Industries, Inc. | | 2,789,695 | |
80,250 | | | | RR Donnelley & Sons Co. | | 1,401,968 | |
20,600 | | | | Ryder System, Inc. | | 1,084,384 | |
32,750 | | ‘@ | | Shaw Group, Inc. | | 1,121,033 | |
22,500 | | | | Snap-On, Inc. | | 1,273,050 | |
289,600 | | | | Southwest Airlines Co. | | 3,759,008 | |
41,250 | | ‘@ | | Spirit Aerosystems Holdings, Inc. | | 858,413 | |
19,400 | | | | SPX Corp. | | 1,386,906 | |
32,950 | | ‘@ | | Stericycle, Inc. | | 2,666,314 | |
42,250 | | ‘@ | | Terex Corp. | | 1,311,440 | |
106,350 | | | | Textron, Inc. | | 2,514,114 | |
20,600 | | ‘@ | | Thomas & Betts Corp. | | 994,980 | |
33,650 | | | | Timken Co. | | 1,606,115 | |
13,100 | | | | Toro Co. | | 807,484 | |
16,700 | | | | Towers Watson & Co. | | 869,402 | |
19,200 | | ‘@ | | TransDigm Group, Inc. | | 1,382,592 | |
30,900 | | | | Trinity Industries, Inc. | | 822,249 | |
122,490 | | ‘@ | | United Continental Holdings, Inc. | | 2,917,712 | |
32,150 | | ‘@ | | URS Corp. | | 1,337,762 | |
26,350 | | ‘@, L | | USG Corp. | | 443,471 | |
39,450 | | | | UTI Worldwide, Inc. | | 836,340 | |
8,600 | | | | Valmont Industries, Inc. | | 763,078 | |
40,200 | | ‘@ | | Verisk Analytics, Inc. | | 1,370,016 | |
25,000 | | ‘@ | | WABCO Holdings, Inc. | | 1,523,250 | |
18,700 | | | | Wabtec Corp. | | 989,043 | |
45,300 | | | | Waste Connections, Inc. | | 1,247,109 | |
16,550 | | ‘@ | | Wesco International, Inc. | | 873,840 | |
24,100 | | | | WW Grainger, Inc. | | 3,328,451 | |
| | | | | | 201,132,614 | |
| | | | Information Technology: 14.3% | | | |
233,800 | | ‘@ | | Advanced Micro Devices, Inc. | | 1,912,484 | |
66,900 | | ‘@ | | Akamai Technologies, Inc. | | 3,147,645 | |
20,750 | | ‘@, L | | Alliance Data Systems Corp. | | 1,473,873 | |
117,400 | | | | Altera Corp. | | 4,177,092 | |
80,350 | | ‘@ | | Amdocs Ltd. | | 2,207,215 | |
67,550 | | | | Amphenol Corp. | | 3,565,289 | |
115,900 | | | | Analog Devices, Inc. | | 4,365,953 | |
35,250 | | ‘@ | | Ansys, Inc. | | 1,835,468 | |
41,500 | | ‘@ | | AOL, Inc. | | 983,965 | |
47,250 | | ‘@ | | Arrow Electronics, Inc. | | 1,618,313 | |
27,200 | | ‘@ | | Atheros Communications, Inc. | | 977,024 | |
179,300 | | ‘@ | | Atmel Corp. | | 2,208,976 | |
89,200 | | ‘@ | | Autodesk, Inc. | | 3,407,440 | |
41,300 | | | | Avago Technologies Ltd. | | 1,175,811 | |
59,000 | | ‘@ | | Avnet, Inc. | | 1,948,770 | |
18,650 | | | | AVX Corp. | | 287,770 | |
70,650 | | ‘@ | | BMC Software, Inc. | | 3,330,441 | |
53,050 | | | | Broadridge Financial Solutions ADR | | 1,163,387 | |
172,800 | | ‘@ | | Brocade Communications Systems, Inc. | | 914,112 | |
151,400 | | | | CA, Inc. | | 3,700,216 | |
105,250 | | ‘@ | | Cadence Design Systems, Inc. | | 869,365 | |
36,050 | | ‘@, L | | Ciena Corp. | | 758,853 | |
72,350 | | ‘@ | | Citrix Systems, Inc. | | 4,949,464 | |
36,700 | | ‘@ | | CommScope, Inc. | | 1,145,774 | |
60,000 | | | | Computer Sciences Corp. | | 2,976,000 | |
87,600 | | ‘@ | | Compuware Corp. | | 1,022,292 | |
38,750 | | ‘@ | | Convergys Corp. | | 510,338 | |
40,400 | | | | CoreLogic, Inc. | | 748,208 | |
41,800 | | ‘@ | | Cree, Inc. | | 2,754,202 | |
63,700 | | ‘@ | | Cypress Semiconductor Corp. | | 1,183,546 | |
25,600 | | | | Diebold, Inc. | | 820,480 | |
20,800 | | ‘@ | | Dolby Laboratories, Inc. | | 1,387,360 | |
13,750 | | | | DST Systems, Inc. | | 609,813 | |
14,450 | | ‘@, L | | EchoStar Holding Corp. | | 360,817 | |
128,300 | | ‘@ | | Electronic Arts, Inc. | | 2,101,554 | |
17,600 | | ‘@ | | Equinix, Inc. | | 1,430,176 | |
31,250 | | ‘@ | | F5 Networks, Inc. | | 4,067,500 | |
18,150 | | | | Factset Research Systems, Inc. | | 1,701,744 | |
48,850 | | ‘@ | | Fairchild Semiconductor International, Inc. | | 762,549 | |
109,955 | | | | Fidelity National Information Services, Inc. | | 3,011,667 | |
21,500 | | ‘@, L | | First Solar, Inc. | | 2,798,010 | |
59,350 | | ‘@ | | Fiserv, Inc. | | 3,475,536 | |
59,650 | | ‘@ | | Flir Systems, Inc. | | 1,774,588 | |
28,400 | | ‘@ | | Gartner, Inc. | | 942,880 | |
25,600 | | ‘@ | | Genpact Ltd. | | 389,120 | |
31,800 | | | | Global Payments, Inc. | | 1,469,478 | |
50,550 | | | | Harris Corp. | | 2,289,915 | |
35,250 | | ‘@ | | IAC/InterActiveCorp | | 1,011,675 | |
35,700 | | ‘@ | | Informatica Corp. | | 1,571,871 | |
64,400 | | ‘@ | | Ingram Micro, Inc. | | 1,229,396 | |
27,500 | | ‘@ | | International Rectifier Corp. | | 816,475 | |
48,150 | | | | Intersil Corp. | | 735,251 | |
109,150 | | ‘@ | | Intuit, Inc. | | 5,381,095 | |
15,700 | | ‘@ | | Itron, Inc. | | 870,565 | |
70,050 | | | | Jabil Circuit, Inc. | | 1,407,305 | |
83,950 | | ‘@ | | JDS Uniphase Corp. | | 1,215,596 | |
66,100 | | | | KLA-Tencor Corp. | | 2,554,104 | |
49,250 | | ‘@ | | Lam Research Corp. | | 2,550,165 | |
36,900 | | | | Lender Processing Services, Inc. | | 1,089,288 | |
30,600 | | ‘@ | | Lexmark International, Inc. | | 1,065,492 | |
87,200 | | | | Linear Technology Corp. | | 3,016,248 | |
254,250 | | ‘@ | | LSI Logic Corp. | | 1,522,958 | |
210,650 | | ‘@ | | Marvell Technology Group Ltd. | | 3,907,558 | |
117,700 | | | | Maxim Integrated Products | | 2,780,074 | |
60,700 | | ‘@ | | McAfee, Inc. | | 2,811,017 | |
88,450 | | ‘@ | | MEMC Electronic Materials, Inc. | | 995,947 | |
71,650 | | | | Microchip Technology, Inc. | | 2,451,147 | |
332,900 | | ‘@ | | Micron Technology, Inc. | | 2,669,858 | |
31,300 | | ‘@ | | Micros Systems, Inc. | | 1,372,818 | |
51,750 | | | | Molex, Inc. | | 1,175,760 | |
49,150 | | ‘@ | | Monster Worldwide, Inc. | | 1,161,415 | |
22,500 | | | | National Instruments Corp. | | 846,900 | |
92,550 | | | | National Semiconductor Corp. | | 1,273,488 | |
62,300 | | ‘@ | | NCR Corp. | | 957,551 | |
134,050 | | ‘@ | | NetApp, Inc. | | 7,367,300 | |
29,100 | | ‘@ | | NeuStar, Inc. | | 758,055 | |
135,500 | | ‘@ | | Novell, Inc. | | 802,160 | |
37,350 | | ‘@ | | Novellus Systems, Inc. | | 1,207,152 | |
88,450 | | ‘@ | | Nuance Communications, Inc. | | 1,608,021 | |
222,650 | | ‘@ | | Nvidia Corp. | | 3,428,810 | |
167,200 | | ‘@ | | ON Semiconductor Corp. | | 1,651,936 | |
125,600 | | | | Paychex, Inc. | | 3,882,296 | |
89,200 | | ‘@ | | PMC - Sierra, Inc. | | 766,228 | |
33,100 | | ‘@ | | Polycom, Inc. | | 1,290,238 | |
43,350 | | ‘@ | | QLogic Corp. | | 737,817 | |
40,850 | | ‘@ | | Rambus, Inc. | | 836,608 | |
73,350 | | ‘@ | | Red Hat, Inc. | | 3,348,428 | |
39,700 | | ‘@ | | Rovi Corp. | | 2,461,797 | |
120,400 | | ‘@ | | SAIC, Inc. | | 1,909,544 | |
44,550 | | ‘@ | | Salesforce.com, Inc. | | 5,880,600 | |
89,500 | | ‘@ | | Sandisk Corp. | | 4,462,470 | |
189,650 | | ‘@ | | Seagate Technology, Inc. | | 2,850,440 | |
17,850 | | ‘@ | | Silicon Laboratories, Inc. | | 821,457 | |
68,900 | | ‘@ | | Skyworks Solutions, Inc. | | 1,972,607 | |
27,300 | | | | Solera Holdings, Inc. | | 1,401,036 | |
37,900 | | ‘@, L | | Sunpower Corp. - Class A | | 486,257 | |
58,200 | | ‘@ | | Synopsys, Inc. | | 1,566,162 | |
20,100 | | ‘@ | | Tech Data Corp. | | 884,802 | |
149,950 | | | | Tellabs, Inc. | | 1,016,661 | |
64,950 | | ‘@ | | Teradata Corp. | | 2,673,342 | |
70,050 | | ‘@ | | Teradyne, Inc. | | 983,502 | |
64,050 | | | | Total System Services, Inc. | | 985,089 | |
47,150 | | ‘@ | | Trimble Navigation Ltd. | | 1,882,700 | |
29,000 | | ‘@ | | Varian Semiconductor Equipment Associates, Inc. | | 1,072,130 | |
70,950 | | ‘@ | | VeriSign, Inc. | | 2,317,937 | |
67,050 | | ‘@ | | Vishay Intertechnology, Inc. | | 984,294 | |
4,817 | | ‘@ | | Vishay Precision Group, Inc. | | 90,752 | |
17,000 | | ‘@ | | VistaPrint NV | | 782,000 | |
20,810 | | ‘@ | | WebMD Health Corp. | | 1,062,559 | |
89,100 | | ‘@ | | Western Digital Corp. | | 3,020,490 | |
261,500 | | | | Western Union Co. | | 4,856,055 | |
536,517 | | | | Xerox Corp. | | 6,180,676 | |
107,600 | | | | Xilinx, Inc. | | 3,118,248 | |
22,500 | | ‘@ | | Zebra Technologies Corp. | | 854,775 | |
| | | | | | 223,416,921 | |
| | | | Materials: 6.0% | | | |
32,450 | | | | Airgas, Inc. | | 2,026,827 | |
42,750 | | | | AK Steel Holding Corp. | | 699,818 | |
35,600 | | | | Albemarle Corp. | | 1,985,768 | |
38,350 | | | | Allegheny Technologies, Inc. | | 2,116,153 | |
26,400 | | | | Aptargroup, Inc. | | 1,255,848 | |
30,600 | | | | Ashland, Inc. | | 1,556,316 | |
35,850 | | | | Ball Corp. | | 2,439,593 | |
42,450 | | | | Bemis Co. | | 1,386,417 | |
25,400 | | | | Cabot Corp. | | 956,310 | |
17,050 | | | | Carpenter Technology Corp. | | 686,092 | |
60,950 | | | | Celanese Corp. | | 2,509,312 | |
27,683 | | | | CF Industries Holdings, Inc. | | 3,741,357 | |
52,750 | | | | Cliffs Natural Resources, Inc. | | 4,115,028 | |
44,350 | | | | Commercial Metals Co. | | 735,767 | |
12,800 | | | | Compass Minerals International, Inc. | | 1,142,656 | |
62,950 | | ‘@ | | Crown Holdings, Inc. | | 2,101,271 | |
19,000 | | | | Cytec Industries, Inc. | | 1,008,140 | |
16,400 | | | | Domtar Corp. | | 1,245,088 | |
17,050 | | | | Eagle Materials, Inc. | | 481,663 | |
28,100 | | | | Eastman Chemical Co. | | 2,362,648 | |
90,850 | | | | Ecolab, Inc. | | 4,580,657 | |
28,200 | | | | FMC Corp. | | 2,252,898 | |
13,400 | | | | Greif, Inc. - Class A | | 829,460 | |
73,450 | | | | Huntsman Corp. | | 1,146,555 | |
31,000 | | | | International Flavors & Fragrances, Inc. | | 1,723,290 | |
169,950 | | | | International Paper Co. | | 4,629,438 | |
17,300 | | ‘@ | | Intrepid Potash, Inc. | | 645,117 | |
26,500 | | | | Lubrizol Corp. | | 2,832,320 | |
17,650 | | L | | Martin Marietta Materials, Inc. | | 1,628,036 | |
66,450 | | | | MeadWestvaco Corp. | | 1,738,332 | |
50,500 | | | | Nalco Holding Co. | | 1,612,970 | |
64,150 | | ‘@ | | Owens-Illinois, Inc. | | 1,969,405 | |
40,150 | | | | Packaging Corp. of America | | 1,037,476 | |
64,750 | | | | PPG Industries, Inc. | | 5,443,533 | |
28,800 | | | | Reliance Steel & Aluminum Co. | | 1,471,680 | |
18,500 | | | | Royal Gold, Inc. | | 1,010,655 | |
50,450 | | | | RPM International, Inc. | | 1,114,945 | |
8,550 | | | | Schnitzer Steel Industries, Inc. | | 567,635 | |
17,850 | | | | Scotts Miracle-Gro Co. | | 906,245 | |
61,950 | | | | Sealed Air Corp. | | 1,576,628 | |
35,850 | | | | Sherwin-Williams Co. | | 3,002,438 | |
47,150 | | | | Sigma-Aldrich Corp. | | 3,138,304 | |
39,150 | | | | Sonoco Products Co. | | 1,318,181 | |
84,350 | | | | Steel Dynamics, Inc. | | 1,543,605 | |
41,850 | | | | Temple-Inland, Inc. | | 888,894 | |
33,250 | | ‘@ | | Titanium Metals Corp. | | 571,235 | |
55,800 | | L | | United States Steel Corp. | | 3,259,836 | |
38,650 | | | | Valspar Corp. | | 1,332,652 | |
49,700 | | L | | Vulcan Materials Co. | | 2,204,692 | |
20,800 | | | | Walter Industries, Inc. | | 2,659,072 | |
| | | | | | 93,188,256 | |
| | | | Telecommunication Services: 2.0% | | | |
116,935 | | L | | CenturyTel, Inc. | | 5,398,889 | |
58,400 | | ‘@ | | Clearwire Corp. | | 300,760 | |
113,000 | | ‘@ | | Crown Castle International Corp. | | 4,952,790 | |
383,100 | | | | Frontier Communications Corp. | | 3,727,563 | |
23,800 | | ‘@ | | Leap Wireless International, Inc. | | 291,788 | |
644,050 | | ‘@ | | Level 3 Communications, Inc. | | 631,169 | |
97,850 | | ‘@ | | MetroPCS Communications, Inc. | | 1,235,846 | |
65,100 | | ‘@ | | NII Holdings, Inc. | | 2,907,366 | |
675,500 | | | | Qwest Communications International, Inc. | | 5,140,555 | |
45,500 | | ‘@ | | SBA Communications Corp. | | 1,862,770 | |
32,850 | | | | Telephone & Data Systems, Inc. | | 1,200,668 | |
59,000 | | ‘@ | | TW Telecom, Inc. | | 1,005,950 | |
6,000 | | ‘@ | | United States Cellular Corp. | | 299,640 | |
188,000 | | | | Windstream Corp. | | 2,620,720 | |
| | | | | | 31,576,474 | |
| | | | Utilities: 6.2% | | | |
260,600 | | ‘@ | | AES Corp. | | 3,174,108 | |
30,300 | | | | AGL Resources, Inc. | | 1,086,255 | |
65,900 | | | | Allegheny Energy, Inc. | | 1,597,416 | |
43,100 | | | | Alliant Energy Corp. | | 1,584,787 | |
92,750 | | | | Ameren Corp. | | 2,614,623 | |
68,000 | | | | American Water Works Co., Inc. | | 1,719,720 | |
53,350 | | | | Aqua America, Inc. | | 1,199,308 | |
36,200 | | | | Atmos Energy Corp. | | 1,129,440 | |
135,900 | | ‘@ | | Calpine Corp. | | 1,812,906 | |
153,500 | | | | CenterPoint Energy, Inc. | | 2,413,020 | |
89,450 | | | | CMS Energy Corp. | | 1,663,770 | |
109,750 | | | | Consolidated Edison, Inc. | | 5,440,308 | |
71,850 | | | | Constellation Energy Group, Inc. | | 2,200,766 | |
46,350 | | | | DPL, Inc. | | 1,191,659 | |
65,550 | | | | DTE Energy Co. | | 2,970,726 | |
126,700 | | | | Edison International | | 4,890,620 | |
28,000 | | | | Energen Corp. | | 1,351,280 | |
118,600 | | L | | FirstEnergy Corp. | | 4,390,572 | |
297,921 | | ‘@ | | GenOn Energy, Inc. | | 1,135,079 | |
52,750 | | | | Great Plains Energy, Inc. | | 1,022,823 | |
36,250 | | | | Hawaiian Electric Industries | | 826,138 | |
29,900 | | | | Integrys Energy Group, Inc. | | 1,450,449 | |
19,500 | | | | ITC Holdings Corp. | | 1,208,610 | |
73,150 | | | | MDU Resources Group, Inc. | | 1,482,751 | |
28,600 | | | | National Fuel Gas Co. | | 1,876,732 | |
107,850 | | | | NiSource, Inc. | | 1,900,317 | |
68,500 | | | | Northeast Utilities | | 2,183,780 | |
99,350 | | ‘@ | | NRG Energy, Inc. | | 1,941,299 | |
41,550 | | | | NSTAR | | 1,752,995 | |
91,400 | | | | NV Energy, Inc. | | 1,284,170 | |
37,800 | | | | OGE Energy Corp. | | 1,721,412 | |
41,350 | | | | Oneok, Inc. | | 2,293,685 | |
7,600 | | | | Ormat Technologies, Inc. | | 224,808 | |
86,850 | | | | Pepco Holdings, Inc. | | 1,585,013 | |
42,250 | | | | Pinnacle West Capital Corp. | | 1,751,263 | |
181,400 | | | | PPL Corp. | | 4,774,448 | |
111,700 | | | | Progress Energy, Inc. | | 4,856,716 | |
68,150 | | | | Questar Corp. | | 1,186,492 | |
43,950 | | | | SCANA Corp. | | 1,784,370 | |
96,250 | | | | Sempra Energy | | 5,051,200 | |
83,250 | | | | TECO Energy, Inc. | | 1,481,850 | |
42,450 | | | | UGI Corp. | | 1,340,571 | |
31,600 | | | | Vectren Corp. | | 802,008 | |
43,100 | | | | Westar Energy, Inc. | | 1,084,396 | |
45,450 | | | | Wisconsin Energy Corp. | | 2,675,187 | |
178,750 | | | | Xcel Energy, Inc. | | 4,209,563 | |
| | | | | | 97,319,409 | |
| | | | Total Common Stock
(Cost $1,038,795,576) | | 1,444,085,336 | |
| | | | | | | |
REAL ESTATE INVESTMENT TRUSTS: 5.7% | | | |
| | | | Financials: 5.7% | | | |
21,300 | | | | Alexandria Real Estate Equities, Inc. | | 1,560,438 | |
65,450 | | | | AMB Property Corp. | | 2,075,420 | |
232,350 | | | | Annaly Capital Management, Inc. | | 4,163,712 | |
45,412 | | | | Apartment Investment & Management Co. | | 1,173,446 | |
32,240 | | | | AvalonBay Communities, Inc. | | 3,628,612 | |
54,150 | | | | Boston Properties, Inc. | | 4,662,315 | |
51,050 | | | | Brandywine Realty Trust | | 594,733 | |
24,800 | | | | BRE Properties, Inc. | | 1,078,800 | |
25,600 | | | | Camden Property Trust | | 1,381,888 | |
335,000 | | | | Chimera Investment Corp. | | 1,376,850 | |
25,087 | | | | CommonWealth REIT | | 639,969 | |
23,000 | | | | Corporate Office Properties Trust SBI MD | | 803,850 | |
77,500 | | | | Developers Diversified Realty Corp. | | 1,091,975 | |
30,400 | | L | | Digital Realty Trust, Inc. | | 1,566,816 | |
47,550 | | | | Douglas Emmett, Inc. | | 789,330 | |
87,350 | | | | Duke Realty Corp. | | 1,088,381 | |
110,150 | | | | Equity Residential | | 5,722,293 | |
11,750 | | | | Essex Property Trust, Inc. | | 1,342,085 | |
23,900 | | | | Federal Realty Investment Trust | | 1,862,527 | |
144,700 | | | | General Growth Properties, Inc. | | 2,239,956 | |
114,450 | | | | HCP, Inc. | | 4,210,616 | |
51,550 | | | | Health Care Real Estate Investment Trust, Inc. | | 2,455,842 | |
48,000 | | | | Hospitality Properties Trust | | 1,105,920 | |
256,124 | | | | Host Hotels & Resorts, Inc. | | 4,576,936 | |
157,850 | | | | Kimco Realty Corp. | | 2,847,614 | |
44,000 | | | | Liberty Property Trust | | 1,404,480 | |
50,498 | | | | Macerich Co. | | 2,392,090 | |
30,900 | | | | Mack-Cali Realty Corp. | | 1,021,554 | |
46,650 | | | | Nationwide Health Properties, Inc. | | 1,697,127 | |
20,400 | | L | | Piedmont Office Realty Trust, Inc. | | 410,856 | |
63,350 | | | | Plum Creek Timber Co., Inc. | | 2,372,458 | |
206,800 | | | | Prologis | | 2,986,192 | |
31,200 | | | | Rayonier, Inc. | | 1,638,624 | |
40,600 | | | | Realty Income Corp. | | 1,388,520 | |
31,900 | | | | Regency Centers Corp. | | 1,347,456 | |
49,600 | | | | Senior Housing Properties Trust | | 1,088,224 | |
30,300 | | | | SL Green Realty Corp. | | 2,045,553 | |
21,200 | | | | Taubman Centers, Inc. | | 1,070,176 | |
63,068 | | | | UDR, Inc. | | 1,483,359 | |
61,050 | | | | Ventas, Inc. | | 3,203,904 | |
62,850 | | | | Vornado Realty Trust | | 5,237,291 | |
46,800 | | | | Weingarten Realty Investors | | 1,111,968 | |
222,632 | | | | Weyerhaeuser Co. | | 4,214,424 | |
| | | | | | | |
| | | | Total Real Estate Investment Trusts
(Cost $65,836,303) | | 90,154,580 | |
| | | | | | | |
| | | | Total Long-Term Investments
(Cost $1,104,631,879) | | 1,534,239,916 | |
| | | | | | | |
SHORT-TERM INVESTMENTS: 4.6% | | | |
| | | | Mutual Funds: 2.0% | | | |
31,081,000 | | | | Blackrock Liquidity Funds TempFund Portfolio - Class I | | 31,081,000 | |
| | | | | | | |
| | | | Total Mutual Funds
(Cost $31,081,000) | | 31,081,000 | |
| | | | | | | |
| | | | Securities Lending Collateral(cc): 2.6% | | | |
40,539,943 | | | | BNY Mellon Overnight Government Fund (1) | | 40,539,943 | |
268,841 | | R | | BNY Institutional Cash Reserves Fund, Series B (1)(2) | | 215,073 | |
| | | | | | | |
| | | | Total Securities Lending Collateral
(Cost $40,808,784) | | 40,755,016 | |
| | | | | | | |
| | | | Total Short-Term Investments
(Cost $71,889,784) | | 71,836,016 | |
| | | | | | | |
| | | | Total Investments in Securities
(Cost $1,176,521,663) * | 102.5 | % | $ | 1,606,075,932 | |
| | | | Other Assets and Liabilities - Net | (2.5 | ) | (39,621,158 | ) |
| | | | Net Assets | 100.0 | % | $ | 1,566,454,774 | |
| | ‘@ | | Non-income producing security |
| | ADR | | American Depositary Receipt |
| | (cc) | | Securities purchased with cash collateral for securities loaned. |
| | (1) | | Collateral received from brokers for securities lending was invested in these short-term investments. |
| | (2) | | On September 12, 2008, BNY established a separate sleeve of the Institutional Cash Reserves Fund (Series B) to hold certain Lehman Brothers defaulted debt obligations. The Portfolio’s position in Series B is being fair valued daily. Please see the accompanying Notes to Financial Statements for additional details on securities lending. |
| | R | | Restricted security |
| | L | | Loaned security, a portion or all of the security is on loan at December 31, 2010. |
| | PORTFOLIO OF INVESTMENTS |
ING RussellTM Small Cap Index Portfolio | | as of December 31, 2010 |
Shares | | | | | | Value | |
| | | | | | | |
COMMON STOCK: 91.7% | | | |
| | | | Consumer Discretionary: 13.7% | | | |
30,910 | | @ | | 99 Cents Only Stores | | $ | 492,705 | |
25,880 | | @ | | AFC Enterprises | | 359,732 | |
9,540 | | | | Ambassadors Group, Inc. | | 109,710 | |
77,370 | | @, L | | American Apparel, Inc. | | 128,434 | |
33,460 | | @ | | American Axle & Manufacturing Holdings, Inc. | | 430,296 | |
25,520 | | | | American Greetings Corp. | | 565,523 | |
12,030 | | @ | | American Public Education, Inc. | | 447,997 | |
8,060 | | @ | | America’s Car-Mart, Inc. | | 218,265 | |
20,700 | | @ | | Amerigon, Inc. | | 225,216 | |
14,680 | | | | Ameristar Casinos, Inc. | | 229,448 | |
37,520 | | @ | | AnnTaylor Stores Corp. | | 1,027,673 | |
18,890 | | | | Arbitron, Inc. | | 784,313 | |
7,300 | | @ | | Archipelago Learning, Inc. | | 71,613 | |
12,800 | | @ | | Arctic Cat, Inc. | | 187,392 | |
20,880 | | @ | | Asbury Automotive Group, Inc. | | 385,862 | |
10,160 | | @ | | Ascent Media Corp. | | 393,802 | |
10,300 | | @ | | Audiovox Corp. | | 88,889 | |
20,900 | | @ | | Ballantyne Strong, Inc. | | 162,393 | |
23,600 | | L | | Barnes & Noble, Inc. | | 333,940 | |
40,600 | | @ | | Beazer Homes USA, Inc. | | 218,834 | |
24,360 | | | | Bebe Stores, Inc. | | 145,186 | |
59,600 | | @ | | Belo Corp. | | 421,968 | |
14,350 | | | | Big 5 Sporting Goods Corp. | | 219,125 | |
871 | | @ | | Biglari Holdings, Inc. | | 357,293 | |
11,880 | | @ | | BJ’s Restaurants, Inc. | | 420,908 | |
7,620 | | @, L | | Blue Nile, Inc. | | 434,797 | |
3,800 | | | | Blyth, Inc. | | 131,024 | |
21,050 | | | | Bob Evans Farms, Inc. | | 693,808 | |
8,400 | | @, L | | Bon-Ton Stores, Inc. | | 106,344 | |
67,350 | | @, L | | Borders Group, Inc. | | 60,628 | |
32,800 | | @, L | | Boyd Gaming Corp. | | 347,680 | |
13,750 | | @, L | | Bridgepoint Education, Inc. | | 261,250 | |
12,600 | | @ | | Brookfield Homes Corp. | | 118,440 | |
26,460 | | | | Brown Shoe Co., Inc. | | 368,588 | |
64,060 | | | | Brunswick Corp. | | 1,200,484 | |
17,280 | | | | Buckle, Inc. | | 652,666 | |
12,200 | | @, L | | Buffalo Wild Wings, Inc. | | 534,970 | |
8,850 | | @ | | Build-A-Bear Workshop, Inc. | | 67,614 | |
21,280 | | @ | | Cabela’s, Inc. | | 462,840 | |
12,420 | | @ | | California Pizza Kitchen, Inc. | | 214,618 | |
44,850 | | | | Callaway Golf Co. | | 361,940 | |
11,580 | | @, L | | Capella Education Co. | | 770,996 | |
18,000 | | @ | | Carrols Restaurant Group, Inc. | | 133,560 | |
44,990 | | @ | | Carter’s, Inc. | | 1,327,655 | |
21,520 | | | | Cato Corp. | | 589,863 | |
4,560 | | @ | | Cavco Industries, Inc. | | 212,906 | |
14,440 | | @ | | CEC Entertainment, Inc. | | 560,705 | |
76,340 | | @ | | Charming Shoppes, Inc. | | 271,007 | |
43,510 | | @ | | Cheesecake Factory | | 1,334,017 | |
5,080 | | | | Cherokee, Inc. | | 95,555 | |
19,070 | | @, L | | Childrens Place Retail Stores, Inc. | | 946,635 | |
20,980 | | | | Christopher & Banks Corp. | | 129,027 | |
6,127 | | | | Churchill Downs, Inc. | | 265,912 | |
38,020 | | | | Cinemark Holdings, Inc. | | 655,465 | |
10,010 | | @ | | Citi Trends, Inc. | | 245,746 | |
35,630 | | @ | | CKX, Inc. | | 143,589 | |
21,400 | | @ | | Coinstar, Inc. | | 1,207,816 | |
30,370 | | @ | | Coldwater Creek, Inc. | | 96,273 | |
48,780 | | @ | | Collective Brands, Inc. | | 1,029,258 | |
7,710 | | L | | Columbia Sportswear Co. | | 464,913 | |
7,820 | | @, L | | Conn’s, Inc. | | 36,598 | |
33,890 | | | | Cooper Tire & Rubber Co. | | 799,126 | |
9,350 | | @ | | Core-Mark Holding Co., Inc. | | 332,767 | |
58,760 | | @ | | Corinthian Colleges, Inc. | | 306,140 | |
3,890 | | | | CPI Corp. | | 87,720 | |
16,730 | | | | Cracker Barrel Old Country Store | | 916,302 | |
47,570 | | @ | | CROCS, Inc. | | 814,398 | |
6,890 | | | | CSS Industries, Inc. | | 142,003 | |
9,500 | | @ | | Culp, Inc. | | 98,420 | |
98,410 | | @ | | Dana Holding Corp. | | 1,693,636 | |
27,600 | | @ | | Deckers Outdoor Corp. | | 2,200,824 | |
66,060 | | @ | | Denny’s Corp. | | 236,495 | |
2,480 | | @ | | Destination Maternity Corp. | | 94,066 | |
33,100 | | @ | | Dex One Corp. | | 246,926 | |
26,910 | | | | Dillard’s, Inc. | | 1,020,965 | |
11,900 | | @ | | DineEquity, Inc. | | 587,622 | |
27,260 | | @ | | Domino’s Pizza, Inc. | | 434,797 | |
10,630 | | @ | | Dorman Products, Inc. | | 385,231 | |
43,962 | | @ | | Dress Barn, Inc. | | 1,161,476 | |
16,310 | | @ | | Drew Industries, Inc. | | 370,563 | |
52,860 | | @ | | Drugstore.Com | | 116,821 | |
9,850 | | @, L | | DSW, Inc. | | 385,135 | |
186,290 | | @ | | Eastman Kodak Co. | | 998,514 | |
14,340 | | | | Ethan Allen Interiors, Inc. | | 286,943 | |
23,050 | | @ | | EW Scripps Co. | | 233,958 | |
41,020 | | @ | | Exide Technologies | | 385,998 | |
11,600 | | @ | | Express, Inc. | | 218,080 | |
34,189 | | | | Finish Line | | 587,709 | |
4,570 | | @ | | Fisher Communications, Inc. | | 99,626 | |
18,090 | | | | Fred’s, Inc. | | 248,918 | |
7,920 | | @, L | | Fuel Systems Solutions, Inc. | | 232,690 | |
26,810 | | @ | | Furniture Brands International, Inc. | | 137,803 | |
| | | | | | | | |
7,220 | | | | Gaiam, Inc. | | 55,594 | |
21,340 | | @, L | | Gaylord Entertainment Co. | | 766,960 | |
13,330 | | @, L | | Genesco, Inc. | | 499,742 | |
8,810 | | @, L | | G-III Apparel Group Ltd. | | 309,672 | |
14,052 | | @ | | Global Sources Ltd. | | 133,775 | |
20,810 | | @ | | Grand Canyon Education, Inc. | | 407,668 | |
14,760 | | L | | Group 1 Automotive, Inc. | | 616,378 | |
23,260 | | | | Harte-Hanks, Inc. | | 297,030 | |
13,050 | | @ | | Haverty Furniture Cos., Inc. | | 169,389 | |
19,510 | | @ | | Helen of Troy Ltd. | | 580,227 | |
8,400 | | @, L | | hhgregg, Inc. | | 175,980 | |
18,850 | | @ | | Hibbett Sporting Goods, Inc. | | 695,565 | |
10,820 | | | | Hooker Furniture Corp. | | 152,887 | |
34,980 | | | | HOT Topic, Inc. | | 219,325 | |
39,560 | | @, L | | Hovnanian Enterprises, Inc. | | 161,800 | |
26,500 | | @ | | HSN, Inc. | | 811,960 | |
44,650 | | @ | | Iconix Brand Group, Inc. | | 862,192 | |
26,750 | | @ | | Interval Leisure Group, Inc. | | 431,745 | |
14,680 | | @, L | | iRobot Corp. | | 365,238 | |
34,220 | | @, L | | Jack in the Box, Inc. | | 723,069 | |
20,080 | | @ | | Jakks Pacific, Inc. | | 365,858 | |
53,900 | | @ | | Jamba, Inc. | | 122,353 | |
16,630 | | @, L | | Jo-Ann Stores, Inc. | | 1,001,459 | |
36,900 | | @ | | Joe’s Jeans, Inc. | | 57,564 | |
59,340 | | | | Jones Group, Inc. | | 922,144 | |
17,130 | | @, L | | JoS. A Bank Clothiers, Inc. | | 690,682 | |
30,600 | | @ | | Journal Communications, Inc. | | 154,530 | |
15,510 | | @ | | K12, Inc. | | 444,517 | |
11,050 | | @ | | Kenneth Cole Productions, Inc. | | 138,015 | |
20,700 | | @ | | Kid Brands, Inc. | | 176,985 | |
8,260 | | @ | | Kirkland’s, Inc. | | 115,888 | |
19,420 | | @ | | Knology, Inc. | | 303,535 | |
37,800 | | @ | | Krispy Kreme Doughnuts, Inc. | | 263,844 | |
18,400 | | @ | | K-Swiss, Inc. | | 229,448 | |
43,100 | | @ | | La-Z-Boy, Inc. | | 388,762 | |
17,050 | | @ | | Leapfrog Enterprises, Inc. | | 94,628 | |
27,400 | | @ | | Life Time Fitness, Inc. | | 1,123,126 | |
8,400 | | @ | | Lifetime Brands, Inc. | | 117,936 | |
23,670 | | @ | | Lin TV Corp. | | 125,451 | |
11,590 | | | | Lincoln Educational Services Corp. | | 179,761 | |
46,200 | | @ | | Lions Gate Entertainment Corp. | | 300,762 | |
96,927 | | @ | | Live Nation, Inc. | | 1,106,906 | |
54,920 | | @, L | | Liz Claiborne, Inc. | | 393,227 | |
19,020 | | @ | | Lodgenet Entertainment Corp. | | 80,835 | |
17,680 | | @, L | | Lumber Liquidators | | 440,409 | |
11,580 | | @ | | M/I Homes, Inc. | | 178,100 | |
10,900 | | | | Mac-Gray Corp. | | 162,955 | |
13,680 | | @ | | Maidenform Brands, Inc. | | 325,174 | |
12,980 | | | | Marcus Corp. | | 172,245 | |
18,000 | | @ | | MarineMax, Inc. | | 168,300 | |
20,680 | | | | Matthews International Corp. - Class A | | 723,386 | |
43,600 | | @, L | | McClatchy Co. | | 203,612 | |
12,850 | | @ | | McCormick & Schmick’s Seafood Restaurants, Inc. | | 116,807 | |
16,300 | | @ | | Media General, Inc. | | 94,214 | |
33,730 | | @ | | Mediacom Communications Corp. | | 285,356 | |
31,600 | | | | Men’s Wearhouse, Inc. | | 789,368 | |
21,410 | | @ | | Meritage Homes Corp. | | 475,302 | |
13,700 | | @ | | Midas, Inc. | | 111,107 | |
29,700 | | @ | | Modine Manufacturing Co. | | 460,350 | |
5,020 | | @ | | Monarch Casino & Resort, Inc. | | 62,750 | |
19,965 | | | | Monro Muffler, Inc. | | 690,589 | |
19,400 | | @ | | Morgans Hotel Group Co. | | 175,958 | |
8,950 | | @ | | Movado Group, Inc. | | 144,453 | |
28,300 | | | | National CineMedia, Inc. | | 563,453 | |
21,240 | | | | Nutri/System, Inc. | | 446,677 | |
19,350 | | @ | | O’Charleys, Inc. | | 139,320 | |
58,150 | | @ | | OfficeMax, Inc. | | 1,029,255 | |
58,200 | | @ | | Orient-Express Hotels Ltd. | | 756,018 | |
10,360 | | @ | | Overstock.com, Inc. | | 170,733 | |
5,070 | | | | Oxford Industries, Inc. | | 129,843 | |
41,490 | | @ | | Pacific Sunwear of California | | 224,876 | |
16,110 | | @ | | Papa John’s International, Inc. | | 446,247 | |
6,440 | | @ | | Peet’s Coffee & Tea, Inc. | | 268,806 | |
26,600 | | @ | | Penske Auto Group, Inc. | | 463,372 | |
31,850 | | | | PEP Boys-Manny Moe & Jack | | 427,746 | |
6,560 | | @ | | Perry Ellis International, Inc. | | 180,203 | |
9,900 | | L | | PetMed Express, Inc. | | 176,319 | |
14,750 | | L | | PF Chang’s China Bistro, Inc. | | 714,785 | |
65,210 | | @ | | Pier 1 Imports, Inc. | | 684,705 | |
36,140 | | @ | | Pinnacle Entertainment, Inc. | | 506,683 | |
33,640 | | @, L | | Playboy Enterprises, Inc. | | 175,601 | |
21,700 | | | | Polaris Industries, Inc. | | 1,693,034 | |
34,870 | | | | Pool Corp. | | 785,970 | |
5,280 | | @, L | | Pre-Paid Legal Services, Inc. | | 318,120 | |
38,400 | | @ | | Princeton Review, Inc. | | 45,312 | |
64,110 | | @ | | Quiksilver, Inc. | | 325,038 | |
12,460 | | @ | | RC2 Corp. | | 271,254 | |
11,400 | | @ | | Red Robin Gourmet Burgers, Inc. | | 244,758 | |
36,610 | | | | Regis Corp. | | 607,726 | |
48,840 | | | | Rent-A-Center, Inc. | | 1,576,555 | |
6,700 | | @ | | Rentrak Corp. | | 202,072 | |
17,300 | | @ | | Retail Ventures, Inc. | | 281,990 | |
43,380 | | @ | | Ruby Tuesday, Inc. | | 566,543 | |
8,700 | | @ | | Rue21, Inc. | | 254,997 | |
39,602 | | @ | | Ruth’s Chris Steak House | | 183,357 | |
29,550 | | | | Ryland Group, Inc. | | 503,237 | |
97,700 | | @, L | | Saks, Inc. | | 1,045,390 | |
58,800 | | @ | | Sally Beauty Holdings, Inc. | | 854,364 | |
17,620 | | | | Scholastic Corp. | | 520,495 | |
40,000 | | @ | | Scientific Games Corp. | | 398,400 | |
20,440 | | @ | | Sealy Corp. | | 59,685 | |
37,300 | | @ | | Select Comfort Corp. | | 340,549 | |
35,980 | | @ | | Shuffle Master, Inc. | | 411,971 | |
16,310 | | @ | | Shutterfly, Inc. | | 571,339 | |
24,250 | | @ | | Sinclair Broadcast Group, Inc. | | 198,365 | |
24,140 | | @ | | Skechers USA, Inc. | | 482,800 | |
6,770 | | | | Skyline Corp. | | 176,562 | |
38,920 | | @, L | | Smith & Wesson Holding Corp. | | 145,561 | |
28,160 | | | | Sonic Automotive, Inc. | | 372,838 | |
38,880 | | @ | | Sonic Corp. | | 393,466 | |
47,280 | | | | Sotheby’s | | 2,127,600 | |
25,630 | | | | Spartan Motors, Inc. | | 156,087 | |
9,860 | | | | Speedway Motorsports, Inc. | | 151,055 | |
25,260 | | | | Stage Stores, Inc. | | 438,008 | |
13,850 | | | | Standard Motor Products, Inc. | | 189,745 | |
76,180 | | @ | | Standard-Pacific Corp. | | 350,428 | |
15,150 | | @ | | Stein Mart, Inc. | | 140,138 | |
9,880 | | @ | | Steiner Leisure Ltd. | | 461,396 | |
4,590 | | @ | | Steinway Musical Instruments | | 91,112 | |
15,510 | | @ | | Steven Madden Ltd. | | 647,077 | |
47,750 | | | | Stewart Enterprises, Inc. | | 319,448 | |
10,200 | | @ | | Stoneridge, Inc. | | 161,058 | |
10,840 | | L | | Sturm Ruger & Co., Inc. | | 165,744 | |
15,100 | | @, L | | Summer Infant, Inc. | | 114,458 | |
15,260 | | | | Superior Industries International | | 323,817 | |
9,100 | | @ | | SuperMedia, Inc. | | 79,261 | |
7,570 | | @ | | Systemax, Inc. | | 106,737 | |
43,110 | | @ | | Talbots, Inc. | | 367,297 | |
42,460 | | @ | | Tenneco, Inc. | | 1,747,654 | |
35,420 | | @ | | Texas Roadhouse, Inc. | | 608,161 | |
25,350 | | @ | | Timberland Co. | | 623,357 | |
14,930 | | @ | | True Religion Apparel, Inc. | | 332,342 | |
22,660 | | @ | | Tuesday Morning Corp. | | 119,645 | |
18,600 | | @ | | Ulta Salon Cosmetics & Fragrance, Inc. | | 632,400 | |
23,690 | | @ | | Under Armour, Inc. | | 1,299,160 | |
11,050 | | @ | | Universal Electronics, Inc. | | 313,489 | |
13,270 | | @ | | Universal Technical Institute, Inc. | | 292,205 | |
27,960 | | @ | | Vail Resorts, Inc. | | 1,455,038 | |
35,340 | | @ | | Valassis Communications, Inc. | | 1,143,249 | |
6,000 | | @ | | Vera Bradley, Inc. | | 198,000 | |
10,300 | | @, R, L, X | | Vitacost.com, Inc. | | 10,300 | |
9,400 | | @ | | Vitamin Shoppe, Inc. | | 316,216 | |
11,910 | | @ | | Volcom, Inc. | | 224,742 | |
30,680 | | @ | | Warnaco Group, Inc. | | 1,689,548 | |
25,000 | | @ | | Warner Music Group Corp. | | 140,750 | |
6,340 | | @ | | West Marine, Inc. | | 67,077 | |
64,220 | | @ | | Wet Seal, Inc. | | 237,614 | |
6,590 | | | | Weyco Group, Inc. | | 161,389 | |
19,980 | | @ | | Winnebago Industries | | 303,696 | |
37,360 | | | | Wolverine World Wide, Inc. | | 1,191,037 | |
14,380 | | L | | World Wrestling Entertainment, Inc. | | 204,771 | |
14,750 | | @, L | | Zumiez, Inc. | | 396,333 | |
| | | | | | 105,373,252 | |
| | | | Consumer Staples: 3.0% | | | |
5,490 | | L | | Alico, Inc. | | 130,882 | |
56,740 | | @ | | Alliance One International, Inc. | | 240,578 | |
14,140 | | | | Andersons, Inc. | | 513,989 | |
28,890 | | | | B&G Foods, Inc. | | 396,660 | |
6,750 | | @ | | Boston Beer Co., Inc. | | 641,858 | |
9,670 | | | | Calavo Growers, Inc. | | 222,894 | |
11,600 | | L | | Cal-Maine Foods, Inc. | | 366,328 | |
27,170 | | | | Casey’s General Stores, Inc. | | 1,154,997 | |
27,200 | | @ | | Central Garden & Pet Co. | | 268,736 | |
28,220 | | @ | | Chiquita Brands International, Inc. | | 395,644 | |
4,400 | | | | Coca-Cola Bottling Co. Consolidated | | 244,552 | |
57,170 | | @ | | Darling International, Inc. | | 759,218 | |
13,580 | | | | Diamond Foods, Inc. | | 722,184 | |
24,100 | | @, L | | Dole Food Co., Inc. | | 325,591 | |
17,290 | | @ | | Elizabeth Arden, Inc. | | 397,843 | |
6,960 | | | | Farmer Bros Co. | | 123,888 | |
26,510 | | | | Fresh Del Monte Produce, Inc. | | 661,425 | |
8,000 | | @ | | Fresh Market, Inc. | | 329,600 | |
27,130 | | @ | | Hain Celestial Group, Inc. | | 734,138 | |
46,980 | | @ | | Heckmann Corp. | | 236,309 | |
15,660 | | | | Imperial Sugar Co. | | 209,374 | |
10,540 | | | | Ingles Markets, Inc. | | 202,368 | |
5,470 | | | | Inter Parfums, Inc. | | 103,110 | |
10,220 | | | | J&J Snack Foods Corp. | | 493,013 | |
15,130 | | | | Lancaster Colony Corp. | | 865,436 | |
5,680 | | @ | | Medifast, Inc. | | 164,038 | |
5,630 | | | | Nash Finch Co. | | 239,331 | |
7,200 | | @ | | National Beverage Corp. | | 94,608 | |
37,270 | | | | Nu Skin Enterprises, Inc. | | 1,127,790 | |
7,500 | | @ | | Nutraceutical International Corp. | | 106,425 | |
5,200 | | | | Oil-Dri Corp. of America | | 111,748 | |
8,710 | | @ | | Pantry, Inc. | | 172,981 | |
34,600 | | @ | | Pilgrim’s Pride Corp. | | 245,314 | |
29,880 | | @ | | Prestige Brands Holdings, Inc. | | 357,066 | |
11,260 | | | | Pricesmart, Inc. | | 428,218 | |
340,900 | | @, L | | Rite Aid Corp. | | 301,083 | |
33,170 | | | | Ruddick Corp. | | 1,221,983 | |
16,340 | | L | | Sanderson Farms, Inc. | | 639,711 | |
6,330 | | @ | | Seneca Foods Corp. | | 170,783 | |
41,210 | | @ | | Smart Balance, Inc. | | 178,439 | |
21,300 | | | | Snyders-Lance, Inc. | | 499,272 | |
20,640 | | | | Spartan Stores, Inc. | | 349,848 | |
12,400 | | @, L | | Spectrum Brands Holdings, Inc. | | 386,508 | |
42,250 | | @, L | | Star Scientific, Inc. | | 82,388 | |
11,240 | | @, L | | Synutra International, Inc. | | 151,178 | |
18,870 | | | | Tootsie Roll Industries, Inc. | | 546,664 | |
25,010 | | @ | | TreeHouse Foods, Inc. | | 1,277,761 | |
31,830 | | @ | | United Natural Foods, Inc. | | 1,167,524 | |
16,070 | | | | Universal Corp. | | 654,049 | |
5,150 | | @ | | USANA Health Sciences, Inc. | | 223,768 | |
28,382 | | L | | Vector Group Ltd. | | 491,576 | |
3,210 | | | | Village Super Market | | 105,930 | |
10,790 | | | | WD-40 Co. | | 434,621 | |
8,200 | | | | Weis Markets, Inc. | | 330,706 | |
38,200 | | @ | | Winn-Dixie Stores, Inc. | | 273,894 | |
| | | | | | 23,275,820 | |
| | | | Energy: 6.1% | | | |
51,360 | | @ | | Allis-Chalmers Energy, Inc. | | 364,142 | |
5,370 | | | | Apco Oil and Gas International, Inc. | | 308,775 | |
12,900 | | @ | | Approach Resources, Inc. | | 297,990 | |
26,670 | | @ | | ATP Oil & Gas Corp. | | 446,456 | |
17,120 | | @ | | Basic Energy Services, Inc. | | 282,138 | |
36,870 | | | | Berry Petroleum Co. | | 1,611,219 | |
27,460 | | @ | | Bill Barrett Corp. | | 1,129,430 | |
55,170 | | @, L | | BPZ Energy, Inc. | | 262,609 | |
83,380 | | @ | | Brigham Exploration Co. | | 2,271,271 | |
26,630 | | @ | | Bristow Group, Inc. | | 1,260,931 | |
64,280 | | @ | | Cal Dive International, Inc. | | 364,468 | |
32,500 | | @ | | Callon Petroleum Co. | | 192,400 | |
13,910 | | | | CARBO Ceramics, Inc. | | 1,440,241 | |
18,100 | | @ | | Carrizo Oil & Gas, Inc. | | 624,269 | |
49,230 | | @, L | | Cheniere Energy, Inc. | | 271,750 | |
3,400 | | @ | | Clayton Williams Energy, Inc. | | 285,498 | |
24,340 | | @, L | | Clean Energy Fuels Corp. | | 336,866 | |
21,700 | | @ | | Cloud Peak Energy, Inc. | | 504,091 | |
61,540 | | @ | | Complete Production Services, Inc. | | 1,818,507 | |
9,220 | | @ | | Contango Oil & Gas Co. | | 534,115 | |
25,020 | | L | | Crosstex Energy, Inc. | | 221,677 | |
15,900 | | @ | | CVR Energy, Inc. | | 241,362 | |
9,070 | | @ | | Dawson Geophysical Co. | | 289,333 | |
113,500 | | @, L | | Delta Petroleum Corp. | | 86,260 | |
34,450 | | @ | | DHT Maritime, Inc. | | 160,193 | |
23,520 | | @ | | Dril-Quip, Inc. | | 1,827,974 | |
11,450 | | @, L | | Endeavour International Corp. | | 158,010 | |
20,400 | | @ | | Energy Partners Ltd. | | 303,144 | |
33,900 | | @ | | Energy XXI Bermuda Ltd. | | 938,013 | |
41,190 | | @ | | FX Energy, Inc. | | 253,319 | |
36,328 | | @, L | | General Maritime Corp. | | 118,066 | |
9,900 | | @ | | Georesources, Inc. | | 219,879 | |
11,400 | | @ | | Global Geophysical Services, Inc. | | 118,332 | |
67,660 | | @ | | Global Industries Ltd. | | 468,884 | |
31,700 | | @, L | | GMX Resources, Inc. | | 174,984 | |
31,530 | | L | | Golar LNG Ltd. | | 473,265 | |
17,090 | | @, L | | Goodrich Petroleum Corp. | | 301,468 | |
6,590 | | | | Gulf Island Fabrication, Inc. | | 185,706 | |
14,220 | | @ | | Gulfmark Offshore, Inc. | | 432,288 | |
15,900 | | @ | | Gulfport Energy Corp. | | 344,235 | |
22,800 | | @, L | | Harvest Natural Resources, Inc. | | 277,476 | |
71,800 | | @ | | Helix Energy Solutions Group, Inc. | | 871,652 | |
72,090 | | @ | | Hercules Offshore, Inc. | | 249,431 | |
17,340 | | @ | | Hornbeck Offshore Services, Inc. | | 362,059 | |
71,390 | | @ | | International Coal Group, Inc. | | 552,559 | |
85,680 | | @ | | ION Geophysical Corp. | | 726,566 | |
19,590 | | @ | | James River Coal Co. | | 496,215 | |
93,010 | | @ | | Key Energy Services, Inc. | | 1,207,270 | |
9,840 | | @, L | | Knightsbridge Tankers Ltd. | | 219,137 | |
71,200 | | @, L | | Kodiak Oil & Gas Corp. | | 469,920 | |
13,900 | | @, L | | L&L Energy, Inc. | | 150,120 | |
20,620 | | | | Lufkin Industries, Inc. | | 1,286,482 | |
50,500 | | @ | | Magnum Hunter Resources Corp. | | 363,600 | |
17,160 | | @ | | Matrix Service Co. | | 209,009 | |
46,070 | | @ | | McMoRan Exploration Co. | | 789,640 | |
12,400 | | @ | | Miller Petroleum, Inc. | | 64,480 | |
9,310 | | @ | | Natural Gas Services Group, Inc. | | 176,052 | |
54,440 | | @, L | | Newpark Resources | | 335,350 | |
30,880 | | L | | Nordic American Tanker Shipping | | 803,498 | |
22,720 | | @ | | Northern Oil And Gas, Inc. | | 618,211 | |
24,700 | | @ | | Oasis Petroleum, Inc. | | 669,864 | |
16,000 | | L | | Overseas Shipholding Group | | 566,720 | |
2,150 | | @ | | OYO Geospace Corp. | | 213,087 | |
4,990 | | | | Panhandle Oil and Gas, Inc. | | 136,826 | |
44,900 | | @ | | Parker Drilling Co. | | 205,193 | |
45,200 | | @ | | Patriot Coal Corp. | | 875,524 | |
29,280 | | | | Penn Virginia Corp. | | 492,490 | |
13,110 | | @ | | Petroleum Development Corp. | | 553,373 | |
32,110 | | @ | | Petroquest Energy, Inc. | | 241,788 | |
9,060 | | @ | | PHI, Inc. | | 170,690 | |
31,800 | | @ | | Pioneer Drilling Co. | | 280,158 | |
20,600 | | @ | | Resolute Energy Corp. | | 304,056 | |
22,830 | | @ | | Rex Energy Corp. | | 311,630 | |
4,630 | | @ | | Rex Stores Corp. | | 71,117 | |
30,120 | | @ | | Rosetta Resources, Inc. | | 1,133,717 | |
32,235 | | | | RPC, Inc. | | 584,098 | |
25,440 | | | | Ship Finance International Ltd. | | 547,469 | |
24,480 | | @ | | Stone Energy Corp. | | 545,659 | |
22,960 | | @ | | Swift Energy Co. | | 898,884 | |
43,420 | | @ | | Syntroleum Corp. | | 80,327 | |
12,590 | | @ | | T-3 Energy Services, Inc. | | 501,460 | |
15,740 | | @, L | | Teekay Tankers Ltd. | | 194,232 | |
17,600 | | @ | | Tesco Corp. | | 279,488 | |
48,170 | | @ | | Tetra Technologies, Inc. | | 571,778 | |
119,100 | | @ | | TransAtlantic Petroleum Ltd. | | 396,603 | |
37,190 | | @, L | | Uranium Energy Corp. | | 224,628 | |
74,830 | | @ | | USEC, Inc. | | 450,477 | |
39,070 | | @ | | Vaalco Energy, Inc. | | 279,741 | |
75,050 | | @ | | Vantage Drilling Co. | | 152,352 | |
12,290 | | @ | | Venoco, Inc. | | 226,751 | |
17,240 | | L | | W&T Offshore, Inc. | | 308,079 | |
56,220 | | @ | | Warren Resources, Inc. | | 254,114 | |
44,180 | | @, L | | Western Refining, Inc. | | 467,424 | |
18,600 | | @ | | Willbros Group, Inc. | | 182,652 | |
42,840 | | | | World Fuel Services Corp. | | 1,549,094 | |
| | | | | | 47,073,828 | |
| | | | Financials: 13.2% | | | |
12,350 | | | | 1st Source Corp. | | 249,964 | |
11,800 | | | | Abington Bancorp, Inc. | | 140,774 | |
36,060 | | | | Advance America Cash Advance Centers, Inc. | | 203,378 | |
69,080 | | | | Alterra Capital Holdings Ltd. | | 1,494,891 | |
235,390 | | @ | | American Capital Ltd. | | 1,779,548 | |
37,420 | | | | American Equity Investment Life Holding Co. | | 469,621 | |
6,300 | | @ | | American Safety Insurance Holdings Ltd. | | 134,694 | |
17,005 | | | | Ameris Bancorp. | | 179,233 | |
13,720 | | @ | | Amerisafe, Inc. | | 240,100 | |
12,630 | | | | Amtrust Financial Services, Inc. | | 221,025 | |
127,110 | | | | Apollo Investment Corp. | | 1,407,108 | |
19,390 | | | | Argo Group International Holdings Ltd. | | 726,156 | |
4,600 | | | | Arlington Asset Investment Corp. | | 110,354 | |
5,484 | | | | Arrow Financial Corp. | | 150,865 | |
19,600 | | | | Artio Global Investors, Inc. | | 289,100 | |
63,980 | | | | Astoria Financial Corp. | | 889,962 | |
5,280 | | @ | | Avatar Holdings, Inc. | | 104,650 | |
5,950 | | | | Bancfirst Corp. | | 245,081 | |
19,180 | | | | Banco Latinoamericano de Exportaciones S.A. | | 354,063 | |
11,150 | | @ | | Bancorp, Inc. | | 113,396 | |
27,650 | | | | Bank Mutual Corp. | | 132,167 | |
1,870 | | | | Bank of Marin Bancorp | | 65,450 | |
10,240 | | L | | Bank of the Ozarks, Inc. | | 443,904 | |
22,500 | | | | BankFinancial Corp. | | 219,375 | |
22,050 | | @ | | Beneficial Mutual Bancorp, Inc. | | 194,702 | |
9,610 | | | | Berkshire Hills Bancorp., Inc. | | 212,381 | |
28,440 | | | | BGC Partners, Inc. | | 236,336 | |
44,950 | | | | BlackRock Kelso Capital Corp. | | 497,147 | |
7,600 | | @ | | BofI Holding, Inc. | | 117,876 | |
31,200 | | | | Boston Private Financial Holdings, Inc. | | 204,360 | |
3,630 | | | | Bridge Bancorp, Inc. | | 89,480 | |
28,740 | | L | | Brookline Bancorp., Inc. | | 311,829 | |
10,700 | | L | | Bryn Mawr Bank Corp. | | 186,715 | |
10,370 | | | | Calamos Asset Management, Inc. | | 145,180 | |
5,540 | | | | Camden National Corp. | | 200,714 | |
2,120 | | | | Capital Southwest Corp. | | 220,056 | |
20,490 | | | | Cardinal Financial Corp. | | 238,299 | |
22,480 | | | | Cash America International, Inc. | | 830,186 | |
50,120 | | | | Cathay General Bancorp. | | 837,004 | |
19,370 | | | | Centerstate Banks of Florida, Inc. | | 153,410 | |
16,530 | | | | Chemical Financial Corp. | | 366,140 | |
5,360 | | | | Citizens & Northern Corp. | | 79,650 | |
246,800 | | @ | | Citizens Banking Corp. | | 151,782 | |
21,770 | | @, L | | Citizens, Inc. | | 162,187 | |
11,340 | | | | City Holding Co. | | 410,848 | |
17,100 | | | | Clifton Savings Bancorp, Inc. | | 184,851 | |
6,170 | | @ | | CNA Surety Corp. | | 146,106 | |
6,560 | | L | | CNB Financial Corp. | | 97,154 | |
127,000 | | @ | | CNO Financial Group, Inc. | | 861,060 | |
39,510 | | L | | CoBiz Financial, Inc. | | 240,221 | |
8,770 | | | | Cohen & Steers, Inc. | | 228,897 | |
26,130 | | | | Columbia Banking System, Inc. | | 550,298 | |
22,090 | | | | Community Bank System, Inc. | | 613,439 | |
11,690 | | | | Community Trust Bancorp., Inc. | | 338,542 | |
17,930 | | | | Compass Diversified Trust | | 317,182 | |
25,024 | | @ | | CompuCredit Holdings Corp. | | 174,668 | |
2,820 | | | | Consolidated-Tomoka Land Co. | | 81,498 | |
30,800 | | @ | | Cowen Group, Inc. | | 143,528 | |
4,750 | | @ | | Credit Acceptance Corp. | | 298,158 | |
54,120 | | L | | CVB Financial Corp. | | 469,220 | |
12,780 | | | | Danvers Bancorp, Inc. | | 225,823 | |
27,440 | | | | Delphi Financial Group | | 791,370 | |
18,110 | | | | Dime Community Bancshares | | 264,225 | |
16,640 | | @ | | Dollar Financial Corp. | | 476,403 | |
9,800 | | | | Donegal Group, Inc. | | 141,904 | |
12,380 | | | | Duff & Phelps Corp. | | 208,727 | |
11,400 | | @ | | Eagle Bancorp, Inc. | | 164,502 | |
13,580 | | @ | | eHealth, Inc. | | 192,700 | |
3,800 | | | | EMC Insurance Group, Inc. | | 86,032 | |
28,830 | | | | Employers Holdings, Inc. | | 503,948 | |
12,260 | | @ | | Encore Capital Group, Inc. | | 287,497 | |
4,120 | | @ | | Enstar Group Ltd. | | 348,470 | |
11,450 | | | | Enterprise Financial Services Corp. | | 119,767 | |
10,860 | | | | Epoch Holding Corp. | | 168,656 | |
8,910 | | | | ESB Financial Corp. | | 144,698 | |
8,150 | | L | | ESSA Bancorp, Inc. | | 107,743 | |
10,730 | | | | Evercore Partners, Inc. | | 364,820 | |
30,460 | | @ | | Ezcorp, Inc. | | 826,380 | |
9,170 | | | | FBL Financial Group, Inc. | | 262,904 | |
13,990 | | @ | | FBR Capital Markets Corp. | | 53,442 | |
6,200 | | | | Federal Agricultural Mortgage Corp. | | 101,184 | |
31,070 | | | | Fifth Street Finance Corp. | | 377,190 | |
3,000 | | | | Financial Institutions, Inc. | | 56,910 | |
75,000 | | | | First American Financial Corp. | | 1,120,500 | |
10,690 | | | | First Bancorp. | | 163,664 | |
37,730 | | | | First Busey Corp. | | 177,331 | |
20,250 | | @ | | First Cash Financial Services, Inc. | | 627,548 | |
51,620 | | | | First Commonwealth Financial Corp. | | 365,470 | |
6,800 | | | | First Community Bancshares, Inc. | | 101,592 | |
38,580 | | | | First Financial Bancorp. | | 712,958 | |
15,510 | | L | | First Financial Bankshares, Inc. | | 793,802 | |
9,330 | | | | First Financial Corp. | | 327,856 | |
9,600 | | | | First Financial Holdings, Inc. | | 110,496 | |
73,050 | | @ | | First Marblehead Corp. | | 158,519 | |
19,520 | | | | First Merchants Corp. | | 172,947 | |
48,830 | | | | First Midwest Bancorp., Inc. | | 562,522 | |
3,070 | | | | First of Long Island Corp. | | 88,754 | |
76,114 | | | | FirstMerit Corp. | | 1,506,296 | |
37,460 | | @ | | Flagstar Bancorp, Inc. | | 61,060 | |
31,760 | | | | Flagstone Reinsurance Holdings S.A. | | 400,176 | |
21,000 | | | | Flushing Financial Corp. | | 294,000 | |
69,066 | | | | FNB Corp. | | 678,228 | |
22,170 | | @ | | Forestar Real Estate Group, Inc. | | 427,881 | |
8,565 | | @ | | Fpic Insurance Group, Inc. | | 316,562 | |
4,740 | | | | GAMCO Investors, Inc. | | 227,567 | |
42,310 | | | | GFI Group, Inc. | | 198,434 | |
46,060 | | | | Glacier Bancorp., Inc. | | 695,967 | |
19,640 | | | | Gladstone Capital Corp. | | 226,253 | |
9,250 | | | | Gladstone Investment Corp. | | 70,763 | |
43,530 | | @ | | Gleacher & Co., Inc. | | 103,166 | |
6,193 | | @ | | Global Indemnity PLC | | 126,647 | |
10,390 | | | | Great Southern Bancorp., Inc. | | 245,100 | |
20,050 | | @ | | Greenlight Capital Re Ltd. | | 537,541 | |
11,300 | | @ | | Hallmark Financial Services, Inc. | | 102,830 | |
17,770 | | | | Hancock Holding Co. | | 619,462 | |
72,700 | | @ | | Hanmi Financial Corp. | | 83,605 | |
6,860 | | | | Harleysville Group, Inc. | | 252,036 | |
8,220 | | | | Heartland Financial USA, Inc. | | 143,521 | |
29,955 | | | | Hercules Technology Growth Capital, Inc. | | 310,334 | |
4,690 | | @ | | Heritage Financial Corp. | | 65,285 | |
24,220 | | @ | | Hilltop Holdings, Inc. | | 240,262 | |
13,624 | | | | Home Bancshares, Inc. | | 300,137 | |
5,760 | | | | Home Federal Bancorp, Inc. | | 70,675 | |
27,070 | | | | Horace Mann Educators Corp. | | 488,343 | |
5,830 | | | | Hudson Valley Holding Corp. | | 144,351 | |
16,690 | | | | IBERIABANK Corp. | | 986,880 | |
12,300 | | | | Independent Bank Corp. | | 332,715 | |
8,150 | | | | Infinity Property & Casualty Corp. | | 503,670 | |
7,955 | | @ | | International Assets Holding Corp. | | 187,738 | |
36,130 | | | | International Bancshares Corp. | | 723,684 | |
19,850 | | @ | | Internet Capital Group, Inc. | | 282,267 | |
29,300 | | @ | | Investment Technology Group, Inc. | | 479,641 | |
28,750 | | @ | | Investors Bancorp, Inc. | | 377,200 | |
4,981 | | | | Kansas City Life Insurance Co. | | 164,522 | |
22,770 | | | | KBW, Inc. | | 635,738 | |
10,000 | | | | Kearny Financial Corp. | | 86,000 | |
11,400 | | @ | | Kennedy-Wilson Holdings, Inc. | | 113,886 | |
60,200 | | @ | | Knight Capital Group, Inc. | | 830,158 | |
36,520 | | @ | | LaBranche & Co., Inc. | | 131,472 | |
14,310 | | | | Lakeland Bancorp, Inc. | | 156,981 | |
11,870 | | | | Lakeland Financial Corp. | | 254,730 | |
4,955 | | L | | Life Partners Holdings, Inc. | | 94,789 | |
44,200 | | | | Maiden Holdings Ltd. | | 347,412 | |
8,350 | | | | Main Street Capital Corp. | | 151,887 | |
17,320 | | | | MainSource Financial Group, Inc. | | 180,301 | |
19,070 | | | | MarketAxess Holdings, Inc. | | 396,847 | |
35,000 | | | | MB Financial Corp. | | 606,200 | |
49,200 | | | | MCG Capital Corp. | | 342,924 | |
32,000 | | | | Meadowbrook Insurance Group, Inc. | | 328,000 | |
10,500 | | | | Medallion Financial Corp. | | 86,100 | |
5,370 | | | | Merchants Bancshares, Inc. | | 147,997 | |
4,030 | | @ | | Metro Bancorp, Inc. | | 44,370 | |
52,600 | | @ | | MF Global Holdings, Ltd. | | 439,736 | |
145,050 | | @, L | | MGIC Investment Corp. | | 1,478,060 | |
6,200 | | | | Midsouth Bancorp, Inc. | | 95,232 | |
44,460 | | | | Montpelier Re Holdings Ltd. | | 886,532 | |
15,150 | | | | MVC Capital, Inc. | | 221,190 | |
20,150 | | @ | | Nara Bancorp., Inc. | | 197,873 | |
3,320 | | L | | National Bankshares, Inc. | | 104,547 | |
30,280 | | @ | | National Financial Partners Corp. | | 405,752 | |
8,590 | | | | National Interstate Corp. | | 183,826 | |
83,910 | | | | National Penn Bancshares, Inc. | | 673,797 | |
1,365 | | | | National Western Life Insurance Co. | | 227,573 | |
7,630 | | @ | | Navigators Group, Inc. | | 384,171 | |
23,030 | | | | NBT Bancorp., Inc. | | 556,175 | |
17,900 | | | | Nelnet, Inc. | | 424,051 | |
72,840 | | | | NewAlliance Bancshares, Inc. | | 1,091,143 | |
14,100 | | @ | | NewStar Financial, Inc. | | 149,037 | |
13,070 | | | | NGP Capital Resources Co. | | 120,244 | |
10,180 | | | | Northfield Bancorp, Inc. | | 135,598 | |
80,070 | | | | Northwest Bancshares, Inc. | | 941,623 | |
16,470 | | | | OceanFirst Financial Corp. | | 211,969 | |
49,850 | | @ | | Ocwen Financial Corp. | | 475,569 | |
59,130 | | | | Old National Bancorp. | | 703,056 | |
15,600 | | @ | | OmniAmerican Bancorp, Inc. | | 211,380 | |
4,660 | | | | Oppenheimer Holdings, Inc. | | 122,139 | |
26,050 | | @ | | OptionsXpress Holdings, Inc. | | 408,204 | |
19,950 | | | | Oriental Financial Group | | 249,176 | |
51,975 | | | | Oritani Financial Corp. | | 636,174 | |
5,770 | | | | Orrstown Financial Services, Inc. | | 158,156 | |
17,540 | | | | PacWest Bancorp | | 375,005 | |
7,460 | | L | | Park National Corp. | | 542,118 | |
19,430 | | | | PennantPark Investment Corp. | | 237,823 | |
12,120 | | | | Peoples Bancorp., Inc. | | 189,678 | |
34,490 | | @ | | PHH Corp. | | 798,444 | |
82,010 | | @ | | Phoenix Cos., Inc. | | 208,305 | |
13,790 | | @ | | Pico Holdings, Inc. | | 438,522 | |
22,880 | | @, L | | Pinnacle Financial Partners, Inc. | | 310,710 | |
12,630 | | @ | | Piper Jaffray Cos. | | 442,176 | |
32,440 | | | | Platinum Underwriters Holdings Ltd. | | 1,458,827 | |
97,550 | | @ | | PMI Group, Inc. | | 321,915 | |
11,520 | | @ | | Portfolio Recovery Associates, Inc. | | 866,304 | |
15,080 | | | | Presidential Life Corp. | | 149,744 | |
16,500 | | | | Primerica, Inc. | | 400,125 | |
24,710 | | @, L | | Primus Guaranty Ltd. | | 125,527 | |
25,820 | | | | PrivateBancorp, Inc. | | 371,292 | |
23,640 | | @ | | ProAssurance Corp. | | 1,432,584 | |
40,090 | | | | Prospect Capital Corp. | | 432,972 | |
33,400 | | | | Prosperity Bancshares, Inc. | | 1,311,952 | |
39,470 | | | | Provident Financial Services, Inc. | | 597,181 | |
26,820 | | | | Provident New York Bancorp | | 281,342 | |
95,700 | | | | Radian Group, Inc. | | 772,299 | |
15,130 | | L | | Renasant Corp. | | 255,848 | |
5,760 | | L | | Republic Bancorp., Inc. | | 136,800 | |
29,200 | | | | Retail Opportunity Investments | | 289,372 | |
11,590 | | L | | RLI Corp. | | 609,286 | |
9,356 | | | | Rockville Financial, Inc. | | 114,330 | |
12,270 | | | | Roma Financial Corp. | | 130,062 | |
15,960 | | L | | S&T Bancorp, Inc. | | 360,536 | |
14,793 | | @ | | Safeguard Scientifics, Inc. | | 252,664 | |
9,120 | | | | Safety Insurance Group, Inc. | | 433,838 | |
17,040 | | | | Sandy Spring Bancorp, Inc. | | 314,047 | |
7,680 | | | | SCBT Financial Corp. | | 251,520 | |
12,220 | | | | SeaBright Insurance Holdings, Inc. | | 112,668 | |
38,490 | | | | Selective Insurance Group | | 698,594 | |
8,250 | | | | Sierra Bancorp. | | 88,523 | |
29,300 | | @ | | Signature Bank | | 1,465,000 | |
11,710 | | | | Simmons First National Corp. | | 333,735 | |
5,200 | | | | Solar Capital Ltd. | | 128,856 | |
9,692 | | | | Southside Bancshares, Inc. | | 204,210 | |
12,040 | | @ | | Southwest Bancorp., Inc. | | 149,296 | |
10,180 | | | | State Auto Financial Corp. | | 177,336 | |
16,800 | | | | State Bancorp, Inc. | | 155,400 | |
12,870 | | | | StellarOne Corp. | | 187,130 | |
19,150 | | | | Sterling Bancorp. | | 200,501 | |
63,750 | | | | Sterling Bancshares, Inc. | | 447,525 | |
12,100 | | L | | Stewart Information Services Corp. | | 139,513 | |
21,390 | | @ | | Stifel Financial Corp. | | 1,327,036 | |
3,100 | | | | Student Loan Corp. | | 100,564 | |
8,030 | | | | Suffolk Bancorp | | 198,180 | |
93,520 | | | | Susquehanna Bancshares, Inc. | | 905,274 | |
29,160 | | @ | | SVB Financial Group | | 1,546,938 | |
16,930 | | | | SWS Group, Inc. | | 85,497 | |
8,140 | | L | | SY Bancorp., Inc. | | 199,837 | |
8,390 | | @ | | Tejon Ranch Co. | | 231,145 | |
6,850 | | | | Territorial Bancorp, Inc. | | 136,384 | |
19,840 | | @ | | Texas Capital Bancshares, Inc. | | 421,997 | |
20,100 | | | | TICC Capital Corp. | | 225,321 | |
4,706 | | | | Tompkins Financial Corp. | | 184,287 | |
6,920 | | | | Tower Bancorp, Inc. | | 152,517 | |
26,254 | | | | Tower Group, Inc. | | 671,577 | |
16,760 | | | | TowneBank | | 266,316 | |
38,300 | | @, L | | TradeStation Group, Inc. | | 258,525 | |
14,100 | | L | | Triangle Capital Corp. | | 267,900 | |
10,490 | | | | Trico Bancshares | | 169,414 | |
50,950 | | | | Trustco Bank Corp. | | 323,023 | |
45,150 | | | | Trustmark Corp. | | 1,121,526 | |
21,610 | | | | UMB Financial Corp. | | 895,086 | |
82,460 | | | | Umpqua Holdings Corp. | | 1,004,363 | |
12,870 | | | | Union First Market Bankshares Corp. | | 190,219 | |
25,380 | | L | | United Bankshares, Inc. | | 741,096 | |
51,808 | | @ | | United Community Banks, Inc. | | 101,026 | |
9,440 | | | | United Financial Bancorp, Inc. | | 144,149 | |
18,720 | | | | United Fire & Casualty Co. | | 417,830 | |
11,660 | | L | | Univest Corp. of Pennsylvania | | 223,522 | |
11,956 | | | | ViewPoint Financial Group | | 139,766 | |
6,380 | | @ | | Virtus Investment Partners | | 289,461 | |
12,000 | | | | Washington Banking Co. | | 164,520 | |
12,010 | | | | Washington Trust Bancorp, Inc. | | 262,779 | |
47,860 | | | | Webster Financial Corp. | | 942,842 | |
17,170 | | | | WesBanco, Inc. | | 325,543 | |
11,720 | | @ | | West BanCorp., Inc. | | 91,299 | |
22,370 | | | | Westamerica Bancorp. | | 1,240,864 | |
40,140 | | @, L | | Western Alliance Bancorp. | | 295,430 | |
24,260 | | | | Westfield Financial, Inc. | | 224,405 | |
4,380 | | | | Westwood Holdings Group, Inc. | | 175,025 | |
63,800 | | | | Whitney Holding Corp. | | 902,770 | |
14,150 | | | | Wilshire Bancorp., Inc. | | 107,823 | |
21,240 | | L | | Wintrust Financial Corp. | | 701,557 | |
10,760 | | @, L | | World Acceptance, Corp. | | 568,128 | |
5,980 | | | | WSFS Financial Corp. | | 283,691 | |
| | | | | | 101,445,678 | |
| | | | Health Care: 11.9% | | | |
12,380 | | @ | | Abaxism, Inc. | | 332,403 | |
20,380 | | @ | | Abiomed, Inc. | | 195,852 | |
40,486 | | @ | | Accelrys, Inc. | | 336,034 | |
30,170 | | @ | | Accuray, Inc. | | 203,648 | |
26,460 | | @ | | Acorda Therapeutics, Inc. | | 721,300 | |
9,430 | | @ | | Affymax, Inc. | | 62,710 | |
41,500 | | @ | | Affymetrix, Inc. | | 208,745 | |
6,920 | | @ | | Air Methods Corp. | | 389,388 | |
27,350 | | @ | | Akorn, Inc. | | 166,015 | |
17,450 | | @ | | Albany Molecular Research, Inc. | | 98,069 | |
39,250 | | @ | | Align Technology, Inc. | | 766,945 | |
64,770 | | @ | | Alkermes, Inc. | | 795,376 | |
17,810 | | @ | | Alliance Imaging, Inc. | | 75,514 | |
41,930 | | @ | | Allos Therapeutics, Inc. | | 193,297 | |
5,970 | | @ | | Almost Family, Inc. | | 229,367 | |
24,250 | | @, L | | Alnylam Pharmaceuticals, Inc. | | 239,105 | |
49,740 | | @ | | Alphatec Holdings, Inc. | | 134,298 | |
14,540 | | @ | | AMAG Pharmaceuticals, Inc. | | 263,174 | |
20,490 | | @ | | Amedisys, Inc. | | 686,415 | |
9,350 | | | | America Service Group, Inc. | | 141,559 | |
12,220 | | @ | | American Dental Partners, Inc. | | 165,092 | |
52,360 | | @ | | American Medical Systems Holdings, Inc. | | 987,510 | |
37,250 | | @ | | AMERIGROUP Corp. | | 1,636,020 | |
21,210 | | @ | | AMN Healthcare Services, Inc. | | 130,229 | |
20,440 | | @ | | Amsurg Corp. | | 428,218 | |
7,900 | | | | Analogic Corp. | | 391,129 | |
18,200 | | @ | | Angiodynamics, Inc. | | 279,734 | |
10,180 | | @ | | Ardea Biosciences, Inc. | | 264,680 | |
58,000 | | @, L | | Arena Pharmaceuticals, Inc. | | 99,760 | |
65,700 | | @ | | Ariad Pharmaceuticals, Inc. | | 335,070 | |
22,670 | | @ | | Arqule, Inc. | | 133,073 | |
40,930 | | @ | | Array Biopharma, Inc. | | 122,381 | |
16,700 | | @ | | Arthrocare Corp. | | 518,702 | |
6,110 | | @ | | Assisted Living Concepts, Inc. | | 198,758 | |
22,380 | | @ | | Athenahealth, Inc. | | 917,132 | |
830 | | | | Atrion Corp. | | 148,952 | |
26,020 | | @, L | | Auxilium Pharmaceuticals, Inc. | | 549,022 | |
55,000 | | @ | | AVANIR Pharmaceuticals, Inc. | | 224,400 | |
100,000 | | @, L | | AVI BioPharma, Inc. | | 212,000 | |
17,990 | | @ | | BioCryst Pharmaceuticals, Inc. | | 93,008 | |
13,462 | | @ | | BioMimetic Therapeutics, Inc. | | 170,967 | |
12,740 | | @ | | Bio-Reference Labs, Inc. | | 282,573 | |
27,610 | | @ | | BioScrip, Inc. | | 144,400 | |
21,550 | | @ | | BMP Sunstone Corp. | | 213,561 | |
45,230 | | @ | | Bruker BioSciences Corp. | | 750,818 | |
18,530 | | @, L | | Cadence Pharmaceuticals, Inc. | | 139,902 | |
31,080 | | @ | | Cambrex Corp. | | 160,684 | |
7,200 | | | | Cantel Medical Corp. | | 168,480 | |
28,980 | | @ | | Capital Senior Living Corp. | | 194,166 | |
18,800 | | @ | | CardioNet, Inc. | | 87,984 | |
25,630 | | @ | | Catalyst Health Solutions, Inc. | | 1,191,539 | |
49,970 | | @ | | Celera Corp. | | 314,811 | |
26,200 | | @, L | | Celldex Therapeutics, Inc. | | 107,944 | |
30,240 | | @ | | Centene Corp. | | 766,282 | |
37,500 | | @ | | Cepheid, Inc. | | 853,125 | |
14,490 | | | | Chemed Corp. | | 920,260 | |
9,570 | | @ | | Chindex International, Inc. | | 157,809 | |
12,980 | | @, L | | Clinical Data, Inc. | | 206,512 | |
9,800 | | @ | | Codexis, Inc. | | 103,880 | |
7,330 | | | | Computer Programs & Systems, Inc. | | 343,337 | |
21,630 | | @ | | Conceptus, Inc. | | 298,494 | |
19,740 | | @ | | Conmed Corp. | | 521,728 | |
4,000 | | @ | | Corvel Corp. | | 193,400 | |
19,260 | | @ | | Cross Country Healthcare, Inc. | | 163,132 | |
25,450 | | @ | | CryoLife, Inc. | | 137,939 | |
40,170 | | @, L | | Cubist Pharmaceuticals, Inc. | | 859,638 | |
50,950 | | @ | | Curis, Inc. | | 100,881 | |
13,090 | | @ | | Cutera, Inc. | | 108,516 | |
16,990 | | @ | | Cyberonics | | 527,030 | |
14,180 | | @ | | Cynosure, Inc. | | 145,061 | |
45,000 | | @ | | Cytokinetics, Inc. | | 94,050 | |
20,900 | | @ | | Cytori Therapeutics, Inc. | | 108,471 | |
23,320 | | @, L | | Delcath Systems, Inc. | | 228,536 | |
48,400 | | @ | | Depomed, Inc. | | 307,824 | |
30,280 | | @ | | DexCom, Inc. | | 413,322 | |
12,700 | | @ | | Dionex Corp. | | 1,498,727 | |
51,010 | | @ | | Durect Corp. | | 175,985 | |
43,010 | | @ | | Dyax Corp. | | 92,041 | |
49,200 | | @ | | Dynavax Technologies Corp. | | 157,440 | |
11,570 | | @ | | Emergent Biosolutions, Inc. | | 271,432 | |
11,880 | | @, L | | Emeritus Corp. | | 234,155 | |
37,130 | | @ | | Endologix, Inc. | | 265,480 | |
7,220 | | | | Ensign Group, Inc. | | 179,561 | |
10,730 | | @ | | Enzo Biochem, Inc. | | 56,654 | |
33,350 | | @ | | Enzon Pharmaceuticals, Inc. | | 405,870 | |
29,370 | | @ | | eResearch Technology, Inc. | | 215,870 | |
10,400 | | @ | | Eurand NV | | 123,032 | |
10,610 | | @ | | Exactech, Inc. | | 199,680 | |
69,950 | | @ | | Exelixis, Inc. | | 574,290 | |
10,000 | | @ | | Furiex Pharmaceuticals, Inc. | | 144,500 | |
9,530 | | @, L | | Genomic Health, Inc. | | 203,847 | |
11,650 | | @ | | Genoptix, Inc. | | 221,583 | |
17,440 | | @ | | Gentiva Health Services, Inc. | | 463,904 | |
59,210 | | @, L | | Geron Corp. | | 306,116 | |
15,380 | | @ | | Greatbatch, Inc. | | 371,427 | |
19,490 | | @ | | Haemonetics Corp. | | 1,231,378 | |
39,860 | | @, L | | Halozyme Therapeutics, Inc. | | 315,691 | |
18,040 | | @ | | Hanger Orthopedic Group, Inc. | | 382,268 | |
68,830 | | @, L | | Hansen Medical, Inc. | | 101,180 | |
64,420 | | @ | | Healthsouth Corp. | | 1,334,138 | |
38,270 | | @ | | Healthspring, Inc. | | 1,015,303 | |
24,420 | | @ | | Healthways, Inc. | | 272,527 | |
6,363 | | @, L | | HeartWare International, Inc. | | 557,208 | |
7,360 | | @, L | | Hi-Tech Pharmacal Co., Inc. | | 183,632 | |
19,020 | | @ | | HMS Holdings Corp. | | 1,231,925 | |
6,680 | | @ | | ICU Medical, Inc. | | 243,820 | |
29,200 | | @ | | Idenix Pharmaceuticals, Inc. | | 147,168 | |
50,240 | | @ | | Immucor, Inc. | | 996,259 | |
34,560 | | @, L | | Immunogen, Inc. | | 320,026 | |
50,550 | | @, L | | Immunomedics, Inc. | | 180,969 | |
42,680 | | @ | | Impax Laboratories, Inc. | | 858,295 | |
57,340 | | @, L | | Incyte Corp. | | 949,550 | |
37,470 | | @ | | Inspire Pharmaceuticals, Inc. | | 314,748 | |
20,050 | | @ | | Insulet Corp. | | 310,775 | |
13,030 | | @ | | Integra LifeSciences Holdings Corp. | | 616,319 | |
20,170 | | @, L | | InterMune, Inc. | | 734,188 | |
19,760 | | | | Invacare Corp. | | 595,962 | |
12,270 | | @ | | IPC The Hospitalist Co., Inc. | | 478,653 | |
11,390 | | @ | | IRIS International, Inc. | | 116,520 | |
17,600 | | @ | | Ironwood Pharmaceuticals, Inc. | | 182,160 | |
51,120 | | @, L | | Isis Pharmaceuticals, Inc. | | 517,334 | |
14,300 | | @ | | Jazz Pharmaceuticals, Inc. | | 281,424 | |
12,750 | | @ | | Kendle International, Inc. | | 138,848 | |
9,140 | | @ | | Kensey Nash Corp. | | 254,366 | |
28,100 | | @, L | | Keryx Biopharmaceuticals, Inc. | | 128,698 | |
26,600 | | @ | | Kindred Healthcare, Inc. | | 488,642 | |
7,180 | | | | Landauer, Inc. | | 430,585 | |
19,460 | | @ | | LCA-Vision, Inc. | | 111,895 | |
141,100 | | @ | | Lexicon Genetics, Inc. | | 203,184 | |
7,110 | | @ | | LHC Group, Inc. | | 213,300 | |
12,355 | | @ | | Ligand Pharmaceuticals, Inc. | | 110,207 | |
22,680 | | @ | | Luminex Corp. | | 414,590 | |
22,900 | | @ | | Magellan Health Services, Inc. | | 1,082,712 | |
18,100 | | @, L | | MAKO Surgical Corp. | | 275,482 | |
37,610 | | @, L | | MannKind Corp. | | 303,137 | |
6,100 | | @ | | MAP Pharmaceuticals, Inc. | | 102,114 | |
20,910 | | @ | | Martek Biosciences Corp. | | 654,483 | |
37,310 | | @ | | Masimo Corp. | | 1,084,602 | |
24,830 | | @ | | MedAssets, Inc. | | 501,318 | |
24,150 | | @ | | Medcath Corp. | | 336,893 | |
8,160 | | @ | | Medical Action Industries, Inc. | | 78,173 | |
28,440 | | @ | | Medicines Co. | | 401,857 | |
41,600 | | | | Medicis Pharmaceutical Corp. | | 1,114,464 | |
10,900 | | @ | | Medidata Solutions, Inc. | | 260,292 | |
19,440 | | @ | | Medivation, Inc. | | 294,905 | |
14,840 | | @ | | MELA Sciences, Inc. | | 49,714 | |
46,600 | | @ | | Merge Healthcare, Inc. | | 173,818 | |
28,990 | | | | Meridian Bioscience, Inc. | | 671,408 | |
15,610 | | @ | | Merit Medical Systems, Inc. | | 247,106 | |
18,380 | | @, L | | Metabolix, Inc. | | 223,685 | |
35,400 | | @ | | Metropolitan Health Networks, Inc. | | 158,238 | |
55,210 | | @ | | Micromet, Inc. | | 448,305 | |
8,240 | | @ | | Molina Healthcare, Inc. | | 229,484 | |
22,060 | | @, L | | Momenta Pharmaceuticals, Inc. | | 330,238 | |
8,390 | | @ | | MWI Veterinary Supply, Inc. | | 529,829 | |
37,520 | | @ | | Nabi Biopharmaceuticals | | 217,241 | |
5,170 | | | | National Healthcare Corp. | | 239,216 | |
19,430 | | @ | | Natus Medical, Inc. | | 275,517 | |
65,770 | | @ | | Nektar Therapeutics | | 845,145 | |
15,215 | | @ | | Neogen Corp. | | 624,271 | |
33,100 | | @, L | | Neostem, Inc. | | 46,671 | |
26,620 | | @ | | Neurocrine Biosciences, Inc. | | 203,377 | |
5,880 | | @, L | | NeurogesX, Inc. | | 37,397 | |
49,940 | | @ | | Novavax, Inc. | | 121,354 | |
28,070 | | @ | | NPS Pharmaceuticals, Inc. | | 221,753 | |
26,880 | | @, L | | NuVasive, Inc. | | 689,472 | |
16,670 | | @ | | NxStage Medical, Inc. | | 414,750 | |
9,290 | | @ | | Obagi Medical Products, Inc. | | 107,300 | |
25,670 | | @ | | Omnicell, Inc. | | 370,932 | |
43,910 | | @, L | | Onyx Pharmaceuticals, Inc. | | 1,618,962 | |
20,050 | | @ | | Opko Health, Inc. | | 73,584 | |
19,040 | | @ | | Optimer Pharmaceuticals, Inc. | | 215,342 | |
36,250 | | @ | | OraSure Technologies, Inc. | | 208,438 | |
23,350 | | @, L | | Orexigen Therapeutics, Inc. | | 188,668 | |
10,680 | | @ | | Orthofix International NV | | 309,720 | |
9,910 | | @ | | Osiris Therapeutics, Inc. | | 77,199 | |
43,580 | | | | Owens & Minor, Inc. | | 1,282,559 | |
28,830 | | @ | | Pain Therapeutics, Inc. | | 194,603 | |
22,360 | | @ | | Palomar Medical Technologies, Inc. | | 317,736 | |
23,520 | | @ | | Par Pharmaceutical Cos., Inc. | | 905,755 | |
39,560 | | @ | | Parexel International Corp. | | 839,859 | |
81,930 | | @ | | PDL BioPharma, Inc. | | 510,424 | |
64,400 | | @ | | Peregrine Pharmaceuticals, Inc. | | 148,120 | |
21,600 | | @ | | Pharmacyclics, Inc. | | 131,328 | |
19,580 | | @ | | Pharmasset, Inc. | | 849,968 | |
19,710 | | @ | | PharMerica Corp. | | 225,680 | |
15,610 | | @ | | Pozen, Inc. | | 103,807 | |
19,610 | | @ | | Progenics Pharmaceuticals, Inc. | | 107,071 | |
5,230 | | @ | | Providence Service Corp. | | 84,046 | |
39,330 | | @ | | PSS World Medical, Inc. | | 888,858 | |
38,400 | | @, L | | Pure Bioscience | | 85,248 | |
11,740 | | | | Quality Systems, Inc. | | 819,687 | |
39,230 | | @ | | Questcor Pharmaceuticals, Inc. | | 577,858 | |
13,650 | | @, L | | Quidel Corp. | | 197,243 | |
16,680 | | @ | | RehabCare Group, Inc. | | 395,316 | |
29,150 | | @, L | | Rigel Pharmaceuticals, Inc. | | 219,500 | |
11,100 | | @ | | Rochester Medical Corp. | | 121,212 | |
63,290 | | @ | | RTI Biologics, Inc. | | 168,984 | |
39,030 | | @ | | Salix Pharmaceuticals Ltd. | | 1,832,849 | |
36,360 | | @ | | Sangamo Biosciences, Inc. | | 241,430 | |
33,500 | | @ | | Santarus, Inc. | | 109,545 | |
42,440 | | @, L | | Savient Pharmaceuticals, Inc. | | 472,782 | |
51,070 | | @, L | | Seattle Genetics, Inc. | | 763,497 | |
23,800 | | @ | | Select Medical Holdings Corp. | | 173,978 | |
41,450 | | @, L | | Sequenom, Inc. | | 332,429 | |
20,920 | | @, L | | SIGA Technologies, Inc. | | 292,880 | |
26,130 | | @ | | Sirona Dental Systems, Inc. | | 1,091,711 | |
12,910 | | @ | | Skilled Healthcare Group, Inc. | | 115,932 | |
27,200 | | @, L | | Somaxon Pharmaceuticals, Inc. | | 85,680 | |
12,120 | | @ | | SonoSite, Inc. | | 382,992 | |
19,920 | | @ | | Spectranetics Corp. | | 102,787 | |
28,340 | | @ | | Spectrum Pharmaceuticals, Inc. | | 194,696 | |
75,420 | | @ | | StemCells, Inc. | | 81,454 | |
22,070 | | @, L | | Stereotaxis, Inc. | | 84,528 | |
38,820 | | | | Steris Corp. | | 1,415,377 | |
9,400 | | @ | | Sun Healthcare Group, Inc. | | 119,004 | |
30,350 | | @ | | Sunrise Senior Living, Inc. | | 165,408 | |
63,930 | | @ | | SuperGen, Inc. | | 167,497 | |
10,170 | | @, L | | SurModics, Inc. | | 120,718 | |
20,090 | | @ | | Symmetry Medical, Inc. | | 185,833 | |
20,600 | | @ | | Syneron Medical Ltd. | | 209,914 | |
6,000 | | @ | | Synovis Life Technologies, Inc. | | 96,660 | |
16,200 | | @ | | Targacept, Inc. | | 429,300 | |
9,300 | | @ | | Team Health Holdings, Inc. | | 144,522 | |
41,810 | | @ | | Theravance, Inc. | | 1,048,177 | |
43,890 | | @ | | TomoTherapy, Inc. | | 158,443 | |
12,770 | | @ | | Triple-S Management Corp. | | 243,652 | |
16,920 | | @ | | Universal American Financial Corp. | | 346,014 | |
5,700 | | @ | | US Physical Therapy, Inc. | | 112,974 | |
17,950 | | @ | | Vanda Pharmaceuticals, Inc. | | 169,807 | |
12,500 | | @ | | Vascular Solutions, Inc. | | 146,500 | |
44,100 | | @, L | | Vical, Inc. | | 89,082 | |
50,190 | | @ | | Viropharma, Inc. | | 869,291 | |
10,560 | | @ | | Vital Images, Inc. | | 147,629 | |
53,870 | | @ | | Vivus, Inc. | | 504,762 | |
28,510 | | @ | | Volcano Corp. | | 778,608 | |
26,400 | | @ | | WellCare Health Plans, Inc. | | 797,808 | |
24,080 | | | | West Pharmaceutical Services, Inc. | | 992,096 | |
22,900 | | @ | | Wright Medical Group, Inc. | | 355,637 | |
18,240 | | @, L | | Xenoport, Inc. | | 155,405 | |
6,100 | | | | Young Innovations, Inc. | | 195,261 | |
54,800 | | @ | | Zalicus, Inc. | | 86,584 | |
14,110 | | @ | | Zoll Medical Corp. | | 525,315 | |
| | | | | | 91,656,345 | |
| | | | Industrials: 15.9% | | | |
12,710 | | @, L | | 3D Systems Corp. | | 400,238 | |
49,100 | | @, L | | A123 Systems, Inc. | | 468,414 | |
8,710 | | | | AAON, Inc. | | 245,709 | |
23,920 | | @ | | AAR Corp. | | 657,082 | |
35,650 | | | | ABM Industries, Inc. | | 937,595 | |
16,880 | | @ | | Acacia Research - Acacia Technologies | | 437,867 | |
47,160 | | @ | | ACCO Brands Corp. | | 401,803 | |
44,440 | | | | Actuant Corp. | | 1,182,993 | |
31,450 | | | | Acuity Brands, Inc. | | 1,813,722 | |
14,080 | | | | Administaff, Inc. | | 412,544 | |
42,940 | | @ | | Advanced Battery Technologies, Inc. | | 165,319 | |
9,780 | | @ | | Advisory Board Co. | | 465,821 | |
9,860 | | @ | | Aerovironment, Inc. | | 264,544 | |
30,280 | | @ | | Air Transport Services Group, Inc. | | 239,212 | |
30,740 | | @ | | Aircastle Ltd. | | 321,233 | |
85,380 | | @ | | Airtran Holdings, Inc. | | 630,958 | |
5,300 | | | | Alamo Group, Inc. | | 147,446 | |
26,360 | | @ | | Alaska Air Group, Inc. | | 1,494,348 | |
15,690 | | | | Albany International Corp. | | 371,696 | |
10,100 | | @, L | | Allegiant Travel Co. | | 497,324 | |
17,330 | | @ | | Altra Holdings, Inc. | | 344,174 | |
6,030 | | @ | | Amerco, Inc. | | 579,121 | |
6,500 | | @ | | American Railcar Industries, Inc. | | 143,845 | |
27,400 | | @ | | American Reprographics Co. | | 207,966 | |
6,060 | | | | American Science & Engineering, Inc. | | 516,494 | |
34,760 | | @ | | American Superconductor Corp. | | 993,788 | |
7,140 | | | | American Woodmark Corp. | | 175,216 | |
6,520 | | | | Ameron International Corp. | | 497,932 | |
4,570 | | | | Ampco-Pittsburgh Corp. | | 128,189 | |
23,775 | | | | AO Smith Corp. | | 905,352 | |
25,120 | | @ | | APAC Customer Services, Inc. | | 152,478 | |
18,900 | | | | Apogee Enterprises, Inc. | | 254,583 | |
26,410 | | | | Applied Industrial Technologies, Inc. | | 857,797 | |
8,200 | | | | Applied Signal Technology, Inc. | | 310,698 | |
12,100 | | | | Arkansas Best Corp. | | 331,782 | |
66,330 | | @ | | ArvinMeritor, Inc. | | 1,361,092 | |
15,610 | | @ | | Astec Industries, Inc. | | 505,920 | |
17,770 | | @ | | Atlas Air Worldwide Holdings, Inc. | | 992,099 | |
76,030 | | @, L | | Avis Budget Group, Inc. | | 1,183,027 | |
8,160 | | | | AZZ, Inc. | | 326,482 | |
9,920 | | | | Badger Meter, Inc. | | 438,662 | |
32,240 | | | | Baldor Electric Co. | | 2,032,410 | |
35,600 | | | | Barnes Group, Inc. | | 735,852 | |
6,900 | | | | Barrett Business Services, Inc. | | 107,295 | |
27,680 | | @ | | Beacon Roofing Supply, Inc. | | 494,642 | |
28,750 | | | | Belden CDT, Inc. | | 1,058,575 | |
32,850 | | @ | | Blount International, Inc. | | 517,716 | |
7,750 | | @ | | BlueLinx Holdings, Inc. | | 28,365 | |
36,720 | | | | Brady Corp. | | 1,197,439 | |
27,670 | | | | Briggs & Stratton Corp. | | 544,822 | |
29,800 | | | | Brink’s Co. | | 801,024 | |
69,140 | | @, L | | Broadwind Energy, Inc. | | 159,713 | |
33,460 | | @ | | Builders FirstSource, Inc. | | 65,916 | |
7,500 | | @ | | CAI International, Inc. | | 147,000 | |
136,800 | | @ | | Capstone Turbine Corp. | | 131,301 | |
5,430 | | | | Cascade Corp. | | 256,730 | |
34,080 | | @ | | CBIZ, Inc. | | 212,659 | |
6,600 | | | | CDI Corp. | | 122,694 | |
13,870 | | @ | | Celadon Group, Inc. | | 205,137 | |
36,930 | | @ | | Cenveo, Inc. | | 197,206 | |
15,480 | | @ | | Ceradyne, Inc. | | 488,084 | |
19,350 | | @ | | Chart Industries, Inc. | | 653,643 | |
11,730 | | | | CIRCOR International, Inc. | | 495,944 | |
36,230 | | | | Clarcor, Inc. | | 1,553,905 | |
16,670 | | @ | | Clean Harbors, Inc. | | 1,401,614 | |
16,980 | | @, L | | Colfax Corp. | | 312,602 | |
10,040 | | @ | | Columbus McKinnon Corp. | | 204,013 | |
27,680 | | | | Comfort Systems USA, Inc. | | 364,546 | |
17,300 | | @ | | Commercial Vehicle Group, Inc. | | 281,125 | |
7,450 | | @ | | Consolidated Graphics, Inc. | | 360,804 | |
21,880 | | | | Corporate Executive Board Co. | | 821,594 | |
12,800 | | @ | | CoStar Group, Inc. | | 736,768 | |
7,420 | | | | Courier Corp. | | 115,158 | |
6,610 | | @ | | CRA International, Inc. | | 155,401 | |
9,620 | | | | Cubic Corp. | | 453,583 | |
31,660 | | | | Curtiss-Wright Corp. | | 1,051,112 | |
33,150 | | | | Deluxe Corp. | | 763,113 | |
18,570 | | @ | | DigitalGlobe, Inc. | | 588,855 | |
12,110 | | @ | | Dolan Media Co. | | 168,571 | |
20,110 | | @ | | Dollar Thrifty Automotive Group | | 950,399 | |
4,360 | | | | Ducommun, Inc. | | 94,961 | |
15,760 | | @ | | Dycom Industries, Inc. | | 232,460 | |
9,760 | | @ | | Dynamex, Inc. | | 241,658 | |
13,560 | | | | Dynamic Materials Corp. | | 306,049 | |
43,260 | | @ | | Eagle Bulk Shipping, Inc. | | 215,435 | |
44,210 | | @ | | EMCOR Group, Inc. | | 1,281,206 | |
13,810 | | | | Encore Wire Corp. | | 346,355 | |
32,450 | | @ | | Ener1, Inc. | | 122,986 | |
22,510 | | @, L | | Energy Recovery, Inc. | | 82,387 | |
51,060 | | | | Energy Solutions, Inc. | | 284,404 | |
13,230 | | @, L | | Enernoc, Inc. | | 316,329 | |
38,210 | | @ | | EnerSys | | 1,227,305 | |
17,720 | | | | Ennis, Inc. | | 303,012 | |
12,640 | | @ | | EnPro Industries, Inc. | | 525,318 | |
15,900 | | | | ESCO Technologies, Inc. | | 601,656 | |
18,280 | | @ | | Esterline Technologies Corp. | | 1,253,825 | |
21,300 | | @, L | | Excel Maritime Carriers Ltd. | | 119,919 | |
8,290 | | @ | | Exponent, Inc. | | 311,124 | |
42,840 | | | | Federal Signal Corp. | | 293,882 | |
41,200 | | @ | | Flow International Corp. | | 168,508 | |
25,060 | | @ | | Force Protection, Inc. | | 138,081 | |
19,070 | | | | Forward Air Corp. | | 541,207 | |
16,320 | | | | Franklin Electric Co., Inc. | | 635,174 | |
7,000 | | | | Freightcar America, Inc. | | 202,580 | |
10,730 | | @ | | Fuel Tech, Inc. | | 104,188 | |
51,840 | | @ | | FuelCell Energy, Inc. | | 119,750 | |
34,910 | | @ | | Furmanite Corp. | | 241,228 | |
11,050 | | | | G&K Services, Inc. | | 341,556 | |
14,500 | | @, L | | Genco Shipping & Trading Ltd. | | 208,800 | |
42,090 | | @ | | Gencorp, Inc. | | 217,605 | |
10,200 | | @ | | Generac Holdings, Inc. | | 164,934 | |
26,640 | | @ | | Genesee & Wyoming, Inc. | | 1,410,588 | |
40,117 | | @ | | Geo Group, Inc. | | 989,285 | |
12,430 | | @ | | GeoEye, Inc. | | 526,908 | |
17,600 | | @ | | Gibraltar Industries, Inc. | | 238,832 | |
9,290 | | | | Gorman-Rupp Co. | | 300,253 | |
83,210 | | @ | | GrafTech International Ltd. | | 1,650,886 | |
12,220 | | | | Graham Corp. | | 244,400 | |
19,140 | | | | Granite Construction, Inc. | | 525,010 | |
31,440 | | | | Great Lakes Dredge & Dock Corp. | | 231,713 | |
15,070 | | @, L | | Greenbrier Cos., Inc. | | 316,319 | |
21,530 | | @ | | Griffon Corp. | | 274,292 | |
20,360 | | @ | | H&E Equipment Services, Inc. | | 235,565 | |
29,060 | | @ | | Hawaiian Holdings, Inc. | | 227,830 | |
35,565 | | | | Healthcare Services Group | | 578,643 | |
37,390 | | | | Heartland Express, Inc. | | 598,988 | |
18,312 | | | | Heico Corp. | | 934,461 | |
11,490 | | | | Heidrick & Struggles International, Inc. | | 329,189 | |
11,420 | | @ | | Herley Industries, Inc. | | 197,794 | |
43,300 | | | | Herman Miller, Inc. | | 1,095,490 | |
66,860 | | @ | | Hexcel Corp. | | 1,209,497 | |
32,620 | | | | HNI, Corp. | | 1,017,744 | |
33,560 | | | | Horizon Lines, Inc. | | 146,657 | |
13,790 | | L | | Houston Wire & Cable Co. | | 185,338 | |
26,960 | | @ | | HUB Group, Inc. | | 947,374 | |
14,750 | | @ | | Huron Consulting Group, Inc. | | 390,138 | |
10,350 | | @ | | ICF International, Inc. | | 266,202 | |
16,910 | | @ | | II-VI, Inc. | | 783,948 | |
16,740 | | @ | | Innerworkings, Inc. | | 109,647 | |
25,890 | | @ | | Insituform Technologies, Inc. | | 686,344 | |
12,330 | | | | Insteel Industries, Inc. | | 154,002 | |
29,570 | | | | Interface, Inc. | | 462,771 | |
22,200 | | @ | | Interline Brands, Inc. | | 505,494 | |
3,830 | | | | International Shipholding Corp. | | 97,282 | |
161,730 | | @, L | | JetBlue Airways Corp. | | 1,069,035 | |
18,070 | | | | John Bean Technologies Corp. | | 363,749 | |
8,740 | | @ | | Kadant, Inc. | | 206,002 | |
15,700 | | | | Kaman Corp. | | 456,399 | |
23,000 | | | | Kaydon Corp. | | 936,560 | |
15,530 | | @ | | Kelly Services, Inc. | | 291,964 | |
25,030 | | @ | | Kforce, Inc. | | 404,985 | |
22,980 | | | | Kimball International, Inc. | | 158,562 | |
39,870 | | | | Knight Transportation, Inc. | | 757,530 | |
31,440 | | | | Knoll, Inc. | | 525,991 | |
27,630 | | @ | | Korn/Ferry International | | 638,529 | |
10,050 | | @ | | LaBarge, Inc. | | 157,886 | |
11,770 | | @ | | Ladish Co., Inc. | | 572,140 | |
11,220 | | @ | | Layne Christensen Co. | | 386,192 | |
7,410 | | @ | | LB Foster Co. | | 303,365 | |
10,440 | | L | | Lindsay Manufacturing Co. | | 620,449 | |
7,400 | | @ | | LMI Aerospace, Inc. | | 118,326 | |
15,520 | | | | LSI Industries, Inc. | | 131,299 | |
8,440 | | @ | | M&F Worldwide Corp. | | 194,964 | |
9,500 | | | | Marten Transport Ltd. | | 203,110 | |
34,690 | | @ | | Mastec, Inc. | | 506,127 | |
15,780 | | | | McGrath Rentcorp | | 413,752 | |
32,910 | | @ | | Metalico, Inc. | | 193,511 | |
9,230 | | | | Met-Pro Corp. | | 109,006 | |
4,600 | | @ | | Michael Baker Corp. | | 143,060 | |
11,376 | | @ | | Middleby Corp. | | 960,362 | |
9,750 | | | | Miller Industries, Inc. | | 138,743 | |
16,120 | | | | Mine Safety Appliances Co. | | 501,816 | |
9,000 | | @ | | Mistras Group, Inc. | | 121,320 | |
24,030 | | @ | | Mobile Mini, Inc. | | 473,151 | |
31,650 | | @ | | Moog, Inc. | | 1,259,670 | |
23,920 | | | | Mueller Industries, Inc. | | 782,184 | |
106,940 | | | | Mueller Water Products, Inc. | | 445,940 | |
14,090 | | @ | | MYR Group, Inc./Delaware | | 295,890 | |
3,750 | | | | Nacco Industries, Inc. | | 406,388 | |
3,860 | | | | National Presto Industries, Inc. | | 501,839 | |
33,170 | | @ | | Navigant Consulting, Inc. | | 305,164 | |
23,760 | | | | Nordson Corp. | | 2,183,069 | |
6,510 | | @ | | Northwest Pipe Co. | | 156,435 | |
29,715 | | @ | | Old Dominion Freight Line | | 950,583 | |
20,780 | | @ | | On Assignment, Inc. | | 169,357 | |
40,920 | | @ | | Orbital Sciences Corp. | | 700,960 | |
16,710 | | @ | | Orion Marine Group, Inc. | | 193,836 | |
34,300 | | @ | | Pacer International, Inc. | | 234,612 | |
9,560 | | @ | | Pike Electric Corp. | | 82,025 | |
8,770 | | @, L | | PMFG, Inc. | | 143,828 | |
16,970 | | @ | | Polypore International, Inc. | | 691,188 | |
3,600 | | @ | | Powell Industries, Inc. | | 118,368 | |
13,500 | | | | Primoris Services Corp. | | 128,790 | |
17,000 | | @ | | Quality Distribution, Inc. | | 154,530 | |
20,650 | | | | Quanex Building Products Corp. | | 391,731 | |
13,300 | | @ | | RailAmerica, Inc. | | 172,235 | |
8,940 | | | | Raven Industries, Inc. | | 426,349 | |
13,200 | | @ | | RBC Bearings, Inc. | | 515,856 | |
11,800 | | @ | | Republic Airways Holdings, Inc. | | 86,376 | |
30,340 | | | | Resources Connection, Inc. | | 564,021 | |
9,200 | | @ | | Roadrunner Transportation Systems, Inc. | | 133,032 | |
18,120 | | L | | Robbins & Myers, Inc. | | 648,334 | |
55,140 | | | | Rollins, Inc. | | 1,089,015 | |
34,720 | | @ | | RSC Holdings, Inc. | | 338,173 | |
20,700 | | @ | | Rush Enterprises, Inc. - Class A | | 423,108 | |
7,960 | | @ | | Saia, Inc. | | 132,056 | |
36,430 | | @ | | SatCon Technology Corp. | | 163,935 | |
7,500 | | @ | | Sauer-Danfoss, Inc. | | 211,875 | |
8,740 | | | | Schawk, Inc. | | 179,869 | |
11,460 | | @ | | School Specialty, Inc. | | 159,638 | |
210 | | | | Seaboard Corp. | | 418,110 | |
38,630 | | @ | | SFN Group, Inc. | | 377,029 | |
25,110 | | | | Simpson Manufacturing Co., Inc. | | 776,150 | |
39,410 | | | | Skywest, Inc. | | 615,584 | |
11,140 | | @ | | Standard Parking Corp. | | 210,435 | |
8,150 | | | | Standex International Corp. | | 243,767 | |
38,200 | | | | Steelcase, Inc. | | 403,774 | |
8,600 | | @ | | Sterling Construction Co., Inc. | | 112,144 | |
6,990 | | | | Sun Hydraulics Corp. | | 264,222 | |
22,720 | | @ | | SYKES Enterprises, Inc. | | 460,307 | |
11,580 | | | | TAL International Group, Inc. | | 357,475 | |
61,820 | | @ | | Taser International, Inc. | | 290,554 | |
12,300 | | @ | | Team, Inc. | | 297,660 | |
9,960 | | @ | | Tecumseh Products Co. | | 129,978 | |
23,060 | | @ | | Teledyne Technologies, Inc. | | 1,013,948 | |
12,180 | | | | Tennant Co. | | 467,834 | |
40,950 | | @, L | | Tetra Tech, Inc. | | 1,026,207 | |
5,280 | | L | | Textainer Group Holdings Ltd. | | 150,427 | |
30,035 | | | | Titan International, Inc. | | 586,884 | |
14,740 | | @, L | | Titan Machinery, Inc. | | 284,482 | |
18,910 | | | | Tredegar Corp. | | 366,476 | |
9,250 | | @, L | | Trex Co., Inc. | | 221,630 | |
12,200 | | @ | | Trimas Corp. | | 249,612 | |
9,530 | | | | Triumph Group, Inc. | | 852,077 | |
27,920 | | @ | | TrueBlue, Inc. | | 502,281 | |
18,180 | | @ | | Tutor Perini Corp. | | 389,234 | |
12,800 | | | | Twin Disc, Inc. | | 382,208 | |
22,550 | | @, L | | Ultrapetrol Bahamas Ltd. | | 144,997 | |
9,390 | | | | Unifirst Corp. | | 516,920 | |
46,640 | | @ | | United Rentals, Inc. | | 1,061,060 | |
16,800 | | @ | | United Stationers, Inc. | | 1,072,008 | |
11,040 | | | | Universal Forest Products, Inc. | | 429,456 | |
114,340 | | @ | | US Airways Group, Inc. | | 1,144,543 | |
11,010 | | | | US Ecology, Inc. | | 191,354 | |
3,890 | | @ | | USA Truck, Inc. | | 51,465 | |
17,560 | | | | Viad Corp. | | 447,253 | |
9,990 | | | | Vicor Corp. | | 163,836 | |
19,930 | | @ | | Volt Information Sciences, Inc. | | 172,395 | |
5,300 | | | | VSE Corp. | | 175,006 | |
35,600 | | @ | | Wabash National Corp. | | 421,860 | |
19,160 | | L | | Watsco, Inc. | | 1,208,613 | |
19,070 | | | | Watts Water Technologies, Inc. | | 697,771 | |
27,410 | | | | Werner Enterprises, Inc. | | 619,466 | |
44,680 | | | | Woodward Governor Co. | | 1,678,181 | |
8,300 | | @ | | Xerium Technologies, Inc. | | 132,385 | |
| | | | | | 122,189,863 | |
| | | | Information Technology: 18.2% | | | |
22,900 | | @ | | ACI Worldwide, Inc. | | 615,323 | |
31,550 | | @ | | Acme Packet, Inc. | | 1,677,198 | |
40,730 | | @ | | Actuate Corp. | | 232,161 | |
45,400 | | @ | | Acxiom Corp. | | 778,610 | |
43,240 | | | | Adtran, Inc. | | 1,565,720 | |
21,450 | | @ | | Advanced Energy Industries, Inc. | | 292,578 | |
11,070 | | @ | | Advent Software, Inc. | | 641,174 | |
11,760 | | @ | | Agilysys, Inc. | | 66,209 | |
7,000 | | @ | | Alpha & Omega Semiconductor Ltd. | | 89,810 | |
20,870 | | | | American Software, Inc. | | 141,290 | |
64,400 | | @ | | Amkor Technology, Inc. | | 475,916 | |
37,930 | | @ | | Anadigics, Inc. | | 262,855 | |
12,840 | | @ | | Anaren, Inc. | | 267,714 | |
10,900 | | @ | | Ancestry.com, Inc. | | 308,688 | |
20,150 | | @ | | Anixter International, Inc. | | 1,203,560 | |
44,930 | | @ | | Applied Micro Circuits Corp. | | 479,852 | |
64,990 | | @ | | Ariba, Inc. | | 1,526,615 | |
91,600 | | @ | | Arris Group, Inc. | | 1,027,752 | |
86,560 | | @ | | Art Technology Group, Inc. | | 517,629 | |
40,930 | | @ | | Aruba Networks, Inc. | | 854,618 | |
39,600 | | @ | | Aspen Technology, Inc. | | 502,920 | |
21,620 | | @ | | ATMI, Inc. | | 431,103 | |
25,140 | | @ | | Aviat Networks, Inc. | | 127,460 | |
16,950 | | @ | | Avid Technology, Inc. | | 295,947 | |
27,900 | | @ | | AXT, Inc. | | 291,276 | |
7,960 | | | | Bel Fuse, Inc. | | 190,244 | |
35,700 | | @ | | Benchmark Electronics, Inc. | | 648,312 | |
23,640 | | @ | | BigBand Networks, Inc. | | 66,192 | |
10,180 | | | | Black Box Corp. | | 389,792 | |
29,360 | | | | Blackbaud, Inc. | | 760,424 | |
23,490 | | @, L | | Blackboard, Inc. | | 970,137 | |
25,760 | | @ | | Blue Coat Systems, Inc. | | 769,451 | |
14,860 | | @ | | Bottomline Technologies, Inc. | | 322,611 | |
56,290 | | @ | | Brightpoint, Inc. | | 491,412 | |
38,980 | | @ | | Brooks Automation, Inc. | | 353,549 | |
16,260 | | @ | | Cabot Microelectronics Corp. | | 673,977 | |
20,740 | | @ | | CACI International, Inc. | | 1,107,516 | |
9,600 | | @, L | | Calix, Inc. | | 162,240 | |
19,150 | | @ | | Cardtronics, Inc. | | 338,955 | |
6,050 | | | | Cass Information Systems, Inc. | | 229,537 | |
30,470 | | @ | | Cavium Networks, Inc. | | 1,148,110 | |
17,130 | | @ | | Ceva, Inc. | | 351,165 | |
25,990 | | @ | | Checkpoint Systems, Inc. | | 534,095 | |
44,710 | | @ | | Ciber, Inc. | | 209,243 | |
37,070 | | @, L | | Cirrus Logic, Inc. | | 592,379 | |
24,540 | | | | Cognex Corp. | | 721,967 | |
15,920 | | @ | | Coherent, Inc. | | 718,629 | |
16,020 | | | | Cohu, Inc. | | 265,612 | |
27,940 | | @ | | Commvault Systems, Inc. | | 799,643 | |
12,790 | | @ | | Compellent Technologies, Inc. | | 352,876 | |
16,000 | | @ | | comScore, Inc. | | 356,960 | |
17,300 | | | | Comtech Telecommunications | | 479,729 | |
12,910 | | @, L | | Comverge, Inc. | | 89,208 | |
27,700 | | @ | | Concur Technologies, Inc. | | 1,438,461 | |
60,700 | | @ | | Conexant Systems, Inc. | | 98,941 | |
17,440 | | @, L | | Constant Contact, Inc. | | 540,466 | |
7,300 | | @ | | CPI International, Inc. | | 141,255 | |
17,200 | | @ | | Cray, Inc. | | 122,980 | |
17,420 | | @ | | CSG Systems International | | 329,935 | |
22,400 | | | | CTS Corp. | | 247,744 | |
17,040 | | @ | | Cymer, Inc. | | 767,993 | |
22,710 | | | | Daktronics, Inc. | | 361,543 | |
14,100 | | | | DDi Corp. | | 165,816 | |
27,440 | | @ | | DealerTrack Holdings, Inc. | | 550,721 | |
4,900 | | @ | | Deltek, Inc. | | 35,574 | |
15,470 | | @ | | DemandTec, Inc. | | 167,695 | |
14,250 | | @ | | DG FastChannel, Inc. | | 411,540 | |
5,600 | | @ | | Dice Holdings, Inc. | | 80,360 | |
5,750 | | @ | | Digi International, Inc. | | 63,825 | |
26,680 | | @ | | Digital River, Inc. | | 918,326 | |
23,710 | | @ | | Diodes, Inc. | | 639,933 | |
19,050 | | @ | | DSP Group, Inc. | | 155,067 | |
10,180 | | @ | | DTS, Inc. | | 499,329 | |
63,100 | | | | Earthlink, Inc. | | 542,660 | |
17,450 | | @, L | | Ebix, Inc. | | 413,042 | |
10,340 | | @ | | Echelon Corp. | | 105,365 | |
6,300 | | @, L | | Echo Global Logistics, Inc. | | 75,852 | |
11,980 | | | | Electro Rent Corp. | | 193,597 | |
24,140 | | @ | | Electro Scientific Industries, Inc. | | 386,964 | |
27,220 | | @ | | Electronics for Imaging | | 389,518 | |
11,050 | | @ | | EMS Technologies, Inc. | | 218,569 | |
55,490 | | @ | | Emulex Corp. | | 647,013 | |
30,560 | | @ | | Energy Conversion Devices, Inc. | | 140,576 | |
90,800 | | @ | | Entegris, Inc. | | 678,276 | |
36,710 | | @ | | Entropic Communications, Inc. | | 443,457 | |
33,560 | | @ | | Epicor Software Corp. | | 338,956 | |
23,550 | | | | EPIQ Systems, Inc. | | 323,342 | |
5,350 | | @ | | ePlus, Inc. | | 126,474 | |
34,870 | | @ | | Euronet Worldwide, Inc. | | 608,133 | |
123,340 | | @, L | | Evergreen Solar, Inc. | | 71,907 | |
19,890 | | @ | | Exar Corp. | | 138,832 | |
12,720 | | @ | | ExlService Holdings, Inc. | | 273,226 | |
64,430 | | @ | | Extreme Networks | | 199,089 | |
28,530 | | | | Fair Isaac Corp. | | 666,746 | |
13,930 | | @ | | Faro Technologies, Inc. | | 457,461 | |
22,950 | | @ | | FEI Co. | | 606,110 | |
51,800 | | @ | | Finisar Corp. | | 1,537,942 | |
31,800 | | @ | | Formfactor, Inc. | | 282,384 | |
9,970 | | @ | | Forrester Research, Inc. | | 351,841 | |
24,100 | | @ | | Fortinet, Inc. | | 779,635 | |
20,500 | | @ | | FSI International, Inc. | | 90,610 | |
26,380 | | @ | | Global Cash Access, Inc. | | 84,152 | |
20,650 | | @ | | Globecomm Systems, Inc. | | 206,500 | |
42,890 | | @ | | GSI Commerce, Inc. | | 995,048 | |
19,400 | | @ | | GSI Technology, Inc. | | 157,140 | |
36,120 | | @ | | GT Solar International, Inc. | | 329,414 | |
65,890 | | @ | | Harmonic, Inc. | | 564,677 | |
21,960 | | | | Heartland Payment Systems, Inc. | | 338,623 | |
21,360 | | @ | | Hittite Microwave Corp. | | 1,303,814 | |
36,100 | | @, L | | Hutchinson Technology, Inc. | | 133,931 | |
13,530 | | | | iGate Corp. | | 266,676 | |
21,250 | | @ | | Imation Corp. | | 219,088 | |
23,310 | | @ | | Immersion Corp. | | 156,410 | |
53,330 | | @ | | Infinera Corp. | | 550,899 | |
21,260 | | @ | | Infospace, Inc. | | 176,458 | |
30,710 | | @, L | | Insight Enterprises, Inc. | | 404,144 | |
18,740 | | @ | | Integral Systems, Inc. | | 185,713 | |
100,900 | | @ | | Integrated Device Technology, Inc. | | 671,994 | |
19,300 | | @ | | Integrated Silicon Solution, Inc. | | 154,979 | |
9,500 | | @ | | Interactive Intelligence, Inc. | | 248,520 | |
27,040 | | @ | | InterDigital, Inc. | | 1,125,946 | |
20,100 | | @ | | Intermec, Inc. | | 254,466 | |
46,170 | | @ | | Internap Network Services Corp. | | 280,714 | |
15,540 | | @ | | Intevac, Inc. | | 217,715 | |
15,420 | | @ | | IPG Photonics Corp. | | 487,580 | |
17,810 | | @ | | Ixia | | 298,852 | |
16,070 | | @ | | IXYS Corp. | | 186,733 | |
28,670 | | @ | | j2 Global Communications, Inc. | | 829,997 | |
60,930 | | | | Jack Henry & Associates, Inc. | | 1,776,110 | |
27,734 | | @ | | JDA Software Group, Inc. | | 776,552 | |
13,700 | | @ | | Kenexa Corp. | | 298,523 | |
16,060 | | | | Keynote Systems, Inc. | | 234,797 | |
20,850 | | @ | | Knot, Inc. | | 205,998 | |
46,110 | | @ | | Kopin Corp. | | 191,818 | |
36,930 | | @ | | Kulicke & Soffa Industries, Inc. | | 265,896 | |
50,800 | | @ | | L-1 Identity Solutions, Inc. | | 605,028 | |
88,430 | | @ | | Lattice Semiconductor Corp. | | 535,886 | |
98,590 | | @ | | Lawson Software, Inc. | | 911,958 | |
14,100 | | @ | | Limelight Networks, Inc. | | 81,921 | |
43,080 | | @ | | Lionbridge Technologies | | 158,965 | |
10,240 | | @ | | Liquidity Services, Inc. | | 143,872 | |
11,580 | | | | Littelfuse, Inc. | | 544,955 | |
32,210 | | @ | | LivePerson, Inc. | | 363,973 | |
10,500 | | @ | | LogMeIn, Inc. | | 465,570 | |
19,640 | | @ | | LoopNet, Inc. | | 218,200 | |
6,440 | | @ | | Loral Space & Communications, Inc. | | 492,660 | |
40,200 | | @ | | LTX-Credence Corp. | | 297,480 | |
15,340 | | @ | | Manhattan Associates, Inc. | | 468,484 | |
15,010 | | @ | | Mantech International Corp. | | 620,363 | |
10,930 | | | | MAXIMUS, Inc. | | 716,789 | |
14,570 | | @ | | Maxwell Technologies, Inc. | | 275,227 | |
10,840 | | @ | | Measurement Specialties, Inc. | | 318,154 | |
68,570 | | @ | | Mentor Graphics Corp. | | 822,840 | |
17,910 | | @ | | Mercury Computer Systems, Inc. | | 329,186 | |
22,060 | | | | Methode Electronics, Inc. | | 286,118 | |
35,840 | | L | | Micrel, Inc. | | 465,562 | |
53,650 | | @ | | Microsemi Corp. | | 1,228,585 | |
6,070 | | @ | | MicroStrategy, Inc. | | 518,803 | |
51,390 | | @ | | Microvision, Inc. | | 95,585 | |
17,800 | | @ | | Mindspeed Technologies, Inc. | | 108,580 | |
36,480 | | @ | | MIPS Technologies, Inc. | | 553,037 | |
33,240 | | @ | | MKS Instruments, Inc. | | 814,048 | |
33,240 | | @ | | Moduslink Global Solutions, Inc. | | 222,708 | |
64,530 | | @ | | MoneyGram International, Inc. | | 174,876 | |
21,610 | | @ | | Monolithic Power Systems, Inc. | | 356,997 | |
17,670 | | @ | | Monotype Imaging Holdings, Inc. | | 196,137 | |
93,250 | | @ | | Move, Inc. | | 239,653 | |
11,200 | | | | MTS Systems Corp. | | 419,552 | |
4,750 | | @ | | Multi-Fineline Electronix, Inc. | | 125,828 | |
4,520 | | @ | | NCI, Inc. | | 103,915 | |
23,520 | | @ | | Netgear, Inc. | | 792,154 | |
43,380 | | @ | | Netlogic Microsystems, Inc. | | 1,362,566 | |
19,540 | | @ | | Netscout Systems, Inc. | | 449,615 | |
12,400 | | @, L | | NetSuite, Inc. | | 310,000 | |
37,700 | | @ | | Network Engines, Inc. | | 57,304 | |
25,470 | | @ | | Newport Corp. | | 442,414 | |
38,660 | | @ | | NIC, Inc. | | 375,389 | |
22,780 | | @ | | Novatel Wireless, Inc. | | 217,549 | |
4,300 | | @ | | NVE Corp. | | 248,669 | |
30,300 | | @ | | Oclaro, Inc. | | 398,445 | |
37,690 | | @ | | Omnivision Technologies, Inc. | | 1,116,001 | |
25,440 | | @ | | Online Resources Corp. | | 118,296 | |
10,550 | | @ | | OpenTable, Inc. | | 743,564 | |
14,730 | | @ | | Oplink Communications, Inc. | | 272,063 | |
9,700 | | | | Opnet Technologies, Inc. | | 259,669 | |
10,260 | | @ | | OSI Systems, Inc. | | 373,054 | |
82,910 | | @ | | Parametric Technology Corp. | | 1,867,962 | |
11,710 | | | | Park Electrochemical Corp. | | 351,300 | |
22,500 | | @ | | PC-Tel, Inc. | | 135,000 | |
13,000 | | | | Pegasystems, Inc. | | 476,190 | |
18,980 | | @ | | Perficient, Inc. | | 237,250 | |
24,890 | | @ | | Pericom Semiconductor Corp. | | 273,292 | |
21,250 | | @ | | Photronics, Inc. | | 125,588 | |
36,260 | | | | Plantronics, Inc. | | 1,349,597 | |
31,570 | | @ | | Plexus Corp. | | 976,776 | |
15,010 | | | | Power Integrations, Inc. | | 602,501 | |
40,120 | | @, L | | Power-One, Inc. | | 409,224 | |
82,380 | | @ | | Powerwave Technologies, Inc. | | 209,245 | |
31,330 | | @ | | Progress Software Corp. | | 1,325,886 | |
9,920 | | @ | | PROS Holdings, Inc. | | 112,989 | |
26,180 | | | | Pulse Electronics Corp. | | 139,278 | |
127,630 | | @ | | Quantum Corp. | | 474,784 | |
37,520 | | @ | | Quest Software, Inc. | | 1,040,805 | |
9,700 | | @ | | QuinStreet, Inc. | | 186,337 | |
73,210 | | @ | | Rackspace Hosting, Inc. | | 2,299,526 | |
20,780 | | @ | | Radiant Systems, Inc. | | 406,665 | |
16,060 | | @ | | Radisys Corp. | | 142,934 | |
29,300 | | @ | | RealNetworks, Inc. | | 123,060 | |
7,260 | | | | Renaissance Learning, Inc. | | 85,958 | |
191,120 | | @ | | RF Micro Devices, Inc. | | 1,404,732 | |
15,780 | | @ | | RightNow Technologies, Inc. | | 373,513 | |
6,100 | | @ | | Rimage Corp. | | 90,951 | |
90,460 | | @ | | Riverbed Technolgoy, Inc. | | 3,181,478 | |
17,370 | | @ | | Rofin-Sinar Technologies, Inc. | | 615,593 | |
11,190 | | @ | | Rogers Corp. | | 428,018 | |
3,740 | | @ | | Rosetta Stone, Inc. | | 79,363 | |
8,630 | | @, L | | Rubicon Technology, Inc. | | 181,920 | |
17,230 | | @ | | Rudolph Technologies, Inc. | | 141,803 | |
35,420 | | @ | | S1 Corp. | | 244,398 | |
62,000 | | @ | | Sanmina-SCI Corp. | | 711,760 | |
62,100 | | @ | | Sapient Corp. | | 751,410 | |
24,650 | | @ | | SAVVIS, Inc. | | 629,068 | |
15,930 | | @ | | Scansource, Inc. | | 508,167 | |
21,300 | | @ | | Seachange Intl., Inc. | | 182,115 | |
38,640 | | @ | | Semtech Corp. | | 874,810 | |
30,760 | | @ | | ShoreTel, Inc. | | 240,236 | |
18,800 | | @ | | Sigma Designs, Inc. | | 266,396 | |
26,970 | | @ | | Silicon Graphics International Corp. | | 243,539 | |
42,950 | | @ | | Silicon Image, Inc. | | 315,683 | |
37,410 | | @ | | Smart Modular Technologies, Inc. | | 215,482 | |
17,460 | | @ | | Smith Micro Software, Inc. | | 274,820 | |
23,310 | | @ | | SolarWinds, Inc. | | 448,718 | |
28,706 | | @ | | Sonic Solutions, Inc. | | 430,590 | |
120,420 | | @ | | Sonus Networks, Inc. | | 321,521 | |
18,670 | | @ | | Sourcefire, Inc. | | 484,113 | |
10,300 | | @ | | Spectrum Control, Inc. | | 154,397 | |
27,360 | | @ | | SRA International, Inc. | | 559,512 | |
9,400 | | @ | | SS&C Technologies Holdings, Inc. | | 192,794 | |
15,380 | | @ | | Stamps.com, Inc. | | 203,785 | |
12,830 | | @ | | Standard Microsystems Corp. | | 369,889 | |
27,510 | | @, L | | STEC, Inc. | | 485,552 | |
13,120 | | @ | | Stratasys, Inc. | | 428,237 | |
43,160 | | @ | | SuccessFactors, Inc. | | 1,249,914 | |
13,820 | | @ | | Super Micro Computer, Inc. | | 159,483 | |
9,620 | | @ | | Supertex, Inc. | | 232,612 | |
35,050 | | @ | | support.com, Inc. | | 227,124 | |
14,096 | | @ | | Sycamore Networks, Inc. | | 290,237 | |
22,800 | | @ | | Symmetricom, Inc. | | 161,652 | |
22,770 | | @ | | Synaptics, Inc. | | 668,983 | |
11,770 | | @ | | Synchronoss Technologies, Inc. | | 314,377 | |
11,650 | | @ | | SYNNEX Corp. | | 363,480 | |
9,150 | | | | Syntel, Inc. | | 437,279 | |
42,820 | | @ | | Take-Two Interactive Software, Inc. | | 524,117 | |
24,680 | | @ | | Taleo Corp. | | 682,402 | |
44,920 | | @ | | Tekelec | | 534,997 | |
38,230 | | @ | | TeleCommunication Systems, Inc. | | 178,534 | |
19,940 | | @ | | TeleTech Holdings, Inc. | | 410,565 | |
37,880 | | @ | | Terremark Worldwide, Inc. | | 490,546 | |
31,160 | | @ | | Tessera Technologies, Inc. | | 690,194 | |
44,470 | | @ | | THQ, Inc. | | 269,488 | |
119,800 | | @ | | TIBCO Software, Inc. | | 2,361,181 | |
70,020 | | @ | | Tivo, Inc. | | 604,273 | |
15,770 | | @ | | TNS, Inc. | | 328,016 | |
57,340 | | @ | | Trident Microsystems, Inc. | | 102,065 | |
99,480 | | @ | | Triquint Semiconductor, Inc. | | 1,162,921 | |
49,480 | | @ | | TTM Technologies, Inc. | | 737,747 | |
21,240 | | @ | | Tyler Technologies, Inc. | | 440,942 | |
17,170 | | @ | | Ultimate Software Group, Inc. | | 834,977 | |
17,910 | | @ | | Ultratech, Inc. | | 356,051 | |
27,214 | | @ | | Unisys Corp. | | 704,570 | |
49,733 | | | | United Online, Inc. | | 328,238 | |
20,770 | | @, L | | Universal Display Corp. | | 636,601 | |
83,810 | | @, L | | Utstarcom, Inc. | | 172,649 | |
54,750 | | @ | | Valueclick, Inc. | | 877,643 | |
18,230 | | @ | | Vasco Data Security Intl. | | 148,210 | |
27,210 | | @, L | | Veeco Instruments, Inc. | | 1,168,942 | |
61,430 | | @ | | Verifone Holdings, Inc. | | 2,368,741 | |
24,110 | | @ | | Viasat, Inc. | | 1,070,725 | |
16,800 | | @ | | VirnetX Holding Corp. | | 249,480 | |
18,600 | | @ | | Virtusa Corp. | | 304,296 | |
10,110 | | @ | | Vocus, Inc. | | 279,643 | |
15,020 | | @ | | Volterra Semiconductor Corp. | | 347,863 | |
27,770 | | @, L | | Websense, Inc. | | 562,343 | |
26,620 | | @ | | Wright Express Corp. | | 1,224,520 | |
13,600 | | @ | | Xyratex Ltd. | | 221,816 | |
92,900 | | @, L | | Zix Corp. | | 396,683 | |
37,510 | | @ | | Zoran Corp. | | 330,088 | |
13,700 | | @ | | Zygo Corp. | | 167,551 | |
| | | | | | 139,752,417 | |
| | | | Materials: 5.6% | | | |
20,814 | | | | A Schulman, Inc. | | 476,432 | |
5,840 | | @ | | AEP Industries, Inc. | | 151,548 | |
41,040 | | @ | | Allied Nevada Gold Corp. | | 1,079,762 | |
8,320 | | @ | | AM Castle & Co. | | 153,171 | |
17,460 | | | | Amcol International Corp. | | 541,260 | |
15,100 | | | | American Vanguard Corp. | | 128,954 | |
17,170 | | | | Arch Chemicals, Inc. | | 651,258 | |
12,310 | | | | Balchem Corp. | | 416,201 | |
41,970 | | @ | | Boise, Inc. | | 332,822 | |
14,570 | | @ | | Brush Engineered Materials, Inc. | | 562,985 | |
25,680 | | | | Buckeye Technologies, Inc. | | 539,537 | |
33,580 | | @ | | Calgon Carbon Corp. | | 507,730 | |
48,880 | | @ | | Century Aluminum Co. | | 759,106 | |
8,458 | | @ | | Clearwater Paper Corp. | | 662,261 | |
58,180 | | @ | | Coeur d’Alene Mines Corp. | | 1,589,478 | |
6,480 | | | | Deltic Timber Corp. | | 365,083 | |
55,780 | | @ | | Ferro Corp. | | 816,619 | |
48,390 | | @ | | General Moly, Inc. | | 313,567 | |
20,500 | | @ | | Georgia Gulf Corp. | | 493,230 | |
37,700 | | | | Globe Specialty Metals, Inc. | | 644,293 | |
202,800 | | @ | | Golden Star Resources Ltd. | | 930,852 | |
11,700 | | @ | | Graham Packaging Co., Inc. | | 152,568 | |
75,580 | | @ | | Graphic Packaging Holding Co. | | 294,006 | |
6,510 | | | | Hawkins, Inc. | | 289,044 | |
8,340 | | | | Haynes International, Inc. | | 348,862 | |
30,290 | | | | HB Fuller Co. | | 621,551 | |
37,970 | | @ | | Headwaters, Inc. | | 173,903 | |
165,000 | | @, L | | Hecla Mining Co. | | 1,857,900 | |
32,520 | | @ | | Horsehead Holding Corp. | | 424,061 | |
12,650 | | | | Innophos Holdings, Inc. | | 456,412 | |
62,800 | | @, L | | Jaguar Mining, Inc. | | 447,764 | |
9,280 | | | | Kaiser Aluminum Corp. | | 464,835 | |
22,900 | | @ | | KapStone Paper and Packaging Corp. | | 350,370 | |
5,100 | | | | KMG Chemicals, Inc. | | 84,507 | |
12,230 | | | | Koppers Holdings, Inc. | | 437,589 | |
6,400 | | @ | | Kraton Performance Polymers, Inc. | | 198,080 | |
27,770 | | @ | | Landec Corp. | | 166,065 | |
78,230 | | @ | | Louisiana-Pacific Corp. | | 740,056 | |
11,570 | | @ | | LSB Industries, Inc. | | 280,688 | |
9,100 | | @ | | Metals USA Holdings Corp. | | 138,684 | |
13,430 | | | | Minerals Technologies, Inc. | | 878,456 | |
12,400 | | @, L | | Molycorp, Inc. | | 618,760 | |
19,490 | | | | Myers Industries, Inc. | | 189,833 | |
10,140 | | | | Neenah Paper, Inc. | | 199,555 | |
6,030 | | | | NewMarket Corp. | | 743,921 | |
13,900 | | @ | | Noranda Aluminum Holding Corp. | | 202,940 | |
56,740 | | | | Olin Corp. | | 1,164,305 | |
6,430 | | | | Olympic Steel, Inc. | | 184,412 | |
20,100 | | @ | | OM Group, Inc. | | 774,051 | |
26,220 | | @ | | Omnova Solutions, Inc. | | 219,199 | |
22,010 | | | | PH Glatfelter Co. | | 270,063 | |
61,850 | | @ | | PolyOne Corp. | | 772,507 | |
4,250 | | | | Quaker Chemical Corp. | | 177,098 | |
27,790 | | | | Rock-Tenn Co. | | 1,499,271 | |
33,170 | | @ | | Rockwood Holdings, Inc. | | 1,297,610 | |
20,080 | | @ | | RTI International Metals, Inc. | | 541,758 | |
11,760 | | | | Schweitzer-Mauduit International, Inc. | | 739,939 | |
36,670 | | | | Sensient Technologies Corp. | | 1,346,889 | |
38,860 | | | | Silgan Holdings, Inc. | | 1,391,577 | |
84,360 | | @ | | Solutia, Inc. | | 1,947,029 | |
21,750 | | @ | | Spartech Corp. | | 203,580 | |
4,690 | | | | Stepan Co. | | 357,706 | |
35,090 | | @, L | | Stillwater Mining Co. | | 749,172 | |
17,100 | | @, L | | STR Holdings, Inc. | | 342,000 | |
14,430 | | | | Texas Industries, Inc. | | 660,605 | |
107,800 | | @ | | Thompson Creek Metals Co., Inc. | | 1,586,816 | |
5,100 | | @ | | Universal Stainless & Alloy | | 159,528 | |
51,170 | | @, L | | US Gold Corp. | | 412,942 | |
27,010 | | | | Wausau Paper Corp. | | 232,556 | |
12,320 | | | | Westlake Chemical Corp. | | 535,550 | |
37,500 | | | | Worthington Industries | | 690,000 | |
50,360 | | @ | | WR Grace & Co. | | 1,769,147 | |
14,660 | | | | Zep, Inc. | | 291,441 | |
16,870 | | @, L | | Zoltek Cos., Inc. | | 194,849 | |
| | | | | | 43,388,159 | |
| | | | Telecommunication Services: 1.0% | | | |
16,330 | | @ | | AboveNet, Inc. | | 954,653 | |
42,490 | | | | Alaska Communications Systems Group, Inc. | | 471,639 | |
5,450 | | | | Atlantic Tele-Network, Inc. | | 208,953 | |
11,640 | | @ | | Cbeyond, Inc. | | 177,859 | |
146,940 | | @ | | Cincinnati Bell, Inc. | | 411,432 | |
31,000 | | @ | | Cogent Communications Group, Inc. | | 438,340 | |
15,910 | | | | Consolidated Communications Holdings, Inc. | | 307,063 | |
27,520 | | @ | | General Communication, Inc. | | 348,403 | |
17,940 | | @ | | Global Crossing Ltd. | | 231,785 | |
70,000 | | @, L | | Globalstar, Inc. | | 101,500 | |
9,370 | | @ | | Hughes Communications, Inc. | | 378,923 | |
24,100 | | @, L | | Iridium Communications, Inc. | | 198,825 | |
21,940 | | @ | | Neutral Tandem, Inc. | | 316,814 | |
19,720 | | | | NTELOS Holdings Corp. | | 375,666 | |
89,790 | | @ | | PAETEC Holding Corp. | | 335,815 | |
35,870 | | @ | | Premier Global Services, Inc. | | 243,916 | |
13,000 | | | | Shenandoah Telecom Co. | | 243,490 | |
51,630 | | @ | | Syniverse Holdings, Inc. | | 1,592,786 | |
13,330 | | | | USA Mobility, Inc. | | 236,874 | |
76,400 | | @ | | Vonage Holdings Corp. | | 171,136 | |
| | | | | | 7,745,872 | |
| | | | Utilities: 3.1% | | | |
18,980 | | | | Allete, Inc. | | 707,195 | |
11,550 | | | | American States Water Co. | | 398,129 | |
34,880 | | | | Avista Corp. | | 785,498 | |
28,350 | | | | Black Hills Corp. | | 850,500 | |
9,800 | | @, L | | Cadiz, Inc. | | 121,912 | |
12,790 | | | | California Water Service Group | | 476,683 | |
10,460 | | | | Central Vermont Public Service Corp. | | 228,656 | |
9,590 | | | | CH Energy Group, Inc. | | 468,855 | |
3,980 | | | | Chesapeake Utilities Corp. | | 165,250 | |
44,690 | | | | Cleco Corp. | | 1,374,664 | |
3,700 | | | | Connecticut Water Service, Inc. | | 103,156 | |
9,940 | | @ | | Consolidated Water Co., Ltd. | | 91,150 | |
62,000 | | @ | | Dynegy, Inc. | | 348,440 | |
29,240 | | @ | | El Paso Electric Co. | | 804,977 | |
26,990 | | | | Empire District Electric Co. | | 599,178 | |
34,000 | | | | Idacorp, Inc. | | 1,257,320 | |
16,600 | | | | Laclede Group, Inc. | | 606,564 | |
14,660 | | | | MGE Energy, Inc. | | 626,862 | |
7,260 | | | | Middlesex Water Co. | | 133,221 | |
29,670 | | | | New Jersey Resources Corp. | | 1,279,074 | |
31,900 | | | | Nicor, Inc. | | 1,592,448 | |
19,200 | | | | Northwest Natural Gas Co. | | 892,224 | |
24,850 | | | | NorthWestern Corp. | | 716,426 | |
21,000 | | | | Otter Tail Corp. | | 473,340 | |
51,250 | | | | Piedmont Natural Gas Co. | | 1,432,950 | |
54,570 | | | | PNM Resources, Inc. | | 710,501 | |
53,230 | | | | Portland General Electric Co. | | 1,155,091 | |
9,230 | | | | SJW Corp. | | 244,318 | |
21,590 | | | | South Jersey Industries, Inc. | | 1,140,384 | |
33,270 | | | | Southwest Gas Corp. | | 1,220,011 | |
28,470 | | | | UIL Holdings Corp. | | 852,961 | |
20,330 | | | | Unisource Energy Corp. | | 728,627 | |
6,400 | | | | Unitil Corp. | | 145,536 | |
35,420 | | | | WGL Holdings, Inc. | | 1,266,973 | |
6,200 | | | | York Water Co. | | 107,198 | |
| | | | | | 24,106,272 | |
| | | | Total Common Stock
(Cost $535,310,982) | | 706,007,506 | |
| | | | | | | |
REAL ESTATE INVESTMENT TRUSTS: 6.9% | | | |
| | | | Financials: 6.9% | | | |
23,996 | | | | Acadia Realty Trust | | 437,687 | |
4,700 | | | | Agree Realty Corp. | | 123,093 | |
1,450 | | | | Alexander’s, Inc. | | 597,806 | |
37,719 | | | | American Campus Communities, Inc. | | 1,197,955 | |
32,380 | | | | American Capital Agency Corp. | | 930,601 | |
78,580 | | | | Anworth Mortgage Asset Corp. | | 550,060 | |
6,600 | | | | Apollo Commercial Real Estate Finance, Inc. | | 107,910 | |
23,710 | | @ | | Ashford Hospitality Trust, Inc. | | 228,802 | |
21,980 | | | | Associated Estates Realty Corp. | | 336,074 | |
92,490 | | | | BioMed Realty Trust, Inc. | | 1,724,939 | |
34,530 | | | | Capital Lease Funding, Inc. | | 200,965 | |
43,340 | | | | Capstead Mortgage Corp. | | 545,651 | |
96,870 | | | | CBL & Associates Properties, Inc. | | 1,695,225 | |
31,370 | | | | Cedar Shopping Centers, Inc. | | 197,317 | |
30,750 | | | | Cogdell Spencer, Inc. | | 178,350 | |
43,490 | | | | Colonial Properties Trust | | 784,995 | |
9,000 | | | | Colony Financial, Inc. | | 180,180 | |
54,798 | | | | Cousins Properties, Inc. | | 457,015 | |
8,500 | | | | CreXus Investment Corp. | | 111,350 | |
9,850 | | | | Cypress Sharpridge Investments, Inc. | | 127,164 | |
127,490 | | | | DCT Industrial Trust, Inc. | | 676,972 | |
105,895 | | @ | | DiamondRock Hospitality Co. | | 1,270,740 | |
25,630 | | | | DuPont Fabros Technology, Inc. | | 545,150 | |
7,650 | | | | Dynex Capital, Inc. | | 83,538 | |
21,520 | | | | EastGroup Properties, Inc. | | 910,726 | |
35,310 | | | | Education Realty Trust, Inc. | | 274,359 | |
33,210 | | | | Entertainment Properties Trust | | 1,535,963 | |
18,130 | | | | Equity Lifestyle Properties, Inc. | | 1,014,011 | |
23,270 | | | | Equity One, Inc. | | 423,049 | |
11,800 | | | | Excel Trust, Inc. | | 142,780 | |
56,450 | | | | Extra Space Storage, Inc. | | 982,230 | |
37,720 | | @ | | FelCor Lodging Trust, Inc. | | 265,549 | |
35,610 | | @ | | First Industrial Realty Trust, Inc. | | 311,944 | |
23,370 | | | | First Potomac Realty Trust | | 393,083 | |
38,670 | | | | Franklin Street Properties Corp. | | 551,048 | |
13,220 | | | | Getty Realty Corp. | | 413,522 | |
7,690 | | | | Gladstone Commercial Corp. | | 144,803 | |
36,920 | | | | Glimcher Realty Trust | | 310,128 | |
14,600 | | | | Government Properties Income Trust | | 391,134 | |
22,740 | | L | | Hatteras Financial Corp. | | 688,340 | |
38,830 | | | | Healthcare Realty Trust, Inc. | | 822,031 | |
57,800 | | | | Hersha Hospitality Trust | | 381,480 | |
49,600 | | | | Highwoods Properties, Inc. | | 1,579,760 | |
27,350 | | | | Home Properties, Inc. | | 1,517,652 | |
50,000 | | | | Inland Real Estate Corp. | | 440,000 | |
27,350 | | | | Invesco Mortgage Capital, Inc. | | 597,324 | |
50,800 | | | | Investors Real Estate Trust | | 455,676 | |
64,710 | | @ | | iStar Financial, Inc. | | 506,032 | |
37,530 | | | | Kilroy Realty Corp. | | 1,368,719 | |
38,800 | | | | Kite Realty Group Trust | | 209,908 | |
45,900 | | | | LaSalle Hotel Properties | | 1,211,760 | |
58,435 | | | | Lexington Realty Trust | | 464,558 | |
15,820 | | | | LTC Properties, Inc. | | 444,226 | |
68,980 | | | | Medical Properties Trust, Inc. | | 747,053 | |
208,420 | | | | MFA Mortgage Investments, Inc. | | 1,700,707 | |
20,220 | | | | Mid-America Apartment Communities, Inc. | | 1,283,768 | |
16,010 | | | | National Health Investors, Inc. | | 720,770 | |
57,220 | | L | | National Retail Properties, Inc. | | 1,516,330 | |
46,488 | | L | | Northstar Realty Finance Corp. | | 220,818 | |
63,880 | | | | Omega Healthcare Investors, Inc. | | 1,433,467 | |
5,700 | | | | One Liberty Properties, Inc. | | 95,190 | |
8,590 | | | | Parkway Properties, Inc. | | 150,497 | |
14,600 | | | | Pebblebrook Hotel Trust | | 296,672 | |
34,180 | | | | Pennsylvania Real Estate Investment Trust | | 496,635 | |
10,200 | | | | Pennymac Mortgage Investment Trust | | 185,130 | |
38,020 | | | | Post Properties, Inc. | | 1,380,126 | |
27,510 | | | | Potlatch Corp. | | 895,451 | |
10,990 | | | | PS Business Parks, Inc. | | 612,363 | |
66,950 | | @, L | | RAIT Investment Trust | | 146,621 | |
18,490 | | | | Ramco-Gershenson Properties | | 230,201 | |
56,480 | | | | Redwood Trust, Inc. | | 843,246 | |
24,550 | | | | Resource Capital Corp. | | 181,179 | |
9,400 | | | | Sabra Healthcare REIT, Inc. | | 172,960 | |
3,470 | | | | Saul Centers, Inc. | | 164,305 | |
17,440 | | | | Sovran Self Storage, Inc. | | 641,966 | |
31,850 | | | | Starwood Property Trust, Inc. | | 684,138 | |
95,020 | | @ | | Strategic Hotel Capital, Inc. | | 502,656 | |
14,340 | | | | Sun Communities, Inc. | | 477,665 | |
62,914 | | @ | | Sunstone Hotel Investors, Inc. | | 649,902 | |
28,300 | | | | Tanger Factory Outlet Centers, Inc. | | 1,448,677 | |
11,100 | | | | UMH Properties, Inc. | | 113,220 | |
6,540 | | | | Universal Health Realty Income Trust | | 238,906 | |
14,240 | | | | Urstadt Biddle Properties, Inc. | | 276,968 | |
57,750 | | | | U-Store-It Trust | | 550,358 | |
17,840 | | | | Walter Investment Management Corp. | | 320,050 | |
41,540 | | | | Washington Real Estate Investment Trust | | 1,287,325 | |
9,950 | | | | Winthrop Realty Trust | | 127,261 | |
| | | | | | | |
| | | | Total Real Estate Investment Trusts
(Cost $43,011,174) | | 52,833,915 | |
| | | | | | | |
MUTUAL FUNDS: 0.0% | | | |
| | | | Closed-End Funds: 0.0% | | | |
8,870 | | | | Kayne Anderson Energy Development Co. | | 159,749 | |
| | | | | | | |
| | | | Total Mutual Funds
(Cost $125,680) | | 159,749 | |
| | | | | | | |
Principal Amount | | | | | | | |
| | | | | | | |
CORPORATE BONDS/NOTES: 0.0% | | | |
| | | | Financials: 0.0% | | | |
$ | 15,100 | | | | GAMCO Investors, Inc., 0.000%, due 12/31/15 | | | — | |
| | | | | | | |
| | | | Total Corporate Bonds/Notes
(Cost $15,168) | | — | |
| | | | | | | |
| | | | Total Long-Term Investments
(Cost $578,463,004) | | 759,001,170 | |
| | | | | | | |
SHORT-TERM INVESTMENTS: 6.8% | | | |
| | | | Mutual Funds: 1.5% | | | |
11,520,000 | | | | Blackrock Liquidity Funds TempFund Portfolio - Class I | | 11,520,000 | |
| | | | | | | |
| | | | Total Mutual Funds
(Cost $11,520,000) | | 11,520,000 | |
| | | | | | | |
| | | | Securities Lending Collateral(cc): 5.3% | | | |
39,933,147 | | | | BNY Mellon Overnight Government Fund (1) | | 39,933,147 | |
502,326 | | R | | BNY Institutional Cash Reserves Fund, Series B (1)(2) | | 401,860 | |
| | | | | | | |
| | | | Total Securities Lending Collateral
(Cost $40,435,473) | | 40,335,007 | |
| | | | | | | |
| | | | Total Short-Term Investments
(Cost $51,955,473) | | 51,855,007 | |
| | | | | | | | |
| | | | Total Investments in Securities
(Cost $630,418,477) * | 105.4 | % | $ | 810,856,177 | |
| | | | Other Assets and Liabilities - Net | (5.4 | ) | (41,240,683 | ) |
| | | | Net Assets | 100.0 | % | $ | 769,615,494 | |
| | | | | | | | | | |
| | @ | | Non-income producing security |
| | (cc) | | Securities purchased with cash collateral for securities loaned. |
| | (1) | | Collateral received from brokers for securities lending was invested in these short-term investments. |
| | (2) | | On September 12, 2008, BNY established a separate sleeve of the Institutional Cash Reserves Fund (Series B) to hold certain Lehman Brothers defaulted debt obligations. The Portfolio’s position in Series B is being fair valued daily. Please see the accompanying Notes to Financial Statements for additional details on securities lending. |
| | R | | Restricted security |
| | L | | Loaned security, a portion or all of the security is on loan at December 31, 2010. |
| | X | | Fair value determined by ING Funds Valuation Committee appointed by the Funds’ Board of Directors/Trustees. |
| PORTFOLIO OF INVESTMENTS |
ING Small Company Portfolio | as of December 31, 2010 |
Shares | | | | | | Value | |
| | | | | | | |
COMMON STOCK: 91.6% | | | |
| | | | Consumer Discretionary: 14.6% | | | |
142,237 | | | | Arbitron, Inc. | | $ | 5,905,680 | |
101,700 | | @ | | Bally Technologies, Inc. | | 4,290,723 | |
254,600 | | | | Callaway Golf Co. | | 2,054,622 | |
312,200 | | @ | | Collective Brands, Inc. | | 6,587,420 | |
246,100 | | | | Cooper Tire & Rubber Co. | | 5,803,038 | |
227,800 | | @ | | Dress Barn, Inc. | | 6,018,476 | |
141,762 | | @ | | Gildan Activewear, Inc. | | 4,038,799 | |
205,300 | | @ | | Jack in the Box, Inc. | | 4,337,989 | |
121,498 | | @ | | Jo-Ann Stores, Inc. | | 7,316,610 | |
160,100 | | @ | | Life Time Fitness, Inc. | | 6,562,499 | |
385,949 | | @ | | OfficeMax, Inc. | | 6,831,293 | |
383,818 | | @ | | Orient-Express Hotels Ltd. | | 4,985,796 | |
184,100 | | @ | | Papa John’s International, Inc. | | 5,099,570 | |
148,674 | | | | Pool Corp. | | 3,351,112 | |
332,700 | | | | Regis Corp. | | 5,522,820 | |
383,400 | | @ | | Ruby Tuesday, Inc. | | 5,007,204 | |
191,900 | | @ | | Wet Seal, Inc. | | 710,030 | |
158,300 | | | | Wolverine World Wide, Inc. | | 5,046,604 | |
83,900 | | | | Wyndham Worldwide Corp. | | 2,513,644 | |
| | | | | | 91,983,929 | |
| | | | Consumer Staples: 2.0% | | | |
131,800 | | | | Casey’s General Stores, Inc. | | 5,602,818 | |
149,800 | | | | Flowers Foods, Inc. | | 4,031,118 | |
168,500 | | | | Spartan Stores, Inc. | | 2,856,075 | |
| | | | | | 12,490,011 | |
| | | | Energy: 5.3% | | | |
134,900 | | @ | | Bill Barrett Corp. | | 5,548,437 | |
162,615 | | @ | | Carrizo Oil & Gas, Inc. | | 5,608,591 | |
73,800 | | @ | | Dril-Quip, Inc. | | 5,735,736 | |
246,500 | | @ | | Frontier Oil Corp. | | 4,439,465 | |
371,700 | | @ | | McMoRan Exploration Co. | | 6,370,938 | |
121,900 | | @ | | Unit Corp. | | 5,665,912 | |
| | | | | | 33,369,079 | |
| | | | Financials: 14.1% | | | |
112,200 | | | | Capitol Federal Financial, Inc. | | 1,336,302 | |
161,620 | | | | Cash America International, Inc. | | 5,968,627 | |
187,337 | | | | Columbia Banking System, Inc. | | 3,945,317 | |
165,082 | | | | Delphi Financial Group | | 4,760,965 | |
11,169 | | @ | | Encore Capital Group, Inc. | | 261,913 | |
311,754 | | | | FirstMerit Corp. | | 6,169,612 | |
262,212 | | | | Flushing Financial Corp. | | 3,670,968 | |
48,992 | | | | Greenhill & Co., Inc. | | 4,001,667 | |
102,400 | | | | IBERIABANK Corp. | | 6,054,912 | |
266,400 | | | | Janus Capital Group, Inc. | | 3,455,208 | |
48,100 | | | | Jones Lang LaSalle, Inc. | | 4,036,552 | |
107,372 | | @ | | Knight Capital Group, Inc. | | 1,480,660 | |
282,680 | | | | Northwest Bancshares, Inc. | | 3,324,317 | |
170,517 | | | | Old National Bancorp. | | 2,027,447 | |
143,288 | | @ | | Piper Jaffray Cos. | | 5,016,513 | |
98,116 | | | | Platinum Underwriters Holdings Ltd. | | 4,412,277 | |
79,518 | | @ | | ProAssurance Corp. | | 4,818,791 | |
135,218 | | | | Prosperity Bancshares, Inc. | | 5,311,363 | |
221,629 | | | | Provident Financial Services, Inc. | | 3,353,247 | |
207,239 | | | | Radian Group, Inc. | | 1,672,419 | |
101,354 | | @ | | Stifel Financial Corp. | | 6,288,002 | |
107,600 | | @ | | SVB Financial Group | | 5,708,180 | |
47,655 | | | | Wintrust Financial Corp. | | 1,574,045 | |
| | | | | | 88,649,304 | |
| | | | Health Care: 10.5% | | | |
54,991 | | @ | | Acorda Therapeutics, Inc. | | 1,499,055 | |
178,200 | | @ | | Align Technology, Inc. | | 3,482,028 | |
102,916 | | @ | | AMERIGROUP Corp. | | 4,520,071 | |
148,800 | | @ | | Amsurg Corp. | | 3,117,360 | |
22,800 | | @ | | Cubist Pharmaceuticals, Inc. | | 487,920 | |
79,900 | | @ | | Greatbatch, Inc. | | 1,929,585 | |
75,700 | | @ | | Haemonetics Corp. | | 4,782,726 | |
349,606 | | @ | | Healthsouth Corp. | | 7,240,340 | |
145,040 | | @ | | Medicines Co. | | 2,049,415 | |
51,800 | | @ | | Mednax, Inc. | | 3,485,622 | |
131,555 | | | | Meridian Bioscience, Inc. | | 3,046,814 | |
197,252 | | @ | | Nektar Therapeutics | | 2,534,688 | |
112,600 | | @ | | Onyx Pharmaceuticals, Inc. | | 4,151,562 | |
| | | | | | | | |
166,900 | | | | Owens & Minor, Inc. | | 4,911,867 | |
225,000 | | @ | | PSS World Medical, Inc. | | 5,085,000 | |
55,300 | | @ | | Salix Pharmaceuticals Ltd. | | 2,596,888 | |
109,400 | | @, L | | Savient Pharmaceuticals, Inc. | | 1,218,716 | |
123,505 | | | | Steris Corp. | | 4,502,992 | |
132,000 | | | | Universal Health Services, Inc. | | 5,731,440 | |
| | | | | | 66,374,089 | |
| | | | Industrials: 16.4% | | | |
176,085 | | | | Actuant Corp. | | 4,687,383 | |
89,900 | | @, L | | Allegiant Travel Co. | | 4,426,676 | |
103,311 | | @ | | Atlas Air Worldwide Holdings, Inc. | | 5,767,853 | |
246,900 | | | | Barnes Group, Inc. | | 5,103,423 | |
169,300 | | | | Brady Corp. | | 5,520,873 | |
51,139 | | @ | | Clean Harbors, Inc. | | 4,299,767 | |
56,200 | | | | Gardner Denver, Inc. | | 3,867,684 | |
317,300 | | | | Heartland Express, Inc. | | 5,083,146 | |
122,196 | | @ | | HUB Group, Inc. | | 4,293,967 | |
108,642 | | @ | | Kirby Corp. | | 4,785,680 | |
85,617 | | @ | | Mobile Mini, Inc. | | 1,685,799 | |
116,297 | | @ | | Moog, Inc. | | 4,628,621 | |
53,800 | | | | Nordson Corp. | | 4,943,144 | |
215,223 | | @ | | Orbital Sciences Corp. | | 3,686,770 | |
85,200 | | | | Regal-Beloit Corp. | | 5,687,952 | |
125,400 | | | | Resources Connection, Inc. | | 2,331,186 | |
119,500 | | @ | | Teledyne Technologies, Inc. | | 5,254,415 | |
143,769 | | @ | | Tetra Tech, Inc. | | 3,602,851 | |
68,500 | | | | Toro Co. | | 4,222,340 | |
127,048 | | @ | | TrueBlue, Inc. | | 2,285,594 | |
176,239 | | | | Waste Connections, Inc. | | 4,851,860 | |
103,300 | | | | Watsco, Inc. | | 6,516,164 | |
161,400 | | | | Watts Water Technologies, Inc. | | 5,905,626 | |
| | | | | | 103,438,774 | |
| | | | Information Technology: 17.1% | | | |
25,400 | | @ | | Acme Packet, Inc. | | 1,350,264 | |
76,200 | | | | Adtran, Inc. | | 2,759,202 | |
371,700 | | @ | | Advanced Energy Industries, Inc. | | 5,069,988 | |
92,900 | | @ | | Anixter International, Inc. | | 5,548,917 | |
99,709 | | @ | | Ansys, Inc. | | 5,191,848 | |
433,700 | | @ | | Arris Group, Inc. | | 4,866,114 | |
68,000 | | @, L | | Blackboard, Inc. | | 2,808,400 | |
105,399 | | @ | | Blue Coat Systems, Inc. | | 3,148,268 | |
87,300 | | @ | | CACI International, Inc. | | 4,661,820 | |
95,800 | | @ | | Concur Technologies, Inc. | | 4,974,894 | |
157,319 | | @ | | FEI Co. | | 4,154,795 | |
84,754 | | @ | | Flir Systems, Inc. | | 2,521,432 | |
215,200 | | @ | | Formfactor, Inc. | | 1,910,976 | |
56,100 | | @ | | Informatica Corp. | | 2,470,083 | |
210,900 | | @ | | Intermec, Inc. | | 2,669,994 | |
117,797 | | @ | | JDA Software Group, Inc. | | 3,298,316 | |
244,222 | | @ | | Mentor Graphics Corp. | | 2,930,664 | |
80,400 | | @ | | Micros Systems, Inc. | | 3,526,344 | |
171,500 | | @ | | MKS Instruments, Inc. | | 4,200,035 | |
240,400 | | @ | | Parametric Technology Corp. | | 5,416,212 | |
174,852 | | @ | | Plexus Corp. | | 5,409,921 | |
110,237 | | @ | | Polycom, Inc. | | 4,297,038 | |
52,100 | | | | Power Integrations, Inc. | | 2,091,294 | |
123,000 | | @ | | Progress Software Corp. | | 5,205,360 | |
291,200 | | @ | | QLogic Corp. | | 4,956,224 | |
121,500 | | @ | | Quest Software, Inc. | | 3,370,410 | |
117,500 | | @ | | Sourcefire, Inc. | | 3,046,775 | |
113,383 | | @ | | THQ, Inc. | | 687,101 | |
385,942 | | @ | | Verigy Ltd. | | 5,024,965 | |
| | | | | | 107,567,654 | |
| | | | Materials: 6.0% | | | |
28,300 | | | | Albemarle Corp. | | 1,578,574 | |
79,500 | | | | Buckeye Technologies, Inc. | | 1,670,295 | |
284,200 | | | | Commercial Metals Co. | | 4,714,878 | |
223,400 | | | | HB Fuller Co. | | 4,584,168 | |
84,000 | | | | Minerals Technologies, Inc. | | 5,494,440 | |
176,000 | | | | RPM International, Inc. | | 3,889,600 | |
199,800 | | | | Silgan Holdings, Inc. | �� | 7,154,838 | |
209,100 | | @ | | Thompson Creek Metals Co., Inc. | | 3,077,952 | |
221,890 | | | | Worthington Industries | | 4,082,776 | |
75,900 | | | | Zep, Inc. | | 1,508,892 | |
| | | | | | 37,756,413 | |
| | | | Telecommunication Services: 1.6% | | | |
217,760 | | | | Alaska Communications Systems Group, Inc. | | 2,417,136 | |
161,833 | | | | NTELOS Holdings Corp. | | 3,082,919 | |
109,400 | | @ | | SBA Communications Corp. | | 4,478,836 | |
| | | | | | 9,978,891 | |
| | | | Utilities: 4.0% | | | |
47,420 | | | | Black Hills Corp. | | 1,422,600 | |
211,500 | | | | Cleco Corp. | | 6,505,740 | |
162,897 | | @ | | El Paso Electric Co. | | 4,484,554 | |
90,150 | | | | Idacorp, Inc. | | 3,333,747 | |
314,000 | | | | Portland General Electric Co. | | 6,813,800 | |
74,700 | | | | WGL Holdings, Inc. | | 2,672,019 | |
| | | | | | 25,232,460 | |
| | | | Total Common Stock
(Cost $ 455,279,574) | | 576,840,604 | |
| | | | | | | |
REAL ESTATE INVESTMENT TRUSTS: 6.0% | | | |
| | | | Financials: 6.0% | | | |
549,744 | | @ | | DiamondRock Hospitality Co. | | 6,596,928 | |
225,100 | | | | DuPont Fabros Technology, Inc. | | 4,787,877 | |
111,300 | | | | Entertainment Properties Trust | | 5,147,625 | |
431,643 | | | | MFA Mortgage Investments, Inc. | | 3,522,207 | |
196,572 | | | | National Retail Properties, Inc. | | 5,209,158 | |
248,847 | | | | Redwood Trust, Inc. | | 3,715,286 | |
227,200 | | | | Starwood Property Trust, Inc. | | 4,880,256 | |
407,382 | | | | U-Store-It Trust | | 3,882,350 | |
| | | | | | | |
| | | | Total Real Estate Investment Trusts
(Cost $ 31,376,059) | | 37,741,687 | |
| | | |
EXCHANGE-TRADED FUNDS: 1.7% | | | |
| | | | Exchange-Traded Funds: 1.7% | | | |
105,565 | | | | iShares Russell 2000 Index Fund | | 8,258,350 | |
31,084 | | | | iShares Russell 2000 Value Index Fund | | 2,209,762 | |
| | | | | | | |
| | | | Total Exchange-Traded Funds
(Cost $ 8,771,180) | | 10,468,112 | |
| | | | | | | |
| | | | Total Long-Term Investments
(Cost $ 495,426,813) | | 625,050,403 | |
| | | | | | | |
SHORT-TERM INVESTMENTS: 2.5% | | | |
| | | | Mutual Funds: 1.6% | | | |
10,035,000 | | | | Blackrock Liquidity Funds TempFund Portfolio - Class I | | 10,035,000 | |
| | | | | | | |
| | | | Total Mutual Funds
(Cost $ 10,035,000) | | 10,035,000 | |
| | | | | | | |
| | | | Securities Lending Collateral(cc): 0.9% | | | |
3,591,410 | | | | BNY Mellon Overnight Government Fund (1) | | 3,591,410 | |
2,114,770 | | R | | BNY Institutional Cash Reserves Fund, Series B (1)(2) | | 1,691,816 | |
| | | | | | | |
| | | | Total Securities Lending Collateral
(Cost $ 5,706,180) | | 5,283,226 | |
| | | | | | | |
| | | | Total Short-Term Investments
(Cost $ 15,741,180) | | 15,318,226 | |
| | | | | | | |
| | | | Total Investments in Securities
(Cost $ 511,167,993) * | | 101.8 | % | $ | 640,368,629 | |
| | | | Other Assets and Liabilities - Net | | (1.8 | ) | (11,041,134 | ) |
| | | | Net Assets | | 100.0 | % | $ | 629,327,495 | |
| | | | | | | |
| |
| | @ | | Non-income producing security | |
| | (cc) | | Securities purchased with cash collateral for securities loaned. | |
| | (1) | | Collateral received from brokers for securities lending was invested in these short-term investments. | |
| | (2) | | On September 12, 2008, BNY established a separate sleeve of the Institutional Cash Reserves Fund (Series B) to hold certain Lehman Brothers defaulted debt obligations. The Portfolio’s position in Series B is being fair valued daily. Please see the accompanying Notes to Financial Statements for additional details on securities lending. | |
| | R | | Restricted security | |
| | L | | Loaned security, a portion or all of the security is on loan at December 31, 2010. | |
| | PORTFOLIO OF INVESTMENTS |
ING U.S. Bond Index Portfolio | | as of December 31, 2010 |
Principal Amount | | | | | | Value | |
| | | | | | | |
CORPORATE BONDS/NOTES: 23.4% | | | |
| | | | Consumer Discretionary: 2.2% | | | |
$ | 6,000,000 | | | | CBS Corp., 4.300%, due 02/15/21 | | $ | 5,708,646 | |
6,260,000 | | | | Comcast Corp., 6.300%, due 11/15/17 | | 7,177,522 | |
4,325,000 | | | | Comcast Corp., 6.500%, due 11/15/35 | | 4,663,163 | |
3,900,000 | | | | COX Communications, Inc., 5.450%, due 12/15/14 | | 4,297,250 | |
3,755,000 | | | | Daimler Finance NA, LLC, 6.500%, due 11/15/13 | | 4,253,732 | |
5,620,000 | | | | DirecTV Holdings, LLC, 6.000%, due 08/15/40 | | 5,661,610 | |
4,550,000 | | | | Discovery Communications LLC, 5.050%, due 06/01/20 | | 4,820,493 | |
500,000 | | | | Fortune Brands, Inc., 3.000%, due 06/01/12 | | 507,673 | |
3,350,000 | | | | Home Depot, Inc., 5.875%, due 12/16/36 | | 3,496,274 | |
3,750,000 | | | | Lowe’s Cos, Inc., 3.750%, due 04/15/21 | | 3,633,173 | |
9,000,000 | | # | | NBC Universal, Inc., 3.650%, due 04/30/15 | | 9,240,435 | |
5,550,000 | | | | News America, Inc., 6.150%, due 03/01/37 | | 5,805,472 | |
3,200,000 | | | | Nordstrom, Inc., 4.750%, due 05/01/20 | | 3,254,061 | |
8,775,000 | | | | Time Warner Cable, Inc., 5.850%, due 05/01/17 | | 9,804,202 | |
4,030,000 | | | | Time Warner Cable, Inc., 6.550%, due 05/01/37 | | 4,328,873 | |
4,370,000 | | | | Time Warner, Inc., 4.875%, due 03/15/20 | | 4,559,584 | |
1,325,000 | | | | Time Warner, Inc., 5.875%, due 11/15/16 | | 1,497,426 | |
3,825,000 | | | | Time Warner, Inc., 6.500%, due 11/15/36 | | 4,194,139 | |
| | | | | | 86,903,728 | |
| | | | Consumer Staples: 1.9% | | | |
3,595,000 | | | | Altria Group, Inc., 9.950%, due 11/10/38 | | 5,080,760 | |
575,000 | | | | Anheuser-Busch InBev Worldwide, Inc., 5.375%, due 01/15/20 | | 624,185 | |
5,600,000 | | # | | Anheuser-Busch InBev Worldwide, Inc., 7.200%, due 01/15/14 | | 6,408,550 | |
150,000 | | | | Clorox Co., 5.450%, due 10/15/12 | | 160,945 | |
5,500,000 | | | | Coca-Cola Co., 3.150%, due 11/15/20 | | 5,171,359 | |
1,940,000 | | | | CVS Caremark Corp., 6.250%, due 06/01/27 | | 2,139,048 | |
4,815,000 | | # | | Erac USA Finance Co., 7.000%, due 10/15/37 | | 5,201,192 | |
5,315,000 | | | | Kraft Foods, Inc., 6.125%, due 02/01/18 | | 6,080,147 | |
7,410,000 | | | | Kraft Foods, Inc., 6.500%, due 02/09/40 | | 8,332,641 | |
5,600,000 | | | | Lorillard Tobacco Co., 8.125%, due 06/23/19 | | 6,240,976 | |
4,805,000 | | | | PepsiCo, Inc., 4.875%, due 11/01/40 | | 4,680,526 | |
5,920,000 | | | | Safeway, Inc., 3.950%, due 08/15/20 | | 5,616,967 | |
3,600,000 | | | | Wal-Mart Stores, Inc., 5.000%, due 10/25/40 | | 3,509,881 | |
3,130,000 | | | | Wal-Mart Stores, Inc., 5.625%, due 04/01/40 | | 3,345,710 | |
10,000,000 | | # | | Woolworths Ltd., 2.550%, due 09/22/15 | | 9,887,480 | |
| | | | | | 72,480,367 | |
| | | | Energy: 1.3% | | | |
1,310,000 | | | | Anadarko Petroleum Corp., 6.200%, due 03/15/40 | | 1,283,043 | |
6,000,000 | | | | Apache Corp., 5.625%, due 01/15/17 | | 6,852,024 | |
3,300,000 | | | | Enterprise Products Operating LLC, 6.125%, due 10/15/39 | | 3,446,500 | |
3,500,000 | | | | Husky Energy, Inc., 5.900%, due 06/15/14 | | 3,849,489 | |
2,825,000 | | | | Kinder Morgan Energy Partners LP, 6.950%, due 01/15/38 | | 3,079,403 | |
5,955,000 | | | | Petrobras International Finance Co., 5.750%, due 01/20/20 | | 6,208,492 | |
5,180,000 | | | | Shell International Finance BV, 3.100%, due 06/28/15 | | 5,325,144 | |
2,950,000 | | | | Suncor Energy, Inc., 6.500%, due 06/15/38 | | 3,285,955 | |
3,965,000 | | | | Trans-Canada Pipelines, 7.625%, due 01/15/39 | | 5,144,128 | |
5,285,000 | | | | Valero Energy Corp., 6.625%, due 06/15/37 | | 5,384,443 | |
8,000,000 | | | | Williams Partners L.P., 3.800%, due 02/15/15 | | 8,275,072 | |
| | | | | | 52,133,693 | |
| | | | Financials: 10.5% | | | |
8,455,000 | | # | | Abbey National Treasury Services PLC/London, 3.875%, due 11/10/14 | | 8,385,787 | |
8,425,000 | | | | American Express Co., 7.000%, due 03/19/18 | | 9,827,400 | |
5,200,000 | | | | AngloGold Ashanti Holdings PLC, 5.375%, due 04/15/20 | | 5,417,870 | |
4,050,000 | | | | AvalonBay Communities, Inc., 5.700%, due 03/15/17 | | 4,469,734 | |
4,905,000 | | | | Bank of America Corp., 5.650%, due 05/01/18 | | 5,019,257 | |
13,725,000 | | | | Bank of America Corp., 6.500%, due 08/01/16 | | 14,910,373 | |
7,050,000 | | # | | Bank of Tokyo-Mitsubishi UFJ Ltd., 1.600%, due 09/11/13 | | 7,027,849 | |
5,905,000 | | | | Barclays Bank PLC, 6.750%, due 05/22/19 | | 6,680,592 | |
5,640,000 | | | | Berkshire Hathaway Finance Corp., 5.750%, due 01/15/40 | | 5,948,294 | |
3,750,000 | | # | | BG Energy Capital PLC, 4.000%, due 12/09/20 | | 3,690,128 | |
6,000,000 | | | | Boston Properties L.P., 5.625%, due 11/15/20 | | 6,397,500 | |
4,875,000 | | | | Caterpillar Financial Services Corp., 1.900%, due 12/17/12 | | 4,956,208 | |
8,095,000 | | | | Citigroup, Inc., 2.125%, due 04/30/12 | | 8,261,967 | |
2,580,000 | | | | Citigroup, Inc., 5.000%, due 09/15/14 | | 2,671,193 | |
14,000,000 | | | | Citigroup, Inc., 5.500%, due 04/11/13 | | 14,915,586 | |
8,635,000 | | | | Citigroup, Inc., 5.875%, due 05/29/37 | | 8,475,460 | |
2,155,000 | | | | Citigroup, Inc., 8.125%, due 07/15/39 | | 2,750,230 | |
5,000,000 | | | | Credit Suisse First Boston USA, Inc., 5.125%, due 01/15/14 | | 5,444,865 | |
2,500,000 | | | | Deutsche Bank AG/London, 5.375%, due 10/12/12 | | 2,687,965 | |
12,195,000 | | | | European Investment Bank, 1.750%, due 09/14/12 | | 12,419,656 | |
9,255,000 | | L | | European Investment Bank, 2.375%, due 03/14/14 | | 9,529,753 | |
11,350,000 | | | | General Electric Capital Corp., 5.250%, due 10/19/12 | | 12,135,908 | |
4,000,000 | | | | General Electric Capital Corp., 5.875%, due 01/14/38 | | 4,166,468 | |
9,150,000 | | | | General Electric Capital Corp., 6.750%, due 03/15/32 | | 10,389,551 | |
19,195,000 | | | | Goldman Sachs Group, Inc., 3.250%, due 06/15/12 | | 19,933,297 | |
13,950,000 | | | | Goldman Sachs Group, Inc., 4.750%, due 07/15/13 | | 14,869,445 | |
9,840,000 | | | | Goldman Sachs Group, Inc., 6.150%, due 04/01/18 | | 10,851,709 | |
4,000,000 | | | | Goldman Sachs Group, Inc., 6.750%, due 10/01/37 | | 4,102,352 | |
2,300,000 | | # | | Harley-Davidson Funding Corp., 6.800%, due 06/15/18 | | 2,426,275 | |
4,350,000 | | | | Hartford Financial Services Group, Inc., 5.375%, due 03/15/17 | | 4,433,137 | |
5,017,000 | | # | | HSBC Finance Corp., 6.676%, due 01/15/21 | | 5,077,776 | |
4,400,000 | | | | HSBC Holdings PLC, 6.500%, due 09/15/37 | | 4,622,763 | |
8,225,000 | | #, L | | Hyundai Capital America, 3.750%, due 04/06/16 | | 8,087,511 | |
1,815,000 | | | | JPMorgan Chase & Co., 2.125%, due 12/26/12 | | 1,865,893 | |
14,605,000 | | | | JPMorgan Chase & Co., 5.375%, due 10/01/12 | | 15,677,898 | |
9,375,000 | | | | JPMorgan Chase & Co., 5.500%, due 10/15/40 | | 9,617,953 | |
17,585,000 | | | | Kreditanstalt fuer Wiederaufbau, 2.000%, due 01/17/12 | | 17,845,715 | |
4,005,000 | | | | Lincoln National Corp., 4.300%, due 06/15/15 | | 4,129,848 | |
3,400,000 | | | | Merrill Lynch & Co., Inc., 5.450%, due 02/05/13 | | 3,588,068 | |
6,675,000 | | | | Merrill Lynch & Co., Inc., 6.220%, due 09/15/26 | | 6,349,360 | |
6,995,000 | | | | Metlife, Inc., 6.750%, due 06/01/16 | | 8,123,287 | |
9,650,000 | | | | Morgan Stanley, 5.375%, due 10/15/15 | | 10,146,724 | |
| | | | | | | | | |
11,500,000 | | | | Morgan Stanley, 6.625%, due 04/01/18 | | 12,492,887 | |
7,095,000 | | | | PNC Funding Corp., 3.625%, due 02/08/15 | | 7,342,857 | |
3,895,000 | | | | Prudential Financial, Inc., 3.875%, due 01/14/15 | | 4,022,117 | |
3,800,000 | | | | Prudential Financial, Inc., 6.200%, due 11/15/40 | | 4,033,894 | |
7,100,000 | | | | Simon Property Group LP, 5.250%, due 12/01/16 | | 7,669,328 | |
5,935,000 | | | | Travelers Cos, Inc., 3.900%, due 11/01/20 | | 5,777,099 | |
5,655,000 | | | | US Bancorp, 1.125%, due 10/30/13 | | 5,604,382 | |
11,275,000 | | # | | WEA Finance, LLC / WT Finance Aust Pty Ltd., 7.500%, due 06/02/14 | | 12,806,416 | |
14,860,000 | | L | | Wells Fargo & Co., 3.625%, due 04/15/15 | | 15,424,204 | |
7,000,000 | | | | Wells Fargo & Co., 4.375%, due 01/31/13 | | 7,411,439 | |
| | | | | | 410,913,228 | |
| | | | Health Care: 1.0% | | | |
6,000,000 | | | | AstraZeneca PLC, 5.400%, due 09/15/12 | | 6,472,740 | |
3,605,000 | | | | Becton Dickinson and Co., 3.250%, due 11/12/20 | | 3,390,751 | |
10,550,000 | | | | CareFusion Corp., 4.125%, due 08/01/12 | | 10,995,949 | |
2,945,000 | | | | Celgene Corp., 3.950%, due 10/15/20 | | 2,805,504 | |
5,675,000 | | | | Express Scripts, Inc., 5.250%, due 06/15/12 | | 5,991,801 | |
5,000,000 | | | | Medco Health Solutions, Inc., 2.750%, due 09/15/15 | | 4,966,110 | |
5,855,000 | | | | Thermo Fisher Scientific, Inc., 2.150%, due 12/28/12 | | 5,958,569 | |
| | | | | | 40,581,424 | |
| | | | Industrials: 1.5% | | | |
7,253,913 | | | | Continental Airlines, Inc., 7.250%, due 11/10/19 | | 8,088,113 | |
6,295,000 | | | | CRH America, Inc., 5.300%, due 10/15/13 | | 6,759,489 | |
1,385,412 | | | | Delta Airlines, Inc., 6.821%, due 08/10/22 | | 1,468,537 | |
4,695,000 | | | | Ingersoll-Rand Global Holding Co., Ltd., 6.000%, due 08/15/13 | | 5,194,956 | |
6,220,000 | | | | L-3 Communications Corp., 4.750%, due 07/15/20 | | 6,122,601 | |
7,420,000 | | | | Raytheon Co., 3.125%, due 10/15/20 | | 6,856,058 | |
5,000,000 | | | | Republic Airways Holdings, Inc., 5.250%, due 11/15/21 | | 5,280,355 | |
5,895,000 | | | | Tyco International Finance S.A., 3.375%, due 10/15/15 | | 6,030,567 | |
5,530,000 | | | | United Parcel Service, Inc., 4.875%, due 11/15/40 | | 5,377,057 | |
5,290,000 | | | | Waste Management, Inc., 6.125%, due 11/30/39 | | 5,681,090 | |
| | | | | | 56,858,823 | |
| | | | Information Technology: 0.5% | | | |
3,130,000 | | | | Cisco Systems, Inc., 5.500%, due 01/15/40 | | 3,281,902 | |
6,000,000 | | | | Hewlett-Packard Co., 6.125%, due 03/01/14 | | 6,799,482 | |
10,800,000 | | | | Xerox Corp., 5.500%, due 05/15/12 | | 11,410,870 | |
20,000 | | | | Xerox Corp., 6.750%, due 12/15/39 | | 22,890 | |
| | | | | | 21,515,144 | |
| | | | Materials: 1.1% | | | |
3,880,000 | | | | ArcelorMittal, 5.250%, due 08/05/20 | | 3,842,996 | |
7,235,000 | | | | ArcelorMittal, 6.125%, due 06/01/18 | | 7,720,302 | |
2,795,000 | | | | Barrick Australian Finance Pty Ltd., 5.950%, due 10/15/39 | | 2,969,992 | |
7,355,000 | | | | Dow Chemical Co., 8.550%, due 05/15/19 | | 9,232,070 | |
3,500,000 | | | | Potash Corp. of Saskatchewan, Inc., 5.625%, due 12/01/40 | | 3,545,073 | |
7,190,000 | | | | Rio Tinto Finance USA Ltd., 6.500%, due 07/15/18 | | 8,395,173 | |
6,000,000 | | | | Southern Copper Corp., 5.375%, due 04/16/20 | | 6,095,892 | |
1,955,000 | | | | Vale Overseas Ltd., 6.875%, due 11/21/36 | | 2,155,352 | |
| | | | | | 43,956,850 | |
| | | | Telecommunication Services: 1.8% | | | |
5,000,000 | | | | America Movil S.A.B de CV, 5.000%, due 03/30/20 | | 5,222,240 | |
8,000,000 | | | | AT&T, Inc., 2.500%, due 08/15/15 | | 7,980,520 | |
6,070,000 | | | | AT&T, Inc., 6.500%, due 09/01/37 | | 6,567,685 | |
1,080,000 | | | | British Telecommunications PLC, 9.875%, due 12/15/30 | | 1,443,091 | |
7,095,000 | | | | Deutsche Telekom International Finance BV, 5.750%, due 03/23/16 | | 7,955,347 | |
1,710,000 | | | | Embarq Corp., 7.082%, due 06/01/16 | | 1,893,244 | |
6,775,000 | | | | France Telecom S.A., 4.375%, due 07/08/14 | | 7,244,806 | |
2,220,000 | | | | Rogers Cable, Inc., 5.500%, due 03/15/14 | | 2,426,316 | |
2,685,000 | | | | Telecom Italia Capital S.A., 5.250%, due 10/01/15 | | 2,751,924 | |
6,510,000 | | | | Telefonica Emisiones S.A.U, 2.582%, due 04/26/13 | | 6,518,873 | |
9,725,000 | | | | Verizon Communications, Inc., 6.350%, due 04/01/19 | | 11,242,528 | |
2,940,000 | | | | Verizon Communications, Inc., 7.750%, due 12/01/30 | | 3,657,375 | |
3,965,000 | | | | Vodafone Group PLC, 6.150%, due 02/27/37 | | 4,258,751 | |
| | | | | | 69,162,700 | |
| | | | Utilities: 1.6% | | | |
3,025,000 | | | | Dominion Resources, Inc., 2.250%, due 09/01/15 | | 2,984,568 | |
5,670,000 | | | | Duke Energy Corp., 3.950%, due 09/15/14 | | 5,946,792 | |
5,260,000 | | | | Exelon Generation Co. LLC, 5.200%, due 10/01/19 | | 5,512,396 | |
3,225,000 | | | | FirstEnergy Solutions Corp., 6.800%, due 08/15/39 | | 3,135,319 | |
5,005,000 | | # | | Kentucky Utilities Co., 5.125%, due 11/01/40 | | 4,928,659 | |
3,495,000 | | | | NextEra Energy Capital Holdings, Inc., 2.550%, due 11/15/13 | | 3,575,612 | |
4,855,000 | | | | Oncor Electric Delivery Co., 5.950%, due 09/01/13 | | 5,379,049 | |
3,850,000 | | | | Pacific Gas & Electric Co., 3.500%, due 10/01/20 | | 3,672,442 | |
2,160,000 | | | | PPL Energy Supply, LLC, 6.300%, due 07/15/13 | | 2,381,063 | |
8,485,000 | | | | Public Service Co. of Colorado, 3.200%, due 11/15/20 | | 8,017,027 | |
3,600,000 | | | | Southern California Gas Co., 5.125%, due 11/15/40 | | 3,572,006 | |
12,575,000 | | | | Southern Co., 2.375%, due 09/15/15 | | 12,392,424 | |
| | | | | | 61,497,357 | |
| | | | Total Corporate Bonds/Notes
(Cost $887,908,422) | | 916,003,314 | |
| | | | | | | |
U.S. GOVERNMENT AGENCY OBLIGATIONS: 39.0% | | | |
| | | | Federal Home Loan Bank: 0.1% | | | |
345,000 | | | | 4.625%, due 06/12/20 | | 375,199 | |
4,710,000 | | L | | 5.375%, due 05/18/16 | | 5,409,981 | |
95,000 | | | | 5.625%, due 06/11/21 | | 108,844 | |
| | | | | | 5,894,024 | |
| | | | Federal Home Loan Mortgage Corporation##: 10.9% | | | |
34,085,000 | | | | 0.625%, due 12/28/12 | | 34,039,667 | |
18,090,000 | | | | 1.400%, due 07/26/13 | | 18,098,466 | |
25,660,000 | | | | 1.625%, due 04/15/13 | | 26,124,420 | |
8,505,000 | | L | | 3.750%, due 03/27/19 | | 8,819,677 | |
32,040,000 | | W | | 4.000%, due 08/15/40 | | 31,814,727 | |
36,245,000 | | W | | 4.500%, due 02/15/40 | | 37,151,125 | |
48,072,991 | | | | 4.500%, due 04/01/23-08/01/40 | | 49,325,142 | |
24,260,000 | | W | | 5.000%, due 01/15/39 | | 25,446,460 | |
54,216,120 | | | | 5.000%, due 03/01/34-08/01/40 | | 57,128,070 | |
190,000 | | | | 5.400%, due 03/17/21 | | 209,125 | |
2,005,000 | | W | | 5.500%, due 01/15/39 | | 2,136,893 | |
64,522,889 | | | | 5.500%, due 09/01/34-05/01/40 | | 69,045,143 | |
370,000 | | | | 5.550%, due 10/04/16 | | 383,450 | |
8,630,000 | | W | | 6.000%, due 01/15/39 | | 9,348,724 | |
32,518,815 | | | | 6.000%, due 04/01/28-05/01/40 | | 35,281,810 | |
10,304,604 | | | | 6.500%, due 06/01/36-01/01/39 | | 11,439,615 | |
7,170,000 | | | | 6.750%, due 03/15/31 | | 9,208,646 | |
| | | | | | 425,001,160 | |
| | | | Federal National Mortgage Association##: 24.3% | | | |
16,990,000 | | | | 0.375%, due 12/28/12 | | 16,890,473 | |
24,935,000 | | | | 1.000%, due 09/23/13 | | 24,913,955 | |
16,480,000 | | L | | 1.625%, due 10/26/15 | | 16,081,168 | |
15,070,000 | | | | 1.800%, due 03/15/13 | | 15,108,157 | |
32,205,000 | | | | 2.750%, due 03/13/14 | | 33,686,849 | |
3,395,000 | | | | 3.000%, due 07/28/14 | | 3,442,187 | |
16,000,000 | | W | | 3.500%, due 01/25/26 | | 16,115,008 | |
81,265,000 | | W | | 4.000%, due 01/25/24-08/25/40 | | 81,599,588 | |
28,051,182 | | | | 4.000%, due 07/01/13-12/01/25 | | 28,965,739 | |
59,330,000 | | W | | 4.500%, due 01/25/24-01/25/39 | | 60,965,332 | |
130,561,882 | | | | 4.500%, due 01/01/14-10/01/40 | | 135,092,070 | |
53,350,000 | | W | | 5.000%, due 01/25/24-01/13/40 | | 56,115,859 | |
124,890,998 | | | | 5.000%, due 02/01/14-07/01/40 | | 131,985,389 | |
3,680,000 | | | | 5.125%, due 08/19/24 | | 3,761,324 | |
18,480,000 | | | | 5.375%, due 06/12/17 | | 21,306,941 | |
56,800,000 | | W | | 5.500%, due 01/25/24-01/25/39 | | 60,993,944 | |
98,763,705 | | | | 5.500%, due 04/01/11-07/01/40 | | 106,020,004 | |
14,225,000 | | W | | 6.000%, due 01/15/33 | | 15,463,030 | |
64,454,317 | | | | 6.000%, due 06/01/11-11/01/39 | | 70,203,309 | |
13,755,000 | | W | | 6.500%, due 01/15/32 | | 15,287,390 | |
27,219,931 | | | | 6.500%, due 04/01/30-09/01/39 | | 30,297,536 | |
1,545,000 | | | | 6.625%, due 11/15/30 | | 1,955,301 | |
3,600,000 | | | | 7.125%, due 01/15/30 | | 4,780,138 | |
| | | | | | 951,030,691 | |
| | | | Government National Mortgage Association: 3.7% | | | |
18,245,000 | | W | | 4.000%, due 01/15/40 | | 18,373,281 | |
45,610,000 | | | | 4.500%, due 01/20/40 | | 47,363,157 | |
23,418,153 | | | | 5.000%, due 10/15/37-05/15/40 | | 24,917,186 | |
8,435,000 | | W | | 5.500%, due 01/15/39 | | 9,116,396 | |
25,077,608 | | | | 5.500%, due 09/15/33-11/20/39 | | 26,965,914 | |
15,604,797 | | | | 6.000%, due 10/15/36-12/15/38 | | 17,185,795 | |
63,014 | | | | 7.000%, due 12/15/37 | | 70,382 | |
| | | | | | 143,992,111 | |
| | | | Other U.S. Agency Obligations: 0.0% | | | |
75,000 | | | | Federal Farm Credit Bank, 5.125%, due 08/25/16 | | 85,556 | |
10,000 | | | | Tennessee Valley Authority, 6.150%, due 01/15/38 | | 12,063 | |
| | | | | | 97,619 | |
| | | | Total U.S. Government Agency Obligations
(Cost $1,510,665,237) | | 1,526,015,605 | |
| | | | | | | |
U.S. TREASURY OBLIGATIONS: 32.6% | | | |
| | | | U.S. Treasury Notes: 32.6% | | | |
89,000,000 | | | | 0.500%, due 10/15/13 | | 88,019,665 | |
6,630,000 | | | | 1.000%, due 07/15/13 | | 6,663,661 | |
63,145,000 | | | | 1.125%, due 01/15/12 | | 63,660,516 | |
276,460,000 | | | | 1.375%, due 05/15/12-03/15/13 | | 280,424,689 | |
112,875,000 | | | | 1.875%, due 04/30/14 | | 115,458,822 | |
220,455,000 | | | | 2.375%, due 08/31/14-07/31/17 | | 225,360,189 | |
40,720,000 | | | | 2.500%, due 03/31/15 | | 42,154,810 | |
25,290,000 | | | | 2.625%, due 02/29/16-11/15/20 | | 25,338,484 | |
50,745,000 | | | | 2.750%, due 02/15/19 | | 50,098,813 | |
59,200,000 | | | | 3.125%, due 04/30/17-05/15/19 | | 60,854,646 | |
8,755,000 | | L | | 3.250%, due 05/31/16 | | 9,235,842 | |
40,930,000 | | | | 3.375%, due 11/15/19 | | 41,790,185 | |
115,035,000 | | | | 3.500%, due 02/15/18-02/15/39 | | 104,989,815 | |
14,775,000 | | | | 3.625%, due 02/15/20 | | 15,335,992 | |
39,370,000 | | | | 3.750%, due 11/15/18 | | 41,882,908 | |
9,340,000 | | | | 4.250%, due 05/15/39 | | 9,202,823 | |
29,745,000 | | | | 4.375%, due 02/15/38 | | 30,065,681 | |
9,870,000 | | | | 6.000%, due 02/15/26 | | 12,204,877 | |
23,315,000 | | | | 6.500%, due 11/15/26 | | 30,269,422 | |
1,550,000 | | | | 6.875%, due 08/15/25 | | 2,072,156 | |
4,025,000 | | | | 8.125%, due 08/15/19 | | 5,608,274 | |
8,160,000 | | | | 8.875%, due 08/15/17 | | 11,336,027 | |
| | | | | | | |
| | | | Total U.S. Treasury Obligations
(Cost $1,273,657,308) | | 1,272,028,297 | |
| | | | | | | |
COLLATERALIZED MORTGAGE OBLIGATIONS: 3.0% | | | |
1,000,000 | | | | Banc of America Commercial Mortgage, Inc., 5.414%, due 09/10/47 | | 1,048,064 | |
1,100,000 | | | | Banc of America Commercial Mortgage, Inc., 5.449%, due 01/15/49 | | 1,146,584 | |
2,240,000 | | | | Banc of America Commercial Mortgage, Inc., 5.634%, due 07/10/46 | | 2,406,458 | |
450,000 | | | | Banc of America Commercial Mortgage, Inc., 5.658%, due 06/10/49 | | 462,660 | |
9,570,000 | | | | Banc of America Commercial Mortgage, Inc., 5.889%, due 07/10/44 | | 10,235,695 | |
12,000,000 | | | | Bear Stearns Commercial Mortgage Securities, 5.331%, due 02/11/44 | | 12,341,011 | |
7,700,000 | | | | Citigroup Commercial Mortgage Trust, 5.698%, due 12/10/49 | | 8,243,202 | |
3,250,000 | | | | Citigroup/Deutsche Bank Commercial Mortgage Trust, 5.886%, due 11/15/44 | | 3,473,419 | |
2,500,000 | | | | Commercial Mortgage Pass-through Certificates, 5.306%, due 12/10/46 | | 2,611,203 | |
2,725,055 | | | | Continental Airlines, Inc., 5.983%, due 04/19/22 | | 2,874,933 | |
2,000,000 | | | | Credit Suisse Mortgage Capital Certificates, 5.311%, due 12/15/39 | | 2,086,058 | |
1,650,000 | | | | Credit Suisse Mortgage Capital Certificates, 5.448%, due 01/15/49 | | 1,682,762 | |
1,750,000 | | | | Credit Suisse Mortgage Capital Certificates, 5.721%, due 06/15/39 | | 1,798,467 | |
1,400,000 | | | | Credit Suisse Mortgage Capital Certificates, 5.804%, due 09/15/39 | | 1,443,061 | |
1,822,961 | | | | CW Capital Cobalt Ltd., 5.334%, due 04/15/47 | | 1,882,794 | |
3,170,000 | | | | CW Capital Cobalt Ltd., 5.818%, due 05/15/46 | | 3,277,703 | |
3,000,000 | | | | GE Capital Commercial Mortgage Corp., 5.315%, due 11/10/45 | | 3,221,823 | |
1,755,000 | | | | Greenwich Capital Commercial Funding Corp., 5.883%, due 07/10/38 | | 1,917,058 | |
4,000,000 | | L | | GS Mortgage Securities Corp. II, 5.807%, due 08/10/45 | | 4,188,656 | |
439,829 | | | | JPMorgan Chase Commercial Mortgage Securities Corp., 4.871%, due 10/15/42 | | 445,097 | |
2,650,000 | | | | JPMorgan Chase Commercial Mortgage Securities Corp., 4.879%, due 01/12/38 | | 2,809,410 | |
1,155,000 | | | | JPMorgan Chase Commercial Mortgage Securities Corp., 5.038%, due 03/15/46 | | 1,233,702 | |
3,655,000 | | | | JPMorgan Chase Commercial Mortgage Securities Corp., 5.336%, due 05/15/47 | | 3,798,898 | |
5,878,000 | | | | JPMorgan Chase Commercial Mortgage Securities Corp., 5.429%, due 12/12/43 | | 6,239,387 | |
500,000 | | | | JPMorgan Chase Commercial Mortgage Securities Corp., 5.434%, due 01/15/49 | | 515,253 | |
2,775,000 | | | | JPMorgan Chase Commercial Mortgage Securities Corp., 5.440%, due 06/12/47 | | 2,912,245 | |
1,105,000 | | | | JPMorgan Chase Commercial Mortgage Securities Corp., 5.688%, due 02/12/51 | | 1,175,865 | |
4,750,000 | | | | JPMorgan Chase Commercial Mortgage Securities Corp., 5.742%, due 02/12/49 | | 5,053,988 | |
500,000 | | | | JPMorgan Chase Commercial Mortgage Securities Corp., 5.827%, due 02/15/51 | | 519,896 | |
2,000,000 | | | | JPMorgan Chase Commercial Mortgage Securities Corp., 5.872%, due 04/15/45 | | 2,189,894 | |
1,255,000 | | | | JPMorgan Chase Commercial Mortgage Securities Corp., 6.125%, due 02/12/51 | | 1,319,585 | |
4,130,000 | | | | LB-UBS Commercial Mortgage Trust, 5.858%, due 07/15/40 | | 4,346,446 | |
4,500,000 | | | | Merrill Lynch/Countrywide Commercial Mortgage Trust, 5.747%, due 06/12/50 | | 4,644,477 | |
410,000 | | | | Merrill Lynch/Countrywide Commercial Mortgage Trust, 5.965%, due 08/12/49 | | 441,926 | |
1,000,000 | | | | Morgan Stanley Capital I, 5.569%, due 12/15/44 | | 1,028,522 | |
1,460,000 | | | | Morgan Stanley Capital I, 5.598%, due 04/12/49 | | 1,466,537 | |
6,124,000 | | | | Wachovia Bank Commercial Mortgage Trust, 5.313%, due 11/15/48 | | 6,388,616 | |
1,250,000 | | | | Wachovia Bank Commercial Mortgage Trust, 5.418%, due 01/15/45 | | 1,340,958 | |
1,500,000 | | | | Wachovia Bank Commercial Mortgage Trust, 5.509%, due 04/15/47 | | 1,531,992 | |
| | | | | | | |
| | | | Total Collateralized Mortgage Obligations
(Cost $95,467,244) | | 115,744,305 | |
| | | | | | | |
MUNICIPAL BONDS: 0.2% | | | |
| | | | California: 0.1% | | | |
2,605,000 | | | | State of California, 7.550%, due 04/01/39 | | 2,710,789 | |
| | | | | | 2,710,789 | |
| | | | Illinois: 0.1% | | | |
4,400,000 | | | | State of Illinois, 4.421%, due 01/01/15 | | 4,422,528 | |
| | | | | | 4,422,528 | |
| | | | | | | |
| | | | Total Municipal Bonds
(Cost $7,166,891) | | 7,133,317 | |
| | | | | | | |
OTHER BONDS: 0.2% | | | |
| | | | Foreign Government Bonds: 0.2% | | | |
7,650,000 | | | | Mexico Government International Bond, 6.375%, due 01/16/13 | | 8,395,875 | |
| | | | | | | |
| | | | Total Other Bonds
(Cost $8,045,918) | | 8,395,875 | |
| | | | | | | |
| | | | Total Long-Term Investments
(Cost $3,782,911,020) | | 3,845,320,713 | |
| | | | | | | |
Shares | | | | | | | |
| | | | | | | |
SHORT-TERM INVESTMENTS: 21.4% | | | |
| | | | Mutual Funds: 6.1% | | | |
236,703,455 | | | | Blackrock Liquidity Funds TempFund Portfolio - Class I | | | 236,703,455 | |
| | | | | | | |
| | | | Total Mutual Funds
(Cost $236,703,455) | | 236,703,455 | |
| | | | | | | |
Principal Amount | | | | | | | |
| | | | | | | |
| | | | U.S. Government Agency Obligations: 3.2% | | | |
50,000,000 | | Z | | Federal Home Loan Mortgage Corporation, 0.120%, due 05/10/11 | | | 49,978,850 | |
75,000,000 | | Z | | Federal Home Loan Mortgage Corporation, 0.120%, due 05/26/11 | | 74,964,225 | |
| | | | | | | |
| | | | Total U.S. Government Agency Obligations
(Cost $124,911,583) | | 124,943,075 | |
| | | | | | | |
| | | | U.S. Treasury Bills: 9.0% | | | |
45,000,000 | | | | 0.120%, due 04/21/11 | | 44,983,125 | |
68,000,000 | | | | 0.130%, due 05/12/11 | | 67,967,088 | |
40,000,000 | | | | 0.140%, due 06/02/11 | | 39,975,840 | |
50,000,000 | | | | 0.170%, due 06/30/11 | | 49,956,750 | |
75,000,000 | | | | 0.180%, due 07/28/11 | | 74,919,750 | |
75,000,000 | | L | | 0.180%, due 08/25/11 | | 74,909,851 | |
| | | | | | | |
| | | | Total U.S. Treasury Bills
(Cost $352,676,215) | | 352,712,404 | |
| | | | | | | |
Shares | | | | | | | |
| | | | | | | |
| | | | Securities Lending Collateral(cc): 3.1% | | | |
121,022,135 | | | | BNY Mellon Overnight Government Fund (1) | | | 121,022,135 | |
| | | | | | | |
| | | | Total Securities Lending Collateral
(Cost $121,022,135) | | 121,022,135 | |
| | | | | | | |
| | | | Total Short-Term Investments
(Cost $835,313,388) | | 835,381,069 | |
| | | | | | | |
| | | | Total Investments in Securities
(Cost $4,618,224,408) * | 119.8 | % | | $ | 4,680,701,782 | |
| | | | Other Assets and Liabilities - Net | (19.8 | ) | | (772,600,905 | ) |
| | | | Net Assets | 100.0 | % | | $ | 3,908,100,877 | |
| | # | | Securities with purchases pursuant to Rule 144A or section 4(2), under the Securities Act of 1933 and may not be resold subject to that rule except to qualified institutional buyers. Unless otherwise noted, these securities have been determined to be liquid under the guidelines established by the Funds’ Board of Directors/Trustees. |
| | (cc) | | Securities purchased with cash collateral for securities loaned. |
| | (1) | | Collateral received from brokers for securities lending was invested in these short-term investments. |
| | ## | | On September 7, 2008, the Federal Housing Finance Agency placed the Federal National Mortgage Association and the Federal Home Loan Mortgage Corporation into conservatorship and the U.S. Treasury guaranteed the debt issued by those organizations. |
| | W | | Settlement is on a when-issued or delayed-delivery basis. |
| | L | | Loaned security, a portion or all of the security is on loan at December 31, 2010. |
| | Z | | Indicates Zero Coupon Bond; rate shown reflects current effective yield. |
| PORTFOLIO OF INVESTMENTS |
ING WisdomTreeSM Global High-Yielding Equity Index Portfolio | as of December 31, 2010 |
Shares | | | | | | Value | |
| | | | | | | |
COMMON STOCK: 97.2% | | | |
| | | | Australia: 9.3% | | | |
10,904 | | | | AGL Energy Ltd. | | $ | 169,983 | |
15,238 | | | | Amcor Ltd. | | 105,217 | |
50,391 | | | | AMP Ltd. | | 272,669 | |
5,305 | | | | ASX Ltd. | | 204,490 | |
68,764 | | | | Australia & New Zealand Banking Group Ltd. | | 1,642,434 | |
30,488 | | | | AXA Asia Pacific Holdings Ltd. | | 196,884 | |
7,807 | | | | Bendigo Bank Ltd. | | 79,506 | |
46,804 | | | | BHP Billiton Ltd. | | 2,176,435 | |
33,648 | | | | Brambles Ltd. | | 245,095 | |
4,223 | | | | Caltex Australia Ltd. | | 62,057 | |
2,732 | | | | Coal & Allied Industries Ltd. | | 334,946 | |
14,381 | | | | Coca-Cola Amatil Ltd. | | 159,914 | |
911 | | | | Cochlear Ltd. | | 74,993 | |
37,321 | | | | Commonwealth Bank of Australia | | 1,939,215 | |
16,323 | | | | Crown Ltd. | | 137,858 | |
51,866 | | | | CSR Ltd. | | 89,096 | |
2,673 | | | | Energy Resources of Australia Ltd. | | 30,437 | |
50,933 | | | | Foster’s Group Ltd. | | 296,088 | |
19,056 | | | | Harvey Norman Holdings Ltd. | | 57,312 | |
45,600 | | | | Insurance Australia Group | | 181,104 | |
6,613 | | | | Leighton Holdings Ltd. | | 208,434 | |
18,532 | | | | Lend Lease Corp., Ltd. | | 163,631 | |
36,800 | | | | Macquarie Airports Management Ltd. | | 112,483 | |
5,228 | | | | Macquarie Group Ltd. | | 197,830 | |
20,799 | | | | Metcash Ltd. | | 87,386 | |
64,659 | | | | National Australia Bank Ltd. | | 1,568,725 | |
5,944 | | | | Orica Ltd. | | 151,587 | |
15,706 | | | | Origin Energy Ltd. | | 267,794 | |
13,561 | | | | Platinum Asset Management Ltd. | | 69,185 | |
28,039 | | | | QBE Insurance Group Ltd. | | 520,714 | |
2,665 | | | | Ramsay Health Care Ltd. | | 48,542 | |
13,408 | | | | Santos Ltd. | | 180,520 | |
10,078 | | | | Sonic Healthcare Ltd. | | 119,802 | |
36,848 | | | | Suncorp Group Ltd. | | 324,494 | |
30,189 | | | | TABCORP Holdings Ltd. | | 219,514 | |
72,391 | | | | Tattersall’s Ltd. | | 191,153 | |
624,215 | | | | Telstra Corp., Ltd. | | 1,780,832 | |
18,242 | | | | Toll Holdings Ltd. | | 107,046 | |
23,503 | | | | Transurban Group | | 123,387 | |
26,302 | | | | Wesfarmers Ltd. | | 861,633 | |
92,967 | | | | Westpac Banking Corp. | | 2,112,013 | |
9,622 | | | | Woodside Petroleum Ltd. | | 419,140 | |
29,240 | | | | Woolworths Ltd. | | 807,457 | |
5,134 | | | | WorleyParsons Ltd. | | 140,613 | |
| | | | | | 19,239,648 | |
| | | | Austria: 0.4% | | | |
1,347 | | @ | | Bank of Austria - Escrow | | — | |
4,287 | | | | OMV AG | | 178,664 | |
12,383 | | | | Telekom Austria AG | | 174,538 | |
5,725 | | | | Verbund AG | | 213,917 | |
4,968 | | | | Voestalpine AG | | 237,624 | |
1,401 | | | | Wiener Staedtische Allgemeine Versicherung AG | | 73,020 | |
| | | | | | 877,763 | |
| | | | Belgium: 0.4% | | | |
33,377 | | | | Ageas | | 76,287 | |
13,571 | | | | Belgacom S.A. | | 455,946 | |
2,128 | | | | Mobistar S.A. | | 138,081 | |
1,600 | | | | Solvay S.A. | | 170,605 | |
2,312 | | | | UCB S.A. | | 79,390 | |
| | | | | | 920,309 | |
| | | | | | | | |
| | | | Brazil: 2.3% | | | |
62,500 | | | | Banco do Brasil S.A. | | 1,182,982 | |
23,500 | | | | Cia de Bebidas das Americas | | 614,398 | |
7,300 | | | | Cia de Concessoes Rodoviarias | | 206,247 | |
8,764 | | | | Cia Energetica de Minas Gerais | | 109,550 | |
30,800 | | | | Cia Siderurgica Nacional S.A. | | 494,841 | |
21,400 | | | | Cielo SA | | 173,392 | |
14,000 | | | | CPFL Energia S.A. | | 347,470 | |
3,300 | | | | EDP - Energias do Brasil S.A. | | 76,954 | |
14,200 | | | | Light S.A. | | 217,534 | |
7,100 | | | | Natura Cosmeticos S.A. | | 203,975 | |
18,600 | | | | Redecard S.A. | | 235,861 | |
7,900 | | | | Souza Cruz S.A. | | 430,169 | |
1,500 | | @ | | Tele Norte Leste Participacoes S.A. | | 29,187 | |
4,400 | | | | Telecomunicacoes de Sao Paulo S.A. | | 104,169 | |
14,600 | | | | Tractebel Energia S.A. | | 241,428 | |
| | | | | | 4,668,157 | |
| | | | Canada: 4.9% | | | |
7,700 | | | | ARC Energy Trust | | 196,779 | |
10,347 | | | | Bank of Montreal | | 598,155 | |
15,800 | | | | Bank of Nova Scotia | | 907,352 | |
600 | | | | Baytex Energy Trust | | 28,126 | |
15,400 | | | | BCE, Inc. | | 547,356 | |
4,300 | | | | Bell Aliant Regional Communications Income Fund | | 112,398 | |
6,000 | | | | Bonavista Energy Trust | | 173,791 | |
10,700 | | | | Brookfield Properties Co. | | 188,969 | |
7,500 | | | | Canadian Imperial Bank of Commerce | | 590,843 | |
11,400 | | | | Canadian Oil Sands Trust | | 303,259 | |
6,600 | | | | CI Financial Corp. | | 149,351 | |
5,600 | | | | Cresent Point Energy Corp. | | 248,883 | |
9,100 | | | | EnCana Corp. | | 266,237 | |
8,100 | | | | Enerplus Resources Fund | | 249,851 | |
600 | | | | Fortis, Inc. | | 20,505 | |
19,450 | | | | Great-West Lifeco, Inc. | | 516,424 | |
16,500 | | | | Husky Energy, Inc. | | 440,586 | |
6,050 | | @ | | IGM Financial, Inc. | | 264,440 | |
1,900 | | | | Inter Pipeline Fund | | 28,511 | |
2,800 | | | | National Bank of Canada | | 192,956 | |
2,200 | | @ | | Pembina Pipeline Corp. | | 47,792 | |
15,001 | | | | Pengrowth Energy Trust | | 192,812 | |
16,113 | | | | Penn West Energy Trust | | 386,336 | |
9,200 | | | | Power Corp. of Canada | | 256,023 | |
13,600 | | | | Power Financial Corp. | | 420,324 | |
6,400 | | | | Rogers Communications, Inc. - Class B (Canadian Denominated Security) | | 222,709 | |
21,056 | | | | Royal Bank of Canada | | 1,107,965 | |
4,000 | | | | Shaw Communications, Inc. - Class B | | 85,890 | |
9,800 | | | | Sun Life Financial, Inc. | | 296,770 | |
3,850 | | | | TELUS Corp. | | 176,102 | |
4,900 | | | | Transalta Corp. | | 104,229 | |
11,324 | | | | TransCanada Corp. | | 432,665 | |
2,000 | | | | Vermilion Energy, Inc. | | 92,970 | |
33,300 | | | | Yellow Media, Inc. | | 207,644 | |
| | | | | | 10,055,003 | |
| | | | Chile: 0.6% | | | |
104,424 | | | | AES Gener SA | | 57,266 | |
2,211,900 | | | | Banco de Chile | | 326,113 | |
3,657,785 | | | | Banco Santander Chile S.A. | | 330,607 | |
91,409 | | | | Empresa Nacional de Electricidad S.A. | | 171,236 | |
5,530 | | | | Empresa Nacional de Telecom | | 97,282 | |
412,468 | | | | Enersis SA | | 191,621 | |
| | | | | | 1,174,125 | |
| | | | China: 0.4% | | | |
1,185,800 | | | | Bank of China Ltd. | | 625,126 | |
44,000 | | | | Guangzhou R&F Properties Co., Ltd. | | 62,895 | |
118,000 | | | | Zhejiang Expressway Co., Ltd. | | 116,230 | |
| | | | | | 804,251 | |
| | | | Czech Republic: 0.6% | | | |
12,228 | | | | CEZ A/S | | 510,594 | |
1,000 | | | | Komercni Banka A/S | | 236,608 | |
20,600 | | | | Telefonica O2 Czech Republic A/S | | 420,063 | |
| | | | | | 1,167,265 | |
| | | | Denmark: 0.0% | | | |
1,535 | | | | TrygVesta A/S | | 70,788 | |
| | | | | | 70,788 | |
| | | | Finland: 1.3% | | | |
22,424 | | | | Fortum OYJ | | 676,385 | |
4,089 | | | | Kone OYJ | | 227,113 | |
79,857 | | | | Nokia OYJ | | 827,224 | |
1,047 | | | | Pohjola Bank PLC | | 12,561 | |
4,988 | | | | Rautaruukki OYJ | | 117,126 | |
13,276 | | | | Sampo OYJ | | 354,995 | |
5,478 | | | | Sanoma-WSOY OYJ | | 118,811 | |
12,408 | | | | UPM-Kymmene OYJ | | 219,967 | |
2,363 | | | | Wartsila OYJ | | 180,070 | |
| | | | | | 2,734,252 | |
| | | | France: 12.4% | | | |
5,217 | | | | Accor S.A. | | 232,509 | |
1,165 | | | | Aeroports de Paris | | 92,076 | |
3,584 | | | | Air Liquide | | 453,786 | |
4,689 | | | | Alstom | | 224,749 | |
49,164 | | | | AXA S.A. | | 818,356 | |
18,388 | | | | BNP Paribas | | 1,171,069 | |
1,644 | | | | Bourbon S.A. | | 76,350 | |
8,435 | | | | Bouygues S.A. | | 364,043 | |
11,574 | | | | Carrefour S.A. | | 477,226 | |
2,378 | | | | Casino Guichard Perrachon S.A. | | 232,031 | |
10,421 | | | | Cie de Saint-Gobain | | 536,739 | |
672 | | | | Ciments Francais SA | | 65,130 | |
16,355 | | | | CNP Assurances | | 295,193 | |
56,789 | | | | Credit Agricole S.A. | | 722,114 | |
1,117 | | | | Eiffage S.A. | | 49,320 | |
34,416 | | | | Electricite de France SA | | 1,413,382 | |
2,992 | | | | Eutelsat Communications | | 109,577 | |
144,403 | | | | France Telecom S.A. | | 3,021,757 | |
75,107 | | | | Gaz de France | | 2,697,481 | |
9,149 | | | | Groupe Danone | | 575,263 | |
6,003 | | | | Lafarge S.A. | | 376,848 | |
4,056 | | | | Lagardere SCA | | 167,227 | |
5,174 | | | | Legrand S.A. | | 211,048 | |
8,110 | | | | Metropole Television SA | | 196,465 | |
1,433 | | | | Neopost S.A. | | 124,970 | |
17,690 | | | | PagesJaunes Groupe S.A. | | 160,860 | |
2,627 | | | | PPR | | 418,249 | |
883 | | | | Remy Cointreau S.A. | | 62,527 | |
32,218 | | | | Sanofi-Aventis | | 2,065,522 | |
3,821 | | | | Schneider Electric S.A. | | 572,906 | |
7,279 | | | | Scor S.A. | | 184,984 | |
4,377 | | | | Societe Television Francaise (T.F.1) | | 76,091 | |
2,569 | | | | Sodexho Alliance S.A. | | 177,273 | |
12,150 | | | | Suez Environnement S.A. | | 251,008 | |
1,176 | | | | Technip S.A. | | 108,702 | |
76,488 | | | | Total S.A. | | 4,073,944 | |
3,169 | | | | Vallourec | | 333,185 | |
14,150 | | | | Veolia Environnement | | 414,190 | |
11,468 | | | | Vinci S.A. | | 624,062 | |
51,752 | | | | Vivendi | | 1,398,425 | |
| | | | | | 25,626,637 | |
| | | | Germany: 4.0% | | | |
9,460 | | | | Allianz AG | | 1,123,997 | |
15,309 | | | | BASF AG | | 1,221,704 | |
2,638 | | | | Deutsche Boerse AG | | 182,262 | |
28,060 | | | | Deutsche Post AG | | 476,044 | |
152,887 | | | | Deutsche Telekom AG | | 1,970,899 | |
46,371 | | | | E.ON AG | | 1,416,117 | |
3,058 | | | | Hannover Rueckversicheru - Reg | | 164,046 | |
4,871 | | | | Muenchener Rueckversicherungs AG | | 737,736 | |
14,516 | | | | RWE AG | | 969,521 | |
| | | | | | 8,262,326 | |
| | | | Greece: 0.6% | | | |
16,905 | | | | Coca-Cola Hellenic Bottling Co. S.A. | | 437,961 | |
13,515 | | | | Hellenic Petroleum S.A. | | 106,018 | |
23,193 | | | | Hellenic Telecommunications Organization S.A. | | 190,363 | |
17,795 | | | | OPAP S.A. | | 307,887 | |
6,982 | | | | Public Power Corp. | | 100,409 | |
| | | | | | 1,142,638 | |
| | | | Hong Kong: 2.6% | | | |
193,000 | | | | BOC Hong Kong Holdings Ltd. | | 656,301 | |
276,000 | | | | China Mobile Ltd. | | 2,736,502 | |
47,000 | | | | CLP Holdings Ltd. | | 381,628 | |
80,000 | | | | Fushan International Energy Group Ltd. | | 54,800 | |
41,700 | | | | Hang Seng Bank Ltd. | | 685,145 | |
42,500 | | | | HongKong Electric Holdings | | 267,921 | |
53,000 | | | | Hutchison Whampoa Ltd. | | 545,227 | |
| | | | | | 5,327,524 | |
| | | | Hungary: 0.1% | | | |
62,284 | | | | Magyar Telekom Telecommunications PLC | | 154,348 | |
| | | | | | 154,348 | |
| | | | Indonesia: 0.2% | | | |
22,500 | | | | Indo Tambangraya Megah PT | | 126,554 | |
178,500 | | | | International Nickel Indonesia Tbk PT | | 96,376 | |
289,500 | | | | Telekomunikasi Indonesia Tbk PT | | 255,441 | |
| | | | | | 478,371 | |
| | | | Ireland: 0.1% | | | |
9,443 | | | | CRH PLC | | 197,019 | |
| | | | | | 197,019 | |
| | | | Israel: 0.5% | | | |
155,870 | | | | Bezeq Israeli Telecommunication Corp., Ltd. | | 474,533 | |
23,791 | | | | Israel Chemicals Ltd. | | 407,462 | |
6,561 | | | | Partner Communications | | 132,822 | |
| | | | | | 1,014,817 | |
| | | | Italy: 3.5% | | | |
91,536 | | | | AEM S.p.A. | | 125,988 | |
12,785 | | | | Altantia S.p.A. | | 261,084 | |
30,199 | | | | Banca Carige S.p.A | | 63,343 | |
6,823 | | | | Banca Popolare di Sondrio Scarl | | 56,169 | |
98,036 | | | | Edison S.p.A. | | 112,880 | |
421,619 | | | | Enel S.p.A. | | 2,112,753 | |
109,888 | | | | ENI S.p.A. | | 2,408,461 | |
10,530 | | | | Finmeccanica S.p.A. | | 119,803 | |
26,546 | | | | Hera SpA | | 54,965 | |
148,477 | | | | Intesa Sanpaolo S.p.A. | | 403,656 | |
3,752 | | | | Lottomatica S.p.A. | | 46,658 | |
29,530 | | | | Mediaset S.p.A. | | 178,840 | |
13,360 | | | | Mediolanum S.p.A | | 55,188 | |
47,787 | | | | Parmalat S.p.A | | 131,083 | |
91,668 | | | | Snam Rete Gas S.p.A. | | 456,484 | |
309,744 | | | | Telecom Italia S.p.A. | | 401,879 | |
52,944 | | | | Terna S.p.A | | 223,764 | |
11,790 | | | | Unione di Banche Italiane SCPA | | 103,448 | |
| | | | | | 7,316,446 | |
| | | | Japan: 1.8% | | | |
6,500 | | | | Astellas Pharma, Inc. | | 247,035 | |
13,500 | | | | Daiichi Sankyo Co., Ltd. | | 294,853 | |
1,800 | | | | Daito Trust Construction Co., Ltd. | | 123,016 | |
4,700 | | | | Eisai Co., Ltd. | | 169,798 | |
2,000 | | | | Lawson, Inc. | | 98,733 | |
315,500 | | | | Mizuho Financial Group, Inc. | | 591,838 | |
662 | | | | NTT DoCoMo, Inc. | | 1,152,943 | |
2,700 | | | | Oracle Corp. Japan | | 132,354 | |
1,300 | | | | Sankyo Co., Ltd. | | 73,246 | |
6,100 | | | | Showa Shell Sekiyu KK | | 55,734 | |
14,900 | | | | Takeda Pharmaceutical Co., Ltd. | | 731,975 | |
9,000 | | | | TonenGeneral Sekiyu KK | | 98,201 | |
| | | | | | 3,769,726 | |
| | | | Malaysia: 0.7% | | | |
7,900 | | | | British American Tobacco Malaysia Bhd | | 115,285 | |
29,300 | | | | Digi.com BHD | | 233,754 | |
6,600 | | | | Petronas Dagangan BHD | | 25,042 | |
44,900 | | | | Petronas Gas BHD | | 161,624 | |
108,900 | | | | PLUS Expressways Bhd | | 159,660 | |
77,291 | | | | Public Bank BHD | | 326,381 | |
24,300 | | | | RHB Capital Berhad | | 68,745 | |
142,100 | | | | Telekom Malaysia BHD | | 161,661 | |
183,500 | | | | YTL Power International | | 145,057 | |
| | | | | | 1,397,209 | |
| | | | Mexico: 0.3% | | | |
6,340 | | | | Industrias Penoles SAB de CV | | 233,168 | |
23,600 | | @ | | Kimberly-Clark Corp. | | 143,989 | |
324,400 | | | | Telefonos de Mexico SAB de CV | | 263,985 | |
| | | | | | 641,142 | |
| | | | Netherlands: 2.4% | | | |
4,135 | | | | Akzo Nobel NV | | 257,269 | |
1,400 | | | | Fugro NV | | 115,270 | |
2,602 | | | | Koninklijke Boskalis Westminster NV | | 124,237 | |
3,216 | | | | Koninklijke DSM NV | | 183,322 | |
45,897 | | | | Koninklijke KPN NV | | 670,367 | |
13,774 | | | | Reed Elsevier NV | | 170,527 | |
72,915 | | | | Royal Dutch Shell PLC - Class B | | 2,414,546 | |
5,022 | | | | SBM Offshore NV | | 112,677 | |
23,905 | | | | Unilever NV | | 745,779 | |
5,839 | | | | Wolters Kluwer NV | | 128,054 | |
| | | | | | 4,922,048 | |
| | | | New Zealand: 0.1% | | | |
17,902 | | | | Fletcher Building Ltd. | | 106,714 | |
90,676 | | | | Telecom Corp. of New Zealand Ltd. | | 152,431 | |
| | | | | | 259,145 | |
| | | | Norway: 0.8% | | | |
111,213 | | | | Marine Harvest | | 118,134 | |
24,694 | | | | Orkla ASA | | 240,876 | |
56,620 | | | | Statoil ASA | | 1,348,578 | |
| | | | | | 1,707,588 | |
| | | | Philippines: 0.2% | | | |
6,910 | | | | Globe Telecom, Inc. | | 126,104 | |
5,610 | | @ | | Philippine Long Distance Telephone Co. | | 326,522 | |
| | | | | | 452,626 | |
| | | | Poland: 0.4% | | | |
9,259 | | | | KGHM Polska Miedz S.A. | | 541,738 | |
53,981 | | | | Telekomunikacja Polska S.A. | | 298,266 | |
| | | | | | 840,004 | |
| | | | Portugal: 0.4% | | | |
10,875 | | | | Banco Espirito Santo S.A. | | 41,822 | |
17,683 | | | | Brisa-Auto Estradas de Portugal S.A. | | 123,344 | |
14,247 | | | | Cimpor Cimentos de Portugal SG | | 96,535 | |
84,905 | | | | Energias de Portugal S.A. | | 282,700 | |
28,978 | | | | Portugal Telecom SGPS S.A. | | 330,786 | |
| | | | | | 875,187 | |
| | | | Russia: 0.4% | | | |
10,200 | | | | Lukoil-Spon ADR | | 583,644 | |
5,900 | | | | Tatneft GDR | | 195,480 | |
| | | | | | 779,124 | |
| | | | Singapore: 1.0% | | | |
53,000 | | | | ComfortDelgro Corp., Ltd. | | 64,005 | |
39,000 | | | | DBS Group Holdings Ltd. | | 435,301 | |
30,000 | | | | Keppel Corp., Ltd. | | 264,707 | |
8,000 | | | | SembCorp Industries Ltd. | | 32,024 | |
20,000 | | | | SembCorp Marine Ltd. | | 83,668 | |
24,000 | | | | Singapore Exchange Ltd. | | 157,399 | |
39,000 | | | | Singapore Press Holdings Ltd. | | 121,078 | |
75,000 | | | | Singapore Technologies Engineering Ltd. | | 199,848 | |
250,000 | | | | Singapore Telecommunications Ltd. | | 594,086 | |
67,000 | | | | StarHub Ltd. | | 137,589 | |
| | | | | | 2,089,705 | |
| | | | South Africa: 0.7% | | | |
24,761 | | | | African Bank Investments Ltd. | | 145,714 | |
6,900 | | | | Kumba Iron Ore Ltd. | | 445,222 | |
17,151 | | | | Pretoria Portland Cement Co., Ltd. | | 91,000 | |
55,870 | | | | Redefine Properties Ltd. | | 67,792 | |
48,078 | | | | Sanlam Ltd. | | 203,894 | |
25,532 | | | | Standard Bank Group Ltd. | | 416,963 | |
| | | | | | 1,370,585 | |
| | | | South Korea: 0.4% | | | |
5,370 | | @ | | Kangwon Land, Inc. | | 132,334 | |
9,310 | | | | Korea Exchange Bank | | 96,630 | |
4,163 | | @ | | KT Corp. | | 169,070 | |
3,064 | | @ | | KT&G Corp. | | 174,696 | |
9,610 | | @ | | LG Telecom Ltd. | | 60,640 | |
1,725 | | | | SK Telecom Co., Ltd. | | 263,152 | |
| | | | | | 896,522 | |
| | | | Spain: 5.8% | | | |
13,439 | | | | Abertis Infraestructuras S.A. | | 242,620 | |
1,070 | | | | Acciona S.A. | | 75,950 | |
8,807 | | | | ACS Actividades de Construccion y Servicios S.A. | | 412,793 | |
103,204 | | | | Banco Bilbao Vizcaya Argentaria S.A. | | 1,051,781 | |
32,955 | | | | Banco De Sabadell S.A. | | 129,912 | |
20,975 | | | | Banco Espanol de Credito SA (Banesto) | | 173,860 | |
35,441 | | | | Banco Popular Espanol S.A. | | 182,746 | |
240,483 | | | | Banco Santander Central Hispano S.A. | | 2,562,545 | |
8,748 | | | | Banco Santander S.A. | | 93,954 | |
10,504 | | | | Bankinter S.A. | | 58,471 | |
60,779 | | | | Corp. Mapfre S.A. | | 169,431 | |
89,830 | | | | Criteria Caixacorp S.A. | | 479,782 | |
3,869 | | | | Ebro Puleva SA | | 82,086 | |
4,548 | | | | Enagas | | 90,962 | |
2,186 | | | | Ferrovial SA | | 21,831 | |
4,054 | | | | Fomento de Construcciones y Contratas S.A. | | 106,765 | |
30,876 | | | | Gas Natural SDG S.A. | | 475,643 | |
4,562 | | | | Grifols S.A. | | 62,353 | |
144,946 | | | | Iberdrola S.A. | | 1,123,855 | |
1,170 | | | | Indra Sistemas S.A. | | 20,054 | |
1,877 | | | | Red Electrica de Espana | | 88,485 | |
31,013 | | | | Repsol YPF S.A. | | 868,476 | |
144,802 | | | | Telefonica S.A. | | 3,305,836 | |
6,689 | | | | Zardoya-Otis S.A. | | 94,347 | |
| | | | | | 11,974,538 | |
| | | | Sweden: 1.5% | | | |
1,561 | | | | Hakon Invest AB | | 27,332 | |
26,824 | | | | Hennes & Mauritz AB | | 893,375 | |
957 | | | | Investor AB | | 19,783 | |
55,255 | | | | Nordea Bank AB | | 600,779 | |
3,160 | | | | Ratos AB | | 116,833 | |
7,319 | | | | Securitas AB | | 85,705 | |
11,362 | | | | Skanska AB | | 225,248 | |
6,443 | | | | Svenska Cellulosa AB - B Shares | | 101,728 | |
12,239 | | | | Svenska Handelsbanken AB | | 391,226 | |
81,732 | | | | TeliaSonera AB | | 648,842 | |
| | | | | | 3,110,851 | |
| | | | Switzerland: 3.4% | | | |
1,138 | | | | Baloise Holding AG | | 110,700 | |
475 | | | | BKW FMB Energie AG | | 35,917 | |
20,870 | | | | Credit Suisse Group | | 840,538 | |
619 | | | | Geberit AG - Reg | | 143,127 | |
42,718 | | | | Novartis AG | | 2,514,621 | |
10,860 | | | | Roche Holding AG - Genusschein | | 1,591,998 | |
101 | | | | SGS S.A. | | 169,515 | |
1,261 | | | | Swisscom AG | | 554,319 | |
3,948 | | | | Zurich Financial Services AG | | 1,022,401 | |
| | | | | | 6,983,136 | |
| | | | Taiwan: 2.0% | | | |
97,850 | | | | Asia Cement Corp. | | 108,188 | |
15,900 | | | | Asustek Computer, Inc. | | 151,011 | |
272,228 | | | | China Steel Corp. | | 312,684 | |
254,592 | | | | Chunghwa Telecom Co., Ltd. | | 647,556 | |
103,720 | | | | Compal Electronics, Inc. | | 137,406 | |
110,159 | | | | Far EasTone Telecommunications Co., Ltd. | | 159,769 | |
20,002 | | | | High Tech Computer Corp. | | 616,638 | |
23,114 | | | | Lite-On Technology Corp. | | 31,772 | |
12,000 | | | | Nan Ya Printed Circuit Board Corp. | | 44,633 | |
82,220 | | | | Quanta Computer, Inc. | | 172,503 | |
108,560 | | | | Siliconware Precision Industries Co. | | 130,028 | |
89,000 | | | | Taiwan Cement Corp. | | 100,095 | |
83,000 | | | | Taiwan Mobile Co., Ltd. | | 198,350 | |
513,427 | | | | Taiwan Semiconductor Manufacturing Co., Ltd. | | 1,249,835 | |
| | | | | | 4,060,468 | |
| | | | Thailand: 0.3% | | | |
92,900 | | | | Advanced Info Service PCL | | 261,968 | |
57,500 | | | | Charoen Pokphand Foods PCL | | 47,071 | |
193,900 | | | | IRPC PCL | | 41,766 | |
57,200 | | | | PTT Aromatics & Refining PCL | | 72,496 | |
60,600 | | | | Thai Oil PCL | | 156,951 | |
54,300 | | | | Total Access Communication PCL | | 75,677 | |
| | | | | | 655,929 | |
| | | | Turkey: 0.7% | | | |
22,510 | | | | Ford Otomotiv Sanayi A/S | | 189,863 | |
10,669 | | | | Tupras Turkiye Petrol Rafine | | 266,393 | |
120,935 | | | | Turk Telekomunikasyon AS | | 508,558 | |
47,560 | | | | Turkcell Iletisim Hizmet AS | | 324,750 | |
60,237 | | | | Turkiye Is Bankasi | | 213,964 | |
| | | | | | 1,503,528 | |
| | | | United Kingdom: 11.0% | | | |
26,554 | | | | Aberdeen Asset Management PLC | | 84,262 | |
6,816 | | | | Admiral Group PLC | | 161,215 | |
15,926 | | | | Amlin PLC | | 101,673 | |
14,161 | | | | Ashmore Group PLC | | 74,127 | |
31,809 | | | | AstraZeneca PLC | | 1,449,675 | |
83,271 | | | | Aviva PLC | | 511,854 | |
84,352 | | | | BAE Systems PLC | | 434,479 | |
8,988 | | | | Balfour Beatty PLC | | 43,950 | |
40,597 | | | | British American Tobacco PLC | | 1,561,603 | |
22,946 | | | | British Sky Broadcasting PLC | | 263,303 | |
180,228 | | | | Cable & Wireless Communications PLC | | 137,029 | |
105,045 | | | | Centrica PLC | | 544,269 | |
37,957 | | | | Diageo PLC | | 703,267 | |
15,619 | | | | Firstgroup PLC | | 97,181 | |
124,731 | | | | GlaxoSmithKline PLC | | 2,418,885 | |
11,448 | | | | Hargreaves Lansdown PLC | | 104,737 | |
39,863 | | | | Hays PLC | | 80,491 | |
22,012 | | | | Home Retail Group | | 65,047 | |
272,919 | | | | HSBC Holdings PLC | | 2,789,263 | |
15,582 | | | | ICAP PLC | | 130,289 | |
18,074 | | | | Imperial Tobacco Group PLC | | 555,587 | |
30,890 | | | | International Power PLC | | 211,547 | |
32,131 | | | | J Sainsbury PLC | | 188,765 | |
141,994 | | | | Legal & General Group PLC | | 215,055 | |
90,593 | | | | Man Group PLC | | 420,069 | |
83,865 | | | | National Grid PLC | | 724,865 | |
2,242 | | | | Next PLC | | 69,244 | |
17,672 | | | | Pearson PLC | | 278,495 | |
5,364 | | | | Pennon Group PLC | | 53,637 | |
41,427 | | | | Prudential PLC | | 432,796 | |
10,424 | | | | Reckitt Benckiser PLC | | 573,473 | |
21,071 | | | | Reed Elsevier PLC | | 177,986 | |
10,672 | | | | Rexam PLC | | 55,423 | |
103,175 | | | | Royal & Sun Alliance Insurance Group | | 201,709 | |
7,323 | | | | Sage Group PLC | | 31,280 | |
26,194 | | | | Scottish & Southern Energy PLC | | 500,363 | |
8,169 | | | | Severn Trent PLC | | 188,865 | |
7,507 | | | | Smiths Group PLC | | 145,933 | |
58,790 | | | | Standard Life PLC | | 198,555 | |
17,980 | | | | Tate & Lyle PLC | | 145,697 | |
112,758 | | | | Tesco PLC | | 747,700 | |
20,238 | | | | Thomas Cook Group PLC | | 59,907 | |
22,643 | | | | TUI Travel PLC | | 87,260 | |
20,578 | | | | Unilever PLC | | 632,076 | |
27,045 | | | | United Utilities Group PLC | | 250,212 | |
1,429,239 | | | | Vodafone Group PLC | | 3,751,951 | |
37,473 | | | | WM Morrison Supermarkets PLC | | 156,564 | |
| | | | | | 22,811,613 | |
| | | | United States: 18.7% | | | |
19,900 | | | | Abbott Laboratories | | 953,409 | |
2,700 | | | | Alliant Energy Corp. | | 99,279 | |
58,450 | | | | Altria Group, Inc. | | 1,439,039 | |
7,550 | | | | Ameren Corp. | | 212,835 | |
9,700 | | | | American Electric Power Co., Inc. | | 349,006 | |
200 | | | | American Water Works Co., Inc. | | 5,058 | |
500 | | | | Ares Capital Corp. | | 8,240 | |
154,050 | | | | AT&T, Inc. | | 4,525,980 | |
2,600 | | | | Avery Dennison Corp. | | 110,084 | |
37,700 | | | | Bristol-Myers Squibb Co. | | 998,296 | |
905 | | | | Capitol Federal Financial, Inc. | | 10,779 | |
9,400 | | | | CenterPoint Energy, Inc. | | 147,768 | |
7,843 | | | | CenturyTel, Inc. | | 362,111 | |
29,300 | | | | Chevron Corp. | | 2,673,625 | |
4,700 | | | | Cincinnati Financial Corp. | | 148,943 | |
21,300 | | | | ConocoPhillips | | 1,450,530 | |
6,650 | | | | Consolidated Edison, Inc. | | 329,641 | |
5,900 | | | | Diamond Offshore Drilling | | 394,533 | |
11,400 | | | | Dominion Resources, Inc. | | 487,008 | |
2,500 | | | | DPL, Inc. | | 64,275 | |
4,000 | | | | DTE Energy Co. | | 181,280 | |
31,950 | | | | Duke Energy Corp. | | 569,030 | |
6,300 | | | | Edison International | | 243,180 | |
16,950 | | | | EI Du Pont de Nemours & Co. | | 845,466 | |
25,250 | | | | Eli Lilly & Co. | | 884,760 | |
2,400 | | | | Entergy Corp. | | 169,992 | |
12,300 | | | | Exelon Corp. | | 512,172 | |
5,800 | | | | Fidelity National Title Group, Inc. | | 79,344 | |
7,800 | | | | FirstEnergy Corp. | | 288,756 | |
35,976 | | | | Frontier Communications Corp. | | 350,046 | |
3,250 | | | | Genuine Parts Co. | | 166,855 | |
2,100 | | | | H&R Block, Inc. | | 25,011 | |
5,700 | | | | HJ Heinz Co. | | 281,922 | |
5,400 | | | | Hudson City Bancorp., Inc. | | 68,796 | |
2,750 | | | | Integrys Energy Group, Inc. | | 133,403 | |
7,300 | | | | Kimberly-Clark Corp. | | 460,192 | |
25,650 | | | | Kraft Foods, Inc. | | 808,232 | |
4,500 | | | | Leggett & Platt, Inc. | | 102,420 | |
3,700 | | | | Lorillard, Inc. | | 303,622 | |
2,200 | | | | M&T Bank Corp. | | 191,510 | |
8,000 | | | | Marsh & McLennan Cos., Inc. | | 218,720 | |
6,500 | | | | Mattel, Inc. | | 165,295 | |
6,100 | | | | Maxim Integrated Products | | 144,082 | |
15,800 | | | | McDonald’s Corp. | | 1,212,808 | |
4,100 | | | | MeadWestvaco Corp. | | 107,256 | |
44,600 | | | | Merck & Co., Inc. | | 1,607,384 | |
4,400 | | | | Microchip Technology, Inc. | | 150,524 | |
12,850 | | | | New York Community Bancorp., Inc. | | 242,223 | |
5,100 | | | | NextEra Energy, Inc. | | 265,149 | |
8,800 | | | | NiSource, Inc. | | 155,056 | |
600 | | | | Northeast Utilities | | 19,128 | |
1,400 | | | | NSTAR | | 59,066 | |
2,400 | | | | NYSE Euronext | | 71,952 | |
2,100 | | | | OGE Energy Corp. | | 95,634 | |
6,500 | | | | Old Republic International Corp. | | 88,595 | |
2,000 | | | | Oneok, Inc. | | 110,940 | |
6,250 | | | | Pacific Gas & Electric Co. | | 299,000 | |
4,950 | | | | Paychex, Inc. | | 153,005 | |
3,400 | | | | People’s United Financial, Inc. | | 47,634 | |
7,000 | | | | Pepco Holdings, Inc. | | 127,750 | |
138,400 | | | | Pfizer, Inc. | | 2,423,384 | |
39,200 | | | | Philip Morris International, Inc. | | 2,294,376 | |
2,400 | | | | Pinnacle West Capital Corp. | | 99,480 | |
5,500 | | | | Pitney Bowes, Inc. | | 132,990 | |
6,000 | | | | PPL Corp. | | 157,920 | |
7,200 | | | | Progress Energy, Inc. | | 313,056 | |
6,600 | | | | Public Service Enterprise Group, Inc. | | 209,946 | |
50,800 | | | | Qwest Communications International, Inc. | | 386,588 | |
17,600 | | | | Reynolds American, Inc. | | 574,112 | |
6,200 | | | | RR Donnelley & Sons Co. | | 108,314 | |
2,900 | | | | SCANA Corp. | | 117,740 | |
17,150 | | | | Southern Co. | | 655,645 | |
14,300 | | | | Southern Copper Corp. | | 696,982 | |
14,100 | | | | Spectra Energy Corp. | | 352,359 | |
5,700 | | | | TECO Energy, Inc. | | 101,460 | |
72,600 | | | | Verizon Communications, Inc. | | 2,597,628 | |
6,000 | | | | Waste Management, Inc. | | 221,220 | |
19,950 | | | | Windstream Corp. | | 278,103 | |
9,650 | | | | Xcel Energy, Inc. | | 227,258 | |
| | | | | | 38,726,190 | |
| | | | Total Common Stock
(Cost $188,223,627) | | 201,058,551 | |
| | | | | | | |
REAL ESTATE INVESTMENT TRUSTS: 1.4% | | | |
| | | | Canada: 0.1% | | | |
9,348 | | | | RioCan Real Estate Investment Trust | | 206,835 | |
| | | | | | 206,835 | |
| | | | France: 0.2% | | | |
1,404 | | | | ICADE | | 143,365 | |
5,067 | | | | Klepierre | | 183,008 | |
| | | | | | 326,373 | |
| | | | United Kingdom: 0.1% | | | |
15,732 | | | | British Land Co. PLC | | 129,136 | |
28,562 | | | | Segro PLC | | 127,892 | |
| | | | | | 257,028 | |
| | | | United States: 1.0% | | | |
3,000 | | | | AMB Property Corp. | | 95,130 | |
1,700 | | | | AvalonBay Communities, Inc. | | 191,335 | |
9,100 | | | | Duke Realty Corp. | | 113,386 | |
1,200 | | | | Federal Realty Investment Trust | | 93,516 | |
7,700 | | | | HCP, Inc. | | 283,283 | |
3,300 | | | | Health Care Real Estate Investment Trust, Inc. | | 157,212 | |
3,600 | | | | Liberty Property Trust | | 114,912 | |
900 | | | | Macerich Co. | | 42,633 | |
100 | | | | Mack-Cali Realty Corp. | | 3,306 | |
2,800 | | | | Nationwide Health Properties, Inc. | | 101,864 | |
3,800 | | | | Plum Creek Timber Co., Inc. | | 142,310 | |
14,700 | | | | Prologis | | 212,268 | |
2,300 | | | | Rayonier, Inc. | | 120,796 | |
3,000 | | | | Realty Income Corp. | | 102,600 | |
2,200 | | | | Regency Centers Corp. | | 92,928 | |
3,900 | | | | Senior Housing Properties Trust | | 85,566 | |
3,600 | | | | Ventas, Inc. | | 188,928 | |
| | | | | | 2,141,973 | |
| | | | Total Real Estate Investment Trusts
(Cost $2,365,577) | | 2,932,209 | |
| | | | | | | |
EXCHANGE-TRADED FUNDS: 0.7% | | | |
| | | | Developed Markets: 0.4% | | | |
16,400 | | | | iShares MSCI EAFE Index Fund | | 954,972 | |
| | | | | | 954,972 | |
| | | | Emerging Markets: 0.1% | | | |
3,700 | | | | iShares MSCI Emerging Markets Index Fund | | 176,194 | |
| | | | | | 176,194 | |
| | | | United States: 0.2% | | | |
6,200 | | | | iShares S&P 500 Value Index Fund | | 369,458 | |
| | | | | | 369,458 | |
| | | | Total Exchange-Traded Funds
(Cost $1,472,092) | | 1,500,624 | |
| | | | | | | |
WARRANTS: 0.0% | | | |
| | | | France: 0.0% | | | |
6,355 | | | | Etablissements Maurel et Prom | | 1,469 | |
| | | | | | 1,469 | |
| | | | Italy: 0.0% | | | |
26,581 | | | | Mediobanca S.p.A. | | 195 | |
| | | | | | 195 | |
| | | | Total Warrants
(Cost $1,226) | | 1,664 | |
| | | | | | | |
| | | | Total Investments in Securities
(Cost $192,062,522) * | 99.3 | % | $ | 205,493,048 | |
| | | | Other Assets and Liabilities - Net | 0.7 | | 1,418,527 | |
| | | | Net Assets | 100.0 | % | $ | 206,911,575 | |
| | @ | | Non-income producing security | | | |
| | ADR | | American Depositary Receipt | | | |
| | GDR | | Global Depositary Receipt | | | |
Item 7. Disclosure of Proxy Voting Policies and Procedures for Closed-End Management Investment Companies.
Not applicable.
Item 8. Portfolio Managers of Closed-End Management Investment Companies.
Not applicable.
Item 9. Purchases of Equity Securities by Closed-End Management Investment Company and Affiliated Purchasers
Not applicable.
Item 10. Submission of Matters to a Vote of Security Holders.
The Nominating Committee operates pursuant to a Charter approved by the Board. The primary purpose of the Nominating Committee is to consider, evaluate and make recommendations to the Board with respect to the nomination and selection of Independent Trustees. In evaluating candidates, the Nominating Committee may consider a variety of factors, but specific qualifications of candidates for Board membership will be based on the needs of the Board at the time of nomination.
The Nominating Committee is willing to consider nominations received from shareholders and shall assess shareholder nominees in the same manner as it reviews nominees it identifies. A shareholder nominee for director should be submitted in writing to the Fund’s Secretary. Any such shareholder nomination should include sufficient background information concerning the candidate and should be received in a timely manner. At a minimum, the following information as to each individual proposed for nomination as director should be included: the individual’s written consent to be named in the proxy statement as a nominee (if nominated) and to serve as a director (if elected), and all information relating to such individual that is required to be disclosed in a solicitation of proxies for election of directors, or is otherwise required, in each case under applicable federal securities laws, rules and regulations.
The Secretary shall submit all nominations received in a timely manner to the Nominating Committee. To be timely, any such submission must be delivered to the Fund’s Secretary not earlier than the 90th day prior to such meeting and not later than the close of business on the later of the 60th day prior to such meeting or the 10th day following the day on which public announcement of the date of the meeting is first made, by either disclosure in a press release or in a document publicly filed by the Fund with the SEC.
In evaluating a candidate for the position of Independent Trustee, including any candidate recommended by shareholders of the Fund, the Nominating Committee shall consider the following: (i) the candidate’s knowledge in matters relating to the mutual fund industry; (ii) any experience possessed by the candidate as a director or senior officer of other public companies; (iii) the candidate’s educational background, reputation for high ethical standards and professional integrity; (iv) any specific financial, technical or other expertise possessed by the candidate, and the extent to which such expertise would complement the Board’s existing mix of skills, core competencies and qualifications; (v) the candidate’s perceived ability to contribute to the ongoing functions of the Board, including the candidate’s ability and commitment to attend meetings regularly and work collaboratively with other members of the Board; (vi) the candidate’s ability to qualify as an Independent Trustee for purposes of the 1940 Act; and (vii) such other factors as the Committee determines to be relevant in light of the existing composition of the Board and any anticipated vacancies. Prior to making a final recommendation to the Board, the Committee shall conduct personal interviews with those candidates it concludes are the most qualified candidates.
Item 11. Controls and Procedures.
(a) Based on our evaluation conducted within 90 days of the filing date, hereof, the design and operation of the registrant’s disclosure controls and procedures are effective to ensure that material information relating to the registrant is made known to the certifying officers by others within the appropriate entities, particularly during the period in which Forms N-CSR are being prepared, and the registrant’s disclosure controls and procedures allow timely preparation and review of the information for the registrant’s Form N-CSR and the officer certifications of such Form N-CSR.
(b) There were no significant changes in the registrant’s internal controls that occurred during the second fiscal quarter of the period covered by this report that has materially affected, or is reasonably likely to materially affect, the registrant’s internal control over financial reporting.
Item 12. Exhibits.
(a)(1) | | Code of Ethics pursuant to Item 2 of Form N-CSR is filed and attached hereto as EX-99.CODE ETH. |
| | |
(a)(2) | | A separate certification for each principal executive officer and principal financial officer of the registrant as required by Rule 30a-2 under the Act (17 CFR 270.30a-2) is attached hereto as EX-99.CERT. |
| | |
(b) | | The officer certifications required by Section 906 of the Sarbanes-Oxley Act of 2002 are attached hereto as EX-99.906CERT |
| | |
(3) | | Not applicable. |
15
SIGNATURES
Pursuant to the requirements of the Securities Exchange Act of 1934 and the Investment Company Act of 1940, the registrant has duly caused this report to be signed on its behalf by the undersigned, thereunto duly authorized.
(Registrant): ING Variable Portfolios, Inc.
By | | |
| Shaun P. Mathews | |
| President and Chief Executive Officer | |
| | |
Date: | March 7, 2011 | |
Pursuant to the requirements of the Securities Exchange Act of 1934 and the Investment Company Act of 1940, this report has been signed below by the following persons on behalf of the registrant and in the capacities and on the dates indicated.
By | | |
| Shaun P. Mathews | |
| President and Chief Executive Officer | |
| | |
Date: | March 7, 2011 | |
By | | |
| Todd Modic | |
| Senior Vice President and Chief Financial Officer | |
| | |
Date: | March 7, 2011 | |
16