OMB APPROVAL
OMB Number: 3235-0570
Expires: August 31, 2011
Estimated average burden hours per response: 18.9
UNITED STATES
SECURITIES AND EXCHANGE COMMISSION
Washington, D.C. 20549
FORM N-CSR
CERTIFIED SHAREHOLDER REPORT OF
REGISTERED MANAGEMENT INVESTMENT COMPANIES
Investment Company Act file number: 811-07651
ING VP Variable Portfolios, Inc.
(Exact name of registrant as specified in charter)
7337 E. Doubletree Ranch Rd., Scottsdale, AZ | | 85258 |
(Address of principal executive offices) | | (Zip code) |
The Corporation Trust Incorporated, 300 E. Lombard Street, Baltimore, MD 21201
(Name and address of agent for service)
Registrant’s telephone number, including area code: 1-800-992-0180
Date of fiscal year end: | December 31 |
| |
Date of reporting period: | January 1, 2008 to December 31, 2008 |
ITEM 1. REPORTS TO STOCKHOLDERS.
The following is a copy of the report transmitted to stockholders pursuant to Rule 30e-1 under the Act (17 CFR 270.30e-1):

Annual Report
December 31, 2008
Classes ADV, I and S
ING Variable Product Funds
Domestic Equity and Income Portfolios
n ING VP Balanced Portfolio
n ING VP Growth and Income Portfolio
Domestic Equity Growth Portfolios
n ING Opportunistic LargeCap Growth Portfolio (formerly, ING VP Growth Portfolio)
n ING VP Small Company Portfolio
Domestic Equity Value Portfolio
n ING Opportunistic LargeCap Value Portfolio (formerly, ING VP Value Opportunity Portfolio)
Fixed-Income Portfolios
n ING VP Intermediate Bond Portfolio
n ING VP Money Market Portfolio
Global Equity Portfolio
n ING BlackRock Global Science and Technology Portfolio (formerly, ING VP Global Science and Technology Portfolio)
 E-Delivery Sign-up – details inside
This report is submitted for general information to shareholders of the ING Funds. It is not authorized for distribution to prospective shareholders unless accompanied or preceded by a prospectus which includes details regarding the funds' investment objectives, risks, charges, expenses and other information. This information should be read carefully.
MUTUAL FUNDS

TABLE OF CONTENTS
| President's Letter | | | 1 | | |
|
| Market Perspective | | | 2 | | |
|
| Portfolio Managers' Reports | | | 4 | | |
|
| Shareholder Expense Examples | | | 19 | | |
|
| Report of Independent Registered Public Accounting Firm | | | 21 | | |
|
| Statements of Assets and Liabilities | | | 22 | | |
|
| Statements of Operations | | | 26 | | |
|
| Statements of Changes in Net Assets | | | 28 | | |
|
| Financial Highlights | | | 32 | | |
|
| Notes to Financial Statements | | | 35 | | |
|
| Portfolios of Investments | | | 54 | | |
|
| Tax Information | | | 113 | | |
|
| Director/Trustee and Officer Information | | | 114 | | |
|
| Advisory Contract Approval Discussion | | | 119 | | |
|
 Go Paperless with E-Delivery!
Sign up now for on-line prospectuses, fund reports, and proxy statements. In less than five minutes, you can help reduce paper mail and lower fund costs.
Just go to www.ingfunds.com, click on the E-Delivery icon from the home page, follow the directions and complete the quick 5 Steps to Enroll.
You will be notified by e-mail when these communications become available on the internet. Documents that are not available on the internet will continue to be sent by mail.
PROXY VOTING INFORMATION
A description of the policies and procedures that the Portfolios use to determine how to vote proxies related to portfolio securities is available: (1) without charge, upon request, by calling Shareholder Services toll-free at (800) 992-0180; (2) on the ING Funds' website at www.ingfunds.com; and (3) on the U.S. Securities and Exchange Commission's (the "SEC") website at www.sec.gov. Information regarding how the Portfolios voted proxies related to portfolio securities during the most recent 12-month period ended June 30 is available without charge on the ING Funds' website at www.ingfunds.com and on the SEC's website at www.sec.gov.
QUARTERLY PORTFOLIO HOLDINGS
The Portfolios file their complete schedule of portfolio holdings with the SEC for the first and third quarters of each fiscal year on Form N-Q. The Portfolios' Forms N-Q are available on the SEC's website at www.sec.gov. The Portfolios' Forms N-Q may be reviewed and copied at the SEC's Public Reference Room in Washington, DC, and information on the operation of the Public Reference Room may be obtained by calling (800) SEC-0330; and is available upon request from the Portfolios by calling Shareholder Services toll-free at (800) 992-0180.
(THIS PAGE INTENTIONALLY LEFT BLANK)
PRESIDENT'S LETTER

Dear Shareholders,
We are in the midst of one of the most challenging periods ever faced by investors, and we at ING Funds are aware of the anxiety that you may be feeling at this time.
I want to assure you that we are actively engaged in monitoring the situation and are committed to keeping you fully informed of how the rapidly unfolding events around us may impact your investments with our company.
We recognize that the confidence of many investors is being tested, perhaps as never before. It is understandable that some of you may be second guessing your investment strategy due to these recent events. We encourage you to work with your investment professional and seek out their advice about your portfolio in light of the current conditions. But we also urge investors not to make rash decisions. ING Funds still believes that a well-diversified, globally allocated portfolio remains the most effective investment strategy of all. We ask that investors not lose sight of their commitment to the long-term.
We thank you for your support and confidence and we look forward to continuing to do business with you in the future.
Sincerely,

Shaun Mathews
President & Chief Executive Officer
ING Funds
January 23, 2009
The views expressed in the President's Letter reflect those of the President as of the date of the letter. Any such views are subject to change at any time based upon market or other conditions and ING Funds disclaims any responsibility to update such views. These views may not be relied on as investment advice and because investment decisions for an ING Fund are based on numerous factors, may not be relied on as an indication of investment intent on behalf of any ING Fund. Reference to specific company securities should not be construed as recommendations or investment advice. Consider the fund's investment objectives, risks, and charges and expenses carefully before investing. The prospectus contains this information and other information about the fund.
International investing poses special risks including currency fluctuation, economic and political risks not found in investments that are solely domestic.
1
MARKET PERSPECTIVE: YEAR ENDED DECEMBER 31, 2008
In our semi-annual report, we described a failed second quarter rally that fizzled when investors realized that borderline recessionary conditions and a credit crunch had not gone away. By year-end, governments were committing previously unimaginable sums of taxpayer money to prevent systemic collapse. Global equities in the form of the MSCI World® Index(1) measured in local currencies, including net reinvested dividends ("MSCI" for regions discussed below) plunged 29.70% in the six months ended December 31, 2008 (down 38.70% for the entire fiscal year). (The MSCI World® Index plunged 40.71% for the entire fiscal year, measured in U.S. dollars.) In currencies, the dollar at first drifted near record lows against the euro. But the tide turned in mid-July and for the six months ended December 31, 2008, the dollar strengthened by 12.10% (4.50% for the entire fiscal year). The dollar also soared 37.80% against the pound for the six months ended December 31, 2008 (37.90% for the entire fiscal year). But the yen advanced as carry trades (essentially short yen positions) were unwound and the dollar fell 14.90% for the six months ended December 31, 2008 (down 19.60% for the entire fiscal year).
Even more dramatic was the price of oil which marched to an all-time high of around $147 per barrel in mid-July, only to lose more than two thirds of that price by December 31, 2008.
The economic statistics remained bleak. By the end of October, the Standard & Poor's ("S&P")/Case-Shiller National U.S. Home Price Index(2) of house prices had fallen a record 18% over the year. New home sales were at 1991 levels. Some 45% of existing home sales were distressed.
Payrolls declined in every month of 2008, as the number of people claiming unemployment reached 4.1 million, a 26-year high. Gross domestic product ("GDP") fell at an annualized rate of 0.50% in the third quarter, and the National Bureau of Economic Research announced that the recession had actually started in December 2007.
Yet these were side-shows to the fireworks display in the financial sector, where major institutions — hanging by a thread through problems rooted in unwise mortgage borrowing, lending and investment — met different fates in September 2008 at the hands of the U.S. government.
The Federal National Mortgage Association ("Fannie Mae") and the Federal Home Loan Mortgage Corporation ("Freddie Mac") were taken into "conservatorship." Merrill Lynch was acquired by the Bank of America with a wink from the authorities. AIG received an $85 billion loan from a reluctant government, which also took a 79.90% equity stake in AIG. But Lehman Brothers having sought capital, then a buyer, found neither and was left to file for Chapter 11 bankruptcy protection.
The U.S. government was now in the position of choosing winners and losers among financial institutions: none too successfully, for it quickly became obvious that by pointedly leaving Lehman Brothers to go under, a credit crisis had become a credit market collapse. Lending all but seized up.
Policy response was huge but at least initially muddled. A Troubled Asset Relief Plan ("TARP") would set up a $700 billion fund to buy illiquid mortgage securities from financial institutions. But on November 12, 2008 with half of the money already used to recapitalize banks, Treasury Secretary Paulson announced that the rest of the funds would not be used to buy illiquid mortgage securities after all. This merely renewed the pressure on the holders of such securities like Citigroup, which within two weeks received guarantees from the government against losses and another $20 billion in capital.
Other programs were of more practical use, like support for the commercial paper market and a guarantee facility for money market funds. Arguably the most effective measure was the announced intention to buy vast quantities of agency mortgage-backed securities and debentures. This had the effect of driving down rates on the 30-year mortgage towards 5.00%, a record low. In the meantime, the newly-elected president promised a stimulus package worth approximately $1 trillion. And by year end, the Federal Open Market Committee ("FOMC") reduced interest rates to a range of between 0% and 0.25%.
2008 ended with much gloom and bad news still to come, but the platform for recovery was perhaps taking shape.
In U.S. fixed-income markets, yields on the 90-day Treasury Bills briefly turned negative in December 2008, while the yield on the ten-year Treasury Note fell below 2.50%, something we had not seen in 50 years. The Barclays Capital U.S. Aggregate Bond Index(3), formerly known as the Lehman Brothers U.S. Aggregate Bond Index, of investment grade bonds returned 4.10% for the six months ended December 31, 2008, (5.20% for the
2
MARKET PERSPECTIVE: YEAR ENDED DECEMBER 31, 2008
entire fiscal year). By contrast, high yield bonds, represented by the Barclays Capital High Yield Bond — 2% Issuer Constrained Composite Index(4), formerly known as the Lehman Brothers High Yield Bond — 2% Issuer Constrained Composite Index, behaved more like a stock index and returned (25.10)% for the six months ended December 31, 2008 (down 25.90% for the entire fiscal year).
U.S. equities, represented by the S&P 500® Composite Stock Price ("S&P 500®") Index(5), including dividends, returned (28.50)% for the six months ended December 31, 2008, (down 37.00% for the entire fiscal year), increasingly unimpressed by sharply falling oil prices. Profits for S&P 500® Index companies suffered their fifth straight quarter of decline, led again by the financials sector, although taxpayer money was also potentially committed to save the big three auto make rs from bankruptcy. On November 20, 2008, the S&P 500® Index plumbed a level not seen since April 1997, before a December recovery.
In international markets, plainly entering recession, the MSCI Japan® Index(6) slumped 35.90% for the six months ended December 31, 2008, (down 42.60% for the entire fiscal year). The strengthening yen hit exports in an export-dependent economy even as global demand slowed for other reasons. The MSCI Europe ex UK® Index(7) sagged 29.40% for the six months ended December 31, 2008 (down 43.20% for the entir e fiscal year), beset by sharply falling economic activity and a European Central Bank in denial that inflation was falling fast. Finally, rates were reduced by an unprecedented 175 basis points (or 1.75%) in two months near the end of the year while governments, one after the other, proposed large stimulus packages. In the UK, the MSCI UK® Index(8) fell 19.40% for the six months ended December 31, 2008 (down 28.50% for the entire fiscal year). The UK had allowed a bigger housing bubble than the United States and deeper personal indebtedness in an economy more dependent on the financial sector. Rates were reduced to 1951 levels as venerable banks ceased to exist as independent entities.
(1) The MSCI World® Index is an unmanaged index that measures the performance of over 1,400 securities listed on exchanges in the U.S., Europe, Canada, Australia, New Zealand and the Far East.
(2) The S&P/Case-Shiller National U.S. Home Price Index tracks the value of single-family housing within the United States. The index is a composite of single-family home price indices for the nine U.S. Census divisions and is calculated quarterly.
(3) The Barclays Capital U.S. Aggregate Bond Index is an unmanaged index of publicly issued investment grade U.S. Government, mortgage-backed, asset-backed and corporate debt securities.
(4) The Barclays Capital High Yield Bond — 2% Issuer Constrained Composite Index is an unmanaged index that measures the performance of non-investment grade fixed-income securities.
(5) The S&P 500® Index is an unmanaged index that measures the performance of securities of approximately 500 of the largest companies in the United States.
(6) The MSCI Japan® Index is a free float-adjusted market capitalization index that is designed to measure developed market equity performance in Japan.
(7) The MSCI Europe ex UK® Index is a free float-adjusted market capitalization index that is designed to measure developed market equity performance in Europe, excluding the UK.
(8) The MSCI UK® Index is a free float-adjusted market capitalization index that is designed to measure developed market equity performance in the UK.
All indices are unmanaged and investors cannot invest directly in an index.
Past performance does not guarantee future results. The performance quoted represents past performance. Investment return and principal value of an investment will fluctuate, and shares, when redeemed, may be worth more or less than their original cost. The Portfolios' performance is subject to change since the period's end and may be lower or higher than the performance data shown. Please call (800) 992-0180 or log on to www.ingfunds.com to obtain performance data current to the most recent month end.
Market Perspective reflects the views of ING's Chief Investment Risk Officer only through the end of the period, and is subject to change based on market and other conditions.
3
ING VP BALANCED PORTFOLIO
PORTFOLIO MANAGERS' REPORT
ING VP Balanced Portfolio (the "Portfolio") seeks to maximize investment return consistent with reasonable safety of principal, by investing in a diversified portfolio of one or more of the following asset classes: stocks, bonds and cash equivalents, based on the judgment of the Portfolio's management, of which of those sectors or mix thereof offers the best investment prospects. The Portfolio is managed by Omar Aguilar, Ph.D., James Kauffmann and Paul Zemsky, Portfolio Managers*, of ING Investment Management Co. — the Sub-Adviser.
Performance: For the year ended December 31, 2008, the Portfolio's Class I shares provided a total return of (28.10)% compared to the Standard & Poor's 500® Composite Stock Price Index(1) ("S&P 500® Index"), the Barclays Capital U.S. Aggregate Bond Index**(2) and the Composite Index(3) (60% S&P 500® Index/40% Barclays Capital U.S. Aggregate Bond Index), which returned (37.00)%, 5.24% and (22.06)%, respectively, for the same period.
Portfolio Specifics: Asset allocation results had a modest positive impact on performance of the Portfolio during 2008, mainly due to our defensive cash positioning.
The performance of the domestic equity portion of the Portfolio was in line with the S&P 500® Index. Stock selection in the larger-cap stocks proved most successful during the year. Selection in the smallest-cap stocks added value, whereas both an average overweight position and stock selection within the mid-cap names detracted from performance. Both Amgen, Inc. and BB&T Corp. were strong performers during the year, as well as Bristol-Myers Squibb Co. and AutoZone, Inc.
The year 2008 turned out to be a painful one for investors. Negative absolute returns in all equity classes were the result of a year underscored by a litany of issues: an escalating financial crisis; global recession fears; geopolitics; collapses of storied financial firms; unparalleled levels of market volatility; threat of deflation; and a credit crunch that dried up liquidity in the bond markets. The housing market continues to weaken, industrial production has slowed and unemployment has risen. Intervention from the Federal Reserve Board (the "Fed") and the U.S. Department of the Treasury appears to have slowed down the pace of negative news, but has not, as yet, halted it.
The fixed income portion of the Portfolio underperformed the Barclays Capital U.S. Aggregate Bond Index, in a very difficult year. A large source of underperformance was the Portfolio's underweight in Treasuries, which hurt when investors fled to their relative safety. The Portfolio was also overweight many of the sectors hit hardest by this risk aversion, including financials, corporate bonds and off-benchmark holdings in non-agency residential mortgage-backed securities. The yield curve, duration and currency exposures of the Portfolio were beneficial for the year, but not by a large enough margin to overcome the negative selection effect.
Current Strategy and Outlook: Looking forward, we believe the recession will continue for the next two quarters, with growth resuming in the second half of 2009. We expect headline inflation to decline, and perhaps turn negative, but we don't believe we are in the midst of a deflationary spiral. Finally, we believe a large fiscal stimulus program will be enacted by Congress early in 2009. We ended the year overweight in equity versus fixed income, but would be looking to pare back our equity position until the effects of the fiscal stimulus are more evident.
Allocations between equities and fixed income are dependent on our quantitative asset allocation model, which uses the factors mentioned above and not on a qualitative evaluation of the bond versus the equity markets.
* Effective January 13, 2009, Omar Aguilar, Ph.D. and James Kauffmann are replaced by Vincent Costa, Michael Hyman and Christine Hurtsellers as co-portfolio managers to the Portfolio.
** Formerly known as the Lehman Brothers U.S. Aggregate Bond Index. As of October 31, 2008, all Lehman Brothers indices were renamed: the words "Lehman Brothers" changed to "Barclays Capital."
Portfolio holdings and characteristics are subject to change and may not be representative of current holdings and characteristics. The outlook for this Portfolio may differ from that presented for other ING Funds. Performance for the different classes of shares will vary based on differences in fees associated with each class.
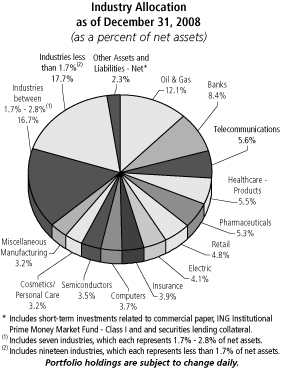
Investment Type Allocation
as of December 31, 2008
(as a percent of net assets)
| Common Stock | | | 61.4 | % | |
| U.S. Government Agency Obligations | | | 12.9 | % | |
| Collateralized Mortgage Obligations | | | 9.8 | % | |
| Corporate Bonds/Notes | | | 9.8 | % | |
| U.S. Treasury Obligations | | | 4.7 | % | |
| Real Estate Investment Trusts | | | 1.4 | % | |
| Asset-Backed Securities | | | 1.2 | % | |
| Municipal Bonds | | | 0.5 | % | |
| Preferred Stock | | | 0.3 | % | |
| Other Assets and Liabilities — Net* | | | (2.0 | )% | |
| Net Assets | | | 100.0 | % | |
* Includes short-term investments related to commercial paper, ING Institutional Prime Money Market Fund — Class I and securities lending collateral.
Portfolio holdings are subject to change daily.
Top Ten Holdings*
as of December 31, 2008
(as a percent of net assets)
| Federal Home Loan Mortgage Corporation, | | | | | |
| 5.500%, due 02/12/37 | | | 3.7 | % | |
| ExxonMobil Corp. | | | 3.1 | % | |
| Federal National Mortgage Association, | | | | | |
| 5.000%, due 01/12/36 | | | 2.1 | % | |
| U.S. Treasury Note, 1.250%, due 11/30/10 | | | 1.9 | % | |
| Federal National Mortgage Association, | | | | | |
| 6.000%, due 02/12/37 | | | 1.2 | % | |
| Hewlett-Packard Co. | | | 1.1 | % | |
| U.S. Treasury Bond, 4.375%, due 02/15/38 | | | 1.1 | % | |
| International Business Machines Corp. | | | 1.0 | % | |
| Wal-Mart Stores, Inc. | | | 1.0 | % | |
| Federal Home Loan Mortgage Corporation, | | | | | |
| 6.000%, due 01/15/29 | | | 1.0 | % | |
* Excludes short-term investments related to securities lending collateral.
Portfolio holdings are subject to change daily.
4
ING VP BALANCED PORTFOLIO
PORTFOLIO MANAGERS' REPORT
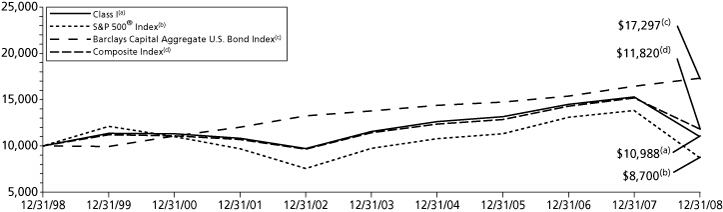
| Average Annual Total Returns for the Periods Ended December 31, 2008 | |
| | | 1 Year | | 5 Year | | 10 Year | | Since Inception
of Class ADV
December 29, 2006 | | Since Inception
of Class S
May 29, 2003 | |
| Class ADV | | | (28.62 | )% | | | — | | | | — | | | | (13.46 | )% | | | — | | |
| Class I | | | (28.10 | )% | | | (0.97 | )% | | | 0.94 | % | | | — | | | | — | | |
| Class S | | | (28.28 | )% | | | (1.25 | )% | | | — | | | | — | | | | 0.66 | % | |
| S&P 500® Index(1) | | | (37.00 | )% | | | (2.19 | )% | | | (1.38 | )% | | | (18.47 | )%(4) | | | 0.77 | %(5) | |
| Barclays Capital Aggregate U.S. Bond Index(2) | | | 5.24 | % | | | 4.65 | % | | | 5.63 | % | | | 6.10 | %(4) | | | 4.15 | %(5) | |
| Composite Index(3) | | | (22.06 | )% | | | 0.71 | % | | | 1.69 | % | | | (9.01 | )%(4) | | | 2.33 | %(5) | |
Based on a $10,000 initial investment, the graph and table above illustrate the total return of ING VP Balanced Portfolio against the indices indicated. An index has no cash in its portfolio, imposes no sales charges and incurs no operating expenses. An investor cannot invest directly in an index. The Portfolio's performance is shown without the imposition of any expenses or charges which are, or may be, imposed under your annuity contract. Total returns would have been lower if such expenses or charges were included.
The performance graph and table do not reflect the deduction of taxes that a shareholder will pay on portfolio distributions or the redemption of portfolio shares.
The performance shown may include the effect of fee waivers and/or expense reimbursements by the Investment Adviser and/or other service providers, which have the effect of increasing total return. Had all fees and expenses been considered, the total returns would have been lower.
The performance update illustrates performance for a variable investment option available through a variable annuity contract. The performance shown indicates past performance and is not a projection or prediction of future results. Actual investment returns and principal value will fluctuate so that shares and/or units, at redemption, may be worth more or less than their original cost. Please call (800) 992-0180 to get performance through the most recent month end.
This report contains statements that may be "forward-looking" statements. Actual results may differ materially from those projected in the "forward-looking" statements.
The views expressed in this report reflect those of the portfolio managers, only through the end of the period as stated on the cover. The portfolio managers' views are subject to change at any time based on market and other conditions.
Portfolio holdings are subject to change daily.
(1) The S&P 500® Index is an unmanaged index that measures the performance of securities of approximately 500 of the largest companies in the U.S.
(2) The Barclays Capital Aggregate U.S. Bond Index is an unmanaged index of publicly issued investment grade U.S. Government, mortgage-backed, asset-backed and corporate debt securities.
(3) The Composite Index consists of 60% of return of (securities included in) the S&P 500® Index and 40% of the return of (securities included in) the Barclays Capital Aggregate U.S. Bond Index.
(4) Since inception performance for the indices is shown from January 1, 2007.
(5) Since inception performance for the indices is shown from June 1, 2003.
Effective March 1, 2002, ING Investments, LLC began serving as investment adviser and ING Investment Management Co., the former investment adviser, began serving as sub-adviser to the Portfolio.
5
ING VP GROWTH AND INCOME PORTFOLIO
PORTFOLIO MANAGERS' REPORT
ING VP Growth and Income Portfolio (the "Portfolio") seeks to maximize total return through investments in a diversified portfolio of common stocks and securities convertible into common stock. It is anticipated that capital appreciation and investment income will both be major factors in achieving total return. The Portfolio is managed by Christopher F. Corapi, Portfolio Manager of ING Investment Management Co. — the Sub-Adviser.
Performance: For the year ended December 31, 2008, the Portfolio's Class I shares provided a total return of (37.63)% compared to the Standard & Poor's 500® Composite Stock Price Index(1) ("S&P 500® Index"), which returned (37.00)% for the same period.
Portfolio Specifics: During this period, the Portfolio was hurt by weak stock selection within the industrials and telecom sectors. Within industrials, our underweight position in United Parcel Service, Inc. ("UPS") detracted from results. UPS held up better than its peers due to its defensive characteristics and attractive dividend yield. Also, Quanta Services, Inc. ("Quanta") declined significantly after a disappointing fourth quarter due to delays in telecom spending. Although some of the projects were pushed out as a result of typical permitting and bureaucratic delays rather than credit-related issues, investors took this as a sign of weakness in the transmission cycle. We continue to believe that the transmission cycle is still alive and believe that Quanta offers a less-cyclical, multi-year growth story at a reasonable price.
Within telecom, the Portfolio's position in Sprint Nextel Corp. ("Sprint") detracted from results during the period. The stock was punished in the fourth quarter due to liquidity concerns. We believe that these concerns were overblown and expect Sprint to be able to stabilize its market share through its continued efforts to improve customer service and reduce costs.
The Portfolio benefited from strong stock selection in the financials, utilities and healthcare sectors. Avoiding or underweighting some of the worst performing financial names, including AIG, the Government-Sponsored Entities ("GSEs") like Fannie Mae and Freddie Mac, and Merrill Lynch, helped relative performance during this period. Our emphasis on companies with lower credit and capital markets exposures, such as life and property/casualty insurers, also contributed to results. Within utilities, investments in NSTAR and Pacific Gas & Electric Co ("PG&E"). held up well due to their defensive characteristics and low exposure to fluctuations in commodity prices.
Abbott Laboratories ("Abbott") and Teva Pharmaceutical Industries Ltd. ("Teva") were two health-care names that aided relative returns. Abbott's diversified business mix and multiple product approvals and launches helped it withstand a pretty brutal market and outperform its peers. Within healthcare, generics were one of the safest places to be this year given limited scrutiny from Washington and limited risk to earnings versus other healthcare names. Teva, a premier generic manufacturer, benefited from having one of the broadest and deepest pipelines for upcoming patent losses on branded drugs.
Current Strategy and Outlook: Currently, the Portfolio is positioned in companies that we believe have strong or improving competitive positions, robust end markets or superior capital allocation opportunities. We believe each stock possesses an attractive valuation and a clear catalyst to improve it. Top holdings include Exxon-Mobil Corp. ("ExxonMobil"), Royal Dutch Shell PLC ("Royal Dutch Shell"), PG&E and Wells Fargo & Co ("Wells Fargo"). Within energy, we continue to favor integrated oil companies such as Exxon-Mobil and Royal Dutch Shell that have strong balance sheets, high dividend yields and good management teams.
We continue to like PG&E as a defensive play within the utility sector. The company is currently trading at an attractive valuation versus its peers and has a good balance sheet, a high dividend yield and no exposure to commodity or customer usage risk. Finally, we believe Wells Fargo's recent acquisition of Wachovia was an extremely favorable deal, which will lead to synergies and will allow its premier banking franchise to achieve national scale.
Portfolio holdings and characteristics are subject to change and may not be representative of current holdings and characteristics. The outlook for this Portfolio may differ from that presented for other ING Funds. Performance for the different classes of shares will vary based on differences in fees associated with each class.
Top Ten Holdings
as of December 31, 2008
(as a percent of net assets)
| ExxonMobil Corp. | | | 6.3 | % | |
| Procter & Gamble Co. | | | 3.2 | % | |
| Wells Fargo & Co. | | | 2.9 | % | |
| JPMorgan Chase & Co. | | | 2.7 | % | |
| AT&T, Inc. | | | 2.1 | % | |
| Philip Morris International, Inc. | | | 1.9 | % | |
| General Electric Co. | | | 1.9 | % | |
| Gilead Sciences, Inc. | | | 1.8 | % | |
| Wal-Mart Stores, Inc. | | | 1.8 | % | |
| Google, Inc. — Class A | | | 1.8 | % | |
Portfolio holdings are subject to change daily.
6
ING VP GROWTH AND INCOME PORTFOLIO
PORTFOLIO MANAGERS' REPORT
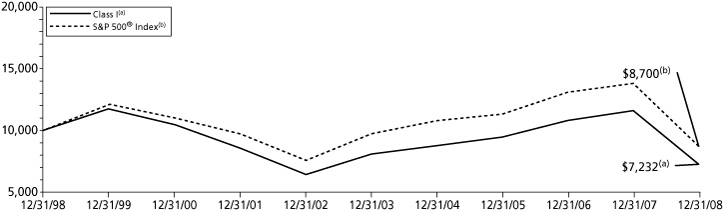
| Average Annual Total Returns for the Periods Ended December 31, 2008 | |
| | | 1 Year | | 5 Year | | 10 Year | | Since Inception
of Class ADV
December 20, 2006 | | Since Inception
of Class S
June 11, 2003 | |
| Class ADV | | | (37.94 | )% | | | — | | | | — | | | | (18.46 | )% | | | — | | |
| Class I | | | (37.63 | )% | | | (2.16 | )% | | | (3.18 | )% | | | — | | | | — | | |
| Class S | | | (37.82 | )% | | | (2.43 | )% | | | — | | | | — | | | | (0.19 | )% | |
| S&P 500® Index(1) | | | (37.00 | )% | | | (2.19 | )% | | | (1.38 | )% | | | (18.47 | )%(2) | | | 0.77 | %(3) | |
Based on a $10,000 initial investment, the graph and table above illustrate the total return of ING VP Growth and Income Portfolio against the index indicated. An index has no cash in its portfolio, imposes no sales charges and incurs no operating expenses. An investor cannot invest directly in an index. The Portfolio's performance is shown without the imposition of any expenses or charges which are, or may be, imposed under your annuity contract. Total returns would have been lower if such expenses or charges were included.
The performance graph and table do not reflect the deduction of taxes that a shareholder will pay on portfolio distributions or the redemption of portfolio shares.
The performance shown may include the effect of fee waivers and/or expense reimbursements by the Investment Adviser and/or other service providers, which have the effect of increasing total return. Had all fees and expenses been considered, the total returns would have been lower.
The performance update illustrates performance for a variable investment option available through a variable annuity contract. The performance shown indicates past performance and is not a projection or prediction of future results. Actual investment returns and principal value will fluctuate so that shares and/or units, at redemption, may be worth more or less than their original cost. Please call (800) 992-0180 to get performance through the most recent month end.
This report contains statements that may be "forward-looking" statements. Actual results may differ materially from those projected in the "forward-looking" statements.
The views expressed in this report reflect those of the portfolio manager only through the end of the period as stated on the cover. The portfolio manager's views are subject to change at any time based on market and other conditions.
Portfolio holdings are subject to change daily.
(1) The S&P 500® Index is an unmanaged index that measures the performance of securities of approximately 500 of the largest companies in the U.S.
(2) Since inception performance for the index is shown from January 1, 2007.
(3) Since inception performance for the index is shown from June 1, 2003.
Effective March 1, 2002, ING Investments, LLC began serving as investment adviser and ING Investment Management Co., the former investment adviser, began serving as sub-adviser to the Portfolio.
7
ING OPPORTUNISTIC LARGE CAP GROWTH PORTFOLIO
PORTFOLIO MANAGERS' REPORT
ING Opportunistic Large Cap Growth Portfolio (the "Portfolio") seeks growth of capital through investment in a diversified portfolio consisting primarily of common stock and securities convertible into common stocks believed to offer growth potential. The Portfolio is managed by Omar Aguilar, Ph.D. and Vincent Costa, CFA, Portfolio Managers* of ING Investment Management Co. ("INGIM")— the Sub-Adviser.
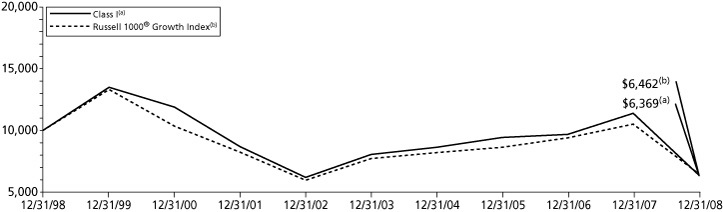
Performance: For the year ended December 31, 2008, the Portfolio's Class I shares provided a total return of (44.06)% compared to the Russell 1000® Growth Index(1), which returned (38.44)% for the same period.
Portfolio Specifics: The Portfolio had a challenging year, underperforming its benchmark for the period.
Equity markets started the year with a turbulent first quarter as volatility spiked, in part, due to the relatively quick changes between the growth and value regimes. This period was particularly difficult for quantitative strategies as the performance of the factors was volatile through the period, making it difficult to sustain a positive model performance.
During the first quarter, we saw a brief change in market leadership from growth to value in January, which was accompanied by a spike in volatility. In February, valuation factors ended their brief comeback while price momentum drove returns. Valuation factors continued their underperformance in March, with factors like free cash flow to price causing the worst underperformance in the healthcare sector.
In the second quarter, security selection in the healthcare and information technology sectors hurt performance. The healthcare sector suffered as some pharmaceutical companies cut their earnings forecasts, with names like Forest Laboratories, Inc. and Perrigo Co. hurting the most. In the technology sector securities in the semiconductor and hardware industries hurt performance. Stocks such as MEMC Electronic Materials, Inc. and Arrow Electronics, Inc. slipped due to lower than expected earnings. In the energy sector our models were unable to keep up with momentum and the Portfolio got hurt by underweight positions in Schlumberger Ltd. and Halliburton Co., which were sharply higher due to a steep increase in crude oil prices.
In the second half of the year our dynamic factor model began pointing more towards valuation and quality factors, resulting in a slight overweight of these factors. This helped performance slightly in the third quarter as valuation factors bounced back; however, they turned negative in September wiping out all the gains from July and August. Market recognition factors, which were in favor for most of the year, turned sharply negative during the period.
Valuation factors continued to perform well in the fourth quarter with factors like forward and trailing earnings to price as well as price to free cash flow doing well in November and December. However, market recognition factors such as analyst estimate revisions and earnings trends that worked well early in the quarter underperformed toward the end of the year hurting returns.
Overall, security selection detracted from performance with selection in the healthcare, industrials, consumer discretionary and information technology sectors hurting returns. These losses were partially offset by security selection in the energy and financials sectors.
Current Strategy and Outlook: Our research builds a structured portfolio of stocks with fundamental characteristics that we believe will translate into a performance advantage over the benchmark. The evaluation includes every stock in the index.
At the close of the reporting period, the Portfolio was overweight in the consumer discretionary and healthcare sectors and underweight in the information technology and utilities sectors.
* Effective January 13, 2009, Mr. Aguilar is no longer a portfolio manager to the Portfolio.
Portfolio holdings and characteristics are subject to change and may not be representative of current holdings and characteristics. The outlook for this Portfolio may differ from that presented for other ING Funds. Performance for the different classes of shares will vary based on differences in fees associated with each class.
Top Ten Holdings
as of December 31, 2008
(as a percent of net assets)
| Apple, Inc. | | | 3.9 | % | |
| Procter & Gamble Co. | | | 3.7 | % | |
| Lockheed Martin Corp. | | | 3.5 | % | |
| TJX Cos., Inc. | | | 2.9 | % | |
| Xilinx, Inc. | | | 2.8 | % | |
| Altera Corp. | | | 2.7 | % | |
| Cooper Industries Ltd. | | | 2.5 | % | |
| CA, Inc. | | | 2.5 | % | |
| Sunoco, Inc. | | | 2.5 | % | |
| Fluor Corp. | | | 2.5 | % | |
Portfolio holdings are subject to change daily.
8
ING OPPORTUNISTIC LARGECAP GROWTH PORTFOLIO
PORTFOLIO MANAGERS' REPORT
| Average Annual Total Returns for the Periods Ended December 31, 2008 | |
| | | 1 Year | | 5 Year | | 10 Year | | Since Inception
of Class ADV
December 29, 2006 | | Since Inception
of Class S
November 1, 2001 | |
| Class ADV | | | (44.38 | )% | | | — | | | | — | | | | (19.19 | )% | | | — | | |
| Class I | | | (44.06 | )% | | | (4.51 | )% | | | (4.40 | )% | | | — | | | | — | | |
| Class S | | | (44.21 | )% | | | (4.76 | )% | | | — | | | | — | | | | (3.78 | )% | |
| Russell 1000® Growth Index(1) | | | (38.44 | )% | | | (3.42 | )% | | | (4.27 | )% | | | (17.03 | )%(2) | | | (2.08 | )% | |
Based on a $10,000 initial investment, the graph and table above illustrate the total return of ING Opportunistic LargeCap Growth Portfolio against the index indicated. An index has no cash in its portfolio, imposes no sales charges and incurs no operating expenses. An investor cannot invest directly in an index. The Portfolio's performance is shown without the imposition of any expenses or charges which are, or may be, imposed under your annuity contract. Total returns would have been lower if such expenses or charges were included.
The performance graph and table do not reflect the deduction of taxes that a shareholder will pay on portfolio distributions or the redemption of portfolio shares.
The performance shown may include the effect of fee waivers and/or expense reimbursements by the Investment Adviser and/or other service providers, which have the effect of increasing total return. Had all fees and expenses been considered, the total returns would have been lower.
The performance update illustrates performance for a variable investment option available through a variable annuity contract. The performance shown indicates past performance and is not a projection or prediction of future results. Actual investment returns and principal value will fluctuate so that shares and/or units, at redemption, may be worth more or less than their original cost. Please call (800) 992-0180 to get performance through the most recent month end.
This report contains statements that may be "forward-looking" statements. Actual results may differ materially from those projected in the "forward-looking" statements.
The views expressed in this report reflect those of the portfolio manager only through the end of the period as stated on the cover. The portfolio manager's views are subject to change at any time based on market and other conditions.
Portfolio holdings are subject to change daily.
(1) The Russell 1000® Growth Index measures the performance of the 1,000 largest companies in the Russell 3000 Index with higher price-to-book ratios and higher forecasted growth. The Russell 3000 Index is an unmanaged index that measures the performance of 3,000 U.S. companies based on total market capitalization.
(2) Since inception performance for the index is shown from January 1, 2007.
Effective March 1, 2002, ING Investments, LLC began serving as investment adviser and ING Investment Management Co., the former investment adviser, began serving as sub-adviser to the Portfolio.
9
ING VP SMALL COMPANY PORTFOLIO
PORTFOLIO MANAGERS' REPORT
ING VP Small Company Portfolio (the "Portfolio") seeks growth of capital primarily through investment in a diversified portfolio of common stocks of companies with smaller market capitalizations. The Portfolio is managed by Joseph Basset, CFA, and Steve Salopek, Portfolio Managers of ING Investment Management Co. — the Sub Adviser.
Performance: For the year ended December 31, 2008, the Portfolio's Class I shares provided a total return of (31.05)% compared to the Russell 2000® Index(1), which returned (33.79)% for the same period.
Portfolio Specifics: Despite the recent rally of nearly 30% for the Russell 2000® Index, the index was down over 33% for the year. This past year was the worst year since 1973 for small-cap stocks and there were few places to hide. Returns were negative across all sectors — fewer than one in five stocks of the index turned in positive results. However, small-caps did outperform both large-caps and mid-caps due to better performance by financials. Energy was down almost 50% for the year due to the significant decline in the price of oil and the fact that the current economic environment is unfavorable for energy.
Stock selection within industrials, financials, utilities and materials benefited the Portfolio during the period. Our underweight in consumer discretionary also added to performance, as the sector was down over 47% for the year. Notable outperformance within industrials was due to strong stock selection within aerospace and defense, commercial services and supplies and professional services. Financials benefited from stock selection within thrifts and mortgage finance and real estate investment trusts ("REITs").
Stock selection within the energy, technology and healthcare sectors detracted most from performance. In energy, returns were held back by our slight overweight position and stock selection within energy equipment and services and oil, gas and consumable fuels. Within technology, stock selection within communications equipment and electronic equipment instruments and components detracted from performance. Underperformance in healthcare is attributable to stock selection among pharmaceuticals.
Greatbatch, Inc. ("Greatbatch") and First Niagara Financial Group, Inc. ("First Niagara") contributed significantly to performance over the period. First Niagara provides retail and commercial banking and financial services. The stock's outperformance was mainly driven by the bank's overall capital strength, disciplined underwriting and lack of exposure to the troubled loan segments, e.g., sub-prime mortgages, construction lending and speculative development. While the company has not been immune to the problems facing the banking sector throughout 2008, the strength of its balance sheet has allowed it to outperform relative to its peers.
Greatbatch is a leading developer and manufacturer of critical components used in medical devices for the cardiac rhythm management, neurostimulation, vascular and interventional radiology markets. The company executed well on its acquisition strategy, which helped it diversify from its cardiac rhythm management franchise and provide greater stability/visibility to its operating earnings. Also, the street was initially skeptical of the company's ability to diversify and execute on the diversification strategy. As each quarter passed, the company's execution proved to be flawless and the firm gained substantial momentum as evidenced by increasing earnings and expanded margins.
Global Industries Ltd. ("Global Industries") and Arbitron, Inc. ("Arbitron") were two of the largest detractors from performance over the period. Global Industries provides construction and support services to the offshore oil and gas industry. The company had a difficult second quarter due to execution issues, which resulted in investors losing confidence in management, and due to a poor macro environment for energy. We no longer hold a position in this company.
Arbitron, which measures the listening audience for radio and provides this data to both radio stations and advertisers, recently lost market share to a competitor. We continue to hold this name, as the company remains the market leader, expectations have been reset and we believe the valuation is reasonable.
Current Strategy and Outlook: We continue to focus on companies with strong balance sheets and cash flow generation capabilities. We are conscious of the difficulties in the current economic environment. We believe, however, that the economy will begin to improve in 2009 due to the massive amount of monetary stimulus being pumped into the system globally.
Accordingly, we have begun to increase our exposure to more early cyclical companies. Within financials, we continue to mitigate risk through diversification and are invested across the financial sector, in banks, diversified financials, insurance companies and real estate investments trusts ("REITS"). The banks that we own are typically over-capitalized and have higher reserves than industry averages. We continue to take advantage of the volatility in the market to acquire attractively valued companies whose share prices we believe are not trading on fundamentals.
Portfolio holdings and characteristics are subject to change and may not be representative of current holdings and characteristics. The outlook for this Portfolio may differ from that presented for other ING Funds. Performance for the different classes of shares will vary based on differences in fees associated with each class.

Top Ten Holdings*
as of December 31, 2008
(as a percent of net assets)
| iShares Russell 2000 Index Fund | | | 3.0 | % | |
| Watson Wyatt Worldwide, Inc. | | | 1.2 | % | |
| Cleco Corp. | | | 1.1 | % | |
| CACI International, Inc. | | | 1.1 | % | |
| Portland General Electric Co. | | | 1.1 | % | |
| Moog, Inc. | | | 1.1 | % | |
| Solera Holdings, Inc. | | | 1.0 | % | |
| Waste Connections, Inc. | | | 1.0 | % | |
| Regal-Beloit Corp. | | | 1.0 | % | |
| Silgan Holdings, Inc. | | | 1.0 | % | |
* Excludes short-term investments related to ING Institutional Prime Money Market Fund — Class I, repurchase agreement and securities lending collateral.
Portfolio holdings are subject to change daily.
10
ING VP SMALL COMPANY PORTFOLIO
PORTFOLIO MANAGERS' REPORT

| Average Annual Total Returns for the Periods Ended December 31, 2008 | |
| | | 1 Year | | 5 Year | | 10 Year | | Since Inception
of Class ADV
December 16, 2008 | | Since Inception
of Class S
November 1, 2001 | |
| Class ADV | | | — | | | | — | | | | — | | | | 4.04 | % | | | — | | |
| Class I | | | (31.05 | )% | | | 1.47 | % | | | 5.12 | % | | | — | | | | — | | |
| Class S | | | (31.28 | )% | | | 1.14 | % | | | — | | | | — | | | | 3.00 | % | |
| Russell 2000® Index(1) | | | (33.79 | )% | | | (0.93 | )% | | | 3.02 | % | | | N/A(2) | | | | 3.49 | % | |
Based on a $10,000 initial investment, the graph and table above illustrate the total return of ING VP Small Company Portfolio against the index indicated. An index has no cash in its portfolio, imposes no sales charges and incurs no operating expenses. An investor cannot invest directly in an index. The Portfolio's performance is shown without the imposition of any expenses or charges which are, or may be, imposed under your annuity contract. Total returns would have been lower if such expenses or charges were included.
The performance graph and table do not reflect the deduction of taxes that a shareholder will pay on portfolio distributions or the redemption of portfolio shares.
The performance shown may include the effect of fee waivers and/or expense reimbursements by the Investment Adviser and/or other service providers, which have the effect of increasing total return. Had all fees and expenses been considered, the total returns would have been lower.
The performance update illustrates performance for a variable investment option available through a variable annuity contract. The performance shown indicates past performance and is not a projection or prediction of future results. Actual investment returns and principal value will fluctuate so that shares and/or units, at redemption, may be worth more or less than their original cost. Please call (800) 992-0180 to get performance through the most recent month end.
This report contains statements that may be "forward-looking" statements. Actual results may differ materially from those projected in the "forward-looking" statements.
The views expressed in this report reflect those of the portfolio manager, only through the end of the period as stated on the cover. The portfolio manager's views are subject to change at any time based on market and other conditions.
Portfolio holdings are subject to change daily.
(1) The Russell 2000® Index measures the performance of the 2,000 smallest companies in the Russell 3000 Index. The Russell 3000 Index is an unmanaged index that measures the performance of 3,000 U.S. companies based on total market capitalization.
(2) Since inception performance for the index is not shown.
Effective March 1, 2002, ING Investments, LLC began serving as investment adviser and ING Investment Management Co., the former investment adviser, began serving as sub-adviser to the Portfolio.
11
ING OPPORTUNISTIC LARGE CAP VALUE PORTFOLIO
PORTFOLIO MANAGERS' REPORT
ING Opportunistic Large Cap Value Portfolio (the "Portfolio") seeks growth of capital primarily through investment in a diversified portfolio of common stocks. The Portfolio is managed by Omar Aguilar, Ph.D. and Vincent Costa — Portfolio Managers* of ING Investment Management Co. — the Sub-Adviser.
Performance: For the year ended December 31, 2008, the Portfolio's Class I shares provided a total return of (35.61)% compared to the Russell 1000® Value Index(1) and the Russell 1000® Index(2), which returned (36.85)% and (37.60)%, respecti vely, for the same period.
Portfolio Specifics: Security selection drove performance for the period, with selection in the financials, energy and consumer discretionary sectors benefiting returns. These gains were partially offset by security selection in the industrials and health care sectors. Underweight positions in the financials and materials sectors as well as an overweight position in the consumer staples sector also benefited results for the period.
2008 began with a spike in volatility, but during the rest of the first half of the year market recognition factors such as sales growth and analyst estimate revisions re-asserted themselves and drove performance. Quality and valuation factors such as book to price, dividend yield and capital expenditure to sales did not work well. Sectors such as banks and utilities benefited from the good performance of market recognition factors. In contrast, market recognition factors in the energy, health care, industrials and financials services sectors could not offset the severe underperformance of the valuation factors.
After a challenging first quarter our quantitative strategies stabilized in the second quarter as the markets began to return to company fundamentals. The Portfolio rebounded and offset much of its loss from the first quarter. Our dynamic factor weighting model helped us tilt the Portfolio's weights away from deep value factors like book to price, steering it to an underweight position in the financials sector, which fell sharply during the second quarter. The tilt also helped security selection within the consumer staples sector, particularly in food and staples retailing names such as Kroger Co.
In the second half of the year the Portfolio's dynamic factor model began pointing more towards valuation and quality factors, resulting in a slight overweight of these factors. Regrettably, after a promising start in July and August, these factors turned negative in September and wiped out all their previous gains. Market recognition factors also turned sharply negative and detracted from performance. Quality factors that were flat for the year performed well during the third quarter.
The shift to value and quality paid off in the fourth quarter, as factors like forward and trailing earnings to price and price to free cash flow performed extremely well. Quality factors such as capital expenditures to deprecation also helped returns during the fourth quarter. Finally, market recognition factors such as analyst estimate revisions and earnings trends worked well early in the quarter but faded toward the end of the year.
Current Strategy and Outlook: Our research builds a structured portfolio of stocks with fundamental characteristics that we believe will translate into a performance advantage over the benchmark. The evaluation includes every stock in the index.
At the close of the reporting period, portfolio overweightings included the energy and information technology sectors and underweightings included the financials sectors and materials sectors.
* Effective January 13, 2009, Mr. Aguilar is no longer a portfolio manager to the Portfolio.
Portfolio holdings and characteristics are subject to change and may not be representative of current holdings and characteristics. The outlook for this Portfolio may differ from that presented for other ING Funds. Performance for the different classes of shares will vary based on differences in fees associated with each class.
Top Ten Holdings*
as of December 31, 2008
(as a percent of net assets)
| ExxonMobil Corp. | | | 8.2 | % | |
| Pfizer, Inc. | | | 4.5 | % | |
| AT&T, Inc. | | | 4.5 | % | |
| ConocoPhillips | | | 4.1 | % | |
| Forest Laboratories, Inc. | | | 2.9 | % | |
| Chevron Corp. | | | 2.7 | % | |
| Gap, Inc. | | | 2.7 | % | |
| Kroger Co. | | | 2.7 | % | |
| Time Warner, Inc. | | | 2.6 | % | |
| Valero Energy Corp. | | | 2.4 | % | |
* Excludes short-term investments related to securities lending collateral.
Portfolio holdings are subject to change daily.
12
ING OPPORTUNISTIC LARGECAP VALUE PORTFOLIO
PORTFOLIO MANAGERS' REPORT

| Average Annual Total Returns for the Periods Ended December 31, 2008 | |
| | | 1 Year | | 5 Year | | 10 Year | | Since Inception
of Class ADV
December 29, 2006 | | Since Inception
of Class S
July 16, 2001 | |
| Class ADV | | | (36.01 | )% | | | — | | | | — | | | | (19.01 | )% | | | — | | |
| Class I | | | (35.61 | )% | | | (1.93 | )% | | | (0.03 | )% | | | — | | | | — | | |
| Class S | | | (35.80 | )% | | | (2.17 | )% | | | — | | | | — | | | | (3.78 | )% | |
| Russell 1000® Value Index(1) | | | (36.85 | )% | | | (0.79 | )% | | | 1.36 | % | | | (20.60 | )%(3) | | | 0.16 | %(4) | |
| Russell 1000® Index(2) | | | (37.60 | )% | | | (2.04 | )% | | | (1.09 | )% | | | (18.76 | )%(3) | | | (1.76 | )%(4) | |
Based on a $10,000 initial investment, the graph and table above illustrate the total return of ING Opportunistic LargeCap Value Portfolio against the indices indicated. An index has no cash in its portfolio, imposes no sales charges and incurs no operating expenses. An investor cannot invest directly in the indices. The Portfolio's performance is shown without the imposition of any expenses or charges which are, or may be, imposed under your annuity contract. Total returns would have been lower if such expenses or charges were included.
The performance graph and table do not reflect the deduction of taxes that a shareholder will pay on portfolio distributions or the redemption of portfolio shares.
The performance shown may include the effect of fee waivers and/or expense reimbursements by the Investment Adviser and/or other service providers, which have the effect of increasing total return. Had all fees and expenses been considered, the total returns would have been lower.
The performance update illustrates performance for a variable investment option available through a variable annuity contract. The performance shown indicates past performance and is not a projection or prediction of future results. Actual investment returns and principal value will fluctuate so that shares and/or units, at redemption, may be worth more or less than their original cost. Please call (800) 992-0180 to get performance through the most recent month end.
This report contains statements that may be "forward-looking" statements. Actual results may differ materially from those projected in the "forward-looking" statements.
The views expressed in this report reflect those of the portfolio manager, only through the end of the period as stated on the cover. The portfolio manager's views are subject to change at any time based on market and other conditions.
Portfolio holdings are subject to change daily.
(1) The Russell 1000® Value Index is an unmanaged index that measures the performance of those Russell 1000 companies with lower price-to-book ratios and lower forecasted growth values, which more closely tracks the types of securities in which the Portfolio invests than the S&P 500® Composite Stock Price Index.
(2) The Russell 1000® Index is a comprehensive large-cap index measuring the performance of the largest 1,000 U.S. incorporated companies.
(3) Since inception performance for the indices is shown from January 1, 2007.
(4) Since inception performance for the indices is shown from August 1, 2001.
Effective March 1, 2002, ING Investments, LLC began serving as investment adviser and ING Investment Management Co., the former investment adviser, began serving as sub-adviser to the Portfolio.
13
ING VP INTERMEDIATE BOND PORTFOLIO
PORTFOLIO MANAGERS' REPORT
ING VP Intermediate Bond Portfolio (the "Portfolio") seeks to maximize total return consistent with reasonable risk. The Portfolio seeks its objective through investments in a diversified portfolio consisting primarily of debt securities. It is anticipated that capital appreciation and investment income will both be major factors in achieving total return. The Portfolio is managed by James Kauffmann, Portfolio Manager* of ING Investment Management Co. — the Sub-Adviser.
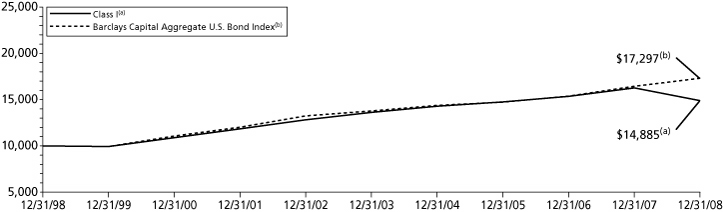
Performance: For the year ended December 31, 2008, the Portfolio's Class I shares provided a total return of (8.41)% compared to the Barclays Capital U.S. Aggregate Bond Index**(1), which returned 5.24% for the same period.
Portfolio Specifics: Most pundits agree that 2008 was a record-breaking annus horribilis. Global de-leveraging worsened volatility across asset classes, and fixed income was not immune. In December, the National Bureau of Economic Research officially declared that the United States had been in recession for a year.
Home prices declined precipitously across major metro areas, foreclosures sky-rocketed and investors largely abandoned the residential mortgage-backed securities ("RMBS") market. Yields on U.S. Treasuries reached historic lows as investment grade corporate debt spreads widened to a level implying an expected default rate of 30%, which tops the experience of the Great Depression, when corporate defaults totaled about 20%.
Central banks around the globe frantically reduced short-term rates in the face of rapidly deteriorating economic conditions. Fiscal stimulus programs were initiated in most major economies. Here in the U.S., the Federal Open Market Committee reduced the federal funds rate at each meeting, eventually settling at 0.25% by year-end. The Federal Reserve Board (the "Fed") also indicated it would purchase large quantities of agency debt and mortgage-backed securities to support the mortgage and housing market. As a result, the markets calmed down a bit in the waning days of 2008.
The Portfolio was underweight Treasuries for most of the year, which hurt performance. The Portfolio was overweight many of the sectors hit hardest by risk aversion, including non-agency residential mortgage-backed securities ("RMBS"), financials and corporate bonds. Given that non-agency RMBS are not in the benchmark, our positions led to significant underperformance versus the benchmark. Additionally, we were too early in adding corporate risk back into the Portfolio following the rescue of Bear Stearns in March; this renewed focus detracted from results when Lehman Brothers went bankrupt in September.
Our investment process focuses on security selection, which was clearly out of favor in 2008. We tend to focus on unique corporate bonds, which are often lower in the capital structure and may trade at a discount to their intrinsic value. Unfortunately, the bond market cared little about important distinctions between bonds and witnessed an unprecedented flight to quality.
We did, however, avoid the underperformance of high yield and emerging market debt by being largely absent those sectors. Although yield curve, duration and currency exposures changed throughout a highly volatile year, the decisions made in this risk area were largely beneficial.
Current Outlook and Strategy: We believe the government will continue to deploy significant amounts of capital in an effort to combat liquidity constraints, which will lead to larger deficits but also a possibility of better economic growth in the future. But since we also believe the Fed will not be raising rates anytime soon, we think that Treasury rates will continue to be range-bound; therefore, we believe a relative neutral duration and curve exposure, with small tactical moves, is warranted at this time.
In an economy where cash flow is scarce and both individuals and corporations want to de-lever we believe it is prudent to be in the higher end of the capital structure where debt holders are the beneficiaries of limited cash flows to the detriment of equity holders. In our opinion, U.S. investment grade bonds offer attractive value.
We believe that in a market where the government is controlling a majority of the outcomes we should invest along with the government. Therefore, some of the companies we own either will have some sort of government support, or their ratings will allow them to sell commercial paper directly to the Fed. Other criteria are that they belong to an extremely important sector for the economy, such as utilities or telecommunications and that they have strong cash flows and balance sheets.
The Portfolio remains overweight securitized assets and RMBS in particular. We still believe there are good investments with the potential for solid, long-term returns in some of these securities. The areas where we believe value exists include certain securities backed by prime jumbo loans with good borrower profiles, and even some ALT-A backed bonds that have a conforming balance and may be refinanced at a lower rate.
* Effective January 13, 2009, James Kauffmann was replaced by Chris Diaz, Peter Guan, Michael Hyman and Christine Hurtsellers as co-portfolio managers to the Portfolio.
** Formerly known as the Lehman Brothers U.S. Aggregate Bond Index. As of October 31, 2008, all Lehman Brothers indices were renamed: the words "Lehman Brothers" changed to "Barclays Capital."
Portfolio holdings and characteristics are subject to change and may not be representative of current holdings and characteristics. The outlook for this Portfolio may differ from that presented for other ING Funds. Performance for the different classes of shares will vary based on differences in fees associated with each class.
Investment Type Allocation
as of December 31, 2008
(as a percent of net assets)
| U.S. Government Agency Obligations | | | 39.0 | % | |
| Corporate Bonds/Notes | | | 27.7 | % | |
| Collateralized Mortgage Obligations | | | 19.6 | % | |
| U.S. Treasury Obligations | | | 15.9 | % | |
| Asset-Backed Securities | | | 2.1 | % | |
| Municipal Bonds | | | 1.0 | % | |
| Preferred Stock | | | 0.5 | % | |
| Other Assets and Liabilities — Net* | | | (5.8 | )% | |
| Net Assets | | | 100.0 | % | |
* Includes short-term investments related to certificates of deposit, commercial paper, ING Institutional Prime Money Market Fund — Class I, securities lending collateral and U.S. Treasury Bills.
Portfolio holdings are subject to change daily.
Top Ten Holdings*
as of December 31, 2008
(as a percent of net assets)
| Federal Home Loan Mortgage Corporation, | | | | | |
| 5.500%, due 02/12/37 | | | 10.3 | % | |
| Federal National Mortgage Association, | | | | | |
| 5.000%, due 01/12/36 | | | 7.6 | % | |
| U.S. Treasury Note, 2.000%, due 11/30/13 | | | 3.7 | % | |
| U.S. Treasury Bond, 3.750%, due 11/15/18 | | | 3.6 | % | |
| U.S. Treasury Bond, 4.375%, due 02/15/38 | | | 2.7 | % | |
| Government National Mortgage Association, | | | | | |
| 6.000%, due 02/15/34 | | | 2.7 | % | |
| U.S. Treasury Note, 1.125%, due 12/15/11 | | | 2.2 | % | |
| Federal National Mortgage Association, | | | | | |
| 6.500%, due 02/12/37 | | | 1.7 | % | |
| Federal National Mortgage Association, | | | | | |
| 6.000%, due 02/12/37 | | | 1.7 | % | |
| Government National Mortgage Association, | | | | | |
| 5.500%, due 02/15/35 | | | 1.6 | % | |
* Excludes short-term investments related to commercial paper, ING Institutional Prime Money Market Fund — Class I and securities lending collateral.
Portfolio holdings are subject to change daily.
14
ING VP INTERMEDIATE BOND PORTFOLIO
PORTFOLIO MANAGERS' REPORT
| Average Annual Total Returns for the Periods Ended December 31, 2008 | |
| | | 1 Year | | 5 Year | | 10 Year | | Since Inception
of Class ADV
December 20, 2006 | | Since Inception
of Class S
May 3, 2002 | |
| Class ADV | | | (9.16 | )% | | | — | | | | — | | | | (2.17 | )% | | | — | | |
| Class I | | | (8.41 | )% | | | 1.78 | % | | | 4.06 | % | | | — | | | | — | | |
| Class S | | | (8.73 | )% | | | 1.51 | % | | | — | | | | — | | | | 3.13 | % | |
| Barclays Capital Aggregate U.S. Bond Index(1) | | | 5.24 | % | | | 4.65 | % | | | 5.63 | % | | | 6.10 | %(2) | | | 5.31 | %(3) | |
Based on a $10,000 initial investment, the graph and table above illustrate the total return of ING VP Intermediate Bond Portfolio against the index indicated. An index has has no cash in its portfolio, imposes no sales charges and incurs no operating expenses. An investor cannot invest directly in an index. The Portfolio's performance is shown without the imposition of any expenses or charges which are, or may be, imposed under your annuity contract. Total returns would have been lower if such expenses or charges were included.
The performance graph and table do not reflect the deduction of taxes that a shareholder will pay on portfolio distributions or the redemption of portfolio shares.
The performance shown may include the effect of fee waivers and/or expense reimbursements by the Investment Adviser and/or other service providers, which have the effect of increasing total return. Had all fees and expenses been considered, the total returns would have been lower.
The performance update illustrates performance for a variable investment option available through a variable annuity contract. The performance shown indicates past performance and is not a projection or prediction of future results. Actual investment returns and principal value will fluctuate so that shares and/or units, at redemption, may be worth more or less than their original cost. Please call (800) 992-0180 to get performance through the most recent month end.
This report contains statements that may be "forward-looking" statements. Actual results may differ materially from those projected in the "forward-looking" statements.
The views expressed in this report reflect those of the portfolio managers, only through the end of the period as stated on the cover. The portfolio managers' views are subject to change at any time based on market and other conditions.
Portfolio holdings are subject to change daily.
(1) The Barclays Capital Aggregate U.S. Bond Index is an unmanaged index publicly issued investment grade U.S. Government, mortgage-backed, asset-backed and corporate debt securities.
(2) Since inception performance for the the index is shown from January 1, 2007.
(3) Since inception performance for the index is shown from May 1, 2002.
Effective March 1, 2002, ING Investments, LLC began serving as investment adviser and ING Investment Management Co., the former investment adviser, began serving as sub-adviser to the Portfolio.
15
ING VP MONEY MARKET PORTFOLIO
PORTFOLIO MANAGERS' REPORT
ING VP Money Market Portfolio (the "Portfolio") seeks to provide high current return, consistent with preservation of capital and liquidity, through investment in high-quality money market instruments, while maintaining a stable share price of $1.00 per share*. The Portfolio is managed by David S. Yealy, Portfolio Manager of ING Investment Management Co. — the Sub-Adviser.
Performance: For the year ended December 31, 2008, the Portfolio's shares provided a total return of 2.67% compared to the iMoneyNet First Tier Retail Index(1), which returned 2.13% for the same period.
Portfolio Specifics: Calendar-year 2008 was one of the most difficult and challenging periods in history for money market funds. The first quarter was highlighted by near collapse of Bear Stearns and the subsequent buyout by JPMorgan. The Federal Reserve Board (the "Fed") aggressively cut interest rates a combined 2% during the quarter. This was one of many steps taken by the U.S. central bank along with the other central banks globally to address the illiquidity and credit stress in the market.
The second quarter was one of transition, from concern over lower economic growth leading to lower short-term rates to concern over inflation and the possibility of significant interest rate increases. The Fed lowered the federal funds rate in April 2008. Liquidity remained an issue but central bank actions prevented further market deterioration, and we saw modest improvement in conditions.
The third quarter was marked by the seizing up of the credit markets and loss of confidence as the government took over Fannie Mae and Freddie Mac, Lehman Brothers went bankrupt and market bellwethers such as General Electric, AIG and Wachovia faltered. The systemic risk and capital market panic that ensued resulted in a worldwide multi-sector collapse of virtually all risk-based asset prices.
The markets for short-term funding, such as money market funds, threatened to stop functioning. The Fed made an emergency inter-meeting cut of the federal funds rate from 2.00% to 1.50% on October 8, 2008. This was followed by another 0.50% cut at the October 29, 2008 meeting and an unprecedented step at the December 15–16, 2008 meeting where the Fed set a Fed funds target rate range of 0% to 0.25%. The Fed initiated a variety of innovative confidence building tactics, such as providing relief for the commercial paper markets and money market funds.
Our focus during the period was not on maximizing yield and return but on preservation of capital, reducing risk and increasing liquidity due to extreme risks in the market. The Portfolio was able to outperform its benchmark despite our risk reduction strategy.
The Portfolio did take on interest rate risk, primarily during the second half of the year, extending its weighted average maturity ("WAM") by buying longer term Treasury and agency securities. The Portfolio finished the year with a 78-day WAM, which is at the long end of its range. We avoided additional credit risk but gave up some incremental yield by not buying higher yielding debt of more marginal issues and structured securities not covered by the government programs. This strategy cushioned the impact of the rate cuts and declining yields, and we believe it should continue to do so in the current low rate environment going forward.
Current Strategy and Outlook: Going into the new year, we continue to emphasize reducing credit risk and maintaining excess liquidity. The Portfolio is targeting three times the normal 7% position in repurchase agreements. The Portfolio is targeting additional liquid positions that mature in fewer than seven days, as well as 35–45% exposure in asset backed commercial paper ("ABCP"), which is eligible to be sold to the Fed at amortized cost under one of its liquidity support programs. We have been extending ABCP maturities into March and April 2009, seeking to lock in the higher yields offered there relative to maturities in January 2009.
The Portfolio continues to reduce exposure to issuers that have not received direct central bank support or guarantees or are not covered by one of the various Fed/Treasury programs. Without these supports, such securities carry more risk and could be illiquid if we had to sell them prior to maturity. We continue to reduce the Portfolio's floating rate exposure through maturities and secondarily via outright sales, as this sector is expected to underperform in a low interest rate environment.
Principal Risk Factors: Please see the "Notes to Financial Statements" section for information regarding the Capital Support Agreement that the Portfolio has entered into.
Although the Portfolio seeks to preserve the value of your investment at $1.00 per share, it is possible to lose money by investing in the Portfolio.
* Effective October 7, 2008, the Portfolio's investment objective was revised to state that it will seek to maintain a stable share price of $1.00 per share.
(1) The iMoneyNet First Tier Retail Index is an unmanaged index that includes the most broadly based money market funds. This index is intended to be the comparative index for the Portfolio.
Portfolio holdings and characteristics are subject to change and may not be representative of current holdings and characteristics. The outlook for this Portfolio may differ from that presented for other ING Funds. Performance for the different classes of shares will vary based on differences in fees associated with each class.
Investment Type Allocation
as of December 31, 2008
(as a percent of net assets) | |
| Commercial Paper | | | 43.0 | % | |
| U.S. Government Agency Obligations | | | 17.0 | % | |
| Corporate Bonds/Notes | | | 13.1 | % | |
| Repurchase Agreement | | | 12.9 | % | |
| Certificates of Deposit | | | 2.8 | % | |
| U.S. Treasury Notes | | | 1.2 | % | |
| Securities Lending Collateral | | | 0.0 | % | |
| Other Assets and Liabilities — Net | | | 10.0 | % | |
| Net Assets | | | 100.0 | % | |
Portfolio holdings are subject to change daily.
16
ING BLACKROCK GLOBAL SCIENCE AND TECHNOLOGY PORTFOLIO
PORTFOLIO MANAGERS' REPORT
ING BlackRock Global Science and Technology Portfolio (the "Portfolio") seeks long-term capital appreciation. The Portfolio is managed by Thomas P. Callan, CFA, Managing Director and Senior Portfolio Manager, Erin Xie, PhD, Managing Director and Portfolio Manager and Jean M. Rosenbaum, CFA, Managing Director and Portfolio Manager of BlackRock Advisors, LLC — the Sub-Adviser.
Performance: For the year ended December 31, 2008, the Portfolio's Class I shares provided a total return of (39.82)% compared to the Standard & Poor's 500® Composite Stock Price Index(1) ("S&P 500® Index") and the NYSE Arca Tech 100 IndexSM(2),which returned (37.00)% and (34.50)%, respectively, for the same period.
Portfolio Specifics: Over the past year, global equity markets suffered massive declines on the back of widespread market failures. During this time, the MSCI All-Country World Index closed down approximately 42.00% Looking back, the first half of 2008 saw a tug-of-war between the inflationary pressures of rising commodity prices and the deflationary pressures of collapsing credit markets. Once it became evident that inflation would not be an ongoing concern, central banks and governments shifted policy towards supporting economic growth. With the bailout of Bear Stearns in early March, followed by the unprecedented events of September, investor sentiment fell rapidly. As a result, equity volatility climbed, with the Chicago Board Options Exchange Volatility Index ("VIX") hitting its all-time high of roughly 90 on October 24. The year ended with a sharp reb ound from mid-November lows as investors hoped economic recovery would be in store for 2009, but with concerns that those lows could be retested if data showed worse than expected economic conditions. In this environment, technology shares unperformed broader markets amidst uncertain economic conditions.
The Portfolio underperformed its reference benchmark, the NYSE Arca Tech 100SM Index for the fiscal year. Stock selection was the weakest component of attribution, while allocation effects somewhat offset these results. Within information technology ("IT"), weak selection came from internet software & services, communications equipment, and, to a lesser extent, from semiconductors and semiconductor equipment holdings. Names such as Baidu.com ADR, eBay, Inc., and VeriSign, Inc. within the internet software & services sub-industry fell by 50% or more during their holding periods. From an individual stock perspective, overweight positions in Apple, Inc., Google, Inc., and Microsoft Corp. had the greatest negative impact, as all experienced significant price depreciation over the period. In addition, stock selection within healthcare detracted, particularly within the pharmaceuticals and life science tools & services subse ctors. Positive stock selection effects came from subindustries such as computer hardware and applications software, as we avoided or held underweights in many of the weakest names within these groups.
Overall allocation effects were positive. An underweight in the information technology sector over the time period contributed positively to allocation results. Within specific subsectors, holding an underweight in application software and computer hardware names contributed positively, as did overweighting the integrated telecommunications space. Additionally, holding cash in a down market helped preserve capital.
Current Strategy and Outlook: We continue to hold a diversified basket of technology shares as we remain cautious on the sector long-term. The industry cut production aggressively in response to the slower than expected demand in the fourth quarter of 2008 and the supply chain may need to be replenished in the near term. Longer-term, we believe there is excess production capacity that needs to be eliminated. Further, smaller players may struggle to stay alive due to credit strains and lack of liquidity. We continue to search for companies within IT that are the relative beneficiaries of the current distress and/or offer innovative new products. Within healthcare, we are relatively more constructive at this time on the large-cap biotechnology names, based on improving fundamentals and attractive valuations.
At year-end, the Portfolio was invested in IT, healthcare, industrials, and telecommunication services, with the remainder in consumer discretionary and consumer staples. Within IT, the Portfolio's primary overweights were in semiconductors, electronic components and home entertainment; significant underweights were in data processing & outsourced services, application software and communications equipment. Inside the healthcare portion of the portfolio, the Portfolio held overweights in healthcare equipment & supplies, and was underweight in pharmaceuticals and life science tools & services.
Portfolio holdings and characteristics are subject to change and may not be representative of current holdings and characteristics. The outlook for this Portfolio may differ from that presented for other ING Funds. Performance for the different classes of shares will vary based on differences in fees associated with each class.

Top Ten Holdings*
as of December 31, 2008
(as a percent of net assets) | |
| International Business Machines Corp. | | | 3.7 | % | |
| Apple, Inc. | | | 3.4 | % | |
| Amgen, Inc. | | | 3.3 | % | |
| Genentech, Inc. | | | 3.0 | % | |
| Qualcomm, Inc. | | | 2.9 | % | |
| Lockheed Martin Corp. | | | 2.5 | % | |
| Hewlett-Packard Co. | | | 2.3 | % | |
| Genzyme Corp. | | | 2.2 | % | |
| Oracle Corp. | | | 2.1 | % | |
| Medtronic, Inc. | | | 2.1 | % | |
* Excludes short-term investments related to securities lending collateral.
Portfolio holdings are subject to change daily.
17
ING BLACKROCK GLOBAL SCIENCE AND TECHNOLOGY PORTFOLIO
PORTFOLIO MANAGERS' REPORT
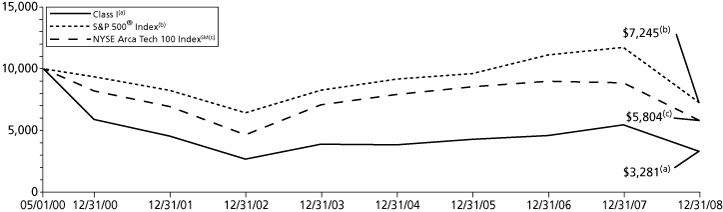
| Average Annual Total Returns for the Periods Ended December 31, 2008 | |
| | | 1 Year | | 5 Year | | Since Inception
of Class ADV
December 16, 2008 | | Since Inception
of Class I
May 1, 2000 | | Since Inception
of Class S
November 1, 2001 | |
| Class ADV | | | — | | | | — | | | | (1.22 | )% | | | — | | | | — | | |
| Class I | | | (39.82 | )% | | | (3.25 | )% | | | — | | | | (12.06 | )% | | | — | | |
| Class S(1) | | | (40.04 | )% | | | (3.51 | )% | | | — | | | | — | | | | (6.16 | )% | |
| S&P 500® Index(2) | | | (37.00 | )% | | | (2.19 | )% | | | N/A(4) | | | | (3.65 | )% | | | (0.36 | )% | |
| NYSE Arca Tech 100 IndexSM(3) | | | (34.50 | )% | | | (2.13 | )% | | | N/A(4) | | | | (6.08 | )% | | | (0.70 | )% | |
Based on a $10,000 initial investment, the graph and table above illustrate the total return of ING BlackRock Global Science and Technology Portfolio against the indices indicated. An index has no cash in its portfolio, imposes no sales charges and incurs no operating expenses. An investor cannot invest directly in an index. The Portfolio's performance is shown without the imposition of any expenses or charges which are, or may be, imposed under your annuity contract. Total returns would have been lower if such expenses or charges were included.
The performance graph and table do not reflect the deduction of taxes that a shareholder will pay on portfolio distributions or the redemption of portfolio shares.
The performance shown may include the effect of fee waivers and/or expense reimbursements by the Investment Adviser and/or other service providers, which have the effect of increasing total return. Had all fees and expenses been considered, the total returns would have been lower.
The performance update illustrates performance for a variable investment option available through a variable annuity contract. The performance shown indicates past performance and is not a projection or prediction of future results. Actual investment returns and principal value will fluctuate so that shares and/or units, at redemption, may be worth more or less than their original cost. Please call (800) 992-0180 to get performance through the most recent month end.
This report contains statements that may be "forward-looking" statements. Actual results may differ materially from those projected in the "forward-looking" statements.
The views expressed in this report reflect those of the portfolio managers, only through the end of the period as stated on the cover. The portfolio managers' views are subject to change at any time based on market and other conditions.
Portfolio holdings are subject to change daily.
(1) On December 16, 2003, all outstanding shares of Class S were fully redeemed. On July 20, 2005, Class S recommenced operations. The returns for Class S include the performance for Class I, adjusted to reflect the higher expenses of Class S, for the period December 17, 2003 to July 19, 2005.
(2) The S&P 500® Index is an unmanaged index that measures the performance of the securities of approximately 500 of the largest companies in the U.S.
(3) The NYSE Arca Tech 100 IndexSM is a multi-industry technology index measuring the performance of companies using technology innovation across a broad spectrum of industries. It is comprised of 100 listed and over-the-counter stocks from 14 different subsectors including computer hardware, software, semiconductors, telecommunications, data storage and processing, electronics and biotechnology.
(4) Since inception performance for the indices is not shown.
Effective March 1, 2002, ING Investments, LLC began serving as investment adviser. Formerly, ING Investment Management Co. served as the investment adviser. Prior to January 1, 2004, the Portfolio was sub-advised by a different sub-adviser.
18
SHAREHOLDER EXPENSE EXAMPLES (UNAUDITED)
As a shareholder of a Portfolio, you incur two types of costs: (1) transaction costs, including redemption fees and exchange fees; and (2) ongoing costs, including management fees, distribution and/or service (12b-1) fees, and other Portfolio expenses. These Examples are intended to help you understand your ongoing costs (in dollars) of investing in a Portfolio and to compare these costs with the ongoing costs of investing in other mutual funds.
The Examples are based on an investment of $1,000 invested at the beginning of the period and held for the entire period from July 1, 2008 to December 31, 2008. The Portfolios' expenses are shown without the imposition of any charges which are, or may be, imposed under your annuity contract. Expenses would have been higher if such charges were included.
Actual Expenses
The first section of the table shown, "Actual Portfolio Return," provides information about actual account values and actual expenses. You may use the information in this section, together with the amount you invested, to estimate the expenses that you paid over the period. Simply divide your account value by $1,000 (for example, an $8,600 account value divided by $1,000 = 8.6), then multiply the result by the number in the first section under the heading entitled "Expenses Paid During the Period" to estimate the expenses you paid on your account during this period.
Hypothetical Example for Comparison Purposes
The second section of the table shown, "Hypothetical (5% return before expenses)," provides information about hypothetical account values and hypothetical expenses based on the Portfolio's actual expense ratio and an assumed rate of return of 5% per year before expenses, which is not the Portfolio's actual return. The hypothetical account values and expenses may not be used to estimate the actual ending account balance or expenses you paid for the period. You may use this information to compare the ongoing costs of investing in the Portfolio and other mutual funds. To do so, compare this 5% hypothetical example with the 5% hypothetical examples that appear in the shareholder reports of the other mutual funds.
Please note that the expenses shown in the table are meant to highlight your ongoing costs only and do not reflect any transactional costs, such as redemption fees or exchange fees. Therefore, the hypothetical lines of the table are useful in comparing ongoing costs only, and will not help you determine the relative total costs of owning different mutual funds. In addition, if these transactional costs were included, your costs would have been higher.
| | | Actual Portfolio Return | | Hypothetical (5% return before expenses) | |
| ING VP Balanced Portfolio | | Beginning
Account
Value
July 1,
2008 | | Ending
Account
Value
December 31,
2008 | | Annualized
Expense
Ratio | | Expenses Paid
During the
Period Ended
December 31,
2008* | | Beginning
Account
Value
July 1,
2008 | | Ending
Account
Value
December 31,
2008 | | Annualized
Expense
Ratio | | Expenses Paid
During the
Period Ended
December 31,
2008* | |
| Class ADV | | $ | 1,000.00 | | | $ | 782.00 | | | | 1.12 | % | | $ | 5.02 | | | $ | 1,000.00 | | | $ | 1,019.51 | | | | 1.12 | % | | $ | 5.69 | | |
| Class I | | | 1,000.00 | | | | 784.60 | | | | 0.62 | | | | 2.78 | | | | 1,000.00 | | | | 1,022.02 | | | | 0.62 | | | | 3.15 | | |
| Class S | | | 1,000.00 | | | | 783.50 | | | | 0.87 | | | | 3.90 | | | | 1,000.00 | | | | 1,020.76 | | | | 0.87 | | | | 4.42 | | |
| ING VP Growth and Income Portfolio | |
| Class ADV | | $ | 1,000.00 | | | $ | 696.40 | | | | 1.10 | % | | $ | 4.69 | | | $ | 1,000.00 | | | $ | 1,019.61 | | | | 1.10 | % | | $ | 5.58 | | |
| Class I | | | 1,000.00 | | | | 698.50 | | | | 0.60 | | | | 2.56 | | | | 1,000.00 | | | | 1,022.12 | | | | 0.60 | | | | 3.05 | | |
| Class S | | | 1,000.00 | | | | 697.10 | | | | 0.85 | | | | 3.63 | | | | 1,000.00 | | | | 1,020.86 | | | | 0.85 | | | | 4.32 | | |
| ING Opportunistic LargeCap Growth Portfolio | |
| Class ADV | | $ | 1,000.00 | | | $ | 664.40 | | | | 1.24 | % | | $ | 5.19 | | | $ | 1,000.00 | | | $ | 1,018.90 | | | | 1.24 | % | | $ | 6.29 | | |
| Class I | | | 1,000.00 | | | | 666.70 | | | | 0.74 | | | | 3.10 | | | | 1,000.00 | | | | 1,021.42 | | | | 0.74 | | | | 3.76 | | |
| Class S | | | 1,000.00 | | | | 665.70 | | | | 0.99 | | | | 4.15 | | | | 1,000.00 | | | | 1,020.16 | | | | 0.99 | | | | 5.03 | | |
* Expenses are equal to each Portfolio's respective annualized expense ratios multiplied by the average account value over the period, multiplied by 184/366 to reflect the most recent fiscal half-year.
19
SHAREHOLDER EXPENSE EXAMPLES (UNAUDITED) (CONTINUED)
| | | Actual Portfolio Return | | Hypothetical (5% return before expenses) | |
| ING VP Small Company Portfolio | | Beginning
Account
Value
July 1,
2008 | | Ending
Account
Value
December 31,
2008 | | Annualized
Expense
Ratio | | Expenses Paid
During the
Period Ended
December 31,
2008* | | Beginning
Account
Value
July 1,
2008 | | Ending
Account
Value
December 31,
2008 | | Annualized
Expense
Ratio | | Expenses Paid
During the
Period Ended
December 31,
2008* | |
| Class ADV(1) | | $ | 1,000.00 | | | $ | 1,040.40 | | | | 1.35 | % | | $ | 0.60 | | | $ | 1,000.00 | | | $ | 1,018.35 | | | | 1.35 | % | | $ | 6.85 | | |
| Class I | | | 1,000.00 | | | | 735.40 | | | | 0.85 | | | | 3.71 | | | | 1,000.00 | | | | 1,020.86 | | | | 0.85 | | | | 4.32 | | |
| Class S | | | 1,000.00 | | | | 734.10 | | | | 1.10 | | | | 4.79 | | | | 1,000.00 | | | | 1,019.61 | | | | 1.10 | | | | 5.58 | | |
| ING Opportunistic LargeCap Value Portfolio | |
| Class ADV | | $ | 1,000.00 | | | $ | 749.30 | | | | 1.21 | % | | $ | 5.32 | | | $ | 1,000.00 | | | $ | 1,019.05 | | | | 1.21 | % | | $ | 6.14 | | |
| Class I | | | 1,000.00 | | | | 749.60 | | | | 0.71 | | | | 3.12 | | | | 1,000.00 | | | | 1,021.57 | | | | 0.71 | | | | 3.61 | | |
| Class S | | | 1,000.00 | | | | 748.70 | | | | 0.96 | | | | 4.22 | | | | 1,000.00 | | | | 1,020.31 | | | | 0.96 | | | | 4.88 | | |
| ING VP Intermediate Bond Portfolio | |
| Class ADV | | $ | 1,000.00 | | | $ | 921.00 | | | | 1.00 | % | | $ | 4.83 | | | $ | 1,000.00 | | | $ | 1,020.11 | | | | 1.00 | % | | $ | 5.08 | | |
| Class I | | | 1,000.00 | | | | 926.30 | | | | 0.50 | | | | 2.42 | | | | 1,000.00 | | | | 1,022.62 | | | | 0.50 | | | | 2.54 | | |
| Class S | | | 1,000.00 | | | | 924.90 | | | | 0.75 | | | | 3.63 | | | | 1,000.00 | | | | 1,021.37 | | | | 0.75 | | | | 3.81 | | |
| ING VP Money Market Portfolio | |
| Class I | | $ | 1,000.00 | | | $ | 1,010.30 | | | | 0.35 | % | | $ | 1.77 | | | $ | 1,000.00 | | | $ | 1,023.38 | | | | 0.35 | % | | $ | 1.78 | | |
| ING BlackRock Global Science and Technology Portfolio | |
| Class ADV(1) | | $ | 1,000.00 | | | $ | 987.80 | | | | 1.56 | % | | $ | 0.68 | | | $ | 1,000.00 | | | $ | 1,017.29 | | | | 1.56 | % | | $ | 7.91 | | |
| Class I | | | 1,000.00 | | | | 687.60 | | | | 1.06 | | | | 4.50 | | | | 1,000.00 | | | | 1,019.81 | | | | 1.06 | | | | 5.38 | | |
| Class S | | | 1,000.00 | | | | 685.70 | | | | 1.31 | | | | 5.55 | | | | 1,000.00 | | | | 1,018.55 | | | | 1.31 | | | | 6.65 | | |
* Expenses are equal to each Portfolio's respective annualized expense ratios multiplied by the average account value over the period, multiplied by 184/366 to reflect the most recent fiscal half-year.
(1) Commencement of operations was December 16, 2008. Expenses paid for the Actual Portfolio Return reflect the 16 day period ended December 31, 2008.
20
REPORT OF INDEPENDENT REGISTERED PUBLIC ACCOUNTING FIRM
The Shareholders, Board of Directors/Trustees
ING VP Balanced Portfolio, Inc., ING Variable Funds, ING Variable Portfolios, Inc., ING VP Intermediate Bond Portfolio, and ING VP Money Market Portfolio
We have audited the accompanying statements of assets and liabilities, including the portfolios of investments, of ING VP Balanced Portfolio, ING VP Growth and Income Portfolio, a series of ING Variable Funds, ING Opportunistic LargeCap Growth Portfolio (formerly, ING VP Growth Portfolio), ING VP Small Company Portfolio, ING Opportunistic LargeCap Value Portfolio (formerly, ING VP Value Opportunity Portfolio), and ING BlackRock Global Science and Technology Portfolio (formerly, ING VP Global Science and Technology Portfolio), each a series of ING Variable Portfolios, Inc., ING VP Intermediate Bond Portfolio, and ING VP Money Market Portfolio as of December 31, 2008, and the related statements of operations for the year then ended, the statements of changes in net assets for each of the years in the two-year period then ended, and the financial highlights for each of the years or periods in the five-year period then ended. These financial sta tements and financial highlights are the responsibility of management. Our responsibility is to express an opinion on these financial statements and financial highlights based on our audits.
We conducted our audits in accordance with the standards of the Public Company Accounting Oversight Board (United States). Those standards require that we plan and perform the audit to obtain reasonable assurance about whether the financial statements and financial highlights are free of material misstatement. An audit includes examining, on a test basis, evidence supporting the amounts and disclosures in the financial statements. Our procedures included confirmation of securities owned as of December 31, 2008, by correspondence with the custodian and brokers, or by other appropriate auditing procedures when replies from brokers were not received. An audit also includes assessing the accounting principles used and significant estimates made by management, as well as evaluating the overall financial statement presentation. We believe that our audits provide a reasonable basis for our opinion.
In our opinion, the financial statements and financial highlights referred to above present fairly, in all material respects, the financial position of the aforementioned portfolios as of December 31, 2008, and the results of their operations, the changes in their net assets, and the financial highlights for the periods specified in the first paragraph above, in conformity with U.S. generally accepted accounting principles.
Boston, Massachusetts
February 27, 2009
21
STATEMENTS OF ASSETS AND LIABILITIES AS OF DECEMBER 31, 2008
| | | ING
VP Balanced
Portfolio | | ING
VP Growth
and Income
Portfolio | | ING
Opportunistic
LargeCap Growth
Portfolio | | ING
VP Small
Company
Portfolio | |
| ASSETS: | |
| Investments in securities at value+* | | $ | 621,389,188 | | | $ | 1,870,066,277 | | | $ | 66,337,602 | | | $ | 453,880,423 | | |
| Short-term investments** | | | 33,714,630 | | | | 3,636,739 | | | | 771,235 | | | | 27,093,656 | | |
| Short-term investments in affiliates*** | | | 3,543,000 | | | | 8,173,000 | | | | 765,000 | | | | 9,691,000 | | |
| Short-term investments at amortized cost | | | 15,181,583 | | | | 21,963,180 | | | | — | | | | 4,897,000 | | |
| Cash | | | 2,896,722 | | | | 3,124 | | | | 175 | | | | 794 | | |
| Cash collateral for futures | | | 3,430,111 | | | | 495,000 | | | | — | | | | — | | |
| Foreign currencies at value**** | | | — | | | | 25,298 | | | | — | | | | — | | |
| Receivables: | |
| Investment securities sold | | | 3,175,224 | | | | 15,730,296 | | | | 1,943,832 | | | | 3,051,816 | | |
Investment securities sold on a delayed-delivery
or when-issued basis | | | 36,910,412 | | | | — | | | | — | | | | — | | |
| Fund shares sold | | | 164 | | | | 508,384 | | | | 17,316 | | | | 575,164 | | |
| Dividends and interest | | | 2,445,320 | | | | 3,645,141 | | | | 69,693 | | | | 508,740 | | |
| Variation margin | | | 513,647 | | | | 59,500 | | | | — | | | | — | | |
Unrealized appreciation on forward foreign
currency contracts | | | 81,262 | | | | — | | | | — | | | | — | | |
| Upfront payments made on swap agreements | | | 1,532,465 | | | | — | | | | — | | | | — | | |
| Unrealized appreciation on swap agreements | | | 6,174,529 | | | | — | | | | — | | | | — | | |
| Prepaid expenses | | | 36,793 | | | | 110,498 | | | | 4,565 | | | | 24,041 | | |
| Total assets | | | 731,025,050 | | | | 1,924,416,437 | | | | 69,909,418 | | | | 499,722,634 | | |
| LIABILITIES: | |
| Payable for investment securities purchased | | | 3,186,254 | | | | 4,099,523 | | | | 1,983,441 | | | | 5,972,857 | | |
Payable for investment securities purchased
on a delayed-delivery or when-issued basis | | | 78,845,362 | | | | — | | | | — | | | | — | | |
| Payable for fund shares redeemed | | | 672,426 | | | | 2,301,498 | | | | — | | | | 394,408 | | |
| Payable for futures variation margin | | | 38,250 | | | | — | | | | — | | | | — | | |
| Payable upon receipt of securities loaned | | | 34,040,061 | | | | 3,721,142 | | | | 806,060 | | | | 27,583,319 | | |
| Payable for terminated investment contracts (Note 12) | | | 716,432 | | | | — | | | | — | | | | — | | |
Unrealized depreciation on forward foreign
currency contracts | | | 244,654 | | | | — | | | | — | | | | — | | |
| Upfront payments received on swap agreements | | | 814,938 | | | | — | | | | — | | | | — | | |
| Unrealized depreciation on swap agreements | | | 2,547,547 | | | | — | | | | — | | | | — | | |
| Payable to affiliates | | | 281,626 | | | | 932,471 | | | | 37,786 | | | | 301,326 | | |
Payable to custodian due to foreign
currency overdraft***** | | | 4,674 | | | | — | | | | — | | | | — | | |
| Payable for directors fees | | | 17,194 | | | | 38,166 | | | | 6,670 | | | | 7,967 | | |
| Other accrued expenses and liabilities | | | 116,033 | | | | 295,706 | | | | 39,690 | | | | 68,641 | | |
| Total liabilities | | | 121,525,451 | | | | 11,388,506 | | | | 2,873,647 | | | | 34,328,518 | | |
| NET ASSETS | | $ | 609,499,599 | | | $ | 1,913,027,931 | | | $ | 67,035,771 | | | $ | 465,394,116 | | |
| NET ASSETS WERE COMPRISED OF: | |
| Paid-in capital | | $ | 861,454,439 | | | $ | 4,654,067,773 | | | $ | 261,220,083 | | | $ | 652,033,039 | | |
Undistributed net investment income
(distributions in excess of net investment income) | | | 24,101,484 | | | | — | | | | 421,521 | | | | 3,541,835 | | |
Accumulated net realized loss on investments,
foreign currency related transactions,
futures, and swaps | | | (155,879,879 | ) | | | (2,548,558,745 | ) | | | (182,407,796 | ) | | | (74,164,152 | ) | |
Net unrealized depreciation on investments,
foreign currency related transactions,
futures, and swaps | | | (120,176,445 | ) | | | (192,481,097 | ) | | | (12,198,037 | ) | | | (116,016,606 | ) | |
| NET ASSETS | | $ | 609,499,599 | | | $ | 1,913,027,931 | | | $ | 67,035,771 | | | $ | 465,394,116 | | |
| + Including securities loaned at value | | $ | 33,428,996 | | | $ | 3,518,884 | | | $ | 785,577 | | | $ | 27,375,069 | | |
| * Cost of investments in securities | | $ | 744,243,467 | | | $ | 2,062,504,051 | | | $ | 78,500,814 | | | $ | 569,407,366 | | |
| ** Cost of short-term investments | | $ | 34,040,061 | | | $ | 3,721,142 | | | $ | 806,060 | | | $ | 27,583,319 | | |
| *** Cost of short-term investments in affiliates | | $ | 3,543,000 | | | $ | 8,173,000 | | | $ | 765,000 | | | $ | 9,691,000 | | |
| **** Cost of foreign currencies | | $ | — | | | $ | 24,622 | | | $ | — | | | $ | — | | |
| ***** Cost of foreign currency overdraft | | $ | 5,453 | | | $ | — | | | $ | — | | | $ | — | | |
See Accompanying Notes to Financial Statements
22
STATEMENTS OF ASSETS AND LIABILITIES AS OF DECEMBER 31, 2008 (CONTINUED)
| | | ING
VP Balanced
Portfolio | | ING
VP Growth
and Income
Portfolio | | ING
Opportunistic
LargeCap Growth
Portfolio | | ING
VP Small
Company
Portfolio | |
| Class ADV: | |
| Net assets | | $ | 629 | | | $ | 790,893 | | | $ | 589,506 | | | $ | 3,122 | | |
| Shares authorized | | | 500,000,000 | | | | unlimited | | | | 100,000,000 | | | | 100,000,000 | | |
| Par value | | $ | 0.001 | | | $ | 1.00 | | | $ | 0.001 | | | $ | 0.001 | | |
| Shares outstanding | | | 69 | | | | 52,593 | | | | 85,006 | | | | 270 | | |
| Net asset value and redemption price per share | | $ | 9.11 | | | $ | 15.04 | | | $ | 6.93 | | | $ | 11.58 | | |
| Class I: | |
| Net assets | | $ | 602,815,045 | | | $ | 1,622,085,238 | | | $ | 59,411,868 | | | $ | 420,626,499 | | |
| Shares authorized | | | 500,000,000 | | | | unlimited | | | | 100,000,000 | | | | 100,000,000 | | |
| Par value | | $ | 0.001 | | | $ | 1.00 | | | $ | 0.001 | | | $ | 0.001 | | |
| Shares outstanding | | | 65,666,210 | | | | 107,384,135 | | | | 8,537,443 | | | | 35,951,337 | | |
| Net asset value and redemption price per share | | $ | 9.18 | | | $ | 15.11 | | | $ | 6.96 | | | $ | 11.70 | | |
| Class S: | |
| Net assets | | $ | 6,683,925 | | | $ | 290,151,800 | | | $ | 7,034,397 | | | $ | 44,764,495 | | |
| Shares authorized | | | 500,000,000 | | | | unlimited | | | | 100,000,000 | | | | 100,000,000 | | |
| Par value | | $ | 0.001 | | | $ | 1.00 | | | $ | 0.001 | | | $ | 0.001 | | |
| Shares outstanding | | | 732,898 | | | | 19,338,593 | | | | 1,020,783 | | | | 3,867,343 | | |
| Net asset value and redemption price per share | | $ | 9.12 | | | $ | 15.00 | | | $ | 6.89 | | | $ | 11.57 | | |
See Accompanying Notes to Financial Statements
23
STATEMENTS OF ASSETS AND LIABILITIES AS OF DECEMBER 31, 2008
| | | ING
Opportunistic
LargeCap Value
Portfolio | | ING
VP Intermediate
Bond
Portfolio | | ING
VP Money
Market
Portfolio | | ING
BlackRock Global
Science and Technology
Portfolio | |
| ASSETS: | |
| Investments in securities at value+* | | $ | 85,618,789 | | | $ | 3,131,220,860 | | | $ | — | | | $ | 136,172,288 | | |
| Short-term investments** | | | 4,865,356 | | | | 361,444,378 | | | | 741,749 | | | | 5,437,097 | | |
| Short-term investment in affiliates*** | | | — | | | | 67,118,000 | | | | — | | | | — | | |
| Short-term investments at amortized cost | | | — | | | | 427,195,573 | | | | 1,386,906,572 | | | | — | | |
| Repurchase agreement | | | — | | | | — | | | | 232,200,000 | | | | — | | |
| Cash | | | — | | | | 50,976,231 | | | | 182,425,773 | | | | 8,225,588 | | |
| Cash collateral for futures | | | — | | | | 31,314,374 | | | | — | | | | — | | |
| Foreign currencies at value**** | | | — | | | | 219,290 | | | | — | | | | 1,192,758 | | |
| Receivables: | |
| Investment securities sold | | | 282,123 | | | | 2,270,118 | | | | — | | | | — | | |
Investment securities sold on a delayed-delivery
or when-issued basis | | | — | | | | 1,033,108,041 | | | | — | | | | — | | |
| Fund shares sold | | | 1,816 | | | | 247,006 | | | | 180,958 | | | | 564,799 | | |
| Dividends and interest | | | 165,690 | | | | 20,510,686 | | | | 2,606,221 | | | | 117,107 | | |
| Variation margin | | | — | | | | 7,024,532 | | | | — | | | | — | | |
Unrealized appreciation on forward foreign
currency contracts | | | — | | | | 1,114,810 | | | | — | | | | 149,242 | | |
| Upfront payments made on swap agreements | | | — | | | | 19,887,974 | | | | — | | | | — | | |
| Unrealized appreciation on swap agreements | | | — | | | | 66,366,701 | | | | — | | | | — | | |
| Prepaid expenses | | | 5,206 | | | | 158,292 | | | | 86,142 | | | | 7,395 | | |
| Reimbursement due from manager | | | — | | | | — | | | | — | | | | 15,575 | | |
| Total assets | | | 90,938,980 | | | | 5,220,176,866 | | | | 1,805,147,415 | | | | 151,881,849 | | |
| LIABILITIES: | |
Payable for investment securities purchased
on a delayed-delivery or when-issued basis | | | — | | | | 1,820,709,882 | | | | — | | | | — | | |
| Payable for fund shares redeemed | | | 178,955 | | | | 58,681,156 | | | | 4,845,606 | | | | 303 | | |
| Payable for futures variation margin | | | — | | | | 21,538 | | | | — | | | | — | | |
| Payable upon receipt of securities loaned | | | 4,910,714 | | | | 337,644,986 | | | | 891,150 | | | | 5,516,457 | | |
Payable for terminated investment contracts
(Note 12) | | | — | | | | 2,597,084 | | | | — | | | | — | | |
Unrealized depreciation on forward foreign
currency contracts | | | — | | | | 3,411,380 | | | | — | | | | 751,086 | | |
| Upfront payments received on swap agreements | | | — | | | | 9,372,272 | | | | — | | | | — | | |
| Unrealized depreciation on swap agreements | | | — | | | | 28,758,878 | | | | — | | | | — | | |
| Payable to affiliates | | | 48,473 | | | | 1,377,041 | | | | 466,384 | | | | 137,618 | | |
| Payable to custodian due to bank overdraft | | | 22,984 | | | | — | | | | — | | | | — | | |
| Payable for directors fees | | | 4,636 | | | | 36,705 | | | | 17,092 | | | | 1,068 | | |
| Other accrued expenses and liabilities | | | 27,524 | | | | 160,993 | | | | 94,258 | | | | 25,904 | | |
| Total liabilities | | | 5,193,286 | | | | 2,262,771,915 | | | | 6,314,490 | | | | 6,432,436 | | |
| NET ASSETS | | $ | 85,745,694 | | | $ | 2,957,404,951 | | | $ | 1,798,832,925 | | | $ | 145,449,413 | | |
| NET ASSETS WERE COMPRISED OF: | |
| Paid-in capital | | $ | 132,409,634 | | | $ | 3,544,232,942 | | | $ | 1,801,087,841 | | | $ | 237,461,122 | | |
Undistributed net investment income
(distributions in excess of net investment income) | | | 2,610,842 | | | | (24,551,451 | ) | | | — | | | | 602,097 | | |
Accumulated net realized loss on investments,
foreign currency related transactions,
futures, and swaps | | | (30,965,902 | ) | | | (133,054,008 | ) | | | (2,105,515 | ) | | | (36,901,358 | ) | |
Net unrealized depreciation on investments,
foreign currency related transactions,
futures, and swaps | | | (18,308,880 | ) | | | (429,222,532 | ) | | | (149,401 | ) | | | (55,712,448 | ) | |
| NET ASSETS | | $ | 85,745,694 | | | $ | 2,957,404,951 | | | $ | 1,798,832,925 | | | $ | 145,449,413 | | |
| + Including securities loaned at value | | $ | 4,874,163 | | | $ | 328,881,005 | | | $ | 867,611 | | | $ | 5,459,636 | | |
| * Cost of investments in securities | | $ | 103,882,311 | | | $ | 3,578,288,949 | | | $ | — | | | $ | 191,208,164 | | |
| ** Cost of short-term investments | | $ | 4,910,714 | | | $ | 364,068,271 | | | $ | 891,150 | | | $ | 5,516,457 | | |
| *** Cost of short-term investment in affiliate | | $ | — | | | $ | 67,118,000 | | | $ | — | | | $ | — | | |
| **** Cost of foreign currencies | | $ | — | | | $ | 228,104 | | | $ | — | | | $ | 1,188,402 | | |
See Accompanying Notes to Financial Statements
24
STATEMENTS OF ASSETS AND LIABILITIES AS OF DECEMBER 31, 2008 (CONTINUED)
| | | ING
Opportunistic
LargeCap Value
Portfolio | | ING
VP Intermediate
Bond
Portfolio | | ING
VP Money
Market
Portfolio | | ING
BlackRock Global
Science and Technology
Portfolio | |
| Class ADV: | |
| Net assets | | $ | 548 | | | $ | 836 | | | | n/a | | | $ | 2,965 | | |
| Shares authorized | | | 100,000,000 | | | | unlimited | | | | n/a | | | | 100,000,000 | | |
| Par value | | $ | 0.001 | | | $ | 1.00 | | | | n/a | | | $ | 0.001 | | |
| Shares outstanding | | | 64 | | | | 75 | | | | n/a | | | | 912 | | |
| Net asset value and redemption price per share | | $ | 8.52 | | | $ | 11.12 | | | | n/a | | | $ | 3.25 | | |
| Class I: | |
| Net assets | | $ | 73,763,896 | | | $ | 1,803,886,303 | | | $ | 1,798,832,925 | | | $ | 55,898,668 | | |
| Shares authorized | | | 100,000,000 | | | | unlimited | | | | unlimited | | | | 100,000,000 | | |
| Par value | | $ | 0.001 | | | $ | 1.00 | | | $ | 1.00 | | | $ | 0.001 | | |
| Shares outstanding | | | 8,524,418 | | | | 162,783,431 | | | | 1,795,880,850 | | | | 17,039,070 | | |
| Net asset value and redemption price per share | | $ | 8.65 | | | $ | 11.08 | | | $ | 1.00 | | | $ | 3.28 | | |
| Class S: | |
| Net assets | | $ | 11,981,250 | | | $ | 1,153,517,812 | | | | n/a | | | $ | 89,547,780 | | |
| Shares authorized | | | 100,000,000 | | | | unlimited | | | | n/a | | | | 100,000,000 | | |
| Par value | | $ | 0.001 | | | $ | 1.00 | | | | n/a | | | $ | 0.001 | | |
| Shares outstanding | | | 1,395,847 | | | | 104,819,711 | | | | n/a | | | | 27,527,309 | | |
| Net asset value and redemption price per share | | $ | 8.58 | | | $ | 11.00 | | | | n/a | | | $ | 3.25 | | |
See Accompanying Notes to Financial Statements
25
STATEMENTS OF OPERATIONS FOR THE YEAR ENDED DECEMBER 31, 2008
| | | ING
VP Balanced
Portfolio | | ING
VP Growth
and Income
Portfolio | | ING
Opportunistic
LargeCap Growth
Portfolio | | ING
VP Small
Company
Portfolio | |
| INVESTMENT INCOME: | |
| Dividends, net of foreign taxes withheld*(1) | | $ | 11,645,045 | | | $ | 52,272,689 | | | $ | 1,208,395 | | | $ | 7,523,478 | | |
| Interest | | | 17,864,681 | | | | 778,577 | | | | 5,749 | | | | 47,371 | | |
| Securities lending income, net | | | 916,444 | | | | 1,267,011 | | | | 55,822 | | | | 1,030,241 | | |
| Total investment income | | | 30,426,170 | | | | 54,318,277 | | | | 1,269,966 | | | | 8,601,090 | | |
| EXPENSES: | |
| Investment management fees | | | 4,238,780 | | | | 12,112,516 | | | | 652,226 | | | | 4,109,492 | | |
| Distribution and service fees: | |
| Class ADV | | | 6 | | | | 4,948 | | | | 5,224 | | | | — | | |
| Class S | | | 21,753 | | | | 336,286 | | | | 32,947 | | | | 47,625 | | |
| Transfer agent fees | | | 913 | | | | 9,920 | | | | 463 | | | | 600 | | |
| Administrative service fees | | | 466,256 | | | | 1,332,360 | | | | 59,786 | | | | 301,356 | | |
| Shareholder reporting expense | | | 83,590 | | | | 217,627 | | | | 20,470 | | | | 37,995 | | |
| Registration fees | | | 839 | | | | 2,286 | | | | — | | | | 464 | | |
| Professional fees | | | 213,605 | | | | 276,624 | | | | 22,335 | | | | 64,215 | | |
| Custody and accounting expense | | | 141,200 | | | | 259,268 | | | | 22,590 | | | | 73,270 | | |
| Directors fees | | | 58,580 | | | | 181,745 | | | | 13,176 | | | | 42,653 | | |
| Miscellaneous expense | | | 52,925 | | | | 132,312 | | | | 13,446 | | | | 37,269 | | |
| Interest expense | | | 172 | | | | 3,675 | | | | 1,135 | | | | 1,982 | | |
| Total expenses | | | 5,278,619 | | | | 14,869,567 | | | | 843,798 | | | | 4,716,921 | | |
| Net waived and reimbursed fees | | | (15,078 | ) | | | (16,163 | ) | | | (173 | ) | | | (11,852 | ) | |
| Brokerage commission recapture | | | — | | | | (1,494 | ) | | | (251 | ) | | | — | | |
| Net expenses | | | 5,263,541 | | | | 14,851,910 | | | | 843,374 | | | | 4,705,069 | | |
| Net investment income | | | 25,162,629 | | | | 39,466,367 | | | | 426,592 | | | | 3,896,021 | | |
REALIZED AND UNREALIZED GAIN (LOSS) ON
INVESTMENTS, FOREIGN CURRENCY RELATED
TRANSACTIONS, FUTURES, SWAPS, AND
PAYMENTS BY AFFILIATES: | |
| Net realized gain (loss) on: | |
| Investments | | | (145,750,821 | ) | | | (659,681,636 | ) | | | (42,958,725 | ) | | | (73,348,618 | ) | |
| Foreign currency related transactions | | | (262,143 | ) | | | 45,539 | | | | — | | | | — | | |
| Futures | | | (4,328,609 | ) | | | (14,168,905 | ) | | | — | | | | — | | |
| Swaps | | | (1,565,179 | ) | | | — | | | | — | | | | — | | |
| Payments by affiliates (Note 16) | | | — | | | | 2,198 | | | | — | | | | — | | |
Net realized loss on investments, foreign
currency related transactions, futures, swaps,
and payments by affiliates | | | (151,906,752 | ) | | | (673,802,804 | ) | | | (42,958,725 | ) | | | (73,348,618 | ) | |
Net change in unrealized appreciation
or depreciation on: | |
| Investments | | | (139,810,120 | ) | | | (515,569,150 | ) | | | (18,373,805 | ) | | | (127,986,885 | ) | |
| Foreign currency related transactions | | | (375,416 | ) | | | (4,473 | ) | | | — | | | | — | | |
| Futures | | | (86,769 | ) | | | 297,375 | | | | — | | | | — | | |
| Swaps | | | 2,334,219 | | | | — | | | | — | | | | — | | |
Net change in unrealized appreciation or
depreciation on investments, foreign currency
related transactions, futures, and swaps | | | (137,938,086 | ) | | | (515,276,248 | ) | | | (18,373,805 | ) | | | (127,986,885 | ) | |
Net realized and unrealized loss on investments,
foreign currency related transactions, futures,
swaps, and payments by affiliates | | | (289,844,838 | ) | | | (1,189,079,052 | ) | | | (61,332,530 | ) | | | (201,335,503 | ) | |
| Decrease in net assets resulting from operations | | $ | (264,682,209 | ) | | $ | (1,149,612,685 | ) | | $ | (60,905,938 | ) | | $ | (197,439,482 | ) | |
| * Foreign taxes withheld | | $ | 27 | | | $ | 472,416 | | | $ | 7,964 | | | $ | 6,768 | | |
| (1) Dividends from affiliates | | $ | 563,666 | | | $ | 635,125 | | | $ | 5,395 | | | $ | 419,603 | | |
See Accompanying Notes to Financial Statements
26
STATEMENTS OF OPERATIONS FOR THE YEAR ENDED DECEMBER 31, 2008
| | | ING
Opportunistic
LargeCap Value
Portfolio | | ING
VP Intermediate
Bond
Portfolio | | ING
VP Money
Market
Portfolio | | ING
BlackRock Global
Science and Technology
Portfolio | |
| INVESTMENT INCOME: | |
| Dividends, net of foreign taxes withheld*(1) | | $ | 3,471,040 | | | $ | 5,593,126 | | | $ | — | | | $ | 1,598,902 | | |
| Interest | | | 4,090 | | | | 178,467,228 | | | | 52,722,090 | | | | 196,769 | | |
| Securities lending income, net | | | 87,936 | | | | 7,672,572 | | | | 130,721 | | | | 137,034 | | |
| Total investment income | | | 3,563,066 | | | | 191,732,926 | | | | 52,852,811 | | | | 1,932,705 | | |
| EXPENSES: | |
| Investment management fees | | | 743,715 | | | | 13,786,402 | | | | 4,386,202 | | | | 1,507,847 | | |
| Distribution and service fees: | |
| Class ADV | | | 4 | | | | 8 | | | | — | | | | — | | |
| Class S | | | 44,358 | | | | 3,039,126 | | | | — | | | | 202,881 | | |
| Transfer agent fees | | | 499 | | | | 9,273 | | | | 1,181 | | | | 476 | | |
| Administrative service fees | | | 68,173 | | | | 1,895,600 | | | | 964,944 | | | | 87,294 | | |
| Shareholder reporting expense | | | 17,529 | | | | 238,400 | | | | 139,812 | | | | 12,816 | | |
| Registration fees | | | — | | | | 2,446 | | | | 6,303 | | | | — | | |
| Professional fees | | | 11,555 | | | | 526,656 | | | | 235,750 | | | | 33,970 | | |
| Custody and accounting expense | | | 18,567 | | | | 384,217 | | | | 208,950 | | | | 49,406 | | |
| Directors fees | | | 10,178 | | | | 234,669 | | | | 109,620 | | | | 11,878 | | |
| Miscellaneous expense | | | 12,826 | | | | 406,880 | | | | 83,986 | | | | 9,248 | | |
| Interest expense | | | 184 | | | | 2,895 | | | | — | | | | — | | |
| Total expenses | | | 927,588 | | | | 20,526,572 | | | | 6,136,748 | | | | 1,915,816 | | |
| Net waived and reimbursed fees | | | (126 | ) | | | (103,127 | ) | | | — | | | | (32,093 | ) | |
| Net expenses | | | 927,462 | | | | 20,423,445 | | | | 6,136,748 | | | | 1,883,723 | | |
| Net investment income | | | 2,635,604 | | | | 171,309,481 | | | | 46,716,063 | | | | 48,982 | | |
REALIZED AND UNREALIZED GAIN (LOSS) ON
INVESTMENTS, FOREIGN CURRENCY RELATED
TRANSACTIONS, FUTURES, SWAPS, AND
PAYMENTS BY AFFILIATES: | |
| Net realized gain (loss) on: | |
| Investments | | | (29,984,551 | ) | | | (23,174,537 | ) | | | 2,471,989 | | | | (16,891,761 | ) | |
| Foreign currency related transactions | | | — | | | | (3,391,686 | ) | | | — | | | | (451,040 | ) | |
| Futures | | | — | | | | (52,196,592 | ) | | | — | | | | — | | |
| Swaps | | | — | | | | (16,864,693 | ) | | | — | | | | — | | |
| Payments by affiliates (Note 16) | | | 22,573 | | | | — | | | | — | | | | — | | |
Net realized gain (loss) on investments, foreign
currency related transactions, futures, swaps, and
payments by affiliates | | | (29,961,978 | ) | | | (95,627,508 | ) | | | 2,471,989 | | | | (17,342,801 | ) | |
Net change in unrealized appreciation
or depreciation on: | |
| Investments | | | (25,565,739 | ) | | | (393,989,177 | ) | | | (149,401 | ) | | | (69,903,171 | ) | |
| Foreign currency related transactions | | | — | | | | (4,002,008 | ) | | | — | | | | (459,168 | ) | |
| Futures | | | — | | | | (13,542,791 | ) | | | — | | | | — | | |
| Swaps | | | — | | | | 28,607,066 | | | | — | | | | — | | |
Net change in unrealized appreciation or
depreciation on investments, foreign currency
related transactions, futures, and swaps | | | (25,565,739 | ) | | | (382,926,910 | ) | | | (149,401 | ) | | | (70,362,339 | ) | |
Net realized and unrealized gain (loss) on investments,
foreign currency related transactions, futures,
swaps, and payments by affiliates | | | (55,527,717 | ) | | | (478,554,418 | ) | | | 2,322,588 | | | | (87,705,140 | ) | |
Increase (decrease) in net assets resulting from
operations | | $ | (52,892,113 | ) | | $ | (307,244,937 | ) | | $ | 49,038,651 | | | $ | (87,656,158 | ) | |
| * Foreign taxes withheld | | $ | 53,450 | | | $ | — | | | $ | — | | | $ | 90,259 | | |
| (1) Dividends from affiliates | | $ | 4,014 | | | $ | 3,251,538 | | | $ | — | | | $ | — | | |
See Accompanying Notes to Financial Statements
27
STATEMENTS OF CHANGES IN NET ASSETS
| | | ING VP Balanced Portfolio | | ING VP Growth and Income Portfolio | |
| | | Year
Ended
December 31,
2008 | | Year
Ended
December 31,
2007 | | Year
Ended
December 31,
2008 | | Year
Ended
December 31,
2007 | |
| FROM OPERATIONS: | |
| Net investment income | | $ | 25,162,629 | | | $ | 30,275,597 | | | $ | 39,466,367 | | | $ | 39,549,958 | | |
Net realized gain (loss) on investments, foreign
currency related transactions, futures, swaps, and
payments by affiliates | | | (151,906,752 | ) | | | 87,413,218 | | | | (673,802,804 | ) | | | 312,390,947 | | |
Net change in unrealized appreciation or depreciation on
investments, foreign currency related transactions,
futures, and swaps | | | (137,938,086 | ) | | | (54,913,731 | ) | | | (515,276,248 | ) | | | (132,775,658 | ) | |
Increase (decrease) in net assets resulting from
operations | | | (264,682,209 | ) | | | 62,775,084 | | | | (1,149,612,685 | ) | | | 219,165,247 | | |
| FROM DISTRIBUTIONS TO SHAREHOLDERS: | |
| Net investment income: | |
| Class ADV | | | (24 | ) | | | (27 | ) | | | (11,483 | ) | | | (15,923 | ) | |
| Class I | | | (30,852,412 | ) | | | (30,215,749 | ) | | | (33,754,627 | ) | | | (39,306,243 | ) | |
| Class S | | | (281,504 | ) | | | (258,983 | ) | | | (5,751,055 | ) | | | (348,348 | ) | |
| Net realized gains: | |
| Class ADV | | | (81 | ) | | | (40 | ) | | | — | | | | — | | |
| Class I | | | (79,796,689 | ) | | | (44,705,487 | ) | | | — | | | | — | | |
| Class S | | | (795,569 | ) | | | (414,002 | ) | | | — | | | | — | | |
| Total distributions | | | (111,726,279 | ) | | | (75,594,288 | ) | | | (39,517,165 | ) | | | (39,670,514 | ) | |
| FROM CAPITAL SHARE TRANSACTIONS: | |
| Net proceeds from sale of shares | | | 5,172,233 | | | | 10,060,036 | | | | 347,174,111 | | | | 8,193,101 | | |
| Proceeds from shares issued in merger (Note 14) | | | — | | | | — | | | | 353,711,801 | | | | 74,681,070 | | |
| Reinvestment of distributions | | | 111,726,174 | | | | 75,594,221 | | | | 39,492,686 | | | | 39,643,089 | | |
| | | | 116,898,407 | | | | 85,654,257 | | | | 740,378,598 | | | | 122,517,260 | | |
| Cost of shares redeemed | | | (187,770,892 | ) | | | (210,666,560 | ) | | | (460,715,815 | ) | | | (582,395,681 | ) | |
Net increase (decrease) in net assets resulting from
capital share transactions | | | (70,872,485 | ) | | | (125,012,303 | ) | | | 279,662,783 | | | | (459,878,421 | ) | |
| Net decrease in net assets | | | (447,280,973 | ) | | | (137,831,507 | ) | | | (909,467,067 | ) | | | (280,383,688 | ) | |
| NET ASSETS: | |
| Beginning of year | | | 1,056,780,572 | | | | 1,194,612,079 | | | | 2,822,494,998 | | | | 3,102,878,686 | | |
| End of year | | $ | 609,499,599 | | | $ | 1,056,780,572 | | | $ | 1,913,027,931 | | | $ | 2,822,494,998 | | |
| Undistributed net investment income at end of year | | $ | 24,101,484 | | | $ | 29,652,010 | | | $ | — | | | $ | — | | |
See Accompanying Notes to Financial Statements
28
STATEMENTS OF CHANGES IN NET ASSETS
| | | ING Opportunistic
LargeCap Growth Portfolio | | ING VP Small Company Portfolio | |
| | | Year
Ended
December 31,
2008 | | Year
Ended
December 31,
2007 | | Year
Ended
December 31,
2008 | | Year
Ended
December 31,
2007 | |
| FROM OPERATIONS: | |
| Net investment income | | $ | 426,592 | | | $ | 791,630 | | | $ | 3,896,021 | | | $ | 6,680,858 | | |
| Net realized gain (loss) on investments | | | (42,958,725 | ) | | | 44,248,409 | | | | (73,348,618 | ) | | | 72,679,556 | | |
Net change in unrealized appreciation or depreciation on
investments | | | (18,373,805 | ) | | | (12,856,157 | ) | | | (127,986,885 | ) | | | (50,313,212 | ) | |
| Increase (decrease) in net assets resulting from operations | | | (60,905,938 | ) | | | 32,183,882 | | | | (197,439,482 | ) | | | 29,047,202 | | |
| FROM DISTRIBUTIONS TO SHAREHOLDERS: | |
| Net investment income: | |
| Class ADV | | | — | | | | (5,297 | ) | | | — | | | | — | | |
| Class I | | | (749,873 | ) | | | (317,593 | ) | | | (5,835,407 | ) | | | (935,976 | ) | |
| Class S | | | (45,652 | ) | | | (41,178 | ) | | | (24,190 | ) | | | — | | |
| Net realized gains: | | | | | | | | | | | | | | | | | |
| Class I | | | — | | | | — | | | | (73,864,230 | ) | | | (76,399,058 | ) | |
| Class S | | | — | | | | — | | | | (384,889 | ) | | | (343,384 | ) | |
| Total distributions | | | (795,525 | ) | | | (364,068 | ) | | | (80,108,716 | ) | | | (77,678,418 | ) | |
| FROM CAPITAL SHARE TRANSACTIONS: | |
| Net proceeds from sale of shares | | | 5,106,219 | | | | 14,782,965 | | | | 213,494,928 | | | | 167,605,751 | | |
| Proceeds from shares issued in merger (Note 14) | | | — | | | | 36,851,627 | | | | — | | | | — | | |
| Reinvestment of distributions | | | 795,525 | | | | 364,068 | | | | 80,108,716 | | | | 77,678,418 | | |
| | | | 5,901,744 | | | | 51,998,660 | | | | 293,603,644 | | | | 245,284,169 | | |
| Cost of shares redeemed | | | (36,759,935 | ) | | | (110,992,399 | ) | | | (157,042,784 | ) | | | (104,878,944 | ) | |
Net increase (decrease) in net assets resulting from
capital share transactions | | | (30,858,191 | ) | | | (58,993,739 | ) | | | 136,560,860 | | | | 140,405,225 | | |
| Net increase (decrease) in net assets | | | (92,559,654 | ) | | | (27,173,925 | ) | | | (140,987,338 | ) | | | 91,774,009 | | |
| NET ASSETS: | |
| Beginning of year | | | 159,595,425 | | | | 186,769,350 | | | | 606,381,454 | | | | 514,607,445 | | |
| End of year | | $ | 67,035,771 | | | $ | 159,595,425 | | | $ | 465,394,116 | | | $ | 606,381,454 | | |
| Undistributed net investment income at end of year | | $ | 421,521 | | | $ | 790,454 | | | $ | 3,541,835 | | | $ | 5,914,678 | | |
See Accompanying Notes to Financial Statements
29
STATEMENTS OF CHANGES IN NET ASSETS
| | | ING Opportunistic
LargeCap Value Portfolio | | ING VP Intermediate
Bond Portfolio | |
| | | Year
Ended
December 31,
2008 | | Year
Ended
December 31,
2007 | | Year
Ended
December 31,
2008 | | Year
Ended
December 31,
2007 | |
| FROM OPERATIONS: | |
| Net investment income | | $ | 2,635,604 | | | $ | 2,650,025 | | | $ | 171,309,481 | | | $ | 150,321,596 | | |
Net realized gain (loss) on investments, foreign
currency related transactions, futures, swaps, and
payments by affiliates | | | (29,961,978 | ) | | | 25,750,024 | | | | (95,627,508 | ) | | | 59,827,309 | | |
Net change in unrealized appreciation or depreciation on
investments, foreign currency related transactions,
futures, and swaps | | | (25,565,739 | ) | | | (22,057,799 | ) | | | (382,926,910 | ) | | | (39,635,582 | ) | |
| Increase (decrease) in net assets resulting from operations | | | (52,892,113 | ) | | | 6,342,250 | | | | (307,244,937 | ) | | | 170,513,323 | | |
| FROM DISTRIBUTIONS TO SHAREHOLDERS: | |
| Net investment income: | |
| Class ADV | | | (11 | ) | | | (17 | ) | | | (47 | ) | | | (34 | ) | |
| Class I | | | (2,288,554 | ) | | | (2,729,403 | ) | | | (118,136,444 | ) | | | (83,987,331 | ) | |
| Class S | | | (316,610 | ) | | | (385,996 | ) | | | (72,938,302 | ) | | | (38,555,643 | ) | |
| Net realized gains: | |
| Class ADV | | | (140 | ) | | | — | | | | (23 | ) | | | — | | |
| Class I | | | (17,966,905 | ) | | | — | | | | (47,870,738 | ) | | | — | | |
| Class S | | | (3,013,623 | ) | | | — | | | | (29,295,110 | ) | | | — | | |
| Total distributions | | | (23,585,843 | ) | | | (3,115,416 | ) | | | (268,240,664 | ) | | | (122,543,008 | ) | |
| FROM CAPITAL SHARE TRANSACTIONS: | |
| Net proceeds from sale of shares | | | 1,563,145 | | | | 1,549,317 | | | | 1,096,749,148 | | | | 1,136,671,743 | | |
| Proceeds from shares issued in merger (Note 14) | | | — | | | | — | | | | 48,015,614 | | | | — | | |
| Reinvestment of distributions | | | 23,585,688 | | | | 3,115,398 | | | | 268,200,908 | | | | 122,517,553 | | |
| | | | 25,148,833 | | | | 4,664,715 | | | | 1,412,965,670 | | | | 1,259,189,296 | | |
| Cost of shares redeemed | | | (30,249,954 | ) | | | (41,972,831 | ) | | | (1,226,745,331 | ) | | | (490,715,350 | ) | |
Net increase (decrease) in net assets resulting from
capital share transactions | | | (5,101,121 | ) | | | (37,308,116 | ) | | | 186,220,339 | | | | 768,473,946 | | |
| Net increase (decrease) in net assets | | | (81,579,077 | ) | | | (34,081,282 | ) | | | (389,265,262 | ) | | | 816,444,261 | | |
| NET ASSETS: | |
| Beginning of year | | | 167,324,771 | | | | 201,406,053 | | | | 3,346,670,213 | | | | 2,530,225,952 | | |
| End of year | | $ | 85,745,694 | | | $ | 167,324,771 | | | $ | 2,957,404,951 | | | $ | 3,346,670,213 | | |
Undistributed net investment income (distributions
in excess of net investment income) at end of year | | $ | 2,610,842 | | | $ | 2,600,516 | | | $ | (24,551,451 | ) | | $ | 22,702,254 | | |
See Accompanying Notes to Financial Statements
30
STATEMENTS OF CHANGES IN NET ASSETS
| | | ING VP Money Market Portfolio | | ING BlackRock
Global Science and
Technology Portfolio | |
| | | Year
Ended
December 31,
2008 | | Year
Ended
December 31,
2007 | | Year
Ended
December 31,
2008 | | Year
Ended
December 31,
2007 | |
| FROM OPERATIONS: | |
| Net investment income (loss) | | $ | 46,716,063 | | | $ | 77,934,256 | | | $ | 48,982 | | | $ | (214,304 | ) | |
Net realized gain (loss) on investments and foreign
currency related transactions | | | 2,471,989 | | | | 43,078 | | | | (17,342,801 | ) | | | 9,815,376 | | |
Net change in unrealized appreciation or depreciation on
investments and foreign currency related transactions | | | (149,401 | ) | | | — | | | | (70,362,339 | ) | | | 4,940,443 | | |
| Increase (decrease) in net assets resulting from operations | | | 49,038,651 | | | | 77,977,334 | | | | (87,656,158 | ) | | | 14,541,515 | | |
| FROM DISTRIBUTIONS TO SHAREHOLDERS: | |
| Net investment income | | | (124,653,168 | ) | | | (57,130,928 | ) | | | — | | | | — | | |
| Total distributions | | | (124,653,168 | ) | | | (57,130,928 | ) | | | — | | | | — | | |
| FROM CAPITAL SHARE TRANSACTIONS: | |
| Net proceeds from sale of shares | | | 384,970,723 | | | | 503,402,892 | | | | 52,450,776 | | | | 17,784,780 | | |
| Proceeds from shares issued in merger (Note 14) | | | — | | | | — | | | | 123,216,459 | | | | — | | |
| Reinvestment of distributions | | | 124,653,168 | | | | 57,130,928 | | | | — | | | | — | | |
| | | | 509,623,891 | | | | 560,533,820 | | | | 175,667,235 | | | | 17,784,780 | | |
| Cost of shares redeemed | | | (346,315,736 | ) | | | (226,091,022 | ) | | | (41,644,715 | ) | | | (15,393,467 | ) | |
Net increase in net assets resulting from capital
share transactions | | | 163,308,155 | | | | 334,442,798 | | | | 134,022,520 | | | | 2,391,313 | | |
| Net increase in net assets | | | 87,693,638 | | | | 355,289,204 | | | | 46,366,362 | | | | 16,932,828 | | |
| NET ASSETS: | |
| Beginning of year | | | 1,711,139,287 | | | | 1,355,850,083 | | | | 99,083,051 | | | | 82,150,223 | | |
| End of year | | $ | 1,798,832,925 | | | $ | 1,711,139,287 | | | $ | 145,449,413 | | | $ | 99,083,051 | | |
| Undistributed net investment income at end of year | | $ | — | | | $ | 77,924,640 | | | $ | 602,097 | | | $ | 131,809 | | |
See Accompanying Notes to Financial Statements
31
FINANCIAL HIGHLIGHTS
Selected data for a share of beneficial interest outstanding throughout each year or period.
| | | | | Income (loss)
from investment
operations | | | | Less distributions | | | |
| | | Net asset value, beginning of year or period | | Net investment income (loss) | | Net realized and unrealized gain (loss) | | Total from investment operations | | From net investment income | | From net realized gains | | From return of capital | | Total distributions | | Net asset value, end of year or period | |
| | | | | | | | | | | | | | | | | | | | |
| Year or period ended | | ($) | | ($) | | ($) | | ($) | | ($) | | ($) | | ($) | | ($) | | ($) | |
| ING VP Balanced Portfolio | |
| Class ADV | |
| 12-31-08 | | | 14.34 | | | | 0.29 | | | | (4.03 | ) | | | (3.74 | ) | | | 0.34 | | | | 1.15 | | | | — | | | | 1.49 | | | | 9.11 | | |
| 12-31-07 | | | 14.65 | | | | 0.29 | | | | 0.37 | | | | 0.66 | | | | 0.39 | | | | 0.58 | | | | — | | | | 0.97 | | | | 14.34 | | |
| 12-29-06(4)-12-31-06 | | | 14.65 | | | | (0.00 | )* | | | — | | | | (0.00 | )* | | | — | | | | — | | | | — | | | | — | | | | 14.65 | | |
| Class I | |
| 12-31-08 | | | 14.45 | | | | 0.40 | | | | (4.07 | ) | | | (3.67 | ) | | | 0.45 | | | | 1.15 | | | | — | | | | 1.60 | | | | 9.18 | | |
| 12-31-07 | | | 14.65 | | | | 0.39 | • | | | 0.38 | | | | 0.77 | | | | 0.39 | | | | 0.58 | | | | — | | | | 0.97 | | | | 14.45 | | |
| 12-31-06 | | | 13.64 | | | | 0.34 | • | | | 1.00 | | | | 1.34 | | | | 0.33 | | | | — | | | | — | | | | 0.33 | | | | 14.65 | | |
| 12-31-05 | | | 13.40 | | | | 0.29 | • | | | 0.27 | | | | 0.56 | | | | 0.32 | | | | — | | | | — | | | | 0.32 | | | | 13.64 | | |
| 12-31-04 | | | 12.50 | | | | 0.29 | | | | 0.87 | | | | 1.16 | | | | 0.26 | | | | — | | | | — | | | | 0.26 | | | | 13.40 | | |
| Class S | |
| 12-31-08 | | | 14.36 | | | | 0.34 | | | | (4.02 | ) | | | (3.68 | ) | | | 0.41 | | | | 1.15 | | | | — | | | | 1.56 | | | | 9.12 | | |
| 12-31-07 | | | 14.57 | | | | 0.35 | • | | | 0.38 | | | | 0.73 | | | | 0.36 | | | | 0.58 | | | | — | | | | 0.94 | | | | 14.36 | | |
| 12-31-06 | | | 13.58 | | | | 0.32 | • | | | 0.97 | | | | 1.29 | | | | 0.30 | | | | — | | | | — | | | | 0.30 | | | | 14.57 | | |
| 12-31-05 | | | 13.35 | | | | 0.27 | | | | 0.25 | | | | 0.52 | | | | 0.29 | | | | — | | | | — | | | | 0.29 | | | | 13.58 | | |
| 12-31-04 | | | 12.49 | | | | 0.22 | | | | 0.89 | | | | 1.11 | | | | 0.25 | | | | — | | | | — | | | | 0.25 | | | | 13.35 | | |
| ING VP Growth and Income Portfolio | |
| Class ADV | |
| 12-31-08 | | | 24.61 | | | | 0.23 | • | | | (9.58 | ) | | | (9.35 | ) | | | 0.22 | | | | — | | | | — | | | | 0.22 | | | | 15.04 | | |
| 12-31-07 | | | 23.38 | | | | 0.72 | • | | | 0.84 | | | | 1.56 | | | | 0.33 | | | | — | | | | — | | | | 0.33 | | | | 24.61 | | |
| 12-20-06(4)-12-31-06 | | | 23.70 | | | | 0.01 | • | | | (0.06 | ) | | | (0.05 | ) | | | 0.27 | | | | — | | | | — | | | | 0.27 | | | | 23.38 | | |
| Class I | |
| 12-31-08 | | | 24.76 | | | | 0.36 | | | | (9.69 | ) | | | (9.33 | ) | | | 0.32 | | | | — | | | | — | | | | 0.32 | | | | 15.11 | | |
| 12-31-07 | | | 23.38 | | | | 0.33 | • | | | 1.40 | | | | 1.73 | | | | 0.35 | | | | — | | | | — | | | | 0.35 | | | | 24.76 | | |
| 12-31-06 | | | 20.71 | | | | 0.25 | • | | | 2.69 | | | | 2.94 | | | | 0.27 | | | | — | | | | — | | | | 0.27 | | | | 23.38 | | |
| 12-31-05 | | | 19.35 | | | | 0.23 | | | | 1.35 | | | | 1.58 | | | | 0.22 | | | | — | | | | — | | | | 0.22 | | | | 20.71 | | |
| 12-31-04 | | | 18.28 | | | | 0.28 | | | | 1.24 | | | | 1.52 | | | | 0.45 | | | | — | | | | — | | | | 0.45 | | | | 19.35 | | |
| Class S | |
| 12-31-08 | | | 24.63 | | | | 0.25 | • | | | (9.58 | ) | | | (9.33 | ) | | | 0.30 | | | | — | | | | — | | | | 0.30 | | | | 15.00 | | |
| 12-31-07 | | | 23.30 | | | | 0.37 | • | | | 1.29 | | | | 1.66 | | | | 0.33 | | | | — | | | | — | | | | 0.33 | | | | 24.63 | | |
| 12-31-06 | | | 20.69 | | | | 0.20 | • | | | 2.64 | | | | 2.84 | | | | 0.23 | | | | — | | | | — | | | | 0.23 | | | | 23.30 | | |
| 12-31-05 | | | 19.34 | | | | 0.14 | | | | 1.41 | | | | 1.55 | | | | 0.20 | | | | — | | | | — | | | | 0.20 | | | | 20.69 | | |
| 12-31-04 | | | 18.26 | | | | 0.21 | | | | 1.26 | | | | 1.47 | | | | 0.39 | | | | — | | | | — | | | | 0.39 | | | | 19.34 | | |
| ING Opportunistic LargeCap Growth Portfolio | |
| Class ADV | |
| 12-31-08 | | | 12.46 | | | | (0.01 | )• | | | (5.52 | ) | | | (5.53 | ) | | | — | | | | — | | | | — | | | | — | | | | 6.93 | | |
| 12-31-07 | | | 10.65 | | | | (0.02 | )• | | | 1.85 | | | | 1.83 | | | | 0.02 | | | | — | | | | — | | | | 0.02 | | | | 12.46 | | |
| 12-29-06(4)-12-31-06 | | | 10.65 | | | | (0.00 | )* | | | — | | | | (0.00 | )* | | | — | | | | — | | | | — | | | | — | | | | 10.65 | | |
| Class I | |
| 12-31-08 | | | 12.53 | | | | 0.05 | | | | (5.54 | ) | | | (5.49 | ) | | | 0.08 | | | | — | | | | — | | | | 0.08 | | | | 6.96 | | |
| 12-31-07 | | | 10.65 | | | | 0.05 | • | | | 1.85 | | | | 1.90 | | | | 0.02 | | | | — | | | | — | | | | 0.02 | | | | 12.53 | | |
| 12-31-06 | | | 10.38 | | | | 0.02 | • | | | 0.26 | | | | 0.28 | | | | 0.01 | | | | — | | | | — | | | | 0.01 | | | | 10.65 | | |
| 12-31-05 | | | 9.56 | | | | 0.02 | | | | 0.87 | | | | 0.89 | | | | 0.07 | | | | — | | | | — | | | | 0.07 | | | | 10.38 | | |
| 12-31-04 | | | 8.93 | | | | 0.06 | | | | 0.58 | | | | 0.64 | | | | 0.01 | | | | — | | | | — | | | | 0.01 | | | | 9.56 | | |
| Class S | |
| 12-31-08 | | | 12.39 | | | | 0.02 | • | | | (5.49 | ) | | | (5.47 | ) | | | 0.03 | | | | — | | | | — | | | | 0.03 | | | | 6.89 | | |
| 12-31-07 | | | 10.56 | | | | 0.00 | * | | | 1.85 | | | | 1.85 | | | | 0.02 | | | | — | | | | — | | | | 0.02 | | | | 12.39 | | |
| 12-31-06 | | | 10.31 | | | | (0.01 | ) | | | 0.26 | | | | 0.25 | | | | — | | | | — | | | | — | | | | — | | | | 10.56 | | |
| 12-31-05 | | | 9.50 | | | | (0.00 | )* | | | 0.85 | | | | 0.85 | | | | 0.04 | | | | — | | | | — | | | | 0.04 | | | | 10.31 | | |
| 12-31-04 | | | 8.88 | | | | 0.04 | | | | 0.58 | | | | 0.62 | | | | — | | | | — | | | | — | | | | — | | | | 9.50 | | |
| | | | | Ratios to average net assets | | Supplemental data | |
| | | Total Return(1) | | Expenses before reductions/additions(2)(3) | | Expenses net of fee waivers and/or recoupments, if any(2)(3) | | Expenses net of all reductions/additions(2)(3) | | Net investment income (loss)(2)(3) | | Net assets, end of year or period | | Portfolio turnover rate | |
| | | | | | | | | | | | | | | | |
| Year or period ended | | (%) | | (%) | | (%) | | (%) | | (%) | | ($000's) | | (%) | |
| ING VP Balanced Portfolio | |
| Class ADV | |
| 12-31-08 | | | (28.62 | ) | | | 1.12 | | | | 1.12 | † | | | 1.12 | † | | | 2.44 | † | | | 1 | | | | 294 | | |
| 12-31-07 | | | 4.78 | | | | 1.10 | | | | 1.10 | † | | | 1.10 | † | | | 2.05 | † | | | 1 | | | | 257 | | |
| 12-29-06(4)-12-31-06 | | | — | | | | 1.10 | | | | 1.10 | † | | | 1.10 | † | | | (1.10 | )† | | | 1 | | | | 236 | | |
| Class I | |
| 12-31-08 | | | (28.10 | ) | | | 0.62 | | | | 0.62 | † | | | 0.62 | † | | | 2.97 | † | | | 602,815 | | | | 294 | | |
| 12-31-07 | | | 5.57 | | | | 0.60 | | | | 0.60 | † | | | 0.60 | † | | | 2.68 | † | | | 1,046,498 | | | | 257 | | |
| 12-31-06 | | | 9.99 | | | | 0.60 | | | | 0.60 | † | | | 0.60 | † | | | 2.44 | † | | | 1,183,928 | | | | 236 | | |
| 12-31-05 | | | 4.24 | | | | 0.60 | | | | 0.60 | | | | 0.60 | | | | 2.30 | | | | 1,236,327 | | | | 308 | | |
| 12-31-04 | | | 9.42 | | | | 0.59 | | | | 0.59 | | | | 0.59 | | | | 2.15 | | | | 1,357,854 | | | | 272 | | |
| Class S | |
| 12-31-08 | | | (28.28 | ) | | | 0.87 | | | | 0.87 | † | | | 0.87 | † | | | 2.73 | † | | | 6,684 | | | | 294 | | |
| 12-31-07 | | | 5.31 | | | | 0.85 | | | | 0.85 | † | | | 0.85 | † | | | 2.43 | † | | | 10,281 | | | | 257 | | |
| 12-31-06 | | | 9.62 | | | | 0.85 | | | | 0.85 | † | | | 0.85 | † | | | 2.29 | † | | | 10,683 | | | | 236 | | |
| 12-31-05 | | | 3.99 | | | | 0.85 | | | | 0.85 | | | | 0.85 | | | | 2.06 | | | | 3,170 | | | | 308 | | |
| 12-31-04 | | | 9.06 | | | | 0.84 | | | | 0.84 | | | | 0.84 | | | | 1.98 | | | | 3,116 | | | | 272 | | |
| ING VP Growth and Income Portfolio | |
| Class ADV | |
| 12-31-08 | | | (37.94 | )(a) | | | 1.10 | | | | 1.10 | † | | | 1.10 | † | | | 1.14 | † | | | 791 | | | | 169 | | |
| 12-31-07 | | | 6.66 | | | | 1.09 | | | | 1.09 | † | | | 1.09 | † | | | 2.95 | † | | | 1,211 | | | | 146 | | |
| 12-20-06(4)-12-31-06 | | | (0.23 | ) | | | 1.09 | | | | 1.09 | † | | | 1.09 | † | | | 1.08 | † | | | 1 | | | | 103 | | |
| Class I | |
| 12-31-08 | | | (37.63 | )(a) | | | 0.60 | | | | 0.60 | † | | | 0.60 | † | | | 1.64 | † | | | 1,622,085 | | | | 169 | | |
| 12-31-07 | | | 7.40 | | | | 0.59 | | | | 0.59 | † | | | 0.59 | † | | | 1.32 | † | | | 2,796,115 | | | | 146 | | |
| 12-31-06 | | | 14.20 | | | | 0.59 | | | | 0.59 | † | | | 0.59 | † | | | 1.15 | † | | | 3,098,120 | | | | 103 | | |
| 12-31-05 | | | 8.13 | | | | 0.59 | | | | 0.59 | | | | 0.59 | | | | 1.03 | | | | 3,146,025 | | | | 80 | | |
| 12-31-04 | | | 8.39 | | | | 0.58 | | | | 0.58 | | | | 0.58 | | | | 1.41 | | | | 3,531,422 | | | | 139 | | |
| Class S | |
| 12-31-08 | | | (37.82 | )(a) | | | 0.85 | | | | 0.85 | † | | | 0.85 | † | | | 1.44 | † | | | 290,152 | | | | 169 | | |
| 12-31-07 | | | 7.13 | | | | 0.84 | | | | 0.84 | † | | | 0.84 | † | | | 1.50 | † | | | 25,169 | | | | 146 | | |
| 12-31-06 | | | 13.72 | | | | 0.84 | | | | 0.84 | † | | | 0.84 | † | | | 0.94 | † | | | 4,758 | | | | 103 | | |
| 12-31-05 | | | 7.98 | | | | 0.84 | | | | 0.84 | | | | 0.84 | | | | 0.78 | | | | 2,431 | | | | 80 | | |
| 12-31-04 | | | 8.10 | | | | 0.83 | | | | 0.83 | | | | 0.83 | | | | 1.18 | | | | 1,776 | | | | 139 | | |
| ING Opportunistic LargeCap Growth Portfolio | |
| Class ADV | |
| 12-31-08 | | | (44.38 | ) | | | 1.24 | | | | 1.24 | † | | | 1.24 | † | | | (0.08 | )† | | | 590 | | | | 259 | | |
| 12-31-07 | | | 17.21 | | | | 1.20 | | | | 1.20 | † | | | 1.20 | † | | | (0.18 | )† | | | 1,386 | | | | 279 | | |
| 12-29-06(4)-12-31-06 | | | — | | | | 1.19 | | | | 1.19 | | | | 1.19 | | | | (1.19 | ) | | | 1 | | | | 188 | | |
| Class I | |
| 12-31-08 | | | (44.06 | ) | | | 0.74 | | | | 0.74 | † | | | 0.74 | † | | | 0.43 | † | | | 59,412 | | | | 259 | | |
| 12-31-07 | | | 17.86 | | | | 0.70 | | | | 0.70 | † | | | 0.70 | † | | | 0.42 | † | | | 137,104 | | | | 279 | | |
| 12-31-06 | | | 2.65 | | | | 0.69 | | | | 0.69 | | | | 0.69 | | | | 0.19 | | | | 186,495 | | | | 188 | | |
| 12-31-05 | | | 9.38 | (b) | | | 0.69 | | | | 0.69 | | | | 0.69 | | | | 0.08 | | | | 175,297 | | | | 119 | | |
| 12-31-04 | | | 7.19 | | | | 0.69 | | | | 0.69 | | | | 0.69 | | | | 0.61 | | | | 193,280 | | | | 123 | | |
| Class S | |
| 12-31-08 | | | (44.21 | ) | | | 0.99 | | | | 0.99 | † | | | 0.99 | † | | | 0.17 | † | | | 7,034 | | | | 259 | | |
| 12-31-07 | | | 17.54 | | | | 0.95 | | | | 0.95 | † | | | 0.95 | † | | | 0.23 | † | | | 21,105 | | | | 279 | | |
| 12-31-06 | | | 2.42 | | | | 0.94 | | | | 0.94 | | | | 0.94 | | | | (0.06 | ) | | | 273 | | | | 188 | | |
| 12-31-05 | | | 9.05 | (b) | | | 0.94 | | | | 0.94 | | | | 0.94 | | | | (0.17 | ) | | | 285 | | | | 119 | | |
| 12-31-04 | | | 6.98 | | | | 0.94 | | | | 0.94 | | | | 0.94 | | | | 0.44 | | | | 356 | | | | 123 | | |
See Accompanying Notes to Financial Statements
32
FINANCIAL HIGHLIGHTS (CONTINUED)
Selected data for a share of beneficial interest outstanding throughout each year or period.
| | | | | Income (loss)
from investment
operations | | | | Less distributions | | | |
| | | Net asset value, beginning of year or period | | Net investment income (loss) | | Net realized and unrealized gain (loss) | | Total from investment operations | | From net investment income | | From net realized gains | | From return of capital | | Total distributions | | Net asset value, end of year or period | |
| | | | | | | | | | | | | | | | | | | | |
| Year or period ended | | ($) | | ($) | | ($) | | ($) | | ($) | | ($) | | ($) | | ($) | | ($) | |
| ING VP Small Company Portfolio | |
| Class ADV | |
| 12-16-08(4)-12-31-08 | | | 11.13 | | | | 0.00 | *• | | | 0.45 | | | | 0.45 | | | | — | | | | — | | | | — | | | | — | | | | 11.58 | | |
| Class I | |
| 12-31-08 | | | 19.56 | | | | 0.11 | • | | | (5.52 | ) | | | (5.41 | ) | | | 0.18 | | | | 2.27 | | | | — | | | | 2.45 | | | | 11.70 | | |
| 12-31-07 | | | 21.70 | | | | 0.24 | • | | | 0.99 | | | | 1.23 | | | | 0.04 | | | | 3.33 | | | | — | | | | 3.37 | | | | 19.56 | | |
| 12-31-06 | | | 21.65 | | | | 0.05 | | | | 3.46 | | | | 3.51 | | | | 0.09 | | | | 3.37 | | | | — | | | | 3.46 | | | | 21.70 | | |
| 12-31-05 | | | 19.94 | | | | 0.10 | | | | 1.92 | | | | 2.02 | | | | 0.03 | | | | 0.28 | | | | — | | | | 0.31 | | | | 21.65 | | |
| 12-31-04 | | | 17.48 | | | | 0.04 | | | | 2.47 | | | | 2.51 | | | | 0.05 | | | | — | | | | — | | | | 0.05 | | | | 19.94 | | |
| Class S | |
| 12-31-08 | | | 19.39 | | | | 0.09 | • | | | (5.50 | ) | | | (5.41 | ) | | | 0.14 | | | | 2.27 | | | | — | | | | 2.41 | | | | 11.57 | | |
| 12-31-07 | | | 21.54 | | | | 0.18 | • | | | 1.00 | | | | 1.18 | | | | — | | | | 3.33 | | | | — | | | | 3.33 | | | | 19.39 | | |
| 12-31-06 | | | 21.59 | | | | (0.05 | )• | | | 3.41 | | | | 3.36 | | | | 0.04 | | | | 3.37 | | | | — | | | | 3.41 | | | | 21.54 | | |
| 12-31-05 | | | 19.90 | | | | 0.06 | | | | 1.92 | | | | 1.98 | | | | 0.01 | | | | 0.28 | | | | — | | | | 0.29 | | | | 21.59 | | |
| 12-31-04 | | | 17.49 | | | | 0.03 | • | | | 2.43 | | | | 2.46 | | | | 0.05 | | | | — | | | | — | | | | 0.05 | | | | 19.90 | | |
| ING Opportunistic LargeCap Value Portfolio | |
| Class ADV | |
| 12-31-08 | | | 15.82 | | | | 0.20 | | | | (5.19 | ) | | | (4.99 | ) | | | 0.16 | | | | 2.15 | | | | — | | | | 2.31 | | | | 8.52 | | |
| 12-31-07 | | | 15.72 | | | | 0.16 | | | | 0.20 | | | | 0.36 | | | | 0.26 | | | | — | | | | — | | | | 0.26 | | | | 15.82 | | |
| 12-29-06(4)-12-31-06 | | | 15.72 | | | | (0.00 | )* | | | — | | | | (0.00 | )* | | | — | | | | — | | | | — | | | | — | | | | 15.72 | | |
| Class I | |
| 12-31-08 | | | 16.05 | | | | 0.29 | | | | (5.27 | ) | | | (4.98 | ) | | | 0.27 | | | | 2.15 | | | | — | | | | 2.42 | | | | 8.65 | | |
| 12-31-07 | | | 15.84 | | | | 0.23 | • | | | 0.24 | | | | 0.47 | | | | 0.26 | | | | — | | | | — | | | | 0.26 | | | | 16.05 | | |
| 12-31-06 | | | 13.84 | | | | 0.23 | • | | | 1.98 | | | | 2.21 | | | | 0.21 | | | | — | | | | — | | | | 0.21 | | | | 15.84 | | |
| 12-31-05 | | | 13.19 | | | | 0.19 | • | | | 0.71 | | | | 0.90 | | | | 0.25 | | | | — | | | | — | | | | 0.25 | | | | 13.84 | | |
| 12-31-04 | | | 12.08 | | | | 0.24 | | | | 0.98 | | | | 1.22 | | | | 0.11 | | | | — | | | | — | | | | 0.11 | | | | 13.19 | | |
| Class S | |
| 12-31-08 | | | 15.93 | | | | 0.26 | | | | (5.23 | ) | | | (4.97 | ) | | | 0.23 | | | | 2.15 | | | | — | | | | 2.38 | | | | 8.58 | | |
| 12-31-07 | | | 15.72 | | | | 0.19 | • | | | 0.24 | | | | 0.43 | | | | 0.22 | | | | — | | | | — | | | | 0.22 | | | | 15.93 | | |
| 12-31-06 | | | 13.77 | | | | 0.19 | • | | | 1.96 | | | | 2.15 | | | | 0.20 | | | | — | | | | — | | | | 0.20 | | | | 15.72 | | |
| 12-31-05 | | | 13.12 | | | | 0.16 | • | | | 0.71 | | | | 0.87 | | | | 0.22 | | | | — | | | | — | | | | 0.22 | | | | 13.77 | | |
| 12-31-04 | | | 12.03 | | | | 0.13 | | | | 1.05 | | | | 1.18 | | | | 0.09 | | | | — | | | | — | | | | 0.09 | | | | 13.12 | | |
| ING VP Intermediate Bond Portfolio | |
| Class ADV | |
| 12-31-08 | | | 13.23 | | | | 0.58 | | | | (1.77 | ) | | | (1.19 | ) | | | 0.62 | | | | 0.30 | | | | — | | | | 0.92 | | | | 11.12 | | |
| 12-31-07 | | | 12.96 | | | | 0.63 | | | | 0.09 | | | | 0.72 | | | | 0.45 | | | | — | | | | — | | | | 0.45 | | | | 13.23 | | |
| 12-20-06(4)-12-31-06 | | | 13.53 | | | | 0.02 | | | | (0.06 | ) | | | (0.04 | ) | | | 0.53 | | | | — | | | | — | | | | 0.53 | | | | 12.96 | | |
| Class I | |
| 12-31-08 | | | 13.22 | | | | 0.64 | • | | | (1.73 | ) | | | (1.09 | ) | | | 0.75 | | | | 0.30 | | | | — | | | | 1.05 | | | | 11.08 | | |
| 12-31-07 | | | 12.96 | | | | 0.69 | • | | | 0.08 | | | | 0.77 | | | | 0.51 | | | | — | | | | — | | | | 0.51 | | | | 13.22 | | |
| 12-31-06 | | | 12.97 | | | | 0.65 | • | | | (0.12 | ) | | | 0.53 | | | | 0.54 | | | | — | | | | — | | | | 0.54 | | | | 12.96 | | |
| 12-31-05 | | | 13.14 | | | | 0.54 | | | | (0.13 | ) | | | 0.41 | | | | 0.51 | | | | 0.07 | | | | — | | | | 0.58 | | | | 12.97 | | |
| 12-31-04 | | | 14.15 | | | | 0.53 | | | | 0.13 | | | | 0.66 | | | | 1.11 | | | | 0.56 | | | | — | | | | 1.67 | | | | 13.14 | | |
| Class S | |
| 12-31-08 | | | 13.14 | | | | 0.60 | • | | | (1.72 | ) | | | (1.12 | ) | | | 0.72 | | | | 0.30 | | | | — | | | | 1.02 | | | | 11.00 | | |
| 12-31-07 | | | 12.89 | | | | 0.65 | • | | | 0.08 | | | | 0.73 | | | | 0.48 | | | | — | | | | — | | | | 0.48 | | | | 13.14 | | |
| 12-31-06 | | | 12.91 | | | | 0.61 | • | | | (0.12 | ) | | | 0.49 | | | | 0.51 | | | | — | | | | — | | | | 0.51 | | | | 12.89 | | |
| 12-31-05 | | | 13.09 | | | | 0.41 | | | | (0.03 | ) | | | 0.38 | | | | 0.49 | | | | 0.07 | | | | — | | | | 0.56 | | | | 12.91 | | |
| 12-31-04 | | | 14.13 | | | | 0.40 | | | | 0.22 | | | | 0.62 | | | | 1.10 | | | | 0.56 | | | | — | | | | 1.66 | | | | 13.09 | | |
| | | | | Ratios to average net assets | | Supplemental data | |
| | | Total Return(1) | | Expenses before reductions/additions(2)(3) | | Expenses net of fee waivers and/or recoupments, if any(2)(3) | | Expenses net of all reductions/additions(2)(3) | | Net investment income (loss)(2)(3) | | Net assets, end of year or period | | Portfolio turnover rate | |
| | | | | | | | | | | | | | | | |
| Year or period ended | | (%) | | (%) | | (%) | | (%) | | (%) | | ($000's) | | (%) | |
| ING VP Small Company Portfolio | |
| Class ADV | |
| 12-16-08(4)-12-31-08 | | | 4.04 | | | | 1.35 | | | | 1.35 | † | | | 1.35 | † | | | 0.65 | † | | | 3 | | | | 145 | | |
| Class I | |
| 12-31-08 | | | (31.05 | ) | | | 0.85 | | | | 0.85 | † | | | 0.85 | † | | | 0.71 | † | | | 420,626 | | | | 145 | | |
| 12-31-07 | | | 5.90 | | | | 0.84 | | | | 0.84 | † | | | 0.84 | † | | | 1.16 | † | | | 603,492 | | | | 106 | | |
| 12-31-06 | | | 16.79 | | | | 0.85 | | | | 0.85 | † | | | 0.85 | † | | | 0.26 | † | | | 512,446 | | | | 83 | | |
| 12-31-05 | | | 10.27 | (b) | | | 0.85 | | | | 0.85 | | | | 0.85 | | | | 0.43 | | | | 393,700 | | | | 72 | | |
| 12-31-04 | | | 14.39 | | | | 0.84 | | | | 0.84 | | | | 0.84 | | | | 0.21 | | | | 461,014 | | | | 93 | | |
| Class S | |
| 12-31-08 | | | (31.28 | ) | | | 1.10 | | | | 1.10 | † | | | 1.10 | † | | | 0.71 | † | | | 44,764 | | | | 145 | | |
| 12-31-07 | | | 5.68 | | | | 1.09 | | | | 1.09 | † | | | 1.09 | † | | | 0.90 | † | | | 2,890 | | | | 106 | | |
| 12-31-06 | | | 16.07 | | | | 1.10 | | | | 1.10 | † | | | 1.10 | † | | | (0.24 | )† | | | 2,162 | | | | 83 | | |
| 12-31-05 | | | 10.05 | (b) | | | 1.10 | | | | 1.10 | | | | 1.10 | | | | 0.26 | | | | 68,768 | | | | 72 | | |
| 12-31-04 | | | 14.09 | | | | 1.09 | | | | 1.09 | | | | 1.09 | | | | 0.19 | | | | 72,225 | | | | 93 | | |
| ING Opportunistic LargeCap Value Portfolio | |
| Class ADV | |
| 12-31-08 | | | (36.01 | )(a) | | | 1.21 | | | | 1.21 | † | | | 1.21 | † | | | 1.68 | † | | | 1 | | | | 132 | | |
| 12-31-07 | | | 2.33 | | | | 1.19 | | | | 1.19 | † | | | 1.19 | † | | | 0.99 | † | | | 1 | | | | 197 | | |
| 12-29-06(4)-12-31-06 | | | — | | | | 1.19 | | | | 1.19 | | | | 1.19 | | | | (1.19 | ) | | | 1 | | | | 83 | | |
| Class I | |
| 12-31-08 | | | (35.61 | )(a) | | | 0.71 | | | | 0.71 | † | | | 0.71 | † | | | 2.16 | † | | | 73,764 | | | | 132 | | |
| 12-31-07 | | | 3.01 | | | | 0.69 | | | | 0.69 | † | | | 0.69 | † | | | 1.44 | † | | | 143,438 | | | | 197 | | |
| 12-31-06 | | | 16.10 | | | | 0.69 | | | | 0.69 | | | | 0.69 | | | | 1.58 | | | | 173,014 | | | | 83 | | |
| 12-31-05 | | | 6.95 | | | | 0.70 | | | | 0.70 | | | | 0.70 | | | | 1.47 | | | | 178,828 | | | | 94 | | |
| 12-31-04 | | | 10.15 | | | | 0.69 | | | | 0.69 | | | | 0.69 | | | | 1.61 | | | | 219,889 | | | | 16 | | |
| Class S | |
| 12-31-08 | | | (35.80 | )(a) | | | 0.96 | | | | 0.96 | † | | | 0.96 | † | | | 1.91 | † | | | 11,981 | | | | 132 | | |
| 12-31-07 | | | 2.77 | | | | 0.94 | | | | 0.94 | † | | | 0.94 | † | | | 1.19 | † | | | 23,886 | | | | 197 | | |
| 12-31-06 | | | 15.77 | | | | 0.94 | | | | 0.94 | | | | 0.94 | | | | 1.32 | | | | 28,391 | | | | 83 | | |
| 12-31-05 | | | 6.76 | | | | 0.95 | | | | 0.95 | | | | 0.95 | | | | 1.18 | | | | 30,125 | | | | 94 | | |
| 12-31-04 | | | 9.88 | | | | 0.94 | | | | 0.94 | | | | 0.94 | | | | 1.36 | | | | 3,505 | | | | 16 | | |
| ING VP Intermediate Bond Portfolio | |
| Class ADV | |
| 12-31-08 | | | (9.16 | ) | | | 1.01 | | | | 1.00 | † | | | 1.00 | † | | | 4.58 | † | | | 1 | | | | 666 | | |
| 12-31-07 | | | 5.60 | (a) | | | 0.99 | | | | 0.99 | † | | | 0.99 | † | | | 4.77 | † | | | 1 | | | | 438 | | |
| 12-20-06(4)-12-31-06 | | | (0.30 | ) | | | 0.99 | | | | 0.99 | † | | | 0.99 | † | | | 6.82 | † | | | 1 | | | | 390 | | |
| Class I | |
| 12-31-08 | | | (8.41 | ) | | | 0.51 | | | | 0.50 | † | | | 0.50 | † | | | 5.05 | † | | | 1,803,886 | | | | 666 | | |
| 12-31-07 | | | 5.95 | (a) | | | 0.49 | | | | 0.49 | † | | | 0.49 | † | | | 5.19 | † | | | 2,267,008 | | | | 438 | | |
| 12-31-06 | | | 4.06 | | | | 0.49 | | | | 0.49 | † | | | 0.49 | † | | | 4.97 | † | | | 1,909,376 | | | | 390 | | |
| 12-31-05 | | | 3.14 | | | | 0.49 | | | | 0.49 | | | | 0.49 | | | | 4.14 | | | | 1,148,075 | | | | 589 | | |
| 12-31-04 | | | 4.88 | | | | 0.48 | | | | 0.48 | | | | 0.48 | | | | 3.79 | | | | 1,092,938 | | | | 407 | | |
| Class S | |
| 12-31-08 | | | (8.73 | ) | | | 0.76 | | | | 0.75 | † | | | 0.75 | † | | | 4.82 | † | | | 1,153,518 | | | | 666 | | |
| 12-31-07 | | | 5.70 | (a) | | | 0.74 | | | | 0.74 | † | | | 0.74 | † | | | 4.92 | † | | | 1,079,662 | | | | 438 | | |
| 12-31-06 | | | 3.77 | | | | 0.74 | | | | 0.74 | † | | | 0.74 | † | | | 4.69 | † | | | 620,849 | | | | 390 | | |
| 12-31-05 | | | 2.94 | | | | 0.74 | | | | 0.74 | | | | 0.74 | | | | 3.94 | | | | 617,269 | | | | 589 | | |
| 12-31-04 | | | 4.58 | | | | 0.73 | | | | 0.73 | | | | 0.73 | | | | 3.52 | | | | 301,346 | | | | 407 | | |
See Accompanying Notes to Financial Statements
33
FINANCIAL HIGHLIGHTS (CONTINUED)
Selected data for a share of beneficial interest outstanding throughout each year or period.
| | | | | Income (loss)
from investment
operations | | | | Less distributions | | | |
| | | Net asset value, beginning of year or period | | Net investment income (loss) | | Net realized and unrealized gain (loss) | | Total from investment operations | | From net investment income | | From net realized gains | | From return of capital | | Total distributions | | Net asset value, end of year or period | |
| | | | | | | | | | | | | | | | | | | | |
| Year or period ended | | ($) | | ($) | | ($) | | ($) | | ($) | | ($) | | ($) | | ($) | | ($) | |
| ING VP Money Market Portfolio(c) | |
| Class I | |
| 12-31-08 | | | 1.05 | | | | 0.02 | | | | 0.00 | | | | 0.02 | | | | 0.07 | | | | — | | | | — | | | | 0.07 | | | | 1.00 | | |
| 12-31-07 | | | 1.04 | | | | 0.05 | | | | (0.00 | ) | | | 0.05 | | | | 0.04 | | | | — | | | | — | | | | 0.04 | | | | 1.05 | | |
| 12-31-06 | | | 1.02 | | | | 0.05 | | | | 0.00 | | | | 0.05 | | | | 0.03 | | | | — | | | | — | | | | 0.03 | | | | 1.04 | | |
| 12-31-05 | | | 1.00 | | | | 0.03 | | | | (0.00 | ) | | | 0.03 | | | | 0.01 | | | | — | | | | — | | | | 0.01 | | | | 1.02 | | |
| 12-31-04 | | | 1.00 | | | | 0.01 | | | | (0.00 | ) | | | 0.01 | | | | 0.01 | | | | — | | | | — | | | | 0.01 | | | | 1.00 | | |
| ING BlackRock Global Science and Technology Portfolio | |
| Class ADV | |
| 12-16-08(4)-12-31-08 | | | 3.29 | | | | (0.01 | ) | | | (0.03 | ) | | | (0.04 | ) | | | — | | | | — | | | | — | | | | — | | | | 3.25 | | |
| Class I | |
| 12-31-08 | | | 5.45 | | | | 0.00 | * | | | (2.17 | ) | | | (2.17 | ) | | | — | | | | — | | | | — | | | | — | | | | 3.28 | | |
| 12-31-07 | | | 4.58 | | | | (0.01 | ) | | | 0.88 | | | | 0.87 | | | | — | | | | — | | | | — | | | | — | | | | 5.45 | | |
| 12-31-06 | | | 4.27 | | | | (0.01 | ) | | | 0.32 | | | | 0.31 | | | | — | | | | — | | | | — | | | | — | | | | 4.58 | | |
| 12-31-05 | | | 3.82 | | | | (0.02 | ) | | | 0.47 | | | | 0.45 | | | | — | | | | — | | | | — | | | | — | | | | 4.27 | | |
| 12-31-04 | | | 3.87 | | | | (0.03 | ) | | | (0.02 | ) | | | (0.05 | ) | | | — | | | | — | | | | — | | | | — | | | | 3.82 | | |
| Class S | |
| 12-31-08 | | | 5.42 | | | | (0.01 | ) | | | (2.16 | ) | | | (2.17 | ) | | | — | | | | — | | | | — | | | | — | | | | 3.25 | | |
| 12-31-07 | | | 4.56 | | | | (0.02 | ) | | | 0.88 | | | | 0.86 | | | | — | | | | — | | | | — | | | | — | | | | 5.42 | | |
| 12-31-06 | | | 4.27 | | | | (0.02 | ) | | | 0.31 | | | | 0.29 | | | | — | | | | — | | | | — | | | | — | | | | 4.56 | | |
| 07-20-05(5)-12-31-05 | | | 3.90 | | | | (0.01 | ) | | | 0.38 | | | | 0.37 | | | | — | | | | — | | | | — | | | | — | | | | 4.27 | | |
| 01-01-03 -12-16-03(5) | | | 2.65 | | | | (0.07 | ) | | | 1.09 | | | | 1.02 | | | | — | | | | — | | | | — | | | | — | | | | 3.67 | | |
| 12-31-02 | | | 4.53 | | | | (0.04 | ) | | | (1.84 | ) | | | (1.88 | ) | | | — | | | | — | | | | — | | | | — | | | | 2.65 | | |
| | | | | Ratios to average net assets | | Supplemental data | |
| | | Total Return(1) | | Expenses before reductions/additions(2)(3) | | Expenses net of fee waivers and/or recoupments, if any(2)(3) | | Expenses net of all reductions/additions(2)(3) | | Net investment income (loss)(2)(3) | | Net assets, end of year or period | | Portfolio turnover rate | |
| | | | | | | | | | | | | | | | |
| Year or period ended | | (%) | | (%) | | (%) | | (%) | | (%) | | ($000's) | | (%) | |
| ING VP Money Market Portfolio(c) | |
| Class I | |
| 12-31-08 | | | 2.67 | | | | 0.35 | | | | 0.35 | | | | 0.35 | | | | 2.66 | | | | 1,798,833 | | | | — | | |
| 12-31-07 | | | 5.13 | | | | 0.33 | | | | 0.33 | | | | 0.33 | | | | 5.03 | | | | 1,711,139 | | | | — | | |
| 12-31-06 | | | 4.88 | | | | 0.34 | | | | 0.34 | | | | 0.34 | | | | 4.79 | | | | 1,355,850 | | | | — | | |
| 12-31-05 | | | 2.98 | | | | 0.35 | | | | 0.35 | | | | 0.35 | | | | 2.93 | | | | 1,073,018 | | | | — | | |
| 12-31-04 | | | 1.06 | | | | 0.34 | | | | 0.34 | | | | 0.34 | | | | 1.11 | | | | 1,101,471 | | | | — | | |
| ING BlackRock Global Science and Technology Portfolio | |
| Class ADV | |
| 12-16-08(4)-12-31-08 | | | (1.22 | ) | | | 1.58 | | | | 1.56 | | | | 1.56 | | | | (2.08 | ) | | | 3 | | | | 137 | | |
| Class I | |
| 12-31-08 | | | (39.82 | ) | | | 1.08 | | | | 1.06 | | | | 1.06 | | | | 0.09 | | | | 55,899 | | | | 137 | | |
| 12-31-07 | | | 19.00 | | | | 1.08 | | | | 1.08 | | | | 1.08 | | | | (0.24 | ) | | | 97,943 | | | | 84 | | |
| 12-31-06 | | | 7.26 | | | | 1.08 | | | | 1.08 | | | | 1.08 | | | | (0.29 | ) | | | 81,599 | | | | 129 | | |
| 12-31-05 | | | 11.78 | | | | 1.06 | | | | 1.06 | | | | 1.06 | | | | (0.48 | ) | | | 84,523 | | | | 118 | | |
| 12-31-04 | | | (1.29 | ) | | | 1.05 | | | | 1.05 | | | | 1.05 | | | | (0.67 | ) | | | 86,291 | | | | 163 | | |
| Class S | |
| 12-31-08 | | | (40.04 | ) | | | 1.33 | | | | 1.31 | | | | 1.31 | | | | (0.02 | ) | | | 89,548 | | | | 137 | | |
| 12-31-07 | | | 18.86 | | | | 1.33 | | | | 1.33 | | | | 1.33 | | | | (0.50 | ) | | | 1,140 | | | | 84 | | |
| 12-31-06 | | | 6.79 | | | | 1.33 | | | | 1.33 | | | | 1.33 | | | | (0.51 | ) | | | 551 | | | | 129 | | |
| 07-20-05(5)-12-31-05 | | | 9.49 | | | | 1.31 | | | | 1.31 | | | | 1.31 | | | | (0.73 | ) | | | 78 | | | | 118 | | |
| 01-01-03 -12-16-03(5) | | | 38.49 | | | | 1.35 | | | | 1.35 | | | | 1.36 | | | | (1.13 | ) | | | — | | | | 15 | | |
| 12-31-02 | | | (41.50 | ) | | | 1.36 | | | | 1.36 | | | | 1.37 | | | | (1.14 | ) | | | 7 | | | | 61 | | |
(1) Total return is calculated assuming reinvestment of all dividends and capital gain distributions at net asset value and does not reflect the effect of insurance contract charges. Total return for periods less than one year is not annualized.
(2) Annualized for periods less than one year.
(3) Expense ratios reflect operating expenses of a Portfolio. Expenses before reductions do not reflect amounts reimbursed by the Investment Adviser and/or Distributor or reductions from brokerage commission recapture arrangements or other expense offset arrangements and do not represent the amount paid by a Portfolio during periods when reimbursements or reductions occur. Expenses net of fee waivers reflect expenses after reimbursement by the Investment Adviser and/or Distributor but prior to reductions from brokerage commission recapture arrangements or other expense offset arrangements. Expenses net of all reductions represent the net expenses paid by a Portfolio. Net investment income (loss) is net of all such additions or reductions.
(4) Commencement of operations.
(5) Class S was fully redeemed on December 16, 2003 and recommenced operations on July 20, 2005.
* Amount is less than $0.005 or more than $(0.005).
• Calculated using average number of shares outstanding throughout the period.
† Impact of waiving the advisory fee for the ING Institutional Prime Money Market Fund holding has less than 0.005% impact on the expense ratio and net investment income or loss ratio.
(a) There was no impact on total return by the affiliate payment in Note 16.
(b) In 2005, the Investment Adviser fully reimbursed each Portfolio for a loss incurred from a transaction not meeting a Portfolio's investment's guidelines. There was no impact on total return.
(c) NAV and per share amounts have been restated to reflect the stock split that occurred on October 7, 2008. Effective October 7, 2008, the Portfolio converted to a stable share price of $1.00 per share. In connection with this change, the Portfolio utilized a stock split and distributed additional shares to its shareholders (adjustment factor: 12.926 shares to 1 share) such that each shareholder's proportionate interest and aggregate value of investment in the Portfolio remained the same.
See Accompanying Notes to Financial Statements
34
NOTES TO FINANCIAL STATEMENTS AS OF DECEMBER 31, 2008
NOTE 1 — ORGANIZATION
Organization. The ING Variable Product Funds are comprised of ING VP Balanced Portfolio, Inc., ING Variable Funds, ING Variable Portfolios, Inc., ING VP Intermediate Bond Portfolio, and ING VP Money Market Portfolio (collectively, "Registrants"), all of which are open-end investment management companies registered under the Investment Company Act of 1940, as amended ("1940 Act" or "Act").
ING VP Balanced Portfolio, Inc. is a company incorporated under the laws of Maryland on December 14, 1988 with one portfolio, ING VP Balanced Portfolio ("Balanced"). ING Variable Funds is a business trust formed under the laws of Massachusetts on January 25, 1984 with one portfolio, ING VP Growth and Income Portfolio ("Growth and Income"). ING Variable Portfolios, Inc. is a company incorporated under the laws of Maryland on June 4, 1996 and has fifteen active separate portfolios. The four portfolios that are in this report are: ING Opportunistic LargeCap Growth Portfolio ("Opportunistic LargeCap Growth"), formerly, ING VP Growth Portfolio, ING VP Small Company Portfolio ("Small Company"), ING Opportunistic LargeCap Value Portfolio ("Opportunistic LargeCap Value"), formerly, ING VP Value Opportunity Portfolio and ING BlackRock Global Science and Technology Portfolio ("Global Science and Technology"), formerly, ING VP Global Science and Techno logy Portfolio. ING VP Intermediate Bond Portfolio is a business trust formed under the laws of Massachusetts on January 25, 1984 with one portfolio, ING VP Intermediate Bond Portfolio ("Intermediate Bond"). ING VP Money Market Portfolio is a business trust formed under the laws of Massachusetts on January 25, 1984 with one portfolio, ING VP Money Market Portfolio ("Money Market"). Each of the portfolios is a "Portfolio" and collectively, they are the "Portfolios".
The following is a brief description of each Portfolio's investment objective:
• Balanced seeks to maximize investment return consistent with reasonable safety of principal, by investing in a diversified portfolio of one or more of the following asset classes: stocks, bonds, and cash equivalents based on the judgment of the Portfolio's management, of which of those sectors or mix thereof offers the best investment prospects;
• Growth and Income seeks to maximize total return through investments in a diversified portfolio of common stocks and securities convertible into common stock;
• Opportunistic LargeCap Growth seeks growth of capital through investment in a diversified portfolio consisting primarily of common stocks and securities convertible into common stock believed to offer growth potential;
• Small Company seeks growth of capital primarily through investment in a diversified portfolio of common stocks and securities of companies with smaller market capitalizations;
• Opportunistic LargeCap Value seeks growth of capital primarily through investment in a diversified portfolio of common stocks;
• Intermediate Bond seeks to maximize total return consistent with reasonable risk;
• Money Market seeks to provide high current return, consistent with preservation of capital and liquidity, through investment in high-quality money market investments while maintaining a stable share price of $1.00(1); and
• Global Science and Technology seeks long-term capital appreciation.
(1) Effective October 7, 2008, Money Market seeks to maintain a stable share price of $1.00 per share. In connection with this change, the Portfolio utilized a stock split and distributed additional shares to its shareholders such that each shareholder's proportionate interest and aggregate value of investment in the Portfolio remained the same.
Each Portfolio offers Class I and Class S shares. Each Portfolio except Money Market offers Adviser ("ADV") Class shares. The three classes differ principally in applicable distribution and service fees. Shareholders of each class also bear certain expenses that pertain to that particular class. All shareholders bear the common expenses of the Portfolios and earn income and realized gains/losses from the Portfolio pro rata based on the average daily net assets of each class, without discrimination between share classes. Common expenses of the Portfolios (including custodial asset-based fees, legal and audit fees, printing and mailing expenses, transfer agency out-of-pocket expenses, and fees and expenses of the independent directors/trustees) are allocated to each Portfolio in proportion to its average net assets. Expenses directly attributable to a particular Portfolio (including advisory, administration, custodial transaction-based, regist ration, other professional, distribution and/or service fees, certain taxes, and offering costs) are charged directly to that Portfolio. Differences in per share dividend rates generally result from differences in separate class expenses, including distribution and shareholder service fees, if applicable.
Shares of the Portfolios may be offered to separate accounts of insurance companies as investment options
35
NOTES TO FINANCIAL STATEMENTS AS OF DECEMBER 31, 2008 (CONTINUED)
NOTE 1 — ORGANIZATION (continued)
under variable annuity contracts and variable life insurance policies. Shares may also be offered to qualified pension and retirement plans outside the variable contract and to certain investment advisers and their affiliates. Class I shares may be made available to other investment companies, including series of the companies under fund-of-funds arrangements.
Participating insurance companies and other designated organizations are authorized to receive purchase orders on each Portfolio's behalf.
ING Investments, LLC ("ING Investments'' or the "Investment Adviser"), an Arizona limited liability company, serves as the investment adviser to the Portfolios. ING Investments has engaged ING Investment Management Co. ("ING IM''), a Connecticut corporation, to serve as the sub-adviser to each Portfolio, with the exception of Global Science and Technology. ING Funds Distributor, LLC ("IFD" or the "Distributor") is the principal underwriter of the Portfolios. ING Investments, ING IM and the Distributor are indirect, wholly-owned subsidiaries of ING Groep N.V. ("ING Groep"). ING Groep is a global financial institution of Dutch origin offering banking, investments, life insurance and retirement services to over 75 million private, corporate and institutional clients in more than 50 countries. With a diverse workforce of about 125,000 people, ING Groep comprises a broad spectrum of prominent companies that increasingly serve their clients under the ING brand.
On October 19, 2008, ING Groep announced that it reached an agreement with the Dutch government to strengthen its capital position, creating a strong buffer to navigate the current market and economic environment. ING Groep will issue non-voting core Tier-1 securities for a total consideration of EUR 10 billion to the Dutch State. The transaction boosts ING Bank's core Tier-1 ratio, strengthens the insurance balance sheet and reduces ING Groep's Debt/Equity ratio.
NOTE 2 — SIGNIFICANT ACCOUNTING POLICIES`
The following significant accounting policies are consistently followed by the Portfolios in the preparation of their financial statements. Such policies are in conformity with U.S. generally accepted accounting principles for investment companies.
A. Security Valuation. Investments in equity securities traded on a national securities exchange are valued at the last reported sale price. Securities reported by NASDAQ are valued at the NASDAQ official closing prices. Securities traded on an exchange or NASDAQ for which there has been no sale and securities traded in the over-the-counter-market are valued at the mean between the last reported bid and ask prices. All investments quoted in foreign currencies will be valued daily in U.S. dollars on the basis of the foreign currency exchange rates prevailing at that time. Debt securities are valued at prices obtained from independent services or from one or more dealers making markets in the securities and may be adjusted based on the Portfolios' valuation procedures. U.S. government obligations are valued by using market quotations or independent pricing services that use prices provided by market-makers or estimates of market values obtained from yield data relating to instruments or securities with similar characteristics.
Securities and assets for which market quotations are not readily available (which may include certain restricted securities, which are subject to limitations as to their sale) are valued at their fair values, as defined in the 1940 Act, and as determined in good faith by or under the supervision of the Portfolios' Board of Directors/Trustees ("Board"), in accordance with methods that are specifically authorized by the Board. Securities traded on exchanges, including foreign exchanges, which close earlier than the time that a Portfolio calculates its net asset value ("NAV") may also be valued at their fair values as defined by the 1940 Act, and as determined in good faith by or under the supervision of the Board, in accordance with methods that are specifically authorized by the Board. The valuation techniques applied in any specific instance are likely to vary from case to case. With respect to a restricted security, for example, considerat ion is generally given to the cost of the investment, the market value of any unrestricted securities of the same class at the time of valuation, the potential expiration of restrictions on the security, the existence of any registration rights, the costs to the Portfolios related to registration of the security, as well as factors relevant to the issuer itself. Consideration may also be given to the price and extent of any public trading in similar securities of the issuer or comparable companies' securities. The value of a foreign security traded on an exchange outside the United States is generally based on its price on the principal foreign exchange where it trades as of the time a Portfolio determines its NAV or if the foreign exchange closes prior to the time a Portfolio determines its NAV, the most recent closing price of the foreign security on its principal exchange.
36
NOTES TO FINANCIAL STATEMENTS AS OF DECEMBER 31, 2008 (CONTINUED)
NOTE 2 — SIGNIFICANT ACCOUNTING POLICIES (continued)
Trading in certain non-U.S. securities may not take place on all days on which the New York Stock Exchange ("NYSE") is open. Further, trading takes place in various foreign markets on days on which the NYSE is not open. Consequently, the calculation of a Portfolio's NAV may not take place contemporaneously with the determination of the prices of securities held by a Portfolio in foreign securities markets. Further, the value of a Portfolio's assets may be significantly affected by foreign trading on days when a shareholder cannot purchase or redeem shares of a Portfolio. In calculating a Portfolio's NAV, foreign securities denominated in foreign currency are converted to U.S. dollar equivalents. If an event occurs after the time at which the market for foreign securities held by a Portfolio closes but before the time that a Portfolio's NAV is calculated, such event may cause the closing price on the foreign exchange to not represent a readil y available reliable market value quotation for such securities at the time a Portfolio determines its NAV. In such a case, a Portfolio will use the fair value of such securities as determined under a Portfolio's valuation procedures. Events after the close of trading on a foreign market that could require a Portfolio to fair value some or all of its foreign securities include, among others, securities trading in the U.S. and other markets, corporate announcements, natural and other disasters, and political and other events. Among other elements of analysis in the determination of a security's fair value, the Board has authorized the use of one or more independent research services to assist with such determinations. An independent research service may use statistical analyses and quantitative models to help determine fair value as of the time a Portfolio calculates its NAV. There can be no assurance that such models accurately reflect the behavior of the applicable markets or the effect of the behavior of s uch markets on the fair value of securities, or that such markets will continue to behave in a fashion that is consistent with such models. Unlike the closing price of a security on an exchange, fair value determinations employ elements of judgment. Consequently, the fair value assigned to a security may not represent the actual value that a Portfolio could obtain if it were to sell the security at the time of the close of the NYSE. Pursuant to procedures adopted by the Board, a Portfolio is not obligated to use the fair valuations suggested by any research service, and valuation recommendations provided by such research services may be overridden if other events have occurred or if other fair valuations are determined in good faith to be more accurate. Unless an event is such that it causes a Portfolio to determine that the closing prices for one or more securities do not represent readily available reliable market value quotations at t he time a Portfolio determines its NAV, events that occur between the time of the close of the foreign market on which they are traded and the close of regular trading on the NYSE will not be reflected in a Portfolio's NAV. Investments in securities maturing in 60 days or less from date of acquisition are valued at amortized cost which approximates market value.
Money Market uses the amortized cost method to value its portfolio securities, which approximates market value. The amortized cost method involves valuing a security at its cost and amortizing any discount or premium over the period until maturity, regardless of the impact of fluctuating interest rates or the market value of the security.
Effective for fiscal years beginning after November 15, 2007, Financial Accounting Standards Board ("FASB") Statement of Financial Accounting Standards No. 157, "Fair Value Measurements", establishes a hierarchy for measuring fair value of assets and liabilities. As required by the standard, each investment asset or liability of the Portfolios is assigned a level at measurement date based on the significance and source of the inputs to its valuation. Quoted prices in active markets for identical securities are classified as "Level 1", inputs other than quoted prices for an asset that are observable are classified as "Level 2" and unobservable inputs, including the sub-adviser's judgment about the assumptions that a market participant would use in pricing an asset or liability are classified as "Level 3". The inputs used for valuing securities are not necessarily an indication of the risks associated with investing in those securities. A tabl e summarizing the Portfolios' investments under these levels of classification is included following the Portfolios of Investments.
Effective for fiscal years and interim periods ending after November 15, 2008, the FASB issued FASB Staff Position ("FSP") No. FAS 133-1 and FASB Interpretation Number ("FIN") 45-4, "Disclosures about Credit Derivatives and Certain
37
NOTES TO FINANCIAL STATEMENTS AS OF DECEMBER 31, 2008 (CONTINUED)
NOTE 2 — SIGNIFICANT ACCOUNTING POLICIES (continued)
Guarantees: An Amendment of FASB Statement No. 133 and FASB Interpretation No. 45; and Clarification of the Effective Date of FASB Statement No. 161." The amendments to FAS 133 require enhanced disclosure regarding credit derivatives sold, including (1) the nature and terms of the credit derivative, reasons for entering into the credit derivative, the events or circumstances that would require the seller to perform under the credit derivative, and the current status of the payment/performance risk of the credit derivative, (2) the maximum potential amount of future payments (undiscounted) the seller could be required to make under the credit derivative, (3) the fair value of the credit derivative, and (4) the nature of any recourse provisions and assets held either as collateral or by third parties. The amendments to FIN 45 require additional disclosures about the current status of the payment/performance risk of a guarantee. All changes to accounting policies have been made in accordance with the FSP and incorporated for the current period as part of the Notes to Financial Statements and Portfolio of Investments.
B. Security Transactions and Revenue Recognition. Securities transactions are accounted for on the trade date. Realized gains and losses are reported on the basis of identified cost of securities sold. Interest income is recorded on an accrual basis. Dividend income is recorded on the ex-dividend date, or for certain foreign securities, when the information becomes available to the Portfolios. Premium amortization and discount accretion are determined by the effective yield method.
C. Foreign Currency Translation. The books and records of the Portfolios are maintained in U.S. dollars. Any foreign currency amounts are translated into U.S. dollars on the following basis:
(1) Market value of investment securities, other assets and liabilities — at the exchange rates prevailing at the end of the day.
(2) Purchases and sales of investment securities, income and expenses — at the rates of exchange prevailing on the respective dates of such transactions.
Although the net assets and the market values are presented at the foreign exchange rates at the end of the day, the Portfolios do not isolate the portion of the results of operations resulting from changes in foreign exchange rates on investments from the fluctuations arising from changes in market prices of securities held. Such fluctuations are included with the net realized and unrealized gains or losses from investments. For securities, which are subject to foreign withholding tax upon disposition, liabilities are recorded on the Statements of Assets and Liabilities for the estimated tax withholding based on the securities' current market value. Upon disposition, realized gains or losses on such securities are recorded net of foreign withholding tax.
Reported net realized foreign exchange gains or losses arise from sales of foreign currencies, currency gains or losses realized between the trade and settlement dates on securities transactions, the difference between the amounts of dividends, interest, and foreign withholding taxes recorded on a Portfolio's books, and the U.S. dollar equivalent of the amounts actually received or paid. Net unrealized foreign exchange gains and losses arise from changes in the value of assets and liabilities other than investments in securities at fiscal year end, resulting from changes in the exchange rate. Foreign security and currency transactions may involve certain considerations and risks not typically associated with investing in U.S. companies and U.S. government securities. These risks include, but are not limited to, revaluation of currencies and future adverse political and economic developments, which could cause securities and their markets to be less liquid and prices more volatile than those of comparable U.S. companies and U.S. government securities.
D. Forward Foreign Currency Transactions and Futures Contracts. Certain Portfolios may enter into foreign currency exchange transactions to convert to and from different foreign currencies and to and from the U.S. dollar in connection with the planned purchases or sales of securities. When entering into a forward foreign currency contract, a Portfolio agrees to receive or deliver a fixed quantity of foreign currency for an agreed-upon price on an agreed future date. A Portfolio either enters into these transactions on a spot basis at the spot rate prevailing in the foreign currency exchange market or uses forward foreign currency cont racts to purchase or sell foreign currencies. When the contract is fulfilled or closed, gains or losses are realized. Until then, the gain or loss is included in unrealized appreciation or depreciation. Risks may arise upon entering into forward contracts from the potential inability of
38
NOTES TO FINANCIAL STATEMENTS AS OF DECEMBER 31, 2008 (CONTINUED)
NOTE 2 — SIGNIFICANT ACCOUNTING POLICIES (continued)
counterparties to meet the terms of their forward contracts and from unanticipated movements in the value of foreign currencies relative to the U.S. dollar.
Each Portfolio, with the exception of Money Market, may enter into futures contracts involving foreign currency, interest rates, securities and securities indices. A futures contract obligates the seller of the contract to deliver and the purchaser of the contract to take delivery of the type of foreign currency, financial instrument or security called for in the contract at a specified future time for a specified price. Upon entering into such a contract, a Portfolio is required to deposit and maintain as collateral such initial margin as required by the exchange on which the contract is traded. Pursuant to the contract, a Portfolio agrees to receive from or pay to the broker an amount equal to the daily fluctuations in the value of the contract. Such receipts or payments are known as variation margins and are recorded as unrealized gains or losses by a Portfolio. When the contract is closed, a Portfolio records a realized gain or loss equa l to the difference between the value of the contract at the time it was opened and the value at the time it was closed. Futures contracts are subject to market, credit and counterparty risk, occasionally in excess of their value in the Statements of Assets and Liabilities.
E. Distributions to Shareholders. The Portfolios record distributions to their shareholders on the ex-dividend date. Balanced, Opportunistic LargeCap Growth, Small Company, Opportunistic LargeCap Value and Global Science and Technology declare and pay dividends annually. Growth and Income and Intermediate Bond, declare and pay dividends semi-annually. Prior to October 7, 2008, Money Market declared and paid dividends annually. As of October 7, 2008, Money Market declares dividends daily and pays dividends, if any, monthly. Each Portfolio distributes capital gains, if any, annually. The Portfolios may make distributions on a more frequent basis to comply with the distribution requirements of the Internal Revenue Code. The characteristics of income and gains to be distributed are dete rmined in accordance with income tax regulations, which may differ from U.S. generally accepted accounting principles for investment companies.
F. Federal Income Taxes. It is the policy of the Portfolios to comply with subchapter M of the Internal Revenue Code and related excise tax provisions applicable to regulated investment companies and to distribute substantially all of their net investment income and any net realized capital gains to their shareholders. Therefore, no federal income tax provision is required. Management has considered the sustainability of the Portfolios' tax positions taken on federal income tax returns for all open tax years in making this determination. No capital gain distributions shall be made until any capital loss carryforwards have been fully utilized or expired.
G. Use of Estimates. The preparation of financial statements in conformity with U.S. generally accepted accounting principles requires management to make estimates and assumptions that affect the reported amounts of assets and liabilities and disclosure of contingent assets and liabilities at the date of the financial statements and the reported amounts of increases and decreases in net assets from operations during the reporting period. Actual results could differ from those estimates.
H. Repurchase Agreements. Each Portfolio may invest in repurchase agreements only with government securities dealers recognized by the Board of Governors of the Federal Reserve System. Under such agreements, the seller of the security agrees to repurchase it at a mutually agreed upon time and price. The resale price is in excess of the purchase price and reflects an agreed upon interest rate for the period of time the agreement is outstanding. The period of the repurchase agreements is usually short, from overnight to one week, while the underlying securities generally have longer maturities. Each Portfolio will receive as collateral securities acceptable to it whose market value is equal to at least 100% of the carrying amount of the repurchase agreements, plus accrued interest, be ing invested by the Portfolio. The underlying collateral is valued daily on a mark-to-market basis to assure that the value, including accrued interest is at least equal to the repurchase price. There would be potential loss to the Portfolio in the event the Portfolio is delayed or prevented from exercising its right to dispose of the collateral, and it might incur disposition costs in liquidating the collateral.
I. Securities Lending. Each Portfolio has the option to temporarily loan up to 30% of its total assets to brokers, dealers or other financial institutions in
39
NOTES TO FINANCIAL STATEMENTS AS OF DECEMBER 31, 2008 (CONTINUED)
NOTE 2 — SIGNIFICANT ACCOUNTING POLICIES (continued)
exchange for a negotiated lender's fee. The borrower is required to fully collateralize the loans with cash or U.S. government securities. Generally, in the event of counterparty default, a Portfolio has the right to use collateral to offset losses incurred. There would be potential loss to a Portfolio in the event a Portfolio is delayed or prevented from exercising its right to dispose of the collateral. A Portfolio bears the risk of loss with respect to the investment of collateral. Engaging in securities lending could have a leveraging effect, which may intensify the credit, market and other risks associated with investing in a Portfolio.
J. Illiquid and Restricted Securities. The Portfolios may not invest more than 15% (10% for Money Market) of their net assets in illiquid securities. Illiquid securities are not readily marketable. Disposing of illiquid investments may involve time-consuming negotiation and legal expenses, and it may be difficult or impossible for the Portfolios to sell them promptly at an acceptable price. The Portfolios may also invest in restricted securities, which include those sold under Rule 144A of the Securities Act of 1933 ("1933 Act") or securities offered pursuant to Section 4(2) of the 1933 Act, and/or are subject to legal or contractual restrictions on resale and may not be publicly sold without registration under the 1933 Act. Certain restricted securities may be considered liquid pur suant to guidelines approved by the Board or may be deemed to be illiquid because they may not be readily marketable. Illiquid and restricted securities are valued using market quotations when readily available. In the absence of market quotations, the securities are valued based upon their fair value, as defined by the Act, determined under procedures approved by the Board.
K. When-Issued and Delayed-Delivery Transactions. Each Portfolio may purchase or sell securities on a when-issued or forward commitment basis. The price of the underlying securities and date when the securities will be delivered and paid for are fixed at the time the transaction is negotiated. The market value of such is identified in the Portfolio of Investments. Losses may arise due to changes in the market value of the securities or from the inability of counterparties to meet the terms of the contract. In connection with such purchases, the Portfolios are required to hold liquid assets as collateral with the Portfolios' custodian sufficient to cover the purchase price.
L. Mortgage Dollar Roll Transactions. Each Portfolio, except Opportunistic LargeCap Growth and Small Company, may engage in dollar roll transactions with respect to mortgage-backed securities issued by Government National Mortgage Association, Federal National Mortgage Association and Federal Home Loan Mortgage Corp. In a dollar roll transaction, a Portfolio sells a mortgage-backed security to a financial institution, such as a bank or broker/dealer, and simultaneously agrees to repurchase a substantially similar (i.e., same type, coupon, and maturity) security from the institution on a delayed delivery basis at an agreed upon price. The mortgage-backed securities that are repurchased will bear the same interest rate as those sold, but generally will be collateralized by different p ools of mortgages with different prepayment histories. The Portfolios account for dollar roll transactions as purchases and sales.
M. Options Contracts. Certain Portfolios may purchase put and call options and may write (sell) put options and covered call options. The Portfolios may engage in option transactions as a hedge against adverse movements in the value of portfolio holdings or to increase market exposure. Option contracts are valued daily and unrealized gains or losses are recorded based upon the last sales price on the principal exchange on which the options are traded. An amount equal to the premium received by the Portfolios upon the writing of a put or call option is included in the Statements of Assets and Liabilities as a liability which is subsequ ently marked-to-market until it is exercised or closed, or it expires. The Portfolios will realize a gain or loss upon the expiration or closing of the option contract. When an option is exercised, the proceeds on sales of the underlying security for a written call option, the purchase cost of the security for a written put option, or the cost of the security for a purchased put or call option is adjusted by the amount of premium received or paid. Realized and unrealized gains or losses on option contracts are reflected in the accompanying financial statements. The risk in writing a covered call option is that the Portfolios give up the opportunity for profit if the market price of the security increases and the option is exercised. The risk in writing a put option is that the Portfolios may incur a loss if the market price of the security decreases and the option is exercised. The risk in buying an option is that the Portfolios pay a premium whether or not the option is exercised. Risks may also arise from an illiquid
40
NOTES TO FINANCIAL STATEMENTS AS OF DECEMBER 31, 2008 (CONTINUED)
NOTE 2 — SIGNIFICANT ACCOUNTING POLICIES (continued)
secondary market or from the inability of counterparties to meet the terms of the contract.
N. Swap Agreements. Certain Portfolios may enter into swap agreements. A swap is an agreement between two parties pursuant to which each party agrees to make one or more payments to the other at specified future intervals based on the return of an asset (such as a stock, bond or currency) or non-asset reference (such as an interest rate or index). The swap agreement will specify the "notional" amount of the asset or non-asset reference to which the contract relates. Subsequent changes in market value, if any, are calculated based upon changes in the performance of the asset or non-asset reference multiplied by the notional value of the contract. A Portfolio may enter into credit default, interest rate, total return and currency swaps to manage its exposure to credit, currency and in terest rate risk. All outstanding swap agreements are reported following each Portfolio's Portfolio of Investments.
Swaps are marked to market daily using quotations primarily from third party pricing services, counterparties or brokers. The value of the swap contract is recorded on each Portfolio's Statements of Assets or Liabilities. During the term of the swap, changes in the value of the swap, if any, are recorded as unrealized gains or losses on the Statements of Operations. Upfront payments paid or received by a Portfolio when entering into the agreements are reported on the Statements of Assets and Liabilities and as a component of the changes in unrealized gains or losses on the Statements of Operations. These upfront payments represent the amounts paid or received when initially entering into the swap agreement to compensate for differences between the stated terms of the swap agreement and the prevailing market conditions. The upfront payments are included as a component in the realized gains or losses on each Portfolio's Statement of Operations upon termination or maturity of the swap. A Portfolio also records net periodic payments paid or received on the swap contract as a realized gain or loss on the Statements of Operations.
Entering into swap agreements involves the risk that the maximum potential loss of an investment exceeds the current value of the investment as reported on each Portfolio's Statements of Assets and Liabilities. Other risks involve the possibility that the counterparty to the agreements may default on its obligation to perform, that there will be no liquid market for these investments and that unfavorable changes in the market will have a negative impact on the value of the index or securities underlying the respective swap agreement.
Credit Default Swap Contracts. A credit default swap is a bilateral agreement between counterparties in which the buyer of the protection agrees to make a stream of periodic payments to the seller of protection in exchange for the right to receive a specified return in the event of a default or other credit event for a referenced entity, obligation or index. As a seller of protection on credit default swaps, a Portfolio will generally receive from the buyer a fixed payment stream based on the notional amount of the swap contract. This fixed payment stream will continue until the swap contract expires or a defined credit event occurs.
A Portfolio is subject to credit risk in the normal course of pursuing its investment objectives. As a seller of protection in a credit default swap, a Portfolio may execute these contracts to manage its exposure to the market or certain sectors of the market. Certain Portfolios may also enter into credit default swaps to speculate on changes in an issuer's credit quality, to take advantage of perceived spread advantages, or to offset an existing short equivalent (i.e. buying protection on an equivalent reference entity).
Certain Portfolios may sell credit default swaps which expose these Portfolios to the risk of loss from credit risk- related events specified in the contract. Although contract specific, credit events are generally defined as bankruptcy, failure to pay, restructuring, obligation acceleration, obligation default or repudiation/moratorium. If a Portfolio is a seller of protection, and a credit event occurs, as defined under the terms of that particular swap agreement, a Portfolio will generally either (i) pay to the buyer an amount equal to the notional amount of the swap and take delivery of the referenced obligation, other deliverable obligations, or underlying securities comprising a referenced index or (ii) pay a net settlement amount in the form of cash or securities equal to the notional amount of the swap less the recovery value of the referenced obligation or underlying securities comprising a referenced index. If a Portfolio is a bu yer of protection and a credit event occurs, as defined under the terms of that particular swap
41
NOTES TO FINANCIAL STATEMENTS AS OF DECEMBER 31, 2008 (CONTINUED)
NOTE 2 — SIGNIFICANT ACCOUNTING POLICIES (continued)
agreement, a Portfolio will either (i) receive from the seller of protection an amount equal to the notional amount of the swap and deliver the referenced obligation, other deliverable obligations or underlying securities comprising the referenced index or (ii) receive a net settlement amount in the form of cash or securities equal to the notional amount of the swap less the recovery value of the referenced obligation or underlying securities comprising the referenced index. Recovery values are assumed by market makers considering either industry standard recovery rates or entity specific factors and considerations until a credit event occurs. If a credit event has occurred, the recovery value is determined by a facilitated auction whereby a minimum number of allowable broker bids, together with a specified valuation method, are used to calculate the settlement value.
Implied credit spreads, represented in absolute terms, utilized in determining the market value of credit default swap agreements on corporate issues or sovereign issues are disclosed in each Portfolio's Portfolio of Investment and serve as an indicator of the current status of the payment/performance risk and represent the likelihood or risk of default for the credit derivative. The implied credit spread of a particular referenced entity reflects the cost of buying/selling protection and may include upfront payments required to be made to enter into the agreement. For credit default swaps on asset-backed securities or credit indices, the quoted market prices and resulting market values serve as the indicator of the current status of the payment/performance risk. Wider credit spreads and increasing market values, in absolute terms when compared to the notional amount of the swap, represent a deterioration of the referenced entity's credit so undness and a greater likelihood or risk of default or other credit event occurring as defined under the terms of the agreement.
The maximum amount of future payments (undiscounted) that a Portfolio as seller of protection could be required to make under a credit default swap agreement would be an amount equal to the notional amount of the agreement. Notional amounts of all credit default swap agreements outstanding as of November December 31, 2008, for which a Portfolio is seller of protection are disclosed in each Portfolio's Portfolio of Investments. These potential amounts would be partially offset by any recovery values of the respective referenced obligations, upfront payments received upon entering into the agreements, or net amounts received from the settlement of buy protection credit default swap agreements entered into by a Portfolio for the same referenced entity or entities.
Interest Rate Swap Contracts. An interest rate swap involves the agreement between counterparties to exchange periodic payments based on interest rates. One payment will be based on a floating rate of a specified interest rate while the other will be a fixed rate. Risks involve the future fluctuations of interest rates in which a Portfolio may make payments that are greater than what a Portfolio received from the counterparty. Other risks include credit, liquidity and market risk.
Total Return Swap Contracts. A total return swap involves the agreement between counterparties to exchange periodic payments based on an asset (such as a basket of securities) or non-asset (such as an index) reference. The periodic payments or cash flows, are usually based on the non-asset reference versus the total return or the asset-based reference. The asset-based reference generally includes unrealized appreciation or depreciation and to the extent that the total return falls short of or exceeds the non-asset reference, a Portfolio will make or receive a payment to the counterparty. Risks of total return swaps include credit, liquidity and market risks.
Currency Swaps. A currency swap involves the agreement between counterparties to exchange two different currencies at contract inception at the prevailing spot rate, and to reverse the exchange at a later agreed upon termination date. The currency exchange at termination may take place at the original exchange rate, an agreed upon exchange rate or the prevailing spot rate on the date of termination. The contract may also include periodic interest payments based on a specified interest rate. Risks related to currency swaps include, but are not limited to, credit, liquidity, market, and exchange rate fluctuations.
Structured Products. Certain Portfolios invest in structured products which are specially-designed derivative investments whose principal payments or interest payments are linked to the performance of underlying foreign currencies, interest rate spreads, stock market indices, prices
42
NOTES TO FINANCIAL STATEMENTS AS OF DECEMBER 31, 2008 (CONTINUED)
NOTE 2 — SIGNIFICANT ACCOUNTING POLICIES (continued)
of individual securities, commodities or other financial instruments or the occurrence of other specific events. The terms and conditions of these products may be 'structured' by the purchaser and the borrower issuing the note. The market value of these products will increase or decrease based on the performance of the underlying asset or reference. A Portfolio records the changes in the market value of these structured products as an unrealized gain or loss in the accompanying Portfolio's Statements of Operations. A Portfolio records a realized gain or loss when a structured product is sold or matures.
Risks associated with structured products include credit risk (if the counterparty fails to meet its obligation) and risk associated with the underlying asset or reference. Since a Portfolio enters into the transaction with the borrower at par value, a Portfolio could receive more or less than it originally invested when a note matures. The prices of the notes may also be very volatile and may have limited liquidity in the market which can make it difficult for a Portfolio to value or sell at an advantageous price.
Certain Portfolios are party to International Swap Dealers Association, Inc. Master Agreements ("ISDA Master Agreements"). These agreements are with select counterparties and they govern transactions, including certain over-the counter derivative and foreign exchange contracts, entered into by the Portfolios and the counterparty. The ISDA Master Agreements maintain provisions for general obligations, representations, agreements, collateral, and events of default or termination. The occurrence of a specified event of termination may give a counterparty the right to terminate all of its contracts and affect settlement of all outstanding transactions under the applicable ISDA Master Agreement.
O. Reverse Repurchase Agreements. A reverse repurchase agreement involves the sale of a security, with an agreement to repurchase the same or a substantially similar security at an agreed upon price and date. Reverse repurchase agreements are considered borrowings and the difference between the sale and repurchase prices represents interest expense at an agreed upon rate. Whether such a transaction produces a gain for a Portfolio depends upon whether the income and gains on the securities purchased with the proceeds received from the sale of the security exceeds the interest expense incurred by the Portfolio. Reverse repurchase agreements, as a leveraging technique, may increase a Portfolio's yield; however, suc h transactions also increase a Portfolio's risk to capital and may result in a shareholder's loss of principal.
P. Indemnifications. In the normal course of business, the Registrants may enter into contracts that provide certain indemnifications. The Registrants' maximum exposure under these arrangements is dependent on future claims that may be made against the Portfolios and, therefore, cannot be estimated; however, based on experience, the risk of loss from such claims is considered remote.
NOTE 3 — INVESTMENT TRANSACTIONS
For the year ended December 31, 2008, the cost of purchases and the proceeds from the sales of securities, excluding short-term and U.S. government securities, were as follows:
| | | Purchases | | Sales | |
| Balanced | | $ | 1,146,916,738 | | | $ | 1,184,079,684 | | |
| Growth and Income | | | 4,267,210,327 | | | | 4,058,289,248 | | |
| Opportunistic LargeCap Growth | | | 284,797,441 | | | | 316,851,194 | | |
| Small Company | | | 848,908,212 | | | | 782,831,665 | | |
| Opportunistic LargeCap Value | | | 164,894,364 | | | | 190,992,277 | | |
| Intermediate Bond | | | 1,394,441,391 | | | | 1,094,966,801 | | |
| Global Science and Technology | | | 220,265,099 | | | | 209,163,558 | | |
U.S. government securities not included above were as follows:
| | | Purchases | | Sales | |
| Balanced | | $ | 1,360,023,367 | | | $ | 1,464,639,454 | | |
| Intermediate Bond | | | 23,192,553,129 | | | | 23,331,428,772 | | |
NOTE 4 — INVESTMENT MANAGEMENT AND ADMINISTRATIVE FEES
The Portfolios entered into investment management agreements ("Investment Management Agreements") with the Investment Adviser. The Investment Management Agreements compensate the Investment Adviser with a fee, computed daily and payable monthly, based on the average daily net assets of each Portfolio, at the following annual rates:
| Balanced | | | 0.500 | % | |
| Growth and Income | | | 0.500% on first $10 billion;
0.450% on next $5 billion; and
0.425% over $15 billion | | |
| Opportunistic LargeCap Growth | | | 0.600 | % | |
| Small Company | | | 0.750 | % | |
| Opportunistic LargeCap Value | | | 0.600 | % | |
| Intermediate Bond | | | 0.400 | % | |
| Money Market | | | 0.250 | % | |
| Global Science and Technology | | | 0.950 | % | |
43
NOTES TO FINANCIAL STATEMENTS AS OF DECEMBER 31, 2008 (CONTINUED)
NOTE 4 — INVESTMENT MANAGEMENT AND ADMINISTRATIVE FEES (continued)
The Investment Adviser entered into sub-advisory agreements with ING IM. ING IM acts as sub-adviser to all Portfolios except for Global Science and Technology. Subject to such policies as the Board or the Investment Adviser may determine, ING IM manages the Portfolios' assets in accordance with the Portfolios' investment objectives, policies, and limitations.
BlackRock Advisors, LLC ("BlackRock"), serves as Sub-Adviser to Global Science and Technology pursuant to a Sub-Advisory Agreement, effective February 2, 2007, between the Investment Adviser and BlackRock.
ING Portfolios are permitted to invest end-of-day cash balances into ING Institutional Prime Money Market Fund. Investment management fees paid by the Portfolios will be reduced by an amount equal to the management fees paid indirectly to ING Institutional Prime Money Market Fund with respect to assets invested by the Portfolios. For the year ended December 31, 2008, the Investment Adviser for Balanced, Growth and Income, Opportunistic LargeCap Growth, Small Company, Opportunistic LargeCap Value and Intermediate Bond waived $15,078, $16,163, $173, $11,852, $126, and $103,127 of such management fees, respectively. These fees are not subject to recoupment.
Pursuant to administration agreements, ING Funds Services, LLC ("IFS"), an indirect, wholly-owned subsidiary of ING Groep, acts as administrator and provides certain administrative and shareholder services necessary for Portfolio operations and is responsible for the supervision of other service providers.
IFS is entitled to receive from each Portfolio a fee at an annual rate of 0.055% on the first $5 billion of daily net assets and 0.03% thereafter.
In placing equity security transactions, each sub-adviser is required to use its best efforts to choose a broker capable of providing brokerage services necessary to obtain the best execution for each transaction. Subject to this requirement, each sub-adviser may allocate equity security transactions through certain designated broker-dealers. Some of these broker-dealers participate in commission recapture programs that have been established for the benefit of the Portfolios. Under these programs, the participating broker-dealers will return to a Portfolio a portion of the brokerage commissions (in the form of a credit to a Portfolio) paid to the broker-dealers to pay certain expenses of a Portfolio. These commission recapture payments benefit the Portfolios and not the sub-adviser. Any amount credited to a Portfolio is recognized as brokerage commission recapture in the Statements of Operations.
NOTE 5 — DISTRIBUTION AND SERVICE FEES
ADV Class shares of the respective Portfolios are subject to a Shareholder Service and Distribution Plan (the "Plan"). Under the Plan, the Distributor is paid an annual shareholder service fee at the rate of 0.25% and an annual distribution fee at the rate of 0.25% of the average daily net assets attributable to its ADV Class shares.
Class S shares of the Portfolios have adopted Distribution Plans pursuant to Rule 12b-1 under the 1940 Act (the "12b-1 Plans"), whereby the Distributor is compensated by each Portfolio for expenses incurred in the distribution of each Portfolio's shares ("Distribution Fees"). Pursuant to the 12b-1 Plans, the Distributor is entitled to a payment each month to compensate for expenses incurred in the distribution and promotion of each Portfolio's shares, including expenses incurred in printing prospectuses and reports used for sales purposes, expenses incurred in preparing and printing sales literature and other such distribution related expenses, including any distribution or shareholder servicing fees ("Service Fees") paid to securities dealers who have executed a distribution agreement with the Distributor. Under the 12b-1 Plans, Class S shares of the Portfolios pay the Distributor a fee calculated at an annual rate of 0.25% of average daily net assets.
NOTE 6 — OTHER TRANSACTIONS WITH AFFILIATED AND RELATED PARTIES
At December 31, 2008, the Portfolios had the following amounts recorded in payable to affiliates on the accompanying Statements of Assets and Liabilities (see Notes 4 and 5):
| | | Accrued
Investment
Management
Fees | | Accrued
Administrative
Fees | | Accrued
Shareholder
Service and
Distribution
Fees | | Total | |
| Balanced | | $ | 252,394 | | | $ | 27,849 | | | $ | 1,383 | | | $ | 281,626 | | |
| Growth and Income | | | 786,025 | | | | 86,529 | | | | 59,917 | | | | 932,471 | | |
Opportunistic LargeCap
Growth | | | 33,048 | | | | 3,033 | | | | 1,705 | | | | 37,786 | | |
| Small Company | | | 272,979 | | | | 20,056 | | | | 8,291 | | | | 301,326 | | |
Opportunistic LargeCap
Value | | | 42,142 | | | | 3,864 | | | | 2,467 | | | | 48,473 | | |
| Intermediate Bond | | | 989,940 | | | | 137,803 | | | | 249,298 | | | | 1,377,041 | | |
| Money Market | | | 382,283 | | | | 84,101 | | | | — | | | | 466,384 | | |
Global Science and
Technology | | | 112,876 | | | | 6,535 | | | | 18,207 | | | | 137,618 | | |
The Registrants have adopted a Deferred Compensation Plan (the "Policy"), which allows eligible non-affiliated directors as described in the Policy to defer the receipt
44
NOTES TO FINANCIAL STATEMENTS AS OF DECEMBER 31, 2008 (CONTINUED)
NOTE 6 — OTHER TRANSACTIONS WITH AFFILIATED AND RELATED PARTIES (continued)
of all or a portion of the directors' fees payable. Deferred fees are invested in various funds advised by ING Investments until distribution in accordance with the Policy.
At December 31, 2008, the following ING Portfolios or indirect, wholly owned subsidiaries of ING Groep owned more than 5% of the following Portfolios:
ING Life Insurance and Annuity Company — Balanced (91.33%); Growth and Income (72.49%); Opportunistic LargeCap Growth (90.46%); Small Company (44.37%); Opportunistic LargeCap Value (82.99%); Intermediate Bond (31.71%); Money Market (98.28%); and Global Science and Technology (38.10%)
ING LifeStyle Aggressive Growth Portfolio — Small Company (5.21%)
ING LifeStyle Growth Portfolio — Small Company (20.00%)
ING LifeSyle Moderate Growth Portfolio — Small Company (5.61%); and Intermediate Bond (6.15%)
ING USA Annuity and Life Insurance Company — Growth and Income (14.52%); Small Company (9.37%); Opportunistic LargeCap Value (13.60%); Intermediate Bond (39.21%); and Global Science and Technology (60.26%)
Reliastar Life Insurance Company — Opportunistic LargeCap Growth (7.65%)
Control is defined by the 1940 Act as the beneficial ownership, either directly or through one or more controlled companies, of more than 25% of the voting securities of a company. The 1940 Act defines affiliates as companies that are under common control. Therefore, because the Portfolios have a common owner that owns over 25% of the outstanding securities of the Portfolios, they may be deemed to be affiliates of each other. Investment activities of these shareholders could have a material impact on the Portfolios.
For the year ended December 31, 2008, Global Science and Technology placed a portion of its portfolio transactions with a brokerage firm which is an affiliate of the Investment Adviser. The commissions paid to the affiliated firm, ING Baring LLC, was $3,081.
On September 16, 2008, Money Market obtained a commitment from the Adviser that an affiliate of ING Groep will provide capital support with respect to certain of its portfolio holdings. The Portfolio entered into a Capital Support Agreement ("Agreement") with ING America Insurance Holdings, Inc., a Delaware corporation ("Capital Support Provider" or "CSP"). The Agreement established certain circumstances ("Contribution Event") where the CSP is obligated to make a cash contribution ("Capital Contribution") to the Portfolio in an amount sufficient for the Portfolio to maintain its market-based net asset value per share ("NAV") at no less than $0.9950. The maximum amount that the CSP would be required to contribute under the Agreement is an amount equal to the outstanding principal balance of certain notes (American General Finance Corp.) ("Notes") held by the Portfolio as a portfolio security on the date of the Contribution Event.
The obligation of the CSP to make Capital Contributions under the Agreement terminates upon the earlier to occur: (i) of the repayment in full, in cash, of all the Notes; (ii) the CSP having made Capital Contributions, in the aggregate, equal to the maximum contribution amount and; (iii) so long as the CSP is not in default with respect to its obligations arising under the Agreement, October 2, 2008 ("Termination Date").
In addition, the Portfolio agreed to sell the Notes: (i) within fifteen (15) calendar days following any change in the CSP's short-term credit ratings such that the CSP's short-term obligations no longer qualify as "First Tier Securities," (as defined in Rule 2a-7); or (ii) on the business day immediately prior to the Termination Date, provided that the Portfolio shall not be required to complete any such sale if (A) the amount the Portfolio expects to receive on such sale date would not result in a loss or the payment of a Capital Contribution, or (B) with respect to an event described above in the first sentence of this paragraph, if the CSP substitutes an obligation or credit support that satisfies the requirement of a First Tier Security within fifteen (15) calendar days from the occurrence of such event and during that 15-day period the CSP's obligations qualify as "Second Tier Securities" (as defined in Rule 2a-7).
On October 2, 2008, American General Finance Corp. commercial paper held by the Portfolio matured at par of $37,500,000. Since the commercial paper was paid in full upon maturity, ING America Insurance Holdings, Inc. was not required to make a capital contribution pursuant to the Capital Support Agreement.
In the event that the Portfolio had received a Capital Contribution from the CSP with respect to the Notes and subsequently received additional payments from, or on behalf of, the Issuer in respect of the Notes, the Portfolio would have repaid the CSP the lesser of the amount of the Capital Contribution or the amount of
45
NOTES TO FINANCIAL STATEMENTS AS OF DECEMBER 31, 2008 (CONTINUED)
NOTE 6 — OTHER TRANSACTIONS WITH AFFILIATED AND RELATED PARTIES (continued)
such subsequent payments, provided that in no event shall such repayment to the CSP cause the Portfolio's NAV per share to fall below $0.9950.
NOTE 7 — EXPENSE LIMITATIONS
ING Investments entered into written expense limitation agreements ("Expense Limitation Agreements") with each of the following Portfolios whereby the Investment Adviser has agreed to limit expenses, excluding interest expense, taxes, brokerage commissions and extraordinary expenses (and acquired fund fees and expenses) to the levels listed below:
| | | Class ADV | | Class I | | Class S | |
| Opportunistic LargeCap Growth | | | 1.30 | % | | | 0.80 | % | | | 1.05 | % | |
| Small Company | | | 1.45 | % | | | 0.95 | % | | | 1.20 | % | |
| Opportunistic LargeCap Value | | | 1.30 | % | | | 0.80 | % | | | 1.05 | % | |
| Global Science and Technology(1) | | | 1.55 | % | | | 1.05 | % | | | 1.30 | % | |
(1) Prior to April 28, 2008, the expense limits for Global Science and Technology were 1.15% and 1.40% for Class I and Class S, respectively.
The Investment Adviser may at a later date recoup from a Portfolio management fees waived and other expenses assumed by the Investment Adviser during the previous 36 months, but only if, after such recoupment, the Portfolio's expense ratio does not exceed the percentage described above. Waived and reimbursed fees net of any recoupment by the Investment Adviser of such waived and reimbursed fees are reflected on the accompanying Statements of Operations. Amounts payable by the Investment Manager are reflected on the accompanying Statements of Assets and Liabilities for each Portfolio.
As of December 31, 2008, the amount of waived and reimbursed fees that are subject to recoupment by the Investment Adviser, and the related expiration dates are as follows:
| | | December 31 | | | |
| | | 2009 | | 2010 | | 2011 | | Total | |
Global Science and
Technology | | $ | — | | | $ | — | | | $ | 32,093 | | | $ | 32,093 | | |
The Expense Limitation Agreements are contractual and shall renew automatically for one-year terms unless ING Investments provides written notice of the termination of an Expense Limitation Agreement within 90 days of the end of the then current term.
NOTE 8 — LINE OF CREDIT
The Portfolios, in addition to certain other funds managed by the Investment Adviser, have entered into an unsecured committed revolving line of credit agreement (the "Citi Credit Agreement ") with Citibank, N.A. for an aggregate amount of $100,000,000. The proceeds may be used only to: (1) temporarily finance the purchase and sale of securities; (2) finance the redemption of shares of an investor in the Portfolios; and (3) enable the Portfolios to meet other emergency expenses as defined in the Citi Credit Agreement. The Portfolios to which the line of credit is available pay a commitment fee equal to 0.08% per annum on the daily unused portion of the committed line amount. Each of the Portfolios will pay its pro rata share of the commitment fee.
On November 11, 2008, the Board approved an extension of the unsecured committed revolving line of credit agreement with Citibank, N.A. for an aggregate amount of $100,000,000. The Citi Credit Agreement was extended for an additional thirty-day period, terminating on December 18, 2008. The Portfolios to which the line of credit is available pay a commitment fee equal to 0.15% per annum on the daily unused portion of the committed line amount.
On December 11, 2008, the Board approved an unsecured committed revolving line of credit agreement (the "BNY Credit Agreement") with The Bank of New York Mellon for an aggregate amount of $100,000,000, not to exceed $50,000,000 with respect to any one Portfolio or 10% of the Portfolio's value of total assets if Net Asset Value is less than $25,000,000 effective December 18, 2008 for a 364-day period, terminating on December 16, 2009. The proceeds may be used to: (1) temporarily finance the purchase and sale of securities; (2) finance the redemption of shares of an investor in the Portfolios; and (3) enable the Portfolios to meet other emergency expenses as defined in the BNY Credit Agreement. The Portfolios to which the line of credit is available pay a commitment fee equal to 0.125% per annum on the daily unused portion of the committed line amount.
Generally, borrowings under the credit agreements accrue interest at the federal funds rate plus a specified margin. Repayments generally must be made within 30 days after the date of a revolving credit advance. The following Portfolios utilized the line of credit during the year ended December 31, 2008:
| | | Days
Utilized | | Approximate
Average Daily
Balance | | Approximate
Weighted
Average
Interest Rate | |
| Balanced | | | 3 | | | $ | 600,000 | | | | 3.49 | % | |
| Growth and Income | | | 7 | | | | 6,557,143 | | | | 2.93 | | |
Opportunistic LargeCap
Growth | | | 7 | | | | 2,061,429 | | | | 2.88 | | |
| Small Company | | | 6 | | | | 4,631,667 | | | | 2.61 | | |
Opportunistic LargeCap
Value | | | 5 | | | | 324,000 | | | | 4.15 | | |
| Intermediate Bond | | | 4 | | | | 9,072,500 | | | | 2.92 | | |
46
NOTES TO FINANCIAL STATEMENTS AS OF DECEMBER 31, 2008 (CONTINUED)
Transactions in capital shares and dollars were as follows:
| | | Shares sold | | Proceeds
from shares
issued
in merger | | Reinvestment
of
distributions | | Shares
redeemed | | Net increase
(decrease)
in shares
outstanding | | Shares sold | | Proceeds
from shares
issued
in merger | | Reinvestment
of
distributions | | Shares
redeemed | | Net increase
(decrease)
in shares
outstanding | |
| Year or period ended | | # | | # | | # | | # | | # | | ($) | | ($) | | ($) | | ($) | | ($) | |
| Balanced | |
| Class ADV | |
| 12-31-08 | | | — | | | | — | | | | — | | | | (1 | ) | | | (1 | ) | | | — | | | | — | | | | — | | | | (12 | ) | | | (12 | ) | |
| 12-31-07 | | | 2 | | | | — | | | | — | | | | — | | | | 2 | | | | 28 | | | | — | | | | — | | | | — | | | | 28 | | |
| Class I | |
| 12-31-08 | | | 354,934 | | | | — | | | | 9,121,937 | | | | (16,235,628 | ) | | | (6,758,757 | ) | | | 3,692,548 | | | | — | | | | 110,649,102 | | | | (185,483,682 | ) | | | (71,142,032 | ) | |
| 12-31-07 | | | 601,762 | | | | — | | | | 5,397,784 | | | | (14,407,746 | ) | | | (8,408,200 | ) | | | 8,646,382 | | | | — | | | | 74,921,236 | | | | (208,308,305 | ) | | | (124,740,687 | ) | |
| Class S | |
| 12-31-08 | | | 125,814 | | | | — | | | | 89,235 | | | | (198,053 | ) | | | 16,996 | | | | 1,479,685 | | | | — | | | | 1,077,072 | | | | (2,287,198 | ) | | | 269,559 | | |
| 12-31-07 | | | 98,592 | | | | — | | | | 48,696 | | | | (164,770 | ) | | | (17,482 | ) | | | 1,413,626 | | | | — | | | | 672,985 | | | | (2,358,255 | ) | | | (271,644 | ) | |
| Growth and Income | |
| Class ADV | |
| 12-31-08 | | | 40,306 | | | | — | | | | 792 | | | | (37,703 | ) | | | 3,395 | | | | 848,718 | | | | — | | | | 11,483 | | | | (780,408 | ) | | | 79,793 | | |
| 12-31-07 | | | 4,938 | | | | 114,031 | | | | 642 | | | | (70,456 | ) | | | 49,155 | | | | 122,979 | | | | 2,802,427 | | | | 15,909 | | | | (1,754,815 | ) | | | 1,186,500 | | |
| Class I | |
| 12-31-08 | | | 11,913,505 | | | | — | | | | 2,316,631 | | | | (19,771,802 | ) | | | (5,541,666 | ) | | | 251,520,863 | | | | — | | | | 33,730,148 | | | | (402,121,000 | ) | | | (116,869,989 | ) | |
| 12-31-07 | | | 203,330 | | | | 2,058,554 | | | | 1,574,933 | | | | (23,418,770 | ) | | | (19,581,953 | ) | | | 4,950,308 | | | | 50,909,777 | | | | 39,278,832 | | | | (576,312,116 | ) | | | (481,173,199 | ) | |
| Class S | |
| 12-31-08 | | | 4,145,988 | | | | 16,787,613 | | | | 397,722 | | | | (3,014,524 | ) | | | 18,316,799 | | | | 94,804,530 | | | | 353,711,801 | | | | 5,751,055 | | | | (57,814,407 | ) | | | 396,452,979 | | |
| 12-31-07 | | | 126,276 | | | | 852,618 | | | | 14,041 | | | | (175,331 | ) | | | 817,604 | | | | 3,119,814 | | | | 20,968,866 | | | | 348,348 | | | | (4,328,750 | ) | | | 20,108,278 | | |
| Opportunistic LargeCap Growth | |
| Class ADV | |
| 12-31-08 | | | 41,857 | | | | — | | | | — | | | | (68,101 | ) | | | (26,244 | ) | | | 449,026 | | | | — | | | | — | | | | (677,704 | ) | | | (228,678 | ) | |
| 12-31-07 | | | 83,613 | | | | 260,860 | | | | 493 | | | | (233,810 | ) | | | 111,156 | | | | 977,275 | | | | 2,856,192 | | | | 5,295 | | | | (2,637,192 | ) | | | 1,201,570 | | |
| Class I | |
| 12-31-08 | | | 252,635 | | | | — | | | | 69,368 | | | | (2,727,762 | ) | | | (2,405,759 | ) | | | 2,567,062 | | | | — | | | | 749,873 | | | | (27,428,648 | ) | | | (24,111,713 | ) | |
| 12-31-07 | | | 978,074 | | | | 294,101 | | | | 29,544 | | | | (7,868,207 | ) | | | (6,566,488 | ) | | | 11,185,278 | | | | 3,220,605 | | | | 317,595 | | | | (92,737,170 | ) | | | (78,013,692 | ) | |
| Class S | |
| 12-31-08 | | | 221,013 | | | | — | | | | 4,259 | | | | (907,567 | ) | | | (682,295 | ) | | | 2,090,131 | | | | — | | | | 45,652 | | | | (8,653,583 | ) | | | (6,517,800 | ) | |
| 12-31-07 | | | 225,599 | | | | 2,834,516 | | | | 3,866 | | | | (1,386,799 | ) | | | 1,677,182 | | | | 2,620,412 | | | | 30,774,830 | | | | 41,178 | | | | (15,618,037 | ) | | | 17,818,383 | | |
| Small Company | |
| Class ADV | |
| 12-16-08(1) - 12-31-08 | | | 270 | | | | — | | | | — | | | | — | | | | 270 | | | | 3,000 | | | | — | | | | — | | | | — | | | | 3,000 | | |
| Class I | |
| 12-31-08 | | | 9,251,093 | | | | — | | | | 4,962,617 | | | | (9,110,644 | ) | | | 5,103,066 | | | | 147,087,480 | | | | — | | | | 79,699,637 | | | | (145,489,311 | ) | | | 81,297,806 | | |
| 12-31-07 | | | 8,292,290 | | | | — | | | | 4,011,153 | | | | (5,072,403 | ) | | | 7,231,040 | | | | 166,568,181 | | | | — | | | | 77,335,029 | | | | (104,467,481 | ) | | | 139,435,729 | | |
| Class S | |
| 12-31-08 | | | 4,478,420 | | | | — | | | | 25,696 | | | | (785,827 | ) | | | 3,718,289 | | | | 66,404,448 | | | | — | | | | 409,079 | | | | (11,553,473 | ) | | | 55,260,054 | | |
| 12-31-07 | | | 50,908 | | | | — | | | | 17,941 | | | | (20,147 | ) | | | 48,702 | | | | 1,037,570 | | | | — | | | | 343,389 | | | | (411,463 | ) | | | 969,496 | | |
| Opportunistic LargeCap Value | |
| Class ADV | |
| 12-31-08 | | | — | | | | — | | | | — | | | | (1 | ) | | | (1 | ) | | | — | | | | — | | | | — | | | | (11 | ) | | | (11 | ) | |
| 12-31-07 | | | 1 | | | | — | | | | — | | | | — | | | | 1 | | | | 16 | | | | — | | | | — | | | | — | | | | 16 | | |
| Class I | |
| 12-31-08 | | | 136,501 | | | | — | | | | 1,629,562 | | | | (2,175,855 | ) | | | (409,792 | ) | | | 1,384,980 | | | | — | | | | 20,255,455 | | | | (25,817,102 | ) | | | (4,176,667 | ) | |
| 12-31-07 | | | 69,432 | | | | — | | | | 171,661 | | | | (2,226,807 | ) | | | (1,985,714 | ) | | | 1,122,023 | | | | — | | | | 2,729,402 | | | | (36,232,111 | ) | | | (32,380,686 | ) | |
| Class S | |
| 12-31-08 | | | 14,810 | | | | — | | | | 269,654 | | | | (387,908 | ) | | | (103,444 | ) | | | 178,165 | | | | — | | | | 3,330,233 | | | | (4,432,841 | ) | | | (924,443 | ) | |
| 12-31-07 | | | 26,164 | | | | — | | | | 24,430 | | | | (357,045 | ) | | | (306,451 | ) | | | 427,278 | | | | — | | | | 385,996 | | | | (5,740,720 | ) | | | (4,927,446 | ) | |
| Intermediate Bond | |
| Class ADV | |
| 12-31-08 | | | — | | | | — | | | | — | | | | (1 | ) | | | (1 | ) | | | — | | | | — | | | | — | | | | (12 | ) | | | (12 | ) | |
| 12-31-07 | | | 1 | | | | — | | | | — | | | | — | | | | 1 | | | | 13 | | | | — | | | | — | | | | — | | | | 13 | | |
| Class I | |
| 12-31-08 | | | 53,358,622 | | | | 2,918,609 | | | | 14,350,541 | | | | (79,274,180 | ) | | | (8,646,408 | ) | | | 686,343,323 | | | | 37,264,333 | | | | 165,967,496 | | | | (993,285,707 | ) | | | (103,710,555 | ) | |
| 12-31-07 | | | 49,001,222 | | | | — | | | | 6,365,573 | | | | (31,214,224 | ) | | | 24,152,571 | | | | 650,399,991 | | | | — | | | | 83,961,911 | | | | (414,573,638 | ) | | | 319,788,264 | | |
(1) Commencement of operations
47
NOTES TO FINANCIAL STATEMENTS AS OF DECEMBER 31, 2008 (CONTINUED)
NOTE 9 — CAPITAL SHARES (continued)
| | | Shares sold | | Proceeds
from shares
issued
in merger | | Reinvestment
of
distributions | | Shares
redeemed | | Net increase
(decrease)
in shares
outstanding | | Shares sold | | Proceeds
from shares
issued
in merger | | Reinvestment
of
distributions | | Shares
redeemed | | Net increase
(decrease)
in shares
outstanding | |
| Year or period ended | | # | | # | | # | | # | | # | | ($) | | ($) | | ($) | | ($) | | ($) | |
| Class S | |
| 12-31-08 | | | 32,168,698 | | | | 848,254 | | | | 8,949,716 | | | | (19,339,594 | ) | | | 22,627,074 | | | | 410,405,825 | | | | 10,751,281 | | | | 102,233,412 | | | | (233,459,612 | ) | | | 289,930,906 | | |
| 12-31-07 | | | 36,862,315 | | | | — | | | | 2,943,179 | | | | (5,787,371 | ) | | | 34,018,123 | | | | 486,271,739 | | | | — | | | | 38,555,642 | | | | (76,141,712 | ) | | | 448,685,669 | | |
| Money Market | |
| Class I | |
| Share amounts have been restated to reflect the stock split of 12.926 shares to 1 share that occurred on October 7, 2008. | |
| 12-31-08 | | | 376,836,805 | | | | — | | | | 124,220,563 | | | | (342,541,056 | ) | | | 158,516,312 | | | | 384,970,723 | | | | — | | | | 124,653,168 | | | | (346,315,736 | ) | | | 163,308,155 | | |
| 12-31-07 | | | 492,258,712 | | | | — | | | | 57,241,641 | | | | (220,329,215 | ) | | | 329,171,138 | | | | 503,402,892 | | | | — | | | | 57,130,928 | | | | (226,091,022 | ) | | | 334,442,798 | | |
| Global Science and Technology | |
| Class ADV | |
| 12-16-08(1) - 12-31-08 | | | 912 | | | | — | | | | — | | | | — | | | | 912 | | | | 3,000 | | | | — | | | | — | | | | — | | | | 3,000 | | |
| Class I | |
| 12-31-08 | | | 3,072,997 | | | | — | | | | — | | | | (3,991,670 | ) | | | (918,673 | ) | | | 14,071,302 | | | | — | | | | — | | | | (18,237,345 | ) | | | (4,166,043 | ) | |
| 12-31-07 | | | 3,234,547 | | | | — | | | | — | | | | (3,091,773 | ) | | | 142,774 | | | | 17,170,211 | | | | — | | | | — | | | | (15,261,016 | ) | | | 1,909,195 | | |
| Class S | |
| 12-31-08 | | | 8,356,135 | | | | 24,911,193 | | | | — | | | | (5,950,375 | ) | | | 27,316,953 | | | | 38,376,474 | | | | 123,216,459 | | | | — | | | | (23,407,370 | ) | | | 138,185,563 | | |
| 12-31-07 | | | 115,132 | | | | — | | | | — | | | | (25,466 | ) | | | 89,666 | | | | 614,569 | | | | — | | | | — | | | | (132,451 | ) | | | 482,118 | | |
(1) Commencement of operations
NOTE 10 — ILLIQUID SECURITIES
Pursuant to guidelines adopted by the Board, the following securities have been deemed to be illiquid. Each Portfolio currently limits investment in illiquid securities to 15% (10% for Money Market) of the Portfolio's net assets, at market value, at time of purchase.
| | | Security | |
Principal
Amount | | Initial
Acquision
Date | | Cost | | Value | | Percent
of Net
Assets | |
| Balanced | | Hudson Mezzanine Funding,
2.189%, due 06/12/42 | | $ | 927,000 | | | | 12/21/06 | | | $ | 926,298 | | | $ | 464 | | | | 0.0 | % | |
| Intermediate Bond | | Hudson Mezzanine Funding,
2.189%, due 06/12/42 | | | 6,265,000 | | | | 12/21/06 | | | | 6,260,257 | | | | 3,133 | | | | 0.0 | % | |
NOTE 11 — SECURITIES LENDING
Under an agreement with The Bank of New York Mellon ("BNY"), the Portfolios can lend their securities to approved brokers, dealers and other financial institutions. Loans are collateralized by cash and U.S. government securities. The collateral is equal to at least 105% of the market value of non-U.S. securities loaned and 102% of the market value of U.S. securities loaned when the transaction is entered into and is adjusted daily for changes in the market values of the securities on loan. The cash collateral received is invested in approved investments as defined in the Securities Lending Agreement with BNY (the "Agreement"). The Portfolios bear the risk of loss with respect to the investment of collateral. Currently, the cash collateral is invested in the Bank of New York Mellon Corp. Institutional Cash Reserves Fund ("BICR Fund"). BNY serves as investment manager, custodian and operational trustee of the BICR Fund. As of December 31, 2008, the BICR Fund held certain defaulted securities that had market values significantly below amortized cost. The investment in the BICR Fund is included in the Portfolio of Investments under Securities Lending Collateral and the unrealized loss on such investment is included in Net Unrealized Depreciation on the Statements of Assets and Liabilities. The Portfolios agreed, in principle, to the terms of capital support extended by The Bank of New York Mellon Corporation ("BNYC"), an affiliated company of BNY, for the certain defaulted securities held by the BICR Fund. BNYC will support the value of these securities up to a certain amount and subject, in part, to the Portfolios' continued lending of securities. The recorded value of each Portfolio's investment in the BICR Fund includes the value of the underlying securities held by the BICR Fund and the estimated value of the support to be provided by BNYC.
48
NOTES TO FINANCIAL STATEMENTS AS OF DECEMBER 31, 2008 (CONTINUED)
NOTE 11 — SECURITIES LENDING (continued)
Generally, in the event of counterparty default, the Portfolios have the right to use the collateral to offset losses incurred. The Agreement contains certain guarantees by BNY in the event of counterparty default and/or a borrower's failure to return a loaned security; however, there would be a potential loss to the Portfolios in the event the Portfolios are delayed or prevented from exercising their right to dispose of the collateral. Engaging in securities lending could have a leveraging effect, which may intensify the credit, market and other risks associated with investing in a Portfolio. At December 31, 2008, the following Portfolios had securities on loan with the following market values:
| | | Value of
Securities
Loaned | | Cash
Collateral
Received* | |
| Balanced | | $ | 33,428,996 | | | $ | 34,040,061 | | |
| Growth and Income | | | 3,518,884 | | | | 3,721,142 | | |
| Opportunistic LargeCap Growth | | | 785,577 | | | | 806,060 | | |
| Small Company | | | 27,375,069 | | | | 27,583,319 | | |
| Opportunistic LargeCap Value | | | 4,874,163 | | | | 4,910,714 | | |
| Intermediate Bond | | | 328,881,005 | | | | 337,644,986 | | |
| Money Market | | | 867,611 | | | | 891,150 | | |
| Global Science and Technology | | | 5,459,636 | | | | 5,516,457 | | |
* Cash collateral received was invested in the BICR Fund, the fair value of which is presented in the respective Portfolio's Portfolio of Investments.
NOTE 12 — CONCENTRATION OF INVESTMENT RISKS
Concentration (Global Science and Technology). The Portfolio concentrates (for purposes of the 1940 Act) its assets in securities related to a particular industry, which means that at least 25% of its assets will be invested in that particular industry at all times. As a result, the Portfolio may be subject to greater market fluctuation than a portfolio which has securities representing a broader range of investment alternatives.
Foreign Securities (All Portfolios). Investments in foreign securities may entail risks not present in domestic investments. Since securities in which the Portfolios may invest are denominated in foreign currencies, changes in the relationship of these foreign currencies to the U.S. dollar can significantly affect the value of the investments and earnings of the Portfolios. Foreign investments may also subject the Portfolios to foreign government exchange restrictions, expropriation, taxation or other political, social or economic developments, as well as changes vis-a-vis the U.S. dollar from movements in currency, and changes in security value and interest rate, all of which could affect the market and/or credit risk of the Portfolios' investments.
Emerging Markets Investments (Intermediate Bond and Global Science and Technology). Because of less developed markets and economies and, in some countries, less mature governments and governmental institutions, the risks of investing in foreign securities can be intensified in the case of investments in issuers domiciled or doing substantial business in emerging market countries.
Derivatives (All Portfolios except Opportunistic LargeCap Value and Money Market). Generally, derivatives can be characterized as financial instruments whose performance is derived, at least in part, from the performance of an underlying asset or assets. Some derivatives are sophisticated instruments that typically involve a small investment of cash relative to the magnitude of risks assumed. These may include swap agreements, options, forwards and futures. Derivative securities are subject to market risk which could be significant for those that have a leveraging effect. Derivatives are also subject to credit risks related to the counterparty's ability to perform and any deterioration in the counterparty's creditworthiness could adversely affect the instrument. In addition, derivatives and their underlying securities may experience periods of illiquidity which co uld cause a Portfolio to hold a security it might otherwise sell or could force the sale of a security at inopportune times or for prices that do not reflect current market value. A risk of using derivatives is that a Portfolio's adviser or sub-adviser might imperfectly judge the market's direction.
Corporate Debt Securities (Balanced and Intermediate Bond). Corporate debt securities are subject to the risk of the issuer's inability to meet principal and interest payment on the obligation and may also be subject to price volatility due to such factors as interest rate sensitivity, market perception of the creditworthiness of the issue and general market liquidity. When interest rates decline, the value of the Portfolio's debt securities can be expected to rise, and when interest rates rise, the value of those securities can be expected to decline. Debt securities with longer maturities tend to be more sensitive to interest rate movements than those with shorter maturities.
During the period, Lehman Brothers Holdings, Inc. (LBHI) and certain of its affiliates sought protection under the insolvency laws of their jurisdictions of organization, including the United States, the United Kingdom and Japan. For the period ended December 31, 2008, VP Balanced had outstanding securities trades with counterparties affiliated with LBHI. As a result of these events, LBHI's affiliates were unable to fulfill their commitments and, in certain cases, VP Balanced may have terminated its trades and related agreements with the relevant entities and,
49
NOTES TO FINANCIAL STATEMENTS AS OF DECEMBER 31, 2008 (CONTINUED)
NOTE 12 — CONCENTRATION OF INVESTMENT RISKS (continued)
where appropriate, is in the process of initiating claims for damages. Management has determined that the financial impact to the Portfolio relating to these events is immaterial.
NOTE 13 — FEDERAL INCOME TAXES AND OTHER TAX MATTERS
The amount of distributions from net investment income and net realized capital gains are determined in accordance with federal income tax regulations, which may differ from U.S. generally accepted accounting principles for investment companies. These book/tax differences may be either temporary or permanent. Permanent differences are reclassified within the capital accounts based on their federal tax-basis treatment; temporary differences are not reclassified. Key differences include the treatment of short-term capital gains, foreign currency transactions, and wash sale deferrals. Distributions in excess of net investment income and/or net realized capital gains for tax purposes are reported as return of capital.
The following permanent tax differences have been reclassified as of December 31, 2008:
| | | Paid-in
Capital | | Undistributed
Net Investment
Income | | Accumulated
Net Realized
Gains /
(Losses) | |
| Balanced | | $ | (574,085 | ) | | $ | 420,785 | | | $ | 153,300 | | |
| Growth and Income | | | (2,159,372 | ) | | | 50,798 | | | | 2,108,574 | | |
| Small Company | | | — | | | | (409,267 | ) | | | 409,267 | | |
Opportunistic Large
Cap Value | | | — | | | | (20,103 | ) | | | 20,103 | | |
| Intermediate Bond | | | 30,933,671 | | | | (27,488,393 | ) | | | (3,445,278 | ) | |
| Money Market | | | (12,465 | ) | | | 12,465 | | | | — | | |
Global Science and
Technology | | | (18,551,648 | ) | | | 421,306 | | | | 18,130,342 | | |
Dividends paid by the Portfolios from net investment income and distributions of net realized short-term capital gains are, for federal income tax purposes, taxable as ordinary income to shareholders.
The tax composition of dividends and distributions to shareholders was as follows:
| | | Year Ended December 31, 2008 | | Year Ended December 31, 2007 | |
| | | Ordinary
Income | | Long-Term
Capital Gains | | Ordinary
Income | | Long-Term
Capital Gains | |
| Balanced | | $ | 60,981,872 | | | $ | 50,744,407 | | | $ | 42,494,750 | | | $ | 33,099,538 | | |
| Growth and Income | | | 39,517,165 | | | | — | | | | 39,670,514 | | | | — | | |
| Opportunistic Large Cap Growth | | | 795,525 | | | | — | | | | 364,068 | | | | — | | |
| Small Company | | | 5,865,236 | | | | 74,243,480 | | | | 10,265,009 | | | | 67,413,409 | | |
| Opportunistic Large Cap Value | | | 2,609,792 | | | | 20,976,051 | | | | 3,115,416 | | | | — | | |
| Intermediate Bond | | | 268,240,664 | | | | — | | | | 122,543,008 | | | | — | | |
| Money Market | | | 124,653,168 | | | | — | | | | 57,130,928 | | | | — | | |
The tax-basis components of distributable earnings and the expiration dates of the capital loss carryforwards which may be used to offset future realized capital gains for federal income tax purposes as of December 31, 2008 were:
| | | Undistributed
Ordinary
Income | | Unrealized
Appreciation/
(Depreciation) | | Post-October
Capital Loss
Deferred | | Capital Loss
Carryforwards | | Expiration
Dates | |
| Balanced | | $ | 27,501,921 | | | $ | (144,712,701 | ) | | $ | — | | | $ | (574,085 | ) | | | 2009 | | |
| | | | | | | | | | | | | | | | (134,169,975 | ) | | | 2016 | | |
| | | | | | | | | | | | | | | $ | (134,744,060 | )* | | | | | |
| Growth and Income | | | — | | | | (307,525,947 | ) | | | (121,332,257 | ) | | | (1,745,504,149 | ) | | | 2009 | | |
| | | | | | | | | | | | | | | | (63,082,574 | ) | | | 2010 | | |
| | | | | | | | | | | | | | | | (48,933,227 | ) | | | 2015 | | |
| | | | | | | | | | | | | | | | (454,661,688 | ) | | | 2016 | | |
| | | | | | | | | | | | | | | $ | (2,312,181,638 | )* | | | | | |
| Opportunistic Large Cap Growth | | | 421,521 | | | | (13,379,890 | ) | | | — | | | | (71,685,369 | ) | | | 2009 | | |
| | | | | | | | | | | | | | | | (65,982,870 | ) | | | 2010 | | |
| | | | | | | | | | | | | | | | (1,529,437 | ) | | | 2011 | | |
| | | | | | | | | | | | | | | | (42,028,267 | ) | | | 2016 | | |
| | | | | | | | | | | | | | | $ | (181,225,943 | )* | | | | | |
| Small Company | | | 3,469,382 | | | | (137,432,190 | ) | | | — | | | | (52,676,115 | ) | | | 2016 | | |
| Opportunistic Large Cap Value | | | 2,610,842 | | | | (19,977,868 | ) | | | — | | | | (29,296,914 | ) | | | 2016 | | |
| Intermediate Bond | | | 10,648,573 | | | | (441,758,355 | ) | | | (155,718,209 | ) | | | — | | | | — | | |
50
NOTES TO FINANCIAL STATEMENTS AS OF DECEMBER 31, 2008 (CONTINUED)
NOTE 13 — FEDERAL INCOME TAXES AND OTHER TAX MATTERS (continued)
| | | Undistributed
Ordinary
Income | | Unrealized
Appreciation/
(Depreciation) | | Post-October
Capital Loss
Deferred | | Capital Loss
Carryforwards | | Expiration
Dates | |
| Money Market | | $ | — | | | $ | (149,401 | ) | | $ | — | | | $ | (1,860,826 | ) | | | 2009 | | |
| | | | | | | | | | (169 | ) | | | 2011 | | |
| | | | | | | | | | (244,520 | ) | | | 2012 | | |
| | | | | | | | | $ | (2,105,515 | ) | | | | | |
| Global Science and Technology | | | — | | | | (59,100,007 | ) | | | — | | | | (6,713,564 | ) | | | 2009 | | |
| | | | | | | | | | (3,997,473 | ) | | | 2010 | | |
| | | | | | | | | | (3,997,473 | ) | | | 2011 | | |
| | | | | | | | | | (4,991,402 | ) | | | 2015 | | |
| | | | | | | | | | (13,211,790 | ) | | | 2016 | | |
| | | | | | | | | $ | (32,911,702 | )* | | | | | |
* Utilization of these capital losses is subject to annual limitations under Section 382 of the Internal Revenue Code.
The Portfolios' major tax jurisdictions are federal, Arizona, and Massachusetts. The earliest tax year that remains subject to examination by these jurisdictions is 2004.
NOTE 14 — REORGANIZATIONS
On September 8, 2008, Growth and Income, as listed below ("Acquiring Portfolio"), acquired the assets and certain liabilities of ING Capital Guardian U.S. Equities Portfolio, also listed below ("Acquired Portfolio"), in a tax-free reorganization in exchange for shares of the Acquiring Portfolio, pursuant to a plan of reorganization approved by the Acquired Portfolio's shareholders. The number and value of shares issued by the Acquiring Portfolio are presented in Note 9 — Capital Shares. Net assets and unrealized depreciation as of the reorganization date were as follows:
Acquiring
Portfolio | | Acquired
Portfolio | | Total
Net Assets of
Acquired
Portfolio (000's) | | Total
Net Assets of
Acquiring
Portfolio (000's) | | Acquired
Capital Loss
Carryforwards
(000's) | | Acquired Portfolio
Unrealized
Appreciation (000's) | | Conversion
Ratio | |
| Growth and | | ING Capital Guardian | | | | | | | | | | | | | | | | | | |
| | |
| Income | | U.S. Equities Portfolio | | $ | 353,712 | | | $ | 2,384,341 | | | $ | (48,933 | ) | | $ | 6,331 | | | | 0.35 | | |
The net assets of Growth and Income after the acquisition were $2,738,052,537.
On April 28, 2008, Global Science and Technology and Intermediate Bond, as listed below ("Acquiring Portfolios"), acquired the assets and certain liabilities of ING Global Technology Portfolio and ING Lord Abbett U.S. Government Securities Portfolio, also listed below ("Acquired Portfolios"), respectively, in a tax-free reorganization in exchange for shares of the Acquiring Portfolio, pursuant to a plan of reorganization approved by the Acquired Portfolio's shareholders. The number and value of shares issued by the Acquiring Portfolio are presented in Note 9 — Capital Shares. Net assets and unrealized depreciation as of the reorganization date were as follows:
Acquiring
Portfolios | | Acquired
Portfolio | | Total
Net Assets of
Acquired
Portfolio (000's) | | Total
Net Assets of
Acquiring
Portfolio (000's) | | Acquired
Capital Loss
Carryforwards
(000's) | | Acquired Portfolio
Unrealized
Depreciation (000's) | | Conversion
Ratio | |
| Global | | ING Global | | | | | | | | | | | |
| Science and | | Technology | | | | | | | | | |
| |
| Technology | | Portfolio | | $ | 123,216 | | | $ | 87,851 | | | $ | (4,991 | ) | | $ | (128 | ) | | | 1.30 | | |
Intermediate
Bond | | ING Lord Abbett U.S
Government Securities
Portfolio | | | 48,016 | | | | 3,557,999 | | | | — | | | | — | | | | 0.77 | | |
The net assets of Global Science and Technology and Intermediate Bond after the acquisitions were approximately $211,067,879 and $3,606,015,157, respectively.
On November 10, 2007, Growth and Income, as listed below ("Acquiring Portfolio"), acquired the assets and certain liabilities of ING Fundamental Research Portfolio, also listed below ("Acquired Portfolio"), in a tax-free reorganization in exchange for shares of the Acquiring Portfolio, pursuant to a plan of reorganization approved by the Acquired Portfolio's shareholders. The number and value of shares issued by the Acquiring Portfolio are
51
NOTES TO FINANCIAL STATEMENTS AS OF DECEMBER 31, 2008 (CONTINUED)
NOTE 14 — REORGANIZATIONS (continued)
presented in Note 9 — Capital Shares. Net assets, acquired capital loss carryforwards and unrealized appreciation as of the reorganization date were as follows:
Acquiring
Portfolio | | Acquired
Portfolio | | Total
Net Assets of
Acquired
Portfolio (000's) | | Total
Net Assets of
Acquiring
Portfolio (000's) | | Acquired
Capital Loss
Carryforwards
(000's) | | Acquired Portfolio
Unrealized
Appreciation (000's) | | Conversion
Ratio | |
| Growth and | | ING Fundamental | | | | | | | | | | | | | | | | | | |
| | |
| Income | | Research | | | | | | | | | | | | | | | | | | |
| | |
| | | Portfolio | | | | | | | | | | | | | | | | | | |
| | |
| Class ADV | | Class ADV | | $ | 2,802 | | | $ | 1 | | | $ | (99 | ) | | $ | 701 | | | | 0.37 | | |
| Class I | | Class I | | | 50,910 | | | | 2,805,342 | | | | (1,793 | ) | | | 1,280 | | | | 0.37 | | |
| Class S | | Class S | | | 20,969 | | | | 6,214 | | | | (738 | ) | | | 1,334 | | | | 0.37 | | |
| | | | | $ | 74,681 | | | $ | 2,811,557 | | | $ | (2,630 | ) | | $ | 3,315 | | | | | | |
The net assets of Growth and Income after the acquisition were approximately $2,886,238,230.
On January 15, 2007, Opportunistic LargeCap Growth, as listed below ("Acquiring Portfolio"), acquired the assets and certain liabilities of ING Goldman Sachs Capital Growth Portfolio, also listed below ("Acquired Portfolio"), in a tax-free reorganization in exchange for shares of the Acquiring Portfolio, pursuant to a plan of reorganization approved by the Acquired Portfolio's shareholders. The number and value of shares issued by the Acquiring Portfolio are presented in Note 9 — Capital Shares. Net assets, acquired capital loss carryforwards and unrealized appreciation as of the reorganization date were as follows:
Acquiring
Portfolio | | Acquired
Portfolio | | Total
Net Assets of
Acquired
Portfolio (000's) | | Total
Net Assets of
Acquiring
Portfolio (000's) | | Acquired
Capital Loss
Carryforwards
(000's) | | Acquired Portfolio
Unrealized
Appreciation (000's) | | Conversion
Ratio | |
| Opportunistic | | ING Goldman Sachs | | | | | | | | | | | | | | | | | | |
| | |
| LargeCap | | Capital Growth | | | | | | | | | | | | | | | | | | |
| | |
| Growth | | Portfolio | | | | | | | | | | | | | | | | | | |
| | |
| Class ADV | | Class ADV | | $ | 2,856 | | | $ | 1 | | | $ | (740 | ) | | $ | 1,689 | | | | 1.14 | | |
| Class I | | Class I | | | 3,221 | | | | 189,159 | | | | (834 | ) | | | 254 | | | | 1.15 | | |
| Class S | | Class S | | | 30,775 | | | | 281 | | | | (7,973 | ) | | | 3,322 | | | | 1.15 | | |
| | | | | $ | 36,852 | | | $ | 189,441 | | | $ | (9,547 | ) | | $ | 5,265 | | | | | | |
The net assets of Opportunistic LargeCap Growth after the acquisition were approximately $226,292,711.
NOTE 15 — OTHER ACCOUNTING PRONOUNCEMENTS
On March 19, 2008, the FASB issued Statement of Financial Accounting Standards No. 161 ("SFAS No. 161"), "Disclosure about Derivative Instruments and Hedging Activities." This new accounting statement requires enhanced disclosures about an entity's derivative and hedging activities. Entities are required to provide enhanced disclosures about (a) how and why an entity invests in derivatives, (b) how derivatives are accounted for under SFAS No. 133, and (c) how derivatives affect an entity's financial position, financial performance, and cash flows. SFAS No. 161 also requires enhanced disclosures regarding credit-risk-related contingent features of derivative instruments. SFAS No. 161 is effective for financial statements issued for fiscal years and interim periods beginning after November 15, 2008. As of December 31, 2008, management of the Portfolios is currently assessing the impact of the expanded financial statement disclosures that will result from adopting SFAS No. 161.
NOTE 16 — INFORMATION REGARDING TRADING OF ING'S U.S. MUTUAL FUNDS
As discussed in earlier supplements that were previously filed with the SEC, ING agreed with the Portfolios to indemnify and hold harmless the Portfolios from all damages resulting from wrongful conduct by ING or its employees or from ING's internal investigation, any investigations conducted by any governmental or self-regulatory agencies, litigation or other formal proceedings, including any proceedings by the U.S. Securities and Exchange Commission in connection with investigations related to mutual funds and variable insurance products. In November, 2007 and December, 2008, ING settled its indemnification commitments by making payments to the affected Portfolios. In connection with the settlement, ING paid $1,480 to Intermediate Bond, $2,198 to Growth and Income, and $22,573 to Opportunistic LargeCap Value.
52
NOTES TO FINANCIAL STATEMENTS AS OF DECEMBER 31, 2008 (CONTINUED)
NOTE 17 — LITIGATION
On December 12, 2003, Aeltus Investment Management, Inc. (now known as ING Investment Management Co.)( "IIM" ) received a copy of a complaint (the "Complaint") filed in the United States Bankruptcy Court for the Southern District of New York in the matter of Enron Corp. v. Mass Mutual Life Insurance Co., et al. Among other defendants named in the Complaint are defendants ING VP Balanced Portfolio, and ING VP Bond Portfolio (the "Subject Portfolios"). As of August 6, 2004 the ING VP Bond Portfolio changed its name to the ING VP Intermediate Bond Portfolio. The Complaint alleges that Enron Corp. ("Enron") transferred to the defendants, including the Subject Portfolios, over $1 billion in the aggregate for the purpose of prepaying certain commercial paper issued by Enron (the "Notes") and held by the defendants prior to the filing by Enron for bankruptcy protection under Chapter 11 of Title 11 of the Bankruptcy Code (the "Bankruptcy Code").
The Complaint seeks to recover from the defendants including the Subject Portfolios, these transfers under the alternative but interrelated bankruptcy theories of preferential transfer and fraudulent conveyance. Although the Complaint does not specify the amount of each transfer in dispute, it appears that the sale of ING VP Balanced Portfolio, Inc. of $23,181,757 of the Notes on or about October 29, 2001, and the sale by ING VP Bond Portfolio, Inc. of $24,963,125 of the Notes on or about October 29, 2001 are in dispute. The Complaint seeks to require the Subject Portfolios to repay to Enron the full amount of these transfers, in which event the Subject Portfolios would be granted unsecured claims against the Enron bankruptcy estate in the amounts of the repayments. If Enron proves up the elements of preferential transfer and/or fraudulent conveyance, these are strict liability theories of recovery.
The Subject Portfolios are part of a defense group of similarly-situated defendants. Along with those and other defendants, the Subject Portfolios moved to dismiss all counts of the Complaint, contending, among other things, that section 546(e) of the Bankruptcy Code provides a complete defense.
The Bankruptcy Court denied the motion on July 1, 2005. Accordingly, the Subject Portfolios filed an answer to the Complaint on July 29, 2005. The Subject Portfolios moved for leave to pursue an immediate appeal (the "Appeal") of the Bankruptcy Court's decision to the District Court.
On April 4, 2006, the Securities and Exchange Commission filed a memorandum in support of the Subject Portfolio's motion for leave with the district court. In addition, the U.S. Attorney's office, on behalf of the United States of America and the Department of Treasury as well as the Governor of the Federal Reserve Board has each filed statements of interest in support of the Appeal.
On January 25, 2008, the United States District Court of Southern New York denied the motion for leave to appeal the bankruptcy court's denial of the Subject Portfolios' motion to dismiss. The court found there were questions of fact that still needed to be resolved.
Settlements between plaintiff and various defendants, both large and small, have taken place. Historically, the range of settlement figures have been between 25 - 40% of face value with most recent settlements being at approximately 13% net, of which those settling defendants will not get a proof of claim. As a result of these settlements, IIM and the Subject Portfolios are one of just two defendant groups remaining.
On April 29, 2008, IIM and the Subject Portfolios joined a plenary motion for summary judgment filed by Goldman Sachs. In addition, a separate brief was filed on behalf of IIM and asserts the defenses unique to the investment advisor defendants; that they were merely conduits. The court is scheduled to hear arguments on the motion on April 6, 2009. The Subject Portfolios believe that the facts and the weight of legal authority support their position.
NOTE 18 — SUBSEQUENT EVENTS
Subsequent to December 31, 2008, the following Portfolio declared dividends from net investment income:
| | | Per Share
Amount | | Payable Date | | Record Date | |
| Money Market | |
| Class I | | $ | 0.0006 | | | February 2, 2009 | | Daily | |
Effective May 1, 2009, the name of each Portfolio will be renamed from "ING VP Balanced Portfolio," "ING VP Growth and Income Portfolio," "ING VP Small Company Portfolio," "ING VP Intermediate Bond Portfolio," "ING VP Money Market Portfolio" and "ING BlackRock Global Science and Technology Portfolio" to "ING Balanced Portfolio," "ING Growth and Income Portfolio," "ING Small Company Portfolio," "ING Intermediate Bond Portfolio," "ING Money Market Portfolio" and "ING BlackRock Science and Technology Portfolio", respectively.
53
PORTFOLIO OF INVESTMENTS
ING VP BALANCED PORTFOLIO AS OF DECEMBER 31, 2008
| Shares | | | | | | Value | |
| COMMON STOCK: 61.4% | | | |
| | | | | Advertising: 0.5% | |
| | 4,550 | | | | | Harte-Hanks, Inc. | | $ | 28,392 | | |
| | 160,070 | | | @ | | Interpublic Group of Cos., Inc. | | | 633,877 | | |
| | 1,360 | | | @ | | inVentiv Health, Inc. | | | 15,694 | | |
| | 83,410 | | | | | Omnicom Group | | | 2,245,397 | | |
| | | | 2,923,360 | | |
| | | | | Aerospace/Defense: 1.5% | |
| | 5,200 | | | @ | | AAR Corp. | | | 95,732 | | |
| | 2,650 | | | @,L | | Alliant Techsystems, Inc. | | | 227,264 | | |
| | 8,080 | | | @ | | BE Aerospace, Inc. | | | 62,135 | | |
| | 4,550 | | | | | Cubic Corp. | | | 123,760 | | |
| | 1,970 | | | | | Curtiss-Wright Corp. | | | 65,778 | | |
| | 4,690 | | | @ | | Esterline Technologies Corp. | | | 177,704 | | |
| | 33,200 | | | | | General Dynamics Corp. | | | 1,911,988 | | |
| | 44,120 | | | | | Goodrich Corp. | | | 1,633,322 | | |
| | 16,380 | | | | | Lockheed Martin Corp. | | | 1,377,230 | | |
| | 1,460 | | | @ | | Moog, Inc. | | | 53,392 | | |
| | 55,280 | | | | | Northrop Grumman Corp. | | | 2,489,811 | | |
| | 4,700 | | | @ | | Orbital Sciences Corp. | | | 91,791 | | |
| | 15,700 | | | | | Raytheon Co. | | | 801,328 | | |
| | 3,550 | | | @ | | Teledyne Technologies, Inc. | | | 158,153 | | |
| | 600 | | | L | | Triumph Group, Inc. | | | 25,476 | | |
| | | | 9,294,864 | | |
| | | | | Agriculture: 1.3% | |
| | 10,750 | | | @ | | Alliance One International, Inc. | | | 31,605 | | |
| | 174,600 | | | | | Altria Group, Inc. | | | 2,629,476 | | |
| | 61,767 | | | | | Archer-Daniels-Midland Co. | | | 1,780,743 | | |
| | 33,369 | | | | | Philip Morris International, Inc. | | | 1,451,885 | | |
| | 52,389 | | | | | Reynolds American, Inc. | | | 2,111,801 | | |
| | | | 8,005,510 | | |
| | | | | Airlines: 0.2% | |
| | 1,600 | | | @ | | Alaska Air Group, Inc. | | | 46,800 | | |
| | 11,865 | | | | | Skywest, Inc. | | | 220,689 | | |
| | 124,910 | | | | | Southwest Airlines Co. | | | 1,076,724 | | |
| | | | 1,344,213 | | |
| | | | | Apparel: 0.3% | |
| | 6,979 | | | @ | | Carter's, Inc. | | | 134,416 | | |
| | 57,600 | | | @ | | Coach, Inc. | | | 1,196,352 | | |
| | 1,190 | | | @ | | Deckers Outdoor Corp. | | | 95,045 | | |
| | 4,950 | | | @ | | Hanesbrands, Inc. | | | 63,113 | | |
| | 7,002 | | | @,L | | Iconix Brand Group, Inc. | | | 68,480 | | |
| | 2,300 | | | | | K-Swiss, Inc. | | | 26,220 | | |
| | 1,920 | | | @ | | Skechers USA, Inc. | | | 24,614 | | |
| | 8,000 | | | @ | | Timberland Co. | | | 92,400 | | |
| | 3,650 | | | @,L | | True Religion Apparel, Inc. | | | 45,406 | | |
| | 3,050 | | | @,L | | Volcom, Inc. | | | 33,245 | | |
| | 5,600 | | | @ | | Warnaco Group, Inc. | | | 109,928 | | |
| | 8,600 | | | | | Wolverine World Wide, Inc. | | | 180,944 | | |
| | | | 2,070,163 | | |
| | | | | Auto Parts & Equipment: 0.0% | |
| | 7,150 | | | | | BorgWarner, Inc. | | | 155,656 | | |
| | 3,700 | | | | | Superior Industries
International | | | 38,924 | | |
| | | | 194,580 | | |
| | | | | Banks: 4.9% | |
| | 17,000 | | | L | | Associated Banc-Corp. | | | 355,810 | | |
| | 6,150 | | | | | Bancorpsouth, Inc. | | | 143,664 | | |
| Shares | | | | | | Value | |
| | 14,620 | | | | | Bank Mutual Corp. | | $ | 168,715 | | |
| | 145,953 | | | | | Bank of America Corp. | | | 2,055,018 | | |
| | 8,450 | | | | | Bank of Hawaii Corp. | | | 381,687 | | |
| | 76,340 | | | | | Bank of New York Mellon Corp. | | | 2,162,712 | | |
| | 61,620 | | | | | BB&T Corp. | | | 1,692,085 | | |
| | 54,857 | | | | | Capital One Financial Corp. | | | 1,749,390 | | |
| | 12,500 | | | L | | Cascade Bancorp. | | | 84,375 | | |
| | 4,200 | | | L | | Cathay General Bancorp. | | | 99,750 | | |
| | 4,890 | | | | | Central Pacific Financial Corp. | | | 49,096 | | |
| | 69,060 | | | | | Citigroup, Inc. | | | 463,393 | | |
| | 2,000 | | | | | City National Corp. | | | 97,400 | | |
| | 1,800 | | | | | Columbia Banking System, Inc. | | | 21,474 | | |
| | 5,817 | | | | | Commerce Bancshares, Inc. | | | 255,657 | | |
| | 3,550 | | | | | Community Bank System, Inc. | | | 86,585 | | |
| | 8,250 | | | | | Cullen/Frost Bankers, Inc. | | | 418,110 | | |
| | 1,012 | | | | | East-West Bancorp., Inc. | | | 16,162 | | |
| | 7,400 | | | @@,L | | First Bancorp. Puerto Rico | | | 82,436 | | |
| | 3,950 | | | | | First Financial Bankshares, Inc. | | | 218,080 | | |
| | 10,036 | | | | | First Midwest Bancorp., Inc. | | | 200,419 | | |
| | 7,450 | | | | | FirstMerit Corp. | | | 153,396 | | |
| | 7,336 | | | L | | Frontier Financial Corp. | | | 31,985 | | |
| | 7,000 | | | L | | Fulton Financial Corp. | | | 67,340 | | |
| | 11,630 | | | | | Glacier Bancorp., Inc. | | | 221,203 | | |
| | 6,505 | | | | | Goldman Sachs Group, Inc. | | | 548,957 | | |
| | 3,800 | | | | | Hancock Holding Co. | | | 172,748 | | |
| | 21,000 | | | L | | Hanmi Financial Corp. | | | 43,260 | | |
| | 61,800 | | | L | | Huntington Bancshares, Inc. | | | 473,388 | | |
| | 113,240 | | | | | JPMorgan Chase & Co. | | | 3,570,457 | | |
| | 20,530 | | | L | | M&T Bank Corp. | | | 1,178,627 | | |
| | 39,200 | | | | | Morgan Stanley | | | 628,768 | | |
| | 10,890 | | | | | Nara Bancorp., Inc. | | | 107,049 | | |
| | 9,940 | | | L | | National Penn Bancshares, Inc. | | | 144,229 | | |
| | 23,360 | | | | | Northern Trust Corp. | | | 1,217,990 | | |
| | 1,000 | | | L | | Old National Bancorp. | | | 18,160 | | |
| | 39,665 | | | | | PNC Financial Services
Group, Inc. | | | 1,943,585 | | |
| | 7,600 | | | | | Prosperity Bancshares, Inc. | | | 224,884 | | |
| | 1,900 | | | | | S&T Bancorp, Inc. | | | 67,450 | | |
| | 2,310 | | | @ | | Signature Bank | | | 66,274 | | |
| | 49,864 | | | | | State Street Corp. | | | 1,961,151 | | |
| | 4,150 | | | L | | Sterling Bancorp. | | | 58,225 | | |
| | 19,850 | | | | | Sterling Bancshares, Inc. | | | 120,688 | | |
| | 5,040 | | | | | Susquehanna Bancshares, Inc. | | | 80,186 | | |
| | 6,500 | | | @ | | SVB Financial Group | | | 170,495 | | |
| | 957 | | | | | Tompkins Financial Corp. | | | 55,458 | | |
| | 10,950 | | | | | Trustco Bank Corp. | | | 104,135 | | |
| | 8,930 | | | | | UCBH Holdings, Inc. | | | 61,438 | | |
| | 4,050 | | | | | UMB Financial Corp. | | | 199,017 | | |
| | 1,100 | | | | | Umpqua Holdings Corp. | | | 15,917 | | |
| | 1,200 | | | L | | United Bankshares, Inc. | | | 39,864 | | |
| | 1,981 | | | L | | United Community Banks, Inc. | | | 26,902 | | |
| | 53,675 | | | | | US Bancorp. | | | 1,342,412 | | |
| | 10,500 | | | | | Valley National Bancorp. | | | 212,625 | | |
| | 93,300 | | | | | Wells Fargo & Co. | | | 2,750,484 | | |
| | 1,750 | | | | | Westamerica Bancorp. | | | 89,513 | | |
| | 12,950 | | | | | Whitney Holding Corp. | | | 207,071 | | |
| | 13,600 | | | L | | Wilmington Trust Corp. | | | 302,464 | | |
| | 4,600 | | | | | Wilshire Bancorp., Inc. | | | 41,768 | | |
| | 6,540 | | | | | Wintrust Financial Corp. | | | 134,528 | | |
| | | | 29,656,109 | | |
| | | | | Beverages: 0.6% | |
| | 31,841 | | | | | Coca-Cola Co. | | | 1,441,442 | | |
| | 41,300 | | | | | Coca-Cola Enterprises, Inc. | | | 496,839 | | |
See Accompanying Notes to Financial Statements
54
PORTFOLIO OF INVESTMENTS
ING VP BALANCED PORTFOLIO AS OF DECEMBER 31, 2008 (CONTINUED)
| Shares | | | | | | Value | |
| | | | | Beverages (continued) | |
| | 1,750 | | | @,L | | Green Mountain Coffee
Roasters, Inc. | | $ | 67,725 | | |
| | 4,650 | | | @,L | | Hansen Natural Corp. | | | 155,915 | | |
| | 1,000 | | | @ | | Peet's Coffee & Tea, Inc. | | | 23,250 | | |
| | 50,050 | | | | | Pepsi Bottling Group, Inc. | | | 1,126,626 | | |
| | 3,650 | | | | | PepsiAmericas, Inc. | | | 74,314 | | |
| | 5,366 | | | | | PepsiCo, Inc. | | | 293,896 | | |
| | | | 3,680,007 | | |
| | | | | Biotechnology: 1.2% | |
| | 64,470 | | | @ | | Amgen, Inc. | | | 3,723,143 | | |
| | 32,210 | | | @ | | Biogen Idec, Inc. | | | 1,534,162 | | |
| | 1,500 | | | @ | | Bio-Rad Laboratories, Inc. | | | 112,965 | | |
| | 1,000 | | | @ | | Charles River Laboratories
International, Inc. | | | 26,200 | | |
| | 6,050 | | | @ | | Cubist Pharmaceuticals, Inc. | | | 146,168 | | |
| | 2,050 | | | @ | | Enzo Biochem, Inc. | | | 10,025 | | |
| | 57,790 | | | @ | | Life Technologies Corp. | | | 1,347,085 | | |
| | 3,620 | | | @,L | | Martek Biosciences Corp. | | | 109,722 | | |
| | 6,530 | | | @ | | Regeneron Pharmaceuticals, Inc. | | | 119,891 | | |
| | 800 | | | @,L | | United Therapeutics Corp. | | | 50,040 | | |
| | 9,300 | | | @ | | Vertex Pharmaceuticals, Inc. | | | 282,534 | | |
| | | | 7,461,935 | | |
| | | | | Building Materials: 0.1% | |
| | 4,400 | | | | | Apogee Enterprises, Inc. | | | 45,584 | | |
| | 4,500 | | | | | Eagle Materials, Inc. | | | 82,845 | | |
| | 9,854 | | | | | Gibraltar Industries, Inc. | | | 117,657 | | |
| | 6,050 | | | | | Lennox International, Inc. | | | 195,355 | | |
| | 600 | | | | | Martin Marietta Materials, Inc. | | | 58,248 | | |
| | 5,950 | | | @ | | NCI Building Systems, Inc. | | | 96,985 | | |
| | 600 | | | | | Simpson Manufacturing Co., Inc. | | | 16,656 | | |
| | 1,280 | | | | | Texas Industries, Inc. | | | 44,160 | | |
| | | | 657,490 | | |
| | | | | Chemicals: 1.2% | |
| | 10,650 | | | | | Airgas, Inc. | | | 415,244 | | |
| | 1,550 | | | | | Albemarle Corp. | | | 34,565 | | |
| | 414 | | | | | Arch Chemicals, Inc. | | | 10,793 | | |
| | 5,100 | | | | | Ashland, Inc. | | | 53,601 | | |
| | 1,200 | | | | | Balchem Corp. | | | 29,892 | | |
| | 7,800 | | | | | Cytec Industries, Inc. | | | 165,516 | | |
| | 1,600 | | | | | FMC Corp. | | | 71,568 | | |
| | 9,340 | | | | | HB Fuller Co. | | | 150,467 | | |
| | 10,000 | | | | | Lubrizol Corp. | | | 363,900 | | |
| | 6,700 | | | | | Minerals Technologies, Inc. | | | 274,030 | | |
| | 3,200 | | | | | Monsanto Co. | | | 225,120 | | |
| | 2,510 | | | | | NewMarket Corp. | | | 87,624 | | |
| | 4,720 | | | @ | | OM Group, Inc. | | | 99,639 | | |
| | 48,040 | | | | | PPG Industries, Inc. | | | 2,038,337 | | |
| | 3,505 | | | | | Quaker Chemical Corp. | | | 57,657 | | |
| | 4,684 | | | | | Rohm & Haas Co. | | | 289,424 | | |
| | 8,620 | | | | | Schulman A, Inc. | | | 146,540 | | |
| | 32,800 | | | | | Sherwin-Williams Co. | | | 1,959,800 | | |
| | 400 | | | | | Stepan Co. | | | 18,796 | | |
| | 8,100 | | | | | Terra Industries, Inc. | | | 135,027 | | |
| | 21,900 | | | | | Valspar Corp. | | | 396,171 | | |
| | 2,350 | | | | | Zep, Inc. | | | 45,379 | | |
| | | | 7,069,090 | | |
| | | | | Coal: 0.0% | |
| | 14,100 | | | | | Arch Coal, Inc. | | | 229,689 | | |
| | 5,110 | | | @,L | | Patriot Coal Corp. | | | 31,938 | | |
| | | | 261,627 | | |
| Shares | | | | | | Value | |
| | | | | Commercial Services: 1.6% | |
| | 8,100 | | | | | Aaron Rents, Inc. | | $ | 215,622 | | |
| | 900 | | | | | Administaff, Inc. | | | 19,512 | | |
| | 8,400 | | | @ | | Alliance Data Systems Corp. | | | 390,852 | | |
| | 3,700 | | | @ | | AMN Healthcare Services, Inc. | | | 31,302 | | |
| | 14,220 | | | @ | | Apollo Group, Inc. - Class A | | | 1,089,536 | | |
| | 4,160 | | | | | Arbitron, Inc. | | | 55,245 | | |
| | 3,250 | | | @ | | Brink's Home Security
Holdings, Inc. | | | 71,240 | | |
| | 1,450 | | | @ | | Capella Education Co. | | | 85,202 | | |
| | 8,750 | | | @ | | Career Education Corp. | | | 156,975 | | |
| | 1,950 | | | | | Chemed Corp. | | | 77,552 | | |
| | 3,617 | | | @ | | Consolidated Graphics, Inc. | | | 81,889 | | |
| | 1,950 | | | | | Corporate Executive Board Co. | | | 43,017 | | |
| | 9,450 | | | @ | | Cross Country Healthcare, Inc. | | | 83,066 | | |
| | 3,950 | | | | | DeVry, Inc. | | | 226,770 | | |
| | 1,500 | | | @ | | Forrester Research, Inc. | | | 42,315 | | |
| | 3,700 | | | @ | | FTI Consulting, Inc. | | | 165,316 | | |
| | 5,250 | | | @ | | Gartner, Inc. | | | 93,608 | | |
| | 5,300 | | | @ | | Geo Group, Inc. | | | 95,559 | | |
| | 3,750 | | | | | Global Payments, Inc. | | | 122,963 | | |
| | 67,740 | | | | | H&R Block, Inc. | | | 1,539,053 | | |
| | 5,850 | | | | | Heartland Payment
Systems, Inc. | | | 102,375 | | |
| | 3,450 | | | | | Heidrick & Struggles
International, Inc. | | | 74,313 | | |
| | 5,920 | | | | | Hillenbrand, Inc. | | | 98,746 | | |
| | 3,450 | | | @,L | | ITT Educational Services, Inc. | | | 327,681 | | |
| | 6,100 | | | | | Kelly Services, Inc. | | | 79,361 | | |
| | 1,150 | | | @ | | Kendle International, Inc. | | | 29,578 | | |
| | 9,300 | | | @,L | | Korn/Ferry International | | | 106,206 | | |
| | 900 | | | | | Landauer, Inc. | | | 65,970 | | |
| | 6,600 | | | | | Lender Processing Services, Inc. | | | 194,370 | | |
| | 4,230 | | | @ | | Live Nation, Inc. | | | 24,280 | | |
| | 11,550 | | | | | Manpower, Inc. | | | 392,585 | | |
| | 18,250 | | | @ | | MPS Group, Inc. | | | 137,423 | | |
| | 5,350 | | | @ | | Navigant Consulting, Inc. | | | 84,905 | | |
| | 12,000 | | | @ | | On Assignment, Inc. | | | 68,040 | | |
| | 1,300 | | | @ | | Parexel International Corp. | | | 12,623 | | |
| | 15,200 | | | | | Pharmaceutical Product
Development, Inc. | | | 440,952 | | |
| | 1,750 | | | @,L | | Pre-Paid Legal Services, Inc. | | | 65,258 | | |
| | 6,400 | | | @ | | Quanta Services, Inc. | | | 126,720 | | |
| | 15,100 | | | @ | | Rent-A-Center, Inc. | | | 266,515 | | |
| | 67,323 | | | | | RR Donnelley & Sons Co. | | | 914,246 | | |
| | 14,100 | | | @ | | SAIC, Inc. | | | 274,668 | | |
| | 900 | | | | | Strayer Education, Inc. | | | 192,969 | | |
| | 4,250 | | | @ | | Ticketmaster | | | 27,285 | | |
| | 5,740 | | | @ | | TrueBlue, Inc. | | | 54,932 | | |
| | 22,709 | | | @ | | United Rentals, Inc. | | | 207,106 | | |
| | 2,900 | | | @ | | Universal Technical Institute, Inc. | | | 49,793 | | |
| | 3,800 | | | | | Viad Corp. | | | 94,012 | | |
| | 3,300 | | | @ | | Volt Information Sciences, Inc. | | | 23,859 | | |
| | 6,550 | | | | | Watson Wyatt Worldwide, Inc. | | | 313,221 | | |
| | | | 9,536,586 | | |
| | | | | Computers: 4.0% | |
| | 21,900 | | | @ | | Affiliated Computer
Services, Inc. | | | 1,006,305 | | |
| | 39,422 | | | @ | | Apple, Inc. | | | 3,364,668 | | |
| | 5,090 | | | @ | | CACI International, Inc. | | | 229,508 | | |
| | 37,300 | | | @ | | Cadence Design Systems, Inc. | | | 136,518 | | |
| | 11,750 | | | @ | | Ciber, Inc. | | | 56,518 | | |
| | 29,200 | | | @ | | Computer Sciences Corp. | | | 1,026,088 | | |
See Accompanying Notes to Financial Statements
55
PORTFOLIO OF INVESTMENTS
ING VP BALANCED PORTFOLIO AS OF DECEMBER 31, 2008 (CONTINUED)
| Shares | | | | | | Value | |
| | | | | Computers (continued) | |
| | 103,380 | | | @ | | Dell, Inc. | | $ | 1,058,611 | | |
| | 3,250 | | | | | Diebold, Inc. | | | 91,293 | | |
| | 109,620 | | | @ | | EMC Corp. | | | 1,147,721 | | |
| | 183,665 | | | | | Hewlett-Packard Co. | | | 6,665,146 | | |
| | 9,500 | | | @,L | | Hutchinson Technology, Inc. | | | 33,060 | | |
| | 10,950 | | | | | Imation Corp. | | | 148,592 | | |
| | 8,440 | | | @ | | Insight Enterprises, Inc. | | | 58,236 | | |
| | 75,750 | | | | | International Business
Machines Corp. | | | 6,375,120 | | |
| | 31,505 | | | @ | | Lexmark International, Inc. | | | 847,485 | | |
| | 6,600 | | | @ | | Manhattan Associates, Inc. | | | 104,346 | | |
| | 7,100 | | | @ | | Mentor Graphics Corp. | | | 36,707 | | |
| | 13,724 | | | @ | | Micros Systems, Inc. | | | 223,976 | | |
| | 2,990 | | | | | MTS Systems Corp. | | | 79,654 | | |
| | 18,750 | | | @ | | NCR Corp. | | | 265,125 | | |
| | 11,670 | | | @ | | Radisys Corp. | | | 64,535 | | |
| | 4,100 | | | @ | | SRA International, Inc. | | | 70,725 | | |
| | 1,300 | | | @ | | SYKES Enterprises, Inc. | | | 24,856 | | |
| | 3,600 | | | @,L | | Synaptics, Inc. | | | 59,616 | | |
| | 15,000 | | | @ | | Synopsys, Inc. | | | 277,800 | | |
| | 60,030 | | | @ | | Teradata Corp. | | | 890,245 | | |
| | 23,100 | | | @ | | Western Digital Corp. | | | 264,495 | | |
| | | | 24,606,949 | | |
| | | | | Cosmetics/Personal Care: 1.0% | |
| | 2,200 | | | | | Alberto-Culver Co. | | | 53,922 | | |
| | 2,150 | | | @,L | | Chattem, Inc. | | | 153,790 | | |
| | 99,132 | | | | | Procter & Gamble Co. | | | 6,128,340 | | |
| | | | 6,336,052 | | |
| | | | | Distribution/Wholesale: 0.4% | |
| | 12,560 | | | @ | | Brightpoint, Inc. | | | 54,636 | | |
| | 4,170 | | | @ | | Fossil, Inc. | | | 69,639 | | |
| | 17,300 | | | | | Genuine Parts Co. | | | 654,978 | | |
| | 31,550 | | | @ | | Ingram Micro, Inc. | | | 422,455 | | |
| | 10,800 | | | @ | | LKQ Corp. | | | 125,928 | | |
| | 6,710 | | | | | Owens & Minor, Inc. | | | 252,632 | | |
| | 4,200 | | | L | | Pool Corp. | | | 75,474 | | |
| | 4,570 | | | @ | | Scansource, Inc. | | | 88,064 | | |
| | 5,400 | | | @ | | School Specialty, Inc. | | | 103,248 | | |
| | 14,000 | | | @ | | Tech Data Corp. | | | 249,760 | | |
| | 3,220 | | | @ | | United Stationers, Inc. | | | 107,838 | | |
| | 2,750 | | | L | | Watsco, Inc. | | | 105,600 | | |
| | | | 2,310,252 | | |
| | | | | Diversified Financial Services: 1.1% | |
| | 890 | | | @ | | Affiliated Managers Group, Inc. | | | 37,309 | | |
| | 72,880 | | | | | Ameriprise Financial, Inc. | | | 1,702,477 | | |
| | 53,271 | | | | | Charles Schwab Corp. | | | 861,392 | | |
| | 4,584 | | | | | CME Group, Inc. | | | 953,976 | | |
| | 33,128 | | | | | Discover Financial Services | | | 315,710 | | |
| | 16,800 | | | | | Federated Investors, Inc. | | | 284,928 | | |
| | 3,230 | | | | | Financial Federal Corp. | | | 75,162 | | |
| | 1,050 | | | | | Greenhill & Co., Inc. | | | 73,259 | | |
| | 8,750 | | | @ | | Investment Technology
Group, Inc. | | | 198,800 | | |
| | 5,990 | | | @ | | LaBranche & Co., Inc. | | | 28,692 | | |
| | 36,200 | | | @ | | Nasdaq Stock Market, Inc. | | | 894,502 | | |
| | 17,250 | | | | | National Financial
Partners Corp. | | | 52,440 | | |
| | 15,510 | | | | | NYSE Euronext | | | 424,664 | | |
| | 4,600 | | | | | OptionsXpress Holdings, Inc. | | | 61,456 | | |
| Shares | | | | | | Value | |
| | 1,330 | | | @,L | | Portfolio Recovery
Associates, Inc. | | $ | 45,007 | | |
| | 10,850 | | | | | Raymond James Financial, Inc. | | | 185,861 | | |
| | 25 | | | @ | | SLM Corp. | | | 223 | | |
| | 1,450 | �� | | @ | | Stifel Financial Corp. | | | 66,483 | | |
| | 3,130 | | | | | SWS Group, Inc. | | | 59,314 | | |
| | 5,478 | | | @ | | TradeStation Group, Inc. | | | 35,333 | | |
| | 2,350 | | | @ | | World Acceptance, Corp. | | | 46,436 | | |
| | | | 6,403,424 | | |
| | | | | Electric: 2.0% | |
| | 226,100 | | | @ | | AES Corp. | | | 1,863,064 | | |
| | 7,550 | | | | | Alliant Energy Corp. | | | 220,309 | | |
| | 6,250 | | | | | Avista Corp. | | | 121,125 | | |
| | 1,850 | | | | | Central Vermont Public
Service Corp. | | | 44,141 | | |
| | 1,100 | | | | | CH Energy Group, Inc. | | | 56,529 | | |
| | 6,350 | | | | | Cleco Corp. | | | 144,971 | | |
| | 93,200 | | | | | CMS Energy Corp. | | | 942,252 | | |
| | 6,800 | | | | | Constellation Energy Group, Inc. | | | 170,612 | | |
| | 10,350 | | | | | DPL, Inc. | | | 236,394 | | |
| | 57,410 | | | | | DTE Energy Co. | | | 2,047,815 | | |
| | 14,280 | | | | | Edison International | | | 458,674 | | |
| | 5,350 | | | @ | | El Paso Electric Co. | | | 96,782 | | |
| | 17,700 | | | | | FirstEnergy Corp. | | | 859,866 | | |
| | 14,600 | | | | | Hawaiian Electric Industries | | | 323,244 | | |
| | 6,100 | | | | | MDU Resources Group, Inc. | | | 131,638 | | |
| | 19,100 | | | | | Northeast Utilities | | | 459,546 | | |
| | 11,900 | | | | | NSTAR | | | 434,231 | | |
| | 5,800 | | | | | NV Energy, Inc. | | | 57,362 | | |
| | 7,150 | | | | | OGE Energy Corp. | | | 184,327 | | |
| | 41,500 | | | | | Pacific Gas & Electric Co. | | | 1,606,465 | | |
| | 37,300 | | | | | Pinnacle West Capital Corp. | | | 1,198,449 | | |
| | 9,550 | | | | | Puget Energy, Inc. | | | 260,429 | | |
| | 1,100 | | | | | UIL Holdings Corp. | | | 33,033 | | |
| | 3,077 | | | | | Unisource Energy Corp. | | | 90,341 | | |
| | | | 12,041,599 | | |
| | | | | | | Electrical Components &
Equipment: 0.2% | | | | | |
| | 8,600 | | | | | Ametek, Inc. | | | 259,806 | | |
| | 3,150 | | | | | Belden CDT, Inc. | | | 65,772 | | |
| | 7,400 | | | @ | | Energizer Holdings, Inc. | | | 400,636 | | |
| | 12,000 | | | | | Hubbell, Inc. | | | 392,160 | | |
| | | | 1,118,374 | | |
| | | | | Electronics: 0.7% | |
| | 60,750 | | | @ | | Agilent Technologies, Inc. | | | 949,523 | | |
| | 400 | | | L | | Analogic Corp. | | | 10,912 | | |
| | 20,050 | | | @ | | Arrow Electronics, Inc. | | | 377,742 | | |
| | 12,936 | | | @ | | Avnet, Inc. | | | 235,565 | | |
| | 300 | | | @ | | Axsys Technologies, Inc. | | | 16,458 | | |
| | 14,910 | | | @ | | Benchmark Electronics, Inc. | | | 190,401 | | |
| | 9,250 | | | | | Brady Corp. | | | 221,538 | | |
| | 5,770 | | | @ | | Checkpoint Systems, Inc. | | | 56,777 | | |
| | 8,146 | | | | | CTS Corp. | | | 44,884 | | |
| | 910 | | | @ | | Cymer, Inc. | | | 19,938 | | |
| | 2,350 | | | L | | Daktronics, Inc. | | | 21,996 | | |
| | 3,800 | | | @ | | Dionex Corp. | | | 170,430 | | |
| | 1,050 | | | @ | | II-VI, Inc. | | | 20,045 | | |
| | 2,550 | | | @,L | | Itron, Inc. | | | 162,537 | | |
| | 62,610 | | | | | Jabil Circuit, Inc. | | | 422,618 | | |
| | 6,710 | | | @ | | LoJack Corp. | | | 27,645 | | |
| | 9,450 | | | | | Methode Electronics, Inc. | | | 63,693 | | |
| | 3,770 | | | @ | | Plexus Corp. | | | 63,902 | | |
See Accompanying Notes to Financial Statements
56
PORTFOLIO OF INVESTMENTS
ING VP BALANCED PORTFOLIO AS OF DECEMBER 31, 2008 (CONTINUED)
| Shares | | | | | | Value | |
| | | | | Electronics (continued) | |
| | 5,100 | | | @ | | Rogers Corp. | | $ | 141,627 | | |
| | 8,150 | | | | | Technitrol, Inc. | | | 28,362 | | |
| | 7,650 | | | @ | | Thomas & Betts Corp. | | | 183,753 | | |
| | 3,340 | | | @ | | Trimble Navigation Ltd. | | | 72,177 | | |
| | 13,273 | | | @ | | TTM Technologies, Inc. | | | 69,152 | | |
| | 24,450 | | | @ | | Vishay Intertechnology, Inc. | | | 83,619 | | |
| | 12,385 | | | @ | | Waters Corp. | | | 453,910 | | |
| | 5,750 | | | | | Watts Water Technologies, Inc. | | | 143,578 | | |
| | 4,200 | | | | | Woodward Governor Co. | | | 96,684 | | |
| | | | 4,349,466 | | |
| | | | | Engineering & Construction: 0.4% | |
| | 8,250 | | | @ | | Dycom Industries, Inc. | | | 67,815 | | |
| | 11,410 | | | @ | | EMCOR Group, Inc. | | | 255,926 | | |
| | 33,221 | | | | | Fluor Corp. | | | 1,490,626 | | |
| | 5,800 | | | | | Granite Construction, Inc. | | | 254,794 | | |
| | 13,800 | | | | | KBR, Inc. | | | 209,760 | | |
| | 10,380 | | | @ | | Shaw Group, Inc. | | | 212,479 | | |
| | 5,920 | | | @ | | URS Corp. | | | 241,358 | | |
| | | | 2,732,758 | | |
| | | | | Entertainment: 0.0% | |
| | 1,400 | | | | | International Speedway Corp. | | | 40,222 | | |
| | 7,091 | | | @ | | Scientific Games Corp. | | | 124,376 | | |
| | 18,200 | | | @ | | Shuffle Master, Inc. | | | 90,272 | | |
| | | | 254,870 | | |
| | | | | Environmental Control: 0.1% | |
| | 5,228 | | | @ | | Calgon Carbon Corp. | | | 80,302 | | |
| | 1,600 | | | @ | | Clean Harbors, Inc. | | | 101,504 | | |
| | 9,050 | | | @ | | Darling International, Inc. | | | 49,685 | | |
| | 5,868 | | | | | Republic Services, Inc. | | | 145,468 | | |
| | 1,500 | | | @ | | Tetra Tech, Inc. | | | 36,225 | | |
| | 7,100 | | | @ | | Waste Connections, Inc. | | | 224,147 | | |
| | | | 637,331 | | |
| | | | | Food: 1.3% | |
| | 1,219 | | | L | | Cal-Maine Foods, Inc. | | | 34,985 | | |
| | 133,900 | | | | | ConAgra Foods, Inc. | | | 2,209,350 | | |
| | 7,000 | | | | | Corn Products International, Inc. | | | 201,950 | | |
| | 2,450 | | | | | Diamond Foods, Inc. | | | 49,368 | | |
| | 3,520 | | | @ | | Hain Celestial Group, Inc. | | | 67,197 | | |
| | 2,729 | | | | | Hormel Foods Corp. | | | 84,817 | | |
| | 2,550 | | | | | J&J Snack Foods Corp. | | | 91,494 | | |
| | 10,898 | | | | | JM Smucker Co. | | | 472,537 | | |
| | 1,890 | | | | | Nash Finch Co. | | | 84,842 | | |
| | 3,360 | | | @ | | Ralcorp Holdings, Inc. | | | 196,224 | | |
| | 12,202 | | | | | Ruddick Corp. | | | 337,385 | | |
| | 63,800 | | | | | Safeway, Inc. | | | 1,516,526 | | |
| | 171,940 | | | | | Sara Lee Corp. | | | 1,683,293 | | |
| | 2,650 | | | @,L | | Smithfield Foods, Inc. | | | 37,286 | | |
| | 47,279 | | | | | Supervalu, Inc. | | | 690,273 | | |
| | 4,900 | | | @,L | | TreeHouse Foods, Inc. | | | 133,476 | | |
| | 1,400 | | | @ | | United Natural Foods, Inc. | | | 24,948 | | |
| | | | 7,915,951 | | |
| | | | | Forest Products & Paper: 0.2% | |
| | 9,550 | | | @ | | Buckeye Technologies, Inc. | | | 34,762 | | |
| | 1,000 | | | @ | | Clearwater Paper Corp. | | | 8,390 | | |
| | 96,800 | | | | | International Paper Co. | | | 1,142,240 | | |
| | | | 1,185,392 | | |
| Shares | | | | | | Value | |
| | | | | Gas: 0.8% | |
| | 2,400 | | | | | AGL Resources, Inc. | | $ | 75,240 | | |
| | 13,490 | | | | | Atmos Energy Corp. | | | 319,713 | | |
| | 114,572 | | | | | CenterPoint Energy, Inc. | | | 1,445,899 | | |
| | 300 | | | | | Laclede Group, Inc. | | | 14,052 | | |
| | 6,950 | | | | | National Fuel Gas Co. | | | 217,744 | | |
| | 4,200 | | | | | New Jersey Resources Corp. | | | 165,270 | | |
| | 75,000 | | | | | NiSource, Inc. | | | 822,750 | | |
| | 600 | | | | | Northwest Natural Gas Co. | | | 26,538 | | |
| | 7,100 | | | | | Piedmont Natural Gas Co. | | | 224,857 | | |
| | 4,800 | | | | | South Jersey Industries, Inc. | | | 191,280 | | |
| | 9,400 | | | | | Southern Union Co. | | | 122,576 | | |
| | 8,450 | | | | | Southwest Gas Corp. | | | 213,109 | | |
| | 15,497 | | | | | UGI Corp. | | | 378,437 | | |
| | 12,900 | | | | | Vectren Corp. | | | 322,629 | | |
| | 5,500 | | | | | WGL Holdings, Inc. | | | 179,795 | | |
| | | | 4,719,889 | | |
| | | | | Hand/Machine Tools: 0.5% | |
| | 6,100 | | | | | Baldor Electric Co. | | | 108,885 | | |
| | 20,078 | | | | | Black & Decker Corp. | | | 839,461 | | |
| | 6,800 | | | | | Lincoln Electric Holdings, Inc. | | | 346,324 | | |
| | 6,100 | | | | | Regal-Beloit Corp. | | | 231,739 | | |
| | 13,200 | | | | | Snap-On, Inc. | | | 519,816 | | |
| | 28,200 | | | | | Stanley Works | | | 961,620 | | |
| | | | 3,007,845 | | |
| | | | | Healthcare-Products: 1.4% | |
| | 18,950 | | | @ | | Affymetrix, Inc. | | | 56,661 | | |
| | 12,450 | | | @ | | American Medical Systems
Holdings, Inc. | | | 111,926 | | |
| | 5,740 | | | @,L | | Arthrocare Corp. | | | 27,380 | | |
| | 500 | | | | | Beckman Coulter, Inc. | | | 21,970 | | |
| | 70,100 | | | @ | | Boston Scientific Corp. | | | 542,574 | | |
| | 1,200 | | | | | Cooper Cos., Inc. | | | 19,680 | | |
| | 10,600 | | | | | CR Bard, Inc. | | | 893,156 | | |
| | 5,770 | | | @,L | | Cyberonics | | | 95,609 | | |
| | 500 | | | @ | | Edwards Lifesciences Corp. | | | 27,475 | | |
| | 8,400 | | | @ | | Gen-Probe, Inc. | | | 359,856 | | |
| | 1,900 | | | @ | | Haemonetics Corp. | | | 107,350 | | |
| | 9,100 | | | @ | | Henry Schein, Inc. | | | 333,879 | | |
| | 14,000 | | | L | | Hill-Rom Holdings, Inc. | | | 230,440 | | |
| | 14,954 | | | @,L | | Hologic, Inc. | | | 195,449 | | |
| | 3,130 | | | @ | | ICU Medical, Inc. | | | 103,728 | | |
| | 7,100 | | | @ | | Immucor, Inc. | | | 188,718 | | |
| | 2,350 | | | | | Invacare Corp. | | | 36,472 | | |
| | 59,190 | | | | | Johnson & Johnson | | | 3,541,338 | | |
| | 5,040 | | | @ | | Kensey Nash Corp. | | | 97,826 | | |
| | 6,490 | | | @,L | | Kinetic Concepts, Inc. | | | 124,478 | | |
| | 3,700 | | | @ | | Masimo Corp. | | | 110,371 | | |
| | 470 | | | | | Mentor Corp. | | | 14,537 | | |
| | 1,000 | | | | | Meridian Bioscience, Inc. | | | 25,470 | | |
| | 3,350 | | | @ | | Merit Medical Systems, Inc. | | | 60,066 | | |
| | 8,180 | | | @,L | | PSS World Medical, Inc. | | | 153,948 | | |
| | 14,020 | | | @ | | St. Jude Medical, Inc. | | | 462,099 | | |
| | 7,000 | | | | | Steris Corp. | | | 167,230 | | |
| | 600 | | | @,L | | SurModics, Inc. | | | 15,162 | | |
| | 2,850 | | | | | Techne Corp. | | | 183,882 | | |
| | 1,500 | | | @,L | | Thoratec Corp. | | | 48,735 | | |
| | 4,197 | | | @ | | Varian Medical Systems, Inc. | | | 147,063 | | |
| | 790 | | | | | West Pharmaceutical
Services, Inc. | | | 29,838 | | |
| | | | 8,534,366 | | |
See Accompanying Notes to Financial Statements
57
PORTFOLIO OF INVESTMENTS
ING VP BALANCED PORTFOLIO AS OF DECEMBER 31, 2008 (CONTINUED)
| Shares | | | | | | Value | |
| | | | | Healthcare-Services: 1.6% | |
| | 58,270 | | | | | Aetna, Inc. | | $ | 1,660,695 | | |
| | 2,380 | | | @,L | | Amedisys, Inc. | | | 98,389 | | |
| | 7,990 | | | @ | | AMERIGROUP Corp. | | | 235,865 | | |
| | 1,300 | | | @ | | Amsurg Corp. | | | 30,342 | | |
| | 5,600 | | | @ | | Centene Corp. | | | 110,376 | | |
| | 49,785 | | | | | Cigna Corp. | | | 838,877 | | |
| | 1,950 | | | @ | | Community Health Systems, Inc. | | | 28,431 | | |
| | 700 | | | @ | | Covance, Inc. | | | 32,221 | | |
| | 27,100 | | | @ | | Health Management
Associates, Inc. | | | 48,509 | | |
| | 8,250 | | | @ | | Health Net, Inc. | | | 89,843 | | |
| | 7,100 | | | @ | | Healthspring, Inc. | | | 141,787 | | |
| | 11,590 | | | @ | | Healthways, Inc. | | | 133,053 | | |
| | 40,700 | | | @ | | Humana, Inc. | | | 1,517,296 | | |
| | 32,732 | | | @ | | Laboratory Corp. of
America Holdings | | | 2,108,268 | | |
| | 1,300 | | | @ | | LHC Group, Inc. | | | 46,800 | | |
| | 5,800 | | | @ | | LifePoint Hospitals, Inc. | | | 132,472 | | |
| | 11,300 | | | @ | | Lincare Holdings, Inc. | | | 304,309 | | |
| | 3,750 | | | @ | | Magellan Health Services, Inc. | | | 146,850 | | |
| | 3,700 | | | @ | | Molina Healthcare, Inc. | | | 65,157 | | |
| | 14,050 | | | @ | | Odyssey HealthCare, Inc. | | | 129,963 | | |
| | 6,880 | | | @ | | Pediatrix Medical Group, Inc. | | | 218,096 | | |
| | 1,190 | | | @ | | Res-Care, Inc. | | | 17,874 | | |
| | 34,300 | | | | | UnitedHealth Group, Inc. | | | 912,380 | | |
| | 1,400 | | | | | Universal Health Services, Inc. | | | 52,598 | | |
| | 3,400 | | | @ | | WellCare Health Plans, Inc. | | | 43,724 | | |
| | 20,400 | | | @ | | WellPoint, Inc. | | | 859,452 | | |
| | | | 10,003,627 | | |
| | | | | Home Builders: 0.3% | |
| | 8,250 | | | @,L | | Hovnanian Enterprises, Inc. | | | 14,190 | | |
| | 24,600 | | | L | | KB Home | | | 335,052 | | |
| | 3,970 | | | L | | M/I Homes, Inc. | | | 41,844 | | |
| | 5,450 | | | | | MDC Holdings, Inc. | | | 165,135 | | |
| | 4,500 | | | @ | | Meritage Homes Corp. | | | 54,765 | | |
| | 700 | | | @ | | NVR, Inc. | | | 319,375 | | |
| | 26,000 | | | | | Pulte Homes, Inc. | | | 284,180 | | |
| | 4,400 | | | | | Ryland Group, Inc. | | | 77,748 | | |
| | 8,600 | | | @ | | Standard-Pacific Corp. | | | 15,308 | | |
| | 1,900 | | | L | | Thor Industries, Inc. | | | 25,042 | | |
| | 16,250 | | | @ | | Toll Brothers, Inc. | | | 348,238 | | |
| | | | 1,680,877 | | |
| | | | | Home Furnishings: 0.0% | |
| | 13,100 | | | L | | Furniture Brands
International, Inc. | | | 28,951 | | |
| | 3,350 | | | @ | | Universal Electronics, Inc. | | | 54,337 | | |
| | | | 83,288 | | |
| | | | | Household Products/Wares: 0.5% | |
| | 35,700 | | | | | Avery Dennison Corp. | | | 1,168,461 | | |
| | 6,636 | | | @ | | Central Garden & Pet Co. | | | 39,152 | | |
| | 1,700 | | | | | Church & Dwight Co., Inc. | | | 95,404 | | |
| | 31,400 | | | | | Kimberly-Clark Corp. | | | 1,656,036 | | |
| | 5,100 | | | | | Tupperware Corp. | | | 115,770 | | |
| | | | 3,074,823 | | |
| | | | | Housewares: 0.0% | |
| | 6,310 | | | L | | Toro Co. | | | 208,230 | | |
| | | | 208,230 | | |
| Shares | | | | | | Value | |
| | | | | Insurance: 2.5% | |
| | 51,320 | | | | | Aflac, Inc. | | $ | 2,352,509 | | |
| | 13,925 | | | | | American Financial Group, Inc. | | | 318,604 | | |
| | 40,150 | | | | | AON Corp. | | | 1,834,052 | | |
| | 15,399 | | | | | Arthur J. Gallagher & Co. | | | 398,988 | | |
| | 9,550 | | | | | Brown & Brown, Inc. | | | 199,595 | | |
| | 10,631 | | | | | Chubb Corp. | | | 542,181 | | |
| | 10,080 | | | | | Delphi Financial Group | | | 185,875 | | |
| | 7,270 | | | @@ | | Everest Re Group Ltd. | | | 553,538 | | |
| | 9,550 | | | | | Fidelity National Title
Group, Inc. | | | 169,513 | | |
| | 8,300 | | | | | First American Corp. | | | 239,787 | | |
| | 3,569 | | | | | Hanover Insurance Group, Inc. | | | 153,360 | | |
| | 16,500 | | | | | HCC Insurance Holdings, Inc. | | | 441,375 | | |
| | 15,100 | | | | | Horace Mann Educators Corp. | | | 138,769 | | |
| | 2,750 | | | | | Infinity Property &
Casualty Corp. | | | 128,508 | | |
| | 59,000 | | | | | Loews Corp. | | | 1,666,750 | | |
| | 3,121 | | | | | Metlife, Inc. | | | 108,798 | | |
| | 4,500 | | | | | Old Republic International Corp. | | | 53,640 | | |
| | 4,250 | | | @ | | ProAssurance Corp. | | | 224,315 | | |
| | 18,050 | | | | | Protective Life Corp. | | | 259,018 | | |
| | 10,150 | | | | | Reinsurance Group of
America, Inc. | | | 434,623 | | |
| | 1,530 | | | | | RLI Corp. | | | 93,575 | | |
| | 4,300 | | | | | Safety Insurance Group, Inc. | | | 163,658 | | |
| | 5,560 | | | | | Selective Insurance Group | | | 127,491 | | |
| | 8,900 | | | | | Stancorp Financial Group, Inc. | | | 371,753 | | |
| | 28,730 | | | | | Torchmark Corp. | | | 1,284,231 | | |
| | 4,160 | | | L | | Tower Group, Inc. | | | 117,354 | | |
| | 11,437 | | | | | Travelers Cos., Inc. | | | 516,952 | | |
| | 3,130 | | | | | United Fire & Casualty Co. | | | 97,249 | | |
| | 11,050 | | | | | Unitrin, Inc. | | | 176,137 | | |
| | 90,453 | | | | | UnumProvident Corp. | | | 1,682,426 | | |
| | 8,100 | | | | | WR Berkley Corp. | | | 251,100 | | |
| | 2,150 | | | | | Zenith National Insurance Corp. | | | 67,876 | | |
| | | | 15,353,600 | | |
| | | | | Internet: 0.9% | |
| | 9,550 | | | @ | | Avocent Corp. | | | 171,041 | | |
| | 4,720 | | | @ | | Blue Coat Systems, Inc. | | | 39,648 | | |
| | 1,340 | | | @,L | | Blue Nile, Inc. | | | 32,817 | | |
| | 2,611 | | | @ | | Cybersource Corp. | | | 31,306 | | |
| | 8,580 | | | @ | | DealerTrack Holdings, Inc. | | | 102,016 | | |
| | 5,750 | | | @ | | Digital River, Inc. | | | 142,600 | | |
| | 93,567 | | | @ | | eBay, Inc. | | | 1,306,195 | | |
| | 1,550 | | | @ | | F5 Networks, Inc. | | | 35,433 | | |
| | 4,800 | | | @ | | Google, Inc. - Class A | | | 1,476,720 | | |
| | 4,600 | | | @ | | Interwoven, Inc. | | | 57,960 | | |
| | 9,150 | | | @ | | j2 Global Communications, Inc. | | | 183,366 | | |
| | 3,700 | | | @,L | | NetFlix, Inc. | | | 110,593 | | |
| | 3,840 | | | L | | Nutri/System, Inc. | | | 56,026 | | |
| | 7,590 | | | @ | | Perficient, Inc. | | | 36,280 | | |
| | 5,850 | | | @,L | | Priceline.com, Inc. | | | 430,853 | | |
| | 7,300 | | | @ | | Stamps.com, Inc. | | | 71,759 | | |
| | 74,520 | | | @ | | Symantec Corp. | | | 1,007,510 | | |
| | 11,600 | | | | | United Online, Inc. | | | 70,412 | | |
| | 17,550 | | | @ | | Valueclick, Inc. | | | 120,042 | | |
| | 6,260 | | | @ | | Websense, Inc. | | | 93,712 | | |
| | | | 5,576,289 | | |
| | | | | Investment Companies: 0.0% | |
| | 29,750 | | | | | Apollo Investment Corp. | | | 276,973 | | |
| | | | 276,973 | | |
See Accompanying Notes to Financial Statements
58
PORTFOLIO OF INVESTMENTS
ING VP BALANCED PORTFOLIO AS OF DECEMBER 31, 2008 (CONTINUED)
| Shares | | | | | | Value | |
| | | | | Iron/Steel: 0.4% | |
| | 5,050 | | | | | Carpenter Technology Corp. | | $ | 103,727 | | |
| | 9,660 | | | | | Cliffs Natural Resources, Inc. | | | 247,393 | | |
| | 20,070 | | | | | Nucor Corp. | | | 927,234 | | |
| | 3,500 | | | | | Reliance Steel & Aluminum Co. | | | 69,790 | | |
| | 7,650 | | | | | Steel Dynamics, Inc. | | | 85,527 | | |
| | 19,930 | | | | | United States Steel Corp. | | | 741,396 | | |
| | | | 2,175,067 | | |
| | | | | Leisure Time: 0.1% | |
| | 3,400 | | | @ | | Interval Leisure Group, Inc. | | | 18,326 | | |
| | 6,650 | | | L | | Polaris Industries, Inc. | | | 190,523 | | |
| | 5,500 | | | @,L | | WMS Industries, Inc. | | | 147,950 | | |
| | | | 356,799 | | |
| | | | | | | Machinery-Construction &
Mining: 0.1% | | | | | |
| | 7,800 | | | | | Bucyrus International, Inc. | | | 144,456 | | |
| | 15,500 | | | | | Joy Global, Inc. | | | 354,795 | | |
| | 7,600 | | | @ | | Terex Corp. | | | 131,632 | | |
| | | | 630,883 | | |
| | | | | Machinery-Diversified: 0.7% | |
| | 12,800 | | | @ | | AGCO Corp. | | | 301,952 | | |
| | 5,800 | | | | | Applied Industrial
Technologies, Inc. | | | 109,736 | | |
| | 5,900 | | | | | Cognex Corp. | | | 87,320 | | |
| | 18,000 | | | | | Cummins, Inc. | | | 481,140 | | |
| | 19,700 | | | | | Flowserve Corp. | | | 1,014,550 | | |
| | 9,200 | | | @ | | Gardner Denver, Inc. | | | 214,728 | | |
| | 1,450 | | | | | Graco, Inc. | | | 34,409 | | |
| | 14,200 | | | | | IDEX Corp. | | | 342,930 | | |
| | 5,000 | | | @ | | Intermec, Inc. | | | 66,400 | | |
| | 3,850 | | | | | Robbins & Myers, Inc. | | | 62,255 | | |
| | 25,100 | | | | | Rockwell Automation, Inc. | | | 809,224 | | |
| | 7,950 | | | | | Roper Industries, Inc. | | | 345,110 | | |
| | 8,200 | | | | | Wabtec Corp. | | | 325,950 | | |
| | 1,750 | | | @ | | Zebra Technologies Corp. | | | 35,455 | | |
| | | | 4,231,159 | | |
| | | | | Media: 1.4% | |
| | 115,463 | | | | | Comcast Corp. - Class A | | | 1,949,015 | | |
| | 65,200 | | | @ | | DIRECTV Group, Inc. | | | 1,493,732 | | |
| | 149,863 | | | | | News Corp. - Class A | | | 1,362,255 | | |
| | 8,050 | | | | | Scholastic Corp. | | | 109,319 | | |
| | 381,300 | | | | | Time Warner, Inc. | | | 3,835,878 | | |
| | | | 8,750,199 | | |
| | | | | Metal Fabricate/Hardware: 0.4% | |
| | 1,700 | | | | | CIRCOR International, Inc. | | | 46,750 | | |
| | 2,300 | | | | | Commercial Metals Co. | | | 27,301 | | |
| | 500 | | | | | Kaydon Corp. | | | 17,175 | | |
| | 1,000 | | | | | Lawson Products | | | 22,850 | | |
| | 7,650 | | | | | Mueller Industries, Inc. | | | 191,862 | | |
| | 34,314 | | | | | Precision Castparts Corp. | | | 2,040,997 | | |
| | 780 | | | | | Valmont Industries, Inc. | | | 47,861 | | |
| | 4,062 | | | L | | Worthington Industries | | | 44,763 | | |
| | | | 2,439,559 | | |
| | | | | Mining: 0.0% | |
| | 1,950 | | | | | Amcol International Corp. | | | 40,853 | | |
| | 1,950 | | | @ | | Century Aluminum Co. | | | 19,500 | | |
| | 6,710 | | | | | Freeport-McMoRan Copper &
Gold, Inc. | | | 163,992 | | |
| | 1,400 | | | @ | | RTI International Metals, Inc. | | | 20,034 | | |
| | | | 244,379 | | |
| Shares | | | | | | Value | |
| | | | | Miscellaneous Manufacturing: 2.1% | |
| | 5,800 | | | | | Actuant Corp. | | $ | 110,316 | | |
| | 7,210 | | | | | Acuity Brands, Inc. | | | 251,701 | | |
| | 4,200 | | | | | AO Smith Corp. | | | 123,984 | | |
| | 6,915 | | | | | Aptargroup, Inc. | | | 243,685 | | |
| | 8,050 | | | | | Brink's Co. | | | 216,384 | | |
| | 1,200 | | | | | Carlisle Cos., Inc. | | | 24,840 | | |
| | 6,030 | | | @ | | Ceradyne, Inc. | | | 122,469 | | |
| | 2,450 | | | | | Clarcor, Inc. | | | 81,291 | | |
| | 39,950 | | | | | Cooper Industries Ltd. | | | 1,167,739 | | |
| | 11,300 | | | | | Crane Co. | | | 194,812 | | |
| | 2,550 | | | | | Donaldson Co., Inc. | | | 85,808 | | |
| | 64,170 | | | | | Dover Corp. | | | 2,112,476 | | |
| | 5,800 | | | @ | | EnPro Industries, Inc. | | | 124,932 | | |
| | 16,800 | | | | | Federal Signal Corp. | | | 137,928 | | |
| | 354,490 | | | | | General Electric Co. | | | 5,742,738 | | |
| | 11,900 | | | @ | | Griffon Corp. | | | 111,027 | | |
| | 40 | | | | | Honeywell International, Inc. | | | 1,313 | | |
| | 3,050 | | | | | John Bean Technologies Corp. | | | 24,919 | | |
| | 7,750 | | | @ | | Lydall, Inc. | | | 44,563 | | |
| | 7,800 | | | | | Matthews International
Corp. - Class A | | | 286,104 | | |
| | 2,292 | | | | | Myers Industries, Inc. | | | 18,336 | | |
| | 20,100 | | | | | Parker Hannifin Corp. | | | 855,054 | | |
| | 7,150 | | | | | Pentair, Inc. | | | 169,241 | | |
| | 5,600 | | | | | SPX Corp. | | | 227,080 | | |
| | 3,450 | | | | | Tredegar Corp. | | | 62,721 | | |
| | | | 12,541,461 | | |
| | | | | Office Furnishings: 0.1% | |
| | 10,552 | | | | | Herman Miller, Inc. | | | 137,493 | | |
| | 10,200 | | | L | | HNI, Corp. | | | 161,568 | | |
| | | | 299,061 | | |
| | | | | Office/Business Equipment: 0.6% | |
| | 70,450 | | | | | Pitney Bowes, Inc. | | | 1,795,066 | | |
| | 234,220 | | | | | Xerox Corp. | | | 1,866,733 | | |
| | | | 3,661,799 | | |
| | | | | Oil & Gas: 6.5% | |
| | 18,526 | | | | | Apache Corp. | | | 1,380,743 | | |
| | 9,470 | | | @ | | Atwood Oceanics, Inc. | | | 144,702 | | |
| | 69,833 | | | | | Chevron Corp. | | | 5,165,547 | | |
| | 4,850 | | | | | Cimarex Energy Co. | | | 129,883 | | |
| | 1,350 | | | @ | | Comstock Resources, Inc. | | | 63,788 | | |
| | 94,600 | | | | | ConocoPhillips | | | 4,900,280 | | |
| | 9,300 | | | @ | | Denbury Resources, Inc. | | | 101,556 | | |
| | 10,350 | | | @ | | Encore Acquisition Co. | | | 264,132 | | |
| | 233,770 | | | | | ExxonMobil Corp. | | | 18,661,859 | | |
| | 7,000 | | | @ | | Forest Oil Corp. | | | 115,430 | | |
| | 5,850 | | | | | Frontier Oil Corp. | | | 73,886 | | |
| | 7,100 | | | | | Helmerich & Payne, Inc. | | | 161,525 | | |
| | 7,483 | | | | | Hess Corp. | | | 401,388 | | |
| | 3,600 | | | | | Holly Corp. | | | 65,628 | | |
| | 7,000 | | | @ | | Mariner Energy, Inc. | | | 71,400 | | |
| | 43,048 | | | | | Murphy Oil Corp. | | | 1,909,179 | | |
| | 71,100 | | | @,@@ | | Nabors Industries Ltd. | | | 851,067 | | |
| | 7,150 | | | @ | | Newfield Exploration Co. | | | 141,213 | | |
| | 39,400 | | | | | Noble Corp. | | | 870,346 | | |
| | 1,850 | | | | | Penn Virginia Corp. | | | 48,063 | | |
| | 580 | | | @ | | Petroleum Development Corp. | | | 13,961 | | |
| | 5,910 | | | @ | | Petroquest Energy, Inc. | | | 39,952 | | |
| | 6,160 | | | @ | | Pioneer Drilling Co. | | | 34,311 | | |
See Accompanying Notes to Financial Statements
59
PORTFOLIO OF INVESTMENTS
ING VP BALANCED PORTFOLIO AS OF DECEMBER 31, 2008 (CONTINUED)
| Shares | | | | | | Value | |
| | | | | Oil & Gas (continued) | |
| | 15,243 | | | @ | | Plains Exploration &
Production Co. | | $ | 354,247 | | |
| | 7,450 | | | @ | | Pride International, Inc. | | | 119,051 | | |
| | 28,850 | | | @,L | | Quicksilver Resources, Inc. | | | 160,695 | | |
| | 5,250 | | | | | St. Mary Land & Exploration Co. | | | 106,628 | | |
| | 5,150 | | | @ | | Stone Energy Corp. | | | 56,753 | | |
| | 21,636 | | | | | Sunoco, Inc. | | | 940,301 | | |
| | 3,430 | | | @ | | Swift Energy Co. | | | 57,658 | | |
| | 31,029 | | | | | Tesoro Corp. | | | 408,652 | | |
| | 3,580 | | | @ | | Unit Corp. | | | 95,658 | | |
| | 67,102 | | | | | Valero Energy Corp. | | | 1,452,087 | | |
| | | | 39,361,569 | | |
| | | | | Oil & Gas Services: 0.9% | |
| | 7,550 | | | @ | | Basic Energy Services, Inc. | | | 98,452 | | |
| | 30,963 | | | | | BJ Services Co. | | | 361,338 | | |
| | 72,894 | | | @ | | Cameron International Corp. | | | 1,494,327 | | |
| | 5,700 | | | @ | | FMC Technologies, Inc. | | | 135,831 | | |
| | 1,980 | | | | | Gulf Island Fabrication, Inc. | | | 28,532 | | |
| | 13,500 | | | @ | | Helix Energy Solutions
Group, Inc. | | | 97,740 | | |
| | 4,600 | | | @ | | Hornbeck Offshore Services, Inc. | | | 75,164 | | |
| | 9,310 | | | @ | | ION Geophysical Corp. | | | 31,933 | | |
| | 2,650 | | | | | Lufkin Industries, Inc. | | | 91,425 | | |
| | 66,866 | | | @ | | National Oilwell Varco, Inc. | | | 1,634,205 | | |
| | 4,300 | | | @ | | Oceaneering International, Inc. | | | 125,302 | | |
| | 10,200 | | | @ | | Oil States International, Inc. | | | 190,638 | | |
| | 2,520 | | | @ | | SEACOR Holdings, Inc. | | | 167,958 | | |
| | 33,500 | | | | | Smith International, Inc. | | | 766,815 | | |
| | 10,750 | | | @ | | Superior Energy Services | | | 171,248 | | |
| | | | 5,470,908 | | |
| | | | | Packaging & Containers: 0.4% | |
| | 27,670 | | | | | Ball Corp. | | | 1,150,795 | | |
| | 24,800 | | | | | Bemis Co. | | | 587,264 | | |
| | 2,350 | | | | | Greif, Inc. - Class A | | | 78,561 | | |
| | 6,730 | | | | | Rock-Tenn Co. | | | 230,031 | | |
| | 16,761 | | | | | Sonoco Products Co. | | | 388,185 | | |
| | | | 2,434,836 | | |
| | | | | Pharmaceuticals: 3.2% | |
| | 5,721 | | | | | Abbott Laboratories | | | 305,330 | | |
| | 38,900 | | | | | Bristol-Myers Squibb Co. | | | 904,425 | | |
| | 2,400 | | | @ | | Catalyst Health Solutions, Inc. | | | 58,440 | | |
| | 80,093 | | | | | Eli Lilly & Co. | | | 3,225,345 | | |
| | 19,700 | | | @ | | Endo Pharmaceuticals
Holdings, Inc. | | | 509,836 | | |
| | 19,360 | | | @ | | Express Scripts, Inc. | | | 1,064,413 | | |
| | 91,630 | | | @ | | Forest Laboratories, Inc. | | | 2,333,816 | | |
| | 18,056 | | | @ | | King Pharmaceuticals, Inc. | | | 191,755 | | |
| | 14,100 | | | | | Medicis Pharmaceutical Corp. | | | 195,990 | | |
| | 26,938 | | | | | Merck & Co., Inc. | | | 818,915 | | |
| | 1,750 | | | @ | | NBTY, Inc. | | | 27,388 | | |
| | 13,150 | | | | | Omnicare, Inc. | | | 365,044 | | |
| | 5,250 | | | @ | | Par Pharmaceutical Cos., Inc. | | | 70,403 | | |
| | 9,450 | | | | | Perrigo Co. | | | 305,330 | | |
| | 310,570 | | | | | Pfizer, Inc. | | | 5,500,195 | | |
| | 3,250 | | | @ | | PharMerica Corp. | | | 50,928 | | |
| | 8,030 | | | @,L | | Salix Pharmaceuticals Ltd. | | | 70,905 | | |
| | 64,960 | | | | | Schering-Plough Corp. | | | 1,106,269 | | |
| | 13,400 | | | @ | | Sepracor, Inc. | | | 147,132 | | |
| | 8,950 | | | @,L | | Valeant Pharmaceuticals
International | | | 204,955 | | |
| Shares | | | | | | Value | |
| | 6,800 | | | @ | | VCA Antech, Inc. | | $ | 135,184 | | |
| | 10,720 | | | @ | | Viropharma, Inc. | | | 139,574 | | |
| | 35,037 | | | @ | | Watson Pharmaceuticals, Inc. | | | 930,933 | | |
| | 21,480 | | | | | Wyeth | | | 805,715 | | |
| | | | 19,468,220 | | |
| | | | | Pipelines: 0.1% | |
| | 8,250 | | | | | Oneok, Inc. | | | 240,240 | | |
| | 22,641 | | | | | Spectra Energy Corp. | | | 356,369 | | |
| | | | 596,609 | | |
| | | | | Real Estate: 0.0% | |
| | 2,750 | | | @,L | | Forestar Real Estate Group, Inc. | | | 26,180 | | |
| | 2,740 | | | | | Jones Lang LaSalle, Inc. | | | 75,898 | | |
| | | | 102,078 | | |
| | | | | Retail: 4.2% | |
| | 9,550 | | | | | Advance Auto Parts, Inc. | | | 321,358 | | |
| | 8,950 | | | @ | | Aeropostale, Inc. | | | 144,095 | | |
| | 14,057 | | | @,L | | Autozone, Inc. | | | 1,960,530 | | |
| | 29,420 | | | @ | | Big Lots, Inc. | | | 426,296 | | |
| | 10,000 | | | @ | | BJ's Wholesale Club, Inc. | | | 342,600 | | |
| | 4,700 | | | L | | Buckle, Inc. | | | 102,554 | | |
| | 1,030 | | | @ | | Buffalo Wild Wings, Inc. | | | 26,420 | | |
| | 6,200 | | | @ | | Cabela's, Inc. | | | 36,146 | | |
| | 5,900 | | | | | Casey's General Stores, Inc. | | | 134,343 | | |
| | 4,700 | | | | | Cash America International, Inc. | | | 128,545 | | |
| | 9,250 | | | | | Cato Corp. | | | 139,675 | | |
| | 5,600 | | | @ | | CEC Entertainment, Inc. | | | 135,800 | | |
| | 7,620 | | | @ | | Charlotte Russe Holding, Inc. | | | 49,454 | | |
| | 6,600 | | | @ | | Cheesecake Factory | | | 66,660 | | |
| | 5,150 | | | @ | | Childrens Place Retail
Stores, Inc. | | | 111,652 | | |
| | 1,950 | | | @,L | | Chipotle Mexican Grill, Inc. | | | 120,861 | | |
| | 14,450 | | | | | Christopher & Banks Corp. | | | 80,920 | | |
| | 10,350 | | | @ | | Collective Brands, Inc. | | | 121,302 | | |
| | 1,250 | | | @ | | Copart, Inc. | | | 33,988 | | |
| | 103,690 | | | | | CVS Caremark Corp. | | | 2,980,051 | | |
| | 12,100 | | | @,L | | Dollar Tree, Inc. | | | 505,780 | | |
| | 9,350 | | | @,L | | Dress Barn, Inc. | | | 100,419 | | |
| | 50,400 | | | | | Family Dollar Stores, Inc. | | | 1,313,928 | | |
| | 5,850 | | | | | Finish Line | | | 32,760 | | |
| | 4,830 | | | @ | | First Cash Financial Services, Inc. | | | 92,060 | | |
| | 18,950 | | | | | Foot Locker, Inc. | | | 139,093 | | |
| | 5,200 | | | | | Fred's, Inc. | | | 55,952 | | |
| | 13,440 | | | @ | | GameStop Corp. | | | 291,110 | | |
| | 125,810 | | | | | Gap, Inc. | | | 1,684,596 | | |
| | 3,350 | | | @,L | | Genesco, Inc. | | | 56,682 | | |
| | 5,950 | | | | | Guess ?, Inc. | | | 91,333 | | |
| | 4,950 | | | @ | | Gymboree Corp. | | | 129,146 | | |
| | 2,250 | | | L | | Haverty Furniture Cos., Inc. | | | 20,993 | | |
| | 3,050 | | | @,L | | Hibbett Sporting Goods, Inc. | | | 47,916 | | |
| | 6,050 | | | @ | | HOT Topic, Inc. | | | 56,084 | | |
| | 1,000 | | | @ | | Jack in the Box, Inc. | | | 22,090 | | |
| | 3,600 | | | @,L | | Jo-Ann Stores, Inc. | | | 55,764 | | |
| | 4,150 | | | @,L | | JoS. A Bank Clothiers, Inc. | | | 108,523 | | |
| | 1,431 | | | L | | Landry's Restaurants, Inc. | | | 16,600 | | |
| | 17,500 | | | | | Lowe's Cos., Inc. | | | 376,600 | | |
| | 42,260 | | | | | McDonald's Corp. | | | 2,628,149 | | |
| | 8,750 | | | | | MSC Industrial Direct Co. | | | 322,263 | | |
| | 1,500 | | | @ | | O'Reilly Automotive, Inc. | | | 46,110 | | |
| | 4,990 | | | @,L | | Panera Bread Co. | | | 260,678 | | |
| | 6,280 | | | @ | | PetMed Express, Inc. | | | 110,716 | | |
| | 16,300 | | | | | Petsmart, Inc. | | | 300,735 | | |
See Accompanying Notes to Financial Statements
60
PORTFOLIO OF INVESTMENTS
ING VP BALANCED PORTFOLIO AS OF DECEMBER 31, 2008 (CONTINUED)
| Shares | | | | | | Value | |
| | | | | Retail (continued) | |
| | 6,920 | | | @,L | | PF Chang's China Bistro, Inc. | | $ | 144,905 | | |
| | 9,000 | | | | | Phillips-Van Heusen | | | 181,170 | | |
| | 32,483 | | | | | RadioShack Corp. | | | 387,847 | | |
| | 13,750 | | | | | Regis Corp. | | | 199,788 | | |
| | 15,350 | | | | | Ross Stores, Inc. | | | 456,356 | | |
| | 5,910 | | | @ | | Sonic Corp. | | | 71,925 | | |
| | 40,800 | | | | | Staples, Inc. | | | 731,136 | | |
| | 5,700 | | | @ | | Tractor Supply Co. | | | 205,998 | | |
| | 15,800 | | | @ | | Urban Outfitters, Inc. | | | 236,684 | | |
| | 110,733 | | | | | Wal-Mart Stores, Inc. | | | 6,207,692 | | |
| | 4,310 | | | | | World Fuel Services Corp. | | | 159,470 | | |
| | 4,200 | | | @ | | Zumiez, Inc. | | | 31,290 | | |
| | | | 25,343,591 | | |
| | | | | Savings & Loans: 0.6% | |
| | 9,276 | | | | | Anchor Bancorp. Wisconsin, Inc. | | | 25,602 | | |
| | 18,250 | | | | | Astoria Financial Corp. | | | 300,760 | | |
| | 10,190 | | | | | Brookline Bancorp., Inc. | | | 108,524 | | |
| | 9,500 | | | | | Dime Community Bancshares | | | 126,350 | | |
| | 2,900 | | | | | First Niagara Financial
Group, Inc. | | | 46,893 | | |
| | 4,700 | | | @,L | | Guaranty Financial Group, Inc. | | | 12,267 | | |
| | 176,000 | | | | | Hudson City Bancorp., Inc. | | | 2,808,960 | | |
| | 37,500 | | | | | New York Community
Bancorp., Inc. | | | 448,500 | | |
| | | | 3,877,856 | | |
| | | | | Semiconductors: 0.6% | |
| | 5,050 | | | @ | | Cabot Microelectronics Corp. | | | 131,654 | | |
| | 2,655 | | | | | Cohu, Inc. | | | 32,258 | | |
| | 3,400 | | | @ | | Cree, Inc. | | | 53,958 | | |
| | 14,750 | | | @ | | Cypress Semiconductor Corp. | | | 65,933 | | |
| | 2,520 | | | @,L | | Diodes, Inc. | | | 15,271 | | |
| | 14,300 | | | @ | | DSP Group, Inc. | | | 114,686 | | |
| | 1,350 | | | @ | | Hittite Microwave Corp. | | | 39,771 | | |
| | 17,800 | | | @ | | Integrated Device
Technology, Inc. | | | 99,858 | | |
| | 67,214 | | | | | Intel Corp. | | | 985,357 | | |
| | 16,250 | | | @ | | Lam Research Corp. | | | 345,800 | | |
| | 9,150 | | | @ | | Microsemi Corp. | | | 115,656 | | |
| | 8,550 | | | @ | | MKS Instruments, Inc. | | | 126,455 | | |
| | 38,720 | | | @ | | QLogic Corp. | | | 520,397 | | |
| | 3,400 | | | @ | | Silicon Laboratories, Inc. | | | 84,252 | | |
| | 17,500 | | | @ | | Skyworks Solutions, Inc. | | | 96,950 | | |
| | 6,200 | | | @ | | Standard Microsystems Corp. | | | 101,308 | | |
| | 800 | | | @ | | Supertex, Inc. | | | 19,208 | | |
| | 9,909 | | | @ | | Triquint Semiconductor, Inc. | | | 34,087 | | |
| | 3,450 | | | @ | | Ultratech, Inc. | | | 41,262 | | |
| | 7,285 | | | @ | | Varian Semiconductor
Equipment Associates, Inc. | | | 132,004 | | |
| | 3,122 | | | @ | | Veeco Instruments, Inc. | | | 19,793 | | |
| | 15,500 | | | | | Xilinx, Inc. | | | 276,210 | | |
| | | | 3,452,128 | | |
| | | | | Software: 2.1% | |
| | 9,150 | | | @ | | ACI Worldwide, Inc. | | | 145,485 | | |
| | 8,750 | | | | | Acxiom Corp. | | | 70,963 | | |
| | 5,450 | | | @ | | Ansys, Inc. | | | 152,001 | | |
| | 20,150 | | | @ | | Autodesk, Inc. | | | 395,948 | | |
| | 1,460 | | | @ | | Avid Technology, Inc. | | | 15,929 | | |
| | 2,450 | | | | | Blackbaud, Inc. | | | 33,075 | | |
| | 13,600 | | | | | Broadridge Financial
Solutions ADR | | | 170,544 | | |
| | 6,050 | | | @,L | | Cerner Corp. | | | 232,623 | | |
| Shares | | | | | | Value | |
| | 85,700 | | | @ | | Compuware Corp. | | $ | 578,475 | | |
| | 1,750 | | | @ | | Concur Technologies, Inc. | | | 57,435 | | |
| | 1,410 | | | @ | | CSG Systems International | | | 24,633 | | |
| | 2,650 | | | @ | | Digi International, Inc. | | | 21,492 | | |
| | 4,900 | | | @ | | Eclipsys Corp. | | | 69,531 | | |
| | 21,350 | | | @,L | | Epicor Software Corp. | | | 102,480 | | |
| | 10,500 | | | L | | Fair Isaac Corp. | | | 177,030 | | |
| | 59,800 | | | | | Fidelity National Information
Services, Inc. | | | 972,946 | | |
| | 38,290 | | | @ | | Fiserv, Inc. | | | 1,392,607 | | |
| | 62,160 | | | | | IMS Health, Inc. | | | 942,346 | | |
| | 11,130 | | | @ | | Informatica Corp. | | | 152,815 | | |
| | 6,264 | | | @ | | JDA Software Group, Inc. | | | 82,246 | | |
| | 1,600 | | | @ | | Mantech International Corp. | | | 86,704 | | |
| | 4,300 | | | @ | | Metavante Technologies, inc. | | | 69,273 | | |
| | 237,544 | | | | | Microsoft Corp. | | | 4,617,855 | | |
| | 6,550 | | | @ | | Omnicell, Inc. | | | 79,976 | | |
| | 54,024 | | | @ | | Oracle Corp. | | | 957,846 | | |
| | 12,600 | | | @ | | Parametric Technology Corp. | | | 159,390 | | |
| | 5,759 | | | @ | | Phase Forward, Inc. | | | 72,103 | | |
| | 4,150 | | | @ | | Phoenix Technologies Ltd. | | | 14,525 | | |
| | 8,950 | | | @ | | Progress Software Corp. | | | 172,377 | | |
| | 11,750 | | | | | SEI Investments Co. | | | 184,593 | | |
| | 3,610 | | | @ | | Smith Micro Software, Inc. | | | 20,072 | | |
| | 2,650 | | | @ | | SPSS, Inc. | | | 71,444 | | |
| | 12,143 | | | @ | | Sybase, Inc. | | | 300,782 | | |
| | 5,300 | | | @,L | | SYNNEX Corp. | | | 60,049 | | |
| | 8,570 | | | @ | | Take-Two Interactive
Software, Inc. | | | 64,789 | | |
| | 3,100 | | | @ | | Taleo Corp. | | | 24,273 | | |
| | 2,331 | | | @ | | Tyler Technologies, Inc. | | | 27,925 | | |
| | | | 12,774,580 | | |
| | | | | Storage/Warehousing: 0.0% | |
| | 3,500 | | | @,L | | Mobile Mini, Inc. | | | 50,470 | | |
| | | | 50,470 | | |
| | | | | Telecommunications: 2.9% | |
| | 40,450 | | | @ | | 3Com Corp. | | | 92,226 | | |
| | 19,600 | | | @ | | Adaptec, Inc. | | | 64,680 | | |
| | 4,040 | | | @,L | | Anixter International, Inc. | | | 121,685 | | |
| | 2,100 | | | | | Applied Signal Technology, Inc. | | | 37,674 | | |
| | 14,192 | | | @ | | Arris Group, Inc. | | | 112,826 | | |
| | 189,907 | | | | | AT&T, Inc. | | | 5,412,350 | | |
| | 5,310 | | | | | Black Box Corp. | | | 138,697 | | |
| | 259,589 | | | @ | | Cisco Systems, Inc. | | | 4,231,301 | | |
| | 15,323 | | | @ | | CommScope, Inc. | | | 238,119 | | |
| | 970 | | | @ | | Comtech Telecommunications | | | 44,445 | | |
| | 14,650 | | | | | Corning, Inc. | | | 139,615 | | |
| | 13,780 | | | | | Embarq Corp. | | | 495,529 | | |
| | 7,090 | | | | | Fairpoint Communications, Inc. | | | 23,255 | | |
| | 2,900 | | | @ | | General Communication, Inc. | | | 23,461 | | |
| | 14,500 | | | @ | | Harmonic, Inc. | | | 81,345 | | |
| | 35,585 | | | | | Harris Corp. | | | 1,354,009 | | |
| | 44,120 | | | @ | | JDS Uniphase Corp. | | | 161,038 | | |
| | 6,550 | | | @ | | Netgear, Inc. | | | 74,736 | | |
| | 13,400 | | | @ | | NeuStar, Inc. | | | 256,342 | | |
| | 8,690 | | | @ | | Novatel Wireless, Inc. | | | 40,322 | | |
| | 5,900 | | | | | Plantronics, Inc. | | | 77,880 | | |
| | 4,150 | | | @ | | Tekelec | | | 55,361 | | |
| | 10,675 | | | | | Telephone & Data Systems, Inc. | | | 338,931 | | |
| | 88,525 | | | | | Verizon Communications, Inc. | | | 3,000,998 | | |
| | 109,670 | | | | | Windstream Corp. | | | 1,008,964 | | |
| | | | 17,625,789 | | |
See Accompanying Notes to Financial Statements
61
PORTFOLIO OF INVESTMENTS
ING VP BALANCED PORTFOLIO AS OF DECEMBER 31, 2008 (CONTINUED)
| Shares | | | | | | Value | |
| | | | | Textiles: 0.0% | |
| | 6,180 | | | | | G&K Services, Inc. | | $ | 124,960 | | |
| | 700 | | | @ | | Mohawk Industries, Inc. | | | 30,079 | | |
| | 3,150 | | | | | Unifirst Corp. | | | 93,524 | | |
| | | | 248,563 | | |
| | | | | Toys/Games/Hobbies: 0.3% | |
| | 45,550 | | | | | Hasbro, Inc. | | | 1,328,694 | | |
| | 3,300 | | | @ | | Jakks Pacific, Inc. | | | 68,079 | | |
| | 5,600 | | | @ | | Marvel Entertainment, Inc. | | | 172,200 | | |
| | | | 1,568,973 | | |
| | | | | Transportation: 0.4% | |
| | 10,600 | | | | | Alexander & Baldwin, Inc. | | | 265,636 | | |
| | 4,700 | | | L | | Arkansas Best Corp. | | | 141,517 | | |
| | 4,650 | | | L | | Heartland Express, Inc. | | | 73,284 | | |
| | 2,360 | | | @ | | HUB Group, Inc. | | | 62,611 | | |
| | 7,350 | | | @ | | Kirby Corp. | | | 201,096 | | |
| | 2,550 | | | | | Landstar System, Inc. | | | 97,997 | | |
| | 2,900 | | | @ | | Old Dominion Freight Line | | | 82,534 | | |
| | 2,950 | | | | | Overseas Shipholding Group | | | 124,225 | | |
| | 20,830 | | | | | Ryder System, Inc. | | | 807,787 | | |
| | 2,100 | | | | | Tidewater, Inc. | | | 84,567 | | |
| | 11,200 | | | | | Werner Enterprises, Inc. | | | 194,208 | | |
| | 8,500 | | | @,L | | YRC Worldwide, Inc. | | | 24,395 | | |
| | | | 2,159,857 | | |
| | | | | Water: 0.0% | |
| | 1,500 | | | | | Aqua America, Inc. | | | 30,885 | | |
| | | | 30,885 | | |
Total Common Stock
(Cost $448,837,066) | | | 374,465,037 | | |
| REAL ESTATE INVESTMENT TRUSTS: 1.4% | | | |
| | | | | Apartments: 0.3% | |
| | 16,080 | | | | | Apartment Investment &
Management Co. | | | 185,724 | | |
| | 800 | | | | | BRE Properties, Inc. | | | 22,384 | | |
| | 3,100 | | | | | Camden Property Trust | | | 97,154 | | |
| | 28,297 | | | | | Equity Residential | | | 843,817 | | |
| | 1,950 | | | | | Essex Property Trust, Inc. | | | 149,663 | | |
| | 2,160 | | | | | Home Properties, Inc. | | | 87,696 | | |
| | 1,550 | | | | | Mid-America Apartment
Communities, Inc. | | | 57,598 | | |
| | 1,800 | | | | | Post Properties, Inc. | | | 29,700 | | |
| | 2,750 | | | | | UDR, Inc. | | | 37,923 | | |
| | | | 1,511,659 | | |
| | | | | Diversified: 0.1% | |
| | 10,500 | | | | | Colonial Properties Trust | | | 87,465 | | |
| | 2,450 | | | | | Duke Realty Corp. | | | 26,852 | | |
| | 4,190 | | | | | Entertainment Properties Trust | | | 124,862 | | |
| | 18,240 | | | | | Lexington Realty Trust | | | 91,200 | | |
| | 7,350 | | | | | Liberty Property Trust | | | 167,801 | | |
| | 400 | | | | | PS Business Parks, Inc. | | | 17,864 | | |
| | | | 516,044 | | |
| | | | | Health Care: 0.4% | |
| | 69,417 | | | L | | HCP, Inc. | | | 1,927,710 | | |
| | 7,500 | | | | | Health Care Real Estate
Investment Trust, Inc. | | | 316,500 | | |
| | 5,450 | | | L | | Medical Properties Trust, Inc. | | | 34,390 | | |
| | 6,600 | | | L | | Nationwide Health
Properties, Inc. | | | 189,552 | | |
| Shares | | | | | | Value | |
| | 6,300 | | | | | Omega Healthcare
Investors, Inc. | | $ | 100,611 | | |
| | 8,720 | | | | | Senior Housing Properties Trust | | | 156,262 | | |
| | | | 2,725,025 | | |
| | | | | Hotels: 0.2% | |
| | 20,061 | | | | | DiamondRock Hospitality Co. | | | 101,709 | | |
| | 15,950 | | | | | Hospitality Properties Trust | | | 237,177 | | |
| | 91,110 | | | | | Host Hotels & Resorts, Inc. | | | 689,703 | | |
| | 6,900 | | | | | LaSalle Hotel Properties | | | 76,245 | | |
| | | | 1,104,834 | | |
| | | | | Office Property: 0.1% | |
| | 1,500 | | | | | Alexandria Real Estate
Equities, Inc. | | | 90,510 | | |
| | 6,410 | | | | | BioMed Realty Trust, Inc. | | | 75,125 | | |
| | 6,000 | | | | | Franklin Street Properties Corp. | | | 88,500 | | |
| | 3,850 | | | | | Highwoods Properties, Inc. | | | 105,336 | | |
| | 2,050 | | | | | Kilroy Realty Corp. | | | 68,593 | | |
| | 9,800 | | | | | Mack-Cali Realty Corp. | | | 240,100 | | |
| | 4,730 | | | | | Parkway Properties, Inc. | | | 85,140 | | |
| | 4,400 | | | | | SL Green Realty Corp. | | | 113,960 | | |
| | | | 867,264 | | |
| | | | | Paper & Related Products: 0.0% | |
| | 2,150 | | | | | Rayonier, Inc. | | | 67,403 | | |
| | | | 67,403 | | |
| | | | | Regional Malls: 0.1% | |
| | 12,850 | | | L | | Macerich Co. | | | 233,356 | | |
| | 8,400 | | | | | Pennsylvania Real Estate
Investment Trust | | | 62,580 | | |
| | | | 295,936 | | |
| | | | | Shopping Centers: 0.1% | |
| | 7,750 | | | | | Cedar Shopping Centers, Inc. | | | 54,870 | | |
| | 2,450 | | | | | Federal Realty Investment Trust | | | 152,096 | | |
| | 1,550 | | | | | Inland Real Estate Corp. | | | 20,119 | | |
| | 4,150 | | | | | Kite Realty Group Trust | | | 23,074 | | |
| | 2,300 | | | | | Regency Centers Corp. | | | 107,410 | | |
| | 1,950 | | | L | | Tanger Factory Outlet
Centers, Inc. | | | 73,359 | | |
| | 11,300 | | | L | | Weingarten Realty Investors | | | 233,797 | | |
| | | | 664,725 | | |
| | | | | Single Tenant: 0.0% | |
| | 4,650 | | | L | | National Retail Properties, Inc. | | | 79,934 | | |
| | 1,750 | | | | | Realty Income Corp. | | | 40,513 | | |
| | | | 120,447 | | |
| | | | | Storage: 0.1% | |
| | 9,809 | | | | | Extra Space Storage, Inc. | | | 101,229 | | |
| | 6,000 | | | | | Public Storage, Inc. | | | 477,000 | | |
| | 617 | | | | | Sovran Self Storage, Inc. | | | 22,212 | | |
| | | | 600,441 | | |
| | | | | Warehouse/Industrial: 0.0% | |
| | 9,400 | | | | | AMB Property Corp. | | | 220,148 | | |
| | 1,150 | | | | | EastGroup Properties, Inc. | | | 40,917 | | |
| | | | 261,065 | | |
Total Real Estate
Investment Trusts
(Cost $10,730,276) | | | 8,734,843 | | |
See Accompanying Notes to Financial Statements
62
PORTFOLIO OF INVESTMENTS
ING VP BALANCED PORTFOLIO AS OF DECEMBER 31, 2008 (CONTINUED)
| Shares | | | | | | Value | |
| PREFERRED STOCK: 0.3% | | | |
| | | | | Diversified Financial Services: 0.1% | |
| | 857 | | | #,P | | Zurich RegCaPS Funding Trust | | $ | 636,858 | | |
| | | | 636,858 | | |
| | | | | Insurance: 0.2% | |
| | 19,271 | | | @@,P | | Aegon NV - Series 1 | | | 172,861 | | |
| | 48,903 | | | @@,P | | Aegon NV | | | 480,716 | | |
| | 65,080 | | | @@,P | | XL Capital, Ltd. | | | 162,700 | | |
| | | | 816,277 | | |
Total Preferred Stock
(Cost $3,626,207) | | | 1,453,135 | | |
Principal
Amount | | | | | | Value | |
| CORPORATE BONDS/NOTES: 9.8% | | | |
| | | | | Aerospace/Defense: 0.1% | |
| $ | 562,000 | | | C | | United Technologies Corp.,
6.125%, due 02/01/19 | | $ | 602,418 | | |
| | | | 602,418 | | |
| | | | | Agriculture: 0.1% | |
| | 209,000 | | | S | | Philip Morris International, Inc.,
5.650%, due 05/16/18 | | | 207,561 | | |
| | 412,000 | | | | | Philip Morris International, Inc.,
6.375%, due 05/16/38 | | | 429,956 | | |
| | | | 637,517 | | |
| | | | | Airlines: 0.1% | |
| | 797,000 | | | C | | Delta Airlines, Inc., 7.570%,
due 11/18/10 | | | 669,480 | | |
| | | | 669,480 | | |
| | | | | Banks: 2.8% | |
| | 1,040,000 | | | @@,C | | Australia & New Zealand
Banking Group Ltd., 3.588%,
due 12/31/49 | | | 404,665 | | |
| | 559,000 | | | C | | BAC Capital Trust XIV, 5.630%,
due 12/31/49 | | | 224,098 | | |
| | 1,255,000 | | | C | | Bank of America Corp., 8.000%,
due 12/01/49 | | | 904,002 | | |
| | 400,000 | | | @@,C | | Bank of Ireland, 1.750%,
due 12/29/49 | | | 204,000 | | |
| | 210,000 | | | @@,C | | Bank of Scotland PLC, 2.750%,
due 12/31/49 | | | 73,696 | | |
| | 490,000 | | | @@,C | | Barclays Bank PLC, 3.250%,
due 12/31/49 | | | 286,696 | | |
| | 434,000 | | | @@,#,C | | Barclays Bank PLC, 5.926%,
due 09/29/49 | | | 159,778 | | |
| | 580,000 | | | @@,# | | Barclays Bank PLC, 6.050%,
due 12/04/17 | | | 512,520 | | |
| | 110,000 | | | @@,C | | Barclays O/S Inv, 2.875%,
due 04/11/49 | | | 63,454 | | |
| | 710,000 | | | @@,C | | BNP Paribas, 3.998%,
due 09/29/49 | | | 323,274 | | |
| | 525,000 | | | | | Citigroup, Inc., 5.000%,
due 09/15/14 | | | 462,334 | | |
| | 1,735,000 | | | C,S | | Citigroup, Inc., 8.400%,
due 04/29/49 | | | 1,147,772 | | |
| | 377,000 | | | @@,#,C | | Danske Bank A/S, 5.914%,
due 12/29/49 | | | 199,316 | | |
Principal
Amount | | | | | | Value | |
| $ | 220,000 | | | @@,C | | Den Norske Bank ASA, 2.500%,
due 11/29/49 | | $ | 105,688 | | |
| | 723,000 | | | #,C | | Dresdner Funding Trust I,
8.151%, due 06/30/31 | | | 286,659 | | |
| | 426,000 | | | | | Fifth Third Bancorp., 8.250%,
due 03/01/38 | | | 352,798 | | |
| | 318,000 | | | | | Goldman Sachs Group, Inc.,
5.250%, due 04/01/13 | | | 293,131 | | |
| | 720,000 | | | | | Goldman Sachs Group, Inc.,
5.450%, due 11/01/12 | | | 687,394 | | |
| | 860,000 | | | @@,C | | Hongkong & Shanghai
Banking Corp., Ltd., 3.813%,
due 07/29/49 | | | 464,400 | | |
| | 1,150,000 | | | @@,C,L | | HSBC Bank PLC, 1.913%,
due 06/29/49 | | | 621,000 | | |
| | 1,140,000 | | | @@ | | HSBC Bank PLC, 3.438%,
due 06/29/49 | | | 609,900 | | |
| | 969,000 | | | C | | JPMorgan Chase & Co., 7.900%,
due 04/29/49 | | | 808,171 | | |
| | 344,000 | | | | | JPMorgan Chase Bank NA,
5.875%, due 06/13/16 | | | 343,700 | | |
| | 620,000 | | | @@,C | | Lloyds TSB Bank PLC, 2.141%,
due 11/29/49 | | | 332,220 | | |
| | 770,000 | | | @@,C | | Lloyds TSB Bank PLC, 2.375%,
due 11/29/49 | | | 393,702 | | |
| | 1,030,000 | | | @@,C,L | | Lloyds TSB Bank PLC, 3.218%,
due 08/29/49 | | | 551,742 | | |
| | 140,000 | | | @@,C | | Mizuho Financial Group
Cayman Ltd., 8.375%,
due 01/29/49 | | | 133,970 | | |
| | 249,000 | | | | | Morgan Stanley, 6.000%,
due 04/28/15 | | | 215,090 | | |
| | 732,000 | | | C | | Morgan Stanley, 6.750%,
due 04/15/11 | | | 720,606 | | |
| | 1,485,000 | | | C | | National City Preferred
Capital Trust I, 12.000%,
due 12/29/49 | | | 1,388,413 | | |
| | 130,000 | | | @@,C | | National Westminster Bank PLC,
2.438%, due 11/29/49 | | | 66,950 | | |
| | 60,000 | | | @@,C | | National Westminster Bank PLC,
3.313%, due 08/29/49 | | | 30,697 | | |
| | 500,000 | | | #,C | | PNC Preferred Funding Trust I,
8.700%, due 02/19/49 | | | 370,382 | | |
| | 487,000 | | | #,C | | Rabobank Capital Funding II,
5.260%, due 12/29/49 | | | 257,883 | | |
| | 538,000 | | | C | | RBS Capital Trust I, 5.512%,
due 09/30/49 | | | 215,281 | | |
| | 1,580,000 | | | @@,C | | Royal Bank of Scotland
Group PLC, 2.063%,
due 12/29/49 | | | 1,002,908 | | |
| | 370,000 | | | @@,C | | Societe Generale, 2.625%,
due 11/29/49 | | | 224,492 | | |
| | 38,000 | | | C | | State Street Capital Trust III,
8.250%, due 12/29/49 | | | 29,381 | | |
| | 324,000 | | | C | | SunTrust Preferred Capital I,
5.853%, due 12/31/49 | | | 175,061 | | |
| | 541,000 | | | | | Wachovia Bank NA, 6.600%,
due 01/15/38 | | | 588,914 | | |
| | 481,000 | | | | | Wachovia Corp., 7.980%,
due 02/08/49 | | | 411,103 | | |
| | 280,000 | | | @@,C | | Westpac Banking Corp.,
4.056%, due 09/30/49 | | | 146,684 | | |
| | 372,000 | | | @@,#,C | | Westpac Capital Trust IV,
5.256%, due 12/29/49 | | | 189,500 | | |
| | | | 16,983,425 | | |
See Accompanying Notes to Financial Statements
63
PORTFOLIO OF INVESTMENTS
ING VP BALANCED PORTFOLIO AS OF DECEMBER 31, 2008 (CONTINUED)
Principal
Amount | | | | | | Value | |
| | | | | Chemicals: 0.2% | |
| $ | 570,000 | | | Z | | Stauffer Chemical, 10.490%,
due 04/15/17 | | $ | 302,832 | | |
| | 450,000 | | | Z | | Stauffer Chemical, 10.950%,
due 04/15/18 | | | 221,486 | | |
| | 260,000 | | | Z | | Stauffer Chemical, 16.970%,
due 04/15/10 | | | 212,486 | | |
| | 373,000 | | | | | Union Carbide Corp., 7.750%,
due 10/01/96 | | | 220,135 | | |
| | | | 956,939 | | |
| | | | | Computers: 0.3% | |
| | 736,000 | | | C | | International Business
Machines Corp., 7.625%,
due 10/15/18 | | | 884,187 | | |
| | 270,000 | | | C | | International Business
Machines Corp., 8.000%,
due 10/15/38 | | | 360,646 | | |
| | 453,000 | | | C | | Lexmark International, Inc.,
5.900%, due 06/01/13 | | | 357,436 | | |
| | 290,000 | | | C | | Lexmark International, Inc.,
6.650%, due 06/01/18 | | | 228,861 | | |
| | | | 1,831,130 | | |
| | | | | Diversified Financial Services: 1.5% | |
| | 2,095,000 | | | @@,#,C,S | | Aiful Corp., 4.450%,
due 02/16/10 | | | 1,284,545 | | |
| | 435,000 | | | | | American Express Co., 7.000%,
due 03/19/18 | | | 440,588 | | |
| | 349,000 | | | | | American Express Co., 8.150%,
due 03/19/38 | | | 401,424 | | |
| | 485,000 | | | @@,C | | BNP Paribas, 1.625%,
due 12/31/49 | | | 272,870 | | |
| | 241,000 | | | #,C | | Corestates Capital Trust I,
8.000%, due 12/15/26 | | | 198,362 | | |
| | 495,000 | | | | | Countrywide Financial Corp.,
5.800%, due 06/07/12 | | | 482,821 | | |
| | 420,000 | | | @@,C | | Financiere CSFB NV, 2.813%,
due 03/29/49 | | | 275,100 | | |
| | 428,000 | | | C | | Fund American Cos., Inc.,
5.875%, due 05/15/13 | | | 311,771 | | |
| | 730,000 | | | | | General Electric Capital Corp.,
5.875%, due 01/14/38 | | | 717,021 | | |
| | 562,000 | | | #,C | | HVB Funding Trust III, 9.000%,
due 10/22/31 | | | 162,679 | | |
| | 1,131,000 | | | @@,#,S | | Mantis Reef Ltd., 4.799%,
due 11/03/09 | | | 1,131,471 | | |
| | 750,000 | | | C | | National Rural Utilities
Cooperative Finance Corp.,
10.375%, due 11/01/18 | | | 879,215 | | |
| | 1,424,364 | | | #,C | | Piper Jaffray Equipment
Trust Securities, 6.000%,
due 09/10/11 | | | 1,011,299 | | |
| | 1,172,515 | | | #,C | | Piper Jaffray Equipment
Trust Securities, 6.750%,
due 04/01/11 | | | 832,486 | | |
| | 73,052 | | | # | | Power Receivable Finance, LLC,
6.290%, due 01/01/12 | | | 71,608 | | |
| | 4,767,391 | | | #,Z | | Toll Road Investors
Partnership II LP, 20.460%,
due 02/15/45 | | | 561,012 | | |
| | 530,000 | | | #,C | | Twin Reefs Pass-through Trust,
1.406%, due 12/10/49 | | | 5,963 | | |
| | | | 9,040,235 | | |
Principal
Amount | | | | | | Value | |
| | | | | Electric: 0.8% | |
| $ | 1,298,000 | | | C | | Commonwealth Edison Co.,
6.950%, due 07/15/18 | | $ | 1,231,000 | | |
| | 391,000 | | | C | | DTE Energy Co., 7.050%,
due 06/01/11 | | | 386,972 | | |
| | 359,856 | | | #,C | | Juniper Generation, LLC,
6.790%, due 12/31/14 | | | 389,776 | | |
| | 283,000 | | | C | | Nevada Power Co., 6.750%,
due 07/01/37 | | | 253,938 | | |
| | 1,214,000 | | | C | | NorthWestern Corp., 5.875%,
due 11/01/14 | | | 1,120,838 | | |
| | 419,000 | | | #,C | | Oncor Electric Delivery Co.,
6.800%, due 09/01/18 | | | 402,514 | | |
| | 568,000 | | | #,C | | Oncor Electric Delivery Co.,
7.500%, due 09/01/38 | | | 541,297 | | |
| | 473,000 | | | C | | Sierra Pacific Power Co.,
6.250%, due 04/15/12 | | | 451,242 | | |
| | 479,000 | | | # | | White Pine Hydro
Portfolio, LLC, 7.260%,
due 07/20/15 | | | 439,879 | | |
| | | | 5,217,456 | | |
| | | | | Energy-Alternate Sources: 0.1% | |
| | 700,000 | | | | | Greater Ohio Ethanol, LLC,
2.630%, due 12/31/13 | | | — | | |
| | 600,000 | | | | | Greater Ohio Ethanol, LLC,
6.301%, due 12/31/13 | | | — | | |
| | 467,000 | | | # | | White Pine Hydro, LLC, 6.310%,
due 07/10/17 | | | 426,872 | | |
| | 319,000 | | | # | | White Pine Hydro, LLC, 6.960%,
due 07/10/37 | | | 305,254 | | |
| | | | 732,126 | | |
| | | | | Food: 0.3% | |
| | 631,000 | | | | | Kraft Foods, Inc., 6.125%,
due 02/01/18 | | | 619,375 | | |
| | 138,000 | | | | | Kraft Foods, Inc., 6.500%,
due 08/11/17 | | | 138,936 | | |
| | 130,000 | | | | | Kraft Foods, Inc., 6.875%,
due 02/01/38 | | | 130,317 | | |
| | 485,000 | | | | | Kraft Foods, Inc., 7.000%,
due 08/11/37 | | | 493,721 | | |
| | 205,000 | | | C | | Safeway, Inc., 6.250%,
due 03/15/14 | | | 206,289 | | |
| | | | 1,588,638 | | |
| | | | | Forest Products & Paper: 0.1% | |
| | 111,000 | | | C | | International Paper Co.,
7.400%, due 06/15/14 | | | 91,084 | | |
| | 654,000 | | | C | | International Paper Co.,
7.950%, due 06/15/18 | | | 517,684 | | |
| | | | 608,768 | | |
| | | | | Gas: 0.1% | |
| | 1,026,000 | | | C,S | | Southern Union Co., 7.200%,
due 11/01/66 | | | 359,100 | | |
| | | | 359,100 | | |
| | | | | Insurance: 0.5% | |
| | 1,355,000 | | | @@,C | | Aegon NV, 4.567%,
due 12/31/49 | | | 372,625 | | |
| | 785,000 | | | | | American International
Group, Inc., 5.850%,
due 01/16/18 | | | 526,999 | | |
See Accompanying Notes to Financial Statements
64
PORTFOLIO OF INVESTMENTS
ING VP BALANCED PORTFOLIO AS OF DECEMBER 31, 2008 (CONTINUED)
Principal
Amount | | | | | | Value | |
| | | | | Insurance (continued) | |
| $ | 586,000 | | | #,C | | Metlife Capital Trust IV,
7.875%, due 12/15/37 | | $ | 368,366 | | |
| | 287,000 | | | C | | Metlife, Inc., 6.375%,
due 06/15/34 | | | 238,253 | | |
| | 368,000 | | | #,C | | Nationwide Mutual Insurance,
5.810%, due 12/15/24 | | | 159,313 | | |
| | 194,000 | | | | | Prudential Financial, Inc.,
5.700%, due 12/14/36 | | | 121,230 | | |
| | 387,000 | | | | | Prudential Financial, Inc.,
6.000%, due 12/01/17 | | | 310,953 | | |
| | 693,000 | | | | | Prudential Financial, Inc.,
6.625%, due 12/01/37 | | | 473,668 | | |
| | 761,000 | | | @@,#,C | | White Mountains Re
Group Ltd., 7.506%,
due 05/29/49 | | | 304,400 | | |
| | 244,000 | | | @@,C | | XL Capital, Ltd., 6.500%,
due 12/15/49 | | | 56,170 | | |
| | | | 2,931,977 | | |
| | | | | Media: 0.7% | |
| | 145,000 | | | C | | Comcast Corp., 5.900%,
due 03/15/16 | | | 138,647 | | |
| | 1,276,000 | | | C | | Comcast Corp., 6.300%,
due 11/15/17 | | | 1,244,252 | | |
| | 76,000 | | | C | | Comcast Corp., 6.950%,
due 08/15/37 | | | 80,287 | | |
| | 1,436,000 | | | #,C,S | | COX Communications, Inc.,
6.250%, due 06/01/18 | | | 1,276,759 | | |
| | 276,000 | | | #,C | | COX Communications, Inc.,
6.950%, due 06/01/38 | | | 250,381 | | |
| | 395,000 | | | C | | News America, Inc., 6.650%,
due 11/15/37 | | | 392,199 | | |
| | 1,013,000 | | | C | | Time Warner, Inc., 5.500%,
due 11/15/11 | | | 952,443 | | |
| | 75,000 | | | C | | Time Warner, Inc., 7.700%,
due 05/01/32 | | | 75,295 | | |
| | | | 4,410,263 | | |
| | | | | Miscellaneous Manufacturing: 0.1% | |
| | 521,000 | | | | | General Electric Co., 5.250%,
due 12/06/17 | | | 520,325 | | |
| | | | 520,325 | | |
| | | | | Pipelines: 0.4% | |
| | 740,000 | | | C | | Enbridge Energy Partners,
9.875%, due 03/01/19 | | | 745,930 | | |
| | 524,000 | | | C | | Energy Transfer Partners,
9.700%, due 03/15/19 | | | 540,807 | | |
| | 345,000 | | | C | | Northwest Pipeline Corp.,
7.000%, due 06/15/16 | | | 312,892 | | |
| | 536,000 | | | C | | Panhandle Eastern Pipe Line,
6.200%, due 11/01/17 | | | 412,472 | | |
| | 460,000 | | | C | | Transcontinental Gas
Pipe Line Corp., 6.400%,
due 04/15/16 | | | 420,514 | | |
| | | | 2,432,615 | | |
| | | | | Real Estate: 0.1% | |
| | 162,000 | | | C | | Liberty Property LP, 6.375%,
due 08/15/12 | | | 124,342 | | |
| | 532,000 | | | C | | Liberty Property LP, 7.750%,
due 04/15/09 | | | 525,724 | | |
| | | | 650,066 | | |
Principal
Amount | | | | | | Value | |
| | | | | Retail: 0.2% | |
| $ | 184,000 | | | C | | CVS Caremark Corp., 5.750%,
due 06/01/17 | | $ | 173,512 | | |
| | 459,682 | | | #,C | | CVS Lease Pass-through,
6.036%, due 12/10/28 | | | 280,232 | | |
| | 414,000 | | | C | | Darden Restaurants, Inc.,
5.625%, due 10/15/12 | | | 358,014 | | |
| | 924,000 | | | C | | Darden Restaurants, Inc.,
6.200%, due 10/15/17 | | | 686,842 | | |
| | | | 1,498,600 | | |
| | | | | Software: 0.1% | |
| | 304,000 | | | C | | Oracle Corp., 5.250%,
due 01/15/16 | | | 309,957 | | |
| | 231,000 | | | C | | Oracle Corp., 5.750%,
due 04/15/18 | | | 242,053 | | |
| | | | 552,010 | | |
| | | | | Telecommunications: 0.7% | |
| | 471,000 | | | | | Bellsouth
Telecommunications, Inc.,
7.000%, due 12/01/95 | | | 369,946 | | |
| | 136,000 | | | @@,C | | British Telecommunications PLC,
5.150%, due 01/15/13 | | | 129,669 | | |
| | 227,000 | | | @@,C,S | | British Telecommunications PLC,
5.950%, due 01/15/18 | | | 197,813 | | |
| | 270,000 | | | @@,C | | Deutsche Telekom
International Finance BV,
6.750%, due 08/20/18 | | | 274,264 | | |
| | 44,000 | | | C | | Embarq Corp., 6.738%,
due 06/01/13 | | | 37,214 | | |
| | 69,000 | | | C | | Embarq Corp., 7.995%,
due 06/01/36 | | | 46,672 | | |
| | 882,000 | | | C | | Sprint Capital Corp., 6.875%,
due 11/15/28 | | | 525,855 | | |
| | 745,000 | | | @@,C | | Telefonica Emisones SAU,
6.421%, due 06/20/16 | | | 744,795 | | |
| | 1,250,000 | | | C | | Verizon Communications, Inc.,
8.950%, due 03/01/39 | | | 1,619,600 | | |
| | 370,000 | | | @@,C | | Vodafone Group PLC, 5.750%,
due 03/15/16 | | | 353,707 | | |
| | | | 4,299,535 | | |
| | | | | Transportation: 0.5% | |
| | 95,000 | | | C | | Burlington Northern Santa Fe
Corp., 5.750%, due 03/15/18 | | | 91,739 | | |
| | 122,000 | | | C | | Burlington Northern Santa Fe
Corp., 6.150%, due 05/01/37 | | | 112,724 | | |
| | 137,000 | | | C | | Burlington Northern Santa Fe
Corp., 6.200%, due 08/15/36 | | | 126,728 | | |
| | 488,000 | | | C | | CSX Corp., 6.250%, due 04/01/15 | | | 479,635 | | |
| | 420,000 | | | C | | CSX Corp., 6.250%, due 03/15/18 | | | 386,960 | | |
| | 556,000 | | | C | | CSX Corp., 7.450%, due 04/01/38 | | | 530,247 | | |
| | 76,000 | | | C | | Norfolk Southern Corp.,
5.750%, due 04/01/18 | | | 74,082 | | |
| | 78,000 | | | C | | Norfolk Southern Corp.,
7.050%, due 05/01/37 | | | 81,822 | | |
| | 600,000 | | | C | | Union Pacific Corp., 5.700%,
due 08/15/18 | | | 578,690 | | |
| | 157,000 | | | C | | Union Pacific Corp., 6.625%,
due 02/01/29 | | | 149,037 | | |
| | 499,000 | | | C | | Union Pacific Corp., 7.875%,
due 01/15/19 | | | 571,086 | | |
| | | | 3,182,750 | | |
Total Corporate Bonds/Notes
(Cost $74,864,059) | | | 59,705,373 | | |
See Accompanying Notes to Financial Statements
65
PORTFOLIO OF INVESTMENTS
ING VP BALANCED PORTFOLIO AS OF DECEMBER 31, 2008 (CONTINUED)
Principal
Amount | | | | | | Value | |
| U.S. GOVERNMENT AGENCY OBLIGATIONS: 12.9% | | | |
| | | | | Federal Home Loan Mortgage
Corporation##: 7.1% | | | | | | | |
| $ | 2,094,000 | | | C,S | | 4.500%, due 02/15/20 | | $ | 2,074,606 | | |
| | 9,796,722 | | | C,S | | 5.000%, due 08/15/16-04/15/32 | | | 9,961,507 | | |
| | 321,831 | | | S | | 5.015%, due 04/01/35 | | | 327,590 | | |
| | 1,958,000 | | | C,S | | 5.500%, due 12/15/20-07/15/33 | | | 2,002,093 | | |
| | 22,007,000 | | | W | | 5.500%, due 02/12/37 | | | 22,457,461 | | |
| | 5,989,463 | | | C,S | | 6.000%, due 01/15/29 | | | 6,200,835 | | |
| | 280,352 | | | S | | 6.500%, due 11/01/28-12/01/31 | | | 293,503 | | |
| | | | 43,317,595 | | |
| | | | | Federal National Mortgage
Association##: 5.4% | | | | | | | |
| | 39,634 | | | S | | 0.821%, due 08/25/33 | | | 38,305 | | |
| | 984,539 | | | S | | 5.000%, due 02/25/29 | | | 998,182 | | |
| | 12,481,000 | | | W | | 5.000%, due 01/12/36 | | | 12,744,274 | | |
| | 1,876,000 | | | S | | 5.500%, due 05/25/30 | | | 1,922,252 | | |
| | 7,000,000 | | | | | 6.000%, due 02/12/37 | | �� | 7,184,842 | | |
| | 7,627,181 | | | S | | 6.000%, due 06/01/16-01/01/38 | | | 7,914,833 | | |
| | 1,210,785 | | | S | | 7.000%, due 06/01/29-07/01/32 | | | 1,281,345 | | |
| | 515,983 | | | C,S | | 7.500%, due 01/25/48 | | | 535,966 | | |
| | 185,866 | | | S | | 7.500%, due 11/01/29-11/01/30 | | | 196,840 | | |
| | | | 32,816,839 | | |
| | | | | Government National
Mortgage Association: 0.4% | | | | | | | |
| | 18,727 | | | S | | 5.125%, due 12/20/29 | | | 18,424 | | |
| | 70,775 | | | S | | 5.375%, due 04/20/28 | | | 70,684 | | |
| | 110,941 | | | S | | 6.500%, due 10/15/31 | | | 116,625 | | |
| | 1,046,924 | | | S | | 7.000%, due 09/15/24-11/15/24 | | | 1,111,373 | | |
| | 932,215 | | | S | | 7.500%, due 12/15/23 | | | 988,156 | | |
| | | | 2,305,262 | | |
Total U.S. Government
Agency Obligations
(Cost $77,809,876) | | | 78,439,696 | | |
| U.S. TREASURY OBLIGATIONS: 4.7% | | | |
| | | | | U.S. Treasury Bonds: 1.2% | |
| | 4,895,000 | | | L | | 4.375%, due 02/15/38 | | | 6,557,773 | | |
| | 493,000 | | | L | | 4.500%, due 05/15/38 | | | 673,022 | | |
| | | | 7,230,795 | | |
| | | | | U.S. Treasury Notes: 2.6% | |
| | 11,316,000 | | | L | | 1.250%, due 11/30/10 | | | 11,441,076 | | |
| | 4,065,000 | | | L | | 2.000%, due 11/30/13 | | | 4,171,710 | | |
| | | | 15,612,786 | | |
| | | | | Treasury Inflation Indexed
Protected Securitiesip: 0.9% | | | | | | | |
| | 3,597,510 | | | | | 1.375%, due 07/15/18 | | | 3,351,129 | | |
| | 2,566,314 | | | | | 2.375%, due 04/15/11 | | | 2,507,171 | | |
| | | | 5,858,300 | | |
Total U.S. Treasury Obligations
(Cost $28,063,799) | | | 28,701,881 | | |
| ASSET-BACKED SECURITIES: 1.2% | | | |
| | | | | Credit Card Asset-Backed
Securities: 0.1% | | | | | | | |
| | 553,000 | | | C,S | | Citibank Credit Card
Issuance Trust, 5.650%,
due 09/20/19 | | | 446,375 | | |
| | | | 446,375 | | |
Principal
Amount | | | | | | Value | |
| | | | | Home Equity Asset-Backed
Securities: 0.4% | | | | | | | |
| $ | 2,324,208 | | | C,S | | GSAA Trust, 5.242%,
due 06/25/34 | | $ | 2,223,940 | | |
| | 428,000 | | | #,C,S | | Irwin Home Equity, 5.960%,
due 08/25/37 | | | 198,883 | | |
| | 153,045 | | | C,S | | Merrill Lynch Mortgage
Investors Trust, 0.831%,
due 07/25/34 | | | 108,668 | | |
| | 211 | | | C,S | | Renaissance Home Equity
Loan Trust, 4.456%,
due 05/25/35 | | | 204 | | |
| | 428,000 | | | C,S | | Residential Funding Mortgage
Securities II, Inc., 5.890%,
due 05/25/37 | | | 313,060 | | |
| | | | 2,844,755 | | |
| | | | | Other Asset-Backed Securities: 0.7% | |
| | 112,798 | | | C,S | | Amortizing Residential
Collateral Trust, 0.721%,
due 05/25/32 | | | 58,549 | | |
| | 83,842 | | | C,S | | Chase Funding Mortgage Loan
Asset-Backed Certificates,
0.771%, due 07/25/33 | | | 72,546 | | |
| | 1,327 | | | C,S | | Chase Funding Mortgage Loan
Asset-Backed Certificates,
4.045%, due 05/25/33 | | | 1,282 | | |
| | 96,848 | | | C,S | | CNH Equipment Trust, 1.235%,
due 06/15/12 | | | 94,246 | | |
| | 104,000 | | | C,S | | Countrywide Asset-Backed
Certificates, 5.689%,
due 10/25/46 | | | 59,006 | | |
| | 845,658 | | | C,S | | Credit-Based Asset Servicing
and Securitization, LLC,
4.831%, due 08/25/35 | | | 753,059 | | |
| | 1,114,298 | | | C,S | | Credit-Based Asset Servicing
and Securitization, LLC,
5.501%, due 12/25/36 | | | 926,474 | | |
| | 459,000 | | | #,C,S | | Credit-Based Asset Servicing
and Securitization, LLC,
5.746%, due 12/25/37 | | | 357,518 | | |
| | 241,000 | | | #,C,S | | Credit-Based Asset Servicing
and Securitization, LLC,
6.020%, due 12/25/37 | | | 142,303 | | |
| | 576,211 | | | C,S | | Equity One, Inc., 5.050%,
due 09/25/33 | | | 437,455 | | |
| | 117,213 | | | C,S | | Fannie Mae, 0.611%,
due 04/25/35 | | | 106,599 | | |
| | 471,250 | | | @@,#,C,S | | Franklin CLO Ltd., 2.075%,
due 09/20/15 | | | 422,758 | | |
| | 927,000 | | | #,C,S,I | | Hudson Mezzanine Funding,
2.189%, due 06/12/42 | | | 464 | | |
| | 191,948 | | | @@,#,C,S | | Liberty Square CDO Ltd.,
4.846%, due 04/15/13 | | | 149,000 | | |
| | 350,782 | | | C,S | | Merrill Lynch Mortgage
Investors Trust, 5.609%,
due 03/25/37 | | | 244,940 | | |
| | 2,249 | | | C,S | | Popular Mortgage
Pass-through Trust, 4.000%,
due 12/25/34 | | | 2,173 | | |
| | 21,384 | | | C,S | | Residential Asset Mortgage
Products, Inc., 1.091%,
due 06/25/33 | | | 17,461 | | |
See Accompanying Notes to Financial Statements
66
PORTFOLIO OF INVESTMENTS
ING VP BALANCED PORTFOLIO AS OF DECEMBER 31, 2008 (CONTINUED)
Principal
Amount | | | | | | Value | |
| | | | | Other Asset-Backed
Securities (continued) | | | | | | | |
| $ | 408,966 | | | C,S | | Structured Asset
Securities Corp.,
4.910%, due 06/25/33 | | $ | 303,903 | | |
| | | | 4,149,736 | | |
Total Asset-Backed Securities
(Cost $9,946,698) | | | 7,440,866 | | |
| COLLATERALIZED MORTGAGE OBLIGATIONS: 9.8% | | | |
| | 767,314 | | | C,S | | American Home Mortgage
Assets, 3.176%, due 11/25/46 | | | 261,111 | | |
| | 1,411,294 | | | C,S | | American Home Mortgage
Investment Trust, 0.851%,
due 11/25/45 | | | 360,120 | | |
| | 151,652 | | | C,S | | Banc of America Alternative
Loan Trust, 6.475%,
due 04/25/37 | | | 74,278 | | |
| | 19,866,357 | | | C,S,^ | | Banc of America Commercial
Mortgage, Inc., 0.291%,
due 01/15/49 | | | 221,550 | | |
| | 97,396 | | | C,S | | Banc of America Commercial
Mortgage, Inc., 4.161%,
due 12/10/42 | | | 94,306 | | |
| | 60,000 | | | C,S | | Banc of America Commercial
Mortgage, Inc., 4.429%,
due 11/10/39 | | | 55,521 | | |
| | 10,000 | | | C,S | | Banc of America Commercial
Mortgage, Inc., 4.502%,
due 07/10/42 | | | 9,204 | | |
| | 5,016 | | | C,S | | Banc of America Commercial
Mortgage, Inc., 4.772%,
due 07/11/43 | | | 4,827 | | |
| | 8,748 | | | C,S | | Banc of America Commercial
Mortgage, Inc., 4.877%,
due 11/10/42 | | | 8,215 | | |
| | 10,000 | | | C,S | | Banc of America Commercial
Mortgage, Inc., 4.891%,
due 07/10/45 | | | 8,268 | | |
| | 516,000 | | | C,S | | Banc of America Commercial
Mortgage, Inc., 5.463%,
due 09/10/47 | | | 109,049 | | |
| | 160,000 | | | C,S | | Banc of America Commercial
Mortgage, Inc., 6.186%,
due 06/11/35 | | | 153,474 | | |
| | 1,490,806 | | | C,S | | Banc of America Funding Corp.,
5.257%, due 09/20/35 | | | 823,663 | | |
| | 2,896,327 | | | C,S | | Banc of America Funding Corp.,
5.650%, due 06/20/37 | | | 1,988,107 | | |
| | 2,172,291 | | | C,S | | Banc of America Funding Corp.,
5.750%, due 09/20/34 | | | 1,658,283 | | |
| | 428,742 | | | C,S | | Banc of America Funding Corp.,
7.000%, due 10/25/37 | | | 234,146 | | |
| | 904,009 | | | C,S | | Banc of America Mortgage
Securities, Inc., 5.172%,
due 09/25/35 | | | 674,487 | | |
| | 646,506 | | | C,S | | Banc of America Mortgage
Securities, Inc., 5.250%,
due 11/25/19 | | | 589,237 | | |
| | 759,464 | | | C,S | | Banc of America Mortgage
Securities, Inc., 5.500%,
due 11/25/33 | | | 669,939 | | |
Principal
Amount | | | | | | Value | |
| $ | 1,334,004 | | | C,S | | Banc of America Mortgage
Securities, Inc., 5.500%,
due 06/25/35 | | $ | 1,083,092 | | |
| | 205,038 | | | C,S | | Bear Stearns Alternative-A
Trust, 0.791%, due 07/25/34 | | | 108,791 | | |
| | 392,000 | | | #,C,S | | Bear Stearns Commercial
Mortgage Securities, 5.660%,
due 09/11/41 | | | 86,230 | | |
| | 1,782,830 | | | C,S | | Chase Manhattan Bank-First
Union National Bank,
7.439%, due 08/15/31 | | | 1,779,014 | | |
| | 2,068,475 | | | C,S | | Chase Mortgage Finance Corp.,
5.408%, due 12/25/35 | | | 1,453,916 | | |
| | 1,135,976 | | | C,S | | Chase Mortgage Finance Corp.,
5.500%, due 11/25/35 | | | 961,347 | | |
| | 736,643 | | | C,S | | Citicorp Mortgage
Securities, Inc., 5.500%,
due 02/25/22 | | | 575,839 | | |
| | 157,590 | | | C,S | | Citigroup Mortgage
Loan Trust, Inc., 5.937%,
due 06/25/36 | | | 101,628 | | |
| | 2,140,015 | | | C,S | | Citigroup Mortgage
Loan Trust, Inc., 6.000%,
due 11/25/35 | | | 1,339,454 | | |
| | 371,000 | | | C,S | | Citigroup/Deutsche Bank
Commercial Mortgage Trust,
5.322%, due 12/11/49 | | | 260,149 | | |
| | 371,000 | | | C,S | | Citigroup/Deutsche Bank
Commercial Mortgage Trust,
5.886%, due 11/15/44 | | | 280,928 | | |
| | 444,000 | | | C,S | | Commercial Mortgage
Pass-through Certificates,
4.221%, due 03/10/39 | | | 421,557 | | |
| | 17,972 | | | C,S | | Countrywide Alternative
Loan Trust, 0.771%,
due 02/25/35 | | | 17,642 | | |
| | 627,172 | | | C,S | | Countrywide Alternative
Loan Trust, 3.136%,
due 11/25/46 | | | 154,920 | | |
| | 23,502 | | | C,S | | Countrywide Alternative
Loan Trust, 5.403%,
due 10/25/35 | | | 14,267 | | |
| | 1,672,652 | | | C, S | | Countrywide Alternative
Loan Trust, 5.500%,
due 02/25/25 | | | 1,132,329 | | |
| | 316,619 | | | C,S | | Countrywide Home Loan
Mortgage Pass-through Trust,
0.791%, due 04/25/35 | | | 69,718 | | |
| | 548,211 | | | C,S | | Countrywide Home Loan
Mortgage Pass-through Trust,
5.250%, due 10/25/35 | | | 361,269 | | |
| | 465,243 | | | C,S | | Credit Suisse First Boston
Mortgage Securities Corp.,
3.727%, due 03/15/35 | | | 426,020 | | |
| | 10,000 | | | C,S | | Credit Suisse First Boston
Mortgage Securities Corp.,
4.801%, due 03/15/36 | | | 8,897 | | |
| | 8,000 | | | C,S | | Credit Suisse First Boston
Mortgage Securities Corp.,
7.695%, due 04/15/62 | | | 8,045 | | |
| | 1,157,405 | | | C,S | | Credit Suisse Mortgage
Capital Certificates, 7.000%,
due 08/25/36 | | | 548,302 | | |
See Accompanying Notes to Financial Statements
67
PORTFOLIO OF INVESTMENTS
ING VP BALANCED PORTFOLIO AS OF DECEMBER 31, 2008 (CONTINUED)
Principal
Amount | | | | | | Value | |
| COLLATERALIZED MORTGAGE OBLIGATIONS (continued) | | | |
| $ | 64,689 | | | C,S | | DLJ Commercial
Mortgage Corp., 7.300%,
due 06/10/32 | | $ | 64,551 | | |
| | 829,258 | | | C,S | | First Horizon Alternative
Mortgage Securities, 5.500%,
due 08/25/35 | | | 561,295 | | |
| | 545,035 | | | C,S | | First Horizon Mortgage
Pass-through Trust, 5.395%,
due 10/25/35 | | | 408,594 | | |
| | 682,431 | | | C,S | | First Horizon Mortgage
Pass-through Trust, 5.500%,
due 12/25/35 | | | 507,190 | | |
| | 1,472,209 | | | C,S | | First Union National Bank
Commercial Mortgage,
6.663%, due 01/12/43 | | | 1,448,705 | | |
| | 18,203,183 | | | C,S,^ | | GE Capital Commercial
Mortgage Corp., 0.502%,
due 06/10/48 | | | 179,136 | | |
| | 1,000 | | | C,S | | GE Capital Commercial
Mortgage Corp., 4.865%,
due 07/10/39 | | | 926 | | |
| | 160,918 | | | C,S | | GE Capital Commercial
Mortgage Corp., 5.560%,
due 06/10/38 | | | 157,045 | | |
| | 1,360,037 | | | C,S | | GMAC Mortgage Corp.
Loan Trust, 4.583%,
due 10/19/33 | | | 1,056,472 | | |
| | 1,561,938 | | | C,S | | GMAC Mortgage Corp.
Loan Trust, 5.264%,
due 03/18/35 | | | 1,375,346 | | |
| | 161,160 | | | C,S | | GMAC Mortgage Corp.
Loan Trust, 5.467%,
due 11/19/35 | | | 103,017 | | |
| | 15,673,304 | | | #,C,S,^ | | Greenwich Capital Commercial
Funding Corp., 0.323%,
due 03/10/39 | | | 182,610 | | |
| | 870,000 | | | C,S | | Greenwich Capital Commercial
Funding Corp., 5.117%,
due 04/10/37 | | | 790,984 | | |
| | 474,000 | | | C,S | | Greenwich Capital Commercial
Funding Corp., 5.534%,
due 03/10/39 | | | 85,948 | | |
| | 240,000 | | | C,S | | Greenwich Capital Commercial
Funding Corp., 5.554%,
due 03/10/39 | | | 42,963 | | |
| | 192,000 | | | C,S | | Greenwich Capital Commercial
Funding Corp., 5.613%,
due 03/10/39 | | | 28,786 | | |
| | 684,000 | | | C,S | | GS Mortgage Securities Corp. II,
5.628%, due 04/10/38 | | | 133,189 | | |
| | 810,615 | | | #,C,S | | GSMPS Mortgage Loan Trust,
0.821%, due 01/25/35 | | | 645,594 | | |
| | 722,722 | | | #,C,S | | GSMPS Mortgage Loan Trust,
0.871%, due 04/25/36 | | | 601,802 | | |
| | 395,704 | | | C,S | | GSR Mortgage Loan Trust,
5.500%, due 07/25/35 | | | 324,926 | | |
| | 704,153 | | | C,S | | GSR Mortgage Loan Trust,
6.500%, due 10/25/36 | | | 550,413 | | |
| | 203,320 | | | C,S | | Harborview Mortgage
Loan Trust, 0.931%,
due 01/19/35 | | | 102,961 | | |
| | 284,200 | | | C,S | | Homebanc Mortgage Trust,
1.331%, due 08/25/29 | | | 177,785 | | |
Principal
Amount | | | | | | Value | |
| $ | 214,517 | | | C,S | | JPMorgan Alternative
Loan Trust, 5.505%,
due 01/25/36 | | $ | 125,077 | | |
| | 53,578,085 | | | C,S,^ | | JPMorgan Chase Commercial
Mortgage Securities Corp.,
0.038%, due 01/12/43 | | | 42,434 | | |
| | 15,000 | | | C,S | | JPMorgan Chase Commercial
Mortgage Securities Corp.,
4.223%, due 01/15/42 | | | 14,511 | | |
| | 310,115 | | | C,S | | JPMorgan Chase Commercial
Mortgage Securities Corp.,
4.262%, due 08/12/40 | | | 303,744 | | |
| | 14,000 | | | C,S | | JPMorgan Chase Commercial
Mortgage Securities Corp.,
4.865%, due 03/15/46 | | | 11,478 | | |
| | 468,000 | | | C,S | | JPMorgan Chase Commercial
Mortgage Securities Corp.,
5.298%, due 05/15/47 | | | 380,968 | | |
| | 152,000 | | | C,S | | JPMorgan Chase Commercial
Mortgage Securities Corp.,
5.455%, due 05/15/47 | | | 45,508 | | |
| | 681,000 | | | C,S | | JPMorgan Chase Commercial
Mortgage Securities Corp.,
5.475%, due 04/15/43 | | | 531,760 | | |
| | 304,000 | | | C,S | | JPMorgan Chase Commercial
Mortgage Securities Corp.,
5.495%, due 05/15/47 | | | 77,365 | | |
| | 104,929 | | | C,S | | JPMorgan Chase Commercial
Mortgage Securities Corp.,
5.833%, due 04/15/45 | | | 101,885 | | |
| | 877,000 | | | C,S | | JPMorgan Chase Commercial
Mortgage Securities Corp.,
5.861%, due 04/15/45 | | | 751,977 | | |
| | 4,064,771 | | | C,S,^ | | LB-UBS Commercial
Mortgage Trust, 0.486%,
due 02/15/40 | | | 78,200 | | |
| | 601,050 | | | C,S | | LB-UBS Commercial
Mortgage Trust, 4.821%,
due 04/15/30 | | | 571,290 | | |
| | 231,000 | | | C,S | | LB-UBS Commercial
Mortgage Trust, 4.836%,
due 02/15/40 | | | 75,896 | | |
| | 250,000 | | | C,S | | LB-UBS Commercial
Mortgage Trust, 4.885%,
due 09/15/30 | | | 231,517 | | |
| | 10,000 | | | C,S | | LB-UBS Commercial
Mortgage Trust, 4.998%,
due 04/15/30 | | | 9,101 | | |
| | 340,000 | | | C,S | | LB-UBS Commercial
Mortgage Trust, 5.103%,
due 11/15/30 | | | 307,718 | | |
| | 620,000 | | | C,S | | LB-UBS Commercial
Mortgage Trust, 5.287%,
due 04/15/40 | | | 172,348 | | |
| | 415,000 | | | C,S | | LB-UBS Commercial
Mortgage Trust, 5.347%,
due 11/15/38 | | | 324,492 | | |
| | 329,000 | | | C,S | | LB-UBS Commercial
Mortgage Trust, 5.516%,
due 11/15/38 | | | 57,392 | | |
| | 246,000 | | | C,S | | LB-UBS Commercial
Mortgage Trust, 5.533%,
due 02/15/40 | | | 44,361 | | |
See Accompanying Notes to Financial Statements
68
PORTFOLIO OF INVESTMENTS
ING VP BALANCED PORTFOLIO AS OF DECEMBER 31, 2008 (CONTINUED)
Principal
Amount | | | | | | Value | |
| COLLATERALIZED MORTGAGE OBLIGATIONS (continued) | | | |
| $ | 491,000 | | | C,S | | LB-UBS Commercial
Mortgage Trust, 5.563%,
due 02/15/40 | | $ | 86,234 | | |
| | 1,581,000 | | | C,S | | LB-UBS Commercial
Mortgage Trust, 6.149%,
due 04/15/41 | | | 1,155,452 | | |
| | 3,104,410 | | | C,S | | LB-UBS Commercial
Mortgage Trust, 7.370%,
due 08/15/26 | | | 3,104,628 | | |
| | 611,454 | | | C,S | | Luminent Mortgage Trust,
0.671%, due 10/25/46 | | | 251,536 | | |
| | 522,000 | | | C,S | | MASTR Alternative Loans Trust,
6.250%, due 07/25/36 | | | 282,065 | | |
| | 21,651 | | | C,S | | MASTR Alternative Loans Trust,
6.500%, due 05/25/33 | | | 17,081 | | |
| | 242,930 | | | C,S | | MASTR Alternative Loans Trust,
8.500%, due 05/25/33 | | | 227,040 | | |
| | 11,991,074 | | | #,C,S,^ | | Merrill Lynch Mortgage Trust,
0.154%, due 11/12/35 | | | 39,839 | | |
| | 3,096,702 | | | C,S,^ | | Merrill Lynch/Countrywide
Commercial Mortgage Trust,
0.541%, due 08/12/48 | | | 61,971 | | |
| | 237,000 | | | C,S | | Merrill Lynch/Countrywide
Commercial Mortgage Trust,
5.479%, due 08/12/48 | | | 41,903 | | |
| | 264,000 | | | C,S | | Merrill Lynch/Countrywide
Commercial Mortgage Trust,
5.509%, due 08/12/48 | | | 45,454 | | |
| | 104,108 | | | C,S | | MLCC Mortgage Investors, Inc.,
0.791%, due 01/25/29 | | | 82,824 | | |
| | 160,000 | | | C,S | | Morgan Stanley Capital I,
5.007%, due 01/14/42 | | | 134,012 | | |
| | 114,927 | | | C,S | | MortgageIT Trust, 0.841%,
due 11/25/35 | | | 27,800 | | |
| | 788,000 | | | C,S | | New York Mortgage Trust, Inc.,
5.652%, due 05/25/36 | | | 511,268 | | |
| | 369,339 | | | C,S | | Prime Mortgage Trust, 0.971%,
due 02/25/35 | | | 209,772 | | |
| | 89,528 | | | C,S | | Prudential Commercial
Mortgage Trust, 3.669%,
due 02/11/36 | | | 85,321 | | |
| | 949,749 | | | C,S | | RAAC Series, 5.250%,
due 09/25/34 | | | 698,452 | | |
| | 404,449 | | | C,S | | Residential Accredit Loans, Inc.,
0.711%, due 04/25/46 | | | 85,303 | | |
| | 757,978 | | | C,S | | Residential Accredit Loans, Inc.,
5.000%, due 09/25/36 | | | 610,420 | | |
| | 114,709 | | | C,S | | Sequoia Mortgage Trust,
0.778%, due 01/20/35 | | | 60,611 | | |
| | 3,308 | | | C,S | | Structured Adjustable Rate
Mortgage Loan Trust,
0.781%, due 07/25/35 | | | 1,538 | | |
| | 190,848 | | | C,S | | Structured Asset Mortgage
Investments, Inc., 0.821%,
due 04/19/35 | | | 101,193 | | |
| | 1,790,000 | | | #,C,S | | Wachovia Bank Commercial
Mortgage Trust, 5.209%,
due 10/15/44 | | | 473,096 | | |
| | 70,000 | | | C,S | | Wachovia Bank Commercial
Mortgage Trust, 5.243%,
due 07/15/42 | | | 65,420 | | |
Principal
Amount | | | | | | Value | |
| $ | 319,340 | | | C,S | | Washington Mutual Mortgage
Pass-through Certificates,
0.781%, due 01/25/45 | | $ | 164,664 | | |
| | 116,142 | | | C,S | | Washington Mutual Mortgage
Pass-through Certificates,
0.791%, due 08/25/45 | | | 63,049 | | |
| | 51,963 | | | C,S | | Washington Mutual Mortgage
Pass-through Certificates,
1.858%, due 06/25/44 | | | 29,826 | | |
| | 1,793,221 | | | C,S | | Washington Mutual Mortgage
Pass-through Certificates,
2.996%, due 01/25/47 | | | 663,125 | | |
| | 1,005,606 | | | C,S | | Washington Mutual Mortgage
Pass-through Certificates,
3.066%, due 07/25/47 | | | 291,265 | | |
| | 958,032 | | | C,S | | Washington Mutual Mortgage
Pass-through Certificates,
3.176%, due 09/25/46 | | | 245,088 | | |
| | 64,509 | | | C,S | | Washington Mutual Mortgage
Pass-through Certificates,
3.226%, due 05/25/46 | | | 18,286 | | |
| | 271,314 | | | C,S | | Washington Mutual Mortgage
Pass-through Certificates,
3.226%, due 06/25/46 | | | 102,345 | | |
| | 758,000 | | | C,S | | Washington Mutual Mortgage
Pass-through Certificates,
3.792%, due 06/25/34 | | | 724,784 | | |
| | 241,328 | | | C,S | | Washington Mutual Mortgage
Pass-through Certificates,
5.000%, due 12/25/18 | | | 228,710 | | |
| | 1,134,206 | | | C,S | | Washington Mutual Mortgage
Pass-through Certificates 2A3,
5.489%, due 01/25/37 | | | 747,640 | | |
| | 119,826 | | | C,S | | Washington Mutual Mortgage
Pass-through Certificates 2A4,
5.489%, due 01/25/37 | | | 45,410 | | |
| | 2,182,329 | | | C,S | | Washington Mutual Mortgage
Pass-through Certificates,
5.658%, due 06/25/37 | | | 1,134,685 | | |
| | 167,393 | | | C,S | | Washington Mutual Mortgage
Pass-through Certificates,
5.814%, due 06/25/37 | | | 94,300 | | |
| | 922,754 | | | C,S | | Washington Mutual Mortgage
Pass-through Certificates,
5.859%, due 07/25/37 | | | 466,917 | | |
| | 1,338,666 | | | C,S | | Washington Mutual Mortgage
Pass-through Certificates,
5.869%, due 07/25/37 | | | 693,399 | | |
| | 352,636 | | | C,S | | Washington Mutual Mortgage
Pass-through Certificates,
5.895%, due 07/25/37 | | | 180,374 | | |
| | 1,417,355 | | | C,S | | Washington Mutual Mortgage
Pass-through Certificates,
6.000%, due 06/25/34 | | | 1,107,132 | | |
| | 1,445,000 | | | C,S | | Wells Fargo Mortgage-Backed
Securities Trust, 3.622%,
due 06/25/35 | | | 1,407,772 | | |
| | 2,180,496 | | | C,S | | Wells Fargo Mortgage-Backed
Securities Trust, 4.500%,
due 08/25/18 | | | 1,955,126 | | |
| | 617,000 | | | C,S | | Wells Fargo Mortgage-Backed
Securities Trust A5, 4.787%,
due 07/25/34 | | | 466,498 | | |
See Accompanying Notes to Financial Statements
69
PORTFOLIO OF INVESTMENTS
ING VP BALANCED PORTFOLIO AS OF DECEMBER 31, 2008 (CONTINUED)
Principal
Amount | | | | | | Value | |
| COLLATERALIZED MORTGAGE OBLIGATIONS (continued) | | | |
| $ | 628,000 | | | C,S | | Wells Fargo Mortgage-Backed
Securities Trust A6, 4.787%,
due 07/25/34 | | $ | 451,410 | | |
| | 657,506 | | | C,S | | Wells Fargo Mortgage-Backed
Securities Trust, 4.888%,
due 08/25/34 | | | 477,830 | | |
| | 1,598,487 | | | C,S | | Wells Fargo Mortgage-Backed
Securities Trust, 5.113%,
due 03/25/36 | | | 1,199,954 | | |
| | 2,201,446 | | | C,S | | Wells Fargo Mortgage-Backed
Securities Trust, 5.387%,
due 08/25/35 | | | 1,557,687 | | |
| | 746,730 | | | C,S | | Wells Fargo Mortgage-Backed
Securities Trust, 5.629%,
due 12/25/36 | | | 486,116 | | |
| | 1,337,608 | | | C,S | | Wells Fargo Mortgage-Backed
Securities Trust, 5.922%,
due 11/25/36 | | | 874,947 | | |
| | 2,019,492 | | | C,S | | Wells Fargo Mortgage-Backed
Securities Trust, 5.938%,
due 10/25/36 | | | 1,394,108 | | |
| | 212,844 | | | C,S | | Wells Fargo Mortgage-Backed
Securities Trust, 6.000%,
due 06/25/36 | | | 142,081 | | |
| | 1,062,404 | | | C,S | | Wells Fargo Mortgage-Backed
Securities Trust, 6.000%,
due 12/28/37 | | | 687,109 | | |
Total Collateralized
Mortgage Obligations
(Cost $86,922,848) | | | 59,542,269 | | |
| MUNICIPAL BONDS: 0.5% | | | |
| | | | | California: 0.1% | |
| | 806,000 | | | C | | City of San Diego, 7.125%,
due 06/01/32 | | | 528,502 | | |
| | | | 528,502 | | |
| | | | | Florida: 0.1% | |
| | 345,000 | | | C | | Florida State Board of
Education, 4.750%,
due 06/01/35 | | | 297,587 | | |
| | | | 297,587 | | |
| | | | | Lousiana: 0.1% | |
| | 802,000 | | | C | | State of Louisiana, 5.000%,
due 10/15/17 | | | 858,308 | | |
| | | | 858,308 | | |
| | | | | Michigan: 0.1% | |
| | 555,000 | | | | | Michigan Tobacco Settlement
Finance Authority, 7.309%,
due 06/01/34 | | | 360,778 | | |
| | | | 360,778 | | |
| | | | | Washington: 0.1% | |
| | 896,000 | | | C | | State of Washington, 5.000%,
due 01/01/33 | | | 860,913 | | |
| | | | 860,913 | | |
Total Municipal Bonds
(Cost $3,442,638) | | | 2,906,088 | | |
Total Long-Term Investments
(Cost $744,243,467) | | | 621,389,188 | | |
Principal
Amount | | | | | | Value | |
| SHORT-TERM INVESTMENTS: 8.6% | | | |
| | | | | Commercial Paper: 2.5% | |
| $ | 5,000,000 | | | S | | Alcoa, Inc., 5.360%,
due 01/13/09 | | $ | 4,990,340 | | |
| | 4,200,000 | | | | | Ciesco, LLC, 0.300%,
due 01/02/09 | | | 4,199,993 | | |
| | 6,000,000 | | | S | | Volkswagen of America,
2.500%, due 01/21/09 | | | 5,991,250 | | |
Total Commercial Paper
(Cost $15,181,583) | | | 15,181,583 | | |
| Shares | | | | | | Value | |
| | | | | Money Market: 0.6% | |
| | 3,543,000 | | | S | | ING Institutional Prime
Money Market Fund - Class I | | $ | 3,543,000 | | |
Total Money Market
(Cost $3,543,000) | | | 3,543,000 | | |
Principal
Amount | | | | Value | |
| | | Securities Lending Collateralcc: 5.5% | |
| $ | 34,040,061 | | | Bank of New York Mellon Corp.
Institutional Cash Reserves | | $ | 33,714,630 | | |
Total Securities Lending
Collateral
(Cost $34,040,061) | | | 33,714,630 | | |
Total Short-Term Investments
(Cost $52,764,644) | | | 52,439,213 | | |
Total Investments in
Securities
(Cost $797,008,111)* | | | 110.6 | % | | $ | 673,828,401 | | |
Other Assets and
Liabilities - Net | | | (10.6 | ) | | | (64,328,802 | ) | |
| Net Assets | | | 100.0 | % | | $ | 609,499,599 | | |
@ Non-income producing security
@@ Foreign Issuer
ADR American Depositary Receipt
MASTR Mortgage Asset Securitization Transaction, Inc.
# Securities with purchases pursuant to Rule 144A or section 4(2), under the Securities Act of 1933 and may not be resold subject to that rule except to qualified institutional buyers. Unless otherwise noted, these securities have been determined to be liquid under the guidelines established by the Funds' Board of Directors/Trustees.
C Bond may be called prior to maturity date.
P Preferred Stock may be called prior to convertible date.
cc Securities purchased with cash collateral for securities loaned.
ip Treasury inflation indexed protected security whose principal value is adjusted in accordance with changes to the Consumer Price Index.
## On September 7, 2008, the Federal Housing Finance Agency placed the Federal National Mortgage Association and the Federal Home Loan Mortgage Corporation into conservatorship and the U.S. Treasury guaranteed the debt issued by those organizations.
W Settlement is on a when-issued or delayed-delivery basis.
S All or a portion of this security is segregated to cover collateral requirements for applicable futures, options, swaps, foreign forward currency contracts and/or when-issued or delayed-delivery securities.
I Illiquid security
See Accompanying Notes to Financial Statements
70
PORTFOLIO OF INVESTMENTS
ING VP BALANCED PORTFOLIO AS OF DECEMBER 31, 2008 (CONTINUED)
L Loaned security, a portion or all of the security is on loan at December 31, 2008.
^ Interest only securities represent the right to receive the monthly interest payments on an underlying pool of mortgage loans. Principal amount shown represents the notional amount on which current interest is calculated. Payments of principal on the pool reduce the value of the interest only security.
Z Indicates Zero Coupon Bond; rate shown reflects current effective yield.
The Portfolio received $3,110,000 in cash collateral for swaps and foreign forward currency contracts, with these amounts being held in a tri-party account.
* Cost for federal income tax purposes is $819,098,035.
Net unrealized depreciation consists of:
| Gross Unrealized Appreciation | | $ | 12,504,229 | | |
| Gross Unrealized Depreciation | | | (157,773,863 | ) | |
| Net Unrealized Depreciation | | $ | (145,269,634 | ) | |
The following table summarizes the inputs used as of December 31, 2008 in determining the Portfolio's investments at fair value for purposes of SFAS 157:
| | | Investments in
Securities | | Other Financial
Instruments* | |
| Level 1 — Quoted Prices | | $ | 386,742,880 | | | $ | (461,104 | ) | |
Level 2 — Other Significant
Observable Inputs | | | 281,795,135 | | | | 4,039,019 | | |
Level 3 — Significant
Unobservable Inputs | | | 5,290,386 | | | | 142,098 | | |
| Total | | $ | 673,828,401 | | | $ | 3,720,013 | | |
"Fair value" for purposes of SFAS 157 is different from "fair value" as used in the 1940 Act. The former generally implies market value, and can include market quotations as a source of value, and the latter refers to determinations of actual value in absence of available market quotations.
* Other financial instruments may include forward foreign currency contracts, futures, swaps, and written options. Forward foreign currency contracts and futures are reported at their unrealized gain/loss at year end. Swaps and written options are reported at their market value at year end.
A roll forward of fair value measurements using significant unobservable inputs (Level 3) for the year ended December 31, 2008, was as follows:
| | | Investments in
Securities | | Other Financial
Instruments* | |
| Beginning Balance at 12/31/07 | | $ | 14,526,723 | | | $ | (48,239 | ) | |
| Net Purchases/(Sales) | | | (4,273,472 | ) | | | 512,952 | | |
| Accrued Discounts/(Premiums) | | | 54,250 | | | | (3,653 | ) | |
| Total Realized Gain/(Loss) | | | (697,580 | ) | | | (370,666 | ) | |
Total Unrealized
Appreciation/(Depreciation) | | | (4,024,808 | ) | | | 120,601 | | |
Net Transfers In/(Out) of
Level 3 | | | (294,727 | ) | | | (68,897 | ) | |
| Ending Balance at 12/31/08 | | $ | 5,290,386 | | | $ | 142,098 | | |
* Other financial instruments may include forward foreign currency contracts, futures, swaps, and written options. Forward foreign currency contracts and futures are reported at their unrealized gain/loss at year end. Swaps and written options are reported at their market value at year end.
For the year ended December 31, 2008, total change in unrealized gain (loss) on Level 3 securities included in the change in net assets was $(4,789,683). Total unrealized gain (loss) for all securities (including Level 1 and Level 2) can be found on the accompanying Statement of Operations.
At December 31, 2008 the following forward foreign currency contracts were outstanding for the ING VP Balanced Portfolio:
| Currency | | Buy/Sell | | Settlement
Date | | In
Exchange
For | | Value | | Unrealized
Appreciation/
(Depreciation) | |
| Colombian Peso | | | | | | | USD | | | | | | | |
| | |
| COP 2,710,657,436 | | BUY | | 01/08/09 | | | 1,171,923 | | | | 1,203,862 | | | $ | 31,939 | | |
Indonesian Rupiah
IDR 6,060,999,679 | | BUY | | 01/08/09 | | | 564,602 | | | | 553,381 | | | | (11,221 | ) | |
Russian Ruble
RUB 16,703,999 | | BUY | | 01/13/09 | | | 581,616 | | | | 535,052 | | | | (46,564 | ) | |
Russian Ruble
RUB 16,733,000 | | BUY | | 01/13/09 | | | 582,498 | | | | 535,981 | | | | (46,517 | ) | |
| | | $ | (72 | ,363) | |
Colombian Peso
COP 1,465,570,045 | | SELL | | 01/08/09 | | | 632,229 | | | | 650,892 | | | $ | (18,663 | ) | |
Colombian Peso
COP 1,245,087,402 | | SELL | | 01/08/09 | | | 539,653 | | | | 552,971 | | | | (13,318 | ) | |
Indonesian Rupiah
IDR 6,060,999,698 | | SELL | | 01/08/09 | | | 445,007 | | | | 553,378 | | | | (108,371 | ) | |
Russian Ruble
RUB 16,733,000 | | SELL | | 01/13/09 | | | 560,945 | | | | 535,981 | | | | 24,964 | | |
Russian Ruble
RUB 16,704,000 | | SELL | | 01/13/09 | | | 559,411 | | | | 535,052 | | | | 24,359 | | |
| | | $ | (91,029 | ) | |
ING VP Balanced Portfolio Open Futures Contracts on December 31, 2008:
Contract
Description | | Number of
Contracts | | Expiration
Date | | Unrealized
Appreciation/
(Depreciation) | |
| Long Contracts | |
| Euro-Bund | | | 31 | | | 03/06/09 | | $ | 48,271 | | |
| Euro-Schatz | | | 140 | | | 03/06/09 | | | 98,642 | | |
| Long Gilt | | | 47 | | | 03/27/09 | | | 520,687 | | |
| Russell 2000 Mini | | | 12 | | | 03/20/09 | | | 38,615 | | |
| S&P 500 | | | 27 | | | 03/19/09 | | | 93,158 | | |
| S&P Mid 400 E-Mini | | | 24 | | | 03/20/09 | | | 32,492 | | |
U.S. Treasury
5-Year Note | | | 72 | | | 03/31/09 | | | 10,508 | | |
| | | | | | | | | $ | 842,373 | | |
| Short Contracts | |
U.S. Treasury
2-Year Note | | | 101 | | | 03/31/09 | | $ | (209,187 | ) | |
U.S. Treasury
10-Year Note | | | 92 | | | 03/20/09 | | | (407,939 | ) | |
U.S. Treasury
Long Bond | | | 60 | | | 03/20/09 | | | (686,351 | ) | |
| | | | | | | | | $ | (1,303,477 | ) | |
See Accompanying Notes to Financial Statements
71
PORTFOLIO OF INVESTMENTS
ING VP BALANCED PORTFOLIO AS OF DECEMBER 31, 2008 (CONTINUED)
ING VP Balanced Portfolio Interest Rate Swap Agreements Outstanding on December 31, 2008:
| | | Termination
Date | | Notional
Principal
Amount | | Unrealized
Appreciation/
(Depreciation) | |
Receive a fixed rate
equal to 7.060%
and pay a floating rate
based on 3-month
NZD-BBR-FRA
Counterparty:
UBS AG, London | | 01/28/11 | | NZD | 26,207,000 | | | $ | 807,515 | | |
Receive a fixed rate
equal to 7.015%
and pay a floating rate
based on 3-month
NZD-BBR-FRA
Counterparty:
UBS AG, London | | 02/04/11 | | NZD13,100,000 | | 400,310 | |
Receive a floating rate
based on 3-month
NZD-BBR-FRA and pay a
fixed rate equal to 7.055%
Counterparty:
UBS AG, London | | 01/28/16 | | NZD8,910,000 | | (704,072) | |
Receive a floating rate
based on 3-month
NZD-BBR-FRA and pay a
fixed rate equal to 7.000%
Counterparty:
UBS AG, London | | 02/04/16 | | NZD4,400,000 | | (339,334) | |
| | | $ | 164,419 | | |
ING VP Balanced Portfolio Credit Default Swap Agreements Outstanding on December 31, 2008:
Credit Default Swaps on Credit Indices — Buy Protection(1)
| Counterparty | | Reference
Entity/Obligation | | Buy/Sell
Protection | | (Pay)/
Receive
Fixed
Rate (%) | | Termination
Date | | Notional
Amount(4) | | Market
Value(5) | | Upfront
Premium
Paid/
(Received) | | Unrealized
Appreciation/
(Depreciation) | |
Citibank N.A.,
New York | | CDX.EM.9 Index | | Buy | | | (2.650 | ) | | 06/20/13 | | USD | 7,078,000 | | | $ | 1,115,547 | | | $ | (18,294 | ) | | $ | 1,133,841 | | |
Citibank N.A.,
New York | | CDX.EM.9 Index | | Buy | | | (2.650 | ) | | 06/20/13 | | USD | 1,254,000 | | | | 197,640 | | | | 15,755 | | | | 181,885 | | |
Citibank N.A.,
New York | | CDX.EM.9 Index | | Buy | | | (2.650 | ) | | 06/20/13 | | USD | 1,426,000 | | | | 224,748 | | | | 17,742 | | | | 207,006 | | |
Barclays
Bank PLC | | CDX.EM.10 Index | | Buy | | | (3.350 | ) | | 12/20/13 | | USD | 123,000 | | | | 18,568 | | | | 26,943 | | | | (8,375 | ) | |
Barclays
Bank PLC | | CDX.EM.10 Index | | Buy | | | (3.350 | ) | | 12/20/13 | | USD | 2,478,000 | | | | 374,077 | | | | 587,847 | | | | (213,770 | ) | |
Barclays
Bank PLC | | CDX.NA.IG.10 Index | | Buy | | | (1.550 | ) | | 06/20/13 | | USD | 2,454,640 | | | | 57,988 | | | | 85,910 | | | | (27,922 | ) | |
Citibank N.A.,
New York | | CDX.NA.IG.10 Index | | Buy | | | (1.550 | ) | | 06/20/13 | | USD | 1,700,192 | | | | 40,165 | | | | (33,941 | ) | | | 74,106 | | |
Barclays
Bank PLC | | CDX.NA.IG.11 Index | | Buy | | | (1.500 | ) | | 12/20/13 | | USD | 1,263,000 | | | | 26,523 | | | | 60,061 | | | | (33,538 | ) | |
Goldman Sachs
International | | CDX.NA.IG.11 Index | | Buy | | | (1.500 | ) | | 12/20/13 | | USD | 1,452,000 | | | | 30,493 | | | | 46,323 | | | | (15,830 | ) | |
Barclays
Bank PLC | | LCDX.NA.9 Index
(15-100% Tranche) | | Buy | | | (1.613 | ) | | 12/20/12 | | USD | 891,182 | | | | 142,098 | | | | — | | | | 142,098 | | |
| | | | | | | | | | | | | | | | | $ | 2,227,847 | | | $ | 788,346 | | | $ | 1,439,501 | | |
See Accompanying Notes to Financial Statements
72
PORTFOLIO OF INVESTMENTS
ING VP BALANCED PORTFOLIO AS OF DECEMBER 31, 2008 (CONTINUED)
Credit Default Swaps on Corporate and Sovereign Issues — Buy Protection(1)
| Counterparty | | Reference
Entity/Obligation | | Buy/Sell
Protection | | (Pay)/
Receive
Fixed
Rate (%) | | Termination
Date | | Notional
Amount(4) | | Market
Value(5) | | Upfront
Premium
Paid/
(Received) | | Unrealized
Appreciation/
(Depreciation) | |
| UBS AG | | Australia & New Zealand
Banking Group
4.450%, 02/05/15 | | Buy | | | (0.350 | ) | | 09/20/17 | | USD | 720,000 | | | $ | 60,226 | | | $ | — | | | $ | 60,226 | | |
| UBS AG | | Australia & New Zealand
Banking Group
4.450%, 02/05/15 | | Buy | | | (0.510 | ) | | 09/20/17 | | USD | 661,000 | | | | 90,397 | | | | — | | | | 90,397 | | |
Citibank N.A.,
New York | | Bank of America Corp.
6.250%, 04/15/12 | | Buy | | | (2.050 | ) | | 12/20/13 | | USD | 1,031,000 | | | | (42,584 | ) | | | — | | | | (42,584 | ) | |
Citibank N.A.,
New York | | BNP Paribas
4.750%, 04/04/11 | | Buy | | | (0.490 | ) | | 09/20/13 | | USD | 1,431,000 | | | | 13,118 | | | | — | | | | 13,118 | | |
Citibank N.A.,
New York | | BNP Paribas
4.750%, 04/04/11 | | Buy | | | (0.505 | ) | | 09/20/13 | | USD | 1,216,000 | | | | 10,332 | | | | — | | | | 10,332 | | |
Citibank N.A.,
New York | | BNP Paribas
5.250%, 12/17/12 | | Buy | | | (0.250 | ) | | 09/20/17 | | USD | 928,000 | | | | 61,971 | | | | — | | | | 61,971 | | |
Citibank N.A.,
New York | | BNP Paribas
5.250%, 12/17/12 | | Buy | | | (0.520 | ) | | 09/20/17 | | USD | 194,000 | | | | 8,980 | | | | — | | | | 8,980 | | |
Citibank N.A.,
New York | | BNP Paribas
5.250%, 12/17/12 | | Buy | | | (0.520 | ) | | 09/20/17 | | USD | 436,000 | | | | 20,181 | | | | — | | | | 20,181 | | |
Bear Stearns
Credit
Products Inc. | | Darden Restaurants Inc.
7.125%, 02/01/16** | | Buy | | | (1.640 | ) | | 03/20/18 | | USD | 723,000 | | | | 50,668 | | | | — | | | | 50,668 | | |
Citibank N.A.,
New York | | Darden Restaurants Inc.
7.125%, 02/01/16 | | Buy | | | (0.610 | ) | | 12/20/12 | | USD | 207,000 | | | | 15,568 | | | | — | | | | 15,568 | | |
Citibank N.A.,
New York | | Darden Restaurants Inc.
7.125%, 02/01/16 | | Buy | | | (1.310 | ) | | 12/20/17 | | USD | 201,000 | | | | 18,375 | | | | — | | | | 18,375 | | |
Citibank N.A.,
New York | | Devon Energy Corp.
7.950%, 04/15/32 | | Buy | | | (1.150 | ) | | 12/20/13 | | USD | 483,000 | | | | (18 | ) | | | — | | | | (18 | ) | |
Morgan Stanley
Capital
Services Inc. | | Domtar Corp.
7.875%, 10/15/11 | | Buy | | | (2.650 | ) | | 09/20/11 | | USD | 543,500 | | | | 68,021 | | | | — | | | | 68,021 | | |
Citibank N.A.,
New York | | Dow Chemical Co.
7.375%, 11/01/29 | | Buy | | | (1.220 | ) | | 12/20/13 | | USD | 475,000 | | | | 53,524 | | | | — | | | | 53,524 | | |
Goldman Sachs
International | | Dow Chemical Co.
7.375%, 11/01/29 | | Buy | | | (1.280 | ) | | 12/20/13 | | USD | 681,000 | | | | 75,054 | | | | — | | | | 75,054 | | |
Barclays
Bank PLC | | GAP Inc.
8.800%, 12/15/08* | | Buy | | | (1.200 | ) | | 06/20/13 | | USD | 344,000 | | | | (2,632 | ) | | | — | | | | (2,632 | ) | |
Citibank N.A.,
New York | | GAP Inc.
8.800%, 12/15/08* | | Buy | | | (1.190 | ) | | 06/20/13 | | USD | 154,000 | | | | (1,113 | ) | | | — | | | | (1,113 | ) | |
Citibank N.A.,
New York | | GAP Inc.
8.800%, 12/15/08* | | Buy | | | (0.850 | ) | | 06/20/13 | | USD | 142,000 | | | | 1,008 | | | | — | | | | 1,008 | | |
Goldman Sachs
International | | Halliburton Co.
5.500%, 10/15/10 | | Buy | | | (0.820 | ) | | 12/20/13 | | USD | 578,000 | | | | 4,161 | | | | — | | | | 4,161 | | |
| UBS AG | | HSBC Bank PLC
4.250%, 03/18/16 | | Buy | | | (0.400 | ) | | 09/20/17 | | USD | 720,000 | | | | 58,983 | | | | — | | | | 58,983 | | |
Citibank N.A.,
New Y.ork | | International Lease
Finance Corp.
4.150%, 01/20/15 | | Buy | | | (1.670 | ) | | 06/20/13 | | USD | 1,121,000 | | | | 232,258 | | | | — | | | | 232,258 | | |
See Accompanying Notes to Financial Statements
73
PORTFOLIO OF INVESTMENTS
ING VP BALANCED PORTFOLIO AS OF DECEMBER 31, 2008 (CONTINUED)
| Counterparty | | Reference
Entity/Obligation | | Buy/Sell
Protection | | (Pay)/
Receive
Fixed
Rate (%) | | Termination
Date | | Notional
Amount(4) | | Market
Value(5) | | Upfront
Premium
Paid/
(Received) | | Unrealized
Appreciation/
(Depreciation) | |
Citibank N.A.,
New York | | International Paper Co.
5.300%, 04/01/15 | | Buy | | | (3.950 | ) | | 12/20/13 | | USD | 621,000 | | | $ | 30,637 | | | $ | — | | | $ | 30,637 | | |
Citibank N.A.,
New York | | International Paper Co.
5.300%, 04/01/15 | | Buy | | | (4.100 | ) | | 12/20/13 | | USD | 246,000 | | | | 10,687 | | | | — | | | | 10,687 | | |
Goldman Sachs
International | | International Paper Co.
5.300%, 04/01/15 | | Buy | | | (3.700 | ) | | 12/20/13 | | USD | 273,000 | | | | 16,154 | | | | — | | | | 16,154 | | |
Goldman Sachs
International | | International Paper Co.
5.850%, 10/30/12 | | Buy | | | (1.900 | ) | | 12/20/13 | | USD | 729,000 | | | | 94,764 | | | | — | | | | 94,764 | | |
Goldman Sachs
International | | Liberty Mutual Insurance
7.875%, 10/15/26 | | Buy | | | (3.150 | ) | | 12/20/13 | | USD | 349,000 | | | | (10,469 | ) | | | — | | | | (10,469 | ) | |
Barclays
Bank PLC | | Louisiana-Pacific Corp.
8.875%, 08/15/10 | | Buy | | | (3.850 | ) | | 03/20/13 | | USD | 194,000 | | | | 39,639 | | | | — | | | | 39,639 | | |
Citibank N.A.,
New York | | Louisiana-Pacific Corp.
8.875%, 08/15/10 | | Buy | | | (2.000 | ) | | 12/20/12 | | USD | 461,000 | | | | 112,714 | | | | — | | | | 112,714 | | |
Morgan Stanley
Capital
Services Inc. | | Louisiana-Pacific Corp.
8.875%, 08/15/10 | | Buy | | | (2.230 | ) | | 12/20/12 | | USD | 684,000 | | | | 163,494 | | | | — | | | | 163,494 | | |
| UBS AG | | Louisiana-Pacific Corp.
8.875%, 08/15/10 | | Buy | | | (2.000 | ) | | 12/20/12 | | USD | 485,000 | | | | 118,582 | | | | — | | | | 118,582 | | |
Citibank N.A.,
New York | | Marks & Spencer PLC
6.375%, 11/07/11 | | Buy | | | (1.100 | ) | | 03/20/13 | | USD | 658,000 | | | | 85,493 | | | | — | | | | 85,493 | | |
Citibank N.A.,
New York | | Marks & Spencer PLC
6.375%, 11/07/11 | | Buy | | | (1.400 | ) | | 03/20/13 | | USD | 631,000 | | | | 75,432 | | | | — | | | | 75,432 | | |
Citibank N.A.,
New York | | MBIA Inc.
6.625%, 10/01/28 | | Buy | | | (5.000 | ) | | 09/20/13 | | USD | 140,000 | | | | 32,988 | | | | 44,670 | | | | (11,682 | ) | |
Citibank N.A.,
New York | | MBIA Inc.
6.625%, 10/01/28 | | Buy | | | (5.000 | ) | | 09/20/13 | | USD | 284,000 | | | | 66,919 | | | | 86,970 | | | | (20,051 | ) | |
Goldman Sachs
International | | MBIA Inc.
6.625%, 10/01/28 | | Buy | | | (5.000 | ) | | 09/20/13 | | USD | 554,000 | | | | 130,538 | | | | 174,277 | | | | (43,739 | ) | |
JPMorgan Chase
Bank, N.A.
New York | | MBIA Inc.
6.625%, 10/01/28 | | Buy | | | (5.000 | ) | | 09/20/13 | | USD | 2,316,000 | | | | 545,715 | | | | 385,967 | | | | 159,748 | | |
Goldman Sachs
International | | MeadWestvaco Corp.
6.850%, 04/01/12 | | Buy | | | (1.900 | ) | | 12/20/13 | | USD | 729,000 | | | | 9,664 | | | | — | | | | 9,664 | | |
Barclays
Bank PLC | | Norbord Inc.
7.250%, 07/01/12 | | Buy | | | (6.350 | ) | | 06/20/13 | | USD | 170,000 | | | | 13,024 | | | | — | | | | 13,024 | | |
Citibank N.A.,
New York | | Norbord Inc.
7.250%, 07/01/12 | | Buy | | | (2.450 | ) | | 12/20/17 | | USD | 1,108,000 | | | | 275,949 | | | | — | | | | 275,949 | | |
| UBS AG | | Norbord Inc.
7.250%, 07/01/12 | | Buy | | | (1.500 | ) | | 06/20/12 | | USD | 193,000 | | | | 39,342 | | | | — | | | | 39,342 | | |
| UBS AG | | Norbord Inc.
7.250%, 07/01/12 | | Buy | | | (2.400 | ) | | 12/20/17 | | USD | 440,000 | | | | 110,637 | | | | — | | | | 110,637 | | |
Citibank N.A.,
New York | | Potash Corp. of
Saskatchewan
7.750%, 05/31/11 | | Buy | | | (0.600 | ) | | 03/20/13 | | USD | 403,000 | | | | 19,366 | | | | — | | | | 19,366 | | |
Goldman Sachs
International | | Potash Corp. of
Saskatchewan
7.750%, 05/31/11 | | Buy | | | (0.880 | ) | | 03/20/18 | | USD | 1,205,000 | | | | 99,101 | | | | — | | | | 99,101 | | |
See Accompanying Notes to Financial Statements
74
PORTFOLIO OF INVESTMENTS
ING VP BALANCED PORTFOLIO AS OF DECEMBER 31, 2008 (CONTINUED)
| Counterparty | | Reference
Entity/Obligation | | Buy/Sell
Protection | | (Pay)/
Receive
Fixed
Rate (%) | | Termination
Date | | Notional
Amount(4) | | Market
Value(5) | | Upfront
Premium
Paid/
(Received) | | Unrealized
Appreciation/
(Depreciation) | |
Morgan Stanley
Capital
Services Inc. | | Potash Corp. of
Saskatchewan
7.750%, 05/31/11 | | Buy | | | (0.610 | ) | | 03/20/13 | | USD | 805,000$ | | | | 38,371 | | | $ | — | | | $ | 38,371 | | |
Morgan Stanley
Capital
Services Inc. | | Temple-Inland Inc.
7.875%, 05/01/12 | | Buy | | | (1.600 | ) | | 09/20/17 | | USD | 811,000 | | | | 211,129 | | | | — | | | | 211,129 | | |
| UBS AG | | Temple-Inland Inc.
7.875%, 05/01/12 | | Buy | | | (0.900 | ) | | 03/20/14 | | USD | 847,000 | | | | 202,347 | | | | — | | | | 202,347 | | |
Morgan Stanley
Capital
Services Inc. | | Verizon
Communications Inc.
4.900%, 09/15/15 | | Buy | | | (1.500 | ) | | 12/20/13 | | USD | 420,000 | | | | (2,570 | ) | | | — | | | | (2,570 | ) | |
Citibank N.A.,
New York | | VF Corp.
8.500%, 10/01/10 | | Buy | | | (0.700 | ) | | 09/20/13 | | USD | 279,000 | | | | 7,623 | | | | — | | | | 7,623 | | |
Citibank N.A.,
New York | | VF Corp.
8.500%, 10/01/10 | | Buy | | | (0.800 | ) | | 09/20/13 | | USD | 139,000 | | | | 3,190 | | | | — | | | | 3,190 | | |
Citibank N.A.,
New York | | VF Corp.
8.500%, 10/01/10 | | Buy | | | (0.800 | ) | | 09/20/13 | | USD | 262,000 | | | | 6,013 | | | | — | | | | 6,013 | | |
Citibank N.A.,
New York | | VF Corp.
8.500%, 10/01/10 | | Buy | | | (0.770 | ) | | 09/20/13 | | USD | 291,000 | | | | 7,060 | | | | — | | | | 7,060 | | |
Morgan Stanley
Capital
Services Inc. | | VF Corp.
8.500%, 10/01/10 | | Buy | | | (0.850 | ) | | 09/20/13 | | USD | 596,000 | | | | 12,375 | | | | — | | | | 12,375 | | |
| UBS AG | | Westpac Banking Corp.
5.875%, 04/29/18 | | Buy | | | (0.350 | ) | | 09/20/17 | | USD | 720,000 | | | | 98,074 | | | | — | | | | 98,074 | | |
| UBS AG | | Westpac Banking Corp.
5.875%, 4/29/18 | | Buy | | | (0.510 | ) | | 09/20/17 | | USD | 661,000 | | | | 82,436 | | | | — | | | | 82,436 | | |
Citibank N.A.,
New York | | Westvaco Corp.
7.950%, 02/15/31 | | Buy | | | (2.800 | ) | | 12/20/13 | | USD | 448,000 | | | | (11,968 | ) | | | — | | | | (11,968 | ) | |
Citibank N.A.,
New York | | Westvaco Corp.
7.950%, 02/15/31 | | Buy | | | (2.750 | ) | | 12/20/13 | | USD | 206,000 | | | | (5,045 | ) | | | — | | | | (5,045 | ) | |
Goldman Sachs
International | | Westvaco Corp.
7.950%, 02/15/31 | | Buy | | | (3.250 | ) | | 12/20/13 | | USD | 492,000 | | | | (22,975 | ) | | | — | | | | (22,975 | ) | |
JPMorgan Chase
Bank N.A.,
New York | | Weyerhaeuser Co.
6.750%, 03/15/12 | | Buy | | | (0.640 | ) | | 03/20/14 | | USD | 974,000 | | | | 70,862 | | | | — | | | | 70,862 | | |
Citibank N.A.,
New York | | Weyerhaeuser Co.
7.125%, 07/15/23 | | Buy | | | (3.150 | ) | | 12/20/13 | | USD | 700,000 | | | | (29,348 | ) | | | — | | | | (29,348 | ) | |
Goldman Sachs
International | | Weyerhaeuser Co.
7.125%, 07/15/23 | | Buy | | | (2.000 | ) | | 12/20/13 | | USD | 729,000 | | | | 6,552 | | | | — | | | | 6,552 | | |
Citibank N.A.,
New York | | Whirlpool Corp.
7.750%, 07/15/16 | | Buy | | | (1.330 | ) | | 09/20/13 | | USD | 502,000 | | | | 49,398 | | | | — | | | | 49,398 | | |
Citibank N.A.,
New York | | Whirlpool Corp.
7.750%, 07/15/16 | | Buy | | | (1.400 | ) | | 09/20/13 | | USD | 305,000 | | | | 29,161 | | | | — | | | | 29,161 | | |
Citibank N.A.,
New York | | Whirlpool Corp.
7.750%, 07/15/16 | | Buy | | | (1.400 | ) | | 09/20/13 | | USD | 192,000 | | | | 18,357 | | | | — | | | | 18,357 | | |
See Accompanying Notes to Financial Statements
75
PORTFOLIO OF INVESTMENTS
ING VP BALANCED PORTFOLIO AS OF DECEMBER 31, 2008 (CONTINUED)
| Counterparty | | Reference
Entity/Obligation | | Buy/Sell
Protection | | (Pay)/
Receive
Fixed
Rate (%) | | Termination
Date | | Notional
Amount(4) | | Market
Value(5) | | Upfront
Premium
Paid/
(Received) | | Unrealized
Appreciation/
(Depreciation) | |
Morgan Stanley
Capital
Services Inc. | | Whirlpool Corp.
7.750%, 07/15/16 | | Buy | | | (1.680 | ) | | 09/20/13 | | USD | 336,000 | | | $ | 28,372 | | | $ | — | | | $ | 28,372 | | |
Citibank N.A.,
New York | | Williams Companies Inc.
7.500%, 01/15/31 | | Buy | | | (2.750 | ) | | 12/20/13 | | USD | 1,000,000 | | | | 39,196 | | | | — | | | | 39,196 | | |
| | | | | | | | | | | | | $ | 3,715,458 | | | $ | 691,884 | | | $ | 3,023,574 | | |
Credit Default Swaps on Corporate and Sovereign Issues — Sell Protection(2)(6)
| Counterparty | | Reference
Entity/Obligation | | Buy/Sell
Protection | | (Pay)/
Receive
Fixed
Rate (%) | | Termination
Date | | Implied
Credit
Spread at
12/31/08(3) | | Notional
Amount(4) | | Market
Value(5) | | Upfront
Premium
Paid/
(Received) | | Unrealized
Appreciation/
(Depreciation) | |
| UBS AG | | Domtar Corp.
7.875%, 10/15/11 | | Sell | | | 2.600 | | | 09/20/11 | | | 8.15 | % | | USD | 542,000 | | | $ | (68,450 | ) | | $ | — | | | $ | (68,450 | ) | |
Citibank N.A.,
New York | | MBIA Insurance Corp.
(no specified
obligation) | | Sell | | | 5.000 | | | 09/20/13 | | | 30.06 | % | | USD | 139,000 | | | | (64,822 | ) | | | (49,349 | ) | | | (15,473 | ) | |
Citibank N.A.,
New York | | MBIA Insurance Corp.
(no specified
obligation) | | Sell | | | 5.000 | | | 09/20/13 | | | 30.06 | % | | USD | 284,000 | | | | (132,442 | ) | | | (109,991 | ) | | | (22,451 | ) | |
Credit Suisse
International | | MBIA Insurance Corp.
(no specified
obligation) | | Sell | | | 5.000 | | | 09/20/13 | | | 30.06 | % | | USD | 619,000 | | | | (288,667 | ) | | | (108,889 | ) | | | (179,778 | ) | |
Goldman Sachs
International | | MBIA Insurance Corp.
(no specified
obligation) | | Sell | | | 5.000 | | | 09/20/13 | | | 30.06 | % | | USD | 554,000 | | | | (258,355 | ) | | | (194,195 | ) | | | (64,160 | ) | |
JPMorgan Chase
Bank, N.A.
New York | | MBIA Insurance Corp.
(no specified
obligation) | | Sell | | | 5.000 | | | 09/20/13 | | | 30.06 | % | | USD | 794,000 | | | | (370,277 | ) | | | (139,673 | ) | | | (230,604 | ) | |
The Royal
Bank of
Scotland PLC | | MBIA Insurance Corp.
(no specified
obligation) | | Sell | | | 5.000 | | | 09/20/13 | | | 30.06 | % | | USD | 913,000 | | | | (425,772 | ) | | | (160,606 | ) | | | (265,166 | ) | |
Citibank N.A.,
New York | | Norbord Inc.
7.250%, 07/01/12 | | Sell | | | 2.200 | | | 06/20/12 | | | 9.32 | % | | USD | 193,000 | | | | (35,819 | ) | | | — | | | | (35,819 | ) | |
Morgan Stanley
Capital
Services Inc. | | Verizon Wireless
7.375%, 11/15/13 | | Sell | | | 1.900 | | | 12/20/13 | | | 2.13 | % | | USD | 420,000 | | | | (4,251 | ) | | �� | — | | | | (4,251 | ) | |
Barclays
Bank PLC | | Weyerhaeuser Co.
7.125%, 07/15/23 | | Sell | | | 0.780 | | | 09/20/12 | | | 2.10 | % | | USD | 874,000 | | | | (39,767 | ) | | | — | | | | (39,767 | ) | |
Citibank N.A.,
New York | | Williams Partners LP
7.500%, 06/15/11 | | Sell | | | 1.030 | | | 03/20/12 | | | 4.14 | % | | USD | 836,947 | | | | (74,593 | ) | | | — | | | | (74,593 | ) | |
| | | | | | | | | | | | | | | | | | | | | $ | (1,763,215 | ) | | $ | (762,703 | ) | | $ | (1,000,512 | ) | |
* In the event of a default, if this bond is no longer available an equivalent bond will be delivered.
** Guaranteed by JPMorgan Chase.
(1) If a Portfolio is a buyer of protection and a credit event occurs, as defined under the terms of that particular swap agreement, a Portfolio will either 1.) receive from the seller of protection an amount equal to the notional amount of the swap and deliver the referenced obligation, other deliverable obligations or underlying securities comprising the referenced index or 2.) receive a net settlement amount
See Accompanying Notes to Financial Statements
76
PORTFOLIO OF INVESTMENTS
ING VP BALANCED PORTFOLIO AS OF DECEMBER 31, 2008 (CONTINUED)
in the form of cash or securities equal to the notional amount of the swap less the recovery value of the referenced obligation or underlying securities comprising the referenced index.
(2) If the Portfolio is a seller of protection, and a credit event occurs, as defined under the terms of that particular swap agreement, the Portfolio will generally either 1.) Pay to the buyer an amount equal to the notional amount of the swap and take delivery of the referenced obligation, other deliverable obligations, or underlying securities comprising a referenced index or 2.) Pay a net settlement amount in the form of cash or securities equal to the notional amount of the swap less the recovery value of the referenced obligation or underlying securities comprising a referenced index.
(3) Implied credit spreads, represented in absolute terms, utilized in determining the market value of credit default swap agreements on corporate issues or sovereign issues are disclosed for credit default swaps sold and serve as an indicator of the current status of the payment/performance risk and represent the likelihood or risk of default for the credit derivative. The implied credit spread of a particular referenced entity reflects the cost of buying/selling protection and may include upfront payments required to be made to enter into the agreement. For credit default swaps on asset-backed securities or credit indices, the quoted market prices and resulting market values as well as the receive fixed rate, serve as indicators of the current status of the payment/performance risk. Wider credit spreads and increasing market values, in absolute terms when compared to the notional amount of the swap, and high receive fixed rate, represent a deterioration of the referenced entity's credit soundness and a greater likelihood or risk of default or other credit event occurring as defined under the terms of the agreement.
(4) The maximum amount of future payments (undiscounted) that a Portfolio as seller of protection could be required to make or receive as a buyer of credit protection under a credit default swap agreement would be an amount equal to the notional amount of the agreement.
(5) The market values for credit default swap agreements serve as an indicator of the current status of the payment/performance risk and represent the likelihood or risk of default for the credit derivative. Increasing market values, in absolute terms, when compared to the notional amount of the agreement, represent a deterioration of the referenced obligation's credit soundness and a greater likelihood or risk of default or other credit event occurring.
(6) For the reason(s) or why a Portfolio may sell credit protection, please see NOTE 2, "Significant Accounting Policies" in the Notes to Financial Statements.
See Accompanying Notes to Financial Statements
77
PORTFOLIO OF INVESTMENTS
ING VP GROWTH AND INCOME PORTFOLIO AS OF DECEMBER 31, 2008
| Shares | | | | | | Value | |
| COMMON STOCK: 97.7% | | | |
| | | | | Aerospace/Defense: 0.9% | |
| | 197,000 | | | | | Lockheed Martin Corp. | | $ | 16,563,760 | | |
| | | | 16,563,760 | | |
| | | | | Agriculture: 2.8% | |
| | 1,067,338 | | | | | Altria Group, Inc. | | | 16,074,110 | | |
| | 855,545 | | | | | Philip Morris International, Inc. | | | 37,224,763 | | |
| | | | 53,298,873 | | |
| | | | | Apparel: 1.2% | |
| | 1,115,200 | | | @ | | Coach, Inc. | | | 23,162,704 | | |
| | | | 23,162,704 | | |
| | | | | Auto Manufacturers: 1.0% | |
| | 678,900 | | | | | Paccar, Inc. | | | 19,416,540 | | |
| | | | 19,416,540 | | |
| | | | | Auto Parts & Equipment: 0.6% | |
| | 527,200 | | | @@ | | Autoliv, Inc. | | | 11,313,712 | | |
| | | | 11,313,712 | | |
| | | | | Banks: 8.4% | |
| | 2,451,400 | | | | | Citigroup, Inc. | | | 16,448,894 | | |
| | 404,700 | | | | | Comerica, Inc. | | | 8,033,295 | | |
| | 187,000 | | | | | Goldman Sachs Group, Inc. | | | 15,780,930 | | |
| | 1,658,460 | | | | | JPMorgan Chase & Co. | | | 52,291,244 | | |
| | 271,400 | | | | | PNC Financial Services
Group, Inc. | | | 13,298,600 | | |
| | 1,891,000 | | | | | Wells Fargo & Co. | | | 55,746,680 | | |
| | | | 161,599,643 | | |
| | | | | Beverages: 1.7% | |
| | 188,000 | | | | | Coca-Cola Co. | | | 8,510,760 | | |
| | 444,950 | | | | | PepsiCo, Inc. | | | 24,369,912 | | |
| | | | 32,880,672 | | |
| | | | | Biotechnology: 2.4% | |
| | 132,000 | | | @ | | Genentech, Inc. | | | 10,944,120 | | |
| | 689,300 | | | @ | | Gilead Sciences, Inc. | | | 35,250,802 | | |
| | | | 46,194,922 | | |
| | | | | Chemicals: 0.9% | |
| | 1,342,643 | | | | | Celanese Corp. | | | 16,689,052 | | |
| | | | 16,689,052 | | |
| | | | | Commercial Services: 1.5% | |
| | 303,800 | | | | | Automatic Data
Processing, Inc. | | | 11,951,492 | | |
| | 836,500 | | | @ | | Quanta Services, Inc. | | | 16,562,700 | | |
| | | | 28,514,192 | | |
| | | | | Computers: 3.7% | |
| | 259,500 | | | @ | | Apple, Inc. | | | 22,148,325 | | |
| | 891,700 | | | | | Hewlett-Packard Co. | | | 32,359,793 | | |
| | 197,700 | | | | | International Business
Machines Corp. | | | 16,638,432 | | |
| | 2,600 | | | | | Seagate Technology,
Inc.-Escrow | | | — | | |
| | | | 71,146,550 | | |
| | | | | Cosmetics/Personal Care: 3.2% | |
| | 1,004,992 | | | | | Procter & Gamble Co. | | | 62,128,605 | | |
| | | | 62,128,605 | | |
| Shares | | | | | | Value | |
| | | | | Distribution/Wholesale: 0.4% | |
| | 92,300 | | | | | WW Grainger, Inc. | | $ | 7,276,932 | | |
| | | | 7,276,932 | | |
| | | | | Diversified Financial Services: 0.6% | |
| | 166,070 | | | @@ | | Deutsche Boerse AG | | | 12,014,989 | | |
| | | | 12,014,989 | | |
| | | | | Electric: 4.1% | |
| | 489,000 | | | | | Exelon Corp. | | | 27,193,290 | | |
| | 665,000 | | | | | NSTAR | | | 24,265,850 | | |
| | 719,500 | | | | | Pacific Gas & Electric Co. | | | 27,851,845 | | |
| | | | 79,310,985 | | |
| | | | | Electronics: 1.0% | |
| | 779,100 | | | | | Amphenol Corp. | | | 18,682,818 | | |
| | | | 18,682,818 | | |
| | | | | Environmental Control: 1.1% | |
| | 630,900 | | | | | Waste Management, Inc. | | | 20,908,026 | | |
| | | | 20,908,026 | | |
| | | | | Food: 0.6% | |
| | 298,500 | | | @@ | | Cadbury PLC ADR | | | 10,647,495 | | |
| | | | 10,647,495 | | |
| | | | | Healthcare-Products: 5.5% | |
| | 694,968 | | | @@ | | Covidien Ltd. | | | 25,185,640 | | |
| | 547,260 | | | | | Johnson & Johnson | | | 32,742,566 | | |
| | 825,700 | | | @ | | St. Jude Medical, Inc. | | | 27,215,072 | | |
| | 506,700 | | | @ | | Zimmer Holdings, Inc. | | | 20,480,814 | | |
| | | | 105,624,092 | | |
| | | | | Healthcare-Services: 1.6% | |
| | 710,500 | | | @ | | WellPoint, Inc. | | | 29,933,365 | | |
| | | | 29,933,365 | | |
| | | | | Insurance: 3.9% | |
| | 489,185 | | | | | Reinsurance Group of
America, Inc. | | | 20,946,902 | | |
| | 744,300 | | | | | Travelers Cos., Inc. | | | 33,642,360 | | |
| | 765,600 | | | @@ | | Willis Group Holdings Ltd. | | | 19,048,128 | | |
| | | | 73,637,390 | | |
| | | | | Internet: 2.6% | |
| | 110,887 | | | @ | | Google, Inc. - Class A | | | 34,114,386 | | |
| | 1,229,200 | | | @ | | Yahoo!, Inc. | | | 14,996,240 | | |
| | | | 49,110,626 | | |
| | | | | Iron/Steel: 1.5% | |
| | 532,600 | | | | | Cliffs Natural Resources, Inc. | | | 13,639,886 | | |
| | 394,400 | | | | | United States Steel Corp. | | | 14,671,680 | | |
| | | | 28,311,566 | | |
| | | | | Media: 2.7% | |
| | 232,900 | | | @ | | DIRECTV Group, Inc. | | | 5,335,739 | | |
| | 1,793,486 | | | @ | | Liberty Media Corp. -
Entertainment | | | 31,350,135 | | |
| | 1,466,100 | | | | | Time Warner, Inc. | | | 14,748,966 | | |
| | | | 51,434,840 | | |
See Accompanying Notes to Financial Statements
78
PORTFOLIO OF INVESTMENTS
ING VP GROWTH AND INCOME PORTFOLIO AS OF DECEMBER 31, 2008 (CONTINUED)
| Shares | | | | | | Value | |
| | | | | Mining: 0.8% | |
| | 610,000 | | | | | Freeport-McMoRan Copper &
Gold, Inc. | | $ | 14,908,400 | | |
| | | | 14,908,400 | | |
| | | | | Miscellaneous Manufacturing: 3.2% | |
| | 2,205,681 | | | | | General Electric Co. | | | 35,732,032 | | |
| | 797,200 | | | | | Honeywell International, Inc. | | | 26,172,076 | | |
| | | | 61,904,108 | | |
| | | | | Oil & Gas: 12.1% | |
| | 335,300 | | | | | Apache Corp. | | | 24,989,909 | | |
| | 1,510,015 | | | | | ExxonMobil Corp. | | | 120,544,497 | | |
| | 959,500 | | | | | Marathon Oil Corp. | | | 26,251,920 | | |
| | 624,800 | | | @@ | | Royal Dutch Shell PLC
ADR - Class A | | | 33,076,912 | | |
| | 294,600 | | | @ | | Transocean, Ltd. | | | 13,919,850 | | |
| | 386,300 | | | | | XTO Energy, Inc. | | | 13,624,801 | | |
| | | | 232,407,889 | | |
| | | | | Oil & Gas Services: 2.1% | |
| | 1,506,900 | | | | | BJ Services Co. | | | 17,585,523 | | |
| | 519,900 | | | | | Schlumberger Ltd. | | | 22,007,367 | | |
| | | | 39,592,890 | | |
| | | | | Packaging & Containers: 1.0% | |
| | 703,600 | | | @ | | Owens-Illinois, Inc. | | | 19,229,388 | | |
| | | | 19,229,388 | | |
| | | | | Pharmaceuticals: 5.3% | |
| | 547,550 | | | | | Abbott Laboratories | | | 29,222,744 | | |
| | 1,495,500 | | | | | Pfizer, Inc. | | | 26,485,305 | | |
| | 484,550 | | | @@,L | | Teva Pharmaceutical
Industries Ltd. ADR | | | 20,627,294 | | |
| | 667,000 | | | | | Wyeth | | | 25,019,170 | | |
| | | | 101,354,513 | | |
| | | | | Retail: 4.8% | |
| | 79,292 | | | | | Burger King Holdings, Inc. | | | 1,893,493 | | |
| | 1,221,600 | | | | | Gap, Inc. | | | 16,357,224 | | |
| | 724,900 | | | | | Home Depot, Inc. | | | 16,687,198 | | |
| | 2,205,700 | | | | | Macy's, Inc. | | | 22,828,995 | | |
| | 619,300 | | | | | Wal-Mart Stores, Inc. | | | 34,717,958 | | |
| | | | 92,484,868 | | |
| | | | | Semiconductors: 3.5% | |
| | 1,441,700 | | | | | Applied Materials, Inc. | | | 14,604,421 | | |
| | 1,565,400 | | | | | Intel Corp. | | | 22,948,764 | | |
| | 697,400 | | | L | | Linear Technology Corp. | | | 15,426,488 | | |
| | 1,888,300 | | | @@ | | Taiwan Semiconductor
Manufacturing Co.,
Ltd. ADR | | | 14,917,570 | | |
| | | | 67,897,243 | | |
| | | | | Software: 1.5% | |
| | 957,461 | | | | | Microsoft Corp. | | | 18,613,042 | | |
| | 615,650 | | | @ | | Oracle Corp. | | | 10,915,475 | | |
| | | | 29,528,517 | | |
| | | | | Telecommunications: 5.6% | |
| | 1,396,200 | | | | | AT&T, Inc. | | | 39,791,699 | | |
| | 1,687,600 | | | @ | | Cisco Systems, Inc. | | | 27,507,880 | | |
| Shares | | | | | | Value | |
| | 709,750 | | | | | Qualcomm, Inc. | | $ | 25,430,343 | | |
| | 7,935,100 | | | | | Sprint Nextel Corp. | | | 14,521,233 | | |
| | | | 107,251,155 | | |
| | | | | Textiles: 0.7% | |
| | 329,700 | | | @ | | Mohawk Industries, Inc. | | | 14,167,209 | | |
| | | | 14,167,209 | | |
| | | | | Toys/Games/Hobbies: 0.8% | |
| | 37,600 | | | @@ | | Nintendo Co., Ltd. | | | 14,368,903 | | |
| | | | 14,368,903 | | |
| | | | | Transportation: 2.4% | |
| | 267,500 | | | | | CH Robinson Worldwide, Inc. | | | 14,720,525 | | |
| | 552,000 | | | | | United Parcel
Service, Inc. - Class B | | | 30,448,320 | | |
| | | | 45,168,845 | | |
Total Common Stock
(Cost $2,062,504,051) | | | 1,870,066,277 | | |
Principal
Amount | | | | | | Value | |
| CORPORATE BONDS/NOTES: 0.0% | | | |
| | | | | Electric: 0.0% | |
| $ | 20,000,000 | | | ±,L | | Mirant Corp.-Escrow,
due 06/15/21 | | $ | — | | |
| | | | | Energy-Alternate Sources: 0.0% | |
| | 10,000,000 | | | ± | | Southern Energy-Escrow,
due 07/15/09 | | | — | | |
| | | | — | | |
Total Corporate Bonds/Notes
(Cost $—) | | | — | | |
Total Long-Term Investments
(Cost $2,062,504,051) | | | 1,870,066,277 | | |
| SHORT-TERM INVESTMENTS: 1.8% | | | |
| | | | | Commercial Paper: 1.2% | |
| | 10,000,000 | | | S | | Alcoa, Inc., 0.000%,
due 01/13/09 | | | 9,980,681 | | |
| | 12,000,000 | | | | | Volkswagen of America,
0.000%, due 01/21/09 | | | 11,982,499 | | |
Total Commercial Paper
(Cost $21,963,180) | | | 21,963,180 | | |
| Shares | | | | | | Value | |
| | | | | Affiliated Mutual Fund: 0.4% | |
| | 8,173,000 | | | S | | ING Institutional Prime Money
Market Fund - Class I | | $ | 8,173,000 | | |
Total Mutual Fund
(Cost $8,173,000) | | | 8,173,000 | | |
See Accompanying Notes to Financial Statements
79
PORTFOLIO OF INVESTMENTS
ING VP GROWTH AND INCOME PORTFOLIO AS OF DECEMBER 31, 2008 (CONTINUED)
Principal
Amount | | | | Value | |
| | | Securities Lending Collateralcc: 0.2% | |
| $ | 3,721,142 | | | Bank of New York Mellon Corp.
Institutional Cash Reserves | | $ | 3,636,739 | | |
Total Securities Lending
Collateral
(Cost $3,721,142) | | | 3,636,739 | | |
Total Short-Term Investments
(Cost $33,857,322) | | | 33,772,919 | | |
Total Investments in
Securities
(Cost $2,096,361,373)* | | | 99.5 | % | | $ | 1,903,839,196 | | |
Other Assets and
Liabilities - Net | | | 0.5 | | | | 9,188,735 | | |
| Net Assets | | | 100.0 | % | | $ | 1,913,027,931 | | |
@ Non-income producing security
@@ Foreign Issuer
ADR American Depositary Receipt
cc Securities purchased with cash collateral for securities loaned.
S All or a portion of this security is segregated to cover collateral requirements for applicable futures, options, swaps, foreign forward currency contracts and/or when-issued or delayed-delivery securities.
L Loaned security, a portion or all of the security is on loan at December 31, 2008.
± Defaulted security
* Cost for federal income tax purposes is $2,211,381,777.
Net unrealized depreciation consists of:
| Gross Unrealized Appreciation | | $ | 121,103,201 | | |
| Gross Unrealized Depreciation | | | (428,645,782 | ) | |
| Net Unrealized Depreciation | | $ | (307,542,581 | ) | |
The following table summarizes the inputs used as of December 31, 2008 in determining the Portfolio's investments at fair value for purposes of SFAS 157:
| | | Investments in
Securities | | Other Financial
Instruments* | |
| Level 1 — Quoted Prices | | $ | 1,851,855,385 | | | $ | 24,446 | | |
Level 2 — Other Significant
Observable Inputs | | | 51,983,811 | | | | — | | |
Level 3 — Significant
Unobservable Inputs | | | — | | | | — | | |
| Total | | $ | 1,903,839,196 | | | $ | 24,446 | | |
"Fair value" for purposes of SFAS 157 is different from "fair value" as used in the 1940 Act. The former generally implies market value, and can include market quotations as a source of value, and the latter refers to determinations of actual value in absence of available market quotations.
* Other financial instruments may include forward foreign currency contracts, futures, swaps, and written options. Forward foreign currency contracts and futures are reported at their unrealized gain/loss at year end. Swaps and written options are reported at their market value at year end.
ING VP Growth and Income Portfolio Open Futures Contracts on December 31, 2008:
Contract
Description | | Number of
Contracts | | Expiration
Date | | Unrealized
Appreciation | |
| Long Contracts | |
| S&P 500 | | | 20 | | | 03/19/09 | | $ | 24,446 | | |
| | | | | | | $ | 24,446 | | |
See Accompanying Notes to Financial Statements
80
ING OPPORTUNISTIC LARGECAP PORTFOLIO OF INVESTMENTS
GROWTH PORTFOLIO AS OF DECEMBER 31, 2008
| Shares | | | | | | Value | |
| COMMON STOCK: 98.2% | | | |
| | | | | Aerospace/Defense: 5.8% | |
| | 28,200 | | | | | Lockheed Martin Corp. | | $ | 2,371,056 | | |
| | 29,300 | | | | | Raytheon Co. | | | 1,495,472 | | |
| | | | 3,866,528 | | |
| | | | | Agriculture: 2.0% | |
| | 46,900 | | | | | Archer-Daniels-Midland Co. | | | 1,352,127 | | |
| | | | 1,352,127 | | |
| | | | | Airlines: 0.9% | |
| | 73,900 | | | | | Southwest Airlines Co. | | | 637,018 | | |
| | | | 637,018 | | |
| | | | | Biotechnology: 5.9% | |
| | 11,500 | | | @ | | Amgen, Inc. | | | 664,125 | | |
| | 25,100 | | | @ | | Biogen Idec, Inc. | | | 1,195,513 | | |
| | 50,598 | | | @ | | Life Technologies Corp. | | | 1,179,439 | | |
| | 13,500 | | | @ | | Myriad Genetics, Inc. | | | 894,510 | | |
| | | | 3,933,587 | | |
| | | | | Chemicals: 3.1% | |
| | 21,700 | | | | | Monsanto Co. | | | 1,526,595 | | |
| | 9,400 | | | | | Sherwin-Williams Co. | | | 561,650 | | |
| | | | 2,088,245 | | |
| | | | | Commercial Services: 2.9% | |
| | 30,800 | | | @ | | Alliance Data Systems Corp. | | | 1,433,124 | | |
| | 6,400 | | | @ | | Apollo Group, Inc. - Class A | | | 490,368 | | |
| | | | 1,923,492 | | |
| | | | | Computers: 8.0% | |
| | 30,700 | | | @ | | Apple, Inc. | | | 2,620,245 | | |
| | 32,000 | | | | | Hewlett-Packard Co. | | | 1,161,280 | | |
| | 18,400 | | | | | International Business
Machines Corp. | | | 1,548,544 | | |
| | | | 5,330,069 | | |
| | | | | Cosmetics/Personal Care: 3.7% | |
| | 39,883 | | | | | Procter & Gamble Co. | | | 2,465,567 | | |
| | | | 2,465,567 | | |
| | | | | Electronics: 1.4% | |
| | 28,300 | | | @ | | Dolby Laboratories, Inc. | | | 927,108 | | |
| | | | 927,108 | | |
| | | | | Engineering & Construction: 2.5% | |
| | 36,700 | | | | | Fluor Corp. | | | 1,646,729 | | |
| | | | 1,646,729 | | |
| | | | | Food: 2.8% | |
| | 28,500 | | | @ | | Dean Foods Co. | | | 512,145 | | |
| | 35,800 | | | | | HJ Heinz Co. | | | 1,346,080 | | |
| | | | 1,858,225 | | |
| | | | | Healthcare-Products: 4.1% | |
| | 48,600 | | | @ | | St. Jude Medical, Inc. | | | 1,601,856 | | |
| | 32,600 | | | @ | | Varian Medical Systems, Inc. | | | 1,142,304 | | |
| | | | 2,744,160 | | |
| | | | | Healthcare-Services: 1.0% | |
| | 10,500 | | | @ | | Laboratory Corp. of
America Holdings | | | 676,305 | | |
| | | | 676,305 | | |
| Shares | | | | | | Value | |
| | | | | Household Products/Wares: 2.6% | |
| | 16,500 | | | | | Church & Dwight Co., Inc. | | $ | 925,980 | | |
| | 15,700 | | | | | Kimberly-Clark Corp. | | | 828,018 | | |
| | | | 1,753,998 | | |
| | | | | Insurance: 1.8% | |
| | 15,000 | | | | | Aflac, Inc. | | | 687,600 | | |
| | 11,800 | | | | | AON Corp. | | | 539,024 | | |
| | | | 1,226,624 | | |
| | | | | Internet: 1.9% | |
| | 1,100 | | | @ | | Google, Inc. - Class A | | | 338,415 | | |
| | 68,400 | | | @ | | Symantec Corp. | | | 924,768 | | |
| | | | 1,263,183 | | |
| | | | | Media: 2.2% | |
| | 88,600 | | | | | Comcast Corp. - Class A | | | 1,495,568 | | |
| | | | 1,495,568 | | |
| | | | | Metal Fabricate/Hardware: 1.0% | |
| | 11,000 | | | | | Precision Castparts Corp. | | | 654,280 | | |
| | | | 654,280 | | |
| | | | | Miscellaneous Manufacturing: 3.6% | |
| | 56,800 | | | | | Cooper Industries Ltd. | | | 1,660,264 | | |
| | 22,400 | | | | | Dover Corp. | | | 737,408 | | |
| | | | 2,397,672 | | |
| | | | | Oil & Gas: 6.9% | |
| | 14,100 | | | | | ExxonMobil Corp. | | | 1,125,603 | | |
| | 10,500 | | | | | Murphy Oil Corp. | | | 465,675 | | |
| | 64,100 | | | | | Noble Corp. | | | 1,415,969 | | |
| | 37,900 | | | | | Sunoco, Inc. | | | 1,647,134 | | |
| | | | 4,654,381 | | |
| | | | | Oil & Gas Services: 0.7% | |
| | 20,300 | | | @ | | National Oilwell Varco, Inc. | | | 496,132 | | |
| | | | 496,132 | | |
| | | | | Packaging & Containers: 1.5% | |
| | 51,700 | | | @ | | Crown Holdings, Inc. | | | 992,640 | | |
| | | | 992,640 | | |
| | | | | Pharmaceuticals: 7.2% | |
| | 10,300 | | | @,L | | Cephalon, Inc. | | | 793,512 | | |
| | 20,100 | | | @ | | Endo Pharmaceuticals Holdings, Inc. | | | 520,188 | | |
| | 28,100 | | | @ | | Express Scripts, Inc. | | | 1,544,938 | | |
| | 57,700 | | | @ | | Forest Laboratories, Inc. | | | 1,469,619 | | |
| | 19,400 | | | @ | | Watson Pharmaceuticals, Inc. | | | 515,458 | | |
| | | | 4,843,715 | | |
| | | | | Retail: 9.4% | |
| | 6,600 | | | @ | | Autozone, Inc. | | | 920,502 | | |
| | 100,500 | | | | | Gap, Inc. | | | 1,345,695 | | |
| | 53,100 | | | | | Limited Brands, Inc. | | | 533,124 | | |
| | 21,000 | | | | | Ross Stores, Inc. | | | 624,330 | | |
| | 93,100 | | | | | TJX Cos., Inc. | | | 1,915,067 | | |
| | 17,500 | | | | | Wal-Mart Stores, Inc. | | | 981,050 | | |
| | | | 6,319,768 | | |
| | | | | Savings & Loans: 1.2% | |
| | 50,000 | | | | | Hudson City Bancorp., Inc. | | | 798,000 | | |
| | | | 798,000 | | |
See Accompanying Notes to Financial Statements
81
ING OPPORTUNISTIC LARGECAP PORTFOLIO OF INVESTMENTS
GROWTH PORTFOLIO AS OF DECEMBER 31, 2008 (CONTINUED)
| Shares | | | | | | Value | |
| | | | | Semiconductors: 6.5% | |
| | 108,400 | | | | | Altera Corp. | | $ | 1,811,364 | | |
| | 96,400 | | | @,@@ | | Marvell Technology Group Ltd. | | | 642,988 | | |
| | 105,700 | | | | | Xilinx, Inc. | | | 1,883,574 | | |
| | | | 4,337,926 | | |
| | | | | Software: 4.2% | |
| | 89,000 | | | | | CA, Inc. | | | 1,649,170 | | |
| | 30,600 | | | | | Microsoft Corp. | | | 594,864 | | |
| | 31,600 | | | @ | | Oracle Corp. | | | 560,268 | | |
| | | | 2,804,302 | | |
| | | | | Telecommunications: 1.9% | |
| | 40,800 | | | @ | | Juniper Networks, Inc. | | | 714,408 | | |
| | 64,300 | | | | | Windstream Corp. | | | 591,560 | | |
| | | | 1,305,968 | | |
| | | | | Toys/Games/Hobbies: 1.5% | |
| | 34,900 | | | | | Hasbro, Inc. | | | 1,018,033 | | |
| | | | 1,018,033 | | |
Total Common Stock
(Cost $77,969,343) | | | 65,811,350 | | |
| EXCHANGE-TRADED FUNDS: 0.8% | | | |
| | | | | Exchange-Traded Funds: 0.8% | |
| | 14,200 | | | | | iShares Russell 1000
Growth Index Fund | | | 526,252 | | |
Total Exchange-Traded Funds
(Cost $531,471) | | | 526,252 | | |
Total Long-Term Investments
(Cost $78,500,814) | | | 66,337,602 | | |
| SHORT-TERM INVESTMENTS: 2.3% | | | |
| | | | | Affiliated Mutual Fund: 1.1% | |
| | 765,000 | | | | | ING Institutional Prime Money
Market Fund - Class I | | | 765,000 | | |
Total Mutual Fund
(Cost $765,000) | | | 765,000 | | |
Principal
Amount | | | | Value | |
| | | Securities Lending Collateralcc: 1.2% | |
| $ | 806,060 | | | Bank of New York Mellon Corp.
Institutional Cash Reserves | | $ | 771,235 | | |
Total Securities Lending Collateral
(Cost $806,060) | | | 771,235 | | |
Total Short-Term Investments
(Cost $1,571,060) | | | 1,536,235 | | |
Total Investments in
Securities
(Cost $80,071,874)* | | | 101.3 | % | | $ | 67,873,837 | | |
Other Assets and
Liabilities - Net | | | (1.3 | ) | | | (838,066 | ) | |
| Net Assets | | | 100.0 | % | | $ | 67,035,771 | | |
@ Non-income producing security
@@ Foreign Issuer
cc Securities purchased with cash collateral for securities loaned.
L Loaned security, a portion or all of the security is on loan at December 31, 2008.
* Cost for federal income tax purposes is $81,253,727.
Net unrealized depreciation consists of:
| Gross Unrealized Appreciation | | $ | 1,985,953 | | |
| Gross Unrealized Depreciation | | | (15,365,843 | ) | |
| Net Unrealized Depreciation | | $ | (13,379,890 | ) | |
The following table summarizes the inputs used as of December 31, 2008 in determining the Portfolio's investments at fair value for purposes of SFAS 157:
| | | Investments in
Securities | | Other Financial
Instruments* | |
| Level 1 — Quoted Prices | | $ | 67,102,602 | | | $ | — | | |
Level 2 — Other Significant
Observable Inputs | | | 771,235 | | | | — | | |
Level 3 — Significant
Unobservable Inputs | | | — | | | | — | | |
| Total | | $ | 67,873,837 | | | $ | — | | |
"Fair value" for purposes of SFAS 157 is different from "fair value" as used in the 1940 Act. The former generally implies market value, and can include market quotations as a source of value, and the latter refers to determinations of actual value in absence of available market quotations.
* Other financial instruments may include forward foreign currency contracts, futures, swaps, and written options. Forward foreign currency contracts and futures are reported at their unrealized gain/loss at year end. Swaps and written options are reported at their market value at year end.
See Accompanying Notes to Financial Statements
82
PORTFOLIO OF INVESTMENTS
ING VP SMALL COMPANY PORTFOLIO AS OF DECEMBER 31, 2008
| Shares | | | | | | Value | |
| COMMON STOCK: 88.3% | | | |
| | | | | Advertising: 0.5% | |
| | 201,840 | | | @ | | inVentiv Health, Inc. | | $ | 2,329,234 | | |
| | | | 2,329,234 | | |
| | | | | Aerospace/Defense: 1.9% | |
| | 133,838 | | | @ | | Moog, Inc. | | | 4,894,456 | | |
| | 89,100 | | | @ | | Teledyne Technologies, Inc. | | | 3,969,405 | | |
| | | | 8,863,861 | | |
| | | | | Apparel: 0.3% | |
| | 103,605 | | | @,@@,L | | Gildan Activewear, Inc. | | | 1,218,395 | | |
| | | | 1,218,395 | | |
| | | | | Auto Parts & Equipment: 1.5% | |
| | 496,800 | | | | | ArvinMeritor, Inc. | | | 1,415,880 | | |
| | 151,400 | | | | | BorgWarner, Inc. | | | 3,295,978 | | |
| | 369,500 | | | | | Cooper Tire & Rubber Co. | | | 2,276,120 | | |
| | | | 6,987,978 | | |
| | | | | Banks: 7.5% | |
| | 260,214 | | | L | | Bank Mutual Corp. | | | 3,002,870 | | |
| | 288,400 | | | | | Boston Private Financial
Holdings, Inc. | | | 1,972,656 | | |
| | 631,700 | | | | | Citizens Banking Corp. | | | 1,882,466 | | |
| | 194,200 | | | | | First Commonwealth
Financial Corp. | | | 2,404,196 | | |
| | 130,926 | | | | | First Midwest Bancorp., Inc. | | | 2,614,592 | | |
| | 155,450 | | | | | FirstMerit Corp. | | | 3,200,716 | | |
| | 50,600 | | | L | | Hancock Holding Co. | | | 2,300,276 | | |
| | 136,200 | | | L | | Old National Bancorp. | | | 2,473,392 | | |
| | 72,900 | | | L | | PrivateBancorp, Inc. | | | 2,366,334 | | |
| | 106,418 | | | | | Prosperity Bancshares, Inc. | | | 3,148,909 | | |
| | 93,950 | | | @ | | Signature Bank | | | 2,695,426 | | |
| | 96,044 | | | @ | | Texas Capital Bancshares, Inc. | | | 1,283,148 | | |
| | 68,172 | | | | | UMB Financial Corp. | | | 3,349,972 | | |
| | 44,300 | | | | | Westamerica Bancorp. | | | 2,265,945 | | |
| | | | 34,960,898 | | |
| | | | | Biotechnology: 1.8% | |
| | 41,000 | | | @,L | | AMAG Pharmaceuticals, Inc. | | | 1,469,850 | | |
| | 58,326 | | | @ | | Bio-Rad Laboratories, Inc. | | | 4,392,531 | | |
| | 307,574 | | | @ | | RTI Biologics, Inc. | | | 848,904 | | |
| | 24,928 | | | @,L | | United Therapeutics Corp. | | | 1,559,246 | | |
| | | | 8,270,531 | | |
| | | | | Chemicals: 2.5% | |
| | 184,900 | | | | | Albemarle Corp. | | | 4,123,270 | | |
| | 96,900 | | | | | Cytec Industries, Inc. | | | 2,056,218 | | |
| | 182,900 | | | | | HB Fuller Co. | | | 2,946,519 | | |
| | 175,200 | | | | | RPM International, Inc. | | | 2,328,408 | | |
| | | | 11,454,415 | | |
| | | | | Commercial Services: 2.8% | |
| | 193,237 | | | | | Arbitron, Inc. | | | 2,566,187 | | |
| | 82,164 | | | @,L | | Bankrate, Inc. | | | 3,122,232 | | |
| | 181,700 | | | @,L | | TrueBlue, Inc. | | | 1,738,869 | | |
| | 119,010 | | | | | Watson Wyatt Worldwide, Inc. | | | 5,691,058 | | |
| | | | 13,118,346 | | |
| | | | | Computers: 2.6% | |
| | 114,400 | | | @ | | CACI International, Inc. | | | 5,158,296 | | |
| | 560,907 | | | @ | | Mentor Graphics Corp. | | | 2,899,889 | | |
| | 243,900 | | | @ | | Micros Systems, Inc. | | | 3,980,448 | | |
| | 101,700 | | | @,@@ | | Xyratex Ltd. | | | 300,015 | | |
| | | | 12,338,648 | | |
| Shares | | | | | | Value | |
| | | | | Distribution/Wholesale: 2.9% | |
| | 234,700 | | | @,L | | Fossil, Inc. | | $ | 3,919,490 | | |
| | 76,600 | | | | | Owens & Minor, Inc. | | | 2,883,990 | | |
| | 217,397 | | | @ | | Tech Data Corp. | | | 3,878,362 | | |
| | 76,300 | | | L | | Watsco, Inc. | | | 2,929,920 | | |
| | | | 13,611,762 | | |
| | | | | Diversified Financial Services: 2.0% | |
| | 119,400 | | | @ | | Interactive Brokers Group, Inc. | | | 2,136,066 | | |
| | 178,550 | | | @ | | Knight Capital Group, Inc. | | | 2,883,583 | | |
| | 55,847 | | | @ | | Stifel Financial Corp. | | | 2,560,585 | | |
| | 105,100 | | | | | Waddell & Reed Financial, Inc. | | | 1,624,846 | | |
| | | | 9,205,080 | | |
| | | | | Electric: 3.0% | |
| | 226,700 | | | | | Cleco Corp. | | | 5,175,561 | | |
| | 130,118 | | | | | Idacorp, Inc. | | | 3,831,975 | | |
| | 259,668 | | | | | Portland General Electric Co. | | | 5,055,730 | | |
| | | | 14,063,266 | | |
| | | | | | | Electrical Components &
Equipment: 1.3% | | | | | |
| | 263,067 | | | @ | | Advanced Energy Industries, Inc. | | | 2,617,517 | | |
| | 43,400 | | | @,L | | Energy Conversion Devices, Inc. | | | 1,094,114 | | |
| | 89,375 | | | @ | | Greatbatch, Inc. | | | 2,364,863 | | |
| | | | 6,076,494 | | |
| | | | | Electronics: 3.4% | |
| | 161,100 | | | @,L | | FEI Co. | | | 3,038,346 | | |
| | 42,354 | | | @ | | Flir Systems, Inc. | | | 1,299,421 | | |
| | 190,200 | | | @ | | Plexus Corp. | | | 3,223,890 | | |
| | 135,207 | | | @ | | Varian, Inc. | | | 4,530,787 | | |
| | 156,300 | | | | | Watts Water Technologies, Inc. | | | 3,902,811 | | |
| | | | 15,995,255 | | |
| | | | | Environmental Control: 1.5% | |
| | 31,539 | | | @ | | Clean Harbors, Inc. | | | 2,000,834 | | |
| | 151,899 | | | @ | | Waste Connections, Inc. | | | 4,795,451 | | |
| | | | 6,796,285 | | |
| | | | | Food: 2.5% | |
| | 95,800 | | | | | Corn Products International, Inc. | | | 2,763,830 | | |
| | 161,469 | | | | | Flowers Foods, Inc. | | | 3,933,385 | | |
| | 33,900 | | | @ | | Ralcorp Holdings, Inc. | | | 1,979,760 | | |
| | 126,200 | | | | | Spartan Stores, Inc. | | | 2,934,150 | | |
| | | | 11,611,125 | | |
| | | | | Gas: 1.3% | |
| | 48,100 | | | | | New Jersey Resources Corp. | | | 1,892,735 | | |
| | 127,301 | | | | | WGL Holdings, Inc. | | | 4,161,470 | | |
| | | | 6,054,205 | | |
| | | | | Hand/Machine Tools: 1.0% | |
| | 125,900 | | | | | Regal-Beloit Corp. | | | 4,782,941 | | |
| | | | 4,782,941 | | |
| | | | | Healthcare-Products: 2.4% | |
| | 94,900 | | | @ | | Immucor, Inc. | | | 2,522,442 | | |
| | 132,252 | | | | | Meridian Bioscience, Inc. | | | 3,368,458 | | |
| | 184,624 | | | @ | | Micrus Endovascular Corp. | | | 2,143,485 | | |
| | 159,299 | | | @,@@ | | Orthofix International NV | | | 2,442,054 | | |
| | 341,387 | | | @ | | Spectranetics Corp. | | | 891,020 | | |
| | | | 11,367,459 | | |
See Accompanying Notes to Financial Statements
83
PORTFOLIO OF INVESTMENTS
ING VP SMALL COMPANY PORTFOLIO AS OF DECEMBER 31, 2008 (CONTINUED)
| Shares | | | | | | Value | |
| | | | | Healthcare-Services: 1.5% | |
| | 176,800 | | | @ | | Nighthawk Radiology
Holdings, Inc. | | $ | 859,248 | | |
| | 88,000 | | | @ | | Psychiatric Solutions, Inc. | | | 2,450,800 | | |
| | 104,261 | | | | | Universal Health Services, Inc. | | | 3,917,086 | | |
| | | | 7,227,134 | | |
| | | | | Home Builders: 0.6% | |
| | 149,500 | | | | | Ryland Group, Inc. | | | 2,641,665 | | |
| | | | 2,641,665 | | |
| | | | | Housewares: 0.6% | |
| | 85,300 | | | L | | Toro Co. | | | 2,814,900 | | |
| | | | 2,814,900 | | |
| | | | | Insurance: 4.6% | |
| | 82,487 | | | @,@@ | | Argo Group International
Holdings Ltd. | | | 2,797,959 | | |
| | 171,354 | | | @@ | | Aspen Insurance Holdings Ltd. | | | 4,155,335 | | |
| | 112,200 | | | | | Brown & Brown, Inc. | | | 2,344,980 | | |
| | 115,900 | | | @@ | | Platinum Underwriters
Holdings Ltd. | | | 4,181,672 | | |
| | 67,418 | | | @ | | ProAssurance Corp. | | | 3,558,322 | | |
| | 128,600 | | | | | Selective Insurance Group | | | 2,948,798 | | |
| | 58,500 | | | | | Stewart Information
Services Corp. | | | 1,374,165 | | |
| | | | 21,361,231 | | |
| | | | | Machinery-Diversified: 2.5% | |
| | 118,727 | | | @ | | Gardner Denver, Inc. | | | 2,771,088 | | |
| | 86,500 | | | L | | Nordson Corp. | | | 2,793,085 | | |
| | 96,700 | | | | | Tennant Co. | | | 1,489,180 | | |
| | 115,121 | | | | | Wabtec Corp. | | | 4,576,060 | | |
| | | | 11,629,413 | | |
| | | | | Media: 0.1% | |
| | 255,114 | | | | | Entercom Communications Corp. | | | 313,790 | | |
| | | | 313,790 | | |
| | | | | Metal Fabricate/Hardware: 0.8% | |
| | 320,200 | | | | | Commercial Metals Co. | | | 3,800,774 | | |
| | | | 3,800,774 | | |
| | | | | Miscellaneous Manufacturing: 1.4% | |
| | 138,600 | | | | | Actuant Corp. | | | 2,636,172 | | |
| | 256,090 | | | | | Barnes Group, Inc. | | | 3,713,305 | | |
| | | | 6,349,477 | | |
| | | | | Oil & Gas: 3.5% | |
| | 85,400 | | | @ | | Bill Barrett Corp. | | | 1,804,502 | | |
| | 183,228 | | | @ | | Carrizo Oil & Gas, Inc. | | | 2,949,971 | | |
| | 51,900 | | | @ | | Comstock Resources, Inc. | | | 2,452,275 | | |
| | 281,900 | | | @ | | EXCO Resources, Inc. | | | 2,554,014 | | |
| | 183,000 | | | | | Frontier Oil Corp. | | | 2,311,290 | | |
| | 178,100 | | | @ | | McMoRan Exploration Co. | | | 1,745,380 | | |
| | 97,300 | | | @ | | Unit Corp. | | | 2,599,856 | | |
| | | | 16,417,288 | | |
| | | | | Oil & Gas Services: 1.6% | |
| | 61,165 | | | | | Core Laboratories NV | | | 3,661,337 | | |
| | 101,600 | | | @ | | Dril-Quip, Inc. | | | 2,083,816 | | |
| | 310,224 | | | @ | | Tetra Technologies, Inc. | | | 1,507,689 | | |
| | | | 7,252,842 | | |
| Shares | | | | | | Value | |
| | | | | Packaging & Containers: 1.7% | |
| | 47,300 | | | @ | | Owens-Illinois, Inc. | | $ | 1,292,709 | | |
| | 81,529 | | | @ | | Pactiv Corp. | | | 2,028,442 | | |
| | 99,400 | | | | | Silgan Holdings, Inc. | | | 4,752,314 | | |
| | | | 8,073,465 | | |
| | | | | Pharmaceuticals: 2.9% | |
| | 495,900 | | | @,L | | Akorn, Inc. | | | 1,140,570 | | |
| | 169,830 | | | @,L | | KV Pharmaceutical Co. | | | 489,110 | | |
| | 240,800 | | | @,L | | Mylan Laboratories | | | 2,381,512 | | |
| | 146,000 | | | | | Omnicare, Inc. | | | 4,052,960 | | |
| | 83,500 | | | @ | | Onyx Pharmaceuticals, Inc. | | | 2,852,360 | | |
| | 74,418 | | | | | Perrigo Co. | | | 2,404,446 | | |
| | | | 13,320,958 | | |
| | | | | Retail: 5.3% | |
| | 66,747 | | | | | Cash America International, Inc. | | | 1,825,530 | | |
| | 164,086 | | | @ | | Gymboree Corp. | | | 4,281,004 | | |
| | 199,237 | | | @ | | Jack in the Box, Inc. | | | 4,401,145 | | |
| | 270,113 | | | @,L | | Jo-Ann Stores, Inc. | | | 4,184,050 | | |
| | 202,512 | | | @ | | Papa John's International, Inc. | | | 3,732,296 | | |
| | 228,500 | | | | | Regis Corp. | | | 3,320,105 | | |
| | 341,534 | | | | | Stage Stores, Inc. | | | 2,817,656 | | |
| | | | 24,561,786 | | |
| | | | | Savings & Loans: 3.0% | |
| | 107,100 | | | | | Astoria Financial Corp. | | | 1,765,008 | | |
| | 200,490 | | | L | | First Niagara Financial
Group, Inc. | | | 3,241,923 | | |
| | 249,268 | | | | | NewAlliance Bancshares, Inc. | | | 3,282,860 | | |
| | 183,900 | | | | | Provident Financial Services, Inc. | | | 2,813,670 | | |
| | 257,541 | | | | | Westfield Financial, Inc. | | | 2,657,823 | | |
| | | | 13,761,284 | | |
| | | | | Semiconductors: 4.3% | |
| | 656,800 | | | @ | | Emulex Corp. | | | 4,584,464 | | |
| | 756,300 | | | @ | | Entegris, Inc. | | | 1,656,297 | | |
| | 205,200 | | | @,L | | Formfactor, Inc. | | | 2,995,920 | | |
| | 200,400 | | | | | Micrel, Inc. | | | 1,464,924 | | |
| | 193,300 | | | @ | | MKS Instruments, Inc. | | | 2,858,907 | | |
| | 392,800 | | | @ | | ON Semiconductor Corp. | | | 1,335,520 | | |
| | 80,000 | | | L | | Power Integrations, Inc. | | | 1,590,400 | | |
| | 352,932 | | | @,@@ | | Verigy Ltd. | | | 3,395,206 | | |
| | | | 19,881,638 | | |
| | | | | Software: 4.7% | |
| | 151,892 | | | @ | | Ansys, Inc. | | | 4,236,268 | | |
| | 293,100 | | | @,L | | Epicor Software Corp. | | | 1,406,880 | | |
| | 247,200 | | | @ | | Informatica Corp. | | | 3,394,056 | | |
| | 342,700 | | | @ | | Parametric Technology Corp. | | | 4,335,155 | | |
| | 143,000 | | | @ | | Progress Software Corp. | | | 2,754,180 | | |
| | 202,300 | | | @,L | | Solera Holdings, Inc. | | | 4,875,430 | | |
| | 227,250 | | | @ | | THQ, Inc. | | | 952,178 | | |
| | | | 21,954,147 | | |
| | | | | Telecommunications: 3.4% | |
| | 226,900 | | | | | Adtran, Inc. | | | 3,376,272 | | |
| | 445,860 | | | | | Alaska Communications
Systems Group, Inc. | | | 4,182,167 | | |
| | 98,100 | | | | | NTELOS Holdings Corp. | | | 2,419,146 | | |
| | 66,300 | | | L | | Otelco, Inc. | | | 501,891 | | |
| | 269,037 | | | @ | | Polycom, Inc. | | | 3,634,690 | | |
| | 292,628 | | | @ | | RCN Corp. | | | 1,726,505 | | |
| | | | 15,840,671 | | |
See Accompanying Notes to Financial Statements
84
PORTFOLIO OF INVESTMENTS
ING VP SMALL COMPANY PORTFOLIO AS OF DECEMBER 31, 2008 (CONTINUED)
| Shares | | | | | | Value | |
| | | | | Transportation: 3.1% | |
| | 146,900 | | | @,L | | Atlas Air Worldwide
Holdings, Inc. | | $ | 2,776,410 | | |
| | 281,600 | | | | | Heartland Express, Inc. | | | 4,438,016 | | |
| | 67,000 | | | @ | | HUB Group, Inc. | | | 1,777,510 | | |
| | 99,400 | | | @ | | Kirby Corp. | | | 2,719,584 | | |
| | 102,300 | | | @ | | Old Dominion Freight Line | | | 2,911,458 | | |
| | | | 14,622,978 | | |
Total Common Stock
(Cost $526,212,121) | | | 410,931,619 | | |
| REAL ESTATE INVESTMENT TRUSTS: 5.3% | | | |
| | | | | Apartments: 1.3% | |
| | 138,100 | | | | | American Campus
Communities, Inc. | | | 2,828,288 | | |
| | 75,441 | | | L | | Home Properties, Inc. | | | 3,062,905 | | |
| | | | 5,891,193 | | |
| | | | | Diversified: 0.7% | |
| | 114,900 | | | | | Washington Real Estate
Investment Trust | | | 3,251,670 | | |
| | | | 3,251,670 | | |
| | | | | Health Care: 0.7% | |
| | 171,058 | | | | | Senior Housing Properties Trust | | | 3,065,359 | | |
| | | | 3,065,359 | | |
| | | | | Mortgage: 0.4% | |
| | 76,581 | | | | | Hatteras Financial Corp. | | | 2,037,055 | | |
| | | | 2,037,055 | | |
| | | | | Office Property: 0.7% | |
| | 104,800 | | | | | Corporate Office Properties
Trust SBI MD | | | 3,217,360 | | |
| | | | 3,217,360 | | |
| | | | | Single Tenant: 1.2% | |
| | 161,100 | | | L | | National Retail Properties, Inc. | | | 2,769,309 | | |
| | 129,100 | | | | | Realty Income Corp. | | | 2,988,665 | | |
| | | | 5,757,974 | | |
| | | | | Storage: 0.3% | |
| | 373,889 | | | | | U-Store-It Trust | | | 1,663,806 | | |
| | | | 1,663,806 | | |
Total Real Estate
Investment Trusts
(Cost $25,440,790) | | | 24,884,417 | | |
| EXCHANGE-TRADED FUNDS: 3.9% | | | |
| | | | | Exchange-Traded Funds: 3.9% | |
| | 281,913 | | | | | iShares Russell 2000 Index Fund | | | 13,889,854 | | |
| | 84,900 | | | | | iShares Russell 2000 Value
Index Fund | | | 4,174,533 | | |
Total Exchange-Traded Funds
(Cost $17,754,455) | | | 18,064,387 | | |
Total Long-Term Investments
(Cost $569,407,366) | | | 453,880,423 | | |
| SHORT-TERM INVESTMENTS: 9.0% | | | |
| | | | | Affiliated Mutual Fund: 2.1% | |
| | 9,691,000 | | | | | ING Institutional Prime Money
Market Fund - Class I | | | 9,691,000 | | |
Total Mutual Fund
(Cost $9,691,000) | | | 9,691,000 | | |
| Shares | | | | Value | |
| | | Repurchase Agreement: 1.1% | |
| $ | 4,897,000 | | | Goldman Sachs Repurchase
Agreement dated 12/31/08,
0.010%, due 01/02/09,
$4,897,003 to be
received upon repurchase
(Collateralized by
$3,140,600 U.S. Treasury,
8.875%, Market Value
plus accrued interest
$4,995,034, due 02/15/19) | | $ | 4,897,000 | | |
Total Repurchase Agreement
(Cost $4,897,000) | | | 4,897,000 | | |
| | | Securities Lending Collateralcc: 5.8% | |
| | 27,583,319 | | | Bank of New York
Mellon Corp.
Institutional Cash
Reserves | | | 27,093,656 | | |
Total Securities
Lending Collateral
(Cost $27,583,319) | | | 27,093,656 | | |
Total Short-Term
Investments
(Cost $42,171,319) | | | 41,681,656 | | |
Total Investments in
Securities
(Cost $611,578,685)* | | | 106.5 | % | | $ | 495,562,079 | | |
Other Assets and
Liabilities - Net | | | (6.5 | ) | | | (30,167,963 | ) | |
| Net Assets | | | 100.0 | % | | $ | 465,394,116 | | |
@ Non-income producing security
@@ Foreign Issuer
cc Securities purchased with cash collateral for securities loaned.
L Loaned security, a portion or all of the security is on loan at December 31, 2008.
* Cost for federal income tax purposes is $632,994,269.
Net unrealized depreciation consists of:
| Gross Unrealized Appreciation | | $ | 12,514,412 | | |
| Gross Unrealized Depreciation | | | (149,946,602 | ) | |
| Net Unrealized Depreciation | | $ | (137,432,190 | ) | |
The following table summarizes the inputs used as of December 31, 2008 in determining the Portfolio's investments at fair value for purposes of SFAS 157:
| | | Investments in
Securities | | Other Financial
Instruments* | |
| Level 1 — Quoted Prices | | $ | 463,571,423 | | | $ | — | | |
Level 2 — Other Significant
Observable Inputs | | | 31,990,656 | | | | — | | |
Level 3 — Significant
Unobservable Inputs | | | — | | | | — | | |
| Total | | $ | 495,562,079 | | | $ | — | | |
"Fair value" for purposes of SFAS 157 is different from "fair value" as used in the 1940 Act. The former generally implies market value, and can include market quotations as a source of value, and the latter refers to determinations of actual value in absence of available market quotations.
* Other financial instruments may include forward foreign currency contracts, futures, swaps, and written options. Forward foreign currency contracts and futures are reported at their unrealized gain/loss at year end. Swaps and written options are reported at their market value at year end.
See Accompanying Notes to Financial Statements
85
ING OPPORTUNISTIC LARGECAP PORTFOLIO OF INVESTMENTS
VALUE PORTFOLIO AS OF DECEMBER 31, 2008
| Shares | | | | | | Value | |
| COMMON STOCK: 96.2% | | | |
| | | | | Advertising: 0.7% | |
| | 22,700 | | | | | Omnicom Group | | $ | 611,084 | | |
| | | | 611,084 | | |
| | | | | Aerospace/Defense: 3.3% | |
| | 30,000 | | | | | General Dynamics Corp. | | | 1,727,700 | | |
| | 21,700 | | | | | Raytheon Co. | | | 1,107,568 | | |
| | | | 2,835,268 | | |
| | | | | Agriculture: 5.0% | |
| | 100,700 | | | | | Altria Group, Inc. | | | 1,516,542 | | |
| | 31,400 | | | | | Archer-Daniels-Midland Co. | | | 905,262 | | |
| | 32,400 | | | | | Lorillard, Inc. | | | 1,825,739 | | |
| | | | 4,247,543 | | |
| | | | | Banks: 6.5% | |
| | 57,100 | | | @@,L | | Banco Bilbao Vizcaya Argentaria
SA ADR | | | 713,179 | | |
| | 85,600 | | | @@,L | | Banco Santander Central Hispano
SA ADR | | | 812,344 | | |
| | 54,500 | | | | | Bank of America Corp. | | | 767,360 | | |
| | 35,800 | | | | | Capital One Financial Corp. | | | 1,141,662 | | |
| | 21,700 | | | | | JPMorgan Chase & Co. | | | 684,201 | | |
| | 62,700 | | | @@,L | | Lloyds TSB Group PLC - Spon ADR | | | 482,790 | | |
| | 121,500 | | | | | Regions Financial Corp. | | | 967,140 | | |
| | | | 5,568,676 | | |
| | | | | Chemicals: 1.1% | |
| | 15,100 | | | | | Sherwin-Williams Co. | | | 902,225 | | |
| | | | 902,225 | | |
| | | | | Commercial Services: 0.7% | |
| | 30,100 | | | L | | Moody's Corp. | | | 604,709 | | |
| | | | 604,709 | | |
| | | | | Computers: 1.7% | |
| | 139,500 | | | @ | | EMC Corp. | | | 1,460,565 | | |
| | | | 1,460,565 | | |
| | | | | Distribution/Wholesale: 0.8% | |
| | 18,500 | | | | | Genuine Parts Co. | | | 700,410 | | |
| | | | 700,410 | | |
| | | | | Diversified Financial Services: 4.3% | |
| | 59,700 | | | | | American Express Co. | | | 1,107,435 | | |
| | 29,700 | | | | | Ameriprise Financial, Inc. | | | 693,792 | | |
| | 71,500 | | | | | Invesco Ltd. | | | 1,032,460 | | |
| | 31,000 | | | | | NYSE Euronext | | | 848,780 | | |
| | | | 3,682,467 | | |
| | | | | Electric: 8.4% | |
| | 62,700 | | | | | Alliant Energy Corp. | | | 1,829,586 | | |
| | 52,600 | | | | | DTE Energy Co. | | | 1,876,242 | | |
| | 58,300 | | | | | Edison International | | | 1,872,596 | | |
| | 9,100 | | | | | Entergy Corp. | | | 756,483 | | |
| | 36,800 | | | @,L | | NRG Energy, Inc. | | | 858,544 | | |
| | | | 7,193,451 | | |
| | | | | Electronics: 1.6% | |
| | 39,200 | | | @ | | Thermo Electron Corp. | | | 1,335,544 | | |
| | | | 1,335,544 | | |
| Shares | | | | | | Value | |
| | | | | Food: 4.3% | |
| | 38,100 | | | | | HJ Heinz Co. | | $ | 1,432,560 | | |
| | 86,300 | | | | | Kroger Co. | | | 2,279,183 | | |
| | | | 3,711,743 | | |
| | | | | Healthcare-Services: 0.6% | |
| | 14,700 | | | @ | | Humana, Inc. | | | 548,016 | | |
| | | | 548,016 | | |
| | | | | Insurance: 6.1% | |
| | 50,600 | | | @@ | | Axis Capital Holdings Ltd. | | | 1,473,473 | | |
| | 8,300 | | | | | Chubb Corp. | | | 423,300 | | |
| | 31,000 | | | | | Loews Corp. | | | 875,750 | | |
| | 32,000 | | | | | Travelers Cos., Inc. | | | 1,446,400 | | |
| | 56,600 | | | | | UnumProvident Corp. | | | 1,052,760 | | |
| | | | 5,271,683 | | |
| | | | | Machinery-Diversified: 1.4% | |
| | 14,900 | | | | | Flowserve Corp. | | | 767,350 | | |
| | 14,500 | | | | | Rockwell Automation, Inc. | | | 467,480 | | |
| | | | 1,234,830 | | |
| | | | | Media: 2.6% | |
| | 222,900 | | | | | Time Warner, Inc. | | | 2,242,374 | | |
| | | | 2,242,374 | | |
| | | | | Mining: 1.6% | |
| | 22,700 | | | @@,L | | BHP Billiton Ltd. ADR | | | 973,830 | | |
| | 22,400 | | | L | | Southern Copper Corp. | | | 359,744 | | |
| | | | 1,333,574 | | |
| | | | | Miscellaneous Manufacturing: 4.6% | |
| | 31,400 | | | | | Cooper Industries Ltd. | | | 917,822 | | |
| | 32,400 | | | | | Dover Corp. | | | 1,066,608 | | |
| | 60,100 | | | | | Honeywell International, Inc. | | | 1,973,083 | | |
| | | | 3,957,513 | | |
| | | | | Office/Business Equipment: 0.7% | |
| | 19,600 | | | @@,L | | Canon, Inc. ADR | | | 615,440 | | |
| | | | 615,440 | | |
| | | | | Oil & Gas: 18.3% | |
| | 31,600 | | | | | Chevron Corp. | | | 2,337,452 | | |
| | 67,300 | | | | | ConocoPhillips | | | 3,486,140 | | |
| | 88,200 | | | | | ExxonMobil Corp. | | | 7,041,006 | | |
| | 17,700 | | | | | Sunoco, Inc. | | | 769,242 | | |
| | 95,200 | | | | | Valero Energy Corp. | | | 2,060,128 | | |
| | | | 15,693,968 | | |
| | | | | Pharmaceuticals: 10.7% | |
| | 41,000 | | | | | AmerisourceBergen Corp. | | | 1,462,060 | | |
| | 52,000 | | | @ | | Endo Pharmaceuticals Holdings, Inc. | | | 1,345,760 | | |
| | 96,000 | | | @ | | Forest Laboratories, Inc. | | | 2,445,120 | | |
| | 219,300 | | | | | Pfizer, Inc. | | | 3,883,803 | | |
| | | | 9,136,743 | | |
| | | | | Retail: 2.7% | |
| | 173,600 | | | | | Gap, Inc. | | | 2,324,504 | | |
| | | | 2,324,504 | | |
| | | | | Savings & Loans: 0.8% | |
| | 41,100 | | | | | Hudson City Bancorp., Inc. | | | 655,956 | | |
| | | | 655,956 | | |
See Accompanying Notes to Financial Statements
86
ING OPPORTUNISTIC LARGECAP PORTFOLIO OF INVESTMENTS
VALUE PORTFOLIO AS OF DECEMBER 31, 2008 (CONTINUED)
| Shares | | | | | | Value | |
| | | | | Semiconductors: 1.2% | |
| | 70,400 | | | | | Intel Corp. | | $ | 1,032,064 | | |
| | | | 1,032,064 | | |
| | | | | Telecommunications: 6.5% | |
| | 134,200 | | | | | AT&T, Inc. | | | 3,824,700 | | |
| | 26,200 | | | @@ | | Telefonica SA ADR | | | 1,765,618 | | |
| | | | 5,590,318 | | |
Total Common Stock
(Cost $101,154,170) | | | 82,490,668 | | |
| REAL ESTATE INVESTMENT TRUSTS: 2.5% | | | |
| | | | | Health Care: 1.9% | |
| | 46,100 | | | | | HCP, Inc. | | | 1,280,197 | | |
| | 11,600 | | | | | Ventas, Inc. | | | 389,412 | | |
| | | | 1,669,609 | | |
| | | | | Shopping Centers: 0.6% | |
| | 7,700 | | | | | Federal Realty Investment Trust | | | 478,016 | | |
| | | | 478,016 | | |
Total Real Estate Investment Trusts
(Cost $1,833,604) | | | 2,147,625 | | |
| EXCHANGE-TRADED FUNDS: 1.1% | | | |
| | | | | Exchange-Traded Funds: 1.1% | |
| | 19,800 | | | L | | iShares Russell 1000 Value
Index Fund | | | 980,496 | | |
Total Exchange-Traded Funds
(Cost $894,537) | | | 980,496 | | |
Total Long-Term Investments
(Cost $103,882,311) | | | 85,618,789 | | |
Principal
Amount | | | | Value | |
| SHORT-TERM INVESTMENTS: 5.7% | |
| | | Securities Lending Collateralcc: 5.7% | |
| $ | 4,910,714 | | | Bank of New York Mellon Corp.
Institutional Cash Reserves | | $ | 4,865,356 | | |
Total Short-Term Investments
(Cost $4,910,714) | | | 4,865,356 | | |
Total Investments in
Securities
(Cost $108,793,025)* | | | 105.5 | % | | $ | 90,484,145 | | |
Other Assets and
Liabilities - Net | | | (5.5 | ) | | | (4,738,451 | ) | |
| Net Assets | | | 100.0 | % | | $ | 85,745,694 | | |
@ Non-income producing security
@@ Foreign Issuer
ADR American Depositary Receipt
cc Securities purchased with cash collateral for securities loaned.
L Loaned security, a portion or all of the security is on loan at December 31, 2008.
* Cost for federal income tax purposes is $110,462,013.
Net unrealized depreciation consists of:
| Gross Unrealized Appreciation | | $ | 3,383,151 | | |
| Gross Unrealized Depreciation | | | (23,361,019 | ) | |
| Net Unrealized Depreciation | | $ | (19,977,868 | ) | |
The following table summarizes the inputs used as of December 31, 2008 in determining the Portfolio's investments at fair value for purposes of SFAS 157:
| | | Investments in
Securities | | Other Financial
Instruments* | |
| Level 1 — Quoted Prices | | $ | 85,618,789 | | | $ | — | | |
Level 2 — Other Significant
Observable Inputs | | | 4,865,356 | | | | — | | |
Level 3 — Significant
Unobservable Inputs | | | — | | | | — | | |
| Total | | $ | 90,484,145 | | | $ | — | | |
"Fair value" for purposes of SFAS 157 is different from "fair value" as used in the 1940 Act. The former generally implies market value, and can include market quotations as a source of value, and the latter refers to determinations of actual value in absence of available market quotations.
* Other financial instruments may include forward foreign currency contracts, futures, swaps, and written options. Forward foreign currency contracts and futures are reported at their unrealized gain/loss at year end. Swaps and written options are reported at their market value at year end.
See Accompanying Notes to Financial Statements
87
PORTFOLIO OF INVESTMENTS
ING VP INTERMEDIATE BOND PORTFOLIO AS OF DECEMBER 31, 2008
Principal
Amount | | | | | | Value | |
| CORPORATE BONDS/NOTES: 27.7% | | | |
| | | | | Aerospace/Defense: 0.3% | |
| $ | 7,904,000 | | | C | | United Technologies Corp.,
6.125%, due 02/01/19 | | $ | 8,472,448 | | |
| | | | 8,472,448 | | |
| | | | | Agriculture: 1.2% | |
| | 10,068,000 | | | S | | Altria Group, Inc.,
9.700%, due 11/10/18 | | | 10,899,295 | | |
| | 10,072,000 | | | S | | Altria Group, Inc., 9.950%,
due 11/10/38 | | | 10,994,323 | | |
| | 6,077,000 | | | | | Philip Morris
International, Inc.,
5.650%, due 05/16/18 | | | 6,035,160 | | |
| | 5,990,000 | | | | | Philip Morris
International, Inc.,
6.375%, due 05/16/38 | | | 6,251,062 | | |
| | | | 34,179,840 | | |
| | | | | Airlines: 0.3% | |
| | 11,337,000 | | | C | | Delta Airlines, Inc., 7.570%,
due 11/18/10 | | | 9,523,080 | | |
| | | | 9,523,080 | | |
| | | | | Banks: 6.5% | |
| | 7,880,000 | | | @@,C,S | | Australia & New Zealand
Banking Group Ltd.,
3.588%, due 12/31/49 | | | 3,066,116 | | |
| | 8,083,000 | | | C | | BAC Capital Trust XIV,
5.630%, due 12/31/49 | | | 3,240,394 | | |
| | 17,790,000 | | | C,S | | Bank of America Corp.,
8.000%, due 12/01/49 | | | 12,814,493 | | |
| | 3,090,000 | | | @@,C | | Bank of Ireland, 1.750%,
due 12/29/49 | | | 1,575,900 | | |
| | 1,220,000 | | | @@,C,L | | Bank of Scotland PLC,
2.750%, due 12/31/49 | | | 428,137 | | |
| | 3,750,000 | | | @@,C | | Barclays Bank PLC, 3.250%,
due 12/31/49 | | | 2,194,103 | | |
| | 2,120,000 | | | @@,C | | Barclays Bank PLC, 3.313%,
due 08/29/49 | | | 1,100,551 | | |
| | 3,395,000 | | | @@,#,C | | Barclays Bank PLC, 5.926%,
due 09/29/49 | | | 1,249,876 | | |
| | 10,438,000 | | | @@,#,S | | Barclays Bank PLC, 6.050%,
due 12/04/17 | | | 9,223,591 | | |
| | 1,475,000 | | | @@,C | | Barclays O/S Inv, 2.875%,
due 04/11/49 | | | 850,858 | | |
| | 5,260,000 | | | @@,C | | BNP Paribas, 3.998%,
due 09/29/49 | | | 2,394,957 | | |
| | 7,406,000 | | | | | Citigroup, Inc., 5.000%,
due 09/15/14 | | | 6,521,990 | | |
| | 23,269,000 | | | C,S | | Citigroup, Inc., 8.400%,
due 04/29/49 | | | 15,393,375 | | |
| | 2,768,000 | | | @@,#,C | | Danske Bank A/S, 5.914%,
due 12/29/49 | | | 1,463,414 | | |
| | 2,280,000 | | | @@,C | | Den Norske Bank ASA,
2.500%, due 11/29/49 | | | 1,095,312 | | |
| | 7,912,000 | | | #,C,S | | Dresdner Funding Trust I,
8.151%, due 06/30/31 | | | 3,136,997 | | |
| | 5,810,000 | | | | | Fifth Third Bancorp.,
8.250%, due 03/01/38 | | | 4,811,633 | | |
| | 3,650,000 | | | | | Goldman Sachs Group, Inc.,
5.250%, due 04/01/13 | | | 3,364,559 | | |
| | 10,115,000 | | | S | | Goldman Sachs Group, Inc.,
5.450%, due 11/01/12 | | | 9,656,932 | | |
Principal
Amount | | | | | | Value | |
| $ | 8,370,000 | | | @@,C | | Hongkong & Shanghai
Banking Corp., Ltd.,
3.813%, due 07/29/49 | | $ | 4,519,800 | | |
| | 10,510,000 | | | @@,C | | HSBC Bank PLC, 1.913%,
due 06/29/49 | | | 5,675,400 | | |
| | 5,770,000 | | | @@ | | HSBC Bank PLC, 3.438%,
due 06/29/49 | | | 3,086,950 | | |
| | 13,652,000 | | | C,S | | JPMorgan Chase & Co.,
7.900%, due 04/29/49 | | | 11,386,123 | | |
| | 4,889,000 | | | | | JPMorgan Chase Bank NA,
5.875%, due 06/13/16 | | | 4,884,742 | | |
| | 6,810,000 | | | @@,C | | Lloyds TSB Bank PLC,
2.141%, due 11/29/49 | | | 3,649,057 | | |
| | 5,540,000 | | | @@,C | | Lloyds TSB Bank PLC,
2.375%, due 11/29/49 | | | 2,832,608 | | |
| | 6,070,000 | | | @@,C | | Lloyds TSB Bank PLC,
3.218%, due 08/29/49 | | | 3,251,529 | | |
| | 1,550,000 | | | @@,C | | Mizuho Financial Group
Cayman Ltd., 8.375%,
due 01/29/49 | | | 1,483,242 | | |
| | 2,877,000 | | | | | Morgan Stanley, 6.000%,
due 04/28/15 | | | 2,485,202 | | |
| | 10,728,000 | | | C,S | | Morgan Stanley, 6.750%,
due 04/15/11 | | | 10,561,019 | | |
| | 20,734,000 | | | C | | National City Preferred
Capital Trust I, 12.000%,
due 12/29/49 | | | 19,385,419 | | |
| | 760,000 | | | @@,C,L | | National Westminster
Bank PLC, 2.438%,
due 11/29/49 | | | 391,400 | | |
| | 1,140,000 | | | @@,C | | National Westminster
Bank PLC, 3.313%,
due 08/29/49 | | | 583,240 | | |
| | 5,200,000 | | | #,C,S | | PNC Preferred Funding Trust I,
8.700%, due 02/19/49 | | | 3,851,973 | | |
| | 5,015,000 | | | #,C | | Rabobank Capital Funding II,
5.260%, due 12/29/49 | | | 2,655,608 | | |
| | 4,399,000 | | | C,S | | RBS Capital Trust I, 5.512%,
due 09/30/49 | | | 1,760,260 | | |
| | 11,980,000 | | | @@,C,L | | Royal Bank of Scotland
Group PLC, 2.063%,
due 12/29/49 | | | 7,604,329 | | |
| | 2,860,000 | | | @@,C | | Societe Generale, 2.625%,
due 11/29/49 | | | 1,735,265 | | |
| | 521,000 | | | C | | State Street Capital Trust III,
8.250%, due 12/29/49 | | | 402,832 | | |
| | 3,566,000 | | | C | | SunTrust Preferred Capital I,
5.853%, due 12/31/49 | | | 1,926,749 | | |
| | 4,895,000 | | | | | Wachovia Bank NA, 6.600%,
due 01/15/38 | | | 5,328,531 | | |
| | 6,722,000 | | | | | Wachovia Corp., 7.980%,
due 02/08/49 | | | 5,745,179 | | |
| | 3,410,000 | | | @@,C | | Westpac Banking Corp.,
4.056%, due 09/30/49 | | | 1,786,404 | | |
| | 2,973,000 | | | @@,#,C | | Westpac Capital Trust IV,
5.256%, due 12/29/49 | | | 1,514,473 | | |
| | | | 192,070,522 | | |
| | | | | Beverages: 0.2% | |
| | 3,790,000 | | | #,C | | Dr Pepper Snapple
Group, Inc., 6.820%,
due 05/01/18 | | | 3,744,630 | | |
See Accompanying Notes to Financial Statements
88
PORTFOLIO OF INVESTMENTS
ING VP INTERMEDIATE BOND PORTFOLIO AS OF DECEMBER 31, 2008 (CONTINUED)
Principal
Amount | | | | | | Value | |
| | | | | Beverages: (continued) | |
| $ | 1,606,000 | | | #,C | | Dr Pepper Snapple
Group, Inc., 7.450%,
due 05/01/38 | | $ | 1,604,797 | | |
| | | | 5,349,427 | | |
| | | | | Chemicals: 0.2% | |
| | 3,180,000 | | | Z | | Stauffer Chemical,
10.490%, due 04/15/17 | | | 1,689,486 | | |
| | 2,620,000 | | | Z | | Stauffer Chemical,
10.950%, due 04/15/18 | | | 1,289,543 | | |
| | 1,510,000 | | | Z | | Stauffer Chemical,
16.970%, due 04/15/10 | | | 1,234,055 | | |
| | 5,382,000 | | | | | Union Carbide Corp.,
7.750%, due 10/01/96 | | | 3,176,322 | | |
| | | | 7,389,406 | | |
| | | | | Computers: 0.9% | |
| | 8,389,000 | | | C,S | | International Business
Machines Corp., 7.625%,
due 10/15/18 | | | 10,078,050 | | |
| | 7,407,000 | | | C,S | | International Business
Machines Corp., 8.000%,
due 10/15/38 | | | 9,893,715 | | |
| | 5,066,000 | | | C | | Lexmark International, Inc.,
5.900%, due 06/01/13 | | | 3,997,282 | | |
| | 4,087,000 | | | C | | Lexmark International, Inc.,
6.650%, due 06/01/18 | | | 3,225,358 | | |
| | | | 27,194,405 | | |
| | | | | Diversified Financial Services: 3.3% | |
| | 17,487,000 | | | @@,#,C,S | | Aiful Corp., 4.450%,
due 02/16/10 | | | 10,722,119 | | |
| | 6,135,000 | | | | | American Express Co.,
7.000%, due 03/19/18 | | | 6,213,810 | | |
| | 4,939,000 | | | | | American Express Co.,
8.150%, due 03/19/38 | | | 5,680,897 | | |
| | 2,802,000 | | | @@,C | | BNP Paribas, 1.625%,
due 12/31/49 | | | 1,576,458 | | |
| | 6,945,000 | | | | | Caterpillar Financial
Services Corp., 5.450%,
due 04/15/18 | | | 6,514,063 | | |
| | 3,403,000 | | | #,C,S | | Corestates Capital Trust I,
8.000%, due 12/15/26 | | | 2,800,941 | | |
| | 5,861,000 | | | | | Countrywide Financial
Corp., 5.800%,
due 06/07/12 | | | 5,716,796 | | |
| | 355,000 | | | #,S | | Farmers Exchange Capital,
7.200%, due 07/15/48 | | | 197,147 | | |
| | 3,090,000 | | | @@,C | | Financiere CSFB NV, 2.813%,
due 03/29/49 | | | 2,023,950 | | |
| | 6,198,000 | | | C,S | | Fund American Cos., Inc.,
5.875%, due 05/15/13 | | | 4,514,853 | | |
| | 7,666,000 | | | | | General Electric Capital
Corp., 5.875%,
due 01/14/38 | | | 7,529,706 | | |
| | 4,798,000 | | | #,C | | HVB Funding Trust III,
9.000%, due 10/22/31 | | | 1,388,853 | | |
| | 11,976,000 | | | S | | International Lease
Finance Corp., 6.625%,
due 11/15/13 | | | 8,076,866 | | |
| | 6,907,000 | | | @@,# | | Mantis Reef Ltd., 4.799%,
due 11/03/09 | | | 6,909,873 | | |
Principal
Amount | | | | | | Value | |
| $ | 10,609,000 | | | C | | National Rural Utilities
Cooperative Finance
Corp., 10.375%,
due 11/01/18 | | $ | 12,436,793 | | |
| | 9,108,862 | | | #,C | | Piper Jaffray Equipment
Trust Securities, 6.000%,
due 09/10/11 | | | 6,467,292 | | |
| | 6,973,338 | | | #,C | | Piper Jaffray Equipment
Trust Securities, 6.750%,
due 04/01/11 | | | 4,951,070 | | |
| | 732,491 | | | # | | Power Receivable Finance,
LLC, 6.290%, due 01/01/12 | | | 718,017 | | |
| | 32,450,810 | | | #,Z | | Toll Road Investors
Partnership II LP, 20.460%,
due 02/15/45 | | | 3,818,714 | | |
| | 4,098,000 | | | #,C,± | | Twin Reefs Pass-through
Trust, 1.406%,
due 12/10/49 | | | 46,103 | | |
| | | | 98,304,321 | | |
| | | | | Electric: 1.7% | |
| | 1,355,000 | | | C | | Commonwealth Edison Co.,
6.150%, due 03/15/12 | | | 1,321,564 | | |
| | 13,524,000 | | | C | | Commonwealth Edison Co.,
6.950%, due 07/15/18 | | | 12,825,918 | | |
| | 4,306,000 | | | C,S | | DTE Energy Co., 7.050%,
due 06/01/11 | | | 4,261,635 | | |
| | 945,336 | | | #,C | | Juniper Generation, LLC,
6.790%, due 12/31/14 | | | 1,023,936 | | |
| | 3,172,000 | | | C | | Nevada Power Co., 6.750%,
due 07/01/37 | | | 2,846,255 | | |
| | 9,278,000 | | | C,S | | NorthWestern Corp.,
5.875%, due 11/01/14 | | | 8,566,006 | | |
| | 4,673,000 | | | #,C | | Oncor Electric Delivery Co.,
6.800%, due 09/01/18 | | | 4,489,141 | | |
| | 6,356,000 | | | #,C | | Oncor Electric Delivery Co.,
7.500%, due 09/01/38 | | | 6,057,192 | | |
| | 5,053,000 | | | C | | Sierra Pacific Power Co.,
6.250%, due 04/15/12 | | | 4,820,562 | | |
| | 3,936,000 | | | # | | White Pine Hydro Portfolio,
LLC, 7.260%, due 07/20/15 | | | 3,614,535 | | |
| | | | 49,826,744 | | |
| | | | | Energy-Alternate Sources: 0.2% | |
| | 4,900,000 | | | | | Greater Ohio Ethanol, LLC,
2.630%, due 12/31/13 | | | — | | |
| | 4,000,000 | | | | | Greater Ohio Ethanol, LLC,
6.301%, due 12/31/13 | | | — | | |
| | 3,837,000 | | | # | | White Pine Hydro, LLC,
6.310%, due 07/10/17 | | | 3,507,294 | | |
| | 2,455,000 | | | # | | White Pine Hydro, LLC,
6.960%, due 07/10/37 | | | 2,349,212 | | |
| | | | 5,856,506 | | |
| | | | | Food: 0.7% | |
| | 8,493,000 | | | | | Kraft Foods, Inc., 6.125%,
due 02/01/18 | | | 8,336,533 | | |
| | 3,278,000 | | | | | Kraft Foods, Inc., 6.125%,
due 08/23/18 | | | 3,237,500 | | |
| | 1,994,000 | | | | | Kraft Foods, Inc., 6.500%,
due 08/11/17 | | | 2,007,523 | | |
| | 1,846,000 | | | | | Kraft Foods, Inc., 6.875%,
due 02/01/38 | | | 1,850,499 | | |
See Accompanying Notes to Financial Statements
89
PORTFOLIO OF INVESTMENTS
ING VP INTERMEDIATE BOND PORTFOLIO AS OF DECEMBER 31, 2008 (CONTINUED)
Principal
Amount | | | | | | Value | |
| | | | | Food: (continued) | |
| $ | 3,783,000 | | | | | Kraft Foods, Inc., 7.000%,
due 08/11/37 | | $ | 3,851,026 | | |
| | 2,893,000 | | | C | | Safeway, Inc., 6.250%,
due 03/15/14 | | | 2,911,185 | | |
| | | | 22,194,266 | | |
| | | | | Forest Products & Paper: 0.4% | |
| | 1,563,000 | | | C | | International Paper Co.,
7.400%, due 06/15/14 | | | 1,282,557 | | |
| | 7,790,000 | | | C | | International Paper Co.,
7.950%, due 06/15/18 | | | 6,166,291 | | |
| | 5,525,000 | | | C | | International Paper Co.,
8.700%, due 06/15/38 | | | 3,868,677 | | |
| | | | 11,317,525 | | |
| | | | | Gas: 0.2% | |
| | 15,247,000 | | | C,S | | Southern Union Co.,
7.200%, due 11/01/66 | | | 5,336,450 | | |
| | | | 5,336,450 | | |
| | | | | Insurance: 1.0% | |
| | 10,157,000 | | | @@,C | | Aegon NV, 4.567%,
due 12/31/49 | | | 2,793,175 | | |
| | 8,012,000 | | | | | American International
Group, Inc., 5.850%,
due 01/16/18 | | | 5,378,744 | | |
| | 5,729,000 | | | #,C,S | | Metlife Capital Trust IV,
7.875%, due 12/15/37 | | | 3,601,312 | | |
| | 3,250,000 | | | C | | Metlife, Inc., 6.375%,
due 06/15/34 | | | 2,697,988 | | |
| | 1,741,000 | | | #,C | | Nationwide Mutual
Insurance, 5.810%,
due 12/15/24 | | | 753,705 | | |
| | 2,288,000 | | | | | Prudential Financial, Inc.,
5.700%, due 12/14/36 | | | 1,429,764 | | |
| | 4,220,000 | | | | | Prudential Financial, Inc.,
6.000%, due 12/01/17 | | | 3,390,753 | | |
| | 7,923,000 | | | | | Prudential Financial, Inc.,
6.625%, due 12/01/37 | | | 5,415,394 | | |
| | 8,235,000 | | | @@,#,C | | White Mountains Re
Group Ltd., 7.506%,
due 05/29/49 | | | 3,294,000 | | |
| | 2,275,000 | | | @@,C | | XL Capital, Ltd., 6.500%,
due 12/15/49 | | | 523,716 | | |
| | | | 29,278,551 | | |
| | | | | Machinery-Construction & Mining: 0.1% | |
| | 2,780,000 | | | C | | Caterpillar, Inc., 8.250%,
due 12/15/38 | | | 3,437,325 | | |
| | | | 3,437,325 | | |
| | | | | Media: 3.1% | |
| | 3,261,000 | | | C | | Comcast Corp., 5.700%,
due 05/15/18 | | | 3,063,605 | | |
| | 4,477,000 | | | C | | Comcast Corp., 5.850%,
due 11/15/15 | | | 4,240,623 | | |
| | 2,093,000 | | | C | | Comcast Corp., 5.900%,
due 03/15/16 | | | 2,001,297 | | |
| | 3,514,000 | | | C | | Comcast Corp., 6.300%,
due 11/15/17 | | | 3,426,568 | | |
| | 2,234,000 | | | C | | Comcast Corp., 6.400%,
due 05/15/38 | | | 2,236,127 | | |
| | 3,373,000 | | | C,S | | Comcast Corp., 6.500%,
due 01/15/17 | | | 3,336,693 | | |
| | 2,207,000 | | | C | | Comcast Corp., 6.950%,
due 08/15/37 | | | 2,331,501 | | |
Principal
Amount | | | | | | Value | |
| $ | 10,411,000 | | | #,C,S | | COX Communications, Inc.,
6.250%, due 06/01/18 | | $ | 9,256,503 | | |
| | 3,855,000 | | | #,C | | COX Communications, Inc.,
6.950%, due 06/01/38 | | | 3,497,163 | | |
| | 3,376,000 | | | #,C | | Cox Enterprises, Inc.,
7.375%, due 07/15/27 | | | 3,203,368 | | |
| | 5,290,000 | | | C | | News America, Inc.,
6.150%, due 03/01/37 | | | 4,951,572 | | |
| | 4,379,000 | | | C | | News America, Inc.,
6.650%, due 11/15/37 | | | 4,347,949 | | |
| | 6,568,000 | | | C,S | | Time Warner Cable, Inc.,
6.750%, due 07/01/18 | | | 6,334,554 | | |
| | 1,890,000 | | | C | | Time Warner Cable, Inc.,
7.300%, due 07/01/38 | | | 1,969,529 | | |
| | 11,237,000 | | | C,S | | Time Warner Cable, Inc.,
8.750%, due 02/14/19 | | | 12,239,172 | | |
| | 1,865,000 | | | | | Time Warner
Entertainment Co. LP,
8.375%, due 07/15/33 | | | 1,886,931 | | |
| | 7,923,000 | | | C | | Time Warner, Inc.,
5.500%, due 11/15/11 | | | 7,449,363 | | |
| | 7,139,000 | | | C | | Time Warner, Inc., 7.700%,
due 05/01/32 | | | 7,167,085 | | |
| | 10,757,000 | | | C,S | | Viacom, Inc., 6.875%,
due 04/30/36 | | | 8,523,578 | | |
| | | | 91,463,181 | | |
| | | | | Miscellaneous Manufacturing: 0.3% | |
| | 9,100,000 | | | S | | General Electric Co.,
5.250%, due 12/06/17 | | | 9,088,216 | | |
| | | | 9,088,216 | | |
| | | | | Pipelines: 0.9% | |
| | 10,472,000 | | | C | | Enbridge Energy Partners,
9.875%, due 03/01/19 | | | 10,555,912 | | |
| | 7,502,000 | | | C | | Energy Transfer Partners,
9.700%, due 03/15/19 | | | 7,742,619 | | |
| | 1,893,000 | | | C | | Northwest Pipeline Corp.,
7.000%, due 06/15/16 | | | 1,716,824 | | |
| | 4,352,000 | | | C | | Panhandle Eastern
Pipe Line, 6.200%,
due 11/01/17 | | | 3,349,029 | | |
| | 2,894,000 | | | C | | Transcontinental Gas
Pipe Line Corp., 6.400%,
due 04/15/16 | | | 2,645,582 | | |
| | | | 26,009,966 | | |
| | | | | Real Estate: 0.2% | |
| | 1,048,000 | | | C | | Liberty Property LP,
6.375%, due 08/15/12 | | | 804,383 | | |
| | 3,933,000 | | | C | | Liberty Property LP,
7.750%, due 04/15/09 | | | 3,886,602 | | |
| | | | 4,690,985 | | |
| | | | | Retail: 0.5% | |
| | 3,244,000 | | | C | | CVS Caremark Corp.,
5.750%, due 06/01/17 | | | 3,059,098 | | |
| | 5,523,811 | | | #,C,S | | CVS Lease Pass-through,
6.036%, due 12/10/28 | | | 3,367,431 | | |
| | 4,822,000 | | | C,S | | Darden Restaurants, Inc.,
5.625%, due 10/15/12 | | | 4,169,906 | | |
| | 7,496,000 | | | C,S | | Darden Restaurants, Inc.,
6.200%, due 10/15/17 | | | 5,572,039 | | |
| | | | 16,168,474 | | |
See Accompanying Notes to Financial Statements
90
PORTFOLIO OF INVESTMENTS
ING VP INTERMEDIATE BOND PORTFOLIO AS OF DECEMBER 31, 2008 (CONTINUED)
Principal
Amount | | | | | | Value | |
| | | | | Software: 0.3% | |
| $ | 4,369,000 | | | C | | Oracle Corp., 5.250%,
due 01/15/16 | | $ | 4,454,619 | | |
| | 3,265,000 | | | C | | Oracle Corp., 5.750%,
due 04/15/18 | | | 3,421,227 | | |
| | | | 7,875,846 | | |
| | | | | Telecommunications: 3.3% | |
| | 10,791,000 | | | C,S | | AT&T, Inc., 6.700%,
due 11/15/13 | | | 11,442,992 | | |
| | 6,675,000 | | | | | Bellsouth
Telecommunications, Inc.,
7.000%, due 12/01/95 | | | 5,242,872 | | |
| | 1,938,000 | | | @@,C | | British
Telecommunications PLC,
5.150%, due 01/15/13 | | | 1,847,780 | | |
| | 9,754,000 | | | @@,C,S | | British
Telecommunications PLC,
5.950%, due 01/15/18 | | | 8,499,840 | | |
| | 1,839,000 | | | @@,C | | Deutsche Telekom
International Finance BV,
5.875%, due 08/20/13 | | | 1,820,801 | | |
| | 1,858,000 | | | @@,C | | Deutsche Telekom
International Finance BV,
6.750%, due 08/20/18 | | | 1,887,342 | | |
| | 3,942,000 | | | C | | Embarq Corp., 6.738%,
due 06/01/13 | | | 3,334,017 | | |
| | 975,000 | | | C | | Embarq Corp., 7.995%,
due 06/01/36 | | | 659,494 | | |
| | 2,206,000 | | | @@,C | | France Telecom SA, 8.500%,
due 03/01/31 | | | 2,777,361 | | |
| | 9,742,000 | | | C | | Sprint Capital Corp.,
6.875%, due 11/15/28 | | | 5,808,258 | | |
| | 3,282,000 | | | @@,C | | Telefonica Emisones SAU,
5.855%, due 02/04/13 | | | 3,193,107 | | |
| | 5,439,000 | | | @@,C | | Telefonica Emisones SAU,
6.421%, due 06/20/16 | | | 5,437,504 | | |
| | 1,320,000 | | | @@,C | | Telefonica Emisones SAU,
7.045%, due 06/20/36 | | | 1,445,401 | | |
| | 19,281,000 | | | C | | Verizon Communications,
Inc., 8.950%, due 03/01/39 | | | 24,982,006 | | |
| | 10,315,000 | | | #,C | | Verizon Wireless, 8.500%,
due 11/15/18 | | | 12,106,746 | | |
| | 2,085,000 | | | @@,C | | Vodafone Group PLC,
5.625%, due 02/27/17 | | | 1,967,727 | | |
| | 5,224,000 | | | @@,C | | Vodafone Group PLC,
5.750%, due 03/15/16 | | | 4,993,961 | | |
| | | | 97,447,209 | | |
| | | | | Transportation: 1.9% | |
| | 1,347,000 | | | C | | Burlington Northern
Santa Fe Corp., 5.750%,
due 03/15/18 | | | 1,300,759 | | |
| | 3,240,000 | | | C | | Burlington Northern
Santa Fe Corp., 6.150%,
due 05/01/37 | | | 2,993,653 | | |
| | 2,574,000 | | | C | | Burlington Northern
Santa Fe Corp., 6.200%,
due 08/15/36 | | | 2,381,004 | | |
| | 5,315,000 | | | C,S | | CSX Corp., 6.250%,
due 04/01/15 | | | 5,223,896 | | |
| | 5,943,000 | | | C,S | | CSX Corp., 6.250%,
due 03/15/18 | | | 5,475,488 | | |
Principal
Amount | | | | | | Value | |
| $ | 8,589,000 | | | C,S | | CSX Corp., 7.450%,
due 04/01/38 | | $ | 8,191,175 | | |
| | 1,093,000 | | | C | | Norfolk Southern Corp.,
5.750%, due 04/01/18 | | | 1,065,418 | | |
| | 1,373,000 | | | C | | Norfolk Southern Corp.,
7.050%, due 05/01/37 | | | 1,440,282 | | |
| | 2,332,000 | | | C,S | | Norfolk Southern Corp.,
7.250%, due 02/15/31 | | | 2,435,513 | | |
| | 6,680,000 | | | C | | Norfolk Southern Corp.,
7.700%, due 05/15/17 | | | 7,171,494 | | |
| | 5,107,000 | | | C | | Union Pacific Corp.,
5.700%, due 08/15/18 | | | 4,925,620 | | |
| | 5,809,000 | | | C | | Union Pacific Corp.,
6.625%, due 02/01/29 | | | 5,514,373 | | |
| | 8,373,000 | | | C,S | | Union Pacific Corp.,
7.875%, due 01/15/19 | | | 9,582,572 | | |
| | | | 57,701,247 | | |
Total Corporate Bonds/
Notes
(Cost $928,612,164) | | | 820,175,940 | | |
| U.S. GOVERNMENT AGENCY OBLIGATIONS: 39.0% | | | |
| | | | | | | Federal Home Loan Mortgage
Corporation##: 18.6% | | | | | |
| | 16,135,194 | | | C,S | | 1.545%, due 05/15/33 | | | 14,949,293 | | |
| | 3,965,027 | | | C,S | | 1.845%, due 04/15/32 | | | 3,866,295 | | |
| | 7,753,000 | | | C,S | | 4.500%, due 02/15/20 | | | 7,681,195 | | |
| | 80,481,623 | | | C,S | | 5.000%, due 08/15/16-
02/15/35 | | | 81,684,198 | | |
| | 1,168,997 | | | S | | 5.015%, due 04/01/35 | | | 1,189,917 | | |
| | 104,207,148 | | | C,S | | 5.500%, due 08/15/20-
08/15/33 | | | 106,445,013 | | |
| | 297,238,000 | | | W | | 5.500%, due 01/11/37-
02/12/37 | | | 303,322,165 | | |
| | 14,411,656 | | | C,S | | 6.000%, due 01/15/29 | | | 14,920,882 | | |
| | 14,461,644 | | | S | | 6.000%, due 02/01/29-
02/01/36 | | | 14,948,498 | | |
| | 1,280,419 | | | S | | 7.000%, due 09/01/26-
11/01/31 | | | 1,338,814 | | |
| | 424,838 | | | S | | 7.500%, due 11/01/28 | | | 448,812 | | |
| | | | 550,795,082 | | |
| | | | | | | Federal National Mortgage
Association##: 16.0% | | | | | |
| | 2,214,771 | | | S | | 0.721%, due 07/25/36 | | | 2,128,972 | | |
| | 377,965 | | | S | | 0.821%, due 08/25/33 | | | 365,295 | | |
| | 1,193,044 | | | S | | 4.945%, due 04/01/35 | | | 1,203,322 | | |
| | 12,326,369 | | | S | | 5.000%, due 02/25/29-
11/25/33 | | | 12,509,772 | | |
| | 221,624,000 | | | W | | 5.000%, due 01/12/36 | | | 226,298,937 | | |
| | 1,371,822 | | | S | | 5.027%, due 07/01/35 | | | 1,398,726 | | |
| | 908,571 | | | S | | 5.229%, due 08/01/35 | | | 926,830 | | |
| | 39,367,728 | | | S | | 5.500%, due 11/01/16-
06/01/37 | | | 39,081,315 | | |
| | 39,604,000 | | | W | | 5.500%, due 02/01/38 | | | 40,476,516 | | |
| | 50,000,000 | | | | | 6.000%, due 02/12/37 | | | 51,320,300 | | |
| | 39,932,121 | | | S | | 6.000%, due 06/01/16-
08/01/38 | | | 41,290,624 | | |
| | 50,000,000 | | | | | 6.500%, due 02/12/37 | | | 51,757,800 | | |
| | 923,422 | | | S | | 6.500%, due 01/01/23-
10/01/32 | | | 964,130 | | |
| | 2,714,756 | | | S | | 7.000%, due 08/01/25-
06/01/31 | | | 2,873,227 | | |
| | 1,266,150 | | | C,S | | 7.500%, due 01/25/48 | | | 1,315,188 | | |
See Accompanying Notes to Financial Statements
91
PORTFOLIO OF INVESTMENTS
ING VP INTERMEDIATE BOND PORTFOLIO AS OF DECEMBER 31, 2008 (CONTINUED)
Principal
Amount | | | | | | Value | |
| | | | | | | Federal National Mortgage
Association##: (continued) | | | | | |
| $ | 246,252 | | | S | | 7.500%, due 11/01/29-
09/01/31 | | $ | 260,851 | | |
| | 187,730 | | | S | | 10.000%, due 02/25/19 | | | 212,031 | | |
| | | | 474,383,836 | | |
| | | | | | | Government National Mortgage
Association: 4.4% | | | | | |
| | 886,000 | | | W | | 5.000%, due 03/15/38 | | | 899,982 | | |
| | 52,629 | | | S | | 5.125%, due 12/20/29 | | | 51,777 | | |
| | 75,522 | | | S | | 5.375%, due 04/20/28 | | | 75,425 | | |
| | 44,877,000 | | | W | | 5.500%, due 02/15/35 | | | 46,019,972 | | |
| | 76,699,000 | | | W | | 6.000%, due 02/15/34 | | | 78,868,124 | | |
| | 2,127,677 | | | S | | 6.500%, due 01/15/29-
01/15/32 | | | 2,236,701 | | |
| | 666,775 | | | S | | 7.000%, due 04/15/26-
05/15/32 | | | 705,338 | | |
| | 1,166,525 | | | S | | 7.500%, due 04/15/22-
06/15/32 | | | 1,237,024 | | |
| | | | 130,094,343 | | |
Total U.S. Government
Agency Obligations
(Cost $1,146,172,554) | | | 1,155,273,261 | | |
| U.S. TREASURY OBLIGATIONS: 15.9% | | | |
| | | | | U.S. Treasury Bonds: 6.5% | |
| | 94,441,000 | | | L | | 3.750%, due 11/15/18 | | | 106,939,605 | | |
| | 59,517,000 | | | L | | 4.375%, due 02/15/38 | | | 79,734,211 | | |
| | 3,959,000 | | | L | | 4.500%, due 05/15/38 | | | 5,404,657 | | |
| | | | 192,078,473 | | |
| | | | | U.S. Treasury Notes: 6.9% | |
| | 63,992,000 | | | L | | 1.125%, due 12/15/11 | | | 64,296,986 | | |
| | 29,456,000 | | | L | | 1.250%, due 11/30/10 | | | 29,781,577 | | |
| | 107,056,000 | | | L | | 2.000%, due 11/30/13 | | | 109,866,327 | | |
| | | | 203,944,890 | | |
| | | | | | | Treasury Inflation Indexed Protected
Securitiesip: 2.5% | | | | | |
| | 40,950,551 | | | S | | 1.375%, due 07/15/18 | | | 38,145,993 | | |
| | 37,098,080 | | | S | | 2.375%, due 04/15/11 | | | 36,243,118 | | |
| | | | 74,389,111 | | |
Total U.S. Treasury
Obligations
(Cost $460,571,893) | | | 470,412,474 | | |
| ASSET-BACKED SECURITIES: 2.1% | | | |
| | | | | Credit Card Asset-Backed Securities: 0.1% | |
| | 4,167,000 | | | C,S | | Citibank Credit Card Issuance Trust, 5.650%, due 09/20/19 | | | 3,363,552 | | |
| | | | 3,363,552 | | |
| | | | | | | Home Equity Asset-Backed
Securities: 0.8% | | | | | |
| | 1,253,000 | | | C,S | | GMAC Mortgage Corp.
Loan Trust, 6.249%,
due 12/25/37 | | | 363,578 | | |
| | 9,095,063 | | | C,S | | GSAA Trust, 5.242%,
due 06/25/34 | | | 8,702,694 | | |
| | 3,328,000 | | | #,C,S | | Irwin Home Equity, 5.960%,
due 08/25/37 | | | 1,546,458 | | |
| | 350,262 | | | C,S | | Merrill Lynch Mortgage
Investors Trust, 0.831%,
due 07/25/34 | | | 248,700 | | |
Principal
Amount | | | | | | Value | |
| $ | 2,646,352 | | | C,S | | Morgan Stanley Capital, Inc.,
1.671%, due 06/25/33 | | $ | 1,677,090 | | |
| | 9,285,000 | | | C,S | | Morgan Stanley Mortgage
Loan Trust, 5.858%,
due 01/25/47 | | | 5,069,574 | | |
| | 247,806 | | | C,S | | Renaissance Home Equity
Loan Trust, 4.456%,
due 05/25/35 | | | 240,096 | | |
| | 3,393,000 | | | C,S | | Residential Funding
Mortgage Securities II,
Inc., 5.890%, due 05/25/37 | | | 2,481,806 | | |
| | 4,000,000 | | | C,S | | Specialty Underwriting &
Residential Finance,
0.671%, due 12/25/36 | | | 3,007,693 | | |
| | 1,391,488 | | | C,S | | Wells Fargo Home Equity
Trust, 3.970%,
due 05/25/34 | | | 1,372,008 | | |
| | 500,000 | | | C,S | | Wells Fargo Home
Equity Trust, 4.430%,
due 05/25/34 | | | 486,854 | | |
| | | | 25,196,551 | | |
| | | | | Other Asset-Backed Securities: 1.2% | |
| | 274,483 | | | C,S | | Amortizing Residential
Collateral Trust, 0.721%,
due 05/25/32 | | | 142,474 | | |
| | 3,075,170 | | | C,S | | Bear Stearns Asset-Backed
Securities, Inc., 0.851%,
due 06/25/36 | | | 2,264,878 | | |
| | 1,203,225 | | | C,S | | Bear Stearns Asset-Backed
Securities, Inc., 0.871%,
due 07/25/36 | | | 456,029 | | |
| | 622,000 | | | S | | CenterPoint Energy
Transition Bond Co., LLC,
4.192%, due 02/01/20 | | | 585,796 | | |
| | 485,323 | | | C,S | | Chase Funding Mortgage
Loan Asset-Backed
Certificates, 0.771%,
due 07/25/33 | | | 419,934 | | |
| | 26,017 | | | C,S | | Chase Funding Mortgage
Loan Asset-Backed
Certificates, 4.045%,
due 05/25/33 | | | 25,122 | | |
| | 1,096,778 | | | C,S | | CNH Equipment Trust,
1.235%, due 06/15/12 | | | 1,067,317 | | |
| | 85,000 | | | C,S | | Countrywide Asset-Backed
Certificates, 5.689%,
due 10/25/46 | | | 48,226 | | |
| | 5,713,115 | | | C,S | | Credit-Based Asset
Servicing and
Securitization, LLC,
4.831%, due 08/25/35 | | | 5,087,538 | | |
| | 3,125,384 | | | C,S | | Credit-Based Asset
Servicing and
Securitization, LLC,
5.501%, due 12/25/36 | | | 2,598,576 | | |
| | 3,360,000 | | | #,C,S | | Credit-Based Asset
Servicing and
Securitization, LLC,
5.746%, due 12/25/37 | | | 2,617,124 | | |
| | 2,876,000 | | | #,C,S | | Credit-Based Asset
Servicing and
Securitization, LLC,
6.020%, due 12/25/37 | | | 1,698,189 | | |
See Accompanying Notes to Financial Statements
92
PORTFOLIO OF INVESTMENTS
ING VP INTERMEDIATE BOND PORTFOLIO AS OF DECEMBER 31, 2008 (CONTINUED)
Principal
Amount | | | | | | Value | |
| | | | | | | Other Asset-Backed
Securities: (continued) | | | | | |
| $ | 2,776,290 | | | C,S | | Equity One, Inc., 5.050%,
due 09/25/33 | | $ | 2,107,736 | | |
| | 566,631 | | | C,S | | Fannie Mae, 0.611%,
due 04/25/35 | | | 515,319 | | |
| | 2,219,526 | | | C,S | | First Horizon Asset Back
Trust, 0.601%,
due 09/25/29 | | | 1,217,061 | | |
| | 5,208,602 | | | @@,#,C,S | | Franklin CLO Ltd., 2.075%,
due 09/20/15 | | | 4,672,636 | | |
| | 6,265,000 | | | #,C,S,I | | Hudson Mezzanine Funding,
2.189%, due 06/12/42 | | | 3,133 | | |
| | 2,306,672 | | | C,S | | Lehman XS Trust, 0.751%,
due 08/25/35 | | | 1,092,294 | | |
| | 1,727,534 | | | @@,#,C,S | | Liberty Square CDO Ltd.,
4.846%, due 04/15/13 | | | 1,340,998 | | |
| | 897,252 | | | C,S | | Merrill Lynch Mortgage
Investors Trust, 0.651%,
due 09/25/36 | | | 280,138 | | |
| | 1,119,184 | | | C,S | | Merrill Lynch Mortgage
Investors Trust, 5.609%,
due 03/25/37 | | | 781,493 | | |
| | 34,571 | | | C,S | | Popular Mortgage
Pass-through Trust,
4.000%, due 12/25/34 | | | 33,410 | | |
| | 48,954 | | | C,S | | Residential Asset Mortgage
Products, Inc., 1.091%,
due 06/25/33 | | | 39,975 | | |
| | 2,772,690 | | | C,S | | Structured Asset Securities
Corp., 4.910%,
due 06/25/33 | | | 2,060,389 | | |
| | 3,625,000 | | | @@,#,C,S | | TCW Select Loan Fund Ltd.,
Inc., 5.150%, due 10/10/13 | | | 2,972,500 | | |
| | | | 34,128,285 | | |
Total Asset-Backed Securities
(Cost $88,066,373) | | | 62,688,388 | | |
| COLLATERALIZED MORTGAGE OBLIGATIONS: 19.6% | | | |
| | 762,676 | | | C,S | | American Home Mortgage
Assets, 3.046%,
due 02/25/47 | | | 127,575 | | |
| | 9,413,531 | | | C,S | | American Home Mortgage
Assets, 3.176%,
due 11/25/46 | | | 3,203,347 | | |
| | 4,390,036 | | | C,S | | American Home Mortgage
Assets, 3.256%,
due 09/25/46 | | | 1,092,522 | | |
| | 4,579,150 | | | C,S | | American Home Mortgage
Investment Trust, 0.761%,
due 11/25/45 | | | 2,200,320 | | |
| | 15,608,034 | | | C,S | | American Home Mortgage
Investment Trust, 0.851%,
due 11/25/45 | | | 3,982,704 | | |
| | 9,166,635 | | | C,S | | Banc of America Alternative
Loan Trust, 6.279%,
due 11/25/21 | | | 6,322,807 | | |
| | 7,776,969 | | | C,S | | Banc of America Alternative
Loan Trust, 6.475%,
due 04/25/37 | | | 3,809,080 | | |
| | 137,934,123 | | | C,S,^ | | Banc of America
Commercial Mortgage,
Inc., 0.291%, due 01/15/49 | | | 1,538,241 | | |
Principal
Amount | | | | | | Value | |
| $ | 760,664 | | | C,S | | Banc of America
Commercial Mortgage,
Inc., 4.161%, due 12/10/42 | | $ | 736,526 | | |
| | 395,000 | | | C,S | | Banc of America
Commercial Mortgage,
Inc., 4.429%,
due 11/10/39 | | | 365,511 | | |
| | 4,010,000 | | | C,S | | Banc of America Commercial
Mortgage, Inc., 4.502%,
due 07/10/42 | | | 3,690,746 | | |
| | 7,299,751 | | | C,S | | Banc of America Commercial
Mortgage, Inc., 4.611%,
due 07/10/43 | | | 6,833,390 | | |
| | 2,783,000 | | | C,S | | Banc of America Commercial
Mortgage, Inc., 4.764%,
due 07/10/45 | | | 2,595,304 | | |
| | 2,541,268 | | | C,S | | Banc of America Commercial
Mortgage, Inc., 4.772%,
due 07/11/43 | | | 2,445,172 | | |
| | 204,713 | | | C,S | | Banc of America Commercial
Mortgage, Inc., 4.877%,
due 11/10/42 | | | 192,239 | | |
| | 4,150,000 | | | C,S | | Banc of America Commercial
Mortgage, Inc., 4.891%,
due 07/10/45 | | | 3,431,174 | | |
| | 3,295,000 | | | C,S | | Banc of America Commercial
Mortgage, Inc., 5.463%,
due 09/10/47 | | | 696,348 | | |
| | 1,000,000 | | | C,S | | Banc of America Commercial
Mortgage, Inc., 6.186%,
due 06/11/35 | | | 959,215 | | |
| | 5,732,199 | | | C,S | | Banc of America Funding
Corp., 0.718%,
due 05/20/47 | | | 1,609,905 | | |
| | 6,909,110 | | | C,S | | Banc of America Funding
Corp., 0.718%,
due 06/20/47 | | | 3,202,359 | | |
| | 10,613,502 | | | C,S | | Banc of America Funding
Corp., 5.257%,
due 09/20/35 | | | 5,863,905 | | |
| | 19,000,917 | | | C,S | | Banc of America Funding
Corp., 5.650%,
due 06/20/37 | | | 13,042,680 | | |
| | 4,972,132 | | | C,S | | Banc of America Funding
Corp., 5.750%,
due 09/20/34 | | | 3,795,624 | | |
| | 3,461,377 | | | C,S | | Banc of America Funding
Corp., 7.000%,
due 10/25/37 | | | 1,890,342 | | |
| | 5,202,423 | | | C,S | | Banc of America Mortgage
Securities, Inc., 5.172%,
due 09/25/35 | | | 3,881,558 | | |
| | 1,833,612 | | | C,S | | Banc of America Mortgage
Securities, Inc., 5.250%,
due 11/25/19 | | | 1,671,187 | | |
| | 2,185,328 | | | C,S | | Banc of America Mortgage
Securities, Inc., 5.500%,
due 11/25/33 | | | 1,927,722 | | |
| | 3,432,493 | | | C,S | | Banc of America Mortgage
Securities, Inc., 5.500%,
due 06/25/35 | | | 2,786,878 | | |
See Accompanying Notes to Financial Statements
93
PORTFOLIO OF INVESTMENTS
ING VP INTERMEDIATE BOND PORTFOLIO AS OF DECEMBER 31, 2008 (CONTINUED)
Principal
Amount | | | | | | Value | |
| COLLATERALIZED MORTGAGE OBLIGATIONS: (continued) | | | |
| $ | 1,187,207 | | | C,S | | Bear Stearns
Alternative-A Trust,
0.791%, due 07/25/34 | | $ | 629,923 | | |
| | 1,206,000 | | | C,S | | Bear Stearns Commercial
Mortgage Securities,
4.565%, due 07/11/42 | | | 1,073,756 | | |
| | 360,455 | | | C,S | | Bear Stearns Commercial
Mortgage Securities,
5.415%, due 04/12/38 | | | 347,721 | | |
| | 5,802,000 | | | #,C,S | | Bear Stearns Commercial
Mortgage Securities,
5.660%, due 09/11/41 | | | 1,276,287 | | |
| | 2,925,803 | | | C,S | | Bear Stearns Commercial
Mortgage Securities,
7.780%, due 02/15/32 | | | 2,929,114 | | |
| | 5,337,741 | | | C,S | | Chase Manhattan Bank-First
Union National Bank,
7.439%, due 08/15/31 | | | 5,326,317 | | |
| | 10,104,362 | | | C,S | | Chase Mortgage Finance
Corp., 5.408%,
due 12/25/35 | | | 7,102,283 | | |
| | 6,038,036 | | | C,S | | Chase Mortgage Finance
Corp., 5.500%,
due 11/25/35 | | | 5,109,830 | | |
| | 2,135,857 | | | C,S | | Citicorp Mortgage
Securities, Inc., 5.500%,
due 02/25/22 | | | 1,669,613 | | |
| | 5,599,653 | | | C,S | | Citigroup Mortgage Loan
Trust, Inc., 5.937%,
due 06/25/36 | | | 3,611,140 | | |
| | 10,052,383 | | | C,S | | Citigroup Mortgage Loan
Trust, Inc., 6.000%,
due 11/25/35 | | | 6,291,875 | | |
| | 20,552,900 | | | C,S | | Citigroup Mortgage Loan
Trust, Inc., 6.056%,
due 08/25/36 | | | 13,465,831 | | |
| | 8,992,000 | | | C,S | | Citigroup/Deutsche Bank
Commercial Mortgage
Trust, 5.322%,
due 12/11/49 | | | 6,305,284 | | |
| | 8,992,000 | | | C,S | | Citigroup/Deutsche Bank
Commercial Mortgage
Trust, 5.886%,
due 11/15/44 | | | 6,808,912 | | |
| | 2,273,515 | | | C,S | | Countrywide Alternative
Loan Trust, 0.711%,
due 11/25/46 | | | 584,586 | | |
| | 69,968 | | | C,S | | Countrywide Alternative
Loan Trust, 0.771%,
due 02/25/35 | | | 68,681 | | |
| | 7,253,993 | | | C,S | | Countrywide Alternative
Loan Trust, 3.136%,
due 11/25/46 | | | 1,791,831 | | |
| | 12,258,011 | | | C,S | | Countrywide Alternative
Loan Trust, 5.403%,
due 10/25/35 | | | 7,441,207 | | |
| | 2,238,845 | | | C,S | | Countrywide Alternative
Loan Trust, 5.500%,
due 02/25/25 | | | 1,515,622 | | |
| | 3,501,321 | | | C,S | | Countrywide Home Loan
Mortgage Pass-through
Trust, 0.791%,
due 04/25/35 | | | 770,976 | | |
Principal
Amount | | | | | | Value | |
| $ | 3,937,980 | | | C,S | | Countrywide Home Loan
Mortgage Pass-through
Trust, 5.250%,
due 10/25/35 | | $ | 2,595,119 | | |
| | 18,398,759 | | | C,S | | Countrywide Home Loan
Mortgage Pass-through
Trust, 5.750%,
due 07/25/37 | | | 12,562,709 | | |
| | 1,290,837 | | | C,S | | Credit Suisse First Boston
Mortgage Securities
Corp., 3.727%,
due 03/15/35 | | | 1,182,011 | | |
| | 991,790 | | | C,S | | Credit Suisse First Boston
Mortgage Securities
Corp., 3.819%,
due 05/15/36 | | | 916,219 | | |
| | 2,328,000 | | | C,S | | Credit Suisse First Boston
Mortgage Securities
Corp., 4.801%,
due 03/15/36 | | | 2,071,242 | | |
| | 1,283,781 | | | C,S | | Credit Suisse First Boston
Mortgage Securities
Corp., 5.000%,
due 08/25/20 | | | 1,127,735 | | |
| | 184,000 | | | C,S | | Credit Suisse First Boston
Mortgage Securities
Corp., 7.695%,
due 04/15/62 | | | 185,030 | | |
| | 1,643,000 | | | C,S | | Credit Suisse Mortgage
Capital Certificates,
5.826%, due 06/15/38 | | | 1,333,245 | | |
| | 3,492,470 | | | C,S | | Credit Suisse Mortgage
Capital Certificates,
7.000%, due 08/25/36 | | | 1,654,500 | | |
| | 1,382,645 | | | C,S | | DLJ Commercial Mortgage
Corp., 7.300%,
due 06/10/32 | | | 1,379,696 | | |
| | 3,000,000 | | | S | | Fannie Mae, 5.000%,
due 05/25/32 | | | 3,021,812 | | |
| | 10,294,213 | | | C,S | | First Horizon Alternative
Mortgage Securities,
5.500%, due 08/25/35 | | | 6,967,783 | | |
| | 3,626,955 | | | C,S | | First Horizon Mortgage
Pass-through Trust,
5.500%, due 12/25/35 | | | 2,695,593 | | |
| | 3,337,006 | | | C,S | | First Union National Bank
Commercial Mortgage,
6.663%, due 01/12/43 | | | 3,283,730 | | |
| | 126,381,539 | | | C,S,^ | | GE Capital Commercial
Mortgage Corp., 0.502%,
due 06/10/48 | | | 1,243,708 | | |
| | 803,000 | | | C,S | | GE Capital Commercial
Mortgage Corp., 4.371%,
due 01/10/38 | | | 773,617 | | |
| | 351,000 | | | C,S | | GE Capital Commercial
Mortgage Corp., 4.865%,
due 07/10/39 | | | 325,108 | | |
| | 651,555 | | | C,S | | GE Capital Commercial
Mortgage Corp., 5.560%,
due 06/10/38 | | | 635,873 | | |
| | 3,458,002 | | | C,S | | GMAC Mortgage Corp.
Loan Trust, 4.583%,
due 10/19/33 | | | 2,686,165 | | |
See Accompanying Notes to Financial Statements
94
PORTFOLIO OF INVESTMENTS
ING VP INTERMEDIATE BOND PORTFOLIO AS OF DECEMBER 31, 2008 (CONTINUED)
Principal
Amount | | | | | | Value | |
| COLLATERALIZED MORTGAGE OBLIGATIONS: (continued) | | | |
| $ | 7,388,501 | | | C,S | | GMAC Mortgage Corp.
Loan Trust, 5.264%,
due 03/18/35 | | $ | 6,505,856 | | |
| | 4,579,839 | | | C,S | | GMAC Mortgage Corp.
Loan Trust, 5.467%,
due 11/19/35 | | | 2,927,522 | | |
| | 237,742 | | | C,S | | GMAC Mortgage Corp.
Loan Trust, 5.500%,
due 09/25/34 | | | 211,954 | | |
| | 109,193,210 | | | #,C,S,^ | | Greenwich Capital
Commercial Funding
Corp., 0.323%,
due 03/10/39 | | | 1,272,210 | | |
| | 6,871,000 | | | C,S | | Greenwich Capital
Commercial Funding
Corp., 5.117%,
due 04/10/37 | | | 6,246,959 | | |
| | 3,280,000 | | | C,S | | Greenwich Capital
Commercial Funding
Corp., 5.534%,
due 03/10/39 | | | 594,749 | | |
| | 1,660,000 | | | C,S | | Greenwich Capital
Commercial Funding
Corp., 5.554%,
due 03/10/39 | | | 297,161 | | |
| | 1,325,000 | | | C,S | | Greenwich Capital
Commercial Funding
Corp., 5.613%,
due 03/10/39 | | | 198,654 | | |
| | 12,993,000 | | | C,S | | GS Mortgage Securities
Corp. II, 5.560%,
due 11/10/39 | | | 10,345,523 | | |
| | 4,390,000 | | | C,S | | GS Mortgage Securities
Corp. II, 5.628%,
due 04/10/38 | | | 854,825 | | |
| | 1,184,372 | | | #,C,S | | GSMPS Mortgage Loan
Trust, 0.821%,
due 01/25/35 | | | 943,263 | | |
| | 2,731,305 | | | C,S | | GSR Mortgage Loan Trust,
5.500%, due 07/25/35 | | | 2,242,769 | | |
| | 6,665,147 | | | C,S | | GSR Mortgage Loan Trust,
6.500%, due 10/25/36 | | | 5,209,927 | | |
| | 932,152 | | | C,S | | Harborview Mortgage
Loan Trust, 0.931%,
due 01/19/35 | | | 472,042 | | |
| | 637,716 | | | C,S | | Homebanc Mortgage Trust,
1.331%, due 08/25/29 | | | 398,931 | | |
| | 15,000,000 | | | C,S | | JPMorgan Alternative Loan
Trust, 0.641%,
due 08/25/36 | | | 9,916,941 | | |
| | 978,968 | | | C,S | | JPMorgan Alternative Loan
Trust, 5.505%,
due 01/25/36 | | | 570,798 | | |
| | 343,618,324 | | | C,S,^ | | JPMorgan Chase
Commercial Mortgage
Securities Corp., 0.038%,
due 01/12/43 | | | 272,146 | | |
| | 510,853 | | | C,S | | JPMorgan Chase
Commercial Mortgage
Securities Corp., 4.200%,
due 07/12/35 | | | 490,244 | | |
Principal
Amount | | | | | | Value | |
| $ | 3,944,000 | | | C,S | | JPMorgan Chase
Commercial Mortgage
Securities Corp., 4.223%,
due 01/15/42 | | $ | 3,815,324 | | |
| | 3,621,373 | | | C,S | | JPMorgan Chase
Commercial Mortgage
Securities Corp., 4.275%,
due 01/12/37 | | | 3,375,256 | | |
| | 1,402,000 | | | C,S | | JPMorgan Chase
Commercial Mortgage
Securities Corp., 4.865%,
due 03/15/46 | | | 1,149,481 | | |
| | 978,000 | | | C,S | | JPMorgan Chase
Commercial Mortgage
Securities Corp., 5.455%,
due 05/15/47 | | | 292,811 | | |
| | 3,434,790 | | | C,S | | JPMorgan Chase
Commercial Mortgage
Securities Corp., 5.475%,
due 04/15/43 | | | 2,682,062 | | |
| | 1,951,000 | | | C,S | | JPMorgan Chase
Commercial Mortgage
Securities Corp., 5.495%,
due 05/15/47 | | | 496,513 | | |
| | 495,496 | | | C,S | | JPMorgan Chase
Commercial Mortgage
Securities Corp., 5.833%,
due 04/15/45 | | | 481,124 | | |
| | 4,421,000 | | | C,S | | JPMorgan Chase
Commercial Mortgage
Securities Corp., 5.861%,
due 04/15/45 | | | 3,790,755 | | |
| | 28,365,045 | | | C,S | | JPMorgan Mortgage Trust,
5.400%, due 11/25/35 | | | 21,452,935 | | |
| | 28,014,473 | | | C,S,^ | | LB-UBS Commercial
Mortgage Trust, 0.486%,
due 02/15/40 | | | 538,954 | | |
| | 1,873,000 | | | C,S | | LB-UBS Commercial
Mortgage Trust, 3.992%,
due 10/15/29 | | | 1,821,563 | | |
| | 509,000 | | | C,S | | LB-UBS Commercial
Mortgage Trust, 4.310%,
due 02/15/30 | | | 472,636 | | |
| | 1,717,000 | | | C,S | | LB-UBS Commercial
Mortgage Trust, 4.510%,
due 12/15/29 | | | 1,563,168 | | |
| | 2,820,907 | | | C,S | | LB-UBS Commercial
Mortgage Trust, 4.821%,
due 04/15/30 | | | 2,681,233 | | |
| | 1,112,000 | | | C,S | | LB-UBS Commercial
Mortgage Trust, 4.836%,
due 02/15/40 | | | 365,351 | | |
| | 2,060,000 | | | C,S | | LB-UBS Commercial
Mortgage Trust, 4.885%,
due 09/15/30 | | | 1,907,696 | | |
| | 2,416,000 | | | C,S | | LB-UBS Commercial
Mortgage Trust, 4.998%,
due 04/15/30 | | | 2,198,770 | | |
| | 3,500,000 | | | C,S | | LB-UBS Commercial
Mortgage Trust, 5.103%,
due 11/15/30 | | | 3,167,683 | | |
See Accompanying Notes to Financial Statements
95
PORTFOLIO OF INVESTMENTS
ING VP INTERMEDIATE BOND PORTFOLIO AS OF DECEMBER 31, 2008 (CONTINUED)
Principal
Amount | | | | | | Value | |
| COLLATERALIZED MORTGAGE OBLIGATIONS: (continued) | | | |
| $ | 4,256,000 | | | C,S | | LB-UBS Commercial
Mortgage Trust, 5.287%,
due 04/15/40 | | $ | 1,183,085 | | |
| | 5,512,000 | | | C,S | | LB-UBS Commercial
Mortgage Trust, 5.347%,
due 11/15/38 | | | 4,309,875 | | |
| | 6,517,000 | | | C,S | | LB-UBS Commercial
Mortgage Trust, 5.403%,
due 02/15/40 | | | 4,688,164 | | |
| | 2,358,000 | | | C,S | | LB-UBS Commercial
Mortgage Trust, 5.516%,
due 11/15/38 | | | 411,337 | | |
| | 1,693,000 | | | C,S | | LB-UBS Commercial
Mortgage Trust, 5.533%,
due 02/15/40 | | | 305,294 | | |
| | 3,386,000 | | | C,S | | LB-UBS Commercial
Mortgage Trust, 5.563%,
due 02/15/40 | | | 594,681 | | |
| | 3,854,000 | | | C,S | | LB-UBS Commercial
Mortgage Trust, 5.883%,
due 06/15/38 | | | 3,182,313 | | |
| | 9,400,000 | | | C,S | | LB-UBS Commercial
Mortgage Trust, 6.149%,
due 04/15/41 | | | 6,859,447 | | |
| | 15,737,000 | | | C,S | | LB-UBS Commercial
Mortgage Trust, 6.365%,
due 12/15/28 | | | 15,333,624 | | |
| | 11,581,335 | | | C,S | | LB-UBS Commercial
Mortgage Trust, 7.370%,
due 08/15/26 | | | 11,582,149 | | |
| | 3,531,119 | | | C,S | | Luminent Mortgage Trust,
0.671%, due 10/25/46 | | | 1,452,610 | | |
| | 343,560 | | | C,S | | MASTR Adjustable Rate
Mortgages Trust, 2.996%,
due 01/25/47 | | | 90,579 | | |
| | 3,752,000 | | | C,S | | MASTR Alternative Loans
Trust, 6.250%,
due 07/25/36 | | | 2,027,413 | | |
| | 63,779 | | | C,S | | MASTR Alternative Loans
Trust, 6.500%,
due 05/25/33 | | | 50,318 | | |
| | 617,583 | | | C,S | | MASTR Alternative Loans
Trust, 8.500%,
due 05/25/33 | | | 577,188 | | |
| | 1,684,492 | | | C,S | | MASTR Asset Securitization
Trust, 5.500%,
due 06/25/33 | | | 1,512,208 | | |
| | 3,717,968 | | | C,S | | MASTR Reperforming
Loan Trust, 0.831%,
due 07/25/35 | | | 3,100,390 | | |
| | 76,901,532 | | | #,C,S,^ | | Merrill Lynch Mortgage
Trust, 0.154%,
due 11/12/35 | | | 255,498 | | |
| | 103,538,595 | | | S,^ | | Merrill Lynch Mortgage
Trust, 0.215%,
due 10/12/41 | | | 1,118,610 | | |
| | 2,725,000 | | | C,S | | Merrill Lynch Mortgage
Trust, 4.892%,
due 02/12/42 | | | 2,501,433 | | |
| | 19,252,716 | | | C,S,^ | | Merrill Lynch/Countrywide
Commercial Mortgage
Trust, 0.541%,
due 08/12/48 | | | 385,285 | | |
Principal
Amount | | | | | | Value | |
| $ | 1,445,000 | | | C,S | | Merrill Lynch/Countrywide
Commercial Mortgage
Trust, 5.479%,
due 08/12/48 | | $ | 255,486 | | |
| | 1,617,000 | | | C,S | | Merrill Lynch/Countrywide
Commercial Mortgage
Trust, 5.509%,
due 08/12/48 | | | 278,407 | | |
| | 915,190 | | | C,S | | MLCC Mortgage
Investors, Inc., 0.701%,
due 04/25/29 | | | 620,400 | | |
| | 425,176 | | | C,S | | MLCC Mortgage
Investors, Inc., 0.791%,
due 01/25/29 | | | 338,252 | | |
| | 8,915,000 | | | C,S | | Morgan Stanley Capital I,
5.007%, due 01/14/42 | | | 7,467,006 | | |
| | 1,743,105 | | | C,S | | Morgan Stanley Dean
Witter Capital I, 4.180%,
due 03/12/35 | | | 1,588,700 | | |
| | 64,342 | | | C,S | | MortgageIT Trust, 0.841%,
due 11/25/35 | | | 15,564 | | |
| | 3,764,000 | | | C,S | | New York Mortgage Trust,
Inc., 5.652%,
due 05/25/36 | | | 2,442,149 | | |
| | 1,804,000 | | | C,S | | Nomura Asset Securities
Corp., 6.690%,
due 03/15/30 | | | 1,771,426 | | |
| | 1,747,867 | | | C,S | | Prime Mortgage Trust,
0.971%, due 02/25/35 | | | 992,729 | | |
| | 1,952,568 | | | C,S | | Prudential Commercial
Mortgage Trust, 3.669%,
due 02/11/36 | | | 1,860,804 | | |
| | 13,386,220 | | | C,S | | RAAC Series, 5.250%,
due 09/25/34 | | | 9,844,318 | | |
| | 1,572,018 | | | C,S | | Residential Accredit Loans,
Inc., 0.701%,
due 05/25/46 | | | 286,594 | | |
| | 4,475,552 | | | C,S | | Residential Accredit
Loans, Inc., 0.711%,
due 04/25/46 | | | 943,949 | | |
| | 8,416,411 | | | C,S | | Residential Accredit
Loans, Inc., 5.000%,
due 09/25/36 | | | 6,777,963 | | |
| | 14,788,268 | | | C,S | | Residential Accredit
Loans, Inc., 5.500%,
due 05/25/34 | | | 10,760,154 | | |
| | 1,170,679 | | | C,S | | Residential Funding
Mortgage Securities I,
0.921%, due 05/25/33 | | | 777,157 | | |
| | 607,884 | | | C,S | | Sequoia Mortgage Trust,
0.778%, due 01/20/35 | | | 321,198 | | |
| | 753,184 | | | C,S | | Structured Adjustable Rate
Mortgage Loan Trust,
0.781%, due 07/25/35 | | | 350,084 | | |
| | 1,189,259 | | | C,S | | Structured Asset Mortgage
Investments, Inc., 0.821%,
due 04/19/35 | | | 630,580 | | |
| | 5,456,126 | | | C,S | | Structured Asset Mortgage
Investments, Inc., 4.762%,
due 12/27/35 | | | 3,352,676 | | |
| | 1,179,677 | | | C,S | | Structured Asset
Securities Corp., 5.500%,
due 07/25/33 | | | 1,138,303 | | |
See Accompanying Notes to Financial Statements
96
PORTFOLIO OF INVESTMENTS
ING VP INTERMEDIATE BOND PORTFOLIO AS OF DECEMBER 31, 2008 (CONTINUED)
Principal
Amount | | | | | | Value | |
| COLLATERALIZED MORTGAGE OBLIGATIONS: (continued) | | | |
| $ | 1,857,754 | | | C,S | | Thornburg Mortgage
Securities Trust, 0.821%,
due 12/25/33 | | $ | 1,450,137 | | |
| | 1,888,668 | | | C,S | | Thornburg Mortgage
Securities Trust, 0.841%,
due 09/25/44 | | | 1,520,147 | | |
| | 12,664,000 | | | #,C,S | | Wachovia Bank
Commercial Mortgage
Trust, 5.209%,
due 10/15/44 | | | 3,347,110 | | |
| | 630,000 | | | C,S | | Wachovia Bank
Commercial Mortgage
Trust, 5.243%,
due 07/15/42 | | | 588,784 | | |
| | 7,217,158 | | | C,S | | Washington Mutual
Mortgage Pass-through
Certificates, 0.761%,
due 09/25/46 | | | 1,478,969 | | |
| | 863,022 | | | C,S | | Washington Mutual
Mortgage Pass-through
Certificates, 0.781%,
due 01/25/45 | | | 445,008 | | |
| | 1,104,812 | | | C,S | | Washington Mutual
Mortgage Pass-through
Certificates, 0.791%,
due 08/25/45 | | | 599,760 | | |
| | 1,604,984 | | | C,S | | Washington Mutual
Mortgage Pass-through
Certificates, 0.871%,
due 08/25/45 | | | 552,125 | | |
| | 1,121,802 | | | C,S | | Washington Mutual
Mortgage Pass-through
Certificates, 1.071%,
due 07/25/36 | | | 622,152 | | |
| | 829,559 | | | C,S | | Washington Mutual
Mortgage Pass-through
Certificates, 1.858%,
due 06/25/44 | | | 476,164 | | |
| | 29,465 | | | C,S | | Washington Mutual
Mortgage Pass-through
Certificates, 2.956%,
due 02/25/47 | | | 10,978 | | |
| | 6,968,050 | | | C,S | | Washington Mutual
Mortgage Pass-through
Certificates, 2.956%,
due 03/25/47 | | | 2,599,509 | | |
| | 12,546,645 | | | C,S | | Washington Mutual
Mortgage Pass-through
Certificates, 2.996%,
due 01/25/47 | | | 4,639,694 | | |
| | 11,327,474 | | | C,S | | Washington Mutual
Mortgage Pass-through
Certificates 1A,
3.006%, due 06/25/47 | | | 4,968,454 | | |
| | 5,092,980 | | | C,S | | Washington Mutual
Mortgage Pass-through
Certificates 1A1B, 3.006%,
due 06/25/47 | | | 1,446,261 | | |
| | 8,562,948 | | | C,S | | Washington Mutual
Mortgage Pass-through
Certificates, 3.016%,
due 04/25/47 | | | 2,456,057 | | |
Principal
Amount | | | | | | Value | |
| $ | 12,416,274 | | | C,S | | Washington Mutual
Mortgage Pass-through
Certificates, 3.026%,
due 04/25/47 | | $ | 5,467,876 | | |
| | 8,638,625 | | | C,S | | Washington Mutual
Mortgage Pass-through
Certificates 1A, 3.026%,
due 05/25/47 | | | 3,808,600 | | |
| | 4,452,440 | | | C,S | | Washington Mutual
Mortgage Pass-through
Certificates 1A1B,
3.026%, due 05/25/47 | | | 1,286,469 | | |
| | 706,515 | | | C,S | | Washington Mutual
Mortgage Pass-through
Certificates, 3.066%,
due 12/25/46 | | | 199,631 | | |
| | 4,637,841 | | | C,S | | Washington Mutual
Mortgage Pass-through
Certificates 1A, 3.066%,
due 07/25/47 | | | 1,894,742 | | |
| | 10,980,541 | | | C,S | | Washington Mutual
Mortgage Pass-through
Certificates 1A1B,
3.066%, due 07/25/47 | | | 3,180,418 | | |
| | 7,516,907 | | | C,S | | Washington Mutual
Mortgage Pass-through
Certificates 1A, 3.096%,
due 11/25/46 | | | 2,786,055 | | |
| | 1,405,029 | | | C,S | | Washington Mutual
Mortgage Pass-through
Certificates 1A1B,
3.096%, due 11/25/46 | | | 342,205 | | |
| | 4,013,448 | | | C,S | | Washington Mutual
Mortgage Pass-through
Certificates, 3.216%,
due 09/25/46 | | | 1,516,021 | | |
| | 6,257,347 | | | C,S | | Washington Mutual
Mortgage Pass-through
Certificates, 3.226%,
due 05/25/46 | | | 1,773,783 | | |
| | 813,283 | | | C,S | | Washington Mutual
Mortgage Pass-through
Certificates, 3.226%,
due 06/25/46 | | | 306,787 | | |
| | 13,718,915 | | | C,S | | Washington Mutual
Mortgage Pass-through
Certificates, 3.246%,
due 06/25/46 | | | 5,247,967 | | |
| | 1,607,856 | | | C,S | | Washington Mutual
Mortgage Pass-through
Certificates, 3.756%,
due 11/25/46 | | | 321,571 | | |
| | 4,782,000 | | | C,S | | Washington Mutual
Mortgage Pass-through
Certificates, 3.792%,
due 06/25/34 | | | 4,572,450 | | |
| | 2,000,914 | | | C,S | | Washington Mutual
Mortgage Pass-through
Certificates, 4.375%,
due 01/25/47 | | | 904,933 | | |
See Accompanying Notes to Financial Statements
97
PORTFOLIO OF INVESTMENTS
ING VP INTERMEDIATE BOND PORTFOLIO AS OF DECEMBER 31, 2008 (CONTINUED)
Principal
Amount | | | | | | Value | |
| COLLATERALIZED MORTGAGE OBLIGATIONS: (continued) | | | |
| $ | 1,423,647 | | | C,S | | Washington Mutual
Mortgage Pass-through
Certificates, 4.625%,
due 10/25/46 | | $ | 665,717 | | |
| | 3,971,707 | | | C,S | | Washington Mutual
Mortgage Pass-through
Certificates, 5.000%,
due 12/25/18 | | | 3,764,043 | | |
| | 7,670,397 | | | C,S | | Washington Mutual
Mortgage Pass-through
Certificates 2A3,
5.489%, due 01/25/37 | | | 5,056,136 | | |
| | 1,140,235 | | | C,S | | Washington Mutual
Mortgage Pass-through
Certificates 2A4,
5.489%, due 01/25/37 | | | 432,109 | | |
| | 13,013,773 | | | C,S | | Washington Mutual
Mortgage Pass-through
Certificates, 5.658%,
due 06/25/37 | | | 6,766,408 | | |
| | 2,989,000 | | | C,S | | Washington Mutual
Mortgage Pass-through
Certificates, 5.812%,
due 10/25/36 | | | 1,645,071 | | |
| | 838,792 | | | C,S | | Washington Mutual
Mortgage Pass-through
Certificates, 5.814%,
due 06/25/37 | | | 472,529 | | |
| | 5,334,576 | | | C,S | | Washington Mutual
Mortgage Pass-through
Certificates, 5.859%,
due 07/25/37 | | | 2,699,313 | | |
| | 7,132,082 | | | C,S | | Washington Mutual
Mortgage Pass-through
Certificates, 5.869%,
due 07/25/37 | | | 3,694,262 | | |
| | 1,625,994 | | | C,S | | Washington Mutual
Mortgage Pass-through
Certificates, 5.895%,
due 07/25/37 | | | 831,699 | | |
| | 3,215,832 | | | C,S | | Washington Mutual
Mortgage Pass-through
Certificates, 6.000%,
due 06/25/34 | | | 2,511,968 | | |
| | 6,983,000 | | | C,S | | Wells Fargo
Mortgage-Backed
Securities Trust, 3.622%,
due 06/25/35 | | | 6,803,093 | | |
| | 5,830,990 | | | C,S | | Wells Fargo
Mortgage-Backed
Securities Trust, 4.500%,
due 08/25/18 | | | 5,228,315 | | |
| | 4,469,000 | | | C,S | | Wells Fargo
Mortgage-Backed
Securities Trust A5,
4.787%, due 07/25/34 | | | 3,378,896 | | |
| | 4,243,000 | | | C,S | | Wells Fargo
Mortgage-Backed
Securities Trust A6,
4.787%, due 07/25/34 | | | 3,049,892 | | |
Principal
Amount | | | | | | Value | |
| $ | 3,795,604 | | | C,S | | Wells Fargo
Mortgage-Backed
Securities Trust, 4.888%,
due 08/25/34 | | $ | 2,758,384 | | |
| | 5,983,215 | | | C,S | | Wells Fargo
Mortgage-Backed
Securities Trust, 5.000%,
due 12/25/33 | | | 5,226,798 | | |
| | 9,230,057 | | | C,S | | Wells Fargo
Mortgage-Backed
Securities Trust, 5.113%,
due 03/25/36 | | | 6,928,825 | | |
| | 28,128 | | | C,S | | Wells Fargo
Mortgage-Backed
Securities Trust, 5.261%,
due 10/25/35 | | | 21,341 | | |
| | 9,974,808 | | | C,S | | Wells Fargo
Mortgage-Backed
Securities Trust, 5.387%,
due 08/25/35 | | | 7,057,920 | | |
| | 7,806,530 | | | C,S | | Wells Fargo
Mortgage-Backed
Securities Trust, 5.629%,
due 12/25/36 | | | 5,081,997 | | |
| | 7,242,869 | | | C,S | | Wells Fargo
Mortgage-Backed
Securities Trust, 5.922%,
due 11/25/36 | | | 4,737,655 | | |
| | 8,404,850 | | | C,S | | Wells Fargo
Mortgage-Backed
Securities Trust, 5.938%,
due 10/25/36 | | | 5,802,085 | | |
| | 9,093,969 | | | C,S | | Wells Fargo
Mortgage-Backed
Securities Trust, 6.000%,
due 06/25/36 | | | 6,070,567 | | |
| | 8,839,198 | | | C,S | | Wells Fargo
Mortgage-Backed
Securities Trust, 6.000%,
due 12/28/37 | | | 5,716,748 | | |
Total Collateralized
Mortgage Obligations
(Cost $880,846,702) | | | 578,429,842 | | |
| MUNICIPAL BONDS: 1.0% | | | |
| | | | | California: 0.1% | |
| | 6,661,000 | | | C | | City of San Diego, 7.125%,
due 06/01/32 | | | 4,367,684 | | |
| | | | 4,367,684 | | |
| | | | | Florida: 0.1% | |
| | 3,775,000 | | | C | | Florida State Board of
Education, 4.750%,
due 06/01/35 | | | 3,256,202 | | |
| | | | 3,256,202 | | |
| | | | | Lousiana: 0.3% | |
| | 7,635,000 | | | C,S | | State of Louisiana, 5.000%,
due 10/15/17 | | | 8,171,053 | | |
| | | | 8,171,053 | | |
See Accompanying Notes to Financial Statements
98
PORTFOLIO OF INVESTMENTS
ING VP INTERMEDIATE BOND PORTFOLIO AS OF DECEMBER 31, 2008 (CONTINUED)
Principal
Amount | | | | | | Value | |
| | | | | Michigan: 0.2% | |
| $ | 10,370,000 | | | S | | Michigan Tobacco
Settlement Finance
Authority, 7.309%,
due 06/01/34 | | $ | 6,741,019 | | |
| | | | 6,741,019 | | |
| | | | | Washington: 0.3% | |
| | 8,530,000 | | | C | | State of Washington,
5.000%, due 01/01/33 | | | 8,195,965 | | |
| | | | 8,195,965 | | |
Total Municipal Bonds
(Cost $37,291,237) | | | 30,731,923 | | |
| Shares | | | | | | Value | |
| PREFERRED STOCK: 0.5% | | | |
| | | | | Diversified Financial Services: 0.2% | |
| | 8,933 | | | #,P | | Zurich RegCaPS
Funding Trust | | $ | 6,638,336 | | |
| | | | 6,638,336 | | |
| | | | | Insurance: 0.3% | |
| | 134,500 | | | @@,P | | Aegon NV - Series 1 | | | 1,206,465 | | |
| | 348,467 | | | @@,P | | Aegon NV | | | 3,425,431 | | |
| | 895,520 | | | @@,P | | XL Capital, Ltd. | | | 2,238,800 | | |
| | | | 6,870,696 | | |
Total Preferred Stock
(Cost $36,728,026) | | | 13,509,032 | | |
Total Long-Term Investments
(Cost $3,578,288,949) | | | 3,131,220,860 | | |
Principal
Amount | | | | | | Value | |
| SHORT-TERM INVESTMENTS: 29.0% | | | |
| | | | | Certificates of Deposit: 1.4% | |
| $ | 15,000,000 | | | S | | BNP Paribas, 0.000%,
due 01/05/09 | | $ | 15,004,729 | | |
| | 26,000,000 | | | S | | BNP Paribas, 3.060%,
due 01/26/09 | | | 26,051,739 | | |
Total Certificates of Deposit
(Cost $41,056,468) | | | 41,056,468 | | |
| | | | | Commercial Paper: 13.7% | |
| | 10,000,000 | | | S | | Alcoa, Inc., 5.360%,
due 01/13/09 | | | 9,980,681 | | |
| | 15,000,000 | | | S | | Alcoa, Inc., 6.310%,
due 01/06/09 | | | 14,984,250 | | |
| | 5,000,000 | | | S | | Barton Capital, LLC,
1.930%, due 02/11/09 | | | 4,988,743 | | |
| | 65,000,000 | | | S | | Caisse Nationale des
Caisses d'Epargne et de
Prevoyance, 0.190%,
due 01/05/09 | | | 64,998,196 | | |
| | 65,000,000 | | | S | | Ciesco, LLC, 0.200%,
due 01/21/09 | | | 64,992,417 | | |
| | 9,250,000 | | | S | | ConAgra Foods, Inc.,
2.750%, due 01/09/09 | | | 9,243,641 | | |
| | 20,000,000 | | | #,S | | ConocoPhillips, 1.230%,
due 01/30/09 | | | 19,979,501 | | |
Principal
Amount | | | | | | Value | |
| $ | 15,000,000 | | | S | | CVS Caremark Corp.,
6.160%, due 01/12/09 | | $ | 14,969,250 | | |
| | 10,000,000 | | | S | | Dow Chemical Co.,
6.010%, due 01/06/09 | | | 9,990,000 | | |
| | 7,169,000 | | | S | | General Mills, Inc.,
4.000%, due 01/08/09 | | | 7,162,627 | | |
| | 20,000,000 | | | #,S | | Kellogg Co., 4.250%,
due 01/02/09 | | | 19,995,278 | | |
| | 65,000,000 | | | #,S | | Thunder Bay Funding, LLC,
0.300%, due 01/15/09 | | | 64,991,875 | | |
| | 15,000,000 | | | S | | Variable Funding Capital,
1.750%, due 01/14/09 | | | 14,989,791 | | |
| | 25,000,000 | | | S | | Volkswagen of America,
6.110%, due 01/05/09 | | | 24,978,820 | | |
| | 18,900,000 | | | #,S | | Yorktown Capital, LLC,
0.250%, due 01/21/09 | | | 18,897,244 | | |
| | 21,000,000 | | | #,S | | Yorktown Capital, LLC,
0.250%, due 01/22/09 | | | 20,996,791 | | |
| | 18,500,000 | | | #,S | | Yorktown Capital, LLC,
1.480%, due 03/06/09 | | | 18,455,229 | | |
Total Commercial Paper
(Cost $404,626,606) | | | 404,594,334 | | |
| Shares | | | | | | Value | |
| | | | | Affiliated Mutual Fund: 2.3% | |
| | 67,118,000 | | | S | | ING Institutional Prime
Money Market
Fund - Class I | | $ | 67,118,000 | | |
Total Mutual Fund
(Cost $67,118,000) | | | 67,118,000 | | |
Principal
Amount | | | | | | Value | |
| | | | | U.S. Treasury Bills: 0.3% | |
| $ | 1,000,000 | | | (a) | | 0.080%, due 05/15/09 | | $ | 999,708 | | |
| | 7,000,000 | | | (a) | | 0.190%, due 09/24/09 | | | 6,989,899 | | |
Total U.S. Treasury Bills
(Cost $7,935,783) | | | 7,989,607 | | |
| | | Securities Lending Collateralcc: 11.3% | |
| | 337,644,986 | | | Bank of New York
Mellon Corp. Institutional
Cash Reserves | | | 334,999,542 | | |
Total Securities
Lending Collateral
(Cost $337,644,986) | | | 334,999,542 | | |
Total Short-Term
Investments
(Cost $858,381,843) | | | 855,757,951 | | |
Total Investments in
Securities
(Cost $4,436,670,792)* | | | 134.8 | % | | $ | 3,986,978,811 | | |
Other Assets and
Liabilities - Net | | | (34.8 | ) | | | (1,029,573,860 | ) | |
| Net Assets | | | 100.0 | % | | $ | 2,957,404,951 | | |
@@ Foreign Issuer
MASTR Mortgage Asset Securitization Transaction, Inc.
See Accompanying Notes to Financial Statements
99
PORTFOLIO OF INVESTMENTS
ING VP INTERMEDIATE BOND PORTFOLIO AS OF DECEMBER 31, 2008 (CONTINUED)
# Securities with purchases pursuant to Rule 144A or section 4(2), under the Securities Act of 1933 and may not be resold subject to that rule except to qualified institutional buyers. Unless otherwise noted, these securities have been determined to be liquid under the guidelines established by the Funds' Board of Directors/Trustees.
C Bond may be called prior to maturity date.
P Preferred Stock may be called prior to convertible date.
I Illiquid security
cc Securities purchased with cash collateral for securities loaned.
ip Treasury inflation indexed protected security whose principal value is adjusted in accordance with changes to the Consumer Price Index.
## On September 7, 2008, the Federal Housing Finance Agency placed the Federal National Mortgage Association and the Federal Home Loan Mortgage Corporation into conservatorship and the U.S. Treasury guaranteed the debt issued by those organizations.
W Settlement is on a when-issued or delayed-delivery basis.
S All or a portion of this security is segregated to cover collateral requirements for applicable futures, options, swaps, foreign forward currency contracts and/or when-issued or delayed-delivery securities.
L Loaned security, a portion or all of the security is on loan at December 31, 2008.
^ Interest only securities represent the right to receive the monthly interest payments on an underlying pool of mortgage loans. Principal amount shown represents the notional amount on which current interest is calculated. Payments of principal on the pool reduce the value of the interest only security.
Z Indicates Zero Coupon Bond; rate shown reflects current effective yield.
± Defaulted security
(a) Held as collateral by The Royal Bank of Scotland PLC posted to a tri-party account as collateral for swaps and foreign forward currency contracts.
The Portfolio received $28,018,000 in cash collateral for swaps and foreign forward currency contracts, with these amounts being held in a tri-party account.
* Cost for federal income tax purposes is $4,438,011,103.
Net unrealized depreciation consists of:
| Gross Unrealized Appreciation | | $ | 70,385,853 | | |
| Gross Unrealized Depreciation | | | (521,418,145 | ) | |
| Net Unrealized Depreciation | | $ | (451,032,292 | ) | |
The following table summarizes the inputs used as of December 31, 2008 in determining the Portfolio's investments at fair value for purposes of SFAS 157:
| | | Investments in
Securities | | Other Financial
Instruments* | |
| Level 1 — Quoted Prices | | $ | 67,118,000 | | | $ | (14,832,990 | ) | |
Level 2 — Other Significant
Observable Inputs | | | 3,876,338,251 | | | | 44,125,411 | | |
Level 3 — Significant
Unobservable Inputs | | | 43,522,560 | | | | 1,701,544 | | |
| Total | | $ | 3,986,978,811 | | | $ | 30,993,965 | | |
"Fair value" for purposes of SFAS 157 is different from "fair value" as used in the 1940 Act. The former generally implies market value, and can include market quotations as a source of value, and the latter refers to determinations of actual value in absence of available market quotations.
* Other financial instruments may include forward foreign currency contracts, futures, swaps, and written options. Forward foreign currency contracts and futures are reported at their unrealized gain/loss at year end. Swaps and written options are reported at their market value at year end.
A roll forward of fair value measurements using significant unobservable inputs (Level 3) for the year ended December 31, 2008, was as follows:
| | | Investments in
Securities | | Other Financial
Instruments* | |
Beginning Balance
at 12/31/07 | | $ | 97,506,953 | | | $ | (358,101 | ) | |
| Net Purchases/(Sales) | | | (15,799,896 | ) | | | 3,663,694 | | |
Accrued Discounts/
(Premiums) | | | 573,139 | | | | (26,568 | ) | |
| Total Realized Gain/(Loss) | | | 1,230,255 | | | | (2,628,763 | ) | |
Total Unrealized
Appreciation/
(Depreciation) | | | (36,352,268 | ) | | | 1,560,206 | | |
Net Transfers In/
(Out) of Level 3 | | | (3,635,623 | ) | | | (508,924 | ) | |
Ending Balance
at 12/31/08 | | $ | 43,522,560 | | | $ | 1,701,544 | | |
* Other financial instruments may include forward foreign currency contracts, futures, swaps, and written options. Forward foreign currency contracts and futures are reported at their unrealized gain/loss at year end. Swaps and written options are reported at their market value at year end.
For the year ended December 31, 2008, total change in unrealized gain (loss) on Level 3 securities included in the change in net assets
was $(43,953,681). Total unrealized gain (loss) for all securities (including Level 1 and Level 2) can be found on the accompanying Statement of Operations.
At December 31, 2008 the following forward foreign currency contracts were outstanding for the ING VP Intermediate Bond Portfolio:
| Currency | | Buy/Sell | | Settlement
Date | | In
Exchange
For | | Value | | Unrealized
Appreciation/
(Depreciation) | |
| Colombian Peso | | | | | �� | USD | | | | | | | | |
| | |
COP
| |
| 36,875,352,017 | | BUY | | 01/08/09 | | | 15,942,651 | | | | 16,377,156 | | | $ | 434,505 | | |
Indonesian Rupiah
IDR
85,773,600,042 | | BUY | | 01/08/09 | | | 7,990,088 | | | | 7,831,301 | | | | (158,787 | ) | |
Russian Ruble
RUB
230,400,000 | | BUY | | 01/13/09 | | | 8,022,284 | | | | 7,380,034 | | | | (642,250 | ) | |
Russian Ruble
RUB
230,800,000 | | BUY | | 01/13/09 | | | 8,034,449 | | | | 7,392,846 | | | | (641,603 | ) | |
| | | $ | (1,008,135 | ) | |
See Accompanying Notes to Financial Statements
100
PORTFOLIO OF INVESTMENTS
ING VP INTERMEDIATE BOND PORTFOLIO AS OF DECEMBER 31, 2008 (CONTINUED)
| Currency | | Buy/Sell | | Settlement
Date | | In
Exchange
For | | Value | | Unrealized
Appreciation/
(Depreciation) | |
| Colombian Peso | | | | | | USD | | | | | | | | |
| | |
| COP | | | | | | | |
| |
| 19,937,389,303 | | SELL | | 01/08/09 | | | 8,600,746 | | | | 8,854,634 | | | $ | (253,888 | ) | |
Colombian Peso
COP
16,937,962,720 | | SELL | | 01/08/09 | | | 7,341,350 | | | | 7,522,522 | | | | (181,172 | ) | |
Indonesian Rupiah
IDR
85,773,600,063 | | SELL | | 01/08/09 | | | 6,297,621 | | | | 7,831,301 | | | | (1,533,680 | ) | |
Russian Ruble
RUB
230,800,000 | | SELL | | 01/13/09 | | | 7,737,177 | | | | 7,392,846 | | | | 344,331 | | |
Russian Ruble
RUB
230,400,000 | | SELL | | 01/13/09 | | | 7,716,008 | | | | 7,380,034 | | | | 335,974 | | |
| | | $ | (1,288,435 | ) | |
ING VP Intermediate Bond Portfolio Open Futures Contracts on December 31, 2008:
Contract
Description | | Number of
Contracts | | Expiration
Date | | Unrealized
Appreciation/
(Depreciation) | |
| Long Contracts | |
| Euro-Bund | | | 428 | | | 03/06/09 | | $ | 666,451 | | |
| Euro-Schatz | | | 1,945 | | | 03/06/09 | | | 1,670,500 | | |
| Long Gilt | | | 656 | | | 03/27/09 | | | 7,492,999 | | |
| U.S. Treasury 2-Year Note | | | 689 | | | 03/31/09 | | | 1,155,167 | | |
| | | $ | 10,985,117 | | |
| Short Contracts | |
| U.S. Treasury 10-Year Note | | | 1,472 | | | 03/20/09 | | $ | (10,600,555 | ) | |
| U.S. Treasury Long Bond | | | 1,239 | | | 03/20/09 | | | (15,217,552 | ) | |
| | | $ | (25,818,107 | ) | |
ING VP Intermediate Bond Portfolio Interest Rate Swap Agreements Outstanding on December 31, 2008:
| | | Termination
Date | | Notional
Principal
Amount | | Unrealized
Appreciation/
(Depreciation) | |
Receive a fixed rate
equal to 7.060% and
pay a floating rate
based on 3-month
NZD-BBR-FRA
Counterparty:
UBS AG, London | | 01/28/11 | | NZD | 287,633,000 | | | $ | 8,862,818 | | |
Receive a fixed rate
equal to 7.015% and
pay a floating rate
based on 3-month
NZD-BBR-FRA
Counterparty:
UBS AG, London | | 02/04/11 | | NZD | 144,010,000 | | | | 4,400,658 | | |
Receive a floating rate
based on 3-month
NZD-BBR-FRA and
pay a fixed rate
equal to 7.055%
Counterparty:
UBS AG, London | | 01/28/16 | | NZD | 97,796,000 | | | | (7,727,876 | ) | |
Receive a floating rate
based on 3-month
NZD-BBR-FRA and
pay a fixed rate
equal to 7.000%
Counterparty:
UBS AG, London | | 02/04/16 | | NZD | 48,390,000 | | | | (3,731,904 | ) | |
| | | | | | | $ | 1,803,696 | | |
ING VP Intermediate Bond Portfolio Credit Default Swap Agreements Outstanding on December 31, 2008:
Credit Default Swaps on Credit Indices — Buy Protection(1)
| Counterparty | | Reference
Entity/Obligation | | Buy/Sell
Protection | | (Pay)/
Receive
Fixed
Rate (%) | | Termination
Date | | Notional
Amount(4) | | Market
Value(5) | | Upfront
Premium
Paid/
(Received) | | Unrealized
Appreciation/
(Depreciation) | |
Citibank N.A.,
New York | | CDX.EM.9 Index | | Buy | | | (2.650 | ) | | 06/20/13 | | USD | 76,001,000 | | | $ | 11,978,338 | | | $ | (196,446 | ) | | $ | 12,174,784 | | |
Citibank N.A.,
New York | | CDX.EM.9 Index | | Buy | | | (2.650 | ) | | 06/20/13 | | USD | 14,064,000 | | | | 2,216,594 | | | | 176,695 | | | | 2,039,899 | | |
Citibank N.A.,
New York | | CDX.EM.9 Index | | Buy | | | (2.650 | ) | | 06/20/13 | | USD | 15,776,000 | | | | 2,486,418 | | | | 196,285 | | | | 2,290,133 | | |
Barclays
Bank PLC | | CDX.EM.10 Index | | Buy | | | (3.350 | ) | | 12/20/13 | | USD | 1,780,000 | | | | 268,708 | | | | 389,904 | | | | (121,196 | ) | |
Barclays
Bank PLC | | CDX.EM.10 Index | | Buy | | | (3.350 | ) | | 12/20/13 | | USD | 35,559,000 | | | | 5,367,970 | | | | 8,435,537 | | | | (3,067,567 | ) | |
Barclays
Bank PLC | | CDX.NA.IG.10 Index | | Buy | | | (1.550 | ) | | 06/20/13 | | USD | 34,644,096 | | | | 818,426 | | | | 1,212,504 | | | | (394,078 | ) | |
Citibank N.A.,
New York | | CDX.NA.IG.10 Index | | Buy | | | (1.550 | ) | | 06/20/13 | | USD | 16,230,880 | | | | 383,435 | | | | (324,675 | ) | | | 708,110 | | |
Barclays
Bank PLC | | CDX.NA.IG.11 Index | | Buy | | | (1.500 | ) | | 12/20/13 | | USD | 17,500,000 | | | | 367,507 | | | | 832,201 | | | | (464,694 | ) | |
Goldman Sachs
International | | CDX.NA.IG.11 Index | | Buy | | | (1.500 | ) | | 12/20/13 | | USD | 19,329,000 | | | | 405,916 | | | | 616,645 | | | | (210,729 | ) | |
See Accompanying Notes to Financial Statements
101
PORTFOLIO OF INVESTMENTS
ING VP INTERMEDIATE BOND PORTFOLIO AS OF DECEMBER 31, 2008 (CONTINUED)
| Counterparty | | Reference
Entity/Obligation | | Buy/Sell
Protection | | (Pay)/
Receive
Fixed
Rate (%) | | Termination
Date | | Notional
Amount(4) | | Market
Value(5) | | Upfront
Premium
Paid/
(Received) | | Unrealized
Appreciation/
(Depreciation) | |
Barclays
Bank PLC | | LCDX.NA.9 Index
(15-100% Tranche) | | Buy | | | (1.613 | ) | | 12/20/12 | | USD | 10,671,432 | | | $ | 1,701,544 | | | $ | — | | | $ | 1,701,544 | | |
| | | | | | | | | | | | | | | | | $ | 25,994,856 | | | $ | 11,338,650 | | | $ | 14,656,206 | | |
| Credit Default Swaps on Corporate and Sovereign Issues — Buy Protection(1) | |
| UBS AG | | Australia & New Zealand
Banking Group
4.450%, 02/05/15 | | Buy | | | (0.350 | ) | | 09/20/17 | | USD | 5,233,000 | | | $ | 437,723 | | | $ | — | | | $ | 437,723 | | |
| UBS AG | | Australia & New Zealand
Banking Group
4.450%, 02/05/15 | | Buy | | | (0.510 | ) | | 09/20/17 | | USD | 5,067,000 | | | | 692,954 | | | | — | | | | 692,954 | | |
Citibank N.A.,
New York | | Bank of America Corp.
6.250%, 04/15/12 | | Buy | | | (2.050 | ) | | 12/20/13 | | USD | 14,038,000 | | | | (579,816 | ) | | | — | | | | (579,816 | ) | |
Citibank N.A.,
New York | | BNP Paribas
4.750%, 04/04/11 | | Buy | | | (0.490 | ) | | 09/20/13 | | USD | 15,747,000 | | | | 144,354 | | | | — | | | | 144,354 | | |
Citibank N.A.,
New York | | BNP Paribas
4.750%, 04/04/11 | | Buy | | | (0.505 | ) | | 09/20/13 | | USD | 13,418,000 | | | | 114,012 | | | | — | | | | 114,012 | | |
Citibank N.A.,
New York | | BNP Paribas
5.250%, 12/17/12 | | Buy | | | (0.250 | ) | | 09/20/17 | | USD | 6,645,000 | | | | 443,746 | | | | — | | | | 443,746 | | |
Citibank N.A.,
New York | | BNP Paribas
5.250%, 12/17/12 | | Buy | | | (0.520 | ) | | 09/20/17 | | USD | 1,410,000 | | | | 65,264 | | | | — | | | | 65,264 | | |
Citibank N.A.,
New York | | BNP Paribas
5.250%, 12/17/12 | | Buy | | | (0.520 | ) | | 09/20/17 | | USD | 3,151,000 | | | | 145,849 | | | | — | | | | 145,849 | | |
Citibank N.A.,
New York | | Darden Restaurants Inc.
6.000%, 08/15/35 | | Buy | | | (1.650 | ) | | 06/20/13 | | USD | 1,500,000 | | | | 63,675 | | | | — | | | | 63,675 | | |
Bear Stearns
Credit
Products Inc. | | Darden Restaurants Inc.
7.125%, 02/01/16** | | Buy | | | (1.640 | ) | | 03/20/18 | | USD | 5,860,000 | | | | 410,671 | | | | — | | | | 410,671 | | |
Citibank N.A.,
New York | | Darden Restaurants Inc.
7.125%, 02/01/16 | | Buy | | | (0.610 | ) | | 12/20/12 | | USD | 1,660,000 | | | | 124,842 | | | | — | | | | 124,842 | | |
Citibank N.A.,
New York | | Darden Restaurants Inc.
7.125%, 02/01/16 | | Buy | | | (1.310 | ) | | 12/20/17 | | USD | 1,634,000 | | | | 149,381 | | | | — | | | | 149,381 | | |
Citibank N.A.,
New York | | Devon Energy Corp.
7.950%, 04/15/32 | | Buy | | | (1.150 | ) | | 12/20/13 | | USD | 6,841,000 | | | | (248 | ) | | | — | | | | (248 | ) | |
Morgan Stanley
Capital
Services Inc. | | Domtar Corp.
7.875%, 10/15/11 | | Buy | | | (2.650 | ) | | 09/20/11 | | USD | 2,758,500 | | | | 345,236 | | | | — | | | | 345,236 | | |
Citibank N.A.,
New York | | Dow Chemical Co.
7.375%, 11/01/29 | | Buy | | | (1.220 | ) | | 12/20/13 | | USD | 6,891,000 | | | | 776,489 | | | | — | | | | 776,489 | | |
Goldman Sachs
International | | Dow Chemical Co.
7.375%, 11/01/29 | | Buy | | | (1.280 | ) | | 12/20/13 | | USD | 9,850,000 | | | | 1,085,587 | | | | — | | | | 1,085,587 | | |
Barclays
Bank PLC | | GAP Inc.
8.800%, 12/15/08* | | Buy | | | (1.200 | ) | | 06/20/13 | | USD | 3,711,000 | | | | (28,393 | ) | | | — | | | | (28,393 | ) | |
Citibank N.A.,
New York | | GAP Inc.
8.800%, 12/15/08* | | Buy | | | (1.190 | ) | | 06/20/13 | | USD | 1,659,000 | | | | (11,994 | ) | | | — | | | | (11,994 | ) | |
Citibank N.A.,
New York | | GAP Inc.
8.800%, 12/15/08* | | Buy | | | (0.850 | ) | | 06/20/13 | | USD | 1,700,000 | | | | 12,070 | | | | — | | | | 12,070 | | |
See Accompanying Notes to Financial Statements
102
PORTFOLIO OF INVESTMENTS
ING VP INTERMEDIATE BOND PORTFOLIO AS OF DECEMBER 31, 2008 (CONTINUED)
| Counterparty | | Reference
Entity/Obligation | | Buy/Sell
Protection | | (Pay)/
Receive
Fixed
Rate (%) | | Termination
Date | | Notional
Amount(4) | | Market
Value(5) | | Upfront
Premium
Paid/
(Received) | | Unrealized
Appreciation/
(Depreciation) | |
Goldman Sachs
International | | Halliburton Co.
5.500%, 10/15/10 | | Buy | | | (0.820 | ) | | 12/20/13 | | USD | 8,187,000 | | | $ | 58,945 | | | $ | — | | | $ | 58,945 | | |
| UBS AG | | HSBC Bank PLC
4.250%, 03/18/16 | | Buy | | | (0.400 | ) | | 09/20/17 | | USD | 5,233,000 | | | | 428,693 | | | | — | | | | 428,693 | | |
Citibank N.A.,
New York | | International Lease
Finance Corp.
4.150%, 01/20/15 | | Buy | | | (1.670 | ) | | 06/20/13 | | USD | 13,498,000 | | | | 2,796,625 | | | | — | | | | 2,796,625 | | |
Citibank N.A.,
New York | | International Paper Co.
5.300%, 04/01/15 | | Buy | | | (3.950 | ) | | 12/20/13 | | USD | 8,552,000 | | | | 421,906 | | | | — | | | | 421,906 | | |
Citibank N.A.,
New York | | International Paper Co.
5.300%, 04/01/15 | | Buy | | | (4.100 | ) | | 12/20/13 | | USD | 3,366,000 | | | | 146,225 | | | | — | | | | 146,225 | | |
Goldman Sachs
International | | International Paper Co.
5.300%, 04/01/15 | | Buy | | | (3.700 | ) | | 12/20/13 | | USD | 3,837,000 | | | | 227,037 | | | | — | | | | 227,037 | | |
Goldman Sachs
International | | International Paper Co.
5.850%, 10/30/12 | | Buy | | | (1.900 | ) | | 12/20/13 | | USD | 8,278,000 | | | | 1,076,070 | | | | — | | | | 1,076,070 | | |
Goldman Sachs
International | | Liberty Mutual Insurance
7.875%, 10/15/26 | | Buy | | | (3.150 | ) | | 12/20/13 | | USD | 4,765,000 | | | | (142,934 | ) | | | — | | | | (142,934 | ) | |
Barclays
Bank PLC | | Louisiana-Pacific Corp.
8.875%, 08/15/10 | | Buy | | | (3.850 | ) | | 03/20/13 | | USD | 1,853,000 | | | | 378,613 | | | | — | | | | 378,613 | | |
Citibank N.A.,
New York | | Louisiana-Pacific Corp.
8.875%, 08/15/10 | | Buy | | | (2.000 | ) | | 12/20/12 | | USD | 3,317,000 | | | | 811,006 | | | | — | | | | 811,006 | | |
Citibank N.A.,
New York | | Louisiana-Pacific Corp.
8.875%, 08/15/10 | | Buy | | | (2.100 | ) | | 12/20/12 | | USD | 3,214,000 | | | | 778,173 | | | | — | | | | 778,173 | | |
Morgan Stanley
Capital
Services Inc. | | Louisiana-Pacific Corp.
8.875%, 08/15/10 | | Buy | | | (2.230 | ) | | 12/20/12 | | USD | 2,042,000 | | | | 488,091 | | | | — | | | | 488,091 | | |
Morgan Stanley
Capital
Services Inc. | | Louisiana-Pacific Corp.
8.875%, 08/15/10 | | Buy | | | (5.350 | ) | | 09/20/13 | | USD | 8,371,000 | | | | 1,463,247 | | | | — | | | | 1,463,247 | | |
| UBS AG | | Louisiana-Pacific Corp.
8.875%, 08/15/10 | | Buy | | | (2.000 | ) | | 12/20/12 | | USD | 3,489,000 | | | | 853,059 | | | | — | | | | 853,059 | | |
Citibank N.A.,
New York | | Marks & Spencer PLC
6.375%, 11/07/11 | | Buy | | | (1.100 | ) | | 03/20/13 | | USD | 7,293,000 | | | | 947,573 | | | | — | | | | 947,573 | | |
Citibank N.A.,
New York | | Marks & Spencer PLC
6.375%, 11/07/11 | | Buy | | | (1.400 | ) | | 03/20/13 | | USD | 5,960,000 | | | | 712,476 | | | | — | | | | 712,476 | | |
Citibank N.A.,
New York | | MBIA Inc.
6.625%, 10/01/28 | | Buy | | | (5.000 | ) | | 09/20/13 | | USD | 1,711,000 | | | | 403,160 | | | | 545,936 | | | | (142,776 | ) | |
Citibank N.A.,
New York | | MBIA Inc.
6.625%, 10/01/28 | | Buy | | | (5.000 | ) | | 09/20/13 | | USD | 3,460,000 | | | | 815,274 | | | | 1,059,560 | | | | (244,286 | ) | |
Goldman Sachs
International | | MBIA Inc.
6.625%, 10/01/28 | | Buy | | | (5.000 | ) | | 09/20/13 | | USD | 6,777,000 | | | | 1,596,852 | | | | 2,131,909 | | | | (535,057 | ) | |
JPMorgan Chase
Bank, N.A.
New York | | MBIA Inc.
6.625%, 10/01/28 | | Buy | | | (5.000 | ) | | 09/20/13 | | USD | 25,747,000 | | | | 6,066,719 | | | | 4,290,798 | | | | 1,775,921 | | |
Goldman Sachs
International | | MeadWestvaco Corp.
6.850%, 04/01/12 | | Buy | | | (1.900 | ) | | 12/20/13 | | USD | 8,278,000 | | | | 109,742 | | | | — | | | | 109,742 | | |
Barclays
Bank PLC | | Norbord Inc.
7.250%, 07/01/12 | | Buy | | | (6.350 | ) | | 06/20/13 | | USD | 1,853,000 | | | | 141,965 | | | | — | | | | 141,965 | | |
See Accompanying Notes to Financial Statements
103
PORTFOLIO OF INVESTMENTS
ING VP INTERMEDIATE BOND PORTFOLIO AS OF DECEMBER 31, 2008 (CONTINUED)
| Counterparty | | Reference
Entity/Obligation | | Buy/Sell
Protection | | (Pay)/
Receive
Fixed
Rate (%) | | Termination
Date | | Notional
Amount(4) | | Market
Value(5) | | Upfront
Premium
Paid/
(Received) | | Unrealized
Appreciation/
(Depreciation) | |
Citibank N.A.,
New York | | Norbord Inc.
7.250%, 07/01/12 | | Buy | | | (2.450 | ) | | 12/20/17 | | USD | 8,363,000 | | | $ | 2,082,814 | | | $ | — | | | $ | 2,082,814 | | |
Morgan Stanley
Capital
Services Inc. | | Norbord Inc.
7.250%, 07/01/12 | | Buy | | | (5.550 | ) | | 09/20/13 | | USD | 7,780,000 | | | | 808,764 | | | | — | | | | 808,764 | | |
| UBS AG | | Norbord Inc.
7.250%, 07/01/12 | | Buy | | | (1.500 | ) | | 06/20/12 | | USD | 1,495,500 | | | | 304,847 | | | | — | | | | 304,847 | | |
| UBS AG | | Norbord Inc.
7.250%, 07/01/12 | | Buy | | | (2.400 | ) | | 12/20/17 | | USD | 3,325,000 | | | | 836,060 | | | | — | | | | 836,060 | | |
Citibank N.A.,
New York | | Potash Corp. of
Saskatchewan
7.750%, 05/31/11 | | Buy | | | (0.600 | ) | | 03/20/13 | | USD | 3,264,000 | | | | 156,849 | | | | — | | | | 156,849 | | |
Goldman Sachs
International | | Potash Corp. of
Saskatchewan
7.750%, 05/31/11 | | Buy | | | (0.880 | ) | | 03/20/18 | | USD | 9,767,000 | | | | 803,251 | | | | — | | | | 803,251 | | |
Morgan Stanley
Capital
Services Inc. | | Potash Corp. of
Saskatchewan
7.750%, 05/31/11 | | Buy | | | (0.610 | ) | | 03/20/13 | | USD | 6,531,000 | | | | 311,302 | | | | — | | | | 311,302 | | |
Goldman Sachs
International | | Temple-Inland Inc.
6.625%, 01/15/18 | | Buy | | | (3.080 | ) | | 12/20/13 | | USD | 3,519,000 | | | | 539,792 | | | | — | | | | 539,792 | | |
JPMorgan Chase
Bank N.A.,
New York | | Temple-Inland Inc.
7.875%, 05/01/12 | | Buy | | | (0.890 | ) | | 03/20/14 | | USD | 3,616,000 | | | | 865,197 | | | | — | | | | 865,197 | | |
JPMorgan Chase
Bank N.A.,
New York | | Temple-Inland Inc.
7.875%, 05/01/12 | | Buy | | | (1.020 | ) | | 03/20/14 | | USD | 3,616,000 | | | | 847,758 | | | | — | | | | 847,758 | | |
Morgan Stanley
Capital
Services Inc. | | Temple-Inland Inc.
7.875%, 05/01/12 | | Buy | | | (0.900 | ) | | 03/20/14 | | USD | 2,720,000 | | | | 649,803 | | | | — | | | | 649,803 | | |
Morgan Stanley
Capital
Services Inc. | | Temple-Inland Inc.
7.875%, 05/01/12 | | Buy | | | (1.600 | ) | | 09/20/17 | | USD | 5,813,000 | | | | 1,513,305 | | | | — | | | | 1,513,305 | | |
| UBS AG | | Temple-Inland Inc.
7.875%, 05/01/12 | | Buy | | | (0.900 | ) | | 03/20/14 | | USD | 5,820,000 | | | | 1,390,387 | | | | — | | | | 1,390,387 | | |
Morgan Stanley
Capital
Services Inc. | | Verizon
Communications Inc.
4.900%, 09/15/15 | | Buy | | | (1.500 | ) | | 12/20/13 | | USD | 5,796,000 | | | | (35,468 | ) | | | — | | | | (35,468 | ) | |
Citibank N.A.,
New York | | VF Corp.
8.500%, 10/01/10 | | Buy | | | (0.700 | ) | | 09/20/13 | | USD | 3,418,000 | | | | 93,394 | | | | — | | | | 93,394 | | |
Citibank N.A.,
New York | | VF Corp.
8.500%, 10/01/10 | | Buy | | | (0.800 | ) | | 09/20/13 | | USD | 1,700,000 | | | | 39,015 | | | | — | | | | 39,015 | | |
Citibank N.A.,
New York | | VF Corp.
8.500%, 10/01/10 | | Buy | | | (0.800 | ) | | 09/20/13 | | USD | 2,843,000 | | | | 65,247 | | | | — | | | | 65,247 | | |
Citibank N.A.,
New York | | VF Corp.
8.500%, 10/01/10 | | Buy | | | (0.770 | ) | | 09/20/13 | | USD | 3,357,000 | | | | 81,449 | | | | — | | | | 81,449 | | |
Morgan Stanley
Capital
Services Inc. | | VF Corp.
8.500%, 10/01/10 | | Buy | | | (0.850 | ) | | 09/20/13 | | USD | 6,456,000 | | | | 134,047 | | | | — | | | | 134,047 | | |
See Accompanying Notes to Financial Statements
104
PORTFOLIO OF INVESTMENTS
ING VP INTERMEDIATE BOND PORTFOLIO AS OF DECEMBER 31, 2008 (CONTINUED)
| Counterparty | | Reference
Entity/Obligation | | Buy/Sell
Protection | | (Pay)/
Receive
Fixed
Rate (%) | | Termination
Date | | Notional
Amount(4) | | Market
Value(5) | | Upfront
Premium
Paid/
(Received) | | Unrealized
Appreciation/
(Depreciation) | |
| UBS AG | | Westpac Banking Corp.
5.875%, 04/29/18 | | Buy | | | (0.350 | ) | | 09/20/17 | | USD | 5,233,000 | | | $ | 712,811 | | | $ | — | | | $ | 712,811 | | |
| UBS AG | | Westpac Banking Corp.
5.875%, 4/29/18 | | Buy | | | (0.510 | ) | | 09/20/17 | | USD | 5,067,000 | | | | 631,930 | | | | — | | | | 631,930 | | |
Citibank N.A.,
New York | | Westvaco Corp.
7.950%, 02/15/31 | | Buy | | | (2.800 | ) | | 12/20/13 | | USD | 6,160,000 | | | | (164,567 | ) | | | — | | | | (164,567 | ) | |
Citibank N.A.,
New York | | Westvaco Corp.
7.950%, 02/15/31 | | Buy | | | (2.750 | ) | | 12/20/13 | | USD | 2,813,000 | | | | (68,886 | ) | | | — | | | | (68,886 | ) | |
Goldman Sachs
International | | Westvaco Corp.
7.950%, 02/15/31 | | Buy | | | (3.250 | ) | | 12/20/13 | | USD | 6,806,000 | | | | (317,826 | ) | | | — | | | | (317,826 | ) | |
JPMorgan Chase
Bank N.A.,
New York | | Weyerhaeuser Co.
6.750%, 03/15/12 | | Buy | | | (0.640 | ) | | 03/20/14 | | USD | 6,191,000 | | | | 450,417 | | | | — | | | | 450,417 | | |
Citibank N.A.,
New York | | Weyerhaeuser Co.
7.125%, 07/15/23 | | Buy | | | (3.150 | ) | | 12/20/13 | | USD | 11,469,000 | | | | (480,844 | ) | | | — | | | | (480,844 | ) | |
Goldman Sachs
International | | Weyerhaeuser Co.
7.125%, 07/15/23 | | Buy | | | (2.000 | ) | | 12/20/13 | | USD | 8,278,000 | | | | 74,395 | | | | — | | | | 74,395 | | |
Citibank N.A.,
New York | | Whirlpool Corp.
7.750%, 07/15/16 | | Buy | | | (1.210 | ) | | 09/20/13 | | USD | 4,676,000 | | | | 482,517 | | | | — | | | | 482,517 | | |
Citibank N.A.,
New York | | Whirlpool Corp.
7.750%, 07/15/16 | | Buy | | | (1.330 | ) | | 09/20/13 | | USD | 6,108,000 | | | | 601,047 | | | | — | | | | 601,047 | | |
Citibank N.A.,
New York | | Whirlpool Corp.
7.750%, 07/15/16 | | Buy | | | (1.400 | ) | | 09/20/13 | | USD | 3,345,000 | | | | 319,818 | | | | — | | | | 319,818 | | |
Citibank N.A.,
New York | | Whirlpool Corp.
7.750%, 07/15/16 | | Buy | | | (1.400 | ) | | 09/20/13 | | USD | 2,104,000 | | | | 201,165 | | | | — | | | | 201,165 | | |
Morgan Stanley
Capital
Services Inc. | | Whirlpool Corp.
7.750%, 07/15/16 | | Buy | | | (1.680 | ) | | 09/20/13 | | USD | 3,687,000 | | | | 311,336 | | | | — | | | | 311,336 | | |
Citibank N.A.,
New York | | Williams Companies Inc.
7.500%, 01/15/31 | | Buy | | | (2.750 | ) | | 12/20/13 | | USD | 6,450,000 | | | | 252,818 | | | | — | | | | 252,818 | | |
| | | | | | | | | | | | | | | | | $ | 39,463,863 | | | $ | 8,028,203 | | | $ | 31,435,660 | | |
Credit Default Swaps on Corporate and Sovereign Issues — Sell Protection(2)(6)
| Counterparty | | Reference
Entity/Obligation | | Buy/Sell
Protection | | (Pay)/
Receive
Fixed
Rate (%) | | Termination
Date | | Implied
Credit
Spread at
12/31/08(3) | | Notional
Amount(4) | | Market
Value(5) | | Upfront
Premium
Paid/
(Received) | | Unrealized
Appreciation/
(Depreciation) | |
| UBS AG | | Domtar Corp.
7.875%, 10/15/11 | | Sell | | | 2.600 | | | 09/20/11 | | | 8.15 | % | | USD | 2,761,000 | | | $ | (348,690 | ) | | $ | — | | | $ | (348,690 | ) | |
Citibank N.A.,
New York | | MBIA
Insurance Corp.
(no specified
obligation) | | Sell | | | 5.000 | | | 09/20/13 | | | 30.06 | % | | USD | 1,710,000 | | | | (797,449 | ) | | | (607,095 | ) | | | (190,354 | ) | |
Citibank N.A.,
New York | | MBIA
Insurance Corp.
(no specified
obligation) | | Sell | | | 5.000 | | | 09/20/13 | | | 30.06 | % | | USD | 3,460,000 | | | | (1,613,551 | ) | | | (1,340,031 | ) | | | (273,520 | ) | |
Credit Suisse
International | | MBIA
Insurance Corp.
(no specified
obligation) | | Sell | | | 5.000 | | | 09/20/13 | | | 30.06 | % | | USD | 6,762,000 | | | | (3,153,420 | ) | | | (1,189,509 | ) | | | (1,963,911 | ) | |
See Accompanying Notes to Financial Statements
105
PORTFOLIO OF INVESTMENTS
ING VP INTERMEDIATE BOND PORTFOLIO AS OF DECEMBER 31, 2008 (CONTINUED)
| Counterparty | | Reference
Entity/Obligation | | Buy/Sell
Protection | | (Pay)/
Receive
Fixed
Rate (%) | | Termination
Date | | Implied
Credit
Spread at
12/31/08(3) | | Notional
Amount(4) | | Market
Value(5) | | Upfront
Premium
Paid/
(Received) | | Unrealized
Appreciation/
(Depreciation) | |
Goldman Sachs
International | | MBIA
Insurance Corp.
(no specified
obligation) | | Sell | | | 5.000 | | | 09/20/13 | | | 30.06 | % | | USD | 6,778,000 | | | $ | (3,160,881 | ) | | $ | (2,375,906 | ) | | $ | (784,975 | ) | |
JPMorgan
Chase
Bank, N.A.
New York | | MBIA
Insurance Corp.
(no specified
obligation) | | Sell | | | 5.000 | | | 09/20/13 | | | 30.06 | % | | USD | 8,824,000 | | | | (4,115,022 | ) | | | (1,552,237 | ) | | | (2,562,785 | ) | |
The Royal
Bank of
Scotland PLC | | MBIA
Insurance Corp.
(no specified
obligation) | | Sell | | | 5.000 | | | 09/20/13 | | | 30.06 | % | | USD | 10,155,000 | | | | (4,735,725 | ) | | | (1,786,373 | ) | | | (2,949,352 | ) | |
Citibank N.A.,
New York | | Norbord Inc.
7.250%, 07/01/12 | | Sell | | | 2.200 | | | 06/20/12 | | | 9.32 | % | | USD | 1,495,500 | | | | (277,553 | ) | | | — | | | | (277,553 | ) | |
Morgan
Stanley
Capital
Services Inc. | | Verizon Wireless
7.375%, 11/15/13 | | Sell | | | 1.900 | | | 12/20/13 | | | 2.13 | % | | USD | 5,796,000 | | | | (58,667 | ) | | | — | | | | (58,667 | ) | |
Barclays
Bank PLC | | Weyerhaeuser Co.
7.125%, 07/15/23 | | Sell | | | 0.780 | | | 09/20/12 | | | 2.10 | % | | USD | 5,906,000 | | | | (268,721 | ) | | | — | | | | (268,721 | ) | |
Citibank N.A.,
New York | | Williams Partners LP
7.500%, 06/15/11 | | Sell | | | 1.030 | | | 03/20/12 | | | 4.14 | % | | USD | 6,835,351 | | | | (609,211 | ) | | | — | | | | (609,211 | ) | |
| | | | | | | | | | | | | | | | | | | | | $ | (19,138,890 | ) | | $ | (8,851,151 | ) | | $ | (10,287,739 | ) | |
* In the event of a default, if this bond is no longer available an equivalent bond will be delivered.
** Guaranteed by JPMorgan Chase.
(1) If a Portfolio is a buyer of protection and a credit event occurs, as defined under the terms of that particular swap agreement, a Portfolio will either 1.) receive from the seller of protection an amount equal to the notional amount of the swap and deliver the referenced obligation, other deliverable obligations or underlying securities comprising the referenced index or 2.) receive a net settlement amount in the form of cash or securities equal to the notional amount of the swap less the recovery value of the referenced obligation or underlying securities comprising the referenced index.
(2) If the Portfolio is a seller of protection, and a credit event occurs, as defined under the terms of that particular swap agreement, the Portfolio will generally either 1.) Pay to the buyer an amount equal to the notional amount of the swap and take delivery of the referenced obligation, other deliverable obligations, or underlying securities comprising a referenced index or 2.) Pay a net settlement amount in the form of cash or securities equal to the notional amount of the swap less the recovery value of the referenced obligation or underlying securities comprising a referenced index.
(3) Implied credit spreads, represented in absolute terms, utilized in determining the market value of credit default swap agreements on corporate issues or sovereign issues are disclosed for credit default swaps sold and serve as an indicator of the current status of the payment/performance risk and represent the likelihood or risk of default for the credit derivative. The implied credit spread of a particular referenced entity reflects the cost of buying/selling protection and may include upfront payments required to be made to enter into the agreement. For credit default swaps on asset-backed securities or credit indices, the quoted market prices and resulting market values, as well as the receive fixed rate, serve as indicators of the current status of the payment/performance risk. Wider credit spreads and increasing market values, in absolute terms when compared to the notional amount of the swap, and high receive fixed rate, represent a deterioration of the referenced entity's credit soundness and a greater likelihood or risk of default or other credit event occurring as defined under the terms of the agreement.
(4) The maximum amount of future payments (undiscounted) that a Portfolio as seller of protection could be required to make or receive as a buyer of credit protection under a credit default swap agreement would be an amount equal to the notional amount of the agreement.
(5) The market values for credit default swap agreements serve as an indicator of the current status of the payment/performance risk and represent the likelihood or risk of default for the credit derivative. Increasing market values, in absolute terms, when compared to the notional amount of the agreement, represent a deterioration of the referenced obligation's credit soundness and a greater likelihood or risk of default or other credit event occurring.
(6) For the reason(s) or why a Portfolio may sell credit protection, please see NOTE 2, "Significant Accounting Policies" in the Notes to Financial Statements.
See Accompanying Notes to Financial Statements
106
PORTFOLIO OF INVESTMENTS
ING VP MONEY MARKET PORTFOLIO(1) AS OF DECEMBER 31, 2008
Principal
Amount | | | | | | Value | |
| CERTIFICATES OF DEPOSIT: 2.8% | | | |
| $ | 8,000,000 | | | | | BNP Paribas,
3.060%, due 01/26/09 | | $ | 8,015,307 | | |
| | 42,000,000 | | | | | UBS AG,
2.980%, due 02/23/09 | | | 42,000,000 | | |
Total Certificates of Deposit
(Cost $50,015,307) | | | 50,015,307 | | |
| COMMERCIAL PAPER: 43.0% | | | |
| | 10,000,000 | | | | | Barton Capital, LLC,
1.460%, due 02/09/09 | | | 9,983,750 | | |
| | 4,500,000 | | | | | Barton Capital, LLC,
1.480%, due 01/23/09 | | | 4,495,738 | | |
| | 24,000,000 | | | # | | Barton Capital, LLC,
1.880%, due 01/20/09 | | | 23,974,920 | | |
| | 16,250,000 | | | # | | Barton Capital, LLC,
2.300%, due 01/22/09 | | | 16,228,592 | | |
| | 5,000,000 | | | | | Cafco, LLC, 1.290%,
due 03/13/09 | | | 4,987,181 | | |
| | 17,500,000 | | | # | | Cafco, LLC, 1.510%,
due 01/21/09 | | | 17,484,639 | | |
| | 17,000,000 | | | | | Cafco, LLC, 2.030%,
due 01/28/09 | | | 16,973,225 | | |
| | 1,500,000 | | | | | Cafco, LLC, 4.100%,
due 01/06/09 | | | 1,499,167 | | |
| | 1,000,000 | | | # | | Cafco, LLC, 4.100%,
due 01/14/09 | | | 998,519 | | |
| | 12,000,000 | | | # | | Cafco, LLC, 4.100%,
due 01/23/09 | | | 11,969,933 | | |
| | 21,000,000 | | | | | Caisse Nationale des
Caisses d'Epargne et
de Prevoyance, 0.240%,
due 01/05/09 | | | 20,999,440 | | |
| | 22,165,000 | | | # | | Ciesco LLC, 2.060%,
due 01/28/09 | | | 22,129,591 | | |
| | 11,000,000 | | | # | | Ciesco LLC, 4.100%,
due 01/22/09 | | | 10,973,692 | | |
| | 1,500,000 | | | | | Ciesco, LLC, 0.200%,
due 01/21/09 | | | 1,496,875 | | |
| | 15,000,000 | | | | | Ciesco, LLC, 1.370%,
due 02/19/09 | | | 14,971,417 | | |
| | 3,000,000 | | | | | Ciesco, LLC, 3.110%,
due 01/23/09 | | | 2,994,042 | | |
| | 32,500,000 | | | # | | Concord Minutemen
Capital Co., LLC,
2.440%, due 04/17/09 | | | 32,265,549 | | |
| | 10,000,000 | | | | | Concord Minutemen
Capital Co., LLC,
2.960%, due 01/22/09 | | | 9,981,917 | | |
| | 11,250,000 | | | # | | Concord Minutemen
Capital Co., LLC,
4.700%, due 01/16/09 | | | 11,227,969 | | |
| | 33,000,000 | | | # | | Crown Point Capital Co.,
2.440%, due 04/17/09 | | | 32,761,942 | | |
| | 7,750,000 | | | | | Crown Point Capital Co.,
2.960%, due 01/22/09 | | | 7,735,985 | | |
| | 13,250,000 | | | # | | Crown Point Capital Co.,
4.700%, due 01/15/09 | | | 13,225,782 | | |
| | 13,000,000 | | | # | | Edison Asset Securities, LLC,
0.300%, due 03/23/09 | | | 12,991,225 | | |
Principal
Amount | | | | | | Value | |
| $ | 33,000,000 | | | # | | Edison Asset Securities, LLC,
0.400%, due 04/23/09 | | $ | 32,958,933 | | |
| | 3,000,000 | | | # | | Edison Asset Securities, LLC,
1.500%, due 01/29/09 | | | 2,996,500 | | |
| | 21,400,000 | | | # | | Jupiter Securities Co., LLC,
1.170%, due 01/16/09 | | | 21,388,854 | | |
| | 10,500,000 | | | | | Jupiter Securities Co., LLC,
1.170%, due 02/12/09 | | | 10,485,300 | | |
| | 5,000,000 | | | | | Jupiter Securities Co., LLC,
1.300%, due 01/14/09 | | | 4,997,472 | | |
| | 14,000,000 | | | | | Jupiter Securities Co., LLC,
1.340%, due 01/23/09 | | | 13,988,022 | | |
| | 3,000,000 | | | | | Jupiter Securities Co., LLC,
1.400%, due 01/21/09 | | | 2,997,667 | | |
| | 3,000,000 | | | | | Old Line Funding, LLC,
1.230%, due 03/09/09 | | | 2,993,021 | | |
| | 6,500,000 | | | # | | Old Line Funding, LLC,
1.380%, due 01/20/09 | | | 6,495,026 | | |
| | 12,500,000 | | | # | | Old Line Funding, LLC,
1.400%, due 01/27/09 | | | 12,486,910 | | |
| | 26,000,000 | | | # | | Old Line Funding, LLC,
2.170%, due 01/26/09 | | | 25,959,375 | | |
| | 7,000,000 | | | # | | Old Line Funding, LLC,
4.150%, due 01/21/09 | | | 6,985,778 | | |
| | 14,000,000 | | | | | Park Avenue, 1.280%,
due 01/12/09 | | | 13,994,011 | | |
| | 9,000,000 | | | | | Park Avenue, 1.500%,
due 01/28/09 | | | 8,990,550 | | |
| | 13,500,000 | | | # | | Park Avenue Receivables,
1.280%, due 03/02/09 | | | 13,470,750 | | |
| | 17,724,000 | | | # | | Park Avenue Receivables,
1.400%, due 01/13/09 | | | 17,715,729 | | |
| | 2,000,000 | | | | | Societe Generale, 0.550%,
due 02/24/09 | | | 1,998,350 | | |
| | 2,400,000 | | | | | Thunder Bay Funding, LLC,
1.290%, due 03/20/09 | | | 2,393,240 | | |
| | 20,500,000 | | | # | | Thunder Bay Funding, LLC,
1.430%, due 01/20/09 | | | 20,483,771 | | |
| | 2,250,000 | | | | | Thunder Bay Funding, LLC,
1.630%, due 03/02/09 | | | 2,243,813 | | |
| | 23,000,000 | | | # | | Thunder Bay Funding, LLC,
1.670%, due 01/22/09 | | | 22,976,521 | | |
| | 3,250,000 | | | | | Thunder Bay Funding, LLC,
1.840%, due 01/05/09 | | | 3,249,169 | | |
| | 3,600,000 | | | | | Thunder Bay Funding, LLC,
4.150%, due 01/14/09 | | | 3,595,255 | | |
| | 5,000,000 | | | | | Toyota Motor Credit Corp.,
0.100%, due 01/05/09 | | | 4,999,944 | | |
| | 30,000,000 | | | # | | Tulip Funding Corp.,
1.650%, due 02/05/09 | | | 29,954,792 | | |
| | 22,000,000 | | | # | | Tulip Funding Corp.,
3.500%, due 01/23/09 | | | 21,952,944 | | |
| | 53,000,000 | | | # | | Variable Funding Capital,
1.000%, due 01/21/09 | | | 52,970,555 | | |
| | 3,000,000 | | | # | | Windmill Funding Corp.,
0.440%, due 02/10/09 | | | 2,998,500 | | |
| | 11,300,000 | | | | | Windmill Funding Corp.,
1.510%, due 03/03/09 | | | 11,270,796 | | |
| | 1,000,000 | | | # | | Windmill Funding Corp.,
1.530%, due 03/02/09 | | | 997,417 | | |
| | 8,500,000 | | | # | | Windmill Funding Corp.,
1.590%, due 04/17/09 | | | 8,459,956 | | |
See Accompanying Notes to Financial Statements
107
PORTFOLIO OF INVESTMENTS
ING VP MONEY MARKET PORTFOLIO(1) AS OF DECEMBER 31, 2008 (CONTINUED)
Principal
Amount | | | | | | Value | |
| COMMERCIAL PAPER: (continued) | | | |
| $ | 14,000,000 | | | # | | Windmill Funding Corp.,
1.600%, due 01/29/09 | | $ | 13,982,033 | | |
| | 12,000,000 | | | # | | Windmill Funding Corp.,
2.300%, due 01/28/09 | | | 11,979,300 | | |
| | 4,000,000 | | | # | | Windmill Funding Corp.,
2.950%, due 01/21/09 | | | 3,993,444 | | |
| | 2,500,000 | | | | | Yorktown Capital, LLC,
0.450%, due 04/02/09 | | | 2,497,156 | | |
| | 30,000,000 | | | | | Yorktown Capital, LLC,
0.500%, due 04/06/09 | | | 29,960,417 | | |
| | 18,500,000 | | | # | | Yorktown Capital, LLC,
1.800%, due 01/23/09 | | | 18,484,172 | | |
Total Commercial Paper
(Cost $772,696,533) | | | 772,696,533 | | |
| CORPORATE BONDS/NOTES: 13.1% | | | |
| | 10,500,000 | | | # | | American Honda Finance
Corp., 2.246%,
due 03/09/09 | | | 10,498,235 | | |
| | 2,500,000 | | | #,L | | American Honda Finance
Corp., 4.500%,
due 05/26/09 | | | 2,512,799 | | |
| | 23,000,000 | | | @@,# | | Australia & New Zealand
Banking Group Ltd.,
2.427%, due 09/02/09 | | | 23,000,000 | | |
| | 6,750,000 | | | | | Bank of America NA,
0.416%, due 06/12/09 | | | 6,744,879 | | |
| | 14,000,000 | | | | | Bank of America NA,
1.625%, due 10/03/09 | | | 14,000,000 | | |
| | 14,000,000 | | | @@ | | BNP Paribas, 2.445%,
due 08/13/09 | | | 14,000,000 | | |
| | 1,000,000 | | | | | Citigroup Funding, Inc.,
2.397%, due 03/02/09 | | | 999,552 | | |
| | 8,500,000 | | | L | | Citigroup, Inc., 3.625%,
due 02/09/09 | | | 8,500,763 | | |
| | 4,749,000 | | | | | Credit Suisse First Boston
USA, Inc., 3.875%,
due 01/15/09 | | | 4,750,024 | | |
| | 6,000,000 | | | | | Credit Suisse New York,
0.481%, due 03/27/09 | | | 5,992,988 | | |
| | 9,000,000 | | | @@ | | Deutsche Bank AG,
1.868%, due 01/09/09 | | | 8,999,453 | | |
| | 4,000,000 | | | | | General Electric Capital
Corp., 0.420%,
due 01/27/09 | | | 3,998,174 | | |
| | 1,000,000 | | | | | General Electric Capital
Corp., 2.281%,
due 08/31/09 | | | 1,000,132 | | |
| | 1,000,000 | | | | | General Electric Capital
Corp., 4.125%,
due 09/01/09 | | | 1,007,099 | | |
| | 6,500,000 | | | | | JPMorgan Chase & Co.,
0.521%, due 06/26/09 | | | 6,494,474 | | |
| | 6,000,000 | | | | | JPMorgan Chase & Co.,
3.500%, due 03/15/09 | | | 6,003,950 | | |
| | 2,750,000 | | | @@,# | | Rabobank Nederland NV,
1.413%, due 04/06/09 | | | 2,749,658 | | |
| | 900,000 | | | @@,# | | Rabobank Nederland NV,
4.773%, due 01/15/09 | | | 900,013 | | |
| | 12,500,000 | | | @@,# | | Societe Generale,
2.620%, due 09/04/09 | | | 12,500,000 | | |
| | 13,100,000 | | | | | Toyota Motor Credit Corp.,
0.660%, due 07/10/09 | | | 13,100,000 | | |
Principal
Amount | | | | | | Value | |
| $ | 13,250,000 | | | | | Toyota Motor Credit Corp.,
1.489%, due 01/12/09 | | $ | 13,250,129 | | |
| | 7,500,000 | | | | | Toyota Motor Credit Corp.,
3.774%, due 01/23/09 | | | 7,500,000 | | |
| | 4,700,000 | | | | | US Bancorp., 5.300%,
due 04/28/09 | | | 4,731,353 | | |
| | 25,000,000 | | | | | US Bank NA, 2.253%,
due 08/24/09 | | | 25,000,000 | | |
| | 2,000,000 | | | | | Wachovia Bank NA,
0.360%, due 02/23/09 | | | 1,998,123 | | |
| | 6,000,000 | | | | | Wachovia Bank NA,
5.029%, due 01/12/09 | | | 6,000,253 | | |
| | 2,252,000 | | | | | Wachovia Corp., 3.625%,
due 02/17/09 | | | 2,251,023 | | |
| | 4,000,000 | | | | | Wells Fargo & Co., 3.125%,
due 04/01/09 | | | 4,000,080 | | |
| | 9,750,000 | | | | | Wells Fargo & Co., 3.552%,
due 05/01/09 | | | 9,751,625 | | |
| | 14,000,000 | | | @@,# | | Westpac Banking Corp.,
2.430%, due 07/03/09 | | | 14,000,000 | | |
Total Corporate Bonds/Notes
(Cost $236,234,779) | | | 236,234,779 | | |
| U.S. GOVERNMENT AGENCY OBLIGATIONS: 17.0% | | | |
| | 118,525,000 | | | | | Federal Home Loan Bank,
0.700%, due 12/14/09 | | | 117,725,286 | | |
| | 32,500,000 | | | | | Federal Home Loan Bank,
1.160%, due 12/07/09 | | | 32,147,935 | | |
| | 4,000,000 | | | | | Federal Home Loan Bank,
2.645%, due 08/07/09 | | | 4,047,299 | | |
| | 25,000,000 | | | | | Federal Home Loan
Mortgage Corporation,
1.400%, due 07/07/09 | | | 24,818,194 | | |
| | 32,000,000 | | | | | Federal Home Loan
Mortgage Corporation,
2.260%, due 04/17/09 | | | 31,786,116 | | |
| | 48,222,000 | | | | | Federal National Mortgage
Association, 0.620%,
due 12/01/09 | | | 47,942,199 | | |
| | 15,000,000 | | | | | Federal National Mortgage
Association, 1.060%,
due 10/28/09 | | | 14,868,750 | | |
| | 15,180,000 | | | L | | Federal National Mortgage
Association, 4.250%,
due 05/15/09 | | | 15,272,262 | | |
| | 17,000,000 | | | | | Federal National Mortgage
Association, 4.625%,
due 12/15/09 | | | 17,531,579 | | |
Total Corporate Bonds/Notes
(Cost $306,139,620) | | | 306,139,620 | | |
| U.S. TREASURY NOTES: 1.2% | | | |
| | 22,000,000 | | | | | 1.000%, due 10/22/09 | | | 21,820,333 | | |
Total U.S. Treasury Notes
(Cost $21,820,333) | | | 21,820,333 | | |
See Accompanying Notes to Financial Statements
108
PORTFOLIO OF INVESTMENTS
ING VP MONEY MARKET PORTFOLIO(1) AS OF DECEMBER 31, 2008 (CONTINUED)
Principal
Amount | | | | Value | |
| REPURCHASE AGREEMENT: 12.9% | |
| $ | 232,200,000 | | | Deutsche Bank Repurchase
Agreement dated 12/31/08,
0.050%, due 01/02/09,
$232,200,645 to be received
upon repurchase
(Collateralized by
$229,580,000 various
U.S. Government Agency
Obligations, 4.210%-4.700%,
Market Value plus accrued
interest $236,848,759,
due 02/21/13-08/20/13) | | $ | 232,200,000 | | |
Total Repurchase Agreement
(Cost $232,200,000) | | | 232,200,000 | | |
| SECURITIES LENDING COLLATERALCC: 0.0% | |
| | | Securities Lending Collateralcc: 0.0% | |
| | 891,150 | | | Bank of New York
Mellon Corp. Institutional | |
Cash Reserves | | | 741,749 | | |
Total Securities
Lending Collateral
(Cost $891,150) | | | 741,749 | | |
Total Investments in
Securities
(Cost $1,619,997,722)* | | | 90.0 | % | | $ | 1,619,848,321 | | |
Other Assets and
Liabilities - Net | | | 10.0 | | | | 178,984,604 | | |
| Net Assets | | | 100.0 | % | | $ | 1,798,832,925 | | |
(1) All securities with a maturity date of greater than 13 months have either a variable rate, a demand feature, prerefunded, optional or mandatory put resulting in a maturity of one year or less. Rate shown reflects current rate.
@@ Foreign Issuer
# Securities with purchases pursuant to Rule144A or section 4(2), under the Securities Act of 1933 and may not be resold subject to that rule except to qualified institutional buyers. Unless otherwise noted, these securities have been determined to be liquid under the guidelines established by the Funds' Board of Directors/Trustees.
cc Securities purchased with cash collateral for securities loaned.
L Loaned security, a portion or all of the security is on loan at December 31, 2008.
* Cost for federal income tax purposes is the same as for financial statement purposes.
The following table summarizes the inputs used as of December 31, 2008 in determining the Portfolio's investments at fair value for purposes of SFAS 157:
| | | Investments in
Securities | | Other Financial
Instruments* | |
| Level 1 — Quoted Prices | | $ | — | | | $ | — | | |
Level 2 — Other Significant
Observable Inputs | | | 1,619,848,321 | | | | — | | |
Level 3 — Significant
Unobservable Inputs | | | — | | | | — | | |
| Total | | $ | 1,619,848,321 | | | $ | — | | |
"Fair value" for purposes of SFAS 157 is different from "fair value" as used in the 1940 Act. The former generally implies market value, and can include market quotations as a source of value, and the latter refers to determinations of actual value in absence of available market quotations.
* Other financial instruments may include forward foreign currency contracts, futures, swaps, and written options. Forward foreign currency contracts and futures are reported at their unrealized gain/loss at year end. Swaps and written options are reported at their market value at year end.
See Accompanying Notes to Financial Statements
109
ING BLACKROCK GLOBAL PORTFOLIO OF INVESTMENTS
SCIENCE AND TECHNOLOGY PORTFOLIO AS OF DECEMBER 31, 2008
| Shares | | | | | | Value | |
| COMMON STOCK: 93.6% | | | |
| | | | | Bermuda: 1.4% | |
| | 32,100 | | | | | Covidien Ltd. | | $ | 1,163,304 | | |
| | 121,500 | | | @ | | Marvell Technology Group Ltd. | | | 810,405 | | |
| | | | 1,973,709 | | |
| | | | | Canada: 1.5% | |
| | 46,900 | | | @,L | | Open Text Corp. | | | 1,413,097 | | |
| | 20,600 | | | @ | | Research In Motion Ltd. | | | 835,948 | | |
| | | | 2,249,045 | | |
| | | | | China: 0.6% | |
| | 3,400 | | | @,L | | Baidu.com ADR | | | 443,938 | | |
| | 21,000 | | | @,L | | Sina Corp. | | | 486,150 | | |
| | | | 930,088 | | |
| | | | | Finland: 0.5% | |
| | 42,900 | | | | | Nokia OYJ ADR | | | 669,240 | | |
| | | | 669,240 | | |
| | | | | Germany: 0.5% | |
| | 18,200 | | | L | | SAP AG ADR | | | 659,204 | | |
| | | | 659,204 | | |
| | | | | Hong Kong: 0.5% | |
| | 236,700 | | | | | ASM Pacific Technology | | | 780,142 | | |
| | | | 780,142 | | |
| | | | | India: 0.5% | |
| | 46,900 | | | @ | | Bharti Airtel Ltd. | | | 691,344 | | |
| | | | 691,344 | | |
| | | | | Israel: 0.5% | |
| | 37,100 | | | @ | | Check Point Software
Technologies | | | 704,529 | | |
| | | | 704,529 | | |
| | | | | Japan: 3.1% | |
| | 24,100 | | | | | Canon, Inc. | | | 763,598 | | |
| | 66,600 | | | | | Konica Minolta Holdings, Inc. | | | 518,203 | | |
| | 62,200 | | | | | Kurita Water Industries Ltd. | | | 1,681,495 | | |
| | 14,000 | | | | | Nidec Corp. | | | 547,530 | | |
| | 2,600 | | | | | Nintendo Co., Ltd. | | | 993,594 | | |
| | | | 4,504,420 | | |
| | | | | South Korea: 1.1% | |
| | 7,800 | | | L | | LG Electronics, Inc. | | | 473,639 | | |
| | 3,300 | | | | | Samsung Electronics Co., Ltd. | | | 1,203,148 | | |
| | | | 1,676,787 | | |
| | | | | Switzerland: 1.6% | |
| | 10,300 | | | | | Alcon, Inc. | | | 918,657 | | |
| | 6,200 | | | | | Roche Holding AG | | | 959,866 | | |
| | 5,600 | | | | | Roche Holding AG ADR | | | 428,680 | | |
| | | | 2,307,203 | | |
| | | | | Taiwan: 1.7% | |
| | 573,052 | | | | | Asustek Computer, Inc. | | | 646,685 | | |
| | 22,620 | | | | | High Tech Computer Corp. | | | 227,056 | | |
| | 306,710 | | | | | HON HAI Precision
Industry Co., Ltd. | | | 604,759 | | |
| | 134,312 | | | | | Taiwan Semiconductor
Manufacturing Co., Ltd. ADR | | | 1,061,065 | | |
| | | | 2,539,565 | | |
| Shares | | | | | | Value | |
| | | | | United States: 80.1% | |
| | 66,000 | | | @ | | Adobe Systems, Inc. | | $ | 1,405,140 | | |
| | 47,700 | | | @ | | Agilent Technologies, Inc. | | | 745,551 | | |
| | 65,600 | | | | | Altera Corp. | | | 1,096,176 | | |
| | 41,300 | | | @ | | American Tower Corp. | | | 1,210,916 | | |
| | 83,700 | | | @ | | Amgen, Inc. | | | 4,833,675 | | |
| | 35,800 | | | | | Amphenol Corp. | | | 858,484 | | |
| | 34,300 | | | | | Analog Devices, Inc. | | | 652,386 | | |
| | 57,100 | | | @ | | Apple, Inc. | | | 4,873,485 | | |
| | 152,500 | | | | | Applied Materials, Inc. | | | 1,544,825 | | |
| | 94,900 | | | @ | | Ariba, Inc. | | | 684,229 | | |
| | 50,300 | | | | | AT&T, Inc. | | | 1,433,550 | | |
| | 32,200 | | | @ | | Atheros Communications, Inc. | | | 460,782 | | |
| | 29,400 | | | @ | | ATMI, Inc. | | | 453,642 | | |
| | 36,000 | | | | | Automatic Data Processing, Inc. | | | 1,416,240 | | |
| | 23,400 | | | | | Baxter International, Inc. | | | 1,254,006 | | |
| | 25,400 | | | | | Beckman Coulter, Inc. | | | 1,116,076 | | |
| | 18,500 | | | | | Becton Dickinson & Co. | | | 1,265,215 | | |
| | 20,100 | | | @ | | Biogen Idec, Inc. | | | 957,363 | | |
| | 76,600 | | | @ | | BMC Software, Inc. | | | 2,061,306 | | |
| | 31,800 | | | | | Bristol-Myers Squibb Co. | | | 739,350 | | |
| | 83,500 | | | @ | | Broadcom Corp. | | | 1,416,995 | | |
| | 59,600 | | | | | CA, Inc. | | | 1,104,388 | | |
| | 36,000 | | | @,L | | Cavium Networks, Inc. | | | 378,360 | | |
| | 83,500 | | | @ | | Celera Corp. | | | 929,355 | | |
| | 178,600 | | | @ | | Cisco Systems, Inc. | | | 2,911,180 | | |
| | 82,600 | | | @ | | Citrix Systems, Inc. | | | 1,946,882 | | |
| | 63,300 | | | | | Corning, Inc. | | | 603,249 | | |
| | 41,300 | | | | | CVS Caremark Corp. | | | 1,186,962 | | |
| | 62,600 | | | @ | | Dell, Inc. | | | 641,024 | | |
| | 25,500 | | | @ | | Digital River, Inc. | | | 632,400 | | |
| | 55,000 | | | @ | | eBay, Inc. | | | 767,800 | | |
| | 35,000 | | | @ | | Electronic Arts, Inc. | | | 561,400 | | |
| | 125,400 | | | @ | | EMC Corp. | | | 1,312,938 | | |
| | 56,000 | | | @ | | F5 Networks, Inc. | | | 1,280,160 | | |
| | 52,900 | | | @ | | Genentech, Inc. | | | 4,385,939 | | |
| | 48,000 | | | @ | | Genzyme Corp. | | | 3,185,760 | | |
| | 36,900 | | | @ | | Gilead Sciences, Inc. | | | 1,887,066 | | |
| | 4,410 | | | @ | | Google, Inc. - Class A | | | 1,356,737 | | |
| | 43,000 | | | | | Harris Corp. | | | 1,636,150 | | |
| | 91,800 | | | | | Hewlett-Packard Co. | | | 3,331,422 | | |
| | 177,600 | | | | | Intel Corp. | | | 2,603,616 | | |
| | 63,500 | | | | | International Business
Machines Corp. | | | 5,344,160 | | |
| | 70,800 | | | | | Intersil Corp. | | | 650,652 | | |
| | 74,400 | | | | | Jabil Circuit, Inc. | | | 502,200 | | |
| | 79,500 | | | @ | | Juniper Networks, Inc. | | | 1,392,045 | | |
| | 51,600 | | | | | KLA-Tencor Corp. | | | 1,124,364 | | |
| | 49,000 | | | @ | | Lam Research Corp. | | | 1,042,720 | | |
| | 52,900 | | | | | Linear Technology Corp. | | | 1,170,148 | | |
| | 44,100 | | | | | Lockheed Martin Corp. | | | 3,707,928 | | |
| | 30 | | | @ | | Macrovision Solutions Corp. | | | 380 | | |
| | 68,900 | | | @ | | McAfee, Inc. | | | 2,381,873 | | |
| | 95,600 | | | | | Medtronic, Inc. | | | 3,003,752 | | |
| | 148,400 | | | | | Microsoft Corp. | | | 2,884,896 | | |
| | 100,700 | | | | | Motorola, Inc. | | | 446,101 | | |
| | 61,100 | | | @,L | | NetApp, Inc. | | | 853,567 | | |
| | 42,500 | | | @,L | | Netlogic Microsystems, Inc. | | | 935,425 | | |
| | 173,300 | | | @ | | Oracle Corp. | | | 3,072,609 | | |
| | 41,900 | | | | | Pfizer, Inc. | | | 742,049 | | |
| | 33,900 | | | @ | | Polycom, Inc. | | | 457,989 | | |
| | 10,400 | | | @,L | | Priceline.com, Inc. | | | 765,960 | | |
| | 44,900 | | | @ | | Progress Software Corp. | | | 864,774 | | |
| | 117,580 | | | | | Qualcomm, Inc. | | | 4,212,891 | | |
See Accompanying Notes to Financial Statements
110
ING BLACKROCK GLOBAL PORTFOLIO OF INVESTMENTS
SCIENCE AND TECHNOLOGY PORTFOLIO AS OF DECEMBER 31, 2008 (CONTINUED)
| Shares | | | | | | Value | |
| | | | | United States: (continued) | |
| | 43,200 | | | | | Raytheon Co. | | $ | 2,204,928 | �� | |
| | 57,500 | | | @ | | Red Hat, Inc. | | | 760,150 | | |
| | 24,200 | | | @ | | Salesforce.com, Inc. | | | 774,642 | | |
| | 68,200 | | | | | Seagate Technology, Inc. | | | 302,126 | | |
| | 23,600 | | | @ | | St. Jude Medical, Inc. | | | 777,856 | | |
| | 68,200 | | | @ | | Sybase, Inc. | | | 1,689,314 | | |
| | 126,000 | | | @ | | Symantec Corp. | | | 1,703,520 | | |
| | 111,900 | | | @ | | Teradyne, Inc. | | | 472,218 | | |
| | 63,700 | | | | | Texas Instruments, Inc. | | | 988,624 | | |
| | 33,300 | | | @ | | Varian Semiconductor
Equipment Associates, Inc. | | | 603,396 | | |
| | 87,800 | | | @ | | VeriSign, Inc. | | | 1,675,224 | | |
| | 51,600 | | | | | Verizon Communications, Inc. | | | 1,749,240 | | |
| | 27,200 | | | @ | | Vertex Pharmaceuticals, Inc. | | | 826,336 | | |
| | 20,100 | | | | | Wyeth | | | 753,951 | | |
| | 68,200 | | | | | Xilinx, Inc. | | | 1,215,324 | | |
| | 107,500 | | | @,L | | Yahoo!, Inc. | | | 1,311,500 | | |
| | | | 116,487,012 | | |
Total Common Stock
(Cost $191,208,164) | | | 136,172,288 | | |
Principal
Amount | | | | | | Value | |
| SHORT-TERM INVESTMENTS: 3.8% | | | |
| | | Securities Lending Collateralcc: 3.8% | |
| $ | 5,516,457 | | | Bank of New York
Mellon Corp. Institutional
Cash Reserves | | | | $ | 5,437,097 | | |
| | | | | Total Short-Term Investments
(Cost $5,516,457) | | | | | 5,437,097 | | |
Total Investments in
Securities
(Cost $196,724,621)* | | | 97.4 | % | | $ | 141,609,385 | | |
Other Assets and
Liabilities - Net | | | 2.6 | | | | 3,840,028 | | |
| Net Assets | | | 100.0 | % | | $ | 145,449,413 | | |
@ Non-income producing security
ADR American Depositary Receipt
cc Securities purchased with cash collateral for securities loaned.
L Loaned security, a portion or all of the security is on loan at December 31, 2008.
* Cost for federal income tax purposes is $200,714,277.
Net unrealized depreciation consists of:
| Gross Unrealized Appreciation | | $ | 724,315 | | |
| Gross Unrealized Depreciation | | | (59,829,207 | ) | |
| Net Unrealized Depreciation | | $ | (59,104,892 | ) | |
| Industry | | Percentage of
Net Assets | |
| Aerospace/Defense | | | 4.1 | % | |
| Biotechnology | | | 11.7 | | |
| Commercial Services | | | 1.0 | | |
| Computers | | | 12.6 | | |
| Electrical Components & Equipment | | | 0.3 | | |
| Electronics | | | 2.2 | | |
| Environmental Control | | | 1.2 | | |
| Healthcare - Products | | | 6.5 | | |
| Internet | | | 8.8 | | |
| Miscellaneous Manufacturing | | | 0.4 | | |
| Office/Business Equipment | | | 0.5 | | |
| Pharmaceuticals | | | 2.5 | | |
| Retail | | | 0.8 | | |
| Semiconductors | | | 13.9 | | |
| Software | | | 14.1 | | |
| Telecommunications | | | 12.3 | | |
| Toys/Games/Hobbies | | | 0.7 | | |
| Short-Term Investments | | | 3.8 | | |
| Other Assets and Liabilities - Net | | | 2.6 | | |
| Net Assets | | | 100.0 | % | |
The following table summarizes the inputs used as of December 31, 2008 in determining the Portfolio's investments at fair value for purposes of SFAS 157:
| | | Investments in
Securities | | Other Financial
Instruments* | |
| Level 1 — Quoted Prices | | $ | 126,081,229 | | | $ | — | | |
Level 2 — Other Significant
Observable Inputs | | | 15,528,156 | | | | (601,844 | ) | |
Level 3 — Significant
Unobservable Inputs | | | — | | | | — | | |
| Total | | $ | 141,609,385 | | | $ | (601,844 | ) | |
"Fair value" for purposes of SFAS 157 is different from "fair value" as used in the 1940 Act. The former generally implies market value, and can include market quotations as a source of value, and the latter refers to determinations of actual value in absence of available market quotations.
* Other financial instruments may include forward foreign currency contracts, futures, swaps, and written options. Forward foreign currency contracts and futures are reported at their unrealized gain/loss at year end. Swaps and written options are reported at their market value at year end.
See Accompanying Notes to Financial Statements
111
ING BLACKROCK GLOBAL PORTFOLIO OF INVESTMENTS
SCIENCE AND TECHNOLOGY PORTFOLIO AS OF DECEMBER 31, 2008 (CONTINUED)
At December 31, 2008 the following forward foreign currency contracts were outstanding for the ING BlackRock Global Science and Technology Portfolio:
| Currency | | Buy/Sell | | Settlement
Date | | In
Exchange
For | | Value | | Unrealized
Appreciation/
(Depreciation) | |
| EU Euro | | | | | | USD | | | | | | | | |
| | |
| EUR 215,000 | | BUY | | 1/21/09 | | | 274,466 | | | | 298,570 | | | $ | 24,104 | | |
EU Euro
EUR 194,400 | | BUY | | 1/21/09 | | | 278,316 | | | | 269,963 | | | | (8,353 | ) | |
EU Euro
EUR 177,900 | | BUY | | 1/21/09 | | | 246,205 | | | | 247,049 | | | | 844 | | |
EU Euro
EUR 155,000 | | BUY | | 1/21/09 | | | 216,902 | | | | 215,248 | | | | (1,654 | ) | |
Hong Kong
Sar Dollar
HKD
14,840,000 | | BUY | | 1/21/09 | | | 1,915,404 | | | | 1,915,092 | | | | (312 | ) | |
Japanese Yen
JPY
167,000,000 | | BUY | | 1/21/09 | | | 1,719,754 | | | | 1,843,064 | | | | 123,310 | | |
Japanese
Yen
JPY 3,749,200 | | BUY | | 1/21/09 | | | 40,959 | | | | 41,377 | | | | 418 | | |
Norwegian Krone
NOK 819,000 | | BUY | | 1/21/09 | | | 119,627 | | | | 116,771 | | | | (2,856 | ) | |
| | | $ | 135,501 | | |
Swiss Franc
| |
| CHF 921,000 | | SELL | | 1/21/09 | | | 763,789 | | | | 865,499 | | | $ | (101,710 | ) | |
EU Euro
EUR 681,000 | | SELL | | 1/21/09 | | | 883,114 | | | | 945,702 | | | | (62,588 | ) | |
Hong Kong
Sar Dollar
HKD
20,152,000 | | SELL | | 1/21/09 | | | 2,601,168 | | | | 2,600,602 | | | | 566 | | |
Japanese Yen
JPY
504,809,000 | | SELL | | 1/21/09 | | | 4,997,614 | | | | 5,571,227 | | | | (573,613 | ) | |
| | | $ | (737,345 | ) | |
See Accompanying Notes to Financial Statements
112
TAX INFORMATION (UNAUDITED)
Dividends paid during the year ended December 31, 2008 were as follows:
| Fund Name | | Type | | Per Share Amount | |
| ING VP Balanced Portfolio | |
| Class ADV | | NII | | $ | 0.3436 | | |
| Class I | | NII | | $ | 0.4456 | | |
| Class S | | NII | | $ | 0.4078 | | |
| All Classes | | STCG | | $ | 0.4268 | | |
| All Classes | | LTCG | | $ | 0.7257 | | |
| ING VP Growth and Income Portfolio | |
| Class ADV | | NII | | $ | 0.2237 | | |
| Class I | | NII | | $ | 0.3207 | | |
| Class S | | NII | | $ | 0.3035 | | |
| ING Opportunistic LargeCap Growth Portfolio | |
| Class ADV | | NII | | $ | — | | |
| Class I | | NII | | $ | 0.0767 | | |
| Class S | | NII | | $ | 0.0346 | | |
| ING VP Small Company Portfolio | |
| Class I | | NII | | $ | 0.1797 | | |
| Class S | | NII | | $ | 0.1430 | | |
| All Classes | | LTCG | | $ | 2.2719 | | |
| Fund Name | | Type | | Per Share Amount | |
| ING Opportunistic LargeCap Value Portfolio | |
| Class ADV | | NII | | $ | 0.1650 | | |
| Class I | | NII | | $ | 0.2739 | | |
| Class S | | NII | | $ | 0.2260 | | |
| All Classes | | LTCG | | $ | 2.1459 | | |
| ING VP Intermediate Bond Portfolio | |
| Class ADV | | NII | | $ | 0.6238 | | |
| Class I | | NII | | $ | 0.7529 | | |
| Class S | | NII | | $ | 0.7188 | | |
| All Classes | | STCG | | $ | 0.2979 | | |
| ING VP Money Market Portfolio | |
| Class I | | NII | | $ | 0.9281 | (1) | |
NII — Net investment income
STCG — Short-term capital gain
LTCG — Long-term capital gain
Of the ordinary distributions made during the year ended December 31, 2008, the following percentages qualify for the dividends received deduction (DRD) available to corporate shareholders:
| ING VP Balanced Portfolio | | | 19.02 | % | |
| ING VP Growth and Income Portfolio | | | 100.00 | % | |
| ING Opportunistic LargeCap Growth Portfolio | | | 100.00 | % | |
| ING VP Small Company Portfolio | | | 100.00 | % | |
| ING Opportunistic LargeCap Value Portfolio | | | 100.00 | % | |
| ING VP Intermediate Bond Portfolio | | | 0.54 | % | |
For the year ended December 31, 2008, the following are percentages of ordinary income dividends paid by the Portfolios that are designated as qualifying dividend income (QDI) subject to reduced income tax rates for individuals:
| ING VP Growth and Income Portfolio | | | 100.00 | % | |
Above figures may differ from those cited elsewhere in this report due to differences in the calculation of income and gains under U.S. generally accepted accounting principles (book) purposes and Internal Revenue Service (tax) purposes.
Shareholders are strongly advised to consult their own tax advisers with respect to the tax consequences of their investments in the Portfolios. In January, shareholders, excluding corporate shareholders, receive an IRS 1099-DIV regarding the federal tax status of the dividends and distributions they received in the calendar year.
(1) Per share amount has not been restated to reflect the stock split that occurred on October 7, 2008.
113
DIRECTOR/TRUSTEE AND OFFICER INFORMATION (UNAUDITED)
The business and affairs of the Registrants are managed under the direction of the Board. A director/trustee who is not an interested person of the Registrants, as defined in the 1940 Act, is an independent director/trustee ("Non-Interested Director/Trustee"). The Directors/Trustees of the Registrants are listed below. The Statement of Additional Information includes additional information about directors/trustees of the Registrants and is available, without charge, upon request at (800) 992-0180.
Name, Address
and Age | | Position(s)
held
with the
Registrants | | Term of
Office and
Length of
Time
Served(1) | | Principal
Occupation(s)
during the
Past Five Years | | Number of
Portfolios
in Fund
Complex
Overseen by
Director/
Trustee(2) | | Other
Directorships
held by
Director/
Trustee | |
Albert E. DePrince, Jr.
7337 E. Doubletree Ranch Rd.
Scottsdale, Arizona 85258
Age: 67 | | Director/Trustee | | June 1998 - Present | | Professor of Economics and Finance, Middle Tennessee State University (August 1991 - Present). | | | 39 | | | Academy of Economics and Finance (February 2002 - Present). | |
|
Martin Gavin(*)
7337 E. Doubletree Ranch Rd.
Scottsdale, Arizona 85258
Age: 58 | | Director/Trustee | | January 2009 - Present | | President, Connecticut Children's Medical Center (May 2006 - Present). Formerly, Interim President, Connecticut Children's Medical Center (January 2006 - May 2006). | | | 39 | | | None | |
|
Sidney Koch
7337 E. Doubletree Ranch Rd.
Scottsdale, Arizona 85258
Age: 73 | | Director/Trustee | | April 1994 - Present | | Retired. Self-Employed Consultant (June 2000 - Present). | | | 39 | | | None | |
|
Dr. Corine T. Norgaard
7337 E. Doubletree Ranch Rd.
Scottsdale, Arizona 85258
Age: 71 | | Director/Trustee | | June 1991 - Present | | Retired. Formerly, Dean of the Barney School of Business, University of Hartford (August 1996 - June 2004). Formerly, President, Thompson Enterprises (September 2004 - September 2005). | | | 39 | | | Mass Mutual Corporate and Participation Investors (April 1997 - Present); Mass Mutual Premier Series (December 2004 - Present); and Mass Mutual MML Series Investment Funds II (December 2005 - Present). | |
|
Joseph E. Obermeyer
7337 E. Doubletree Ranch Rd.
Scottsdale, Arizona 85258
Age: 51 | | Director/Trustee | | January 2003 - Present | | President, Obermeyer & Associates, Inc. (November 1999 - Present). | | | 39 | | | None | |
|
Russell Jones
7337 E. Doubletree Ranch Rd.
Scottsdale, Arizona 85258
Age: 64 | | Director/Trustee | | December 2007 - Present | | Retired. Formerly, Senior Vice President, Chief Investment Officer and Treasurer Kaman Corporation (April 1973 - March 2008). | | | 39 | | | None | |
|
| Directors/Trustees who are "Interested Persons:" | |
|
Shaun Mathews(3)(4)
7337 E. Doubletree Ranch Rd.
Scottsdale, Arizona 85258
Age: 53 | | Director/Trustee | | December 2007 - Present | | President and Chief Executive Officer, ING Investments, LLC(5)(November 2006 - Present). Formerly, President, ING Mutual Funds and Investment Products (November 2004 - November 2006); Chief Marketing Officer, ING USFS (April 2002 - October 2004); and Head of Rollover/Payout (October 2001- December 2003). | | | 200 | | | ING Services Holding Company, Inc. (May 2000 - Present); Southland Life Insurance Company (June 2002 - Present); and ING Capital Corporation, LLC, ING Funds Distributor, LLC(6), ING Funds Services, LLC(7), ING Investments, LLC(5) and ING Pilgrim Funding, Inc. (December 2006 - Present). | |
|
114
DIRECTOR/TRUSTEE AND OFFICER INFORMATION (UNAUDITED) (CONTINUED)
Name, Address
and Age | | Position(s)
held
with the
Registrants | | Term of
Office and
Length of
Time
Served(1) | | Principal
Occupation(s)
during the
Past Five Years | | Number of
Portfolios
in Fund
Complex
Overseen by
Director/
Trustee(2) | | Other
Directorships
held by
Director/
Trustee | |
Fredric (Rick) A. Nelson III(8)
ING Investment Management
230 Park Avenue
New York, New York 10169
Age: 52 | | Director/Trustee | | December 2007 - January 2009 | | Chief Investment Officer, ING (April 2003 - January 2009) | | | | None | |
|
(*) Mr. Martin Gavin was appointed to the Board effective January 1, 2009.
(1) Directors/Trustees serve until their successors are duly elected and qualified.
(2) For the purposes of this table (except for Mr. Mathews), "Fund Complex" means the following investment companies: ING Series Fund, Inc.; ING Strategic Allocation Portfolios, Inc.; ING Variable Funds; ING Variable Portfolios, Inc.; ING VP Balanced Portfolio, Inc.; ING VP Intermediate Bond Portfolio; and ING VP Money Market Portfolio.
(3) For Mr. Mathews, the Fund Complex also includes the following investment companies: ING Asia Pacific High Dividend Equity Income Fund, ING Equity Trust; ING Funds Trust; ING Global Equity Dividend and Premium Opportunity Fund; ING Global Advantage and Premium Opportunity Fund; ING International High Dividend Equity Income Fund; ING Investors Trust; ING Mayflower Trust; ING Mutual Funds; ING Prime Rate Trust; ING Risk Managed Natural Resources Fund; ING Senior Income Fund; ING Separate Portfolios Trust; ING Variable Insurance Trust; ING Variable Products Trust; and ING Partners, Inc.
(4) "Interested person," as defined in the 1940 Act, by virtue of this Director's/Trustee's affiliation with any of the Funds, ING or any of ING's affiliates.
(5) ING Investments, LLC was previously named ING Pilgrim Investments, LLC. ING Pilgrim Investments, LLC is the successor in interest to ING Pilgrim Investments, Inc., which was previously known as Pilgrim Investments, Inc. and before that was known as Pilgrim America Investments, Inc.
(6) ING Funds Distributor, LLC is the successor in interest to ING Funds Distributor, Inc., which was previously known as ING Pilgrim Securities, Inc., and before that was known as Pilgrim Securities, Inc., and before that was known as Pilgrim America Securities, Inc.
(7) ING Funds Services, LLC was previously named ING Pilgrim Group, LLC. ING Pilgrim Group, LLC is the successor in interest to ING Pilgrim Group, Inc., which was previously known as Pilgrim Group, Inc. and before that was known as Pilgrim America Group, Inc.
(8) Mr. Nelson resigned from the Board as of January 15, 2009.
115
DIRECTOR/TRUSTEE AND OFFICER INFORMATION (UNAUDITED) (CONTINUED)
Name, Address
and Age | | Position(s) Held with
Companies | | Term of Office and
Length of Time Served(1) | | Principal Occupation(s) - During the
Past 5 Years | |
| Officers: | |
|
Shaun P. Mathews
7337 East Doubletree Ranch Rd.
Scottsdale, Arizona 85258
Age: 53 | | President and Chief Executive Officer | | December 2006 - Present | | President and Chief Executive Officer, ING Investments, LLC (November 2006 - Present). Formerly, President, ING Mutual Funds and Investment Products (November 2004 - November 2006); Chief Marketing Officer, ING USFS (April 2002 - October 2004); and Head of Rollover/Payout (October 2001- December 2003). | |
|
Michael J. Roland
7337 East Doubletree Ranch Rd.
Scottsdale, Arizona 85258
Age: 50 | | Executive Vice President | | April 2002 - Present | | Head of Mutual Fund Platform (February 2007 - Present) and Executive Vice President, ING Investments, LLC(2) and ING Funds Services, LLC(3) (December 2001 - Present). Formerly, Executive Vice President, Head of Product Management (January 2005 - January 2007); Chief Compliance Officer, ING Investments, LLC(2) and Directed Services LLC(6) (October 2004 - December 2005); and Chief Financial Officer and Treasurer, ING Investments, LLC(2) (December 2001 - March 2005). | |
|
Stanley D. Vyner
230 Park Avenue
New York, New York 10169
Age: 58 | | Executive Vice President | | March 2002 - Present | | Executive Vice President, ING Investments, LLC(2) (July 2000 - Present) and Chief Investment Risk Officer, ING Investments, LLC(2) (January 2003 - Present). | |
|
Joseph M. O'Donnell
7337 East Doubletree Ranch Rd.
Scottsdale, Arizona 85258
Age: 54 | | Executive Vice President
Chief Compliance Officer | | March 2006 - Present
November 2004 - Present | | Chief Compliance Officer of the ING Funds (November 2004 - Present) and Executive Vice President of the ING Funds (March 2006 - Present). Formerly, Chief Compliance Officer of ING Investments, LLC(2) (March 2006 - July 2008); Investment Advisor Chief Compliance Officer, Directed Services LLC(6) (March 2006 - July 2008) ING Life Insurance and Annuity Company (March 2006 - December 2006); and Vice President, Chief Legal Counsel, Chief Compliance Officer and Secretary of Atlas Securities, Inc., Atlas Advisers, Inc. and Atlas Funds (October 2001 - October 2004). | |
|
Todd Modic
7337 East Doubletree Ranch Rd
Scottsdale, Arizona 85258
Age: 41 | | Senior Vice President, Chief/Principle Financial Officer and Assistant Secretary | | March 2005 - Present | | Senior Vice President, ING Funds Services, LLC(3) (March 2005 - Present). Formerly, Vice President, ING Funds Services, LLC(3) (September 2002 - March 2005). | |
|
Kimberly A. Anderson
7337 East Doubletree Ranch Rd.
Scottsdale, Arizona 85258
Age: 44 | | Senior Vice President | | December 2003 - Present | | Senior Vice President, ING Investments, LLC(2) (October 2003 - Present). | |
|
Robert Terris
7337 East Doubletree Ranch Rd. Scottsdale, Arizona 85258 Age: 38 | | Senior Vice President | | June 2006 - Present | | Senior Vice President, Head of Division Operations, ING Funds Services, LLC(3) (May 2006 - Present). Formerly, Vice President of Administration, ING Funds Services, LLC(3) (October 2001 - March 2006). | |
|
116
DIRECTOR/TRUSTEE AND OFFICER INFORMATION (UNAUDITED) (CONTINUED)
Name, Address
and Age | | Position(s) Held with
Companies | | Term of Office and
Length of Time Served(1) | | Principal Occupation(s) - During the
Past 5 Years | |
Ernest J. C'DeBaca
7337 East Doubletree Ranch Rd.
Scottsdale, Arizona 85258
Age: 39 | | Senior Vice President | | June 2006 - Present | | Chief Compliance Officer, ING Investments, LLC(2)(July 2008 - Present); Investment Advisor Chief Compliance Officer, Directed Services LLC(6) (July 2008 - Present); Head of Retail Compliance, ING Funds Distributor, LLC(4) and ING Funds Services, LLC(3), (July 2008 - Present); and Senior Vice President, ING In vestments, LLC(2) (December 2006 - Present), ING Funds Services, LLC(3) (April 2006 - Present), ING Funds Distributor, LLC(4) (July 2008 - Present), and Directed Services LLC(6) (July 2008 - Present). Formerly, Counsel, ING Americas, U.S. Legal Services (January 2004 - March 2006) and Attorney-Adviser, U.S. Securities and Exchange Commission (May 2001 - December 2003). | |
|
Robyn L. Ichilov
7337 East Doubletree Ranch Rd.
Scottsdale, Arizona 85258
Age: 41 | | Vice President and Treasurer | | March 2002 - Present | | Vice President and Treasurer, ING Funds Services, LLC(3) (November 1995 - Present) and ING Investments, LLC(2) (August 1997 - Present). | |
|
Lauren D. Bensinger
7337 East Doubletree Ranch Rd.
Scottsdale, Arizona 85258
Age: 54 | | Vice President | | March 2003 - Present | | Vice President and Chief Compliance Officer, ING Funds Distributor, LLC(4) (August 1995 - Present); Vice President, ING Investments, LLC(2) and ING Funds Services, LLC(3)(February 1996 - Present); and Director of Compliance, ING Investments, LLC(2) (October 2004 - Present). Formerly, Chief Compliance Officer, ING Investments, LLC(2) (October 2001 - October 2004). | |
|
William Evans
10 State House Square
Hartford, Connecticut 06103
Age: 36 | | Vice President | | September 2007 - Present | | Vice President, Head of Mutual Fund Advisory Group (April 2007 - Present). Formerly, Vice President, U.S. Mutual Funds and Investment Products (May 2005 - April 2007) and Senior Fund Analyst, U.S. Mutual Funds and Investment Products (May 2002 - May 2005). | |
|
Maria M. Anderson
7337 East Doubletree Ranch Rd.
Scottsdale, Arizona 85258
Age: 50 | | Vice President | | September 2004 - Present | | Vice President, ING Funds Services, LLC(3) (September 2004 - Present). Formerly, Assistant Vice President, ING Funds Services, LLC(3) (October 2001 - September 2004). | |
|
Denise Lewis
7337 East Doubletree Ranch Rd.
Scottsdale, Arizona 85258
Age: 45 | | Vice President | | April 2007 - Present | | Vice President, ING Funds Services, LLC (December 2006 - Present). Formerly, Senior Vice President, UMB Investment Services Group, LLC (November 2003 - December 2006). | |
|
Kimberly K. Springer
7337 East Doubletree Ranch Rd.
Scottsdale, Arizona 85258
Age: 51 | | Vice President | | March 2006 - Present | | Vice President, ING Funds Services, LLC(3) (March 2006 - Present). Formerly, Assistant Vice President, ING Funds Services, LLC(3) (August 2004 - March 2006) and Manager, Registration Statements, ING Funds Services, LLC(3) (May 2003 - August 2004). | |
|
Susan P. Kinens
7337 East Doubletree Ranch Rd. Scottsdale, Arizona 85258 Age: 32 | | Assistant Vice President | | March 2003 - Present | | Assistant Vice President, ING Funds Services, LLC(3) (December 2002 - Present). | |
|
Craig Wheeler
7337 East Doubletree Ranch Rd.
Scottsdale, Arizona 85258 Age: 39 | | Assistant Vice President | | June 2008 - Present | | Assistant Vice President - Director of Tax, ING Funds Services (March 2008 - Present). Formerly, Tax Manager, ING Funds Services (March 2005 - March 2008); Tax Senior , ING Funds Services (January 2004 - March 2005); and Tax Senior, KPMG LLP (August 2002 - December 2003). | |
|
Theresa K. Kelety
7337 East Doubletree Ranch Rd. Scottsdale, Arizona 85258 Age: 45 | | Secretary | | September 2003 - Present | | Senior Counsel, ING Americas, U.S. Legal Services (April 2008 - Present). Formerly, Counsel, ING Americas, U.S. Legal Services (April 2003 - April 2008). | |
|
117
DIRECTOR/TRUSTEE AND OFFICER INFORMATION (UNAUDITED) (CONTINUED)
Name, Address
and Age | | Position(s) Held with
Companies | | Term of Office and
Length of Time Served(1) | | Principal Occupation(s) - During the
Past 5 Years | |
Huey P. Falgout, Jr.
7337 East Doubletree Ranch Rd. Scottsdale, Arizona 85258 Age: 45 | | Assistant Secretary | | September 2003 - Present | | Chief Counsel, ING Americas, U.S. Legal Services (September 2003 - Present). | |
|
Kathleen Nichols
7337 East Doubletree Ranch Rd.
Scottsdale, Arizona 85258
Age: 33 | | Assistant Secretary | | June 2008 - Present | | Counsel, ING Americas, U.S. Legal Services (February 2008 - Present). Formerly, Associate, Ropes & Gray LLP (September 2005 - February 2008) | |
|
(1) The officers hold office until the next annual meeting of the Director/Trustees and until their successors shall have been elected and qualified.
(2) ING Investments, LLC was previously named ING Pilgrim Investments, LLC. ING Pilgrim Investments, LLC is the successor in interest to ING Pilgrim Investments, Inc., which was previously known as Pilgrim Investments, Inc. and before that was known as Pilgrim America Investments, Inc.
(3) ING Funds Services, LLC was previously named ING Pilgrim Group, LLC. ING Pilgrim Group, LLC is the successor in interest to ING Pilgrim Group, Inc., which was previously known as Pilgrim Group, Inc. and before that was known as Pilgrim America Group, Inc.
(4) ING Funds Distributor, LLC is the successor in interest to ING Funds Distributor, Inc., which was previously known as ING Pilgrim Securities, Inc., and before that was known as Pilgrim Securities, Inc., and before that was known as Pilgrim America Securities, Inc.
(5) Directed Services, LLC is the successor in interest to Directed Services, Inc.
118
ADVISORY CONTRACT APPROVAL DISCUSSION (UNAUDITED)
BOARD CONSIDERATION AND APPROVAL OF INVESTMENT ADVISORY AND SUB-ADVISORY AGREEMENTS
The Investment Company Act of 1940, as amended (the "1940 Act"), provides, in substance, that each investment advisory agreement and sub-advisory agreement for a mutual fund will terminate automatically after the initial term of the agreement (which term may not exceed two years), unless continuation of the agreement is approved annually by the Board of Trustees or Directors, as the case may be (the "Board") of the fund, including a majority of the Trustees/Directors who have no direct or indirect interest in the agreement and who are not "interested persons" of the fund (the "Independent Trustees"). Consistent with this requirement of the 1940 Act, the Board of ING VP Balanced Portfolio, Inc., ING Strategic Allocation Portfolios, Inc., ING VP Intermediate Bond Portfolio, ING VP Money Market Portfolio, ING Variable Funds, ING Variable Portfolios, Inc. and ING Series Fund, Inc., with respect to each portfolio series thereof (each, a "Fund" an d collectively, the "Funds") has established a process for considering on an annual basis approval of the continuation of the Investment Management Agreement for each Fund (the "Advisory Agreement") with ING Investments, LLC (the "Adviser") and the sub-advisory agreement for each Fund (collectively, the "Sub-Advisory Agreements") with each sub-adviser of the Funds (the "Sub-Advisers"). Set forth below is a description of the process followed by the Board in considering approval of the continuation of each Advisory and Sub-Advisory Agreement (collectively, the "Agreements"), together with an explanation of many of the factors considered and related conclusions reached by the Board in voting to approve the continuation of each Agreement for an additional one-year period commencing January 1, 2009, followed by specific considerations with respect to each portfolio series covered by this report (each, a "Portfolio").
Overview of the Review Process
At a meeting of the Board held on December 11, 2008, the Board, including all of the Independent Trustees, voted to approve continuation of each of the existing Advisory and Sub-Advisory Agreements for the Funds. Prior to voting such approvals, the Board received the affirmative recommendation of the Contracts Committee of the Board, which is a Committee of the Board comprised of all of the Independent Trustees and exclusively of the Independent Trustees. The Contracts Committee recommended approval of the Advisory and Sub-Advisory Agreements after completing an extensive review of information requested by the Committee from the Adviser and each Sub-Adviser, including the following: (1) comparative performance data for each Fund for various time periods; (2) comparative data regarding management fees, including data regarding the fees charged by the Adviser and Sub-Advisers for managing other mutual funds and institutional accounts using inv estment strategies and techniques similar to those used in managing the Funds; (3) comparative data regarding the total expenses of each Fund; (4) copies of each form of Advisory Agreement and Sub-Advisory Agreement; (5) copies of the codes of ethics of the Adviser and each Sub-Adviser, together with information relating to the manner in which each code is administered; (6) financial statements of the Adviser and each Sub-Adviser; (7) profitability analyses for the Adviser and each Sub-Adviser with respect to each Fund, and all Funds as a group; (8) descriptions of the qualifications of the investment personnel responsible for managing each Fund, the structure of their compensation and their responsibilities with respect to managing other accounts or mutual funds; (9) descriptions of the services provided to the Funds, including the investment strategies and techniques used by each Sub-Adviser in managing the Funds; (10) data relating to portfolio turnover and brokerage practices, including practices with re spect to the acquisition of research through "soft dollar" benefits received in connection with the Funds' brokerage; (11) data comparing the performance of certain Funds against "static portfolios" of the Funds over various time periods; (12) descriptions of the policies and procedures of the various service providers of the Funds for protecting the privacy of shareholder information; (13) information relating to projected sales and redemptions of Fund shares and business plans relating to the Adviser's mutual fund platform; (14) descriptions of the business continuity and disaster recovery plans of the Adviser and each Sub-Adviser; (15) descriptions of various compliance programs of the Adviser and Sub-Advisers, including the Adviser's programs for monitoring and enforcing compliance with the Funds' policies with respect to market-timing, late trading and selective portfolio disclosure; (16) independent reports analyzing the quality of the trade execution services performed by Sub-Advisers for the Funds; a nd (17) other information relevant to an evaluation of the nature, extent and quality of the services provided by the Adviser and each Sub-Adviser in response to a series of detailed questions posed by independent legal counsel on behalf of the Independent Trustees.
119
ADVISORY CONTRACT APPROVAL DISCUSSION (UNAUDITED) (CONTINUED)
The Contracts Committee began the formal review process in July 2008 when it met separately with Goodwin Procter LLP, legal counsel for the Independent Trustees ("Independent Counsel"), to review the information to be requested from management and the methodology to be used in determining the selected peer groups for comparing performance and expenses. The Contracts Committee then held meetings on October 15-16, 2008 and December 9-10, 2008, during which the Independent Trustees, meeting separately with Independent Counsel, reviewed and evaluated the information described above. As part of the review process, the Contracts Committee also met with representatives from the Adviser and/or the Sub-Advisers to discuss the information provided to the Committee. The Contracts Committee also considered information that had been provided by the Adviser and Sub-Advisers throughout the year at other meetings of the Contracts Committee, the Audit Commit tee, the Compliance Committee and the full Board.
The Independent Trustees were assisted by Independent Counsel, throughout the contract review process. The Independent Trustees relied upon the advice of Independent Counsel and their own business judgment in determining the material factors to be considered in evaluating each Advisory and Sub-Advisory Agreement and the weight to be given to each such factor. The conclusions reached by the Independent Trustees were based on a comprehensive evaluation of all of the information provided and were not the result of any one factor. Moreover, each Independent Trustee may have afforded different weight to the various factors in reaching his or her conclusions with respect to each Advisory and Sub-Advisory Agreement.
Nature, Extent and Quality of Services
In considering whether to approve the Advisory and Sub-Advisory Agreements for the Funds for the year commencing January 1, 2009, the Board evaluated the nature, extent and quality of services provided to the Funds by the Adviser and Sub-Advisers. The Board considered the investment management and related services provided by the Adviser and Sub-Advisers, including the quantity and quality of the resources available to provide such services. Among other things, the Board considered the qualifications of the individuals responsible for performing various investment related services.
The Board also considered the quality of the compliance programs of the Adviser and each Sub-Adviser, including the manner in which the Adviser and each Sub-Adviser monitor for compliance with the investment policies and restrictions of a Fund and with the Codes of Ethics of the Funds, the Adviser and the Sub-Advisers with respect to personal trading by employees with access to portfolio information. The Board also considered the actions taken by the Adviser and Sub-Advisers to establish and maintain effective disaster recovery and business continuity plans.
The Board considered the actions taken by the Adviser and its affiliated companies to administer the Funds' policies and procedures for voting proxies, valuing the Funds' assets, selective disclosure of portfolio holdings and preventing late-trading and frequent trading of Fund shares. With respect to these and related compliance matters, the Board also considered the responsiveness of the Adviser and its affiliated companies over the course of the past several years to the inquiries of various regulatory authorities.
The Board also took into account the efforts of the Adviser and its affiliated companies to reduce the expenses of the Funds. With respect to those Funds that are sub-advised by an affiliate of the Adviser, the Board specifically noted that, in recent years, the Adviser and its affiliated companies have significantly reduced the Funds' brokerage costs and portfolio turnover rates, as well as the quantity of research acquired through the use of soft dollars from the Funds' brokerage. The Board also noted the efforts of the Adviser to optimize the number of Funds in the ING complex of mutual funds and to standardize the asset management characteristics and policies across the ING mutual fund platform. Consideration was also given to the benefits that shareholders of the Funds realize because the Funds are part of a larger ING family of mutual funds, including, in most cases, the ability of shareholders to exchange or transfer investments withi n the same class of shares among a wide variety of mutual funds without incurring additional sales charges.
The Board concluded that the nature, extent and quality of advisory and related services provided by the Adviser and each of the Sub-Advisers, taken as a whole, are consistent with the terms of the respective Advisory and Sub-Advisory Agreements and justify the fees paid by the Funds for such services.
Fund Performance
The Board reviewed each Fund's investment performance over various time periods on an absolute basis and relative to the performance of (i) one or more appropriate benchmark indexes (such as the S&P 500 Composite Stock Price Index), (ii) a group of
120
ADVISORY CONTRACT APPROVAL DISCUSSION (UNAUDITED) (CONTINUED)
similarly managed mutual funds identified by Lipper, Inc. and/or Morningstar, Inc., and (iii) similarly managed mutual funds within a specified peer group based upon a methodology approved by the Contracts Committee (each, a "Selected Peer Group"). The Board reviewed comparative performance data for the one-, three-, five- and ten-year periods, where applicable, ending June 30, 2008 and the one-, three-, and five-year periods ending September 30, 2008. Summaries of selected portions of the performance information reviewed by the Board, together with the Board's conclusions regarding the performance of each Portfolio covered by this report, are set forth below under "Fund-by-Fund Analysis."
Management Fees, Sub-Advisory Fees and Expenses
Consideration was given to the contractual investment advisory fee rates, inclusive of administrative fee rates, payable by the Funds to the Adviser and its affiliated companies (referred to collectively as "management fees") and the contractual sub-advisory fee rates payable by the Adviser to each Sub-Adviser for sub-advisory services. As part of its review, the Board considered each Fund's management fee and total expense ratio, as compared to its Selected Peer Group, both before and after giving effect to any undertaking by the Adviser to waive fees and/or limit the total expenses of a Fund. In addition, the Trustees received information regarding the fees charged by each Sub-Adviser to similarly-managed institutional accounts and other mutual funds, if any, and the comparability (or lack thereof) of the services provided by the Sub-Adviser in managing such accounts and other mutual funds to the services provided in managing the Funds. Wi th respect to the Funds sub-advised by an affiliate of the Adviser, the Board evaluated the reasonableness of the total fees received by the Adviser and its affiliate in the aggregate under the Advisory and Sub-Advisory Agreements. With respect to those Funds sub-advised by a Sub-Adviser that is not affiliated with the Adviser, the Board considered the reasonableness of the fees payable to the Sub-Adviser by the Adviser in light of the ability of the Adviser to negotiate such fees on an arm's-length basis. Summaries of selected portions of the fee and expense information reviewed with respect to each Portfolio covered by this report are set forth below under "Fund-by-Fund Analysis." After reviewing the foregoing information, and in light of the nature, extent and quality of the services provided by the Adviser and each Sub-Adviser, the Board concluded with respect to each Fund that the management fee charged to the Fund for advisory, sub-advisory and related services is fair and reasonable and that the total expense ratio of the Fund is reasonable.
Profitability
The Board considered information relating to revenues, expenses, and profits realized by the Adviser and each Sub-Adviser attributable to performing advisory, sub-advisory and administrative services for the Funds. With respect to Funds sub-advised by an unaffiliated Sub-Adviser, the Board did not consider the profitability of the Sub-Adviser to be a material factor because the Board believes that the Adviser negotiates sub-advisory fees with the unaffiliated Sub-Adviser on an arm's-length basis. The Board reviewed profitability data for the Adviser and its affiliated companies, including the distributor of the Funds, relating to (i) each Fund separately, (ii) all Funds as a group, (iii) all "retail" Funds as a group, and (iv) all variable insurance product Funds as a group, in each case for the one-year periods ended December 31, 2007 and December 31, 2006 and the nine-month period ended September 30, 2008. With respect to the Adviser and i ts affiliates, such information was prepared in accordance with a methodology approved by the Contracts Committee. The Board considered the profitability of the Adviser and its affiliated companies attributable to managing and operating each Fund both with and without the profitability of the distributor of the Funds and both before and after giving effect to any expenses incurred by the Adviser or any affiliated company in making revenue sharing or other payments to third parties, including affiliated insurance companies, for distribution and administrative services. With respect to Funds sub-advised by an affiliate of the Adviser, the Board considered the total profits derived by the Adviser and its affiliate in the aggregate attributable to managing and operating each Fund. The Board also considered other direct or indirect benefits that the Adviser and Sub-Advisers, and any affiliated companies thereof, derive from their relationships with the Funds, including the receipt by certain affiliates of the Adv iser, of fees relating to the offering of bundled financial products, such as annuity contracts, and the receipt by Sub-Advisers of "soft dollar" benefits from the Funds' brokerage. The Board concluded that, in light of the nature, extent and quality of the services provided, the profits realized by the Adviser and its affiliated companies, taken as a whole, with respect to providing advisory, sub-advisory and administrative services for each Fund are reasonable.
121
ADVISORY CONTRACT APPROVAL DISCUSSION (UNAUDITED) (CONTINUED)
Economies of Scale
In considering the reasonableness of the management fee of each Fund, the Board considered the extent to which economies of scale can be expected to be realized by a Fund's Adviser and its affiliated companies, on the one hand, and by the Fund, on the other hand, as the assets of the Fund increase. The Board noted that the advisory fee schedule for certain Funds includes breakpoints such that, as the assets of the Fund increase, the Fund's management fee will decrease as a percentage of the Fund's total assets. The Board recognized the inherent difficulties in measuring precisely the impact of any economies of scale being realized by the Adviser and its affiliated companies with respect to their management of any one or more Funds. In an effort to determine the extent to which economies of scale, if any, will be realized by the Adviser and its affiliated companies as the assets of the Funds grow, the Board considered the profitability data d escribed above relating to the Adviser and its affiliated companies in light of changes in the assets of the Funds over various time periods. The Board noted that the total assets under management of many Funds have decreased during the past several years and concluded that the economies of scale realized by the Adviser and its affiliated companies from managing the Funds have not increased with respect to such Funds. The Board also reviewed information regarding the expense ratio of each Fund in light of changes in the assets of the Funds over various time periods, noting that, as the assets of a Fund increase, the fixed expenses of the Fund, as a percentage of the total assets of the Fund, can be expected to decrease. The Board considered such expense information in light of projections provided by the Adviser with respect to the future growth of assets of the Funds. Based upon the foregoing, the Board concluded that the economies of scale being realized by the Adviser and its affiliated companies do not m andate the implementation of breakpoints or additional breakpoints, as the case may be, with respect to any Fund at this time.
Fund-by-Fund Analysis
In deciding to approve the continuation of each Advisory and Sub-Advisory Agreement for an additional one-year period beginning January 1, 2009, the Board took into account the specific data and factors identified below relating to the performance, fees and expenses of each Fund and actions being taken by the Adviser or Sub-Adviser, as the case may be, with respect to these matters. Except as otherwise indicated, the performance data described below for each Portfolio is for periods ended September 30, 2008 and the management fees and expense data described below are as of June 30, 2008.
ING VP Balanced Portfolio
In evaluating the investment performance of ING VP Balanced Portfolio, the Board noted that the Portfolio outperformed its Morningstar category median for the most recent calendar quarter, year-to-date and one-year periods but underperformed for the three-year and five-year periods. The Board received performance information relating to a benchmark index of fixed income securities (the "FISB") and equity securities (the "ESB") from which the Board could calculate a composite benchmark index (the "Composite Benchmark") comprised of 60% ESB and 40% FISB. The Board noted that the Portfolio underperformed the Composite Benchmark for all periods presented. The Board considered the fact that the Portfolio is ranked in its Morningstar category in the second quintile for the most recent calendar quarter, year-to-date and one-year periods and in the fourth quintile for the three-year and five-year periods. The Board noted that the Sub-Adviser impleme nted a quantitative-based model for selecting stocks based on dynamic factor weightings to manage the equity portion of the Portfolio in 2008. The Board concluded that appropriate actions are being taken to improve performance and that additional time is needed to evaluate the effectiveness of these actions.
In assessing the reasonableness of the management fee and expense ratio of ING VP Balanced Portfolio, the Board noted that the management fee for the Portfolio is below the median and average management fees of the funds in its Selected Peer Group and that the expense ratio for the Portfolio is below the median and average expense ratios of the funds in its Selected Peer Group.
ING BlackRock Global Science and Technology Portfolio
In evaluating the investment performance of ING BlackRock Global Science and Technology Portfolio, the Board noted that: (1) the Portfolio outperformed its Morningstar category median for all periods presented; (2) the Portfolio outperformed its benchmark index for the three-year period but underperformed for the most recent calendar quarter, year-to-date, one-year and five-year periods; and (3) the Portfolio is ranked in its Morningstar category in the first quintile for the most recent calendar quarter, year-to-date, one-year and three-year periods and in the second quintile for the five-year period. The Board concluded that the performance of the Portfolio is satisfactory.
122
ADVISORY CONTRACT APPROVAL DISCUSSION (UNAUDITED) (CONTINUED)
In assessing the reasonableness of the management fee and expense ratio for ING BlackRock Global Science and Technology Portfolio, the Board noted that the management fee for the Portfolio is above the median and average management fees of the funds in its Selected Peer Group and that the expense ratio for the Portfolio is above the median and average expense ratios of the portfolios in its Selected Peer Group. Additionally, the Board noted that in April 2008, ING Global Technology Portfolio merged with and into the Portfolio, and, in connection with the merger, the Adviser agreed to implement a lower expense cap for the Portfolio, which resulted in a management fee waiver of .03 of 1% (three basis points) of the Portfolio's average net assets.
ING Opportunistic LargeCap Growth Portfolio
In evaluating the investment performance of ING Opportunistic LargeCap Growth Portfolio, the Board noted that: (1) the Portfolio outperformed its Morningstar category median for the most recent calendar quarter but underperformed for the year-to-date, one-year, three-year and five-year periods; (2) the Portfolio underperformed its benchmark index for all periods presented; and (3) the Portfolio is ranked in its Morningstar category in the third quintile for the most recent calendar quarter, in the fourth quintile for the one-year, three-year and five-year periods and in the fifth quintile for the year-to-date period. The Board further noted that in November 2007 the Portfolio transitioned to a quantitative, opportunistic large-cap growth strategy. The Board concluded that appropriate actions are being taken to improve performance and that additional time is needed to evaluate the effectiveness of these actions.
In assessing the reasonableness of the management fee and expense ratio for ING Opportunistic LargeCap Growth Portfolio, the Board noted that the management fee for the Portfolio is below the median and average management fees of the funds in its Selected Peer Group and that the expense ratio for the Portfolio is below the median and average expense ratios of the funds in its Selected Peer Group.
ING VP Growth and Income Portfolio
In evaluating the investment performance of ING VP Growth and Income Portfolio, the Board noted that: (1) the Portfolio outperformed its Morningstar category median for the one-year, three-year and five-year periods, but underperformed for the most recent calendar quarter and year-to-date periods; (2) the Portfolio outperformed its benchmark index for the one-year and five-year periods but underperformed for the most recent calendar quarter, year-to-date and three-year periods; and (3) the Portfolio is ranked in its Morningstar category in the second quintile for the one-year, three-year and five-year periods, in the third quintile for the year-to-date period and in the fourth quintile for the most recent calendar quarter. The Board concluded that the performance of the Portfolio is satisfactory.
In assessing the reasonableness of the management fee and expense ratio for ING VP Growth and Income Portfolio, the Board noted that the management fee for the Portfolio is below the median and average management fees of the funds in its Selected Peer Group and that the expense ratio for the Portfolio is below the median and average expense ratios of the funds in its Selected Peer Group.
ING VP Small Company Portfolio
In evaluating the investment performance of ING VP Small Company Portfolio, the Board noted that: (1) the Portfolio outperformed its Morningstar category median for all periods presented; (2) the Portfolio outperformed its benchmark index for the year-to-date, one-year, three-year and five-year periods but underperformed for the most recent calendar quarter; and (3) the Portfolio is ranked in its Morningstar category in the first quintile for the year-to-date, one-year and three-year periods and in the second quintile for the most recent calendar quarter and five-year periods. The Board concluded that the performance of the Portfolio is satisfactory.
In assessing the reasonableness of the management fee and expense ratio for ING VP Small Company Portfolio, the Board noted that the management fee for the Portfolio is below the median and average management fees of the funds in its Selected Peer Group, and that the expense ratio for the Portfolio is below the median and average expense ratios of the funds in its Selected Peer Group.
ING Opportunistic LargeCap Value Portfolio
In evaluating the investment performance of ING Opportunistic LargeCap Value Portfolio, the Board noted that: (1) the Portfolio underperformed its Morningstar category median and its benchmark index for all periods presented; and (2) the Portfolio is ranked in its Morningstar category in the fourth quintile for all periods presented. The Board further noted that in November 2007 the Portfolio transitioned to a quantitative, opportunistic large-cap value strategy. The Board concluded that appropriate actions are being taken to improve the performance
123
ADVISORY CONTRACT APPROVAL DISCUSSION (UNAUDITED) (CONTINUED)
of the Portfolio and that additional time is needed to evaluate the effectiveness of these actions.
In assessing the reasonableness of the management fee and expense ratio for ING Opportunistic LargeCap Value Portfolio, the Board noted that the management fee for the Portfolio is below the median and average management fees of the funds in its Selected Peer Group, and that the expense ratio for the Portfolio is below the median and average expense ratios of the funds in its Selected Peer Group.
ING VP Intermediate Bond Portfolio
In evaluating the investment performance of ING VP Intermediate Bond Portfolio, the Board noted that: (1) the Portfolio outperformed its Morningstar category median for the five-year period but underperformed for the most recent calendar quarter, year-to-date, one-year and three-year periods; (2) the Portfolio underperformed its benchmark index for all periods presented; and (3) the Portfolio is ranked in its Morningstar category in the third quintile for the three-year and five-year periods and in the fourth quintile for the most recent calendar quarter, year-to-date and one-year periods. The Board noted that in July 2008 the Sub-adviser implemented a realignment of its fixed income portfolio management and research team in an effort to maximize fixed income research capabilities to better position the Portfolio for investment opportunities. The Board concluded that appropriate actions are being taken to improve the performance of the Portf olio and that additional time is needed to evaluate the effectiveness of these actions.
In assessing the reasonableness of the management fee and expense ratio for ING VP Intermediate Bond Portfolio, the Board noted that the management fee for the Portfolio is below the median and average management fees of the funds in its Selected Peer Group, and that the expense ratio for the Portfolio is below the median and average expense ratios of the funds in its Selected Peer Group.
ING VP Money Market Portfolio
In evaluating the investment performance of ING VP Money Market Portfolio, the Board noted that: (1) the Portfolio outperformed its Morningstar category median and its benchmark index for all periods presented; and (2) although the Portfolio is not ranked by Morningstar, the Portfolio is ranked in its Lipper category in the first quintile for the year-to-date, one-year, three-year and five-year periods and in the second quintile for the most recent calendar quarter. The Board concluded that the performance of the Portfolio is satisfactory.
In assessing the reasonableness of the management fee and expense ratio for ING VP Money Market Portfolio, the Board noted that the management fee for the Portfolio is below the median and average management fees of the funds in its Selected Peer Group, and that the expense ratio for the Portfolio is below the median and average expense ratios of the funds in its Selected Peer Group. The Board also noted that in 2008 the Adviser and its affiliates provided credit support with respect to certain impaired securities held by the Portfolio, which minimized deviations between the Portfolio's market-based and amortized cost-based net asset value per share during tumultuous market conditions.
124
(THIS PAGE INTENTIONALLY LEFT BLANK)
(THIS PAGE INTENTIONALLY LEFT BLANK)
Investment Adviser
ING Investments, LLC
7337 East Doubletree Ranch Road
Scottsdale, Arizona 85258
Administrator
ING Funds Services, LLC
7337 East Doubletree Ranch Road
Scottsdale, Arizona 85258
Distributor
ING Funds Distributor, LLC
7337 East Doubletree Ranch Road
Scottsdale, Arizona 85258
Transfer Agent
DST Systems, Inc.
P.O. Box 419368
Kansas City, Missouri 64141
Independent Registered Public
Accounting Firm
KPMG LLP
99 High Street
Boston, Massachusetts 02110
Custodian
The Bank of New York Mellon
One Wall Street
New York, New York 10286
Legal Counsel
Goodwin Procter LLP
Exchange Place
53 State Street
Boston, Massachusetts 02109
Before investing, carefully consider the investment objectives, risks, charges and expenses of the variable annuity contract and the underlying variable investment options. This and other information is contained in the prospectus for the variable annuity contract and the underlying variable investment options. Obtain these prospectuses from your agent/registered representative and read them carefully before investing.
VPAR-ACAPAPADVIS (1208-022609)


Annual Report
December 31, 2008
Classes I and S
Domestic Equity Index Portfolios
| n | ING VP Index Plus LargeCap Portfolio |
| n | ING VP Index Plus MidCap Portfolio |
| n | ING VP Index Plus SmallCap Portfolio |
| | |
 | | E-Delivery Sign-up – details inside |
This report is submitted for general information to shareholders of the ING Funds. It is not authorized for distribution to prospective shareholders unless accompanied or preceded by a prospectus which includes details regarding the funds’ investment objectives, risks, charges, expenses and other information. This information should be read carefully.
MUTUAL FUNDS 
| |
TABLE OF CONTENTS
| | | | |
| | | |
| | Go Paperless with E-Delivery! | | |
Sign up now for on-line prospectuses, fund reports, and proxy statements. In less than five minutes, you can help reduce paper mail and lower fund costs. Just go to www.ingfunds.com, click on the E-Delivery icon from the home page, follow the directions and complete the quick 5 Steps to Enroll. You will be notified by e-mail when these communications become available on the internet. Documents that are not available on the internet will continue to be sent by mail. |
PROXY VOTING INFORMATION
A description of the policies and procedures that the Portfolios use to determine how to vote proxies related to portfolio securities is available: (1) without charge, upon request, by calling Shareholder Services toll-free at (800) 992-0180; (2) on the ING Funds’ website at www.ingfunds.com; and (3) on the U.S. Securities and Exchange Commission’s (“SEC”) website at www.sec.gov. Information regarding how the Portfolios voted proxies related to portfolio securities during the most recent 12-month period ended June 30 is available without charge on the ING Funds’ website at www.ingfunds.com and on the SEC’s website at www.sec.gov.
QUARTERLY PORTFOLIO HOLDINGS
The Portfolios file their complete schedule of portfolio holdings with the SEC for the first and third quarters of each fiscal year on Form N-Q. The Portfolios’ Forms N-Q are available on the SEC’s website at www.sec.gov. The Portfolios’ Forms N-Q may be reviewed and copied at the SEC’s Public Reference Room in Washington, DC, and information on the operation of the Public Reference Room may be obtained by calling (800) SEC-0330; and is available upon request from the Portfolios by calling Shareholder Services toll-free at (800) 992-0180.
PRESIDENT’S LETTER

Dear Shareholders,
We are in the midst of one of the most challenging periods ever faced by investors, and we at ING Funds are aware of the anxiety that you may be feeling at this time.
I want to assure you that we are actively engaged in monitoring the situation and are committed to keeping you fully informed of how the rapidly unfolding events around us may impact your investments with our company.
We recognize that the confidence of many investors is being tested, perhaps as never before. It is understandable that some of you may be second guessing your investment strategy due to these recent events. We encourage you to work with your investment professional and seek out their advice about your portfolio in light of the current conditions. But we also urge investors not to make rash decisions. ING Funds still believes that a well-diversified, globally allocated portfolio remains the most effective
investment strategy of all. We ask that investors not lose sight of their commitment to the long-term.
We thank you for your support and confidence and we look forward to continuing to do business with you in the future.
Sincerely,

Shaun Mathews
President & Chief Executive Officer
ING Funds
January 23, 2009
The views expressed in the President’s Letter reflect those of the President as of the date of the letter. Any such views are subject to change at any time based upon market or other conditions and ING Funds disclaims any responsibility to update such views. These views may not be relied on as investment advice and because investment decisions for an ING Fund are based on numerous factors, may not be relied on as an indication of investment intent on behalf of any ING Fund. Reference to specific company securities should not be construed as recommendations or investment advice. Consider the fund’s investment objectives, risks, and charges and expenses carefully before investing. The prospectus contains this information and other information about the fund.
International investing poses special risks including currency fluctuation, economic and political risks not found in investments that are solely domestic.
1
MARKET PERSPECTIVE: YEAR ENDED DECEMBER 31, 2008
In our semi-annual report, we described a failed second quarter rally that fizzled when investors realized that borderline recessionary conditions and a credit crunch had not gone away. By year-end, governments were committing previously unimaginable sums of taxpayer money to prevent systemic collapse. Global equities in the form of the MSCI World® Index(1) measured in local currencies, including net reinvested dividends (“MSCI” for regions discussed below) plunged 29.70% in the six months ended December 31, 2008 (down 38.70% for the entire fiscal year). (The MSCI World® Index plunged 40.71% for the entire fiscal year, measured in U.S. dollars.) In currencies, the dollar at first drifted near record lows against the euro. But the tide turned in mid-July and for the six months ended December 31, 2008, the dollar strengthened by 12.10% (4.50% for the entire fiscal year). The dollar also soared 37.80% against the pound for the six months ended December 31, 2008 (37.90% for the entire fiscal year). But the yen advanced as carry trades (essentially short yen positions) were unwound and the dollar fell 14.90% for the six months ended December 31, 2008 (down 19.60% for the entire fiscal year).
Even more dramatic was the price of oil which marched to an all-time high of around $147 per barrel in mid-July, only to lose more than two thirds of that price by December 31, 2008.
The economic statistics remained bleak. By the end of October, the Standard & Poor’s (“S&P”)/Case-Shiller National U.S. Home Price Index(2) of house prices had fallen a record 18% over the year. New home sales were at 1991 levels. Some 45% of existing home sales were distressed.
Payrolls declined in every month of 2008, as the number of people claiming unemployment reached 4.1 million, a 26-year high. Gross domestic product (“GDP”) fell at an annualized rate of 0.50% in the third quarter, and the National Bureau of Economic Research announced that the recession had actually started in December 2007.
Yet these were side-shows to the fireworks display in the financial sector, where major institutions—hanging by a thread through problems rooted in unwise mortgage borrowing, lending and investment—met different fates in September 2008 at the hands of the U.S. government.
The Federal National Mortgage Association (“Fannie Mae”) and the Federal Home Loan Mortgage
Corporation (“Freddie Mac”) were taken into “conservatorship.” Merrill Lynch was acquired by the Bank of America with a wink from the authorities. AIG received an $85 billion loan from a reluctant government, which also took a 79.90% equity stake in AIG. But Lehman Brothers having sought capital, then a buyer, found neither and was left to file for Chapter 11 bankruptcy protection.
The U.S. government was now in the position of choosing winners and losers among financial institutions: none too successfully, for it quickly became obvious that by pointedly leaving Lehman Brothers to go under, a credit crisis had become a credit market collapse. Lending all but seized up.
Policy response was huge but at least initially muddled. A Troubled Asset Relief Plan (“TARP”) would set up a $700 billion fund to buy illiquid mortgage securities from financial institutions. But on November 12, 2008 with half of the money already used to recapitalize banks, Treasury Secretary Paulson announced that the rest of the funds would not be used to buy illiquid mortgage securities after all. This merely renewed the pressure on the holders of such securities like Citigroup, which within two weeks received guarantees from the government against losses and another $20 billion in capital.
Other programs were of more practical use, like support for the commercial paper market and a guarantee facility for money market funds. Arguably the most effective measure was the announced intention to buy vast quantities of agency mortgage-backed securities and debentures. This had the effect of driving down rates on the 30-year mortgage towards 5.00%, a record low. In the meantime, the newly-elected president promised a stimulus package worth approximately $1 trillion. And by year end, the Federal Open Market Committee (“FOMC”) reduced interest rates to a range of between 0% and 0.25%.
2008 ended with much gloom and bad news still to come, but the platform for recovery was perhaps taking shape.
In U.S. fixed-income markets, yields on the 90-day Treasury Bills briefly turned negative in December 2008, while the yield on the ten-year Treasury Note fell below 2.50%, something we had not seen in 50 years. The Barclays Capital U.S. Aggregate Bond Index(3), formerly known as the Lehman Brothers U.S. Aggregate Bond Index, of investment grade bonds returned 4.10% for the six months ended December 31, 2008, (5.20% for the entire fiscal year).
2
MARKET PERSPECTIVE: YEAR ENDED DECEMBER 31, 2008
By contrast, high yield bonds, represented by the Barclays Capital High Yield Bond—2% Issuer Constrained Composite Index(4), formerly known as the Lehman Brothers High Yield Bond—2% Issuer Constrained Composite Index, behaved more like a stock index and returned (25.10)% for the six months ended December 31, 2008 (down 25.90% for the entire fiscal year).
U.S. equities, represented by the S&P 500® Composite Stock Price (“S&P 500®”) Index(5), including dividends, returned (28.50)% for the six months ended December 31, 2008, (down 37.00% for the entire fiscal year), increasingly unimpressed by sharply falling oil prices. Profits for S&P 500® Index companies suffered their fifth straight quarter of decline, led again by the financials sector, although taxpayer money was also potentially committed to save the big three auto makers from bankruptcy. On November 20, 2008, the S&P 500® Index plumbed a level not seen since April 1997, before a December recovery.
In international markets, plainly entering recession, the MSCI Japan® Index(6) slumped 35.90% for the six months ended December 31, 2008, (down 42.60% for the entire fiscal year). The strengthening yen hit exports in an export-dependent economy even as global demand slowed for other reasons. The MSCI Europe ex UK® Index(7) sagged 29.40% for the six months ended December 31, 2008 (down 43.20% for the entire fiscal year), beset by sharply falling economic activity and a European Central Bank in denial that inflation was falling fast. Finally, rates were reduced by an unprecedented 175 basis points (or 1.75%) in two months near the end of the year while governments, one after the other, proposed large stimulus packages. In the UK, the MSCI UK® Index(8) fell 19.40% for the six months ended December 31, 2008 (down 28.50% for the entire fiscal year). The UK had allowed a bigger housing bubble than the United States and deeper personal indebtedness in an economy more dependent on the financial sector. Rates were reduced to 1951 levels as venerable banks ceased to exist as independent entities.
(1) | | The MSCI World® Index is an unmanaged index that measures the performance of over 1,400 securities listed on exchanges in the U.S., Europe, Canada, Australia, New Zealand and the Far East. |
| (2) | | The S&P/Case-Shiller National U.S. Home Price Index tracks the value of single-family housing within the United States. The index is a composite of single-family home price indices for the nine U.S. Census divisions and is calculated quarterly. |
| (3) | | The Barclays Capital U.S. Aggregate Bond Index is an unmanaged index of publicly issued investment grade U.S. Government, mortgage-backed, asset-backed and corporate debt securities. |
| (4) | | The Barclays Capital High Yield Bond—2% Issuer Constrained Composite Index is an unmanaged index that measures the performance of non-investment grade fixed-income securities. |
(5) | | The S&P 500® Index is an unmanaged index that measures the performance of securities of approximately 500 of the largest companies in the United States. |
(6) | | The MSCI Japan® Index is a free float-adjusted market capitalization index that is designed to measure developed market equity performance in Japan. |
(7) | | The MSCI Europe ex UK® Index is a free float-adjusted market capitalization index that is designed to measure developed market equity performance in Europe, excluding the UK. |
(8) | | The MSCI UK® Index is a free float-adjusted market capitalization index that is designed to measure developed market equity performance in the UK. |
All indices are unmanaged and investors cannot invest directly in an index.
Past performance does not guarantee future results. The performance quoted represents past performance. Investment return and principal value of an investment will fluctuate, and shares, when redeemed, may be worth more or less than their original cost. The Portfolios’ performance is subject to change since the period’s end and may be lower or higher than the performance data shown. Please call (800) 992-0180 or log on to www.ingfunds.com to obtain performance data current to the most recent month end.
Market Perspective reflects the views of ING’s Chief Investment Risk Officer only through the end of the period, and is subject to change based on market and other conditions.
3
| | |
| ING VP INDEX PLUS LARGECAP PORTFOLIO | | PORTFOLIO MANAGERS’ REPORT |
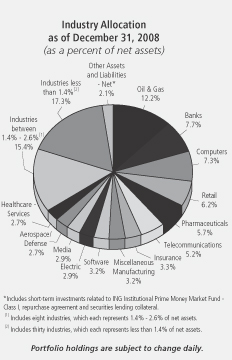
ING VP Index Plus LargeCap Portfolio (the “Portfolio”) seeks to outperform the total return performance of the Standard & Poor’s 500® Composite Stock Price Index(1) (“S&P 500® Index”), while maintaining a market level of risk. The Portfolio is managed by Omar Aguilar, Ph.D. and Vincent Costa, CFA, Portfolio Managers*, of ING Investment Management Co. — the Sub-Adviser.
Performance: For the year ended December 31, 2008, the Portfolio’s Class I shares provided a total return of (37.21)% compared to the S&P 500® Index, which returned (37.00)% for the same period.
Portfolio Specifics: 2008 began with a spike in volatility, but during the rest of the first half of the year, market recognition factors such as earnings trend, long term price momentum, and analyst estimate revision re-asserted themselves and drove performance. Quality and valuation factors such as book to price, forward earnings to price and capital expenditure to depreciation did not work well during the first half of the year. Sectors such as banks and materials benefited from good performance in the market recognition factors. Energy, healthcare, industrials and financials services underperformed during the first half of the year. The market recognition factors in those sectors could not offset the underperformance of the valuation factors.
In the second half of the year, our dynamic factor model began pointing more towards valuation and quality factors, resulting in slight overweights of these factors. This helped performance slightly in the
third quarter, thanks to value factors such as book to price and free cash flow to price, and quality factors such as shares buyback and capital expenditure to depreciation. The shift to value and quality paid off in the fourth quarter, as valuation factors like forward and trailing earnings to price as well as price to free cash flow performed extremely well. Quality factors such as capital expenditures to deprecation also delivered positive excess returns during that period.
Current Strategy and Outlook: Our research builds a structured portfolio of stocks with fundamental characteristics that we believe will translate into a performance advantage over the benchmark. The evaluation includes every stock in the index.
At the close of the reporting period, portfolio overweightings included the consumer discretionary and financials sectors and underweightings included the healthcare and industrials sectors.
| * | | Effective January 13, 2009, Mr. Aguilar was removed as portfolio manager to the Portfolio. |
Portfolio holdings and characteristics are subject to change and may not be representative of current holdings and characteristics. The outlook for this Portfolio may differ from that presented for other ING Funds. Performance for the different classes of shares will vary based on differences in fees associated with each class.
Top Ten Holdings
as of December 31, 2008
(as a percent of net assets)
| | |
ExxonMobil Corp. | | 6.2% |
Hewlett-Packard Co. | | 2.2% |
International Business Machines Corp. | | 2.1% |
Procter & Gamble Co. | | 2.0% |
Wal-Mart Stores, Inc. | | 2.0% |
General Electric Co. | | 1.9% |
AT&T, Inc. | | 1.8% |
Pfizer, Inc. | | 1.8% |
Chevron Corp. | | 1.7% |
ConocoPhillips | | 1.6% |
Portfolio holdings are subject to change daily.
4
| | |
| PORTFOLIO MANAGERS’ REPORT | | ING VP INDEX PLUS LARGECAP PORTFOLIO |
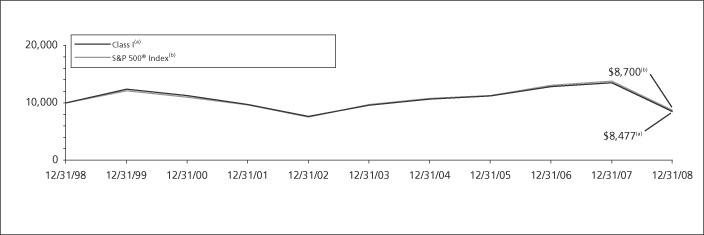
| | | | | | | | | | | | | | | | |
| | | |
| | | Average Annual Total Returns for the Periods Ended December 31, 2008 | | | |
| | | | | 1 Year | | | 5 Year | | | 10 Year | | | Since Inception of Class S July 16, 2001 | | | |
| | | Class I | | (37.21 | )% | | (2.51 | )% | | (1.64 | )% | | — | | | |
| | | Class S | | (37.40 | )% | | (2.77 | )% | | — | | | (2.69 | )% | | |
| | | S&P 500® Index(1) | | (37.00 | )% | | (2.19 | )% | | (1.38 | )% | | (2.07 | )%(2) | | |
Based on a $10,000 initial investment, the graph and table above illustrate the total return of ING VP Index Plus LargeCap Portfolio against the index indicated. An index is unmanaged and has no cash in its portfolio, imposes no sales charges and incurs no operating expenses. An investor cannot invest directly in an index. The Portfolio’s performance is shown without the imposition of any expenses or charges which are, or may be, imposed under your annuity contract or life insurance policy. Total returns would have been lower if such expenses or charges were included.
The performance graph and table do not reflect the deduction of taxes that a shareholder will pay on Portfolio distributions or the redemption of Portfolio shares.
The performance shown may include the effect of fee waivers and/or expense reimbursements by the Investment Adviser and/or other service providers, which have the effect of increasing total return. Had all fees and expenses been considered, the total returns would have been lower.
The performance update illustrates performance for a variable investment option available through a variable annuity contract and/or a variable universal life policy. The performance shown indicates past performance and is not a projection or prediction of future results. Actual investment returns and principal value will fluctuate so that shares and/or units, at redemption, may be worth
more or less than their original cost. For variable annuity contracts, please call (800) 992-0180 to get performance through the most recent month end. For variable universal life policies, please log on to www.ing.com/us to get performance through the most recent month end.
This report contains statements that may be “forward-looking” statements. Actual results may differ materially from those projected in the “forward-looking” statements.
The views expressed in this report reflect those of the portfolio managers, only through the end of the period as stated on the cover. The portfolio managers’ views are subject to change at any time based on market and other conditions.
Portfolio holdings are subject to change daily.
(1) | | The S&P 500® Index is an unmanaged index that measures the performance of securities of approximately 500 of the largest companies in the United States. |
(2) | | Since inception performance for the index is shown from August 1, 2001. |
Effective March 1, 2002, ING Investments, LLC began serving as investment adviser and ING Investment Management Co., the former investment adviser, began serving as sub-adviser to the Portfolio.
5
| | |
| ING VP INDEX PLUS MIDCAP PORTFOLIO | | PORTFOLIO MANAGERS’ REPORT |
ING VP Index Plus MidCap Portfolio (the “Portfolio”) seeks to outperform the total return performance of the Standard & Poor’s MidCap 400 Index(1) (“S&P MidCap 400 Index”), while maintaining a market level of risk. The Portfolio is managed by Omar Aguilar, Ph.D. and Vincent Costa, CFA, Portfolio Managers* of ING Investment Management Co. — the Sub-Adviser.
Performance: For the year ended December 31, 2008, the Portfolio’s Class I shares provided a total return of (37.56)% compared to the S&P MidCap 400 Index, which returned (36.23)% for the same period.
Portfolio Specifics: 2008 began with a spike in volatility, but during the rest of the first half of the year, market recognition factors such as earnings trend, long term price momentum, and analyst estimate revision re-asserted themselves and drove performance. Quality and valuation factors such as book to price, forward earnings to price and capital expenditure to depreciation did not work well during the first half of the year. Sectors such as utilities and materials benefited from good performance in the market recognition factors. Financials and industrials services sectors underperformed during the first half of the year. The market recognition factors in those sectors could not offset the underperformance of the valuation factors.
In the second half of the year our dynamic factor model began pointing more towards valuation and quality factors, resulting in a slight overweight in these factors. This helped performance slightly in
the third quarter, thanks to value factors such as book to price and free cash flow to price, and quality factors such as shares buyback and capital expenditure to depreciation.
The shift to value and quality paid off in the fourth quarter as quality factors such as capital expenditures to deprecation performed extremely well. Additionally, valuation factors such as price to free cash flow delivered positive excess returns in December. Finally, market recognition factors such as analyst estimate revisions and earnings trends worked well early in the quarter but faded toward year-end.
The top detractors during the year were overweight positions in BorgWarner, Inc., Crane Co. and Life Technologies Corp. The top contributors were underweight positions in Covance, Inc., Lamar Advertising Co. and Pride International, Inc.
Current Strategy and Outlook: Our research builds a structured portfolio of stocks with fundamental characteristics that we believe will translate into a performance advantage over the benchmark. The evaluation includes every stock in the index.
At the close of the reporting period, portfolio overweightings included the industrials and energy sectors and underweightings included the utilities sector.
| * | | Effective January 13, 2009, Mr. Aguilar was removed as portfolio manager to the Portfolio. |
Portfolio holdings and characteristics are subject to change and may not be representative of current holdings and characteristics. The outlook for this Portfolio may differ from that presented for other ING Funds. Performance for the different classes of shares will vary based on differences in fees associated with each class.
Top Ten Holdings*
as of December 31, 2008
(as a percent of net assets)
| | |
Everest Re Group Ltd. | | 1.1% |
Endo Pharmaceuticals Holdings, Inc. | | 1.0% |
Dollar Tree, Inc. | | 1.0% |
Reinsurance Group of America, Inc. | | 0.9% |
Ross Stores, Inc. | | 0.9% |
New York Community Bancorp., Inc. | | 0.9% |
HCC Insurance Holdings, Inc. | | 0.8% |
Pharmaceutical Product Development, Inc. | | 0.8% |
Northeast Utilities | | 0.8% |
Cullen/Frost Bankers, Inc. | | 0.8% |
| | * | Excludes short-term investments related to ING Institutional Prime Money Market Fund — Class I and securities lending collateral. |
Portfolio holdings are subject to change daily.
6
| | |
| PORTFOLIO MANAGERS’ REPORT | | ING VP INDEX PLUS MIDCAP PORTFOLIO |
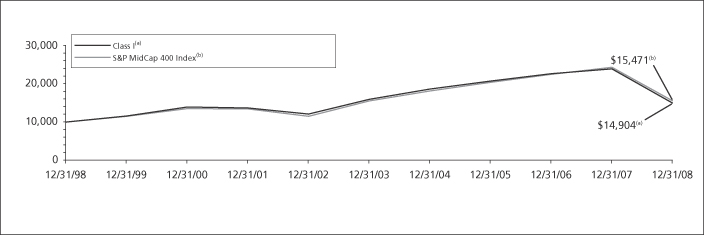
| | | | | | | | | | | | | | | | |
| | | |
| | | Average Annual Total Returns for the Periods Ended December 31, 2008 | | | |
| | | | | 1 Year | | | 5 Year | | | 10 Year | | | Since
Inception
of Class S
July 16,
2001 | | | |
| | | Class I | | (37.56 | )% | | (1.35 | )% | | 4.07 | % | | — | | | |
| | | Class S | | (37.73 | )% | | (1.60 | )% | | — | | | 1.02 | % | | |
| | | S&P MidCap 400 Index(1) | | (36.23 | )% | | (0.08 | )% | | 4.46 | % | | 1.95 | %(2) | | |
Based on a $10,000 initial investment, the graph and table above illustrate the total return of ING VP Index Plus MidCap Portfolio against the index indicated. An index is unmanaged and has no cash in its portfolio, imposes no sales charges and incurs no operating expenses. An investor cannot invest directly in an index. The Portfolio’s performance is shown without the imposition of any expenses or charges which are, or may be, imposed under your annuity contract or life insurance policy. Total returns would have been lower if such expenses or charges were included.
The performance graph and table do not reflect the deduction of taxes that a shareholder will pay on Portfolio distributions or the redemption of Portfolio shares.
The performance shown may include the effect of fee waivers and/or expense reimbursements by the Investment Adviser and/or other service providers, which have the effect of increasing total return. Had all fees and expenses been considered, the total returns would have been lower.
The performance update illustrates performance for a variable investment option available through a variable annuity contract and/or a variable universal life policy. The performance shown indicates past performance and is not a projection or prediction of future results. Actual investment returns and principal value will fluctuate so that shares and/or units, at redemption, may be worth
more or less than their original cost. For variable annuity contracts, please call (800) 992-0180 to get performance through the most recent month end. For variable universal life policies, please log on to www.ing.com/us to get performance through the most recent month end.
This report contains statements that may be “forward-looking” statements. Actual results may differ materially from those projected in the “forward-looking” statements.
The views expressed in this report reflect those of the portfolio managers, only through the end of the period as stated on the cover. The portfolio managers’ views are subject to change at any time based on market and other conditions.
Portfolio holdings are subject to change daily.
(1) | | The S&P MidCap 400 Index is an unmanaged index that measures the performance of the mid-size company segment of the U.S. market. |
(2) | | Since inception performance for the index is shown from August 1, 2001. |
Effective March 1, 2002, ING Investments, LLC began serving as investment adviser and ING Investment Management Co., the former investment adviser, began serving as sub-adviser to the Portfolio.
7
| | |
| ING VP INDEX PLUS SMALLCAP PORTFOLIO | | PORTFOLIO MANAGERS’ REPORT |
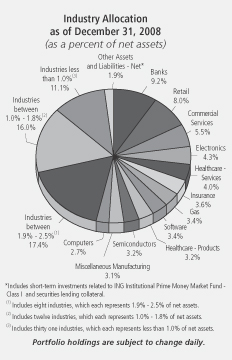
ING VP Index Plus SmallCap Portfolio (the “Portfolio”) seeks to outperform the total return performance of the Standard & Poor’s SmallCap 600 Index(1) (“S&P SmallCap 600 Index”), while maintaining a market level of risk. The Portfolio is managed by Omar Aguilar, Ph.D. and Vincent Costa, CFA, Portfolio Managers* of ING Investment Management Co. — the Sub-Adviser.
Performance: For the year ended December 31, 2008, the Portfolio’s Class I shares provided a total return of (33.58)% compared to the S&P SmallCap 600 Index, which returned (31.07)% for the same period.
Portfolio Review: Overall, underweight positions in the healthcare and consumer staples sectors hurt returns. These losses were partially offset by an overweight position in the financials sector and an underweight position in the materials sector. Security selection detracted from performance in the financials, industrials and energy sectors. These losses were offset by security selection in the materials and consumer discretionary sectors.
2008 began with a spike in volatility, but during the rest of the first half of the year, market recognition factors such as earnings trend, long term price momentum, and analyst estimate revision re-asserted themselves and drove performance. Quality and valuation factors such as book to price, forward earnings to price and capital expenditure to depreciation did not work well during the first half of the year. Sectors such as financials and information technology and consumer staples were hurt by the underperformance of valuation and quality factors. The industrials and materials sectors benefited from the good performance of the market recognition factors.
In the second half of the year, our dynamic factor model began pointing more towards valuation and quality, resulting in a slight overweight of these factors. This helped performance slightly in the third quarter, thanks to value factors such as book to price and free cash flow to price, and quality factors like shares buyback and capital expenditure to depreciation. The shift paid off in the fourth quarter as quality factors like capital expenditures to deprecation performed well. Valuation factors such as price to free cash flow helped returns in December. Market recognition factors such as analyst estimate revisions and earnings trends worked well early in the quarter but faded toward year-end.
The top detractors during the year were overweight positions in Bowne and Co., Inc., Atwood Oceanics, Inc. and Stone Energy Corp. The top contributors were underweight positions in THQ, Inc., Sunrise Senior Living, Inc., and Dril-Quip, Inc.
Current Strategy and Outlook: Our research builds a structured portfolio of stocks with fundamental characteristics that we believe will translate into a performance advantage over the benchmark. The evaluation includes every stock in the index.
At the close of the reporting period, slight portfolio overweightings included the financials sector and underweightings included the healthcare sector.
| * | | Effective January 13, 2009, Mr. Aguilar was removed as portfolio manager to the Portfolio. |
Portfolio holdings and characteristics are subject to change and may not be representative of current holdings and characteristics. The outlook for this Portfolio may differ from that presented for other ING Funds. Performance for the different classes of shares will vary based on differences in fees associated with each class.
Top Ten Holdings*
as of December 31, 2008
(as a percent of net assets)
| | |
Atmos Energy Corp. | | 0.9% |
Watson Wyatt Worldwide, Inc. | | 0.9% |
Panera Bread Co. | | 0.8% |
EMCOR Group, Inc. | | 0.7% |
Owens & Minor, Inc. | | 0.7% |
Acuity Brands, Inc. | | 0.7% |
AMERIGROUP Corp. | | 0.7% |
CACI International, Inc. | | 0.7% |
Regal-Beloit Corp. | | 0.7% |
Rock-Tenn Co. | | 0.7% |
| | * | Excludes short-term investments related to ING Institutional Prime Money Market Fund—Class I and securities lending collateral. | |
Portfolio holdings are subject to change daily.
8
| | |
| PORTFOLIO MANAGERS’ REPORT | | ING VP INDEX PLUS SMALLCAP PORTFOLIO |
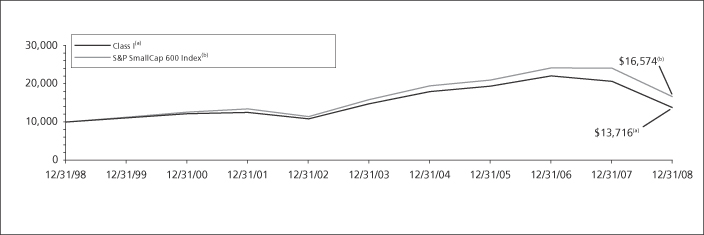
| | | | | | | | | | | | | | | | |
| | | |
| | | Average Annual Total Returns for the Periods Ended December 31, 2008 | | | |
| | | | | 1 Year | | | 5 Year | | | 10 Year | | | Since Inception of Class S July 16, 2001 | | | |
| | | Class I | | (33.58 | )% | | (1.41 | )% | | 3.21 | % | | — | | | |
| | | Class S | | (33.73 | )% | | (1.67 | )% | | — | | | 1.37 | % | | |
| | | S&P SmallCap 600 Index(1) | | (31.07 | )% | | 0.88 | % | | 5.18 | % | | 3.19 | %(2) | | |
Based on a $10,000 initial investment, the graph and table above illustrate the total return of ING VP Index Plus SmallCap Portfolio against the index indicated. An index is unmanaged and has no cash in its portfolio, imposes no sales charges and incurs no operating expenses. An investor cannot invest directly in an index. The Portfolio’s performance is shown without the imposition of any expenses or charges which are, or may be, imposed under your annuity contract or life insurance policy. Total returns would have been lower if such expenses or charges were included.
The performance graph and table do not reflect the deduction of taxes that a shareholder will pay on Portfolio distributions or the redemption of Portfolio shares.
The performance shown may include the effect of fee waivers and/or expense reimbursements by the Investment Adviser and/or other service providers, which have the effect of increasing total return. Had all fees and expenses been considered, the total returns would have been lower.
The performance update illustrates performance for a variable investment option available through a variable annuity contract and/or a variable universal life policy. The performance shown indicates past performance and is not a projection or prediction of future results. Actual investment returns and principal value will fluctuate so that shares and/or units, at redemption, may be worth
more or less than their original cost. For variable annuity contracts, please call (800) 992-0180 to get performance through the most recent month end. For variable universal life policies, please log on to www.ing.com/us to get performance through the most recent month end.
This report contains statements that may be “forward-looking” statements. Actual results may differ materially from those projected in the “forward-looking” statements.
The views expressed in this report reflect those of the portfolio managers, only through the end of the period as stated on the cover. The portfolio managers’ views are subject to change at any time based on market and other conditions.
Portfolio holdings are subject to change daily.
(1) | | The S&P SmallCap 600 Index is an unmanaged index used to measure stock market performance composed of companies with a weighted average market value of approximately $630 million. |
(2) | | Since inception performance for the index is shown from August 1, 2001. |
Effective March 1, 2002, ING Investments, LLC began serving as investment adviser and ING Investment Management Co., the former investment adviser, began serving as sub-adviser to the Portfolio.
9
SHAREHOLDER EXPENSE EXAMPLES (UNAUDITED)
As a shareholder of a Portfolio, you incur two types of costs: (1) transaction costs, including redemption fees and exchange fees; and (2) ongoing costs, including management fees, distribution and/or service (12b-1) fees, and other Portfolio expenses. These Examples are intended to help you understand your ongoing costs (in dollars) of investing in a Portfolio and to compare these costs with the ongoing costs of investing in other mutual funds.
The Examples are based on an investment of $1,000 invested at the beginning of the period and held for the entire period from July 1, 2008 to December 31, 2008. The Portfolios’ expenses are shown without the imposition of any charges which are, or may be, imposed under your annuity contract. Expenses would have been higher if such charges were included.
Actual Expenses
The first section of the table shown, “Actual Portfolio Return,” provides information about actual account values and actual expenses. You may use the information in this section, together with the amount you invested, to estimate the expenses that you paid over the period. Simply divide your account value by $1,000 (for example, an $8,600 account value divided by $1,000 = 8.6), then multiply the result by the number in the first section under the heading entitled “Expenses Paid During the Period” to estimate the expenses you paid on your account during this period.
Hypothetical Example for Comparison Purposes
The second section of the table shown, “Hypothetical (5% return before expenses),” provides information about hypothetical account values and hypothetical expenses based on the Portfolio’s actual expense ratio and an assumed rate of return of 5% per year before expenses, which is not the Portfolio’s actual return. The hypothetical account values and expenses may not be used to estimate the actual ending account balance or expenses you paid for the period. You may use this information to compare the ongoing costs of investing in the Portfolio and other mutual funds. To do so, compare this 5% hypothetical example with the 5% hypothetical examples that appear in the shareholder reports of the other mutual funds.
Please note that the expenses shown in the table are meant to highlight your ongoing costs only and do not reflect any transactional costs, such as redemption fees or exchange fees. Therefore, the hypothetical lines of the table are useful in comparing ongoing costs only, and will not help you determine the relative total costs of owning different mutual funds. In addition, if these transactional costs were included, your costs would have been higher.
| | | | | | | | | | | | | | | | | | | | | | | | |
| | | Actual Portfolio Return | | Hypothetical (5% return before expenses) |
| | | Beginning
Account
Value
July 1, 2008 | | Ending
Account Value
December 31, 2008 | | Annualized
Expense
Ratio | | | Expenses Paid
During the
Period Ended
December 31, 2008* | | Beginning
Account
Value
July 1, 2008 | | Ending
Account Value
December 31, 2008 | | Annualized
Expense
Ratio | | | Expenses Paid
During the
Period Ended
December 31, 2008* |
ING VP Index Plus LargeCap Portfolio | | | | | | | | | | | | | | | | |
Class I | | $ | 1,000.00 | | $ | 729.10 | | 0.47 | % | | $ | 2.04 | | $ | 1,000.00 | | $ | 1,022.77 | | 0.47 | % | | $ | 2.39 |
Class S | | | 1,000.00 | | | 727.70 | | 0.72 | | | | 3.13 | | | 1,000.00 | | | 1,021.52 | | 0.72 | | | | 3.66 |
ING VP Index Plus MidCap Portfolio | | | | | | | | | | | | | | | | |
Class I | | $ | 1,000.00 | | $ | 662.70 | | 0.52 | % | | $ | 2.17 | | $ | 1,000.00 | | $ | 1,022.52 | | 0.52 | % | | $ | 2.64 |
Class S | | | 1,000.00 | | | 661.70 | | 0.77 | | | | 3.22 | | | 1,000.00 | | | 1,021.27 | | 0.77 | | | | 3.91 |
ING VP Index Plus SmallCap Portfolio | | | | | | | | | | | | | | | | |
Class I | | $ | 1,000.00 | | $ | 732.30 | | 0.52 | % | | $ | 2.26 | | $ | 1,000.00 | | $ | 1,022.52 | | 0.52 | % | | $ | 2.64 |
Class S | | | 1,000.00 | | | 731.10 | | 0.77 | | | | 3.35 | | | 1,000.00 | | | 1,021.27 | | 0.77 | | | | 3.91 |
| * | | Expenses are equal to each Portfolio’s respective annualized expense ratios multiplied by the average account value over the period, multiplied by 184/366 to reflect the most recent fiscal half-year. |
10
REPORT OF INDEPENDENT REGISTERED PUBLIC ACCOUNTING FIRM
The Shareholders and Board of Directors
ING Variable Portfolios, Inc.
We have audited the accompanying statements of assets and liabilities, including the portfolios of investments, of ING VP Index Plus LargeCap Portfolio, ING VP Index Plus MidCap Portfolio, and ING VP Index Plus SmallCap Portfolio, each a series of ING Variable Portfolios, Inc., as of December 31, 2008, and the related statements of operations for the year then ended, the statements of changes in net assets for each of the years in the two-year period then ended, and the financial highlights for each of the years in the five-year period then ended. These financial statements and financial highlights are the responsibility of management. Our responsibility is to express an opinion on these financial statements and financial highlights based on our audits.
We conducted our audits in accordance with the standards of the Public Company Accounting Oversight Board (United States). Those standards require that we plan and perform the audit to obtain reasonable assurance about whether the financial statements and financial highlights are free of material misstatement. An audit includes examining, on a test basis, evidence supporting the amounts and disclosures in the financial statements. Our procedures included confirmation of securities owned as of December 31, 2008, by correspondence with the custodian and brokers, or by other appropriate auditing procedures when replies from brokers were not received. An audit also includes assessing the accounting principles used and significant estimates made by management, as well as evaluating the overall financial statement presentation. We believe that our audits provide a reasonable basis for our opinion.
In our opinion, the financial statements and financial highlights referred to above present fairly, in all material respects, the financial position of the aforementioned portfolios as of December 31, 2008, and the results of their operations, the changes in their net assets, and the financial highlights for the periods specified in the first paragraph above, in conformity with U.S. generally accepted accounting principles.

Boston, Massachusetts
February 23, 2009
11
STATEMENTS OF ASSETS AND LIABILITIES ASOF DECEMBER 31, 2008
| | | | | | | | | | | | |
| | | ING VP Index Plus LargeCap Portfolio | | | ING VP Index Plus MidCap Portfolio | | | ING VP Index Plus SmallCap Portfolio | |
ASSETS: | | | | | | | | | | | | |
Investments in securities at value+* | | $ | 847,751,701 | | | $ | 554,642,859 | | | $ | 292,012,109 | |
Short-term investments** | | | 11,003,171 | | | | 36,237,748 | | | | 33,694,872 | |
Short-term investments in affiliates*** | | | 12,508,000 | | | | 7,304,000 | | | | 6,613,000 | |
Short-term investments at amortized cost | | | 4,966,000 | | | | 3,787,000 | | | | — | |
Cash | | | 881 | | | | 682 | | | | 51,696 | |
Cash collateral for futures | | | 2,227,500 | | | | 1,650,000 | | | | 918,500 | |
Receivables: | | | | | | | | | | | | |
Investment securities sold | | | 5,584,793 | | | | 7,799,786 | | | | 704,642 | |
Fund shares sold | | | 122,542 | | | | 1,613,812 | | | | 31,124 | |
Dividends and interest | | | 1,872,213 | | | | 818,726 | | | | 1,008,608 | |
Variation margin | | | 267,750 | | | | 318,960 | | | | 185,900 | |
Prepaid expenses | | | 65,703 | | | | 39,540 | | | | 22,167 | |
| | | | | | | | | | | | |
Total assets | | | 886,370,254 | | | | 614,213,113 | | | | 335,242,618 | |
| | | | | | | | | | | | |
LIABILITIES: | | | | | | | | | | | | |
Payable for investment securities purchased | | | 6,910,771 | | | | 4,420,944 | | | | 2,993,926 | |
Payable for fund shares redeemed | | | 1,795,797 | | | | 520,789 | | | | 329,502 | |
Payable upon receipt of securities loaned | | | 11,324,932 | | | | 37,056,930 | | | | 34,105,517 | |
Payable to affiliates | | | 324,953 | | | | 231,838 | | | | 126,598 | |
Payable for directors fees | | | 59,682 | | | | 36,608 | | | | 23,243 | |
Other accrued expenses and liabilities | | | 275,824 | | | | 135,338 | | | | 99,689 | |
| | | | | | | | | | | | |
Total liabilities | | | 20,691,959 | | | | 42,402,447 | | | | 37,678,475 | |
| | | | | | | | | | | | |
NET ASSETS | | $ | 865,678,295 | | | $ | 571,810,666 | | | $ | 297,564,143 | |
| | | | | | | | | | | | |
NET ASSETS WERE COMPRISED OF: | | | | | | | | | | | | |
Paid-in capital | | $ | 1,376,045,578 | | | $ | 952,864,088 | | | $ | 520,209,849 | |
Undistributed net investment income | | | 26,695,514 | | | | 9,893,675 | | | | 5,073,760 | |
Accumulated net realized loss on investments and futures | | | (372,372,262 | ) | | | (178,191,742 | ) | | | (122,334,431 | ) |
Net unrealized depreciation on investments and futures | | | (164,690,535 | ) | | | (212,755,355 | ) | | | (105,385,035 | ) |
| | | | | | | | | | | | |
NET ASSETS | | $ | 865,678,295 | | | $ | 571,810,666 | | | $ | 297,564,143 | |
| | | | | | | | | | | | |
| | | | | | | | | | | | |
+ Including securities loaned at value | | $ | 11,316,930 | | | $ | 36,870,421 | | | $ | 33,837,508 | |
* Cost of investments in securities | | $ | 1,012,396,432 | | | $ | 767,306,184 | | | $ | 397,347,208 | |
** Cost of short-term investments | | $ | 11,324,932 | | | $ | 37,056,930 | | | $ | 34,105,517 | |
*** Cost of short-term investments in affiliates | | $ | 12,508,000 | | | $ | 7,304,000 | | | $ | 6,613,000 | |
| | | | | | | | | | | | |
Class I: | | | | | | | | | | | | |
Net assets | | $ | 680,917,849 | | | $ | 447,502,716 | | | $ | 201,977,645 | |
Shares authorized | | | 200,000,000 | | | | 100,000,000 | | | | 100,000,000 | |
Par value | | $ | 0.001 | | | $ | 0.001 | | | $ | 0.001 | |
Shares outstanding | | | 65,245,444 | | | | 45,031,421 | | | | 21,466,120 | |
Net asset value and redemption price per share | | $ | 10.44 | | | $ | 9.94 | | | $ | 9.41 | |
Class S: | | | | | | | | | | | | |
Net assets | | $ | 184,760,446 | | | $ | 124,307,950 | | | $ | 95,586,498 | |
Shares authorized | | | 100,000,000 | | | | 100,000,000 | | | | 100,000,000 | |
Par value | | $ | 0.001 | | | $ | 0.001 | | | $ | 0.001 | |
Shares outstanding | | | 17,865,969 | | | | 12,658,276 | | | | 10,273,478 | |
Net asset value and redemption price per share | | $ | 10.34 | | | $ | 9.82 | | | $ | 9.30 | |
See Accompanying Notes to Financial Statements
12
STATEMENTS OF OPERATIONS FORTHE YEAR ENDED DECEMBER 31, 2008
| | | | | | | | | | | | |
| | | ING VP Index Plus LargeCap Portfolio | | | ING VP Index Plus MidCap Portfolio | | | ING VP Index Plus SmallCap Portfolio | |
INVESTMENT INCOME: | | | | | | | | | | | | |
Dividends, net of foreign taxes withheld*(1) | | $ | 34,437,761 | | | $ | 14,430,250 | | | $ | 6,869,619 | |
Interest | | | 148,898 | | | | 93,059 | | | | 71,872 | |
Securities lending income, net | | | 555,729 | | | | 1,470,321 | | | | 1,657,506 | |
| | | | | | | | | | | | |
Total investment income | | | 35,142,388 | | | | 15,993,630 | | | | 8,598,997 | |
| | | | | | | | | | | | |
EXPENSES: | | | | | | | | | | | | |
Investment management fees | | | 5,638,358 | | | | 3,847,915 | | | | 2,113,383 | |
Distribution and service fees — Class S | | | 682,509 | | | | 476,697 | | | | 356,478 | |
Transfer agent fees | | | 1,097 | | | | 970 | | | | 728 | |
Administrative service fees | | | 886,013 | | | | 529,075 | | | | 290,583 | |
Shareholder reporting expense | | | 186,313 | | | | 130,676 | | | | 62,658 | |
Registration fees | | | 1,884 | | | | 1,083 | | | | 705 | |
Professional fees | | | 337,934 | | | | 174,802 | | | | 101,328 | |
Custody and accounting expense | | | 206,997 | | | | 141,658 | | | | 89,935 | |
Directors fees | | | 198,408 | | | | 114,323 | | | | 64,500 | |
Miscellaneous expense | | | 134,179 | | | | 67,399 | | | | 41,109 | |
Interest expense | | | 12,192 | | | | 6,047 | | | | 6,734 | |
| | | | | | | | | | | | |
Total expenses | | | 8,285,884 | | | | 5,490,645 | | | | 3,128,141 | |
Net waived and reimbursed fees | | | (7,199 | ) | | | (5,474 | ) | | | (4,496 | ) |
| | | | | | | | | | | | |
Net expenses | | | 8,278,685 | | | | 5,485,171 | | | | 3,123,645 | |
| | | | | | | | | | | | |
Net investment income | | | 26,863,703 | | | | 10,508,459 | | | | 5,475,352 | |
| | | | | | | | | | | | |
REALIZED AND UNREALIZED GAIN (LOSS) ON INVESTMENTS AND FUTURES: | | | | | | | | | | | | |
Net realized loss on: | | | | | | | | | | | | |
Investments | | | (352,780,753 | ) | | | (162,936,927 | ) | | | (108,604,711 | ) |
Futures | | | (6,474,222 | ) | | | (8,642,922 | ) | | | (5,794,213 | ) |
| | | | | | | | | | | | |
Net realized loss on investments and futures | | | (359,254,975 | ) | | | (171,579,849 | ) | | | (114,398,924 | ) |
| | | | | | | | | | | | |
Net change in unrealized appreciation or depreciation on: | | | | | | | | | | | | |
Investments | | | (298,706,452 | ) | | | (230,434,314 | ) | | | (74,054,513 | ) |
Futures | | | 430,571 | | | | 798,815 | | | | 237,203 | |
| | | | | | | | | | | | |
Net change in unrealized appreciation or depreciation on investments and futures | | | (298,275,881 | ) | | | (229,635,499 | ) | | | (73,817,310 | ) |
| | | | | | | | | | | | |
Net realized and unrealized loss on investments and futures | | | (657,530,856 | ) | | | (401,215,348 | ) | | | (188,216,234 | ) |
| | | | | | | | | | | | |
Decrease in net assets resulting from operations | | $ | (630,667,153 | ) | | $ | (390,706,889 | ) | | $ | (182,740,882 | ) |
| | | | | | | | | | | | |
| | | | | | | | | | | | |
* Foreign taxes withheld | | $ | — | | | $ | — | | | $ | 749 | |
(1) Dividends from affiliates | | $ | 384,365 | | | $ | 202,047 | | | $ | 152,880 | |
See Accompanying Notes to Financial Statements
13
STATEMENTS OF CHANGES IN NET ASSETS
| | | | | | | | | | | | | | | | |
| | | ING VP Index Plus LargeCap Portfolio | | | ING VP Index Plus MidCap Portfolio | |
| | | Year Ended December 31, 2008 | | | Year Ended December 31, 2007 | | | Year Ended December 31, 2008 | | | Year Ended December 31, 2007 | |
FROM OPERATIONS: | | | | | | | | | | | | | | | | |
Net investment income | | $ | 26,863,703 | | | $ | 42,196,532 | | | $ | 10,508,459 | | | $ | 15,265,193 | |
Net realized gain (loss) on investments and futures | | | (359,254,975 | ) | | | 210,388,131 | | | | (171,579,849 | ) | | | 139,387,553 | |
Net change in unrealized appreciation or depreciation on investments and futures | | | (298,275,881 | ) | | | (121,993,435 | ) | | | (229,635,499 | ) | | | (79,655,961 | ) |
| | | | | | | | | | | | | | | | |
Increase (decrease) in net assets resulting from operations | | | (630,667,153 | ) | | | 130,591,228 | | | | (390,706,889 | ) | | | 74,996,785 | |
| | | | | | | | | | | | | | | | |
FROM DISTRIBUTIONS TO SHAREHOLDERS: | | | | | | | | | | | | | | | | |
Net investment income: | | | | | | | | | | | | | | | | |
Class I | | | (36,524,688 | ) | | | (29,658,100 | ) | | | (11,952,630 | ) | | | (9,245,456 | ) |
Class S | | | (5,640,026 | ) | | | (1,795,960 | ) | | | (2,200,936 | ) | | | (1,137,434 | ) |
Net realized gains: | | | | | | | | | | | | | | | | |
Class I | | | (128,358,189 | ) | | | — | | | | (112,082,941 | ) | | | (88,976,015 | ) |
Class S | | | (21,899,099 | ) | | | — | | | | (26,411,236 | ) | | | (16,919,188 | ) |
| | | | | | | | | | | | | | | | |
Total distributions | | | (192,422,002 | ) | | | (31,454,060 | ) | | | (152,647,743 | ) | | | (116,278,093 | ) |
| | | | | | | | | | | | | | | | |
FROM CAPITAL SHARE TRANSACTIONS: | | | | | | | | | | | | | | | | |
Net proceeds from sale of shares | | | 365,179,995 | | | | 584,837,947 | | | | 114,639,139 | | | | 250,536,595 | |
Reinvestment of distributions | | | 192,422,002 | | | | 31,454,060 | | | | 152,647,743 | | | | 116,278,093 | |
| | | | | | | | | | | | | | | | |
| | | 557,601,997 | | | | 616,292,007 | | | | 267,286,882 | | | | 366,814,688 | |
Cost of shares redeemed | | | (1,512,259,207 | ) | | | (633,637,563 | ) | | | (575,777,856 | ) | | | (277,567,728 | ) |
| | | | | | | | | | | | | | | | |
Net increase (decrease) in net assets resulting from capital share transactions | | | (954,657,210 | ) | | | (17,345,556 | ) | | | (308,490,974 | ) | | | 89,246,960 | |
| | | | | | | | | | | | | | | | |
Net increase (decrease) in net assets | | | (1,777,746,365 | ) | | | 81,791,612 | | | | (851,845,606 | ) | | | 47,965,652 | |
| | | | | | | | | | | | | | | | |
NET ASSETS: | | | | | | | | | | | | | | | | |
Beginning of year | | | 2,643,424,660 | | | | 2,561,633,048 | | | | 1,423,656,272 | | | | 1,375,690,620 | |
| | | | | | | | | | | | | | | | |
End of year | | $ | 865,678,295 | | | $ | 2,643,424,660 | | | $ | 571,810,666 | | | $ | 1,423,656,272 | |
| | | | | | | | | | | | | | | | |
Undistributed net investment income at end of year | | $ | 26,695,514 | | | $ | 42,151,648 | | | $ | 9,893,675 | | | $ | 14,290,606 | |
| | | | | | | | | | | | | | | | |
See Accompanying Notes to Financial Statements
14
STATEMENTS OF CHANGES IN NET ASSETS
| | | | | | | | |
| | | ING VP Index Plus SmallCap Portfolio | |
| | | Year Ended December 31, 2008 | | | Year Ended December 31, 2007 | |
FROM OPERATIONS: | | | | | | | | |
Net investment income | | $ | 5,475,352 | | | $ | 5,690,689 | |
Net realized gain (loss) on investments and futures | | | (114,398,924 | ) | | | 39,097,941 | |
Net change in unrealized appreciation or depreciation on investments and futures | | | (73,817,310 | ) | | | (102,285,972 | ) |
| | | | | | | | |
Decrease in net assets resulting from operations | | | (182,740,882 | ) | | | (57,497,342 | ) |
| | | | | | | | |
FROM DISTRIBUTIONS TO SHAREHOLDERS: | | | | | | | | |
Net investment income: | | | | | | | | |
Class I | | | (4,491,258 | ) | | | (3,166,038 | ) |
Class S | | | (934,827 | ) | | | (242,440 | ) |
Net realized gains: | | | | | | | | |
Class I | | | (30,586,826 | ) | | | (70,161,316 | ) |
Class S | | | (9,757,114 | ) | | | (19,463,532 | ) |
| | | | | | | | |
Total distributions | | | (45,770,025 | ) | | | (93,033,326 | ) |
| | | | | | | | |
FROM CAPITAL SHARE TRANSACTIONS: | | | | | | | | |
Net proceeds from sale of shares | | | 102,067,744 | | | | 207,309,140 | |
Reinvestment of distributions | | | 45,770,025 | | | | 93,033,326 | |
| | | | | | | | |
| | | 147,837,769 | | | | 300,342,466 | |
Cost of shares redeemed | | | (442,222,983 | ) | | | (278,712,565 | ) |
| | | | | | | | |
Net increase (decrease) in net assets resulting from capital share transactions | | | (294,385,214 | ) | | | 21,629,901 | |
| | | | | | | | |
Net decrease in net assets | | | (522,896,121 | ) | | | (128,900,767 | ) |
| | | | | | | | |
NET ASSETS: | | | | | | | | |
Beginning of year | | | 820,460,264 | | | | 949,361,031 | |
| | | | | | | | |
End of year | | $ | 297,564,143 | | | $ | 820,460,264 | |
| | | | | | | | |
Undistributed net investment income at end of year | | $ | 5,073,760 | | | $ | 5,454,465 | |
| | | | | | | | |
See Accompanying Notes to Financial Statements
15
FINANCIAL HIGHLIGHTS
Selected data for a share of beneficial interest outstanding throughout each year or period.
| | | | | | | | | | | | | | | | | | | | | | | | | | | | | | | | | | | | | | | |
| | | | | Income (loss)
from
investment
operations | | | | | | Less distributions | | | | | | | | | Ratios to average net assets | | | Supplemental
Data |
| | | | | | | | | | | | | | | | | | | | | | | | | | | | | | | | | | | | | | | |
| | | Net asset value, beginning of year or period | | Net investment income (loss) | | | Net realized and unrealized gain (loss) | | | Total from investment operations | | | From net investment income | | From net realized gains | | From return of capital | | Total distributions | | Net asset value, end of year or period | | Total Return(1) | | | Expenses before reductions/ additions(2) | | Expenses net of fee waivers and/or recoupments, if any | | | Expenses net of all reductions/ additions | | | Net investment income (loss) net of all reductions/additions | | | Net assets, end of year or period | | Portfolio turnover rate |
| | | | | | | | | | | | | | | | | | | | | | | | | | | | | | | | | | | | | | | |
Year or period ended | | ($) | | ($) | | | ($) | | | ($) | | | ($) | | ($) | | ($) | | ($) | | ($) | | (%) | | | (%) | | (%) | | | (%) | | | (%) | | | ($000’s) | | (%) |
ING VP Index Plus LargeCap Portfolio | | | | | | | | | | | | | | | | | | | | | | | | | | | | | | | | | | | | | | | |
Class I | | | | | | | | | | | | | | | | | | | | | | | | | | | | | | | | | | | | | | | |
12-31-08 | | 18.13 | | 0.25 | * | | (6.57 | ) | | (6.32 | ) | | 0.30 | | 1.07 | | — | | 1.37 | | 10.44 | | (37.21 | ) | | 0.47 | | 0.47 | † | | 0.47 | † | | 1.70 | † | | 680,918 | | 175 |
12-31-07 | | 17.48 | | 0.29 | * | | 0.58 | | | 0.87 | | | 0.22 | | — | | — | | 0.22 | | 18.13 | | 5.03 | †† | | 0.44 | | 0.44 | † | | 0.44 | † | | 1.62 | † | | 2,323,707 | | 121 |
12-31-06 | | 15.42 | | 0.23 | * | | 2.00 | | | 2.23 | | | 0.17 | | — | | — | | 0.17 | | 17.48 | | 14.58 | | | 0.43 | | 0.43 | † | | 0.43 | † | | 1.46 | † | | 2,352,193 | | 128 |
12-31-05 | | 14.82 | | 0.19 | * | | 0.60 | | | 0.79 | | | 0.19 | | — | | — | | 0.19 | | 15.42 | | 5.38 | | | 0.45 | | 0.45 | | | 0.45 | | | 1.30 | | | 1,389,139 | | 89 |
12-31-04 | | 13.54 | | 0.22 | | | 1.20 | | | 1.42 | | | 0.14 | | — | | — | | 0.14 | | 14.82 | | 10.58 | | | 0.44 | | 0.44 | | | 0.44 | | | 1.55 | | | 1,511,946 | | 70 |
Class S | | | | | | | | | | | | | | | | | | | | | | | | | | | | | | | | | | | | | | | |
12-31-08 | | 17.99 | | 0.21 | * | | (6.51 | ) | | (6.30 | ) | | 0.28 | | 1.07 | | — | | 1.35 | | 10.34 | | (37.40 | ) | | 0.72 | | 0.72 | † | | 0.72 | † | | 1.53 | † | | 184,760 | | 175 |
12-31-07 | | 17.32 | | 0.25 | * | | 0.57 | | | 0.82 | | | 0.15 | | — | | — | | 0.15 | | 17.99 | | 4.77 | †† | | 0.69 | | 0.69 | † | | 0.69 | † | | 1.38 | † | | 319,717 | | 121 |
12-31-06 | | 15.30 | | 0.18 | * | | 1.99 | | | 2.17 | | | 0.15 | | — | | — | | 0.15 | | 17.32 | | 14.28 | | | 0.68 | | 0.68 | † | | 0.68 | † | | 1.13 | † | | 209,440 | | 128 |
12-31-05 | | 14.73 | | 0.16 | * | | 0.59 | | | 0.75 | | | 0.18 | | — | | — | | 0.18 | | 15.30 | | 5.15 | | | 0.70 | | 0.70 | | | 0.70 | | | 1.10 | | | 557,134 | | 89 |
12-31-04 | | 13.49 | | 0.19 | * | | 1.18 | | | 1.37 | | | 0.13 | | — | | — | | 0.13 | | 14.73 | | 10.26 | | | 0.69 | | 0.69 | | | 0.69 | | | 1.39 | | | 128,127 | | 70 |
| | | | | | | | | | | | | | | | |
ING VP Index Plus MidCap Portfolio | | | | | | | | | | | | | | | | | | | | | | | | | | | | | | | | | | | | | | | |
Class I | | | | | | | | | | | | | | | | | | | | | | | | | | | | | | | | | | | | | | | |
12-31-08 | | 18.33 | | 0.22 | | | (6.37 | ) | | (6.15 | ) | | 0.22 | | 2.02 | | — | | 2.24 | | 9.94 | | (37.56 | ) | | 0.52 | | 0.52 | † | | 0.52 | † | | 1.14 | † | | 447,503 | | 113 |
12-31-07 | | 18.89 | | 0.21 | | | 0.83 | | | 1.04 | | | 0.15 | | 1.45 | | — | | 1.60 | | 18.33 | | 5.50 | †† | | 0.49 | | 0.49 | † | | 0.49 | † | | 1.06 | † | | 1,177,708 | | 127 |
12-31-06 | | 18.69 | | 0.17 | * | | 1.57 | | | 1.74 | | | 0.12 | | 1.42 | | — | | 1.54 | | 18.89 | | 9.44 | | | 0.49 | | 0.49 | † | | 0.49 | † | | 0.92 | † | | 1,148,074 | | 84 |
12-31-05 | | 18.16 | | 0.16 | * | | 1.77 | | | 1.93 | | | 0.09 | | 1.31 | | — | | 1.40 | | 18.69 | | 11.14 | | | 0.49 | | 0.49 | | | 0.49 | | | 0.87 | | | 844,703 | | 100 |
12-31-04 | | 15.64 | | 0.09 | | | 2.50 | | | 2.59 | | | 0.07 | | — | | — | | 0.07 | | 18.16 | | 16.59 | | | 0.49 | | 0.49 | | | 0.49 | | | 0.73 | | | 678,869 | | 108 |
Class S | | | | | | | | | | | | | | | | | | | | | | | | | | | | | | | | | | | | | | | |
12-31-08 | | 18.13 | | 0.14 | | | (6.26 | ) | | (6.12 | ) | | 0.17 | | 2.02 | | — | | 2.19 | | 9.82 | | (37.73 | ) | | 0.77 | | 0.77 | † | | 0.77 | † | | 0.91 | † | | 124,308 | | 113 |
12-31-07 | | 18.69 | | 0.15 | | | 0.84 | | | 0.99 | | | 0.10 | | 1.45 | | — | | 1.55 | | 18.13 | | 5.26 | †† | | 0.74 | | 0.74 | † | | 0.74 | † | | 0.81 | † | | 245,948 | | 127 |
12-31-06 | | 18.53 | | 0.12 | | | 1.55 | | | 1.67 | | | 0.09 | | 1.42 | | — | | 1.51 | | 18.69 | | 9.12 | | | 0.74 | | 0.74 | † | | 0.74 | † | | 0.63 | † | | 227,616 | | 84 |
12-31-05 | | 18.05 | | 0.11 | * | | 1.75 | | | 1.86 | | | 0.07 | | 1.31 | | — | | 1.38 | | 18.53 | | 10.84 | | | 0.74 | | 0.74 | | | 0.74 | | | 0.62 | | | 278,554 | | 100 |
12-31-04 | | 15.57 | | 0.07 | * | | 2.47 | | | 2.54 | | | 0.06 | | — | | — | | 0.06 | | 18.05 | | 16.35 | | | 0.74 | | 0.74 | | | 0.74 | | | 0.45 | | | 122,153 | | 108 |
See Accompanying Notes to Financial Statements
16
FINANCIAL HIGHLIGHTS (CONTINUED)
Selected data for a share of beneficial interest outstanding throughout each year or period.
| | | | | | | | | | | | | | | | | | | | | | | | | | | | | | | | | | | | | | | |
| | | | | Income (loss)
from
investment
operations | | | | | | Less distributions | | | | | | | | | Ratios to average net assets | | | Supplemental
Data |
| | | | | | | | | | | | | | | | | | | | | | | | | | | | | | | | | | | | | | | |
| | | Net asset value, beginning of year or period | | Net investment income (loss) | | | Net realized and unrealized gain (loss) | | | Total from investment operations | | | From net investment income | | From net realized gains | | From return of capital | | Total distributions | | Net asset value, end of year or period | | Total Return(1) | | | Expenses before reductions/ additions | | Expenses net of fee waivers and/or recoupments, if any | | | Expenses net of all reductions/ additions | | | Net investment income (loss) net of all reductions/additions | | | Net assets, end of year or period | | Portfolio turnover rate |
| | | | | | | | | | | | | | | | | | | | | | | | | | | | | | | | | | | | | | | |
Year or period ended | | ($) | | ($) | | | ($) | | | ($) | | | ($) | | ($) | | ($) | | ($) | | ($) | | (%) | | | (%) | | (%) | | | (%) | | | (%) | | | ($000’s) | | (%) |
ING VP Index Plus SmallCap Portfolio | | | | | | | | | | | | | | | | | | | | | | | | | | | | | | | | | | | | | | | |
Class I | | | | | | | | | | | | | | | | | | | | | | | | | | | | | | | | | | | | | | | |
12-31-08 | | 15.19 | | 0.14 | * | | (4.97 | ) | | (4.83 | ) | | 0.12 | | 0.83 | | — | | 0.95 | | 9.41 | | (33.58 | ) | | 0.52 | | 0.52 | † | | 0.52 | † | | 1.10 | † | | 201,978 | | 100 |
12-31-07 | | 17.99 | | 0.12 | | | (1.07 | ) | | (0.95 | ) | | 0.08 | | 1.77 | | — | | 1.85 | | 15.19 | | (6.22 | ) | | 0.49 | | 0.49 | † | | 0.49 | † | | 0.67 | † | | 638,474 | | 126 |
12-31-06 | | 16.68 | | 0.09 | * | | 2.20 | | | 2.29 | | | 0.07 | | 0.91 | | — | | 0.98 | | 17.99 | | 13.82 | | | 0.49 | | 0.49 | † | | 0.49 | † | | 0.52 | † | | 745,115 | | 93 |
12-31-05 | | 16.39 | | 0.11 | * | | 1.09 | | | 1.20 | | | 0.05 | | 0.86 | | — | | 0.91 | | 16.68 | | 7.62 | | | 0.49 | | 0.49 | | | 0.49 | | | 0.66 | | | 378,121 | | 71 |
12-31-04 | | 13.52 | | 0.07 | | | 2.90 | | | 2.97 | | | 0.02 | | 0.08 | | — | | 0.10 | | 16.39 | | 22.07 | | | 0.49 | | 0.49 | | | 0.49 | | | 0.64 | | | 303,041 | | 94 |
Class S | | | | | | | | | | | | | | | | | | | | | | | | | | | | | | | | | | | | | | | |
12-31-08 | | 15.01 | | 0.13 | | | (4.93 | ) | | (4.80 | ) | | 0.08 | | 0.83 | | — | | 0.91 | | 9.30 | | (33.73 | ) | | 0.77 | | 0.77 | † | | 0.77 | † | | 0.87 | † | | 95,586 | | 100 |
12-31-07 | | 17.79 | | 0.07 | | | (1.06 | ) | | (0.99 | ) | | 0.02 | | 1.77 | | — | | 1.79 | | 15.01 | | (6.49 | ) | | 0.74 | | 0.74 | † | | 0.74 | † | | 0.42 | † | | 181,986 | | 126 |
12-31-06 | | 16.53 | | 0.04 | * | | 2.18 | | | 2.22 | | | 0.05 | | 0.91 | | — | | 0.96 | | 17.79 | | 13.48 | | | 0.74 | | 0.74 | † | | 0.74 | † | | 0.25 | † | | 204,246 | | 93 |
12-31-05 | | 16.28 | | 0.07 | * | | 1.08 | | | 1.15 | | | 0.04 | | 0.86 | | — | | 0.90 | | 16.53 | | 7.36 | | | 0.74 | | 0.74 | | | 0.74 | | | 0.43 | | | 333,092 | | 71 |
12-31-04 | | 13.46 | | 0.06 | * | | 2.86 | | | 2.92 | | | 0.02 | | 0.08 | | — | | 0.10 | | 16.28 | | 21.74 | | | 0.74 | | 0.74 | | | 0.74 | | | 0.45 | | | 110,292 | | 94 |
(1) | | Total return is calculated assuming reinvestment of all dividends and capital gain distributions at net asset value and does not reflect the effect of insurance contract charges. |
| * | | Calculated using average number of shares outstanding throughout the period. |
| † | | Impact of waiving the advisory fee for the ING Institutional Prime Money Market Fund holding has less than 0.005% impact on the expense ratio and net investment income ratio. |
| †† | | There was no impact on total return by the affiliate payment in Note 14. |
See Accompanying Notes to Financial Statements
17
NOTES TO FINANCIAL STATEMENTSASOF DECEMBER 31, 2008
NOTE 1 — ORGANIZATION
Organization. ING Variable Portfolios, Inc. (the “Company”) is registered under the Investment Company Act of 1940, as amended (“1940 Act” or “Act”) as an open-end management investment company.
ING Variable Portfolios, Inc. is a company incorporated under the laws of Maryland on June 4, 1996. There are fifteen active separate investment series that comprise the Company. The three series (each a “Portfolio”, collectively the “Portfolios”) that are in this report are: ING VP Index Plus LargeCap Portfolio (“VP Index Plus LargeCap”), ING VP Index Plus MidCap Portfolio (“VP Index Plus MidCap”) and ING VP Index Plus SmallCap Portfolio (“VP Index Plus SmallCap”).
VP Index Plus LargeCap seeks to outperform the total return performance of the Standard & Poor’s 500® Composite Stock Price Index (“S&P 500® Index”), while maintaining a market level of risk.
VP Index Plus MidCap seeks to outperform the total return performance of the Standard & Poor’s (“S&P”) MidCap 400 Index, while maintaining a market level of risk.
VP Index Plus SmallCap seeks to outperform the total return performance of the S&P SmallCap 600 Index, while maintaining a market level of risk.
Each Portfolio offers Class I and Class S shares. The two classes differ principally in the applicable distribution and service fees. Shareholders of each class also bear certain expenses that pertain to that particular class. All shareholders bear the common expenses of the Portfolio and earn income and realized gains/losses from the portfolio pro rata based on the average daily net assets of each class, without distinction between share classes. Common expenses of the Portfolios (including custodial asset-based fees, legal and audit fees, printing and mailing expenses, transfer agency out-of-pocket expenses, and fees and expenses of the independent directors) are allocated to each Portfolio in proportion to its average net assets. Expenses directly attributable to a particular Portfolio (including advisory, administration, custodial transaction-based, registration, other professional, distribution and/or service fees, certain taxes, and offering costs) are charged directly to that Portfolio. Differences in per share dividend rates generally result from differences in separate class expenses, including distribution and shareholder service fees, if applicable.
Shares of the Portfolios may be offered to separate accounts of insurance companies as investment options
under variable annuity contracts and variable life insurance policies (“Variable Contracts”). Shares may also be offered to qualified pension and retirement plans outside the Variable Contract and to certain investment advisers and their affiliates. Class I shares may be made available to other investment companies, including series of each Company under fund-of-funds arrangements.
Participating insurance companies and other designated organizations are authorized to receive purchase orders on each Portfolio’s behalf.
ING Investments, LLC (“ING Investments” or the “Investment Adviser”), an Arizona limited liability company, serves as the Investment Adviser to the Portfolios. ING Investments has engaged ING Investment Management Co. (“ING IM”), a Connecticut corporation, to serve as the Sub-Adviser to the Portfolios. ING Funds Distributor, LLC (the “Distributor” or ”IFD”) is the principal underwriter of the Portfolios. ING Investments, ING IM and the Distributor are indirect, wholly-owned subsidiaries of ING Groep N.V. (“ING Groep”). ING Groep is a global financial institution of Dutch origin offering banking, investments, life insurance and retirement services to over 75 million private, corporate and institutional clients in more than 50 countries. With a diverse workforce of about 125,000 people, ING Groep comprises a broad spectrum of prominent companies that increasingly serve their clients under the ING brand.
On October 19, 2008, ING Groep announced that it reached an agreement with the Dutch government to strengthen its capital position, creating a strong buffer to navigate the current market and economic environment. ING Groep will issue non-voting core Tier-1 securities for a total consideration of EUR 10 billion to the Dutch State. The transaction boosts ING Bank’s core Tier-1 ratio, strengthens the insurance balance sheet and reduces ING Groep’s Debt/Equity ratio.
NOTE 2 — SIGNIFICANT ACCOUNTING POLICIES
The following significant accounting policies are consistently followed by the Portfolios in the preparation of their financial statements. Such policies are in conformity with U.S. generally accepted accounting principles for investment companies.
| A. | Security Valuation. Investments in equity securities traded on a national securities exchange are valued at the last reported sale price. Securities |
18
NOTES TO FINANCIAL STATEMENTSASOF DECEMBER 31, 2008 (CONTINUED)
NOTE 2 — SIGNIFICANT ACCOUNTING POLICIES (continued)
| | reported by NASDAQ are valued at the NASDAQ official closing prices. Securities traded on an exchange or NASDAQ for which there has been no sale and securities traded in the over-the-counter-market are valued at the mean between the last reported bid and ask prices. All investments quoted in foreign currencies will be valued daily in U.S. dollars on the basis of the foreign currency exchange rates prevailing at that time. Debt securities are valued at prices obtained from independent services or from one or more dealers making markets in the securities and may be adjusted based on the Portfolios’ valuation procedures. U.S. government obligations are valued by using market quotations or independent pricing services that use prices provided by market- makers or estimates of market values obtained from yield data relating to instruments or securities with similar characteristics. |
Securities and assets for which market quotations are not readily available (which may include certain restricted securities which are subject to limitations as to their sale) are valued at their fair values, as defined in the 1940 Act, and as determined in good faith by or under the supervision of the Portfolios’ Board of Directors (“Board”), in accordance with methods that are specifically authorized by the Board. Securities traded on exchanges, including foreign exchanges, which close earlier than the time that a Portfolio calculates its net asset value (“NAV”) may also be valued at their fair values, as defined by the 1940 Act, and as determined in good faith by or under the supervision of the Board, in accordance with methods that are specifically authorized by the Board. The valuation techniques applied in any specific instance are likely to vary from case to case. With respect to a restricted security, for example, consideration is generally given to the cost of the investment, the market value of any unrestricted securities of the same class at the time of valuation, the potential expiration of restrictions on the security, the existence of any registration rights, the costs to the Portfolios related to registration of the security, as well as factors relevant to the issuer itself. Consideration may also be given to the price and extent of any public trading in similar securities of the issuer or comparable companies’ securities. The value of a foreign security traded on
an exchange outside the United States is generally based on its price on the principal foreign exchange where it trades as of the time a Portfolio determines its NAV or if the foreign exchange closes prior to the time a Portfolio determines its NAV, the most recent closing price of the foreign security on its principal exchange. Trading in certain non-U.S. securities may not take place on all days on which the New York Stock Exchange (“NYSE”) is open. Further, trading takes place in various foreign markets on days on which the NYSE is not open. Consequently, the calculation of a Portfolio’s NAV may not take place contemporaneously with the determination of the prices of securities held by a Portfolio in foreign securities markets. Further, the value of a Portfolio’s assets may be significantly affected by foreign trading on days when a shareholder cannot purchase or redeem shares of a Portfolio. In calculating a Portfolio’s NAV, foreign securities denominated in foreign currency are converted to U.S. dollar equivalents. If an event occurs after the time at which the market for foreign securities held by a Portfolio closes but before the time that a Portfolio’s NAV is calculated, such event may cause the closing price on the foreign exchange to not represent a readily available reliable market value quotation for such securities at the time a Portfolio determines its NAV. In such a case, a Portfolio will use the fair value of such securities as determined under a Portfolio’s valuation procedures. Events after the close of trading on a foreign market that could require a Portfolio to fair value some or all of its foreign securities include, among others, securities trading in the U.S. and other markets, corporate announcements, natural and other disasters, and political and other events. Among other elements of analysis in the determination of a security’s fair value, the Board has authorized the use of one or more independent research services to assist with such determinations. An independent research service may use statistical analyses and quantitative models to help determine fair value as of the time a Portfolio calculates its NAV. There can be no assurance that such models accurately reflect the behavior of the applicable markets or the effect of the behavior of such markets on the fair value of securities, or that such markets will continue to behave in a fashion that is consistent with such models. Unlike the closing price of a security on an exchange, fair value determinations employ
19
NOTES TO FINANCIAL STATEMENTSASOF DECEMBER 31, 2008 (CONTINUED)
NOTE 2 — SIGNIFICANT ACCOUNTING POLICIES (continued)
elements of judgment. Consequently, the fair value assigned to a security may not represent the actual value that a Portfolio could obtain if it were to sell the security at the time of the close of the NYSE. Pursuant to procedures adopted by the Board, a Portfolio is not obligated to use the fair valuations suggested by any research service, and valuation recommendations provided by such research services may be overridden if other events have occurred or if other fair valuations are determined in good faith to be more accurate. Unless an event is such that it causes a Portfolio to determine that the closing prices for one or more securities do not represent readily available reliable market value quotations at the time the Portfolio determines its NAV, events that occur between the time of the close of the foreign market on which they are traded and the close of regular trading on the NYSE will not be reflected in a Portfolio’s NAV. Investments in securities maturing in 60 days or less from date of acquisition are valued at amortized cost which approximates market value.
Effective for fiscal years beginning after November 15, 2007, Financial Accounting Standards Board (“FASB”) Statement of Financial Accounting Standards No. 157, “Fair Value Measurements”, establishes a hierarchy for measuring fair value of assets and liabilities. As required by the standard, each investment asset or liability of the Portfolios is assigned a level at measurement date based on the significance and source of the inputs to its valuation. Quoted prices in active markets for identical securities are classified as “Level 1”, inputs other than quoted prices for an asset that are observable are classified as “Level 2” and unobservable inputs, including the sub-adviser’s judgment about the assumptions that a market participant would use in pricing an asset or liability are classified as “Level 3”. The inputs used for valuing securities are not necessarily an indication of the risks associated with investing in those securities. A table summarizing the Portfolios’ investments under these levels of classification is included following the Portfolios of Investments.
Effective for fiscal years and interim periods ending after November 15, 2008, the FASB issued FASB Staff Position (“FSP”) No. FAS 133-1 and FASB Interpretation Number (“FIN”) 45-4, “Disclosures about Credit Derivatives and Certain Guarantees:
An Amendment of FASB Statement No. 133 and FASB Interpretation No. 45; and Clarification of the Effective Date of FASB Statement No. 161.” The amendments to FAS 133 require enhanced disclosure regarding credit derivatives sold, including (1) the nature and terms of the credit derivative, reasons for entering into the credit derivative, the events or circumstances that would require the seller to perform under the credit derivative, and the current status of the payment/performance risk of the credit derivative, (2) the maximum potential amount of future payments (undiscounted) the seller could be required to make under the credit derivative, (3) the fair value of the credit derivative, and (4) the nature of any recourse provisions and assets held either as collateral or by third parties. The amendments to FIN 45 require additional disclosures about the current status of the payment/performance risk of a guarantee. All changes to accounting policies have been made in accordance with the FSP and incorporated for the current period as part of the Notes to Financial Statements and Portfolio of Investments.
| B. | Security Transactions and Revenue Recognition. Securities transactions are accounted for on the trade date. Realized gains and losses are reported on the basis of identified cost of securities sold. Interest income is recorded on an accrual basis. Dividend income is recorded on the ex-dividend date, or for certain foreign securities, when the information becomes available to the Portfolios. Premium amortization and discount accretion are determined by the effective yield method. |
| C. | Foreign Currency Translation. The books and records of the Portfolios are maintained in U.S. dollars. Any foreign currency amounts are translated into U.S. dollars on the following basis: |
| | (1) | Market value of investment securities, other assets and liabilities — at the exchange rates prevailing at the end of the day. |
| | (2) | Purchases and sales of investment securities, income and expenses — at the rates of exchange prevailing on the respective dates of such transactions. |
Although the net assets and the market values are presented at the foreign exchange rates at the end of the day, the Portfolios do not isolate the portion of the results of operations resulting from changes in foreign exchange rates on investments from the
20
NOTES TO FINANCIAL STATEMENTSASOF DECEMBER 31, 2008 (CONTINUED)
NOTE 2 — SIGNIFICANT ACCOUNTING POLICIES (continued)
fluctuations arising from changes in market prices of securities held. Such fluctuations are included with the net realized and unrealized gains or losses from investments. For securities, which are subject to foreign withholding tax upon disposition, liabilities are recorded on the Statements of Assets and Liabilities for the estimated tax withholding based on the securities’ current market value. Upon disposition, realized gains or losses on such securities are recorded net of foreign withholding tax.
Reported net realized foreign exchange gains or losses arise from sales of foreign currencies, currency gains or losses realized between the trade and settlement dates on securities transactions, the difference between the amounts of dividends, interest, and foreign withholding taxes recorded on a Portfolio’s books, and the U.S. dollar equivalent of the amounts actually received or paid. Net unrealized foreign exchange gains and losses arise from changes in the value of assets and liabilities other than investments in securities at fiscal year end, resulting from changes in the exchange rate. Foreign security and currency transactions may involve certain considerations and risks not typically associated with investing in U.S. companies and U.S. Government securities. These risks include, but are not limited to, revaluation of currencies and future adverse political and economic developments which could cause securities and their markets to be less liquid and prices more volatile than those of comparable U.S. companies and U.S. Government securities.
| D. | Foreign Currency Transactions and Futures Contracts. Each Portfolio may enter into foreign currency exchange transactions to convert to and from different foreign currencies and to and from the U.S. dollar in connection with the planned purchases or sales of securities. When entering into a currency forward contract, a Portfolio agrees to receive or deliver a fixed quantity of foreign currency for an agreed-upon price on an agreed upon date. The Portfolios either enter into these transactions on a spot basis at the spot rate prevailing in the foreign currency exchange market or use forward foreign currency contracts to purchase or sell foreign currencies. When the contract is fulfilled or closed, gains or losses are realized. Until then, the gain or loss is included in |
| | unrealized appreciation or depreciation. Risks may arise upon entering into forward contracts from the potential inability of counterparties to meet the terms of their forward contracts and from unanticipated movements in the value of foreign currencies relative to the U.S. dollar. |
Each Portfolio may enter into futures contracts involving foreign currency, interest rates, securities and security indices. A futures contract obligates the seller of the contract to deliver and the purchaser of the contract to take delivery of the type of foreign currency, financial instrument or security called for in the contract at a specified future time for a specified price. Upon entering into such a contract, a Portfolio is required to deposit and maintain as collateral such initial margin as required by the exchange on which the contract is traded. Pursuant to the contract, a Portfolio agrees to receive from or pay to the broker an amount equal to the daily fluctuations in the value of the contract. Such receipts or payments are known as variation margins and are recorded as unrealized gains or losses by a Portfolio. When the contract is closed, a Portfolio records a realized gain or loss equal to the difference between the value of the contract at the time it was opened and the value at the time it was closed.
| E. | Distributions to Shareholders. The Portfolios record distributions to their shareholders on the ex- dividend date. Dividends from net investment income and capital gains, if any, are declared and paid annually by the Portfolios. The Portfolios may make distributions on a more frequent basis to comply with the distribution requirements of the Internal Revenue Code. The characteristics of income and gains to be distributed are determined in accordance with income tax regulations, which may differ from U.S. generally accepted accounting principles for investment companies. |
| F. | Federal Income Taxes. It is the policy of each Portfolio to comply with subchapter M of the Internal Revenue Code and related excise tax provisions applicable to regulated investment companies and to distribute substantially all of its net investment income and any net realized capital gains to their shareholders. Therefore, no federal income tax provision is required. Management has considered the sustainability of the Portfolios’ tax positions taken on federal income tax returns for all open tax years in making this determination. No |
21
NOTES TO FINANCIAL STATEMENTSASOF DECEMBER 31, 2008 (CONTINUED)
NOTE 2 — SIGNIFICANT ACCOUNTING POLICIES (continued)
| | capital gain distributions shall be made until any capital loss carryforwards have been fully utilized or expired. |
| G. | Use of Estimates. The preparation of financial statements in conformity with U.S. generally accepted accounting principles requires management to make estimates and assumptions that affect the reported amounts of assets and liabilities and disclosure of contingent assets and liabilities at the date of the financial statements and the reported amounts of increases and decreases in net assets from operations during the reporting period. Actual results could differ from those estimates. |
| H. | Repurchase Agreements. Each Portfolio may invest in repurchase agreements only with government securities dealers recognized by the Board of Governors of the Federal Reserve System. Under such agreements, the seller of the security agrees to repurchase it at a mutually agreed upon time and price. The resale price is in excess of the purchase price and reflects an agreed upon interest rate for the period of time the agreement is outstanding. The period of the repurchase agreements is usually short, from overnight to one week, while the underlying securities generally have longer maturities. Each Portfolio will receive as collateral securities acceptable to it whose market value is equal to at least 100% of the carrying amount of the repurchase agreements, plus accrued interest, being invested by the Portfolio. The underlying collateral is valued daily on a mark to market basis to assure that the value, including accrued interest is at least equal to the repurchase price. There would be potential loss to a Portfolio in the event the Portfolio is delayed or prevented from exercising its right to dispose of the collateral, and it might incur disposition costs in liquidating the collateral. |
| I. | Securities Lending. Each Portfolio has the option to temporarily loan up to 30% of its total assets to brokers, dealers or other financial institutions in exchange for a negotiated lender’s fee. The borrower is required to fully collateralize the loans with cash or U.S. Government securities. Generally, in the event of counterparty default, each Portfolio has the right to use collateral to offset losses incurred. There would be potential loss to a |
| | Portfolio in the event the Portfolio is delayed or prevented from exercising its right to dispose of the collateral. Each Portfolio bears the risk of loss with respect to the investment of collateral. Engaging in securities lending could have a leveraging effect, which may intensify the credit, market and other risks associated with investing in a Portfolio. |
| J. | Illiquid and Restricted Securities. Each Portfolio may not invest more than 10% of its net assets in illiquid securities. Illiquid securities are not readily marketable. Disposing of illiquid investments may involve time-consuming negotiation and legal expenses, and it may be difficult or impossible for the Portfolios to sell them promptly at an acceptable price. Each Portfolio may also invest in restricted securities, which include those sold under Rule 144A of the Securities Act of 1933 (“1933 Act”) or securities offered pursuant to Section 4(2) of the 1933 Act, and/or are subject to legal or contractual restrictions on resale and may not be publicly sold without registration under the 1933 Act. Certain restricted securities may be considered liquid pursuant to procedures adopted by the Board or may be deemed to be illiquid because they may not be readily marketable. Illiquid and restricted securities are valued using market quotations when readily available. In the absence of market quotations, the securities are valued based upon their fair value, as defined in the Act, determined under procedures approved by the Board. |
| K. | When-Issued and Delayed-Delivery Transactions. Each Portfolio may purchase or sell securities on a when-issued or forward commitment basis. The price of the underlying securities and date when the securities will be delivered and paid for are fixed at the time the transaction is negotiated. The market value of such is identified in each Portfolio’s Portfolio of Investments. Losses may arise due to changes in the market value of the securities or from the inability of counterparties to meet the terms of the contract. In connection with such purchases, the Portfolios are required to segregate liquid assets sufficient to cover the purchase price. |
| L. | Swap Agreements. Each Portfolio may enter into swap agreements. A swap is an agreement between two parties pursuant to which each party agrees to make one or more payments to the other at specified future intervals based on the return of an asset (such as a stock, bond or currency) or |
22
NOTES TO FINANCIAL STATEMENTSASOF DECEMBER 31, 2008 (CONTINUED)
NOTE 2 — SIGNIFICANT ACCOUNTING POLICIES (continued)
| | non-asset reference (such as an interest rate or index). The swap agreement will specify the “notional” amount of the asset or non-asset reference to which the contract relates. Subsequent changes in market value, if any, are calculated based upon changes in the performance of the asset or non-asset reference multiplied by the notional value of the contract. A Portfolio may enter into credit default, interest rate, total return and currency swaps to manage its exposure to credit, currency and interest rate risk. All outstanding swap agreements are reported following each Portfolio’s Portfolio of Investments. |
Swaps are marked to market daily using quotations primarily from third party pricing services, counterparties or brokers. The value of the swap contract is recorded on each Portfolio’s Statements of Assets or Liabilities. During the term of the swap, changes in the value of the swap, if any, are recorded as unrealized gains or losses on the Statements of Operations. Upfront payments paid or received by a Portfolio when entering into the agreements are reported on the Statements of Assets and Liabilities and as a component of the changes in unrealized gains or losses on the Statements of Operations. These upfront payments represent the amounts paid or received when initially entering into the swap agreement to compensate for differences between the stated terms of the swap agreement and the prevailing market conditions. The upfront payments are included as a component in the realized gains or losses on each Portfolio’s Statement of Operations upon termination or maturity of the swap. A Portfolio also records net periodic payments paid or received on the swap contract as a realized gain or loss on the Statements of Operations.
Entering into swap agreements involves the risk that the maximum potential loss of an investment exceeds the current value of the investment as reported on each Portfolio’s Statements of Assets and Liabilities. Other risks involve the possibility that the counterparty to the agreements may default on its obligation to perform, that there will be no liquid market for these investments and that unfavorable changes in the market will have a negative impact on the value of the index or securities underlying the respective swap agreement.
Credit Default Swap Contracts. A credit default swap is a bilateral agreement between counterparties in which the buyer of the protection agrees to make a stream of periodic payments to the seller of protection in exchange for the right to receive a specified return in the event of a default or other credit event for a referenced entity, obligation or index. As a seller of protection on credit default swaps, a Portfolio will generally receive from the buyer a fixed payment stream based on the notional amount of the swap contract. This fixed payment stream will continue until the swap contract expires or a defined credit event occurs.
A Portfolio is subject to credit risk in the normal course of pursuing its investment objectives. As a seller of protection in a credit default swap, a Portfolio may execute these contracts to manage its exposure to the market or certain sectors of the market. Each Portfolio may also enter into credit default swaps to speculate on changes in an issuer’s credit quality, to take advantage of perceived spread advantages, or to offset an existing short equivalent (i.e., buying protection on an equivalent reference entity).
Each Portfolio may sell credit default swaps which expose them to the risk of loss from credit risk- related events specified in the contract. Although contract specific, credit events are generally defined as bankruptcy, failure to pay, restructuring, obligation acceleration, obligation default or repudiation/moratorium. If a Portfolio is a seller of protection, and a credit event occurs, as defined under the terms of that particular swap agreement, a Portfolio will generally either (i) pay to the buyer an amount equal to the notional amount of the swap and take delivery of the referenced obligation, other deliverable obligations, or underlying securities comprising a referenced index or (ii) pay a net settlement amount in the form of cash or securities equal to the notional amount of the swap less the recovery value of the referenced obligation or underlying securities comprising a referenced index. If a Portfolio is a buyer of protection and a credit event occurs, as defined under the terms of that particular swap agreement, a Portfolio will either (i) receive from the seller of protection an amount equal to the notional amount of the swap and deliver the referenced obligation, other deliverable obligations or underlying securities comprising the
23
NOTES TO FINANCIAL STATEMENTSASOF DECEMBER 31, 2008 (CONTINUED)
NOTE 2 — SIGNIFICANT ACCOUNTING POLICIES (continued)
referenced index or (ii) receive a net settlement amount in the form of cash or securities equal to the notional amount of the swap less the recovery value of the referenced obligation or underlying securities comprising the referenced index. Recovery values are assumed by market makers considering either industry standard recovery rates or entity specific factors and considerations until a credit event occurs. If a credit event has occurred, the recovery value is determined by a facilitated auction whereby a minimum number of allowable broker bids, together with a specified valuation method, are used to calculate the settlement value.
Implied credit spreads, represented in absolute terms, utilized in determining the market value of credit default swap agreements on corporate issues or sovereign issues are disclosed in each Portfolio’s Portfolio of Investment and serve as an indicator of the current status of the payment/performance risk and represent the likelihood or risk of default for the credit derivative. The implied credit spread of a particular referenced entity reflects the cost of buying/selling protection and may include upfront payments required to be made to enter into the agreement. For credit default swaps on asset-backed securities or credit indices, the quoted market prices and resulting market values serve as the indicator of the current status of the payment/performance risk. Wider credit spreads and increasing market values, in absolute terms when compared to the notional amount of the swap, represent a deterioration of the referenced entity’s credit soundness and a greater likelihood or risk of default or other credit event occurring as defined under the terms of the agreement.
The maximum amount of future payments (undiscounted) that a Portfolio as seller of protection could be required to make under a credit default swap agreement would be an amount equal to the notional amount of the agreement. Notional amounts of all credit default swap agreements outstanding as of December 31, 2008, for which a Portfolio is seller of protection are disclosed in each Portfolio’s Portfolio of Investments. These potential amounts would be partially offset by any recovery values of the respective referenced obligations, upfront payments received upon entering into the agreements, or net amounts received from the
settlement of buy protection credit default swap agreements entered into by a Portfolio for the same referenced entity or entities
Interest Rate Swap Contracts. An interest rate swap involves the agreement between counterparties to exchange periodic payments based on interest rates. One payment will be based on a floating rate of a specified interest rate while the other will be a fixed rate. Risks involve the future fluctuations of interest rates in which a Portfolio may make payments that are greater than what a Portfolio received from the counterparty. Other risks include credit, liquidity and market risk.
Total Return Swap Contracts. A total return swap involves the agreement between counterparties to exchange periodic payments based on an asset (such as a basket of securities) or non-asset (such as an index) reference. The periodic payments or cash flows, are usually based on the non-asset reference versus the total return or the asset-based reference. The asset-based reference generally includes unrealized appreciation or depreciation and to the extent that the total return falls short of or exceeds the non-asset reference, a Portfolio will make or receive a payment to the counterparty. Risks of total return swaps include credit, liquidity and market risks.
Currency Swaps. A currency swap involves the agreement between counterparties to exchange two different currencies at contract inception at the prevailing spot rate, and to reverse the exchange at a later agreed upon termination date. The currency exchange at termination may take place at the original exchange rate, an agreed upon exchange rate or the prevailing spot rate on the date of termination. The contract may also include periodic interest payments based on a specified interest rate. Risks related to currency swaps include, but are not limited to, credit, liquidity, market, and exchange rate fluctuations.
Structured Products. Each Portfolio may invest in structured products which are specially-designed derivative investments whose principal payments or interest payments are linked to the performance of underlying foreign currencies, interest rate spreads, stock market indices, prices of individual securities, commodities or other financial instruments or the occurrence of other specific events. The terms and conditions of these products may be ‘structured’ by the purchaser and the borrower issuing the note. The market value of
24
NOTES TO FINANCIAL STATEMENTSASOF DECEMBER 31, 2008 (CONTINUED)
NOTE 2 — SIGNIFICANT ACCOUNTING POLICIES (continued)
these products will increase or decrease based on the performance of the underlying asset or reference. A Portfolio records the changes in the market value of these structured products as an unrealized gain or loss in the accompanying Portfolio’s Statements of Operations. A Portfolio records a realized gain or loss when a structured product is sold or matures.
Risks associated with structured products include credit risk (if the counterparty fails to meet its obligation) and risk associated with the underlying asset or reference. Since a Portfolio enters into the transaction with the borrower at par value, a Portfolio could receive more or less than it originally invested when a note matures. The prices of the notes may also be very volatile and may have limited liquidity in the market which can make it difficult for a Portfolio to value or sell at an advantageous price.
| M. | Options Contracts. The Portfolios may purchase put and call options and may write (sell) put options and covered call options. The Portfolios may engage in option transactions as a hedge against adverse movements in the value of portfolio holdings or to increase market exposure. Option contracts are valued daily and unrealized gains or losses are recorded based upon the last sales price on the principal exchange on which the options are traded. An amount equal to the premium received by the Portfolios upon the writing of a put or call option is included in the Statements of Assets and Liabilities as a liability which is subsequently marked-to-market until it is exercised or closed, or it expires. The Portfolios will realize a gain or loss upon the expiration or closing of the option contract. When an option is exercised, the proceeds on sales of the underlying security for a written call option, the purchase cost of the security for a written put option, or the cost of the security for a purchased put or call option is adjusted by the amount of premium received or paid. Realized and unrealized gains or losses on option contracts are reflected in the accompanying financial statements. The risk in writing a covered call option is that the Portfolios give up the opportunity for profit if the market price of the security increases and the option is exercised. The risk in writing a put option is that the Portfolios may incur a loss if the market price of the security |
| | decreases and the option is exercised. The risk in buying an option is that the Portfolios pay a premium whether or not the option is exercised. Risks may also arise from an illiquid secondary market or from the inability of counterparties to meet the terms of the contract. |
| N. | Indemnifications. In the normal course of business, the Company may enter into contracts that provide certain indemnifications. The Company maximum exposure under these arrangements is dependent on future claims that may be made against the Portfolios and, therefore, cannot be estimated; however, based on experience, the risk of loss from such claims is considered remote. |
NOTE 3 — INVESTMENT TRANSACTIONS
For the year ended December 31, 2008, the cost of purchases and the proceeds from the sale of securities, excluding short-term securities, were as follows:
| | | | | | |
| | | Purchases | | Sales |
VP Index Plus LargeCap | | $ | 2,860,487,247 | | $ | 3,988,145,337 |
VP Index Plus MidCap | | | 1,091,400,369 | | | 1,530,627,663 |
VP Index Plus SmallCap | | | 531,171,351 | | | 863,762,437 |
NOTE 4 — INVESTMENT MANAGEMENT AND ADMINISTRATIVE FEES
The Portfolios entered into an investment management agreement (“Investment Management Agreement”) with the Investment Adviser. The Investment Management Agreement compensates the Investment Adviser with a fee, computed daily and payable monthly, based on the average daily net assets of each Portfolio, at the following annual rates:
| | | |
VP Index Plus LargeCap | | 0.35 | % |
VP Index Plus MidCap | | 0.40 | % |
VP Index Plus SmallCap | | 0.40 | % |
The Investment Adviser entered into a sub-advisory agreement with ING IM. Subject to such policies as the Board or the Investment Adviser may determine, ING IM manages the Portfolios’ assets in accordance with the Portfolios’ investment objectives, policies, and limitations.
ING Portfolios are permitted to invest end-of-day cash balances into ING Institutional Prime Money Market Fund. Investment management fees paid by the Portfolios will be reduced by an amount equal to the management fees paid indirectly to the ING Institutional Prime Money Market Fund with respect to assets invested by the Portfolios. For the year ended December 31, 2008, the Investment Adviser for VP
25
NOTES TO FINANCIAL STATEMENTSASOF DECEMBER 31, 2008 (CONTINUED)
NOTE 4 — INVESTMENT MANAGEMENT AND ADMINISTRATIVE FEES (continued)
Index Plus LargeCap, VP Index Plus MidCap and VP Index Plus SmallCap waived $7,199, $5,474 and $4,496 of such management fees, respectively. These fees are not subject to recoupment.
Pursuant to the Administration Agreement, ING Funds Services, LLC (“IFS”), an indirect, wholly-owned subsidiary of ING Groep, acts as administrator and provides certain administrative and shareholder services necessary for Portfolio operations and is responsible for the supervision of other service providers. IFS is entitled to receive from each Portfolio a fee at an annual rate of 0.055% on the first $5 billion of daily net assets and 0.03% thereafter.
In placing equity security transactions, the Investment Adviser or Sub-Adviser is required to use its best efforts to choose a broker capable of providing brokerage services necessary to obtain the best execution for each transaction. Subject to this requirement, the Investment Adviser or Sub-Adviser may allocate equity security transactions through certain designated broker-dealers. Some of these broker-dealers participate in commission recapture programs that have been established for the benefit of the Portfolios. Under these programs, the participating broker-dealers will return to a Portfolio a portion of the brokerage commissions (in the form of a credit to a Portfolio) paid to the broker-dealers to pay certain expenses of a Portfolio. These commission recapture payments benefit the Portfolios and not the Investment Adviser or Sub-Adviser. Any amount credited to a Portfolio is reflected as brokerage commission recapture in the Statements of Operations.
NOTE 5 — DISTRIBUTION FEES
Class S shares of the respective Portfolios have adopted a Distribution Plan pursuant to Rule 12b-1 under the 1940 Act (the “12b-1 Plan”), whereby the Distributor is compensated by each Portfolio for expenses incurred in the distribution of each Portfolio’s Class S shares (“Distribution Fees”). Pursuant to the 12b-1 Plans, the Distributor is entitled to a payment each month to compensate for expenses incurred in the distribution and promotion of each Portfolio’s S shares, including expenses incurred in printing prospectuses and reports used for sales purposes, expenses incurred in preparing and printing sales literature and other such distribution related expenses, including any distribution or shareholder servicing fees (“Service Fees”) paid to securities dealers who have executed a distribution agreement with the Distributor. Under the 12b-1 Plans,
Class S of the Portfolios pays the Distributor Distribution Fees at a rate of 0.25% based on average daily net assets.
NOTE 6 — OTHER TRANSACTIONS WITH AFFILIATED AND RELATED PARTIES
At December 31, 2008, the Portfolios had the following amounts recorded in payable to affiliates on the accompanying Statements of Assets and Liabilities (see Notes 4 and 5):
| | | | | | | | | | | | |
| | | Accrued
Investment
Management
Fees | | Accrued
Administrative
Fees | | Accrued
Shareholder
Service and
Distribution
Fees | | Total |
VP Index Plus LargeCap | | $ | 247,999 | | $ | 39,057 | | $ | 37,897 | | $ | 324,953 |
VP Index Plus MidCap | | | 182,108 | | | 25,120 | | | 24,610 | | | 231,838 |
VP Index Plus SmallCap | | | 94,507 | | | 13,027 | | | 19,064 | | | 126,598 |
At December 31, 2008, the following indirect, wholly-owned subsidiaries of ING Groep owned more than 5% of the following Portfolios:
ING Life Insurance and Annuity Company — VP Index Plus LargeCap (69.15%); VP Index Plus MidCap (69.61%); VP Index Plus SmallCap (52.93%);
ING USA Annuity and Life Insurance Company — VP Index Plus LargeCap (20.27%); VP Index Plus MidCap (20.25%); and VP Index Plus SmallCap (30.17%).
Control is defined by the 1940 Act as the beneficial ownership, either directly or through one or more controlled companies, of more than 25% of the voting securities of a company. The 1940 Act defines affiliates as companies that are under common control. Therefore, because the Portfolios have a common owner that owns over 25% of the outstanding securities of the Portfolios, they may be deemed to be affiliates of each other. Investment activities of these shareholders could have a material impact on the Portfolios.
The Company has adopted a Deferred Compensation Plan (“Policy”), which allows eligible non-affiliated directors as described in the Policy to defer the receipt of all or a portion of the directors’ fees payable. Deferred fees are invested in various funds advised by ING Investments until distribution in accordance with the Policy.
26
NOTES TO FINANCIAL STATEMENTSASOF DECEMBER 31, 2008 (CONTINUED)
NOTE 7 — EXPENSE LIMITATIONS
ING Investments entered into written expense limitation agreements (“Expense Limitation Agreements”) with each of the Portfolios whereby the Investment Adviser has agreed to limit expenses, excluding interest, taxes, brokerage commissions and extraordinary expenses (and acquired fund fees and expenses) to the levels listed below:
| | | | | | |
| | | Class I | | | Class S | |
VP Index Plus LargeCap | | 0.55 | % | | 0.80 | % |
VP Index Plus MidCap | | 0.60 | % | | 0.85 | % |
VP Index Plus SmallCap | | 0.60 | % | | 0.85 | % |
The Investment Adviser may at a later date recoup from a Portfolio for management fees waived and other expenses assumed by the Investment Adviser during the previous 36 months, but only if, after such recoupment, the Portfolio’s expense ratio does not exceed the percentage described above. Waived and reimbursed fees and any recoupment by the Investment Adviser of such waived and reimbursed fees are reflected on the accompanying Statements of Operations for each Portfolio. Amounts payable by the Investment Adviser are reflected on the accompanying Statements of Assets and Liabilities for each Portfolio.
As of December 31, 2008, the Portfolios did not have any amount of waived or reimbursed fees that would be subject to possible recoupment by the Investment Adviser.
The Expense Limitation Agreement is contractual and shall renew automatically for one-year terms unless ING Investments provides written notice of the termination of an Expense Limitation Agreement within 90 days of the end of the then current term.
NOTE 8 — BORROWINGS
All of the Portfolios included in this report, in addition to certain other Portfolios managed by the Investment Adviser, have entered into an unsecured committed revolving line of credit agreement with Citibank, N.A. (the “Citi Credit Agreement”) for an aggregate amount of $100,000,000. The proceeds may be used only to: (1) temporarily finance the purchase and sale of securities; (2) finance the redemption of shares of an investor in the Portfolios; and (3) enable the Portfolios to meet
other emergency expenses as defined in the Citi Credit Agreement. The Portfolios to which the line of credit is available pay a commitment fee equal to 0.08% per annum on the daily unused portion of the committed line amount. Each of the Portfolios will pay its pro rata share of the commitment fee.
On November 11, 2008, the Board approved an extension of the unsecured committed revolving line of credit agreement with Citibank, N.A. for an aggregate amount of $100,000,000. The Citi Credit Agreement was extended for an additional thirty-day period, terminating on December 18, 2008. The portfolios to which the line of credit is available pay a commitment fee equal to 0.15% per annum on the daily unused portion of the committed line amount.
On December 11, 2008, the Board approved an unsecured committed revolving line of credit agreement with The Bank of New York Mellon (the “BNY Credit Agreement”) for an aggregate amount of $100,000,000, not to exceed $50,000,000 with respect to any one Portfolio or 10% of the Portfolio’s value of total assets if Net Asset Value is less than $25,000,000, effective December 18, 2008 for a 364-day period, terminating on December 16, 2009. The proceeds may be used to: (1) temporarily finance the purchase and sale of securities; (2) finance the redemption of shares of an investor in the Portfolios; and (3) enable the Portfolios to meet other emergency expenses as defined in the BNY Credit Agreement. The Portfolios to which the line of credit is available pay a commitment fee equal to 0.125% per annum on the daily unused portion of the committed line amount.
Generally, borrowings under the credit agreements accrue interest at the federal funds rate plus a specified margin. Repayments generally must be made within 30 days after the date of a revolving credit advance. The following Portfolios utilized the line of credit during the year ended December 31, 2008:
| | | | | | | | |
| | | Days
Utilized | | Approximate
Average Daily
Balance | | Approximate
Weighted
Average
Interest Rate | |
VP Index Plus LargeCap | | 17 | | $ | 13,961,765 | | 1.88 | % |
VP Index Plus MidCap | | 11 | | | 10,875,455 | | 1.85 | |
VP Index Plus SmallCap | | 15 | | | 8,470,000 | | 1.94 | |
27
NOTES TO FINANCIAL STATEMENTSASOF DECEMBER 31, 2008 (CONTINUED)
NOTE 9 — CAPITAL SHARES
Transactions in capital shares and dollars were as follows:
| | | | | | | | | | | | | | | | | | | | | | |
| | | Shares sold | | Reinvestment
of
distributions | | Shares
redeemed | | | Net increase
(decrease) in
shares
outstanding | | | | | Shares sold | | Reinvestment
of
distributions | | Shares
redeemed | | | Net increase
(decrease) in
shares
outstanding | |
Year or period ended | | # | | # | | # | | | # | | | | | ($) | | ($) | | �� ($) | | | ($) | |
VP Index Plus LargeCap | | | | | | | | | | | | | | | | |
Class I | | | | | | | | | | | | | | | | | | | | | | |
12-31-08 | | 18,229,336 | | 10,840,426 | | (92,001,496 | ) | | (62,931,734 | ) | | | | 282,508,457 | | 164,882,876 | | (1,413,077,540 | ) | | (965,686,207 | ) |
12-31-07 | | 23,704,067 | | 1,705,469 | | (31,787,126 | ) | | (6,377,590 | ) | | | | 427,491,782 | | 29,658,100 | | (576,171,274 | ) | | (119,021,392 | ) |
Class S | | | | | | | | | | | | | | | | | | | | | | |
12-31-08 | | 5,309,574 | | 1,823,783 | | (7,040,019 | ) | | 93,338 | | | | | 82,671,538 | | 27,539,126 | | (99,181,667 | ) | | 11,028,997 | |
12-31-07 | | 8,778,375 | | 103,873 | | (3,200,299 | ) | | 5,681,949 | | | | | 157,346,165 | | 1,795,960 | | (57,466,289 | ) | | 101,675,836 | |
VP Index Plus MidCap | | | | | | | | | | | | | | | | |
Class I | | | | | | | | | | | | | | | | | | | | | | |
12-31-08 | | 6,462,183 | | 8,397,804 | | (34,069,136 | ) | | (19,209,149 | ) | | | | 96,400,909 | | 124,035,571 | | (517,320,853 | ) | | (296,884,373 | ) |
12-31-07 | | 9,625,192 | | 5,352,669 | | (11,521,257 | ) | | 3,456,604 | | | | | 183,759,944 | | 98,221,472 | | (218,617,745 | ) | | 63,363,671 | |
Class S | | | | | | | | | | | | | | | | | | | | | | |
12-31-08 | | 1,214,189 | | 1,955,719 | | (4,074,969 | ) | | (905,061 | ) | | | | 18,238,230 | | 28,612,172 | | (58,457,003 | ) | | (11,606,601 | ) |
12-31-07 | | 3,505,312 | | 992,667 | | (3,111,849 | ) | | 1,386,130 | | | | | 66,776,651 | | 18,056,621 | | (58,949,983 | ) | | 25,883,289 | |
VP Index Plus SmallCap | | | | | | | | | | | | | | | | |
Class I | | | | | | | | | | | | | | | | | | | | | | |
12-31-08 | | 6,415,118 | | 2,651,405 | | (29,643,796 | ) | | (20,577,273 | ) | | | | 85,265,910 | | 35,078,084 | | (392,832,028 | ) | | (272,488,034 | ) |
12-31-07 | | 9,936,569 | | 4,396,124 | | (13,706,804 | ) | | 625,889 | | | | | 167,629,988 | | 73,327,354 | | (229,248,987 | ) | | 11,708,355 | |
Class S | | | | | | | | | | | | | | | | | | | | | | |
12-31-08 | | 1,235,200 | | 815,556 | | (3,898,281 | ) | | (1,847,525 | ) | | | | 16,801,834 | | 10,691,941 | | (49,390,955 | ) | | (21,897,180 | ) |
12-31-07 | | 2,418,198 | | 1,192,855 | | (2,970,975 | ) | | 640,078 | | | | | 39,679,152 | | 19,705,972 | | (49,463,578 | ) | | 9,921,546 | |
NOTE 10 — SECURITIES LENDING
Under an agreement with The Bank of New York Mellon (“BNY”), the Portfolios can lend their securities to approved brokers, dealers and other financial institutions. Loans are collateralized by cash and U.S. government securities. The collateral is equal to at least 105% of the market value of non-U.S. securities loaned and 102% of the market value of U.S. securities loaned when the transaction is entered into and is adjusted daily for changes in the market values of the securities on loan. The cash collateral received is invested in approved investments as defined in the Securities Lending Agreement with BNY (the “Agreement”). The Portfolios bear the risk of loss with respect to the investment of collateral. Currently, the cash collateral is invested in the Bank of New York Mellon Corp. Institutional Cash Reserves Fund (“BICR Fund”). BNY serves as investment manager, custodian and operational trustee of the BICR Fund. As of December 31, 2008, the BICR Fund held certain defaulted securities that had market values significantly
below amortized cost. The investment in the BICR Fund is included in the Portfolio of Investments under Securities Lending Collateral and the unrealized loss on such investment is included in Net Unrealized Depreciation on the Statements of Assets and Liabilities. The Portfolios agreed, in principle, to the terms of capital support extended by The Bank of New York Mellon Corporation (“BNYC”), an affiliated company of BNY, for the certain defaulted securities held by the BICR Fund. BNYC will support the value of these securities up to a certain amount and subject, in part, to the Portfolios’ continued lending of securities. The recorded value of each Portfolio’s investment in the BICR Fund includes the value of the underlying securities held by the BICR Fund and the estimated value of the support to be provided by BNYC.
Generally, in the event of counterparty default, the Portfolios have the right to use the collateral to offset losses incurred. The Agreement contains certain guarantees by BNY in the event of counterparty default and/or a borrower’s failure to return a loaned security;
28
NOTES TO FINANCIAL STATEMENTSASOF DECEMBER 31, 2008 (CONTINUED)
NOTE 10 — SECURITIES LENDING (continued)
however, there would be a potential loss to the Portfolios in the event the Portfolios are delayed or prevented from exercising their right to dispose of the collateral. Engaging in securities lending could have a leveraging effect, which may intensify the credit, market and other risks associated with investing in a Portfolio. At December 31, 2008, the following Portfolios had securities on loan with the following market values:
| | | | | | |
| | | Value of
Securities
Loaned | | Cash
Collateral
Received* |
VP Index Plus LargeCap | | $ | 11,316,930 | | $ | 11,324,932 |
VP Index Plus MidCap | | | 36,870,421 | | | 37,056,930 |
VP Index Plus SmallCap | | | 33,837,508 | | | 34,105,517 |
| * | Cash collateral received was invested in the BICR Fund, the fair value of which is presented in the respective Portfolio’s Portfolio of Investments. |
NOTE 11 — FEDERAL INCOME TAXES AND OTHER TAX MATTERS
The amount of distributions from net investment income and net realized capital gains are determined in
accordance with federal income tax regulations, which may differ from U.S. generally accepted accounting principles for investment companies. These book/tax differences may be either temporary or permanent. Permanent differences are reclassified within the capital accounts based on their federal tax-basis treatment; temporary differences are not reclassified. Key differences include the treatment of short-term capital gains, foreign currency transactions, and wash sale deferrals. Distributions in excess of net investment income and/or net realized capital gains for tax purposes are reported as return of capital.
The following permanent tax differences have been reclassified as of December 31, 2008:
| | | | | | | |
| | | Undistributed Net Investment Income | | | Accumulated Net Realized Gains / (Losses) |
VP Index Plus LargeCap | | $ | (155,123 | ) | | $ | 155,123 |
VP Index Plus MidCap | | | (751,824 | ) | | | 751,824 |
VP Index Plus SmallCap | | | (429,972 | ) | | | 429,972 |
Dividends paid by the Portfolios from net investment income and distributions of net realized short-term capital gains are, for federal income tax purposes, taxable as ordinary income to shareholders.
The tax composition of dividends and distributions to shareholders was as follows:
| | | | | | | | | | | | |
| | | Year Ended December 31, 2008 | | Year Ended December 31, 2007 |
| | | Ordinary Income | | Long-Term Capital Gains | | Ordinary Income | | Long-Term Capital Gains |
VP Index Plus LargeCap | | $ | 71,475,961 | | $ | 120,946,041 | | $ | 31,454,060 | | $ | — |
VP Index Plus MidCap | | | 23,925,398 | | | 128,722,345 | | | 36,018,831 | | | 80,259,262 |
VP Index Plus SmallCap | | | 5,433,138 | | | 40,336,887 | | | 39,157,943 | | | 53,875,383 |
The tax-basis components of distributable earnings and the expiration dates of the capital loss carryforwards which may be used to offset future realized capital gains for federal income tax purposes as of December 31, 2008 were:
| | | | | | | | | | | | | |
| | | Undistributed Ordinary Income | | Unrealized Appreciation/ (Depreciation) | | | Capital Loss Carryforwards | | | Expiration Dates |
VP Index Plus LargeCap | | $ | 26,695,514 | | $ | (205,097,739 | ) | | $ | (331,965,058 | ) | | 2016 |
VP Index Plus MidCap | | | 9,893,675 | | | (229,163,490 | ) | | | (161,783,607 | ) | | 2016 |
VP Index Plus SmallCap | | | 5,073,760 | | | (118,609,455 | ) | | | (109,110,011 | ) | | 2016 |
The Portfolios’ major tax jurisdictions are federal and Arizona. The earliest tax year that remains subject to examination by these jurisdictions is 2004.
29
NOTES TO FINANCIAL STATEMENTSASOF DECEMBER 31, 2008 (CONTINUED)
NOTE 12 — OTHER ACCOUNTING PRONOUNCEMENTS
On March 19, 2008, the FASB issued Statement of Financial Accounting Standards No. 161 (“SFAS No. 161”), “Disclosure about Derivative Instruments and Hedging Activities.” This new accounting statement requires enhanced disclosures about an entity’s derivative and hedging activities. Entities are required to provide enhanced disclosures about (a) how and why an entity invests in derivatives, (b) how derivatives are accounted for under SFAS No. 133, and (c) how derivatives affect an entity’s financial position, financial performance, and cash flows. SFAS No. 161 also requires enhanced disclosures regarding credit-risk-related contingent features of derivative instruments. SFAS No. 161 is effective for financial statements issued for fiscal years and interim periods beginning after November 15, 2008. As of December 31, 2008, management of the Portfolios is currently assessing the impact of the expanded financial statement disclosures that will result from adopting SFAS No. 161.
NOTE 13 — SUBSEQUENT EVENTS
Effective May 1, 2009, the name of each Portfolio will be renamed from “ING VP Index Plus LargeCap Portfolio,” “ING VP Index Plus MidCap Portfolio” and “ING VP Index Plus SmallCap Portfolio” to “ING Index Plus LargeCap Portfolio,” “ING Index Plus MidCap Portfolio” and “ING Index Plus SmallCap Portfolio,” respectively.
NOTE 14 — INFORMATION REGARDING TRADING OF ING’S U.S. MUTUAL FUNDS
As discussed in earlier supplements that were previously filed with the SEC, ING agreed with the Portfolios to indemnify and hold harmless the Portfolios from all damages resulting from wrongful conduct by ING or its employees or from ING’s internal investigation, any investigations conducted by any governmental or self-regulatory agencies, litigation or other formal proceedings, including any proceedings by the U.S. Securities and Exchange Commission in connection with investigations related to mutual funds and variable insurance products. In November, 2007, ING settled its indemnification commitments by making payments to the affected Portfolios. In connection with the settlement, ING paid $22,785 to VP Index Plus LargeCap and $23,412 to VP Index Plus MidCap.
30
| | |
| ING VP INDEX PLUS LARGECAP PORTFOLIO | | PORTFOLIO OF INVESTMENTS ASOF DECEMBER 31, 2008 |
| | | | | | | |
| Shares | | | | | | Value |
| | | | | | | |
| COMMON STOCK: 96.6% | | | |
| Advertising: 0.9% | | | |
| 449,450 | | @ | | Interpublic Group of Cos., Inc. | | $ | 1,779,822 |
| 235,550 | | | | Omnicom Group | | | 6,341,006 |
| | | | | | | |
| | | | | | | 8,120,828 |
| | | | | | | |
| Aerospace/Defense: 2.7% | | | |
| 94,100 | | | | General Dynamics Corp. | | | 5,419,219 |
| 124,150 | | | | Goodrich Corp. | | | 4,596,033 |
| 46,550 | | | | Lockheed Martin Corp. | | | 3,913,924 |
| 157,750 | | | | Northrop Grumman Corp. | | | 7,105,060 |
| 45,100 | | | | Raytheon Co. | | | 2,301,904 |
| | | | | | | |
| | | | | | | 23,336,140 |
| | | | | | | |
| Agriculture: 2.6% | | | |
| 489,250 | | | | Altria Group, Inc. | | | 7,368,105 |
| 176,782 | | | | Archer-Daniels-Midland Co. | | | 5,096,625 |
| 95,487 | | | | Philip Morris International, Inc. | | | 4,154,639 |
| 148,301 | | | | Reynolds American, Inc. | | | 5,978,013 |
| | | | | | | |
| | | | | | | 22,597,382 |
| | | | | | | |
| Airlines: 0.4% | | | |
| 357,300 | | | | Southwest Airlines Co. | | | 3,079,926 |
| | | | | | | |
| | | | | | | 3,079,926 |
| | | | | | | |
| Apparel: 0.4% | | | |
| 163,900 | | @ | | Coach, Inc. | | | 3,404,203 |
| | | | | | | |
| | | | | | | 3,404,203 |
| | | | | | | |
| Banks: 7.7% | | | |
| 411,250 | | | | Bank of America Corp. | | | 5,790,400 |
| 214,750 | | | | Bank of New York Mellon Corp. | | | 6,083,868 |
| 172,350 | | | | BB&T Corp. | | | 4,732,731 |
| 157,062 | | L | | Capital One Financial Corp. | | | 5,008,707 |
| 196,100 | | | | Citigroup, Inc. | | | 1,315,831 |
| 16,776 | | | | Goldman Sachs Group, Inc. | | | 1,415,727 |
| 176,700 | | L | | Huntington Bancshares, Inc. | | | 1,353,522 |
| 318,250 | | | | JPMorgan Chase & Co. | | | 10,034,423 |
| 57,100 | | L | | M&T Bank Corp. | | | 3,278,111 |
| 111,700 | | | | Morgan Stanley | | | 1,791,668 |
| 62,450 | | | | Northern Trust Corp. | | | 3,256,143 |
| 111,562 | | | | PNC Financial Services Group, Inc. | | | 5,466,538 |
| 142,545 | | | | State Street Corp. | | | 5,606,295 |
| 151,609 | | | | US Bancorp. | | | 3,791,741 |
| 270,815 | | | | Wells Fargo & Co. | | | 7,983,626 |
| | | | | | | |
| | | | | | | 66,909,331 |
| | | | | | | |
| Beverages: 1.1% | | | |
| 89,618 | | | | Coca-Cola Co. | | | 4,057,007 |
| 118,100 | | | | Coca-Cola Enterprises, Inc. | | | 1,420,743 |
| 133,450 | | | | Pepsi Bottling Group, Inc. | | | 3,003,960 |
| 15,307 | | | | PepsiCo, Inc. | | | 838,364 |
| | | | | | | |
| | | | | | | 9,320,074 |
| | | | | | | |
| Biotechnology: 2.2% | | | |
| 195,000 | | @ | | Amgen, Inc. | | | 11,261,250 |
| 90,450 | | @ | | Biogen Idec, Inc. | | | 4,308,134 |
| 165,367 | | @ | | Life Technologies Corp. | | | 3,854,705 |
| | | | | | | |
| | | | | | | 19,424,089 |
| | | | | | | |
| Chemicals: 1.5% | | | |
| 9,000 | | | | Monsanto Co. | | | 633,150 |
| 134,750 | | | | PPG Industries, Inc. | | | 5,717,443 |
| | | | | | | |
| Shares | | | | | | Value |
| | | | | | | |
| Chemicals: (continued) | | | |
| 13,117 | | | | Rohm & Haas Co. | | $ | 810,499 |
| 92,300 | | L | | Sherwin-Williams Co. | | | 5,514,925 |
| | | | | | | |
| | | | | | | 12,676,017 |
| | | | | | | |
| Commercial Services: 1.2% | | | |
| 40,700 | | @ | | Apollo Group, Inc. - Class A | | | 3,118,434 |
| 193,814 | | | | H&R Block, Inc. | | | 4,403,454 |
| 190,977 | | | | RR Donnelley & Sons Co. | | | 2,593,468 |
| | | | | | | |
| | | | | | | 10,115,356 |
| | | | | | | |
| Computers: 7.3% | | | |
| 61,800 | | @ | | Affiliated Computer Services, Inc. | | | 2,839,710 |
| 111,493 | | @ | | Apple, Inc. | | | 9,515,928 |
| 82,050 | | @ | | Computer Sciences Corp. | | | 2,883,237 |
| 295,750 | | @ | | Dell, Inc. | | | 3,028,480 |
| 308,250 | | @ | | EMC Corp. | | | 3,227,378 |
| 525,514 | | | | Hewlett-Packard Co. | | | 19,070,896 |
| 213,950 | | | | International Business Machines Corp. | | | 18,006,032 |
| 89,264 | | @ | | Lexmark International, Inc. | | | 2,401,202 |
| 170,400 | | @ | | Teradata Corp. | | | 2,527,032 |
| | | | | | | |
| | | | | | | 63,499,895 |
| | | | | | | |
| Cosmetics/Personal Care: 2.0% | | | |
| 286,492 | | | | Procter & Gamble Co. | | | 17,710,935 |
| | | | | | | |
| | | | | | | 17,710,935 |
| | | | | | | |
| Distribution/Wholesale: 0.2% | | | |
| 49,900 | | | | Genuine Parts Co. | | | 1,889,214 |
| | | | | | | |
| | | | | | | 1,889,214 |
| | | | | | | |
| Diversified Financial Services: 1.7% | | | |
| 189,550 | | | | Ameriprise Financial, Inc. | | | 4,427,888 |
| 150,303 | | | | Charles Schwab Corp. | | | 2,430,400 |
| 12,962 | | | | CME Group, Inc. | | | 2,697,522 |
| 93,774 | | | | Discover Financial Services | | | 893,666 |
| 48,000 | | | | Federated Investors, Inc. | | | 814,080 |
| 101,700 | | @ | | Nasdaq Stock Market, Inc. | | | 2,513,007 |
| 43,614 | | | | NYSE Euronext | | | 1,194,151 |
| | | | | | | |
| | | | | | | 14,970,714 |
| | | | | | | |
| Electric: 2.9% | | | |
| 642,400 | | @ | | AES Corp. | | | 5,293,376 |
| 265,600 | | | | CMS Energy Corp. | | | 2,685,216 |
| 19,200 | | S | | Constellation Energy Group, Inc. | | | 481,728 |
| 155,700 | | | | DTE Energy Co. | | | 5,553,819 |
| 30,550 | | | | Edison International | | | 981,266 |
| 49,900 | | | | FirstEnergy Corp. | | | 2,424,142 |
| 117,800 | | | | Pacific Gas & Electric Co. | | | 4,560,038 |
| 106,200 | | | | Pinnacle West Capital Corp. | | | 3,412,206 |
| | | | | | | |
| | | | | | | 25,391,791 |
| | | | | | | |
| Electronics: 0.6% | | | |
| 173,850 | | @ | | Agilent Technologies, Inc. | | | 2,717,276 |
| 199,700 | | | | Jabil Circuit, Inc. | | | 1,347,975 |
| 35,560 | | @ | | Waters Corp. | | | 1,303,274 |
| | | | | | | |
| | | | | | | 5,368,525 |
| | | | | | | |
| Engineering & Construction: 0.5% | | | |
| 94,955 | | | | Fluor Corp. | | | 4,260,631 |
| | | | | | | |
| | | | | | | 4,260,631 |
| | | | | | | |
See Accompanying Notes to Financial Statements
31
| | |
| ING VP INDEX PLUS LARGECAP PORTFOLIO | | PORTFOLIO OF INVESTMENTS ASOF DECEMBER 31, 2008 (CONTINUED) |
| | | | | | | |
| Shares | | | | | | Value |
| | | | | | | |
| Environmental Control: 0.0% | | | |
| 16,560 | | | | Republic Services, Inc. | | $ | 410,522 |
| | | | | | | |
| | | | | | | 410,522 |
| | | | | | | |
| Food: 2.2% | | | |
| 383,100 | | | | ConAgra Foods, Inc. | | | 6,321,150 |
| 31,010 | | | | JM Smucker Co. | | | 1,344,594 |
| 182,500 | | | | Safeway, Inc. | | | 4,338,025 |
| 491,813 | | | | Sara Lee Corp. | | | 4,814,849 |
| 135,382 | | | | Supervalu, Inc. | | | 1,976,577 |
| | | | | | | |
| | | | | | | 18,795,195 |
| | | | | | | |
| Forest Products & Paper: 0.4% | | | |
| 276,900 | | | | International Paper Co. | | | 3,267,420 |
| | | | | | | |
| | | | | | | 3,267,420 |
| | | | | | | |
| Gas: 0.8% | | | |
| 327,702 | | | | CenterPoint Energy, Inc. | | | 4,135,599 |
| 213,500 | | | | NiSource, Inc. | | | 2,342,095 |
| | | | | | | |
| | | | | | | 6,477,694 |
| | | | | | | |
| Hand/Machine Tools: 0.8% | | | |
| 57,504 | | | | Black & Decker Corp. | | | 2,404,242 |
| 37,500 | | | | Snap-On, Inc. | | | 1,476,750 |
| 79,600 | | | | Stanley Works | | | 2,714,360 |
| | | | | | | |
| | | | | | | 6,595,352 |
| | | | | | | |
| Healthcare - Products: 1.8% | | | |
| 200,600 | | @ | | Boston Scientific Corp. | | | 1,552,644 |
| 30,300 | | | | CR Bard, Inc. | | | 2,553,078 |
| 168,150 | | | | Johnson & Johnson | | | 10,060,415 |
| 40,450 | | @ | | St. Jude Medical, Inc. | | | 1,333,232 |
| 11,872 | | @ | | Varian Medical Systems, Inc. | | | 415,995 |
| | | | | | | |
| | | | | | | 15,915,364 |
| | | | | | | |
| Healthcare - Services: 2.7% | | | |
| 163,950 | | | | Aetna, Inc. | | | 4,672,575 |
| 142,309 | | | | Cigna Corp. | | | 2,397,907 |
| 116,100 | | @ | | Humana, Inc. | | | 4,328,208 |
| 92,808 | | @ | | Laboratory Corp. of America Holdings | | | 5,977,763 |
| 98,100 | | | | UnitedHealth Group, Inc. | | | 2,609,460 |
| 76,500 | | @ | | WellPoint, Inc. | | | 3,222,945 |
| | | | | | | |
| | | | | | | 23,208,858 |
| | | | | | | |
| Home Builders: 0.2% | | | |
| 70,400 | | L | | KB Home | | | 958,848 |
| 74,400 | | | | Pulte Homes, Inc. | | | 813,192 |
| | | | | | | |
| | | | | | | 1,772,040 |
| | | | | | | |
| Household Products/Wares: 0.9% | | | |
| 102,100 | | | | Avery Dennison Corp. | | | 3,341,733 |
| 89,500 | | | | Kimberly-Clark Corp. | | | 4,720,230 |
| | | | | | | |
| | | | | | | 8,061,963 |
| | | | | | | |
| Insurance: 3.3% | | | |
| 146,750 | | L | | Aflac, Inc. | | | 6,727,020 |
| 113,200 | | | | AON Corp. | | | 5,170,976 |
| 30,400 | | | | Chubb Corp. | | | 1,550,400 |
| 168,700 | | | | Loews Corp. | | | 4,765,775 |
| 6,549 | | | | Metlife, Inc. | | | 228,298 |
| 81,300 | | | | Torchmark Corp. | | | 3,634,110 |
| 33,507 | | | | Travelers Cos., Inc. | | | 1,514,516 |
| 256,360 | | | | UnumProvident Corp. | | | 4,768,296 |
| | | | | | | |
| | | | | | | 28,359,391 |
| | | | | | | |
| | | | | | | |
| Shares | | | | | | Value |
| | | | | | | |
| Internet: 1.2% | | | |
| 264,507 | | @, S | | eBay, Inc. | | $ | 3,692,518 |
| 13,700 | | @ | | Google, Inc. - Class A | | | 4,214,805 |
| 210,000 | | @ | | Symantec Corp. | | | 2,839,200 |
| | | | | | | |
| | | | | | | 10,746,523 |
| | | | | | | |
| Iron/Steel: 0.6% | | | | | |
| 57,350 | | | | Nucor Corp. | | | 2,649,570 |
| 56,550 | | | | United States Steel Corp. | | | 2,103,660 |
| | | | | | | |
| | | | | | | 4,753,230 |
| | | | | | | |
| Machinery - Diversified: 0.8% | | | |
| 50,700 | | | | Cummins, Inc. | | | 1,355,211 |
| 55,300 | | | | Flowserve Corp. | | | 2,847,950 |
| 71,400 | | L | | Rockwell Automation, Inc. | | | 2,301,936 |
| | | | | | | |
| | | | | | | 6,505,097 |
| | | | | | | |
| Media: 2.9% | | | | | |
| 326,524 | | | | Comcast Corp. - Class A | | | 5,511,725 |
| 183,950 | | @ | | DIRECTV Group, Inc. | | | 4,214,295 |
| 428,738 | | | | News Corp. - Class A | | | 3,897,228 |
| 1,108,305 | | | | Time Warner, Inc. | | | 11,149,548 |
| | | | | | | |
| | | | | | | 24,772,796 |
| | | | | | | |
| Metal Fabricate/Hardware: 0.7% | | | |
| 97,995 | | | | Precision Castparts Corp. | | | 5,828,743 |
| | | | | | | |
| | | | | | | 5,828,743 |
| | | | | | | |
| Mining: 0.1% | | | | | |
| 18,950 | | | | Freeport-McMoRan Copper & Gold, Inc. | | | 463,138 |
| | | | | | | |
| | | | | | | 463,138 |
| | | | | | | |
| Miscellaneous Manufacturing: 3.2% | | | |
| 114,400 | | | | Cooper Industries Ltd. | | | 3,343,912 |
| 180,200 | | | | Dover Corp. | | | 5,932,184 |
| 1,006,362 | | | | General Electric Co. | | | 16,303,064 |
| 57,575 | | | | Parker Hannifin Corp. | | | 2,449,241 |
| | | | | | | |
| | | | | | | 28,028,401 |
| | | | | | | |
| Office/Business Equipment: 1.2% | | | |
| 197,600 | | | | Pitney Bowes, Inc. | | | 5,034,848 |
| 668,600 | | | | Xerox Corp. | | | 5,328,742 |
| | | | | | | |
| | | | | | | 10,363,590 |
| | | | | | | |
| Oil & Gas: 12.2% | | | |
| 52,904 | | | | Apache Corp. | | | 3,942,935 |
| 199,805 | | | | Chevron Corp. | | | 14,779,576 |
| 270,776 | | | | ConocoPhillips | | | 14,026,197 |
| 668,800 | | | | ExxonMobil Corp. | | | 53,390,304 |
| 20,992 | | | | Hess Corp. | | | 1,126,011 |
| 123,168 | | | | Murphy Oil Corp. | | | 5,462,501 |
| 202,500 | | @, @@ | | Nabors Industries Ltd. | | | 2,423,925 |
| 110,800 | | | | Noble Corp. | | | 2,447,572 |
| 62,918 | | | | Sunoco, Inc. | | | 2,734,416 |
| 88,262 | | L | | Tesoro Corp. | | | 1,162,411 |
| 191,906 | | | | Valero Energy Corp. | | | 4,152,846 |
| | | | | | | |
| | | | | | | 105,648,694 |
| | | | | | | |
See Accompanying Notes to Financial Statements
32
| | |
| ING VP INDEX PLUS LARGECAP PORTFOLIO | | PORTFOLIO OF INVESTMENTS ASOF DECEMBER 31, 2008 (CONTINUED) |
| | | | | | | |
| Shares | | | | | | Value |
| | | | | | | |
| Oil & Gas Services: 1.4% | | | |
| 101,917 | | | | BJ Services Co. | | $ | 1,189,371 |
| 208,675 | | @ | | Cameron International Corp. | | | 4,277,838 |
| 189,427 | | @ | | National Oilwell Varco, Inc. | | | 4,629,596 |
| 95,700 | | | | Smith International, Inc. | | | 2,190,573 |
| | | | | | | |
| | | | | | | 12,287,378 |
| | | | | | | |
| Packaging & Containers: 0.7% | | | |
| 96,950 | | | | Ball Corp. | | | 4,032,151 |
| 70,600 | | S | | Bemis Co. | | | 1,671,808 |
| | | | | | | |
| | | | | | | 5,703,959 |
| | | | | | | |
| Pharmaceuticals: 5.7% | | | |
| 16,298 | | | | Abbott Laboratories | | | 869,824 |
| 107,400 | | | | Bristol-Myers Squibb Co. | | | 2,497,050 |
| 227,659 | | | | Eli Lilly & Co. | | | 9,167,829 |
| 55,350 | | @ | | Express Scripts, Inc. | | | 3,043,143 |
| 259,650 | | @ | | Forest Laboratories, Inc. | | | 6,613,286 |
| 118,999 | | @ | | King Pharmaceuticals, Inc. | | | 1,263,769 |
| 77,091 | | | | Merck & Co., Inc. | | | 2,343,566 |
| 873,250 | | | | Pfizer, Inc. | | | 15,465,258 |
| 185,700 | | | | Schering-Plough Corp. | | | 3,162,471 |
| 100,137 | | @ | | Watson Pharmaceuticals, Inc. | | | 2,660,640 |
| 60,900 | | | | Wyeth | | | 2,284,359 |
| | | | | | | |
| | | | | | | 49,371,195 |
| | | | | | | |
| Pipelines: 0.1% | | | |
| 63,787 | | | | Spectra Energy Corp. | | | 1,004,007 |
| | | | | | | |
| | | | | | | 1,004,007 |
| | | | | | | |
| Retail: 6.2% | | | | | |
| 39,038 | | @, L | | Autozone, Inc. | | | 5,444,630 |
| 82,800 | | @ | | Big Lots, Inc. | | | 1,199,772 |
| 294,000 | | | | CVS Caremark Corp. | | | 8,449,560 |
| 145,500 | | | | Family Dollar Stores, Inc. | | | 3,793,185 |
| 38,450 | | @ | | GameStop Corp. | | | 832,827 |
| 359,950 | | | | Gap, Inc. | | | 4,819,731 |
| 50,000 | | | | Lowe’s Cos., Inc. | | | 1,076,000 |
| 111,379 | | | | McDonald’s Corp. | | | 6,926,660 |
| 91,855 | | | | RadioShack Corp. | | | 1,096,749 |
| 116,300 | | | | Staples, Inc. | | | 2,084,096 |
| 313,452 | | | | Wal-Mart Stores, Inc. | | | 17,572,119 |
| | | | | | | |
| | | | | | | 53,295,329 |
| | | | | | | |
| Savings & Loans: 0.9% | | | |
| 494,300 | | | | Hudson City Bancorp., Inc. | | | 7,889,028 |
| | | | | | | |
| | | | | | | 7,889,028 |
| | | | | | | |
| Semiconductors: 0.6% | | | |
| 204,900 | | | | Intel Corp. | | | 3,003,834 |
| 108,750 | | @ | | QLogic Corp. | | | 1,461,600 |
| 44,400 | | | | Xilinx, Inc. | | | 791,208 |
| | | | | | | |
| | | | | | | 5,256,642 |
| | | | | | | |
| Software: 3.2% | | | |
| 57,000 | | @ | | Autodesk, Inc. | | | 1,120,050 |
| 243,400 | | @ | | Compuware Corp. | | | 1,642,950 |
| 168,900 | | | | Fidelity National Information Services, Inc. | | | 2,748,003 |
| 109,500 | | @ | | Fiserv, Inc. | | | 3,982,515 |
| 174,900 | | | | IMS Health, Inc. | | | 2,651,484 |
| | | | | | | |
| Shares | | | | | | Value |
| | | | | | | |
| Software: (continued) | | | |
| 679,575 | | | | Microsoft Corp. | | $ | 13,210,938 |
| 152,626 | | @ | | Oracle Corp. | | | 2,706,059 |
| | | | | | | |
| | | | | | | 28,061,999 |
| | | | | | | |
| Telecommunications: 5.2% | | | |
| 544,856 | | | | AT&T, Inc. | | | 15,528,396 |
| 735,992 | | @ | | Cisco Systems, Inc. | | | 11,996,670 |
| 41,650 | | S | | Corning, Inc. | | | 396,925 |
| 39,450 | | | | Embarq Corp. | | | 1,418,622 |
| 100,382 | | | | Harris Corp. | | | 3,819,535 |
| 123,950 | | @ | | JDS Uniphase Corp. | | | 452,418 |
| 251,016 | | | | Verizon Communications, Inc. | | | 8,509,442 |
| 313,804 | | | | Windstream Corp. | | | 2,886,997 |
| | | | | | | |
| | | | | | | 45,009,005 |
| | | | | | | |
| Toys/Games/Hobbies: 0.4% | | | |
| 128,200 | | | | Hasbro, Inc. | | | 3,739,594 |
| | | | | | | |
| | | | | | | 3,739,594 |
| | | | | | | |
| Transportation: 0.3% | | | |
| 59,250 | | | | Ryder System, Inc. | | | 2,297,715 |
| | | | | | | |
| | | | | | | 2,297,715 |
| | | | | | | |
| | | | Total Common Stock
(Cost $1,000,469,936) | | | 835,964,913 |
| | | | | | | |
| REAL ESTATE INVESTMENT TRUSTS: 1.3% | | | |
| Apartments: 0.3% | | | |
| 45,672 | | | | Apartment Investment & Management Co. | | | 527,512 |
| 80,335 | | | | Equity Residential | | | 2,395,590 |
| | | | | | | |
| | | | | | | 2,923,102 |
| | | | | | | |
| Health Care: 0.6% | | | |
| 198,617 | | | | HCP, Inc. | | | 5,515,594 |
| | | | | | | |
| | | | | | | 5,515,594 |
| | | | | | | |
| Hotels: 0.2% | | | |
| 260,600 | | | | Host Hotels & Resorts, Inc. | | | 1,972,742 |
| | | | | | | |
| | | | | | | 1,972,742 |
| | | | | | | |
| Storage: 0.2% | | | |
| 17,300 | | | | Public Storage, Inc. | | | 1,375,350 |
| | | | | | | |
| | | | | | | 1,375,350 |
| | | | | | | |
| | | | Total Real Estate Investment Trusts (Cost $11,926,496) | | | 11,786,788 |
| | | | | | | |
| | | | Total Long-Term Investments
(Cost $1,012,396,432) | | | 847,751,701 |
| | | | | | | |
| SHORT-TERM INVESTMENTS: 3.3% | | | |
| Affiliated Mutual Fund: 1.4% | | | |
| 12,508,000 | | S | | ING Institutional Prime Money Market Fund - Class I | | | 12,508,000 |
| | | | | | | |
| | | | Total Mutual Fund
(Cost $12,508,000) | | | 12,508,000 |
| | | | | | | |
See Accompanying Notes to Financial Statements
33
| | |
| ING VP INDEX PLUS LARGECAP PORTFOLIO | | PORTFOLIO OF INVESTMENTS ASOF DECEMBER 31, 2008 (CONTINUED) |
| | | | | | | | | | | | |
| | | | |
Principal
Amount | | | | | | | | | Value | |
| | | | | | | | | | | | |
| | Repurchase Agreement: 0.6% | | | | | | | |
| $ | 4,966,000 | | S | | Morgan Stanley Repurchase Agreement dated 12/31/08, 0.030%, due 01/02/09, $4,966,008 to be received upon repurchase (Collateralized by $8,770,000 Resolution Funding Corporation, Discount Note, Market Value $5,067,306, due 01/15/21) | | | | | $ | 4,966,000 | |
| | | | | | | | | | | | |
| | | | | Total Repurchase Agreement
(Cost $4,966,000) | | | | | | 4,966,000 | |
| | | | | | | | | | | | |
| | Securities Lending Collateralcc: 1.3% | | | | | | | |
| | 11,324,932 | | | | Bank of New York Mellon Corp. Institutional Cash Reserves | | | | | | 11,003,171 | |
| | | | | | | | | | | | |
| | | | | Total Securities Lending Collateral
(Cost $11,324,932) | | | | | | 11,003,171 | |
| | | | | | | | | | | | |
| | | | | Total Short-Term Investments
(Cost $28,798,932) | | | | | | 28,477,171 | |
| | | | | | | | | | | | |
| | | | | Total Investments in
Securities
(Cost $1,041,195,364)* | | 101.2 | % | | $ | 876,228,872 | |
| | | | | Other Assets and Liabilities - Net | | (1.2 | ) | | | (10,550,577 | ) |
| | | | | | | | | | | | |
| | | | | Net Assets | | 100.0 | % | | $ | 865,678,295 | |
| | | | | | | | | | | | |
| @ | Non-income producing security |
| cc | Securities purchased with cash collateral for securities loaned. |
| S | All or a portion of this security is segregated to cover collateral requirements for applicable futures, options, swaps, foreign forward currency contracts and/or when-issued or delayed-delivery securities. |
| L | Loaned security, a portion or all of the security is on loan at December 31, 2008. |
| * | Cost for federal income tax purposes is $1,081,326,611. |
| | | | |
Net unrealized depreciation consists of: | |
Gross Unrealized Appreciation | | $ | 19,177,348 | |
Gross Unrealized Depreciation | | | (224,275,087 | ) |
| | | | |
Net Unrealized Depreciation | | $ | (205,097,739 | ) |
| | | | |
The following table summarizes the inputs used as of December 31, 2008 in determining the Portfolio’s investments at fair value for purposes of SFAS 157:
| | | | | | |
| | | Investments in Securities | | Other Financial Instruments* |
Level 1 — Quoted Prices | | $ | 860,259,701 | | $ | 275,957 |
Level 2 — Other Significant Observable Inputs | | | 15,969,171 | | | — |
Level 3 — Significant Unobservable Inputs | | | — | | | — |
| | | | | | |
Total | | $ | 876,228,872 | | $ | 275,957 |
| | | | | | |
“Fair value” for purposes of SFAS 157 is different from “fair value” as used in the 1940 Act. The former generally implies market value, and can include market quotations as a source of value, and the latter refers to determinations of actual value in absence of available market quotations.
| * | Other financial instruments may include forward foreign currency contracts, futures, swaps, and written options. Forward foreign currency contracts and futures are reported at their unrealized gain/loss at year end. Swaps and written options are reported at their market value at year end. |
ING VP Index Plus LargeCap Portfolio Open Futures Contracts on December 31, 2008:
| | | | | | | |
Contract Description | | Number of Contracts | | Expiration Date | | Unrealized Appreciation |
Long Contracts | | | | | | | |
S&P 500® Index | | 90 | | 03/19/09 | | $ | 275,957 |
| | | | | | | |
| | | | | | $ | 275,957 |
| | | | | | | |
See Accompanying Notes to Financial Statements
34
| | |
| ING VP INDEX PLUS MIDCAP PORTFOLIO | | PORTFOLIO OF INVESTMENTS ASOF DECEMBER 31, 2008 |
| | | | | | | |
| Shares | | | | | | Value |
| | | | | | | |
| COMMON STOCK: 91.5% | | | |
| Advertising: 0.0% | | | |
| 46,200 | | | | Harte-Hanks, Inc. | | $ | 288,288 |
| | | | | | | |
| | | | | | | 288,288 |
| | | | | | | |
| Aerospace/Defense: 0.5% | | | |
| 27,600 | | @, L | | Alliant Techsystems, Inc. | | | 2,366,976 |
| 83,310 | | @ | | BE Aerospace, Inc. | | | 640,654 |
| | | | | | | |
| | | | | | | 3,007,630 |
| | | | | | | |
| Airlines: 0.1% | | | |
| 17,000 | | @ | | Alaska Air Group, Inc. | | | 497,250 |
| | | | | | | |
| | | | | | | 497,250 |
| | | | | | | |
| Apparel: 0.5% | | | |
| 51,610 | | @ | | Hanesbrands, Inc. | | | 658,028 |
| 88,200 | | @ | | Timberland Co. | | | 1,018,710 |
| 57,660 | | @ | | Warnaco Group, Inc. | | | 1,131,866 |
| | | | | | | |
| | | | | | | 2,808,604 |
| | | | | | | |
| Auto Parts & Equipment: 0.3% | | | |
| 84,570 | | | | BorgWarner, Inc. | | | 1,841,089 |
| | | | | | | |
| | | | | | | 1,841,089 |
| | | | | | | |
| Banks: 5.2% | | | | | |
| 179,400 | | L | | Associated Banc-Corp. | | | 3,754,842 |
| 62,650 | | L | | Bancorpsouth, Inc. | | | 1,463,504 |
| 92,150 | | | | Bank of Hawaii Corp. | | | 4,162,416 |
| 43,047 | | L | | Cathay General Bancorp. | | | 1,022,366 |
| 26,200 | | | | City National Corp. | | | 1,275,940 |
| 60,142 | | | | Commerce Bancshares, Inc. | | | 2,643,241 |
| 90,200 | | | | Cullen/Frost Bankers, Inc. | | | 4,571,336 |
| 78,650 | | | | FirstMerit Corp. | | | 1,619,404 |
| 76,500 | | L | | Fulton Financial Corp. | | | 735,930 |
| 68,250 | | @ | | SVB Financial Group | | | 1,790,198 |
| 112,000 | | | | Valley National Bancorp. | | | 2,268,000 |
| 18,700 | | | | Westamerica Bancorp. | | | 956,505 |
| 149,200 | | L | | Wilmington Trust Corp. | | | 3,318,208 |
| | | | | | | |
| | | | | | | 29,581,890 |
| | | | | | | |
| Beverages: 0.4% | | | |
| 50,460 | | @, L | | Hansen Natural Corp. | | | 1,691,924 |
| 40,448 | | | | PepsiAmericas, Inc. | | | 823,521 |
| | | | | | | |
| | | | | | | 2,515,445 |
| | | | | | | |
| Biotechnology: 0.9% | | | |
| 15,600 | | @ | | Bio-Rad Laboratories, Inc. | | | 1,174,836 |
| 15,450 | | @ | | Charles River Laboratories International, Inc. | | | 404,790 |
| 8,850 | | @, L | | United Therapeutics Corp. | | | 553,568 |
| 96,250 | | @ | | Vertex Pharmaceuticals, Inc. | | | 2,924,075 |
| | | | | | | |
| | | | | | | 5,057,269 |
| | | | | | | |
| Building Materials: 0.1% | | | |
| 6,600 | | L | | Martin Marietta Materials, Inc. | | | 640,727 |
| | | | | | | |
| | | | | | | 640,727 |
| | | | | | | |
| Chemicals: 3.6% | | | |
| 116,330 | | | | Airgas, Inc. | | | 4,535,707 |
| 12,258 | | | | Albemarle Corp. | | | 273,353 |
| 53,200 | | | | Ashland, Inc. | | | 559,132 |
| 79,850 | | | | Cytec Industries, Inc. | | | 1,694,417 |
| 16,900 | | | | FMC Corp. | | | 755,937 |
| 102,939 | | | | Lubrizol Corp. | | | 3,745,950 |
| 76,790 | | | | Minerals Technologies, Inc. | | | 3,140,711 |
| | | | | | | |
| Shares | | | | | | Value |
| | | | | | | |
| Chemicals: (continued) | | | |
| 84,670 | | | | Terra Industries, Inc. | | $ | 1,411,449 |
| 240,700 | | | | Valspar Corp. | | | 4,354,263 |
| | | | | | | |
| | | | | | | 20,470,919 |
| | | | | | | |
| Coal: 0.5% | | | |
| 154,850 | | | | Arch Coal, Inc. | | | 2,522,507 |
| 51,900 | | @ | | Patriot Coal Corp. | | | 324,375 |
| | | | | | | |
| | | | | | | 2,846,882 |
| | | | | | | |
| Commercial Services: 7.6% | | | |
| 87,663 | | @ | | Alliance Data Systems Corp. | | | 4,078,959 |
| 34,750 | | @ | | Brink's Home Security Holdings, Inc. | | | 761,720 |
| 94,090 | | @ | | Career Education Corp. | | | 1,687,975 |
| 18,800 | | | | Corporate Executive Board Co. | | | 414,728 |
| 43,690 | | | | DeVry, Inc. | | | 2,508,243 |
| 38,300 | | @ | | FTI Consulting, Inc. | | | 1,711,244 |
| 53,750 | | @ | | Gartner, Inc. | | | 958,363 |
| 39,080 | | | | Global Payments, Inc. | | | 1,281,433 |
| 36,158 | | @ | | ITT Educational Services, Inc. | | | 3,434,287 |
| 63,600 | | | | Kelly Services, Inc. | | | 827,436 |
| 97,250 | | @, L | | Korn/Ferry International | | | 1,110,595 |
| 67,800 | | | | Lender Processing Services, Inc. | | | 1,996,710 |
| 117,806 | | | | Manpower, Inc. | | | 4,004,226 |
| 189,252 | | @ | | MPS Group, Inc. | | | 1,425,068 |
| 70,600 | | @, L | | Navigant Consulting, Inc. | | | 1,120,422 |
| 166,500 | | | | Pharmaceutical Product Development, Inc. | | | 4,830,165 |
| 65,350 | | @ | | Quanta Services, Inc. | | | 1,293,930 |
| 158,400 | | @ | | Rent-A-Center, Inc. | | | 2,795,760 |
| 147,400 | | @ | | SAIC, Inc. | | | 2,871,352 |
| 9,700 | | | | Strayer Education, Inc. | | | 2,079,777 |
| 249,252 | | @ | | United Rentals, Inc. | | | 2,273,178 |
| | | | | | | |
| | | | | | | 43,465,571 |
| | | | | | | |
| Computers: 2.4% | | | |
| 391,650 | | @ | | Cadence Design Systems, Inc. | | | 1,433,439 |
| 33,850 | | | | Diebold, Inc. | | | 950,847 |
| 114,350 | | | | Imation Corp. | | | 1,551,730 |
| 73,950 | | @ | | Mentor Graphics Corp. | | | 382,322 |
| 195,250 | | @ | | NCR Corp. | | | 2,760,835 |
| 44,578 | | @ | | SRA International, Inc. | | | 768,971 |
| 157,215 | | @ | | Synopsys, Inc. | | | 2,911,622 |
| 238,198 | | @ | | Western Digital Corp. | | | 2,727,367 |
| | | | | | | |
| | | | | | | 13,487,133 |
| | | | | | | |
| Cosmetics/Personal Care: 0.1% | | | |
| 23,800 | | | | Alberto-Culver Co. | | | 583,338 |
| | | | | | | |
| | | | | | | 583,338 |
| | | | | | | |
| Distribution/Wholesale: 1.5% | | | |
| 326,021 | | @, S | | Ingram Micro, Inc. | | | 4,365,421 |
| 115,000 | | @ | | LKQ Corp. | | | 1,340,900 |
| 153,250 | | @, S | | Tech Data Corp. | | | 2,733,980 |
| | | | | | | |
| | | | | | | 8,440,301 |
| | | | | | | |
| Diversified Financial Services: 0.4% | | | |
| 10,050 | | @ | | Affiliated Managers Group, Inc. | | | 421,296 |
| 118,731 | | | | Raymond James Financial, Inc. | | | 2,033,862 |
| | | | | | | |
| | | | | | | 2,455,158 |
| | | | | | | |
| Electric: 4.3% | | | |
| 78,900 | | | | Alliant Energy Corp. | | | 2,302,302 |
| 108,600 | | | | DPL, Inc. | | | 2,480,424 |
| 160,450 | | | | Hawaiian Electric Industries | | | 3,552,363 |
See Accompanying Notes to Financial Statements
35
| | |
| ING VP INDEX PLUS MIDCAP PORTFOLIO | | PORTFOLIO OF INVESTMENTS ASOF DECEMBER 31, 2008 (CONTINUED) |
| | | | | | | |
| Shares | | | | | | Value |
| | | | | | | |
| Electric: (continued) | | | |
| 67,243 | | | | MDU Resources Group, Inc. | | $ | 1,451,104 |
| 198,128 | | | | Northeast Utilities | | | 4,766,960 |
| 124,400 | | | | NSTAR | | | 4,539,356 |
| 63,400 | | | | NV Energy, Inc. | | | 627,026 |
| 76,019 | | | | OGE Energy Corp. | | | 1,959,770 |
| 102,102 | | | | Puget Energy, Inc. | | | 2,784,322 |
| | | | | | | |
| | | | | | | 24,463,627 |
| | | | | | | |
| Electrical Components & Equipment: 1.9% | | | |
| 89,242 | | | | Ametek, Inc. | | | 2,696,001 |
| 81,300 | | @ | | Energizer Holdings, Inc. | | | 4,401,582 |
| 118,800 | | | | Hubbell, Inc. | | | 3,882,384 |
| | | | | | | |
| | | | | | | 10,979,967 |
| | | | | | | |
| Electronics: 2.0% | | | |
| 213,950 | | @ | | Arrow Electronics, Inc. | | | 4,030,818 |
| 138,637 | | @ | | Avnet, Inc. | | | 2,524,580 |
| 80,207 | | @ | | Thomas & Betts Corp. | | | 1,926,572 |
| 35,850 | | @ | | Trimble Navigation Ltd. | | | 774,719 |
| 268,300 | | @ | | Vishay Intertechnology, Inc. | | | 917,586 |
| 44,100 | | | | Woodward Governor Co. | | | 1,015,182 |
| | | | | | | |
| | | | | | | 11,189,457 |
| | | | | | | |
| Engineering & Construction: 1.8% | | | |
| 86,600 | | @ | | Dycom Industries, Inc. | | | 711,852 |
| 61,130 | | | | Granite Construction, Inc. | | | 2,685,441 |
| 150,990 | | | | KBR, Inc. | | | 2,295,048 |
| 108,700 | | @ | | Shaw Group, Inc. | | | 2,225,089 |
| 64,770 | | @ | | URS Corp. | | | 2,640,673 |
| | | | | | | |
| | | | | | | 10,558,103 |
| | | | | | | |
| Entertainment: 0.3% | | | |
| 9,850 | | | | International Speedway Corp. | | | 282,991 |
| 75,215 | | @, L | | Scientific Games Corp. | | | 1,319,271 |
| | | | | | | |
| | | | | | | 1,602,262 |
| | | | | | | |
| Environmental Control: 0.6% | | | |
| 16,500 | | @ | | Clean Harbors, Inc. | | | 1,046,760 |
| 74,400 | | @ | | Waste Connections, Inc. | | | 2,348,808 |
| | | | | | | |
| | | | | | | 3,395,568 |
| | | | | | | |
| Food: 1.6% | | | |
| 75,000 | | | | Corn Products International, Inc. | | | 2,163,750 |
| 27,434 | | L | | Hormel Foods Corp. | | | 852,649 |
| 35,750 | | @ | | Ralcorp Holdings, Inc. | | | 2,087,800 |
| 126,915 | | | | Ruddick Corp. | | | 3,509,200 |
| 29,450 | | @, L | | Smithfield Foods, Inc. | | | 414,362 |
| | | | | | | |
| | | | | | | 9,027,761 |
| | | | | | | |
| Gas: 2.4% | | | |
| 25,800 | | | | AGL Resources, Inc. | | | 808,830 |
| 76,200 | | | | National Fuel Gas Co. | | | 2,387,346 |
| 98,900 | | | | Southern Union Co. | | | 1,289,656 |
| 161,866 | | | | UGI Corp. | | | 3,952,768 |
| 142,000 | | | | Vectren Corp. | | | 3,551,420 |
| 60,300 | | | | WGL Holdings, Inc. | | | 1,971,207 |
| | | | | | | |
| | | | | | | 13,961,227 |
| | | | | | | |
| Hand/Machine Tools: 0.6% | | | |
| 71,070 | | | | Lincoln Electric Holdings, Inc. | | | 3,619,595 |
| | | | | | | |
| | | | | | | 3,619,595 |
| | | | | | | |
| | | | | | | |
| Shares | | | | | | Value |
| | | | | | | |
| Healthcare - Products: 3.5% | | | |
| 199,860 | | @ | | Affymetrix, Inc. | | $ | 597,581 |
| 4,900 | | | | Beckman Coulter, Inc. | | | 215,306 |
| 5,589 | | @ | | Edwards Lifesciences Corp. | | | 307,116 |
| 87,566 | | @ | | Gen-Probe, Inc. | | | 3,751,327 |
| 100,327 | | @ | | Henry Schein, Inc. | | | 3,680,998 |
| 153,900 | | L | | Hill-Rom Holdings, Inc. | | | 2,533,194 |
| 160,306 | | @, L | | Hologic, Inc. | | | 2,095,199 |
| 61,010 | | @, L | | Kinetic Concepts, Inc. | | | 1,170,172 |
| 38,800 | | @ | | Masimo Corp. | | | 1,157,404 |
| 74,000 | | | | Steris Corp. | | | 1,767,860 |
| 30,508 | | | | Techne Corp. | | | 1,968,376 |
| 16,000 | | @, L | | Thoratec Corp. | | | 519,840 |
| | | | | | | |
| | | | | | | 19,764,373 |
| | | | | | | |
| Healthcare - Services: 1.4% | | | |
| 20,800 | | @ | | Community Health Systems, Inc. | | | 303,264 |
| 10,150 | | @ | | Covance, Inc. | | | 467,205 |
| 280,300 | | @ | | Health Management Associates, Inc. | | | 501,737 |
| 94,450 | | @ | | Health Net, Inc. | | | 1,028,561 |
| 60,700 | | @ | | LifePoint Hospitals, Inc. | | | 1,386,388 |
| 118,585 | | @ | | Lincare Holdings, Inc. | | | 3,193,494 |
| 14,400 | | | | Universal Health Services, Inc. | | | 541,008 |
| 35,920 | | @ | | WellCare Health Plans, Inc. | | | 461,931 |
| | | | | | | |
| | | | | | | 7,883,588 |
| | | | | | | |
| Home Builders: 1.8% | | | |
| 82,190 | | @, L | | Hovnanian Enterprises, Inc. | | | 141,367 |
| 60,190 | | | | MDC Holdings, Inc. | | | 1,823,757 |
| 7,530 | | @ | | NVR, Inc. | | | 3,435,563 |
| 47,150 | | | | Ryland Group, Inc. | | | 833,141 |
| 20,800 | | L | | Thor Industries, Inc. | | | 274,144 |
| 177,940 | | @ | | Toll Brothers, Inc. | | | 3,813,254 |
| | | | | | | |
| | | | | | | 10,321,226 |
| | | | | | | |
| Home Furnishings: 0.0% | | | |
| 137,000 | | L | | Furniture Brands International, Inc. | | | 302,770 |
| | | | | | | |
| | | | | | | 302,770 |
| | | | | | | |
| Household Products/Wares: 0.4% | | | |
| 18,600 | | | | Church & Dwight Co., Inc. | | | 1,043,832 |
| 53,587 | | | | Tupperware Corp. | | | 1,216,425 |
| | | | | | | |
| | | | | | | 2,260,257 |
| | | | | | | |
| Insurance: 8.0% | | | |
| 150,936 | | | | American Financial Group, Inc. | | | 3,453,416 |
| 169,456 | | | | Arthur J. Gallagher & Co. | | | 4,390,605 |
| 108,019 | | | | Brown & Brown, Inc. | | | 2,257,597 |
| 82,229 | | @@ | | Everest Re Group Ltd. | | | 6,260,916 |
| 99,900 | | | | Fidelity National Title Group, Inc. | | | 1,773,225 |
| 87,350 | | | | First American Corp. | | | 2,523,542 |
| 37,555 | | | | Hanover Insurance Group, Inc. | | | 1,613,738 |
| 181,316 | | | | HCC Insurance Holdings, Inc. | | | 4,850,203 |
| 158,590 | | | | Horace Mann Educators Corp. | | | 1,457,442 |
| 47,600 | | | | Old Republic International Corp. | | | 567,392 |
| 197,587 | | | | Protective Life Corp. | | | 2,835,373 |
| 117,400 | | | | Reinsurance Group of America, Inc. | | | 5,027,068 |
| 92,614 | | | | Stancorp Financial Group, Inc. | | | 3,868,487 |
| 121,137 | | L | | Unitrin, Inc. | | | 1,930,924 |
| 88,553 | | | | WR Berkley Corp. | | | 2,745,143 |
| | | | | | | |
| | | | | | | 45,555,071 |
| | | | | | | |
See Accompanying Notes to Financial Statements
36
| | |
| ING VP INDEX PLUS MIDCAP PORTFOLIO | | PORTFOLIO OF INVESTMENTS ASOF DECEMBER 31, 2008 (CONTINUED) |
| | | | | | | |
| Shares | | | | | | Value |
| | | | | | | |
| Internet: 1.9% | | | |
| 112,950 | | @ | | Avocent Corp. | | $ | 2,022,935 |
| 60,550 | | @ | | Digital River, Inc. | | | 1,501,640 |
| 16,550 | | @ | | F5 Networks, Inc. | | | 378,333 |
| 40,200 | | @, L | | NetFlix, Inc. | | | 1,201,578 |
| 61,850 | | @, L | | Priceline.com, Inc. | | | 4,555,253 |
| 184,100 | | @ | | Valueclick, Inc. | | | 1,259,244 |
| | | | | | | |
| | | | | | | 10,918,983 |
| | | | | | | |
| Investment Companies: 0.5% | | | |
| 326,530 | | L | | Apollo Investment Corp. | | | 3,039,994 |
| | | | | | | |
| | | | | | | 3,039,994 |
| | | | | | | |
| Iron/Steel: 0.9% | | | |
| 52,300 | | | | Carpenter Technology Corp. | | | 1,074,242 |
| 101,600 | | | | Cliffs Natural Resources, Inc. | | | 2,601,976 |
| 37,900 | | | | Reliance Steel & Aluminum Co. | | | 755,726 |
| 84,076 | | | | Steel Dynamics, Inc. | | | 939,970 |
| | | | | | | |
| | | | | | | 5,371,914 |
| | | | | | | |
| Machinery - Construction & Mining: 1.2% | | | |
| 85,800 | | L | | Bucyrus International, Inc. | | | 1,589,016 |
| 173,130 | | | | Joy Global, Inc. | | | 3,962,946 |
| 79,650 | | @ | | Terex Corp. | | | 1,379,538 |
| | | | | | | |
| | | | | | | 6,931,500 |
| | | | | | | |
| Machinery - Diversified: 2.6% | | | |
| 134,000 | | @ | | AGCO Corp. | | | 3,161,060 |
| 15,650 | | | | Graco, Inc. | | | 371,375 |
| 155,580 | | | | IDEX Corp. | | | 3,757,257 |
| 83,820 | | | | Roper Industries, Inc. | | | 3,638,626 |
| 85,900 | | | | Wabtec Corp. | | | 3,414,525 |
| 19,340 | | @ | | Zebra Technologies Corp. | | | 391,828 |
| | | | | | | |
| | | | | | | 14,734,671 |
| | | | | | | |
| Media: 0.2% | | | |
| 84,850 | | | | Scholastic Corp. | | | 1,152,263 |
| | | | | | | |
| | | | | | | 1,152,263 |
| | | | | | | |
| Metal Fabricate/Hardware: 0.1% | | | |
| 25,300 | | | | Commercial Metals Co. | | | 300,311 |
| 47,390 | | L | | Worthington Industries | | | 522,238 |
| | | | | | | |
| | | | | | | 822,549 |
| | | | | | | |
| Miscellaneous Manufacturing: 3.0% | | | |
| 72,497 | | | | Aptargroup, Inc. | | | 2,554,794 |
| 84,350 | | | | Brink’s Co. | | | 2,267,328 |
| 12,700 | | | | Carlisle Cos., Inc. | | | 262,890 |
| 124,194 | | | | Crane Co. | | | 2,141,105 |
| 26,650 | | | | Donaldson Co., Inc. | | | 896,773 |
| 192,000 | | | | Federal Signal Corp. | | | 1,576,320 |
| 80,320 | | | | Matthews International Corp. - Class A | | | 2,946,138 |
| 78,798 | | | | Pentair, Inc. | | | 1,865,149 |
| 60,890 | | | | SPX Corp. | | | 2,469,090 |
| | | | | | | |
| | | | | | | 16,979,587 |
| | | | | | | |
| Office Furnishings: 0.6% | | | |
| 119,082 | | | | Herman Miller, Inc. | | | 1,551,638 |
| 111,537 | | L | | HNI, Corp. | | | 1,766,746 |
| | | | | | | |
| | | | | | | 3,318,384 |
| | | | | | | |
| | | | | | | |
| Shares | | | | | | Value |
| | | | | | | |
| Oil & Gas: 3.5% | | | |
| 50,300 | | | | Cimarex Energy Co. | | $ | 1,347,034 |
| 14,600 | | @ | | Comstock Resources, Inc. | | | 689,850 |
| 120,780 | | @ | | Denbury Resources, Inc. | | | 1,318,918 |
| 113,700 | | @ | | Encore Acquisition Co. | | | 2,901,624 |
| 72,550 | | @ | | Forest Oil Corp. | | | 1,196,350 |
| 64,570 | | | | Frontier Oil Corp. | | | 815,519 |
| 77,712 | | | | Helmerich & Payne, Inc. | | | 1,767,948 |
| 73,500 | | @ | | Mariner Energy, Inc. | | | 749,700 |
| 78,840 | | @ | | Newfield Exploration Co. | | | 1,557,090 |
| 159,605 | | @ | | Plains Exploration & Production Co. | | | 3,709,220 |
| 77,600 | | @ | | Pride International, Inc. | | | 1,240,048 |
| 316,390 | | @, L | | Quicksilver Resources, Inc. | | | 1,762,292 |
| 37,580 | | @ | | Unit Corp. | | | 1,004,138 |
| | | | | | | |
| | | | | | | 20,059,731 |
| | | | | | | |
| Oil & Gas Services: 1.0% | | | |
| 59,450 | | @ | | FMC Technologies, Inc. | | | 1,416,694 |
| 142,250 | | @ | | Helix Energy Solutions Group, Inc. | | | 1,029,890 |
| 44,700 | | @ | | Oceaneering International, Inc. | | | 1,302,558 |
| 117,570 | | @ | | Superior Energy Services | | | 1,872,890 |
| | | | | | | |
| | | | | | | 5,622,032 |
| | | | | | | |
| Packaging & Containers: 0.9% | | | |
| 24,450 | | | | Greif, Inc. - Class A | | | 817,364 |
| 180,348 | | | | Sonoco Products Co. | | | 4,176,860 |
| | | | | | | |
| | | | | | | 4,994,224 |
| | | | | | | |
| Pharmaceuticals: 3.6% | | | |
| 224,040 | | @, L | | Endo Pharmaceuticals Holdings, Inc. | | | 5,798,134 |
| 146,100 | | | | Medicis Pharmaceutical Corp. | | | 2,030,790 |
| 16,890 | | @ | | NBTY, Inc. | | | 264,329 |
| 134,200 | | | | Omnicare, Inc. | | | 3,725,392 |
| 98,650 | | | | Perrigo Co. | | | 3,187,382 |
| 140,410 | | @ | | Sepracor, Inc. | | | 1,541,702 |
| 98,400 | | @, L | | Valeant Pharmaceuticals International | | | 2,253,360 |
| 80,165 | | @ | | VCA Antech, Inc. | | | 1,593,680 |
| | | | | | | |
| | | | | | | 20,394,769 |
| | | | | | | |
| Pipelines: 0.4% | | | |
| 85,280 | | | | Oneok, Inc. | | | 2,483,354 |
| | | | | | | |
| | | | | | | 2,483,354 |
| | | | | | | |
| Real Estate: 0.1% | | | |
| 26,280 | | | | Jones Lang LaSalle, Inc. | | | 727,956 |
| | | | | | | |
| | | | | | | 727,956 |
| | | | | | | |
| Retail: 6.8% | | | |
| 98,200 | | | | Advance Auto Parts, Inc. | | | 3,304,430 |
| 98,225 | | @ | | Aeropostale, Inc. | | | 1,581,423 |
| 103,740 | | @ | | BJ’s Wholesale Club, Inc. | | | 3,554,132 |
| 72,000 | | @, L | | Cheesecake Factory | | | 727,200 |
| 19,260 | | @, L | | Chipotle Mexican Grill, Inc. | | | 1,193,735 |
| 113,000 | | @ | | Collective Brands, Inc. | | | 1,324,360 |
| 13,430 | | @ | | Copart, Inc. | | | 365,162 |
| 130,992 | | @, L | | Dollar Tree, Inc. | | | 5,475,466 |
| 197,200 | | | | Foot Locker, Inc. | | | 1,447,448 |
| 65,190 | | | | Guess ?, Inc. | | | 1,000,667 |
| 91,100 | | | | MSC Industrial Direct Co. | | | 3,355,213 |
| 15,400 | | @ | | O’Reilly Automotive, Inc. | | | 473,396 |
| 179,000 | | | | Petsmart, Inc. | | | 3,302,550 |
See Accompanying Notes to Financial Statements
37
| | |
| ING VP INDEX PLUS MIDCAP PORTFOLIO | | PORTFOLIO OF INVESTMENTS ASOF DECEMBER 31, 2008 (CONTINUED) |
| | | | | | | |
| Shares | | | | | | Value |
| | | | | | | |
| Retail: (continued) | | | |
| 98,320 | | | | Phillips-Van Heusen | | $ | 1,979,182 |
| 144,290 | | | | Regis Corp. | | | 2,096,534 |
| 166,058 | | | | Ross Stores, Inc. | | | 4,936,904 |
| 173,490 | | @ | | Urban Outfitters, Inc. | | | 2,598,880 |
| | | | | | | |
| | | | | | | 38,716,682 |
| | | | | | | |
| Savings & Loans: 1.5% | | | |
| 199,920 | | | | Astoria Financial Corp. | | | 3,294,682 |
| 31,624 | | | | First Niagara Financial Group, Inc. | | | 511,360 |
| 411,100 | | | | New York Community Bancorp., Inc. | | | 4,916,756 |
| | | | | | | |
| | | | | | | 8,722,798 |
| | | | | | | |
| Semiconductors: 1.1% | | | |
| 37,000 | | @, L | | Cree, Inc. | | | 587,190 |
| 195,500 | | @ | | Integrated Device Technology, Inc. | | | 1,096,755 |
| 167,793 | | @ | | Lam Research Corp. | | | 3,570,635 |
| 45,800 | | @ | | Silicon Laboratories, Inc. | | | 1,134,924 |
| | | | | | | |
| | | | | | | 6,389,504 |
| | | | | | | |
| Software: 3.3% | | | |
| 95,700 | | @, L | | ACI Worldwide, Inc. | | | 1,521,630 |
| 90,150 | | | | Acxiom Corp. | | | 731,117 |
| 57,200 | | @ | | Ansys, Inc. | | | 1,595,308 |
| 149,700 | | | | Broadridge Financial Solutions ADR | | | 1,877,238 |
| 62,950 | | @, L | | Cerner Corp. | | | 2,420,428 |
| 115,400 | | | | Fair Isaac Corp. | | | 1,945,644 |
| 16,800 | | @, L | | Mantech International Corp. | | | 910,392 |
| 47,100 | | @ | | Metavante Technologies, inc. | | | 758,781 |
| 132,100 | | @ | | Parametric Technology Corp. | | | 1,671,065 |
| 126,300 | | | | SEI Investments Co. | | | 1,984,173 |
| 130,865 | | @ | | Sybase, Inc. | | | 3,241,526 |
| | | | | | | |
| | | | | | | 18,657,302 |
| | | | | | | |
| Telecommunications: 1.8% | | | |
| 321,869 | | @ | | 3Com Corp. | | | 733,861 |
| 167,928 | | @ | | CommScope, Inc. | | | 2,609,601 |
| 146,730 | | @ | | NeuStar, Inc. | | | 2,806,945 |
| 61,320 | | | | Plantronics, Inc. | | | 809,424 |
| 110,300 | | | | Telephone & Data Systems, Inc. | | | 3,502,025 |
| | | | | | | |
| | | | | | | 10,461,856 |
| | | | | | | |
| Textiles: 0.1% | | | |
| 7,872 | | @ | | Mohawk Industries, Inc. | | | 338,260 |
| | | | | | | |
| | | | | | | 338,260 |
| | | | | | | |
| Toys/Games/Hobbies: 0.3% | | | |
| 61,100 | | @ | | Marvel Entertainment, Inc. | | | 1,878,825 |
| | | | | | | |
| | | | | | | 1,878,825 |
| | | | | | | |
| Transportation: 1.3% | | | |
| 110,700 | | | | Alexander & Baldwin, Inc. | | | 2,774,142 |
| 30,200 | | | | Overseas Shipholding Group | | | 1,271,722 |
| 23,580 | | | | Tidewater, Inc. | | | 949,567 |
| 115,550 | | | | Werner Enterprises, Inc. | | | 2,003,637 |
| 93,200 | | @, L | | YRC Worldwide, Inc. | | | 267,484 |
| | | | | | | |
| | | | | | | 7,266,552 |
| | | | | | | |
| Water: 0.1% | | | |
| 16,600 | | | | Aqua America, Inc. | | | 341,794 |
| | | | | | | |
| | | | | | | 341,794 |
| | | | | | | |
| | | | Total Common Stock
(Cost $719,291,096) | | | 523,197,830 |
| | | | | | | |
| | | | | | | |
| Shares | | | | | | Value |
| | | | | | | |
| REAL ESTATE INVESTMENT TRUSTS: 5.5% | | | |
| Apartments: 0.6% | | | |
| 8,100 | | | | BRE Properties, Inc. | | $ | 226,638 |
| 33,700 | | | | Camden Property Trust | | | 1,056,158 |
| 20,250 | | | | Essex Property Trust, Inc. | | | 1,554,188 |
| 28,900 | | | | UDR, Inc. | | | 398,531 |
| | | | | | | |
| | | | | | | 3,235,515 |
| | | | | | | |
| Diversified: 0.4% | | | |
| 25,500 | | S | | Duke Realty Corp. | | | 279,480 |
| 81,100 | | | | Liberty Property Trust | | | 1,851,513 |
| | | | | | | |
| | | | | | | 2,130,993 |
| | | | | | | |
| Health Care: 1.1% | | | |
| 78,550 | | | | Health Care Real Estate Investment Trust, Inc. | | | 3,314,810 |
| 68,900 | | L | | Nationwide Health Properties, Inc. | | | 1,978,808 |
| 67,400 | | | | Omega Healthcare Investors, Inc. | | | 1,076,378 |
| | | | | | | |
| | | | | | | 6,369,996 |
| | | | | | | |
| Hotels: 0.5% | | | |
| 174,680 | | L | | Hospitality Properties Trust | | | 2,597,492 |
| | | | | | | |
| | | | | | | 2,597,492 |
| | | | | | | |
| Office Property: 1.0% | | | |
| 16,900 | | | | Alexandria Real Estate Equities, Inc. | | | 1,019,746 |
| 40,750 | | L | | Highwoods Properties, Inc. | | | 1,114,920 |
| 101,650 | | | | Mack-Cali Realty Corp. | | | 2,490,425 |
| 46,600 | | | | SL Green Realty Corp. | | | 1,206,940 |
| | | | | | | |
| | | | | | | 5,832,031 |
| | | | | | | |
| Paper & Related Products: 0.1% | | | |
| 23,200 | | | | Rayonier, Inc. | | | 727,320 |
| | | | | | | |
| | | | | | | 727,320 |
| | | | | | | |
| Regional Malls: 0.4% | | | |
| 141,010 | | L | | Macerich Co. | | | 2,560,742 |
| | | | | | | |
| | | | | | | 2,560,742 |
| | | | | | | |
| Shopping Centers: 0.9% | | | |
| 28,800 | | | | Federal Realty Investment Trust | | | 1,787,904 |
| 24,000 | | | | Regency Centers Corp. | | | 1,120,800 |
| 118,000 | | L | | Weingarten Realty Investors | | | 2,441,420 |
| | | | | | | |
| | | | | | | 5,350,124 |
| | | | | | | |
| Single Tenant: 0.1% | | | |
| 18,300 | | | | Realty Income Corp. | | | 423,645 |
| | | | | | | |
| | | | | | | 423,645 |
| | | | | | | |
| Warehouse/Industrial: 0.4% | | | |
| 94,670 | | | | AMB Property Corp. | | | 2,217,171 |
| | | | | | | |
| | | | | | | 2,217,171 |
| | | | | | | |
| | | | Total Real Estate Investment Trusts (Cost $48,015,088) | | | 31,445,029 |
| | | | | | | |
| | | | Total Long-Term Investments
(Cost $767,306,184) | | | 554,642,859 |
| | | | | | | |
| SHORT-TERM INVESTMENTS: 8.3% | | | |
| Affiliated Mutual Fund: 1.3% | | | |
| 7,304,000 | | S | | ING Institutional Prime Money Market Fund - Class I | | | 7,304,000 |
| | | | | | | |
| | | | Total Mutual Fund
(Cost $7,304,000) | | | 7,304,000 |
| | | | | | | |
See Accompanying Notes to Financial Statements
38
| | |
| ING VP INDEX PLUS MIDCAP PORTFOLIO | | PORTFOLIO OF INVESTMENTS ASOF DECEMBER 31, 2008 (CONTINUED) |
| | | | | | | | | | | | |
| | | | |
Principal
Amount | | | | | | | | | Value | |
| | | | | | | | | | | | |
| | Repurchase Agreement: 0.7% | | | | | | | |
| $ | 3,787,000 | | S | | Goldman Sachs Repurchase Agreement dated 12/31/08, 0.010%, due 01/02/09, $3,787,002 to be received upon repurchase (Collateralized by $2,428,700 U.S. Treasury, 8.875%, Market Value plus accrued interest $3,862,778, due 02/15/19) | | | | | $ | 3,787,000 | |
| | | | | | | | | | | | |
| | | | | Total Repurchase Agreement
(Cost $3,787,000) | | | | | | 3,787,000 | |
| | | | | | | | | | | | |
| Securities Lending Collateralcc: 6.3%
|
| | | | |
| | 37,056,930 | | | | Bank of New York Mellon Corp. Institutional Cash Reserves | | | | | | 36,237,748 | |
| | | | | | | | | | | | |
| | | | | Total Securities Lending Collateral
(Cost $37,056,930) | | | | | | 36,237,748 | |
| | | | | | | | | | | | |
| | | | | Total Short-Term Investments
(Cost $48,147,930) | | | | | | 47,328,748 | |
| | | | | | | | | | | | |
| | | | | Total Investments in Securities
(Cost $815,454,114)* | | 105.3 | % | | $ | 601,971,607 | |
| | | | | Other Assets and Liabilities -Net | | (5.3 | ) | | | (30,160,941 | ) |
| | | | | | | | | | | | |
| | | | | Net Assets | | 100.0 | % | | $ | 571,810,666 | |
| | | | | | | | | | | | |
| @ | Non-income producing security |
| ADR | American Depositary Receipt |
| cc | Securities purchased with cash collateral for securities loaned. |
| S | All or a portion of this security is segregated to cover collateral requirements for applicable futures, options, swaps, foreign forward currency contracts and/or when-issued or delayed-delivery securities. |
| L | Loaned security, a portion or all of the security is on loan at December 31, 2008. |
| * | Cost for federal income tax purposes is $831,135,097. |
| | | | |
Net unrealized depreciation consists of: | |
Gross Unrealized Appreciation | | $ | 16,229,610 | |
Gross Unrealized Depreciation | | | (245,393,100 | ) |
| | | | |
Net Unrealized Depreciation | | $ | (229,163,490 | ) |
| | | | |
The following table summarizes the inputs used as of December 31, 2008 in determining the Portfolio's investments at fair value for purposes of SFAS 157:
| | | | | | |
| | | Investments in Securities | | Other Financial Instruments* |
Level 1 — Quoted Prices | | $ | 561,946,859 | | $ | 727,152 |
Level 2 — Other Significant Observable Inputs | | | 40,024,748 | | | — |
Level 3 — Significant Unobservable Inputs | | | — | | | — |
| | | | | | |
Total | | $ | 601,971,607 | | $ | 727,152 |
| | | | | | |
“Fair value” for purposes of SFAS 157 is different from “fair value” as used in the 1940 Act. The former generally implies market value, and can include market quotations as a source of value, and the latter refers to determinations of actual value in absence of available market quotations.
| * | Other financial instruments may include forward foreign currency contracts, futures, swaps, and written options. Forward foreign currency contracts and futures are reported at their unrealized gain/loss at year end. Swaps and written options are reported at their market value at year end. |
ING VP Index Plus MidCap Portfolio Open Futures Contracts on December 31, 2008:
| | | | | | | |
Contract Description | | Number of Contracts | | Expiration Date | | Unrealized Appreciation |
Long Contracts | | | | | | | |
S&P MidCap 400 Index | | 65 | | 03/19/09 | | $ | 727,152 |
| | | | | | | |
| | | | | | $ | 727,152 |
| | | | | | | |
See Accompanying Notes to Financial Statements
39
| | |
| ING VP INDEX PLUS SMALLCAP PORTFOLIO | | PORTFOLIO OF INVESTMENTS ASOF DECEMBER 31, 2008 (CONTINUED) |
| | | | | | | |
| Shares | | | | | | Value |
| | | | | | | |
| COMMON STOCK: 93.3% | | | |
| Advertising: 0.0% | | | |
| 12,118 | | @ | | inVentiv Health, Inc. | | $ | 139,842 |
| | | | | | | |
| | | | | | | 139,842 |
| | | | | | | |
| Aerospace/Defense: 2.3% | | | |
| 45,300 | | @, L | | AAR Corp. | | | 833,973 |
| 39,263 | | | | Cubic Corp. | | | 1,067,954 |
| 16,900 | | | | Curtiss-Wright Corp. | | | 564,291 |
| 41,350 | | @ | | Esterline Technologies Corp. | | | 1,566,752 |
| 13,050 | | @ | | Moog, Inc. | | | 477,239 |
| 42,800 | | @ | | Orbital Sciences Corp. | | | 835,884 |
| 30,590 | | @ | | Teledyne Technologies, Inc. | | | 1,362,785 |
| 4,800 | | L | | Triumph Group, Inc. | | | 203,808 |
| | | | | | | |
| | | | | | | 6,912,686 |
| | | | | | | |
| Agriculture: 0.1% | | | |
| 87,300 | | @ | | Alliance One International, Inc. | | | 256,662 |
| | | | | | | |
| | | | | | | 256,662 |
| | | | | | | |
| Airlines: 0.6% | | | |
| 103,089 | | | | Skywest, Inc. | | | 1,917,455 |
| | | | | | | |
| | | | | | | 1,917,455 |
| | | | | | | |
| Apparel: 1.8% | | | |
| 60,716 | | @ | | Carter’s, Inc. | | | 1,169,390 |
| 10,540 | | @ | | Deckers Outdoor Corp. | | | 841,830 |
| 60,915 | | @, L | | Iconix Brand Group, Inc. | | | 595,749 |
| 20,300 | | | | K-Swiss, Inc. | | | 231,420 |
| 16,340 | | @ | | Skechers USA, Inc. | | | 209,479 |
| 32,100 | | @, L | | True Religion Apparel, Inc. | | | 399,324 |
| 27,000 | | @, L | | Volcom, Inc. | | | 294,300 |
| 76,868 | | | | Wolverine World Wide, Inc. | | | 1,617,303 |
| | | | | | | |
| | | | | | | 5,358,795 |
| | | | | | | |
| Auto Parts & Equipment: 0.1% | | | |
| 34,920 | | | | Superior Industries International | | | 367,358 |
| | | | | | | |
| | | | | | | 367,358 |
| | | | | | | |
| Banks: 9.2% | | | |
| 126,960 | | | | Bank Mutual Corp. | | | 1,465,118 |
| 108,950 | | L | | Cascade Bancorp. | | | 735,413 |
| 38,455 | | | | Central Pacific Financial Corp. | | | 386,088 |
| 15,300 | | | | Columbia Banking System, Inc. | | | 182,529 |
| 29,870 | | | | Community Bank System, Inc. | | | 728,529 |
| 8,873 | | L | | East-West Bancorp., Inc. | | | 141,702 |
| 64,500 | | @@, L | | First Bancorp. Puerto Rico | | | 718,530 |
| 34,350 | | L | | First Financial Bankshares, Inc. | | | 1,896,464 |
| 90,334 | | | | First Midwest Bancorp., Inc. | | | 1,803,970 |
| 54,621 | | L | | Frontier Financial Corp. | | | 238,148 |
| 101,480 | | | | Glacier Bancorp., Inc. | | | 1,930,150 |
| 32,800 | | | | Hancock Holding Co. | | | 1,491,088 |
| 177,588 | | L | | Hanmi Financial Corp. | | | 365,831 |
| 94,820 | | | | Nara Bancorp., Inc. | | | 932,081 |
| 85,370 | | L | | National Penn Bancshares, Inc. | | | 1,238,719 |
| 8,700 | | | | Old National Bancorp. | | | 157,992 |
| 66,540 | | | | Prosperity Bancshares, Inc. | | | 1,968,919 |
| 16,300 | | | | S&T Bancorp, Inc. | | | 578,650 |
| 20,010 | | @ | | Signature Bank | | | 574,087 |
| 31,910 | | L | | Sterling Bancorp. | | | 447,697 |
| 168,800 | | | | Sterling Bancshares, Inc. | | | 1,026,304 |
| 42,220 | | L | | Susquehanna Bancshares, Inc. | | | 671,720 |
| 8,178 | | L | | Tompkins Financial Corp. | | | 473,915 |
| 94,070 | | | | Trustco Bank Corp. | | | 894,606 |
| | | | | | | |
| Shares | | | | | | Value |
| | | | | | | |
| Banks: (continued) | | | |
| 77,959 | | | | UCBH Holdings, Inc. | | $ | 536,358 |
| 34,770 | | | | UMB Financial Corp. | | | 1,708,598 |
| 9,800 | | | | Umpqua Holdings Corp. | | | 141,806 |
| 10,100 | | L | | United Bankshares, Inc. | | | 335,522 |
| 15,939 | | L | | United Community Banks, Inc. | | | 216,452 |
| 112,995 | | | | Whitney Holding Corp. | | | 1,806,790 |
| 40,400 | | | | Wilshire Bancorp., Inc. | | | 366,832 |
| 56,340 | | | | Wintrust Financial Corp. | | | 1,158,914 |
| | | | | | | |
| | | | | | | 27,319,522 |
| | | | | | | |
| Beverages: 0.3% | | | |
| 15,600 | | @, L | | Green Mountain Coffee Roasters, Inc. | | | 603,720 |
| 8,200 | | @ | | Peet’s Coffee & Tea, Inc. | | | 190,650 |
| | | | | | | |
| | | | | | | 794,370 |
| | | | | | | |
| Biotechnology: 1.1% | | | |
| 52,950 | | @ | | Cubist Pharmaceuticals, Inc. | | | 1,279,272 |
| 17,920 | | @ | | Enzo Biochem, Inc. | | | 87,629 |
| 31,850 | | @, L | | Martek Biosciences Corp. | | | 965,374 |
| 56,140 | | @ | | Regeneron Pharmaceuticals, Inc. | | | 1,030,730 |
| | | | | | | |
| | | | | | | 3,363,005 |
| | | | | | | |
| Building Materials: 1.7% | | | |
| 35,610 | | | | Apogee Enterprises, Inc. | | | 368,920 |
| 38,600 | | | | Eagle Materials, Inc. | | | 710,626 |
| 84,049 | | | | Gibraltar Industries, Inc. | | | 1,003,545 |
| 52,972 | | | | Lennox International, Inc. | | | 1,710,466 |
| 51,090 | | @ | | NCI Building Systems, Inc. | | | 832,767 |
| 5,100 | | | | Simpson Manufacturing Co., Inc. | | | 141,576 |
| 10,280 | | L | | Texas Industries, Inc. | | | 354,660 |
| | | | | | | |
| | | | | | | 5,122,560 |
| | | | | | | |
| Chemicals: 1.9% | | | |
| 3,638 | | | | Arch Chemicals, Inc. | | | 94,843 |
| 10,200 | | | | Balchem Corp. | | | 254,082 |
| 81,366 | | | | HB Fuller Co. | | | 1,310,806 |
| 20,930 | | | | NewMarket Corp. | | | 730,666 |
| 41,530 | | @ | | OM Group, Inc. | | | 876,698 |
| 30,295 | | | | Quaker Chemical Corp. | | | 498,353 |
| 74,970 | | | | Schulman A, Inc. | | | 1,274,490 |
| 3,400 | | | | Stepan Co. | | | 159,766 |
| 18,130 | | L | | Zep, Inc. | | | 350,090 |
| | | | | | | |
| | | | | | | 5,549,794 |
| | | | | | | |
| Commercial Services: 5.5% | | | |
| 70,740 | | | | Aaron Rents, Inc. | | | 1,883,099 |
| 7,210 | | | | Administaff, Inc. | | | 156,313 |
| 28,630 | | @ | | AMN Healthcare Services, Inc. | | | 242,210 |
| 40,530 | | | | Arbitron, Inc. | | | 538,238 |
| 12,600 | | @ | | Capella Education Co. | | | 740,376 |
| 17,134 | | | | Chemed Corp. | | | 681,419 |
| 32,493 | | @ | | Consolidated Graphics, Inc. | | | 735,642 |
| 82,490 | | @ | | Cross Country Healthcare, Inc. | | | 725,087 |
| 13,100 | | @ | | Forrester Research, Inc. | | | 369,551 |
| 45,100 | | @ | | Geo Group, Inc. | | | 813,153 |
| 50,300 | | L | | Heartland Payment Systems, Inc. | | | 880,250 |
| 30,442 | | | | Heidrick & Struggles International, Inc. | | | 655,721 |
| 51,710 | | | | Hillenbrand, Inc. | | | 862,523 |
| 7,951 | | @ | | Kendle International, Inc. | | | 204,500 |
| 7,200 | | | | Landauer, Inc. | | | 527,760 |
| 32,782 | | @ | | Live Nation, Inc. | | | 188,169 |
See Accompanying Notes to Financial Statements
40
| | |
| ING VP INDEX PLUS SMALLCAP PORTFOLIO | | PORTFOLIO OF INVESTMENTS ASOF DECEMBER 31, 2008 (CONTINUED) |
| | | | | | | |
| Shares | | | | | | Value |
| | | | | | | |
| Commercial Services: (continued) | | | |
| 93,050 | | @ | | On Assignment, Inc. | | $ | 527,594 |
| 9,840 | | @ | | Parexel International Corp. | | | 95,546 |
| 15,466 | | @, L | | Pre-Paid Legal Services, Inc. | | | 576,727 |
| 36,700 | | @ | | Ticketmaster | | | 235,614 |
| 48,930 | | @, S | | TrueBlue, Inc. | | | 468,260 |
| 25,000 | | @ | | Universal Technical Institute, Inc. | | | 429,250 |
| 32,800 | | | | Viad Corp. | | | 811,472 |
| 25,655 | | @, L | | Volt Information Sciences, Inc. | | | 185,486 |
| 58,196 | | | | Watson Wyatt Worldwide, Inc. | | | 2,782,933 |
| | | | | | | |
| | | | | | | 16,316,893 |
| | | | | | | |
| Computers: 2.7% | | | |
| 44,921 | | @ | | CACI International, Inc. | | | 2,025,488 |
| 102,094 | | @ | | Ciber, Inc. | | | 491,072 |
| 80,850 | | @, L | | Hutchinson Technology, Inc. | | | 281,358 |
| 72,180 | | @ | | Insight Enterprises, Inc. | | | 498,042 |
| 57,200 | | @ | | Manhattan Associates, Inc. | | | 904,332 |
| 122,328 | | @ | | Micros Systems, Inc. | | | 1,996,393 |
| 25,820 | | | | MTS Systems Corp. | | | 687,845 |
| 103,270 | | @ | | Radisys Corp. | | | 571,083 |
| 10,950 | | @ | | SYKES Enterprises, Inc. | | | 209,364 |
| 30,245 | | @, L | | Synaptics, Inc. | | | 500,857 |
| | | | | | | |
| | | | | | | 8,165,834 |
| | | | | | | |
| Cosmetics/Personal Care: 0.4% | | | |
| 18,460 | | @, L | | Chattem, Inc. | | | 1,320,444 |
| | | | | | | |
| | | | | | | 1,320,444 |
| | | | | | | |
| Distribution/Wholesale: 2.5% | | | |
| 99,350 | | @ | | Brightpoint, Inc. | | | 432,173 |
| 36,520 | | @, L | | Fossil, Inc. | | | 609,884 |
| 58,870 | | | | Owens & Minor, Inc. | | | 2,216,456 |
| 36,900 | | L | | Pool Corp. | | | 663,093 |
| 38,030 | | @ | | Scansource, Inc. | | | 732,838 |
| 47,210 | | @ | | School Specialty, Inc. | | | 902,655 |
| 28,360 | | @ | | United Stationers, Inc. | | | 949,776 |
| 23,830 | | L | | Watsco, Inc. | | | 915,072 |
| | | | | | | |
| | | | | | | 7,421,947 |
| | | | | | | |
| Diversified Financial Services: 2.2% | | | |
| 28,040 | | | | Financial Federal Corp. | | | 652,491 |
| 9,450 | | L | | Greenhill & Co., Inc. | | | 659,327 |
| 74,901 | | @ | | Investment Technology Group, Inc. | | | 1,701,751 |
| 48,905 | | @ | | LaBranche & Co., Inc. | | | 234,255 |
| 146,800 | | L | | National Financial Partners Corp. | | | 446,272 |
| 40,240 | | | | OptionsXpress Holdings, Inc. | | | 537,606 |
| 11,380 | | @, L | | Portfolio Recovery Associates, Inc. | | | 385,099 |
| 12,250 | | @ | | Stifel Financial Corp. | | | 561,663 |
| 27,555 | | | | SWS Group, Inc. | | | 522,167 |
| 47,545 | | @ | | TradeStation Group, Inc. | | | 306,665 |
| 20,773 | | @ | | World Acceptance, Corp. | | | 410,474 |
| | | | | | | |
| | | | | | | 6,417,770 |
| | | | | | | |
| Electric: 1.7% | | | |
| 56,180 | | | | Avista Corp. | | | 1,088,768 |
| 16,100 | | | | Central Vermont Public Service Corp. | | | 384,146 |
| 9,500 | | | | CH Energy Group, Inc. | | | 488,205 |
| 54,200 | | | | Cleco Corp. | | | 1,237,386 |
| 46,640 | | @ | | El Paso Electric Co. | | | 843,718 |
| 9,600 | | | | UIL Holdings Corp. | | | 288,288 |
| 26,321 | | | | Unisource Energy Corp. | | | 772,785 |
| | | | | | | |
| | | | | | | 5,103,296 |
| | | | | | | |
| | | | | | | |
| Shares | | | | | | Value |
| | | | | | | |
| Electrical Components & Equipment: 0.2% | | | |
| 28,110 | | | | Belden CDT, Inc. | | $ | 586,937 |
| | | | | | | |
| | | | | | | 586,937 |
| | | | | | | |
| Electronics: 4.3% | | | |
| 3,610 | | L | | Analogic Corp. | | | 98,481 |
| 2,200 | | @ | | Axsys Technologies, Inc. | | | 120,692 |
| 127,430 | | @ | | Benchmark Electronics, Inc. | | | 1,627,281 |
| 81,580 | | | | Brady Corp. | | | 1,953,841 |
| 49,850 | | @ | | Checkpoint Systems, Inc. | | | 490,524 |
| 69,728 | | | | CTS Corp. | | | 384,201 |
| 8,317 | | @ | | Cymer, Inc. | | | 182,225 |
| 20,300 | | L | | Daktronics, Inc. | | | 190,008 |
| 33,161 | | @, L | | Dionex Corp. | | | 1,487,271 |
| 8,200 | | @ | | II-VI, Inc. | | | 156,538 |
| 21,898 | | @, L | | Itron, Inc. | | | 1,395,779 |
| 54,190 | | @ | | LoJack Corp. | | | 223,263 |
| 76,593 | | | | Methode Electronics, Inc. | | | 516,237 |
| 31,820 | | @ | | Plexus Corp. | | | 539,349 |
| 46,550 | | @ | | Rogers Corp. | | | 1,292,694 |
| 66,490 | | | | Technitrol, Inc. | | | 231,385 |
| 115,625 | | @ | | TTM Technologies, Inc. | | | 602,406 |
| 49,500 | | | | Watts Water Technologies, Inc. | | | 1,236,015 |
| | | | | | | |
| | | | | | | 12,728,190 |
| | | | | | | |
| Engineering & Construction: 0.8% | | | |
| 99,292 | | @ | | EMCOR Group, Inc. | | | 2,227,095 |
| | | | | | | |
| | | | | | | 2,227,095 |
| | | | | | | |
| Entertainment: 0.3% | | | |
| 154,020 | | @ | | Shuffle Master, Inc. | | | 763,939 |
| | | | | | | |
| | | | | | | 763,939 |
| | | | | | | |
| Environmental Control: 0.5% | | | |
| 44,731 | | @ | | Calgon Carbon Corp. | | | 687,068 |
| 77,450 | | @ | | Darling International, Inc. | | | 425,201 |
| 13,100 | | @ | | Tetra Tech, Inc. | | | 316,365 |
| | | | | | | |
| | | | | | | 1,428,634 |
| | | | | | | |
| Food: 1.4% | | | |
| 10,596 | | L | | Cal-Maine Foods, Inc. | | | 304,105 |
| 21,500 | | | | Diamond Foods, Inc. | | | 433,225 |
| 33,168 | | @ | | Hain Celestial Group, Inc. | | | 633,177 |
| 21,500 | | | | J&J Snack Foods Corp. | | | 771,420 |
| 16,190 | | | | Nash Finch Co. | | | 726,769 |
| 42,684 | | @ | | TreeHouse Foods, Inc. | | | 1,162,712 |
| 12,600 | | @ | | United Natural Foods, Inc. | | | 224,532 |
| | | | | | | |
| | | | | | | 4,255,940 |
| | | | | | | |
| Forest Products & Paper: 0.1% | | | |
| 81,937 | | @ | | Buckeye Technologies, Inc. | | | 298,251 |
| 9,000 | | @ | | Clearwater Paper Corp. | | | 75,510 |
| | | | | | | |
| | | | | | | 373,761 |
| | | | | | | |
| Gas: 3.4% | | | |
| 119,031 | | | | Atmos Energy Corp. | | | 2,821,035 |
| 2,900 | | | | Laclede Group, Inc. | | | 135,836 |
| 35,325 | | | | New Jersey Resources Corp. | | | 1,390,039 |
| 5,300 | | | | Northwest Natural Gas Co. | | | 234,419 |
| 60,500 | | L | | Piedmont Natural Gas Co. | | | 1,916,035 |
| 41,790 | | | | South Jersey Industries, Inc. | | | 1,665,332 |
| 73,800 | | | | Southwest Gas Corp. | | | 1,861,236 |
| | | | | | | |
| | | | | | | 10,023,932 |
| | | | | | | |
See Accompanying Notes to Financial Statements
41
| | |
| ING VP INDEX PLUS SMALLCAP PORTFOLIO | | PORTFOLIO OF INVESTMENTS ASOF DECEMBER 31, 2008 (CONTINUED) |
| | | | | | | |
| Shares | | | | | | Value |
| | | | | | | |
| Hand/Machine Tools: 1.0% | | | |
| 52,480 | | | | Baldor Electric Co. | | $ | 936,768 |
| 53,190 | | | | Regal-Beloit Corp. | | | 2,020,688 |
| | | | | | | |
| | | | | | | 2,957,456 |
| | | | | | | |
| Healthcare - Products: 3.2% | | | |
| 108,450 | | @, L | | American Medical Systems Holdings, Inc. | | | 974,966 |
| 50,930 | | @, L | | Arthrocare Corp. | | | 242,936 |
| 10,620 | | | | Cooper Cos., Inc. | | | 174,168 |
| 50,540 | | @ | | Cyberonics | | | 837,448 |
| 16,650 | | @ | | Haemonetics Corp. | | | 940,725 |
| 27,025 | | @ | | ICU Medical, Inc. | | | 895,609 |
| 62,285 | | @ | | Immucor, Inc. | | | 1,655,535 |
| 21,700 | | | | Invacare Corp. | | | 336,784 |
| 44,770 | | @ | | Kensey Nash Corp. | | | 868,986 |
| 4,460 | | | | Mentor Corp. | | | 137,948 |
| 8,010 | | | | Meridian Bioscience, Inc. | | | 204,015 |
| 29,450 | | @ | | Merit Medical Systems, Inc. | | | 528,039 |
| 69,900 | | @, L | | PSS World Medical, Inc. | | | 1,315,518 |
| 4,980 | | @, L | | SurModics, Inc. | | | 125,845 |
| 6,860 | | | | West Pharmaceutical Services, Inc. | | | 259,102 |
| | | | | | | |
| | | | | | | 9,497,624 |
| | | | | | | |
| Healthcare - Services: 4.0% | | | |
| 19,431 | | @, L | | Amedisys, Inc. | | | 803,278 |
| 69,855 | | @ | | AMERIGROUP Corp. | | | 2,062,120 |
| 11,015 | | @ | | Amsurg Corp. | | | 257,090 |
| 48,276 | | @ | | Centene Corp. | | | 951,520 |
| 63,670 | | @ | | Healthspring, Inc. | | | 1,271,490 |
| 101,260 | | @ | | Healthways, Inc. | | | 1,162,465 |
| 11,300 | | @ | | LHC Group, Inc. | | | 406,800 |
| 32,350 | | @ | | Magellan Health Services, Inc. | | | 1,266,826 |
| 32,680 | | @ | | Molina Healthcare, Inc. | | | 575,495 |
| 120,000 | | @ | | Odyssey HealthCare, Inc. | | | 1,110,000 |
| 59,943 | | @ | | Pediatrix Medical Group, Inc. | | | 1,900,193 |
| 11,560 | | @ | | Res-Care, Inc. | | | 173,631 |
| | | | | | | |
| | | | | | | 11,940,908 |
| | | | | | | |
| Home Builders: 0.3% | | | |
| 34,800 | | L | | M/I Homes, Inc. | | | 366,792 |
| 39,600 | | @, L | | Meritage Homes Corp. | | | 481,932 |
| 74,800 | | @ | | Standard-Pacific Corp. | | | 133,144 |
| | | | | | | |
| | | | | | | 981,868 |
| | | | | | | |
| Home Furnishings: 0.1% | | | |
| 26,230 | | @, L | | Universal Electronics, Inc. | | | 425,451 |
| | | | | | | |
| | | | | | | 425,451 |
| | | | | | | |
| Household Products/Wares: 0.1% | | | |
| 54,983 | | @ | | Central Garden & Pet Co. | | | 324,400 |
| | | | | | | |
| | | | | | | 324,400 |
| | | | | | | |
| Housewares: 0.6% | | | |
| 55,220 | | | | Toro Co. | | | 1,822,260 |
| | | | | | | |
| | | | | | | 1,822,260 |
| | | | | | | |
| Insurance: 3.6% | | | |
| 88,747 | | | | Delphi Financial Group | | | 1,636,495 |
| 23,800 | | | | Infinity Property & Casualty Corp. | | | 1,112,174 |
| 37,192 | | @ | | ProAssurance Corp. | | | 1,962,994 |
| 13,671 | | | | RLI Corp. | | | 836,118 |
| 38,190 | | | | Safety Insurance Group, Inc. | | | 1,453,511 |
| 48,298 | | | | Selective Insurance Group | | | 1,107,473 |
| | | | | | | |
| Shares | | | | | | Value |
| | | | | | | |
| Insurance: (continued) | | | |
| 35,860 | | L | | Tower Group, Inc. | | $ | 1,011,611 |
| 28,700 | | | | United Fire & Casualty Co. | | | 891,709 |
| 19,475 | | | | Zenith National Insurance Corp. | | | 614,826 |
| | | | | | | |
| | | | | | | 10,626,911 |
| | | | | | | |
| Internet: 2.2% | | | |
| 40,260 | | @ | | Blue Coat Systems, Inc. | | | 338,184 |
| 11,550 | | @, L | | Blue Nile, Inc. | | | 282,860 |
| 22,810 | | @ | | Cybersource Corp. | | | 273,492 |
| 70,430 | | @ | | DealerTrack Holdings, Inc. | | | 837,413 |
| 39,700 | | @ | | Interwoven, Inc. | | | 500,220 |
| 79,530 | | @ | | j2 Global Communications, Inc. | | | 1,593,781 |
| 30,250 | | L | | Nutri/System, Inc. | | | 441,348 |
| 63,640 | | @ | | Perficient, Inc. | | | 304,199 |
| 64,375 | | @, L | | Stamps.com, Inc. | | | 632,806 |
| 101,472 | | | | United Online, Inc. | | | 615,935 |
| 54,710 | | @ | | Websense, Inc. | | | 819,009 |
| | | | | | | |
| | | | | | | 6,639,247 |
| | | | | | | |
| Leisure Time: 1.0% | | | |
| 29,800 | | @ | | Interval Leisure Group, Inc. | | | 160,622 |
| 57,038 | | L | | Polaris Industries, Inc. | | | 1,634,139 |
| 47,410 | | @, L | | WMS Industries, Inc. | | | 1,275,329 |
| | | | | | | |
| | | | | | | 3,070,090 |
| | | | | | | |
| Machinery - Diversified: 1.6% | | | |
| 49,992 | | | | Applied Industrial Technologies, Inc. | | | 945,849 |
| 51,050 | | | | Cognex Corp. | | | 755,540 |
| 81,171 | | @ | | Gardner Denver, Inc. | | | 1,894,531 |
| 43,500 | | @ | | Intermec, Inc. | | | 577,680 |
| 32,172 | | | | Robbins & Myers, Inc. | | | 520,221 |
| | | | | | | |
| | | | | | | 4,693,821 |
| | | | | | | |
| Metal Fabricate/Hardware: 1.0% | | | |
| 15,000 | | L | | CIRCOR International, Inc. | | | 412,500 |
| 4,500 | | | | Kaydon Corp. | | | 154,575 |
| 5,231 | | | | Lawson Products | | | 119,528 |
| 68,760 | | | | Mueller Industries, Inc. | | | 1,724,501 |
| 7,140 | | | | Valmont Industries, Inc. | | | 438,110 |
| | | | | | | |
| | | | | | | 2,849,214 |
| | | | | | | |
| Mining: 0.2% | | | |
| 16,460 | | | | Amcol International Corp. | | | 344,837 |
| 15,840 | | @, L | | Century Aluminum Co. | | | 158,400 |
| 9,200 | | @ | | RTI International Metals, Inc. | | | 131,652 |
| | | | | | | |
| | | | | | | 634,889 |
| | | | | | | |
| Miscellaneous Manufacturing: 3.1% | | | |
| 50,000 | | | | Actuant Corp. | | | 951,000 |
| 62,675 | | | | Acuity Brands, Inc. | | | 2,187,984 |
| 36,249 | | | | AO Smith Corp. | | | 1,070,070 |
| 51,495 | | @, L | | Ceradyne, Inc. | | | 1,045,863 |
| 20,940 | | | | Clarcor, Inc. | | | 694,789 |
| 50,924 | | @ | | EnPro Industries, Inc. | | | 1,096,903 |
| 98,140 | | @ | | Griffon Corp. | | | 915,646 |
| 25,850 | | | | John Bean Technologies Corp. | | | 211,195 |
| 67,480 | | @ | | Lydall, Inc. | | | 388,010 |
| 19,852 | | | | Myers Industries, Inc. | | | 158,816 |
| 33,500 | | | | Tredegar Corp. | | | 609,030 |
| | | | | | | |
| | | | | | | 9,329,306 |
| | | | | | | |
See Accompanying Notes to Financial Statements
42
| | |
| ING VP INDEX PLUS SMALLCAP PORTFOLIO | | PORTFOLIO OF INVESTMENTS ASOF DECEMBER 31, 2008 (CONTINUED) |
| | | | | | | |
| Shares | | | | | | Value |
| | | | | | | |
| Oil & Gas: 1.6% | | | |
| 81,770 | | @ | | Atwood Oceanics, Inc. | | $ | 1,249,446 |
| 30,500 | | | | Holly Corp. | | | 556,015 |
| 15,930 | | | | Penn Virginia Corp. | | | 413,861 |
| 4,240 | | @ | | Petroleum Development Corp. | | | 102,057 |
| 51,320 | | @, L | | Petroquest Energy, Inc. | | | 346,923 |
| 52,020 | | @ | | Pioneer Drilling Co. | | | 289,751 |
| 45,080 | | | | St. Mary Land & Exploration Co. | | | 915,575 |
| 45,190 | | @, L | | Stone Energy Corp. | | | 497,994 |
| 30,573 | | @ | | Swift Energy Co. | | | 513,932 |
| | | | | | | |
| | | | | | | 4,885,554 |
| | | | | | | |
| Oil & Gas Services: 2.0% | | | |
| 62,240 | | @ | | Basic Energy Services, Inc. | | | 811,610 |
| 15,660 | | | | Gulf Island Fabrication, Inc. | | | 225,661 |
| 40,190 | | @ | | Hornbeck Offshore Services, Inc. | | | 656,705 |
| 83,390 | | @ | | ION Geophysical Corp. | | | 286,028 |
| 22,973 | | | | Lufkin Industries, Inc. | | | 792,569 |
| 87,100 | | @ | | Oil States International, Inc. | | | 1,627,899 |
| 21,534 | | @ | | SEACOR Holdings, Inc. | | | 1,435,241 |
| | | | | | | |
| | | | | | | 5,835,713 |
| | | | | | | |
| Packaging & Containers: 0.7% | | | |
| 59,075 | | | | Rock-Tenn Co. | | | 2,019,184 |
| | | | | | | |
| | | | | | | 2,019,184 |
| | | | | | | |
| Pharmaceuticals: 1.1% | | | |
| 21,080 | | @ | | Catalyst Health Solutions, Inc. | | | 513,298 |
| 45,900 | | @ | | Par Pharmaceutical Cos., Inc. | | | 615,519 |
| 27,250 | | @ | | PharMerica Corp. | | | 427,008 |
| 70,980 | | @, L | | Salix Pharmaceuticals Ltd. | | | 626,753 |
| 93,420 | | @ | | Viropharma, Inc. | | | 1,216,328 |
| | | | | | | |
| | | | | | | 3,398,906 |
| | | | | | | |
| Real Estate: 0.1% | | | |
| 30,910 | | @, L | | Forestar Real Estate Group, Inc. | | | 294,263 |
| | | | | | | |
| | | | | | | 294,263 |
| | | | | | | |
| Retail: 8.0% | | | |
| 40,025 | | | | Buckle, Inc. | | | 873,346 |
| 8,880 | | @, L | | Buffalo Wild Wings, Inc. | | | 227,772 |
| 54,000 | | @, L | | Cabela’s, Inc. | | | 314,820 |
| 51,288 | | | | Casey’s General Stores, Inc. | | | 1,167,828 |
| 42,570 | | | | Cash America International, Inc. | | | 1,164,290 |
| 83,216 | | | | Cato Corp. | | | 1,256,562 |
| 48,280 | | @ | | CEC Entertainment, Inc. | | | 1,170,790 |
| 68,320 | | @ | | Charlotte Russe Holding, Inc. | | | 443,397 |
| 45,100 | | @ | | Childrens Place Retail Stores, Inc. | | | 977,768 |
| 125,960 | | | | Christopher & Banks Corp. | | | 705,376 |
| 80,630 | | @, L | | Dress Barn, Inc. | | | 865,966 |
| 50,570 | | | | Finish Line | | | 283,192 |
| 41,620 | | @, L | | First Cash Financial Services, Inc. | | | 793,277 |
| 45,000 | | | | Fred’s, Inc. | | | 484,200 |
| 28,500 | | @, L | | Genesco, Inc. | | | 482,220 |
| 45,109 | | @ | | Gymboree Corp. | | | 1,176,894 |
| 19,830 | | L | | Haverty Furniture Cos., Inc. | | | 185,014 |
| 25,750 | | @, L | | Hibbett Sporting Goods, Inc. | | | 404,533 |
| 52,250 | | @ | | HOT Topic, Inc. | | | 484,358 |
| 8,322 | | @ | | Jack in the Box, Inc. | | | 183,833 |
| 31,220 | | @, L | | Jo-Ann Stores, Inc. | | | 483,598 |
| 35,910 | | @, L | | JoS. A Bank Clothiers, Inc. | | | 939,047 |
| 11,069 | | L | | Landry’s Restaurants, Inc. | | | 128,400 |
| 43,288 | | @, L | | Panera Bread Co. | | | 2,261,365 |
| 54,540 | | @ | | PetMed Express, Inc. | | | 961,540 |
| | | | | | | |
| Shares | | | | | | Value |
| | | | | | | |
| Retail: (continued) | | | |
| 60,490 | | @, L | | PF Chang’s China Bistro, Inc. | | $ | 1,266,661 |
| 50,576 | | @ | | Sonic Corp. | | | 615,510 |
| 48,930 | | @ | | Tractor Supply Co. | | | 1,768,330 |
| 37,990 | | | | World Fuel Services Corp. | | | 1,405,630 |
| 31,430 | | @, L | | Zumiez, Inc. | | | 234,154 |
| | | | | | | |
| | | | | | | 23,709,671 |
| | | | | | | |
| Savings & Loans: 0.8% | | | |
| 78,380 | | | | Anchor Bancorp. Wisconsin, Inc. | | | 216,329 |
| 88,830 | | S | | Brookline Bancorp., Inc. | | | 946,040 |
| 82,570 | | | | Dime Community Bancshares | | | 1,098,181 |
| 37,910 | | @, L | | Guaranty Financial Group, Inc. | | | 98,945 |
| | | | | | | |
| | | | | | | 2,359,495 |
| | | | | | | |
| Semiconductors: 3.2% | | | |
| 44,470 | | @ | | Cabot Microelectronics Corp. | | | 1,159,333 |
| 21,552 | | | | Cohu, Inc. | | | 261,857 |
| 128,250 | | @, L | | Cypress Semiconductor Corp. | | | 573,278 |
| 18,870 | | @, L | | Diodes, Inc. | | | 114,352 |
| 124,640 | | @ | | DSP Group, Inc. | | | 999,613 |
| 12,100 | | @ | | Hittite Microwave Corp. | | | 356,466 |
| 79,630 | | @ | | Microsemi Corp. | | | 1,006,523 |
| 74,760 | | @ | | MKS Instruments, Inc. | | | 1,105,700 |
| 150,180 | | @, S | | Skyworks Solutions, Inc. | | | 831,997 |
| 53,750 | | @ | | Standard Microsystems Corp. | | | 878,275 |
| 6,680 | | @ | | Supertex, Inc. | | | 160,387 |
| 85,468 | | @ | | Triquint Semiconductor, Inc. | | | 294,010 |
| 29,500 | | @ | | Ultratech, Inc. | | | 352,820 |
| 62,660 | | @ | | Varian Semiconductor Equipment Associates, Inc. | | | 1,135,399 |
| 27,294 | | @ | | Veeco Instruments, Inc. | | | 173,044 |
| | | | | | | |
| | | | | | | 9,403,054 |
| | | | | | | |
| Software: 3.4% | | | |
| 12,600 | | @, L | | Avid Technology, Inc. | | | 137,466 |
| 20,900 | | | | Blackbaud, Inc. | | | 282,150 |
| 13,720 | | @, L | | Concur Technologies, Inc. | | | 450,290 |
| 12,300 | | @ | | CSG Systems International | | | 214,881 |
| 23,250 | | @ | | Digi International, Inc. | | | 188,558 |
| 42,900 | | @, L | | Eclipsys Corp. | | | 608,751 |
| 182,750 | | @, L | | Epicor Software Corp. | | | 877,200 |
| 97,130 | | @ | | Informatica Corp. | | | 1,333,595 |
| 54,736 | | @ | | JDA Software Group, Inc. | | | 718,684 |
| 55,580 | | @ | | Omnicell, Inc. | | | 678,632 |
| 52,113 | | @ | | Phase Forward, Inc. | | | 652,455 |
| 31,630 | | @ | | Phoenix Technologies Ltd. | | | 110,705 |
| 80,419 | | @ | | Progress Software Corp. | | | 1,548,870 |
| 28,030 | | @ | | Smith Micro Software, Inc. | | | 155,847 |
| 23,011 | | @ | | SPSS, Inc. | | | 620,377 |
| 45,850 | | @, L | | SYNNEX Corp. | | | 519,481 |
| 75,060 | | @ | | Take-Two Interactive Software, Inc. | | | 567,454 |
| 26,150 | | @ | | Taleo Corp. | | | 204,755 |
| 20,123 | | @ | | Tyler Technologies, Inc. | | | 241,074 |
| | | | | | | |
| | | | | | | 10,111,225 |
| | | | | | | |
| Storage/Warehousing: 0.2% | | | |
| 30,900 | | @, S | | Mobile Mini, Inc. | | | 445,578 |
| | | | | | | |
| | | | | | | 445,578 |
| | | | | | | |
| Telecommunications: 2.4% | | | |
| 167,650 | | @ | | Adaptec, Inc. | | | 553,245 |
| 36,600 | | @, L | | Anixter International, Inc. | | | 1,102,392 |
| 17,700 | | | | Applied Signal Technology, Inc. | | | 317,538 |
See Accompanying Notes to Financial Statements
43
| | |
| ING VP INDEX PLUS SMALLCAP PORTFOLIO | | PORTFOLIO OF INVESTMENTS ASOF DECEMBER 31, 2008 (CONTINUED) |
| | | | | | | |
| Shares | | | | | | Value |
| | | | | | | |
| Telecommunications: (continued) | | | |
| 116,323 | | @ | | Arris Group, Inc. | | $ | 924,768 |
| 45,740 | | | | Black Box Corp. | | | 1,194,729 |
| 7,940 | | @ | | Comtech Telecommunications | | | 363,811 |
| 60,898 | | | | Fairpoint Communications, Inc. | | | 199,745 |
| 25,000 | | @ | | General Communication, Inc. | | | 202,250 |
| 125,899 | | @ | | Harmonic, Inc. | | | 706,293 |
| 57,250 | | @ | | Netgear, Inc. | | | 653,223 |
| 68,640 | | @ | | Novatel Wireless, Inc. | | | 318,490 |
| 35,800 | | @ | | Tekelec | | | 477,572 |
| | | | | | | |
| | | | | | | 7,014,056 |
| | | | | | | |
| Textiles: 0.6% | | | |
| 55,456 | | | | G&K Services, Inc. | | | 1,121,320 |
| 25,300 | | | | Unifirst Corp. | | | 751,157 |
| | | | | | | |
| | | | | | | 1,872,477 |
| | | | | | | |
| Toys/Games/Hobbies: 0.2% | | | |
| 28,972 | | @ | | Jakks Pacific, Inc. | | | 597,692 |
| | | | | | | |
| | | | | | | 597,692 |
| | | | | | | |
| Transportation: 1.9% | | | |
| 40,680 | | L | | Arkansas Best Corp. | | | 1,224,875 |
| 40,200 | | | | Heartland Express, Inc. | | | 633,552 |
| 20,942 | | @ | | HUB Group, Inc. | | | 555,591 |
| 62,950 | | @ | | Kirby Corp. | | | 1,722,312 |
| 21,920 | | | | Landstar System, Inc. | | | 842,386 |
| 25,180 | | @ | | Old Dominion Freight Line | | | 716,623 |
| | | | | | | |
| | | | | | | 5,695,339 |
| | | | | | | |
| | | | Total Common Stock
( Cost $375,328,869 ) | | | 277,672,313 |
| | | | | | | |
| REAL ESTATE INVESTMENT TRUSTS: 4.8% | | | |
| Apartments: 0.5% | | | |
| 19,230 | | L | | Home Properties, Inc. | | | 780,738 |
| 13,550 | | | | Mid-America Apartment Communities, Inc. | | | 503,518 |
| 15,400 | | | | Post Properties, Inc. | | | 254,100 |
| | | | | | | |
| | | | | | | 1,538,356 |
| | | | | | | |
| Diversified: 1.0% | | | |
| 91,570 | | | | Colonial Properties Trust | | | 762,778 |
| 38,260 | | | | Entertainment Properties Trust | | | 1,140,148 |
| 158,570 | | | | Lexington Realty Trust | | | 792,850 |
| 3,900 | | | | PS Business Parks, Inc. | | | 174,174 |
| | | | | | | |
| | | | | | | 2,869,950 |
| | | | | | | |
| Health Care: 0.5% | | | |
| 47,180 | | L | | Medical Properties Trust, Inc. | | | 297,706 |
| 74,080 | | | | Senior Housing Properties Trust | | | 1,327,514 |
| | | | | | | |
| | | | | | | 1,625,220 |
| | | | | | | |
| Hotels: 0.5% | | | |
| 173,870 | | | | DiamondRock Hospitality Co. | | | 881,521 |
| 59,550 | | | | LaSalle Hotel Properties | | | 658,028 |
| | | | | | | |
| | | | | | | 1,539,549 |
| | | | | | | |
| Office Property: 0.9% | | | |
| 53,160 | | | | BioMed Realty Trust, Inc. | | | 623,035 |
| 51,600 | | | | Franklin Street Properties Corp. | | | 761,100 |
| 16,830 | | | | Kilroy Realty Corp. | | | 563,132 |
| 38,160 | | | | Parkway Properties, Inc. | | | 686,880 |
| | | | | | | |
| | | | | | | 2,634,147 |
| | | | | | | |
| | | | | | | |
| Shares | | | | | | Value |
| | | | | | | |
| Regional Malls: 0.2% | | | |
| 72,310 | | L | | Pennsylvania Real Estate Investment Trust | | $ | 538,710 |
| | | | | | | |
| | | | | | | 538,710 |
| | | | | | | |
| Shopping Centers: 0.5% | | | |
| 66,550 | | | | Cedar Shopping Centers, Inc. | | | 471,174 |
| 13,750 | | | | Inland Real Estate Corp. | | | 178,475 |
| 35,800 | | | | Kite Realty Group Trust | | | 199,048 |
| 16,750 | | L | | Tanger Factory Outlet Centers, Inc. | | | 630,135 |
| | | | | | | |
| | | | | | | 1,478,832 |
| | | | | | | |
| Single Tenant: 0.2% | | | |
| 40,820 | | L | | National Retail Properties, Inc. | | | 701,696 |
| | | | | | | |
| | | | | | | 701,696 |
| | | | | | | |
| Storage: 0.4% | | | |
| 85,498 | | | | Extra Space Storage, Inc. | | | 882,339 |
| 4,916 | | | | Sovran Self Storage, Inc. | | | 176,976 |
| | | | | | | |
| | | | | | | 1,059,315 |
| | | | | | | |
| Warehouse/Industrial: 0.1% | | | |
| 9,950 | | | | EastGroup Properties, Inc. | | | 354,021 |
| | | | | | | |
| | | | | | | 354,021 |
| | | | | | | |
| | | | Total Real Estate Investment Trusts
(Cost $22,018,339) | | | 14,339,796 |
| | | | | | | |
| | | | Total Long-Term Investments
(Cost $397,347,208) | | | 292,012,109 |
| | | | | | | |
| SHORT-TERM INVESTMENTS: 13.6% |
| Affiliated Mutual Fund: 2.2% | | | |
| 6,613,000 | | S | | ING Institutional Prime Money Market Fund - Class I | | | 6,613,000 |
| | | | | | | |
| | | | Total Mutual Fund
(Cost $6,613,000) | | | 6,613,000 |
| | | | | | | |
| | | | | | | | | | | | |
Principal
Amount | | | | | | | | | Value | |
| | Securities Lending Collateralcc: 11.4% | | | | | | | |
| $ | 34,105,517 | | | | Bank of New York Mellon Corp. Institutional Cash Reserves | | | | | $ | 33,694,872 | |
| | | | | | | | | | | | |
| | | | | Total Securities Lending Collateral
(Cost $34,105,517) | | | | | | 33,694,872 | |
| | | | | | | | | | | | |
| | | | | Total Short-Term Investments
(Cost $40,718,517) | | | | | | 40,307,872 | |
| | | | | | | | | | | | |
| | | | | Total Investments in Securities
(Cost $438,065,725)* | | 111.7 | % | | $ | 332,319,981 | |
| | | | | Other Assets and Liabilities - Net | | (11.7 | ) | | | (34,755,838 | ) |
| | | | | | | | | | | | |
| | | | | Net Assets | | 100.0% | | | | $297,564,143 | |
| | | | | | | | | | | | |
See Accompanying Notes to Financial Statements
44
| | |
| ING VP INDEX PLUS SMALLCAP PORTFOLIO | | PORTFOLIO OF INVESTMENTS ASOF DECEMBER 31, 2008 (CONTINUED) |
| @ | Non-income producing security |
| cc | Securities purchased with cash collateral for securities loaned. |
| S | All or a portion of this security is segregated to cover collateral requirements for applicable futures, options, swaps, foreign forward currency contracts and/or when-issued or delayed-delivery securities. |
| L | Loaned security, a portion or all of the security is on loan at December 31, 2008. |
| * | Cost for federal income tax purposes is $450,929,436. |
| | | | |
Net unrealized depreciation consists of: | | | | |
Gross Unrealized Appreciation | | $ | 7,056,516 | |
Gross Unrealized Depreciation | | | (125,665,971 | ) |
| | | | |
Net Unrealized Depreciation | | $ | (118,609,455 | ) |
| | | | |
The following table summarizes the inputs used as of December 31, 2008 in determining the Portfolio's investments at fair value for purposes of SFAS 157:
| | | | | | |
| | | Investments in
Securities | | Other Financial
Instruments* |
Level 1 — Quoted Prices | | $ | 298,625,109 | | $ | 360,709 |
Level 2 — Other Significant Observable Inputs | | | 33,694,872 | | | — |
Level 3 — Significant Unobservable Inputs | | | — | | | — |
| | | | | | |
Total | | $ | 332,319,981 | | $ | 360,709 |
| | | | | | |
"Fair value" for purposes of SFAS 157 is different from "fair value" as used in the 1940 Act. The former generally implies market value, and can include market quotations as a source of value, and the latter refers to determinations of actual value in absence of available market quotations.
| * | Other financial instruments may include forward foreign currency contracts, futures, swaps, and written options. Forward foreign currency contracts and futures are reported at their unrealized gain/loss at year end. Swaps and written options are reported at their market value at year end. |
ING VP Index Plus SmallCap Portfolio Open Futures Contracts on December 31, 2008:
| | | | | | | |
Contract Description | | Number of Contracts | | Expiration Date | | Unrealized Appreciation |
Long Contracts | | | | | | | |
Russell 2000 Mini | | 130 | | 03/20/09 | | $ | 360,709 |
| | | | | | | |
| | | | | | $ | 360,709 |
| | | | | | | |
See Accompanying Notes to Financial Statements
45
TAX INFORMATION (UNAUDITED)
Dividends paid during the year ended December 31, 2008 were as follows:
| | | | | |
Portfolio Name | | Type | | Per Share Amount |
| | |
ING VP Index Plus LargeCap Portfolio | | | | | |
Class I | | NII | | $ | 0.3045 |
Class S | | NII | | $ | 0.2756 |
All Classes | | STCG | | $ | 0.2087 |
All Classes | | LTCG | | $ | 0.8614 |
| | |
ING VP Index Plus MidCap Portfolio | | | | | |
Class I | | NII | | $ | 0.2156 |
Class S | | NII | | $ | 0.1685 |
All Classes | | STCG | | $ | 0.1425 |
All Classes | | LTCG | | $ | 1.8782 |
| | |
ING VP Index Plus SmallCap Portfolio | | | | | |
Class I | | NII | | $ | 0.1224 |
Class S | | NII | | $ | 0.0799 |
All Classes | | LTCG | | $ | 0.8328 |
NII - Net investment income
STCG - Short-term capital gain
LTCG - Long-term capital gain
Of the ordinary distributions made during the year ended December 31, 2008, the following percentages qualify for the dividends received deduction (DRD) available to corporate shareholders:
| | | |
| |
ING VP Index Plus LargeCap Portfolio | | 66.08 | % |
| |
ING VP Index Plus MidCap Portfolio | | 64.10 | % |
| |
ING VP Index Plus SmallCap Portfolio | | 100.00 | % |
Above figures may differ from those cited elsewhere in this report due to differences in the calculation of income and gains under U.S. generally accepted accounting principles (book) purposes and Internal Revenue Service (tax) purposes.
Shareholders are strongly advised to consult their own tax advisers with respect to the tax consequences of their investments in the Portfolios. In January, shareholders, excluding corporate shareholders, receive an IRS 1099-DIV regarding the federal tax status of the dividends and distributions they received in the calendar year.
46
DIRECTOR AND OFFICER INFORMATION (UNAUDITED)
The business and affairs of the Company are managed under the direction of the Board. A director who is not an interested person of the Company, as defined in the 1940 Act, is an independent director (“Non-Interested Director”). The Directors of the Portfolios are listed below. The Statement of Additional Information includes additional information about Directors of the Company and is available, without charge, upon request at (800) 992-0180.
| | | | | | | | | | |
Name, Address and Age | | Position(s)
held with
the Company | | Term of Office
and Length of
Time Served(1) | | Principal Occupation(s)
during the Past Five Years | | Number of
Portfolios
in Fund
Complex
Overseen
by Director(2) | | Other Directorships
held by Director |
| | | | | |
Albert E. DePrince, Jr. 7337 E. Doubletree Ranch Rd. Scottsdale, Arizona 85258 Age: 67 | | Director | | June 1998 - Present | | Professor of Economics and Finance, Middle Tennessee State University (August 1991- Present). | | 39 | | Academy of Economics and Finance (February 2002 - Present). |
| | | | | |
Martin Gavin (*) 7337 E. Doubletree Ranch Rd. Scottsdale, Arizona 85258 Age: 58 | | Director | | January 2009- Present | | President, Connecticut Children’s Medical Center (May 2006 - Present). Formerly, Interim President, Connecticut Children’s Medical Center (January 2006 – May 2006). | | 39 | | None |
| | | | | |
Sidney Koch 7337 E. Doubletree Ranch Rd. Scottsdale, Arizona 85258 Age: 73 | | Director | | April 1994 - Present | | Retired. Self-Employed Consultant (June 2000 - Present). | | 39 | | None |
| | | | | |
Dr. Corine T. Norgaard 7337 E. Doubletree Ranch Rd. Scottsdale, Arizona 85258 Age: 71 | | Director | | June 1991 - Present | | Retired. Formerly, Dean of the Barney School of Business, University of Hartford (August 1996 - June 2004). Formerly, President, Thompson Enterprises (September 2004 - September 2005). | | 39 | | Mass Mutual Corporate and Participation Investors (April 1997 - Present); Mass Mutual Premier Series (December 2004 - Present); and Mass Mutual MML Series Investment Funds II (December 2005 - Present). |
| | | | | |
Joseph E. Obermeyer 7337 E. Doubletree Ranch Rd. Scottsdale, Arizona 85258 Age: 51 | | Director | | January 2003 - Present | | President, Obermeyer & Associates, Inc. (November 1999 - Present). | | 39 | | None |
| | | | | |
Russell Jones 7337 E. Doubletree Ranch Rd. Scottsdale, Arizona 85258 Age: 64 | | Director | | December 2007 - Present | | Retired. Formerly, Senior Vice President, Chief Investment Officer and Treasurer Kaman Corporation (1973 - March 2008) | | 39 | | None |
47
DIRECTOR AND OFFICER INFORMATION (UNAUDITED) (CONTINUED)
| | | | | | | | | | |
Name, Address and Age | | Position(s)
held with
the Companies | | Term of Office
and Length of
Time Served(1) | | Principal Occupation(s)
during the Past Five Years | | Number of
Portfolios
in Fund
Complex
Overseen
by Director(2) | | Other Directorships
held by Director |
Directors/Trustees who are “Interested Persons:” | | | | |
| | | | | |
Shaun Mathews(3)(4) 7337 E. Doubletree Ranch Rd. Scottsdale, Arizona 85258 Age: 53 | | Director | | December 2007 - Present | | President and Chief Executive Officer, ING Investments, LLC(5) (November 2006 - Present). Formerly, President, ING Mutual Funds and Investment Products (November 2004 - November 2006); Chief Marketing Officer, ING USFS (April 2002 - October 2004); and Head of Rollover/Payout (October 2001 - December 2003). | | 200 | | ING Services Holding Company, Inc. (May 2000 - Present); Southland Life Insurance Company (June 2002 - Present); and ING Capital Corporation, LLC, ING Funds Distributor, LLC(6), ING Funds Services, LLC(7), ING Investments, LLC(5) and ING Pilgrim Funding, Inc. (December 2006 - Present). |
| | | | | |
Fredric (Rick) A. Nelson III(8) ING Investment Management 230 Park Avenue New york, New york 10169 Age: 52 | | Director | | December 2007 - January 2009 | | Chief Investment Officer, ING (April 2003 - January 2009). | | | | None. |
(*) | | Mr. Martin Gavin was appointed to the Board effective January 1, 2009. |
(1) | | Directors/Trustees serve until their successors are duly elected and qualified. |
(2) | | For the purposes of this table (except for Mr. Mathews), “Fund Complex” means the following investment companies: ING Series Fund, Inc.; ING Strategic Allocation Portfolios, Inc.; ING Variable Funds; ING Variable Portfolios, Inc.; ING VP Balanced Portfolio, Inc.; ING VP Intermediate Bond Portfolio; and ING VP Money Market Portfolio. |
(3) | | For Mr. Mathews, the Fund Complex also includes the following investment companies: ING Asia Pacific High Dividend Equity Income Fund, ING Equity Trust; ING Funds Trust; ING Global Equity Dividend and Premium Opportunity Fund; ING Global Advantage and Premium Opportunity Fund; ING International High Dividend Equity Income Fund; ING Investors Trust; ING Mayflower Trust; ING Mutual Funds; ING Prime Rate Trust; ING Risk Managed Natural Resources Fund; ING Senior Income Fund; ING Separate Portfolios Trust; ING Variable Insurance Trust; ING Variable Products Trust; and ING Partners, Inc. |
(4) | | “Interested person,” as defined in the 1940 Act, by virtue of this Director’s/Trustee’s affiliation with any of the Funds, ING or any of ING’s affiliates. |
(5) | | ING Investments, LLC was previously named ING Pilgrim Investments, LLC. ING Pilgrim Investments, LLC is the successor in interest to ING Pilgrim Investments, Inc., which was previously known as Pilgrim Investments, Inc. and before that was known as Pilgrim America Investments, Inc. |
(6) | | ING Funds Distributor, LLC is the successor in interest to ING Funds Distributor, Inc., which was previously known as ING Pilgrim Securities, Inc., and before that was known as Pilgrim Securities, Inc., and before that was known as Pilgrim America Securities, Inc. |
(7) | | ING Funds Services, LLC was previously named ING Pilgrim Group, LLC. ING Pilgrim Group, LLC is the successor in interest to ING Pilgrim Group, Inc., which was previously known as Pilgrim Group, Inc. and before that was known as Pilgrim America Group, Inc. |
(8) | | Mr. Nelson resigned from the Board as of January 15, 2009. |
48
DIRECTOR AND OFFICER INFORMATION (UNAUDITED) (CONTINUED)
| | | | | | |
Name, Address and Age | | Position(s) Held
with the Companies | | Term of Office
and Length of
Time Served(1) | | Principal Occupation(s)
during the Past Five Years |
Officers: | | | | | | |
| | | |
Shaun P. Mathews 7337 East Doubletree Ranch Rd. Scottsdale, Arizona 85258 Age: 53 | | President and Chief Executive Officer | | December 2006 - Present | | President and Chief Executive Officer, ING Investments, LLC (November 2006 - Present). Formerly, President, ING Mutual Funds and Investment Products (November 2004 - November 2006); Chief Marketing Officer, ING USFS (April 2002 - October 2004); and Head of Rollover/Payout (October 2001 - December 2003). |
| | | |
Michael J. Roland 7337 East Doubletree Ranch Rd. Scottsdale, Arizona 85258 Age: 50 | | Executive Vice President | | April 2002 - Present | | Head of Mutual Fund Platform (February 2007 - Present) and Executive Vice President, ING Investments, LLC(2) and ING Funds Services, LLC(3) (December 2001 - Present). Formerly, Executive Vice President, Head of Product Management (January 2005 - January 2007); Chief Compliance Officer, ING Investments, LLC(2) and Directed Services LLC(6) (October 2004 - December 2005); and Chief Financial Officer and Treasurer, ING Investments, LLC(2) (December 2001 - March 2005). |
| | | |
Stanley D. Vyner 230 Park Avenue New York, New York 10169 Age: 58 | | Executive Vice President | | March 2002 - Present | | Executive Vice President, ING Investments, LLC(2) (July 2000 - Present) and Chief Investment Risk Officer, ING Investments, LLC(2) (January 2003 - Present). |
| | | |
Joseph M. O’Donnell 7337 East Doubletree Ranch Rd. Scottsdale, Arizona 85258 Age: 54 | | Executive Vice President and Chief Compliance Officer | | March 2006 - Present November 2004 - Present | | Chief Compliance Officer of the ING Funds (November 2004 - Present) and Executive Vice President of the ING Funds (March 2006 - Present). Formerly, Chief Compliance Officer of ING Investments, LLC(2) (March 2006 - July 2008); Investment Advisor Chief Compliance Officer, Directed Services LLC(6) (March 2006 - July 2008) ING Life Insurance and Annuity Company (March 2006 - December 2006); and Vice President, Chief Legal Counsel, Chief Compliance Officer and Secretary of Atlas Securities, Inc., Atlas Advisers, Inc. and Atlas Funds (October 2001 - October 2004). |
| | | |
Todd Modic 7337 East Doubletree Ranch Rd Scottsdale, Arizona 85258 Age: 41 | | Senior Vice President, Chief/Principle Financial Officer and Assistant Secretary | | March 2005 - Present | | Senior Vice President, ING Funds Services, LLC(3) (March 2005 - Present). Formerly, Vice President, ING Funds Services, LLC(3) (September 2002 - March 2005). |
| | | |
Kimberly A. Anderson 7337 East Doubletree Ranch Rd. Scottsdale, Arizona 85258 Age: 44 | | Senior Vice President | | December 2003 - Present | | Senior Vice President, ING Investments, LLC(2) (October 2003 - Present). |
| | | |
Robert Terris 7337 East Doubletree Ranch Rd. Scottsdale, Arizona 85258 Age: 38 | | Senior Vice President | | June 2006 - Present | | Senior Vice President, Head of Division Operations, ING Funds Services, LLC(3) (May 2006 - Present). Formerly, Vice President of Administration, ING Funds Services, LLC(3) (October 2001 - March 2006). |
| | | |
Ernest J. C’DeBaca 7337 East Doubletree Ranch Rd. Scottsdale, Arizona 85258 Age: 39 | | Senior Vice President | | June 2006 - Present | | Chief Compliance Officer, ING Investments, LLC(2) (July 2008 - Present); Investment Advisor Chief Compliance Officer, Directed Services LLC(6) (July 2008 - Present); Head of Retail Compliance, ING Funds Distributor, LLC(4) and ING Funds Services, LLC(3), (July 2008 - Present); and Senior Vice President, ING Investments, LLC(2) (December 2006 - Present), ING Funds Services, LLC(3) (April 2006 - Present), ING Funds Distributor, LLC(4) (July 2008 - Present), and Directed Services LLC(6) (July 2008 - Present). Formerly, Counsel, ING Americas, U.S. Legal Services (January 2004 - March 2006) and Attorney-Adviser, U.S. Securities and Exchange Commission (May 2001 - December 2003). |
| | | |
Robyn L. Ichilov 7337 East Doubletree Ranch Rd. Scottsdale, Arizona 85258 Age: 41 | | Vice President and Treasurer | | March 2002 - Present | | Vice President and Treasurer, ING Funds Services, LLC(3) (November 1995 - Present) and ING Investments, LLC(2) (August 1997 - Present). |
| | | |
Lauren D. Bensinger 7337 East Doubletree Ranch Rd. Scottsdale, Arizona 85258 Age: 54 | | Vice President | | March 2003 - Present | | Vice President and Chief Compliance Officer, ING Funds Distributor, LLC(4) (August 1995 - Present); Vice President, ING Investments, LLC(2) and ING Funds Services, LLC(3) (February 1996 - Present); and Director of Compliance, ING Investments, LLC(2) (October 2004 - Present). Formerly, Chief Compliance Officer, ING Investments, LLC(2) (October 2001 - October 2004). |
49
DIRECTOR AND OFFICER INFORMATION (UNAUDITED) (CONTINUED)
| | | | | | |
Name, Address and Age | | Position(s) Held
with the Companies | | Term of Office
and Length of
Time Served(1) | | Principal Occupation(s)
during the Past Five Years |
| | | |
William Evans 10 State House Square Hartford, Connecticut 06103 Age: 36 | | Vice President | | September 2007 - Present | | Vice President, Head of Mutual Fund Advisory Group (April 2007 - Present). Formerly, Vice President, U.S. Mutual Funds and Investment Products (May 2005 - April 2007) and Senior Fund Analyst, U.S. Mutual Funds and Investment Products (May 2002 - May 2005). |
| | | |
Maria M. Anderson 7337 East Doubletree Ranch Rd. Scottsdale, Arizona 85258 Age: 50 | | Vice President | | September 2004 - Present | | Vice President, ING Funds Services, LLC(3) (September 2004 - Present). Formerly, Assistant Vice President, ING Funds Services, LLC(3) (October 2001 - September 2004). |
| | | |
Denise Lewis 7337 East Doubletree Ranch Rd. Scottsdale, Arizona 85258 Age: 45 | | Vice President | | April 2007 - Present | | Vice President, ING Funds Services, LLC (December 2006 - Present). Formerly, Senior Vice President, UMB Investment Services Group, LLC (November 2003 - December 2006). |
| | | |
Kimberly K. Springer 7337 East Doubletree Ranch Rd. Scottsdale, Arizona 85258 Age: 51 | | Vice President | | March 2006 - Present | | Vice President, ING Funds Services, LLC(3) (March 2006 - Present). Formerly, Assistant Vice President, ING Funds Services, LLC(3) (August 2004 - March 2006) and Manager, Registration Statements, ING Funds Services, LLC(3) (May 2003 - August 2004). |
| | | |
Susan P. Kinens 7337 East Doubletree Ranch Rd. Scottsdale, Arizona 85258 Age: 32 | | Assistant Vice President | | March 2003 - Present | | Assistant Vice President, ING Funds Services, LLC(3) (December 2002 - Present). |
| | | |
Craig Wheeler 7337 East Doubletree Ranch Rd. Scottsdale, Arizona 85258 Age: 39 | | Assistant Vice President | | June 2008 - Present | | Assistant Vice President - Director of Tax, ING Funds Services (March 2008 - Present). Formerly, Tax Manager, ING Funds Services (March 2005 - March 2008); Tax Senior, ING Funds Services (January 2004 - March 2005); and Tax Senior, KPMG LLP (August 2002 - December 2003). |
| | | |
Theresa K. Kelety 7337 East Doubletree Ranch Rd. Scottsdale, Arizona 85258 Age: 45 | | Secretary | | September 2003 - Present | | Senior Counsel, ING Americas, U.S. Legal Services (April 2008 - Present). Formerly, Counsel, ING Americas, U.S. Legal Services (April 2003 - April 2008). |
| | | |
Huey P. Falgout, Jr. 7337 East Doubletree Ranch Rd. Scottsdale, Arizona 85258 Age: 45 | | Assistant Secretary | | September 2003 - Present | | Chief Counsel, ING Americas, U.S. Legal Services (September 2003 - Present). |
| | | |
Kathleen Nichols 7337 East Doubletree Ranch Rd. Scottsdale, Arizona 85258 Age: 33 | | Assistant Secretary | | June 2008 - Present | | Counsel, ING Americas, U.S. Legal Services (February 2008 - Present). Formerly, Associate, Ropes & Gray LLP (September 2005 - February 2008). |
(1) | | The officers hold office until the next annual meeting of the Directors/Trustees and until their successors shall have been elected and qualified. |
(2) | | ING Investments, LLC was previously named ING Pilgrim Investments, LLC. ING Pilgrim Investments, LLC is the successor in interest to ING Pilgrim Investments, Inc., which was previously known as Pilgrim Investments, Inc. and before that was known as Pilgrim America Investments, Inc. |
(3) | | ING Funds Services, LLC was previously named ING Pilgrim Group, LLC. ING Pilgrim Group, LLC is the successor in interest to ING Pilgrim Group, Inc., which was previously known as Pilgrim Group, Inc. and before that was known as Pilgrim America Group, Inc. |
(4) | | ING Funds Distributor, LLC is the successor in interest to ING Funds Distributor, Inc., which was previously known as ING Pilgrim Securities, Inc., and before that was known as Pilgrim Securities, Inc., and before that was known as Pilgrim America Securities, Inc. |
(5) | | Directed Services, LLC is the successor in interest to Directed Services, Inc. |
50
ADVISORY CONTRACT APPROVAL DISCUSSION (UNAUDITED)
BOARD CONSIDERATION AND APPROVAL OF INVESTMENT ADVISORY AND SUB-ADVISORY AGREEMENTS
The Investment Company Act of 1940, as amended (the “1940 Act”), provides, in substance, that each investment advisory agreement and sub-advisory agreement for a mutual fund will terminate automatically after the initial term of the agreement (which term may not exceed two years), unless continuation of the agreement is approved annually by the Board of Trustees or Directors, as the case may be (the “Board”) of the fund, including a majority of the Trustees/Directors who have no direct or indirect interest in the agreement and who are not “interested persons” of the fund (the “Independent Trustees”). Consistent with this requirement of the 1940 Act, the Board of ING VP Balanced Portfolio, Inc., ING Strategic Allocation Portfolios, Inc., ING VP Intermediate Bond Portfolio, ING VP Money Market Portfolio, ING Variable Funds, ING Variable Portfolios, Inc. and ING Series Fund, Inc., with respect to each portfolio series thereof (each, a “Fund” and, collectively, the “Funds”) has established a process for considering on an annual basis approval of the continuation of the Investment Management Agreement for each Fund (the “Advisory Agreement”) with ING Investments, LLC (the “Adviser”) and the sub-advisory agreement for each Fund (collectively, the “Sub-Advisory Agreements”) with each sub-adviser of the Funds (the “Sub-Advisers”). Set forth below is a description of the process followed by the Board in considering approval of the continuation of each Advisory and Sub-Advisory Agreement (collectively, the “Agreements”), together with an explanation of many of the factors considered and related conclusions reached by the Board in voting to approve the continuation of each Agreement for an additional one-year period commencing January 1, 2009, followed by specific considerations with respect to each portfolio series covered by this report (each, a “Portfolio”).
Overview of the Review Process
At a meeting of the Board held on December 11, 2008, the Board, including all of the Independent Trustees, voted to approve continuation of each of the existing Advisory and Sub-Advisory Agreements for the Funds. Prior to voting such approvals, the Board received the affirmative recommendation of the Contracts Committee of the Board, which is a Committee of the Board comprised of all of the Independent Trustees and exclusively of the Independent Trustees. The Contracts Committee recommended approval of the Advisory and Sub-Advisory Agreements after completing an
extensive review of information requested by the Committee from the Adviser and each Sub-Adviser, including the following: (1) comparative performance data for each Fund for various time periods; (2) comparative data regarding management fees, including data regarding the fees charged by the Adviser and Sub-Advisers for managing other mutual funds and institutional accounts using investment strategies and techniques similar to those used in managing the Funds; (3) comparative data regarding the total expenses of each Fund; (4) copies of each form of Advisory Agreement and Sub-Advisory Agreement; (5) copies of the codes of ethics of the Adviser and each Sub-Adviser, together with information relating to the manner in which each code is administered; (6) financial statements of the Adviser and each Sub-Adviser; (7) profitability analyses for the Adviser and each Sub-Adviser with respect to each Fund, and all Funds as a group; (8) descriptions of the qualifications of the investment personnel responsible for managing each Fund, the structure of their compensation and their responsibilities with respect to managing other accounts or mutual funds; (9) descriptions of the services provided to the Funds, including the investment strategies and techniques used by each Sub-Adviser in managing the Funds; (10) data relating to portfolio turnover and brokerage practices, including practices with respect to the acquisition of research through “soft dollar” benefits received in connection with the Funds’ brokerage; (11) data comparing the performance of certain Funds against “static portfolios” of the Funds over various time periods; (12) descriptions of the policies and procedures of the various service providers of the Funds for protecting the privacy of shareholder information; (13) information relating to projected sales and redemptions of Fund shares and business plans relating to the Adviser’s mutual fund platform; (14) descriptions of the business continuity and disaster recovery plans of the Adviser and each Sub-Adviser; (15) descriptions of various compliance programs of the Adviser and Sub-Advisers, including the Adviser’s programs for monitoring and enforcing compliance with the Funds’ policies with respect to market-timing, late trading and selective portfolio disclosure; (16) independent reports analyzing the quality of the trade execution services performed by Sub-Advisers for the Funds; and (17) other information relevant to an evaluation of the nature, extent and quality of the services provided by the Adviser and each Sub-Adviser in response to a series of detailed questions posed by independent legal counsel on behalf of the Independent Trustees.
51
ADVISORY CONTRACT APPROVAL DISCUSSION (UNAUDITED)
The Contracts Committee began the formal review process in July 2008 when it met separately with Goodwin Procter LLP, legal counsel for the Independent Trustees (“Independent Counsel”), to review the information to be requested from management and the methodology to be used in determining the selected peer groups for comparing performance and expenses. The Contracts Committee then held meetings on October 15-16, 2008 and December 9-10, 2008, during which the Independent Trustees, meeting separately with Independent Counsel, reviewed and evaluated the information described above. As part of the review process, the Contracts Committee also met with representatives from the Adviser and/or the Sub-Advisers to discuss the information provided to the Committee. The Contracts Committee also considered information that had been provided by the Adviser and Sub-Advisers throughout the year at other meetings of the Contracts Committee, the Audit Committee, the Compliance Committee and the full Board.
The Independent Trustees were assisted by Independent Counsel, throughout the contract review process. The Independent Trustees relied upon the advice of Independent Counsel and their own business judgment in determining the material factors to be considered in evaluating each Advisory and Sub-Advisory Agreement and the weight to be given to each such factor. The conclusions reached by the Independent Trustees were based on a comprehensive evaluation of all of the information provided and were not the result of any one factor. Moreover, each Independent Trustee may have afforded different weight to the various factors in reaching his or her conclusions with respect to each Advisory and Sub-Advisory Agreement.
Nature, Extent and Quality of Services
In considering whether to approve the Advisory and Sub-Advisory Agreements for the Funds for the year commencing January 1, 2009, the Board evaluated the nature, extent and quality of services provided to the Funds by the Adviser and Sub-Advisers. The Board considered the investment management and related services provided by the Adviser and Sub-Advisers, including the quantity and quality of the resources available to provide such services. Among other things, the Board considered the qualifications of the individuals responsible for performing various investment related services.
The Board also considered the quality of the compliance programs of the Adviser and each Sub-Adviser, including the manner in which the Adviser and each Sub-Adviser monitor for compliance with the investment policies and restrictions of a Fund and with the Codes of Ethics of the Funds, the Adviser and the Sub-Advisers with respect to personal trading by employees with access to portfolio information. The Board also considered the actions taken by the Adviser and Sub-Advisers to establish and maintain effective disaster recovery and business continuity plans.
The Board considered the actions taken by the Adviser and its affiliated companies to administer the Funds’ policies and procedures for voting proxies, valuing the Funds’ assets, selective disclosure of portfolio holdings and preventing late-trading and frequent trading of Fund shares. With respect to these and related compliance matters, the Board also considered the responsiveness of the Adviser and its affiliated companies over the course of the past several years to the inquiries of various regulatory authorities.
The Board also took into account the efforts of the Adviser and its affiliated companies to reduce the expenses of the Funds. With respect to those Funds that are sub-advised by an affiliate of the Adviser, the Board specifically noted that, in recent years, the Adviser and its affiliated companies have significantly reduced the Funds’ brokerage costs and portfolio turnover rates, as well as the quantity of research acquired through the use of soft dollars from the Funds’ brokerage. The Board also noted the efforts of the Adviser to optimize the number of Funds in the ING complex of mutual funds and to standardize the asset management characteristics and policies across the ING mutual fund platform. Consideration was also given to the benefits that shareholders of the Funds realize because the Funds are part of a larger ING family of mutual funds, including, in most cases, the ability of shareholders to exchange or transfer investments within the same class of shares among a wide variety of mutual funds without incurring additional sales charges.
The Board concluded that the nature, extent and quality of advisory and related services provided by the Adviser and each of the Sub-Advisers, taken as a whole, are consistent with the terms of the respective Advisory and Sub-Advisory Agreements and justify the fees paid by the Funds for such services.
Fund Performance
The Board reviewed each Fund’s investment performance over various time periods on an absolute
52
ADVISORY CONTRACT APPROVAL DISCUSSION (UNAUDITED)
basis and relative to the performance of (i) one or more appropriate benchmark indexes (such as the S&P 500 Composite Stock Price Index), (ii) a group of similarly managed mutual funds identified by Lipper, Inc. and/or Morningstar, Inc., and (iii) similarly managed mutual funds within a specified peer group based upon a methodology approved by the Contracts Committee (each, a “Selected Peer Group”). The Board reviewed comparative performance data for the one-, three-, five- and ten-year periods, where applicable, ending June 30, 2008 and the one-, three-, and five-year periods ending September 30, 2008. Summaries of selected portions of the performance information reviewed by the Board, together with the Board’s conclusions regarding the performance of each Portfolio covered by this report, are set forth below under “Fund-by-Fund Analysis.”
Management Fees, Sub-Advisory Fees and Expenses
Consideration was given to the contractual investment advisory fee rates, inclusive of administrative fee rates, payable by the Funds to the Adviser and its affiliated companies (referred to collectively as “management fees”) and the contractual sub-advisory fee rates payable by the Adviser to each Sub-Adviser for sub-advisory services. As part of its review, the Board considered each Fund’s management fee and total expense ratio, as compared to its Selected Peer Group, both before and after giving effect to any undertaking by the Adviser to waive fees and/or limit the total expenses of a Fund. In addition, the Trustees received information regarding the fees charged by each Sub-Adviser to similarly-managed institutional accounts and other mutual funds, if any, and the comparability (or lack thereof) of the services provided by the Sub-Adviser in managing such accounts and other mutual funds to the services provided in managing the Funds. With respect to the Funds sub-advised by an affiliate of the Adviser, the Board evaluated the reasonableness of the total fees received by the Adviser and its affiliate in the aggregate under the Advisory and Sub-Advisory Agreements. With respect to those Funds sub-advised by a Sub-Adviser that is not affiliated with the Adviser, the Board considered the reasonableness of the fees payable to the Sub-Adviser by the Adviser in light of the ability of the Adviser to negotiate such fees on an arm’s-length basis. Summaries of selected portions of the fee and expense information reviewed with respect to each Portfolio covered by this report are set forth below under “Fund-by-Fund Analysis.” After reviewing the
foregoing information, and in light of the nature, extent and quality of the services provided by the Adviser and each Sub-Adviser, the Board concluded with respect to each Fund that the management fee charged to the Fund for advisory, sub-advisory and related services is fair and reasonable and that the total expense ratio of the Fund is reasonable.
Profitability
The Board considered information relating to revenues, expenses, and profits realized by the Adviser and each Sub-Adviser attributable to performing advisory, sub-advisory and administrative services for the Funds. With respect to Funds sub-advised by an unaffiliated Sub-Adviser, the Board did not consider the profitability of the Sub-Adviser to be a material factor because the Board believes that the Adviser negotiates sub-advisory fees with the unaffiliated Sub-Adviser on an arm’s-length basis. The Board reviewed profitability data for the Adviser and its affiliated companies, including the distributor of the Funds, relating to (i) each Fund separately, (ii) all Funds as a group, (iii) all “retail” Funds as a group, and (iv) all variable insurance product Funds as a group, in each case for the one-year periods ended December 31, 2007 and December 31, 2006 and the nine-month period ended September 30, 2008. With respect to the Adviser and its affiliates, such information was prepared in accordance with a methodology approved by the Contracts Committee. The Board considered the profitability of the Adviser and its affiliated companies attributable to managing and operating each Fund both with and without the profitability of the distributor of the Funds and both before and after giving effect to any expenses incurred by the Adviser or any affiliated company in making revenue sharing or other payments to third parties, including affiliated insurance companies, for distribution and administrative services. With respect to Funds sub-advised by an affiliate of the Adviser, the Board considered the total profits derived by the Adviser and its affiliate in the aggregate attributable to managing and operating each Fund. The Board also considered other direct or indirect benefits that the Adviser and Sub-Advisers, and any affiliated companies thereof, derive from their relationships with the Funds, including the receipt by certain affiliates of the Adviser, of fees relating to the offering of bundled financial products, such as annuity contracts, and the receipt by Sub-Advisers of “soft dollar” benefits from the Funds’ brokerage. The Board concluded that, in light of the nature, extent and quality of the services provided, the profits realized by the Adviser and its affiliated
53
ADVISORY CONTRACT APPROVAL DISCUSSION (UNAUDITED)
companies, taken as a whole, with respect to providing advisory, sub-advisory and administrative services for each Fund are reasonable.
Economies of Scale
In considering the reasonableness of the management fee of each Fund, the Board considered the extent to which economies of scale can be expected to be realized by a Fund’s Adviser and its affiliated companies, on the one hand, and by the Fund, on the other hand, as the assets of the Fund increase. The Board noted that the advisory fee schedule for certain Funds includes breakpoints such that, as the assets of the Fund increase, the Fund’s management fee will decrease as a percentage of the Fund’s total assets. The Board recognized the inherent difficulties in measuring precisely the impact of any economies of scale being realized by the Adviser and its affiliated companies with respect to their management of any one or more Funds. In an effort to determine the extent to which economies of scale, if any, will be realized by the Adviser and its affiliated companies as the assets of the Funds grow, the Board considered the profitability data described above relating to the Adviser and its affiliated companies in light of changes in the assets of the Funds over various time periods. The Board noted that the total assets under management of many Funds have decreased during the past several years and concluded that the economies of scale realized by the Adviser and its affiliated companies from managing the Funds have not increased with respect to such Funds. The Board also reviewed information regarding the expense ratio of each Fund in light of changes in the assets of the Funds over various time periods, noting that, as the assets of a Fund increase, the fixed expenses of the Fund, as a percentage of the total assets of the Fund, can be expected to decrease. The Board considered such expense information in light of projections provided by the Adviser with respect to the future growth of assets of the Funds. Based upon the foregoing, the Board concluded that the economies of scale being realized by the Adviser and its affiliated companies do not mandate the implementation of breakpoints or additional breakpoints, as the case may be, with respect to any Fund at this time.
Fund-by-Fund Analysis
In deciding to approve the continuation of each Advisory and Sub-Advisory Agreement for an additional one-year period beginning January 1, 2009, the Board took into account the specific data and factors identified below relating to the performance,
fees and expenses of each Fund and actions being taken by the Adviser or Sub-Adviser, as the case may be, with respect to these matters. Except as otherwise indicated, the performance data described below for each Portfolio is for periods ended September 30, 2008 and the management fees and expense data described below are as of June 30, 2008.
ING VP Index Plus LargeCap Portfolio
In evaluating the investment performance of ING VP Index Plus LargeCap Portfolio, the Board noted that: (1) the Portfolio outperformed its Morningstar category median for the most recent calendar quarter but underperformed for the year-to-date, one-year, three-year and five-year periods; (2) the Portfolio outperformed its benchmark index for the most recent calendar quarter but underperformed for the year-to-date, one-year, three-year and five-year periods; and (3) the Portfolio is ranked in its Morningstar category in the second quintile for the most recent calendar quarter, in the third quintile for the one-year and five-year periods and in the fourth quintile for the year-to-date and three-year periods. The Board noted that in 2008 the Sub-adviser implemented a quantitative based model for selecting stocks based on dynamic factor weightings. The Board concluded that appropriate actions are being taken to improve performance and that additional time is needed to evaluate the effectiveness of these actions.
In assessing the reasonableness of the management fee and expense ratio for ING VP Index Plus LargeCap Portfolio, the Board noted that the management fee for the Portfolio is below the median and average management fees of the funds in its Selected Peer Group and that the expense ratio for the Portfolio is below the median and average expense ratios of the funds in its Selected Peer Group.
ING VP Index Plus MidCap Portfolio
In evaluating the investment performance of ING VP Index Plus MidCap Portfolio, the Board noted that: (1) the Portfolio outperformed its Morningstar category median for the year-to-date, one-year and five-year periods but underperformed for the most recent calendar quarter and three-year periods; (2) the Portfolio underperformed its benchmark index for all periods presented; and (3) the Portfolio is ranked in its Morningstar category in the third quintile for the most recent calendar quarter, year-to-date, three-year and five-year periods and in the second quintile for the one-year period. The Board noted that in 2008 the
54
ADVISORY CONTRACT APPROVAL DISCUSSION (UNAUDITED)
Sub-adviser implemented a quantitative based model for selecting stocks based on dynamic factor weightings. The Board concluded that appropriate actions are being taken to improve performance and that additional time is needed to evaluate the effectiveness of these actions.
In assessing the reasonableness of the management fee and expense ratio for ING VP Index Plus MidCap Portfolio, the Board noted that the management fee for the Portfolio is below the median and average management fees of the funds in its Selected Peer Group and that the expense ratio for the Portfolio is below the median and average expense ratios of the funds in its Selected Peer Group.
ING VP Index Plus SmallCap Portfolio
In evaluating the investment performance of ING VP Index Plus SmallCap Portfolio, the Board noted that: (1) the Portfolio outperformed its Morningstar category median for the most recent calendar quarter, year-to-date and one-year periods, but
underperformed for the three-year and five-year periods; (2) the Portfolio underperformed its benchmark index for all periods presented; and (3) the Portfolio is ranked in its Morningstar category in the second quintile for the most recent calendar quarter and year-to-date periods, in the third quintile for the one-year and five-year periods and in the fourth quintile for the three-year period. The Board noted that in 2008 the Sub-adviser implemented a quantitative based model for selecting stocks based on dynamic factor weightings. The Board concluded that appropriate actions are being taken to improve performance and that additional time is needed to evaluate the effectiveness of these actions.
In assessing the reasonableness of the management fee and expense ratio for ING VP Index Plus SmallCap Portfolio, the Board noted that the management fee for the Portfolio is below the median and average management fees of the funds in its Selected Peer Group, and that the expense ratio for the Portfolio is below the median and average expense ratios of the funds in its Selected Peer Group.
55
Investment Adviser
ING Investments, LLC
7337 East Doubletree Ranch Road
Scottsdale, Arizona 85258
Administrator
ING Funds Services, LLC
7337 East Doubletree Ranch Road
Scottsdale, Arizona 85258
Distributor
ING Funds Distributor, LLC
7337 East Doubletree Ranch Road
Scottsdale, Arizona 85258
Transfer Agent
DST Systems, Inc.
P.O. Box 419368
Kansas City, Missouri 64141
Independent Registered Public Accounting Firm
KPMG LLP
99 High Street
Boston, Massachusetts 02110
Custodian
The Bank of New York Mellon
One Wall Street
New York, New York 10286
Legal Counsel
Goodwin Procter LLP
Exchange Place
53 State Street
Boston, Massachusetts 02109
Before investing, carefully consider the investment objectives, risks, charges and expenses of the variable universal life insurance policy or variable annuity contract and the underlying variable investment options. This and other information is contained in the prospectus for the variable universal life policy or variable annuity contract and the underlying variable investment options. Obtain these prospectuses from your agent/registered representative and read them carefully before investing.
| | | | |
 | | VAR-AIP | | (1208-022309) |

Annual Report
December 31, 2008
Classes ADV, I and S
ING Variable Products Index Funds
Domestic Equity Index Portfolios
n | ING Russell™ Large Cap Index Portfolio |
n | ING Russell™ Mid Cap Index Portfolio |
n | ING Russell™ Small Cap Index Portfolio |
Fixed-Income Index Portfolio
n | ING Lehman Brothers U.S. Aggregate Bond Index® Portfolio |
International/Global Equity index Portfolios
| n | ING International Index Portfolio |
n | ING Russell™ Global Large Cap Index 85% Portfolio |
n | ING WisdomTreeSM Global High-Yielding Equity Index Portfolio |
| | |
 | | E-Delivery Sign-up – details inside |
This report is submitted for general information to shareholders of the ING Funds. It is not authorized for distribution to prospective shareholders unless accompanied or preceded by a prospectus which includes details regarding the funds’ investment objectives, risks, charges, expenses and other information. This information should be read carefully.
MUTUAL FUNDS 
| |
TABLE OF CONTENTS
| | | | |
| | | |
| | Go Paperless with E-Delivery! | | |
Sign up now for on-line prospectuses, fund reports, and proxy statements. In less than five minutes, you can help reduce paper mail and lower fund costs. Just go to www.ingfunds.com, click on the E-Delivery icon from the home page, follow the directions and complete the quick 5 Steps to Enroll. You will be notified by e-mail when these communications become available on the internet. Documents that are not available on the internet will continue to be sent by mail. |
PROXY VOTING INFORMATION
A description of the policies and procedures that the Portfolios use to determine how to vote proxies related to portfolio securities is available: (1) without charge, upon request by calling Shareholder Services toll-free at (800) 992-0180; (2) on the ING Funds’ website at www.ingfunds.com; and (3) on the U.S. Securities and Exchange Commission’s (“SEC”) website at www.sec.gov. Information regarding how the Portfolios voted proxies related to portfolio securities during the most recent 12-month period ended June 30 is available without charge on the ING Funds’ website at www.ingfunds.com and on the SEC’s website at www.sec.gov.
QUARTERLY PORTFOLIO HOLDINGS
The Portfolios file their complete schedule of portfolio holdings with the SEC for the first and third quarters of each fiscal year on Form N-Q. The Portfolios’ Forms N-Q are available on the SEC’s website at www.sec.gov. The Portfolios’ Forms N-Q may be reviewed and copied at the SEC’s Public Reference Room in Washington, DC, and information on the operation of the Public Reference Room may be obtained by calling (800) SEC-0330; and is available upon request from the Portfolios by calling Shareholder Services toll-free at (800) 992-0180.
PRESIDENT’S LETTER

Dear Shareholders,
We are in the midst of one of the most challenging periods ever faced by investors, and we at ING Funds are aware of the anxiety that you may be feeling at this time.
I want to assure you that we are actively engaged in monitoring the situation and are committed to keeping you fully informed of how the rapidly unfolding events around us may impact your investments with our company.
We recognize that the confidence of many investors is being tested, perhaps as never before. It is understandable that some of you may be second guessing your investment strategy due to these recent events. We encourage you to work with your investment professional and seek out their advice about your portfolio in light of the current conditions. But we also urge investors not to make rash decisions. ING Funds still believes that a well-diversified, globally allocated portfolio remains the most effective investment strategy of all. We ask that investors not lose sight of
their commitment to the long-term.
We thank you for your support and confidence and we look forward to continuing to do business with you in the future.
Sincerely,

Shaun Mathews
President & Chief Executive Officer
ING Funds
January 23, 2009
The views expressed in the President’s Letter reflect those of the President as of the date of the letter. Any such views are subject to change at any time based upon market or other conditions and ING Funds disclaims any responsibility to update such views. These views may not be relied on as investment advice and because investment decisions for an ING Fund are based on numerous factors, may not be relied on as an indication of investment intent on behalf of any ING Fund. Reference to specific company securities should not be construed as recommendations or investment advice. Consider the fund’s investment objectives, risks, and charges and expenses carefully before investing. The prospectus contains this information and other information about the fund.
International investing poses special risks including currency fluctuation, economic and political risks not found in investments that are solely domestic.
1
MARKET PERSPECTIVE: YEAR ENDED DECEMBER 31, 2008
In our semi-annual report, we described a failed second quarter rally that fizzled when investors realized that borderline recessionary conditions and a credit crunch had not gone away. By year-end, governments were committing previously unimaginable sums of taxpayer money to prevent systemic collapse. Global equities in the form of the MSCI World® Index(1) measured in local currencies, including net reinvested dividends (“MSCI” for regions discussed below) plunged 29.70% in the six months ended December 31, 2008 (down 38.70% for the entire fiscal year). (The MSCI World® Index plunged 40.71% for the entire fiscal year, measured in U.S. dollars.) In currencies, the dollar at first drifted near record lows against the euro. But the tide turned in mid-July and for the six months ended December 31, 2008, the dollar strengthened by 12.10% (4.50% for the entire fiscal year). The dollar also soared 37.80% against the pound for the six months ended December 31, 2008 (37.90% for the entire fiscal year). But the yen advanced as carry trades (essentially short yen positions) were unwound and the dollar fell 14.90% for the six months ended December 31, 2008 (down 19.60% for the entire fiscal year).
Even more dramatic was the price of oil which marched to an all-time high of around $147 per barrel in mid-July, only to lose more than two thirds of that price by December 31, 2008.
The economic statistics remained bleak. By the end of October, the Standard & Poor’s (“S&P”)/Case-Shiller National U.S. Home Price Index(2) of house prices had fallen a record 18% over the year. New home sales were at 1991 levels. Some 45% of existing home sales were distressed.
Payrolls declined in every month of 2008, as the number of people claiming unemployment reached 4.1 million, a 26-year high. Gross domestic product (“GDP”) fell at an annualized rate of 0.50% in the third quarter, and the National Bureau of Economic Research announced that the recession had actually started in December 2007.
Yet these were side-shows to the fireworks display in the financial sector, where major institutions—hanging by a thread through problems rooted in unwise mortgage borrowing, lending and investment—met different fates in September 2008 at the hands of the U.S. government.
The Federal National Mortgage Association (“Fannie Mae”) and the Federal Home Loan Mortgage
Corporation (“Freddie Mac”) were taken into “conservatorship.” Merrill Lynch was acquired by the Bank of America with a wink from the authorities. AIG received an $85 billion loan from a reluctant government, which also took a 79.90% equity stake in AIG. But Lehman Brothers having sought capital, then a buyer, found neither and was left to file for Chapter 11 bankruptcy protection.
The U.S. government was now in the position of choosing winners and losers among financial institutions: none too successfully, for it quickly became obvious that by pointedly leaving Lehman Brothers to go under, a credit crisis had become a credit market collapse. Lending all but seized up.
Policy response was huge but at least initially muddled. A Troubled Asset Relief Plan (“TARP”) would set up a $700 billion fund to buy illiquid mortgage securities from financial institutions. But on November 12, 2008 with half of the money already used to recapitalize banks, Treasury Secretary Paulson announced that the rest of the funds would not be used to buy illiquid mortgage securities after all. This merely renewed the pressure on the holders of such securities like Citigroup, which within two weeks received guarantees from the government against losses and another $20 billion in capital.
Other programs were of more practical use, like support for the commercial paper market and a guarantee facility for money market funds. Arguably the most effective measure was the announced intention to buy vast quantities of agency mortgage-backed securities and debentures. This had the effect of driving down rates on the 30-year mortgage towards 5.00%, a record low. In the meantime, the newly-elected president promised a stimulus package worth approximately $1 trillion. And by year end, the Federal Open Market Committee (“FOMC”) reduced interest rates to a range of between 0% and 0.25%.
2008 ended with much gloom and bad news still to come, but the platform for recovery was perhaps taking shape.
In U.S. fixed-income markets, yields on the 90-day Treasury Bills briefly turned negative in December 2008, while the yield on the ten-year Treasury Note fell below 2.50%, something we had not seen in 50 years. The Barclays Capital U.S. Aggregate Bond Index(3), formerly known as the Lehman Brothers U.S. Aggregate Bond Index, of investment grade bonds returned 4.10% for the six months ended December 31, 2008, (5.20% for the entire fiscal year).
2
MARKET PERSPECTIVE: YEAR ENDED DECEMBER 31, 2008
By contrast, high yield bonds, represented by the Barclays Capital High Yield Bond—2% Issuer Constrained Composite Index(4), formerly known as the Lehman Brothers High Yield Bond—2% Issuer Constrained Composite Index, behaved more like a stock index and returned (25.10)% for the six months ended December 31, 2008 (down 25.90% for the entire fiscal year).
U.S. equities, represented by the S&P 500® Composite Stock Price (“S&P 500®”) Index(5), including dividends, returned (28.50)% for the six months ended December 31, 2008, (down 37.00% for the entire fiscal year), increasingly unimpressed by sharply falling oil prices. Profits for S&P 500® Index companies suffered their fifth straight quarter of decline, led again by the financials sector, although taxpayer money was also potentially committed to save the big three auto makers from bankruptcy. On November 20, 2008, the S&P 500® Index plumbed a level not seen since April 1997, before a December recovery.
In international markets, plainly entering recession, the MSCI Japan® Index(6) slumped 35.90% for the six months ended December 31, 2008, (down 42.60% for the entire fiscal year). The strengthening yen hit exports in an export-dependent economy even as global demand slowed for other reasons. The MSCI Europe ex UK® Index(7) sagged 29.40% for the six months ended December 31, 2008 (down 43.20% for the entire fiscal year), beset by sharply falling economic activity and a European Central Bank in denial that inflation was falling fast. Finally, rates were reduced by an unprecedented 175 basis points (or 1.75%) in two months near the end of the year while governments, one after the other, proposed large stimulus packages. In the UK, the MSCI UK® Index(8) fell 19.40% for the six months ended December 31, 2008 (down 28.50% for the entire fiscal year). The UK had allowed a bigger housing bubble than the United States and deeper personal indebtedness in an economy more dependent on the financial sector. Rates were reduced to 1951 levels as venerable banks ceased to exist as independent entities.
(1) | | The MSCI World® Index is an unmanaged index that measures the performance of over 1,400 securities listed on exchanges in the U.S., Europe, Canada, Australia, New Zealand and the Far East. |
| (2) | | The S&P/Case-Shiller National U.S. Home Price Index tracks the value of single-family housing within the United States. The index is a composite of single-family home price indices for the nine U.S. Census divisions and is calculated quarterly. |
| (3) | | The Barclays Capital U.S. Aggregate Bond Index is an unmanaged index of publicly issued investment grade U.S. Government, mortgage-backed, asset-backed and corporate debt securities. |
| (4) | | The Barclays Capital High Yield Bond—2% Issuer Constrained Composite Index is an unmanaged index that measures the performance of non-investment grade fixed-income securities. |
(5) | | The S&P 500® Index is an unmanaged index that measures the performance of securities of approximately 500 of the largest companies in the United States. |
(6) | | The MSCI Japan® Index is a free float-adjusted market capitalization index that is designed to measure developed market equity performance in Japan. |
(7) | | The MSCI Europe ex UK® Index is a free float-adjusted market capitalization index that is designed to measure developed market equity performance in Europe, excluding the UK. |
(8) | | The MSCI UK® Index is a free float-adjusted market capitalization index that is designed to measure developed market equity performance in the UK. |
All indices are unmanaged and investors cannot invest directly in an index.
Past performance does not guarantee future results. The performance quoted represents past performance. Investment return and principal value of an investment will fluctuate, and shares, when redeemed, may be worth more or less than their original cost. The Portfolios’ performance is subject to change since the period’s end and may be lower or higher than the performance data shown. Please call (800) 992-0180 or log on to www.ingfunds.com to obtain performance data current to the most recent month end.
Market Perspective reflects the views of ING’s Chief Investment Risk Officer only through the end of the period, and is subject to change based on market and other conditions.
3
| | |
| ING RUSSELL™ LARGE CAP INDEX PORTFOLIO | | PORTFOLIO MANAGERS’ REPORT |
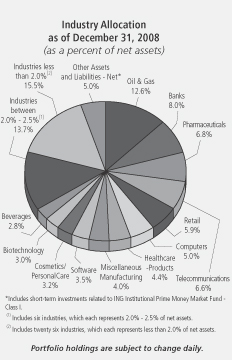
ING Russell™ Large Cap Index Portfolio (the “Portfolio”) seeks investment results (before fees and expenses) that correspond to the total return of the Russell Top 200® Index(1). The Portfolio is managed by Omar Aguilar, Ph.D. and Vincent Costa, Portfolio Managers* of ING Investment Management Co. (“ING IM”) — the Sub-Adviser.
Performance: Since its inception on March 10, 2008 through December 31, 2008, the Portfolio’s Class S shares provided a total return of (27.23)% compared to the Russell Top 200® Index, which returned (29.78)% for the period of March 1, 2008 through December 31, 2008.
Portfolio Specifics: The Portfolio employs a “passive management” approach designed to track the performance of the Russell Top 200® Index. The Portfolio attempts to track the Russell Top 200® Index by investing all, or substantially all, of its assets in stocks that make up the Russell Top 200® Index. The Portfolio may not always hold all of the same securities as the Russell Top 200® Index.
Most sectors had negative returns during the period with financials, information technology, energy and industrials leading the way down.
Current Outlook & Strategy: Our view is that the decline in economic activity is global. The plunge in Germany’s Ifo Business Climate Index of business confidence and Japan’s Shoko Chukin Bank Index of small business confidence, along with sharp declines in industrial production, point to a sharp contraction in economic activity in Europe and Japan that could last several quarters.
The challenge to policymakers around the world is to break the cycle by which tighter credit conditions result in an economic contraction, which leads in turn to further losses and tightening in the financial system. In our view, massive fiscal stimulus packages and central bank easing eventually will break that loop, but that has not occurred yet.
While it appears that this recession may be the most severe since that of 1981-82, many of the extreme market movements in October and November reflect de-leveraging by hedge funds and other investors, in our view, rather than an exceptionally pessimistic assessment of the outlook for the global economy.
It is worth remembering that the stock market often retests its lows again before a bear market rally turns into a bull market.
Top Ten Holdings*
as of December 31, 2008
(as a percent of net assets)
| | |
ExxonMobil Corp | | 6.1% |
Procter & Gamble Co. | | 2.7% |
General Electric Co. | | 2.5% |
AT&T, Inc. | | 2.5% |
Johnson & Johnson | | 2.5% |
Microsoft Corp. | | 2.3% |
Chevron Corp | | 2.2% |
Wal-Mart Stores, Inc. | | 1.8% |
Pfizer, Inc. | | 1.7% |
JPMorgan Chase & Co. | | 1.7% |
| | * | Excludes short-term investments related to ING Institutional Prime Money Market Fund - Class I |
Portfolio holdings are subject to change daily.
| * | | Effective January 13, 2009, Mr. Aguilar is no longer a portfolio manager to the Portfolio. |
Portfolio holdings and characteristics are subject to change and may not be representative of current holdings and characteristics. The outlook for this Portfolio may differ from that presented for other ING Funds. Performance for the different classes of shares will vary based on differences in fees associated with each class.
4
| | |
| PORTFOLIO MANAGERS’ REPORT | | ING RUSSELL™ LARGE CAP INDEX PORTFOLIO |
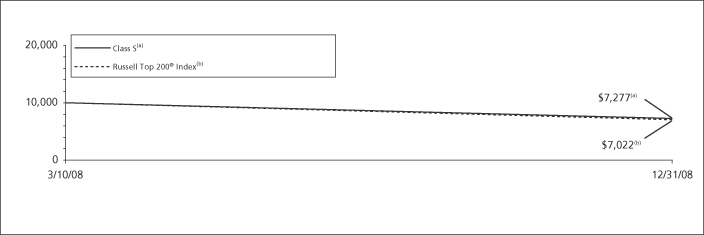
| | | | | | | |
| | | |
| | | Cumulative Total Returns for the Period Ended December 31, 2008 | | | |
| | | | | Since Inception of Classes ADV, I and S March 10, 2008 | | | |
| | | Class ADV | | (27.42 | )% | | |
| | | Class I | | (27.06 | )% | | |
| | | Class S | | (27.23 | )% | | |
| | | Russell Top 200® Index(1) | | (29.78 | )%(2) | | |
Based on a $10,000 initial investment, the graph and table above illustrate the total return of ING Russell™ Large Cap Index Portfolio against the index indicated. An index has no cash in its portfolio, imposes no sales charges and incurs no operating expenses. An investor cannot invest directly in an Index. The Portfolio’s performance is shown without the imposition of any expenses or charges which are, or may be, imposed under your annuity contract. Total returns would have been lower if such expenses or charges were included.
The performance graph and table do not reflect the deduction of taxes that a shareholder will pay on portfolio distributions or the redemption of portfolio shares.
The performance shown may include the effect of fee waivers and/or expense reimbursements by the Investment Adviser and/or other service providers, which have the effect of increasing total return. Had all fees and expenses been considered, the total returns would have been lower.
The performance update illustrates performance for a variable investment option available through a variable annuity contract. The performance shown indicates past performance and is not a projection or prediction of future results. Actual investment returns and principal value will fluctuate so that shares and/or units, at redemption, may be worth more or less than their original cost. Please call (800) 992-0180 to get performance through the most recent month end.
It is important to note that the Portfolio has a limited operating history. Performance over a longer period of time may be more meaningful than short-term performance.
This report contains statements that may be “forward-looking” statements. Actual results may differ materially from those projected in the “forward-looking” statements.
The views expressed in this report reflect those of the portfolio managers, only through the end of the period as stated on the cover. The portfolio managers’ views are subject to change at any time based on market and other conditions.
Portfolio holdings are subject to change daily.
(1) | | The Russell Top 200® Index measures the performance of the largest cap segment of the U.S. equity universe. The Russell Top 200® Index is a subset of the Russell Top 300® Index. It includes approximately 200 of the largest securities based on a combination of their market cap and current index membership and represents approximately 68% of the U.S. market. |
(2) | | Since inception performance for the index is shown from March 1, 2008. |
5
| | |
| ING RUSSELL™ MID CAP INDEX PORTFOLIO | | PORTFOLIO MANAGERS’ REPORT |
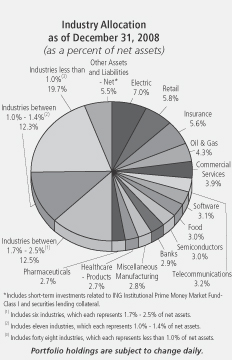
Russell™ Mid Cap Index Index Portfolio (the “Portfolio”) seeks investment results (before fees and expenses) that correspond to the total return of the Russell Midcap® Index(1). The Portfolio is managed by Omar Aguilar, Ph.D. and Vincent Costa, Portfolio Managers* of ING Investment Management Co. (“ING IM”) — the Sub-Adviser.
Performance: Since its inception on March 10, 2008 through December 31, 2008, the Portfolio’s Class S shares provided a total return of (32.90)% compared to the Russell Midcap® Index, which returned (35.91)% for the period of March 1, 2008 through December 31, 2008.
Portfolio Specifics: The Portfolio employs a “passive management” approach designed to track the performance of the Russell Midcap® Index. The Portfolio attempts to track the Russell Midcap® Index by investing all, or substantially all, of its assets in stocks that make up the Russell Midcap® Index. The Portfolio may not always hold all of the same securities as the Russell Midcap® Index.
All sectors posted negative returns for the period. Financials, consumer discretionary, energy and information technology were the worst performers.
Current Outlook & Strategy: Our view is that the decline in economic activity is global. The plunge in Germany’s Ifo Business Climate Index of business confidence and Japan’s Shoko Chukin Bank Index of small business confidence, along with sharp declines in industrial production, point to a sharp contraction in economic activity in Europe and Japan that could last several quarters.
The challenge to policymakers around the world is to break the cycle by which tighter credit conditions result in an economic contraction, which leads in turn to further losses and tightening in the financial system. In our view, massive fiscal stimulus packages and central bank easing eventually will break that loop, but that has not occurred yet.
While it appears that this recession may be the most severe since that of 1981-82, many of the extreme market movements in October and November reflect de-leveraging by hedge funds and other investors, in our view, rather than an exceptionally pessimistic assessment of the outlook for the global economy.
It is worth remembering that the stock market often retests its lows again before a bear market rally turns into a bull market.
* Effective January 13, 2009, Mr. Aguilar is no longer a portfolio manager to the Portfolio.
Portfolio holdings and characteristics are subject to change and may not be representative of current holdings and characteristics. The outlook for this Portfolio may differ from that presented for other ING Funds. Performance for the different classes of shares will vary based on differences in fees associated with each class.
Top Ten Holdings*
as of December 31, 2008
(as a percent of net assets)
| | |
Yum! Brands, Inc. | | 0.6% |
Pacific Gas & Electric Co. | | 0.6% |
American Electric Power Co., Inc. | | 0.5% |
AON Corp. | | 0.5% |
Marsh & McLennan Cos., Inc. | | 0.5% |
Allergan, Inc. | | 0.5% |
HJ Heinz Co. | | 0.5% |
American Tower Corp. | | 0.5% |
Express Scripts, Inc. | | 0.5% |
Northern Trust Corp. | | 0.5% |
| | * | Excludes short-term investments related to ING Institutional Prime Money Market Fund - Class I and securities lending collateral. |
Portfolio holdings are subject to change daily.
6
| | |
| PORTFOLIO MANAGERS’ REPORT | | ING RUSSELL™ MID CAP INDEX PORTFOLIO |
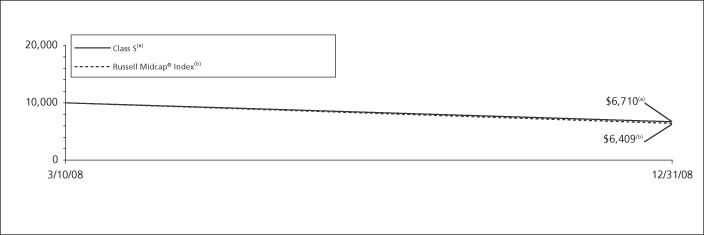
| | | | | | | |
| | | |
| | | Cumulative Total Returns for the Period Ended December 31, 2008 | | | |
| | | | | Since Inception of Classes ADV, I and S March 10, 2008 | | | |
| | | Class ADV | | (32.92 | )% | | |
| | | Class I | | (32.74 | )% | | |
| | | Class S | | (32.90 | )% | | |
| | | Russell Midcap® Index(1) | | (35.91 | )%(2) | | |
Based on a $10,000 initial investment, the graph and table above illustrate the total return of ING Russell™ MidCap Index Portfolio against the index indicated. An index has no cash in its portfolio, imposes no sales charges and incurs no operating expenses. An investor cannot invest directly in an Index. The Portfolio’s performance is shown without the imposition of any expenses or charges which are, or may be, imposed under your annuity contract. Total returns would have been lower if such expenses or charges were included.
The performance graph and table do not reflect the deduction of taxes that a shareholder will pay on portfolio distributions or the redemption of portfolio shares.
The performance shown may include the effect of fee waivers and/or expense reimbursements by the Investment Adviser and/or other service providers, which have the effect of increasing total return. Had all fees and expenses been considered, the total returns would have been lower.
The performance update illustrates performance for a variable investment option available through a variable annuity contract. The performance shown indicates past performance and is not a projection or prediction of future results. Actual investment returns and principal value will fluctuate so that shares and/or units, at redemption, may be worth more or less than their original cost. Please call (800) 992-0180 to get performance through the most recent month end.
It is important to note that the Portfolio has a limited operating history. Performance over a longer period of time may be more meaningful than short-term performance.
This report contains statements that may be “forward-looking” statements. Actual results may differ materially from those projected in the “forward-looking” statements.
The views expressed in this report reflect those of the portfolio managers, only through the end of the period as stated on the cover. The portfolio managers’ views are subject to change at any time based on market and other conditions.
Portfolio holdings are subject to change daily.
(1) | | The Russell Midcap® Index is an unmanaged index that measures the performance of the 800 smallest companies in the Russell 1000® Index, which represents approximately 26% of the total market capitalization of the Russell 1000® Index. |
(2) | | Since inception performance for the index is shown from March 1, 2008. |
7
| | |
| ING RUSSELL™ SMALL CAP INDEX PORTFOLIO | | PORTFOLIO MANAGERS’ REPORT |
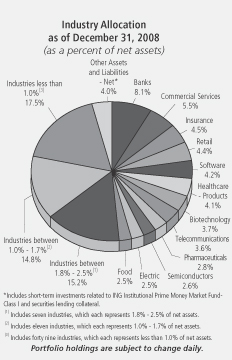
ING RussellTM Small Cap Index Portfolio (the “Portfolio”) seeks investment results (before fees and expenses) that correspond to the total return of the Russell 2000® Index(1). The Portfolio is managed by Omar Aguilar, Ph.D. and Vincent Costa, Portfolio Managers* of ING Investment Management Co. (“ING IM”) — the Sub-Adviser.
Performance: Since its inception on March 10, 2008 through December 31, 2008, the Portfolio’s Class I shares provided a total return of (21.95)% compared to the Russell 2000® Index, which returned (26.21)% for the period of March 1, 2008 through December 31, 2008.
Portfolio Specifics: The Portfolio employs a “passive management” approach designed to track the performance of the Russell 2000® Index. The Portfolio attempts to track the Russell 2000® Index by investing all, or substantially all, of its assets in stocks that make up the Russell 2000® Index. The Portfolio may not always hold all of the same securities as the Russell 2000® Index.
Most sectors posted negative returns for the period with the information technology, consumer discretionary, energy and industrials being the worst performers.
Current Outlook & Strategy: Our view is that the decline in economic activity is global. The plunge in Germany’s Ifo Business Climate Index of business confidence and Japan’s Shoko Chukin Bank Index of small business confidence, along with sharp declines in industrial production, point to a sharp contraction in economic activity in Europe and Japan that could last several quarters.
The challenge to policymakers around the world is to break the cycle by which tighter credit conditions result in an economic contraction, which leads in turn to further losses and tightening in the financial system. In our view, massive fiscal stimulus packages and central bank easing eventually will break that loop, but that has not occurred yet.
While it appears that this recession may be the most severe since that of 1981-82, many of the extreme market movements in October and November reflect de-leveraging by hedge funds and other investors, in our view, rather than an exceptionally pessimistic assessment of the outlook for the global economy.
It is worth remembering that the stock market often retests its lows again before a bear market rally turns into a bull market.
| * | | Effective January 13, 2009, Mr. Aguilar is no longer a portfolio manager to the Portfolio. |
Portfolio holdings and characteristics are subject to change and may not be representative of current holdings and characteristics. The outlook for this Portfolio may differ from that presented for other ING Funds. Performance for the different classes of shares will vary based on differences in fees associated with each class.
Top Ten Holdings*
as of December 31, 2008
(as a percent of net assets)
| | |
Ralcorp Holdings, Inc. | | 0.4% |
Myriad Genetics, Inc. | | 0.4% |
Alexion Pharmaceuticals, Inc. | | 0.4% |
Waste Connections, Inc. | | 0.3% |
Realty Income Corp. | | 0.3% |
Piedmont Natural Gas Co. | | 0.3% |
OSI Pharmaceuticals, Inc. | | 0.3% |
Comstock Resources, Inc. | | 0.3% |
ITC Holdings Corp. | | 0.3% |
Westar Energy, Inc. | | 0.3% |
| | * | Excludes short-term investments related to ING Institutional Prime Money Market Fund - Class I and securities lending collateral. |
Portfolio holdings are subject to change daily.
8
| | |
| PORTFOLIO MANAGERS’ REPORT | | ING RUSSELL™ SMALL CAP INDEX PORTFOLIO |
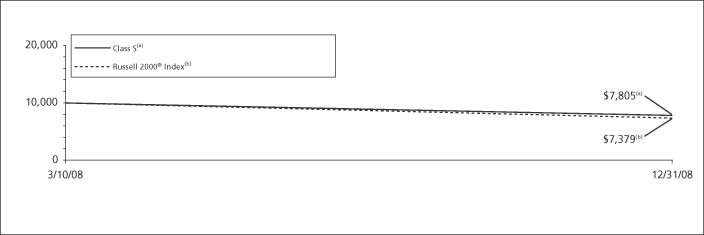
| | | | | | | |
| | | |
| | | Cumulative Total Returns for the Period Ended December 31, 2008 | | | |
| | | | | Since Inception of Classes ADV, I and S March 10, 2008 | | | |
| | | Class ADV | | (22.02 | )% | | |
| | | Class I | | (21.68 | )% | | |
| | | Class S | | (21.95 | )% | | |
| | | Russell 2000® Index(1) | | (26.21 | )%(2) | | |
Based on a $10,000 initial investment, the graph and table above illustrate the total return of ING Russell™ Small Cap Index Portfolio against the index indicated. An index has no cash in its portfolio, imposes no sales charges and incurs no operating expenses. An investor cannot invest directly in an Index. The Portfolio’s performance is shown without the imposition of any expenses or charges which are, or may be, imposed under your annuity contract. Total returns would have been lower if such expenses or charges were included.
The performance graph and table do not reflect the deduction of taxes that a shareholder will pay on portfolio distributions or the redemption of portfolio shares.
The performance shown may include the effect of fee waivers and/or expense reimbursements by the Investment Adviser and/or other service providers, which have the effect of increasing total return. Had all fees and expenses been considered, the total returns would have been lower.
The performance update illustrates performance for a variable investment option available through a variable annuity contract. The performance shown indicates past performance and is not a projection or prediction of future results. Actual investment returns and principal value will fluctuate so that shares and/or units, at redemption, may be worth more or less than their original cost. Please call (800) 992-0180 to get performance through the most recent month end.
It is important to note that the Portfolio has a limited operating history. Performance over a longer period of time may be more meaningful than short-term performance.
This report contains statements that may be “forward-looking” statements. Actual results may differ materially from those projected in the “forward-looking” statements.
The views expressed in this report reflect those of the portfolio manager, only through the end of the period as stated on the cover. The portfolio manager’s views are subject to change at any time based on market and other conditions.
Portfolio holdings are subject to change daily.
(1) | | The Russell 2000® Index measures the performance of the 2,000 smallest companies in the Russell 3000 Index. The Russell 3000 Index is an unmanaged index that measures the performance of 3,000 U.S. companies based on total market capitalization. |
(2) | | Since inception performance for the index is shown from March 1, 2008. |
9
| | |
| ING LEHMAN BROTHERS U.S. AGGREGATE BOND INDEX® PORTFOLIO | | PORTFOLIO MANAGERS’ REPORT |
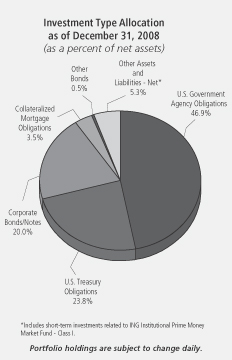
ING Lehman Brothers U.S. Aggregate Bond Index® Portfolio (the “Portfolio”) seeks investment results (before fees and expenses) that correspond to the total return of the Barclays Capital U.S. Aggregate Bond Index*. The Portfolio is managed by Andrew A. Johnson, Managing Director and Tracy L. Gage, Senior Vice President of Lehman Brothers Asset Management LLC — the Sub-Adviser.
Performance: Since its inception on March 7, 2008 through December 31, 2008, the Portfolio’s Class I shares provided a total return of 3.61% compared to the Barclays Capital U.S. Aggregate Bond Index, which returned 3.36% for the period of March 1, 2008 through December 31, 2008.
Portfolio Specifics: Based on the events of the last year, it’s clear that we are in the midst of the worst financial crisis since the Great Depression. Against this backdrop, returns on all non-Treasury fixed income obligations (spread sectors) continued to suffer in 2008, as investor risk aversion reached historic levels. In addition, credit spreads moved substantially beyond their prior historical wide levels due to forced selling, a void in the extension of credit, and recessionary fears. The issues related to the economy and financial markets have not been lost on the Federal Reserve Board (the “Fed”), the U.S. Department of the Treasury and other government agencies. Government intervention has been aggressive and we believe is expected to continue until the markets have stabilized. Thus far, policy response has included, among other initiatives, borrower refinancing programs created by the Federal Housing Administration (“FHA”) and the U.S. Department of Housing and Urban Development (“HUD”), broker/dealer lending programs established by the Fed, and securities/loan purchase programs implemented by the Treasury and Federal Deposit Insurance Corporation (“FDIC”). During
the period from March 7, 2008 through December 31, 2008, the Portfolio generated a return that was better than that of its benchmark. These results reflect our passive index strategy, whereby we structure the Portfolio with neutral exposure relative to the benchmark for changes in the level of interest rates, shape of the yield curve, and sector spreads. To the extent that returns differ from the benchmark, this is attributable to issue selection decisions and trading costs associated with rebalancing the portfolio. During the year, the largest contributor to performance was security selection within the corporate bond sector. In particular, the Portfolio’s exposure to large, highly diversified banks and brokerage companies held up relatively well. Examples include JPMorgan Chase & Co., Goldman Sachs and Bank of America Corp. which added value relative to the overall industry performance.
Current Strategy and Outlook: In keeping with the mandate, we continue to manage the Portfolio with neutral exposure relative to the benchmark for changes in the level of interest rates, the shape of the yield curve and changes in sector
spreads, while seeking to add value through security selection. Looking ahead to the new year, we firmly believe that the securities in the Portfolio are substantially undervalued and offer exceptional return opportunities. It’s important to note that high quality fixed-income sectors, which represent a significant part of the Barclays Capital U.S. Aggregate Bond Index, currently offer compelling yields, in some cases higher than the long term average return of 8-10% for common stocks. For example, Aaa rated super senior commercial mortgage-backed securities (“CMBS”) had a yield of 11.2% at the end of December and investment grade corporates within the financial sector were yielding 8.1%. Even if we assume defaults accelerate sharply from today’s levels, we believe the incremental yields provide investors with a significant return advantage without incurring the types of excessive risk that undermined the markets over the past 18 months. As we have counseled over this chaotic period, the prudent action is to stay the course and seek to earn the income advantage offered by these spreads.
| * | | Formerly known as the Lehman Brothers U.S. Aggregate Bond Index. As of October 31, 2008, all Lehman Brothers indices were renamed: the words “Lehman Brothers” changed to “Barclay’s Capital.” |
Portfolio holdings and characteristics are subject to change and may not be representative of current holdings and characteristics. The outlook for this Portfolio may differ from that presented for other ING Funds. Performance for the different classes of shares will vary based on differences in fees associated with each class.
Top Ten Holdings*
as of December 31, 2008
(as a percent of net assets)
| | |
Federal National Mortgage Association, 6.000%, due 01/11/37 | | 2.5% |
U.S. Treasury Note, 3.875%, due 09/15/10 | | 2.5% |
Federal National Mortgage Association, 5.500%, due 01/12/36 | | 2.5% |
Federal Home Loan Mortgage Corporation, 6.000%, due 01/15/36 | | 2.1% |
U.S. Treasury Bond, 4.250%, due 11/15/13 | | 2.0% |
Federal Home Loan Mortgage Corporation, 5.500%, due 01/11/37 | | 2.0% |
U.S. Treasury Bond, 6.875%, due 08/15/25 | | 1.9% |
U.S. Treasury Bond, 4.500%, due 11/15/15 | | 1.8% |
U.S. Treasury Note, 4.875%, due 05/31/11 | | 1.4% |
U.S. Treasury Note, 4.750%, due 05/31/12 | | 1.3% |
| | * | Excludes short-term investments related to ING Institutional Prime Money Market Fund - Class I. |
Portfolio holdings are subject to change daily.
10
| | |
| PORTFOLIO MANAGERS’ REPORT | | ING LEHMAN BROTHERS U.S. AGGREGATE BOND INDEX® PORTFOLIO |

| | | | | | | | | | |
| | | |
| | | Cumulative Total Returns for the Periods Ended December 31, 2008 | | | |
| | | | | Since Inception of Class I March 7, 2008 | | | Since Inception
of Classes ADV and S
March 10, 2008 | | | |
| | | Class ADV | | — | | | 3.26 | % | | |
| | | Class I | | 3.61 | % | | — | | | |
| | | Class S | | — | | | 3.29 | % | | |
| | | Barclays Capital U.S. Aggregate Bond Index(1) | | 3.36 | %(2) | | 3.36 | %(2) | | |
Based on a $10,000 initial investment, the graph and table above illustrate the total return of ING Lehman Brothers U.S. Aggregate Bond Index® Portfolio against the index indicated. An index has no cash in its portfolio, imposes no sales charges and incurs no operating expenses. An investor cannot invest directly in an index. The Portfolio’s performance is shown without the imposition of any expenses or charges which are, or may be, imposed under your annuity contract. Total returns would have been lower if such expenses or charges were included.
The performance graph and table do not reflect the deduction of taxes that a shareholder will pay on portfolio distributions or the redemption of portfolio shares.
The performance shown may include the effect of fee waivers and/or expense reimbursements by the Investment Adviser and/or other service providers, which have the effect of increasing total return. Had all fees and expenses been considered, the total returns would have been lower.
The performance update illustrates performance for a variable investment option available through a variable annuity contract. The performance shown indicates past performance and is not a projection or prediction of future results. Actual investment returns and principal value will fluctuate so that shares and/or units, at
redemption, may be worth more or less than their original cost. Please call (800) 992-0180 to get performance through the most recent month end.
It is important to note that the Portfolio has a limited operating history. Performance over a longer period of time may be more meaningful than short-term performance.
This report contains statements that may be “forward-looking” statements. Actual results may differ materially from those projected in the “forward-looking” statements.
The views expressed in this report reflect those of the portfolio managers, only through the end of the period as stated on the cover. The portfolio managers’ views are subject to change at any time based on market and other conditions.
Portfolio holdings are subject to change daily.
(1) | | The Barclays Capital U.S. Aggregate Bond Index is an unmanaged index of publicly issued investment grade U.S. Government, mortgage-backed, asset-backed and corporate debt securities. |
(2) | | Since inception performance for the index is shown from March 1, 2008. |
11
| | |
| ING INTERNATIONAL INDEX PORTFOLIO | | PORTFOLIO MANAGERS’ REPORT |
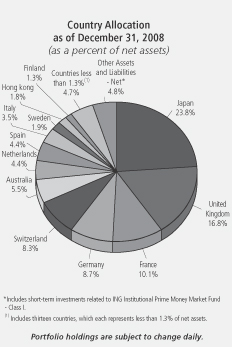
ING International Index Portfolio (the “Portfolio”) seeks investment results (before fees and expenses) that correspond to the total return of a widely accepted international index. The Portfolio is managed by Omar Aguilar, Ph.D. and Vincent Costa, Portfolio Managers* of ING Investment Management Co. (“ING IM”) — the Sub-Adviser.
Performance: Since its inception on March 10, 2008 through December 31, 2008, the Portfolio’s Class S shares provided a total return of (34.79)% compared to the MSCI Europe, Australasia and Far East® (“MSCI EAFE®”) Index(1), which returned (38.50)% for period of March 1, 2008 through December 31, 2008.
Portfolio Specifics: The Portfolio employs a “passive management” approach designed to track the performance of the MSCI EAFE® Index. The Portfolio attempts to track the MSCI EAFE® Index by investing all, or substantially all, of its assets in stocks that make up the MSCI EAFE® Index. The Portfolio may not always hold all of the same securities as the MSCI EAFE® Index.
All sectors in the MSCI EAFE® Index returned negatively for the period with the financials, materials, industrials and consumer discretionary sectors delivering the worst absolute performance. Healthcare and utilities were the least weak, though they still delivered negative results.
Current Outlook and Strategy: Our view is that the decline in economic activity is global. The plunge in Germany’s Ifo Business Climate Index of business confidence and Japan’s Shoko Chukin Bank Index of small
business confidence, along with sharp declines in industrial production, point to a sharp contraction in economic activity in Europe and Japan that could last several quarters.
The challenge to policymakers around the world is to break the cycle by which tighter credit conditions result in an economic contraction, which leads in turn to further losses and tightening in the financial system. In our view, massive fiscal stimulus packages and central bank easing eventually will break that loop, but that has not occurred yet.
We continue to remain neutral in our allocation to international equity.
Top Ten Holdings
as of December 31, 2008
(as a percent of net assets)
| | |
Nestle SA | | 1.8% |
BP PLC | | 1.7% |
Novartis AG | | 1.5% |
Total SA | | 1.5% |
HSBC Holdings PLC | | 1.4% |
Roche Holding AG | | 1.4% |
Vodafone Group PLC | | 1.3% |
Telefonica SA | | 1.2% |
GlaxoSmithKline PLC | | 1.2% |
Royal Dutch Shell PLC - Class A | | 1.1% |
Portfolio holdings are subject to change daily.
12
| * | Effective January 13, 2009, Mr. Aguilar is no longer a portfolio manager to the Portfolio. |
Portfolio holdings and characteristics are subject to change and may not be representative of current holdings and characteristics. The outlook for this Portfolio may differ from that presented for other ING Funds. Performance for the different classes of shares will vary based on differences in fees associated with each class.
| | |
PORTFOLIO MANAGERS’ REPORT | | ING INTERNATIONAL INDEX PORTFOLIO |
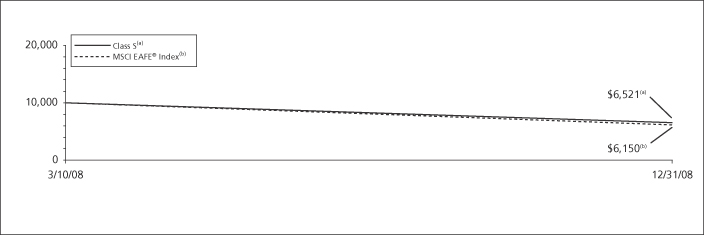
| | | | | | | |
| | | |
| | | Cumulative Total Returns for the Period Ended December 31, 2008 | | | |
| | | | | Since Inception of Classes ADV, I and S March 10, 2008 | | | |
| | | Class ADV | | (34.85 | )% | | |
| | | Class I | | (34.73 | )% | | |
| | | Class S | | (34.79 | )% | | |
| | | MSCI EAFE® Index(1) | | (38.50 | )%(2) | | |
Based on a $10,000 initial investment, the graph and table above illustrate the total return of ING International Index Portfolio against the index indicated. An index has no cash in its portfolio, imposes no sales charges and incurs no operating expenses. An investor cannot invest directly in an Index. The Portfolio’s performance is shown without the imposition of any expenses or charges which are, or may be, imposed under your annuity contract. Total returns would have been lower if such expenses or charges were included.
The performance graph and table do not reflect the deduction of taxes that a shareholder will pay on portfolio distributions or the redemption of portfolio shares.
The performance shown include the effect of fee waivers and/or expense reimbursements by the Investment Adviser and/or other service providers, which have the effect of increasing total return. Had all fees and expenses been considered, the total returns would have been lower.
The performance update illustrate performance for a variable investment option available through a variable annuity contract. The performance shown indicates past performance and is not a projection or prediction of future results. Actual investment returns and principal value will fluctuate so that shares and/or
units, at redemption, may be worth more or less than their original cost. Please call (800) 992-0180 to get performance through the most recent month end.
It is important to note that the Portfolio has a limited operating history. Performance over a longer period of time may be more meaningful than short-term performance.
This report contains statements-that may be “forward-looking” statements. Actual results may differ materially from those projected in the “forward-looking” statements.
The views expressed in this report reflect those of the portfolio managers, only through the end of the period as stated on the cover. The portfolio managers’ views are subject to change at any time based on market and other conditions.
Portfolio holdings are subject to change daily.
(1) | | The MSCI EAFE® Index is an unmanaged index that measures the performance of securities listed on exchanges in Europe, Australasia and the Far East. It includes the reinvestment of dividends net of withholding taxes, but does not reflect fees, brokerage commissions or other expenses of investing. |
(2) | | Since inception performance for the index is shown from March 1, 2008. |
13
| | |
| ING RUSSELLTM GLOBAL LARGE CAP INDEX 85% PORTFOLIO | | PORTFOLIO MANAGERS’ REPORT |
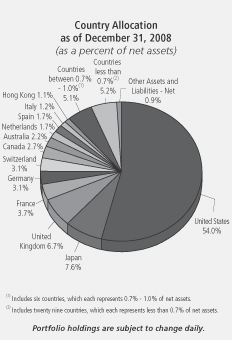
ING RussellTM Global Large Cap Index 85% Portfolio (the “Portfolio”) seeks to maximize total return, consisting of capital appreciation and current income, over the long term by allocating its assets among stock, bonds, short-term instruments and other investments. The Portfolio is managed by Omar Aguilar, Ph.D. and Vincent Costa, Portfolio Managers* of ING Investment Management Co. (“ING IM”) — the Sub-Adviser.
Performance: Since its inception on September 17, 2008 through December 31, 2008, the Portfolio’s Class S shares provided a total return of (18.18)% compared to the Russell Global Large Cap® Index(1), Barclays Capital U.S. Aggregate Bond Index**(2) and a composite index consisting of 85% Russell Global Large Cap Index® and 15% Barclays Capital U.S. Aggregate Bond Index, which returned (22.80)%, 4.58% and (18.94)%, respectively, for the period from October 1, 2008 through December 31, 2008.
Portfolio Specifics: The Portfolio employs a “passive management” approach designed to track the performance of the Russell Global Large Cap® Index and the Barclays Capital U.S. Aggregate Bond Index (collectively, “indices”). The Portfolio attempts to track the indices by investing all, or substantially all, of its assets in securities that make up the indices. The Portfolio may not always hold all of the same securities as the indices.
The financials sector was the largest detractor from performance followed by the materials sector. The best performing sectors were the defensive sectors such as telecom and utilities. The fixed income portion served as a good diversifier, adding positive returns to the Portfolio.
Current Outlook and Strategy: Our view is that the decline in economic activity is global. The plunge in Germany’s Ifo Business Climate Index of business confidence and Japan’s Shoko Chukin Bank index of small business confidence, along with sharp declines in industrial production, point to a sharp contraction in economic activity in Europe and Japan that could last several quarters.
The challenge to policymakers around the world is to break the cycle by which tighter credit conditions result in an economic contraction, which leads in turn to further losses and tightening in the financial system. In our view, massive fiscal stimulus packages and central bank easing eventually will break that loop, but that has not occurred yet.
While it appears that this recession may be the most severe since that of 1981-82, many of the extreme market movements in October and November reflect de-leveraging by hedge funds and other investors, in our view, rather than an exceptionally pessimistic assessment of the outlook for the global economy.
It is worth remembering that the stock market often retests its lows again before a bear market rally turns into a bull market.
Top Ten Holdings
as of December 31, 2008
(as a percent of net assets)
| | |
iShares Lehman Aggregate Bond Fund | | 14.9% |
ExxonMobil Corp. | | 1.8% |
SPDR Trust Series 1 | | 1.5% |
iShares MSCI EAFE Index Fund | | 1.0% |
Procter & Gamble Co. | | 0.8% |
Johnson & Johnson | | 0.7% |
AT&T, Inc. | | 0.7% |
General Electric Co. | | 0.7% |
Chevron Corp. | | 0.7% |
Microsoft Corp. | | 0.6% |
Portfolio holdings are subject to change daily.
| * | | Effective January 13, 2009, Mr. Aguilar is no longer a portfolio manager to the Portfolio. |
** | | Formerly known as the Lehman Brothers U.S. Aggregate Bond Index. As of October 31, 2008, all Lehman Brothers indices were renamed: the words “Lehman Brothers” changed to “Barclay’s Capital.” |
Portfolio holdings and characteristics are subject to change and may not be representative of current holdings and characteristics. The outlook for this Portfolio may differ from that presented for other ING Funds. Performance for the different classes of shares will vary based on differences in fees associated with each class.
14
| | |
| PORTFOLIO MANAGERS’ REPORT | | ING RUSSELL GLOBAL LARGE CAP INDEX 85% PORTFOLIO |
15
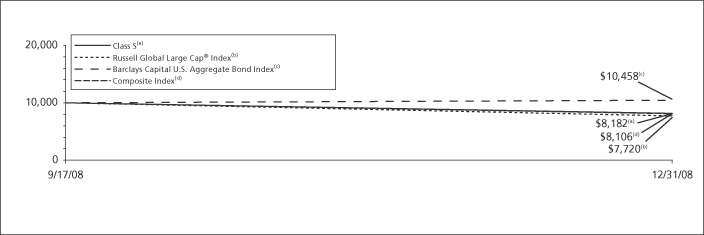
| | | | | | | |
| | | |
| | | Cumulative Total Returns for the Periods Ended December 31, 2008 | | | |
| | | | | Since Inception of Classes ADV, I and S September 17, 2008 | | | |
| | | Class ADV | | (18.43 | )% | | |
| | | Class I | | (18.22 | )% | | |
| | | Class S | | (18.18 | )% | | |
| | | Russell Global Large Cap® Index(1) | | (22.80 | )%(4) | | |
| | | Barclays Capital U.S. Aggregate Bond Index(2) | | 4.58 | %(4) | | |
| | | Composite Index(3) | | (18.94 | )%(4) | | |
Based on a $10,000 initial investment, the graph and table above illustrate the total return of ING Russell Global Large Cap Index 85% Portfolio against the indices indicated. An index has no cash in its portfolio, imposes no sales charges and incurs no operating expenses. An investor cannot invest directly in an Index. The Portfolio’s performance is shown without the imposition of any expenses or charges which are, or may be, imposed under your annuity contract. Total returns would have been lower if such expenses or charges were included.
The performance graph and table do not reflect the deduction of taxes that a shareholder will pay on portfolio distributions or the redemption of portfolio shares.
The performance shown may include the effect of fee waivers and/or expense reimbursements by the Investment Adviser and/or other service providers, which have the effect of increasing total return. Had all fees and expenses been considered, the total returns would have been lower.
The performance update illustrates performance for a variable investment option available through a variable annuity contract. The performance shown indicates past performance and is not a projection or prediction of future results. Actual investment returns and principal value will fluctuate so that shares and/or units, at redemption, may be worth more or less than their original cost. Please call (800) 992-0180 to get performance through the most recent month end.
It is important to note that the Portfolio has a limited operating history. Performance over a longer period of time may be more meaningful than short-term performance.
This report contains statements that may be “forward-looking” statements. Actual results may differ materially from those projected in the “forward-looking” statements.
The views expressed in this report reflect those of the portfolio managers, only through the end of the period as stated on the cover. The portfolio managers’ views are subject to change at any time based on market and other conditions.
Portfolio holdings are subject to change daily.
(1) | | The Russell Global Large Cap® Index measures the performance of the largest securities in the Russell Global Index, based on market capitalization. The index includes approximately 3,000 securities and covers 86% of the investable global market. |
(2) | | The Barclays Capital U.S. Aggregate Bond Index is an unmanaged index of publicly issued investment grade U.S. Government, mortgage-backed, asset-backed and corporate debt securities. |
(3) | | The Composite Index consists of 85% Russell Global Large Cap® Index and 15% Barclays Capital U.S. Aggregate Bond Index. |
(4) | | Since inception performance for the indices is shown from October 1, 2008. |
| | |
| ING WISDOMTREESM GLOBAL HIGH-YIELDING EQUITY INDEX PORTFOLIO | | PORTFOLIO MANAGERS’ REPORT |
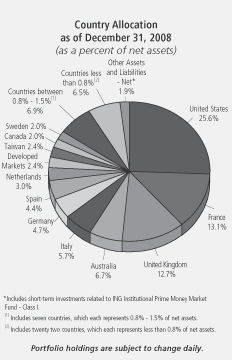
ING WisdomTreeSM Global High-Yielding Equity Index Portfolio (the “Portfolio”) seeks investment returns that closely correspond to the price and yield performance, before fees and expenses, of the WisdomTreeSM Global High-Yielding Equity Index(1). The Portfolio is managed by Omar Aguilar, Ph.D. and Vincent Costa, Portfolio Managers* of ING Investment Management Co. (“ING IM”) — the Sub-Adviser.
Performance: Since its inception on January 28, 2008 through December 31, 2008, the Portfolio’s Class S shares provided a total return of (38.10)% compared to the WisdomTreeSM Global High-Yielding Equity Index, which returned (38.52)% for the period of February 1, 2008 through December 31, 2008.
Portfolio Specifics: The Portfolio employs a “passive management” approach designed to track the performance of the WisdomTreeSM Global High-Yielding Equity Index. The Portfolio attempts to replicate the WisdomTreeSM Global High-Yielding Equity Index by investing all, or substantially all, of its assets in stocks that make up the WisdomTreeSM Global High-Yielding Equity Index. The Portfolio may not always hold all of the same securities as the WisdomTreeSM Global High-Yielding Equity Index.
All sectors in the Portfolio returned negatively for the period. Financials were the worst performers and were chiefly responsible for the Portfolio’s results, followed by industrials and telecommunications sectors.
Current Outlook & Strategy: Our view is that the decline in economic
activity is global. The plunge in Germany’s Ifo Business Climate Index of business confidence and Japan’s Shoko Chukin Bank Index of small business confidence, along with sharp declines in industrial production, point to a sharp contraction in economic activity in Europe and Japan that could last several quarters.
The challenge to policymakers around the world is to break the cycle by which tighter credit conditions result in an economic contraction, which leads in turn to further losses and tightening in the financial system. In our view, massive fiscal stimulus packages and central bank easing eventually will break that loop, but that has not occurred yet.
While it appears that this recession may be the most severe since that of 1981-82, many of the extreme market movements in October and November reflect de-leveraging by hedge funds and other investors, in our view, rather than an exceptionally pessimistic assessment of the outlook for the global economy.
It is worth remembering that the stock market often retests its lows again before a bear market rally turns into a bull market.
Top Ten Holdings
as of December 31, 2008
(as a percent of net assets)
| | |
iShares MSCI EAFE Index Fund | | 2.4% |
Pfizer, Inc. | | 2.2% |
AT&T, Inc. | | 2.0% |
HSBC Holdings PLC | | 2.0% |
Total SA | | 1.9% |
BP PLC | | 1.9% |
France Telecom SA | | 1.9% |
General Electric Co. | | 1.8% |
Vodafone Group PLC | | 1.6% |
Bank of America Corp. | | 1.6% |
Portfolio holdings are subject to change daily.
| * | | Effective January 13, 2009, Mr. Aguilar is no longer a portfolio manager to the Portfolio. |
Portfolio holdings and characteristics are subject to change and may not be representative of current holdings and characteristics. The outlook for this Portfolio may differ from that presented for other ING Funds. Performance for the different classes of shares will vary based on differences in fees associated with each class.
16
| | |
| PORTFOLIO MANAGERS’ REPORT | | ING WISDOMTREESM GLOBAL HIGH-YIELDING EQUITY INDEX PORTFOLIO |
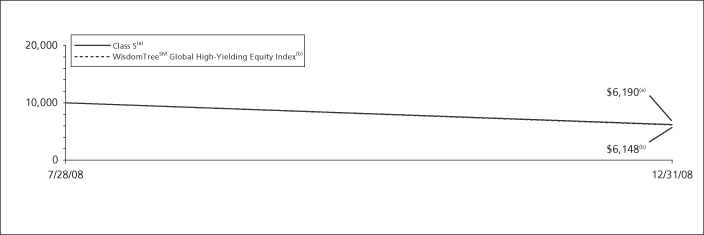
| | | | | | | |
| | | |
| | | Cumulative Total Returns for the Period Ended December 31, 2008 | | | |
| | | | | Since Inception of Classes ADV, I and S January 28, 2008 | | | |
| | | Class ADV | | (38.33 | )% | | |
| | | Class I | | (38.10 | )% | | |
| | | Class S | | (38.10 | )% | | |
| | | WisdomTreeSM Global High-Yielding Equity Index(1) | | (38.52 | )%(2) | | |
Based on a $10,000 initial investment, the graph and table above illustrate the total return of ING WisdomTreeSM Global High-Yielding Equity Index Portfolio against the index indicated. An index has no cash in its portfolio, imposes no sales charges and incurs no operating expenses. An investor cannot invest directly in an Index. The Portfolio’s performance is shown without the imposition of any expenses or charges which are, or may be, imposed under your annuity contract. Total returns would have been lower if such expenses or charges were included.
The performance graph and table do not reflect the deduction of taxes that a shareholder will pay on portfolio distributions or the redemption of portfolio shares.
The performance shown may include the effect of fee waivers and/or expense reimbursements by the Investment Adviser and/or other service providers, which have the effect of increasing total return. Had all fees and expenses been considered, the total returns would have been lower.
The performance update illustrates performance for a variable investment option available through a variable annuity contract. The performance shown indicates past performance and is not a projection or prediction of future results. Actual investment returns and principal value will fluctuate so that shares and/or units, at redemption, may be worth more or less than their original cost. Please call (800) 992-0180 to get performance through the most recent month end.
It is important to note that the Portfolio has a limited operating history. Performance over a longer period of time may be more meaningful than short-term performance.
This report contains statements that may be “forward-looking” statements. Actual results may differ materially from those projected in the “forward-looking” statements.
The views expressed in this report reflect those of the portfolio managers, only through the end of the period as stated on the cover. The portfolio managers’ views are subject to change at any time based on market and other conditions.
Portfolio holdings are subject to change daily.
(1) | | The WisdomTreeSM Global High-Yielding Equity Index is a fundamentally weighted index that measures the performance of high dividend-yielding companies selected from the WisdomTree Global Dividend Index, which measures the performance of dividend-paying companies in the U.S., developed and emerging markets. |
(2) | | Since inception performance for the index is shown from February 1, 2008. |
17
SHAREHOLDER EXPENSE EXAMPLES (UNAUDITED)
As a shareholder of a Portfolio, you incur two types of costs: (1) transaction costs, including redemption fees and exchange fees; and (2) ongoing costs, including management fees, distribution and/or service (12b-1) fees, and other Portfolio expenses. These Examples are intended to help you understand your ongoing costs (in dollars) of investing in a Portfolio and to compare these costs with the ongoing costs of investing in other mutual funds.
The Examples are based on an investment of $1,000 invested at the beginning of the period and held for the entire period from July 1, 2008 to December 31, 2008. The Portfolios’ expenses are shown without the imposition of any charges which are, or may be, imposed under your annuity contract. Expenses would have been higher if such charges were included.
Actual Expenses
The first section of the table shown, “Actual Portfolio Return,” provides information about actual account values and actual expenses. You may use the information in this section, together with the amount you invested, to estimate the expenses that you paid over the period. Simply divide your account value by $1,000 (for example, an $8,600 account value divided by $1,000 = 8.6), then multiply the result by the number in the first section under the heading entitled “Expenses Paid During the Period” to estimate the expenses you paid on your account during this period.
Hypothetical Example for Comparison Purposes
The second section of the table shown, “Hypothetical (5% return before expenses),” provides information about hypothetical account values and hypothetical expenses based on the Portfolio’s actual expense ratio and an assumed rate of return of 5% per year before expenses, which is not the Portfolio’s actual return. The hypothetical account values and expenses may not be used to estimate the actual ending account balance or expenses you paid for the period. You may use this information to compare the ongoing costs of investing in the Portfolio and other mutual funds. To do so, compare this 5% hypothetical example with the 5% hypothetical examples that appear in the shareholder reports of the other mutual funds.
Please note that the expenses shown in the table are meant to highlight your ongoing costs only and do not reflect any transactional costs, such as redemption fees or exchange fees. Therefore, the hypothetical lines of the table are useful in comparing ongoing costs only, and will not help you determine the relative total costs of owning different mutual funds. In addition, if these transactional costs were included, your costs would have been higher.
| | | | | | | | | | | | | | | | | | | | | | | | |
| | | Actual Portfolio Return | | Hypothetical (5% return before expenses) |
| | | Beginning
Account
Value
July 1, 2008 | | Ending Account Value
December 31, 2008 | | Annualized
Expense
Ratio | | | Expenses Paid
During the Period Ended
December 31, 2008* | | Beginning
Account
Value
July 1, 2008 | | Ending Account Value
December 31, 2008 | | Annualized
Expense
Ratio | | | Expenses Paid
During the Period Ended
December 31, 2008* |
ING Russell™ Large Cap Index Portfolio | | | | | | | | | | | | |
Class ADV | | $ | 1,000.00 | | $ | 727.30 | | 0.87 | % | | $ | 3.78 | | $ | 1,000.00 | | $ | 1,020.76 | | 0.87 | % | | $ | 4.42 |
Class I | | | 1,000.00 | | | 730.10 | | 0.37 | | | | 1.61 | | | 1,000.00 | | | 1,023.28 | | 0.37 | | | | 1.88 |
Class S | | | 1,000.00 | | | 728.50 | | 0.62 | | | | 2.69 | | | 1,000.00 | | | 1,022.02 | | 0.62 | | | | 3.15 |
ING Russell™ Mid Cap Index Portfolio | | | | | | | | | | | | |
Class ADV | | $ | 1,000.00 | | $ | 630.50 | | 0.93 | % | | $ | 3.81 | | $ | 1,000.00 | | $ | 1,020.46 | | 0.93 | % | | $ | 4.72 |
Class I | | | 1,000.00 | | | 631.50 | | 0.43 | | | | 1.76 | | | 1,000.00 | | | 1,022.97 | | 0.43 | | | | 2.19 |
Class S | | | 1,000.00 | | | 630.60 | | 0.68 | | | | 2.79 | | | 1,000.00 | | | 1,021.72 | | 0.68 | | | | 3.46 |
ING Russell™ Small Cap Index Portfolio | | | | | | | | | | | | |
Class ADV | | $ | 1,000.00 | | $ | 727.40 | | 0.95 | % | | $ | 4.12 | | $ | 1,000.00 | | $ | 1,020.36 | | 0.95 | % | | $ | 4.82 |
Class I | | | 1,000.00 | | | 729.20 | | 0.45 | | | | 1.96 | | | 1,000.00 | | | 1,022.87 | | 0.45 | | | | 2.29 |
Class S | | | 1,000.00 | | | 727.40 | | 0.70 | | | | 3.04 | | | 1,000.00 | | | 1,021.62 | | 0.70 | | | | 3.56 |
| * | | Expenses are equal to each Portfolio’s respective annualized expense ratios multiplied by the average account value over the period, multiplied by 184/366 to reflect the most recent fiscal half-year. |
18
SHAREHOLDER EXPENSE EXAMPLES (UNAUDITED) (CONTINUED)
| | | | | | | | | | | | | | | | | | | | | | | | |
| | | Actual Portfolio Return | | Hypothetical (5% return before expenses) |
| | | Beginning
Account
Value
July 1, 2008 | | Ending Account Value
December 31, 2008 | | Annualized
Expense
Ratio | | | Expenses Paid
During the Period Ended
December 31, 2008* | | Beginning
Account
Value
July 1, 2008 | | Ending Account Value
December 31, 2008 | | Annualized
Expense
Ratio | | | Expenses Paid
During the Period Ended
December 31, 2008* |
ING Lehman Brothers U.S. Aggregate Bond Index® Portfolio | | | | | | | | | | | | |
Class ADV | | $ | 1,000.00 | | $ | 1,037.80 | | 0.95 | % | | $ | 4.87 | | $ | 1,000.00 | | $ | 1,020.36 | | 0.95 | % | | $ | 4.82 |
Class I | | | 1,000.00 | | | 1,039.20 | | 0.45 | | | | 2.31 | | | 1,000.00 | | | 1,022.87 | | 0.45 | | | | 2.29 |
Class S | | | 1,000.00 | | | 1,038.10 | | 0.70 | | | | 3.59 | | | 1,000.00 | | | 1,021.62 | | 0.70 | | | | 3.56 |
ING International Index Portfolio | | | | | | | | | | | | |
Class ADV | | $ | 1,000.00 | | $ | 650.90 | | 1.00 | % | | $ | 4.15 | | $ | 1,000.00 | | $ | 1,020.11 | | 1.00 | % | | $ | 5.08 |
Class I | | | 1,000.00 | | | 652.70 | | 0.50 | | | | 2.08 | | | 1,000.00 | | | 1,022.62 | | 0.50 | | | | 2.54 |
Class S | | | 1,000.00 | | | 651.50 | | 0.75 | | | | 3.11 | | | 1,000.00 | | | 1,021.37 | | 0.75 | | | | 3.81 |
ING Russell Global Large Cap Index 85% Portfolio | | | | | | | | | | | | |
Class ADV(1) | | $ | 1,000.00 | | $ | 815.70 | | 1.10 | % | | $ | 2.89 | | $ | 1,000.00 | | $ | 1,019.61 | | 1.10 | % | | $ | 5.58 |
Class I(1) | | | 1,000.00 | | | 817.80 | | 0.60 | | | | 1.58 | | | 1,000.00 | | | 1,022.12 | | 0.60 | | | | 3.05 |
Class S(1) | | | 1,000.00 | | | 818.20 | | 0.85 | | | | 2.24 | | | 1,000.00 | | | 1,020.86 | | 0.85 | | | | 4.32 |
ING WisdomTreeSM Global High-Yielding Equity Index Portfolio | | | | | | | | | | | | |
Class ADV | | $ | 1,000.00 | | $ | 677.60 | | 1.20 | % | | $ | 5.06 | | $ | 1,000.00 | | $ | 1,019.10 | | 1.20 | % | | $ | 6.09 |
Class I | | | 1,000.00 | | | 619.00 | | 0.70 | | | | 2.85 | | | 1,000.00 | | | 1,021.62 | | 0.70 | | | | 3.56 |
Class S | | | 1,000.00 | | | 678.70 | | 0.89 | | | | 3.76 | | | 1,000.00 | | | 1,020.66 | | 0.89 | | | | 4.52 |
| * | | Expenses are equal to each Portfolio’s respective annualized expense ratios multiplied by the average account value over the period, multiplied by 184/366 to reflect the most recent fiscal half-year. |
(1) | | Commencement of operations was September 17, 2008. Expenses paid for the Actual Portfolio Return reflect the 106-day period ended December 31, 2008. |
19
REPORT OF INDEPENDENT REGISTERED PUBLIC ACCOUNTING FIRM
The Shareholders and Board of Directors
ING Variable Portfolios, Inc.
We have audited the accompanying statements of assets and liabilities, including the portfolios of investments, of ING RussellTM Large Cap Index Portfolio, ING RussellTM Mid Cap Index Portfolio, ING Russell TM Small Cap Index Portfolio, ING Lehman Brothers U.S. Aggregate Bond Index® Portfolio, ING International Index Portfolio, ING Russell Global Large Cap Index 85% Portfolio, and ING WisdomTreeSM Global High-Yielding Equity Index Portfolio, each a series of the ING Variable Portfolios, Inc., as of December 31, 2008, and the related statements of operations for the period then ended, the statements of changes in net assets for the period then ended, and the financial highlights for the period then ended. These financial statements and financial highlights are the responsibility of management. Our responsibility is to express an opinion on these financial statements and financial highlights based on our audits.
We conducted our audits in accordance with the standards of the Public Company Accounting Oversight Board (United States). Those standards require that we plan and perform the audit to obtain reasonable assurance about whether the financial statements and financial highlights are free of material misstatement. An audit includes examining, on a test basis, evidence supporting the amounts and disclosures in the financial statements. Our procedures included confirmation of securities owned as of December 31, 2008, by correspondence with the custodian and brokers, or by other appropriate auditing procedures when replies from brokers were not received. An audit also includes assessing the accounting principles used and significant estimates made by management, as well as evaluating the overall financial statement presentation. We believe that our audits provide a reasonable basis for our opinion.
In our opinion, the financial statements and financial highlights referred to above present fairly, in all material respects, the financial position of the aforementioned portfolios as of December 31, 2008, and the results of their operations, the changes in their net assets, and the financial highlights for the periods specified in the first paragraph above, in conformity with U.S. generally accepted accounting principles.

Boston, Massachusetts
February 25, 2009
20
STATEMENTS OF ASSETS AND LIABILITIESASOF DECEMBER 31, 2008
| | | | | | | | | | | | | | | |
| | | ING
RussellTM
Large Cap
Index
Portfolio | | | ING
RussellTM
Mid Cap
Index
Portfolio | | | ING
RussellTM
Small Cap
Index
Portfolio | | | ING
Lehman
Brothers U.S.
Aggregate
Bond Index®
Portfolio |
ASSETS: | | | | | | | | | | | | | | | |
Investments in securities at value+* | | $ | 1,033,265,655 | | | $ | 135,011,790 | | | $ | 199,631,177 | | | $ | 272,749,676 |
Short-term investments** | | | — | | | | 4,305,340 | | | | 18,415,709 | | | | — |
Short-term investments in affiliates*** | | | 33,732,000 | | | | 4,808,000 | | | | 4,869,000 | | | | 67,861,659 |
Cash | | | 8,998,832 | | | | 612 | | | | 42,032 | | | | 3,162 |
Cash collateral for futures | | | 5,247,000 | | | | 712,800 | | | | 506,000 | | | | — |
Receivables: | | | | | | | | | | | | | | | |
Investment securities sold | | | — | | | | 719,973 | | | | — | | | | 10,181,170 |
Fund shares sold | | | 4,206,100 | | | | 1,451,631 | | | | 2,873,344 | | | | 1,273,555 |
Dividends and interest | | | 1,975,529 | | | | 306,926 | | | | 484,669 | | | | 2,008,081 |
Variation margin | | | 634,488 | | | | 129,945 | | | | 143,047 | | | | — |
Prepaid expenses | | | 29,234 | | | | 7,490 | | | | 9,392 | | | | 10,419 |
Reimbursement due from manager | | | 30,451 | | | | 6,842 | | | | 15,229 | | | | 2,783 |
| | | | | | | | | | | | | | | |
Total assets | | | 1,088,119,289 | | | | 147,461,349 | | | | 226,989,599 | | | | 354,090,505 |
| | | | | | | | | | | | | | | |
LIABILITIES: | | | | | | | | | | | | | | | |
Payable for investment securities purchased | | | 9,015 | | | | 92,599 | | | | 272,266 | | | | 62,526,495 |
Payable for fund shares redeemed | | | 166,888 | | | | 13,351 | | | | 15,002 | | | | 3,337,697 |
Payable upon receipt of securities loaned | | | — | | | | 4,359,108 | | | | 18,516,175 | | | | — |
Payable to affiliates | | | 233,530 | | | | 52,343 | | | | 82,673 | | | | 130,144 |
Payable for directors fees | | | 6,582 | | | | 3,991 | | | | 2,136 | | | | 3,138 |
Other accrued expenses and liabilities | | | 54,384 | | | | 41,244 | | | | 51,523 | | | | 51,512 |
Payable for licensing fees | | | 10,000 | | | | 10,000 | | | | 10,000 | | | | — |
| | | | | | | | | | | | | | | |
Total liabilities | | | 480,399 | | | | 4,572,636 | | | | 18,949,775 | | | | 66,048,986 |
| | | | | | | | | | | | | | | |
NET ASSETS | | $ | 1,087,638,890 | | | $ | 142,888,713 | | | $ | 208,039,824 | | | $ | 288,041,519 |
| | | | | | | | | | | | | | | |
NET ASSETS WERE COMPRISED OF: | | | | | | | | | | | | | | | |
Paid-in capital | | $ | 1,406,246,700 | | | $ | 220,889,297 | | | $ | 282,889,963 | | | $ | 284,170,577 |
Undistributed net investment income | | | 158,673 | | | | — | | | | 94,360 | | | | 78,081 |
Accumulated net realized gain (loss) on investments and futures | | | (34,438,005 | ) | | | (14,310,514 | ) | | | (12,178,624 | ) | | | 1,375,115 |
Net unrealized appreciation or depreciation on investments and futures | | | (284,328,478 | ) | | | (63,690,070 | ) | | | (62,765,875 | ) | | | 2,417,746 |
| | | | | | | | | | | | | | | |
NET ASSETS | | $ | 1,087,638,890 | | | $ | 142,888,713 | | | $ | 208,039,824 | | | $ | 288,041,519 |
| | | | | | | | | | | | | | | |
| | | | | | | | | | | | | | | |
+ Including securities loaned at value | | $ | — | | | $ | 4,213,351 | | | $ | 17,863,015 | | | $ | — |
* Cost of investments in securities | | $ | 1,318,650,544 | | | $ | 198,907,915 | | | $ | 262,655,963 | | | $ | 270,331,930 |
** Cost of short-term investments | | $ | — | | | $ | 4,359,108 | | | $ | 18,516,175 | | | $ | — |
*** Cost of short-term investments in affiliates | | $ | 33,732,000 | | | $ | 4,808,000 | | | $ | 4,869,000 | | | $ | 67,861,659 |
See Accompanying Notes to Financial Statements
21
STATEMENTS OF ASSETS AND LIABILITIESASOF DECEMBER 31, 2008 (CONTINUED)
| | | | | | | | | | | | |
| | | ING RussellTM
Large Cap
Index Portfolio | | ING RussellTM
Mid Cap
Index Portfolio | | ING RussellTM
Small Cap
Index Portfolio | | ING Lehman
Brothers U.S. Aggregate
Bond Index®
Portfolio |
Class ADV: | | | | | | | | | | | | |
Net assets | | $ | 1,135,332 | | $ | 61,097 | | $ | 571,091 | | $ | 143,291 |
Shares authorized | | | 100,000,000 | | | 100,000,000 | | | 100,000,000 | | | 100,000,000 |
Par value | | $ | 0.001 | | $ | 0.001 | | $ | 0.001 | | $ | 0.001 |
Shares outstanding | | | 157,913 | | | 9,221 | | | 73,963 | | | 14,163 |
Net asset value and redemption price per share | | $ | 7.19 | | $ | 6.63 | | $ | 7.72 | | $ | 10.12 |
Class I: | | | | | | | | | | | | |
Net assets | | $ | 1,057,974,224 | | $ | 117,525,007 | | $ | 132,761,620 | | $ | 107,276,309 |
Shares authorized | | | 200,000,000 | | | 100,000,000 | | | 100,000,000 | | | 100,000,000 |
Par value | | $ | 0.001 | | $ | 0.001 | | $ | 0.001 | | $ | 0.001 |
Shares outstanding | | | 146,789,804 | | | 17,715,700 | | | 17,138,537 | | | 10,596,928 |
Net asset value and redemption price per share | | $ | 7.21 | | $ | 6.63 | | $ | 7.75 | | $ | 10.12 |
Class S: | | | | | | | | | | | | |
Net assets | | $ | 28,529,334 | | $ | 25,302,609 | | $ | 74,707,113 | | $ | 180,621,919 |
Shares authorized | | | 100,000,000 | | | 100,000,000 | | | 100,000,000 | | | 100,000,000 |
Par value | | $ | 0.001 | | $ | 0.001 | | $ | 0.001 | | $ | 0.001 |
Shares outstanding | | | 3,962,706 | | | 3,819,833 | | | 9,658,976 | | | 17,879,911 |
Net asset value and redemption price per share | | $ | 7.20 | | $ | 6.62 | | $ | 7.73 | | $ | 10.10 |
See Accompanying Notes to Financial Statements
22
STATEMENTS OF ASSETS AND LIABILITIESASOF DECEMBER 31, 2008
| | | | | | | | | | | | |
| | | ING International
Index Portfolio | | | ING RussellTM Global Large
Cap Index 85% Portfolio | | | ING WisdomTreeSM
High-Yielding Equity Index Portfolio | |
ASSETS: | | | | | | | | | | | | |
Investments in securities at value* | | $ | 232,430,429 | | | $ | 42,783,600 | | | $ | 145,955,930 | |
Investments in affiliates** | | | 640,930 | | | | 34,272 | | | | — | |
Short-term investments in affiliates*** | | | 1,546,000 | | | | — | | | | 1,323,000 | |
Cash | | | 685 | | | | — | | | | 7,774 | |
Cash collateral for futures | | | 1,697,281 | | | | — | | | | — | |
Foreign currencies at value**** | | | 6,536,797 | | | | 142,015 | | | | 216,063 | |
Receivables: | | | | | | | | | | | | |
Investment securities sold | | | 443,856 | | | | 1,301,634 | | | | — | |
Fund shares sold | | | 1,390,852 | | | | 1,451 | | | | 2,302,064 | |
Dividends and interest | | | 448,997 | | | | 94,724 | | | | 436,690 | |
Variation margin | | | 239,657 | | | | — | | | | — | |
Prepaid expenses | | | 11,038 | | | | 44,961 | | | | 10,601 | |
Reimbursement due from manager | | | 80,653 | | | | 89,813 | | | | 76,818 | |
| | | | | | | | | | | | |
Total assets | | | 245,467,175 | | | | 44,492,470 | | | | 150,328,940 | |
| | | | | | | | | | | | |
LIABILITIES: | | | | | | | | | | | | |
Payable for investment securities purchased | | | 479,255 | | | | 840,582 | | | | 1,254,061 | |
Payable for fund shares redeemed | | | 26,703 | | | | 12,500 | | | | — | |
Payable for futures variation margin | | | 1,085 | | | | — | | | | — | |
Payable to affiliates | | | 93,851 | | | | 28,565 | | | | 87,685 | |
Payable to custodian due to bank overdraft | | | — | | | | 303,264 | | | | — | |
Payable for directors fees | | | 936 | | | | 9,973 | | | | 6,756 | |
Other accrued expenses and liabilities | | | 104,050 | | | | 81,317 | | | | 166,771 | |
Payable for licensing fees | | | — | | | | 10,000 | | | | 67,641 | |
| | | | | | | | | | | | |
Total liabilities | | | 705,880 | | | | 1,286,201 | | | | 1,582,914 | |
| | | | | | | | | | | | |
NET ASSETS | | $ | 244,761,295 | | | $ | 43,206,269 | | | $ | 148,746,026 | |
| | | | | | | | | | | | |
NET ASSETS WERE COMPRISED OF: | | | | | | | | | | | | |
Paid-in capital | | $ | 390,535,803 | | | $ | 52,585,151 | | | $ | 232,819,402 | |
Undistributed net investment income | | | 3,389 | | | | 351 | | | | — | |
Accumulated net realized loss on investments, foreign currency related transactions, and futures | | | (7,372,859 | ) | | | (629,399 | ) | | | (14,055,025 | ) |
Net unrealized depreciation on investments, foreign currency related transactions, and futures | | | (138,405,038 | ) | | | (8,749,834 | ) | | | (70,018,351 | ) |
| | | | | | | | | | | | |
NET ASSETS | | $ | 244,761,295 | | | $ | 43,206,269 | | | $ | 148,746,026 | |
| | | | | | | | | | | | |
| | | | | | | | | | | | |
* Cost of investments in securities | | $ | 369,853,183 | | | $ | 51,483,002 | | | $ | 215,954,468 | |
** Cost of investments in affiliates | | $ | 2,044,570 | | | $ | 77,577 | | | $ | — | |
*** Cost of short-term investments in affiliates | | $ | 1,546,000 | | | $ | — | | | $ | 1,323,000 | |
****Cost of foreign currencies | | $ | 6,285,361 | | | $ | 148,608 | | | $ | 225,709 | |
See Accompanying Notes to Financial Statements
23
STATEMENTS OF ASSETS AND LIABILITIESASOF DECEMBER 31, 2008 (CONTINUED)
| | | | | | | | | |
| | | ING International
Index Portfolio | | ING RussellTM Global
Large Cap
Index 85% Portfolio | | ING WisdomTreeSM
Global
High-Yielding
Equity Index Portfolio |
Class ADV: | | | | | | | | | |
Net assets | | $ | 1,938 | | $ | 2,431 | | $ | 605 |
Shares authorized | | | 100,000,000 | | | 100,000,000 | | | 100,000,000 |
Par value | | $ | 0.001 | | $ | 0.001 | | $ | 0.001 |
Shares outstanding | | | 302 | | | 301 | | | 101 |
Net asset value and redemption price per share | | $ | 6.43 | | $ | 8.07 | | $ | 5.99 |
Class I: | | | | | | | | | |
Net assets | | $ | 237,776,698 | | $ | 2,432 | | $ | 6 |
Shares authorized | | | 100,000,000 | | | 100,000,000 | | | 100,000,000 |
Par value | | $ | 0.001 | | $ | 0.001 | | $ | 0.001 |
Shares outstanding | | | 37,080,141 | | | 301 | | | 1 |
Net asset value and redemption price per share | | $ | 6.41 | | $ | 8.08 | | $ | 5.97 |
Class S: | | | | | | | | | |
Net assets | | $ | 6,982,659 | | $ | 43,201,406 | | $ | 148,745,415 |
Shares authorized | | | 100,000,000 | | | 100,000,000 | | | 100,000,000 |
Par value | | $ | 0.001 | | $ | 0.001 | | $ | 0.001 |
Shares outstanding | | | 1,090,083 | | | 5,336,847 | | | 24,871,599 |
Net asset value and redemption price per share | | $ | 6.41 | | $ | 8.09 | | $ | 5.98 |
See Accompanying Notes to Financial Statements
24
STATEMENTS OF OPERATIONS
| | | | | | | | | | | | | | | | |
| | | ING
RussellTM
Large Cap
Index
Portfolio | | | ING
RussellTM
Mid Cap
Index
Portfolio | | | ING
RussellTM
Small Cap
Index
Portfolio | | | ING
Lehman
Brothers U.S.
Aggregate
Bond Index®
Portfolio | |
| | | March 10, 2008(1)
to December 31, 2008 | | | March 10, 2008(1)
to December 31, 2008 | | | March 10, 2008(1)
to December 31, 2008 | | | March 7, 2008(1)
to December 31, 2008 | |
INVESTMENT INCOME: | | | | | | | | | | | | | | | | |
Dividends, net of foreign taxes withheld*(2) | | $ | 13,750,791 | | | $ | 2,268,761 | | | $ | 2,334,284 | | | $ | 154,999 | |
Interest | | | 9,534 | | | | — | | | | 2,311 | | | | 4,267,693 | |
Securities lending income | | | — | | | | 43,636 | | | | 188,679 | | | | — | |
| | | | | | | | | | | | | | | | |
Total investment income | | | 13,760,325 | | | | 2,312,397 | | | | 2,525,274 | | | | 4,422,692 | |
| | | | | | | | | | | | | | | | |
EXPENSES: | | | | | | | | | | | | | | | | |
Investment management fees | | | 1,282,275 | | | | 324,618 | | | | 407,806 | | | | 350,798 | |
Distribution and service fees: | | | | | | | | | | | | | | | | |
Class ADV | | | 2,364 | | | | 160 | | | | 360 | | | | 320 | |
Class S | | | 23,208 | | | | 20,637 | | | | 64,873 | | | | 160,845 | |
Transfer agent fees | | | 632 | | | | 624 | | | | 618 | | | | 2,623 | |
Administrative service fees | | | 512,903 | | | | 104,714 | | | | 123,576 | | | | 109,622 | |
Shareholder reporting expense | | | 21,692 | | | | 13,150 | | | | 12,382 | | | | 22,416 | |
Professional fees | | | 55,490 | | | | 25,364 | | | | 25,294 | | | | 27,684 | |
Custody and accounting expense | | | 47,682 | | | | 24,137 | | | | 47,860 | | | | 20,260 | |
Directors fees | | | 37,583 | | | | 10,305 | | | | 9,115 | | | | 7,562 | |
Offering expense | | | 13,020 | | | | 11,393 | | | | 11,393 | | | | 11,393 | |
Miscellaneous expense | | | 13,537 | | | | 6,835 | | | | 9,246 | | | | 6,282 | |
Licensing fees | | | 10,000 | | | | 10,000 | | | | 10,000 | | | | — | |
| | | | | | | | | | | | | | | | |
Total expenses | | | 2,020,386 | | | | 551,937 | | | | 722,523 | | | | 719,805 | |
Net waived and reimbursed fees | | | (96,260 | ) | | | (81,188 | ) | | | (101,899 | ) | | | (63,017 | ) |
| | | | | | | | | | | | | | | | |
Net expenses | | | 1,924,126 | | | | 470,749 | | | | 620,624 | | | | 656,788 | |
| | | | | | | | | | | | | | | | |
Net investment income | | | 11,836,199 | | | | 1,841,648 | | | | 1,904,650 | | | | 3,765,904 | |
| | | | | | | | | | | | | | | | |
REALIZED AND UNREALIZED GAIN (LOSS) ON INVESTMENTS, AND FUTURES: | | | | | | | | | | | | | | | | |
Net realized gain (loss) on: | | | | | | | | | | | | | | | | |
Investments | | | (19,554,391 | ) | | | (12,709,315 | ) | | | (7,328,016 | ) | | | 1,887,738 | |
Futures | | | (14,884,382 | ) | | | (1,764,745 | ) | | | (4,944,273 | ) | | | — | |
| | | | | | | | | | | | | | | | |
Net realized gain (loss) on investments and futures | | | (34,438,773 | ) | | | (14,474,060 | ) | | | (12,272,289 | ) | | | 1,887,738 | |
| | | | | | | | | | | | | | | | |
Net change in unrealized appreciation or depreciation on: | | | | | | | | | | | | | | | | |
Investments | | | (285,384,889 | ) | | | (63,949,893 | ) | | | (63,125,252 | ) | | | 2,417,746 | |
Futures | | | 1,056,411 | | | | 259,823 | | | | 359,377 | | | | — | |
| | | | | | | | | | | | | | | | |
Net change in unrealized appreciation or depreciation on investments | | | (284,328,478 | ) | | | (63,690,070 | ) | | | (62,765,875 | ) | | | 2,417,746 | |
| | | | | | | | | | | | | | | | |
Net realized and unrealized gain (loss) on investments and futures | | | (318,767,251 | ) | | | (78,164,130 | ) | | | (75,038,164 | ) | | | 4,305,484 | |
| | | | | | | | | | | | | | | | |
Increase (decrease) in net assets resulting from operations | | $ | (306,931,052 | ) | | $ | (76,322,482 | ) | | $ | (73,133,514 | ) | | $ | 8,071,388 | |
| | | | | | | | | | | | | | | | |
| | | | | | | | | | | | | | | | |
* Foreign taxes withheld | | $ | — | | | $ | 285 | | | $ | 311 | | | $ | — | |
(1) Commencement of operations | | | | | | | | | | | | | | | | |
(2) Dividends from affiliates | | $ | 440,429 | | | $ | 116,870 | | | $ | 126,996 | | | $ | 154,999 | |
See Accompanying Notes to Financial Statements
25
STATEMENTS OF OPERATIONS
| | | | | | | | | | | | |
| | | ING International Index Portfolio | | | ING RussellTM Global
Large Cap Index 85% Portfolio | | | ING WisdomTreeSM Global
High-Yielding
Equity Index Portfolio | |
| | | March 10, 2008(1)
to December 31, 2008 | | | September 17, 2008(1)
to December 31, 2008 | | | January 28, 2008(1)
to December 31, 2008 | |
INVESTMENT INCOME: | | | | | | | | | | | | |
Dividends, net of foreign taxes withheld*(2) | | $ | 5,180,366 | | | $ | 277,287 | | | $ | 5,702,310 | |
Interest | | | 178,674 | | | | 127,204 | | | | 283,611 | |
| | | | | | | | | | | | |
Total investment income | | | 5,359,040 | | | | 404,491 | | | | 5,985,921 | |
| | | | | | | | | | | | |
EXPENSES: | | | | | | | | | | | | |
Investment management fees | | | 667,316 | | | | 55,717 | | | | 527,789 | |
Distribution and service fees: | | | | | | | | | | | | |
Class ADV | | | 10 | | | | 4 | | | | 6 | |
Class S | | | 6,599 | | | | 30,278 | | | | 239,921 | |
Transfer agent fees | | | 569 | | | | 1,826 | | | | 428 | |
Administrative service fees | | | 175,607 | | | | 12,112 | | | | 114,735 | |
Shareholder reporting expense | | | 8,442 | | | | 8,360 | | | | 35,458 | |
Registration fees | | | — | | | | 105 | | | | 5,024 | |
Professional fees | | | 29,606 | | | | 25,122 | | | | 23,302 | |
Custody and accounting expense | | | 270,492 | | | | 60,211 | | | | 333,624 | |
Directors fees | | | 10,785 | | | | 10,192 | | | | 13,477 | |
Offering expense | | | 11,393 | | | | 17,549 | | | | 47,740 | |
Miscellaneous expense | | | 9,621 | | | | 3,782 | | | | 15,713 | |
Licensing fees | | | — | | | | 10,000 | | | | 215,399 | |
| | | | | | | | | | | | |
Total expenses | | | 1,190,440 | | | | 235,258 | | | | 1,572,616 | |
Net waived and reimbursed fees | | | (304,811 | ) | | | (132,243 | ) | | | (587,386 | ) |
| | | | | | | | | | | | |
Net expenses | | | 885,629 | | | | 103,015 | | | | 985,230 | |
| | | | | | | | | | | | |
Net investment income | | | 4,473,411 | | | | 301,476 | | | | 5,000,691 | |
| | | | | | | | | | | | |
REALIZED AND UNREALIZED GAIN (LOSS) ON INVESTMENTS, FOREIGN CURRENCY RELATED TRANSACTIONS, AND FUTURES: | | | | | | | | | | | | |
Net realized gain (loss) on: | | | | | | | | | | | | |
Investments | | | (5,744,083 | ) | | | (631,454 | ) | | | (14,112,942 | ) |
Foreign currency related transactions | | | (301,574 | ) | | | 144,846 | | | | (227,498 | ) |
Futures | | | (1,613,546 | ) | | | — | | | | 25,890 | |
| | | | | | | | | | | | |
Net realized loss on investments, foreign currency related transactions, and futures | | | (7,659,203 | ) | | | (486,608 | ) | | | (14,314,550 | ) |
| | | | | | | | | | | | |
Net change in unrealized appreciation or depreciation on: | | | | | | | | | | | | |
Investments | | | (138,826,394 | ) | | | (8,742,707 | ) | | | (69,998,538 | ) |
Foreign currency related transactions | | | 230,036 | | | | (7,127 | ) | | | (19,813 | ) |
Futures | | | 191,320 | | | | — | | | | — | |
| | | | | | | | | | | | |
Net change in unrealized appreciation or depreciation on investments, foreign currency related transactions, and futures | | | (138,405,038 | ) | | | (8,749,834 | ) | | | (70,018,351 | ) |
| | | | | | | | | | | | |
Net realized and unrealized loss on investments, foreign currency related transactions, and futures | | | (146,064,241 | ) | | | (9,236,442 | ) | | | (84,332,901 | ) |
| | | | | | | | | | | | |
Decrease in net assets resulting from operations | | $ | (141,590,830 | ) | | $ | (8,934,966 | ) | | $ | (79,332,210 | ) |
| | | | | | | | | | | | |
| | | | | | | | | | | | |
* Foreign taxes withheld | | $ | 540,536 | | | $ | 15,566 | | | $ | 474,711 | |
(1) Commencement of operations | | | | | | | | | | | | |
(2) Dividends from affiliates | | $ | 32,432 | | | $ | 11,870 | | | $ | 65,175 | |
See Accompanying Notes to Financial Statements
26
STATEMENTS OF CHANGES IN NET ASSETS
| | | | | | | | | | | | | | | | |
| | | ING
RussellTM
Large Cap
Index
Portfolio | | | ING
RussellTM
Mid Cap
Index
Portfolio | | | ING
RussellTM
Small Cap
Index
Portfolio | | | ING
Lehman
Brothers U.S.
Aggregate
Bond Index(R)
Portfolio | |
| | | March 10, 2008(1)
to December 31, 2008 | | | March 10, 2008(1) to December 31, 2008 | | | March 10, 2008(1) to December 31, 2008 | | | March 7, 2008(1) to December 31, 2008 | |
FROM OPERATIONS: | | | | | | | | | | | | | | | | |
Net investment income | | $ | 11,836,199 | | | $ | 1,841,648 | | | $ | 1,904,650 | | | $ | 3,765,904 | |
Net realized gain (loss) on investments and futures | | | (34,438,773 | ) | | | (14,474,060 | ) | | | (12,272,289 | ) | | | 1,887,738 | |
Net change in unrealized appreciation or depreciation on investments and futures | | | (284,328,478 | ) | | | (63,690,070 | ) | | | (62,765,875 | ) | | | 2,417,746 | |
| | | | | | | | | | | | | | | | |
Increase (decrease) in net assets resulting from operations | | | (306,931,052 | ) | | | (76,322,482 | ) | | | (73,133,514 | ) | | | 8,071,388 | |
| | | | | | | | | | | | | | | | |
FROM DISTRIBUTIONS
TO SHAREHOLDERS: | | | | | | | | | | | | | | | | |
Net investment income: | | | | | | | | | | | | | | | | |
Class ADV | | | (10,253 | ) | | | (592 | ) | | | (4,703 | ) | | | (1,025 | ) |
Class I | | | (11,412,515 | ) | | | (1,417,233 | ) | |
| (1,144,504
| )
| | | (1,581,897 | ) |
Class S | | | (278,152 | ) | | | (267,329 | ) | | | (575,955 | ) | | | (2,140,124 | ) |
Net realized gains: | | | | | | | | | | | | | | | | |
Class ADV | | | — | | | | — | | | | — | | | | (238 | ) |
Class I | | | — | | | | — | | | | — | | | | (175,555 | ) |
Class S | | | — | | | | — | | | | — | | | | (301,607 | ) |
Return of capital: | | | | | | | | | | | | | | | | |
Class ADV | | | — | | | | (81 | ) | | | (606 | ) | | | — | |
Class I | | | — | | | | (154,707 | ) | | | (138,724 | ) | | | — | |
Class S | | | — | | | | (31,322 | ) | | | (77,527 | ) | | | — | |
| | | | | | | | | | | | | | | | |
Total distributions | | | (11,700,920 | ) | | | (1,871,264 | ) | | | (1,942,019 | ) | | | (4,200,446 | ) |
| | | | | | | | | | | | | | | | |
FROM CAPITAL SHARE TRANSACTIONS: | | | | | | | | | | | | | | | | |
Net proceeds from sale of shares | | | 1,509,643,001 | | | | 277,919,046 | | | | 352,853,424 | | | | 368,680,313 | |
Reinvestment of distributions | | | 11,700,920 | | | | 1,871,264 | | | | 1,942,019 | | | | 3,769,800 | |
| | | | | | | | | | | | | | | | |
| | | 1,521,343,921 | | | | 279,790,310 | | | | 354,795,443 | | | | 372,450,113 | |
Cost of shares redeemed | | | (115,073,059 | ) | | | (58,707,851 | ) | | | (71,680,086 | ) | | | (88,279,536 | ) |
| | | | | | | | | | | | | | | | |
Net increase in net assets resulting from capital share transactions | | | 1,406,270,862 | | | | 221,082,459 | | | | 283,115,357 | | | | 284,170,577 | |
| | | | | | | | | | | | | | | | |
Net increase in net assets | | | 1,087,638,890 | | | | 142,888,713 | | | | 208,039,824 | | | | 288,041,519 | |
| | | | | | | | | | | | | | | | |
NET ASSETS: | | | | | | | | | | | | | | | | |
Beginning of period | | | — | | | | — | | | | — | | | | — | |
| | | | | | | | | | | | | | | | |
End of period | | $ | 1,087,638,890 | | | $ | 142,888,713 | | | $ | 208,039,824 | | | $ | 288,041,519 | |
| | | | | | | | | | | | | | | | |
Undistributed net investment income at end of period | | $ | 158,673 | | | $ | — | | | $ | 94,360 | | | $ | 78,081 | |
| | | | | | | | | | | | | | | | |
(1) | | Commencement of operations |
See Accompanying Notes to Financial Statements
27
STATEMENTS OF CHANGES IN NET ASSETS
| | | | | | | | | | | | |
| | | ING
International
Index Portfolio | | | ING
RussellTM Global Large Cap
Index 85% Portfolio | | | ING
WisdomTreeSM Global High-Yielding Equity Index
Portfolio | |
| | | March 10, 2008(1)
to December 31, 2008 | | | September 17, 2008(1)
to December 31, 2008 | | | January 28, 2008(1)
to December 31, 2008 | |
FROM OPERATIONS: | | | | | | | | | | | | |
Net investment income | | $ | 4,473,411 | | | $ | 301,476 | | | $ | 5,000,691 | |
Net realized loss on investments, foreign currency related transactions, and futures | | | (7,659,203 | ) | | | (486,608 | ) | | | (14,314,550 | ) |
Net change in unrealized appreciation or depreciation on investments, foreign currency related transactions, and futures | | | (138,405,038 | ) | | | (8,749,834 | ) | | | (70,018,351 | ) |
| | | | | | | | | | | | |
Decrease in net assets resulting from operations | | | (141,590,830 | ) | | | (8,934,966 | ) | | | (79,332,210 | ) |
| | | | | | | | | | | | |
FROM DISTRIBUTIONS TO SHAREHOLDERS: | | | | | | | | | | | | |
Net investment income: | | | | | | | | | | | | |
Class ADV | | | (25 | ) | | | (26 | ) | | | (17 | ) |
Class I | | | (4,138,013 | ) | | | (29 | ) | | | — | |
Class S | | | (113,042 | ) | | | (478,786 | ) | | | (4,806,407 | ) |
| | | | | | | | | | | | |
Total distributions | | | (4,251,080 | ) | | | (478,841 | ) | | | (4,806,424 | ) |
| | | | | | | | | | | | |
FROM CAPITAL SHARE TRANSACTIONS: | | | | | | | | | | | | |
Net proceeds from sale of shares | | | 429,531,847 | | | | 54,016,909 | | | | 252,565,746 | |
Reinvestment of distributions | | | 4,251,055 | | | | 41,786 | | | | 4,806,407 | |
| | | | | | | | | | | | |
| | | 433,782,902 | | | | 54,058,695 | | | | 257,372,153 | |
Cost of shares redeemed | | | (43,179,697 | ) | | | (1,438,619 | ) | | | (24,487,493 | ) |
| | | | | | | | | | | | |
Net increase in net assets resulting from capital share transactions | | | 390,603,205 | | | | 52,620,076 | | | | 232,884,660 | |
| | | | | | | | | | | | |
Net increase in net assets | | | 244,761,295 | | | | 43,206,269 | | | | 148,746,026 | |
| | | | | | | | | | | | |
NET ASSETS: | | | | | | | | | | | | |
Beginning of period | | | — | | | | — | | | | — | |
| | | | | | | | | | | | |
End of period | | $ | 244,761,295 | | | $ | 43,206,269 | | | $ | 148,746,026 | |
| | | | | | | | | | | | |
Undistributed net investment income at end of period | | $ | 3,389 | | | $ | 351 | | | $ | — | |
| | | | | | | | | | | | |
(1) | | Commencement of operations |
See Accompanying Notes to Financial Statements
28
FINANCIAL HIGHLIGHTS
Selected data for a share of beneficial interest outstanding throughout each year or period.
| | | | | | | | | | | | | | | | | | | | | | | | | | | | | | | | | | | | |
| | | | | Income (loss)
from
investment
operations | | | | | | Less distributions | | | | | | | | | Ratios to average net assets | | Supplemental
data |
| | | | | | | | | | | | | | | | | | | | | | | | | | | | | | | | | | | | |
| | | Net asset value, beginning of year or period | | Net investment income (loss) | | | Net realized and unrealized gain (loss) | | | Total from investment operations | | | From net investment income | | From net realized gains | | From return of capital | | Total distributions | | Net asset value, end of year or period | | Total return(1) | | | Expenses before reductions(2)(3) | | Expenses net of fee waivers, if any(2)(3) | | Expenses net of all reductions(2)(3) | | Net investment income (loss)(2)(3) | | Net assets, end of year or period | | Portfolio turnover rate |
| | | | | | | | | | | | | | | | | | | | | | | | | | | | | | | | | | | | |
Year or period ended | | ($) | | ($) | | | ($) | | | ($) | | | ($) | | ($) | | ($) | | ($) | | ($) | | (%) | | | (%) | | (%) | | (%) | | (%) | | ($000's) | | (%) |
ING Russell™ Large Cap Portfolio | | | | | | | | | | | | | | | | | | | | | | | | | | | | | | | | | | | | |
Class ADV | | | | | | | | | | | | | | | | | | | | | | | | | | | | | | | | | | | | |
03-10-08(4) - 12-31-08 | | 10.00 | | 0.13 | · | | (2.87 | ) | | (2.74 | ) | | 0.07 | | — | | — | | 0.07 | | 7.19 | | (27.42 | ) | | 0.89+ | | 0.87+ | | 0.87+ | | 1.98+ | | 1,135 | | 8 |
Class I | | | | | | | | | | | | | | | | | | | | | | | | | | | | | | | | | | | | |
03-10-08(4) - 12-31-08 | | 10.00 | | 0.17 | · | | (2.88 | ) | | (2.71 | ) | | 0.08 | | — | | — | | 0.08 | | 7.21 | | (27.06 | ) | | 0.39+ | | 0.37+ | | 0.37+ | | 2.31+ | | 1,057,974 | | 8 |
Class S | | | | | | | | | | | | | | | | | | | | | | | | | | | | | | | | | | | | |
03-10-08(4) - 12-31-08 | | 10.00 | | 0.14 | · | | (2.87 | ) | | (2.73 | ) | | 0.07 | | — | | — | | 0.07 | | 7.20 | | (27.23 | ) | | 0.64+ | | 0.62+ | | 0.62+ | | 2.19+ | | 28,529 | | 8 |
| | | | | | | | | | | | | | | | |
ING Russell™ Mid Cap Portfolio | | | | | | | | | | | | | | | | | | | | | | | | | | | | | | | | | | | | |
Class ADV | | | | | | | | | | | | | | | | | | | | | | | | | | | | | | | | | | | | |
03-10-08(4) - 12-31-08 | | 10.00 | | 0.08 | · | | (3.37 | ) | | (3.29 | ) | | 0.07 | | — | | 0.01 | | 0.08 | | 6.63 | | (32.92 | ) | | 1.24+ | | 1.15+ | | 1.15+ | | 1.23+ | | 61 | | 30 |
Class I | | | | | | | | | | | | | | | | | | | | | | | | | | | | | | | | | | | | |
03-10-08(4) - 12-31-08 | | 10.00 | | 0.13 | · | | (3.41 | ) | | (3.28 | ) | | 0.08 | | — | | 0.01 | | 0.09 | | 6.63 | | (32.74 | ) | | 0.51+ | | 0.43+ | | 0.43+ | | 1.74+ | | 117,525 | | 30 |
Class S | | | | | | | | | | | | | | | | | | | | | | | | | | | | | | | | | | | | |
03-10-08(4) - 12-31-08 | | 10.00 | | 0.12 | · | | (3.41 | ) | | (3.29 | ) | | 0.08 | | — | | 0.01 | | 0.09 | | 6.62 | | (32.90 | ) | | 0.76+ | | 0.68+ | | 0.68+ | | 1.85+ | | 25,303 | | 30 |
| | | | | | | | | | | | | | | | |
ING Russell™ Small Cap Portfolio | | | | | | | | | | | | | | | | | | | | | | | | | | | | | | | | | | | | |
Class ADV | | | | | | | | | | | | | | | | | | | | | | | | | | | | | | | | | | | | |
03-10-08(4) - 12-31-08 | | 10.00 | | 0.11 | · | | (2.32 | ) | | (2.21 | ) | | 0.06 | | — | | 0.01 | | 0.07 | | 7.72 | | (22.02 | ) | | 1.27+ | | 1.17+ | | 1.17+ | | 1.74+ | | 571 | | 35 |
Class I | | | | | | | | | | | | | | | | | | | | | | | | | | | | | | | | | | | | |
03-10-08(4) - 12-31-08 | | 10.00 | | 0.12 | · | | (2.29 | ) | | (2.17 | ) | | 0.07 | | — | | 0.01 | | 0.08 | | 7.75 | | (21.68 | ) | | 0.53+ | | 0.45+ | | 0.45+ | | 1.49+ | | 132,762 | | 35 |
Class S | | | | | | | | | | | | | | | | | | | | | | | | | | | | | | | | | | | | |
03-10-08(4) - 12-31-08 | | 10.00 | | 0.12 | · | | (2.32 | ) | | (2.20 | ) | | 0.06 | | — | | 0.01 | | 0.07 | | 7.73 | | (21.95 | ) | | 0.78+ | | 0.70+ | | 0.70+ | | 1.71+ | | 74,707 | | 35 |
| | | | | | | | | | | | | | | | |
ING Lehman Brothers U.S. Aggregate Bond Index® Portfolio | | | | | | | | | | | | | | | | | | | | | | | | | | | | | | | | | | | | |
Class ADV | | | | | | | | | | | | | | | | | | | | | | | | | | | | | | | | | | | | |
03-10-08(4) - 12-31-08 | | 10.00 | | 0.25 | | | 0.07 | | | 0.32 | | | 0.18 | | 0.02 | | — | | 0.20 | | 10.12 | | 3.26 | | | 1.01+ | | 0.95+ | | 0.95+ | | 2.95+ | | 143 | | 360 |
Class I | | | | | | | | | | | | | | | | | | | | | | | | | | | | | | | | | | | | |
03-07-08(4) - 12-31-08 | | 10.00 | | 0.28 | · | | 0.08 | | | 0.36 | | | 0.22 | | 0.02 | | — | | 0.24 | | 10.12 | | 3.61 | | | 0.51+ | | 0.45+ | | 0.45+ | | 3.42+ | | 107,276 | | 360 |
Class S | | | | | | | | | | | | | | | | | | | | | | | | | | | | | | | | | | | | |
03-10-08(4) - 12-31-08 | | 10.00 | | 0.27 | · | | 0.06 | | | 0.33 | | | 0.21 | | 0.02 | | — | | 0.23 | | 10.10 | | 3.29 | | | 0.76+ | | 0.70+ | | 0.70+ | | 3.42+ | | 180,622 | | 360 |
ING International Index Portfolio | | | | | | | | | | | | | | | | | | | | | | | | | | | | | | | | | | | | |
Class ADV | | | | | | | | | | | | | | | | | | | | | | | | | | | | | | | | | | | | |
03-10-08(4) - 12-31-08 | | 10.00 | | 0.20 | · | | (3.69 | ) | | (3.49 | ) | | 0.08 | | — | | — | | 0.08 | | 6.43 | | (34.85 | ) | | 1.17+ | | 1.00+ | | 1.00+ | | 2.87+ | | 2 | | 22 |
Class I | | | | | | | | | | | | | | | | | | | | | | | | | | | | | | | | | | | | |
03-10-08(4) - 12-31-08 | | 10.00 | | 0.17 | · | | (3.65 | ) | | (3.48 | ) | | 0.11 | | — | | — | | 0.11 | | 6.41 | | (34.73 | ) | | 0.67+ | | 0.50+ | | 0.50+ | | 2.56+ | | 237,777 | | 22 |
Class S | | | | | | | | | | | | | | | | | | | | | | | | | | | | | | | | | | | | |
03-10-08(4) - 12-31-08 | | 10.00 | | 0.12 | · | | (3.60 | ) | | (3.48 | ) | | 0.11 | | — | | — | | 0.11 | | 6.41 | | (34.79 | ) | | 0.92+ | | 0.75+ | | 0.75+ | | 1.93+ | | 6,983 | | 22 |
See Accompanying Notes to Financial Statements
29
FINANCIAL HIGHLIGHTS (CONTINUED)
| | | | | | | | | | | | | | | | | | | | | | | | | | | | | | | | | | | | | |
| | | | | Income (loss)
from
investment
operations | | | | | | Less distributions | | | | | | | | | Ratios to average net assets | | Supplemental
data |
| | | | | | | | | | | | | | | | | | | | | | | | | | | | | | | | | | | | | |
| | | Net asset value, beginning of year or period | | Net investment income (loss) | | | Net realized and unrealized gain (loss) | | | Total from investment operations | | | From net investment income | | From net realized gains | | From return of capital | | Total distributions | | Net asset value, end of year or period | | Total return(1) | | | Expenses before reductions(2)(3) | | Expenses net of fee waivers, if any(2)(3) | | Expenses net of all reductions(2)(3) | | Net investment income (loss)(2)(3) | | Net assets, end of year or period | | | Portfolio turnover rate |
| | | | | | | | | | | | | | | | | | | | | | | | | | | | | | | | | | | | | |
Year or period ended | | ($) | | ($) | | | ($) | | | ($) | | | ($) | | ($) | | ($) | | ($) | | ($) | | (%) | | | (%) | | (%) | | (%) | | (%) | | ($000's) | | | (%) |
ING Russell Global Large Cap Index 85% Portfolio | | | | | | | | | | | | | | | | | | | | | | | | | | | | | | | | | | | | | |
Class ADV | | | | | | | | | | | | | | | | | | | | | | | | | | | | | | | | | | | | | |
09-17-08(4) - 12-31-08 | | 10.00 | | 0.05 | | | (1.89 | ) | | (1.84 | ) | | 0.09 | | — | | — | | 0.09 | | 8.07 | | (18.43 | ) | | 2.19 | | 1.10 | | 1.10 | | 2.12 | | 2 | | | 12 |
Class I | | | | | | | | | | | | | | | | | | | | | | | | | | | | | | | | | | | | | |
09-17-08(4) - 12-31-08 | | 10.00 | | 0.06 | | | (1.88 | ) | | (1.82 | ) | | 0.10 | | — | | — | | 0.10 | | 8.08 | | (18.22 | ) | | 1.69 | | 0.60 | | 0.60 | | 2.61 | | 2 | | | 12 |
Class S | | | | | | | | | | | | | | | | | | | | | | | | | | | | | | | | | | | | | |
09-17-08(4) - 12-31-08 | | 10.00 | | 0.06 | | | (1.88 | ) | | (1.82 | ) | | 0.09 | | — | | — | | 0.09 | | 8.09 | | (18.18 | ) | | 1.94 | | 0.85 | | 0.85 | | 2.45 | | 43,201 | | | 12 |
| | | | | | | | | | | | | | | | |
ING WisdomTreeSM Global High-Yielding Equity Index Portfolio | | | | | | | | | | | | | | | | | | | | | | | | | | | | | | | | | | | | | |
Class ADV | | | | | | | | | | | | | | | | | | | | | | | | | | | | | | | | | | | | | |
01-28-08(4) - 12-31-08 | | 10.00 | | 0.34 | · | | (4.18 | ) | | (3.84 | ) | | 0.17 | | — | | — | | 0.17 | | 5.99 | | (38.33 | ) | | 1.66+ | | 1.20+ | | 1.20+ | | 4.28+ | | 1 | | | 128 |
Class I | | | | | | | | | | | | | | | | | | | | | | | | | | | | | | | | | | | | | |
01-28-08(4) - 12-31-08 | | 10.00 | | 0.41 | · | | (4.23 | ) | | (3.82 | ) | | 0.21 | | — | | — | | 0.21 | | 5.97 | | (38.10 | ) | | 1.16+ | | 0.70+ | | 0.70+ | | 4.92+ | | — | * | | 128 |
Class S | | | | | | | | | | | | | | | | | | | | | | | | | | | | | | | | | | | | | |
01-28-08(4) - 12-31-08 | | 10.00 | | 0.31 | · | | (4.13 | ) | | (3.82 | ) | | 0.20 | | — | | — | | 0.20 | | 5.98 | | (38.10 | ) | | 1.41+ | | 0.89+ | | 0.89+ | | 4.23+ | | 148,745 | | | 128 |
(1) | | Total return is calculated assuming reinvestment of all dividends and capital gain distributions at net asset value and does not reflect the effect of insurance contract charges. Total return for periods less than one year is not annualized. |
(2) | | Annualized for periods less than one year. |
(3) | | Expense ratios reflect operating expenses of a Portfolio. Expenses before reductions do not reflect amounts reimbursed by the Investment Adviser and/or Distributor or reductions from brokerage commission recapture arrangements or other expense offset arrangements and do not represent the amount paid by a Portfolio during periods when reimbursements or reductions occur. Expenses net of fee waivers reflect expenses after reimbursement by the Investment Adviser and/or Distributor but prior to reductions from brokerage commission recapture arrangements or other expense offset arrangements. Expenses net of all reductions represent the net expenses paid by a Portfolio. Net investment income (loss) is net of all such additions or reductions. |
(4) | | Commencement of operations. |
| · | | Calculated using average number of shares outstanding throughout the period. |
| + | | Impact of waiving the advisory fee for the ING Institutional Prime Money Market Fund holding has less than 0.005% impact on the expense ratios and net investment income or loss ratio. |
| * | | Amount is less than $500. |
See Accompanying Notes to Financial Statements
30
NOTES TO FINANCIAL STATEMENTSASOF DECEMBER 31, 2008
NOTE 1 — ORGANIZATION
Organization. ING Variable Portfolios, Inc. (the “Company” or “Registrant”) is registered under the Investment Company Act of 1940, as amended (“1940 Act” or “Act”) as an open-end diversified management investment company.
The Company was incorporated under the laws of Maryland on June 4, 1996. There are fifteen active separate investment series that comprise the Company. The seven portfolios (each a “Portfolio”, collectively the “Portfolios”) that are in this report are:
ING RussellTM Large Cap Index Portfolio (“RussellTM Large Cap Index”), ING RussellTM Mid Cap Index Portfolio (“RussellTM Mid Cap Index”), ING RussellTM Small Cap Index Portfolio (“RussellTM Small Cap Index”), ING Lehman Brothers U.S. Aggregate Bond Index® Portfolio (“LBAB Index”), ING International Index Portfolio (“International Index”), ING Russell Global Large Cap Index 85% Portfolio (“Russell Global Large Cap Index 85%”), and ING WisdomTreeSM Global High-Yielding Equity Index Portfolio (“WisdomTreeSM Index”).
The following is a brief description of each Portfolio’s investment objective:
• | | RussellTM Large Cap Index seeks investment results (before fees and expenses) that correspond to the total return of the Russell Top 200® Index; |
• | | RussellTM Mid Cap Index seeks investment results (before fees and expenses) that correspond to the total return of the Russell Midcap® Index; |
• | | RussellTM Small Cap Index seeks investment results (before fees and expenses) that correspond to the total return of the Russell 2000® Index; |
| • | | LBAB Index seeks investment results (before fees and expenses) that correspond to the total return of the Barclays Capital U.S. Aggregate Bond Index; |
| • | | International Index seeks investment results (before fees and expenses) that correspond to the total return of a widely accepted international index; |
| • | | Russell Global Large Cap Index 85% seeks to maximize total return, consisting of capital appreciation and current income, over the long term by allocating its assets among stock, bonds, short-term instruments and other investments; and |
• | | WisdomTreeSM Index seeks investment returns that closely correspond to the price and yield performance, before fees and expenses, of the WisdomTreeSM Global High-Yielding Equity Index. |
Each Portfolio offers Class I, Class S shares and Adviser (“ADV”) Class shares. The three classes differ principally in applicable distribution and service fees. Shareholders of each class also bear certain expenses that pertain to that particular class. All shareholders bear the common expenses of the Portfolios and earn income and realized gains/losses from the Portfolios pro rata based on the average daily net assets of each class, without discrimination between share classes. Common expenses of the Portfolios (including custodial asset-based fees, legal and audit fees, printing and mailing expenses, transfer agency out-of-pocket expenses, and fees and expenses of the independent trustees) are allocated to each Portfolio in proportion to its average net assets. Expenses directly attributable to a particular portfolio (including advisory, administration, custodial transaction-based, registration, other professional, distribution and/or service fees, certain taxes, and offering costs) are charged directly to that Portfolio. Differences in per share dividend rates generally result from differences in separate class expenses, including distribution and shareholder service fees, if applicable.
Shares of the Portfolios may be offered to separate accounts of insurance companies as investment options under variable annuity contracts and variable life insurance policies. Shares may also be offered to qualified pension and retirement plans outside the variable contract and to certain investment advisers and their affiliates. Class I shares may be made available to other investment companies, including series of the companies under fund-of-funds arrangements.
Participating insurance companies and other designated organizations are authorized to receive purchase orders on each Portfolio’s behalf.
ING Investments, LLC (“ING Investments” or the “Investment Adviser”), an Arizona limited liability company, serves as the investment adviser to the Portfolios. ING Investments has engaged ING Investment Management Co. (“ING IM”), a Connecticut corporation, to serve as the sub-adviser to each Portfolio, with the exception of LBAB Index. ING Funds Distributor, LLC (“IFD” or the “Distributor”) is the principal underwriter of the Portfolios. ING Investments, ING IM and the Distributor are indirect, wholly-owned subsidiaries of ING Groep N.V. (“ING Groep”). ING Groep is a global financial institution of Dutch origin offering banking, investments, life insurance and retirement services to over 75 million private, corporate and institutional clients in more than 50 countries. With a diverse workforce of about 125,000 people, ING Groep comprises a broad spectrum
31
NOTES TO FINANCIAL STATEMENTSASOF DECEMBER 31, 2008 (CONTINUED)
NOTE 1 — ORGANIZATION (continued)
of prominent companies that increasingly serve their clients under the ING brand.
On October 19, 2008, ING Groep announced that it reached an agreement with the Dutch government to strengthen its capital position, creating a strong buffer to navigate the current market and economic environment. ING Groep will issue non-voting core Tier-1 securities for a total consideration of EUR 10 billion to the Dutch State. The transaction boosts ING Bank’s core Tier-1 ratio, strengthens the insurance balance sheet and reduces ING Groep’s Debt/Equity ratio.
NOTE 2 — SIGNIFICANT ACCOUNTING POLICIES
The following significant accounting policies are consistently followed by the Portfolios in the preparation of their financial statements. Such policies are in conformity with U.S. generally accepted accounting principles for investment companies.
| A. | Security Valuation. Investments in equity securities traded on a national securities exchange are valued at the last reported sale price. Securities reported by NASDAQ are valued at the NASDAQ official closing prices. Securities traded on an exchange or NASDAQ for which there has been no sale and securities traded in the over-the-counter-market are valued at the mean between the last reported bid and ask prices. All investments quoted in foreign currencies will be valued daily in U.S. dollars on the basis of the foreign currency exchange rates prevailing at that time. Debt securities are valued at prices obtained from independent services or from one or more dealers making markets in the securities and may be adjusted based on the Portfolios’ valuation procedures. U.S. government obligations are valued by using market quotations or independent pricing services that use prices provided by market- makers or estimates of market values obtained from yield data relating to instruments or securities with similar characteristics. |
Securities and assets for which market quotations are not readily available (which may include certain restricted securities, which are subject to limitations as to their sale) are valued at their fair values, as defined by the 1940 Act, and as determined in good faith by or under the supervision of the Portfolios’ Board of Directors (“Board”), in accordance with methods that are
specifically authorized by the Board. Securities traded on exchanges, including foreign exchanges, which close earlier than the time that a Portfolio calculates its net asset value (“NAV”) may also be valued at their fair values, as defined by the 1940 Act, and as determined in good faith by or under the supervision of the Board, in accordance with methods that are specifically authorized by the Board. The valuation techniques applied in any specific instance are likely to vary from case to case. With respect to a restricted security, for example, consideration is generally given to the cost of the investment, the market value of any unrestricted securities of the same class at the time of valuation, the potential expiration of restrictions on the security, the existence of any registration rights, the costs to the Portfolios related to registration of the security, as well as factors relevant to the issuer itself. Consideration may also be given to the price and extent of any public trading in similar securities of the issuer or comparable companies’ securities. The value of a foreign security traded on an exchange outside the United States is generally based on its price on the principal foreign exchange where it trades as of the time a Portfolio determines its NAV or if the foreign exchange closes prior to the time a Portfolio determines its NAV, the most recent closing price of the foreign security on its principal exchange. Trading in certain non-U.S. securities may not take place on all days on which the New York Stock Exchange (“NYSE”) is open. Further, trading takes place in various foreign markets on days on which the NYSE is not open. Consequently, the calculation of a Portfolio’s NAV may not take place contemporaneously with the determination of the prices of securities held by a Portfolio in foreign securities markets. Further, the value of a Portfolio’s assets may be significantly affected by foreign trading on days when a shareholder cannot purchase or redeem shares of a Portfolio. In calculating a Portfolio’s NAV, foreign securities denominated in foreign currency are converted to U.S. dollar equivalents. If an event occurs after the time at which the market for foreign securities held by a Portfolio closes but before the time that a Portfolio’s NAV is calculated, such event may cause the closing price on the foreign exchange to not represent a readily available reliable market value quotation for such securities at the time a Portfolio determines its NAV. In such a case, a Portfolio will use the fair value of such securities as
32
NOTES TO FINANCIAL STATEMENTSASOF DECEMBER 31, 2008 (CONTINUED)
NOTE 2 — SIGNIFICANT ACCOUNTING POLICIES (continued)
determined under a Portfolio’s valuation procedures. Events after the close of trading on a foreign market that could require a Portfolio to fair value some or all of its foreign securities include, among others, securities trading in the U.S. and other markets, corporate announcements, natural and other disasters, and political and other events. Among other elements of analysis in the determination of a security’s fair value, the Board has authorized the use of one or more independent research services to assist with such determinations. An independent research service may use statistical analyses and quantitative models to help determine fair value as of the time a Portfolio calculates its NAV. There can be no assurance that such models accurately reflect the behavior of the applicable markets or the effect of the behavior of such markets on the fair value of securities, or that such markets will continue to behave in a fashion that is consistent with such models. Unlike the closing price of a security on an exchange, fair value determinations employ elements of judgment. Consequently, the fair value assigned to a security may not represent the actual value that a Portfolio could obtain if it were to sell
the security at the time of the close of the NYSE. Pursuant to procedures adopted by the Board, a Portfolio is not obligated to use the fair valuations suggested by any research service, and valuation recommendations provided by such research services may be overridden if other events have occurred or if other fair valuations are determined in good faith to be more accurate. Unless an event is such that it causes a Portfolio to determine that the closing prices for one or more securities do not represent readily available reliable market value quotations at the time a Portfolio determines its NAV, events that occur between the time of the close of the foreign market on which they are traded and the close of regular trading on the NYSE will not be reflected in a Portfolio’s NAV. Investments in securities maturing in 60 days or less from date of acquisition are valued at amortized cost which approximates market value.
Effective for fiscal years beginning after November 15, 2007, Financial Accounting Standards Board (“FASB”) Statement of Financial Accounting Standards No. 157, “Fair Value Measurements”, establishes a hierarchy for
measuring fair value of assets and liabilities. As required by the standard, each investment asset or liability of the Portfolios is assigned a level at measurement date based on the significance and source of the inputs to its valuation. Quoted prices in active markets for identical securities are classified as “Level 1”, inputs other than quoted prices for an asset that are observable are classified as “Level 2” and unobservable inputs, including the sub-adviser’s judgment about the assumptions that a market participant would use in pricing an asset or liability are classified as “Level 3”. The inputs used for valuing securities are not necessarily an indication of the risks associated with investing in those securities. A table summarizing the Portfolios’ investments under these levels of classification is included following the Portfolios of Investments.
Effective for fiscal years and interim periods ending after November 15, 2008, the FASB issued FASB Staff Position (“FSP”) No. FAS 133-1 and FASB Interpretation Number (“FIN”) 45-4, “Disclosures about Credit Derivatives and Certain Guarantees: An Amendment of FASB Statement No. 133 and FASB Interpretation No. 45; and Clarification of the Effective Date of FASB Statement No. 161.” The amendments to FAS 133 require enhanced disclosure regarding credit derivatives sold, including (1) the nature and terms of the credit derivative, reasons for entering into the credit derivative, the events or circumstances that would require the seller to perform under the credit derivative, and the current status of the payment/performance risk of the credit derivative, (2) the maximum potential amount of future payments (undiscounted) the seller could be required to make under the credit derivative, (3) the fair value of the credit derivative, and (4) the nature of any recourse provisions and assets held either as collateral or by third parties. The amendments to FIN 45 require additional disclosures about the current status of the payment/performance risk of a guarantee. All changes to accounting policies have been made in accordance with the FSP and incorporated for the current period as part of the Notes to Financial Statements and Portfolios of Investments.
| B. | Security Transactions and Revenue Recognition. Securities transactions are accounted for on the trade date. Realized gains and losses are reported on the basis of identified cost of securities sold. |
33
NOTES TO FINANCIAL STATEMENTSASOF DECEMBER 31, 2008 (CONTINUED)
NOTE 2 — SIGNIFICANT ACCOUNTING POLICIES (continued)
| | Interest income is recorded on an accrual basis. Dividend income is recorded on the ex-dividend date, or for certain foreign securities, when the information becomes available to the Portfolios. Premium amortization and discount accretion are determined by the effective yield method. |
| C. | Foreign Currency Translation. The books and records of the Portfolios are maintained in U.S. dollars. Any foreign currency amounts are translated into U.S. dollars on the following basis: |
| | (1) | Market value of investment securities, other assets and liabilities — at the exchange rates prevailing at the end of the day. |
| | (2) | Purchases and sales of investment securities, income and expenses — at the rates of exchange prevailing on the respective dates of such transactions. |
Although the net assets and the market values are presented at the foreign exchange rates at the end of the day, the Portfolios do not isolate the portion of the results of operations resulting from changes in foreign exchange rates on investments from the fluctuations arising from changes in market prices of securities held. Such fluctuations are included with the net realized and unrealized gains or losses from investments. For securities, which are subject to foreign withholding tax upon disposition, liabilities are recorded on the Statements of Assets and Liabilities for the estimated tax withholding based on the securities’ current market value. Upon disposition, realized gains or losses on such securities are recorded net of foreign withholding tax.
Reported net realized foreign exchange gains or losses arise from sales of foreign currencies, currency gains or losses realized between the trade and settlement dates on securities transactions, the difference between the amounts of dividends, interest, and foreign withholding taxes recorded on a Portfolio’s books, and the U.S. dollar equivalent of the amounts actually received or paid. Net unrealized foreign exchange gains and losses arise from changes in the value of assets and liabilities other than investments in securities at fiscal year end, resulting from changes in the exchange rate. Foreign security and currency transactions may involve certain considerations and
risks not typically associated with investing in U.S. companies and U.S. government securities. These risks include, but are not limited to, revaluation of currencies and future adverse political and economic developments, which could cause securities and their markets to be less liquid and prices more volatile than those of comparable U.S. companies and U.S. government securities.
| D. | Forward Foreign Currency Transactions and Futures Contracts. Each Portfolio may enter into foreign currency exchange transactions to convert to and from different foreign currencies and to and from the U.S. dollar in connection with the planned purchases or sales of securities. When entering into a forward foreign currency contract, a Portfolio agrees to receive or deliver a fixed quantity of foreign currency for an agreed-upon price on an agreed future date. A Portfolio either enters into these transactions on a spot basis at the spot rate prevailing in the foreign currency exchange market or uses forward foreign currency contracts to purchase or sell foreign currencies. When the contract is fulfilled or closed, gains or losses are realized. Until then, the gain or loss is included in unrealized appreciation or depreciation. Risks may arise upon entering into forward contracts from the potential inability of counterparties to meet the terms of their forward contracts and from unanticipated movements in the value of foreign currencies relative to the U.S. dollar. |
Each Portfolio may enter into futures contracts involving foreign currency, interest rates, securities and securities indices. A futures contract obligates the seller of the contract to deliver and the purchaser of the contract to take delivery of the type of foreign currency, financial instrument or security called for in the contract at a specified future time for a specified price. Upon entering into such a contract, a Portfolio is required to deposit and maintain as collateral such initial margin as required by the exchange on which the contract is traded. Pursuant to the contract, a Portfolio agrees to receive from or pay to the broker an amount equal to the daily fluctuations in the value of the contract. Such receipts or payments are known as variation margins and are recorded as unrealized gains or losses by a Portfolio. When the contract is closed, a Portfolio records a realized gain or loss equal to the difference between the value of the contract at the time it was opened and the value at the time it was closed.
34
NOTES TO FINANCIAL STATEMENTSASOF DECEMBER 31, 2008 (CONTINUED)
NOTE 2 — SIGNIFICANT ACCOUNTING POLICIES (continued)
E. | Distributions to Shareholders. The Portfolios record distributions to their shareholders on the ex-dividend date. International Index, LBAB Index, Russell™ Large Cap Index, Russell™ Mid Cap Index, Russell™ Small Cap Index and WisdomTreeSM Index declare and pay dividends semi-annually. Russell Global Large Cap Index 85% declare and pay dividends annually. The Portfolios may make distributions on a more frequent basis to comply with the distribution requirements of the Internal Revenue Code. The characteristics of income and gains to be distributed are determined in accordance with income tax regulations, which may differ from U.S. generally accepted accounting principles for investment companies. |
| F. | Federal Income Taxes. It is the policy of the Portfolios to comply with subchapter M of the Internal Revenue Code and related excise tax provisions applicable to regulated investment companies and to distribute substantially all of their net investment income and any net realized capital gains to their shareholders. Therefore, no federal income tax provision is required. Management has considered the sustainability of the Portfolios’ tax position taken on federal income tax returns for all open tax years in making this determination. No capital gain distributions shall be made until any capital loss carryforwards have been fully utilized or expired. |
| G. | Use of Estimates. The preparation of financial statements in conformity with U.S. generally accepted accounting principles requires management to make estimates and assumptions that affect the reported amounts of assets and liabilities and disclosure of contingent assets and liabilities at the date of the financial statements and the reported amounts of increases and decreases in net assets from operations during the reporting period. Actual results could differ from those estimates. |
| H. | Repurchase Agreements. Each Portfolio may invest in repurchase agreements only with government securities dealers recognized by the Board of Governors of the Federal Reserve System. Under such agreements, the seller of the security agrees to repurchase it at a mutually agreed upon time and price. The resale price is in excess of the purchase price and reflects an agreed upon interest rate for |
| | the period of time the agreement is outstanding. The period of the repurchase agreements is usually short, from overnight to one week, while the underlying securities generally have longer maturities. Each Portfolio will receive as collateral securities acceptable to it whose market value is equal to at least 100% of the carrying amount of the repurchase agreements, plus accrued interest, being invested by the Portfolio. The underlying collateral is valued daily on a mark-to-market basis to assure that the value, including accrued interest is at least equal to the repurchase price. There would be potential loss to the Portfolio in the event the Portfolio is delayed or prevented from exercising its right to dispose of the collateral, and it might incur disposition costs in liquidating the collateral. |
| I. | Securities Lending. Each Portfolio has the option to temporarily loan up to 30% of its total assets to brokers, dealers or other financial institutions in exchange for a negotiated lender’s fee. The borrower is required to fully collateralize the loans with cash or U.S. government securities. Generally, in the event of counterparty default, a Portfolio has the right to use collateral to offset losses incurred. There would be potential loss to a Portfolio in the event a Portfolio is delayed or prevented from exercising its right to dispose of the collateral. A Portfolio bears the risk of loss with respect to the investment of collateral. Engaging in securities lending could have a leveraging effect, which may intensify the credit, market and other risks associated with investing in a Portfolio. |
| J. | Illiquid and Restricted Securities. The Portfolios may not invest more than 15% of their net assets in illiquid securities. Illiquid securities are not readily marketable. Disposing of illiquid investments may involve time-consuming negotiation and legal expenses, and it may be difficult or impossible for the Portfolios to sell them promptly at an acceptable price. The Portfolios may also invest in restricted securities, which include those sold under Rule 144A of the Securities Act of 1933 (“1933 Act”) or securities offered pursuant to Section 4(2) of the 1933 Act, and/or are subject to legal or contractual restrictions on resale and may not be publicly sold without registration under the 1933 Act. Certain restricted securities may be considered liquid pursuant to guidelines approved by the Board or may be deemed to be illiquid because they may not be readily marketable. Illiquid and restricted |
35
NOTES TO FINANCIAL STATEMENTSASOF DECEMBER 31, 2008 (CONTINUED)
NOTE 2 — SIGNIFICANT ACCOUNTING POLICIES (continued)
| | securities are valued using market quotations when readily available. In the absence of market quotations, the securities are valued based upon their fair value, as defined by the Act, determined under procedures approved by the Board. |
| K. | When-Issued and Delayed-Delivery Transactions. Each Portfolio may purchase or sell securities on a when-issued or forward commitment basis. The price of the underlying securities and date when the securities will be delivered and paid for are fixed at the time the transaction is negotiated. The market value of such is identified in a Portfolio of Investments. Losses may arise due to changes in the market value of the securities or from the inability of counterparties to meet the terms of the contract. In connection with such purchases, the Portfolios are required to hold liquid assets as collateral with the Portfolios’ custodian sufficient to cover the purchase price. |
| L. | Options Contracts. The Portfolios may purchase put and call options and may write (sell) put options and covered call options. The Portfolios may engage in option transactions as a hedge against adverse movements in the value of portfolio holdings or to increase market exposure. Option contracts are valued daily and unrealized gains or losses are recorded based upon the last sales price on the principal exchange on which the options are traded. An amount equal to the premium received by the Portfolios upon the writing of a put or call option is included in the Statements of Assets and Liabilities as a liability which is subsequently marked-to-market until it is exercised or closed, or it expires. The Portfolios will realize a gain or loss upon the expiration or closing of the option contract. When an option is exercised, the proceeds on sales of the underlying security for a written call option, the purchase cost of the security for a written put option, or the cost of the security for a purchased put or call option is adjusted by the amount of premium received or paid. Realized and unrealized gains or losses on option contracts are reflected in the accompanying financial statements. The risk in writing a covered call option is that the Portfolios give up the opportunity for profit if the market price of the security increases and the option is exercised. The risk in writing a put option is that the Portfolios may incur a loss if the market price of the security |
| | decreases and the option is exercised. The risk in buying an option is that the Portfolios pay a premium whether or not the option is exercised. Risks may also arise from an illiquid secondary market or from the inability of counterparties to meet the terms of the contract. |
| M. | Swap Agreements. Certain Portfolios may enter into swap agreements. A swap is an agreement between two parties pursuant to which each party agrees to make one or more payments to the other at specified future intervals based on the return of an asset (such as a stock, bond or currency) or non-asset reference (such as an interest rate or index). The swap agreement will specify the “notional” amount of the asset or non-asset reference to which the contract relates. Subsequent changes in market value, if any, are calculated based upon changes in the performance of the asset or non-asset reference multiplied by the notional value of the contract. A Portfolio may enter into credit default, interest rate, total return and currency swaps to manage its exposure to credit, currency and interest rate risk. All outstanding swap agreements are reported following each Portfolio’s Portfolio of Investments. |
Swaps are marked to market daily using quotations primarily from third party pricing services, counterparties or brokers. The value of the swap contract is recorded on each Portfolio’s Statements of Assets or Liabilities. During the term of the swap, changes in the value of the swap, if any, are recorded as unrealized gains or losses on the Statements of Operations. Upfront payments paid or received by a Portfolio when entering into the agreements are reported on the Statements of Assets and Liabilities and as a component of the changes in unrealized gains or losses on the Statements of Operations. These upfront payments represent the amounts paid or received when initially entering into the swap agreement to compensate for differences between the stated terms of the swap agreement and the prevailing market conditions. The upfront payments are included as a component in the realized gains or losses on each Portfolio’s Statement of Operations upon termination or maturity of the swap. A Portfolio also records net periodic payments paid or received on the swap contract as a realized gain or loss on the Statements of Operations.
Entering into swap agreements involves the risk that the maximum potential loss of an investment
36
NOTES TO FINANCIAL STATEMENTSASOF DECEMBER 31, 2008 (CONTINUED)
NOTE 2 — SIGNIFICANT ACCOUNTING POLICIES (continued)
exceeds the current value of the investment as reported on each Portfolio’s Statements of Assets and Liabilities. Other risks involve the possibility that the counterparty to the agreements may default on its obligation to perform, that there will be no liquid market for these investments and that unfavorable changes in the market will have a negative impact on the value of the index or securities underlying the respective swap agreement.
Credit Default Swap Contracts—A credit default swap is a bilateral agreement between counterparties in which the buyer of the protection agrees to make a stream of periodic payments to the seller of protection in exchange for the right to receive a specified return in the event of a default or other credit event for a referenced entity, obligation or index. As a seller of protection on credit default swaps, a Portfolio will generally receive from the buyer a fixed payment stream based on the notional amount of the swap contract. This fixed payment stream will continue until the swap contract expires or a defined credit event occurs.
A Portfolio is subject to credit risk in the normal course of pursuing its investment objectives. As a seller of protection in a credit default swap, a Portfolio may execute these contracts to manage its exposure to the market or certain sectors of the market. Certain Portfolios may also enter into credit default swaps to speculate on changes in an issuer’s credit quality, to take advantage of perceived spread advantages, or to offset an existing short equivalent (i.e. buying protection on an equivalent reference entity).
Certain Portfolios may sell credit default swaps which expose these Portfolios to the risk of loss from credit risk- related events specified in the contract. Although contract specific, credit events are generally defined as bankruptcy, failure to pay, restructuring, obligation acceleration, obligation default or repudiation/moratorium. If a Portfolio is a seller of protection, and a credit event occurs, as defined under the terms of that particular swap agreement, a Portfolio will generally either (i) pay to the buyer an amount equal to the notional amount of the swap and take delivery of the referenced obligation, other deliverable
obligations, or underlying securities comprising a referenced index or (ii) pay a net settlement amount in the form of cash or securities equal to the notional amount of the swap less the recovery value of the referenced obligation or underlying securities comprising a referenced index. If a Portfolio is a buyer of protection and a credit event occurs, as defined under the terms of that particular swap agreement, a Portfolio will either (i) receive from the seller of protection an amount equal to the notional amount of the swap and deliver the referenced obligation, other deliverable obligations or underlying securities comprising the referenced index or (ii) receive a net settlement amount in the form of cash or securities equal to the notional amount of the swap less the recovery value of the referenced obligation or underlying securities comprising the referenced index. Recovery values are assumed by market makers considering either industry standard recovery rates or entity specific factors and considerations until a credit event occurs. If a credit event has occurred, the recovery value is determined by a facilitated auction whereby a minimum number of allowable broker bids, together with a specified valuation method, are used to calculate the settlement value.
Implied credit spreads, represented in absolute terms, utilized in determining the market value of credit default swap agreements on corporate issues or sovereign issues are disclosed in each Portfolio’s Portfolio of Investment and serve as an indicator of the current status of the payment/performance risk and represent the likelihood or risk of default for the credit derivative. The implied credit spread of a particular referenced entity reflects the cost of buying/selling protection and may include upfront payments required to be made to enter into the agreement. For credit default swaps on asset-backed securities or credit indices, the quoted market prices and resulting market values serve as the indicator of the current status of the payment/performance risk. Wider credit spreads and increasing market values, in absolute terms when compared to the notional amount of the swap, represent a deterioration of the referenced entity’s credit soundness and a greater likelihood or risk of default or other credit event occurring as defined under the terms of the agreement.
The maximum amount of future payments (undiscounted) that a Portfolio as seller of protection could be required to make under a
37
NOTES TO FINANCIAL STATEMENTSASOF DECEMBER 31, 2008 (CONTINUED)
NOTE 2 — SIGNIFICANT ACCOUNTING POLICIES (continued)
credit default swap agreement would be an amount equal to the notional amount of the agreement. Notional amounts of all credit default swap agreements outstanding as of December 31, 2008, for which a Portfolio is seller of protection are disclosed in each Portfolio’s Portfolio of Investments. These potential amounts would be partially offset by any recovery values of the respective referenced obligations, upfront payments received upon entering into the agreements, or net amounts received from the settlement of buy protection credit default swap agreements entered into by a Portfolio for the same referenced entity or entities.
Interest Rate Swap Contracts—An interest rate swap involves the agreement between counterparties to exchange periodic payments based on interest rates. One payment will be based on a floating rate of a specified interest rate while the other will be a fixed rate. Risks involve the future fluctuations of interest rates in which a Portfolio may make payments that are greater than what a Portfolio received from the counterparty. Other risks include credit, liquidity and market risk.
Total Return Swap Contracts—A total return swap involves the agreement between counterparties to exchange periodic payments based on an asset (such as a basket of securities) or non-asset (such as an index) reference. The periodic payments or cash flows, are usually based on the non-asset reference versus the total return or the asset-based reference. The asset-based reference generally includes unrealized appreciation or depreciation and to the extent that the total return falls short of or exceeds the non-asset reference, a Portfolio will make or receive a payment to the counterparty. Risks of total return swaps include credit, liquidity and market risks.
Currency Swaps—A currency swap involves the agreement between counterparties to exchange two different currencies at contract inception at the prevailing spot rate, and to reverse the exchange at a later agreed upon termination date. The currency exchange at termination may take place at the original exchange rate, an agreed upon exchange rate or the prevailing spot rate on the date of termination. The contract may also include periodic interest payments based on a specified interest rate. Risks related to currency swaps include, but are not limited to, credit, liquidity, market, and exchange rate fluctuations.
Structured Products—Certain Portfolios invest in structured products which are specially-designed derivative investments whose principal payments or interest payments are linked to the performance of underlying foreign currencies, interest rate spreads, stock market indices, prices of individual securities, commodities or other financial instruments or the occurrence of other specific events. The terms and conditions of these products may be ‘structured’ by the purchaser and the borrower issuing the note. The market value of these products will increase or decrease based on the performance of the underlying asset or reference. A Portfolio records the changes in the market value of these structured products as an unrealized gain or loss in the accompanying Portfolio’s Statements of Operations. A Portfolio records a realized gain or loss when a structured product is sold or matures.
Risks associated with structured products include credit risk (if the counterparty fails to meet its obligation) and risk associated with the underlying asset or reference. Since a Portfolio enters into the transaction with the borrower at par value, a Portfolio could receive more or less than it originally invested when a note matures. The prices of the notes may also be very volatile and may have limited liquidity in the market which can make it difficult for a Portfolio to value or sell at an advantageous price.
Certain Portfolios are party to International Swap Dealers Association, Inc. Master Agreements (“ISDA Master Agreements”). These agreements are with select counterparties and they govern transactions, including certain over-the counter derivative and foreign exchange contracts, entered into by the Portfolios and the counterparty. The ISDA Master Agreements maintain provisions for general obligations, representations, agreements, collateral, and events of default or termination. The occurrence of a specified event of termination may give a counterparty the right to terminate all of its contracts and affect settlement of all outstanding transactions under the applicable ISDA Master Agreement.
| N. | Reverse Repurchase Agreements. A reverse repurchase agreement involves the sale of a security, with an agreement to repurchase the same or a substantially similar security at an agreed upon price and date. Reverse repurchase agreements are considered borrowings and the difference between the sale and repurchase prices represents interest expense at an agreed upon rate. Whether such a transaction produces a gain for a Portfolio depends upon whether the income and gains on the securities purchased with the |
38
NOTES TO FINANCIAL STATEMENTSASOF DECEMBER 31, 2008 (CONTINUED)
NOTE 2 — SIGNIFICANT ACCOUNTING POLICIES (continued)
| | proceeds received from the sale of the security exceeds the interest expense incurred by the Portfolio. Reverse repurchase agreements, as a leveraging technique, may increase a Portfolio’s yield; however, such transactions also increase a Portfolio’s risk to capital and may result in a shareholder’s loss of principal. |
| O. | Organization Expenses and Offering Costs. Costs incurred with the organization of the Portfolios are expensed as incurred. Costs incurred with the offering of shares of the Portfolios are deferred and amortized over a period of twelve months. |
| P. | Indemnifications. In the normal course of business, the Company may enter into contracts that provide certain indemnifications. The Company maximum exposure under these arrangements is dependent on future claims that may be made against the Portfolios and, therefore, cannot be estimated; however, based on experience, the risk of loss from such claims is considered remote. |
NOTE 3 — INVESTMENT TRANSACTIONS
For the period ended December 31, 2008, the cost of purchases and the proceeds from the sales of securities, excluding short-term securities and U.S. government securities, were as follows:
| | | | | | |
| | | Purchases | | Sales |
Russell™ Large Cap Index | | $ | 1,390,337,283 | | $ | 52,132,347 |
Russell™ Mid Cap Index | | | 249,775,572 | | | 38,158,342 |
Russell™ Small Cap Index | | | 322,365,018 | | | 52,488,765 |
LBAB Index | | | 102,329,834 | | | 28,404,631 |
International Index | | | 424,577,256 | | | 47,583,114 |
Russell Global Large Cap Index 85% | | | 57,465,552 | | | 5,313,744 |
WisdomTreeSM Index | | | 386,388,041 | | | 156,207,178 |
U.S. government securities not included above were as follows:
| | | | | | |
| | | Purchases | | Sales |
LBAB Index | | $ | 662,430,521 | | $ | 468,307,853 |
NOTE 4 — INVESTMENT MANAGEMENT, ADMINISTRATIVE AND LICENSING FEES
The Portfolios entered into investment management agreements (“Investment Management Agreements”) with the Investment Adviser. The Investment Management Agreements compensate the Investment Adviser with a fee, computed daily and payable monthly, based on the average daily net assets of each Portfolio, at the following annual rates:
| | |
RussellTM Large Cap Index | | 0.25% |
RussellTM Mid Cap Index | | 0.31% |
RussellTM Small Cap Index | | 0.33% |
LBAB Index | | 0.32% |
International Index | | 0.38% |
Russell Global Large Cap Index 85% | | 0.46% |
WisdomTreeSM Index | | 0.46% |
The Investment Adviser entered into sub-advisory agreements with ING IM. ING IM acts as sub-adviser to all Portfolios except for LBAB Index. Subject to such policies as the Board or the Investment Adviser may determine, ING IM manages the Portfolios’ assets in accordance with the Portfolios’ investment objectives, policies, and limitations.
Lehman Brothers Asset Management LLC (“Lehman Brothers Asset Management”) serves as Sub-Adviser to LBAB Index pursuant to a Sub-Advisory Agreement effective March 7, 2008.
ING Portfolios are permitted to invest end-of-day cash balances into ING Institutional Prime Money Market Fund. Investment management fees paid by the Portfolios will be reduced by an amount equal to the management fees paid indirectly to ING Institutional Prime Money Market Fund with respect to assets invested by the Portfolios. For the period ended December 31, 2008, the Investment Adviser for Russell™ Large Cap Index, Russell™ Mid Cap Index, Russell™ Small Cap Index, LBAB Index, International Index, Russell Global Large Cap Index 85%, and WisdomTreeSM Index waived $16,658, $3,338, $4,286, $7,236, $1,084, $358, and $1,928 of such management fees, respectively. These fees are not subject to recoupment.
Pursuant to administration agreements, ING Funds Services, LLC (“IFS”), an indirect, wholly-owned subsidiary of ING Groep, acts as administrator and provides certain administrative and shareholder services necessary for Portfolio operations and is responsible for the supervision of other service providers.
IFS is entitled to receive from Russell™ Large Cap Index, Russell™ Mid Cap Index, Russell™ Small Cap Index, LBAB Index, International Index, Russell Global Large Cap Index 85% and WisdomTreeSM Index a fee at an annual rate of 0.10% of daily net assets.
Russell Investment Group receives an annual licensing fee for the Russell Top 200® Index, the Russell Mid Cap® Index and the Russell 2000® Index. WisdomTreeSM Index pays an annual licensing fee to WisdomTree Investments, Inc.
NOTE 5 — DISTRIBUTION AND SERVICE FEES
ADV Class shares of the respective Portfolios are subject to a Shareholder Service and Distribution Plan (the “Plan”). Under the Plan, the Distributor is paid an annual shareholder service fee at the rate of 0.25% and an annual distribution fee at the rate of 0.25% of the average daily net assets attributable to its ADV Class shares.
Class S shares of the Portfolios have adopted Distribution Plans pursuant to Rule 12b-1 under the
39
NOTES TO FINANCIAL STATEMENTSASOF DECEMBER 31, 2008 (CONTINUED)
NOTE 5 — DISTRIBUTION AND SERVICE FEES
(continued)
1940 Act (the “12b-1 Plans”), whereby the Distributor is compensated by each Portfolio for expenses incurred in the distribution of each Portfolio’s shares (“Distribution Fees”). Pursuant to the 12b-1 Plans, the Distributor is entitled to a payment each month to compensate for expenses incurred in the distribution and promotion of each Portfolio’s shares, including expenses incurred in printing prospectuses and reports used for sales
purposes, expenses incurred in preparing and printing sales literature and other such distribution related expenses, including any distribution or shareholder servicing fees (“Service Fees”) paid to securities dealers who have executed a distribution agreement with the Distributor. Under the 12b-1 Plans, Class S shares of the Portfolios pay the Distributor a fee calculated at an annual rate of 0.25%(1) of average daily net assets.
(1) | Effective January 16, 2008, IFD has agreed to waive a portion of the service/distribution fees for Class S Shares of WisdomTreeSM Index so that the fees collected will not exceed 0.19% through May 1, 2009. |
NOTE 6 — OTHER TRANSACTIONS WITH AFFILIATED AND RELATED PARTIES
At December 31, 2008, the Portfolios had the following amounts recorded in payable to affiliates on the accompanying Statements of Assets and Liabilities (see Notes 4 and 5):
| | | | | | | | | | | | | | | |
Fund | | Accrued
Investment
Management
Fees | | Accrued
Administrative
Fees | | Accrued
Shareholder
Service and
Distribution
Fees | | Accrued
Recoupment | | Total |
Russell Large Cap Index | | $ | 161,498 | | $ | 66,283 | | $ | 5,749 | | $ | — | | $ | 233,530 |
Russell Mid Cap Index | | | 36,188 | | | 11,788 | | | 4,367 | | | — | | | 52,343 |
Russell Small Cap Index | | | 52,550 | | | 16,043 | | | 14,080 | | | — | | | 82,673 |
LBAB Index | | | 60,987 | | �� | 20,105 | | | 37,453 | | | 11,599 | | | 130,144 |
International Index | | | 73,282 | | | 19,311 | | | 1,258 | | | — | | | 93,851 |
Russell Global Large Cap Index 85% | | | 16,216 | | | 3,528 | | | 8,821 | | | — | | | 28,565 |
WisdomTreeSM Index | | | 54,000 | | | 11,753 | | | 21,932 | | | — | | | 87,685 |
The Company has adopted a Deferred Compensation Plan (the “Policy”), which allows eligible non-affiliated directors as described in the Policy to defer the receipt of all or a portion of the directors’ fees payable. Deferred fees are invested in various funds advised by ING Investments until distribution in accordance with the Policy.
At December 31, 2008, the following ING Portfolios or indirect, wholly owned subsidiaries of ING Groep owned more than 5% of the following Portfolios:
| | |
ING Life Insurance & Annuity Company— | | Russell™ Mid Cap Index (8.32%) |
ING Lifestyle Aggressive Growth Portfolio— | | International Index (16.13%) |
| | Russell™ Large Cap Index (11.72%) |
| | Russell™ Mid Cap Index (11.19%) |
| | Russell™ Small Cap Index (7.80%) |
ING Lifestyle Growth Portfolio— | | International Index (43.35%) |
| | LBAB Index (25.37%) |
| | Russell™ Large Cap Index (37.38%) |
| | Russell™ Mid Cap Index (32.23%) |
| | Russell™ Small Cap Index (29.96%) |
ING Lifestyle Moderate Growth Portfolio— | | International Index (20.85%) |
| | Russell™ Large Cap Index (30.00%) |
| | Russell™ Mid Cap Index (18.09%) |
| | Russell™ Small Cap Index (12.61%) |
ING Lifestyle Moderate Portfolio— | | International Index (12.17%) |
| | Russell™ Large Cap Index (14.63%) |
| | Russell™ Mid Cap Index (10.55%) |
| | Russell™ Small Cap Index (7.36%) |
ING USA Annuity and Life Insurance Company— | | LBAB Index (62.29%) |
| | Russell Global Large Cap Index (6.31%) |
| | Russell™ Mid Cap Index (15.62%) |
| | Russell™ Small Cap Index (33.62%) |
| | WisdomTreeSM Global High-Yield Equity Index (97.62%) |
ING USA Life & Annuity Company— | | Russell Global Large Cap Index 85% (93.69%) |
40
NOTES TO FINANCIAL STATEMENTSASOF DECEMBER 31, 2008 (CONTINUED)
NOTE 6 — OTHER TRANSACTIONS WITH AFFILIATED AND RELATED PARTIES (continued)
Control is defined by the 1940 Act as the beneficial ownership, either directly or through one or more controlled companies, of more than 25% of the voting securities of a company. The 1940 Act defines affiliates as companies that are under common control. Therefore, because the Portfolios have a common owner that owns over 25% of the outstanding securities of the Portfolios, they may be deemed to be affiliates of each other. Investment activities of these shareholders could have a material impact on the Portfolios.
NOTE 7 — OTHER ACCRUED EXPENSES AND LIABILITIES
At December 31, 2008, the following portfolios had the following payables included in Other Accrued Expenses and Liabilities on the Statements of Assets and Liabilities that exceed 5% of total liabilities.
| | | | | |
Portfolio | | Accrued
Expenses | | Amount |
International Index | | Custody | | $ | 75,706 |
WisdomTreeSM Index | | Custody | | | 111,157 |
NOTE 8 — EXPENSE LIMITATIONS
ING Investments entered into written expense limitation agreements (“Expense Limitation Agreements”) with each of the following Portfolios whereby the Investment Adviser has agreed to limit expenses, excluding interest expense, taxes, brokerage commissions and extraordinary expenses (and acquired fund fees and expenses) to the levels listed below:
| | | | | | |
| | | Class ADV | | Class I | | Class S |
Russell™ Large Cap Index | | 0.87% | | 0.37% | | 0.62% |
Russell™ Mid Cap Index | | 0.93% | | 0.43% | | 0.68% |
Russell™ Small Cap Index | | 0.95% | | 0.45% | | 0.70% |
LBAB Index | | 0.95% | | 0.45% | | 0.70% |
International Index | | 1.00% | | 0.50% | | 0.75% |
Russell Global Large Cap Index 85% | | 1.10% | | 0.60% | | 0.85% |
WisdomTreeSM Index | | 1.20% | | 0.70% | | 0.89% |
The Investment Adviser may at a later date recoup from a Portfolio management fees waived and other expenses assumed by the Investment Adviser during the previous 36 months, but only if, after such recoupment, the Portfolio’s expense ratio does not exceed the percentage described above. Waived and reimbursed fees net of any recoupment by the Investment Adviser of such waived and reimbursed fees are reflected on the accompanying Statements of Operations. Amounts payable by the Investment Manager are reflected on the accompanying Statements of Assets and Liabilities for each Portfolio.
As of December 31, 2008, the amount of waived and reimbursed fees that are subject to recoupment by the Investment Adviser, and the related expiration dates are as follows:
| | | | | | | | | | | | |
| | | December 31, | | |
| | | 2009 | | 2010 | | 2011 | | Total |
RussellTM Large Cap Index | | $ | — | | $ | — | | $ | 79,602 | | $ | 79,602 |
RussellTM Mid Cap Index | | | — | | | — | | | 77,850 | | | 77,850 |
RussellTM Small Cap Index | | | — | | | — | | | 97,613 | | | 97,613 |
LBAB Index | | | — | | | — | | | 55,781 | | | 55,781 |
International Index | | | — | | | — | | | 303,727 | | | 303,727 |
Russell Global Large Cap Index 85% | | | — | | | — | | | 131,885 | | | 131,885 |
WisdomTreeSM Index | | | — | | | — | | | 527,898 | | | 527,898 |
The Expense Limitation Agreements are contractual and shall renew automatically for one-year terms unless ING Investments provides written notice of the termination of an Expense Limitation Agreement within 90 days of the end of the then current term.
NOTE 9 — BORROWINGS
All of the Portfolios included in this report, in addition to certain other Portfolios managed by the Investment Adviser, have entered into an unsecured committed revolving line of credit agreement with Citibank, N.A. (the “Citi Credit Agreement”) for an aggregate amount of $100,000,000. The proceeds may be used only to: (1) temporarily finance the purchase and sale of securities; (2) finance the redemption of shares of an investor in the Portfolios; and (3) enable the Portfolios to meet other emergency expenses as defined in the Citi Credit Agreement. The Portfolios to which the line of credit is available pay a commitment fee equal to 0.08% per annum on the daily unused portion of the committed line amount. Each of the Portfolios will pay its pro rata share of the commitment fee.
On November 11, 2008, the Board approved an extension of the unsecured committed revolving line of credit agreement with Citibank, N.A. for an aggregate amount of $100,000,000. The Citi Credit Agreement was extended for an additional thirty-day period, terminating on December 18, 2008. The portfolios to which the line of credit is available pay a commitment fee equal to 0.15% per annum on the daily unused portion of the committed line amount.
On December 11, 2008, the Board approved an unsecured committed revolving line of credit agreement with The Bank of New York Mellon (the “BNY Credit Agreement”) for an aggregate amount of $100,000,000, not to exceed $50,000,000 with respect to any one Portfolio or 10% of the Portfolio’s value of total assets if Net Asset Value is less than $25,000,000, effective December 18, 2008 for a 364-day period,
41
NOTES TO FINANCIAL STATEMENTSASOF DECEMBER 31, 2008 (CONTINUED)
NOTE 9 — BORROWINGS (continued)
terminating on December 16, 2009. The proceeds may be used to: (1) temporarily finance the purchase and sale of securities; (2) finance the redemption of shares of an investor in the Portfolios; and (3) enable the Portfolios to meet other emergency expenses as defined in the BNY Credit Agreement. The Portfolios to which the line of credit is available pay a
commitment fee equal to 0.125% per annum on the daily unused portion of the committed line amount.
Generally, borrowings under the credit agreements accrue interest at the federal funds rate plus a specified margin. Repayments generally must be made within 30 days after the date of a revolving credit advance. The Portfolios did not utilize the line of credit during the period ended December 31, 2008.
NOTE 10 — CAPITAL SHARES
Transactions in capital shares and dollars were as follows:
| | | | | | | | | | | | | | | | | | | | |
| | | Shares sold | | Reinvestment
of
distributions | | Shares
redeemed | | | Net increase
(decrease) in
shares
outstanding | | | | Shares sold | | Reinvestment
of
distributions | | Shares
redeemed | | | Net increase
(decrease) in
shares
outstanding |
Year or period ended | | # | | # | | # | | | # | | | | ($) | | ($) | | ($) | | | ($) |
Russell™ Large Cap Index | | | | | | | |
Class ADV | | | | | | | | | | | | | | | | | | | | |
03-10-08(1) - 12-31-08 | | 173,419 | | 1,477 | | (16,983 | ) | | 157,913 | | | | 1,601,543 | | 10,253 | | (129,180 | ) | | 1,482,616 |
Class I | | | | | | | | | | | | | | | | | | | | |
03-10-08(1) - 12-31-08 | | 156,568,086 | | 1,639,729 | | (11,418,011 | ) | | 146,789,804 | | | | 1,462,652,407 | | 11,412,515 | | (104,015,660 | ) | | 1,370,049,262 |
Class S | | | | | | | | | | | | | | | | | | | | |
03-10-08(1) - 12-31-08 | | 5,238,385 | | 40,022 | | (1,315,701 | ) | | 3,962,706 | | | | 45,389,051 | | 278,152 | | (10,928,219 | ) | | 34,738,984 |
Russell™ Mid Cap Index | | | | | | | |
Class ADV | | | | | | | | | | | | | | | | | | | | |
12-31-08 | | 12,095 | | 107 | | (2,981 | ) | | 9,221 | | | | 119,229 | | 673 | | (28,046 | ) | | 91,856 |
Class I | | | | | | | | | | | | | | | | | | | | |
03-10-08(1)-12-31-08 | | 23,565,313 | | 250,309 | | (6,099,922 | ) | | 17,715,700 | | | | 241,572,524 | | 1,571,940 | | (55,109,453 | ) | | 188,035,011 |
Class S | | | | | | | | | | | | | | | | | | | | |
03-10-08(1)-12-31-08 | | 4,220,077 | | 47,556 | | (447,800 | ) | | 3,819,833 | | | | 36,227,293 | | 298,651 | | (3,570,352 | ) | | 32,955,592 |
Russell™ Small Cap Index | | | | | | | |
Class ADV | | | | | | | | | | | | | | | | | | | | |
12-31-08 | | 76,560 | | 736 | | (3,333 | ) | | 73,963 | | | | 617,766 | | 5,309 | | (30,133 | ) | | 592,942 |
Class I | | | | | | | | | | | | | | | | | | | | |
03-10-08(1)-12-31-08 | | 21,909,094 | | 177,487 | | (4,948,044 | ) | | 17,138,537 | | | | 231,680,241 | | 1,283,228 | | (53,769,012 | ) | | 179,194,457 |
Class S | | | | | | | | | | | | | | | | | | | | |
03-10-08(1)-12-31-08 | | 11,631,264 | | 90,510 | | (2,062,798 | ) | | 9,658,976 | | | | 120,555,417 | | 653,482 | | (17,880,941 | ) | | 103,327,958 |
LBAB Index | | | | | | | |
Class ADV | | | | | | | | | | | | | | | | | | | | |
03-10-08(1) - 12-31-08 | | 91,269 | | 122 | | (77,228 | ) | | 14,163 | | | | 905,986 | | 1,224 | | (785,857 | ) | | 121,353 |
Class I | | | | | | | | | | | | | | | | | | | | |
03-07-08(1) - 12-31-08 | | 15,032,466 | | 132,177 | | (4,567,715 | ) | | 10,596,928 | | | | 151,617,806 | | 1,326,845 | | (45,352,057 | ) | | 107,592,594 |
Class S | | | | | | | | | | | | | | | | | | | | |
03-10-08(1) - 12-31-08 | | 21,942,330 | | 244,538 | | (4,306,957 | ) | | 17,879,911 | | | | 216,156,521 | | 2,441,731 | | (42,141,622 | ) | | 176,456,630 |
International Index | | | | | | | |
Class ADV | | | | | | | | | | | | | | | | | | | | |
03-10-08(1) - 12-31-08 | | 302 | | — | | — | | | 302 | | | | 3,015 | | — | | — | | | 3,015 |
Class I | | | | | | | | | | | | | | | | | | | | |
03-10-08(1) - 12-31-08 | | 40,895,819 | | 661,024 | | (4,476,702 | ) | | 37,080,141 | | | | 418,500,442 | | 4,138,013 | | (41,281,528 | ) | | 381,356,927 |
Class S | | | | | | | | | | | | | | | | | | | | |
03-10-08(1) - 12-31-08 | | 1,326,452 | | 18,087 | | (254,456 | ) | | 1,090,083 | | | | 11,028,390 | | 113,042 | | (1,898,169 | ) | | 9,243,263 |
42
NOTES TO FINANCIAL STATEMENTSASOF DECEMBER 31, 2008 (CONTINUED)
NOTE 10 — CAPITAL SHARES (continued)
| | | | | | | | | | | | | | | | | | | | |
| | | Shares sold | | Reinvestment
of
distributions | | Shares
redeemed | | | Net
increase
(decrease)
in shares
outstanding | | | | Shares sold | | Reinvestment
of
distributions | | Shares
redeemed | | | Net increase
(decrease) in
shares
outstanding |
Year or period ended | | # | | # | | # | | | # | | | | ($) | | ($) | | ($) | | | ($) |
Russell Global Large Cap Index 85% | | | | | | | |
Class ADV | | | | | | | | | | | | | | | | | | | | |
09-17-08(1) - 12-31-08 | | 301 | | — | | — | | | 301 | | | | 3,011 | | — | | — | | | 3,011 |
Class I | | | | | | | | | | | | | | | | | | | | |
09-17-08(1) - 12-31-08 | | 301 | | — | | — | | | 301 | | | | 3,010 | | — | | — | | | 3,010 |
Class S | | | | | | | | | | | | | | | | | | | | |
09-17-08(1) - 12-31-08 | | 5,514,975 | | 5,250 | | (183,378 | ) | | 5,336,847 | | | | 54,010,888 | | 41,786 | | (1,438,619 | ) | | 52,614,055 |
WisdomTreeSM Index | | | | | | | |
Class ADV | | | | | | | | | | | | | | | | | | | | |
01-28-08(1) - 12-31-08 | | 101 | | — | | — | | | 101 | | | | 1,010 | | — | | — | | | 1,010 |
Class I | | | | | | | | | | | | | | | | | | | | |
01-28-08(1) - 12-31-08 | | 2,500,001 | | — | | (2,500,000 | ) | | 1 | | | | 25,001,982 | | — | | (14,684,999 | ) | | 10,316,983 |
Class S | | | | | | | | | | | | | | | | | | | | |
01-28-08(1) - 12-31-08 | | 25,374,339 | | 825,843 | | (1,328,583 | ) | | 24,871,599 | | | | 227,562,754 | | 4,806,407 | | (9,802,494 | ) | | 222,566,667 |
(1) | | Commencement of operations. |
NOTE 11 — SECURITIES LENDING
Under an agreement with The Bank of New York Mellon (“BNY”), the Portfolios can lend their securities to approved brokers, dealers and other financial institutions. Loans are collateralized by cash and U.S. government securities. The collateral is equal to at least 105% of the market value of non-U.S. securities loaned and 102% of the market value of U.S. securities loaned when the transaction is entered into and is adjusted daily for changes in the market values of the securities on loan. The cash collateral received is invested in approved investments as defined in the Securities Lending Agreement with BNY (the “Agreement”). The Portfolios bear the risk of loss with respect to the investment of collateral. Currently, the cash collateral is invested in the Bank of New York Mellon Corp. Institutional Cash Reserves Fund (“BICR Fund”). BNY serves as investment manager, custodian and operational trustee of the BICR Fund. As of December 31, 2008, the BICR Fund held certain defaulted securities that had market values significantly below amortized cost. The investment in the BICR Fund is included in the Portfolio of Investments under Securities Lending Collateral and the unrealized loss on such investment is included in Net Unrealized Depreciation on the Statements of Assets and Liabilities. The Portfolios agreed, in principle, to the terms of capital support extended by The Bank of New York Mellon Corporation (“BNYC”), an affiliated
company of BNY, for the certain defaulted securities held by the BICR Fund. BNYC will support the value of these securities up to a certain amount and subject, in part, to the Portfolios’ continued lending of securities. The recorded value of each Portfolio’s investment in the BICR Fund includes the value of the underlying securities held by the BICR Fund and the estimated value of the support to be provided by BNYC.
Generally, in the event of counterparty default, the Portfolios have the right to use the collateral to offset losses incurred. The Agreement contains certain guarantees by BNY in the event of counterparty default and/or a borrower’s failure to return a loaned security; however, there would be a potential loss to the Portfolios in the event the Portfolios are delayed or prevented from exercising their right to dispose of the collateral. Engaging in securities lending could have a leveraging effect, which may intensify the credit, market and other risks associated with investing in the Portfolios. At December 31, 2008, the following Portfolios had securities on loan with the following market values:
| | | | | | |
| | | Value of
Securities
Loaned | | Cash
Collateral
Received* |
Russell™ Mid Cap Index | | $ | 4,213,351 | | $ | 4,359,108 |
Russell™ Small Cap Index | | | 17,863,015 | | | 18,516,175 |
| * | Cash collateral received was invested in the BICR Fund, the fair value of which is presented in the respective Portfolio’s Portfolio of Investments |
43
NOTES TO FINANCIAL STATEMENTSASOF DECEMBER 31, 2008 (CONTINUED)
NOTE 12 — CONCENTRATION OF INVESTMENT RISKS
Foreign Securities (International Index). Investments in foreign securities may entail risks not present in domestic investments. Since securities in which the Portfolios may invest are denominated in foreign currencies, changes in the relationship of these foreign currencies to the U.S. dollar can significantly affect the value of the investments and earnings of the Portfolios. Foreign investments may also subject the Portfolios to foreign government exchange restrictions, expropriation, taxation or other political, social or economic developments, as well as changes vis-a-vis the U.S. dollar from movements in currency, and changes in security value and interest rate, all of which could affect the market and/or credit risk of the Portfolios’ investments.
Emerging Markets Investments (WisdomTreeSM Index). Because of less developed markets and economies and, in some countries, less mature governments and governmental institutions, the risks of investing in foreign securities can be intensified in the case of investments in issuers domiciled or doing substantial business in emerging market countries.
Index Strategy (All Portfolios). A Portfolio may use an indexing strategy that does not attempt to manage market volatility, use defensive strategies or reduce the effects of any long-term periods of poor stock performance. The correlation between a Portfolio and an index performance may be affected by the Portfolio’s expenses, and the timing of purchases and redemptions of a Portfolio’s shares.
Derivatives (All Portfolios). Generally, derivatives can be characterized as financial instruments whose performance is derived, at least in part, from the performance of an underlying asset or assets. Some derivatives are sophisticated instruments that typically involve a small investment of cash relative to the magnitude of risks assumed. These may include swap agreements, options, forwards and futures. Derivative securities are subject to market risk which could be significant for those that have a leveraging effect. Derivatives are also subject to credit risks related to the counterparty’s ability to perform and any deterioration in the counterparty’s creditworthiness could adversely affect the instrument. In addition, derivatives and their underlying securities may experience periods of illiquidity which could cause a Portfolio to hold a security it might otherwise sell or could force the sale
of a security at inopportune times or for prices that do not reflect current market value. A risk of using derivatives is that a Portfolio’s adviser or sub-adviser might imperfectly judge the market’s direction.
NOTE 13 — FEDERAL INCOME TAXES
The amount of distributions from net investment income and net realized capital gains are determined in accordance with federal income tax regulations, which may differ from U.S. generally accepted accounting principles for investment companies. These book/tax differences may be either temporary or permanent. Permanent differences are reclassified within the capital accounts based on their federal tax-basis treatment; temporary differences are not reclassified. Key differences include the treatment of short-term capital gains, foreign currency transactions, and wash sale deferrals. Distributions in excess of net investment income and/or net realized capital gains for tax purposes are reported as return of capital.
The following permanent tax differences have been reclassified as of December 31, 2008:
| | | | | | | | | | | | |
| | | Paid-in
Capital | | | Undistributed
Net
Investment
Income | | | Accumulated
Net Realized
Gains /
(Losses) | |
RussellTM Large Cap Index | | $ | (24,162 | ) | | $ | 23,394 | | | $ | 768 | |
RussellTM Mid Cap Index | | | (7,052 | ) | | | (156,494 | ) | | | 163,546 | |
RussellTM Small Cap Index | | | (8,537 | ) | | | (85,128 | ) | | | 93,665 | |
LBAB Index | | | — | | | | 35,223 | | | | (35,223 | ) |
International Index | | | (67,402 | ) | | | (218,942 | ) | | | 286,344 | |
Russell Global Large Cap Index 85% | | | (34,925 | ) | | | 177,716 | | | | (142,791 | ) |
WisdomTreeSM Index | | | (65,258 | ) | | | (194,267 | ) | | | 259,525 | |
Dividends paid by the Portfolios from net investment income and distributions of net realized short-term capital gains are, for federal income tax purposes, taxable as ordinary income to shareholders.
The tax composition of dividends and distributions to shareholders for the period ended December 31, 2008 was as follows:
| | | | | | |
| | | Ordinary
Income | | Return of
Capital |
RussellTM Large Cap Index | | $ | 11,700,920 | | $ | — |
RussellTM Mid Cap Index | | | 1,685,154 | | | 186,110 |
RussellTM Small Cap Index | | | 1,725,162 | | | 216,857 |
LBAB Index | | | 4,200,446 | | | — |
International Index | | | 4,251,080 | | | — |
Russell Global Large Cap Index 85% | | | 478,841 | | | — |
WisdomTreeSM Index | | | 4,806,424 | | | — |
44
NOTES TO FINANCIAL STATEMENTSASOF DECEMBER 31, 2008 (CONTINUED)
NOTE 13 — FEDERAL INCOME TAXES (continued)
The tax-basis components of distributable earnings and the expiration dates of the capital loss carryforwards which may be used to offset future realized capital gains for federal income tax purposes as of December 31, 2008 were:
| | | | | | | | | | | | | | | | | | | | |
| | | Undistributed
Ordinary
Income | | Undistributed
Long-Term
Capital Gains | | Unrealized
Appreciation/
(Depreciation) | | | Post-October
Capital Loss
Deferred | | | Capital Loss
Carryforwards | | | Expiration
Dates |
RussellTM Large Cap Index | | $ | 151,312 | | $ | — | | $ | (295,801,163 | ) | | $ | — | | | $ | (22,957,959 | ) | | 2016 |
RussellTM Mid Cap Index | | | — | | | — | | | (77,355,407 | ) | | | — | | | | (645,177 | ) | | 2016 |
RussellTM Small Cap Index | | | — | | | — | | | (65,758,273 | ) | | | — | | | | (9,091,866 | ) | | 2016 |
LBAB Index | | | 2,278,506 | | | 5,794 | | | 1,586,642 | | | | — | | | | — | | | — |
International Index | | | — | | | — | | | (140,065,005 | ) | | | — | | | | (5,709,503 | ) | | 2016 |
Russell Global Large Cap Index 85% | | | — | | | — | | | (9,115,233 | ) | | | (82,265 | ) | | | (181,384 | ) | | 2016 |
WisdomTreeSM Index | | | — | | | — | | | (74,451,026 | ) | | | — | | | | (9,622,350 | ) | | 2016 |
The Portfolios’ major tax jurisdictions are federal and Arizona. The earliest tax year that remains subject to examination by these jurisdictions is 2008.
NOTE 14 — OTHER ACCOUNTING PRONOUNCEMENT
On March 19, 2008, the FASB issued Statement of Financial Accounting Standards No. 161 (“SFAS No. 161”), “Disclosure about Derivative Instruments and Hedging Activities.” This new accounting statement requires enhanced disclosures about an entity’s derivative and hedging activities. Entities are required to provide enhanced disclosures about (a) how and why an entity invests in derivatives, (b) how derivatives are accounted for under SFAS No. 133, and (c) how derivatives affect an entity’s financial position, financial performance, and cash flows. SFAS No. 161 also requires enhanced disclosures regarding credit-risk- related contingent features of derivative instruments.
SFAS No. 161 is effective for financial statements issued for fiscal years and interim periods beginning after November 15, 2008. As of December 31, 2008, management of the Portfolios is currently assessing the impact of the expanded financial statement disclosures that will result from adopting SFAS No. 161.
NOTE 15 — SUBSEQUENT EVENTS
Effective May 1, 2009, ING Lehman Brothers U.S. Aggregate Bond Index® Portfolio will be renamed to “ING U.S. Bond Index Portfolio.”
Also effective May 1, 2009, ING Russell Global Large Cap Index 85% Portfolio will be renamed to “ING Russell Global Large Cap Index 75% Portfolio” with a corresponding strategy change.
45
| | |
| ING RUSSELL™ LARGE CAP INDEX PORTFOLIO | | PORTFOLIO OF INVESTMENTS AS OF DECEMBER 31, 2008 |
| | | | | | | |
| Shares | | | | | | Value |
| | | | | | | |
| COMMON STOCK: 94.8% | | | |
| Advertising: 0.1% | | | |
| 50,850 | | | | Omnicom Group | | $ | 1,368,882 |
| | | | | | | |
| | | | | | | 1,368,882 |
| | | | | | | |
| Aerospace/Defense: 2.5% | | | |
| 119,100 | | | | Boeing Co. | | | 5,081,997 |
| 63,150 | | | | General Dynamics Corp. | | | 3,636,809 |
| 52,100 | | | | Lockheed Martin Corp. | | | 4,380,568 |
| 54,350 | | | | Northrop Grumman Corp. | | | 2,447,924 |
| 67,050 | | | | Raytheon Co. | | | 3,422,232 |
| 154,300 | | | | United Technologies Corp. | | | 8,270,480 |
| | | | | | | |
| | | | | | | 27,240,010 |
| | | | | | | |
| Agriculture: 2.2% | | | |
| 332,150 | | | | Altria Group, Inc. | | | 5,002,179 |
| 102,150 | | | | Archer-Daniels-Midland Co. | | | 2,944,985 |
| 334,250 | | | | Philip Morris International, Inc. | | | 14,543,218 |
| 27,100 | | | | Reynolds American, Inc. | | | 1,092,401 |
| | | | | | | |
| | | | | | | 23,582,783 |
| | | | | | | |
| Apparel: 0.3% | | | |
| 56,000 | | | | Nike, Inc. | | | 2,856,000 |
| | | | | | | |
| | | | | | | 2,856,000 |
| | | | | | | |
| Auto Manufacturers: 0.1% | | | |
| 58,050 | | | | Paccar, Inc. | | | 1,660,230 |
| | | | | | | |
| | | | | | | 1,660,230 |
| | | | | | | |
| Auto Parts & Equipment: 0.2% | | | |
| 94,050 | | | | Johnson Controls, Inc. | | | 1,707,948 |
| | | | | | | |
| | | | | | | 1,707,948 |
| | | | | | | |
| Banks: 8.0% | | | |
| 796,700 | | | | Bank of America Corp. | | | 11,217,536 |
| 181,300 | | | | Bank of New York Mellon Corp. | | | 5,136,229 |
| 86,750 | | | | BB&T Corp. | | | 2,382,155 |
| 59,400 | | | | Capital One Financial Corp. | | | 1,894,266 |
| 863,100 | | | | Citigroup, Inc. | | | 5,791,401 |
| 69,850 | | | | Goldman Sachs Group, Inc. | | | 5,894,642 |
| 585,235 | | | | JPMorgan Chase & Co. | | | 18,452,460 |
| 175,550 | | | | Morgan Stanley | | | 2,815,822 |
| 54,800 | | | | PNC Financial Services Group, Inc. | | | 2,685,200 |
| 67,700 | | | | State Street Corp. | | | 2,662,641 |
| 56,000 | | | | SunTrust Bank | | | 1,654,240 |
| 276,000 | | | | US Bancorp. | | | 6,902,760 |
| 342,400 | | | | Wachovia Corp. | | | 1,896,896 |
| 598,800 | | | | Wells Fargo & Co. | | | 17,652,624 |
| | | | | | | |
| | | | | | | 87,038,872 |
| | | | | | | |
| Beverages: 2.8% | | | |
| 368,200 | | | | Coca-Cola Co. | | | 16,668,414 |
| 251,400 | | | | PepsiCo, Inc. | | | 13,769,178 |
| | | | | | | |
| | | | | | | 30,437,592 |
| | | | | | | |
| Biotechnology: 3.0% | | | |
| 172,550 | | @ | | Amgen, Inc. | | | 9,964,763 |
| 46,100 | | @ | | Biogen Idec, Inc. | | | 2,195,743 |
| 69,300 | | @ | | Celgene Corp. | | | 3,830,904 |
| 73,700 | | @ | | Genentech, Inc. | | | 6,110,467 |
| 42,350 | | @ | | Genzyme Corp. | | | 2,810,770 |
| 146,250 | | @ | | Gilead Sciences, Inc. | | | 7,479,225 |
| | | | | | | |
| | | | | | | 32,391,872 |
| | | | | | | |
| | | | | | | |
| Shares | | | | | | Value |
| | | | | | | |
| Chemicals: 1.6% | | | |
| 33,400 | | S | | Air Products & Chemicals, Inc. | | $ | 1,679,018 |
| 147,600 | | | | Dow Chemical Co. | | | 2,227,284 |
| 142,800 | | | | EI Du Pont de Nemours & Co. | | | 3,612,840 |
| 87,050 | | | | Monsanto Co. | | | 6,123,968 |
| 24,700 | | | | Mosaic Co. | | | 854,620 |
| 49,700 | | | | Praxair, Inc. | | | 2,950,192 |
| | | | | | | |
| | | | | | | 17,447,922 |
| | | | | | | |
| Coal: 0.1% | | | |
| 43,000 | | | | Peabody Energy Corp. | | | 978,250 |
| | | | | | | |
| | | | | | | 978,250 |
| | | | | | | |
| Commercial Services: 1.1% | | | |
| 82,100 | | | | Automatic Data Processing, Inc. | | | 3,229,814 |
| 11,600 | | | | Mastercard, Inc. | | | 1,657,988 |
| 43,850 | | | | McKesson Corp. | | | 1,698,311 |
| 70,900 | | | | Visa, Inc. | | | 3,718,705 |
| 117,200 | | | | Western Union Co. | | | 1,680,648 |
| | | | | | | |
| | | | | | | 11,985,466 |
| | | | | | | |
| Computers: 5.0% | | | |
| 94,750 | | @@ | | Accenture Ltd. | | | 3,106,853 |
| 139,750 | | @ | | Apple, Inc. | | | 11,927,663 |
| 287,800 | | @ | | Dell, Inc. | | | 2,947,072 |
| 327,800 | | @ | | EMC Corp. | | | 3,432,066 |
| 390,850 | | | | Hewlett-Packard Co. | | | 14,183,947 |
| 217,850 | | | | International Business Machines Corp. | | | 18,334,256 |
| | | | | | | |
| | | | | | | 53,931,857 |
| | | | | | | |
| Cosmetics/Personal Care: 3.2% |
| 80,750 | | | | Colgate-Palmolive Co. | | | 5,534,605 |
| 478,100 | | | | Procter & Gamble Co. | | | 29,556,142 |
| | | | | | | |
| | | | | | | 35,090,747 |
| | | | | | | |
| Diversified Financial Services: 1.3% |
| 159,800 | | | | American Express Co. | | | 2,964,290 |
| 2,900 | | S | | Blackrock, Inc. | | | 389,035 |
| 148,150 | | | | Charles Schwab Corp. | | | 2,395,586 |
| 10,700 | | | | CME Group, Inc. | | | 2,226,777 |
| 102,550 | | ## | | Federal Home Loan Mortgage Corporation | | | 74,862 |
| 177,150 | | ## | | Federal National Mortgage Association | | | 134,634 |
| 24,450 | | | | Franklin Resources, Inc. | | | 1,559,421 |
| 242,450 | | | | Merrill Lynch & Co., Inc. | | | 2,822,118 |
| 42,050 | | | | NYSE Euronext | | | 1,151,329 |
| | | | | | | |
| | | | | | | 13,718,052 |
| | | | | | | |
| Electric: 2.5% |
| 91,550 | | | | Dominion Resources, Inc. | | | 3,281,152 |
| 200,450 | | | | Duke Energy Corp. | | | 3,008,755 |
| 30,450 | | | | Entergy Corp. | | | 2,531,309 |
| 103,800 | | | | Exelon Corp. | | | 5,772,318 |
| 48,350 | | | | FirstEnergy Corp. | | | 2,348,843 |
| 64,450 | | | | FPL Group, Inc. | | | 3,243,769 |
| 80,750 | | | | Public Service Enterprise Group, Inc. | | | 2,355,478 |
| 121,500 | | | | Southern Co. | | | 4,495,500 |
| | | | | | | |
| | | | | | | 27,037,124 |
| | | | | | | |
| Electrical Components & Equipment: 0.4% |
| 123,850 | | | | Emerson Electric Co. | | | 4,534,149 |
| | | | | | | |
| | | | | | | 4,534,149 |
| | | | | | | |
See Accompanying Notes to Financial Statements
46
| | |
| ING RUSSELL™ LARGE CAP INDEX PORTFOLIO | | PORTFOLIO OF INVESTMENTS ASOF DECEMBER 31, 2008 (CONTINUED) |
| | | | | | | |
| Shares | | | | | | Value |
| | | | | | | |
| Electronics: 0.3% |
| 66,400 | | @ | | Thermo Electron Corp. | | $ | 2,262,248 |
| 75,800 | | @@ | | Tyco Electronics Ltd. | | | 1,228,718 |
| | | | | | | |
| | | | | | | 3,490,966 |
| | | | | | | |
| Energy - Alternate Sources: 0.1% |
| 7,100 | | @ | | First Solar, Inc. | | | 979,516 |
| | | | | | | |
| | | | | | | 979,516 |
| | | | | | | |
| Environmental Control: 0.2% |
| 77,750 | | | | Waste Management, Inc. | | | 2,576,635 |
| | | | | | | |
| | | | | | | 2,576,635 |
| | | | | | | |
| Food: 1.5% |
| 53,200 | | | | General Mills, Inc. | | | 3,231,900 |
| 39,650 | | | | Kellogg Co. | | | 1,738,653 |
| 233,100 | | | | Kraft Foods, Inc. | | | 6,258,735 |
| 104,700 | | | | Kroger Co. | | | 2,765,127 |
| 95,150 | | | | Sysco Corp. | | | 2,182,741 |
| | | | | | | |
| | | | | | | 16,177,156 |
| | | | | | | |
| Healthcare - Products: 4.4% |
| 99,350 | | | | Baxter International, Inc. | | | 5,324,167 |
| 38,800 | | | | Becton Dickinson & Co. | | | 2,653,532 |
| 237,350 | | @ | | Boston Scientific Corp. | | | 1,837,089 |
| 79,100 | | @@ | | Covidien Ltd. | | | 2,866,584 |
| 446,650 | | | | Johnson & Johnson | | | 26,723,070 |
| 177,850 | | | | Medtronic, Inc. | | | 5,588,047 |
| 48,650 | | | | Stryker Corp. | | | 1,943,568 |
| 36,650 | | @ | | Zimmer Holdings, Inc. | | | 1,481,393 |
| | | | | | | |
| | | | | | | 48,417,450 |
| | | | | | | |
| Healthcare - Services: 1.0% |
| 76,850 | | | | Aetna, Inc. | | | 2,190,225 |
| 194,750 | | | | UnitedHealth Group, Inc. | | | 5,180,350 |
| 83,350 | | @ | | WellPoint, Inc. | | | 3,511,536 |
| | | | | | | |
| | | | | | | 10,882,111 |
| | | | | | | |
| Household Products/Wares: 0.3% |
| 66,400 | | | | Kimberly-Clark Corp. | | | 3,501,936 |
| | | | | | | |
| | | | | | | 3,501,936 |
| | | | | | | |
| Insurance: 2.0% |
| 75,400 | | | | Aflac, Inc. | | | 3,456,336 |
| 87,200 | | | | Allstate Corp. | | | 2,856,672 |
| 368,200 | | | | American International Group, Inc. | | | 578,074 |
| 58,050 | | | | Chubb Corp. | | | 2,960,550 |
| 50,000 | | | | Hartford Financial Services Group, Inc. | | | 821,000 |
| 49,772 | | | | Loews Corp. | | | 1,406,059 |
| 79,750 | | | | Metlife, Inc. | | | 2,780,085 |
| 68,850 | | | | Prudential Financial, Inc. | | | 2,083,401 |
| 95,750 | | | | Travelers Cos., Inc. | | | 4,327,900 |
| | | | | | | |
| | | | | | | 21,270,077 |
| | | | | | | |
| Internet: 1.9% |
| 49,850 | | @ | | Amazon.com, Inc. | | | 2,556,308 |
| 176,000 | | @ | | eBay, Inc. | | | 2,456,960 |
| 37,650 | | @ | | Google, Inc. - Class A | | | 11,583,023 |
| 133,200 | | @ | | Symantec Corp. | | | 1,800,864 |
| 218,600 | | @ | | Yahoo!, Inc. | | | 2,666,920 |
| | | | | | | |
| | | | | | | 21,064,075 |
| | | | | | | |
| | | | | | | |
| Shares | | | | | | Value |
| | | | | | | |
| Iron/Steel: 0.3% |
| 50,150 | | | | Nucor Corp. | | $ | 2,316,930 |
| 18,800 | | | | United States Steel Corp. | | | 699,360 |
| | | | | | | |
| | | | | | | 3,016,290 |
| | | | | | | |
| Leisure Time: 0.1% |
| 69,150 | | | | Carnival Corp. | | | 1,681,728 |
| | | | | | | |
| | | | | | | 1,681,728 |
| | | | | | | |
| Lodging: 0.0% |
| 16,700 | | @ | | Las Vegas Sands Corp. | | | 99,031 |
| | | | | | | |
| | | | | | | 99,031 |
| | | | | | | |
| Machinery - Construction & Mining: 0.4% |
| 97,700 | | | | Caterpillar, Inc. | | | 4,364,259 |
| | | | | | | |
| | | | | | | 4,364,259 |
| | | | | | | |
| Machinery - Diversified: 0.2% |
| 68,300 | | | | Deere & Co. | | | 2,617,256 |
| | | | | | | |
| | | | | | | 2,617,256 |
| | | | | | | |
| Media: 2.5% |
| 444,550 | | | | Comcast Corp. - Class A | | | 7,504,004 |
| 94,400 | | @ | | DIRECTV Group, Inc. | | | 2,162,704 |
| 367,450 | | | | News Corp. - Class A | | | 3,340,121 |
| 24,650 | | @ | | Time Warner Cable, Inc. | | | 528,743 |
| 567,450 | | | | Time Warner, Inc. | | | 5,708,547 |
| 88,800 | | @ | | Viacom - Class B | | | 1,692,528 |
| 302,100 | | | | Walt Disney Co. | | | 6,854,649 |
| | | | | | | |
| | | | | | | 27,791,296 |
| | | | | | | |
| Mining: 0.6% | | | |
| 129,300 | | | | Alcoa, Inc. | | | 1,455,918 |
| 60,700 | | | | Freeport-McMoRan Copper & Gold, Inc. | | | 1,483,508 |
| 69,300 | | | | Newmont Mining Corp. | | | 2,820,510 |
| 34,900 | | | | Southern Copper Corp. | | | 560,494 |
| | | | | | | |
| | | | | | | 6,320,430 |
| | | | | | | |
| Miscellaneous Manufacturing: 4.0% |
| 111,550 | | | | 3M Co. | | | 6,418,587 |
| 40,600 | | | | Danaher Corp. | | | 2,298,366 |
| 1,662,500 | | | | General Electric Co. | | | 26,932,478 |
| 117,600 | | | | Honeywell International, Inc. | | | 3,860,808 |
| 74,500 | | | | Illinois Tool Works, Inc. | | | 2,611,225 |
| 76,200 | | @@ | | Tyco International Ltd. | | | 1,645,920 |
| | | | | | | |
| | | | | | | 43,767,384 |
| | | | | | | |
| Oil & Gas: 12.6% |
| 74,300 | | | | Anadarko Petroleum Corp. | | | 2,864,265 |
| 52,750 | | S | | Apache Corp. | | | 3,931,458 |
| 91,500 | | | | Chesapeake Energy Corp. | | | 1,479,555 |
| 328,150 | | | | Chevron Corp. | | | 24,273,256 |
| 244,400 | | | | ConocoPhillips | | | 12,659,920 |
| 70,650 | | | | Devon Energy Corp. | | | 4,642,412 |
| 39,400 | | | | EOG Resources, Inc. | | | 2,623,252 |
| 834,800 | | | | ExxonMobil Corp. | | | 66,642,084 |
| 44,400 | | | | Hess Corp. | | | 2,381,616 |
| 112,350 | | | | Marathon Oil Corp. | | | 3,073,896 |
| 130,150 | | | | Occidental Petroleum Corp. | | | 7,807,699 |
| 83,750 | | | | Valero Energy Corp. | | | 1,812,350 |
| 87,450 | | | | XTO Energy, Inc. | | | 3,084,362 |
| | | | | | | |
| | | | | | | 137,276,125 |
| | | | | | | |
See Accompanying Notes to Financial Statements
47
| | |
| ING RUSSELL™ LARGE CAP INDEX PORTFOLIO | | PORTFOLIO OF INVESTMENTS ASOF DECEMBER 31, 2008 (CONTINUED) |
| | | | | | | |
| Shares | | | | | | Value |
| | | | | | | |
| Oil & Gas Services: 1.4% |
| 48,700 | | | | Baker Hughes, Inc. | | $ | 1,561,809 |
| 138,200 | | | | Halliburton Co. | | | 2,512,476 |
| 65,800 | | @ | | National Oilwell Varco, Inc. | | | 1,608,152 |
| 189,000 | | | | Schlumberger Ltd. | | | 8,000,370 |
| 107,800 | | @ | | Weatherford International Ltd. | | | 1,166,396 |
| | | | | | | |
| | | | | | | 14,849,203 |
| | | | | | | |
| Pharmaceuticals: 6.8% |
| 244,550 | | | | Abbott Laboratories | | | 13,051,634 |
| 313,850 | | | | Bristol-Myers Squibb Co. | | | 7,297,013 |
| 56,450 | | | | Cardinal Health, Inc. | | | 1,945,832 |
| 158,500 | | | | Eli Lilly & Co. | | | 6,382,795 |
| 80,300 | | @ | | Medco Health Solutions, Inc. | | | 3,365,373 |
| 340,400 | | | | Merck & Co., Inc. | | | 10,348,160 |
| 1,072,500 | | | | Pfizer, Inc. | | | 18,993,975 |
| 257,050 | | | | Schering-Plough Corp. | | | 4,377,562 |
| 211,400 | | | | Wyeth | | | 7,929,614 |
| | | | | | | |
| | | | | | | 73,691,958 |
| | | | | | | |
| Pipelines: 0.1% |
| 92,800 | | | | Williams Cos., Inc. | | | 1,343,744 |
| | | | | | | |
| | | | | | | 1,343,744 |
| | | | | | | |
| Retail: 5.9% |
| 53,150 | | | | Best Buy Co., Inc. | | | 1,494,047 |
| 68,850 | | | | Costco Wholesale Corp. | | | 3,614,625 |
| 226,650 | | | | CVS Caremark Corp. | | | 6,513,921 |
| 267,950 | | | | Home Depot, Inc. | | | 6,168,209 |
| 231,750 | | | | Lowe’s Cos., Inc. | | | 4,987,260 |
| 179,650 | | | | McDonald’s Corp. | | | 11,172,434 |
| 111,200 | | | | Staples, Inc. | | | 1,992,704 |
| 125,100 | | | | Target Corp. | | | 4,319,703 |
| 157,000 | | | | Walgreen Co. | | | 3,873,190 |
| 355,800 | | | | Wal-Mart Stores, Inc. | | | 19,946,148 |
| | | | | | | |
| | | | | | | 64,082,241 |
| | | | | | | |
| Semiconductors: 1.7% |
| 214,600 | | | | Applied Materials, Inc. | | | 2,173,898 |
| 908,000 | | | | Intel Corp. | | | 13,311,280 |
| 209,650 | | | | Texas Instruments, Inc. | | | 3,253,768 |
| | | | | | | |
| | | | | | | 18,738,946 |
| | | | | | | |
| Software: 3.5% |
| 84,450 | | @ | | Adobe Systems, Inc. | | | 1,797,941 |
| 1,272,650 | | S | | Microsoft Corp. | | | 24,740,316 |
| 617,450 | | @ | | Oracle Corp. | | | 10,947,389 |
| 6,700 | | @ | | VMware, Inc. | | | 158,723 |
| | | | | | | |
| | | | | | | 37,644,369 |
| | | | | | | |
| Telecommunications: 6.6% |
| 941,900 | | | | AT&T, Inc. | | | 26,844,150 |
| 936,600 | | @ | | Cisco Systems, Inc. | | | 15,266,580 |
| 249,750 | | | | Corning, Inc. | | | 2,380,118 |
| 357,450 | | | | Motorola, Inc. | | | 1,583,504 |
| 256,400 | | | | Qualcomm, Inc. | | | 9,186,812 |
| 440,250 | | | | Sprint Nextel Corp. | | | 805,658 |
| 452,000 | | | | Verizon Communications, Inc. | | | 15,322,800 |
| | | | | | | |
| | | | | | | 71,389,622 |
| | | | | | | |
| Transportation: 2.0% |
| 44,700 | | | | Burlington Northern Santa Fe Corp. | | | 3,384,237 |
| 64,200 | | | | CSX Corp. | | | 2,084,574 |
| 49,250 | | | | FedEx Corp. | | | 3,159,388 |
| | | | | | | |
| Shares | | | | | | Value |
| | | | | | | |
| Transportation: (continued) |
| 59,500 | | | | Norfolk Southern Corp. | | $ | 2,799,475 |
| 81,900 | | | | Union Pacific Corp. | | | 3,914,820 |
| 108,500 | | | | United Parcel Service, Inc. - Class B | | | 5,984,860 |
| | | | | | | |
| | | | | | | 21,327,354 |
| | | | | | | |
| | | | Total Common Stock
(Cost $1,315,775,095) | | | 1,031,368,914 |
| | | | | | | |
| REAL ESTATE INVESTMENT TRUSTS: 0.2% |
| Regional Malls: 0.2% |
| 35,700 | | | | Simon Property Group, Inc. | | | 1,896,741 |
| | | | | | | |
| | | | Total Real Estate Investment Trusts
(Cost $2,875,449) | | | 1,896,741 |
| | | | | | | |
| | | | Total Long-Term Investments
(Cost $1,318,650,544) | | | 1,033,265,655 |
| | | | | | | |
| | | | | | | | | | |
| SHORT-TERM INVESTMENTS: 3.1% |
| Affiliated Mutual Fund: 3.1% |
| 33,732,000 | | S | | ING Institutional Prime Money Market Fund - Class I | | | | | | 33,732,000 |
| | | | | | | | | | |
| | | | Total Short-Term Investments
(Cost $33,732,000) | | | | | | 33,732,000 |
| | | | | | | | | | |
| | | | Total Investments in Securities
(Cost $1,352,382,544)* | | 98.1 | % | | $ | 1,066,997,655 |
| | | | Other Assets and Liabilities - Net | | 1.9 | | | | 20,641,235 |
| | | | | | | | | | |
| | | | Net Assets | | 100.0 | % | | $ | 1,087,638,890 |
| | | | | | | | | | |
| @ | Non-income producing security |
| ## | On September 7, 2008, the Federal Housing Finance Agency placed the Federal National Mortgage Association and the Federal Home Loan Mortgage Corporation into conservatorship and the U.S. Treasury guaranteed the debt issued by those organizations. |
| S | All or a portion of this security is segregated to cover collateral requirements for applicable futures, options, swaps, foreign forward currency contracts and/or when-issued or delayed-delivery securities. |
| * | Cost for federal income tax purposes is $1,362,798,818. |
| | | | |
Net unrealized depreciation consists of: | |
Gross Unrealized Appreciation | | $ | 3,029,284 | |
Gross Unrealized Depreciation | | | (298,830,447 | ) |
| | | | |
Net Unrealized Depreciation | | $ | (295,801,163 | ) |
| | | | |
See Accompanying Notes to Financial Statements
48
| | |
| ING RUSSELL™ LARGE CAP INDEX PORTFOLIO | | PORTFOLIO OF INVESTMENTS ASOF DECEMBER 31, 2008 (CONTINUED) |
The following table summarizes the inputs used as of December 31, 2008 in determining the Portfolio’s investments at fair value for purposes of SFAS 157:
| | | | | | |
| | | Investments in
Securities | | Other Financial
Instruments* |
Level 1 — Quoted Prices | | $ | 1,066,788,159 | | $ | 1,056,411 |
Level 2 — Other Significant Observable Inputs | | | 209,496 | | | — |
Level 3 — Significant Unobservable Inputs | | | — | | | — |
| | | | | | |
Total | | $ | 1,066,997,655 | | $ | 1,056,411 |
| | | | | | |
“Fair value” for purposes of SFAS 157 is different from “fair value” as used in the 1940 Act. The former generally implies market value, and can include market quotations as a source of value, and the latter refers to determinations of actual value in absence of available market quotations.
| * | Other financial instruments may include forward foreign currency contracts, futures, swaps, and written options. Forward foreign currency contracts and futures are reported at their unrealized gain/loss at year end. Swaps and written options are reported at their market value at year end. |
ING Russell Large Cap Index Portfolio Open Futures Contracts on December 31, 2008
| | | | | | | |
Contract Description | | Number
of
Contracts | | Expiration
Date | | Unrealized
Appreciation/
(Depreciation) |
Long Contracts | | | | | | | |
S&P 500® | | 216 | | 03/19/09 | | $ | 1,056,411 |
| | | | | | | |
| | | | | | $ | 1,056,411 |
| | | | | | | |
See Accompanying Notes to Financial Statements
49
| | |
| ING RUSSELL™ MID CAP INDEX PORTFOLIO | | PORTFOLIO OF INVESTMENTS ASOF DECEMBER 31, 2008 |
| | | | | | | |
| Shares | | | | | | Value |
| | | | | | | |
| COMMON STOCK: 89.5% | | | |
| Advertising: 0.1% | | | |
| 2,300 | | @ | | Clear Channel Outdoor Holdings, Inc. | | $ | 14,145 |
| 27,050 | | @ | | Interpublic Group of Cos., Inc. | | | 107,118 |
| 4,450 | | @, L | | Lamar Advertising Co. | | | 55,892 |
| | | | | | | |
| | | | | | | 177,155 |
| | | | | | | |
| Aerospace/Defense: 1.0% | | | |
| 1,900 | | @, L | | Alliant Techsystems, Inc. | | | 162,944 |
| 5,750 | | @ | | BE Aerospace, Inc. | | | 44,218 |
| 7,150 | | | | Goodrich Corp. | | | 264,693 |
| 7,050 | | | | L-3 Communications Holdings, Inc. | | | 520,149 |
| 9,200 | | | | Rockwell Collins, Inc. | | | 359,628 |
| 5,950 | | @ | | Spirit Aerosystems Holdings, Inc. | | | 60,512 |
| | | | | | | |
| | | | | | | 1,412,144 |
| | | | | | | |
| Agriculture: 1.1% | | | |
| 6,950 | | L | | Bunge Ltd. | | | 359,802 |
| 10,000 | | | | Lorillard, Inc. | | | 563,500 |
| 8,500 | | | | UST, Inc. | | | 589,730 |
| | | | | | | |
| | | | | | | 1,513,032 |
| | | | | | | |
| Airlines: 0.8% | | | |
| 15,950 | | @ | | AMR Corp. | | | 170,187 |
| 6,250 | | @ | | Continental Airlines, Inc. | | | 112,875 |
| 1,700 | | @@ | | Copa Holdings SA | | | 51,544 |
| 34,312 | | @ | | Delta Airlines, Inc. | | | 393,216 |
| 41,900 | | | | Southwest Airlines Co. | | | 361,178 |
| | | | | | | |
| | | | | | | 1,089,000 |
| | | | | | | |
| Apparel: 0.6% | | | |
| 19,500 | | @ | | Coach, Inc. | | | 405,015 |
| 5,350 | | @ | | Hanesbrands, Inc. | | | 68,213 |
| 4,950 | | | | Jones Apparel Group, Inc. | | | 29,007 |
| 3,150 | | | | Polo Ralph Lauren Corp. | | | 143,042 |
| 4,950 | | | | VF Corp. | | | 271,112 |
| | | | | | | |
| | | | | | | 916,389 |
| | | | | | | |
| Auto Manufacturers: 0.3% | | | |
| 132,563 | | @, L | | Ford Motor Co. | | | 303,569 |
| 27,950 | | L | | General Motors Corp. | | | 89,440 |
| 4,250 | | | | Oshkosh Truck Corp. | | | 37,783 |
| | | | | | | |
| | | | | | | 430,792 |
| | | | | | | |
| Auto Parts & Equipment: 0.3% | | | |
| 4,150 | | @@ | | Autoliv, Inc. | | | 89,059 |
| 6,650 | | S | | BorgWarner, Inc. | | | 144,771 |
| 1,300 | | @ | | Federal Mogul Corp. | | | 5,499 |
| 13,850 | | @ | | Goodyear Tire & Rubber Co. | | | 82,685 |
| 2,850 | | @ | | TRW Automotive Holdings Corp. | | | 10,260 |
| 3,750 | | | | WABCO Holdings, Inc. | | | 59,213 |
| | | | | | | |
| | | | | | | 391,487 |
| | | | | | | |
| Banks: 2.9% | | | |
| 7,350 | | | | Associated Banc-Corp. | | | 153,836 |
| 4,750 | | | | Bancorpsouth, Inc. | | | 110,960 |
| 2,750 | | | | Bank of Hawaii Corp. | | | 124,218 |
| 1,300 | | | | BOK Financial Corp. | | | 52,520 |
| 2,300 | | | | City National Corp. | | | 112,010 |
| 8,600 | | | | Comerica, Inc. | | | 170,710 |
| 3,512 | | | | Commerce Bancshares, Inc. | | | 154,352 |
| 3,350 | | | | Cullen/Frost Bankers, Inc. | | | 169,778 |
| 28,850 | | | | Fifth Third Bancorp. | | | 238,301 |
| 400 | | | | First Citizens BancShares, Inc. | | | 61,120 |
| 11,802 | | L | | First Horizon National Corp. | | | 124,747 |
| | | | | | | |
| Shares | | | | | | Value |
| | | | | | | |
| Banks: (continued) | | | |
| 10,000 | | | | Fulton Financial Corp. | | $ | 96,200 |
| 21,000 | | L | | Huntington Bancshares, Inc. | | | 160,860 |
| 28,250 | | | | Keycorp | | | 240,690 |
| 3,750 | | | | M&T Bank Corp. | | | 215,288 |
| 14,850 | | L | | Marshall & Ilsley Corp. | | | 202,554 |
| 12,600 | | | | Northern Trust Corp. | | | 656,964 |
| 16,150 | | @@ | | Popular, Inc. | | | 83,334 |
| 39,850 | | | | Regions Financial Corp. | | | 317,206 |
| 16,150 | | | | Synovus Financial Corp. | | | 134,045 |
| 7,250 | | | | TCF Financial Corp. | | | 99,035 |
| 7,585 | | | | Valley National Bancorp. | | | 153,596 |
| 3,050 | | | | Webster Financial Corp. | | | 42,029 |
| 3,650 | | | | Whitney Holding Corp. | | | 58,364 |
| 3,850 | | | | Wilmington Trust Corp. | | | 85,624 |
| 6,650 | | | | Zions Bancorp. | | | 162,992 |
| | | | | | | |
| | | | | | | 4,181,333 |
| | | | | | | |
| Beverages: 1.2% | | | |
| 5,912 | | | | Brown-Forman Corp. | | | 304,409 |
| 2,300 | | @ | | Central European Distribution Corp. | | | 45,310 |
| 18,250 | | | | Coca-Cola Enterprises, Inc. | | | 219,548 |
| 10,600 | | @ | | Constellation Brands, Inc. | | | 167,162 |
| 14,550 | | @ | | Dr Pepper Snapple Group, Inc. | | | 236,438 |
| 4,150 | | @, L | | Hansen Natural Corp. | | | 139,150 |
| 6,650 | | | | Molson Coors Brewing Co. | | | 325,318 |
| 7,850 | | | | Pepsi Bottling Group, Inc. | | | 176,704 |
| 3,350 | | | | PepsiAmericas, Inc. | | | 68,206 |
| | | | | | | |
| | | | | | | 1,682,245 |
| | | | | | | |
| Biotechnology: 0.7% | | | |
| 400 | | @ | | Abraxis Bioscience, Inc. | | | 26,368 |
| 7,850 | | @ | | Amylin Pharmaceuticals, Inc. | | | 85,173 |
| 3,950 | | @ | | Charles River Laboratories International, Inc. | | | 103,490 |
| 7,050 | | @, L | | Illumina, Inc. | | | 183,653 |
| 9,511 | | @ | | Life Technologies Corp. | | | 221,701 |
| 3,150 | | @ | | Millipore Corp. | | | 162,288 |
| 8,500 | | @, S | | Vertex Pharmaceuticals, Inc. | | | 258,230 |
| | | | | | | |
| | | | | | | 1,040,903 |
| | | | | | | |
| Building Materials: 0.5% | | | |
| 1,200 | | @ | | Armstrong World Industries, Inc. | | | 25,944 |
| 2,500 | | | | Eagle Materials, Inc. | | | 46,025 |
| 2,700 | | | | Lennox International, Inc. | | | 87,183 |
| 2,300 | | | | Martin Marietta Materials, Inc. | | | 223,284 |
| 20,700 | | | | Masco Corp. | | | 230,391 |
| 4,350 | | @ | | Owens Corning, Inc. | | | 75,255 |
| 3,850 | | @ | | USG Corp. | | | 30,954 |
| | | | | | | |
| | | | | | | 719,036 |
| | | | | | | |
| Chemicals: 2.5% | | | |
| 4,750 | | | | Airgas, Inc. | | | 185,203 |
| 5,250 | | | | Albemarle Corp. | | | 117,075 |
| 4,150 | | | | Ashland, Inc. | | | 43,617 |
| 3,750 | | | | Cabot Corp. | | | 57,375 |
| 8,200 | | | | Celanese Corp. | | | 101,926 |
| 3,150 | | | | CF Industries Holdings, Inc. | | | 154,854 |
| 13,950 | | | | Chemtura Corp. | | | 19,530 |
| 2,750 | | | | Cytec Industries, Inc. | | | 58,355 |
| 4,350 | | | | Eastman Chemical Co. | | | 137,939 |
| 10,000 | | | | Ecolab, Inc. | | | 351,500 |
| 4,250 | | | | FMC Corp. | | | 190,103 |
| 9,300 | | | | Huntsman Corp. | | | 31,992 |
See Accompanying Notes to Financial Statements
50
| | |
| ING RUSSELL™ MID CAP INDEX PORTFOLIO | | PORTFOLIO OF INVESTMENTS ASOF DECEMBER 31, 2008 (CONTINUED) |
| | | | | | | |
| Shares | | | | | | Value |
| | | | | | | |
| Chemicals: (continued) | | | |
| 4,650 | | | | International Flavors & Fragrances, Inc. | | $ | 138,198 |
| 2,000 | | @ | | Intrepid Potash, Inc. | | | 41,540 |
| 3,950 | | | | Lubrizol Corp. | | | 143,741 |
| 9,400 | | | | PPG Industries, Inc. | | | 398,842 |
| 7,650 | | | | Rohm & Haas Co. | | | 472,694 |
| 7,450 | | | | RPM International, Inc. | | | 99,011 |
| 5,850 | | S | | Sherwin-Williams Co. | | | 349,538 |
| 7,450 | | | | Sigma-Aldrich Corp. | | | 314,688 |
| 5,850 | | | | Terra Industries, Inc. | | | 97,520 |
| 400 | | | | Valhi, Inc. | | | 4,280 |
| 5,750 | | | | Valspar Corp. | | | 104,018 |
| | | | | | | |
| | | | | | | 3,613,539 |
| | | | | | | |
| Coal: 0.5% | | | |
| 4,050 | | @ | | Alpha Natural Resources, Inc. | | | 65,570 |
| 8,250 | | | | Arch Coal, Inc. | | | 134,393 |
| 10,400 | | | | Consol Energy, Inc. | | | 297,232 |
| 2,600 | | | | Foundation Coal Holdings, Inc. | | | 36,452 |
| 4,650 | | | | Massey Energy Co. | | | 64,124 |
| 4,450 | | @ | | Patriot Coal Corp. | | | 27,813 |
| 3,150 | | | | Walter Industries, Inc. | | | 55,157 |
| | | | | | | |
| | | | | | | 680,741 |
| | | | | | | |
| Commercial Services: 3.9% | | | |
| 3,850 | | @ | | Alliance Data Systems Corp. | | | 179,141 |
| 7,350 | | @ | | Apollo Group, Inc. - Class A | | | 563,157 |
| 5,850 | | @ | | Avis Budget Group, Inc. | | | 4,095 |
| 2,300 | | @ | | Brink’s Home Security Holdings, Inc. | | | 50,416 |
| 5,150 | | @ | | Career Education Corp. | | | 92,391 |
| 7,050 | | @ | | Convergys Corp. | | | 45,191 |
| 2,000 | | | | Corporate Executive Board Co. | | | 44,120 |
| 7,150 | | @ | | Corrections Corp. of America | | | 116,974 |
| 3,550 | | | | DeVry, Inc. | | | 203,806 |
| 7,450 | | | | Equifax, Inc. | | | 197,574 |
| 2,850 | | @ | | FTI Consulting, Inc. | | | 127,338 |
| 3,450 | | @, @@ | | Genpact Ltd. | | | 28,359 |
| 4,550 | | | | Global Payments, Inc. | | | 149,195 |
| 18,650 | | | | H&R Block, Inc. | | | 423,728 |
| 18,450 | | @ | | Hertz Global Holdings, Inc. | | | 93,542 |
| 5,650 | | @ | | Hewitt Associates, Inc. | | | 160,347 |
| 3,550 | | | | Hillenbrand, Inc. | | | 59,214 |
| 10,300 | | @ | | Iron Mountain, Inc. | | | 254,719 |
| 2,200 | | @ | | ITT Educational Services, Inc. | | | 208,956 |
| 5,600 | | | | Lender Processing Services, Inc. | | | 164,920 |
| 4,550 | | | | Manpower, Inc. | | | 154,655 |
| 6,850 | | @ | | Monster Worldwide, Inc. | | | 82,817 |
| 11,300 | | | | Moody’s Corp. | | | 227,017 |
| 900 | | @ | | Morningstar, Inc. | | | 31,950 |
| 18,550 | | | | Paychex, Inc. | | | 487,494 |
| 6,150 | | L | | Pharmaceutical Product Development, Inc. | | | 178,412 |
| 11,300 | | @ | | Quanta Services, Inc. | | | 223,740 |
| 8,250 | | | | Robert Half International, Inc. | | | 171,765 |
| 12,100 | | | | RR Donnelley & Sons Co. | | | 164,318 |
| 11,600 | | @ | | SAIC, Inc. | | | 225,968 |
| 14,950 | | | | Service Corp. International | | | 74,302 |
| 800 | | | | Strayer Education, Inc. | | | 171,528 |
| 2,120 | | @ | | Ticketmaster | | | 13,610 |
| 9,400 | | | | Total System Services, Inc. | | | 131,600 |
| 369 | | @ | | Tree.com, Inc. | | | 959 |
| | | | | | | |
| Shares | | | | | | Value |
| | | | | | | |
| Commercial Services: (continued) | | | |
| 3,350 | | @ | | United Rentals, Inc. | | $ | 30,552 |
| 2,100 | | | | Weight Watchers International, Inc. | | | 61,782 |
| | | | | | | |
| | | | | | | 5,599,652 |
| | | | | | | |
| Computers: 1.9% | | | |
| 5,150 | | @ | | Affiliated Computer Services, Inc. | | | 236,643 |
| 21,600 | | @ | | Brocade Communications Systems, Inc. | | | 60,480 |
| 14,850 | | @ | | Cadence Design Systems, Inc. | | | 54,351 |
| 16,650 | | @ | | Cognizant Technology Solutions Corp. | | | 300,699 |
| 8,600 | | @ | | Computer Sciences Corp. | | | 302,204 |
| 3,750 | | | | Diebold, Inc. | | | 105,338 |
| 2,500 | | @, L | | DST Systems, Inc. | | | 94,950 |
| 2,500 | | @ | | IHS, Inc. | | | 93,550 |
| 5,050 | | @ | | Lexmark International, Inc. | | | 135,845 |
| 9,600 | | @ | | NCR Corp. | | | 135,744 |
| 19,700 | | @ | | NetApp, Inc. | | | 275,209 |
| 12,900 | | @ | | Sandisk Corp. | | | 123,840 |
| 27,750 | | | | Seagate Technology, Inc. | | | 122,933 |
| 44,800 | | @ | | Sun Microsystems, Inc. | | | 171,136 |
| 8,150 | | @ | | Synopsys, Inc. | | | 150,938 |
| 10,300 | | @ | | Teradata Corp. | | | 152,749 |
| 20,400 | | @ | | Unisys Corp. | | | 17,340 |
| 12,700 | | @ | | Western Digital Corp. | | | 145,415 |
| | | | | | | |
| | | | | | | 2,679,364 |
| | | | | | | |
| Cosmetics/Personal Care: 0.6% | | | |
| 4,950 | | | | Alberto-Culver Co. | | | 121,325 |
| 24,500 | | S | | Avon Products, Inc. | | | 588,735 |
| 3,450 | | @ | | Bare Escentuals, Inc. | | | 18,044 |
| 5,650 | | | | Estee Lauder Cos., Inc. | | | 174,924 |
| | | | | | | |
| | | | | | | 903,028 |
| | | | | | | |
| Distribution/Wholesale: 0.9% | | | |
| 7,450 | | | | Fastenal Co. | | | 259,633 |
| 9,400 | | | | Genuine Parts Co. | | | 355,884 |
| 9,600 | | @ | | Ingram Micro, Inc. | | | 128,544 |
| 7,750 | | @ | | LKQ Corp. | | | 90,365 |
| 3,050 | | @ | | Tech Data Corp. | | | 54,412 |
| 2,400 | | @ | | Wesco International, Inc. | | | 46,152 |
| 4,350 | | | | WW Grainger, Inc. | | | 342,954 |
| | | | | | | |
| | | | | | | 1,277,944 |
| | | | | | | |
| Diversified Financial Services: 2.5% | | | |
| 2,300 | | @ | | Affiliated Managers Group, Inc. | | | 96,416 |
| 6,650 | | @, L | | AmeriCredit Corp. | | | 50,806 |
| 12,800 | | | | Ameriprise Financial, Inc. | | | 299,008 |
| 16,250 | | | | CIT Group, Inc. | | | 73,775 |
| 27,450 | | | | Discover Financial Services | | | 261,599 |
| 24,100 | | @ | | E*Trade Financial Corp. | | | 27,715 |
| 5,850 | | | | Eaton Vance Corp. | | | 122,909 |
| 4,950 | | | | Federated Investors, Inc. | | | 83,952 |
| 2,850 | | | | GLG Partners, Inc. | | | 6,470 |
| 4,050 | | @ | | IntercontinentalExchange, Inc. | | | 333,882 |
| 22,200 | | | | Invesco Ltd. | | | 320,568 |
| 2,500 | | @ | | Investment Technology Group, Inc. | | | 56,800 |
| 9,400 | | | | Janus Capital Group, Inc. | | | 75,482 |
| 7,250 | | | | Jefferies Group, Inc. | | | 101,935 |
| 4,350 | | @@ | | Lazard Ltd. | | | 129,369 |
| 7,950 | | | | Legg Mason, Inc. | | | 174,185 |
See Accompanying Notes to Financial Statements
51
| | |
| ING RUSSELL™ MID CAP INDEX PORTFOLIO | | PORTFOLIO OF INVESTMENTS ASOF DECEMBER 31, 2008 (CONTINUED) |
| | | | | | | |
| Shares | | | | | | Value |
| | | | | | | |
| Diversified Financial Services: (continued) | | | |
| 5,650 | | @, @@, L | | MF Global Ltd. | | $ | 11,526 |
| 7,750 | | @ | | Nasdaq Stock Market, Inc. | | | 191,503 |
| 5,450 | | | | Raymond James Financial, Inc. | | | 93,359 |
| 26,750 | | @ | | SLM Corp. | | | 238,075 |
| 300 | | | | Student Loan Corp. | | | 12,300 |
| 14,850 | | | | T. Rowe Price Group, Inc. | | | 526,284 |
| 13,950 | | @ | | TD Ameritrade Holding Corp. | | | 198,788 |
| 4,950 | | | | Waddell & Reed Financial, Inc. | | | 76,527 |
| | | | | | | |
| | | | | | | 3,563,233 |
| | | | | | | |
| Electric: 7.0% | | | |
| 38,550 | | @ | | AES Corp. | | | 317,652 |
| 9,600 | | | | Allegheny Energy, Inc. | | | 325,056 |
| 6,350 | | | | Alliant Energy Corp. | | | 185,293 |
| 12,000 | | | | Ameren Corp. | | | 399,120 |
| 23,000 | | | | American Electric Power Co., Inc. | | | 765,440 |
| 20,300 | | @ | | Calpine Corp. | | | 147,784 |
| 13,000 | | | | CMS Energy Corp. | | | 131,430 |
| 15,650 | | | | Consolidated Edison, Inc. | | | 609,255 |
| 10,300 | | | | Constellation Energy Group, Inc. | | | 258,427 |
| 6,550 | | | | DPL, Inc. | | | 149,602 |
| 9,400 | | | | DTE Energy Co. | | | 335,298 |
| 28,350 | | @ | | Dynegy, Inc. - Class A | | | 56,700 |
| 18,650 | | | | Edison International | | | 599,038 |
| 6,750 | | | | Great Plains Energy, Inc. | | | 130,478 |
| 4,850 | | | | Hawaiian Electric Industries | | | 107,379 |
| 4,350 | | | | Integrys Energy Group, Inc. | | | 186,963 |
| 10,500 | | | | MDU Resources Group, Inc. | | | 226,590 |
| 9,000 | | @ | | Mirant Corp. | | | 169,830 |
| 8,900 | | | | Northeast Utilities | | | 214,134 |
| 13,500 | | @, L | | NRG Energy, Inc. | | | 314,955 |
| 6,150 | | | | NSTAR | | | 224,414 |
| 13,400 | | | | NV Energy, Inc. | | | 132,526 |
| 5,250 | | | | OGE Energy Corp. | | | 135,345 |
| 20,500 | | | | Pacific Gas & Electric Co. | | | 793,555 |
| 11,500 | | | | Pepco Holdings, Inc. | | | 204,240 |
| 5,850 | | | | Pinnacle West Capital Corp. | | | 187,961 |
| 21,400 | | | | PPL Corp. | | | 656,766 |
| 14,950 | | | | Progress Energy, Inc. | | | 595,758 |
| 7,450 | | | | Puget Energy, Inc. | | | 203,162 |
| 19,900 | | @ | | Reliant Energy, Inc. | | | 115,022 |
| 6,750 | | | | SCANA Corp. | | | 240,300 |
| 12,100 | | | | TECO Energy, Inc. | | | 149,435 |
| 6,750 | | | | Wisconsin Energy Corp. | | | 283,365 |
| 24,700 | | | | Xcel Energy, Inc. | | | 458,185 |
| | | | | | | |
| | | | | | | 10,010,458 |
| | | | | | | |
| Electrical Components & Equipment: 0.6% | | | |
| 6,050 | | | | Ametek, Inc. | | | 182,771 |
| 3,250 | | @ | | Energizer Holdings, Inc. | | | 175,955 |
| 3,050 | | @, S | | General Cable Corp. | | | 53,955 |
| 3,150 | | | | Hubbell, Inc. | | | 102,942 |
| 7,750 | | | | Molex, Inc. | | | 112,298 |
| 4,700 | | @ | | Sunpower Corp. - Class A | | | 173,900 |
| | | | | | | |
| | | | | | | 801,821 |
| | | | | | | |
| Electronics: 1.7% | | | |
| 21,000 | | @ | | Agilent Technologies, Inc. | | | 328,230 |
| 10,100 | | | | Amphenol Corp. | | | 242,198 |
| 7,050 | | @ | | Arrow Electronics, Inc. | | | 132,822 |
| 8,600 | | @ | | Avnet, Inc. | | | 156,606 |
| 2,850 | | | | AVX Corp. | | | 22,629 |
| 2,950 | | @ | | Dolby Laboratories, Inc. | | | 96,642 |
| | | | | | | |
| Shares | | | | | | Value |
| | | | | | | |
| Electronics: (continued) | | | |
| 7,850 | | @ | | Flir Systems, Inc. | | $ | 240,838 |
| 7,350 | | @@ | | Garmin Ltd. | | | 140,900 |
| 8,250 | | | | Gentex Corp. | | | 72,848 |
| 2,000 | | @ | | Itron, Inc. | | | 127,480 |
| 12,000 | | | | Jabil Circuit, Inc. | | | 81,000 |
| 2,000 | | @, @@ | | Mettler Toledo International, Inc. | | | 134,800 |
| 3,250 | | | | National Instruments Corp. | | | 79,170 |
| 6,750 | | | | PerkinElmer, Inc. | | | 93,893 |
| 3,350 | | @ | | Thomas & Betts Corp. | | | 80,467 |
| 6,950 | | @ | | Trimble Navigation Ltd. | | | 150,190 |
| 10,700 | | @ | | Vishay Intertechnology, Inc. | | | 36,594 |
| 5,750 | | @ | | Waters Corp. | | | 210,738 |
| | | | | | | |
| | | | | | | 2,428,045 |
| | | | | | | |
| Energy - Alternate Sources: 0.1% | | | |
| 6,850 | | @ | | Covanta Holding Corp. | | | 150,426 |
| | | | | | | |
| | | | | | | 150,426 |
| | | | | | | |
| Engineering & Construction: 1.2% | | | |
| 5,850 | | @ | | Aecom Technology Corp. | | | 179,771 |
| 10,200 | | | | Fluor Corp. | | | 457,674 |
| 8,250 | | @, @@ | | Foster Wheeler Ltd. | | | 192,885 |
| 6,950 | | @ | | Jacobs Engineering Group, Inc. | | | 334,295 |
| 9,700 | | | | KBR, Inc. | | | 147,440 |
| 13,000 | | @ | | McDermott International, Inc. | | | 128,440 |
| 4,750 | | @ | | Shaw Group, Inc. | | | 97,233 |
| 4,850 | | @ | | URS Corp. | | | 197,735 |
| | | | | | | |
| | | | | | | 1,735,473 |
| | | | | | | |
| Entertainment: 0.4% | | | |
| 760 | | @ | | Ascent Media Corp. | | | 16,598 |
| 4,550 | | @ | | DreamWorks Animation SKG, Inc. | | | 114,933 |
| 17,750 | | | | International Game Technology | | | 211,048 |
| 1,900 | | | | International Speedway Corp. | | | 54,587 |
| 4,250 | | @ | | Penn National Gaming, Inc. | | | 90,865 |
| 4,550 | | | | Regal Entertainment Group | | | 46,456 |
| 3,750 | | @ | | Scientific Games Corp. | | | 65,775 |
| 3,150 | | L | | Warner Music Group Corp. | | | 9,513 |
| | | | | | | |
| | | | | | | 609,775 |
| | | | | | | |
| Environmental Control: 0.6% | | | |
| 8,150 | | | | Nalco Holding Co. | | | 94,051 |
| 18,660 | | | | Republic Services, Inc. | | | 462,581 |
| 4,950 | | @ | | Stericycle, Inc. | | | 257,796 |
| | | | | | | |
| | | | | | | 814,428 |
| | | | | | | |
| Food: 3.0% | | | |
| 12,500 | | | | Campbell Soup Co. | | | 375,125 |
| 25,950 | | | | ConAgra Foods, Inc. | | | 428,175 |
| 4,250 | | | | Corn Products International, Inc. | | | 122,613 |
| 7,750 | | @ | | Dean Foods Co. | | | 139,268 |
| 11,300 | | | | Del Monte Foods Co. | | | 80,682 |
| 8,800 | | | | Hershey Co. | | | 305,712 |
| 18,050 | | | | HJ Heinz Co. | | | 678,680 |
| 4,050 | | | | Hormel Foods Corp. | | | 125,874 |
| 6,750 | | | | JM Smucker Co. | | | 292,680 |
| 6,450 | | | | McCormick & Co., Inc. | | | 205,497 |
| 25,150 | | | | Safeway, Inc. | | | 597,816 |
| 40,550 | | | | Sara Lee Corp. | | | 396,985 |
| 6,750 | | @, L | | Smithfield Foods, Inc. | | | 94,973 |
| 12,100 | | | | Supervalu, Inc. | | | 176,660 |
| 16,850 | | | | Tyson Foods, Inc. | | | 147,606 |
| 8,050 | | L | | Whole Foods Market, Inc. | | | 75,992 |
| | | | | | | |
| | | | | | | 4,244,338 |
| | | | | | | |
See Accompanying Notes to Financial Statements
52
| | |
| ING RUSSELL™ MID CAP INDEX PORTFOLIO | | PORTFOLIO OF INVESTMENTS ASOF DECEMBER 31, 2008 (CONTINUED) |
| | | | | | | |
| Shares | | | | | | Value |
| | | | | | | |
| Forest Products & Paper: 0.6% | | | |
| 28,150 | | @, @@ | | Domtar Corp. | | $ | 47,011 |
| 24,500 | | | | International Paper Co. | | | 289,100 |
| 10,000 | | | | MeadWestvaco Corp. | | | 111,900 |
| 12,100 | | | | Weyerhaeuser Co. | | | 370,381 |
| | | | | | | |
| | | | | | | 818,392 |
| | | | | | | |
| Gas: 1.3% | | | |
| 4,350 | | | | AGL Resources, Inc. | | | 136,373 |
| 5,150 | | | | Atmos Energy Corp. | | | 122,055 |
| 18,850 | | | | CenterPoint Energy, Inc. | | | 237,887 |
| 4,050 | | | | Energen Corp. | | | 118,787 |
| 4,650 | | | | National Fuel Gas Co. | | | 145,685 |
| 15,750 | | | | NiSource, Inc. | | | 172,778 |
| 14,350 | | | | Sempra Energy | | | 611,741 |
| 6,450 | | | | Southern Union Co. | | | 84,108 |
| 6,150 | | | | UGI Corp. | | | 150,183 |
| 4,650 | | | | Vectren Corp. | | | 116,297 |
| | | | | | | |
| | | | | | | 1,895,894 |
| | | | | | | |
| Hand/Machine Tools: 0.5% | | | |
| 3,450 | | | | Black & Decker Corp. | | | 144,245 |
| 4,350 | | | | Kennametal, Inc. | | | 96,527 |
| 2,400 | | | | Lincoln Electric Holdings, Inc. | | | 122,232 |
| 3,250 | | | | Snap-On, Inc. | | | 127,985 |
| 4,450 | | | | Stanley Works | | | 151,745 |
| | | | | | | |
| | | | | | | 642,734 |
| | | | | | | |
| Healthcare - Products: 2.7% | | | |
| 2,950 | | @ | | Advanced Medical Optics, Inc. | | | 19,500 |
| 3,650 | | | | Beckman Coulter, Inc. | | | 160,381 |
| 2,600 | | | | Cooper Cos., Inc. | | | 42,640 |
| 5,750 | | | | CR Bard, Inc. | | | 484,495 |
| 8,500 | | | | Densply International, Inc. | | | 240,040 |
| 3,150 | | @ | | Edwards Lifesciences Corp. | | | 173,093 |
| 3,150 | | @ | | Gen-Probe, Inc. | | | 134,946 |
| 5,150 | | @ | | Henry Schein, Inc. | | | 188,954 |
| 3,550 | | | | Hill-Rom Holdings, Inc. | | | 58,433 |
| 14,750 | | @, L | | Hologic, Inc. | | | 192,783 |
| 9,100 | | @ | | Hospira, Inc. | | | 244,062 |
| 3,450 | | @ | | Idexx Laboratories, Inc. | | | 124,476 |
| 2,200 | | @ | | Intuitive Surgical, Inc. | | | 279,378 |
| 4,450 | | @ | | Inverness Medical Innovations, Inc. | | | 84,150 |
| 3,250 | | @ | | Kinetic Concepts, Inc. | | | 62,335 |
| 6,950 | | @ | | Patterson Cos., Inc. | | | 130,313 |
| 4,450 | | @ | | Resmed, Inc. | | | 166,786 |
| 19,400 | | @ | | St. Jude Medical, Inc. | | | 639,424 |
| 2,200 | | | | Techne Corp. | | | 141,944 |
| 7,250 | | @ | | Varian Medical Systems, Inc. | | | 254,040 |
| | | | | | | |
| | | | | | | 3,822,173 |
| | | | | | | |
| Healthcare - Services: 1.9% | | | |
| 2,100 | | L | | Brookdale Senior Living, Inc. | | | 11,718 |
| 16,050 | | | | Cigna Corp. | | | 270,443 |
| 5,550 | | @ | | Community Health Systems, Inc. | | | 80,919 |
| 3,650 | | @ | | Covance, Inc. | | | 168,010 |
| 8,700 | | @ | | Coventry Health Care, Inc. | | | 129,456 |
| 5,950 | | @ | | DaVita, Inc. | | | 294,942 |
| 13,950 | | @ | | Health Management Associates, Inc. | | | 24,971 |
| 6,150 | | @ | | Health Net, Inc. | | | 66,974 |
| 9,700 | | @ | | Humana, Inc. | | | 361,616 |
| 6,350 | | @ | | Laboratory Corp. of America Holdings | | | 409,004 |
| | | | | | | |
| Shares | | | | | | Value |
| | | | | | | |
| Healthcare - Services: (continued) | | | |
| 3,150 | | @ | | LifePoint Hospitals, Inc. | | $ | 71,946 |
| 4,150 | | @ | | Lincare Holdings, Inc. | | | 111,760 |
| 2,700 | | @ | | Pediatrix Medical Group, Inc. | | | 85,590 |
| 9,100 | | | | Quest Diagnostics | | | 472,381 |
| 27,450 | | @ | | Tenet Healthcare Corp. | | | 31,568 |
| 2,700 | | | | Universal Health Services, Inc. | | | 101,439 |
| 2,400 | | @ | | WellCare Health Plans, Inc. | | | 30,864 |
| | | | | | | |
| | | | | | | 2,723,601 |
| | | | | | | |
| Holding Companies - Diversified: 0.1% | | | |
| 10,200 | | | | Leucadia National Corp. | | | 201,960 |
| | | | | | | |
| | | | | | | 201,960 |
| | | | | | | |
| Home Builders: 0.6% | | | |
| 7,050 | | | | Centex Corp. | | | 75,012 |
| 18,150 | | | | D.R. Horton, Inc. | | | 128,321 |
| 4,350 | | L | | KB Home | | | 59,247 |
| 7,750 | | | | Lennar Corp. | | | 67,193 |
| 2,000 | | | | MDC Holdings, Inc. | | | 60,600 |
| 220 | | @ | | NVR, Inc. | | | 100,375 |
| 12,100 | | | | Pulte Homes, Inc. | | | 132,253 |
| 2,100 | | | | Thor Industries, Inc. | | | 27,678 |
| 7,550 | | @ | | Toll Brothers, Inc. | | | 161,797 |
| | | | | | | |
| | | | | | | 812,476 |
| | | | | | | |
| Home Furnishings: 0.2% | | | |
| 3,350 | | | | Harman International Industries, Inc. | | | 56,046 |
| 4,250 | | | | Whirlpool Corp. | | | 175,738 |
| | | | | | | |
| | | | | | | 231,784 |
| | | | | | | |
| Household Products/Wares: 0.9% | | | |
| 6,050 | | | | Avery Dennison Corp. | | | 198,017 |
| 3,850 | | | | Church & Dwight Co., Inc. | | | 216,062 |
| 7,850 | | | | Clorox Co. | | | 436,146 |
| 8,800 | | | | Fortune Brands, Inc. | | | 363,264 |
| 3,950 | | @ | | Jarden Corp. | | | 45,425 |
| 2,500 | | | | Scotts Miracle-Gro Co. | | | 74,300 |
| | | | | | | |
| | | | | | | 1,333,214 |
| | | | | | | |
| Housewares: 0.2% | | | |
| 15,850 | | | | Newell Rubbermaid, Inc. | | | 155,013 |
| 2,100 | | | | Toro Co. | | | 69,300 |
| | | | | | | |
| | | | | | | 224,313 |
| | | | | | | |
| Insurance: 5.6% | | | |
| 320 | | @ | | Alleghany Corp. | | | 90,240 |
| 2,850 | | | | Allied World Assurance Holdings Ltd. | | | 115,710 |
| 4,550 | | | | American Financial Group, Inc. | | | 104,104 |
| 900 | | | | American National Insurance | | | 66,357 |
| 15,850 | | | | AON Corp. | | | 724,028 |
| 2,600 | | @, @@ | | Arch Capital Group Ltd. | | | 182,260 |
| 5,350 | | | | Arthur J. Gallagher & Co. | | | 138,619 |
| 6,750 | | | | Assurant, Inc. | | | 202,500 |
| 8,500 | | @@ | | Axis Capital Holdings Ltd. | | | 247,520 |
| 6,650 | | | | Brown & Brown, Inc. | | | 138,985 |
| 8,400 | | | | Cincinnati Financial Corp. | | | 244,188 |
| 1,500 | | | | CNA Financial Corp. | | | 24,660 |
| 10,600 | | @ | | Conseco, Inc. | | | 54,908 |
| 3,050 | | @@ | | Endurance Specialty Holdings Ltd. | | | 93,117 |
| 1,800 | | | | Erie Indemnity Co. | | | 67,734 |
| 3,550 | | @@ | | Everest Re Group Ltd. | | | 270,297 |
| 12,200 | | | | Fidelity National Title Group, Inc. | | | 216,550 |
See Accompanying Notes to Financial Statements
53
| | |
| ING RUSSELL™ MID CAP INDEX PORTFOLIO | | PORTFOLIO OF INVESTMENTS ASOF DECEMBER 31, 2008 (CONTINUED) |
| | | | | | | |
| Shares | | | | | | Value |
| | | | | | | |
| Insurance: (continued) | | | |
| 5,250 | | | | First American Corp. | | $ | 151,673 |
| 24,750 | | | | Genworth Financial, Inc. | | | 70,043 |
| 2,950 | | | | Hanover Insurance Group, Inc. | | | 126,762 |
| 6,650 | | | | HCC Insurance Holdings, Inc. | | | 177,888 |
| 14,850 | | | | Lincoln National Corp. | | | 279,774 |
| 580 | | @ | | Markel Corp. | | | 173,420 |
| 29,250 | | | | Marsh & McLennan Cos., Inc. | | | 709,898 |
| 12,200 | | | | MBIA, Inc. | | | 49,654 |
| 1,500 | | | | Mercury General Corp. | | | 68,985 |
| 7,150 | | | | MGIC Investment Corp. | | | 24,882 |
| 2,600 | | | | Nationwide Financial Services | | | 135,746 |
| 13,200 | | | | Old Republic International Corp. | | | 157,344 |
| 1,300 | | | | OneBeacon Insurance Group Ltd. | | | 13,572 |
| 3,150 | | @@ | | PartnerRe Ltd. | | | 224,501 |
| 14,850 | | | | Principal Financial Group, Inc. | | | 335,165 |
| 38,850 | | | | Progressive Corp. | | | 575,369 |
| 4,050 | | | | Protective Life Corp. | | | 58,118 |
| 3,950 | | | | Reinsurance Group of America, Inc. | | | 169,139 |
| 3,550 | | @@ | | RenaissanceRe Holdings Ltd. | | | 183,038 |
| 2,850 | | | | Stancorp Financial Group, Inc. | | | 119,045 |
| 5,150 | | | | Torchmark Corp. | | | 230,205 |
| 1,500 | | | | Transatlantic Holdings, Inc. | | | 60,090 |
| 2,300 | | | | Unitrin, Inc. | | | 36,662 |
| 19,900 | | | | UnumProvident Corp. | | | 370,140 |
| 100 | | | | Wesco Financial Corp. | | | 28,790 |
| 480 | | | | White Mountains Insurance Group Ltd. | | | 128,213 |
| 8,250 | | | | WR Berkley Corp. | | | 255,750 |
| 18,950 | | @@ | | XL Capital, Ltd. | | | 70,115 |
| | | | | | | |
| | | | | | | 7,965,758 |
| | | | | | | |
| Internet: 1.0% | | | |
| 9,600 | | @ | | Akamai Technologies, Inc. | | | 144,864 |
| 5,854 | | @ | | Emdeon Corp. | | | 61,233 |
| 1,900 | | @ | | Equinix, Inc. | | | 101,061 |
| 11,900 | | @ | | Expedia, Inc. | | | 98,056 |
| 4,750 | | @ | | F5 Networks, Inc. | | | 108,585 |
| 5,300 | | @ | | IAC/InterActiveCorp | | | 83,369 |
| 34,000 | | @ | | Liberty Media Corp. - Interactive - Class A | | | 106,080 |
| 8,600 | | @ | | McAfee, Inc. | | | 297,302 |
| 2,200 | | @ | | Priceline.com, Inc. | | | 162,030 |
| 1,600 | | @, @@ | | Sohucom, Inc. | | | 75,744 |
| 11,200 | | @ | | VeriSign, Inc. | | | 213,696 |
| 400 | | @ | | WebMD Health Corp. | | | 9,436 |
| | | | | | | |
| | | | | | | 1,461,456 |
| | | | | | | |
| Investment Companies: 0.0% |
| 10,300 | | | | Allied Capital Corp. | | | 27,707 |
| 11,600 | | L | | American Capital Ltd. | | | 37,584 |
| | | | | | | |
| | | | | | | 65,291 |
| | | | | | | |
| Iron/Steel: 0.5% |
| 6,450 | | | | AK Steel Holding Corp. | | | 60,114 |
| 5,850 | | | | Allegheny Technologies, Inc. | | | 149,351 |
| 2,500 | | | | Carpenter Technology Corp. | | | 51,350 |
| 6,550 | | | | Cliffs Natural Resources, Inc. | | | 167,746 |
| 3,550 | | | | Reliance Steel & Aluminum Co. | | | 70,787 |
| 1,300 | | | | Schnitzer Steel Industries, Inc. | | | 48,945 |
| 9,300 | | | | Steel Dynamics, Inc. | | | 103,974 |
| | | | | | | |
| | | | | | | 652,267 |
| | | | | | | |
| | | | | | | |
| Shares | | | | | | Value |
| | | | | | | |
| Leisure Time: 0.2% |
| 13,600 | | | | Harley-Davidson, Inc. | | $ | 230,792 |
| 2,120 | | @ | | Interval Leisure Group, Inc. | | | 11,427 |
| 7,850 | | L | | Royal Caribbean Cruises Ltd. | | | 107,938 |
| | | | | | | |
| | | | | | | 350,157 |
| | | | | | | |
| Lodging: 0.6% |
| 3,250 | | L | | Boyd Gaming Corp. | | | 15,373 |
| 1,700 | | | | Choice Hotels International, Inc. | | | 51,102 |
| 16,950 | | | | Marriott International, Inc. | | | 329,678 |
| 7,150 | | @, L | | MGM Mirage | | | 98,384 |
| 2,400 | | @@ | | Orient-Express Hotels Ltd. | | | 18,384 |
| 10,700 | | | | Starwood Hotels & Resorts Worldwide, Inc. | | | 191,530 |
| 10,200 | | | | Wyndham Worldwide Corp. | | | 66,810 |
| 3,250 | | @, L | | Wynn Resorts Ltd. | | | 137,345 |
| | | | | | | |
| | | | | | | 908,606 |
| | | | | | | |
| Machinery - Construction & Mining: 0.2% |
| 4,250 | | | | Bucyrus International, Inc. | | | 78,710 |
| 6,150 | | | | Joy Global, Inc. | | | 140,774 |
| 5,850 | | @ | | Terex Corp. | | | 101,322 |
| | | | | | | |
| | | | | | | 320,806 |
| | | | | | | |
| Machinery - Diversified: 1.1% |
| 5,250 | | @ | | AGCO Corp. | | | 123,848 |
| 11,600 | | | | Cummins, Inc. | | | 310,068 |
| 3,250 | | | | Flowserve Corp. | | | 167,375 |
| 3,050 | | @ | | Gardner Denver, Inc. | | | 71,187 |
| 3,450 | | | | Graco, Inc. | | | 81,869 |
| 4,750 | | | | IDEX Corp. | | | 114,713 |
| 7,450 | | | | Manitowoc Co., Inc. | | | 64,517 |
| 8,500 | | | | Rockwell Automation, Inc. | | | 274,040 |
| 5,050 | | | | Roper Industries, Inc. | | | 219,221 |
| 3,750 | | @ | | Zebra Technologies Corp. | | | 75,975 |
| | | | | | | |
| | | | | | | 1,502,813 |
| | | | | | | |
| Media: 2.0% |
| 12,700 | | | | Cablevision Systems Corp. | | | 213,868 |
| 33,800 | | | | CBS Corp. - Class B | | | 276,822 |
| 2,100 | | @, @@, S, L | | Central European Media Enterprises Ltd. | | | 45,612 |
| 3,050 | | @, @@ | | CTC Media, Inc. | | | 14,640 |
| 16,150 | | @ | | Discovery Communications, Inc. - Class C | | | 216,249 |
| 11,700 | | @ | | Dish Network Corp. | | | 129,753 |
| 1,600 | | | | EW Scripps Co. | | | 3,536 |
| 2,400 | | | | Factset Research Systems, Inc. | | | 106,176 |
| 13,100 | | L | | Gannett Co., Inc. | | | 104,800 |
| 1,300 | | | | Hearst-Argyle Television, Inc. | | | 7,878 |
| 2,300 | | | | John Wiley & Sons, Inc. | | | 81,834 |
| 16,850 | | @ | | Liberty Global, Inc. | | | 268,252 |
| 6,450 | | @ | | Liberty Media Corp. - Capital Shares A | | | 30,380 |
| 29,650 | | @ | | Liberty Media Corp. - Entertainment | | | 518,282 |
| 18,350 | | | | McGraw-Hill Cos., Inc. | | | 425,537 |
| 2,200 | | | | Meredith Corp. | | | 37,664 |
| 8,250 | | L | | New York Times Co. | | | 60,473 |
| 4,950 | | | | Scripps Networks Interactive - Class A | | | 108,900 |
| 170,170 | | @ | | Sirius XM Radio, Inc. | | | 20,420 |
| 420 | | | | Washington Post | | | 163,905 |
| | | | | | | |
| | | | | | | 2,834,981 |
| | | | | | | |
See Accompanying Notes to Financial Statements
54
| | |
| ING RUSSELL™ MID CAP INDEX PORTFOLIO | | PORTFOLIO OF INVESTMENTS ASOF DECEMBER 31, 2008 (CONTINUED) |
| | | | | | | |
| Shares | | | | | | Value |
| | | | | | | |
| Metal Fabricate/Hardware: 0.5% |
| 6,550 | | | | Commercial Metals Co. | | $ | 77,749 |
| 7,950 | | | | Precision Castparts Corp. | | | 472,866 |
| 4,750 | | | | Timken Co. | | | 93,243 |
| 1,100 | | | | Valmont Industries, Inc. | | | 67,496 |
| | | | | | | |
| | | | | | | 711,354 |
| | | | | | | |
| Mining: 0.3% |
| 2,000 | | @ | | Century Aluminum Co. | | | 20,000 |
| 4,950 | | | | Titanium Metals Corp. | | | 43,610 |
| 6,250 | | | | Vulcan Materials Co. | | | 434,875 |
| | | | | | | |
| | | | | | | 498,485 |
| | | | | | | |
| Miscellaneous Manufacturing: 2.8% |
| 3,950 | | | | Aptargroup, Inc. | | | 139,198 |
| 2,300 | | | | Brink’s Co. | | | 61,824 |
| 3,450 | | | | Carlisle Cos., Inc. | | | 71,415 |
| 10,000 | | | | Cooper Industries Ltd. | | | 292,300 |
| 2,950 | | | | Crane Co. | | | 50,858 |
| 4,450 | | | | Donaldson Co., Inc. | | | 149,743 |
| 10,900 | | | | Dover Corp. | | | 358,828 |
| 16,550 | | L | | Eastman Kodak Co. | | | 108,899 |
| 9,400 | | | | Eaton Corp. | | | 467,274 |
| 4,850 | | | | Harsco Corp. | | | 134,248 |
| 17,960 | | @@ | | Ingersoll-Rand Co. | | | 311,606 |
| 10,400 | | | | ITT Corp. | | | 478,296 |
| 1,609 | | | | John Bean Technologies Corp. | | | 13,146 |
| 9,000 | | | | Leggett & Platt, Inc. | | | 136,710 |
| 7,050 | | | | Pall Corp. | | | 200,432 |
| 9,600 | | | | Parker Hannifin Corp. | | | 408,384 |
| 5,750 | | | | Pentair, Inc. | | | 136,103 |
| 3,150 | | | | SPX Corp. | | | 127,733 |
| 2,200 | | | | Teleflex, Inc. | | | 110,220 |
| 14,250 | | | | Textron, Inc. | | | 197,648 |
| 4,650 | | S | | Trinity Industries, Inc. | | | 73,284 |
| | | | | | | |
| | | | | | | 4,028,149 |
| | | | | | | |
| Office Furnishings: 0.0% |
| 3,550 | | | | Steelcase, Inc. | | | 19,951 |
| | | | | | | |
| | | | | | | 19,951 |
| | | | | | | |
| Office/Business Equipment: 0.5% |
| 11,900 | | | | Pitney Bowes, Inc. | | | 303,212 |
| 51,550 | | | | Xerox Corp. | | | 410,854 |
| | | | | | | |
| | | | | | | 714,066 |
| | | | | | | |
| Oil & Gas: 4.3% |
| 3,150 | | @ | | Atwood Oceanics, Inc. | | | 48,132 |
| 5,850 | | | | Cabot Oil & Gas Corp. | | | 152,100 |
| 4,750 | | | | Cimarex Energy Co. | | | 127,205 |
| 1,600 | | @ | | CNX Gas Corp. | | | 43,680 |
| 1,700 | | @, L | | Continental Resources, Inc. | | | 35,207 |
| 14,050 | | @ | | Denbury Resources, Inc. | | | 153,426 |
| 3,950 | | | | Diamond Offshore Drilling | | | 232,813 |
| 3,050 | | @ | | Encore Acquisition Co. | | | 77,836 |
| 8,300 | | | | ENSCO International, Inc. | | | 235,637 |
| 7,550 | | | | Equitable Resources, Inc. | | | 253,303 |
| 5,050 | | @ | | Forest Oil Corp. | | | 83,275 |
| 5,950 | | | | Frontier Oil Corp. | | | 75,149 |
| 5,950 | | | | Helmerich & Payne, Inc. | | | 135,363 |
| 5,050 | | @ | | Hercules Offshore, Inc. | | | 23,988 |
| 2,400 | | | | Holly Corp. | | | 43,752 |
| 4,950 | | @ | | Mariner Energy, Inc. | | | 50,490 |
| 10,900 | | | | Murphy Oil Corp. | | | 483,415 |
| 16,150 | | @, @@ | | Nabors Industries Ltd. | | | 193,316 |
| | | | | | | |
| Shares | | | | | | Value |
| | | | | | | |
| Oil & Gas: (continued) |
| 7,550 | | @ | | Newfield Exploration Co. | | $ | 149,113 |
| 15,450 | | | | Noble Corp. | | | 341,291 |
| 9,900 | | | | Noble Energy, Inc. | | | 487,278 |
| 8,800 | | | | Patterson-UTI Energy, Inc. | | | 101,288 |
| 14,400 | | @ | | PetroHawk Energy Corp. | | | 225,072 |
| 6,850 | | | | Pioneer Natural Resources Co. | | | 110,833 |
| 6,150 | | @ | | Plains Exploration & Production Co. | | | 142,926 |
| 9,600 | | @ | | Pride International, Inc. | | | 153,408 |
| 9,900 | | | | Questar Corp. | | | 323,631 |
| 5,850 | | @ | | Quicksilver Resources, Inc. | | | 32,585 |
| 8,800 | | | | Range Resources Corp. | | | 302,632 |
| 6,450 | | | | Rowan Cos., Inc. | | | 102,555 |
| 5,950 | | @ | | SandRidge Energy, Inc. | | | 36,593 |
| 19,600 | | @ | | Southwestern Energy Co. | | | 567,812 |
| 3,550 | | | | St. Mary Land & Exploration Co. | | | 72,101 |
| 6,750 | | | | Sunoco, Inc. | | | 293,355 |
| 7,850 | | | | Tesoro Corp. | | | 103,385 |
| 2,700 | | @ | | Unit Corp. | | | 72,144 |
| 1,700 | | | | W&T Offshore, Inc. | | | 24,344 |
| 2,400 | | @ | | Whiting Petroleum Corp. | | | 80,304 |
| | | | | | | |
| | | | | | | 6,170,737 |
| | | | | | | |
| Oil & Gas Services: 1.0% |
| 16,850 | | | | BJ Services Co. | | | 196,640 |
| 12,400 | | @ | | Cameron International Corp. | | | 254,200 |
| 4,950 | | @ | | Dresser-Rand Group, Inc. | | | 85,388 |
| 3,750 | | @, L | | Exterran Holdings, Inc. | | | 79,875 |
| 7,350 | | @ | | FMC Technologies, Inc. | | | 175,151 |
| 6,650 | | @ | | Global Industries Ltd. | | | 23,209 |
| 5,250 | | @ | | Helix Energy Solutions Group, Inc. | | | 38,010 |
| 7,150 | | @ | | Key Energy Services, Inc. | | | 31,532 |
| 3,150 | | @ | | Oceaneering International, Inc. | | | 91,791 |
| 2,850 | | @ | | Oil States International, Inc. | | | 53,267 |
| 1,200 | | @ | | SEACOR Holdings, Inc. | | | 79,980 |
| 12,300 | | | | Smith International, Inc. | | | 281,547 |
| 4,650 | | @ | | Superior Energy Services | | | 74,075 |
| 4,250 | | @ | | Tetra Technologies, Inc. | | | 20,655 |
| | | | | | | |
| | | | | | | 1,485,320 |
| | | | | | | |
| Packaging & Containers: 1.0% | | | |
| 5,650 | | | | Ball Corp. | | | 234,984 |
| 5,750 | | | | Bemis Co. | | | 136,160 |
| 9,200 | | @ | | Crown Holdings, Inc. | | | 176,640 |
| 1,900 | | | | Greif, Inc. - Class A | | | 63,517 |
| 14,750 | | @ | | Jefferson Smurfit Corp. | | | 3,761 |
| 9,500 | | @ | | Owens-Illinois, Inc. | | | 259,635 |
| 5,950 | | | | Packaging Corp. of America | | | 80,087 |
| 7,550 | | @ | | Pactiv Corp. | | | 187,844 |
| 9,200 | | | | Sealed Air Corp. | | | 137,448 |
| 5,750 | | | | Sonoco Products Co. | | | 133,170 |
| 6,050 | | | | Temple-Inland, Inc. | | | 29,040 |
| | | | | | | |
| | | | | | | 1,442,286 |
| | | | | | | |
| Pharmaceuticals: 2.7% | | | |
| 17,450 | | | | Allergan, Inc. | | | 703,584 |
| 9,300 | | | | AmerisourceBergen Corp. | | | 331,638 |
| 5,650 | | @ | | BioMarin Pharmaceuticals, Inc. | | | 100,570 |
| 3,950 | | @ | | Cephalon, Inc. | | | 304,308 |
| 6,850 | | @ | | Endo Pharmaceuticals Holdings, Inc. | | | 177,278 |
| 12,100 | | @ | | Express Scripts, Inc. | | | 665,258 |
| 17,450 | | @ | | Forest Laboratories, Inc. | | | 444,452 |
| 3,750 | | @@ | | Herbalife Ltd. | | | 81,300 |
| 14,150 | | @ | | King Pharmaceuticals, Inc. | | | 150,273 |
See Accompanying Notes to Financial Statements
55
| | |
| ING RUSSELL™ MID CAP INDEX PORTFOLIO | | PORTFOLIO OF INVESTMENTS ASOF DECEMBER 31, 2008 (CONTINUED) |
| | | | | | | |
| Shares | | | | | | Value |
| | | | | | | |
| Pharmaceuticals: (continued) | | | |
| 17,450 | | @, L | | Mylan Laboratories | | $ | 172,581 |
| 3,050 | | @ | | NBTY, Inc. | | | 47,733 |
| 6,050 | | | | Omnicare, Inc. | | | 167,948 |
| 4,450 | | | | Perrigo Co. | | | 143,780 |
| 6,150 | | @ | | Sepracor, Inc. | | | 67,527 |
| 4,850 | | @ | | VCA Antech, Inc. | | | 96,418 |
| 5,250 | | @ | | Warner Chilcott Ltd. | | | 76,125 |
| 5,950 | | @ | | Watson Pharmaceuticals, Inc. | | | 158,092 |
| | | | | | | |
| | | | | | | 3,888,865 |
| | | | | | | |
| Pipelines: 0.7% | | | |
| 40,250 | | | | El Paso Corp. | | | 315,158 |
| 5,950 | | | | Oneok, Inc. | | | 173,264 |
| 36,350 | | | | Spectra Energy Corp. | | | 572,149 |
| | | | | | | |
| | | | | | | 1,060,571 |
| | | | | | | |
| Real Estate: 0.2% | | | |
| 9,800 | | @ | | CB Richard Ellis Group, Inc. | | | 42,336 |
| 4,250 | | | | Forest City Enterprises, Inc. | | | 28,475 |
| 1,800 | | | | Jones Lang LaSalle, Inc. | | | 49,860 |
| 5,250 | | @, L | | St. Joe Co. | | | 127,680 |
| | | | | | | |
| | | | | | | 248,351 |
| | | | | | | |
| Retail: 5.8% | | | |
| 4,950 | | | | Abercrombie & Fitch Co. | | | 114,197 |
| 5,450 | | | | Advance Auto Parts, Inc. | | | 183,393 |
| 9,900 | | | | American Eagle Outfitters | | | 92,664 |
| 3,350 | | @ | | AnnTaylor Stores Corp. | | | 19,330 |
| 6,650 | | @ | | Autonation, Inc. | | | 65,702 |
| 2,200 | | @ | | Autozone, Inc. | | | 306,834 |
| 2,100 | | | | Barnes & Noble, Inc. | | | 31,500 |
| 14,850 | | @ | | Bed Bath & Beyond, Inc. | | | 377,487 |
| 4,650 | | @ | | Big Lots, Inc. | | | 67,379 |
| 3,450 | | @ | | BJ’s Wholesale Club, Inc. | | | 118,197 |
| 5,850 | | | | Brinker International, Inc. | | | 61,659 |
| 4,650 | | | | Burger King Holdings, Inc. | | | 111,042 |
| 12,500 | | @, L | | Carmax, Inc. | | | 98,500 |
| 1,900 | | @ | | Chipotle Mexican Grill, Inc. | | | 117,762 |
| 3,650 | | @ | | Copart, Inc. | | | 99,244 |
| 8,050 | | | | Darden Restaurants, Inc. | | | 226,849 |
| 4,850 | | @ | | Dick’s Sporting Goods, Inc. | | | 68,434 |
| 5,150 | | @ | | Dollar Tree, Inc. | | | 215,270 |
| 8,050 | | | | Family Dollar Stores, Inc. | | | 209,864 |
| 8,900 | | | | Foot Locker, Inc. | | | 65,326 |
| 9,400 | | @ | | GameStop Corp. | | | 203,604 |
| 27,950 | | | | Gap, Inc. | | | 374,251 |
| 3,450 | | | | Guess ?, Inc. | | | 52,958 |
| 2,120 | | @ | | HSN, Inc. | | | 15,412 |
| 12,700 | | | | JC Penney Co., Inc. | | | 250,190 |
| 17,650 | | @ | | Kohl’s Corp. | | | 638,930 |
| 16,350 | | | | Limited Brands, Inc. | | | 164,154 |
| 5,450 | | | | Liz Claiborne, Inc. | | | 14,170 |
| 24,100 | | | | Macy’s, Inc. | | | 249,435 |
| 2,500 | | | | MSC Industrial Direct Co. | | | 92,075 |
| 10,400 | | L | | Nordstrom, Inc. | | | 138,424 |
| 15,750 | | @ | | Office Depot, Inc. | | | 46,935 |
| 4,350 | | | | OfficeMax, Inc. | | | 33,234 |
| 7,650 | | @ | | O’Reilly Automotive, Inc. | | | 235,161 |
| 1,500 | | @ | | Panera Bread Co. | | | 78,360 |
| 2,300 | | L | | Penske Auto Group, Inc. | | | 17,664 |
| 7,350 | | | | Petsmart, Inc. | | | 135,608 |
| 2,950 | | | | Phillips-Van Heusen | | | 59,384 |
| 7,550 | | | | RadioShack Corp. | | | 90,147 |
| | | | | | | |
| Shares | | | | | | Value |
| | | | | | | |
| Retail: (continued) | | | |
| 29,150 | | @, L | | Rite Aid Corp. | | $ | 9,037 |
| 7,650 | | | | Ross Stores, Inc. | | | 227,435 |
| 8,300 | | @, L | | Saks, Inc. | | | 36,354 |
| 3,350 | | @, L | | Sears Holding Corp. | | | 130,215 |
| 4,950 | | @@, L | | Signet Jewelers Ltd. | | | 42,917 |
| 41,700 | | @ | | Starbucks Corp. | | | 394,482 |
| 7,250 | | | | Tiffany & Co. | | | 171,318 |
| 10,600 | | @@ | | Tim Hortons, Inc. | | | 305,704 |
| 24,400 | | | | TJX Cos., Inc. | | | 501,908 |
| 6,550 | | @ | | Urban Outfitters, Inc. | | | 98,119 |
| 5,450 | | | | Williams-Sonoma, Inc. | | | 42,837 |
| 27,150 | | | | Yum! Brands, Inc. | | | 855,109 |
| | | | | | | |
| | | | | | | 8,356,164 |
| | | | | | | |
| Savings & Loans: 1.0% | | | |
| 4,850 | | | | Astoria Financial Corp. | | | 79,928 |
| 1,300 | | | | Capitol Federal Financial | | | 59,280 |
| 29,750 | | | | Hudson City Bancorp., Inc. | | | 474,810 |
| 19,600 | | | | New York Community Bancorp., Inc. | | | 234,416 |
| 19,800 | | | | People’s United Financial, Inc. | | | 353,034 |
| 25,450 | | @ | | Sovereign Bancorp., Inc. | | | 75,841 |
| 5,950 | | L | | TFS Financial Corp. | | | 76,755 |
| 4,950 | | | | Washington Federal, Inc. | | | 74,052 |
| | | | | | | |
| | | | | | | 1,428,116 |
| | | | | | | |
| Semiconductors: 3.0% | | | |
| 34,800 | | @, L | | Advanced Micro Devices, Inc. | | | 75,168 |
| 17,250 | | | | Altera Corp. | | | 288,248 |
| 16,650 | | | | Analog Devices, Inc. | | | 316,683 |
| 25,550 | | @ | | Atmel Corp. | | | 79,972 |
| 29,450 | | @ | | Broadcom Corp. | | | 499,767 |
| 5,150 | | @ | | Cree, Inc. | | | 81,731 |
| 8,600 | | @ | | Cypress Semiconductor Corp. | | | 38,442 |
| 7,150 | | @ | | Fairchild Semiconductor International, Inc. | | | 34,964 |
| 9,800 | | @ | | Integrated Device Technology, Inc. | | | 54,978 |
| 4,150 | | @ | | International Rectifier Corp. | | | 56,025 |
| 7,050 | | | | Intersil Corp. | | | 64,790 |
| 9,700 | | | | KLA-Tencor Corp. | | | 211,363 |
| 7,150 | | @ | | Lam Research Corp. | | | 152,152 |
| 12,700 | | | | Linear Technology Corp. | | | 280,924 |
| 36,550 | | @ | | LSI Logic Corp. | | | 120,250 |
| 27,850 | | @, @@ | | Marvell Technology Group Ltd. | | | 185,760 |
| 13,000 | | @ | | MEMC Electronic Materials, Inc. | | | 185,640 |
| 10,600 | | | | Microchip Technology, Inc. | | | 207,018 |
| 43,600 | | @ | | Micron Technology, Inc. | | | 115,104 |
| 13,100 | | | | National Semiconductor Corp. | | | 131,917 |
| 5,750 | | @ | | Novellus Systems, Inc. | | | 70,955 |
| 31,800 | | @ | | Nvidia Corp. | | | 256,626 |
| 23,400 | | @ | | ON Semiconductor Corp. | | | 79,560 |
| 7,650 | | @ | | QLogic Corp. | | | 102,816 |
| 5,950 | | @ | | Rambus, Inc. | | | 94,724 |
| 2,850 | | @ | | Silicon Laboratories, Inc. | | | 70,623 |
| 9,800 | | @ | | Teradyne, Inc. | | | 41,356 |
| 4,250 | | @ | | Varian Semiconductor Equipment Associates, Inc. | | | 77,010 |
| 15,950 | | | | Xilinx, Inc. | | | 284,229 |
| | | | | | | |
| | | | | | | 4,258,795 |
| | | | | | | |
| Software: 3.1% | | | |
| 34,000 | | @ | | Activision Blizzard, Inc. | | | 293,760 |
| 4,850 | | @ | | Ansys, Inc. | | | 135,267 |
| 12,800 | | @ | | Autodesk, Inc. | | | 251,520 |
See Accompanying Notes to Financial Statements
56
| | |
| ING RUSSELL™ MID CAP INDEX PORTFOLIO | | PORTFOLIO OF INVESTMENTS ASOF DECEMBER 31, 2008 (CONTINUED) |
| | | | | | | |
| Shares | | | | | | Value |
| | | | | | | |
| Software: (continued) | | | |
| 11,000 | | @, S | | BMC Software, Inc. | | $ | 296,010 |
| 8,050 | | | | Broadridge Financial Solutions ADR | | | 100,947 |
| 22,200 | | | | CA, Inc. | | | 411,366 |
| 3,950 | | @, L | | Cerner Corp. | | | 151,878 |
| 10,500 | | @ | | Citrix Systems, Inc. | | | 247,485 |
| 14,950 | | @ | | Compuware Corp. | | | 100,913 |
| 3,150 | | | | Dun & Bradstreet Corp. | | | 243,180 |
| 18,250 | | @ | | Electronic Arts, Inc. | | | 292,730 |
| 11,200 | | | | Fidelity National Information Services, Inc. | | | 182,224 |
| 9,400 | | @ | | Fiserv, Inc. | | | 341,878 |
| 10,400 | | | | IMS Health, Inc. | | | 157,664 |
| 18,350 | | @ | | Intuit, Inc. | | | 436,547 |
| 5,150 | | @ | | Metavante Technologies, inc. | | | 82,967 |
| 2,500 | | @ | | MSCI, Inc. - Class A | | | 44,400 |
| 20,200 | | @ | | Novell, Inc. | | | 78,578 |
| 10,600 | | @ | | Nuance Communications, Inc. | | | 109,816 |
| 10,900 | | @ | | Red Hat, Inc. | | | 144,098 |
| 6,050 | | @ | | Salesforce.com, Inc. | | | 193,661 |
| 7,650 | | | | SEI Investments Co. | | | 120,182 |
| | | | | | | |
| | | | | | | 4,417,071 |
| | | | | | | |
| Telecommunications: 3.2% | | | |
| 6,750 | | @ | | ADC Telecommunications, Inc. | | | 36,923 |
| 11,200 | | @, @@ | | Amdocs Ltd. | | | 204,848 |
| 22,800 | | @ | | American Tower Corp. | | | 668,496 |
| 6,050 | | | | CenturyTel, Inc. | | | 165,347 |
| 4,950 | | @, L | | Ciena Corp. | | | 33,165 |
| 3,650 | | @, L | | Clearwire Corp. | | | 17,995 |
| 4,050 | | @ | | CommScope, Inc. | | | 62,937 |
| 16,150 | | @ | | Crown Castle International Corp. | | | 283,917 |
| 2,400 | | @ | | EchoStar Holding Corp. | | | 35,688 |
| 8,500 | | | | Embarq Corp. | | | 305,660 |
| 18,550 | | | | Frontier Communications Corp. | | | 162,127 |
| 7,650 | | | | Harris Corp. | | | 291,083 |
| 12,000 | | @ | | JDS Uniphase Corp. | | | 43,800 |
| 30,050 | | @ | | Juniper Networks, Inc. | | | 526,176 |
| 3,050 | | @ | | Leap Wireless International, Inc. | | | 82,015 |
| 89,000 | | @ | | Level 3 Communications, Inc. | | | 62,300 |
| 13,950 | | @ | | MetroPCS Communications, Inc. | | | 207,158 |
| 4,450 | | @ | | NeuStar, Inc. | | | 85,129 |
| 9,600 | | @ | | NII Holdings, Inc. | | | 174,528 |
| 86,200 | | L | | Qwest Communications International, Inc. | | | 313,768 |
| 6,250 | | @ | | SBA Communications Corp. | | | 102,000 |
| 5,950 | | | | Telephone & Data Systems, Inc. | | | 188,913 |
| 22,800 | | @ | | Tellabs, Inc. | | | 93,936 |
| 1,000 | | @ | | US Cellular Corp. | | | 43,240 |
| 16,850 | | | | Virgin Media, Inc. | | | 84,082 |
| 25,650 | | | | Windstream Corp. | | | 235,980 |
| | | | | | | |
| | | | | | | 4,511,211 |
| | | | | | | |
| Textiles: 0.2% | | | |
| 7,550 | | | | Cintas Corp. | | | 175,387 |
| 3,150 | | @ | | Mohawk Industries, Inc. | | | 135,356 |
| | | | | | | |
| | | | | | | 310,743 |
| | | | | | | |
| Toys/Games/Hobbies: 0.4% | | | |
| 7,050 | | | | Hasbro, Inc. | | | 205,649 |
| 20,800 | | | | Mattel, Inc. | | | 332,800 |
| | | | | | | |
| | | | | | | 538,449 |
| | | | | | | |
| | | | | | | |
| Shares | | | | | | Value |
| | | | | | | |
| Transportation: 1.4% | | | |
| 2,300 | | | | Alexander & Baldwin, Inc. | | $ | 57,638 |
| 9,800 | | | | CH Robinson Worldwide, Inc. | | | 539,294 |
| 2,600 | | | | Con-way, Inc. | | | 69,160 |
| 12,200 | | | | Expeditors International Washington, Inc. | | | 405,894 |
| 2,850 | | @@, L | | Frontline Ltd. | | | 84,389 |
| 4,650 | | | | JB Hunt Transport Services, Inc. | | | 122,156 |
| 5,150 | | @ | | Kansas City Southern | | | 98,108 |
| 3,150 | | @ | | Kirby Corp. | | | 86,184 |
| 3,050 | | | | Landstar System, Inc. | | | 117,212 |
| 1,300 | | | | Overseas Shipholding Group | | | 54,743 |
| 3,250 | | | | Ryder System, Inc. | | | 126,035 |
| 2,400 | | @@ | | Teekay Shipping Corp. | | | 47,160 |
| 3,050 | | | | Tidewater, Inc. | | | 122,824 |
| 5,750 | | @@ | | UTI Worldwide, Inc. | | | 82,455 |
| | | | | | | |
| | | | | | | 2,013,252 |
| | | | | | | |
| Trucking & Leasing: 0.1% | | | |
| 2,850 | | | | GATX Corp. | | | 88,265 |
| | | | | | | |
| | | | | | | 88,265 |
| | | | | | | |
| Water: 0.2% | | | |
| 3,650 | | | | American Water Works Co., Inc. | | | 76,212 |
| 7,650 | | | | Aqua America, Inc. | | | 157,514 |
| | | | | | | |
| | | | | | | 233,726 |
| | | | | | | |
| | | | Total Common Stock
(Cost $187,696,214) | | | 127,858,384 |
| | | | | | | |
| REAL ESTATE INVESTMENT TRUSTS: 5.0% | | | |
| Apartments: 0.8% | | | |
| 5,104 | | | | Apartment Investment & Management Co. | | | 58,951 |
| 4,450 | | | | AvalonBay Communities, Inc. | | | 269,581 |
| 2,750 | | | | BRE Properties, Inc. | | | 76,945 |
| 3,050 | | | | Camden Property Trust | | | 95,587 |
| 15,550 | | | | Equity Residential | | | 463,701 |
| 1,400 | | | | Essex Property Trust, Inc. | | | 107,450 |
| 7,350 | | | | UDR, Inc. | | | 101,357 |
| | | | | | | |
| | | | | | | 1,173,572 |
| | | | | | | |
| Diversified: 0.6% | | | |
| 11,200 | | | | CapitalSource, Inc. | | | 51,744 |
| 4,050 | | | | Digital Realty Trust, Inc. | | | 133,043 |
| 8,400 | | | | Duke Realty Corp. | | | 92,064 |
| 5,350 | | | | Liberty Property Trust | | | 122,141 |
| 7,750 | | | | Vornado Realty Trust | | | 467,713 |
| | | | | | | |
| | | | | | | 866,705 |
| | | | | | | |
| Forestry: 0.2% | | | |
| 9,800 | | | | Plum Creek Timber Co., Inc. | | | 340,452 |
| | | | | | | |
| | | | | | | 340,452 |
| | | | | | | |
| Health Care: 0.8% | | | |
| 14,450 | | | | HCP, Inc. | | | 401,277 |
| 5,850 | | | | Health Care Real Estate Investment Trust, Inc. | | | 246,870 |
| 5,550 | | | | Nationwide Health Properties, Inc. | | | 159,396 |
| 7,550 | | | | Ventas, Inc. | | | 253,454 |
| | | | | | | |
| | | | | | | 1,060,997 |
| | | | | | | |
See Accompanying Notes to Financial Statements
57
| | |
| ING RUSSELL™ MID CAP INDEX PORTFOLIO | | PORTFOLIO OF INVESTMENTS ASOF DECEMBER 31, 2008 (CONTINUED) |
| | | | | | | |
| Shares | | | | | | Value |
| | | | | | | |
| Hotels: 0.2% | | | |
| 5,350 | | | | Hospitality Properties Trust | | $ | 79,555 |
| 29,950 | | | | Host Hotels & Resorts, Inc. | | | 226,722 |
| | | | | | | |
| | | | | | | 306,277 |
| | | | | | | |
| Mortgage: 0.4% | | | |
| 30,900 | | | | Annaly Capital Management, Inc. | | | 490,383 |
| 7,650 | | L | | iStar Financial, Inc. | | | 17,060 |
| | | | | | | |
| | | | | | | 507,443 |
| | | | | | | |
| Office Property: 0.6% | | | |
| 1,800 | | | | Alexandria Real Estate Equities, Inc. | | | 108,612 |
| 6,850 | | | | Boston Properties, Inc. | | | 376,750 |
| 4,950 | | | | Brandywine Realty Trust | | | 38,165 |
| 6,950 | | | | Douglas Emmett, Inc. | | | 90,767 |
| 13,000 | | | | HRPT Properties Trust | | | 43,810 |
| 1,900 | | | | Kilroy Realty Corp. | | | 63,574 |
| 3,750 | | | | Mack-Cali Realty Corp. | | | 91,875 |
| 3,350 | | | | SL Green Realty Corp. | | | 86,765 |
| | | | | | | |
| | | | | | | 900,318 |
| | | | | | | |
| Paper & Related Products: 0.1% | | | |
| 4,450 | | | | Rayonier, Inc. | | | 139,508 |
| | | | | | | |
| | | | | | | 139,508 |
| | | | | | | |
| Regional Malls: 0.1% | | | |
| 3,850 | | | | CBL & Associates Properties, Inc. | | | 25,025 |
| 13,000 | | | | General Growth Properties, Inc. | | | 16,770 |
| 4,250 | | L | | Macerich Co. | | | 77,180 |
| 3,050 | | | | Taubman Centers, Inc. | | | 77,653 |
| | | | | | | |
| | | | | | | 196,628 |
| | | | | | | |
| Shopping Centers: 0.5% | | | |
| 6,850 | | | | Developers Diversified Realty Corp. | | | 33,428 |
| 3,350 | | | | Federal Realty Investment Trust | | | 207,968 |
| 12,300 | | | | Kimco Realty Corp. | | | 224,844 |
| 4,050 | | | | Regency Centers Corp. | | | 189,135 |
| 4,250 | | L | | Weingarten Realty Investors | | | 87,933 |
| | | | | | | |
| | | | | | | 743,308 |
| | | | | | | |
| Storage: 0.4% | | | |
| 7,250 | | | | Public Storage, Inc. | | | 576,375 |
| | | | | | | |
| | | | | | | 576,375 |
| | | | | | | |
| Warehouse/Industrial: 0.3% | | | |
| 5,650 | | | | AMB Property Corp. | | | 132,323 |
| 15,050 | | | | Prologis | | | 209,045 |
| | | | | | | |
| | | | | | | 341,368 |
| | | | | | | |
| | | | Total Real Estate Investment Trusts (Cost $11,211,701) | | | 7,152,951 |
| | | | | | | |
| RIGHTS: 0.0% | | | |
| Pharmaceuticals: 0.0% | | | |
| 1,300 | | @@ | | Fresenius Kabi Pharmaceuticals Holding, Inc. | | | 455 |
| | | | | | | |
| | | | Total Rights
(Cost $—) | | | 455 |
| | | | | | | |
| | | | Total Long-Term Investments
(Cost $198,907,915) | | | 135,011,790 |
| | | | | | | |
| | | | | | | |
| Shares | | | | | | Value |
| | | | | | | |
| SHORT-TERM INVESTMENTS: 6.4% | | | |
| Affiliated Mutual Fund: 3.4% | | | |
| 4,808,000 | | S | | ING Institutional Prime Money Market Fund - Class I | | $ | 4,808,000 |
| | | | | | | |
| | | | Total Mutual Fund
(Cost $4,808,000) | | | 4,808,000 |
| | | | | | | |
| | | | | | | | | | |
| | | |
Principal
Amount | | | | | | | Value | |
| | Securities Lending Collateralcc: 3.0% | |
| $ | 4,359,108 | | Bank of New York Mellon Corp. Institutional Cash Reserves | | | | | $ | 4,305,340 | |
| | | | | | | | | | |
| | | Total Securities Lending Collateral
(Cost $4,359,108) | | | | | | 4,305,340 | |
| | | | | | | | | | |
| | | Total Short-Term Investments
(Cost $9,167,108) | | | | | | 9,113,340 | |
| | | | | | | | | | |
| | | Total Investments in Securities
(Cost $208,075,023)* | | 100.9 | % | | $ | 144,125,130 | |
| | | Other Assets and
Liabilities - Net | | (0.9 | ) | | | (1,236,417 | ) |
| | | | | | | | | | |
| | | Net Assets | | 100.0 | % | | $ | 142,888,713 | |
| | | | | | | | | | |
| @ | Non-income producing security |
| ADR | American Depositary Receipt |
| cc | Securities purchased with cash collateral for securities loaned. |
| S | All or a portion of this security is segregated to cover collateral requirements for applicable futures, options, swaps, foreign forward currency contracts and/or when-issued or delayed-delivery securities. |
| L | Loaned security, a portion or all of the security is on loan at December 31, 2008. |
| * | Cost for federal income tax purposes is $221,480,537. |
| | | | |
Net unrealized depreciation consists of: | | | | |
Gross Unrealized Appreciation | | $ | 1,329,051 | |
Gross Unrealized Depreciation | | | (78,684,458 | ) |
| | | | |
Net Unrealized Depreciation | | $ | (77,355,407 | ) |
| | | | |
The following table summarizes the inputs used as of December 31, 2008 in determining the Portfolio’s investments at fair value for purposes of SFAS 157:
| | | | | | |
| | | Investments in
Securities | | Other Financial
Instruments* |
Level 1 — Quoted Prices | | $ | 139,819,790 | | $ | 259,823 |
Level 2 — Other Significant Observable Inputs | | | 4,305,340 | | | — |
Level 3 — Significant Unobservable Inputs | | | — | | | — |
| | | | | | |
Total | | $ | 144,125,130 | | $ | 259,823 |
| | | | | | |
See Accompanying Notes to Financial Statements
58
| | |
| ING RUSSELL™ MID CAP INDEX PORTFOLIO | | PORTFOLIO OF INVESTMENTS ASOF DECEMBER 31, 2008 (CONTINUED) |
“Fair value” for purposes of SFAS 157 is different from “fair value” as used in the 1940 Act. The former generally implies market value, and can include market quotations as a source of value, and the latter refers to determinations of actual value in absence of available market quotations.
| * | Other financial instruments may include forward foreign currency contracts, futures, swaps, and written options. Forward foreign currency contracts and futures are reported at their unrealized gain/loss at year end. Swaps and written options are reported at their market value at year end. |
ING Russell Mid Cap Index Portfolio Open Futures Contracts on December 31, 2008
| | | | | | | |
Contract Description | | Number
of
Contracts | | Expiration
Date | | Unrealized
Appreciation/
(Depreciation) |
Long Contracts | | | | | | | |
S&P Mid 400 E-Mini | | 118 | | 03/20/09 | | $ | 259,823 |
| | | | | | | |
| | | | | | $ | 259,823 |
| | | | | | | |
See Accompanying Notes to Financial Statements
59
| | |
| ING RUSSELL™ SMALL CAP INDEX PORTFOLIO | | PORTFOLIO OF INVESTMENTS ASOF DECEMBER 31, 2008 |
| | | | | | | |
| Shares | | | | | | Value |
| | | | | | | |
| COMMON STOCK: 90.4% |
| Advertising: 0.1% |
| 12,800 | | | | Harte-Hanks, Inc. | | $ | 79,872 |
| 9,200 | | @ | | inVentiv Health, Inc. | | | 106,168 |
| 8,200 | | | | Marchex, Inc. | | | 47,806 |
| | | | | | | |
| | | | | | | 233,846 |
| | | | | | | |
| Aerospace/Defense: 1.7% |
| 9,300 | | @ | | AAR Corp. | | | 171,213 |
| 3,400 | | @ | | Aerovironment, Inc. | | | 125,154 |
| 2,200 | | @ | | Argon ST, Inc. | | | 41,492 |
| 4,900 | | | | Cubic Corp. | | | 133,280 |
| 13,000 | | | | Curtiss-Wright Corp. | | | 434,070 |
| 2,300 | | | | Ducommun, Inc. | | | 38,410 |
| 7,900 | | @ | | Esterline Technologies Corp. | | | 299,331 |
| 20,200 | | @ | | Gencorp, Inc. | | | 74,336 |
| 5,800 | | | | Heico Corp. | | | 225,214 |
| 3,400 | | @ | | Herley Industries, Inc. | | | 41,752 |
| 7,500 | | | | Kaman Corp. | | | 135,975 |
| 11,300 | | @ | | Moog, Inc. | | | 413,241 |
| 1,600 | | | | National Presto Industries, Inc. | | | 123,200 |
| 16,800 | | @ | | Orbital Sciences Corp. | | | 328,104 |
| 10,600 | | @ | | Teledyne Technologies, Inc. | | | 472,230 |
| 9,300 | | @, L | | TransDigm Group, Inc. | | | 312,201 |
| 3,900 | | | | Triumph Group, Inc. | | | 165,594 |
| | | | | | | |
| | | | | | | 3,534,797 |
| | | | | | | |
| Agriculture: 0.4% |
| 2,100 | | | | Alico, Inc. | | | 86,079 |
| 21,800 | | @ | | Alliance One International, Inc. | | | 64,092 |
| 6,100 | | | | Andersons, Inc. | | | 100,528 |
| 2,300 | | @ | | Cadiz, Inc. | | | 28,773 |
| 18,800 | | @, L | | Star Scientific, Inc. | | | 72,004 |
| 3,300 | | @ | | Tejon Ranch Co. | | | 81,642 |
| 7,400 | | | | Universal Corp. | | | 221,038 |
| 7,385 | | | | Vector Group Ltd. | | | 100,584 |
| | | | | | | |
| | | | | | | 754,740 |
| | | | | | | |
| Airlines: 1.0% |
| 30,100 | | @ | | Airtran Holdings, Inc. | | | 133,644 |
| 9,700 | | @ | | Alaska Air Group, Inc. | | | 283,725 |
| 3,900 | | @ | | Allegiant Travel Co. | | | 189,423 |
| 10,400 | | @ | | Hawaiian Holdings, Inc. | | | 66,352 |
| 45,700 | | @ | | JetBlue Airways Corp. | | | 324,470 |
| 10,000 | | @ | | Republic Airways Holdings, Inc. | | | 106,700 |
| 15,500 | | | | Skywest, Inc. | | | 288,300 |
| 33,400 | | @, L | | UAL Corp. | | | 368,068 |
| 30,500 | | @, L | | US Airways Group, Inc. | | | 235,765 |
| | | | | | | |
| | | | | | | 1,996,447 |
| | | | | | | |
| Apparel: 1.3% |
| 7,900 | | @, L | | American Apparel, Inc. | | | 15,721 |
| 15,900 | | @ | | Carter’s, Inc. | | | 306,234 |
| 4,000 | | | | Cherokee, Inc. | | | 69,400 |
| 3,200 | | | | Columbia Sportswear Co. | | | 113,184 |
| 12,200 | | @, L | | CROCS, Inc. | | | 15,128 |
| 3,500 | | @ | | Deckers Outdoor Corp. | | | 279,545 |
| 3,700 | | @ | | G-III Apparel Group Ltd. | | | 23,643 |
| 14,900 | | @, L | | Iconix Brand Group, Inc. | | | 145,722 |
| 9,200 | | | | K-Swiss, Inc. | | | 104,880 |
| 5,600 | | @ | | Maidenform Brands, Inc. | | | 56,840 |
| 8,600 | | | | Oxford Industries, Inc. | | | 75,422 |
| 6,100 | | @ | | Perry Ellis International, Inc. | | | 38,674 |
| 30,800 | | @ | | Quiksilver, Inc. | | | 56,672 |
| | | | | | | |
| Shares | | | | | | Value |
| | | | | | | |
| Apparel: (continued) |
| 8,500 | | @ | | Skechers USA, Inc. | | $ | 108,970 |
| 5,500 | | @ | | Steven Madden Ltd. | | | 117,260 |
| 11,200 | | @ | | Timberland Co. | | | 129,360 |
| 5,400 | | @, L | | True Religion Apparel, Inc. | | | 67,176 |
| 8,500 | | @, L | | Under Armour, Inc. | | | 202,640 |
| 23,300 | | @ | | Unifi, Inc. | | | 65,706 |
| 4,900 | | @ | | Volcom, Inc. | | | 53,410 |
| 12,100 | | @ | | Warnaco Group, Inc. | | | 237,523 |
| 3,200 | | | | Weyco Group, Inc. | | | 105,760 |
| 13,300 | | | | Wolverine World Wide, Inc. | | | 279,832 |
| | | | | | | |
| | | | | | | 2,668,702 |
| | | | | | | |
| Auto Manufacturers: 0.1% |
| 18,000 | | @ | | Force Protection, Inc. | | | 107,640 |
| 10,200 | | | | Wabash National Corp. | | | 45,900 |
| | | | | | | |
| | | | | | | 153,540 |
| | | | | | | |
| Auto Parts & Equipment: 0.5% |
| 11,000 | | | | American Axle & Manufacturing Holdings, Inc. | | | 31,790 |
| 5,500 | | @ | | Amerigon, Inc. | | | 17,930 |
| 20,800 | | | | ArvinMeritor, Inc. | | | 59,280 |
| 5,700 | | @ | | ATC Technology Corp. | | | 83,391 |
| 10,700 | | | | Cooper Tire & Rubber Co. | | | 65,912 |
| 37,600 | | @ | | Dana Holding Corp. | | | 27,824 |
| 6,100 | | @ | | Dorman Products, Inc. | | | 80,520 |
| 19,100 | | @ | | Exide Technologies | | | 101,039 |
| 3,100 | | @ | | Fuel Systems Solutions, Inc. | | | 101,556 |
| 26,800 | | @ | | Hayes Lemmerz International, Inc. | | | 12,060 |
| 18,700 | | @ | | Lear Corp. | | | 26,367 |
| 7,500 | | | | Modine Manufacturing Co. | | | 36,525 |
| 6,600 | | | | Spartan Motors, Inc. | | | 31,218 |
| 11,200 | | | | Superior Industries International | | | 117,824 |
| 17,600 | | @ | | Tenneco, Inc. | | | 51,920 |
| 8,175 | | | | Titan International, Inc. | | | 67,444 |
| 31,100 | | @ | | Visteon Corp. | | | 10,885 |
| 5,000 | | @, @@ | | Wonder Auto Technology, Inc. | | | 19,600 |
| | | | | | | |
| | | | | | | 943,085 |
| | | | | | | |
| Banks: 8.1% |
| 6,100 | | | | 1st Source Corp. | | | 144,143 |
| 7,006 | | | | Amcore Financial, Inc. | | | 25,362 |
| 3,700 | | | | Arrow Financial Corp. | | | 93,018 |
| 3,300 | | | | Bancfirst Corp. | | | 174,636 |
| 4,900 | | @@ | | Banco Latinoamericano de Exportaciones SA | | | 70,364 |
| 3,100 | | L | | BancTrust Financial Group, Inc. | | | 45,756 |
| 12,200 | | | | Bank Mutual Corp. | | | 140,788 |
| 5,700 | | L | | Bank of the Ozarks, Inc. | | | 168,948 |
| 10,800 | | | | Boston Private Financial Holdings, Inc. | | | 73,872 |
| 3,400 | | | | Camden National Corp. | | | 91,732 |
| 4,600 | | S, L | | Capital City Bank Group, Inc. | | | 125,304 |
| 5,500 | | L | | Capitol Bancorp., Ltd. | | | 42,900 |
| 8,000 | | | | Cardinal Financial Corp. | | | 45,520 |
| 6,300 | | L | | Cascade Bancorp. | | | 42,525 |
| 2,400 | | | | Cass Information Systems, Inc. | | | 73,104 |
| 12,200 | | L | | Cathay General Bancorp. | | | 289,750 |
| 4,600 | | | | Centerstate Banks of Florida, Inc. | | | 78,154 |
| 7,300 | | | | Central Pacific Financial Corp. | | | 73,292 |
| 6,400 | | | | Chemical Financial Corp. | | | 178,432 |
| 23,900 | | | | Citizens Banking Corp. | | | 71,222 |
| 7,500 | | | | City Bank | | | 39,000 |
See Accompanying Notes to Financial Statements
60
| | |
| ING RUSSELL™ SMALL CAP INDEX PORTFOLIO | | PORTFOLIO OF INVESTMENTS ASOF DECEMBER 31, 2008 (CONTINUED) |
| | | | | | | |
| Shares | | | | | | Value |
| | | | | | | |
| Banks: (continued) |
| 5,000 | | | | City Holding Co. | | $ | 173,900 |
| 3,400 | | | | CoBiz Financial, Inc. | | | 33,116 |
| 49,300 | | L | | Colonial BancGroup, Inc. | | | 102,051 |
| 5,800 | | | | Columbia Banking System, Inc. | | | 69,194 |
| 7,500 | | | | Community Bank System, Inc. | | | 182,925 |
| 4,600 | | | | Community Trust Bancorp., Inc. | | | 169,050 |
| 29,100 | | L | | Corus Bankshares, Inc. | | | 32,301 |
| 15,400 | | | | CVB Financial Corp. | | | 183,260 |
| 18,100 | | | | East-West Bancorp., Inc. | | | 289,057 |
| 4,000 | | | | Enterprise Financial Services Corp. | | | 60,960 |
| 7,300 | | | | First Bancorp. | | | 133,955 |
| 20,200 | | @@ | | First Bancorp. Puerto Rico | | | 225,028 |
| 7,900 | | L | | First Busey Corp. | | | 144,096 |
| 19,700 | | | | First Commonwealth Financial Corp. | | | 243,886 |
| 3,200 | | L | | First Community Bancshares, Inc. | | | 111,584 |
| 5,200 | | | | First Financial Bancorp. | | | 64,428 |
| 6,500 | | L | | First Financial Bankshares, Inc. | | | 358,865 |
| 4,000 | | | | First Financial Corp. | | | 163,960 |
| 7,400 | | | | First Merchants Corp. | | | 164,354 |
| 16,000 | | | | First Midwest Bancorp., Inc. | | | 319,520 |
| 5,600 | | | | First South Bancorp, Inc. | | | 70,336 |
| 20,400 | | | | FirstMerit Corp. | | | 420,036 |
| 29,106 | | | | FNB Corp. | | | 384,199 |
| 8,600 | | L | | Frontier Financial Corp. | | | 37,496 |
| 14,000 | | | | Glacier Bancorp., Inc. | | | 266,280 |
| 5,245 | | L | | Greene County Bancshares, Inc. | | | 71,017 |
| 26,400 | | @ | | Guaranty Bancorp | | | 52,800 |
| 7,600 | | | | Hancock Holding Co. | | | 345,496 |
| 21,400 | | | | Hanmi Financial Corp. | | | 44,084 |
| 10,100 | | | | Harleysville National Corp. | | | 145,844 |
| 2,200 | | L | | Heartland Financial USA, Inc. | | | 45,298 |
| 4,916 | | L | | Home Bancshares, Inc. | | | 132,486 |
| 3,400 | | | | IBERIABANK Corp. | | | 163,200 |
| 4,900 | | | | Independent Bank Corp. | | | 128,184 |
| 14,100 | | | | International Bancshares Corp. | | | 307,803 |
| 6,800 | | | | Lakeland Bancorp, Inc. | | | 76,568 |
| 4,000 | | | | Lakeland Financial Corp. | | | 95,280 |
| 500 | | | | MainSource Financial Group, Inc. | | | 7,750 |
| 8,300 | | | | MB Financial Corp. | | | 231,985 |
| 18,500 | | | | Midwest Banc Holdings, Inc. | | | 25,900 |
| 10,100 | | | | Nara Bancorp., Inc. | | | 99,283 |
| 23,700 | | | | National Penn Bancshares, Inc. | | | 343,887 |
| 6,600 | | | | NBT Bancorp., Inc. | | | 184,536 |
| 20,000 | | | | Old National Bancorp. | | | 363,200 |
| 8,800 | | @@ | | Oriental Financial Group | | | 53,240 |
| 12,100 | | L | | Pacific Capital Bancorp. | | | 204,248 |
| 6,300 | | | | PacWest Bancorp | | | 169,470 |
| 2,400 | | L | | Park National Corp. | | | 172,200 |
| 5,800 | | | | Peoples Bancorp., Inc. | | | 110,954 |
| 6,200 | | @ | | Pinnacle Financial Partners, Inc. | | | 184,822 |
| 4,800 | | | | PrivateBancorp, Inc. | | | 155,808 |
| 10,400 | | | | Prosperity Bancshares, Inc. | | | 307,736 |
| 7,800 | | | | Provident Bankshares Corp. | | | 75,348 |
| 5,900 | | | | Renasant Corp. | | | 100,477 |
| 3,700 | | L | | Republic Bancorp., Inc. | | | 100,640 |
| 6,300 | | | | S&T Bancorp, Inc. | | | 223,650 |
| 6,800 | | | | Sandy Spring Bancorp, Inc. | | | 148,444 |
| 4,000 | | | | SCBT Financial Corp. | | | 138,000 |
| 2,100 | | L | | Sierra Bancorp. | | | 44,100 |
| 7,800 | | @ | | Signature Bank | | | 223,782 |
| 2,700 | | | | Simmons First National Corp. | | | 79,569 |
| 5,000 | | L | | Smithtown Bancorp., Inc. | | | 80,150 |
| 21,800 | | | | South Financial Group, Inc. | | | 94,176 |
| | | | | | | |
| Shares | | | | | | Value |
| | | | | | | |
| Banks: (continued) |
| 3,900 | | | | Southwest Bancorp., Inc. | | $ | 50,544 |
| 6,900 | | L | | StellarOne Corp. | | | 116,610 |
| 25,000 | | | | Sterling Bancshares, Inc. | | | 152,000 |
| 11,900 | | | | Sterling Financial Corp. | | | 104,720 |
| 3,800 | | | | Suffolk Bancorp | | | 136,534 |
| 22,900 | | | | Susquehanna Bancshares, Inc. | | | 364,339 |
| 8,800 | | @ | | SVB Financial Group | | | 230,824 |
| 5,000 | | | | SY Bancorp., Inc. | | | 137,500 |
| 4,400 | | @ | | Texas Capital Bancshares, Inc. | | | 58,784 |
| 1,200 | | | | Tompkins Financial Corp. | | | 69,540 |
| 5,100 | | | | TowneBank | | | 126,429 |
| 6,900 | | | | Trico Bancshares | | | 172,293 |
| 20,000 | | | | Trustco Bank Corp. | | | 190,200 |
| 14,000 | | | | Trustmark Corp. | | | 302,260 |
| 31,000 | | | | UCBH Holdings, Inc. | | | 213,280 |
| 8,600 | | | | UMB Financial Corp. | | | 422,604 |
| 15,700 | | | | Umpqua Holdings Corp. | | | 227,179 |
| 400 | | | | Union Bankshares Corp. | | | 9,920 |
| 11,300 | | | | United Bankshares, Inc. | | | 375,386 |
| 10,875 | | L | | United Community Banks, Inc. | | | 147,683 |
| 4,744 | | L | | United Security Bancshares | | | 54,936 |
| 2,200 | | | | Univest Corp. of Pennsylvania | | | 70,708 |
| 566 | | @@, L | | W Holding Co., Inc. | | | 5,830 |
| 4,800 | | | | Washington Trust Bancorp, Inc. | | | 94,800 |
| 7,100 | | | | WesBanco, Inc. | | | 193,191 |
| 11,400 | | | | West Bancorporation, Inc. | | | 139,650 |
| 7,500 | | | | Westamerica Bancorp. | | | 383,625 |
| 8,500 | | @, L | | Western Alliance Bancorp. | | | 85,765 |
| 7,600 | | | | Wilshire Bancorp., Inc. | | | 69,008 |
| 5,800 | | | | Wintrust Financial Corp. | | | 119,306 |
| | | | | | | |
| | | | | | | 16,848,522 |
| | | | | | | |
| Beverages: 0.2% |
| 2,400 | | @ | | Boston Beer Co., Inc. | | | 68,160 |
| 3,400 | | | | Farmer Bros Co. | | | 84,796 |
| 5,000 | | @, L | | Green Mountain Coffee Roasters, Inc. | | | 193,500 |
| 5,000 | | @ | | Peet’s Coffee & Tea, Inc. | | | 116,250 |
| | | | | | | |
| | | | | | | 462,706 |
| | | | | | | |
| Biotechnology: 3.7% |
| 9,900 | | @ | | Acorda Therapeutics, Inc. | | | 203,049 |
| 2,600 | | @ | | Affymax, Inc. | | | 25,974 |
| 21,300 | | @ | | Alexion Pharmaceuticals, Inc. | | | 770,847 |
| 8,600 | | @, L | | Alnylam Pharmaceuticals, Inc. | | | 212,678 |
| 4,100 | | @, L | | AMAG Pharmaceuticals, Inc. | | | 146,985 |
| 18,100 | | @, @@, L | | American Oriental Bioengineering, Inc. | | | 122,899 |
| 10,800 | | @ | | Arena Pharmaceuticals, Inc. | | | 45,036 |
| 12,400 | | @ | | Ariad Pharmaceuticals, Inc. | | | 10,540 |
| 5,000 | | @ | | Bio-Rad Laboratories, Inc. | | | 376,550 |
| 14,100 | | @ | | Cambrex Corp. | | | 65,142 |
| 22,600 | | @ | | Celera Corp. | | | 251,538 |
| 3,000 | | @ | | Celldex Therapeutics, Inc. | | | 23,760 |
| 3,200 | | @, L | | Clinical Data, Inc. | | | 28,480 |
| 4,100 | | @ | | Cougar Biotechnology, Inc. | | | 106,600 |
| 13,900 | | @ | | Cubist Pharmaceuticals, Inc. | | | 335,824 |
| 7,800 | | @ | | Cytokinetics, Inc. | | | 22,230 |
| 20,800 | | @, L | | Dendreon Corp. | | | 95,264 |
| 28,600 | | @, L | | Discovery Laboratories, Inc. | | | 32,032 |
| 4,200 | | @ | | Emergent Biosolutions, Inc. | | | 109,662 |
| 5,200 | | @ | | Enzo Biochem, Inc. | | | 25,428 |
| 9,900 | | @, L | | Enzon Pharmaceuticals, Inc. | | | 57,717 |
See Accompanying Notes to Financial Statements
61
| | |
| ING RUSSELL™ SMALL CAP INDEX PORTFOLIO | | PORTFOLIO OF INVESTMENTS ASOF DECEMBER 31, 2008 (CONTINUED) |
| | | | | | | |
| Shares | | | | | | Value |
| | | | | | | |
| Biotechnology: (continued) |
| 29,400 | | @ | | Exelixis, Inc. | | $ | 147,588 |
| 6,440 | | @ | | Facet Biotech Corp. | | | 61,760 |
| 23,500 | | @, L | | Geron Corp. | | | 109,745 |
| 4,700 | | @, L | | GTx, Inc. | | | 79,148 |
| 13,700 | | @ | | Halozyme Therapeutics, Inc. | | | 76,720 |
| 45,500 | | @ | | Human Genome Sciences, Inc. | | | 96,460 |
| 7,100 | | @, L | | Idera Pharmaceuticals, Inc. | | | 54,528 |
| 6,700 | | @ | | Immunogen, Inc. | | | 28,743 |
| 25,900 | | @, L | | Immunomedics, Inc. | | | 44,030 |
| 22,200 | | @ | | Incyte Corp. | | | 84,138 |
| 8,600 | | @, L | | InterMune, Inc. | | | 90,988 |
| 24,200 | | @ | | Ligand Pharmaceuticals, Inc. | | | 66,308 |
| 8,200 | | @ | | Martek Biosciences Corp. | | | 248,542 |
| 10,400 | | @ | | Maxygen, Inc. | | | 92,768 |
| 15,800 | | @ | | Medicines Co. | | | 232,734 |
| 9,900 | | @, L | | Molecular Insight Pharmaceuticals, Inc. | | | 42,570 |
| 6,900 | | @ | | Momenta Pharmaceuticals, Inc. | | | 80,040 |
| 11,800 | | @ | | Myriad Genetics, Inc. | | | 781,868 |
| 12,200 | | @ | | Novavax, Inc. | | | 23,058 |
| 13,300 | | @ | | NPS Pharmaceuticals, Inc. | | | 82,593 |
| 15,900 | | @ | | OSI Pharmaceuticals, Inc. | | | 620,895 |
| 32,200 | | @ | | PDL BioPharma, Inc. | | | 198,996 |
| 16,900 | | @ | | Regeneron Pharmaceuticals, Inc. | | | 310,284 |
| 15,500 | | @ | | Repligen Corp. | | | 58,590 |
| 11,600 | | @ | | RTI Biologics, Inc. | | | 32,016 |
| 18,600 | | @, L | | Sangamo Biosciences, Inc. | | | 64,728 |
| 17,200 | | @ | | Seattle Genetics, Inc. | | | 153,768 |
| 14,700 | | @ | | Sequenom, Inc. | | | 291,648 |
| 5,900 | | @ | | United Therapeutics Corp. | | | 369,045 |
| 24,000 | | @, L | | XOMA Ltd. | | | 14,880 |
| 18,500 | | @, L | | Zymogenetics, Inc. | | | 55,500 |
| | | | | | | |
| | | | | | | 7,762,914 |
| | | | | | | |
| Building Materials: 0.6% |
| 1,200 | | | | AAON, Inc. | | | 25,056 |
| 7,400 | | | | Apogee Enterprises, Inc. | | | 76,664 |
| 12,500 | | @, L | | China Architectural Engineering, Inc. | | | 30,750 |
| 10,700 | | | | Comfort Systems USA, Inc. | | | 114,062 |
| 6,900 | | | | Gibraltar Industries, Inc. | | | 82,386 |
| 8,600 | | @ | | Interline Brands, Inc. | | | 91,418 |
| 39,500 | | L | | Louisiana-Pacific Corp. | | | 61,620 |
| 6,700 | | | | LSI Industries, Inc. | | | 46,029 |
| 4,700 | | @ | | NCI Building Systems, Inc. | | | 76,610 |
| 8,100 | | | | Quanex Building Products Corp. | | | 75,897 |
| 9,500 | | | | Simpson Manufacturing Co., Inc. | | | 263,720 |
| 5,700 | | | | Texas Industries, Inc. | | | 196,650 |
| 3,300 | | @, L | | Trex Co., Inc. | | | 54,318 |
| 3,600 | | | | Universal Forest Products, Inc. | | | 96,876 |
| 11,700 | | @ | | US Concrete, Inc. | | | 39,312 |
| | | | | | | |
| | | | | | | 1,331,368 |
| | | | | | | |
| Chemicals: 1.5% |
| 6,600 | | | | Aceto Corp. | | | 66,066 |
| 7,000 | | L | | American Vanguard Corp. | | | 81,900 |
| 4,800 | | | | Arch Chemicals, Inc. | | | 125,136 |
| 3,200 | | | | Balchem Corp. | | | 79,712 |
| 9,800 | | | | Ferro Corp. | | | 69,090 |
| 10,600 | | | | HB Fuller Co. | | | 170,766 |
| 7,700 | | @ | | ICO, Inc. | | | 24,332 |
| 2,300 | | | | Innophos Holdings, Inc. | | | 45,563 |
| 9,200 | | @@ | | Innospec, Inc. | | | 54,188 |
| | | | | | | |
| Shares | | | | | | Value |
| | | | | | | |
| Chemicals: (continued) |
| 10,800 | | @ | | Landec Corp. | | $ | 71,064 |
| 5,200 | | | | Minerals Technologies, Inc. | | | 212,680 |
| 3,700 | | | | NewMarket Corp. | | | 129,167 |
| 20,500 | | | | Olin Corp. | | | 370,640 |
| 9,500 | | @ | | OM Group, Inc. | | | 200,545 |
| 4,300 | | | | Penford Corp. | | | 43,516 |
| 32,100 | | @ | | PolyOne Corp. | | | 101,115 |
| 1,500 | | | | Quaker Chemical Corp. | | | 24,675 |
| 11,000 | | @ | | Rockwood Holdings, Inc. | | | 118,800 |
| 8,200 | | | | Schulman A, Inc. | | | 139,400 |
| 13,500 | | | | Sensient Technologies Corp. | | | 322,380 |
| 9,100 | | @, @@, L | | ShengdaTech, Inc. | | | 32,032 |
| 25,700 | | @ | | Solutia, Inc. | | | 115,650 |
| 7,400 | | | | Spartech Corp. | | | 46,324 |
| 1,200 | | | | Stepan Co. | | | 56,388 |
| 7,600 | | @ | | Symyx Technologies | | | 45,144 |
| 4,900 | | | | Westlake Chemical Corp. | | | 79,821 |
| 19,700 | | @ | | WR Grace & Co. | | | 117,609 |
| 5,700 | | | | Zep, Inc. | | | 110,067 |
| 5,100 | | @, L | | Zoltek Cos., Inc. | | | 45,849 |
| | | | | | | |
| | | | | | | 3,099,619 |
| | | | | | | |
| Coal: 0.1% |
| 34,000 | | @, L | | International Coal Group, Inc. | | | 78,200 |
| 6,800 | | @, L | | James River Coal Co. | | | 104,244 |
| | | | | | | |
| | | | | | | 182,444 |
| | | | | | | |
| Commercial Services: 5.5% |
| 12,000 | | | | Aaron Rents, Inc. | | | 319,440 |
| 11,300 | | | | ABM Industries, Inc. | | | 215,265 |
| 5,900 | | | | Administaff, Inc. | | | 127,912 |
| 13,700 | | | | Advance America Cash Advance Centers, Inc. | | | 25,893 |
| 4,600 | | @ | | Advisory Board Co. | | | 102,580 |
| 6,800 | | @ | | Albany Molecular Research, Inc. | | | 66,232 |
| 2,800 | | @, L | | American Public Education, Inc. | | | 104,132 |
| 8,500 | | @ | | AMN Healthcare Services, Inc. | | | 71,910 |
| 5,800 | | | | Arbitron, Inc. | | | 77,024 |
| 3,600 | | @, L | | Bankrate, Inc. | | | 136,800 |
| 12,100 | | | | Bowne & Co., Inc. | | | 71,148 |
| 3,900 | | @ | | Capella Education Co. | | | 229,164 |
| 18,800 | | @ | | CBIZ, Inc. | | | 162,620 |
| 2,000 | | | | CDI Corp. | | | 25,880 |
| 8,000 | | @ | | Cenveo, Inc. | | | 35,600 |
| 6,300 | | | | Chemed Corp. | | | 250,551 |
| 6,900 | | @ | | Coinstar, Inc. | | | 134,619 |
| 2,700 | | @ | | Consolidated Graphics, Inc. | | | 61,128 |
| 22,700 | | @ | | Corinthian Colleges, Inc. | | | 371,599 |
| 2,300 | | @ | | Cornell Cos., Inc. | | | 42,757 |
| 2,900 | | @ | | Corvel Corp. | | | 63,742 |
| 4,800 | | @, L | | CoStar Group, Inc. | | | 158,112 |
| 3,100 | | @ | | CRA International, Inc. | | | 83,483 |
| 9,000 | | @ | | Cross Country Healthcare, Inc. | | | 79,110 |
| 13,500 | | | | Deluxe Corp. | | | 201,960 |
| 4,600 | | @ | | Dollar Financial Corp. | | | 47,380 |
| 5,600 | | @ | | DynCorp International, Inc. | | | 84,952 |
| 5,800 | | | | Electro Rent Corp. | | | 64,728 |
| 3,400 | | @ | | Emergency Medical Services Corp. | | | 124,474 |
| 13,800 | | @ | | Euronet Worldwide, Inc. | | | 160,218 |
| 6,100 | | @ | | ExlService Holdings, Inc. | | | 52,277 |
| 5,900 | | @ | | First Advantage Corp. | | | 83,485 |
| 5,800 | | @ | | Forrester Research, Inc. | | | 163,618 |
See Accompanying Notes to Financial Statements
62
| | |
| ING RUSSELL™ SMALL CAP INDEX PORTFOLIO | | PORTFOLIO OF INVESTMENTS ASOF DECEMBER 31, 2008 (CONTINUED) |
| | | | | | | |
| Shares | | | | | | Value |
| | | | | | | |
| Commercial Services: (continued) |
| 15,700 | | @ | | Gartner, Inc. | | $ | 279,931 |
| 14,200 | | @ | | Geo Group, Inc. | | | 256,026 |
| 26,600 | | | | Gevity HR, Inc. | | | 40,166 |
| 10,800 | | @ | | Global Cash Access, Inc. | | | 23,976 |
| 15,800 | | | | Great Lakes Dredge & Dock Corp. | | | 65,570 |
| 5,900 | | @ | | H&E Equipment Services, Inc. | | | 45,489 |
| 12,300 | | @ | | Hackett Group, Inc. | | | 35,916 |
| 11,800 | | | | Healthcare Services Group | | | 187,974 |
| 6,800 | | | | Heartland Payment Systems, Inc. | | | 119,000 |
| 5,200 | | | | Heidrick & Struggles International, Inc. | | | 112,008 |
| 8,100 | | @ | | Hill International, Inc. | | | 57,024 |
| 6,000 | | @ | | HMS Holdings Corp. | | | 189,120 |
| 13,500 | | @ | | Hudson Highland Group, Inc. | | | 45,225 |
| 5,700 | | @ | | Huron Consulting Group, Inc. | | | 326,439 |
| 2,200 | | @ | | ICF International, Inc. | | | 54,054 |
| 1,700 | | @ | | Integrated Electrical Services, Inc. | | | 14,892 |
| 10,400 | | | | Interactive Data Corp. | | | 256,464 |
| 7,400 | | | | Jackson Hewitt Tax Service, Inc. | | | 116,106 |
| 1,600 | | @ | | K12, Inc. | | | 30,000 |
| 7,400 | | | | Kelly Services, Inc. | | | 96,274 |
| 3,800 | | @ | | Kendle International, Inc. | | | 97,736 |
| 3,500 | | @ | | Kenexa Corp. | | | 27,930 |
| 9,800 | | @ | | Kforce, Inc. | | | 75,264 |
| 13,000 | | @ | | Korn/Ferry International | | | 148,460 |
| 2,800 | | | | Landauer, Inc. | | | 205,240 |
| 6,000 | | @ | | LECG Corp. | | | 40,260 |
| 4,000 | | @ | | Lincoln Educational Services Corp. | | | 53,000 |
| 21,500 | | @ | | Live Nation, Inc. | | | 123,410 |
| 5,200 | | | | MAXIMUS, Inc. | | | 182,572 |
| 6,300 | | | | McGrath Rentcorp | | | 134,568 |
| 5,400 | | | | Monro Muffler, Inc. | | | 137,700 |
| 24,400 | | @ | | MPS Group, Inc. | | | 183,732 |
| 3,000 | | | | Multi-Color Corp. | | | 47,460 |
| 13,100 | | @ | | Navigant Consulting, Inc. | | | 207,897 |
| 10,200 | | @, @@ | | Net 1 UEPS Technologies, Inc. | | | 139,740 |
| 14,700 | | @, L | | Odyssey Marine Exploration, Inc. | | | 47,334 |
| 11,000 | | @ | | On Assignment, Inc. | | | 62,370 |
| 12,600 | | @ | | Parexel International Corp. | | | 122,346 |
| 21,800 | | @ | | Pharmanet Development Group | | | 19,838 |
| 8,100 | | @ | | PHH Corp. | | | 103,113 |
| 1,500 | | @ | | Pre-Paid Legal Services, Inc. | | | 55,935 |
| 17,000 | | @ | | Rent-A-Center, Inc. | | | 300,050 |
| 11,900 | | @ | | Resources Connection, Inc. | | | 194,922 |
| 6,100 | | @ | | Riskmetrics Group, Inc. | | | 90,829 |
| 9,600 | | | | Rollins, Inc. | | | 173,568 |
| 12,400 | | @, L | | RSC Holdings, Inc. | | | 105,648 |
| 17,500 | | L | | Sotheby’s | | | 155,575 |
| 11,700 | | @ | | Spherion Corp. | | | 25,857 |
| 3,600 | | @ | | Standard Parking Corp. | | | 69,624 |
| 5,000 | | @, @@ | | Steiner Leisure Ltd. | | | 147,600 |
| 11,200 | | | | Stewart Enterprises, Inc. | | | 33,712 |
| 7,400 | | @, L | | SuccessFactors, Inc. | | | 42,476 |
| 4,900 | | @ | | Team, Inc. | | | 135,730 |
| 8,900 | | @ | | TeleTech Holdings, Inc. | | | 74,315 |
| 7,500 | | @ | | TNS, Inc. | | | 70,425 |
| 11,000 | | @ | | TrueBlue, Inc. | | | 105,270 |
| 8,100 | | @ | | Universal Technical Institute, Inc. | | | 139,077 |
| 25,600 | | @ | | Valassis Communications, Inc. | | | 33,792 |
| 5,400 | | | | Viad Corp. | | | 133,596 |
| 11,500 | | @ | | Vistaprint Ltd. | | | 214,015 |
| 2,900 | | @ | | Volt Information Sciences, Inc. | | | 20,967 |
| | | | | | | |
| Shares | | | | | | Value |
| | | | | | | |
| Commercial Services: (continued) |
| 11,900 | | | | Watson Wyatt Worldwide, Inc. | | $ | 569,058 |
| 10,700 | | @ | | Wright Express Corp. | | | 134,820 |
| | | | | | | |
| | | | | | | 11,538,278 |
| | | | | | | |
| Computers: 2.1% |
| 3,600 | | @, L | | 3D Systems Corp. | | | 28,584 |
| 7,000 | | @ | | 3PAR, Inc. | | | 53,410 |
| 12,000 | | | | Agilysys, Inc. | | | 51,480 |
| 8,100 | | @, S | | CACI International, Inc. | | | 365,229 |
| 18,000 | | @ | | Ciber, Inc. | | | 86,580 |
| 11,400 | | @, @@ | | Cogo Group, Inc. | | | 55,404 |
| 6,500 | | @ | | Compellent Technologies, Inc. | | | 63,245 |
| 9,200 | | @, L | | Data Domain, Inc. | | | 172,960 |
| 9,100 | | @, L | | Echelon Corp. | | | 74,165 |
| 14,600 | | @ | | Electronics for Imaging | | | 139,576 |
| 10,200 | | @, L | | Hutchinson Technology, Inc. | | | 35,496 |
| 7,600 | | @ | | iGate Corp. | | | 49,476 |
| 8,300 | | | | Imation Corp. | | | 112,631 |
| 11,000 | | @ | | Immersion Corp. | | | 64,790 |
| 9,200 | | @ | | Insight Enterprises, Inc. | | | 63,480 |
| 4,700 | | @ | | Integral Systems, Inc. | | | 56,635 |
| 12,000 | | @, L | | Isilon Systems, Inc. | | | 39,480 |
| 20,700 | | | | Jack Henry & Associates, Inc. | | | 401,787 |
| 7,000 | | @ | | Manhattan Associates, Inc. | | | 110,670 |
| 24,500 | | @ | | Mentor Graphics Corp. | | | 126,665 |
| 7,500 | | @ | | Mercury Computer Systems, Inc. | | | 47,325 |
| 21,200 | | @ | | Micros Systems, Inc. | | | 345,984 |
| 3,300 | | | | MTS Systems Corp. | | | 87,912 |
| 3,300 | | @ | | NCI, Inc. | | | 99,429 |
| 5,900 | | @, @@ | | Ness Technologies, Inc. | | | 25,252 |
| 9,200 | | @ | | Netezza Corp. | | | 61,088 |
| 8,100 | | @ | | Netscout Systems, Inc. | | | 69,822 |
| 28,100 | | @, L | | Palm, Inc. | | | 86,267 |
| 25,300 | | @ | | Perot Systems Corp. | | | 345,851 |
| 9,600 | | @ | | Rackable Systems, Inc. | | | 37,824 |
| 8,700 | | @ | | Radiant Systems, Inc. | | | 29,319 |
| 7,600 | | @ | | Radisys Corp. | | | 42,028 |
| 17,000 | | @ | | Riverbed Technolgoy, Inc. | | | 193,630 |
| 8,100 | | @ | | Silicon Storage Technology, Inc. | | | 18,549 |
| 12,800 | | @ | | SRA International, Inc. | | | 220,800 |
| 6,900 | | @, L | | STEC, Inc. | | | 29,394 |
| 5,200 | | @ | | Stratasys, Inc. | | | 55,900 |
| 6,500 | | @ | | Super Micro Computer, Inc. | | | 41,145 |
| 9,000 | | @ | | SYKES Enterprises, Inc. | | | 172,080 |
| 8,750 | | @ | | Synaptics, Inc. | | | 144,900 |
| 3,000 | | | | Syntel, Inc. | | | 69,360 |
| | | | | | | |
| | | | | | | 4,375,602 |
| | | | | | | |
| Cosmetics/Personal Care: 0.2% |
| 5,100 | | @, L | | Chattem, Inc. | | | 364,803 |
| 3,600 | | @ | | Elizabeth Arden, Inc. | | | 45,396 |
| 2,300 | | | | Inter Parfums, Inc. | | | 17,664 |
| | | | | | | |
| | | | | | | 427,863 |
| | | | | | | |
| Distribution/Wholesale: 1.0% |
| 10,700 | | @ | | Beacon Roofing Supply, Inc. | | | 148,516 |
| 7,300 | | @, L | | BMP Sunstone Corp. | | | 40,661 |
| 13,500 | | @ | | Brightpoint, Inc. | | | 58,725 |
| 6,800 | | @ | | Chindex International, Inc. | | | 54,060 |
| 3,800 | | @ | | Core-Mark Holding Co., Inc. | | | 81,776 |
| 3,300 | | @ | | FGX Internationall Holdings Ltd. | | | 45,342 |
| 12,400 | | @ | | Fossil, Inc. | | | 207,080 |
| 5,300 | | L | | Houston Wire & Cable Co. | | | 49,343 |
See Accompanying Notes to Financial Statements
63
| | |
| ING RUSSELL™ SMALL CAP INDEX PORTFOLIO | | PORTFOLIO OF INVESTMENTS ASOF DECEMBER 31, 2008 (CONTINUED) |
| | | | | | | |
| Shares | | | | | | Value |
| | | | | | | |
| Distribution/Wholesale: (continued) |
| 3,300 | | @ | | MWI Veterinary Supply, Inc. | | $ | 88,968 |
| 12,200 | | | | Owens & Minor, Inc. | | | 459,330 |
| 12,400 | | L | | Pool Corp. | | | 222,828 |
| 6,300 | | @ | | Scansource, Inc. | | | 121,401 |
| 4,300 | | @ | | School Specialty, Inc. | | | 82,216 |
| 2,200 | | @ | | Titan Machinery, Inc. | | | 30,932 |
| 4,000 | | @ | | United Stationers, Inc. | | | 133,960 |
| 6,900 | | L | | Watsco, Inc. | | | 264,960 |
| | | | | | | |
| | | | | | | 2,090,098 |
| | | | | | | |
| Diversified Financial Services: 1.7% |
| 10,700 | | | | Advanta Corp. | | | 22,363 |
| 7,000 | | @ | | Asset Acceptance Capital Corp. | | | 35,770 |
| 13,900 | | | | BGC Partners, Inc. | | | 38,364 |
| 3,400 | | | | Calamos Asset Management, Inc. | | | 25,160 |
| 3,900 | | | | Cohen & Steers, Inc. | | | 42,861 |
| 9,200 | | @, L | | CompuCredit Corp. | | | 50,876 |
| 2,300 | | @, L | | Credit Acceptance Corp. | | | 31,510 |
| 900 | | @ | | Diamond Hill Investment Group, Inc. | | | 58,500 |
| 4,400 | | @, @@, L | | Doral Financial Corp. | | | 33,000 |
| 2,700 | | @ | | Duff & Phelps Corp. | | | 51,624 |
| 4,900 | | @ | | Encore Capital Group, Inc. | | | 35,280 |
| 6,900 | | @ | | FBR Capital Markets Corp. | | | 33,534 |
| 5,300 | | @, L | | FCStone Group, Inc. | | | 23,479 |
| 9,800 | | | | Federal Agricultural Mortgage Corp. | | | 34,300 |
| 5,200 | | | | Financial Federal Corp. | | | 121,004 |
| 30,100 | | L | | First Marblehead Corp. | | | 38,829 |
| 2,600 | | | | GAMCO Investors, Inc. | | | 71,032 |
| 17,200 | | | | GFI Group, Inc. | | | 60,888 |
| 4,600 | | | | Greenhill & Co., Inc. | | | 320,942 |
| 10,300 | | @ | | Interactive Brokers Group, Inc. | | | 184,267 |
| 4,000 | | @ | | International Assets Holding Corp. | | | 34,320 |
| 6,200 | | @, L | | KBW, Inc. | | | 142,600 |
| 25,800 | | @ | | Knight Capital Group, Inc. | | | 416,670 |
| 12,300 | | @ | | LaBranche & Co., Inc. | | | 58,917 |
| 29,700 | | @, L | | Ladenburg Thalmann Financial Services, Inc. | | | 21,384 |
| 10,700 | | @ | | MarketAxess Holdings, Inc. | | | 87,312 |
| 10,300 | | | | National Financial Partners Corp. | | | 31,312 |
| 5,400 | | | | Nelnet, Inc. | | | 77,382 |
| 10,300 | | @ | | NewStar Financial, Inc. | | | 41,097 |
| 7,500 | | @ | | Ocwen Financial Corp. | | | 68,850 |
| 12,000 | | | | OptionsXpress Holdings, Inc. | | | 160,320 |
| 4,000 | | @ | | Penson Worldwide, Inc. | | | 30,480 |
| 4,800 | | @ | | Piper Jaffray Cos. | | | 190,848 |
| 3,600 | | @, L | | Portfolio Recovery Associates, Inc. | | | 121,824 |
| 6,000 | | L | | Pzena Investment Management, Inc. | | | 25,320 |
| 7,400 | | | | Sanders Morris Harris Group, Inc. | | | 44,326 |
| 7,300 | | @ | | Stifel Financial Corp. | | | 334,705 |
| 7,200 | | | | SWS Group, Inc. | | | 136,440 |
| 7,300 | | @ | | Thomas Weisel Partners Group, Inc. | | | 34,456 |
| 10,700 | | @ | | TradeStation Group, Inc. | | | 69,015 |
| 2,900 | | | | US Global Investors, Inc. | | | 14,181 |
| | | | | | | |
| Shares | | | | | | Value |
| | | | | | | |
| Diversified Financial Services: (continued) |
| 2,400 | | | | Westwood Holdings Group, Inc. | | $ | 68,184 |
| 4,400 | | @ | | World Acceptance, Corp. | | | 86,944 |
| | | | | | | |
| | | | | | | 3,610,470 |
| | | | | | | |
| Electric: 2.5% |
| 6,600 | | | | Allete, Inc. | | | 212,982 |
| 14,100 | | | | Avista Corp. | | | 273,258 |
| 10,200 | | | | Black Hills Corp. | | | 274,992 |
| 3,400 | | | | CH Energy Group, Inc. | | | 174,726 |
| 16,000 | | | | Cleco Corp. | | | 365,280 |
| 12,900 | | @ | | El Paso Electric Co. | | | 233,361 |
| 8,700 | | L | | Empire District Electric Co. | | | 153,120 |
| 2,500 | | @, L | | Enernoc, Inc. | | | 18,600 |
| 12,200 | | | | Idacorp, Inc. | | | 359,290 |
| 13,400 | | | | ITC Holdings Corp. | | | 585,312 |
| 5,800 | | | | MGE Energy, Inc. | | | 191,400 |
| 9,800 | | | | NorthWestern Corp. | | | 230,006 |
| 4,100 | | | | Ormat Technologies, Inc. | | | 130,667 |
| 8,100 | | | | Otter Tail Corp. | | | 188,973 |
| 4,600 | | @ | | Pike Electric Corp. | | | 56,580 |
| 21,500 | | | | PNM Resources, Inc. | | | 216,720 |
| 20,100 | | | | Portland General Electric Co. | | | 391,347 |
| 27,100 | | @, L | | Synthesis Energy Systems, Inc. | | | 18,428 |
| 7,500 | | | | UIL Holdings Corp. | | | 225,225 |
| 9,800 | | | | Unisource Energy Corp. | | | 287,728 |
| 28,400 | | | | Westar Energy, Inc. | | | 582,484 |
| | | | | | | |
| | | | | | | 5,170,479 |
| | | | | | | |
| Electrical Components & Equipment: 1.0% |
| 6,300 | | @, L | | Advanced Battery Technologies, Inc. | | | 16,758 |
| 8,600 | | @ | | Advanced Energy Industries, Inc. | | | 85,570 |
| 10,700 | | @, L | | American Superconductor Corp. | | | 174,517 |
| 10,500 | | | | Belden CDT, Inc. | | | 219,240 |
| 32,800 | | @, L | | Capstone Turbine Corp. | | | 27,552 |
| 13,000 | | @, @@, L | | China BAK Battery, Inc. | | | 21,060 |
| 5,400 | | | | Encore Wire Corp. | | | 102,384 |
| 8,500 | | @, L | | Ener1, Inc. | | | 60,775 |
| 12,700 | | @, L | | Energy Conversion Devices, Inc. | | | 320,167 |
| 6,900 | | @ | | EnerSys | | | 75,900 |
| 39,900 | | @, L | | Evergreen Solar, Inc. | | | 127,281 |
| 9,500 | | @, @@, L | | Fushi Copperweld, Inc. | | | 50,065 |
| 31,600 | | @ | | GrafTech International Ltd. | | | 262,912 |
| 2,600 | | | | Graham Corp. | | | 28,132 |
| 6,000 | | @ | | Greatbatch, Inc. | | | 158,760 |
| 6,000 | | | | Insteel Industries, Inc. | | | 67,740 |
| 6,200 | | @ | | Littelfuse, Inc. | | | 102,920 |
| 2,200 | | @ | | Powell Industries, Inc. | | | 63,844 |
| 22,700 | | @ | | Power-One, Inc. | | | 27,013 |
| 8,300 | | @, L | | Universal Display Corp. | | | 78,435 |
| 16,200 | | @, L | | Valence Technology, Inc. | | | 29,484 |
| 8,200 | | | | Vicor Corp. | | | 54,202 |
| | | | | | | |
| | | | | | | 2,154,711 |
| | | | | | | |
| Electronics: 2.2% |
| 2,400 | | | | American Science & Engineering, Inc. | | | 177,504 |
| 3,700 | | | | Analogic Corp. | | | 100,936 |
| 2,900 | | @ | | Axsys Technologies, Inc. | | | 159,094 |
| 3,900 | | L | | Badger Meter, Inc. | | | 113,178 |
| 3,800 | | | | Bel Fuse, Inc. | | | 80,560 |
| 17,800 | | @ | | Benchmark Electronics, Inc. | | | 227,306 |
See Accompanying Notes to Financial Statements
64
| | |
| ING RUSSELL™ SMALL CAP INDEX PORTFOLIO | | PORTFOLIO OF INVESTMENTS ASOF DECEMBER 31, 2008 (CONTINUED) |
| | | | | | | |
| Shares | | | | | | Value |
| | | | | | | |
| Electronics: (continued) |
| 13,500 | | | | Brady Corp. | | $ | 323,325 |
| 10,600 | | @ | | Checkpoint Systems, Inc. | | | 104,304 |
| 7,100 | | @, @@, L | | China Security & Surveillance Technology, Inc. | | | 31,453 |
| 9,800 | | @ | | Cogent, Inc. | | | 132,986 |
| 6,300 | | @ | | Coherent, Inc. | | | 135,198 |
| 8,700 | | @ | | Cymer, Inc. | | | 190,617 |
| 6,300 | | | | Daktronics, Inc. | | | 58,968 |
| 4,600 | | @, L | | Dionex Corp. | | | 206,310 |
| 6,900 | | @ | | Electro Scientific Industries, Inc. | | | 46,851 |
| 5,100 | | @ | | Faro Technologies, Inc. | | | 85,986 |
| 10,400 | | @ | | FEI Co. | | | 196,144 |
| 6,600 | | @ | | II-VI, Inc. | | | 125,994 |
| 5,000 | | @, L | | Kemet Corp. | | | 1,350 |
| 12,300 | | @ | | L-1 Identity Solutions, Inc. | | | 82,902 |
| 3,600 | | @ | | Measurement Specialties, Inc. | | | 25,020 |
| 8,700 | | | | Methode Electronics, Inc. | | | 58,638 |
| 20,300 | | @, L | | Microvision, Inc. | | | 34,104 |
| 2,400 | | @ | | Multi-Fineline Electronix, Inc. | | | 28,056 |
| 6,500 | | @ | | Newport Corp. | | | 44,070 |
| 1,700 | | @ | | NVE Corp. | | | 44,421 |
| 5,200 | | @ | | OSI Systems, Inc. | | | 72,020 |
| 4,600 | | | | Park Electrochemical Corp. | | | 87,216 |
| 11,300 | | @ | | Plexus Corp. | | | 191,535 |
| 8,300 | | @, L | | Rofin-Sinar Technologies, Inc. | | | 170,814 |
| 4,300 | | @ | | Rogers Corp. | | | 119,411 |
| 114,000 | | @ | | Sanmina-SCI Corp. | | | 53,580 |
| 9,000 | | @ | | Stoneridge, Inc. | | | 41,040 |
| 18,400 | | @ | | Taser International, Inc. | | | 97,152 |
| 8,600 | | | | Technitrol, Inc. | | | 29,928 |
| 11,000 | | @ | | TTM Technologies, Inc. | | | 57,310 |
| 8,300 | | @ | | Varian, Inc. | | | 278,133 |
| 7,500 | | | | Watts Water Technologies, Inc. | | | 187,275 |
| 14,500 | | | | Woodward Governor Co. | | | 333,790 |
| | | | | | | |
| | | | | | | 4,534,479 |
| | | | | | | |
| Energy - Alternate Sources: 0.2% |
| 18,500 | | @, L | | Akeena Solar, Inc. | | | 31,820 |
| 7,200 | | @, L | | Clean Energy Fuels Corp. | | | 43,488 |
| 4,800 | | @ | | Comverge, Inc. | | | 23,520 |
| 17,200 | | @, L | | FuelCell Energy, Inc. | | | 66,736 |
| 13,400 | | @ | | GT Solar International, Inc. | | | 38,726 |
| 8,200 | | @ | | Headwaters, Inc. | | | 55,350 |
| 29,700 | | @ | | Plug Power, Inc. | | | 30,294 |
| 27,500 | | @, L | | Quantum Fuel Systems Technologies Worldwide, Inc. | | | 23,375 |
| | | | | | | |
| | | | | | | 313,309 |
| | | | | | | |
| Engineering & Construction: 0.9% |
| 10,100 | | @ | | Dycom Industries, Inc. | | | 83,022 |
| 15,000 | | @ | | EMCOR Group, Inc. | | | 336,450 |
| 17,200 | | @ | | ENGlobal Corp. | | | 55,900 |
| 4,600 | | @ | | Exponent, Inc. | | | 138,368 |
| 8,200 | | | | Granite Construction, Inc. | | | 360,226 |
| 6,500 | | @ | | Insituform Technologies, Inc. | | | 127,985 |
| 3,700 | | @ | | Layne Christensen Co. | | | 88,837 |
| 2,800 | | @ | | Michael Baker Corp. | | | 103,348 |
| 6,400 | | @ | | Orion Marine Group, Inc. | | | 61,824 |
| 12,400 | | @ | | Perini Corp. | | | 289,912 |
| 2,900 | | @ | | Stanley, Inc. | | | 105,038 |
| 3,000 | | @ | | Sterling Construction Co., Inc. | | | 55,620 |
| | | | | | | |
| | | | | | | 1,806,530 |
| | | | | | | |
| | | | | | | |
| Shares | | | | | | Value |
| | | | | | | |
| Entertainment: 0.6% |
| 14,800 | | @ | | Bally Technologies, Inc. | | $ | 355,644 |
| 2,800 | | | | Churchill Downs, Inc. | | | 113,176 |
| 8,800 | | | | Cinemark Holdings, Inc. | | | 65,384 |
| 8,300 | | | | Dover Downs Gaming & Entertainment, Inc. | | | 26,394 |
| 18,800 | | | | Dover Motorsports, Inc. | | | 24,440 |
| 8,200 | | @ | | Isle of Capri Casinos, Inc. | | | 26,240 |
| 10,300 | | | | National CineMedia, Inc. | | | 104,442 |
| 11,100 | | @, L | | Pinnacle Entertainment, Inc. | | | 85,248 |
| 14,900 | | @ | | Shuffle Master, Inc. | | | 73,904 |
| 8,300 | | | | Speedway Motorsports, Inc. | | | 133,713 |
| 4,500 | | @ | | Steinway Musical Instruments | | | 78,795 |
| 6,800 | | @, L | | Vail Resorts, Inc. | | | 180,880 |
| | | | | | | |
| | | | | | | 1,268,260 |
| | | | | | | |
| Environmental Control: 1.1% |
| 4,200 | | | | American Ecology Corp. | | | 84,966 |
| 10,600 | | @ | | Calgon Carbon Corp. | | | 162,816 |
| 5,000 | | @ | | Casella Waste Systems, Inc. | | | 20,400 |
| 5,800 | | @ | | Clean Harbors, Inc. | | | 367,952 |
| 21,800 | | @ | | Darling International, Inc. | | | 119,682 |
| 2,300 | | @, L | | Energy Recovery, Inc. | | | 17,434 |
| 10,500 | | | | Energy Solutions, Inc. | | | 59,325 |
| 3,800 | | @, L | | Fuel Tech, Inc. | | | 40,242 |
| 16,600 | | @, L | | Metalico, Inc. | | | 25,730 |
| 5,100 | | | | Met-Pro Corp. | | | 67,932 |
| 9,100 | | | | Mine Safety Appliances Co. | | | 217,581 |
| 71,900 | | @, L | | Rentech, Inc. | | | 48,892 |
| 16,500 | | @ | | Tetra Tech, Inc. | | | 398,475 |
| 21,100 | | @ | | Waste Connections, Inc. | | | 666,126 |
| 11,600 | | @, @@ | | Waste Services, Inc. | | | 76,328 |
| | | | | | | |
| | | | | | | 2,373,881 |
| | | | | | | |
| Food: 2.5% |
| 2,900 | | @, L | | American Dairy, Inc. | | | 43,616 |
| 400 | | | | Arden Group, Inc. | | | 50,400 |
| 8,600 | | | | B&G Foods, Inc. | | | 46,440 |
| 4,800 | | | | Calavo Growers, Inc. | | | 55,200 |
| 3,300 | | | | Cal-Maine Foods, Inc. | | | 94,710 |
| 13,400 | | @ | | Chiquita Brands International, Inc. | | | 198,052 |
| 3,500 | | | | Diamond Foods, Inc. | | | 70,525 |
| 21,800 | | | | Flowers Foods, Inc. | | | 531,048 |
| 11,800 | | @, @@ | | Fresh Del Monte Produce, Inc. | | | 264,556 |
| 8,100 | | @, L | | Great Atlantic & Pacific Tea Co. | | | 50,787 |
| 9,300 | | @ | | Hain Celestial Group, Inc. | | | 177,537 |
| 4,900 | | @ | | HQ Sustainable Maritime Industries, Inc. | | | 38,367 |
| 3,800 | | | | Imperial Sugar Co. | | | 54,492 |
| 2,300 | | | | Ingles Markets, Inc. | | | 40,457 |
| 4,900 | | | | J&J Snack Foods Corp. | | | 175,812 |
| 5,000 | | | | Lancaster Colony Corp. | | | 171,500 |
| 7,500 | | | | Lance, Inc. | | | 172,050 |
| 2,900 | | @ | | Lifeway Foods, Inc. | | | 26,042 |
| 2,500 | | @ | | M&F Worldwide Corp. | | | 38,625 |
| 3,500 | | | | Nash Finch Co. | | | 157,115 |
| 15,200 | | @ | | Ralcorp Holdings, Inc. | | | 887,680 |
| 14,200 | | | | Ruddick Corp. | | | 392,630 |
| 5,300 | | L | | Sanderson Farms, Inc. | | | 183,168 |
| 40 | | | | Seaboard Corp. | | | 47,760 |
| 14,100 | | @ | | Smart Balance, Inc. | | | 95,880 |
| 4,600 | | | | Spartan Stores, Inc. | | | 106,950 |
| 5,700 | | | | Tootsie Roll Industries, Inc. | | | 145,977 |
| 7,800 | | @ | | TreeHouse Foods, Inc. | | | 212,472 |
See Accompanying Notes to Financial Statements
65
| | |
| ING RUSSELL™ SMALL CAP INDEX PORTFOLIO | | PORTFOLIO OF INVESTMENTS ASOF DECEMBER 31, 2008 (CONTINUED) |
| | | | | | | |
| Shares | | | | | | Value |
| | | | | | | |
| Food: (continued) |
| 11,300 | | @ | | United Natural Foods, Inc. | | $ | 201,366 |
| 3,400 | | | | Weis Markets, Inc. | | | 114,342 |
| 13,800 | | @ | | Winn-Dixie Stores, Inc. | | | 222,180 |
| 5,000 | | @, @@ | | Zhongpin, Inc. | | | 60,000 |
| | | | | | | |
| | | | | | | 5,127,736 |
| | | | | | | |
| Forest Products & Paper: 0.3% |
| 7,000 | | @ | | Buckeye Technologies, Inc. | | | 25,480 |
| 3,228 | | @, L | | Clearwater Paper Corp. | | | 27,083 |
| 4,000 | | | | Deltic Timber Corp. | | | 183,000 |
| 11,900 | | | | Glatfelter | | | 110,670 |
| 3,600 | | | | Neenah Paper, Inc. | | | 31,824 |
| 3,500 | | | | Schweitzer-Mauduit International, Inc. | | | 70,070 |
| 10,800 | | | | Wausau Paper Corp. | | | 123,552 |
| 23,100 | | @ | | Xerium Technologies, Inc. | | | 15,246 |
| | | | | | | |
| | | | | | | 586,925 |
| | | | | | | |
| Gas: 1.6% |
| 6,600 | | | | Laclede Group, Inc. | | | 309,144 |
| 11,800 | | | | New Jersey Resources Corp. | | | 464,330 |
| 12,300 | | | | Nicor, Inc. | | | 427,302 |
| 7,900 | | | | Northwest Natural Gas Co. | | | 349,417 |
| 20,000 | | | | Piedmont Natural Gas Co. | | | 633,400 |
| 8,700 | | | | South Jersey Industries, Inc. | | | 346,695 |
| 12,000 | | | | Southwest Gas Corp. | | | 302,640 |
| 15,000 | | | | WGL Holdings, Inc. | | | 490,350 |
| | | | | | | |
| | | | | | | 3,323,278 |
| | | | | | | |
| Hand/Machine Tools: 0.4% |
| 12,300 | | | | Baldor Electric Co. | | | 219,555 |
| 6,700 | | | | Franklin Electric Co., Inc. | | | 188,337 |
| 600 | | @ | | K-Tron International, Inc. | | | 47,940 |
| 8,700 | | | | Regal-Beloit Corp. | | | 330,513 |
| 4,400 | | @ | | Thermadyne Holdings Corp. | | | 30,228 |
| | | | | | | |
| | | | | | | 816,573 |
| | | | | | | |
| Healthcare - Products: 4.1% |
| 5,000 | | @ | | Abaxism, Inc. | | | 80,150 |
| 7,900 | | @ | | Abiomed, Inc. | | | 129,718 |
| 9,600 | | @ | | Accuray, Inc. | | | 49,536 |
| 20,700 | | @ | | Affymetrix, Inc. | | | 61,893 |
| 15,400 | | @ | | Align Technology, Inc. | | | 134,750 |
| 6,800 | | @ | | Alphatec Holdings, Inc. | | | 15,980 |
| 15,600 | | @ | | American Medical Systems Holdings, Inc. | | | 140,244 |
| 6,900 | | @ | | Angiodynamics, Inc. | | | 94,461 |
| 7,700 | | @, L | | Arthrocare Corp. | | | 36,729 |
| 600 | | | | Atrion Corp. | | | 58,260 |
| 3,600 | | @ | | BioMimetic Therapeutics, Inc. | | | 33,192 |
| 8,600 | | @ | | Bruker BioSciences Corp. | | | 34,744 |
| 9,600 | | @ | | Cardiac Science Corp. | | | 72,000 |
| 1,300 | | @ | | CardioNet, Inc. | | | 32,045 |
| 14,800 | | @ | | Cepheid, Inc. | | | 153,624 |
| 20,699 | | @ | | Columbia Laboratories, Inc. | | | 26,288 |
| 8,200 | | @, L | | Conceptus, Inc. | | | 124,804 |
| 4,800 | | @, L | | Conmed Corp. | | | 114,912 |
| 7,100 | | @ | | CryoLife, Inc. | | | 68,941 |
| 5,900 | | @ | | Cyberonics | | | 97,763 |
| 3,800 | | @ | | Cynosure, Inc. | | | 34,694 |
| 3,600 | | | | Datascope Corp. | | | 188,064 |
| 8,200 | | @, L | | DexCom, Inc. | | | 22,632 |
| 16,100 | | @, L | | ev3, Inc. | | | 98,210 |
| | | | | | | |
| Shares | | | | | | Value |
| | | | | | | |
| Healthcare - Products: (continued) |
| 2,800 | | @ | | Exactech, Inc. | | $ | 47,152 |
| 4,000 | | @ | | Genomic Health, Inc. | | | 77,920 |
| 7,000 | | @ | | Haemonetics Corp. | | | 395,500 |
| 7,400 | | @ | | Hanger Orthopedic Group, Inc. | | | 107,374 |
| 5,300 | | @ | | Hansen Medical, Inc. | | | 38,266 |
| 4,500 | | @ | | ICU Medical, Inc. | | | 149,130 |
| 19,200 | | @ | | Immucor, Inc. | | | 510,336 |
| 3,900 | | @ | | Insulet Corp. | | | 30,108 |
| 2,500 | | @ | | Integra LifeSciences Holdings Corp. | | | 88,925 |
| 10,000 | | | | Invacare Corp. | | | 155,200 |
| 4,300 | | @ | | IRIS International, Inc. | | | 59,942 |
| 2,800 | | @ | | Kensey Nash Corp. | | | 54,348 |
| 9,200 | | @ | | Luminex Corp. | | | 196,512 |
| 13,400 | | @ | | Masimo Corp. | | | 399,722 |
| 6,900 | | @ | | Medical Action Industries, Inc. | | | 69,000 |
| 9,700 | | | | Mentor Corp. | | | 300,021 |
| 11,400 | | | | Meridian Bioscience, Inc. | | | 290,358 |
| 6,100 | | @ | | Merit Medical Systems, Inc. | | | 109,373 |
| 4,900 | | @, L | | Micrus Endovascular Corp. | | | 56,889 |
| 7,600 | | @ | | Natus Medical, Inc. | | | 98,420 |
| 10,400 | | @ | | NuVasive, Inc. | | | 360,360 |
| 7,900 | | @ | | NxStage Medical, Inc. | | | 21,093 |
| 16,400 | | @ | | OraSure Technologies, Inc. | | | 60,352 |
| 4,200 | | @, @@ | | Orthofix International NV | | | 64,386 |
| 19,400 | | @ | | Orthovita, Inc. | | | 65,766 |
| 4,400 | | @ | | Palomar Medical Technologies, Inc. | | | 50,732 |
| 17,600 | | @ | | PSS World Medical, Inc. | | | 331,232 |
| 8,200 | | @ | | Quidel Corp. | | | 107,174 |
| 4,500 | | @ | | Sirona Dental Systems, Inc. | | | 47,250 |
| 3,700 | | @ | | Somanetics Corp. | | | 61,087 |
| 4,800 | | @ | | SonoSite, Inc. | | | 91,584 |
| 7,700 | | @ | | Spectranetics Corp. | | | 20,097 |
| 9,700 | | @, L | | Stereotaxis, Inc. | | | 42,680 |
| 18,300 | | | | Steris Corp. | | | 437,187 |
| 4,000 | | @, L | | SurModics, Inc. | | | 101,080 |
| 11,400 | | @ | | Symmetry Medical, Inc. | | | 90,858 |
| 15,000 | | @ | | Thoratec Corp. | | | 487,350 |
| 9,500 | | @, L | | TomoTherapy, Inc. | | | 22,610 |
| 5,400 | | @ | | Trans1, Inc. | | | 38,934 |
| 16,500 | | @, L | | Vision-Sciences, Inc. | | | 25,245 |
| 4,000 | | @ | | Vital Images, Inc. | | | 55,640 |
| 2,300 | | @ | | Vnus Medical Technologies, Inc. | | | 37,306 |
| 12,600 | | @ | | Volcano Corp. | | | 189,000 |
| 8,700 | | | | West Pharmaceutical Services, Inc. | | | 328,599 |
| 8,300 | | @ | | Wright Medical Group, Inc. | | | 169,569 |
| 5,800 | | @ | | Zoll Medical Corp. | | | 109,562 |
| | | | | | | |
| | | | | | | 8,554,863 |
| | | | | | | |
| Healthcare - Services: 2.2% |
| 3,800 | | @ | | Air Methods Corp. | | | 60,762 |
| 8,100 | | @ | | Alliance Imaging, Inc. | | | 64,557 |
| 1,700 | | @ | | Almost Family, Inc. | | | 76,466 |
| 7,300 | | @, L | | Amedisys, Inc. | | | 301,782 |
| 14,700 | | @ | | AMERIGROUP Corp. | | | 433,944 |
| 8,000 | | @ | | Amsurg Corp. | | | 186,720 |
| 12,000 | | @ | | Assisted Living Concepts, Inc. | | | 49,800 |
| 4,500 | | @ | | Bio-Reference Labs, Inc. | | | 118,035 |
| 6,600 | | @ | | Capital Senior Living Corp. | | | 19,668 |
| 12,000 | | @ | | Centene Corp. | | | 236,520 |
| 4,800 | | @, L | | Emeritus Corp. | | | 48,144 |
| 2,200 | | | | Ensign Group, Inc. | | | 36,828 |
See Accompanying Notes to Financial Statements
66
| | |
| ING RUSSELL™ SMALL CAP INDEX PORTFOLIO | | PORTFOLIO OF INVESTMENTS ASOF DECEMBER 31, 2008 (CONTINUED) |
| | | | | | | |
| Shares | | | | | | Value |
| | | | | | | |
| Healthcare - Services: (continued) |
| 24,000 | | @ | | Five Star Quality Care, Inc. | | $ | 36,720 |
| 2,800 | | @, L | | Genoptix, Inc. | | | 95,424 |
| 6,900 | | @ | | Gentiva Health Services, Inc. | | | 201,894 |
| 23,100 | | @, L | | Healthsouth Corp. | | | 253,176 |
| 14,700 | | @ | | Healthspring, Inc. | | | 293,559 |
| 10,000 | | @ | | Healthways, Inc. | | | 114,800 |
| 2,600 | | @ | | IPC The Hospitalist Co., Inc. | | | 43,758 |
| 6,800 | | @ | | Kindred Healthcare, Inc. | | | 88,536 |
| 3,800 | | @ | | LHC Group, Inc. | | | 136,800 |
| 2,500 | | @ | | Life Partners Holdings, Inc. | | | 23,500 |
| 11,700 | | @ | | Magellan Health Services, Inc. | | | 458,172 |
| 4,900 | | @ | | Medcath Corp. | | | 51,156 |
| 5,000 | | @ | | Molina Healthcare, Inc. | | | 88,050 |
| 2,500 | | | | National Healthcare Corp. | | | 126,600 |
| 5,200 | | @ | | Odyssey HealthCare, Inc. | | | 48,100 |
| 15,300 | | @ | | Psychiatric Solutions, Inc. | | | 426,105 |
| 12,000 | | @, L | | RadNet, Inc. | | | 40,200 |
| 2,800 | | @ | | RehabCare Group, Inc. | | | 42,448 |
| 6,900 | | @ | | Res-Care, Inc. | | | 103,638 |
| 10,800 | | @ | | Sun Healthcare Group, Inc. | | | 95,580 |
| 20,500 | | @, L | | Sunrise Senior Living, Inc. | | | 34,440 |
| 4,200 | | @, L | | Triple-S Management Corp. | | | 48,300 |
| | | | | | | |
| | | | | | | 4,484,182 |
| | | | | | | |
| Holding Companies - Diversified: 0.0% |
| 6,400 | | | | Compass Diversified Trust | | | 72,000 |
| 5,193 | | | | Resource America, Inc. | | | 20,772 |
| | | | | | | |
| | | | | | | 92,772 |
| | | | | | | |
| Home Builders: 0.3% |
| 500 | | @ | | Amrep Corp. | | | 15,640 |
| 20,400 | | @, L | | Beazer Homes USA, Inc. | | | 32,232 |
| 5,400 | | L | | Brookfield Homes Corp. | | | 23,328 |
| 2,800 | | @ | | Cavco Industries, Inc. | | | 75,292 |
| 20,400 | | @, L | | Champion Enterprises, Inc. | | | 11,424 |
| 18,900 | | @, L | | Hovnanian Enterprises, Inc. | | | 32,508 |
| 2,800 | | | | M/I Homes, Inc. | | | 29,512 |
| 7,700 | | @ | | Meritage Homes Corp. | | | 93,709 |
| 5,100 | | @, L | | Palm Harbor Homes, Inc. | | | 25,398 |
| 11,600 | | | | Ryland Group, Inc. | | | 204,972 |
| 3,300 | | | | Skyline Corp. | | | 65,967 |
| 32,800 | | @ | | Standard-Pacific Corp. | | | 58,384 |
| 4,700 | | L | | Winnebago Industries | | | 28,341 |
| | | | | | | |
| | | | | | | 696,707 |
| | | | | | | |
| Home Furnishings: 0.4% |
| 4,300 | | L | | American Woodmark Corp. | | | 78,389 |
| 4,000 | | @ | | DTS, Inc. | | | 73,400 |
| 6,400 | | | | Ethan Allen Interiors, Inc. | | | 91,968 |
| 5,100 | | L | | Furniture Brands International, Inc. | | | 11,271 |
| 5,400 | | | | Hooker Furniture Corp. | | | 41,364 |
| 5,900 | | | | Kimball International, Inc. | | | 50,799 |
| 8,400 | | L | | La-Z-Boy, Inc. | | | 18,228 |
| 15,900 | | | | Sealy Corp. | | | 39,909 |
| 18,800 | | L | | Tempur-Pedic International, Inc. | | | 133,292 |
| 26,900 | | @ | | Tivo, Inc. | | | 192,604 |
| 3,600 | | @ | | Universal Electronics, Inc. | | | 58,392 |
| | | | | | | |
| | | | | | | 789,616 |
| | | | | | | |
| Household Products/Wares: 0.6% |
| 14,700 | | @ | | ACCO Brands Corp. | | | 50,715 |
| 13,600 | | | | American Greetings Corp. | | | 102,952 |
| 4,500 | | | | Blyth, Inc. | | | 35,280 |
| | | | | | | |
| Shares | | | | | | Value |
| | | | | | | |
| Household Products/Wares: (continued) |
| 18,000 | | @ | | Central Garden & Pet Co. | | $ | 106,200 |
| 2,600 | | | | CSS Industries, Inc. | | | 46,124 |
| 9,100 | | | | Ennis, Inc. | | | 110,201 |
| 8,200 | | @ | | Helen of Troy Ltd. | | | 142,352 |
| 9,000 | | @ | | Prestige Brands Holdings, Inc. | | | 94,950 |
| 8,500 | | | | Standard Register Co. | | | 75,905 |
| 17,200 | | | | Tupperware Corp. | | | 390,440 |
| 4,500 | | | | WD-40 Co. | | | 127,305 |
| | | | | | | |
| | | | | | | 1,282,424 |
| | | | | | | |
| Housewares: 0.0% |
| 9,000 | | | | Libbey, Inc. | | | 11,250 |
| | | | | | | |
| | | | | | | 11,250 |
| | | | | | | |
| Insurance: 4.5% |
| 78,200 | | | | AMBAC Financial Group, Inc. | | | 101,660 |
| 8,100 | | | | American Equity Investment Life Holding Co. | | | 56,700 |
| 2,800 | | | | American Physicians Capital, Inc. | | | 134,680 |
| 4,000 | | @ | | Amerisafe, Inc. | | | 82,120 |
| 7,500 | | | | Amtrust Financial Services, Inc. | | | 87,000 |
| 8,500 | | @, @@ | | Argo Group International Holdings Ltd. | | | 288,320 |
| 23,700 | | @@ | | Aspen Insurance Holdings Ltd. | | | 574,725 |
| 16,200 | | @@ | | Assured Guaranty Ltd. | | | 184,680 |
| 4,000 | | | | Baldwin & Lyons, Inc. | | | 72,760 |
| 7,700 | | @@ | | Castlepoint Holdings Ltd. | | | 104,412 |
| 8,300 | | @, L | | Citizens, Inc. | | | 80,510 |
| 5,400 | | @ | | CNA Surety Corp. | | | 103,680 |
| 6,900 | | @, L | | Crawford & Co. | | | 100,326 |
| 10,800 | | | | Delphi Financial Group | | | 199,152 |
| 7,000 | | @ | | eHealth, Inc. | | | 92,960 |
| 16,500 | | | | Employers Holdings, Inc. | | | 272,250 |
| 1,500 | | @ | | Enstar Group Ltd. | | | 88,710 |
| 5,800 | | | | FBL Financial Group, Inc. | | | 89,610 |
| 14,700 | | @ | | First Acceptance Corp. | | | 42,630 |
| 6,600 | | @ | | First Mercury Financial Corp. | | | 94,116 |
| 8,100 | | | | Flagstone Reinsurance Holdings Ltd. | | | 79,137 |
| 700 | | @ | | Fpic Insurance Group, Inc. | | | 30,646 |
| 6,500 | | @, @@ | | Greenlight Capital Re Ltd. | | | 84,435 |
| 3,600 | | | | Harleysville Group, Inc. | | | 125,028 |
| 9,500 | | | | Horace Mann Educators Corp. | | | 87,305 |
| 4,800 | | | | Infinity Property & Casualty Corp. | | | 224,304 |
| 15,400 | | @@, L | | IPC Holdings Ltd. | | | 460,460 |
| 2,001 | | | | Kansas City Life Insurance Co. | | | 86,743 |
| 1,900 | | L | | Life Partners Holdings, Inc. | | | 82,916 |
| 13,600 | | @@ | | Maiden Holdings Ltd. | | | 42,568 |
| 14,200 | | @@ | | Max Re Capital Ltd. | | | 251,340 |
| 16,400 | | | | Meadowbrook Insurance Group, Inc. | | | 105,616 |
| 24,900 | | @@ | | Montpelier Re Holdings Ltd. | | | 418,071 |
| 3,200 | | | | National Interstate Corp. | | | 57,184 |
| 600 | | | | National Western Life Insurance Co. | | | 101,502 |
| 3,700 | | @ | | Navigators Group, Inc. | | | 203,167 |
| 6,900 | | | | Odyssey Re Holdings Corp. | | | 357,489 |
| 31,400 | | | | Phoenix Cos., Inc. | | | 102,678 |
| 12,800 | | @@ | | Platinum Underwriters Holdings Ltd. | | | 461,824 |
| 8,100 | | @ | | PMA Capital Corp. | | | 57,348 |
| 30,100 | | | | PMI Group, Inc. | | | 58,695 |
| 5,200 | | | | Presidential Life Corp. | | | 51,428 |
See Accompanying Notes to Financial Statements
67
| | |
| ING RUSSELL™ SMALL CAP INDEX PORTFOLIO | | PORTFOLIO OF INVESTMENTS ASOF DECEMBER 31, 2008 (CONTINUED) |
| | | | | | | |
| Shares | | | | | | Value |
| | | | | | | |
| Insurance: (continued) |
| 8,500 | | @ | | ProAssurance Corp. | | $ | 448,630 |
| 19,200 | | | | Radian Group, Inc. | | | 70,656 |
| 4,600 | | | | RLI Corp. | | | 281,336 |
| 3,600 | | | | Safety Insurance Group, Inc. | | | 137,016 |
| 4,000 | | @ | | SeaBright Insurance Holdings, Inc. | | | 46,960 |
| 15,200 | | | | Selective Insurance Group | | | 348,536 |
| 4,000 | | | | State Auto Financial Corp. | | | 120,240 |
| 4,800 | | | | Stewart Information Services Corp. | | | 112,752 |
| 5,900 | | | | Tower Group, Inc. | | | 166,439 |
| 7,900 | | @, @@ | | United America Indemnity Ltd. | | | 101,199 |
| 5,400 | | | | United Fire & Casualty Co. | | | 167,778 |
| 10,100 | | @ | | Universal American Financial Corp. | | | 89,082 |
| 20,700 | | | | Validus Holdings Ltd. | | | 541,512 |
| 10,400 | | | | Zenith National Insurance Corp. | | | 328,328 |
| | | | | | | |
| | | | | | | 9,341,349 |
| | | | | | | |
| Internet: 2.5% |
| 34,900 | | @ | | Art Technology Group, Inc. | | | 67,357 |
| 9,000 | | @, @@ | | AsiaInfo Holdings, Inc. | | | 106,560 |
| 10,700 | | @ | | Avocent Corp. | | | 191,637 |
| 5,900 | | @, L | | Bidz.com, Inc. | | | 27,140 |
| 8,500 | | @ | | Blue Coat Systems, Inc. | | | 71,400 |
| 3,500 | | @, L | | Blue Nile, Inc. | | | 85,715 |
| 6,100 | | @ | | Chordiant Software, Inc. | | | 16,226 |
| 13,000 | | @, L | | Cogent Communications Group, Inc. | | | 84,890 |
| 5,300 | | @ | | comScore, Inc. | | | 67,575 |
| 5,200 | | @, L | | Constant Contact, Inc. | | | 68,900 |
| 19,700 | | @ | | Cybersource Corp. | | | 236,203 |
| 11,100 | | @ | | DealerTrack Holdings, Inc. | | | 131,979 |
| 4,700 | | @ | | Dice Holdings, Inc. | | | 19,176 |
| 9,900 | | @ | | Digital River, Inc. | | | 245,520 |
| 40,700 | | @ | | Drugstore.Com | | | 50,468 |
| 24,300 | | @ | | Earthlink, Inc. | | | 164,268 |
| 11,900 | | @ | | eResearch Technology, Inc. | | | 78,897 |
| 4,201 | | @, @@ | | Global Sources Ltd. | | | 22,895 |
| 6,100 | | @, L | | GSI Commerce, Inc. | | | 64,172 |
| 5,000 | | @, L | | i2 Technologies, Inc. | | | 31,950 |
| 13,100 | | @ | | Ibasis, Inc. | | | 18,471 |
| 7,700 | | @ | | Infospace, Inc. | | | 58,135 |
| 11,600 | | @, L | | Internap Network Services Corp. | | | 29,000 |
| 4,800 | | @ | | Internet Brands, Inc. | | | 27,936 |
| 7,000 | | @ | | Internet Capital Group, Inc. | | | 38,150 |
| 13,300 | | @ | | Interwoven, Inc. | | | 167,580 |
| 12,900 | | @ | | j2 Global Communications, Inc. | | | 258,516 |
| 3,700 | | @ | | Keynote Systems, Inc. | | | 28,527 |
| 6,600 | | @ | | Knot, Inc. | | | 54,912 |
| 8,100 | | @ | | Limelight Networks, Inc. | | | 19,845 |
| 5,200 | | @ | | Liquidity Services, Inc. | | | 43,316 |
| 7,200 | | @ | | LoopNet, Inc. | | | 49,104 |
| 6,900 | | @, @@, L | | Mercadolibre, Inc. | | | 113,229 |
| 14,600 | | @ | | Moduslink Global Solutions, Inc. | | | 42,194 |
| 35,100 | | @ | | Move, Inc. | | | 56,160 |
| 11,000 | | @, L | | NetFlix, Inc. | | | 328,790 |
| 7,200 | | L | | Nutri/System, Inc. | | | 105,048 |
| 12,700 | | @ | | Online Resources Corp. | | | 60,198 |
| 5,100 | | @ | | Orbitz Worldwide, Inc. | | | 19,788 |
| 3,900 | | @, L | | Overstock.com, Inc. | | | 42,042 |
| | | | | | | |
| Shares | | | | | | Value |
| | | | | | | |
| Internet: (continued) |
| 7,700 | | @ | | PC-Tel, Inc. | | $ | 50,589 |
| 9,500 | | @ | | Perficient, Inc. | | | 45,410 |
| 2,800 | | @ | | Rackspace Hosting, Inc. | | | 15,064 |
| 21,500 | | @ | | RealNetworks, Inc. | | | 75,895 |
| 12,100 | | @ | | S1 Corp. | | | 95,469 |
| 24,300 | | @ | | Sapient Corp. | | | 107,892 |
| 3,800 | | @, L | | Shutterfly, Inc. | | | 26,562 |
| 14,900 | | @ | | SonicWALL, Inc. | | | 59,302 |
| 5,700 | | @ | | Sourcefire, Inc. | | | 31,920 |
| 4,500 | | @ | | Stamps.com, Inc. | | | 44,235 |
| 7,700 | | @ | | TechTarget, Inc. | | | 33,264 |
| 12,000 | | @ | | TeleCommunication Systems, Inc. | | | 103,080 |
| 13,700 | | @ | | Terremark Worldwide, Inc. | | | 53,293 |
| 8,800 | | | | TheStreet.com, Inc. | | | 25,520 |
| 15,800 | | @ | | thinkorswim Group, Inc. | | | 88,796 |
| 51,500 | | @ | | TIBCO Software, Inc. | | | 267,285 |
| 16,893 | | | | United Online, Inc. | | | 102,541 |
| 21,600 | | @ | | Valueclick, Inc. | | | 147,744 |
| 6,700 | | @ | | Vasco Data Security Intl. | | | 69,211 |
| 4,800 | | @ | | Vignette Corp. | | | 45,168 |
| 4,000 | | @ | | Vocus, Inc. | | | 72,840 |
| 10,600 | | @ | | Websense, Inc. | | | 158,682 |
| | | | | | | |
| | | | | | | 5,113,631 |
| | | | | | | |
| Investment Companies: 0.5% | | | |
| 37,900 | | | | Apollo Investment Corp. | | | 352,849 |
| 22,200 | | | | Ares Capital Corp. | | | 140,526 |
| 6,100 | | L | | BlackRock Kelso Capital Corp. | | | 60,146 |
| 600 | | | | Capital Southwest Corp. | | | 64,896 |
| 1,900 | | | | Fifth Street Finance Corp | | | 14,345 |
| 7,600 | | @ | | Harris & Harris Group, Inc. | | | 30,020 |
| 11,700 | | | | Hercules Technology Growth Capital, Inc. | | | 92,664 |
| 6,700 | | | | Kohlberg Capital Corp. | | | 24,388 |
| 2,000 | | | | Medallion Financial Corp. | | | 15,260 |
| 8,100 | | | | NGP Capital Resources Co. | | | 67,797 |
| 11,100 | | | | Patriot Capital Funding, Inc. | | | 40,404 |
| 8,200 | | | | Prospect Capital Corp. | | | 98,154 |
| | | | | | | |
| | | | | | | 1,001,449 |
| | | | | | | |
| Iron/Steel: 0.0% | | | |
| 2,100 | | | | Olympic Steel, Inc. | | | 42,777 |
| 8,300 | | @, @@ | | Sutor Technology Group, Ltd. | | | 19,173 |
| 2,100 | | @ | | Universal Stainless & Alloy | | | 30,429 |
| | | | | | | |
| | | | | | | 92,379 |
| | | | | | | |
| Leisure Time: 0.5% | | | |
| 6,500 | | | | Ambassadors Group, Inc. | | | 59,800 |
| 24,800 | | | | Brunswick Corp. | | | 104,408 |
| 17,600 | | | | Callaway Golf Co. | | | 163,504 |
| 9,200 | | @, L | | Life Time Fitness, Inc. | | | 119,140 |
| 7,700 | | | | Marine Products Corp. | | | 43,274 |
| 10,600 | | @ | | Nautilus, Inc. | | | 23,426 |
| 8,600 | | L | | Polaris Industries, Inc. | | | 246,390 |
| 13,300 | | @ | | Town Sports International Holdings, Inc. | | | 42,427 |
| 11,800 | | @ | | WMS Industries, Inc. | | | 317,420 |
| | | | | | | |
| | | | | | | 1,119,789 |
| | | | | | | |
| Lodging: 0.1% | | | |
| 4,900 | | | | Ameristar Casinos, Inc. | | | 42,336 |
| 8,400 | | @ | | Gaylord Entertainment Co. | | | 91,056 |
| 8,200 | | @ | | Lodgian, Inc. | | | 17,466 |
See Accompanying Notes to Financial Statements
68
| | |
| ING RUSSELL™ SMALL CAP INDEX PORTFOLIO | | PORTFOLIO OF INVESTMENTS ASOF DECEMBER 31, 2008 (CONTINUED) |
| | | | | | | |
| Shares | | | | | | Value |
| | | | | | | |
| Lodging: (continued) | | | |
| 6,400 | | | | Marcus Corp. | | $ | 103,872 |
| 2,900 | | @ | | Monarch Casino & Resort, Inc. | | | 33,785 |
| 5,300 | | @ | | Morgans Hotel Group Co. | | | 24,698 |
| | | | | | | |
| | | | | | | 313,213 |
| | | | | | | |
| Machinery - Construction & Mining: 0.1% | | | |
| 5,400 | | @ | | Astec Industries, Inc. | | | 169,182 |
| | | | | | | |
| | | | | | | 169,182 |
| | | | | | | |
| Machinery - Diversified: 1.5% | | | |
| 6,200 | | | | Albany International Corp. | | | 79,608 |
| 6,900 | | @ | | Altra Holdings, Inc. | | | 54,579 |
| 11,900 | | | | Applied Industrial Technologies, Inc. | | | 225,148 |
| 12,900 | | L | | Briggs & Stratton Corp. | | | 226,911 |
| 3,000 | | | | Cascade Corp. | | | 89,580 |
| 7,600 | | @ | | Chart Industries, Inc. | | | 80,788 |
| 11,000 | | | | Cognex Corp. | | | 162,800 |
| 3,900 | | @ | | Columbus McKinnon Corp. | | | 53,235 |
| 2,000 | | @ | | DXP Enterprises, Inc. | | | 29,220 |
| 5,100 | | @ | | Gerber Scientific, Inc. | | | 26,061 |
| 3,600 | | | | Gorman-Rupp Co. | | | 112,032 |
| 1,300 | | @ | | Hurco Cos, Inc. | | | 15,600 |
| 16,600 | | @ | | Intermec, Inc. | | | 220,448 |
| 4,700 | | @ | | Intevac, Inc. | | | 23,829 |
| 5,800 | | @, L | | iRobot Corp. | | | 52,374 |
| 5,900 | | @ | | Kadant, Inc. | | | 79,532 |
| 1,700 | | @ | | Key Technology, Inc. | | | 32,113 |
| 3,200 | | | | Lindsay Manufacturing Co. | | | 101,728 |
| 4,000 | | @ | | Middleby Corp. | | | 109,080 |
| 1,900 | | | | Nacco Industries, Inc. | | | 71,079 |
| 9,200 | | L | | Nordson Corp. | | | 297,068 |
| 12,300 | | @, L | | Raser Technologies, Inc. | | | 45,879 |
| 7,200 | | | | Robbins & Myers, Inc. | | | 116,424 |
| 6,900 | | | | Sauer-Danfoss, Inc. | | | 60,375 |
| 4,500 | | @ | | Tecumseh Products Co. | | | 43,110 |
| 3,600 | | | | Tennant Co. | | | 55,440 |
| 9,800 | | @ | | TurboChef Technologies, Inc. | | | 48,118 |
| 13,100 | | | | Wabtec Corp. | | | 520,725 |
| | | | | | | |
| | | | | | | 3,032,884 |
| | | | | | | |
| Media: 0.5% | | | |
| 4,400 | | | | AH Belo Corp. | | | 9,592 |
| 23,200 | | | | Belo Corp. | | | 36,192 |
| 111,300 | | @, L | | Charter Communications, Inc. | | | 9,104 |
| 13,900 | | @ | | CKX, Inc. | | | 51,013 |
| 3,500 | | | | Courier Corp. | | | 62,650 |
| 6,200 | | @ | | Cox Radio, Inc. | | | 37,262 |
| 31,400 | | @ | | Cumulus Media, Inc. | | | 78,186 |
| 5,300 | | @ | | DG FastChannel, Inc. | | | 66,144 |
| 5,400 | | @ | | Dolan Media Co. | | | 35,586 |
| 28,400 | | L | | Entercom Communications Corp. | | | 34,932 |
| 29,800 | | @ | | Entravision Communications Corp. | | | 46,488 |
| 1,500 | | @ | | Fisher Communications, Inc. | | | 30,960 |
| 50,900 | | L | | Gray Television, Inc. | | | 20,360 |
| 37,983 | | L | | Lee Enterprises, Inc. | | | 15,573 |
| 12,000 | | @ | | Martha Stewart Living Omnimedia | | | 31,200 |
| 10,400 | | | | McClatchy Co. | | | 8,320 |
| 23,000 | | L | | Media General, Inc. | | | 40,250 |
| 16,800 | | @ | | Mediacom Communications Corp. | | | 72,240 |
| 12,600 | | @ | | Playboy Enterprises, Inc. | | | 27,216 |
| 200 | | @ | | Rhi Entertainment, Inc. | | | 1,624 |
| 7,000 | | | | Scholastic Corp. | | | 95,060 |
| 16,500 | | | | Sinclair Broadcast Group, Inc. | | | 51,150 |
| | | | | | | |
| Shares | | | | | | Value |
| | | | | | | |
| Media: (continued) | | | |
| 2,000 | | | | Value Line, Inc. | | $ | 69,040 |
| 8,200 | | L | | World Wrestling Entertainment, Inc. | | | 90,856 |
| | | | | | | |
| | | | | | | 1,020,998 |
| | | | | | | |
| Metal Fabricate/Hardware: 0.9% | | | |
| 4,000 | | | | AM Castle & Co. | | | 43,320 |
| 2,200 | | | | Ampco-Pittsburgh Corp. | | | 47,740 |
| 5,900 | | | | CIRCOR International, Inc. | | | 162,250 |
| 2,300 | | | | Dynamic Materials Corp. | | | 44,413 |
| 13,300 | | @ | | Furmanite Corp. | | | 71,687 |
| 3,300 | | @ | | Haynes International, Inc. | | | 81,246 |
| 7,300 | | | | Kaydon Corp. | | | 250,755 |
| 4,000 | | @ | | Ladish Co., Inc. | | | 55,400 |
| 2,100 | | | | Lawson Products | | | 47,985 |
| 2,900 | | @ | | LB Foster Co. | | | 90,712 |
| 10,400 | | | | Mueller Industries, Inc. | | | 260,832 |
| 28,100 | | | | Mueller Water Products, Inc. | | | 236,040 |
| 8,000 | | | | NN, Inc. | | | 18,320 |
| 2,500 | | @ | | Northwest Pipe Co. | | | 106,525 |
| 6,300 | | @ | | RBC Bearings, Inc. | | | 127,764 |
| 2,600 | | | | Sun Hydraulics Corp. | | | 48,984 |
| 17,300 | | | | Worthington Industries | | | 190,646 |
| | | | | | | |
| | | | | | | 1,884,619 |
| | | | | | | |
| Mining: 0.9% | | | |
| 15,900 | | @ | | Allied Nevada Gold Corp. | | | 80,454 |
| 6,900 | | | | Amcol International Corp. | | | 144,555 |
| 51,400 | | @, @@ | | Apex Silver Mines Ltd. | | | 50,372 |
| 4,700 | | @ | | Brush Engineered Materials, Inc. | | | 59,784 |
| 118,100 | | @, L | | Coeur d’Alene Mines Corp. | | | 103,928 |
| 9,300 | | | | Compass Minerals International, Inc. | | | 545,538 |
| 22,900 | | @, L | | General Moly, Inc. | | | 27,022 |
| 32,400 | | @, L | | Hecla Mining Co. | | | 90,720 |
| 13,400 | | @ | | Horsehead Holding Corp. | | | 62,980 |
| 4,300 | | | | Kaiser Aluminum Corp. | | | 96,836 |
| 8,200 | | | | Royal Gold, Inc. | | | 403,522 |
| 6,200 | | @ | | RTI International Metals, Inc. | | | 88,722 |
| 13,300 | | @ | | Stillwater Mining Co | | | 65,702 |
| 29,700 | | @, L | | USEC, Inc. | | | 133,353 |
| | | | | | | |
| | | | | | | 1,953,488 |
| | | | | | | |
| Miscellaneous Manufacturing: 1.9% | | | |
| 16,000 | | | | Actuant Corp. | | | 304,320 |
| 11,000 | | | | Acuity Brands, Inc. | | | 384,010 |
| 2,900 | | | | American Railcar Industries, Inc. | | | 30,537 |
| 2,600 | | | | Ameron International Corp. | | | 163,592 |
| 5,700 | | | | AO Smith Corp. | | | 168,264 |
| 3,200 | | @ | | AZZ, Inc. | | | 80,320 |
| 14,100 | | | | Barnes Group, Inc. | | | 204,450 |
| 10,500 | | @ | | Blount International, Inc. | | | 99,540 |
| 7,600 | | @ | | Ceradyne, Inc. | | | 154,356 |
| 6,300 | | @, @@, L | | China Fire & Security Group, Inc. | | | 42,903 |
| 13,600 | | | | Clarcor, Inc. | | | 451,248 |
| 4,000 | | @ | | Colfax Corp. | | | 41,560 |
| 3,700 | | @ | | EnPro Industries, Inc. | | | 79,698 |
| 7,300 | | @ | | ESCO Technologies, Inc. | | | 298,935 |
| 15,400 | | | | Federal Signal Corp. | | | 126,434 |
| 2,800 | | | | Freightcar America, Inc. | | | 51,156 |
| 1,700 | | @ | | GenTek, Inc. | | | 25,585 |
See Accompanying Notes to Financial Statements
69
| | |
| ING RUSSELL™ SMALL CAP INDEX PORTFOLIO | | PORTFOLIO OF INVESTMENTS ASOF DECEMBER 31, 2008 (CONTINUED) |
| | | | | | | |
| Shares | | | | | | Value |
| | | | | | | |
| Miscellaneous Manufacturing: (continued) | | | |
| 3,200 | | @ | | Griffon Corp. | | $ | 29,856 |
| 26,700 | | @ | | Hexcel Corp. | | | 197,313 |
| 5,800 | | | | Koppers Holdings, Inc. | | | 125,396 |
| 4,600 | | @ | | LSB Industries, Inc. | | | 38,272 |
| 5,600 | | @ | | Lydall, Inc. | | | 32,200 |
| 8,100 | | | | Matthews International Corp. - Class A | | | 297,108 |
| 5,100 | | @, L | | Metabolix, Inc. | | | 64,872 |
| 7,500 | | | | Myers Industries, Inc. | | | 60,000 |
| 4,800 | | | | NL Industries, Inc. | | | 64,320 |
| 3,100 | | @ | | Park-Ohio Holdings Corp. | | | 19,127 |
| 2,500 | | @ | | PMFG, Inc. | | | 23,900 |
| 4,700 | | @ | | Polypore International, Inc. | | | 35,532 |
| 4,500 | | | | Raven Industries, Inc. | | | 108,450 |
| 16,800 | | @ | | Smith & Wesson Holding Corp. | | | 38,136 |
| 3,300 | | | | Standex International Corp. | | | 65,472 |
| 7,400 | | | | Tredegar Corp. | | | 134,532 |
| | | | | | | |
| | | | | | | 4,041,394 |
| | | | | | | |
| Office Furnishings: 0.3% | | | |
| 15,500 | | | | Herman Miller, Inc. | | | 201,965 |
| 10,000 | | | | HNI, Corp. | | | 158,400 |
| 10,800 | | | | Interface, Inc. | | | 50,112 |
| 15,400 | | | | Knoll, Inc. | | | 138,908 |
| | | | | | | |
| | | | | | | 549,385 |
| | | | | | | |
| Oil & Gas: 2.5% | | | |
| 4,000 | | L | | Alon USA Energy, Inc. | | | 36,600 |
| 1,600 | | | | APCO Argentina, Inc. | | | 42,608 |
| 3,200 | | @ | | Approach Resources, Inc. | | | 23,392 |
| 10,100 | | @ | | Arena Resources, Inc. | | | 283,709 |
| 8,000 | | | | Atlas America, Inc. | | | 118,800 |
| 8,100 | | @ | | ATP Oil & Gas Corp. | | | 47,385 |
| 13,600 | | | | Berry Petroleum Co. | | | 102,816 |
| 9,900 | | @ | | Bill Barrett Corp. | | | 209,187 |
| 18,800 | | @, L | | BPZ Energy, Inc. | | | 120,320 |
| 20,800 | | @ | | Brigham Exploration Co. | | | 66,560 |
| 5,800 | | @, L | | Bronco Drilling Co., Inc. | | | 37,468 |
| 16,800 | | @ | | Callon Petroleum Co. | | | 43,680 |
| 51,200 | | @, L | | Cano Petroleum, Inc. | | | 22,528 |
| 7,300 | | @ | | Carrizo Oil & Gas, Inc. | | | 117,530 |
| 5,900 | | @, L | | Cheniere Energy, Inc. | | | 16,815 |
| 1,100 | | @ | | Clayton Williams Energy, Inc. | | | 49,984 |
| 12,900 | | @ | | Comstock Resources, Inc. | | | 609,525 |
| 14,400 | | @ | | Concho Resources, Inc. | | | 328,608 |
| 4,000 | | @ | | Contango Oil & Gas Co. | | | 225,200 |
| 13,800 | | @ | | CVR Energy, Inc. | | | 55,200 |
| 5,300 | | | | Delek US Holdings, Inc. | | | 28,037 |
| 15,700 | | @, L | | Delta Petroleum Corp. | | | 74,732 |
| 36,500 | | @ | | Endeavour International Corp. | | | 18,250 |
| 19,900 | | @@ | | Energy XXI Bermuda Ltd. | | | 15,721 |
| 39,100 | | @ | | EXCO Resources, Inc. | | | 354,246 |
| 14,700 | | @ | | FX Energy, Inc. | | | 41,013 |
| 1,400 | | @ | | GeoMet, Inc. | | | 2,408 |
| 3,600 | | @, L | | GMX Resources, Inc. | | | 91,152 |
| 5,400 | | @, L | | Goodrich Petroleum Corp. | | | 161,730 |
| 63,400 | | @, @@ | | Gran Tierra Energy, Inc. | | | 177,520 |
| 8,600 | | @ | | Gulfport Energy Corp. | | | 33,970 |
| 11,000 | | @ | | Harvest Natural Resources, Inc. | | | 47,300 |
| 300 | | | | Houston American Energy Corp. | | | 1,014 |
| 15,200 | | @ | | McMoRan Exploration Co. | | | 148,960 |
| 14,300 | | @ | | Meridian Resource Corp. | | | 8,151 |
| 7,400 | | @, L | | Northern Oil And Gas, Inc. | | | 19,240 |
| | | | | | | |
| Shares | | | | | | Value |
| | | | | | | |
| Oil & Gas: (continued) | | | |
| 45,100 | | @, @@, L | | Oilsands Quest, Inc. | | $ | 32,923 |
| 2,400 | | | | Panhandle Oil and Gas, Inc. | | | 43,200 |
| 14,700 | | @ | | Parallel Petroleum Corp. | | | 29,547 |
| 33,600 | | @ | | Parker Drilling Co. | | | 97,440 |
| 11,100 | | | | Penn Virginia Corp. | | | 288,378 |
| 4,000 | | @ | | Petroleum Development Corp. | | | 96,280 |
| 11,700 | | @ | | Petroquest Energy, Inc. | | | 79,092 |
| 15,200 | | @ | | Pioneer Drilling Co. | | | 84,664 |
| 19,100 | | @ | | RAM Energy Resources, Inc. | | | 16,808 |
| 11,800 | | @ | | Rex Energy Corp. | | | 34,692 |
| 10,900 | | @ | | Rosetta Resources, Inc. | | | 77,172 |
| 8,310 | | @ | | Stone Energy Corp. | | | 91,576 |
| 18,800 | | @, L | | Sulphco, Inc. | | | 17,672 |
| 8,500 | | @ | | Swift Energy Co. | | | 142,885 |
| 5,200 | | @, L | | Toreador Resources Corp. | | | 28,548 |
| 9,200 | | @, L | | TXCO Resources, Inc. | | | 13,708 |
| 19,100 | | @ | | Vaalco Energy, Inc. | | | 142,104 |
| 8,800 | | @ | | Venoco, Inc. | | | 23,848 |
| 15,800 | | @ | | Warren Resources, Inc. | | | 31,442 |
| 8,000 | | L | | Western Refining, Inc. | | | 62,080 |
| | | | | | | |
| | | | | | | 5,215,418 |
| | | | | | | |
| Oil & Gas Services: 0.8% | | | |
| 6,900 | | @ | | Allis-Chalmers Energy, Inc. | | | 37,950 |
| 10,100 | | @ | | Basic Energy Services, Inc. | | | 131,704 |
| 6,200 | | @, L | | Cal Dive International, Inc. | | | 40,362 |
| 5,500 | | | | CARBO Ceramics, Inc. | | | 195,415 |
| 12,900 | | @ | | Complete Production Services, Inc. | | | 105,135 |
| 2,200 | | @ | | Dawson Geophysical Co. | | | 39,182 |
| 8,500 | | @ | | Dril-Quip, Inc. | | | 174,335 |
| 7,700 | | @ | | Flotek Industries, Inc. | | | 19,404 |
| 3,200 | | | | Gulf Island Fabrication, Inc. | | | 46,112 |
| 7,000 | | @ | | Hornbeck Offshore Services, Inc. | | | 114,380 |
| 18,200 | | @ | | ION Geophysical Corp. | | | 62,426 |
| 4,300 | | | | Lufkin Industries, Inc. | | | 148,350 |
| 6,000 | | @ | | Matrix Service Co. | | | 46,020 |
| 5,700 | | @ | | NATCO Group, Inc. | | | 86,526 |
| 2,000 | | @ | | Natural Gas Services Group, Inc. | | | 20,260 |
| 20,200 | | @ | | Newpark Resources | | | 74,740 |
| 8,400 | | | | RPC, Inc. | | | 81,984 |
| 5,600 | | @ | | Superior Well Services, Inc. | | | 56,000 |
| 4,100 | | @ | | T-3 Energy Services, Inc. | | | 38,704 |
| 4,900 | | @ | | Union Drilling, Inc. | | | 25,431 |
| 6,400 | | @, @@ | | Willbros Group, Inc | | | 54,208 |
| | | | | | | |
| | | | | | | 1,598,628 |
| | | | | | | |
| Packaging & Containers: 0.4% | | | |
| 2,200 | | @ | | AEP Industries, Inc. | | | 38,676 |
| 4,000 | | @ | | Bway Holding Co. | | | 31,840 |
| 30,300 | | @ | | Graphic Packaging Holding Co. | | | 34,542 |
| 10,000 | | | | Rock-Tenn Co. | | | 341,800 |
| 8,400 | | | | Silgan Holdings, Inc. | | | 401,604 |
| | | | | | | |
| | | | | | | 848,462 |
| | | | | | | |
| Pharmaceuticals: 2.8% | | | |
| 17,700 | | @ | | Acadia Pharmaceuticals, Inc. | | | 15,930 |
| 11,200 | | @ | | Adolor, Corp. | | | 18,592 |
| 10,500 | | @, L | | Akorn, Inc. | | | 24,150 |
| 10,500 | | @ | | Alexza Pharmaceuticals, Inc. | | | 33,285 |
| 24,500 | | @ | | Alkermes, Inc. | | | 260,925 |
| 14,600 | | @ | | Allos Therapeutics, Inc. | | | 89,352 |
See Accompanying Notes to Financial Statements
70
| | |
| ING RUSSELL™ SMALL CAP INDEX PORTFOLIO | | PORTFOLIO OF INVESTMENTS ASOF DECEMBER 31, 2008 (CONTINUED) |
| | | | | | | |
| Shares | | | | | | Value |
| | | | | | | |
| Pharmaceuticals: (continued) | | | |
| 2,900 | | @ | | Amicus Therapeutics, Inc. | | $ | 23,142 |
| 8,900 | | @ | | Array Biopharma, Inc. | | | 36,045 |
| 11,400 | | @, L | | Auxilium Pharmaceuticals, Inc. | | | 324,216 |
| 7,300 | | @, L | | Cadence Pharmaceuticals, Inc. | | | 52,779 |
| 5,600 | | @, S | | Caraco Pharmaceutical Laboratories Ltd. | | | 33,152 |
| 9,200 | | @ | | Catalyst Health Solutions, Inc. | | | 224,020 |
| 3,200 | | @, @@, L | | China Sky One Medical, Inc. | | | 51,168 |
| 15,800 | | @, L | | CV Therapeutics, Inc. | | | 145,518 |
| 13,100 | | @ | | Cypress Bioscience, Inc. | | | 89,604 |
| 24,100 | | @ | | Depomed, Inc. | | | 39,765 |
| 22,100 | | @ | | Durect Corp. | | | 74,919 |
| 15,300 | | @ | | Dyax Corp. | | | 55,692 |
| 6,100 | | @ | | Idenix Pharmaceuticals, Inc. | | | 35,319 |
| 7,800 | | @ | | I-Flow Corp. | | | 37,440 |
| 26,500 | | @ | | Indevus Pharmaceuticals, Inc. | | | 83,210 |
| 8,800 | | @ | | Inspire Pharmaceuticals, Inc. | | | 31,680 |
| 22,100 | | @, L | | Isis Pharmaceuticals, Inc. | | | 313,378 |
| 10,600 | | @ | | KV Pharmaceutical Co. | | | 30,528 |
| 11,400 | | @, L | | MannKind Corp. | | | 39,102 |
| 32,100 | | @ | | Medarex, Inc. | | | 179,118 |
| 17,600 | | | | Medicis Pharmaceutical Corp. | | | 244,640 |
| 5,400 | | @, L | | Medivation, Inc. | | | 78,678 |
| 18,000 | | @ | | Nabi Biopharmaceuticals | | | 60,300 |
| 21,700 | | @ | | Nektar Therapeutics | | | 120,652 |
| 4,000 | | @ | | Neogen Corp. | | | 99,920 |
| 5,500 | | @ | | Neurocrine Biosciences, Inc. | | | 17,600 |
| 5,300 | | @ | | Noven Pharmaceuticals, Inc. | | | 58,300 |
| 3,600 | | @ | | Obagi Medical Products, Inc. | | | 26,856 |
| 14,900 | | @ | | Onyx Pharmaceuticals, Inc. | | | 508,984 |
| 6,400 | | @, L | | Optimer Pharmaceuticals, Inc. | | | 77,504 |
| 6,600 | | @ | | Orexigen Therapeutics, Inc. | | | 36,828 |
| 3,600 | | @, L | | Osiris Therapeutics, Inc. | | | 68,976 |
| 11,400 | | @ | | Pain Therapeutics, Inc. | | | 67,488 |
| 9,200 | | @ | | Par Pharmaceutical Cos., Inc. | | | 123,372 |
| 5,200 | | @ | | Pharmasset, Inc. | | | 68,172 |
| 8,500 | | @ | | PharMerica Corp. | | | 133,195 |
| 7,600 | | @, L | | Pozen, Inc. | | | 38,304 |
| 5,200 | | @, L | | Progenics Pharmaceuticals, Inc. | | | 53,612 |
| 15,300 | | @ | | Questcor Pharmaceuticals, Inc. | | | 142,443 |
| 9,900 | | @ | | Rigel Pharmaceuticals, Inc. | | | 79,200 |
| 6,900 | | @, L | | Salix Pharmaceuticals Ltd. | | | 60,927 |
| 16,900 | | @ | | Savient Pharmaceuticals, Inc. | | | 97,851 |
| 6,000 | | @ | | Schiff Nutrition International, Inc. | | | 35,820 |
| 500 | | @ | | Sucampo Pharmaceuticals, Inc. | | | 2,875 |
| 2,500 | | @, L | | Synutra International, Inc. | | | 27,550 |
| 8,700 | | @ | | Targacept, Inc. | | | 30,972 |
| 14,200 | | @ | | Theravance, Inc. | | | 175,938 |
| 1,900 | | @, L | | USANA Health Sciences, Inc. | | | 65,056 |
| 17,500 | | @, L | | Valeant Pharmaceuticals International | | | 400,750 |
| 19,200 | | @ | | Viropharma, Inc. | | | 249,984 |
| 15,300 | | @, L | | Vivus, Inc. | | | 81,396 |
| 7,500 | | @ | | Xenoport, Inc. | | | 188,100 |
| | | | | | | |
| | | | | | | 5,864,272 |
| | | | | | | |
| Pipelines: 0.0% | | | |
| 16,300 | | | | Crosstex Energy, Inc. | | | 63,570 |
| | | | | | | |
| | | | | | | 63,570 |
| | | | | | | |
| Real Estate: 0.2% | | | |
| 2,100 | | @ | | Avatar Holdings, Inc. | | | 55,692 |
| 800 | | | | Consolidated-Tomoka Land Co. | | | 30,552 |
| | | | | | | |
| Shares | | | | | | Value |
| | | | | | | |
| Real Estate: (continued) | | | |
| 11,000 | | @ | | Forestar Real Estate Group, Inc. | | $ | 104,720 |
| 12,200 | | @ | | Hilltop Holdings, Inc. | | | 118,828 |
| 3,300 | | @ | | Stratus Properties, Inc. | | | 41,118 |
| 10,600 | | | | Thomas Properties Group, Inc. | | | 27,454 |
| | | | | | | |
| | | | | | | 378,364 |
| | | | | | | |
| Retail: 4.4% | | | |
| 14,200 | | @ | | 99 Cents Only Stores | | | 155,206 |
| 18,500 | | @ | | Aeropostale, Inc. | | | 297,850 |
| 11,100 | | @ | | AFC Enterprises | | | 52,059 |
| 2,300 | | @ | | America’s Car-Mart, Inc. | | | 31,763 |
| 6,700 | | | | Asbury Automotive Group, Inc. | | | 30,619 |
| 9,800 | | | | Bebe Stores, Inc. | | | 73,206 |
| 4,400 | | @ | | BJ’s Restaurants, Inc. | | | 47,388 |
| 37,700 | | @, L | | Blockbuster, Inc. | | | 46,371 |
| 8,200 | | | | Bob Evans Farms, Inc. | | | 167,526 |
| 75,700 | | | | Borders Group, Inc. | | | 30,280 |
| 8,900 | | | | Brown Shoe Co., Inc. | | | 75,383 |
| 5,850 | | | | Buckle, Inc. | | | 127,647 |
| 4,900 | | @ | | Buffalo Wild Wings, Inc. | | | 125,685 |
| 8,300 | | @ | | Cabela’s, Inc. | | | 48,389 |
| 4,900 | | @ | | California Pizza Kitchen, Inc. | | | 52,528 |
| 13,500 | | | | Casey’s General Stores, Inc. | | | 307,395 |
| 7,900 | | | | Cash America International, Inc. | | | 216,065 |
| 8,300 | | | | Cato Corp. | | | 125,330 |
| 5,700 | | @ | | CEC Entertainment, Inc. | | | 138,225 |
| 2,800 | | @ | | Charlotte Russe Holding, Inc. | | | 18,172 |
| 35,100 | | @ | | Charming Shoppes, Inc. | | | 85,644 |
| 22,700 | | @ | | Cheesecake Factory | | | 229,270 |
| 43,400 | | @ | | Chico’s FAS, Inc. | | | 181,412 |
| 6,300 | | @ | | Childrens Place Retail Stores, Inc. | | | 136,584 |
| 7,300 | | | | Christopher & Banks Corp. | | | 40,880 |
| 4,600 | | @ | | Citi Trends, Inc. | | | 67,712 |
| 11,800 | | | | CKE Restaurants, Inc. | | | 102,424 |
| 20,500 | | @ | | Coldwater Creek, Inc. | | | 58,425 |
| 17,000 | | @ | | Collective Brands, Inc. | | | 199,240 |
| 3,800 | | @ | | Conn’s, Inc. | | | 32,224 |
| 5,300 | | | | Cracker Barrel Old Country Store | | | 109,127 |
| 31,800 | | @ | | Denny’s Corp. | | | 63,282 |
| 15,900 | | | | Dillard’s, Inc. | | | 63,123 |
| 2,700 | | L | | DineEquity, Inc. | | | 31,212 |
| 11,300 | | @ | | Domino’s Pizza, Inc. | | | 53,223 |
| 9,000 | | @, L | | Dress Barn, Inc. | | | 96,660 |
| 2,000 | | @, L | | DSW, Inc. | | | 24,920 |
| 10,300 | | @ | | Ezcorp, Inc. | | | 156,663 |
| 8,779 | | | | Finish Line | | | 49,162 |
| 5,900 | | @ | | First Cash Financial Services, Inc. | | | 112,454 |
| 9,200 | | | | Fred’s, Inc. | | | 98,992 |
| 3,300 | | @, @@ | | Fuqi International, Inc. | | | 20,658 |
| 4,300 | | @ | | Gaiam, Inc. | | | 19,866 |
| 5,200 | | @ | | Genesco, Inc. | | | 87,984 |
| 5,300 | | L | | Group 1 Automotive, Inc. | | | 57,081 |
| 7,200 | | @ | | Gymboree Corp. | | | 187,848 |
| 2,600 | | L | | Haverty Furniture Cos., Inc. | | | 24,258 |
| 5,500 | | @ | | hhgregg, Inc. | | | 47,740 |
| 7,300 | | @ | | Hibbett Sporting Goods, Inc. | | | 114,683 |
| 10,400 | | @ | | HOT Topic, Inc. | | | 96,408 |
| 9,800 | | @, L | | J Crew Group, Inc. | | | 119,560 |
| 16,000 | | @ | | Jack in the Box, Inc. | | | 353,440 |
| 6,300 | | @ | | Jo-Ann Stores, Inc. | | | 97,587 |
| 5,500 | | @, L | | JoS. A Bank Clothiers, Inc. | | | 143,825 |
| 5,000 | | | | Kenneth Cole Productions, Inc. | | | 35,400 |
| 13,900 | | @, L | | Krispy Kreme Doughnuts, Inc. | | | 23,352 |
See Accompanying Notes to Financial Statements
71
| | |
| ING RUSSELL™ SMALL CAP INDEX PORTFOLIO | | PORTFOLIO OF INVESTMENTS ASOF DECEMBER 31, 2008 (CONTINUED) |
| | | | | | | |
| Shares | | | | | | Value |
| | | | | | | |
| Retail: (continued) | | | |
| 4,600 | | | | Landry’s Restaurants, Inc. | | $ | 53,360 |
| 5,800 | | @, @@, L | | Lululemon Athletica, Inc. | | | 45,994 |
| 4,000 | | @ | | Lumber Liquidators, Inc. | | | 42,240 |
| 10,400 | | @, L | | MarineMax, Inc. | | | 35,256 |
| 13,500 | | | | Men’s Wearhouse, Inc. | | | 182,790 |
| 10,000 | | @ | | New York & Co., Inc. | | | 23,200 |
| 13,900 | | | | Nu Skin Enterprises, Inc. | | | 144,977 |
| 20,900 | | @ | | Pacific Sunwear of California | | | 33,231 |
| 6,100 | | @ | | Pantry, Inc. | | | 130,845 |
| 6,300 | | @ | | Papa John’s International, Inc. | | | 116,109 |
| 10,200 | | @ | | PC Mall, Inc. | | | 40,902 |
| 11,300 | | | | PEP Boys-Manny Moe & Jack | | | 46,669 |
| 7,000 | | @ | | PetMed Express, Inc. | | | 123,410 |
| 5,800 | | @, L | | PF Chang’s China Bistro, Inc. | | | 121,452 |
| 4,900 | | | | Pricesmart, Inc. | | | 101,234 |
| 4,500 | | @ | | Red Robin Gourmet Burgers, Inc. | | | 75,735 |
| 9,300 | | | | Regis Corp. | | | 135,129 |
| 12,600 | | @ | | Retail Ventures, Inc. | | | 43,722 |
| 4,700 | | @ | | Rex Stores Corp. | | | 37,929 |
| 8,300 | | @ | | Ruby Tuesday, Inc. | | | 12,948 |
| 8,100 | | @ | | Rush Enterprises, Inc. - Class A | | | 69,417 |
| 22,400 | | @ | | Sally Beauty Holdings, Inc. | | | 127,456 |
| 8,000 | | | | Sonic Automotive, Inc. | | | 31,840 |
| 14,200 | | @ | | Sonic Corp. | | | 172,814 |
| 9,900 | | | | Stage Stores, Inc. | | | 81,675 |
| 1,900 | | | | Stein Mart, Inc. | | | 2,147 |
| 2,200 | | @ | | Systemax, Inc. | | | 23,694 |
| 15,300 | | L | | Talbots, Inc. | | | 36,567 |
| 13,600 | | @ | | Texas Roadhouse, Inc. | | | 105,400 |
| 8,900 | | @ | | Tractor Supply Co. | | | 321,646 |
| 6,800 | | @ | | Tween Brands, Inc. | | | 29,376 |
| 3,100 | | @ | | Ulta Salon Cosmetics & Fragrance, Inc. | | | 25,668 |
| 97,700 | | | | Wendy’s/Arby’s Group, Inc. - Class A | | | 482,638 |
| 23,800 | | @ | | Wet Seal, Inc. | | | 70,686 |
| 7,300 | | | | World Fuel Services Corp. | | | 270,100 |
| 8,000 | | @ | | Zale Corp. | | | 26,640 |
| 6,300 | | @ | | Zumiez, Inc. | | | 46,935 |
| | | | | | | |
| | | | | | | 9,061,241 |
| | | | | | | |
| Savings & Loans: 1.4% | | | |
| 1,900 | | | | BankFinancial Corp. | | | 19,361 |
| 13,200 | | @ | | Beneficial Mutual Bancorp, Inc. | | | 148,500 |
| 400 | | | | Berkshire Hills Bancorp., Inc. | | | 12,344 |
| 15,400 | | | | Brookline Bancorp., Inc. | | | 164,010 |
| 7,000 | | | | Dime Community Bancshares | | | 93,100 |
| 7,600 | | | | ESSA Bancorp, Inc. | | | 107,388 |
| 31,800 | | S | | First Niagara Financial Group, Inc. | | | 514,206 |
| 13,700 | | @, L | | FirstFed Financial Corp. | | | 23,975 |
| 26,700 | | @, L | | Guaranty Financial Group, Inc. | | | 69,687 |
| 11,200 | | @ | | Investors Bancorp, Inc. | | | 150,416 |
| 1,700 | | @ | | Meridian Interstate Bancorp, Inc. | | | 15,725 |
| 3,300 | | | | NASB Financial, Inc. | | | 89,100 |
| 28,800 | | | | NewAlliance Bancshares, Inc. | | | 379,296 |
| 5,600 | | | | Northfield Bancorp, Inc. | | | 63,000 |
| 5,900 | | | | Northwest Bancorp, Inc. | | | 126,142 |
| 3,300 | | | | OceanFirst Financial Corp. | | | 54,780 |
| 4,000 | | @ | | Oritani Financial Corp. | | | 67,400 |
| 15,500 | | | | Provident Financial Services, Inc. | | | 237,150 |
| | | | | | | |
| Shares | | | | | | Value |
| | | | | | | |
| Savings & Loans: (continued) | | | |
| 5,300 | | | | Provident New York Bancorp | | $ | 65,720 |
| 6,900 | | | | Rockville Financial, Inc. | | | 96,393 |
| 5,200 | | | | Roma Financial Corp. | | | 65,468 |
| 5,900 | | | | ViewPoint Financial Group | | | 94,695 |
| 5,000 | | @ | | Waterstone Financial, Inc. | | | 16,750 |
| 3,300 | | | | Westfield Financial, Inc. | | | 34,056 |
| 2,400 | | | | WSFS Financial Corp. | | | 115,176 |
| | | | | | | |
| | | | | | | 2,823,838 |
| | | | | | | |
| Semiconductors: 2.6% | | | |
| 7,000 | | @ | | Actel Corp. | | | 82,040 |
| 15,500 | | @ | | Advanced Analogic Technologies, Inc. | | | 46,810 |
| 32,000 | | @ | | Amkor Technology, Inc. | | | 69,760 |
| 11,700 | | @ | | Anadigics, Inc. | | | 17,316 |
| 17,900 | | @ | | Applied Micro Circuits Corp. | | | 70,347 |
| 43,500 | | @ | | Asyst Technologies, Inc. | | | 10,875 |
| 7,900 | | @ | | ATMI, Inc. | | | 121,897 |
| 76,200 | | @ | | Axcelis Technologies, Inc. | | | 38,862 |
| 16,900 | | @ | | Brooks Automation, Inc. | | | 98,189 |
| 6,300 | | @ | | Cabot Microelectronics Corp. | | | 164,241 |
| 7,600 | | @, L | | Cavium Networks, Inc. | | | 79,876 |
| 8,300 | | @ | | Ceva, Inc. | | | 58,100 |
| 20,600 | | @ | | Cirrus Logic, Inc. | | | 55,208 |
| 6,300 | | | | Cohu, Inc. | | | 76,545 |
| 8,200 | | @ | | Diodes, Inc. | | | 49,692 |
| 7,400 | | @ | | DSP Group, Inc. | | | 59,348 |
| 33,600 | | @, L | | Emcore Corp. | | | 43,680 |
| 22,700 | | @ | | Emulex Corp. | | | 158,446 |
| 39,500 | | @ | | Entegris, Inc. | | | 86,505 |
| 13,300 | | @ | | Exar Corp. | | | 88,711 |
| 12,500 | | @ | | Formfactor, Inc. | | | 182,500 |
| 5,000 | | @ | | Hittite Microwave Corp. | | | 147,300 |
| 7,400 | | | | IXYS Corp. | | | 61,124 |
| 22,400 | | @ | | Kopin Corp. | | | 45,696 |
| 17,400 | | @, L | | Kulicke & Soffa Industries, Inc. | | | 29,580 |
| 34,700 | | @ | | Lattice Semiconductor Corp. | | | 52,397 |
| 38,500 | | @ | | LTX-Credence Corp. | | | 10,395 |
| 22,152 | | @ | | Macrovision Solutions Corp. | | | 280,223 |
| 28,400 | | @ | | Mattson Technology, Inc. | | | 40,044 |
| 15,400 | | | | Micrel, Inc. | | | 112,574 |
| 21,100 | | @ | | Microsemi Corp. | | | 266,704 |
| 22,500 | | @ | | Microtune, Inc. | | | 45,900 |
| 18,500 | | @ | | MIPS Technologies, Inc. | | | 20,535 |
| 14,600 | | @ | | MKS Instruments, Inc. | | | 215,934 |
| 7,700 | | @ | | Monolithic Power Systems, Inc. | | | 97,097 |
| 5,300 | | @ | | Netlogic Microsystems, Inc. | | | 116,653 |
| 13,500 | | @, L | | Omnivision Technologies, Inc. | | | 70,875 |
| 2,900 | | @ | | Pericom Semiconductor Corp. | | | 15,892 |
| 12,500 | | @ | | PLX Technology, Inc. | | | 21,500 |
| 52,800 | | @ | | PMC - Sierra, Inc. | | | 256,608 |
| 8,200 | | L | | Power Integrations, Inc. | | | 163,016 |
| 8,400 | | @ | | Rubicon Technology, Inc. | | | 35,784 |
| 6,600 | | @ | | Rudolph Technologies, Inc. | | | 23,298 |
| 17,300 | | @ | | Semtech Corp. | | | 194,971 |
| 6,300 | | @, L | | Sigma Designs, Inc. | | | 59,850 |
| 24,600 | | @ | | Silicon Image, Inc. | | | 103,320 |
| 27,300 | | @ | | Sirf Technology Holdings, Inc. | | | 34,944 |
| 46,200 | | @ | | Skyworks Solutions, Inc. | | | 255,948 |
| 35,200 | | @, L | | Spansion, LLC | | | 6,663 |
| 5,000 | | @ | | Standard Microsystems Corp. | | | 81,700 |
| 3,600 | | @ | | Supertex, Inc. | | | 86,436 |
| 7,000 | | @ | | Techwell, Inc. | | | 45,500 |
See Accompanying Notes to Financial Statements
72
| | |
| ING RUSSELL™ SMALL CAP INDEX PORTFOLIO | | PORTFOLIO OF INVESTMENTS ASOF DECEMBER 31, 2008 (CONTINUED) |
| | | | | | | |
| Shares | | | | | | Value |
| | | | | | | |
| Semiconductors: (continued) | | | |
| 14,900 | | @ | | Tessera Technologies, Inc. | | $ | 177,012 |
| 3,700 | | @ | | Transmeta Corp. | | | 67,340 |
| 38,300 | | @ | | Triquint Semiconductor, Inc. | | | 131,752 |
| 7,100 | | @ | | Ultratech, Inc. | | | 84,916 |
| 10,900 | | @ | | Veeco Instruments, Inc. | | | 69,106 |
| 5,900 | | @ | | Volterra Semiconductor Corp. | | | 42,185 |
| 13,800 | | @ | | Zoran Corp. | | | 94,254 |
| | | | | | | |
| | | | | | | 5,323,974 |
| | | | | | | |
| Software: 4.2% | | | |
| 16,100 | | @ | | Accelrys, Inc. | | | 70,196 |
| 9,100 | | @, L | | ACI Worldwide, Inc. | | | 144,690 |
| 20,700 | | @ | | Actuate Corp. | | | 61,272 |
| 14,100 | | | | Acxiom Corp. | | | 114,351 |
| 4,500 | | @, L | | Advent Software, Inc. | | | 89,865 |
| 33,200 | | @ | | Allscripts Healthcare Solutions, Inc. | | | 329,344 |
| 5,000 | | @ | | American Reprographics Co. | | | 34,500 |
| 14,100 | | | | American Software, Inc. | | | 66,270 |
| 23,300 | | @ | | Ariba, Inc. | | | 167,993 |
| 5,100 | | @ | | Athenahealth, Inc. | | | 191,862 |
| 5,000 | | @, L | | Avid Technology, Inc. | | | 54,550 |
| 11,800 | | | | Blackbaud, Inc. | | | 159,300 |
| 9,300 | | @ | | Blackboard, Inc. | | | 243,939 |
| 4,900 | | @ | | Bottomline Technologies, Inc. | | | 34,790 |
| 16,000 | | @ | | Callidus Software, Inc. | | | 47,840 |
| 10,700 | | @, L | | China Information Security Technology, Inc. | | | 38,520 |
| 11,000 | | @ | | Commvault Systems, Inc. | | | 147,510 |
| 4,300 | | | | Computer Programs & Systems, Inc. | | | 115,240 |
| 11,900 | | @ | | Concur Technologies, Inc. | | | 390,558 |
| 10,100 | | @ | | CSG Systems International | | | 176,447 |
| 3,800 | | @ | | Deltek, Inc. | | | 17,632 |
| 5,700 | | @ | | DemandTec, Inc. | | | 45,999 |
| 8,600 | | @ | | Digi International, Inc. | | | 69,746 |
| 8,000 | | @ | | DivX, Inc. | | | 41,840 |
| 4,800 | | @ | | Double-Take Software, Inc. | | | 43,056 |
| 2,300 | | @ | | Ebix, Inc. | | | 54,970 |
| 13,500 | | @ | | Eclipsys Corp. | | | 191,565 |
| 11,700 | | @ | | Epicor Software Corp. | | | 56,160 |
| 10,100 | | @ | | EPIQ Systems, Inc. | | | 168,771 |
| 14,400 | | | | Fair Isaac Corp. | | | 242,784 |
| 12,900 | | @ | | FalconStor Software, Inc. | | | 35,862 |
| 5,300 | | @ | | Guidance Software, Inc. | | | 21,624 |
| 11,800 | | | | infoGROUP, Inc. | | | 55,932 |
| 22,400 | | @ | | Informatica Corp. | | | 307,552 |
| 8,100 | | @, L | | Innerworkings, Inc. | | | 53,055 |
| 4,900 | | @ | | Interactive Intelligence, Inc. | | | 31,409 |
| 7,500 | | @ | | JDA Software Group, Inc. | | | 98,475 |
| 33,500 | | @ | | Lawson Software, Inc. | | | 158,790 |
| 5,500 | | @ | | Mantech International Corp. | | | 298,045 |
| 6,100 | | @ | | MedAssets, Inc. | | | 89,060 |
| 1,900 | | @ | | MicroStrategy, Inc. | | | 70,547 |
| 9,100 | | @ | | Monotype Imaging Holdings, Inc. | | | 52,780 |
| 10,200 | | @ | | MSCSoftware Corp. | | | 68,136 |
| 2,700 | | @, L | | NetSuite, Inc. | | | 22,788 |
| 10,200 | | @ | | Omnicell, Inc. | | | 124,542 |
| 17,600 | | @ | | Omniture, Inc. | | | 187,264 |
| 32,300 | | @ | | Parametric Technology Corp. | | | 408,595 |
| 5,800 | | | | Pegasystems, Inc. | | | 71,688 |
| 10,700 | | @ | | Phase Forward, Inc. | | | 133,964 |
| 7,400 | | @ | | Phoenix Technologies Ltd. | | | 25,900 |
| 11,300 | | @ | | Progress Software Corp. | | | 217,638 |
| 4,300 | | | | Quality Systems, Inc. | | | 187,566 |
| | | | | | | |
| Shares | | | | | | Value |
| | | | | | | |
| Software: (continued) | | | |
| 20,500 | | @ | | Quest Software, Inc. | | $ | 258,095 |
| 3,500 | | | | Renaissance Learning, Inc. | | | 31,465 |
| 5,800 | | @ | | RightNow Technologies, Inc. | | | 44,834 |
| 5,500 | | | | Schawk, Inc. | | | 63,030 |
| 8,200 | | @ | | Seachange Intl., Inc. | | | 59,122 |
| 6,900 | | @ | | Smith Micro Software, Inc. | | | 38,364 |
| 14,400 | | @ | | Solera Holdings, Inc. | | | 347,040 |
| 5,000 | | @ | | SPSS, Inc. | | | 134,800 |
| 22,500 | | @ | | Sybase, Inc. | | | 557,325 |
| 4,000 | | @ | | Synchronoss Technologies, Inc. | | | 42,640 |
| 4,900 | | @ | | SYNNEX Corp. | | | 55,517 |
| 21,400 | | @ | | Take-Two Interactive Software, Inc. | | | 161,784 |
| 6,000 | | @ | | Taleo Corp. | | | 46,980 |
| 17,400 | | @ | | THQ, Inc. | | | 72,906 |
| 20,400 | | @ | | Trident Microsystems, Inc. | | | 38,556 |
| 12,300 | | @ | | Tyler Technologies, Inc. | | | 147,354 |
| 7,000 | | @ | | Ultimate Software Group, Inc. | | | 102,200 |
| 19,500 | | @, L | | Verifone Holdings, Inc. | | | 95,550 |
| 18,800 | | @ | | Wind River Systems, Inc. | | | 169,764 |
| | | | | | | |
| | | | | | | 8,800,098 |
| | | | | | | |
| Storage/Warehousing: 0.0% | | | |
| 7,200 | | @ | | Mobile Mini, Inc. | | | 103,824 |
| | | | | | | |
| | | | | | | 103,824 |
| | | | | | | |
| Telecommunications: 3.6% | | | |
| 90,800 | | @ | | 3Com Corp. | | | 207,024 |
| 5,400 | | @ | | Acme Packet, Inc. | | | 28,404 |
| 23,600 | | @ | | Adaptec, Inc. | | | 77,880 |
| 15,500 | | | | Adtran, Inc. | | | 230,640 |
| 11,800 | | @ | | Airvana, Inc. | | | 72,216 |
| 4,800 | | | | Alaska Communications Systems Group, Inc. | | | 45,024 |
| 5,000 | | @ | | Anaren, Inc. | | | 59,750 |
| 8,100 | | @ | | Anixter International, Inc. | | | 243,972 |
| 3,200 | | | | Applied Signal Technology, Inc. | | | 57,408 |
| 33,200 | | @ | | Arris Group, Inc. | | | 263,940 |
| 15,400 | | @ | | Aruba Networks, Inc. | | | 39,270 |
| 16,600 | | @ | | Atheros Communications, Inc. | | | 237,546 |
| 3,400 | | | | Atlantic Tele-Network, Inc. | | | 90,270 |
| 10,500 | | @ | | BigBand Networks, Inc. | | | 57,960 |
| 4,000 | | | | Black Box Corp. | | | 104,480 |
| 35,400 | | @ | | Bookham, Inc. | | | 15,930 |
| 6,100 | | @ | | Cbeyond, Inc. | | | 97,478 |
| 19,900 | | @ | | Centennial Communications Corp. | | | 160,394 |
| 57,400 | | @ | | Cincinnati Bell, Inc. | | | 110,782 |
| 6,900 | | @ | | Comtech Telecommunications | | | 316,158 |
| 6,300 | | | | Consolidated Communications Holdings, Inc. | | | 74,844 |
| 4,300 | | @ | | EMS Technologies, Inc. | | | 111,241 |
| 14,600 | | @ | | Extreme Networks | | | 34,164 |
| 14,300 | | | | Fairpoint Communications, Inc. | | | 46,904 |
| 43,200 | | @ | | FiberTower Corp. | | | 6,912 |
| 115,862 | | @ | | Finisar Corp. | | | 44,028 |
| 10,500 | | @ | | General Communication, Inc. | | | 84,945 |
| 5,100 | | @ | | GeoEye, Inc. | | | 98,073 |
| 7,100 | | @ | | Global Crossing Ltd. | | | 56,374 |
| 2,900 | | @ | | Globecomm Systems, Inc. | | | 15,921 |
| 26,200 | | @ | | Harmonic, Inc. | | | 146,982 |
| 7,500 | | @ | | Harris Stratex Networks, Inc. | | | 38,700 |
| 2,700 | | @ | | Hughes Communications, Inc. | | | 43,038 |
| 2,600 | | @ | | Hungarian Telephone & Cable Corp. | | | 22,360 |
| 21,400 | | @ | | Hypercom Corp. | | | 23,112 |
See Accompanying Notes to Financial Statements
73
| | |
| ING RUSSELL™ SMALL CAP INDEX PORTFOLIO | | PORTFOLIO OF INVESTMENTS ASOF DECEMBER 31, 2008 (CONTINUED) |
| | | | | | | |
| Shares | | | | | | Value |
| | | | | | | |
| Telecommunications: (continued) | | | |
| 34,200 | | @ | | ICO Global Communications Holdings Ltd. | | $ | 38,646 |
| 25,100 | | @ | | Infinera Corp. | | | 224,896 |
| 11,700 | | @ | | InterDigital, Inc. | | | 321,750 |
| 9,200 | | | | Iowa Telecommunications Services, Inc. | | | 131,376 |
| 5,900 | | @ | | IPG Photonics Corp. | | | 77,762 |
| 6,400 | | @ | | Ixia | | | 36,992 |
| 7,600 | | @ | | Knology, Inc. | | | 39,216 |
| 3,400 | | @ | | Loral Space & Communications, Inc. | | | 49,402 |
| 11,200 | | @ | | Mastec, Inc. | | | 129,696 |
| 33,600 | | @ | | MRV Communications, Inc. | | | 25,872 |
| 8,300 | | @ | | Netgear, Inc. | | | 94,703 |
| 5,100 | | @ | | Neutral Tandem, Inc. | | | 82,722 |
| 5,500 | | @ | | Novatel Wireless, Inc. | | | 25,520 |
| 6,800 | | | | NTELOS Holdings Corp. | | | 167,688 |
| 4,700 | | @ | | Oplink Communications, Inc. | | | 40,420 |
| 16,700 | | @ | | OpNext, Inc. | | | 29,225 |
| 11,900 | | @, L | | Orbcomm, Inc. | | | 25,704 |
| 38,100 | | @ | | PAETEC Holding Corp. | | | 54,864 |
| 5,100 | | @, L | | Parkervision, Inc. | | | 12,597 |
| 13,400 | | | | Plantronics, Inc. | | | 176,880 |
| 22,400 | | @ | | Polycom, Inc. | | | 302,624 |
| 76,200 | | @ | | Powerwave Technologies, Inc. | | | 38,100 |
| 400 | | | | Preformed Line Products Co. | | | 18,416 |
| 18,800 | | @ | | Premier Global Services, Inc. | | | 161,868 |
| 5,500 | | @ | | RCN Corp. | | | 32,450 |
| 45,300 | | @ | | RF Micro Devices, Inc. | | | 35,334 |
| 9,600 | | @, L | | SAVVIS, Inc. | | | 66,144 |
| 8,100 | | | | Shenandoah Telecom Co. | | | 227,205 |
| 12,500 | | @ | | ShoreTel, Inc. | | | 56,125 |
| 47,300 | | @ | | Sonus Networks, Inc. | | | 74,734 |
| 7,400 | | @ | | Starent Networks Corp. | | | 88,282 |
| 5,100 | | @, L | | Switch and Data, Inc. | | | 37,689 |
| 55,100 | | @ | | Sycamore Networks, Inc. | | | 148,219 |
| 12,400 | | @ | | Syniverse Holdings, Inc. | | | 148,056 |
| 18,200 | | @ | | Tekelec | | | 242,788 |
| 60,300 | | @, L | | TerreStar Corp. | | | 24,120 |
| 38,000 | | @ | | TW Telecom, Inc. | | | 321,860 |
| 10,500 | | @ | | USA Mobility, Inc. | | | 121,485 |
| 22,000 | | @ | | Utstarcom, Inc. | | | 40,700 |
| 3,600 | | @ | | Viasat, Inc. | | | 86,688 |
| 32,300 | | @ | | Vonage Holdings Corp. | | | 21,318 |
| | | | | | | |
| | | | | | | 7,444,260 |
| | | | | | | |
| Textiles: 0.1% |
| 5,700 | | | | G&K Services, Inc. | | | 115,254 |
| 3,700 | | | | Unifirst Corp. | | | 109,853 |
| | | | | | | |
| | | | | | | 225,107 |
| | | | | | | |
| Toys/Games/Hobbies: 0.3% |
| 7,900 | | @ | | Jakks Pacific, Inc. | | | 162,977 |
| 9,000 | | @ | | Leapfrog Enterprises, Inc. | | | 31,500 |
| 13,500 | | @ | | Marvel Entertainment, Inc. | | | 415,125 |
| 2,600 | | @ | | RC2 Corp. | | | 27,742 |
| | | | | | | |
| | | | | | | 637,344 |
| | | | | | | |
| Transportation: 1.8% |
| 12,800 | | @ | | American Commercial Lines, Inc. | | | 62,720 |
| 6,700 | | L | | Arkansas Best Corp. | | | 201,737 |
| 3,000 | | @ | | Atlas Air Worldwide Holdings, Inc. | | | 56,700 |
| 5,700 | | @, L | | Bristow Group, Inc. | | | 152,703 |
| 4,900 | | @ | | Celadon Group, Inc. | | | 41,797 |
| | | | | | | |
| Shares | | | | | | Value |
| | | | | | | |
| Transportation: (continued) |
| 12,600 | | | | DHT Maritime, Inc. | | $ | 69,804 |
| 1,300 | | @ | | Dynamex, Inc. | | | 19,175 |
| 14,100 | | L | | Eagle Bulk Shipping, Inc. | | | 96,162 |
| 7,500 | | | | Forward Air Corp. | | | 182,025 |
| 5,400 | | L | | Genco Shipping & Trading Ltd. | | | 79,920 |
| 14,838 | | L | | General Maritime Corp. | | | 160,250 |
| 8,500 | | @ | | Genesee & Wyoming, Inc. | | | 259,250 |
| 8,700 | | @@ | | Golar LNG Ltd. | | | 58,812 |
| 6,500 | | @ | | Gulfmark Offshore, Inc. | | | 154,635 |
| 14,600 | | | | Heartland Express, Inc. | | | 230,096 |
| 13,900 | | | | Horizon Lines, Inc. | | | 48,511 |
| 9,600 | | @ | | HUB Group, Inc. | | | 254,688 |
| 2,500 | | | | International Shipholding Corp. | | | 63,325 |
| 13,900 | | | | Knight Transportation, Inc. | | | 224,068 |
| 2,300 | | | | Knightsbridge Tankers Ltd. | | | 33,695 |
| 4,600 | | @ | | Marten Transport Ltd. | | | 87,216 |
| 9,200 | | @@, L | | Nordic American Tanker Shipping | | | 310,500 |
| 8,400 | | @ | | Old Dominion Freight Line | | | 239,064 |
| 8,700 | | | | Pacer International, Inc. | | | 90,741 |
| 3,600 | | @ | | PHI, Inc. | | | 50,436 |
| 2,400 | | @ | | Saia, Inc. | | | 26,064 |
| 11,600 | | @@, L | | Ship Finance International Ltd. | | | 128,180 |
| 3,800 | | L | | Teekay Tankers Ltd. | | | 48,260 |
| 11,000 | | @ | | Ultrapetrol Bahamas Ltd. | | | 35,090 |
| 11,000 | | | | Werner Enterprises, Inc. | | | 190,740 |
| 13,800 | | @, L | | YRC Worldwide, Inc. | | | 39,606 |
| | | | | | | |
| | | | | | | 3,695,970 |
| | | | | | | |
| Trucking & Leasing: 0.1% | | | |
| 12,100 | | | | Aircastle Ltd. | | | 57,838 |
| 2,400 | | @ | | Amerco, Inc. | | | 82,872 |
| 5,900 | | | | Greenbrier Cos., Inc. | | | 40,533 |
| 3,900 | | | | TAL International Group, Inc. | | | 54,990 |
| 4,800 | | @@ | | Textainer Group Holdings Ltd. | | | 50,880 |
| | | | | | | |
| | | | | | | 287,113 |
| | | | | | | |
| Water: 0.3% |
| 3,700 | | | | American States Water Co. | | | 122,026 |
| 5,000 | | | | California Water Service Group | | | 232,150 |
| 2,000 | | | | Consolidated Water Co., Ltd. | | | 25,000 |
| 4,100 | | | | Middlesex Water Co. | | | 70,643 |
| 4,100 | | @ | | Pico Holdings, Inc. | | | 108,978 |
| 3,600 | | | | SJW Corp. | | | 107,784 |
| 6,300 | | | | Southwest Water Co. | | | 20,286 |
| | | | | | | |
| | | | | | | 686,867 |
| | | | | | | |
| | | | Total Common Stock
(Cost $246,510,046) | | | 188,095,126 |
| | | | | | | |
| REAL ESTATE INVESTMENT TRUSTS: 5.6% |
| Apartments: 0.6% |
| 13,989 | | | | American Campus Communities, Inc. | | | 286,495 |
| 6,000 | | | | Associated Estates Realty Corp. | | | 54,780 |
| 11,200 | | | | Education Realty Trust, Inc. | | | 58,464 |
| 10,100 | | | | Home Properties, Inc. | | | 410,060 |
| 7,000 | | | | Mid-America Apartment Communities, Inc. | | | 260,120 |
| 12,700 | | | | Post Properties, Inc. | | | 209,550 |
| | | | | | | |
| | | | | | | 1,279,469 |
| | | | | | | |
| Diversified: 0.8% |
| 26,200 | | | | Capital Lease Funding, Inc. | | | 45,326 |
| 12,500 | | | | Colonial Properties Trust | | | 104,125 |
See Accompanying Notes to Financial Statements
74
| | |
| ING RUSSELL™ SMALL CAP INDEX PORTFOLIO | | PORTFOLIO OF INVESTMENTS ASOF DECEMBER 31, 2008 (CONTINUED) |
| | | | | | | |
| Shares | | | | | | Value |
| | | | | | | |
| Diversified: (continued) |
| 9,200 | | L | | Cousins Properties, Inc. | | $ | 127,420 |
| 8,500 | | | | Entertainment Properties Trust | | | 253,300 |
| 16,600 | | | | Investors Real Estate Trust | | �� | 177,786 |
| 16,700 | | | | Lexington Realty Trust | | | 83,500 |
| 11,000 | | | | Mission West Properties | | | 84,150 |
| 4,300 | | | | PS Business Parks, Inc. | | | 192,038 |
| 16,900 | | | | Washington Real Estate Investment Trust | | | 478,270 |
| 4,000 | | | | Winthrop Realty Trust | | | 43,360 |
| | | | | | | |
| | | | | | | 1,589,275 |
| | | | | | | |
| Health Care: 0.8% |
| 6,200 | | | | Care Investment Trust, Inc. | | | 48,298 |
| 5,900 | | | | Cogdell Spencer, Inc. | | | 55,224 |
| 13,500 | | | | Healthcare Realty Trust, Inc. | | | 316,980 |
| 6,600 | | | | LTC Properties, Inc. | | | 133,848 |
| 22,000 | | | | Medical Properties Trust, Inc. | | | 138,820 |
| 2,900 | | | | National Health Investors, Inc. | | | 79,547 |
| 17,300 | | | | Omega Healthcare Investors, Inc. | | | 276,281 |
| 31,200 | | | | Senior Housing Properties Trust | | | 559,104 |
| 3,700 | | | | Universal Health Realty Income Trust | | | 121,767 |
| | | | | | | |
| | | | | | | 1,729,869 |
| | | | | | | |
| Hotels: 0.2% |
| 35,500 | | | | Ashford Hospitality Trust, Inc. | | | 40,825 |
| 26,400 | | | | DiamondRock Hospitality Co. | | | 133,848 |
| 27,700 | | | | FelCor Lodging Trust, Inc. | | | 50,968 |
| 9,400 | | | | LaSalle Hotel Properties | | | 103,870 |
| 20,500 | | | | Strategic Hotel Capital, Inc. | | | 34,440 |
| 9,300 | | | | Sunstone Hotel Investors, Inc. | | | 57,567 |
| | | | | | | |
| | | | | | | 421,518 |
| | | | | | | |
| Manufactured Homes: 0.2% |
| 7,400 | | | | Equity Lifestyle Properties, Inc. | | | 283,864 |
| 5,700 | | | | Sun Communities, Inc. | | | 79,800 |
| | | | | | | |
| | | | | | | 363,664 |
| | | | | | | |
| Mortgage: 0.6% |
| 3,400 | | | | American Capital Agency Corp. | | | 72,624 |
| 15,500 | | L | | Anthracite Capital, Inc. | | | 34,565 |
| 23,200 | | | | Anworth Mortgage Asset Corp. | | | 149,176 |
| 15,600 | | L | | Arbor Realty Trust, Inc. | | | 46,020 |
| 4,600 | | L | | Capital Trust, Inc. | | | 16,560 |
| 17,100 | | | | Capstead Mortgage Corp. | | | 184,167 |
| 9,400 | | | | Chimera Investment Corp. | | | 32,430 |
| 28,035 | | | | Gramercy Capital Corp. | | | 35,885 |
| 3,000 | | | | Hatteras Financial Corp. | | | 79,800 |
| 45,100 | | | | MFA Mortgage Investments, Inc. | | | 265,639 |
| 16,500 | | L | | Newcastle Investment Corp. | | | 13,860 |
| 12,600 | | L | | Northstar Realty Finance Corp. | | | 49,266 |
| 10,800 | | L | | RAIT Investment Trust | | | 28,080 |
| 8,400 | | | | Redwood Trust, Inc. | | | 125,244 |
| | | | | | | |
| | | | | | | 1,133,316 |
| | | | | | | |
| Office Property: 0.6% |
| 18,100 | | | | BioMed Realty Trust, Inc. | | | 212,132 |
| 11,400 | | | | Corporate Office Properties Trust SBI MD | | | 349,980 |
| 13,600 | | | | Franklin Street Properties Corp. | | | 200,600 |
| 14,100 | | | | Highwoods Properties, Inc. | | | 385,776 |
| 3,300 | | | | Parkway Properties, Inc. | | | 59,400 |
| | | | | | | |
| | | | | | | 1,207,888 |
| | | | | | | |
| | | | | | | |
| Shares | | | | | | Value |
| | | | | | | |
| Paper & Related Products: 0.1% |
| 11,300 | | | | Potlatch Corp. | | $ | 293,913 |
| | | | | | | |
| | | | | | | 293,913 |
| | | | | | | |
| Regional Malls: 0.0% |
| 12,300 | | | | Glimcher Realty Trust | | | 34,563 |
| 6,100 | | | | Pennsylvania Real Estate Investment Trust | | | 45,445 |
| | | | | | | |
| | | | | | | 80,008 |
| | | | | | | |
| Shopping Centers: 0.5% |
| 8,200 | | | | Acadia Realty Trust | | | 117,014 |
| 9,400 | | | | Cedar Shopping Centers, Inc. | | | 66,552 |
| 8,300 | | L | | Equity One, Inc. | | | 146,910 |
| 15,500 | | | | Inland Real Estate Corp. | | | 201,190 |
| 5,100 | | | | Kite Realty Group Trust | | | 28,356 |
| 3,700 | | | | Ramco-Gershenson Properties | | | 22,866 |
| 2,900 | | | | Saul Centers, Inc. | | | 114,550 |
| 8,300 | | | | Tanger Factory Outlet Centers, Inc. | | | 312,246 |
| 3,200 | | | | Urstadt Biddle Properties, Inc. | | | 50,976 |
| | | | | | | |
| | | | | | | 1,060,660 |
| | | | | | | |
| Single Tenant: 0.7% |
| 600 | | @ | | Alexander’s, Inc. | | | 152,940 |
| 5,000 | | | | Getty Realty Corp. | | | 105,300 |
| 25,800 | | | | National Retail Properties, Inc. | | | 443,502 |
| 27,500 | | | | Realty Income Corp. | | | 636,625 |
| | | | | | | |
| | | | | | | 1,338,367 |
| | | | | | | |
| Storage: 0.2% |
| 19,700 | | | | Extra Space Storage, Inc. | | | 203,304 |
| 5,900 | | | | Sovran Self Storage, Inc. | | | 212,400 |
| 14,000 | | | | U-Store-It Trust | | | 62,300 |
| | | | | | | |
| | | | | | | 478,004 |
| | | | | | | |
| Warehouse/Industrial: 0.3% |
| 46,100 | | | | DCT Industrial Trust, Inc. | | | 233,266 |
| 6,300 | | | | EastGroup Properties, Inc. | | | 224,154 |
| 13,600 | | | | First Industrial Realty Trust, Inc. | | | 102,680 |
| | | | | | | |
| | | | | | | 560,100 |
| | | | | | | |
| | | | Total Real Estate Investment Trusts
(Cost $16,145,917) | | | 11,536,051 |
| | | | | | | |
| | | | Total Long-Term Investments
(Cost $262,655,963) | | | 199,631,177 |
| | | | | | | |
| | | | | | | | |
| SHORT-TERM INVESTMENTS: 11.2% |
| Money Market: 2.3% |
| 4,869,000 | | S | | ING Institutional Prime Money Market Fund - Class I | | | | 4,869,000 |
| | | | | | | | |
| | | | Total Money Market
(Cost $4,869,000) | | | | 4,869,000 |
| | | | | | | | |
See Accompanying Notes to Financial Statements
75
| | |
| ING RUSSELL™ SMALL CAP INDEX PORTFOLIO | | PORTFOLIO OF INVESTMENTS ASOF DECEMBER 31, 2008 (CONTINUED) |
| | | | | | | | | | |
Principal
Amount | | | | | | | Value | |
| | Securities Lending Collateralcc: 8.9% | |
| $ | 18,516,175 | | Bank of New York Mellon Corp. Institutional Cash Reserves | | | | | $ | 18,415,709 | |
| | | | | | | | | | |
| | | Total Securities Lending Collateral
(Cost $18,516,175) | | | | | | 18,415,709 | |
| | | | | | | | | | |
| | | Total Short-Term Investments
(Cost $23,385,175) | | | | | | 23,284,709 | |
| | | | | | | | | | |
| | | Total Investments in Securities
(Cost $ 286,041,138)* | | 107.2 | % | | $ | 222,915,886 | |
| | | Other Assets and Liabilities - Net | | (7.2 | ) | | | (14,876,062 | ) |
| | | | | | | | | | |
| | | Net Assets | | 100.0 | % | | $ | 208,039,824 | |
| | | | | | | | | | |
| @ | Non-income producing security |
| cc | Securities purchased with cash collateral for securities loaned. |
| S | All or a portion of this security is segregated to cover collateral requirements for applicable futures, options, swaps, foreign forward currency contracts and/or when-issued or delayed-delivery securities. |
| L | Loaned security, a portion or all of the security is on loan at December 31, 2008. |
| * | Cost for federal income tax purposes is $288,674,159. |
| | | | |
Net unrealized depreciation consists of: | | | | |
Gross Unrealized Appreciation | | $ | 6,806,145 | |
Gross Unrealized Depreciation | | | (72,564,418 | ) |
| | | | |
Net Unrealized Depreciation | | $ | (65,758,273 | ) |
| | | | |
The following table summarizes the inputs used as of December 31, 2008 in determining the Portfolio’s investments at fair value for purposes of SFAS 157:
| | | | | | |
| | | Investments in
Securities | | Other Financial
Instruments* |
Level 1 — Quoted Prices | | $ | 204,500,177 | | $ | 359,377 |
Level 2 — Other Significant Observable Inputs | | | 18,415,709 | | | — |
Level 3 — Significant Unobservable Inputs | | | — | | | — |
| | | | | | |
Total | | $ | 222,915,886 | | $ | 359,377 |
| | | | | | |
“Fair value” for purposes of SFAS 157 is different from “fair value” as used in the 1940 Act. The former generally implies market value, and can include market quotations as a source of value, and the latter refers to determinations of actual value in absence of available market quotations.
| * | Other financial instruments may include forward foreign currency contracts, futures, swaps, and written options. Forward foreign currency contracts and futures are reported at their unrealized gain/loss at year end. Swaps and written options are reported at their market value at year end. |
ING Russell Small Cap Index Portfolio Open Futures Contracts on December 31, 2008
| | | | | | | |
Contract Description | | Number
of
Contracts | | Expiration
Date | | Unrealized
Appreciation/
(Depreciation) |
Long Contracts | | | | | | | |
Russell 2000 Mini | | 101 | | 03/20/09 | | $ | 359,377 |
| | | | | | | |
| | | | | | $ | 359,377 |
| | | | | | | |
See Accompanying Notes to Financial Statements
76
| | |
ING LEHMAN BROTHERS U.S. AGGREGATE
BOND INDEX® PORTFOLIO | | PORTFOLIO OF INVESTMENTS ASOF DECEMBER 31, 2008 |
| | | | | | | | |
Principal
Amount | | | | | | Value |
| | | | | | | | |
| | CORPORATE BONDS/NOTES: 20.0% |
| | Aerospace/Defense: 0.1% |
| $ | 150,000 | | C | | Northrop Grumman Corp.,
7.125%, due 02/15/11 | | $ | 156,041 |
| | 220,000 | | C | | United Technologies Corp., 4.875%, due 05/01/15 | | | 214,739 |
| | | | | | | | |
| | | | | | | | 370,780 |
| | | | | | | | |
| | Agriculture: 0.3% |
| | 285,000 | | | | Altria Group, Inc.,
9.950%, due 11/10/38 | | | 311,098 |
| | 505,000 | | | | Philip Morris International, Inc.,
4.875%, due 05/16/13 | | | 506,938 |
| | | | | | | | |
| | | | | | | | 818,036 |
| | | | | | | | |
| | Airlines: 0.3% |
| | 659,130 | | C | | Delta Airlines, Inc.,
6.821%, due 08/10/22 | | | 382,295 |
| | 100,000 | | C | | Northwest Airlines, Inc.,
7.027%, due 11/01/19 | | | 54,000 |
| | 604,214 | | C | | Southwest Airlines Co. 2007-1 Pass-through Trust,
6.150%, due 08/01/22 | | | 466,478 |
| | | | | | | | |
| | | | | | | | 902,773 |
| | | | | | | | |
| | Auto Manufacturers: 0.1% |
| | 255,000 | | | | Daimler Finance NA, LLC,
6.500%, due 11/15/13 | | | 199,097 |
| | | | | | | | |
| | | | | | | | 199,097 |
| | | | | | | | |
| | Banks: 4.6% |
| | 860,000 | | | | Bank of America Corp.,
3.125%, due 06/15/12 | | | 894,426 |
| | 210,000 | | | | Bank of America Corp.,
5.375%, due 06/15/14 | | | 206,073 |
| | 525,000 | | | | Bank of America Corp.,
5.650%, due 05/01/18 | | | 529,065 |
| | 1,330,000 | | | | Citigroup, Inc.,
5.000%, due 09/15/14 | | | 1,171,246 |
| | 1,035,000 | | | | Citigroup, Inc.,
5.875%, due 05/29/37 | | | 1,037,777 |
| | 500,000 | | @@ | | Deutsche Bank AG/London,
5.375%, due 10/12/12 | | | 512,148 |
| | 1,250,000 | | | | Goldman Sachs Group, Inc.,
4.750%, due 07/15/13 | | | 1,124,426 |
| | 700,000 | | | | Goldman Sachs Group, Inc.,
6.150%, due 04/01/18 | | | 673,835 |
| | 275,000 | | C | | Goldman Sachs Group, Inc.,
6.450%, due 05/01/36 | | | 214,154 |
| | 350,000 | | @@ | | HSBC Holdings PLC,
6.500%, due 09/15/37 | | | 356,617 |
| | 1,250,000 | | | | JPMorgan Chase & Co.,
5.375%, due 10/01/12 | | | 1,279,769 |
| | 1,715,000 | | @@ | | KFW,
3.250%, due 02/15/11 | | | 1,764,804 |
| | 250,000 | | C | | Morgan Stanley,
5.375%, due 10/15/15 | | | 215,496 |
| | 950,000 | | C | | Morgan Stanley,
6.625%, due 04/01/18 | | | 834,802 |
| | 335,000 | | @@ | | Royal Bank of Scotland Group PLC,
5.000%, due 11/12/13 | | | 295,504 |
| | 1,315,000 | | | | Wachovia Corp.,
5.500%, due 05/01/13 | | | 1,301,559 |
| | | | | | | | |
Principal
Amount | | | | | | Value |
| | | | | | | | |
| | Banks: (continued) |
| $ | 200,000 | | | | Wachovia Corp.,
5.700%, due 08/01/13 | | $ | 194,204 |
| | 730,000 | | | | Wells Fargo & Co.,
5.625%, due 12/11/17 | | | 762,928 |
| | | | | | | | |
| | | | | | | | 13,368,833 |
| | | | | | | | |
| | Beverages: 0.0% |
| | 125,000 | | @@, #, C | | SABMiller PLC,
5.700%, due 01/15/14 | | | 115,371 |
| | | | | | | | |
| | | | | | | | 115,371 |
| | | | | | | | |
| | Chemicals: 0.3% |
| | 140,000 | | | | Dow Chemical Co.,
7.375%, due 11/01/29 | | | 132,187 |
| | 575,000 | | C | | EI Du Pont de Nemours & Co.,
5.000%, due 01/15/13 | | | 580,726 |
| | | | | | | | |
| | | | | | | | 712,913 |
| | | | | | | | |
| | Commercial Services: 0.1% |
| | 395,000 | | # | | Erac USA Finance Co.,
7.000%, due 10/15/37 | | | 217,989 |
| | | | | | | | |
| | | | | | | | 217,989 |
| | | | | | | | |
| | Computers: 0.1% |
| | 300,000 | | C | | Hewlett-Packard Co.,
4.500%, due 03/01/13 | | | 304,812 |
| | | | | | | | |
| | | | | | | | 304,812 |
| | | | | | | | |
| | Cosmetics/Personal Care: 0.1% |
| | 240,000 | | C | | Procter & Gamble Co.,
5.550%, due 03/05/37 | | | 267,424 |
| | | | | | | | |
| | | | | | | | 267,424 |
| | | | | | | | |
| | Diversified Financial Services: 2.1% |
| | 425,000 | | | | American Express Co.,
7.000%, due 03/19/18 | | | 430,460 |
| | 425,000 | | | | Bear Stearns Cos., Inc.,
5.350%, due 02/01/12 | | | 417,272 |
| | 40,000 | | | | CIT Group, Inc.,
5.000%, due 02/13/14 | | | 29,103 |
| | 550,000 | | @@, C | | ConocoPhillips Canada Funding Co. I,
5.625%, due 10/15/16 | | | 561,956 |
| | 40,000 | | | | Countrywide Financial Corp.,
5.800%, due 06/07/12 | | | 39,016 |
| | 1,950,000 | | | | General Electric Capital Corp.,
5.250%, due 10/19/12 | | | 1,965,733 |
| | 600,000 | | C | | General Electric Capital Corp.,
6.750%, due 03/15/32 | | | 639,852 |
| | 475,000 | | | | HSBC Finance Corp.,
5.000%, due 06/30/15 | | | 422,193 |
| | 110,000 | | | | International Lease Finance Corp.,
5.625%, due 09/15/10 | | | 86,497 |
| | 625,000 | | | | International Lease Finance Corp.,
5.625%, due 09/20/13 | | | 417,752 |
| | 350,000 | | C | | JPMorgan Chase Capital XV,
5.875%, due 03/15/35 | | | 271,650 |
| | 810,000 | | C | | Merrill Lynch & Co., Inc.,
6.220%, due 09/15/26 | | | 749,835 |
| | | | | | | | |
| | | | | | | | 6,031,319 |
| | | | | | | | |
See Accompanying Notes to Financial Statements
77
| | |
ING LEHMAN BROTHERS U.S. AGGREGATE
BOND INDEX® PORTFOLIO | | PORTFOLIO OF INVESTMENTS ASOF DECEMBER 31, 2008 (CONTINUED) |
| | | | | | | | |
Principal
Amount | | | | | | Value |
| | | | | | | | |
| | Electric: 1.8% |
| $ | 210,000 | | C | | Alabama Power Co.,
5.800%, due 11/15/13 | | $ | 218,787 |
| | 295,000 | | C | | Consolidated Edison Co. of New York, Inc.,
7.125%, due 12/01/18 | | | 317,774 |
| | 290,000 | | C | | Dominion Resources, Inc.,
5.950%, due 06/15/35 | | | 248,544 |
| | 230,000 | | C | | Duke Energy Carolinas, LLC,
6.000%, due 01/15/38 | | | 251,471 |
| | 350,000 | | C | | Exelon Generation Co., LLC,
6.200%, due 10/01/17 | | | 301,489 |
| | 975,000 | | C | | FirstEnergy Corp.,
6.450%, due 11/15/11 | | | 922,211 |
| | 325,000 | | C | | Florida Power & Light Co.,
5.550%, due 11/01/17 | | | 345,337 |
| | 160,000 | | C | | Georgia Power Co.,
6.000%, due 11/01/13 | | | 168,358 |
| | 230,000 | | C | | Midamerican Energy Co.,
4.650%, due 10/01/14 | | | 219,116 |
| | 200,000 | | C | | Midamerican Energy Holdings Co.,
6.125%, due 04/01/36 | | | 186,559 |
| | 355,000 | | #, C | | Oncor Electric Delivery Co.,
5.950%, due 09/01/13 | | | 331,411 |
| | 190,000 | | C | | Pacific Gas & Electric Co.,
6.050%, due 03/01/34 | | | 202,459 |
| | 160,000 | | C | | PPL Energy Supply, LLC,
6.300%, due 07/15/13 | | | 148,284 |
| | 775,000 | | C | | Progress Energy, Inc.,
7.100%, due 03/01/11 | | | 768,502 |
| | 230,000 | | C | | Southern California Edison Co.,
5.500%, due 08/15/18 | | | 240,911 |
| | 240,000 | | C | | Southwestern Public Service Co.,
8.750%, due 12/01/18 | | | 264,651 |
| | | | | | | | |
| | | | | | | | 5,135,864 |
| | | | | | | | |
| | Electronics: 0.1% |
| | 350,000 | | @@, C | | Koninklijke Philips Electronics NV,
5.750%, due 03/11/18 | | | 323,033 |
| | | | | | | | |
| | | | | | | | 323,033 |
| | | | | | | | |
| | Food: 0.4% |
| | 600,000 | | | | Kraft Foods, Inc.,
6.500%, due 08/11/17 | | | 604,069 |
| | 225,000 | | C | | Kroger Co.,
5.500%, due 02/01/13 | | | 223,175 |
| | 310,000 | | C | | Safeway, Inc.,
6.250%, due 03/15/14 | | | 311,949 |
| | | | | | | | |
| | | | | | | | 1,139,193 |
| | | | | | | | |
| | Healthcare - Products: 0.2% |
| | 375,000 | | @@, C | | Covidien International Finance SA,
6.000%, due 10/15/17 | | | 370,563 |
| | 225,000 | | C | | Johnson & Johnson,
5.950%, due 08/15/37 | | | 275,728 |
| | | | | | | | |
| | | | | | | | 646,291 |
| | | | | | | | |
| | Healthcare - Services: 0.2% |
| | 425,000 | | C | | UnitedHealth Group, Inc.,
6.000%, due 02/15/18 | | | 392,788 |
| | | | | | | | |
Principal
Amount | | | | | | Value |
| | | | | | | | |
| | Healthcare - Services: (continued) |
| $ | 105,000 | | C | | WellPoint, Inc.,
5.850%, due 01/15/36 | | $ | 86,038 |
| | | | | | | | |
| | | | | | | | 478,826 |
| | | | | | | | |
| | Household Products/Wares: 0.1% |
| | 150,000 | | C | | Clorox Co.,
5.450%, due 10/15/12 | | | 149,386 |
| | | | | | | | |
| | | | | | | | 149,386 |
| | | | | | | | |
| | Insurance: 0.2% |
| | 110,000 | | C | | Genworth Financial, Inc.,
6.515%, due 05/22/18 | | | 38,188 |
| | 75,000 | | C | | Hartford Financial Services Group, Inc.,
5.250%, due 10/15/11 | | | 64,731 |
| | 75,000 | | C | | Metlife, Inc.,
5.000%, due 06/15/15 | | | 70,346 |
| | 265,000 | | | | Prudential Financial, Inc.,
5.700%, due 12/14/36 | | | 165,598 |
| | 215,000 | | C | | Travelers Cos., Inc.,
6.250%, due 06/15/37 | | | 207,387 |
| | | | | | | | |
| | | | | | | | 546,250 |
| | | | | | | | |
| | Iron/Steel: 0.1% |
| | 260,000 | | @@, C | | ArcelorMittal,
6.125%, due 06/01/18 | | | 178,322 |
| | | | | | | | |
| | | | | | | | 178,322 |
| | | | | | | | |
| | Machinery - Construction & Mining: 0.2% |
| | 570,000 | | C | | Caterpillar, Inc.,
7.900%, due 12/15/18 | | | 657,317 |
| | | | | | | | |
| | | | | | | | 657,317 |
| | | | | | | | |
| | Media: 1.5% |
| | 240,000 | | @@, #, C | | British Sky Broadcasting,
9.500%, due 11/15/18 | | | 245,406 |
| | 800,000 | | C | | Comcast Corp.,
6.300%, due 11/15/17 | | | 780,095 |
| | 475,000 | | C | | Comcast Corp.,
6.500%, due 11/15/35 | | | 474,231 |
| | 400,000 | | C | | COX Communications, Inc.,
5.450%, due 12/15/14 | | | 350,252 |
| | 500,000 | | C | | News America, Inc.,
6.150%, due 03/01/37 | | | 468,013 |
| | 220,000 | | @@, C | | Rogers Cable, Inc.,
5.500%, due 03/15/14 | | | 203,185 |
| | 525,000 | | C | | Time Warner Cable, Inc.,
5.850%, due 05/01/17 | | | 480,382 |
| | 325,000 | | C | | Time Warner, Inc.,
5.875%, due 11/15/16 | | | 291,801 |
| | 325,000 | | C | | Time Warner, Inc.,
6.500%, due 11/15/36 | | | 295,534 |
| | 200,000 | | C | | Viacom, Inc.,
5.750%, due 04/30/11 | | | 181,732 |
| | 550,000 | | C | | Walt Disney Company,
4.500%, due 12/15/13 | | | 554,237 |
| | | | | | | | |
| | | | | | | | 4,324,868 |
| | | | | | | | |
| | Mining: 0.2% |
| | 400,000 | | C | | Alcoa, Inc.,
5.550%, due 02/01/17 | | | 315,265 |
| | 360,000 | | @@, C | | Rio Tinto Finance USA Ltd.,
6.500%, due 07/15/18 | | | 264,367 |
| | | | | | | | |
| | | | | | | | 579,632 |
| | | | | | | | |
See Accompanying Notes to Financial Statements
78
| | |
ING LEHMAN BROTHERS U.S. AGGREGATE
BOND INDEX® PORTFOLIO | | PORTFOLIO OF INVESTMENTS ASOF DECEMBER 31, 2008 (CONTINUED) |
| | | | | | | | |
Principal
Amount | | | | | | Value |
| | | | | | | | |
| | Miscellaneous Manufacturing: 0.5% |
| $ | 525,000 | | C | | Eaton Corp.,
4.900%, due 05/15/13 | | $ | 502,615 |
| | 395,000 | | @@, C | | Ingersoll-Rand Global Holding Co., Ltd.,
6.000%, due 08/15/13 | | | 386,827 |
| | 345,000 | | C | | Parker Hannifin Corp.,
5.500%, due 05/15/18 | | | 334,136 |
| | 200,000 | | @@, #, C | | Siemens Financieringsmaatschappij NV,
6.125%, due 08/17/26 | | | 195,004 |
| | | | | | | | |
| | | | | | | | 1,418,582 |
| | | | | | | | |
| | Multi-National: 0.7% |
| | 2,040,000 | | @@ | | European Investment Bank,
2.625%, due 05/16/11 | | | 2,074,966 |
| | | | | | | | |
| | | | | | | | 2,074,966 |
| | | | | | | | |
| | Office/Business Equipment: 0.2% |
| | 625,000 | | C | | Xerox Corp.,
5.500%, due 05/15/12 | | | 524,163 |
| | | | | | | | |
| | | | | | | | 524,163 |
| | | | | | | | |
| | Oil & Gas: 0.8% |
| | 560,000 | | C | | Anadarko Petroleum Corp.,
5.950%, due 09/15/16 | | | 495,388 |
| | 175,000 | | C | | Apache Corp.,
5.625%, due 01/15/17 | | | 176,457 |
| | 170,000 | | @@, C | | Canadian Natural Resources Ltd.,
6.250%, due 03/15/38 | | | 134,006 |
| | 335,000 | | @@, C | | EnCana Corp.,
6.625%, due 08/15/37 | | | 270,533 |
| | 550,000 | | C | | Marathon Oil Corp.,
6.000%, due 10/01/17 | | | 469,731 |
| | 215,000 | | @@, C | | Nexen, Inc.,
6.400%, due 05/15/37 | | | 168,706 |
| | 350,000 | | @@, C | | Suncor Energy, Inc.,
6.500%, due 06/15/38 | | | 265,396 |
| | 175,000 | | C | | Valero Energy Corp.,
6.625%, due 06/15/37 | | | 129,051 |
| | 325,000 | | C | | XTO Energy, Inc.,
6.100%, due 04/01/36 | | | 270,668 |
| | | | | | | | |
| | | | | | | | 2,379,936 |
| | | | | | | | |
| | Oil & Gas Services: 0.1% |
| | 280,000 | | @@, C | | Weatherford International Ltd.,
7.000%, due 03/15/38 | | | 215,463 |
| | | | | | | | |
| | | | | | | | 215,463 |
| | | | | | | | |
| | Pharmaceuticals: 0.6% |
| | 725,000 | | @@, C | | AstraZeneca PLC,
5.400%, due 09/15/12 | | | 766,303 |
| | 250,000 | | C | | Bristol-Myers Squibb Co.,
5.250%, due 08/15/13 | | | 263,614 |
| | 345,000 | | C | | GlaxoSmithKline Capital, Inc.,
5.650%, due 05/15/18 | | | 363,023 |
| | 190,000 | | C | | Wyeth,
5.950%, due 04/01/37 | | | 211,712 |
| | | | | | | | |
| | | | | | | | 1,604,652 |
| | | | | | | | |
| | | | | | | | |
Principal
Amount | | | | | | Value |
| | | | | | | | |
| | Pipelines: 0.5% |
| $ | 200,000 | | #, C | | DCP Midstream LLC,
6.750%, due 09/15/37 | | $ | 151,341 |
| | 300,000 | | C | | Enterprise Products Operating L.P.,
6.300%, due 09/15/17 | | | 254,314 |
| | 225,000 | | C | | Enterprise Products Operating L.P.,
6.500%, due 01/31/19 | | | 189,626 |
| | 325,000 | | C | | Kinder Morgan Energy Partners LP,
6.950%, due 01/15/38 | | | 263,556 |
| | 350,000 | | #, C | | NGPL PipeCo, LLC,
6.514%, due 12/15/12 | | | 332,438 |
| | 325,000 | | C | | ONEOK Partners L.P.,
6.850%, due 10/15/37 | | | 258,630 |
| | 105,000 | | C | | TEPPCO Partners L.P.,
7.550%, due 04/15/38 | | | 78,762 |
| | | | | | | | |
| | | | | | | | 1,528,667 |
| | | | | | | | |
| | Real Estate: 0.1% |
| | 600,000 | | C | | Simon Property Group LP,
5.250%, due 12/01/16 | | | 383,945 |
| | | | | | | | |
| | | | | | | | 383,945 |
| | | | | | | | |
| | Regional (state/province): 0.5% |
| | 780,000 | | @@ | | Province of Ontario Canada,
3.125%, due 09/08/10 | | | 788,315 |
| | 465,000 | | @@ | | Province of Quebec Canada,
7.125%, due 02/09/24 | | | 605,937 |
| | | | | | | | |
| | | | | | | | 1,394,252 |
| | | | | | | | |
| | Retail: 0.5% |
| | 440,000 | | C | | CVS Caremark Corp.,
6.250%, due 06/01/27 | | | 410,193 |
| | 225,000 | | C | | Home Depot, Inc.,
5.875%, due 12/16/36 | | | 176,949 |
| | 180,000 | | | | JC Penney Corp., Inc.,
6.375%, due 10/15/36 | | | 109,208 |
| | 160,000 | | C | | Macys Retail Holdings, Inc.,
7.875%, due 07/15/15 | | | 115,375 |
| | 350,000 | | C | | Target Corp.,
6.500%, due 10/15/37 | | | 301,425 |
| | 55,000 | | | | Wal-Mart Stores, Inc.,
4.500%, due 07/01/15 | | | 55,743 |
| | 305,000 | | | | Wal-Mart Stores, Inc.,
6.500%, due 08/15/37 | | | 363,415 |
| | | | | | | | |
| | | | | | | | 1,532,308 |
| | | | | | | | |
| | Software: 0.0% |
| | 100,000 | | C | | Oracle Corp.,
5.750%, due 04/15/18 | | | 104,785 |
| | | | | | | | |
| | | | | | | | 104,785 |
| | | | | | | | |
| | Telecommunications: 2.3% |
| | 875,000 | | C | | AT&T, Inc.,
6.500%, due 09/01/37 | | | 945,546 |
| | 80,000 | | @@, C | | British Telecommunications PLC,
9.125%, due 12/15/30 | | | 85,243 |
| | 950,000 | | C | | Cisco Systems, Inc.,
5.250%, due 02/22/11 | | | 986,721 |
| | 135,000 | | @@ | | Deutsche Telekom International Finance BV,
8.750%, due 06/15/30 | | | 166,922 |
| | 210,000 | | C | | Embarq Corp.,
7.082%, due 06/01/16 | | | 161,916 |
See Accompanying Notes to Financial Statements
79
| | |
ING LEHMAN BROTHERS U.S. AGGREGATE
BOND INDEX® PORTFOLIO | | PORTFOLIO OF INVESTMENTS ASOF DECEMBER 31, 2008 (CONTINUED) |
| | | | | | | | |
Principal
Amount | | | | | | Value |
| | | | | | | | |
| | Telecommunications: (continued) |
| $ | 375,000 | | @@, C | | France Telecom SA,
7.750%, due 03/01/11 | | $ | 394,809 |
| | 175,000 | | C | | Motorola, Inc.,
6.000%, due 11/15/17 | | | 94,501 |
| | 930,000 | | C | | New Cingular Wireless Services, Inc.,
7.875%, due 03/01/11 | | | 963,249 |
| | 500,000 | | C | | Qwest Corp.,
8.875%, due 03/15/12 | | | 465,000 |
| | 285,000 | | @@, C | | Telecom Italia Capital SA,
5.250%, due 10/01/15 | | | 217,245 |
| | 325,000 | | @@, C | | Telefonica Europe BV,
8.250%, due 09/15/30 | | | 381,634 |
| | 500,000 | | C | | Verizon Communications, Inc.,
5.350%, due 02/15/11 | | | 503,215 |
| | 325,000 | | C | | Verizon Communications, Inc.,
7.750%, due 12/01/30 | | | 361,388 |
| | 290,000 | | #, C | | Verizon Wireless,
8.500%, due 11/15/18 | | | 340,374 |
| | 525,000 | | @@, C | | Vodafone Group PLC,
5.625%, due 02/27/17 | | | 495,471 |
| | | | | | | | |
| | | | | | | | 6,563,234 |
| | | | | | | | |
| | Transportation: 0.1% |
| | 300,000 | | @@, C | | Canadian National Railway Co.,
6.375%, due 11/15/37 | | | 330,209 |
| | | | | | | | |
| | | | | | | | 330,209 |
| | | | | | | | |
| | | | | Total Corporate Bonds/Notes
(Cost $58,254,329) | | | 57,523,491 |
| | | | | | | | |
| | U.S. GOVERNMENT AGENCY OBLIGATIONS: 46.9% |
| | Federal Home Loan Bank: 1.6% |
| | 660,000 | | | | 3.375%, due 06/24/11 | | | 691,071 |
| | 1,815,000 | | | | 3.625%, due 09/16/11 | | | 1,921,707 |
| | 1,320,000 | | | | 4.500%, due 11/15/12 | | | 1,426,177 |
| | 395,000 | | | | 5.375%, due 05/18/16 | | | 452,347 |
| | 95,000 | | | | 5.625%, due 06/11/21 | | | 109,716 |
| | | | | | | | |
| | | | | | | | 4,601,018 |
| | | | | | | | |
| | Federal Home Loan Mortgage Corporation##: 13.4% |
| | 2,560,000 | | | | 3.875%, due 06/29/11 | | | 2,726,011 |
| | 1,025,000 | | C | | 4.125%, due 07/14/11 | | | 1,042,911 |
| | 195,771 | | | | 4.500%, due 04/01/23 | | | 200,508 |
| | 4,998,901 | | | | 5.000%, due 03/01/34 - 06/01/36 | | | 5,116,461 |
| | 3,155,000 | | W | | 5.000%, due 01/15/35 | | | 3,224,508 |
| | 501,462 | | | | 5.002%, due 08/01/38 | | | 510,341 |
| | 262,143 | | | | 5.101%, due 08/01/36 | | | 266,113 |
| | 855,000 | | | | 5.125%, due 07/15/12 | | | 945,186 |
| | 5,965,109 | | | | 5.500%, due 01/01/35 - 03/01/38 | | | 6,115,152 |
| | 5,530,000 | | W | | 5.500%, due 01/11/37 | | | 5,663,498 |
| | 370,000 | | C | | 5.550%, due 10/04/16 | | | 383,522 |
| | 1,335,514 | | | | 5.724%, due 05/01/37 | | | 1,363,527 |
| | 8,317,356 | | | | 6.000%, due 01/15/36 - 08/01/38 | | | 8,571,004 |
| | 2,076,231 | | | | 6.500%, due 01/15/34 - 07/01/38 | | | 2,159,039 |
| | 260,000 | | | | 6.750%, due 03/15/31 | | | 382,553 |
| | | | | | | | |
| | | | | | | | 38,670,334 |
| | | | | | | | |
| | Federal National Mortgage Association##: 29.4% |
| | 505,000 | | C | | 3.125%, due 04/01/11 | | | 507,823 |
| | 2,200,000 | | | | 3.375%, due 05/19/11 | | | 2,313,128 |
| | 745,000 | | | | 3.875%, due 07/12/13 | | | 791,414 |
| | 606,604 | | | | 4.000%, due 07/01/22 - 07/01/23 | | | 614,175 |
| | | | | | | | |
Principal
Amount | | | | | | Value |
| | | | | | | | |
| | Federal National Mortgage Association##: (continued) |
| $ | 350,000 | | W | | 4.000%, due 01/01/24 | | $ | 353,719 |
| | 175,000 | | C | | 4.350%, due 05/29/13 | | | 177,112 |
| | 130,000 | | | | 4.375%, due 03/15/13 | | | 139,757 |
| | 3,219,543 | | | | 4.500%, due 04/01/23 - 09/01/38 | | | 3,278,660 |
| | 2,065,000 | | W | | 4.500%, due 01/15/19 | | | 2,110,818 |
| | 1,793,191 | | | | 4.500%, due 05/01/23 - 07/01/38 | | | 1,830,768 |
| | 2,595,000 | | | | 4.625%, due 10/15/13 - 10/15/14 | | | 2,882,937 |
| | 580,000 | | | | 4.750%, due 11/19/12 | | | 638,816 |
| | 155,000 | | C | | 4.750%, due 04/19/10 | | | 162,189 |
| | 474,236 | | | | 4.818%, due 12/01/35 | | | 480,904 |
| | 449,077 | | | | 4.830%, due 09/01/35 | | | 450,002 |
| | 1,145,000 | | | | 4.875%, due 06/13/18 | | | 1,318,476 |
| | 5,569,447 | | | | 5.000%, due 03/15/16 - 05/01/36 | | | 5,724,816 |
| | 185,000 | | C | | 5.000%, due 04/26/17 | | | 189,497 |
| | 3,455,000 | | W | | 5.000%, due 01/15/20 - 01/12/36 | | | 3,539,725 |
| | 4,656,551 | | | | 5.000%, due 05/01/23 - 12/01/36 | | | 4,773,979 |
| | 1,045,000 | | | | 5.375%, due 06/12/17 | | | 1,223,006 |
| | 1,073,956 | | | | 5.459%, due 12/01/36 | | | 1,094,377 |
| | 1,227,561 | | | | 5.480%, due 11/01/36 | | | 1,250,523 |
| | 13,101,236 | | | | 5.500%, due 03/15/11 - 01/01/37 | | | 13,492,803 |
| | 10,375,000 | | W | | 5.500%, due 01/15/20 - 01/12/36 | | | 10,652,188 |
| | 113,202 | | | | 5.681%, due 10/01/37 | | | 116,223 |
| | 183,518 | | | | 5.799%, due 06/01/37 | | | 188,053 |
| | 12,796,369 | | | | 6.000%, due 08/01/21 - 10/01/38 | | | 13,189,366 |
| | 1,828,126 | | W | | 6.000%, due 03/01/36 - 11/01/37 | | | 1,884,462 |
| | 275,410 | | | | 6.000%, due 10/01/37 | | | 283,908 |
| | 335,903 | | | | 6.032%, due 09/01/37 | | | 342,932 |
| | 20,000 | | | | 6.210%, due 08/06/38 | | | 28,153 |
| | 3,103,325 | | | | 6.500%, due 04/01/30 - 09/01/38 | | | 3,227,224 |
| | 1,645,000 | | W | | 6.500%, due 06/25/34 | | | 1,708,487 |
| | 378,755 | | | | 6.500%, due 12/01/37 | | | 393,884 |
| | 225,000 | | | | 6.625%, due 11/15/30 | | | 325,939 |
| | 195,314 | | | | 7.000%, due 10/01/36 | | | 205,718 |
| | 2,045,000 | | W | | 7.000%, due 01/15/34 | | | 2,141,499 |
| | 380,000 | | | | 7.125%, due 01/15/30 | | | 569,778 |
| | | | | | | | |
| | | | | | | | 84,597,238 |
| | | | | | | | |
| | Government National Mortgage Association: 2.5% |
| | 241,651 | | | | 5.000%, due 10/15/37 | | | 248,273 |
| | 1,280,000 | | W | | 5.000%, due 01/01/38 | | | 1,312,200 |
| | 494,230 | | | | 5.500%, due 09/15/33 | | | 510,869 |
| | 3,040,000 | | W | | 5.500%, due 01/01/38 | | | 3,130,726 |
| | 1,745,000 | | W | | 6.000%, due 01/01/34 | | | 1,800,350 |
| | 158,945 | | | | 7.000%, due 12/15/37 | | | 165,334 |
| | | | | | | | |
| | | | | | | | 7,167,752 |
| | | | | | | | |
| | Other U.S. Agency Obligations: 0.0% |
| | 75,000 | | | | Federal Farm Credit Bank,
5.125%, due 08/25/16 | | | 85,960 |
| | 10,000 | | | | Tennessee Valley Authority,
6.150%, due 01/15/38 | | | 13,847 |
| | | | | | | | |
| | | | | | | | 99,807 |
| | | | | | | | |
| | | | | Total U.S. Government Agency Obligations
(Cost $132,209,757) | | | 135,136,149 |
| | | | | | | | |
| | U.S. TREASURY OBLIGATIONS: 23.8% |
| | U.S. Treasury Bonds: 12.9% |
| | 2,850,000 | | | | 3.500%, due 02/15/18 | | | 3,155,486 |
| | 1,685,000 | | | | 4.000%, due 02/15/15 | | | 1,920,374 |
| | 2,345,000 | | | | 4.125%, due 05/15/15 | | | 2,690,156 |
| | 7,535,000 | | | | 4.250%, due 11/15/13 - 11/15/17 | | | 8,660,858 |
See Accompanying Notes to Financial Statements
80
| | |
ING LEHMAN BROTHERS U.S. AGGREGATE
BOND INDEX® PORTFOLIO | | PORTFOLIO OF INVESTMENTS ASOF DECEMBER 31, 2008 (CONTINUED) |
| | | | | | | | |
Principal
Amount | | | | | | Value |
| | | | | | | | |
| | U.S. Treasury Bonds: (continued) |
| $ | 5,390,000 | | | | 4.500%, due 11/15/15 - 02/15/36 | | $ | 6,523,011 |
| | 30,000 | | | | 4.750%, due 02/15/37 | | | 41,813 |
| | 2,485,000 | | | | 5.000%, due 05/15/37 | | | 3,601,309 |
| | 200,000 | | | | 5.125%, due 05/15/16 | | | 242,234 |
| | 35,000 | | | | 5.250%, due 11/15/28 | | | 46,211 |
| | 335,000 | | | | 5.375%, due 02/15/31 | | | 460,416 |
| | 895,000 | | | | 6.375%, due 08/15/27 | | | 1,310,056 |
| | 3,540,000 | | | | 6.875%, due 08/15/25 | | | 5,383,568 |
| | 1,605,000 | | | | 7.125%, due 02/15/23 | | | 2,329,006 |
| | 645,000 | | | | 8.125%, due 08/15/19 | | | 953,492 |
| | | | | | | | |
| | | | | | | | 37,317,990 |
| | | | | | | | |
| | U.S. Treasury Notes: 10.9% |
| | 3,075,000 | | | | 2.750%, due 02/28/13 | | | 3,286,409 |
| | 1,690,000 | | | | 3.375%, due 11/30/12 | | | 1,842,497 |
| | 6,905,000 | | | | 3.875%, due 09/15/10 | | | 7,314,446 |
| | 875,000 | | | | 4.000%, due 09/30/09 | | | 898,858 |
| | 860,000 | | | | 4.375%, due 12/15/10 | | | 923,895 |
| | 5,495,000 | | | | 4.625%, due 08/31/11 - 10/31/11 | | | 6,055,962 |
| | 6,305,000 | | | | 4.750%, due 01/31/12 - 05/31/12 | | | 7,038,170 |
| | 3,575,000 | | | | 4.875%, due 05/31/11 | | | 3,931,106 |
| | | | | | | | |
| | | | | | | | 31,291,343 |
| | | | | | | | |
| | | | | Total U.S. Treasury Obligations
(Cost $66,546,403) | | | 68,609,333 |
| | | | | | | | |
| | COLLATERALIZED MORTGAGE OBLIGATIONS: 3.5% |
| | 1,100,000 | | C | | Banc of America Commercial Mortgage, Inc.,
5.449%, due 01/15/49 | | | 738,748 |
| | 450,000 | | C | | Banc of America Commercial Mortgage, Inc.,
5.658%, due 06/10/49 | | | 330,528 |
| | 1,200,000 | | C | | Citigroup Commercial Mortgage Trust,
4.380%, due 10/15/41 | | | 1,107,278 |
| | 575,000 | | C | | Continental Airlines, Inc.,
5.983%, due 04/19/22 | | | 385,250 |
| | 333,035 | | C | | Credit Suisse Mortgage Capital Certificates,
5.250%, due 03/15/39 | | | 317,030 |
| | 1,650,000 | | C | | Credit Suisse Mortgage Capital Certificates,
5.448%, due 01/15/49 | | | 1,259,146 |
| | 500,000 | | C | | Credit Suisse Mortgage Capital Certificates,
5.723%, due 06/15/39 | | | 318,989 |
| | 500,000 | | C | | JPMorgan Chase Commercial Mortgage Securities Corp.,
4.871%, due 10/15/42 | | | 428,827 |
| | 490,186 | | C | | JPMorgan Chase Commercial Mortgage Securities Corp.,
5.284%, due 05/15/47 | | | 406,499 |
| | 500,000 | | C | | JPMorgan Chase Commercial Mortgage Securities Corp.,
5.434%, due 01/15/49 | | | 314,197 |
| | 1,775,000 | | C | | JPMorgan Chase Commercial Mortgage Securities Corp.,
5.440%, due 06/12/47 | | | 1,286,298 |
| | 500,000 | | C | | JPMorgan Chase Commercial Mortgage Securities Corp.,
5.827%, due 02/15/51 | | | 391,331 |
| | | | | | | | |
Principal
Amount | | | | | | Value |
| | | | | | | | |
| | COLLATERALIZED MORTGAGE OBLIGATIONS: (continued) |
| $ | 1,255,000 | | C | | JPMorgan Chase Commercial Mortgage Securities Corp., 6.125%, due 02/12/51 | | $ | 1,005,337 |
| | 297,504 | | C | | Merrill Lynch/Countrywide Commercial Mortgage Trust, 5.773%, due 06/12/46 | | | 290,998 |
| | 1,460,000 | | C | | Morgan Stanley Capital I, 5.632%, due 04/12/49 | | | 892,604 |
| | 195,942 | | C | | Salomon Brothers Mortgage Securities VII, Inc., 4.467%, due 03/18/36 | | | 182,708 |
| | 500,000 | | C | | Wachovia Bank Commercial Mortgage Trust, 5.509%, due 04/15/47 | | | 361,414 |
| | | | | | | | |
| | | | | Total Collateralized Mortgage Obligations
(Cost $11,870,090) | | | 10,017,182 |
| | | | | | | | |
| | OTHER BONDS: 0.5% | | | |
| | Foreign Government Bonds: 0.5% | | | |
| | 1,050,000 | | | | Mexico Government International Bond,
6.375%, due 01/16/13 | | | 1,107,750 |
| | 350,000 | | | | Republic of Italy,
3.500%, due 07/15/11 | | | 355,771 |
| | | | | | | | |
| | | | | Total Other Bonds
(Cost $1,451,351) | | | 1,463,521 |
| | | | | | | | |
| | | | | Total Long-Term Investments
(Cost $270,331,930) | | | 272,749,676 |
| | | | | | | | |
| | | | | | | | | |
| | | |
| Shares | | | | | | | Value | |
| SHORT-TERM INVESTMENTS: 23.6% | | | | | |
| Affiliated Mutual Fund: 23.6% | | | | | |
| 67,861,659 | | ING Institutional Prime Money Market Fund - Class I | | | | | $ | 67,861,659 | |
| | | | | | | | | |
| | Total Short-Term Investments
(Cost $67,861,659) | | | | | | 67,861,659 | |
| | | | | | | | | |
| | Total Investments in
Securities
(Cost $338,193,589)* | | 118.3 | % | | $ | 340,611,335 | |
| | Other Assets and
Liabilities - Net | | (18.3 | ) | | | (52,569,816 | ) |
| | | | | | | | | |
| | Net Assets | | 100.0 | % | | $ | 288,041,519 | |
| | | | | | | | | |
| # | Securities with purchases pursuant to Rule 144A or section 4(2), under the Securities Act of 1933 and may not be resold subject to that rule except to qualified institutional buyers. Unless otherwise noted, these securities have been determined to be liquid under the guidelines established by the Funds’ Board of Directors/Trustees. |
| C | Bond may be called prior to maturity date. |
| ## | On September 7, 2008, the Federal Housing Finance Agency placed the Federal National Mortgage Association and the Federal Home Loan Mortgage Corporation into conservatorship and the U.S. Treasury guaranteed the debt issued by those organizations. |
See Accompanying Notes to Financial Statements
81
| | |
ING LEHMAN BROTHERS U.S. AGGREGATE
BOND INDEX® PORTFOLIO | | PORTFOLIO OF INVESTMENTS ASOF DECEMBER 31, 2008 (CONTINUED) |
| W | Settlement is on a when-issued or delayed-delivery basis. |
| * | Cost for federal income tax purposes is $339,024,693. |
| | | | |
Net unrealized appreciation consists of: | | | | |
Gross Unrealized Appreciation | | $ | 6,565,555 | |
Gross Unrealized Depreciation | | | (4,978,913 | ) |
| | | | |
Net Unrealized Appreciation | | $ | 1,586,642 | |
| | | | |
The following table summarizes the inputs used as of December 31, 2008 in determining the Portfolio’s investments at fair value for purposes of SFAS 157:
| | | | | | |
| | | Investments in
Securities | | Other Financial
Instruments* |
| | | | | | |
Level 1 — Quoted Prices | | $ | 67,861,659 | | $ | — |
Level 2 — Other Significant Observable Inputs | | | 272,749,676 | | | — |
Level 3 — Significant Unobservable Inputs | | | — | | | — |
| | | | | | |
Total | | $ | 340,611,335 | | $ | — |
| | | | | | |
“Fair value” for purposes of SFAS 157 is different from “fair value” as used in the 1940 Act. The former generally implies market value, and can include market quotations as a source of value, and the latter refers to determinations of actual value in absence of available market quotations.
| * | Other financial instruments may include forward foreign currency contracts, futures, swaps, and written options. Forward foreign currency contracts and futures are reported at their unrealized gain/loss at year end. Swaps and written options are reported at their market value at year end. |
See Accompanying Notes to Financial Statements
82
| | |
| ING INTERNATIONAL INDEX PORTFOLIO | | PORTFOLIO OF INVESTMENTS ASOF DECEMBER 31, 2008 |
| | | | | | | |
| Shares | | | | | | Value |
| | | | | | | |
| COMMON STOCK: 93.9% | | | |
| Australia: 5.2% | | | |
| 10,687 | | | | AGL Energy Ltd. | | $ | 113,941 |
| 44,773 | | | | Alumina Ltd. | | | 45,108 |
| 23,068 | | | | Amcor Ltd. | | | 93,744 |
| 56,562 | | | | AMP Ltd. | | | 215,659 |
| 17,676 | | | | Asciano Group | | | 18,816 |
| 5,652 | | | | ASX Ltd. | | | 132,117 |
| 63,529 | | | | Australia & New Zealand Banking Group Ltd. | | | 685,872 |
| 31,809 | | | | AXA Asia Pacific Holdings Ltd. | | | 110,563 |
| 6,000 | | | | Bendigo Bank Ltd. | | | 46,419 |
| 103,427 | | | | BHP Billiton Ltd. | | | 2,197,221 |
| 18,673 | | | | BlueScope Steel Ltd. | | | 45,878 |
| 21,161 | | | | Boral Ltd. | | | 68,533 |
| 38,428 | | | | Brambles Ltd. | | | 199,654 |
| 6,190 | | | | Caltex Australia Ltd. | | | 31,280 |
| 19,700 | | | | Coca-Cola Amatil Ltd. | | | 126,594 |
| 1,898 | | | | Cochlear Ltd. | | | 73,527 |
| 41,619 | | | | Commonwealth Bank of Australia | | | 856,332 |
| 11,050 | | | | Computershare Ltd. | | | 60,379 |
| 15,618 | | | | Crown Ltd. | | | 65,421 |
| 16,710 | | | | CSL Ltd. | | | 394,053 |
| 34,002 | | @ | | Fortescue Metals Group Ltd. | | | 46,364 |
| 60,584 | | | | Foster’s Group Ltd. | | | 233,011 |
| 61,828 | | | | Goodman Fielder Ltd. | | | 57,476 |
| 33,796 | | | | Incitec Pivot Ltd. | | | 59,240 |
| 54,268 | | | | Insurance Australia Group | | | 147,898 |
| 50,705 | | | | John Fairfax Holdings Ltd. | | | 58,178 |
| 4,323 | | | | Leighton Holdings Ltd. | | | 84,000 |
| 15,110 | | | | Lend Lease Corp., Ltd. | | | 76,139 |
| 11,042 | | | | Lion Nathan Ltd. | | | 63,434 |
| 27,697 | | | | Macquarie Airports Management Ltd. | | | 46,623 |
| 7,644 | | | | Macquarie Group Ltd. | | | 155,138 |
| 76,052 | | | | Macquarie Infrastructure Group | | | 91,164 |
| 26,359 | | | | Metcash Ltd. | | | 80,705 |
| 51,400 | | | | National Australia Bank Ltd. | | | 755,665 |
| 13,168 | | | | Newcrest Mining Ltd. | | | 313,436 |
| 21,339 | | | | OneSteel Ltd. | | | 36,900 |
| 10,334 | | | | Orica Ltd. | | | 101,411 |
| 24,610 | | | | Origin Energy Ltd. | | | 277,564 |
| 73,293 | | X | | Oxiana Ltd. | | | 28,105 |
| 2,890 | | | | Perpetual Trustees Australia Ltd. | | | 75,588 |
| 31,305 | | | | Qantas Airways Ltd. | | | 57,673 |
| 26,371 | | | | QBE Insurance Group Ltd. | | | 476,611 |
| 8,131 | | | | Rio Tinto Ltd. | | | 217,893 |
| 15,717 | | | | Santos Ltd. | | | 164,681 |
| 3,046 | | | | Sims Group Ltd. | | | 37,281 |
| 10,072 | | | | Sonic Healthcare Ltd. | | | 102,614 |
| 27,525 | | | | Suncorp-Metway Ltd. | | | 162,241 |
| 19,540 | | | | TABCORP Holdings Ltd. | | | 95,601 |
| 35,744 | | | | Tattersall’s Ltd. | | | 69,793 |
| 128,211 | | | | Telstra Corp., Ltd. | | | 343,226 |
| 22,487 | | | | Toll Holdings Ltd. | | | 97,156 |
| 37,644 | | @ | | Transurban Group | | | 142,394 |
| 23,084 | | | | Wesfarmers Ltd. | | | 291,333 |
| 82,223 | | | | Westpac Banking Corp. | | | 986,159 |
| 13,311 | | | | Woodside Petroleum Ltd. | | | 344,453 |
| 37,286 | | | | Woolworths Ltd. | | | 695,242 |
| 4,550 | | | | WorleyParsons Ltd. | | | 45,391 |
| | | | | | | |
| | | | | | | 12,698,892 |
| | | | | | | |
| | | | | | | |
| Shares | | | | | | Value |
| | | | | | | |
| Austria: 0.3% | | | |
| 5,459 | | | | Erste Bank der Oesterreichischen Sparkassen AG | | $ | 127,107 |
| 2,570 | | | | Oesterreichische Elektrizitaetswirtschafts AG | | | 118,831 |
| 4,754 | | | | OMV AG | | | 126,321 |
| 1,555 | | | | Raiffeisen International Bank Holding AG | | | 43,228 |
| 1,464 | | | | Strabag SE | | | 34,208 |
| 9,923 | | | | Telekom Austria AG | | | 144,381 |
| 2,536 | | | | Voestalpine AG | | | 54,790 |
| 1,353 | | | | Wiener Staedtische Allgemeine Versicherung AG | | | 47,007 |
| 3,969 | | | | Wienerberger AG | | | 67,704 |
| | | | | | | |
| | | 763,577 |
| | | | | | | |
| Belgium: 0.7% | | | |
| 13,482 | | @ | | Anheuser-Busch InBev NV | | | 313,095 |
| 8,296 | | @ | | Anheuser-Busch InBev NV - VVPR Share | | | 46 |
| 5,156 | | | | Belgacom SA | | | 197,106 |
| 412 | | | | Colruyt SA | | | 88,533 |
| 3,029 | | | | Delhaize Group | | | 187,242 |
| 13,002 | | | | Dexia | | | 58,949 |
| 61,969 | | | | Fortis | | | 81,716 |
| 1,892 | | | | Groupe Bruxelles Lambert SA | | | 151,571 |
| 4,600 | | | | KBC Groep NV | | | 138,240 |
| 1,216 | | | | Mobistar SA | | | 87,716 |
| 1,178 | | | | Nationale A Portefeuille | | | 57,449 |
| 1,637 | | | | Solvay SA | | | 121,558 |
| 3,582 | | | | UCB SA | | | 116,839 |
| 3,944 | | | | Umicore | | | 77,935 |
| | | | | | | |
| | | | | | | 1,677,995 |
| | | | | | | |
| Bermuda: 0.0% | | | |
| 1,450 | | | | Frontline Ltd. | | | 42,569 |
| 7,522 | | | | SeaDrill Ltd. ADR | | | 61,304 |
| | | | | | | |
| | | | | | | 103,873 |
| | | | | | | |
| Denmark: 0.8% | | | |
| 26 | | S | | AP Moller - Maersk A/S - Class A | | | 142,290 |
| 41 | | | | AP Moller - Maersk A/S - Class B | | | 220,642 |
| 1,908 | | | | Carlsberg A/S | | | 62,372 |
| 13,000 | | | | Danske Bank A/S | | | 130,962 |
| 6,317 | | | | DSV A/S | | | 68,746 |
| 1,457 | | | | Flsmidth & Co. A/S | | | 51,141 |
| 1,857 | | @ | | Jyske Bank | | | 43,345 |
| 14,917 | | | | Novo-Nordisk A/S | | | 769,477 |
| 925 | | | | Novozymes A/S | | | 74,187 |
| 525 | | @ | | Topdanmark A/S | | | 68,755 |
| 1,200 | | | | TrygVesta A/S | | | 75,624 |
| 5,215 | | @ | | Vestas Wind Systems A/S | | | 306,886 |
| | | | | | | |
| | | | | | | 2,014,427 |
| | | | | | | |
| Finland: 1.3% | | | |
| 4,847 | | | | Elisa OYJ | | | 84,381 |
| 12,497 | | | | Fortum OYJ | | | 271,626 |
| 4,058 | | | | Kone OYJ | | | 90,996 |
| 3,775 | | | | Metso OYJ | | | 46,263 |
| 3,332 | | | | Neste Oil OYJ | | | 50,154 |
| 117,723 | | | | Nokia OYJ | | | 1,847,353 |
| 3,307 | | | | Nokian Renkaat OYJ | | | 37,573 |
| 7,573 | | | | OKO Bank | | | 105,326 |
| 2,645 | | | | Rautaruukki OYJ | | | 46,196 |
| 11,983 | | | | Sampo OYJ | | | 226,807 |
See Accompanying Notes to Financial Statements
83
| | |
| ING INTERNATIONAL INDEX PORTFOLIO | | PORTFOLIO OF INVESTMENTS ASOF DECEMBER 31, 2008 (CONTINUED) |
| | | | | | | |
| Shares | | | | | | Value |
| | | | | | | |
| Finland: (continued) | | | |
| 16,593 | | | | Stora Enso OYJ (Euro Denominated Security) | | $ | 131,442 |
| 15,260 | | | | UPM-Kymmene OYJ | | | 195,614 |
| 2,432 | | | | Wartsila OYJ | | | 73,486 |
| | | | | | | |
| | | | | | | 3,207,217 |
| | | | | | | |
| France: 9.9% | | | |
| 5,479 | | | | Accor SA | | | 269,893 |
| 898 | | | | ADP | | | 61,133 |
| 4,672 | | | | Air France-KLM | | | 60,251 |
| 7,786 | | | | Air Liquide | | | 713,037 |
| 68,562 | | @ | | Alcatel SA | | | 148,410 |
| 5,917 | | | | Alstom | | | 352,621 |
| 1,735 | | | | Atos Origin | | | 43,670 |
| 47,428 | | | | AXA SA | | | 1,064,549 |
| 25,110 | | S | | BNP Paribas | | | 1,083,859 |
| 7,131 | | | | Bouygues SA | | | 302,522 |
| 1,026 | | S | | Bureau Veritas SA | | | 41,249 |
| 3,975 | | | | Capgemini SA | | | 153,701 |
| 19,903 | | | | Carrefour SA | | | 769,338 |
| 1,501 | | | | Casino Guichard Perrachon SA | | | 114,398 |
| 1,611 | | | | Christian Dior SA | | | 91,085 |
| 7,961 | | | | Cie de Saint-Gobain | | | 376,159 |
| 6,109 | | | | Cie Generale D’Optique Essilor International SA | | | 286,970 |
| 1,069 | | | | CNP Assurances | | | 77,672 |
| 3,562 | | @ | | Compagnie Generale de Geophysique SA | | | 53,318 |
| 4,283 | | | | Compagnie Generale des Etablissements Michelin | | | 226,286 |
| 24,245 | | | | Credit Agricole SA | | | 272,323 |
| 1,982 | | | | Dassault Systemes SA | | | 89,858 |
| 1,478 | | | | Eiffage SA | | | 77,489 |
| 5,812 | | | | Electricite de France | | | 338,036 |
| 194 | | | | Eramet SLN | | | 37,843 |
| 56,835 | | | | France Telecom SA | | | 1,584,143 |
| 34,296 | | S | | Gaz de France | | | 1,702,352 |
| 13,678 | | | | Groupe Danone | | | 826,422 |
| 1,827 | | S | | Hermes International | | | 255,785 |
| 2,873 | | | | JC Decaux SA | | | 49,692 |
| 4,136 | | | | Lafarge SA | | | 252,964 |
| 3,617 | | | | Lagardere SCA | | | 146,952 |
| 7,238 | | | | L’Oreal SA | | | 631,667 |
| 8,030 | | | | LVMH Moet Hennessy Louis Vuitton SA | | | 538,159 |
| 2,509 | | | | M6-Metropole Television | | | 48,642 |
| 36,221 | | | | Natixis | | | 64,253 |
| 870 | | | | Neopost SA | | | 78,942 |
| 5,905 | | | | PagesJaunes Groupe SA | | | 58,187 |
| 4,878 | | | | Pernod-Ricard SA | | | 362,376 |
| 4,109 | | | | Peugeot SA | | | 70,250 |
| 2,545 | | | | PPR | | | 166,635 |
| 4,202 | | | | Publicis Groupe | | | 108,445 |
| 5,061 | | | | Renault SA | | | 132,072 |
| 6,311 | | | | Safran SA | | | 85,209 |
| 32,201 | | | | Sanofi-Aventis | | | 2,059,676 |
| 6,755 | | | | Schneider Electric SA | | | 502,935 |
| 5,733 | | | | Scor SA | | | 132,452 |
| 1,341 | | | | Societe BIC SA | | | 77,154 |
| 14,284 | | | | Societe Generale | | | 724,669 |
| 4,175 | | | | Societe Television Francaise (T.F.1) | | | 61,170 |
| 2,863 | | | | Sodexho Alliance SA | | | 159,116 |
| 7,027 | | @ | | Suez Environnement SA | | | 118,676 |
| 2,966 | | | | Technip SA | | | 91,068 |
| | | | | | | |
| Shares | | | | | | Value |
| | | | | | | |
| France: (continued) | | | |
| 1,890 | | | | Thales SA | | $ | 79,159 |
| 66,609 | | | | Total SA | | | 3,662,105 |
| 3,652 | | | | Valeo SA | | | 54,404 |
| 1,523 | | | | Vallourec | | | 173,165 |
| 10,775 | | | | Veolia Environnement | | | 339,875 |
| 11,848 | | | | Vinci SA | | | 499,981 |
| 35,085 | | | | Vivendi | | | 1,143,561 |
| 1,001 | | | | Wendel Investissement | | | 50,076 |
| 1,292 | | | | Zodiac SA | | | 47,176 |
| | | | | | | |
| | | | | | | 24,245,235 |
| | | | | | | |
| Germany: 8.3% | | | |
| 5,218 | | | | Adidas AG | | | 198,542 |
| 13,941 | | | | Allianz AG | | | 1,481,353 |
| 28,670 | | | | BASF AG | | | 1,106,301 |
| 23,728 | | | | Bayer AG | | | 1,377,269 |
| 8,575 | | | | Bayerische Motoren Werke AG | | | 267,683 |
| 1,701 | | | | Beiersdorf AG | | | 101,063 |
| 3,077 | | | | Celesio AG | | | 82,827 |
| 16,806 | | | | Commerzbank AG | | | 161,840 |
| 4,311 | | @ | | Continental AG | | | 431,018 |
| 26,630 | | | | DaimlerChrysler AG | | | 1,003,251 |
| 15,056 | | | | Deutsche Bank AG | | | 600,328 |
| 5,728 | | | | Deutsche Boerse AG | | | 414,415 |
| 6,152 | | | | Deutsche Lufthansa AG | | | 102,383 |
| 24,506 | | | | Deutsche Post AG | | | 410,831 |
| 2,339 | | | | Deutsche Postbank AG | | | 51,439 |
| 86,026 | | | | Deutsche Telekom AG | | | 1,298,232 |
| 58,841 | | | | E.ON AG | | | 2,276,397 |
| 1,013 | | | | Fraport AG Frankfurt Airport Services Worldwide | | | 45,467 |
| 1,752 | | | | Fresenius AG | | | 87,711 |
| 4,648 | | | | Fresenius Medical Care AG & Co. KGaA | | | 215,665 |
| 4,407 | | | | GEA Group AG | | | 77,662 |
| 1,148 | | | | Hamburger Hafen und Logistik AG | | | 38,599 |
| 2,195 | | | | Hannover Rueckversicheru - Reg | | | 70,951 |
| 958 | | | | HeidelbergCement AG | | | 42,134 |
| 5,297 | | | | Henkel KGaA | | | 139,909 |
| 1,198 | | | | Hochtief AG | | | 61,725 |
| 6,186 | | | | Hypo Real Estate Holding AG | | | 26,883 |
| 22,169 | | @ | | Infineon Technologies AG | | | 29,557 |
| 3,938 | | | | K+S AG | | | 227,436 |
| 3,901 | | | | Linde AG | | | 331,781 |
| 2,883 | | | | MAN AG | | | 164,099 |
| 2,013 | | | | Merck KGaA | | | 180,111 |
| 2,606 | | | | Metro AG | | | 104,217 |
| 6,336 | | | | Muenchener Rueckversicherungs AG | | | 970,800 |
| 1,711 | | @ | | Q-Cells AG | | | 63,709 |
| 13,432 | | | | RWE AG | | | 1,186,059 |
| 1,135 | | | | Salzgitter AG | | | 88,223 |
| 26,627 | | | | SAP AG | | | 958,750 |
| 26,901 | | | | Siemens AG | | | 2,029,426 |
| 2,030 | | | | Solarworld AG | | | 44,980 |
| 9,997 | | | | ThyssenKrupp AG | | | 282,113 |
| 4,924 | | | | TUI AG | | | 58,023 |
| 2,294 | | | | United Internet AG | | | 20,422 |
| 3,595 | | | | Volkswagen AG | | | 1,250,885 |
| 494 | | | | Wacker Chemie AG | | | 53,147 |
| | | | | | | |
| | | | | | | 20,215,616 |
| | | | | | | |
| Greece: 0.5% | | | |
| 10,901 | | | | Alpha Bank AE | | | 101,985 |
| 5,591 | | | | Coca-Cola Hellenic Bottling Co. SA | | | 81,297 |
See Accompanying Notes to Financial Statements
84
| | |
| ING INTERNATIONAL INDEX PORTFOLIO | | PORTFOLIO OF INVESTMENTS ASOF DECEMBER 31, 2008 (CONTINUED) |
| | | | | | | |
| Shares | | | | | | Value |
| | | | | | | |
| Greece: (continued) | | | |
| 8,862 | | | | EFG Eurobank Ergasias SA | | $ | 70,578 |
| 3,376 | | | | Hellenic Petroleum SA | | | 25,380 |
| 8,200 | | | | Hellenic Telecommunications Organization SA | | | 136,233 |
| 15,581 | | @ | | Marfin Investment Group SA | | | 62,990 |
| 14,550 | | | | National Bank of Greece SA | | | 270,202 |
| 6,700 | | | | OPAP SA | | | 192,815 |
| 9,525 | | | | Piraeus Bank SA | | | 85,025 |
| 3,919 | | | | Public Power Corp. | | | 62,983 |
| 1,620 | | | | Titan Cement Co. SA | | | 31,355 |
| | | | | | | |
| | | | | | | 1,120,843 |
| | | | | | | |
| Hong Kong: 1.8% | | | |
| 8,400 | | | | ASM Pacific Technology | | | 27,686 |
| 51,800 | | | | Bank of East Asia Ltd. | | | 109,265 |
| 113,500 | | | | BOC Hong Kong Holdings Ltd. | | | 129,911 |
| 56,000 | | | | Cathay Pacific Airways Ltd. | | | 63,252 |
| 40,000 | | | | Cheung Kong Holdings Ltd. | | | 381,585 |
| 16,000 | | | | Cheung Kong Infrastructure Holdings Ltd. | | | 60,422 |
| 57,000 | | S | | CLP Holdings Ltd. | | | 387,527 |
| 31,300 | | | | Esprit Holdings Ltd. | | | 178,360 |
| 31,000 | | | | Hang Lung Group Ltd. | | | 94,700 |
| 56,000 | | | | Hang Lung Properties Ltd. | | | 122,952 |
| 22,300 | | | | Hang Seng Bank Ltd. | | | 294,418 |
| 31,000 | | | | Henderson Land Development Co., Ltd. | | | 115,945 |
| 109,700 | | | | Hong Kong & China Gas | | | 166,356 |
| 29,500 | | | | Hong Kong Exchanges and Clearing Ltd. | | | 283,228 |
| 37,500 | | | | HongKong Electric Holdings | | | 211,125 |
| 25,000 | | | | Hopewell Holdings | | | 82,941 |
| 62,000 | | | | Hutchison Whampoa Ltd. | | | 312,989 |
| 24,000 | | | | Hysan Development Co., Ltd. | | | 39,023 |
| 25,000 | | | | Kerry Properties Ltd. | | | 67,253 |
| 19,500 | | | | Kingboard Chemicals Holdings | | | 35,347 |
| 70,000 | | | | Li & Fung Ltd. | | | 120,974 |
| 93,100 | | @ | | Mongolia Energy Corp., Ltd. | | | 28,959 |
| 49,000 | | | | MTR Corp. | | | 114,118 |
| 73,000 | | | | New World Development Ltd. | | | 74,746 |
| 54,000 | | | | Sino Land Co. | | | 56,551 |
| 42,000 | | | | Sun Hung Kai Properties Ltd. | | | 353,411 |
| 27,000 | | | | Swire Pacific Ltd. | | | 187,035 |
| 15,000 | | | | Television Broadcasts Ltd. | | | 49,174 |
| 39,000 | | | | Wharf Holdings Ltd. | | | 107,958 |
| 37,000 | | | | Wheelock & Co., Ltd. | | | 81,159 |
| 8,000 | | | | Wing Hang Bank Ltd. | | | 46,537 |
| 31,500 | | | | Yue Yuen Industrial Holdings | | | 62,541 |
| | | | | | | |
| | | | | | | 4,447,448 |
| | | | | | | |
| Ireland: 0.3% | | | |
| 25,325 | | | | Allied Irish Banks PLC | | | 60,578 |
| 20,010 | | | | Anglo Irish Bank Corp. PLC | | | 4,817 |
| 26,727 | | | | Bank of Ireland - London Exchange | | | 31,766 |
| 15,722 | | | | CRH PLC | | | 398,374 |
| 13,342 | | @ | | Elan Corp. PLC | | | 78,746 |
| 3,046 | | | | Kerry Group PLC | | | 55,531 |
| 23,200 | | @ | | Ryanair Holdings PLC | | | 95,700 |
| | | | | | | |
| | | | | | | 725,512 |
| | | | | | | |
| Italy: 3.5% | | | |
| 44,540 | | | | AEM S.p.A. | | | 80,075 |
| 13,039 | | | | Alleanza Assicurazioni S.p.A. | | | 107,177 |
| 31,549 | | | | Assicurazioni Generali S.p.A. | | | 871,051 |
| | | | | | | |
| Shares | | | | | | Value |
| | | | | | | |
| Italy: (continued) | | | |
| 8,846 | | | | Autostrade S.p.A. | | $ | 165,946 |
| 17,660 | | | | Banca Carige S.p.A | | | 42,980 |
| 68,577 | | | | Banca Monte dei Paschi di Siena S.p.A. | | | 149,747 |
| 9,762 | | | | Banca Popolare di Milano Scrl | | | 58,679 |
| 17,099 | | | | Banche Popolari Unite Scpa | | | 250,778 |
| 17,114 | | | | Banco Popolare Scarl | | | 121,343 |
| 130,654 | | | | Enel S.p.A. | | | 841,620 |
| 79,096 | | | | ENI S.p.A. | | | 1,903,337 |
| 21,099 | | | | Fiat S.p.A | | | 141,240 |
| 6,665 | | | | Finmeccanica S.p.A. | | | 103,234 |
| 2,316 | | | | Fondiaria-Sai S.p.A. | | | 42,277 |
| 15,900 | | | | IFIL - Investments S.p.A. | | | 41,151 |
| 24,931 | | | | Intesa Sanpaolo S.p.A. - RNC | | | 64,493 |
| 239,019 | | | | Intesa Sanpaolo S.p.A. | | | 868,281 |
| 4,699 | | | | Italcementi S.p.A. | | | 61,060 |
| 6,993 | | | | Italcementi S.p.A. RSP | | | 48,762 |
| 2,084 | | | | Lottomatica S.p.A. | | | 51,874 |
| 20,850 | | | | Mediaset S.p.A. | | | 120,138 |
| 13,749 | | | | Mediobanca S.p.A. | | | 141,390 |
| 49,049 | | | | Parmalat S.p.A | | | 82,284 |
| 3,601 | | | | Prysmian S.p.A. | | | 57,025 |
| 7,632 | | | | Saipem S.p.A. | | | 130,168 |
| 21,751 | | | | Snam Rete Gas S.p.A. | | | 121,501 |
| 341,890 | | | | Telecom Italia S.p.A. | | | 562,468 |
| 250,912 | | | | Telecom Italia S.p.A. RNC | | | 285,678 |
| 42,791 | | | | Terna S.p.A | | | 141,209 |
| 348,725 | | | | UniCredito Italiano S.p.A. | | | 886,641 |
| | | | | | | |
| | | | | | | 8,543,607 |
| | | | | | | |
| Japan: 23.6% | | | |
| 17,000 | | | | 77 Bank Ltd. | | | 92,533 |
| 30 | | | | Acom Co., Ltd. | | | 1,268 |
| 5,500 | | | | Advantest Corp. | | | 89,656 |
| 18,400 | | | | Aeon Co., Ltd. | | | 185,301 |
| 16,267 | | | | Aioi Insurance Co., Ltd. | | | 85,096 |
| 6,600 | | | | Aisin Seiki Co., Ltd. | | | 94,530 |
| 19,000 | | | | Ajinomoto Co., Inc. | | | 207,368 |
| 26,000 | | | | All Nippon Airways Co., Ltd. | | | 102,470 |
| 6,800 | | | | Alps Electric Co., Ltd. | | | 33,538 |
| 9,900 | | | | Asahi Breweries Ltd. | | | 171,172 |
| 30,000 | | | | Asahi Glass Co., Ltd. | | | 171,009 |
| 39,000 | | | | Asahi Kasei Corp. | | | 172,148 |
| 13,500 | | | | Astellas Pharma, Inc. | | | 552,586 |
| 35,000 | | | | Bank of Yokohama Ltd. | | | 206,457 |
| 3,000 | | | | Benesse Corp. | | | 131,283 |
| 19,200 | | | | Bridgestone Corp. | | | 287,992 |
| 33,300 | | | | Canon, Inc. | | | 1,055,096 |
| 8,800 | | | | Casio Computer Co., Ltd. | | | 55,531 |
| 42 | | | | Central Japan Railway Co. | | | 364,251 |
| 21,000 | | | | Chiba Bank Ltd. | | | 131,331 |
| 18,000 | | | | Chubu Electric Power Co., Inc. | | | 548,241 |
| 7,200 | | | | Chugai Pharmaceutical Co., Ltd. | | | 139,959 |
| 8,044 | | | | Chugoku Electric Power Co., Inc. | | | 211,802 |
| 11,100 | | | | Citizen Watch Co., Ltd. | | | 40,012 |
| 16,000 | | | | Dai Nippon Printing Co., Ltd. | | | 176,874 |
| 15,000 | | | | Daido Steel Co., Ltd. | | | 45,502 |
| 20,600 | | | | Daiichi Sankyo Co., Ltd. | | | 487,156 |
| 7,100 | | | | Daikin Industries Ltd. | | | 186,719 |
| 3,200 | | | | Daito Trust Construction Co., Ltd. | | | 167,982 |
| 16,000 | | | | Daiwa House Industry Co., Ltd. | | | 156,874 |
| 42,000 | | | | Daiwa Securities Group, Inc. | | | 252,139 |
| 15,700 | | | | Denso Corp. | | | 266,027 |
| 74 | | X | | Dentsu, Inc. | | | 150,269 |
See Accompanying Notes to Financial Statements
85
| | |
| ING INTERNATIONAL INDEX PORTFOLIO | | PORTFOLIO OF INVESTMENTS ASOF DECEMBER 31, 2008 (CONTINUED) |
| | | | | | | |
| Shares | | | | | | Value |
| | | | | | | |
| Japan: (continued) | | | |
| 2,180 | | | | Diamond Lease Co., Ltd. | | $ | 55,560 |
| 100 | | X | | East Japan Railway Co. | | | 790,469 |
| 7,000 | | | | Eisai Co., Ltd. | | | 292,107 |
| 3,900 | | | | Electric Power Development Co. | | | 153,295 |
| 4,300 | | @ | | Elpida Memory, Inc. | | | 26,599 |
| 1,900 | | | | FamilyMart Co., Ltd. | | | 82,514 |
| 5,400 | | | | Fanuc Ltd. | | | 387,028 |
| 1,800 | | | | Fast Retailing Co., Ltd. | | | 264,119 |
| 19,000 | | | | Fuji Heavy Industries Ltd. | | | 52,214 |
| 14,000 | | | | Fuji Photo Film Co., Ltd. | | | 312,538 |
| 55,000 | | | | Fujitsu Ltd. | | | 267,410 |
| 31,000 | | | | Fukuoka Financial Group, Inc. | | | 135,500 |
| 26,000 | | | | Furukawa Electric Co., Ltd. | | | 126,883 |
| 14,000 | | | | Gunma Bank Ltd. | | | 89,623 |
| 43,000 | | | | Hankyu Hanshin Holdings, Inc. | | | 248,336 |
| 1,400 | | | | Hirose Electric Co., Ltd. | | | 141,654 |
| 25,000 | | | | Hiroshima Bank Ltd. | | | 109,402 |
| 2,200 | | | | Hisamitsu Pharmaceutical Co., Inc. | | | 89,931 |
| 4,200 | | | | Hitachi Construction Machinery Co., Ltd. | | | 50,221 |
| 105,000 | | | | Hitachi Ltd. | | | 407,497 |
| 7,000 | | | | Hitachi Metals Ltd. | | | 32,557 |
| 5,600 | | | | Hokkaido Electric Power Co., Inc. | | | 141,583 |
| 53,000 | | | | Hokugin Financial Group, Inc. | | | 125,463 |
| 5,600 | | | | Hokuriku Electric Power Co. | | | 158,413 |
| 52,500 | | S | | Honda Motor Co., Ltd. | | | 1,118,181 |
| 10,600 | | | | Hoya Corp. | | | 185,142 |
| 3,900 | | | | Ibiden Co., Ltd. | | | 80,862 |
| 700 | | | | Idemitsu Kosan Co., Ltd. | | | 45,081 |
| 25 | | | | Inpex Holdings, Inc. | | | 199,302 |
| 13,400 | | @ | | Isetan Mitsukoshi Holdings Ltd. | | | 115,640 |
| 33,000 | | | | Isuzu Motors Ltd. | | | 42,641 |
| 45,000 | | | | Itochu Corp. | | | 227,029 |
| 9,000 | | | | Iyo Bank Ltd. | | | 112,023 |
| 40,000 | | @ | | Japan Airlines Corp. | | | 94,353 |
| 900 | | | | Japan Petroleum Exploration Co. | | | 39,570 |
| 12,000 | | | | Japan Steel Works Ltd. | | | 168,010 |
| 128 | | | | Japan Tobacco, Inc. | | | 423,980 |
| 15,300 | | | | JFE Holdings, Inc. | | | 406,610 |
| 6,000 | | S | | JGC Corp. | | | 89,796 |
| 9,500 | | | | JS Group Corp. | | | 146,801 |
| 8,200 | | | | JSR Corp. | | | 92,252 |
| 86 | | | | Jupiter Telecommunications Co. | | | 89,512 |
| 12,000 | | | | Kamigumi Co., Ltd. | | | 106,617 |
| 21,000 | | | | Kansai Electric Power Co., Inc. | | | 608,286 |
| 15,000 | | | | Kao Corp. | | | 455,630 |
| 17,000 | | | | Kawasaki Kisen Kaisha Ltd. | | | 79,731 |
| 80 | | | | KDDI Corp. | | | 571,224 |
| 19,000 | | | | Keihin Electric Express Railway Co., Ltd. | | | 167,792 |
| 23,000 | | | | Keio Corp. | | | 138,392 |
| 16,000 | | | | Keisei Electric Railway Co., Ltd. | | | 100,026 |
| 1,400 | | | | Keyence Corp. | | | 287,717 |
| 6,000 | | | | Kikkoman Corp. | | | 71,299 |
| 48,000 | | | | Kintetsu Corp. | | | 220,826 |
| 24,000 | | | | Kirin Brewery Co., Ltd. | | | 319,089 |
| 87,000 | | | | Kobe Steel Ltd. | | | 159,829 |
| 26,500 | | | | Komatsu Ltd. | | | 338,048 |
| 2,800 | | | | Konami Corp. | | | 72,590 |
| 13,000 | | | | Konica Minolta Holdings, Inc. | | | 101,151 |
| 9,200 | | | | Koyo Seiko Co., Ltd. | | | 71,698 |
| 35,000 | | | | Kubota Corp. | | | 253,414 |
| 12,500 | | | | Kuraray Co., Ltd. | | | 97,937 |
| 3,500 | | | | Kurita Water Industries Ltd. | | | 94,618 |
| | | | | | | |
| Shares | | | | | | Value |
| | | | | | | |
| Japan: (continued) | | | |
| 4,500 | | | | Kyocera Corp. | | $ | 325,790 |
| 7,000 | | | | Kyowa Hakko Kogyo Co., Ltd. | | | 73,487 |
| 9,900 | | | | Kyushu Electric Power Co., Inc. | | | 262,821 |
| 1,600 | | | | Lawson, Inc. | | | 92,274 |
| 4,000 | | | | Makita Corp. | | | 89,496 |
| 42,000 | | | | Marubeni Corp. | | | 160,799 |
| 59,000 | | | | Matsushita Electric Industrial Co., Ltd. | | | 725,242 |
| 13,000 | | | | Matsushita Electric Works Ltd. | | | 115,921 |
| 24,000 | | | | Mazda Motor Corp. | | | 39,448 |
| 35,500 | | | | Mitsubishi Chemical Holdings Corp. | | | 157,304 |
| 40,900 | | | | Mitsubishi Corp. | | | 579,310 |
| 59,000 | | | | Mitsubishi Electric Corp. | | | 369,738 |
| 39,000 | | | | Mitsubishi Estate Co., Ltd. | | | 644,237 |
| 19,000 | | | | Mitsubishi Gas Chemical Co., Inc. | | | 77,961 |
| 97,000 | | | | Mitsubishi Heavy Industries Ltd. | | | 433,517 |
| 41,000 | | | | Mitsubishi Materials Corp. | | | 103,775 |
| 118,255 | | @ | | Mitsubishi Motors Corp. | | | 161,977 |
| 32,000 | | | | Mitsubishi Rayon Co., Ltd. | | | 96,924 |
| 323,600 | | | | Mitsubishi UFJ Financial Group, Inc. | | | 2,033,874 |
| 53,000 | | | | Mitsui & Co., Ltd. | | | 544,860 |
| 23,000 | | | | Mitsui Chemicals, Inc. | | | 85,470 |
| 42,000 | | | | Mitsui Engineering & Shipbuilding Co., Ltd. | | | 68,571 |
| 25,000 | | | | Mitsui Fudosan Co., Ltd. | | | 416,806 |
| 32,000 | | | | Mitsui OSK Lines Ltd. | | | 197,769 |
| 10,100 | | | | Mitsui Sumitomo Insurance Group Holdings, Inc. | | | 321,192 |
| 32,000 | | | | Mitsui Trust Holdings, Inc. | | | 157,335 |
| 3,200 | | | | Mitsumi Electric Co., Ltd. | | | 56,035 |
| 304 | | X | | Mizuho Financial Group, Inc. | | | 898,780 |
| 79,000 | | | | Mizuho Trust & Banking Co., Ltd. | | | 100,228 |
| 6,600 | | | | Murata Manufacturing Co., Ltd. | | | 258,795 |
| 9,700 | | | | Namco Bandai Holdings, Inc. | | | 106,316 |
| 55,000 | | | | NEC Corp. | | | 186,074 |
| 8,000 | | | | NGK Insulators Ltd. | | | 90,654 |
| 3,600 | | | | Nidec Corp. | | | 140,794 |
| 9,000 | | | | Nikon Corp. | | | 108,023 |
| 3,100 | | | | Nintendo Co., Ltd. | | | 1,184,670 |
| 12,000 | | | | Nippon Electric Glass Co., Ltd. | | | 63,343 |
| 28,000 | | | | Nippon Express Co., Ltd. | | | 118,023 |
| 4,000 | | | | Nippon Meat Packers, Inc. | | | 60,888 |
| 31,000 | | | | Nippon Mining Holdings, Inc. | | | 134,514 |
| 37,000 | | | | Nippon Oil Corp. | | | 187,604 |
| 35 | | X | | Nippon Paper Group, Inc. | | | 143,753 |
| 25,000 | | | | Nippon Sheet Glass Co., Ltd. | | | 82,769 |
| 145,000 | | | | Nippon Steel Corp. | | | 476,511 |
| 167 | | X | | Nippon Telegraph & Telephone Corp. | | | 896,660 |
| 32,000 | | | | Nippon Yusen KK | | | 197,272 |
| 16,340 | | | | Nipponkoa Insurance Co., Ltd. | | | 127,122 |
| 43,000 | | | | Nishi-Nippon City Bank Ltd. | | | 125,067 |
| 66,500 | | | | Nissan Motor Co., Ltd. | | | 239,242 |
| 3,000 | | | | Nisshin Seifun Group, Inc. | | | 39,619 |
| 7,000 | | | | Nisshinbo Industries, Inc. | | | 53,362 |
| 2,600 | | | | Nissin Food Products Co., Ltd. | | | 90,606 |
| 6,100 | | | | Nitto Denko Corp. | | | 116,777 |
| 55,400 | | S | | Nomura Holdings, Inc. | | | 461,278 |
| 3,100 | | | | Nomura Real Estate Holdings, Inc. | | | 61,847 |
| 4,500 | | | | Nomura Research Institute Ltd. | | | 85,843 |
| 16,000 | | | | NSK Ltd. | | | 60,426 |
| 38 | | | | NTT Data Corp. | | | 153,105 |
| 475 | | | | NTT DoCoMo, Inc. | | | 934,950 |
| 21,000 | | | | Odakyu Electric Railway Co., Ltd. | | | 184,904 |
| 25,000 | | | | OJI Paper Co., Ltd. | | | 146,979 |
See Accompanying Notes to Financial Statements
86
| | |
| ING INTERNATIONAL INDEX PORTFOLIO | | PORTFOLIO OF INVESTMENTS ASOF DECEMBER 31, 2008 (CONTINUED) |
| | | | | | | |
| Shares | | | | | | Value |
| | | | | | | |
| Japan: (continued) | | | |
| 6,000 | | | | Olympus Corp. | | $ | 120,112 |
| 7,500 | | | | Omron Corp. | | | 100,769 |
| 2,700 | | | | Ono Pharmaceutical Co., Ltd. | | | 140,573 |
| 2,300 | | S | | Oracle Corp. Japan | | | 99,621 |
| 2,100 | | | | Oriental Land Co., Ltd. | | | 172,409 |
| 3,090 | | | | ORIX Corp. | | | 176,442 |
| 50,000 | | | | Osaka Gas Co., Ltd. | | | 231,212 |
| 160 | | X | | Resona Holdings, Inc. | | | 246,158 |
| 20,000 | | | | Ricoh Co., Ltd. | | | 256,334 |
| 2,900 | | | | Rohm Co., Ltd. | | | 146,412 |
| 1,600 | | | | Sankyo Co., Ltd. | | | 80,718 |
| 62,000 | | @ | | Sanyo Electric Co., Ltd. | | | 115,981 |
| 10,000 | | | | Sapporo Holdings Ltd. | | | 63,339 |
| 5,600 | | | | Secom Co., Ltd. | | | 288,974 |
| 8,900 | | | | Sega Sammy Holdings, Inc. | | | 103,782 |
| 4,800 | | | | Seiko Epson Corp. | | | 76,377 |
| 16,000 | | | | Sekisui House Ltd. | | | 141,159 |
| 28,000 | | | | Seven & I Holdings Co., Ltd. | | | 962,405 |
| 28,000 | | | | Sharp Corp. | | | 201,838 |
| 5,500 | | | | Shikoku Electric Power Co. | | | 185,433 |
| 5,000 | | | | Shimadzu Corp. | | | 31,474 |
| 2,800 | | | | Shimano, Inc. | | | 110,227 |
| 11,700 | | | | Shin-Etsu Chemical Co., Ltd. | | | 539,973 |
| 44,000 | | | | Shinko Securities Co., Ltd. | | | 96,542 |
| 45,000 | | | | Shinsei Bank Ltd. | | | 71,222 |
| 8,000 | | | | Shionogi & Co., Ltd. | | | 206,601 |
| 8,000 | | | | Shiseido Co., Ltd. | | | 164,519 |
| 20,000 | | | | Shizuoka Bank Ltd. | | | 232,416 |
| 52,000 | | | | Showa Denko KK | | | 75,316 |
| 7,000 | | | | Showa Shell Sekiyu KK | | | 69,370 |
| 1,600 | | | | SMC Corp. | | | 164,827 |
| 22,600 | | | | Softbank Corp. | | | 410,443 |
| 795 | | | | Softbank Investment Corp. | | | 122,732 |
| 44,200 | | | | Sojitz Corp. | | | 73,867 |
| 26,000 | | | | Sompo Japan Insurance, Inc. | | | 192,522 |
| 32,200 | | | | Sony Corp. | | | 704,276 |
| 35 | | | | Sony Financial Holdings, Inc. | | | 133,576 |
| 2,700 | | | | Square Enix Co., Ltd. | | | 87,122 |
| 4,600 | | | | Stanley Electric Co., Ltd. | | | 48,570 |
| 4,900 | | | | Sumco Corp. | | | 62,251 |
| 50,000 | | | | Sumitomo Chemical Co., Ltd. | | | 171,402 |
| 33,600 | | | | Sumitomo Corp. | | | 298,008 |
| 23,200 | | | | Sumitomo Electric Industries Ltd. | | | 179,596 |
| 21,000 | | | | Sumitomo Heavy Industries | | | 84,007 |
| 114,000 | | | | Sumitomo Metal Industries Ltd. | | | 281,594 |
| 16,000 | | | | Sumitomo Metal Mining Co., Ltd. | | | 171,162 |
| 213 | | X | | Sumitomo Mitsui Financial Group, Inc. | | | 918,825 |
| 13,000 | | | | Sumitomo Realty & Development Co., Ltd. | | | 195,418 |
| 43,000 | | | | Sumitomo Trust & Banking Co., Ltd. | | | 254,184 |
| 11,000 | | | | Suruga Bank Ltd. | | | 109,281 |
| 12,300 | | | | Suzuki Motor Corp. | | | 171,912 |
| 5,450 | | S | | T&D Holdings, Inc. | | | 230,676 |
| 5,000 | | | | Taisho Pharmaceutical Co., Ltd. | | | 106,511 |
| 16,000 | | | | Taiyo Nippon Sanso Corp. | | | 123,503 |
| 26,600 | | | | Takeda Pharmaceutical Co., Ltd. | | | 1,386,453 |
| 5,370 | | | | Takefuji Corp. | | | 44,058 |
| 6,000 | | | | Tanabe Seiyaku Co., Ltd. | | | 90,563 |
| 4,100 | | | | TDK Corp. | | | 151,481 |
| 4,700 | | | | Terumo Corp. | | | 220,174 |
| 24,000 | | | | Tobu Railway Co., Ltd. | | | 143,390 |
| 4,100 | | | | Toho Co., Ltd. | | | 88,226 |
| 12,000 | | | | Toho Gas Co., Ltd. | | | 79,183 |
| | | | | | | |
| Shares | | | | | | Value |
| | | | | | | |
| Japan: (continued) | | | |
| 11,300 | | | | Tohoku Electric Power Co., Inc. | | $ | 305,679 |
| 21,100 | | | | Tokio Marine Holdings, Inc. | | | 625,181 |
| 37,700 | | | | Tokyo Electric Power Co., Inc. | | | 1,258,492 |
| 4,700 | | | | Tokyo Electron Ltd. | | | 165,457 |
| 60,000 | | | | Tokyo Gas Co., Ltd. | | | 304,133 |
| 20,000 | | | | Tokyo Tatemono Co., Ltd. | | | 91,658 |
| 38,000 | | | | Tokyu Corp. | | | 191,590 |
| 23,000 | | | | Tokyu Land Corp. | | | 88,161 |
| 14,000 | | | | TonenGeneral Sekiyu KK | | | 140,282 |
| 16,000 | | | | Toppan Printing Co., Ltd. | | | 123,605 |
| 50,000 | | | | Toray Industries, Inc. | | | 254,459 |
| 88,000 | | | | Toshiba Corp. | | | 362,102 |
| 25,000 | | | | Tosoh Corp. | | | 61,704 |
| 10,000 | | | | Toto Ltd. | | | 63,195 |
| 6,000 | | | | Toyo Seikan Kaisha Ltd. | | | 104,003 |
| 3,000 | | | | Toyo Suisan Kaisha Ltd. | | | 86,449 |
| 6,500 | | | | Toyota Industries Corp. | | | 140,017 |
| 78,700 | | | | Toyota Motor Corp. | | | 2,601,690 |
| 7,700 | | | | Toyota Tsusho Corp. | | | 82,897 |
| 2,500 | | | | Trend Micro, Inc. | | | 87,807 |
| 36,000 | | | | Ube Industries Ltd. | | | 101,129 |
| 1,400 | | | | Uni-Charm Corp. | | | 105,324 |
| 5,500 | | | | Ushio, Inc. | | | 72,668 |
| 1,270 | | | | USS Co., Ltd. | | | 67,391 |
| 37 | | | | West Japan Railway Co. | | | 168,588 |
| 476 | | | | Yahoo! Japan Corp. | | | 195,310 |
| 2,300 | | | | Yakult Honsha Co., Ltd. | | | 49,213 |
| 2,550 | | | | Yamada Denki Co., Ltd. | | | 178,249 |
| 5,000 | | | | Yamaguchi Financial Group, Inc. | | | 56,232 |
| 6,800 | | | | Yamaha Corp. | | | 63,220 |
| 9,300 | | | | Yamaha Motor Co., Ltd. | | | 97,858 |
| 13,000 | | | | Yamato Holdings Co., Ltd. | | | 169,998 |
| 2,100 | | | | Yamato Kogyo Co., Ltd. | | | 56,835 |
| 12,000 | | | | Yaskawa Electric Corp. | | | 48,469 |
| | | | | | | |
| | | | | | | 57,839,064 |
| | | | | | | |
| Kazakhstan: 0.0% | | | |
| 9,247 | | | | Eurasian Natural Resources Corp. | | | 44,245 |
| | | | | | | |
| | | | | | | 44,245 |
| | | | | | | |
| Luxembourg: 0.3% | | | |
| 27,119 | | | | ArcelorMittal | | | 657,347 |
| 9,434 | | | | SES SA | | | 182,835 |
| | | | | | | |
| | | | | | | 840,182 |
| | | | | | | |
| Mauritius: 0.0% | | | |
| 193,000 | | | | Golden Agri-Resources Ltd. | | | 31,804 |
| | | | | | | |
| | | | | | | 31,804 |
| | | | | | | |
| Netherlands: 4.4% | | | |
| 37,735 | | | | Aegon NV | | | 238,207 |
| 7,510 | | | | Akzo Nobel NV | | | 309,771 |
| 12,054 | | | | ASML Holding NV | | | 217,299 |
| 1,584 | | | | Boskalis Westminster | | | 36,955 |
| 10,019 | | | | European Aeronautic Defence and Space Co. NV | | | 169,675 |
| 1,389 | | | | Fugro NV | | | 39,924 |
| 2,674 | | | | Heineken Holding NV | | | 76,382 |
| 7,192 | | | | Heineken NV | | | 220,195 |
| 58,235 | | ** | | ING Groep NV | | | 640,930 |
| 34,812 | | | | Koninklijke Ahold NV | | | 428,985 |
| 4,067 | | | | Koninklijke DSM NV | | | 104,364 |
| 31,105 | | | | Koninklijke Philips Electronics NV | | | 616,710 |
See Accompanying Notes to Financial Statements
87
| | |
| ING INTERNATIONAL INDEX PORTFOLIO | | PORTFOLIO OF INVESTMENTS ASOF DECEMBER 31, 2008 (CONTINUED) |
| | | | | | | |
| Shares | | | | | | Value |
| | | | | | | |
| Netherlands: (continued) | | | |
| 2,392 | | | | Randstad Holdings NV | | $ | 48,815 |
| 15,793 | | | | Reed Elsevier NV | | | 187,769 |
| 105,199 | | | | Royal Dutch Shell PLC - Class A | | | 2,763,904 |
| 82,341 | | | | Royal Dutch Shell PLC - Class B | | | 2,087,216 |
| 55,909 | | | | Royal KPN NV | | | 812,829 |
| 4,017 | | | | SBM Offshore NV | | | 52,775 |
| 5,148 | | | | SNS Reaal | | | 28,295 |
| 10,485 | | | | TNT NV | | | 203,675 |
| 51,966 | | | | Unilever NV | | | 1,259,550 |
| 7,894 | | | | Wolters Kluwer NV | | | 149,674 |
| | | | | | | |
| | | | | | | 10,693,899 |
| | | | | | | |
| New Zealand: 0.1% | | | |
| 48,758 | | | | Auckland International Airport Ltd. | | | 46,263 |
| 17,998 | | | | Fletcher Building Ltd. | | | 60,641 |
| 51,472 | | | | Telecom Corp. of New Zealand Ltd. | | | 69,180 |
| | | | | | | |
| | | | | | | 176,084 |
| | | | | | | |
| Norway: 0.5% | | | |
| 4,517 | | | | Aker Kvaerner ASA | | | 29,874 |
| 22,100 | | | | DnB NOR ASA | | | 87,685 |
| 20,000 | | | | Norsk Hydro ASA | | | 81,488 |
| 20,900 | | | | Orkla ASA | | | 139,063 |
| 4,550 | | @ | | Renewable Energy Corp. A/S | | | 43,583 |
| 38,800 | | S | | Statoil ASA | | | 648,922 |
| 25,400 | | | | Telenor ASA | | | 171,358 |
| 5,565 | | | | Yara International ASA | | | 122,412 |
| | | | | | | |
| | | | | | | 1,324,385 |
| | | | | | | |
| Portugal: 0.3% | | | |
| 77,290 | | @ | | Banco Comercial Portugues SA | | | 88,235 |
| 7,511 | | | | Banco Espirito Santo SA | | | 69,956 |
| 10,267 | | | | Brisa-Auto Estradas de Portugal SA | | | 76,957 |
| 10,839 | | | | Cimpor Cimentos de Portugal SG | | | 52,630 |
| 54,913 | | | | Energias de Portugal SA | | | 206,581 |
| 17,395 | | | | Portugal Telecom SGPS SA | | | 148,863 |
| | | | | | | |
| | | | | | | 643,222 |
| | | | | | | |
| Singapore: 0.9% | | | |
| 53,000 | | | | CapitaLand Ltd. | | | 115,642 |
| 19,000 | | | | City Developments Ltd. | | | 85,005 |
| 37,000 | | | | DBS Group Holdings Ltd. | | | 217,944 |
| 33,000 | | | | Fraser and Neave Ltd. | | | 68,230 |
| 8,000 | | | | Jardine Cycle & Carriage Ltd. | | | 53,205 |
| 44,000 | | | | Keppel Corp., Ltd. | | | 133,588 |
| 77,000 | | | | Oversea-Chinese Banking Corp. | | | 267,735 |
| 19,133 | | | | Parkway Holdings Ltd. | | | 16,581 |
| 36,000 | | | | SembCorp Industries Ltd. | | | 58,728 |
| 36,000 | | | | SembCorp Marine Ltd. | | | 42,430 |
| 16,000 | | | | Singapore Airlines Ltd. | | | 125,839 |
| 31,000 | | | | Singapore Exchange Ltd. | | | 110,428 |
| 55,000 | | | | Singapore Press Holdings Ltd. | | | 119,258 |
| 37,000 | | | | Singapore Technologies Engineering Ltd. | | | 61,272 |
| 222,000 | | S | | Singapore Telecommunications Ltd. | | | 395,616 |
| 38,000 | | | | United Overseas Bank Ltd. | | | 343,407 |
| | | | | | | |
| | | | | | | 2,214,908 |
| | | | | | | |
| Spain: 4.4% | | | |
| 6,085 | | | | Abertis Infraestructuras SA | | | 109,058 |
| 822 | | | | Acciona SA | | | 104,519 |
| 4,927 | | | | Acerinox SA | | | 80,087 |
| 5,052 | | | | ACS Actividades de Construccion y Servicios SA | | | 234,597 |
| | | | | | | |
| Shares | | | | | | Value |
| | | | | | | |
| Spain: (continued) | | | |
| 110,568 | | | | Banco Bilbao Vizcaya Argentaria SA | | $ | 1,369,978 |
| 21,093 | | | | Banco De Sabadell SA | | | 144,399 |
| 21,991 | | | | Banco Popular Espanol SA | | | 190,741 |
| 233,792 | | | | Banco Santander Central Hispano SA | | | 2,258,592 |
| 4,785 | | | | Banco Santander SA | | | 43,378 |
| 9,985 | | | | Bankinter SA | | | 90,316 |
| 18,840 | | | | Corp. Mapfre SA | | | 64,252 |
| 23,559 | | | | Criteria Caixacorp SA | | | 93,985 |
| 5,862 | | | | Enagas | | | 129,440 |
| 2,092 | | | | Fomento de Construcciones y Contratas SA | | | 69,570 |
| 5,039 | | | | Gamesa Corp. Tecnologica SA | | | 91,877 |
| 3,283 | | | | Gas Natural SDG SA | | | 89,328 |
| 3,956 | | | | Grifols SA | | | 69,316 |
| 2,344 | | | | Grupo Ferrovial | | | 65,385 |
| 20,900 | | @ | | Iberdrola Renovables | | | 91,117 |
| 109,720 | | | | Iberdrola SA | | | 1,022,775 |
| 18,638 | | | | Iberia Lineas Aereas de Espana | | | 52,567 |
| 5,966 | | | | Inditex SA | | | 265,671 |
| 3,717 | | | | Indra Sistemas SA | | | 85,315 |
| 3,475 | | | | Red Electrica de Espana | | | 177,144 |
| 20,611 | | S | | Repsol YPF SA | | | 440,048 |
| 3,514 | | | | Sacyr Vallehermoso SA | | | 31,859 |
| 133,132 | | | | Telefonica SA | | | 3,005,011 |
| 11,123 | | | | Union Fenosa SA | | | 278,691 |
| 5,457 | | | | Zardoya-Otis SA | | | 98,082 |
| | | | | | | |
| | | | | | | 10,847,098 |
| | | | | | | |
| Sweden: 1.9% | | | |
| 9,875 | | | | Alfa Laval AB | | | 88,160 |
| 8,800 | | | | Assa Abloy AB | | | 102,336 |
| 22,600 | | | | Atlas Copco AB - Class A | | | 198,846 |
| 19,200 | | | | Atlas Copco AB - Class B | | | 150,330 |
| 7,500 | | | | Electrolux AB | | | 65,626 |
| 557 | | @ | | Getinge AB - Class A | | | 6,427 |
| 5,017 | | @ | | Getinge AB - Class B | | | 60,878 |
| 13,600 | | | | Hennes & Mauritz AB | | | 540,942 |
| 2,100 | | | | Holmen AB | | | 52,551 |
| 10,617 | | | | Investor AB | | | 161,941 |
| 1,480 | | @ | | Loomis AB | | | 9,171 |
| 6,400 | | @ | | Lundin Petroleum AB | | | 34,347 |
| 2,156 | | @ | | Millicom International Cellular SA | | | 101,871 |
| 2,250 | | | | Modern Times Group AB | | | 49,259 |
| 62,800 | | | | Nordea Bank AB | | | 447,619 |
| 27,800 | | | | Sandvik AB | | | 178,568 |
| 11,400 | | | | Scania AB - B Shares | | | 115,999 |
| 7,400 | | | | Securitas AB | | | 62,300 |
| 11,000 | | | | Skandinaviska Enskilda Banken AB | | | 88,795 |
| 10,600 | | | | SKF AB - B Shares | | | 107,867 |
| 7,000 | | | | SSAB Svenskt Staal AB - Class A | | | 62,077 |
| 5,900 | | | | SSAB Svenskt Staal AB - Class B | | | 49,192 |
| 18,000 | | | | Svenska Cellulosa AB - B Shares | | | 156,284 |
| 12,900 | | | | Svenska Handelsbanken AB | | | 213,317 |
| 10,034 | | | | Swedbank AB | | | 59,268 |
| 8,200 | | | | Swedish Match AB | | | 118,382 |
| 7,622 | | | | Tele2 AB - B Shares | | | 68,975 |
| 90,600 | | | | Telefonaktiebolaget LM Ericsson | | | 706,307 |
| 64,000 | | | | TeliaSonera AB | | | 322,305 |
| 29,800 | | | | Volvo AB | | | 169,586 |
| | | | | | | |
| | | | | | | 4,549,526 |
| | | | | | | |
| Switzerland: 8.3% | | | |
| 69,962 | | @, S | | ABB Ltd. | | | 1,066,930 |
| 2,631 | | @ | | Actelion Ltd. - Reg | | | 148,840 |
See Accompanying Notes to Financial Statements
88
| | |
| ING INTERNATIONAL INDEX PORTFOLIO | | PORTFOLIO OF INVESTMENTS ASOF DECEMBER 31, 2008 (CONTINUED) |
| | | | | | | |
| Shares | | | | | | Value |
| | | | | | | |
| Switzerland: (continued) | | | |
| 3,159 | | | | Adecco SA | | $ | 108,145 |
| 2,092 | | @ | | Aryzta AG | | | 67,221 |
| 1,534 | | | | Baloise Holding AG | | | 115,845 |
| 14,450 | | | | Compagnie Financiere Richemont SA | | | 275,329 |
| 32,061 | | | | Credit Suisse Group | | | 898,496 |
| 1,775 | | | | EFG International | | | 31,719 |
| 1,057 | | | | Geberit AG - Reg | | | 114,315 |
| 209 | | | | Givaudan | | | 165,151 |
| 5,922 | | | | Holcim Ltd. | | | 342,766 |
| 6,580 | | | | Julius Baer Holding AG - Reg | | | 255,023 |
| 1,622 | | | | Kuehne & Nagel International AG | | | 105,054 |
| 37 | | | | Lindt & Spruengli AG | | | 69,230 |
| 4,754 | | @ | | Logitech International SA | | | 74,607 |
| 1,505 | | | | Lonza Group AG | | | 139,531 |
| 111,834 | | | | Nestle SA | | | 4,428,419 |
| 3,968 | | | | Nobel Biocare Holding AG | | | 81,938 |
| 73,388 | | | | Novartis AG | | | 3,675,378 |
| 332 | | @ | | OC Oerlikon Corp. AG | | | 22,203 |
| 1,258 | | | | Pargesa Holding SA | | | 84,074 |
| 21,844 | | | | Roche Holding AG | | | 3,381,825 |
| 1,869 | | | | Schindler Holding AG | | | 85,749 |
| 114 | | | | SGS SA | | | 119,228 |
| 1,471 | | | | Sonova Holding AG - Reg | | | 89,404 |
| 17,792 | | | | STMicroelectronics NV | | | 119,325 |
| 309 | | | | Straumann Holding AG | | | 54,776 |
| 1,056 | | | | Sulzer AG | | | 60,939 |
| 768 | | | | Swatch Group AG - BR | | | 108,317 |
| 1,913 | | | | Swatch Group AG - Reg | | | 52,719 |
| 903 | | @ | | Swiss Life Holding | | | 62,617 |
| 9,547 | | S | | Swiss Reinsurance | | | 467,475 |
| 569 | | | | Swisscom AG | | | 184,575 |
| 3,282 | | | | Syngenta AG | | | 637,580 |
| 1,727 | | | | Synthes, Inc. | | | 216,453 |
| 90,794 | | @ | | UBS AG - Reg | | | 1,320,994 |
| 17,841 | | | | Xstrata PLC | | | 166,945 |
| 4,414 | | | | Zurich Financial Services AG | | | 964,375 |
| | | | | | | |
| | | | | | | 20,363,510 |
| | | | | | | |
| United Kingdom: 16.6% |
| 10,226 | | | | 3i Group PLC | | | 40,046 |
| 6,380 | | | | Amec PLC | | | 46,058 |
| 40,913 | | | | Anglo American PLC | | | 954,792 |
| 9,655 | | | | Antofagasta PLC | | | 60,480 |
| 10,778 | | | | Associated British Foods PLC | | | 113,464 |
| 45,404 | | | | AstraZeneca PLC | | | 1,857,498 |
| 82,027 | | | | Aviva PLC | | | 464,805 |
| 104,471 | | | | BAE Systems PLC | | | 568,546 |
| 14,727 | | | | Balfour Beatty PLC | | | 71,241 |
| 248,530 | | | | Barclays PLC | | | 564,881 |
| 101,789 | | | | BG Group PLC | | | 1,408,921 |
| 66,720 | | | | BHP Billiton PLC | | | 1,294,075 |
| 552,459 | | | | BP PLC | | | 4,264,656 |
| 22,805 | | | | British Airways PLC | | | 60,277 |
| 55,759 | | | | British American Tobacco PLC | | | 1,454,578 |
| 29,685 | | | | British Energy Group PLC | | | 332,648 |
| 33,711 | | | | British Sky Broadcasting PLC | | | 238,065 |
| 217,527 | | | | BT Group PLC | | | 437,470 |
| 8,151 | | | | Bunzl PLC | | | 69,555 |
| 13,794 | | | | Burberry Group PLC | | | 44,661 |
| 62,436 | | | | Cable & Wireless PLC | | | 141,201 |
| 36,984 | | | | Cadbury PLC | | | 321,968 |
| 3,649 | | @ | | Cairn Energy PLC | | | 106,873 |
| 16,165 | | | | Capita Group PLC | | | 173,401 |
| | | | | | | |
| Shares | | | | | | Value |
| | | | | | | |
| United Kingdom: (continued) |
| 4,523 | | | | Carnival PLC | | $ | 99,886 |
| 15,648 | | | | Carphone Warehouse Group | | | 20,506 |
| 145,136 | | | | Centrica PLC | | | 558,746 |
| 26,129 | | | | Cobham PLC | | | 78,103 |
| 50,038 | | | | Compass Group PLC | | | 249,574 |
| 76,901 | | | | Diageo PLC | | | 1,080,525 |
| 8,354 | | | | Drax Group PLC | | | 67,816 |
| 27,661 | | | | Experian Group Ltd. | | | 174,402 |
| 14,514 | | | | Firstgroup PLC | | | 91,788 |
| 67,314 | | | | Friends Provident PLC | | | 86,043 |
| 26,212 | | | | GKN PLC | | | 36,496 |
| 153,848 | | | | GlaxoSmithKline PLC | | | 2,861,227 |
| 26,152 | | | | Group 4 Securicor PLC | | | 77,879 |
| 57,744 | | | | Hays PLC | | | 58,349 |
| 150,472 | | | | HBOS PLC | | | 155,765 |
| 28,357 | | | | Home Retail Group | | | 87,522 |
| 354,212 | | | | HSBC Holdings PLC | | | 3,466,742 |
| 19,065 | | | | ICAP PLC | | | 80,478 |
| 11,617 | | | | IMI PLC | | | 45,180 |
| 31,965 | | | | Imperial Tobacco Group PLC | | | 853,817 |
| 8,072 | | | | Intercontinental Hotels Group PLC | | | 66,595 |
| 35,935 | | | | International Power PLC | | | 125,223 |
| 19,086 | | @ | | Invensys PLC | | | 48,236 |
| 12,951 | | | | Investec PLC | | | 53,476 |
| 134,725 | | | | ITV PLC | | | 77,734 |
| 29,416 | | | | J Sainsbury PLC | | | 140,374 |
| 5,679 | | | | Johnson Matthey PLC | | | 90,375 |
| 6,433 | | | | Kazakhmys PLC | | | 21,959 |
| 63,080 | | | | Kingfisher PLC | | | 124,263 |
| 24,039 | | | | Ladbrokes PLC | | | 64,568 |
| 173,478 | | | | Legal & General Group PLC | | | 193,900 |
| 155,969 | | | | Lloyds TSB Group PLC | | | 295,206 |
| 44,774 | | | | LogicaCMG PLC | | | 45,012 |
| 4,510 | | | | Lonmin PLC | | | 60,112 |
| 49,146 | | | | Man Group PLC | | | 169,070 |
| 45,853 | | | | Marks & Spencer Group PLC | | | 143,728 |
| 4,911 | | | | National Express Group PLC | | | 35,314 |
| 74,344 | | | | National Grid PLC | | | 734,627 |
| 6,598 | | | | Next PLC | | | 103,682 |
| 160,070 | | | | Old Mutual PLC | | | 128,655 |
| 22,887 | | | | Pearson PLC | | | 215,718 |
| 69,401 | | | | Prudential PLC | | | 421,281 |
| 18,097 | | | | Reckitt Benckiser PLC | | | 678,112 |
| 32,295 | | | | Reed Elsevier PLC | | | 237,105 |
| 17,794 | | | | Rexam PLC | | | 91,075 |
| 30,931 | | | | Rio Tinto PLC | | | 687,491 |
| 2,908,105 | | @ | | Rolls-Royce Group PLC - C Share | | | 4,181 |
| 53,162 | | @ | | Rolls-Royce Group PLC | | | 260,064 |
| 74,382 | | | | Royal & Sun Alliance Insurance Group | | | 148,222 |
| 510,963 | | | | Royal Bank of Scotland Group PLC | | | 376,134 |
| 26,575 | | | | SABMiller PLC | | | 446,270 |
| 34,894 | | | | Sage Group PLC | | | 86,404 |
| 25,084 | | | | Scottish & Southern Energy PLC | | | 442,265 |
| 15,765 | | | | Serco Group PLC | | | 103,199 |
| 5,923 | | | | Severn Trent PLC | | | 102,647 |
| 16,079 | | | | Shire PLC | | | 236,843 |
| 28,040 | | | | Smith & Nephew PLC | | | 179,078 |
| 8,995 | | | | Smiths Group PLC | | | 115,586 |
| 16,558 | | | | Stagecoach Group PLC | | | 34,059 |
| 42,830 | | | | Standard Chartered PLC | | | 548,055 |
| 59,003 | | | | Standard Life PLC | | | 172,242 |
| 13,530 | | | | Tate & Lyle PLC | | | 78,835 |
| 243,672 | | | | Tesco PLC | | | 1,268,808 |
See Accompanying Notes to Financial Statements
89
| | |
| ING INTERNATIONAL INDEX PORTFOLIO | | PORTFOLIO OF INVESTMENTS ASOF DECEMBER 31, 2008 (CONTINUED) |
| | | | | | | |
| Shares | | | | | | Value |
| | | | | | | |
| United Kingdom: (continued) |
| 16,250 | | | | Thomas Cook Group PLC | | $ | 41,554 |
| 4,938 | | | | Thomson Reuters PLC | | | 110,038 |
| 17,587 | | | | TUI Travel PLC | | | 59,612 |
| 18,527 | | | | Tullow Oil PLC | | | 177,381 |
| 42,756 | | | | Unilever PLC | | | 982,097 |
| 10,640 | | | | United Business Media Ltd. | | | 78,613 |
| 19,763 | | | | United Utilities Group PLC | | | 179,449 |
| 4,495 | | | | Vedanta Resources PLC | | | 40,364 |
| 1,567,724 | | | | Vodafone Group PLC | | | 3,210,155 |
| 4,816 | | | | Whitbread PLC | | | 64,190 |
| 70,222 | | | | WM Morrison Supermarkets PLC | | | 284,634 |
| 18,418 | | | | Wolseley PLC | | | 102,598 |
| 34,000 | | | | WPP PLC | | | 198,810 |
| | | | | | | |
| | | | | | | 40,506,282 |
| | | | | | | |
| | | | Total Common Stock
(Cost $365,905,841) | | | 229,838,451 |
| | | | | | | |
| REAL ESTATE INVESTMENT TRUSTS: 0.9% |
| Australia: 0.3% |
| 48,243 | | | | CFS Retail Property Trust | | | 63,415 |
| 76,468 | | | | Dexus Property Group | | | 43,787 |
| 76,770 | | | | GPT Group | | | 50,060 |
| 58,210 | | | | Macquarie Goodman Group | | | 29,975 |
| 29,016 | | | | Mirvac Group | | | 25,969 |
| 45,903 | | | | Stockland | | | 130,580 |
| 55,487 | | | | Westfield Group | | | 503,752 |
| | | | | | | |
| | | | | | | 847,538 |
| | | | | | | |
| France: 0.2% |
| 584 | | | | Gecina SA | | | 40,606 |
| 1,963 | | | | Klepierre | | | 48,274 |
| 2,094 | | | | Unibail | | | 312,832 |
| | | | | | | |
| | | | | | | 401,712 |
| | | | | | | |
| Hong Kong: 0.0% |
| 69,000 | | | | Link Real Estate Investment Trust | | | 114,782 |
| | | | | | | |
| | | | | | | 114,782 |
| | | | | | | |
| Japan: 0.2% |
| 13 | | | | Japan Real Estate Investment Corp. | | | 116,131 |
| 20 | | | | Japan Retail Fund Investment Corp. | | | 86,387 |
| 13 | | | | Nippon Building Fund, Inc. | | | 142,893 |
| 13 | | | | Nomura Real Estate Office Fund, Inc. | | | 84,586 |
| | | | | | | |
| | | | | | | 429,997 |
| | | | | | | |
| Netherlands: 0.0% |
| 1,342 | | | | Corio NV | | | 61,797 |
| | | | | | | |
| | | | | | | 61,797 |
| | | | | | | |
| United Kingdom: 0.2% |
| 11,615 | | | | British Land Co. PLC | | | 93,062 |
| 7,824 | | | | Hammerson PLC | | | 60,609 |
| 12,567 | | | | Land Securities Group PLC | | | 168,955 |
| 5,651 | | | | Liberty International PLC | | | 39,126 |
| 12,722 | | | | Segro PLC | | | 45,355 |
| | | | | | | |
| | | | | | | 407,107 |
| | | | | | | |
| | | | Total Real Estate Investment Trusts
(Cost $4,204,713) | | | 2,262,933 |
| | | | | | | |
| PREFERRED STOCK: 0.4% |
| Germany: 0.4% |
| 2,196 | | | | Bayerische Motoren Werke AG | | | 43,513 |
| 2,669 | | | | Fresenius AG | | | 154,145 |
| | | | | | | |
| Shares | | | | | | Value |
| | | | | | | |
| Germany: (continued) |
| 6,885 | | | | Henkel KGaA - Vorzug | | | 219,231 |
| 2,574 | | | | Porsche AG | | $ | 204,932 |
| 1,150 | | | | RWE AG | | | 87,405 |
| 4,033 | | | | Volkswagen AG | | | 222,194 |
| | | | | | | |
| | | | Total Preferred Stock
(Cost $1,787,199) | | | 931,420 |
| | | | | | | |
| RIGHTS: 0.0% | | | |
| Belgium: 0.0% | | | |
| 59,263 | | | | Forits | | | — |
| | | | | | | |
| | | | | | | — |
| | | | | | | |
| Germany: 0.0% | | | |
| 2,339 | | | | Deutsche Postbank AG | | | 11 |
| | | | | | | |
| | | | | | | 11 |
| | | | | | | |
| Singapore: 0.0% | | | |
| 18,500 | | | | DBS Group Holdings Ltd. | | | 38,544 |
| | | | | | | |
| | | | | | | 38,544 |
| | | | | | | |
| | | | Total Rights
(Cost $—) | | | 38,555 |
| | | | | | | |
| | | | Total Long-Term Investments
(Cost $371,897,753) | | | 233,071,359 |
| | | | | | | |
| | | | | | | | | | |
| SHORT-TERM INVESTMENTS: 0.7% | | | | |
| Affiliated Mutual Fund: 0.7% | | | | |
| 1,546,000 | | S | | ING Institutional Prime Money Market Fund - Class I | | | | | | 1,546,000 |
| | | | | | | | | | |
| | | | Total Short-Term Investments
(Cost $1,546,000) | | | | | | 1,546,000 |
| | | | | | | | | | |
| | | | Total Investments in Securities
(Cost $373,443,753)* | | 95.9 | % | | $ | 234,617,359 |
| | | | Other Assets and
Liabilities - Net | | 4.1 | | �� | | 10,143,936 |
| | | | | | | | | | |
| | | | Net Assets | | 100.0 | % | | $ | 244,761,295 |
| | | | | | | | | | |
| @ | Non-income producing security |
| ADR | American Depositary Receipt |
| S | All or a portion of this security is segregated to cover collateral requirements for applicable futures, options, swaps, foreign forward currency contracts and/or when-issued or delayed-delivery securities. |
| ** | Investment in affiliate |
| X | Fair value determined by ING Funds Valuation Committee appointed by the Funds’ Board of Directors/Trustees. |
| * | Cost for federal income tax purposes is $375,107,109. |
| | | | |
Net unrealized depreciation consists of: | |
Gross Unrealized Appreciation | | $ | 2,694,733 | |
Gross Unrealized Depreciation | | | (143,184,483 | ) |
| | | | |
Net Unrealized Depreciation | | $ | (140,489,750 | ) |
| | | | |
See Accompanying Notes to Financial Statements
90
| | |
| ING INTERNATIONAL INDEX PORTFOLIO | | PORTFOLIO OF INVESTMENTS ASOF DECEMBER 31, 2008 (CONTINUED) |
| | | |
Industry | | Percentage of
Net Assets | |
Advertising | | 0.1 | % |
Aerospace/Defense | | 0.6 | |
Agriculture | | 1.2 | |
Airlines | | 0.3 | |
Apparel | | 0.3 | |
Auto Manufacturers | | 3.2 | |
Auto Parts & Equipment | | 0.8 | |
Banks | | 12.7 | |
Beverages | | 1.5 | |
Biotechnology | | 0.2 | |
Building Materials | | 1.1 | |
Chemicals | | 3.0 | |
Commercial Services | | 1.1 | |
Computers | | 0.4 | |
Cosmetics/Personal Care | | 0.6 | |
Distribution/Wholesale | | 0.9 | |
Diversified | | 0.5 | |
Diversified Financial Services | | 1.1 | |
Electric | | 5.3 | |
Electrical Components & Equipment | | 0.9 | |
Electronics | | 1.3 | |
Energy - Alternate Sources | | 0.2 | |
Engineering & Construction | | 1.3 | |
Entertainment | | 0.3 | |
Environmental Control | | 0.0 | |
Food | | 5.4 | |
Food Service | | 0.2 | |
Forest Products & Paper | | 0.3 | |
Gas | | 1.4 | |
Hand/Machine Tools | | 0.2 | |
Healthcare - Products | | 0.7 | |
Healthcare - Services | | 0.1 | |
Holding Companies - Diversified | | 0.7 | |
Home Builders | | 0.1 | |
Home Furnishings | | 0.7 | |
Household Products/Wares | | 0.5 | |
Insurance | | 4.9 | |
Internet | | 0.2 | |
Investment Companies | | 0.2 | |
Iron/Steel | | 1.2 | |
Leisure Time | | 0.3 | |
Lodging | | 0.2 | |
Machinery - Construction & Mining | | 0.3 | |
Machinery - Diversified | | 1.0 | |
Media | | 1.4 | |
Metal Fabricate/Hardware | | 0.2 | |
Mining | | 2.7 | |
Miscellaneous Manufacturing | | 1.3 | |
Office Property | | 0.1 | |
Office/Business Equipment | | 0.6 | |
Oil & Gas | | 7.9 | |
Oil & Gas Services | | 0.2 | |
Packaging & Containers | | 0.1 | |
Pharmaceuticals | | 7.8 | |
Real Estate | | 1.4 | |
Retail | | 1.7 | |
Semiconductors | | 0.3 | |
| | | |
Industry | | Percentage of
Net Assets | |
Shipbuilding | | 0.0 | % |
Shopping Centers | | 0.3 | |
Software | | 0.6 | |
Telecommunications | | 8.0 | |
Textiles | | 0.2 | |
Toys/Games/Hobbies | | 0.5 | |
Transportation | | 2.1 | |
Venture Capital | | 0.0 | |
Water | | 0.3 | |
Short-Term Investments | | 0.7 | |
Other Assets and Liabilities - Net | | 4.1 | |
| | | |
Net Assets | | 100.0 | % |
| | | |
The following table summarizes the inputs used as of December 31, 2008 in determining the Portfolio’s investments at fair value for purposes of SFAS 157:
| | | | | | |
| | | Investments in
Securities | | Other Financial
Instruments* |
Level 1 — Quoted Prices | | $ | 6,906,758 | | $ | 191,320 |
Level 2 — Other Significant Observable Inputs | | | 227,436,338 | | | — |
Level 3 — Significant Unobservable Inputs | | | 274,263 | | | — |
| | | | | | |
Total | | $ | 234,617,359 | | $ | 191,320 |
| | | | | | |
“Fair value” for purposes of SFAS 157 is different from “fair value” as used in the 1940 Act. The former generally implies market value, and can include market quotations as a source of value, and the latter refers to determinations of actual value in absence of available market quotations.
| * | Other financial instruments may include forward foreign currency contracts, futures, swaps, and written options. Forward foreign currency contracts and futures are reported at their unrealized gain/loss at year end. Swaps and written options are reported at their market value at year end. |
A roll forward of fair value measurements using significant unobservable inputs (Level 3) for the year ended December 31, 2008, was as follows:
| | | | | | |
| | | Investments in
Securities | | Other Financial
Instruments* |
Beginning Balance at 12/31/07 | | $ | — | | $ | — |
Net Purchases/(Sales) | | | — | | | — |
Accrued Discounts/(Premiums) | | | — | | | — |
Total Realized Gain/(Loss) | | | — | | | — |
Total Unrealized Appreciation/(Depreciation) | | | — | | | — |
Net Transfers In/(Out) of Level 3 | | | 274,263 | | | — |
| | | | | | |
Ending Balance at 12/31/08 | | $ | 274,263 | | $ | — |
| | | | | | |
| * | Other financial instruments may include forward foreign currency contracts, futures, swaps, and written options. Forward foreign currency contracts and futures are reported |
See Accompanying Notes to Financial Statements
91
| | |
| ING INTERNATIONAL INDEX PORTFOLIO | | PORTFOLIO OF INVESTMENTS ASOF DECEMBER 31, 2008 (CONTINUED) |
| | at their unrealized gain/loss at year end. Swaps and written options are reported at their market value at year end. |
For the year ended December 31, 2008, total change in unrealized gain (loss) on Level 3 securities included in the change in net assets
was $11,176. Total unrealized gain (loss) for all securities (including Level 1 and Level 2) can be found on the accompanying Statement of Operations.
ING International Index Portfolio Open Futures Contracts on December 31, 2008
| | | | | | | | |
Contract Description | | Number
of
Contracts | | Expiration
Date | | Unrealized
Appreciation/
(Depreciation) | |
Long Contracts | | | | | | | | |
CAC40 10 Euro | | 8 | | 01/16/09 | | $ | 484 | |
DAX Index | | 2 | | 03/20/09 | | | 6,458 | |
Dow Jones Euro STOXX 50 | | 74 | | 03/20/09 | | | 19,395 | |
FTSE 100 Index | | 35 | | 03/20/09 | | | 64,256 | |
Hang Seng Stock Index | | 1 | | 01/29/09 | | | (734 | ) |
IBEX 35 Index | | 2 | | 01/16/09 | | | 1,445 | |
OMXS30 Index | | 60 | | 01/23/09 | | | (399 | ) |
S&P ASX 200 Index (SPI) | | 11 | | 03/19/09 | | | 31,503 | |
S&P/MIB Index | | 1 | | 03/20/09 | | | 1,534 | |
Tokyo Price Index (TOPIX) | | 17 | | 03/12/09 | | | 67,378 | |
| | | | | | | | |
| | | | | | $ | 191,320 | |
| | | | | | | | |
See Accompanying Notes to Financial Statements
92
| | |
ING RUSSELL™ GLOBAL LARGE CAP INDEX
85% PORTFOLIO | | PORTFOLIO OF INVESTMENTS ASOF DECEMBER 31, 2008 |
| | | | | | | |
| Shares | | | | | | Value |
| | | | | | | |
| COMMON STOCK: 79.9% | | | |
| Australia: 2.1% | | | |
| 1,172 | | | | AGL Energy Ltd. | | $ | 12,495 |
| 2,635 | | | | Amcor Ltd. | | | 10,708 |
| 5,581 | | | | AMP Ltd. | | | 21,279 |
| 1,800 | | | | Aquarius Platinum Ltd. | | | 4,764 |
| 1,526 | | | | Aristocrat Leisure Ltd. | | | 4,152 |
| 2,623 | | | | Asciano Group | | | 2,792 |
| 520 | | | | ASX Ltd. | | | 12,155 |
| 4,354 | | | | Australia & New Zealand Banking Group Ltd. | | | 47,007 |
| 6,213 | | | | BHP Billiton Ltd. | | | 131,990 |
| 1,026 | | | | Billabong International Ltd. | | | 5,634 |
| 2,305 | | | | Boral Ltd. | | | 7,465 |
| 2,219 | | | | Brambles Ltd. | | | 11,529 |
| 2,389 | | | | Commonwealth Bank of Australia | | | 49,155 |
| 1,300 | | | | Crown Ltd. | | | 5,445 |
| 1,103 | | | | CSL Ltd. | | | 26,011 |
| 3,391 | | @ | | Fortescue Metals Group Ltd. | | | 4,624 |
| 4,904 | | | | Foster’s Group Ltd. | | | 18,861 |
| 3,180 | | | | Incitec Pivot Ltd. | | | 5,574 |
| 3,439 | | | | Insurance Australia Group | | | 9,372 |
| 502 | | | | Leighton Holdings Ltd. | | | 9,754 |
| 4,063 | | | | Macquarie Airports Management Ltd. | | | 6,839 |
| 397 | | | | Macquarie Group Ltd. | | | 8,057 |
| 6,483 | | | | Macquarie Infrastructure Group | | | 7,771 |
| 3,884 | | | | National Australia Bank Ltd. | | | 57,101 |
| 716 | | | | Newcrest Mining Ltd. | | | 17,043 |
| 3,472 | | | | OneSteel Ltd. | | | 6,004 |
| 1,400 | | | | Orica Ltd. | | | 13,739 |
| 1,954 | | | | Origin Energy Ltd. | | | 22,038 |
| 9,315 | | X | | Oxiana Ltd. | | | 3,572 |
| 3,580 | | @ | | Paladin Resources Ltd. | | | 6,291 |
| 3,298 | | | | Qantas Airways Ltd. | | | 6,076 |
| 2,201 | | | | QBE Insurance Group Ltd. | | | 39,779 |
| 3,028 | | @, X | | Queensland Gas Co., Ltd. | | | 12,139 |
| 491 | | | | Rio Tinto Ltd. | | | 13,158 |
| 1,900 | | | | Santos Ltd. | | | 19,908 |
| 540 | | | | Sims Group Ltd. | | | 6,609 |
| 1,573 | | | | Sonic Healthcare Ltd. | | | 16,026 |
| 3,100 | | | | Suncorp-Metway Ltd. | | | 18,272 |
| 2,071 | | | | TABCORP Holdings Ltd. | | | 10,133 |
| 7,045 | | | | Telstra Corp., Ltd. | | | 18,860 |
| 2,754 | | | | Toll Holdings Ltd. | | | 11,899 |
| 3,222 | | @ | | Transurban Group | | | 12,188 |
| 930 | | | | Wesfarmers Ltd. | | | 11,738 |
| 5,341 | | | | Westpac Banking Corp. | | | 64,058 |
| 802 | | | | Woodside Petroleum Ltd. | | | 20,754 |
| 2,608 | | | | Woolworths Ltd. | | | 48,629 |
| 541 | | | | WorleyParsons Ltd. | | | 5,397 |
| | | | | | | |
| | | | | | | 884,844 |
| | | | | | | |
| Austria: 0.1% | | | |
| 335 | | | | Andritz AG | | | 8,849 |
| 596 | | | | Erste Bank der Oesterreichischen Sparkassen AG | | | 13,877 |
| 500 | | | | Evn AG | | | 7,787 |
| 553 | | | | OMV AG | | | 14,694 |
| 180 | | | | Raiffeisen International Bank Holding AG | | | 5,004 |
| | | | | | | |
| | | | | | | 50,211 |
| | | | | | | |
| | | | | | | |
| Shares | | | | | | Value |
| | | | | | | |
| Barbados: 0.1% | | | |
| 200 | | | | Everest Re Group Ltd. | | $ | 15,228 |
| 800 | | @ | | Nabors Industries Ltd. | | | 9,576 |
| | | | | | | |
| | | | | | | 24,804 |
| | | | | | | |
| Belgium: 0.3% | | | |
| 1,170 | | @ | | Anheuser-Busch InBev NV | | | 27,171 |
| 720 | | @ | | Anheuser-Busch InBev NV - VVPR Share | | | 4 |
| 554 | | | | Belgacom SA | | | 21,179 |
| 351 | | | | Delhaize Group | | | 21,698 |
| 947 | | | | Dexia | | | 4,294 |
| 3 | | | | Distrigaz | | | 28,086 |
| 3,682 | | | | Fortis | | | 4,855 |
| 219 | | | | Kbc Ancora | | | 3,799 |
| 392 | | | | KBC Groep NV | | | 11,780 |
| 285 | | | | UCB SA | | | 9,296 |
| 486 | | | | Umicore | | | 9,604 |
| | | | | | | |
| | | | | | | 141,766 |
| | | | | | | |
| Bermuda: 0.5% | | | |
| 1,500 | | | | Accenture Ltd. | | | 49,185 |
| 200 | | @ | | Arch Capital Group Ltd. | | | 14,020 |
| 200 | | @ | | Central European Media Enterprises Ltd. | | | 4,344 |
| 700 | | | | Covidien Ltd. | | | 25,368 |
| 400 | | @ | | Foster Wheeler Ltd. | | | 9,352 |
| 1,000 | | | | Ingersoll-Rand Co. | | | 17,350 |
| 300 | | | | Lazard Ltd. | | | 8,922 |
| 200 | | | | PartnerRe Ltd. | | | 14,254 |
| 300 | | | | RenaissanceRe Holdings Ltd. | | | 15,468 |
| 800 | | | | SeaDrill Ltd. ADR | | | 6,520 |
| 900 | | | | Tyco Electronics Ltd. | | | 14,589 |
| 900 | | | | Tyco International Ltd. | | | 19,440 |
| | | | | | | |
| | | | | | | 198,812 |
| | | | | | | |
| Brazil: 0.3% | | | |
| 1,500 | | | | Banco Bradesco SA | | | 12,858 |
| 1,800 | | | | Banco do Brasil SA | | | 11,331 |
| 3,700 | | | | BM&F BOVESPA SA | | | 9,551 |
| 800 | | | | Centrais Eletricas Brasileiras SA | | | 8,882 |
| 1,000 | | | | Cia Siderurgica Nacional SA | | | 12,436 |
| 2,500 | | | | CIA Vale do Rio Doce | | | 29,685 |
| 700 | | | | CPFL Energia SA | | | 9,050 |
| 500 | | | | Perdigao SA | | | 6,377 |
| 3,900 | | | | Petroleo Brasileiro SA | | | 45,974 |
| | | | | | | |
| | | | | | | 146,144 |
| | | | | | | |
| Canada: 2.7% | | | |
| 200 | | | | Agrium, Inc. | | | 6,719 |
| 800 | | | | ARC Energy Trust | | | 13,026 |
| 800 | | | | Bank of Montreal | | | 20,251 |
| 1,700 | | | | Bank of Nova Scotia | | | 45,870 |
| 1,500 | | | | Barrick Gold Corp. | | | 54,326 |
| 600 | | | | BCE, Inc. | | | 12,214 |
| 2,200 | | | | Bombardier, Inc. - Class B | | | 7,930 |
| 600 | | | | Bonavista Energy Trust | | | 8,262 |
| 1,200 | | | | Brookfield Asset Management, Inc. - Class A | | | 18,032 |
| 700 | | | | Brookfield Properties Co. | | | 5,273 |
| 600 | | | | Canadian Imperial Bank of Commerce | | | 24,831 |
| 700 | | | | Canadian National Railway Co. | | | 25,392 |
| 1,000 | | | | Canadian Natural Resources Ltd. | | | 39,490 |
| 500 | | | | Canadian Oil Sands Trust | | | 8,546 |
| 400 | | | | Canadian Utilities Ltd. | | | 13,123 |
| 1,400 | | @ | | CGI Group, Inc. - Class A | | | 10,887 |
See Accompanying Notes to Financial Statements
93
| | |
ING RUSSELL™ GLOBAL LARGE CAP INDEX
85% PORTFOLIO | | PORTFOLIO OF INVESTMENTS ASOF DECEMBER 31, 2008 (CONTINUED) |
| | | | | | | |
| Shares | | | | | | Value |
| | | | | | | |
| Canada: (continued) | | | |
| 500 | | | | Crescent Point Energy Trust | | $ | 9,757 |
| 3,600 | | @ | | Domtar Corp. | | | 6,012 |
| 700 | | | | Enbridge, Inc. | | | 22,432 |
| 1,400 | | | | EnCana Corp. | | | 64,596 |
| 500 | | | | Enerplus Resources Fund | | | 9,704 |
| 900 | | | | Ensign Energy Services, Inc. | | | 9,638 |
| 600 | | | | Finning International, Inc. | | | 6,926 |
| 200 | | | | First Quantum Minerals Ltd. | | | 2,853 |
| 400 | | @ | | Gildan Activewear, Inc. | | | 4,598 |
| 1,200 | | | | GoldCorp, Inc. | | | 37,317 |
| 700 | | | | Great-West Lifeco, Inc. | | | 11,738 |
| 900 | | | | Harvest Energy Trust | | | 7,655 |
| 600 | | | | Husky Energy, Inc. | | | 15,004 |
| 1,000 | | | | Imperial Oil Ltd. | | | 33,204 |
| 500 | | | | Industrial Alliance Insurance | | | 9,441 |
| 200 | | | | Inmet Mining Corp. | | | 3,172 |
| 1,300 | | @ | | Ivanhoe Mines Ltd. | | | 3,444 |
| 1,400 | | | | Kinross Gold Corp. | | | 25,516 |
| 2,980 | | | | Manulife Financial Corp. | | | 50,210 |
| 700 | | | | Nexen, Inc. | | | 12,163 |
| 1,100 | | | | Pengrowth Energy Trust | | | 8,331 |
| 900 | | | | Penn West Energy Trust | | | 9,893 |
| 900 | | | | Petro-Canada | | | 19,480 |
| 650 | | | | Potash Corp. of Saskatchewan | | | 47,145 |
| 800 | | | | Power Corp. of Canada | | | 14,529 |
| 1,700 | | | | Provident Energy Trust | | | 7,367 |
| 800 | | @ | | Research In Motion Ltd. | | | 32,078 |
| 800 | | | | Ritchie Brothers Auctioneers, Inc. | | | 17,017 |
| 1,000 | | | | Rogers Communications, Inc. - Class B (Canadian Denominated Security) | | | 29,640 |
| 2,390 | | | | Royal Bank of Canada | | | 69,890 |
| 500 | | | | Saputo, Inc. | | | 8,979 |
| 800 | | | | Shaw Communications, Inc. - Class B | | | 14,004 |
| 1,900 | | | | Sherritt International Corp. | | | 4,864 |
| 500 | | | | Shoppers Drug Mart Corp. | | | 19,461 |
| 900 | | | | Sun Life Financial, Inc. | | | 20,734 |
| 1,400 | | | | Suncor Energy, Inc. | | | 26,900 |
| 1,700 | | | | Talisman Energy, Inc. | | | 16,773 |
| 400 | | | | Teck Cominco Ltd. - Class A | | | 2,352 |
| 973 | | | | Teck Cominco Ltd. - Class B | | | 4,745 |
| 400 | | | | TELUS Corp. | | | 12,044 |
| 600 | | | | Tim Hortons, Inc. | | | 17,304 |
| 1,480 | | | | Toronto Dominion Bank | | | 52,091 |
| 300 | | | | Transalta Corp. | | | 5,905 |
| 1,100 | | | | TransCanada Corp. | | | 29,556 |
| 400 | | | | TSX Group, Inc. | | | 8,162 |
| 4,200 | | @ | | UTS Energy Corp. | | | 2,722 |
| 1,500 | | | | Yamana Gold, Inc. (Canadian Denominated Security) | | | 11,482 |
| | | | | | | |
| | | | | | | 1,173,000 |
| | | | | | | |
| Chile: 0.0% |
| 800 | | | | Empresa Nacional de Electricidad S.A. | | | 916 |
| 173 | | | | Enersis SA | | | 45 |
| 1,890 | | | | S.A.C.I. Falabella, SA | | | 4,983 |
| | | | | | | |
| | | | | | | 5,944 |
| | | | | | | |
| China: 0.9% |
| 18,000 | | | | Aluminum Corp. of China Ltd. | | | 9,705 |
| 12,000 | | | | Angang New Steel Co., Ltd. | | | 13,581 |
| 67,000 | | | | Bank of China Ltd. | | | 18,460 |
| 16,000 | | | | Beijing Capital International Airport Co., Ltd. | | | 8,107 |
| | | | | | | |
| Shares | | | | | | Value |
| | | | | | | |
| China: (continued) |
| 8,000 | | | | China Coal Energy Co. - Shares H | | $ | 6,465 |
| 69,000 | | | | China Construction Bank | | | 38,390 |
| 10,500 | | | | China COSCO Holdings Co., Ltd. | | | 7,397 |
| 11,000 | | | | China Life Insurance Co., Ltd. | | | 33,797 |
| 10,000 | | | | China Oilfield Services Ltd. | | | 8,164 |
| 32,000 | | | | China Petroleum & Chemical Corp. | | | 19,669 |
| 6,000 | | | | China Shenhua Energy Co., Ltd. | | | 12,863 |
| 6,000 | | | | China Shipping Development Co., Ltd. | | | 6,046 |
| 36,000 | | | | China Telecom Corp., Ltd. | | | 13,609 |
| 22,000 | | | | Datang International Power Generation Co., Ltd. | | | 11,742 |
| 26,000 | | | | Fujian Zijin Mining Industry Co., Ltd. | | | 15,767 |
| 20,000 | | | | Huaneng Power International, Inc. | | | 14,574 |
| 65,000 | | | | Industrial and Commercial Bank of China Ltd. | | | 34,510 |
| 10,000 | | | | Jiangxi Copper Co., Ltd. | | | 7,431 |
| 10,000 | | | | Parkson Retail Group Ltd. | | | 11,448 |
| 32,000 | | | | PetroChina Co., Ltd. | | | 28,437 |
| 22,000 | | @ | | PICC Property & Casualty Insurance | | | 11,866 |
| 2,500 | | | | Ping An Insurance Group Co. of China Ltd. | | | 12,286 |
| 300 | | @ | | Suntech Power Holdings Co., Ltd. ADR | | | 3,510 |
| 2,000 | | | | Tencent Holdings Ltd. | | | 12,995 |
| 10,000 | | | | Tingyi Cayman Islands Holding Corp. | | | 11,631 |
| 36,000 | | | | Want Want China Holdings Ltd. | | | 14,972 |
| 12,000 | | | | Yanzhou Coal Mining Co., Ltd. | | | 8,943 |
| | | | | | | |
| | | | | | | 396,365 |
| | | | | | | |
| Czech Republic: 0.0% |
| 300 | | | | CEZ A/S | | | 12,763 |
| | | | | | | |
| | | | | | | 12,763 |
| | | | | | | |
| Denmark: 0.3% |
| 4 | | | | AP Moller - Maersk A/S - Class A | | | 21,891 |
| 150 | | | | Coloplast A/S | | | 10,373 |
| 200 | | | | D/S Norden | | | 7,056 |
| 1,000 | | | | DSV A/S | | | 10,883 |
| 200 | | @ | | Genmab A/S | | | 7,764 |
| 675 | | | | Novo-Nordisk A/S | | | 34,819 |
| 175 | | | | Novozymes A/S | | | 14,035 |
| 250 | | | | TDC A/S | | | 10,878 |
| 350 | | @ | | Vestas Wind Systems A/S | | | 20,596 |
| 250 | | @ | | William Demant Holding | | | 10,467 |
| | | | | | | |
| | | | | | | 148,762 |
| | | | | | | |
| Finland: 0.6% |
| 901 | | | | Elisa OYJ | | | 15,685 |
| 737 | | | | Fortum OYJ | | | 16,019 |
| 631 | | | | Kone OYJ | | | 14,149 |
| 461 | | | | Metso OYJ | | | 5,650 |
| 687 | | | | Neste Oil OYJ | | | 10,341 |
| 7,006 | | | | Nokia OYJ | | | 109,941 |
| 773 | | | | Orion OYJ | | | 13,147 |
| 611 | | | | Rautaruukki OYJ | | | 10,671 |
| 1,375 | | | | Sampo OYJ | | | 26,025 |
| 1,896 | | | | UPM-Kymmene OYJ | | | 24,304 |
| 369 | | | | Wartsila OYJ | | | 11,150 |
| | | | | | | |
| | | | | | | 257,082 |
| | | | | | | |
| France: 3.6% |
| 384 | | | | Accor SA | | | 18,916 |
| 569 | | | | Air France-KLM | | | 7,338 |
| 351 | | | | Air Liquide | | | 32,144 |
| 3,889 | | @ | | Alcatel SA | | | 8,418 |
See Accompanying Notes to Financial Statements
94
| | |
ING RUSSELL™ GLOBAL LARGE CAP INDEX
85% PORTFOLIO | | PORTFOLIO OF INVESTMENTS ASOF DECEMBER 31, 2008 (CONTINUED) |
| | | | | | | |
| Shares | | | | | | Value |
| | | | | | | |
| France: (continued) |
| 346 | | | | Alstom | | $ | 20,620 |
| 2,993 | | | | AXA SA | | | 67,180 |
| 1,595 | | | | BNP Paribas | | | 68,847 |
| 266 | | | | Bourbon SA | | | 6,727 |
| 800 | | | | Bouygues SA | | | 33,939 |
| 423 | | | | Capgemini SA | | | 16,356 |
| 913 | | | | Carrefour SA | | | 35,291 |
| 207 | | | | Casino Guichard Perrachon SA | | | 15,776 |
| 200 | | | | Christian Dior SA | | | 11,308 |
| 922 | | | | Cie de Saint-Gobain | | | 43,565 |
| 500 | | | | Cie Generale D’Optique Essilor International SA | | | 23,487 |
| 443 | | @ | | Compagnie Generale de Geophysique SA | | | 6,631 |
| 328 | | | | Compagnie Generale des Etablissements Michelin | | | 17,329 |
| 1,521 | | | | Credit Agricole SA | | | 17,084 |
| 313 | | | | Dassault Systemes SA | | | 14,190 |
| 479 | | | | Electricite de France | | | 27,859 |
| 696 | | @ | | Eutelsat Communications | | | 16,439 |
| 3,351 | | | | France Telecom SA | | | 93,401 |
| 2,174 | | | | Gaz de France | | | 107,911 |
| 923 | | | | Groupe Danone | | | 55,767 |
| 139 | | | | Hermes International | | | 19,460 |
| 259 | | | | Lafarge SA | | | 15,841 |
| 332 | | | | L’Oreal SA | | | 28,974 |
| 452 | | | | LVMH Moet Hennessy Louis Vuitton SA | | | 30,292 |
| 2,834 | | | | Natixis | | | 5,027 |
| 154 | | | | Neopost SA | | | 13,974 |
| 161 | | | | Nexans SA | | | 9,641 |
| 263 | | | | Pernod-Ricard SA | | | 19,538 |
| 197 | | | | PPR | | | 12,899 |
| 218 | | | | Remy Cointreau SA | | | 9,049 |
| 309 | | | | Renault SA | | | 8,064 |
| 809 | | | | Rhodia SA | | | 5,133 |
| 989 | | | | Safran SA | | | 13,353 |
| 1,804 | | | | Sanofi-Aventis | | | 115,389 |
| 373 | | | | Schneider Electric SA | | | 27,771 |
| 956 | | | | Societe Generale | | | 48,501 |
| 295 | | | | Sodexho Alliance SA | | | 16,395 |
| 823 | | @ | | Suez Environnement SA | | | 13,899 |
| 286 | | | | Thales SA | | | 11,979 |
| 3,839 | | | | Total SA | | | 211,065 |
| 266 | | | | Valeo SA | | | 3,963 |
| 692 | | | | Veolia Environnement | | | 21,828 |
| 647 | | | | Vinci SA | | | 27,303 |
| 2,140 | | | | Vivendi | | | 69,751 |
| 178 | | | | Wendel Investissement | | | 8,905 |
| 233 | | | | Zodiac SA | | | 8,508 |
| | | | | | | |
| | | | | | | 1,543,025 |
| | | | | | | |
| Germany: 3.0% |
| 746 | | | | Adidas AG | | | 28,385 |
| 809 | | | | Allianz AG | | | 85,963 |
| 85 | | | | AMB Generali Holding AG | | | 8,726 |
| 116 | | | | Axel Springer AG | | | 8,206 |
| 1,755 | | | | BASF AG | | | 67,721 |
| 1,382 | | | | Bayer AG | | | 80,217 |
| 1,200 | | | | Bayerische Motoren Werke AG | | | 37,460 |
| 294 | | | | Celesio AG | | | 7,914 |
| 925 | | | | Commerzbank AG | | | 8,908 |
| 264 | | | | Continental AG | | | 10,491 |
| 1,658 | | | | DaimlerChrysler AG | | | 62,463 |
| 802 | | | | Deutsche Bank AG | | | 31,978 |
| | | | | | | |
| Shares | | | | | | Value |
| | | | | | | |
| Germany: (continued) |
| 312 | | | | Deutsche Boerse AG | | $ | 22,573 |
| 1,400 | | | | Deutsche Post AG | | | 23,470 |
| 5,380 | | | | Deutsche Telekom AG | | | 81,190 |
| 3,553 | | | | E.ON AG | | | 137,456 |
| 200 | | | | EnBW Energie Baden-Wuerttemberg AG | | | 10,532 |
| 539 | | | | Fresenius Medical Care AG & Co. KGaA | | | 25,009 |
| 496 | | | | Henkel KGaA | | | 13,101 |
| 194 | | | | Hochtief AG | | | 9,995 |
| 742 | | | | Hypo Real Estate Holding AG | | | 3,225 |
| 2,249 | | @ | | Infineon Technologies AG | | | 2,999 |
| 274 | | | | K+S AG | | | 15,825 |
| 217 | | | | Linde AG | | | 18,456 |
| 281 | | | | MAN AG | | | 15,994 |
| 122 | | | | Merck KGaA | | | 10,916 |
| 455 | | | | MTU Aero Engines Holding AG | | | 12,310 |
| 337 | | | | Muenchener Rueckversicherungs AG | | | 51,635 |
| 202 | | @ | | Q-Cells AG | | | 7,521 |
| 489 | | | | Rhoen Klinikum AG | | | 12,149 |
| 690 | | | | RWE AG | | | 60,928 |
| 162 | | | | Salzgitter AG | | | 12,592 |
| 1,468 | | | | SAP AG | | | 52,858 |
| 1,718 | | | | Siemens AG | | | 129,607 |
| 278 | | | | Solarworld AG | | | 6,160 |
| 1,279 | | | | ThyssenKrupp AG | | | 36,093 |
| 254 | | | | Volkswagen AG | | | 88,380 |
| 72 | | | | Wacker Chemie AG | | | 7,746 |
| | | | | | | |
| | | | | | | 1,307,152 |
| | | | | | | |
| Greece: 0.1% |
| 800 | | @ | | Emporiki Bank of Greece SA | | | 6,347 |
| 1,201 | | | | Intralot SA - Integrated Lottery Systems & Services | | | 5,020 |
| 953 | | | | National Bank of Greece SA | | | 17,698 |
| 922 | | | | Piraeus Bank SA | | | 8,230 |
| 600 | | | | Public Power Corp. | | | 9,643 |
| | | | | | | |
| | | | | | | 46,938 |
| | | | | | | |
| Guernsey: 0.0% |
| 700 | | @ | | Amdocs Ltd. | | | 12,803 |
| | | | | | | |
| | | | | | | 12,803 |
| | | | | | | |
| Hong Kong: 1.1% |
| 20,000 | | | | Agile Property Holdings Ltd. | | | 10,563 |
| 3,000 | | | | Cheung Kong Holdings Ltd. | | | 28,619 |
| 8,000 | | | | China Everbright Ltd. | | | 9,945 |
| 2,000 | | | | China Merchants Holdings International Co., Ltd. | | | 3,906 |
| 9,000 | | | | China Mobile Ltd. | | | 91,315 |
| 8,000 | | | | China Overseas Land & Investment Ltd. | | | 11,233 |
| 6,000 | | | | China Resources Enterprise | | | 10,551 |
| 6,000 | | | | China Resources Power Holdings Co. | | | 11,666 |
| 20,294 | | | | China Unicom Ltd. | | | 24,352 |
| 3,000 | | | | CLP Holdings Ltd. | | | 20,396 |
| 27,000 | | | | CNOOC Ltd. | | | 25,682 |
| 8,000 | | | | Cosco Pacific Ltd. | | | 8,225 |
| 2,700 | | | | Dairy Farm International Holdings Ltd. | | | 11,570 |
| 2,900 | | | | Esprit Holdings Ltd. | | | 16,525 |
| 1,300 | | | | Hang Seng Bank Ltd. | | | 17,163 |
| 9,000 | | | | Hong Kong & China Gas | | | 13,648 |
| 2,000 | | | | Hong Kong Exchanges and Clearing Ltd. | | | 19,202 |
| 3,500 | | | | HongKong Electric Holdings | | | 19,705 |
| 4,000 | | | | Hongkong Land Holdings Ltd. | | | 9,920 |
| 4,000 | | | | Hopewell Holdings | | | 13,271 |
See Accompanying Notes to Financial Statements
95
| | |
ING RUSSELL™ GLOBAL LARGE CAP INDEX
85% PORTFOLIO | | PORTFOLIO OF INVESTMENTS ASOF DECEMBER 31, 2008 (CONTINUED) |
| | | | | | | |
| Shares | | | | | | Value |
| | | | | | | |
| Hong Kong: (continued) |
| 4,000 | | | | Hutchison Whampoa Ltd. | | $ | 20,193 |
| 4,000 | | | | Hysan Development Co., Ltd. | | | 6,504 |
| 500 | | | | Jardine Strategic Holdings Ltd. | | | 5,220 |
| 4,000 | | | | Li & Fung Ltd. | | | 6,913 |
| 26,000 | | | | PCCW Ltd. | | | 12,483 |
| 3,000 | | | | Sun Hung Kai Properties Ltd. | | | 25,244 |
| 6,000 | | | | Wharf Holdings Ltd. | | | 16,609 |
| | | | | | | |
| | | | | | | 470,623 |
| | | | | | | |
| Hungary: 0.1% |
| 200 | | | | Mol Magyar Olaj- es Gazipari Rt | | | 10,398 |
| 500 | | @ | | OTP Bank Nyrt | | | 7,592 |
| 100 | | | | Richter Gedeon Nyrt | | | 14,975 |
| | | | | | | |
| | | | | | | 32,965 |
| | | | | | | |
| Indonesia: 0.1% |
| 27,500 | | | | Bank Rakyat Indonesia | | | 11,542 |
| 38,500 | | | | Bumi Resources Tbk PT | | | 3,214 |
| 43,500 | | | | Perusahaan Gas Negara PT | | | 7,423 |
| 28,500 | | | | Telekomunikasi Indonesia Tbk PT | | | 18,041 |
| | | | | | | |
| | | | | | | 40,220 |
| | | | | | | |
| Ireland: 0.1% |
| 1,664 | | | | Allied Irish Banks PLC | | | 3,980 |
| 2,811 | | | | Anglo Irish Bank Corp. PLC | | | 677 |
| 2,861 | | | | Bank of Ireland - London Exchange | | | 3,400 |
| 1,197 | | | | CRH PLC | | | 30,330 |
| 1,778 | | | | Irish Life & Permanent PLC | | | 3,894 |
| | | | | | | |
| | | | | | | 42,281 |
| | | | | | | |
| Israel: 0.2% |
| 400 | | @ | | Check Point Software Technologies | | | 7,596 |
| 1,481 | | | | Teva Phaemaceutical Industries Ltd. | | | 63,588 |
| | | | | | | |
| | | | | | | 71,184 |
| | | | | | | |
| Italy: 1.2% |
| 759 | | | | ACEA S.p.A. | | | 10,345 |
| 5,001 | | | | AEM S.p.A. | | | 8,991 |
| 1,651 | | | | Alleanza Assicurazioni S.p.A. | | | 13,571 |
| 1,639 | | | | Assicurazioni Generali S.p.A. | | | 45,252 |
| 1,100 | | | | Banca Popolare dell’Emilia Romagna Scrl | | | 15,349 |
| 1,600 | | | | Banca Popolare di Sondrio Scarl | | | 14,912 |
| 845 | | | | Banche Popolari Unite Scpa | | | 12,393 |
| 1,515 | | | | Bulgari S.p.A. | | | 9,654 |
| 378 | | | | Credito Bergamasco S.p.A | | | 12,635 |
| 6,864 | | | | Enel S.p.A. | | | 44,215 |
| 3,806 | | | | ENI S.p.A. | | | 91,586 |
| 1,533 | | | | Fiat S.p.A | | | 10,262 |
| 763 | | | | Finmeccanica S.p.A. | | | 11,818 |
| 504 | | | | Fondiaria-Sai S.p.A. | | | 9,200 |
| 17,699 | | | | Intesa Sanpaolo S.p.A. | | | 64,295 |
| 624 | | | | Luxottica Group S.p.A. | | | 11,414 |
| 6,467 | | | | Parmalat S.p.A | | | 10,849 |
| 533 | | | | Saipem S.p.A. | | | 9,091 |
| 1,783 | | | | Snam Rete Gas S.p.A. | | | 9,960 |
| 15,799 | | | | Telecom Italia S.p.A. | | | 25,992 |
| 17,924 | | | | Telecom Italia S.p.A. RNC | | | 20,408 |
| 20,223 | | | | UniCredito Italiano S.p.A. | | | 51,417 |
| | | | | | | |
| | | | | | | 513,609 |
| | | | | | | |
| Japan: 7.6% |
| 600 | | | | Advantest Corp. | | | 9,781 |
| 1,900 | | | | Aeon Co., Ltd. | | | 19,134 |
| 1,000 | | | | Ajinomoto Co., Inc. | | | 10,914 |
| | | | | | | |
| Shares | | | | | | Value |
| | | | | | | |
| Japan: (continued) |
| 3,000 | | | | All Nippon Airways Co., Ltd. | | $ | 11,824 |
| 3,000 | | | | Amada Co., Ltd. | | | 14,591 |
| 1,100 | | | | Asahi Breweries Ltd. | | | 19,019 |
| 1,100 | | | | Astellas Pharma, Inc. | | | 45,026 |
| 500 | | | | Benesse Corp. | | | 21,881 |
| 900 | | | | Bridgestone Corp. | | | 13,500 |
| 1,700 | | | | Canon, Inc. | | | 53,864 |
| 900 | | | | Casio Computer Co., Ltd. | | | 5,679 |
| 5 | | | | Central Japan Railway Co. | | | 43,363 |
| 2,000 | | | | Chiyoda Corp. | | | 11,140 |
| 1,000 | | | | Chubu Electric Power Co., Inc. | | | 30,458 |
| 600 | | | | Chugai Pharmaceutical Co., Ltd. | | | 11,663 |
| 600 | | | | Chugoku Electric Power Co., Inc. | | | 15,798 |
| 1,600 | | | | Citizen Watch Co., Ltd. | | | 5,768 |
| 1,000 | | | | Dai Nippon Printing Co., Ltd. | | | 11,055 |
| 1,100 | | | | Daiichi Sankyo Co., Ltd. | | | 26,013 |
| 300 | | | | Daito Trust Construction Co., Ltd. | | | 15,748 |
| 3,000 | | | | Daiwa Securities Group, Inc. | | | 18,010 |
| 900 | | | | Denso Corp. | | | 15,250 |
| 8 | | X | | East Japan Railway Co. | | | 63,238 |
| 500 | | | | Eisai Co., Ltd. | | | 20,865 |
| 400 | | | | Fanuc Ltd. | | | 28,669 |
| 100 | | | | Fast Retailing Co., Ltd. | | | 14,673 |
| 600 | | | | Fuji Photo Film Co., Ltd. | | | 13,394 |
| 3,000 | | | | Fujikura Ltd. | | | 9,940 |
| 7,000 | | | | Fujitsu Ltd. | | | 34,034 |
| 3,000 | | | | Furukawa Electric Co., Ltd. | | | 14,640 |
| 600 | | | | Hitachi Construction Machinery Co., Ltd. | | | 7,174 |
| 3,000 | | | | Hitachi Ltd. | | | 11,643 |
| 600 | | | | Hokkaido Electric Power Co., Inc. | | | 15,170 |
| 600 | | | | Hokuriku Electric Power Co. | | | 16,973 |
| 2,700 | | | | Honda Motor Co., Ltd. | | | 57,506 |
| 800 | | | | Hoya Corp. | | | 13,973 |
| 500 | | | | Ibiden Co., Ltd. | | | 10,367 |
| 9,000 | | | | Ishikawajima - Harima Heavy Industries Co., Ltd. | | | 11,481 |
| 5,000 | | | | Isuzu Motors Ltd. | | | 6,461 |
| 3,000 | | | | Itochu Corp. | | | 15,135 |
| 2,000 | | | | J Front Retailing Co., Ltd. | | | 8,276 |
| 7,000 | | @ | | Japan Airlines Corp. | | | 16,512 |
| 11 | | | | Japan Tobacco, Inc. | | | 36,436 |
| 1,000 | | | | JFE Holdings, Inc. | | | 26,576 |
| 1,100 | | | | JSR Corp. | | | 12,375 |
| 3,000 | | | | Kajima Corp. | | | 10,567 |
| 1,200 | | | | Kansai Electric Power Co., Inc. | | | 34,759 |
| 1,000 | | | | Kao Corp. | | | 30,375 |
| 7,000 | | | | Kawasaki Heavy Industries Ltd. | | | 14,130 |
| 6 | | | | KDDI Corp. | | | 42,842 |
| 2,000 | | | | Keio Corp. | | | 12,034 |
| 100 | | | | Keyence Corp. | | | 20,551 |
| 4,000 | | | | Kintetsu Corp. | | | 18,402 |
| 2,000 | | | | Kirin Brewery Co., Ltd. | | | 26,591 |
| 1,600 | | | | Komatsu Ltd. | | | 20,410 |
| 1,000 | | | | Konica Minolta Holdings, Inc. | | | 7,781 |
| 3,000 | | | | Kubota Corp. | | | 21,721 |
| 1,500 | | | | Kuraray Co., Ltd. | | | 11,752 |
| 400 | | | | Kurita Water Industries Ltd. | | | 10,813 |
| 500 | | | | Kyocera Corp. | | | 36,199 |
| 1,000 | | | | Kyowa Hakko Kogyo Co., Ltd. | | | 10,498 |
| 600 | | | | Kyushu Electric Power Co., Inc. | | | 15,929 |
| 300 | | | | Lawson, Inc. | | | 17,301 |
| 700 | | | | Makita Corp. | | | 15,662 |
| 4,000 | | | | Marubeni Corp. | | | 15,314 |
See Accompanying Notes to Financial Statements
96
| | |
ING RUSSELL™ GLOBAL LARGE CAP INDEX
85% PORTFOLIO | | PORTFOLIO OF INVESTMENTS ASOF DECEMBER 31, 2008 (CONTINUED) |
| | | | | | | |
| Shares | | | | | | Value |
| | | | | | | |
| Japan: (continued) |
| 3,000 | | | | Matsushita Electric Industrial Co., Ltd. | | $ | 36,877 |
| 3,000 | | | | Minebea Co., Ltd. | | | 10,382 |
| 3,500 | | | | Mitsubishi Chemical Holdings Corp. | | | 15,509 |
| 2,000 | | | | Mitsubishi Corp. | | | 28,328 |
| 4,000 | | | | Mitsubishi Electric Corp. | | | 25,067 |
| 2,000 | | | | Mitsubishi Estate Co., Ltd. | | | 33,038 |
| 6,000 | | | | Mitsubishi Heavy Industries Ltd. | | | 26,816 |
| 16,100 | | | | Mitsubishi UFJ Financial Group, Inc. | | | 101,191 |
| 2,000 | | | | Mitsui & Co., Ltd. | | | 20,561 |
| 6,000 | | | | Mitsui Engineering & Shipbuilding Co., Ltd. | | | 9,796 |
| 1,000 | | | | Mitsui Fudosan Co., Ltd. | | | 16,672 |
| 2,000 | | | | Mitsui OSK Lines Ltd. | | | 12,361 |
| 700 | | | | Mitsui Sumitomo Insurance Group Holdings, Inc. | | | 22,261 |
| 20 | | X | | Mizuho Financial Group, Inc. | | | 59,130 |
| 1,100 | | | | Mori Seiki Co., Ltd. | | | 8,548 |
| 400 | | | | Murata Manufacturing Co., Ltd. | | | 15,685 |
| 4,000 | | | | Nagoya Railroad Co., Ltd. | | | 12,810 |
| 1,100 | | | | Namco Bandai Holdings, Inc. | | | 12,056 |
| 1,000 | | | | NGK Insulators Ltd. | | | 11,332 |
| 200 | | | | Nintendo Co., Ltd. | | | 76,430 |
| 1,000 | | | | Nippon Electric Glass Co., Ltd. | | | 5,279 |
| 3,000 | | | | Nippon Express Co., Ltd. | | | 12,645 |
| 6 | | X | | Nippon Paper Group, Inc. | | | 24,643 |
| 3,000 | | | | Nippon Sheet Glass Co., Ltd. | | | 9,932 |
| 8,000 | | | | Nippon Steel Corp. | | | 26,290 |
| 17 | | X | | Nippon Telegraph & Telephone Corp. | | | 91,277 |
| 4,000 | | | | Nissan Motor Co., Ltd. | | | 14,391 |
| 400 | | | | Nissin Food Products Co., Ltd. | | | 13,939 |
| 3,300 | | | | Nomura Holdings, Inc. | | | 27,477 |
| 600 | | | | Nomura Research Institute Ltd. | | | 11,446 |
| 4 | | | | NTT Data Corp. | | | 16,116 |
| 40 | | | | NTT DoCoMo, Inc. | | | 78,733 |
| 2,000 | | | | OJI Paper Co., Ltd. | | | 11,758 |
| 2,000 | | | | Okuma Corp. | | | 7,547 |
| 300 | | | | Ono Pharmaceutical Co., Ltd. | | | 15,619 |
| 200 | | | | Oriental Land Co., Ltd. | | | 16,420 |
| 150 | | | | ORIX Corp. | | | 8,565 |
| 4,000 | | | | Osaka Gas Co., Ltd. | | | 18,497 |
| 13 | | X | | Resona Holdings, Inc. | | | 20,000 |
| 1,000 | | | | Ricoh Co., Ltd. | | | 12,817 |
| 7,000 | | @ | | Sanyo Electric Co., Ltd. | | | 13,095 |
| 300 | | | | Secom Co., Ltd. | | | 15,481 |
| 500 | | | | Seiko Epson Corp. | | | 7,956 |
| 1,400 | | | | Seven & I Holdings Co., Ltd. | | | 48,120 |
| 500 | | | | Shikoku Electric Power Co. | | | 16,858 |
| 800 | | | | Shin-Etsu Chemical Co., Ltd. | | | 36,921 |
| 1,000 | | | | Shionogi & Co., Ltd. | | | 25,825 |
| 1,000 | | | | Shiseido Co., Ltd. | | | 20,565 |
| 1,300 | | | | Softbank Corp. | | | 23,610 |
| 94 | | | | Softbank Investment Corp. | | | 14,512 |
| 5,900 | | | | Sojitz Corp. | | | 9,860 |
| 2,000 | | | | Sompo Japan Insurance, Inc. | | | 14,809 |
| 1,500 | | | | Sony Corp. | | | 32,808 |
| 5 | | | | Sony Financial Holdings, Inc. | | | 19,082 |
| 600 | | | | Stanley Electric Co., Ltd. | | | 6,335 |
| 1,700 | | | | Sumitomo Corp. | | | 15,078 |
| 7,000 | | | | Sumitomo Metal Industries Ltd. | | | 17,291 |
| 13 | | X | | Sumitomo Mitsui Financial Group, Inc. | | | 56,079 |
| 1,000 | | | | Sumitomo Realty & Development Co., Ltd. | | | 15,032 |
| 2,000 | | | | Sumitomo Trust & Banking Co., Ltd. | | | 11,822 |
| 400 | | | | T&D Holdings, Inc. | | | 16,930 |
| | | | | | | |
| Shares | | | | | | Value |
| | | | | | | |
| Japan: (continued) |
| 1,000 | | | | Taiyo Yuden Co., Ltd. | | $ | 5,688 |
| 1,500 | | | | Takeda Pharmaceutical Co., Ltd. | | | 78,183 |
| 300 | | | | TDK Corp. | | | 11,084 |
| 300 | | | | Terumo Corp. | | | 14,054 |
| 2,000 | | | | Tobu Railway Co., Ltd. | | | 11,949 |
| 500 | | | | Toho Co., Ltd. | | | 10,759 |
| 2,000 | | | | Toho Gas Co., Ltd. | | | 13,197 |
| 800 | | | | Tohoku Electric Power Co., Inc. | | | 21,641 |
| 900 | | | | Tokio Marine Holdings, Inc. | | | 26,666 |
| 2,000 | | | | Tokuyama Corp. | | | 16,957 |
| 1,800 | | | | Tokyo Electric Power Co., Inc. | | | 60,087 |
| 4,000 | | | | Tokyo Gas Co., Ltd. | | | 20,276 |
| 3,000 | | | | Tokyu Corp. | | | 15,126 |
| 2,000 | | | | Tokyu Land Corp. | | | 7,666 |
| 6,000 | | | | Toshiba Corp. | | | 24,689 |
| 600 | | | | Toyo Seikan Kaisha Ltd. | | | 10,400 |
| 3,800 | | | | Toyota Motor Corp. | | | 125,622 |
| 700 | | | | Toyota Tsusho Corp. | | | 7,536 |
| 500 | | | | Trend Micro, Inc. | | | 17,561 |
| 6 | | | | West Japan Railway Co. | | | 27,339 |
| 210 | | | | Yamada Denki Co., Ltd. | | | 14,679 |
| 1,000 | | | | Yamaha Motor Co., Ltd. | | | 10,522 |
| 1,000 | | | | Yamato Holdings Co., Ltd. | | | 13,077 |
| | | | | | | |
| | | | | | | 3,289,689 |
| | | | | | | |
| Luxembourg: 0.1% |
| 1,443 | | | | ArcelorMittal | | | 34,783 |
| 200 | | @ | | Millicom International Cellular SA | | | 8,982 |
| 126 | | @ | | Reinet Investments SA | | | 1,226 |
| 485 | | @ | | Reinet Investments SA - Depository Reciept | | | 509 |
| 900 | | | | Tenaris SA | | | 9,354 |
| | | | | | | |
| | | | | | | 54,854 |
| | | | | | | |
| Malaysia: 0.1% |
| 13,300 | | | | Astro All Asia Networks PLC | | | 8,519 |
| 7,400 | | | | Malayan Banking BHD | | | 10,945 |
| 18,100 | | | | Resorts World BHD | | | 11,873 |
| 9,000 | | @ | | TM International Bhd | | | 9,459 |
| | | | | | | |
| | | | | | | 40,796 |
| | | | | | | |
| Mauritius: 0.0% |
| 50,000 | | | | Golden Agri-Resources Ltd. | | | 8,239 |
| | | | | | | |
| | | | | | | 8,239 |
| | | | | | | |
| Mexico: 0.3% |
| 37,810 | | | | America Movil SA de CV - Series L | | | 58,018 |
| 12,000 | | @ | | Cemex SAB de C.V. | | | 10,866 |
| 4,100 | | | | Fomento Economico Mexicano SA de CV ADR | | | 12,257 |
| 4,435 | | | | Grupo Financiero Inbursa SA | | | 10,408 |
| 10,594 | | | | Grupo Mexico SA de CV | | | 6,808 |
| 2,800 | | | | Grupo Modelo SA | | | 8,896 |
| 3,400 | | | | Grupo Televisa SA | | | 10,042 |
| 4,200 | | | | Wal-Mart de Mexico SA de CV | | | 11,221 |
| | | | | | | |
| | | | | | | 128,516 |
| | | | | | | |
| Morocco: 0.0% |
| 640 | | | | Douja Promotion Groupe Addoha SA | | | 8,195 |
| | | | | | | |
| | | | | | | 8,195 |
| | | | | | | |
| Netherlands: 1.7% |
| 1,920 | | | | Aegon NV | | | 12,120 |
| 500 | | | | Akzo Nobel NV | | | 20,624 |
See Accompanying Notes to Financial Statements
97
| | |
ING RUSSELL™ GLOBAL LARGE CAP INDEX
85% PORTFOLIO | | PORTFOLIO OF INVESTMENTS ASOF DECEMBER 31, 2008 (CONTINUED) |
| | | | | | | |
| Shares | | | | | | Value |
| | | | | | | |
| Netherlands: (continued) |
| 806 | | | | ASML Holding NV | | $ | 14,530 |
| 500 | | | | Chicago Bridge & Iron Co. NV | | | 5,025 |
| 891 | | | | European Aeronautic Defence and Space Co. NV | | | 15,089 |
| 563 | | | | Heineken NV | | | 17,237 |
| 278 | | | | Hunter Douglas NV | | | 9,152 |
| 3,114 | | ** | | ING Groep NV | | | 34,272 |
| 2,277 | | | | Koninklijke Ahold NV | | | 28,059 |
| 971 | | | | Koninklijke BAM Groep NV | | | 8,757 |
| 1,674 | | | | Koninklijke Philips Electronics NV | | | 33,190 |
| 559 | | @ | | Qiagen NV | | | 9,550 |
| 1,307 | | | | Reed Elsevier NV | | | 15,539 |
| 6,869 | | | | Royal Dutch Shell PLC - Class A | | | 180,470 |
| 5,359 | | | | Royal Dutch Shell PLC - Class B | | | 135,842 |
| 2,900 | | | | Royal KPN NV | | | 42,161 |
| 734 | | | | SBM Offshore NV | | | 9,643 |
| 1,001 | | | | SNS Reaal | | | 5,502 |
| 2,317 | | | | TNT NV | | | 45,009 |
| 3,208 | | | | Unilever NV | | | 77,755 |
| 178 | | | | Van Lanschot NV | | | 11,864 |
| | | | | | | |
| | | | | | | 731,390 |
| | | | | | | |
| Norway: 0.2% |
| 1,100 | | | | Acergy SA | | | 6,339 |
| 750 | | | | Aker Kvaerner ASA | | | 4,960 |
| 1,000 | | @ | | Petroleum Geo-Services ASA | | | 4,082 |
| 750 | | @ | | Renewable Energy Corp. A/S | | | 7,184 |
| 2,650 | | | | Statoil ASA | | | 44,321 |
| 3,800 | | | | Storebrand ASA | | | 9,385 |
| 800 | | @ | | Subsea 7, Inc. | | | 4,756 |
| | | | | | | |
| | | | | | | 81,027 |
| | | | | | | |
| Philippines: 0.1% |
| 330 | | | | Philippine Long Distance Telephone Co. | | | 15,082 |
| 2,100 | | | | SM Investments Corp. | | | 8,649 |
| | | | | | | |
| | | | | | | 23,731 |
| | | | | | | |
| Poland: 0.1% |
| 243 | | | | Bank Pekao SA | | | 10,424 |
| 178 | | | | Bank Zachodni WBK SA | | | 6,715 |
| 100 | | @ | | BRE Bank SA | | | 6,734 |
| 2,900 | | @ | | Getin Holding SA | | | 4,913 |
| 1,100 | | @ | | Globe Trade Centre SA | | | 5,671 |
| 536 | | | | KGHM Polska Miedz SA | | | 5,114 |
| 800 | | | | Polski Koncern Naftowy SA | | | 6,970 |
| 1,789 | | | | Telekomunikacja Polska SA | | | 11,619 |
| | | | | | | |
| | | | | | | 58,160 |
| | | | | | | |
| Portugal: 0.1% |
| 6,532 | | | | Energias de Portugal SA | | | 24,573 |
| | | | | | | |
| | | | | | | 24,573 |
| | | | | | | |
| Russia: 0.2% |
| 700 | | | | Lukoil-Spon ADR | | | 22,656 |
| 4,580 | | @ | | OAO Gazprom ADR | | | 65,985 |
| | | | | | | |
| | | | | | | 88,641 |
| | | | | | | |
| Singapore: 0.4% |
| 2,000 | | | | City Developments Ltd. | | | 8,948 |
| 11,000 | | | | Cosco Corp. Singapore Ltd. | | | 7,354 |
| 2,000 | | | | DBS Group Holdings Ltd. | | | 11,781 |
| 5,000 | | | | Fraser and Neave Ltd. | | | 10,338 |
| 1,000 | | | | Great Eastern Holdings Ltd. | | | 6,301 |
| 1,000 | | | | Jardine Cycle & Carriage Ltd. | | | 6,651 |
| | | | | | | |
| Shares | | | | | | Value |
| | | | | | | |
| Singapore: (continued) |
| 2,000 | | | | Keppel Corp., Ltd. | | $ | 6,072 |
| 9,000 | | | | Oversea-Chinese Banking Corp. | | | 31,294 |
| 4,000 | | | | Singapore Exchange Ltd. | | | 14,249 |
| 6,000 | | | | Singapore Press Holdings Ltd. | | | 13,010 |
| 12,000 | | | | Singapore Telecommunications Ltd. | | | 21,385 |
| 3,000 | | | | United Overseas Bank Ltd. | | | 27,111 |
| | | | | | | |
| | | | | | | 164,494 |
| | | | | | | |
| South Africa: 0.5% |
| 733 | | | | ABSA Group Ltd. | | | 8,625 |
| 2,789 | | | | African Bank Investments Ltd. | | | 7,770 |
| 161 | | | | Anglo Platinum Ltd. | | | 9,092 |
| 1,442 | | | | Barloworld Ltd. | | | 6,518 |
| 1,004 | | | | Exxaro Resources Ltd. | | | 7,849 |
| 7,742 | | | | FirstRand Ltd. | | | 13,618 |
| 934 | | | | Impala Platinum Holdings Ltd. | | | 13,765 |
| 1,800 | | | | MTN Group Ltd. | | | 21,222 |
| 800 | | | | Naspers Ltd. | | | 14,472 |
| 1,037 | | | | Nedcor Ltd. | | | 10,726 |
| 762 | | | | Remgro Ltd. | | | 6,303 |
| 3,961 | | | | RMB Holdings Ltd. | | | 11,051 |
| 5,973 | | | | Sanlam Ltd. | | | 10,983 |
| 800 | | | | Sasol Ltd. | | | 24,329 |
| 2,370 | | | | Shoprite Holdings Ltd. | | | 13,587 |
| 1,875 | | | | Standard Bank Group Ltd. | | | 16,917 |
| 6,100 | | @ | | Steinhoff International Holdings Ltd. | | | 8,281 |
| 616 | | | | Telkom SA Ltd. | | | 7,649 |
| | | | | | | |
| | | | | | | 212,757 |
| | | | | | | |
| South Korea: 1.0% |
| 112 | | @ | | CJ CheilJedang Corp. | | | 16,245 |
| 172 | | | | Daelim Industrial Co. | | | 6,290 |
| 1,400 | | | | Daewoo Engineering & Construction Co., Ltd. | | | 10,125 |
| 500 | | | | Daewoo Shipbuilder & Marine Engine Co., Ltd. | | | 6,303 |
| 404 | | | | Hanjin Heavy Industries & Construction | | | 9,482 |
| 102 | | @ | | Hite Brewery Co., Ltd. | | | 13,543 |
| 800 | | @ | | Hynix Semiconductor, Inc. | | | 4,255 |
| 63 | | | | Hyundai Mipo Dockyard Co., Ltd. | | | 6,968 |
| 1,040 | | | | Industrial Bank of Korea | | | 6,527 |
| 661 | | @ | | KB Financial Group, Inc. | | | 17,685 |
| 149 | | @ | | Korea Express Co., Ltd. | | | 10,603 |
| 390 | | | | Korea Investment Holdings Co., Ltd. | | | 7,601 |
| 360 | | | | KT Corp. | | | 10,738 |
| 700 | | @ | | KT Freetel Co., Ltd. | | | 17,539 |
| 203 | | | | KT&G Corp. | | | 12,840 |
| 220 | | | | LG Chem Ltd. | | | 12,664 |
| 600 | | | | LG Display Co., Ltd. | | | 10,000 |
| 3,115 | | | | Macquarie Korea Infrastructure Fund | | | 11,920 |
| 143 | | | | Mirae Asset Securities Co., Ltd. | | | 8,557 |
| 220 | | | | Posco | | | 66,808 |
| 420 | | | | Samsung Card Co. | | | 12,494 |
| 245 | | | | Samsung Electronics Co., Ltd. | | | 89,325 |
| 600 | | | | Samsung Heavy Industries Co., Ltd. | | | 11,141 |
| 200 | | @ | | Samsung SDI Co., Ltd. | | | 8,893 |
| 700 | | | | Shinhan Financial Group Ltd. | | | 16,506 |
| 91 | | | | SK Telecom Co., Ltd. | | | 15,126 |
| 200 | | | | S-Oil Corp. | | | 9,884 |
| | | | | | | |
| | | | | | | 430,062 |
| | | | | | | |
| Spain: 1.7% |
| 1,065 | | | | Abertis Infraestructuras SA | | | 19,087 |
| 129 | | | | Acciona SA | | | 16,403 |
See Accompanying Notes to Financial Statements
98
| | |
ING RUSSELL™ GLOBAL LARGE CAP INDEX
85% PORTFOLIO | | PORTFOLIO OF INVESTMENTS ASOF DECEMBER 31, 2008 (CONTINUED) |
| | | | | | | |
| Shares | | | | | | Value |
| | | | | | | |
| Spain: (continued) |
| 617 | | | | ACS Actividades de Construccion y Servicios SA | | $ | 28,651 |
| 7,434 | | | | Banco Bilbao Vizcaya Argentaria SA | | | 92,110 |
| 3,261 | | | | Banco De Sabadell SA | | | 22,324 |
| 12,885 | | | | Banco Santander Central Hispano SA | | | 124,478 |
| 1,476 | | | | Bankinter SA | | | 13,351 |
| 327 | | | | Corporacion Financiera Alba SA | | | 12,699 |
| 2,982 | | | | Criteria Caixacorp SA | | | 11,896 |
| 311 | | | | Endesa SA | | | 12,666 |
| 1,878 | | | | Faes Farma SA | | | 8,014 |
| 468 | | | | Gamesa Corp. Tecnologica SA | | | 8,533 |
| 610 | | | | Grifols SA | | | 10,688 |
| 3,104 | | @ | | Iberdrola Renovables | | | 13,532 |
| 6,171 | | | | Iberdrola SA | | | 57,524 |
| 772 | | | | Inditex SA | | | 34,378 |
| 1,591 | | | | Repsol YPF SA | | | 33,968 |
| 8,457 | | | | Telefonica SA | | | 190,889 |
| 1,200 | | | | Union Fenosa SA | | | 30,066 |
| | | | | | | |
| | | | | | | 741,257 |
| | | | | | | |
| Sweden: 0.7% |
| 1,400 | | | | Atlas Copco AB - Class A | | | 12,318 |
| 1,200 | | | | Atlas Copco AB - Class B | | | 9,396 |
| 925 | | | | Hennes & Mauritz AB | | | 36,792 |
| 900 | | | | Hexagon AB | | | 4,493 |
| 1,800 | | | | Husqvarna AB - B Shares | | | 9,684 |
| 360 | | @ | | Loomis AB | | | 2,231 |
| 1,600 | | @ | | Lundin Petroleum AB | | | 8,587 |
| 800 | | @ | | Meda AB - Class A | | | 5,535 |
| 133 | | @ | | Meda AB - Class B | | | 885 |
| 3,800 | | | | Nordea Bank AB | | | 27,085 |
| 2,694 | | | | Sandvik AB | | | 17,304 |
| 1,400 | | | | Scania AB - B Shares | | | 14,245 |
| 1,800 | | | | Securitas AB | | | 15,154 |
| 800 | | | | Skandinaviska Enskilda Banken AB | | | 6,458 |
| 1,600 | | | | Svenska Cellulosa AB - B Shares | | | 13,892 |
| 1,100 | | | | Svenska Handelsbanken AB | | | 18,190 |
| 775 | | | | Swedbank AB | | | 4,578 |
| 600 | | | | Swedish Match AB | | | 8,662 |
| 1,000 | | | | Tele2 AB - B Shares | | | 9,049 |
| 1,600 | | | | Telefonaktiebolaget LM Ericsson - Class A | | | 12,339 |
| 5,000 | | | | Telefonaktiebolaget LM Ericsson - Class B | | | 38,979 |
| 2,000 | | | | TeliaSonera AB | | | 10,072 |
| 2,500 | | | | Volvo AB | | | 14,227 |
| 300 | | @ | | Vostok Gas Ltd. | | | 2,597 |
| 16,300 | | @ | | West Siberian Resources Ltd. GDR | | | 5,256 |
| | | | | | | |
| | | | | | | 308,008 |
| | | | | | | |
| Switzerland: 3.1% |
| 4,644 | | @ | | ABB Ltd. | | | 70,822 |
| 500 | | | | ACE Ltd. | | | 26,460 |
| 212 | | @ | | Actelion Ltd. - Reg | | | 11,993 |
| 444 | | | | Adecco SA | | | 15,200 |
| 100 | | | | Alcon, Inc. | | | 8,919 |
| 200 | | @ | | Aryzta AG | | | 6,394 |
| 120 | | | | Basler Kantonalbank | | | 13,003 |
| 926 | | | | Compagnie Financiere Richemont SA | | | 17,644 |
| 1,857 | | | | Credit Suisse Group | | | 52,042 |
| 625 | | | | Holcim Ltd. | | | 36,175 |
| 434 | | | | Julius Baer Holding AG - Reg | | | 16,821 |
| 2 | | | | Lindt & Spruengli AG | | | 43,025 |
| 748 | | @ | | Logitech International SA | | | 11,739 |
| 152 | | | | Lonza Group AG | | | 14,092 |
| | | | | | | |
| Shares | | | | | | Value |
| | | | | | | |
| Switzerland: (continued) |
| 100 | | @ | | Mettler Toledo International, Inc. | | $ | 6,740 |
| 6,855 | | | | Nestle SA | | | 271,445 |
| 494 | | | | Nobel Biocare Holding AG | | | 10,201 |
| 4,158 | | | | Novartis AG | | | 208,239 |
| 269 | | @ | | Petroplus Holdings AG | | | 5,438 |
| 190 | | @ | | PSP Swiss Property AG | | | 9,475 |
| 1,328 | | | | Roche Holding AG - Genusschein | | | 205,597 |
| 100 | | | | Roche Holding AG - Bearer | | | 16,056 |
| 1,401 | | | | STMicroelectronics NV | | | 9,396 |
| 41 | | | | Straumann Holding AG | | | 7,268 |
| 93 | | | | Swatch Group AG - BR | | | 13,116 |
| 465 | | | | Swiss Reinsurance | | | 22,769 |
| 47 | | | | Swisscom AG | | | 15,246 |
| 204 | | | | Syngenta AG | | | 39,630 |
| 131 | | | | Synthes, Inc. | | | 16,419 |
| 5,344 | | @ | | UBS AG - Reg | | | 77,752 |
| 82 | | | | Valiant Holding | | | 15,358 |
| 1,182 | | | | Xstrata PLC | | | 11,060 |
| 211 | | | | Zurich Financial Services AG | | | 46,099 |
| | | | | | | |
| | | | | | | 1,351,633 |
| | | | | | | |
| Taiwan: 0.7% |
| 28,000 | | | | Advanced Semiconductor Engineering, Inc. | | | 10,125 |
| 17,000 | | | | AU Optronics Corp. | | | 12,887 |
| 8,000 | | | | Cathay Financial Holding Co., Ltd. | | | 9,013 |
| 19,000 | | | | China Steel Corp. | | | 13,449 |
| 9,680 | | | | Chunghwa Telecom Co., Ltd. | | | 15,593 |
| 14,000 | | | | Far EasTone Telecommunications Co., Ltd. | | | 15,954 |
| 12,000 | | | | Formosa Chemicals & Fibre Co. | | | 14,706 |
| 5,000 | | | | Formosa Petrochemical Corp. | | | 10,377 |
| 8,000 | | | | Formosa Plastics Corp. | | | 10,672 |
| 2,000 | | | | High Tech Computer Corp. | | | 20,076 |
| 11,000 | | | | HON HAI Precision Industry Co., Ltd. | | | 21,689 |
| 2,000 | | | | MediaTek, Inc. | | | 13,527 |
| 32,000 | | | | Mega Financial Holdings Co., Ltd. | | | 11,286 |
| 20,000 | | | | Nan Ya Plastics Corp. | | | 21,645 |
| 7,000 | | | | Novatek Microelectronics Corp., Ltd. | | | 6,686 |
| 12,000 | | | | Siliconware Precision Industries Co. | | | 10,449 |
| 42,000 | | | | Sinopac Financial Holdings, Co. | | | 9,276 |
| 23,000 | | | | Taiwan Cooperative Bank | | | 11,634 |
| 47,000 | | | | Taiwan Semiconductor Manufacturing Co., Ltd. | | | 64,131 |
| 12,000 | | | | Uni-President Enterprises Corp. | | | 10,624 |
| 19,000 | | | | Yuanta Financial Holding Co., Ltd. | | | 8,651 |
| | | | | | | |
| | | | | | | 322,450 |
| | | | | | | |
| Thailand: 0.1% | | | |
| 3,600 | | | | Advanced Info Service PCL | | | 8,308 |
| 1,200 | | | | Banpu Public Co., Ltd. | | | 8,011 |
| 2,200 | | | | PTT PLC | | | 11,214 |
| 5,800 | | | | Siam Commercial Bank PCL | | | 8,046 |
| | | | | | | |
| | | | | | | 35,579 |
| | | | | | | |
| Turkey: 0.1% | | | |
| 2,816 | | | | Akbank TAS | | | 8,872 |
| 2,135 | | | | Eregli Demir ve Celik Fabrikalari TAS | | | 5,721 |
| 3,700 | | | | Haci Omer Sabanci Holding A/S | | | 8,513 |
| 3,302 | | @ | | KOC Holding A/S | | | 5,609 |
| 4,561 | | @ | | Turkiye Garanti Bankasi A/S | | | 7,851 |
| 2,027 | | | | Turkiye Halk Bankasi | | | 6,067 |
| | | | | | | |
| | | | | | | 42,633 |
| | | | | | | |
See Accompanying Notes to Financial Statements
99
| | |
ING RUSSELL™ GLOBAL LARGE CAP INDEX
85% PORTFOLIO | | PORTFOLIO OF INVESTMENTS ASOF DECEMBER 31, 2008 (CONTINUED) |
| | | | | | | |
| Shares | | | | | | Value |
| | | | | | | |
| United Kingdom: 6.6% | | | |
| 1,436 | | | | Amec PLC | | $ | 10,367 |
| 2,410 | | | | Anglo American PLC | | | 56,242 |
| 1,896 | | | | Antofagasta PLC | | | 11,877 |
| 5,899 | | | | ARM Holdings PLC | | | 7,468 |
| 1,361 | | | | Associated British Foods PLC | | | 14,328 |
| 2,621 | | | | AstraZeneca PLC | | | 107,226 |
| 727 | | @ | | Autonomy Corp. PLC | | | 10,116 |
| 4,013 | | | | Aviva PLC | | | 22,740 |
| 6,028 | | | | BAE Systems PLC | | | 32,805 |
| 12,544 | | | | Barclays PLC | | | 28,511 |
| 6,243 | | | | BG Group PLC | | | 86,413 |
| 4,202 | | | | BHP Billiton PLC | | | 81,500 |
| 34,962 | | | | BP PLC | | | 269,887 |
| 4,616 | | | | British American Tobacco PLC | | | 120,417 |
| 1,824 | | | | British Energy Group PLC | | | 20,440 |
| 2,653 | | | | British Sky Broadcasting PLC | | | 18,735 |
| 14,032 | | | | BT Group PLC | | | 28,220 |
| 1,250 | | | | Bunzl PLC | | | 10,667 |
| 2,030 | | | | Burberry Group PLC | | | 6,573 |
| 3,927 | | | | Cable & Wireless PLC | | | 8,881 |
| 2,046 | | | | Cadbury PLC | | | 17,812 |
| 1,455 | | | | Capita Group PLC | | | 15,608 |
| 9,321 | | | | Centrica PLC | | | 35,884 |
| 2,789 | | | | Cobham PLC | | | 8,337 |
| 13,685 | | | | Compass Group PLC | | | 68,257 |
| 5,155 | | | | Diageo PLC | | | 72,432 |
| 5,042 | | | | Experian Group Ltd. | | | 31,790 |
| 1,820 | | | | Firstgroup PLC | | | 11,510 |
| 9,681 | | | | GlaxoSmithKline PLC | | | 180,045 |
| 10,470 | | | | Hays PLC | | | 10,580 |
| 8,283 | | | | HBOS PLC | | | 8,574 |
| 22,494 | | | | HSBC Holdings PLC | | | 220,153 |
| 1,426 | | | | ICAP PLC | | | 6,019 |
| 2,023 | | | | Imperial Tobacco Group PLC | | | 54,036 |
| 2,898 | | | | Inchcape PLC | | | 1,531 |
| 1,650 | | | | Inmarsat PLC | | | 11,333 |
| 907 | | | | Intercontinental Hotels Group PLC | | | 7,483 |
| 2,341 | | | | International Power PLC | | | 8,158 |
| 3,777 | | @ | | Invensys PLC | | | 9,546 |
| 1,971 | | | | Investec PLC | | | 8,138 |
| 2,291 | | | | J Sainsbury PLC | | | 10,933 |
| 1,026 | | | | Kazakhmys PLC | | | 3,502 |
| 3,900 | | | | Ladbrokes PLC | | | 10,475 |
| 28,358 | | | | Legal & General Group PLC | | | 31,696 |
| 8,806 | | | | Lloyds TSB Group PLC | | | 16,667 |
| 7,155 | | | | LogicaCMG PLC | | | 7,193 |
| 271 | | | | Lonmin PLC | | | 3,612 |
| 2,300 | | | | Man Group PLC | | | 7,912 |
| 2,956 | | | | Mitchells & Butlers PLC | | | 6,892 |
| 918 | | | | National Express Group PLC | | | 6,601 |
| 4,102 | | | | National Grid PLC | | | 40,534 |
| 200 | | @ | | NDS Group PLC ADR | | | 11,468 |
| 2,253 | | | | Northumbrian Water Group PLC | | | 7,712 |
| 8,680 | | | | Old Mutual PLC | | | 6,976 |
| 1,976 | | | | Pearson PLC | | | 18,625 |
| 1,167 | | | | Pennon Group PLC | | | 8,448 |
| 1,711 | | | | Persimmon PLC | | | 5,720 |
| 4,011 | | | | Prudential PLC | | | 24,348 |
| 3,793 | | | | QinetiQ PLC | | | 8,748 |
| 302 | | | | Randgold Resources Ltd. | | | 13,079 |
| 1,020 | | | | Reckitt Benckiser PLC | | | 38,220 |
| 2,448 | | | | Reed Elsevier PLC | | | 17,973 |
| 8,584 | | | | Rentokil Initial PLC | | | 5,488 |
| | | | | | | |
| Shares | | | | | | Value |
| | | | | | | |
| United Kingdom: (continued) | | | |
| 1,786 | | | | Rexam PLC | | $ | 9,141 |
| 1,669 | | | | Rio Tinto PLC | | | 37,096 |
| 6,600 | | @ | | Rolls-Royce Group PLC | | | 32,287 |
| 5,127 | | | | Royal & Sun Alliance Insurance Group | | | 10,217 |
| 26,505 | | | | Royal Bank of Scotland Group PLC | | | 19,511 |
| 1,181 | | | | SABMiller PLC | | | 19,832 |
| 5,132 | | | | Sage Group PLC | | | 12,708 |
| 505 | | | | Schroders PLC | | | 6,353 |
| 1,434 | | | | Scottish & Southern Energy PLC | | | 25,283 |
| 468 | | | | Severn Trent PLC | | | 8,111 |
| 988 | | | | Shire PLC | | | 14,553 |
| 1,524 | | | | Smith & Nephew PLC | | | 9,733 |
| 891 | | | | Smiths Group PLC | | | 11,449 |
| 2,410 | | | | Stagecoach Group PLC | | | 4,957 |
| 4,502 | | | | Standard Chartered PLC | | | 57,608 |
| 3,905 | | | | Standard Life PLC | | | 11,400 |
| 1,277 | | | | Tate & Lyle PLC | | | 7,441 |
| 17,312 | | | | Tesco PLC | | | 90,144 |
| 586 | | | | Thomson Reuters PLC | | | 13,058 |
| 3,277 | | | | Unilever PLC | | | 75,272 |
| 3,351 | | | | United Utilities Group PLC | | | 30,427 |
| 550 | | | | Vedanta Resources PLC | | | 4,939 |
| 100,289 | | | | Vodafone Group PLC | | | 205,357 |
| 500 | | | | Willis Group Holdings Ltd. | | | 12,440 |
| 8,100 | | | | WM Morrison Supermarkets PLC | | | 32,832 |
| 5,766 | | | | WPP PLC | | | 33,716 |
| | | | | | | |
| | | | | | | 2,849,326 |
| | | | | | | |
| United States: 37.1% | | | |
| 1,380 | | | | 3M Co. | | | 79,405 |
| 2,860 | | | | Abbott Laboratories | | | 152,638 |
| 1,100 | | @ | | Activision Blizzard, Inc. | | | 9,504 |
| 700 | | @ | | Adobe Systems, Inc. | | | 14,903 |
| 700 | | @ | | Aecom Technology Corp. | | | 21,511 |
| 1,800 | | @ | | AES Corp. | | | 14,832 |
| 900 | | | | Aetna, Inc. | | | 25,650 |
| 400 | | @ | | Affiliated Computer Services, Inc. | | | 18,380 |
| 800 | | | | Aflac, Inc. | | | 36,672 |
| 500 | | @ | | Agilent Technologies, Inc. | | | 7,815 |
| 300 | | | | Air Products & Chemicals, Inc. | | | 15,081 |
| 400 | | | | AK Steel Holding Corp. | | | 3,728 |
| 800 | | @ | | Akamai Technologies, Inc. | | | 12,072 |
| 600 | | | | Alberto-Culver Co. | | | 14,706 |
| 1,900 | | | | Alcoa, Inc. | | | 21,394 |
| 300 | | | | Allegheny Energy, Inc. | | | 10,158 |
| 400 | | | | Allegheny Technologies, Inc. | | | 10,212 |
| 700 | | | | Allergan, Inc. | | | 28,224 |
| 300 | | @ | | Alliance Data Systems Corp. | | | 13,959 |
| 100 | | @ | | Alliant Techsystems, Inc. | | | 8,576 |
| 400 | | | | Allied World Assurance Holdings Ltd. | | | 16,240 |
| 900 | | | | Allstate Corp. | | | 29,484 |
| 200 | | @ | | Alpha Natural Resources, Inc. | | | 3,238 |
| 800 | | | | Altera Corp. | | | 13,368 |
| 3,870 | | | | Altria Group, Inc. | | | 58,282 |
| 500 | | @ | | Amazon.com, Inc. | | | 25,640 |
| 400 | | | | Ameren Corp. | | | 13,304 |
| 500 | | | | American Electric Power Co., Inc. | | | 16,640 |
| 1,700 | | | | American Express Co. | | | 31,535 |
| 500 | | @ | | American Tower Corp. | | | 14,660 |
| 500 | | | | AmerisourceBergen Corp. | | | 17,830 |
| 2,100 | | @ | | Amgen, Inc. | | | 121,275 |
| 1,100 | | | | Anadarko Petroleum Corp. | | | 42,405 |
| 600 | | | | Analog Devices, Inc. | | | 11,412 |
See Accompanying Notes to Financial Statements
100
| | |
ING RUSSELL™ GLOBAL LARGE CAP INDEX
85% PORTFOLIO | | PORTFOLIO OF INVESTMENTS ASOF DECEMBER 31, 2008 (CONTINUED) |
| | | | | | | |
| Shares | | | | | | Value |
| | | | | | | |
| United States: (continued) | | | |
| 500 | | | | AON Corp. | | $ | 22,840 |
| 650 | | | | Apache Corp. | | | 48,445 |
| 200 | | @ | | Apollo Group, Inc. - Class A | | | 15,324 |
| 1,600 | | @ | | Apple, Inc. | | | 136,560 |
| 2,200 | | | | Applied Materials, Inc. | | | 22,286 |
| 300 | | | | Aptargroup, Inc. | | | 10,572 |
| 700 | | | | Aqua America, Inc. | | | 14,413 |
| 400 | | | | Arch Coal, Inc. | | | 6,516 |
| 1,100 | | | | Archer-Daniels-Midland Co. | | | 31,713 |
| 500 | | | | Arthur J. Gallagher & Co. | | | 12,955 |
| 30 | | @ | | Ascent Media Corp. | | | 655 |
| 300 | | | | Assurant, Inc. | | | 9,000 |
| 10,970 | | | | AT&T, Inc. | | | 312,645 |
| 2,800 | | @ | | Atmel Corp. | | | 8,764 |
| 500 | | @ | | Autodesk, Inc. | | | 9,825 |
| 1,000 | | | | Automatic Data Processing, Inc. | | | 39,340 |
| 100 | | @ | | Autozone, Inc. | | | 13,947 |
| 400 | | | | Avery Dennison Corp. | | | 13,092 |
| 500 | | @ | | Avnet, Inc. | | | 9,105 |
| 700 | | | | Avon Products, Inc. | | | 16,821 |
| 600 | | | | Baker Hughes, Inc. | | | 19,242 |
| 300 | | | | Ball Corp. | | | 12,477 |
| 8,430 | | | | Bank of America Corp. | | | 118,694 |
| 200 | | | | Bank of Hawaii Corp. | | | 9,034 |
| 2,070 | | | | Bank of New York Mellon Corp. | | | 58,643 |
| 1,280 | | | | Baxter International, Inc. | | | 68,595 |
| 800 | | | | BB&T Corp. | | | 21,968 |
| 600 | | @ | | BE Aerospace, Inc. | | | 4,614 |
| 400 | | | | Becton Dickinson & Co. | | | 27,356 |
| 500 | | @ | | Bed Bath & Beyond, Inc. | | | 12,710 |
| 400 | | | | Bemis Co. | | | 9,472 |
| 900 | | | | Best Buy Co., Inc. | | | 25,299 |
| 400 | | @ | | Big Lots, Inc. | | | 5,796 |
| 400 | | @ | | Biogen Idec, Inc. | | | 19,052 |
| 300 | | @ | | BJ’s Wholesale Club, Inc. | | | 10,278 |
| 600 | | @ | | BMC Software, Inc. | | | 16,146 |
| 1,400 | | | | Boeing Co. | | | 59,738 |
| 200 | | | | BOK Financial Corp. | | | 8,080 |
| 2,900 | | @ | | Boston Scientific Corp. | | | 22,446 |
| 3,450 | | | | Bristol-Myers Squibb Co. | | | 80,213 |
| 1,100 | | @ | | Broadcom Corp. | | | 18,667 |
| 800 | | | | Broadridge Financial Solutions ADR | | | 10,032 |
| 1,800 | | @ | | Brocade Communications Systems, Inc. | | | 5,040 |
| 700 | | | | Brown & Brown, Inc. | | | 14,630 |
| 250 | | | | Brown-Forman Corp. | | | 12,873 |
| 300 | | | | Bucyrus International, Inc. | | | 5,556 |
| 400 | | | | Bunge Ltd. | | | 20,708 |
| 550 | | | | Burlington Northern Santa Fe Corp. | | | 41,641 |
| 900 | | | | CA, Inc. | | | 16,677 |
| 400 | | | | Cabot Corp. | | | 6,120 |
| 1,000 | | @ | | Calpine Corp. | | | 7,280 |
| 500 | | | | Campbell Soup Co. | | | 15,005 |
| 600 | | | | Capital One Financial Corp. | | | 19,134 |
| 300 | | | | Capitol Federal Financial | | | 13,680 |
| 400 | | | | Cardinal Health, Inc. | | | 13,788 |
| 500 | | @ | | Career Education Corp. | | | 8,970 |
| 400 | | | | Carlisle Cos., Inc. | | | 8,280 |
| 800 | | @ | | Carmax, Inc. | | | 6,304 |
| 700 | | | | Carnival Corp. | | | 17,024 |
| 1,200 | | | | Caterpillar, Inc. | | | 53,604 |
| 800 | | @ | | CB Richard Ellis Group, Inc. | | | 3,456 |
| 1,400 | | | | CBS Corp. - Class B | | | 11,466 |
| 700 | | @ | | Celgene Corp. | | | 38,696 |
| | | | | | | |
| Shares | | | | | | Value |
| | | | | | | |
| United States: (continued) | | | |
| 700 | | | | Centex Corp. | | $ | 7,448 |
| 200 | | @ | | Cephalon, Inc. | | | 15,408 |
| 200 | | @ | | Cerner Corp. | | | 7,690 |
| 600 | | | | CH Robinson Worldwide, Inc. | | | 33,018 |
| 1,500 | | | | Charles Schwab Corp. | | | 24,255 |
| 1,000 | | | | Chesapeake Energy Corp. | | | 16,170 |
| 3,870 | | | | Chevron Corp. | | | 286,264 |
| 200 | | @ | | Chipotle Mexican Grill, Inc. | | | 12,396 |
| 600 | | | | Chubb Corp. | | | 30,600 |
| 600 | | | | Cincinnati Financial Corp. | | | 17,442 |
| 11,290 | | @ | | Cisco Systems, Inc. | | | 184,027 |
| 1,400 | | | | CIT Group, Inc. | | | 6,356 |
| 10,080 | | | | Citigroup, Inc. | | | 67,637 |
| 200 | | | | City National Corp. | | | 9,740 |
| 200 | | | | Cliffs Natural Resources, Inc. | | | 5,122 |
| 300 | | | | Clorox Co. | | | 16,668 |
| 100 | | | | CME Group, Inc. | | | 20,811 |
| 600 | | @ | | Coach, Inc. | | | 12,462 |
| 4,240 | | | | Coca-Cola Co. | | | 191,945 |
| 700 | | @ | | Cognizant Technology Solutions Corp. | | | 12,642 |
| 960 | | | | Colgate-Palmolive Co. | | | 65,798 |
| 5,470 | | | | Comcast Corp. - Class A | | | 92,334 |
| 315 | | | | Commerce Bancshares, Inc. | | | 13,844 |
| 600 | | | | Commercial Metals Co. | | | 7,122 |
| 500 | | @ | | Computer Sciences Corp. | | | 17,570 |
| 1,000 | | | | ConAgra Foods, Inc. | | | 16,500 |
| 2,860 | | | | ConocoPhillips | | | 148,148 |
| 400 | | | | Consol Energy, Inc. | | | 11,432 |
| 600 | | | | Consolidated Edison, Inc. | | | 23,358 |
| 400 | | | | Constellation Energy Group, Inc. | | | 10,036 |
| 1,000 | | @ | | Continental Airlines, Inc. | | | 18,060 |
| 1,000 | | @ | | Convergys Corp. | | | 6,410 |
| 300 | | | | Con-way, Inc. | | | 7,980 |
| 600 | | | | Cooper Industries Ltd. | | | 17,538 |
| 400 | | | | Corn Products International, Inc. | | | 11,540 |
| 2,600 | | | | Corning, Inc. | | | 24,778 |
| 400 | | | | Corporate Executive Board Co. | | | 8,824 |
| 700 | | | | Costco Wholesale Corp. | | | 36,750 |
| 100 | | @ | | Covance, Inc. | | | 4,603 |
| 200 | | | | CR Bard, Inc. | | | 16,852 |
| 900 | | @ | | Crown Castle International Corp. | | | 15,822 |
| 700 | | @ | | Crown Holdings, Inc. | | | 13,440 |
| 700 | | | | CSX Corp. | | | 22,729 |
| 200 | | | | Cullen/Frost Bankers, Inc. | | | 10,136 |
| 400 | | | | Cummins, Inc. | | | 10,692 |
| 2,660 | | | | CVS Caremark Corp. | | | 76,448 |
| 400 | | @ | | Cypress Semiconductor Corp. | | | 1,788 |
| 1,000 | | | | D.R. Horton, Inc. | | | 7,070 |
| 400 | | | | Danaher Corp. | | | 22,644 |
| 300 | | @ | | DaVita, Inc. | | | 14,871 |
| 600 | | | | Deere & Co. | | | 22,992 |
| 3,000 | | @ | | Dell, Inc. | | | 30,720 |
| 4,675 | | @ | | Delta Airlines, Inc. | | | 53,576 |
| 800 | | @ | | Denbury Resources, Inc. | | | 8,736 |
| 910 | | | | Devon Energy Corp. | | | 59,796 |
| 200 | | | | DeVry, Inc. | | | 11,482 |
| 500 | | | | Diebold, Inc. | | | 14,045 |
| 1,200 | | @ | | DIRECTV Group, Inc. | | | 27,492 |
| 1,100 | | | | Discover Financial Services | | | 10,483 |
| 300 | | @ | | Discovery Communications, Inc. - Class A | | | 4,248 |
| 300 | | @ | | Discovery Communications, Inc. - Class C | | | 4,017 |
| 700 | | @ | | Dish Network Corp. | | | 7,763 |
| 1,000 | | | | Dominion Resources, Inc. | | | 35,840 |
See Accompanying Notes to Financial Statements
101
| | |
ING RUSSELL™ GLOBAL LARGE CAP INDEX
85% PORTFOLIO | | PORTFOLIO OF INVESTMENTS ASOF DECEMBER 31, 2008 (CONTINUED) |
| | | | | | | |
| Shares | | | | | | Value |
| | | | | | | |
| United States: (continued) | | | |
| 300 | | | | Donaldson Co., Inc. | | $ | 10,095 |
| 600 | | | | Dover Corp. | | | 19,752 |
| 1,500 | | | | Dow Chemical Co. | | | 22,635 |
| 800 | | @ | | Dr Pepper Snapple Group, Inc. | | | 13,000 |
| 500 | | @ | | DreamWorks Animation SKG, Inc. | | | 12,630 |
| 300 | | | | DTE Energy Co. | | | 10,701 |
| 1,800 | | | | Duke Energy Corp. | | | 27,018 |
| 200 | | | | Dun & Bradstreet Corp. | | | 15,440 |
| 300 | | | | Eastman Chemical Co. | | | 9,513 |
| 1,000 | | | | Eastman Kodak Co. | | | 6,580 |
| 400 | | | | Eaton Corp. | | | 19,884 |
| 400 | | | | Eaton Vance Corp. | | | 8,404 |
| 2,300 | | @ | | eBay, Inc. | | | 32,108 |
| 500 | | | | Ecolab, Inc. | | | 17,575 |
| 600 | | | | Edison International | | | 19,272 |
| 300 | | @ | | Edwards Lifesciences Corp. | | | 16,485 |
| 1,500 | | | | EI Du Pont de Nemours & Co. | | | 37,950 |
| 1,100 | | | | El Paso Corp. | | | 8,613 |
| 700 | | @ | | Electronic Arts, Inc. | | | 11,228 |
| 1,800 | | | | Eli Lilly & Co. | | | 72,486 |
| 500 | | | | Embarq Corp. | | | 17,980 |
| 3,500 | | @ | | EMC Corp. | | | 36,645 |
| 1,300 | | | | Emerson Electric Co. | | | 47,593 |
| 200 | | @ | | Encore Acquisition Co. | | | 5,104 |
| 200 | | @ | | Energizer Holdings, Inc. | | | 10,828 |
| 300 | | | | Entergy Corp. | | | 24,939 |
| 550 | | | | EOG Resources, Inc. | | | 36,619 |
| 500 | | | | Equifax, Inc. | | | 13,260 |
| 300 | | | | Equitable Resources, Inc. | | | 10,065 |
| 300 | | | | Erie Indemnity Co. | | | 11,289 |
| 400 | | | | Estee Lauder Cos., Inc. | | | 12,384 |
| 1,300 | | | | Exelon Corp. | | | 72,293 |
| 500 | | | | Expeditors International Washington, Inc. | | | 16,635 |
| 300 | | @ | | Express Scripts, Inc. | | | 16,494 |
| 9,560 | | | | ExxonMobil Corp. | | | 763,175 |
| 800 | | | | Family Dollar Stores, Inc. | | | 20,856 |
| 600 | | | | FedEx Corp. | | | 38,490 |
| 800 | | | | Fidelity National Information Services, Inc. | | | 13,016 |
| 800 | | | | Fidelity National Title Group, Inc. | | | 14,200 |
| 1,100 | | | | Fifth Third Bancorp. | | | 9,086 |
| 400 | | | | First American Corp. | | | 11,556 |
| 100 | | @ | | First Solar, Inc. | | | 13,796 |
| 500 | | | | FirstEnergy Corp. | | | 24,290 |
| 400 | | @ | | Fiserv, Inc. | | | 14,548 |
| 600 | | @ | | Flir Systems, Inc. | | | 18,408 |
| 600 | | | | Fluor Corp. | | | 26,922 |
| 200 | | | | FMC Corp. | | | 8,946 |
| 300 | | @ | | FMC Technologies, Inc. | | | 7,149 |
| 4,000 | | @ | | Ford Motor Co. | | | 9,160 |
| 400 | | | | Forest City Enterprises, Inc. | | | 2,680 |
| 700 | | @ | | Forest Laboratories, Inc. | | | 17,829 |
| 300 | | | | Fortune Brands, Inc. | | | 12,384 |
| 600 | | | | FPL Group, Inc. | | | 30,198 |
| 300 | | | | Franklin Resources, Inc. | | | 19,134 |
| 600 | | | | Freeport-McMoRan Copper & Gold, Inc. | | | 14,664 |
| 600 | | | | Frontier Oil Corp. | | | 7,578 |
| 900 | | | | Fulton Financial Corp. | | | 8,658 |
| 1,200 | | | | Gap, Inc. | | | 16,068 |
| 910 | | @ | | Genentech, Inc. | | | 75,448 |
| 700 | | | | General Dynamics Corp. | | | 40,313 |
| 18,390 | | | | General Electric Co. | | | 297,918 |
| 600 | | | | General Mills, Inc. | | | 36,450 |
| 1,200 | | | | General Motors Corp. | | | 3,840 |
| | | | | | | |
| Shares | | | | | | Value |
| | | | | | | |
| United States: (continued) | | | |
| 200 | | @ | | Gen-Probe, Inc. | | $ | 8,568 |
| 300 | | | | Genuine Parts Co. | | | 11,358 |
| 1,300 | | | | Genworth Financial, Inc. | | | 3,679 |
| 550 | | @ | | Genzyme Corp. | | | 36,504 |
| 1,700 | | @ | | Gilead Sciences, Inc. | | | 86,938 |
| 400 | | | | Global Payments, Inc. | | | 13,116 |
| 690 | | | | Goldman Sachs Group, Inc. | | | 58,229 |
| 700 | | @ | | Goodyear Tire & Rubber Co. | | | 4,179 |
| 470 | | @ | | Google, Inc. - Class A | | | 144,596 |
| 400 | | | | Graco, Inc. | | | 9,492 |
| 700 | | | | Great Plains Energy, Inc. | | | 13,531 |
| 300 | | | | Greif, Inc. - Class A | | | 10,029 |
| 300 | | | | Guess ?, Inc. | | | 4,605 |
| 500 | | | | H&R Block, Inc. | | | 11,360 |
| 1,600 | | | | Halliburton Co. | | | 29,088 |
| 400 | | @ | | Hansen Natural Corp. | | | 13,412 |
| 400 | | | | Harley-Davidson, Inc. | | | 6,788 |
| 400 | | | | Harris Corp. | | | 15,220 |
| 400 | | | | Hartford Financial Services Group, Inc. | | | 6,568 |
| 400 | | | | Hasbro, Inc. | | | 11,668 |
| 600 | | | | Hawaiian Electric Industries | | | 13,284 |
| 600 | | | | HCC Insurance Holdings, Inc. | | | 16,050 |
| 600 | | @ | | Health Net, Inc. | | | 6,534 |
| 700 | | | | Hearst-Argyle Television, Inc. | | | 4,242 |
| 200 | | @ | | Henry Schein, Inc. | | | 7,338 |
| 400 | | | | Hershey Co. | | | 13,896 |
| 1,300 | | @ | | Hertz Global Holdings, Inc. | | | 6,591 |
| 400 | | | | Hess Corp. | | | 21,456 |
| 4,780 | | | | Hewlett-Packard Co. | | | 173,466 |
| 700 | | | | HJ Heinz Co. | | | 26,320 |
| 500 | | @ | | Hologic, Inc. | | | 6,535 |
| 3,650 | | | | Home Depot, Inc. | | | 84,023 |
| 1,300 | | | | Honeywell International, Inc. | | | 42,679 |
| 500 | | @ | | Hospira, Inc. | | | 13,410 |
| 800 | | | | Hudson City Bancorp., Inc. | | | 12,768 |
| 500 | | @ | | Humana, Inc. | | | 18,640 |
| 1,400 | | | | Huntington Bancshares, Inc. | | | 10,724 |
| 800 | | | | Illinois Tool Works, Inc. | | | 28,040 |
| 900 | | @ | | Ingram Micro, Inc. | | | 12,051 |
| 200 | | | | Integrys Energy Group, Inc. | | | 8,596 |
| 11,410 | | | | Intel Corp. | | | 167,271 |
| 200 | | @ | | IntercontinentalExchange, Inc. | | | 16,488 |
| 2,660 | | | | International Business Machines Corp. | | | 223,866 |
| 400 | | | | International Flavors & Fragrances, Inc. | | | 11,888 |
| 1,400 | | | | International Paper Co. | | | 16,520 |
| 400 | | | | International Speedway Corp. | | | 11,492 |
| 600 | | | | Intersil Corp. | | | 5,514 |
| 500 | | @ | | Intuit, Inc. | | | 11,895 |
| 100 | | @ | | Intuitive Surgical, Inc. | | | 12,699 |
| 800 | | | | Invesco Ltd. | | | 11,552 |
| 300 | | | | ITT Corp. | | | 13,797 |
| 1,100 | | | | Jabil Circuit, Inc. | | | 7,425 |
| 400 | | @ | | Jacobs Engineering Group, Inc. | | | 19,240 |
| 600 | | | | Janus Capital Group, Inc. | | | 4,818 |
| 300 | | | | JB Hunt Transport Services, Inc. | | | 7,881 |
| 700 | | | | Jefferies Group, Inc. | | | 9,842 |
| 400 | | | | JM Smucker Co. | | | 17,344 |
| 400 | | | | John Wiley & Sons, Inc. | | | 14,232 |
| 5,250 | | | | Johnson & Johnson | | | 314,108 |
| 900 | | | | Johnson Controls, Inc. | | | 16,344 |
| 200 | | | | Joy Global, Inc. | | | 4,578 |
| 6,850 | | | | JPMorgan Chase & Co. | | | 215,981 |
| 700 | | @ | | Juniper Networks, Inc. | | | 12,257 |
See Accompanying Notes to Financial Statements
102
| | |
ING RUSSELL™ GLOBAL LARGE CAP INDEX
85% PORTFOLIO | | PORTFOLIO OF INVESTMENTS ASOF DECEMBER 31, 2008 (CONTINUED) |
| | | | | | | |
| Shares | | | | | | Value |
| | | | | | | |
| United States: (continued) | | | |
| 400 | | | | Kellogg Co. | | $ | 17,540 |
| 700 | | | | Kimberly-Clark Corp. | | | 36,918 |
| 500 | | | | KLA-Tencor Corp. | | | 10,895 |
| 700 | | @ | | Kohl’s Corp. | | | 25,340 |
| 3,280 | | | | Kraft Foods, Inc. | | | 88,068 |
| 1,100 | | | | Kroger Co. | | | 29,051 |
| 200 | | | | L-3 Communications Holdings, Inc. | | | 14,756 |
| 300 | | @ | | Laboratory Corp. of America Holdings | | | 19,323 |
| 400 | | @ | | Lam Research Corp. | | | 8,512 |
| 200 | | | | Landstar System, Inc. | | | 7,686 |
| 400 | | @ | | Las Vegas Sands Corp. | | | 2,372 |
| 300 | | @ | | Leap Wireless International, Inc. | | | 8,067 |
| 600 | | | | Leggett & Platt, Inc. | | | 9,114 |
| 400 | | | | Lender Processing Services, Inc. | | | 11,780 |
| 800 | | | | Lennar Corp. | | | 6,936 |
| 4,300 | | @ | | Level 3 Communications, Inc. | | | 3,010 |
| 900 | | @ | | Liberty Media Corp. - Entertainment | | | 15,732 |
| 132 | | @ | | Life Technologies Corp. | | | 3,077 |
| 400 | | @ | | LifePoint Hospitals, Inc. | | | 9,136 |
| 700 | | | | Limited Brands, Inc. | | | 7,028 |
| 500 | | @ | | Lincare Holdings, Inc. | | | 13,465 |
| 700 | | | | Linear Technology Corp. | | | 15,484 |
| 1,000 | | @ | | LKQ Corp. | | | 11,660 |
| 590 | | | | Lockheed Martin Corp. | | | 49,607 |
| 700 | | | | Loews Corp. | | | 19,775 |
| 400 | | | | Lorillard, Inc. | | | 22,540 |
| 3,100 | | | | Lowe’s Cos., Inc. | | | 66,712 |
| 300 | | | | Lubrizol Corp. | | | 10,917 |
| 200 | | | | M&T Bank Corp. | | | 11,482 |
| 700 | | | | Manitowoc Co., Inc. | | | 6,062 |
| 1,200 | | | | Marathon Oil Corp. | | | 32,832 |
| 500 | | @ | | Mariner Energy, Inc. | | | 5,100 |
| 900 | | | | Marriott International, Inc. | | | 17,505 |
| 1,000 | | | | Marsh & McLennan Cos., Inc. | | | 24,270 |
| 900 | | | | Masco Corp. | | | 10,017 |
| 100 | | | | Mastercard, Inc. | | | 14,293 |
| 1,000 | | | | Mattel, Inc. | | | 16,000 |
| 500 | | @ | | McAfee, Inc. | | | 17,285 |
| 300 | | | | McCormick & Co., Inc. | | | 9,558 |
| 600 | | @ | | McDermott International, Inc. | | | 5,928 |
| 2,070 | | | | McDonald’s Corp. | | | 128,733 |
| 600 | | | | McGraw-Hill Cos., Inc. | | | 13,914 |
| 400 | | | | McKesson Corp. | | | 15,492 |
| 600 | | | | MDU Resources Group, Inc. | | | 12,948 |
| 800 | | @ | | Medco Health Solutions, Inc. | | | 33,528 |
| 2,070 | | | | Medtronic, Inc. | | | 65,039 |
| 500 | | @ | | MEMC Electronic Materials, Inc. | | | 7,140 |
| 3,870 | | | | Merck & Co., Inc. | | | 117,648 |
| 300 | | | | Mercury General Corp. | | | 13,797 |
| 2,400 | | | | Merrill Lynch & Co., Inc. | | | 27,936 |
| 1,100 | | | | Metlife, Inc. | | | 38,346 |
| 400 | | @ | | MGM Mirage | | | 5,504 |
| 600 | | | | Microchip Technology, Inc. | | | 11,718 |
| 14,060 | | | | Microsoft Corp. | | | 273,326 |
| 200 | | @ | | Mohawk Industries, Inc. | | | 8,594 |
| 200 | | | | Molson Coors Brewing Co. | | | 9,784 |
| 1,160 | | | | Monsanto Co. | | | 81,606 |
| 700 | | @ | | Monster Worldwide, Inc. | | | 8,463 |
| 1,700 | | | | Morgan Stanley | | | 27,268 |
| 400 | | | | Mosaic Co. | | | 13,840 |
| 3,900 | | | | Motorola, Inc. | | | 17,277 |
| 400 | | | | Murphy Oil Corp. | | | 17,740 |
| 700 | | @ | | National Oilwell Varco, Inc. | | | 17,108 |
| | | | | | | |
| Shares | | | | | | Value |
| | | | | | | |
| United States: (continued) | | | |
| 800 | | | | National Semiconductor Corp. | | $ | 8,056 |
| 300 | | | | Nationwide Financial Services | | | 15,663 |
| 700 | | @ | | NetApp, Inc. | | | 9,779 |
| 800 | | | | New York Community Bancorp., Inc. | | | 9,568 |
| 800 | | | | Newmont Mining Corp. | | | 32,560 |
| 4,200 | | | | News Corp. - Class A | | | 38,178 |
| 400 | | @ | | NII Holdings, Inc. | | | 7,272 |
| 700 | | | | Nike, Inc. | | | 35,700 |
| 1,100 | | | | NiSource, Inc. | | | 12,067 |
| 600 | | | | Noble Corp. | | | 13,254 |
| 500 | | | | Noble Energy, Inc. | | | 24,610 |
| 600 | | | | Norfolk Southern Corp. | | | 28,230 |
| 400 | | | | Northeast Utilities | | | 9,624 |
| 300 | | | | Northern Trust Corp. | | | 15,642 |
| 600 | | | | Northrop Grumman Corp. | | | 27,024 |
| 600 | | @ | | Novellus Systems, Inc. | | | 7,404 |
| 600 | | @ | | NRG Energy, Inc. | | | 13,998 |
| 500 | | | | NSTAR | | | 18,245 |
| 600 | | @ | | Nuance Communications, Inc. | | | 6,216 |
| 800 | | | | Nucor Corp. | | | 36,960 |
| 1,400 | | @ | | Nvidia Corp. | | | 11,298 |
| 500 | | | | NYSE Euronext | | | 13,690 |
| 1,600 | | | | Occidental Petroleum Corp. | | | 95,984 |
| 200 | | @ | | Oceaneering International, Inc. | | | 5,828 |
| 300 | | | | Omnicare, Inc. | | | 8,328 |
| 700 | | | | Omnicom Group | | | 18,844 |
| 1,600 | | @ | | ON Semiconductor Corp. | | | 5,440 |
| 700 | | | | OneBeacon Insurance Group Ltd. | | | 7,308 |
| 7,420 | | @ | | Oracle Corp. | | | 131,557 |
| 600 | | | | Paccar, Inc. | | | 17,160 |
| 500 | | | | Pacific Gas & Electric Co. | | | 19,355 |
| 300 | | | | Pall Corp. | | | 8,529 |
| 200 | | @ | | Panera Bread Co. | | | 10,448 |
| 400 | | | | Parker Hannifin Corp. | | | 17,016 |
| 800 | | | | Paychex, Inc. | | | 21,024 |
| 400 | | | | Peabody Energy Corp. | | | 9,100 |
| 600 | | | | People’s United Financial, Inc. | | | 10,698 |
| 2,980 | | | | PepsiCo, Inc. | | | 163,215 |
| 500 | | | | PerkinElmer, Inc. | | | 6,955 |
| 300 | | | | Perrigo Co. | | | 9,693 |
| 600 | | @ | | PetroHawk Energy Corp. | | | 9,378 |
| 500 | | | | Petsmart, Inc. | | | 9,225 |
| 12,470 | | | | Pfizer, Inc. | | | 220,844 |
| 300 | | | | Pharmaceutical Product Development, Inc. | | | 8,703 |
| 3,970 | | | | Philip Morris International, Inc. | | | 172,735 |
| 300 | | | | Pinnacle West Capital Corp. | | | 9,639 |
| 500 | | | | Pitney Bowes, Inc. | | | 12,740 |
| 500 | | | | PNC Financial Services Group, Inc. | | | 24,500 |
| 300 | | | | PPG Industries, Inc. | | | 12,729 |
| 500 | | | | PPL Corp. | | | 15,345 |
| 500 | | | | Praxair, Inc. | | | 29,680 |
| 400 | | | | Precision Castparts Corp. | | | 23,792 |
| 700 | | | | Principal Financial Group, Inc. | | | 15,799 |
| 5,320 | | | | Procter & Gamble Co. | | | 328,890 |
| 300 | | | | Progress Energy, Inc. | | | 11,955 |
| 1,400 | | | | Progressive Corp. | | | 20,734 |
| 800 | | | | Prudential Financial, Inc. | | | 24,208 |
| 1,100 | | | | Public Service Enterprise Group, Inc. | | | 32,087 |
| 800 | | | | Pulte Homes, Inc. | | | 8,744 |
| 500 | | @ | | QLogic Corp. | | | 6,720 |
| 2,980 | | | | Qualcomm, Inc. | | | 106,773 |
| 400 | | | | Quest Diagnostics | | | 20,764 |
| 400 | | | | Questar Corp. | | | 13,076 |
See Accompanying Notes to Financial Statements
103
| | |
ING RUSSELL™ GLOBAL LARGE CAP INDEX
85% PORTFOLIO | | PORTFOLIO OF INVESTMENTS ASOF DECEMBER 31, 2008 (CONTINUED) |
| | | | | | | |
| Shares | | | | | | Value |
| | | | | | | |
| United States: (continued) | | | |
| 4,800 | | | | Qwest Communications International, Inc. | | $ | 17,472 |
| 300 | | | | Range Resources Corp. | | | 10,317 |
| 700 | | | | Raytheon Co. | | | 35,728 |
| 1,400 | | | | Regions Financial Corp. | | | 11,144 |
| 300 | | | | Reinsurance Group of America, Inc. | | | 12,846 |
| 900 | | | | Republic Services, Inc. | | | 22,311 |
| 400 | | | | Reynolds American, Inc. | | | 16,124 |
| 400 | | | | Rockwell Collins, Inc. | | | 15,636 |
| 200 | | | | Rohm & Haas Co. | | | 12,358 |
| 400 | | | | Ross Stores, Inc. | | | 11,892 |
| 500 | | | | Royal Caribbean Cruises Ltd. | | | 6,875 |
| 800 | | | | RPM International, Inc. | | | 10,632 |
| 200 | | | | Ryder System, Inc. | | | 7,756 |
| 1,200 | | | | Safeway, Inc. | | | 28,524 |
| 700 | | @ | | SAIC, Inc. | | | 13,636 |
| 700 | | @ | | SandRidge Energy, Inc. | | | 4,305 |
| 1,600 | | | | Sara Lee Corp. | | | 15,664 |
| 3,300 | | | | Schering-Plough Corp. | | | 56,199 |
| 2,170 | | | | Schlumberger Ltd. | | | 91,856 |
| 300 | | | | Scripps Networks Interactive - Class A | | | 6,600 |
| 700 | | | | Sealed Air Corp. | | | 10,458 |
| 100 | | @ | | Sears Holding Corp. | | | 3,887 |
| 300 | | | | Sempra Energy | | | 12,789 |
| 1,600 | | | | Service Corp. International | | | 7,952 |
| 300 | | @ | | Shaw Group, Inc. | | | 6,141 |
| 200 | | | | Sherwin-Williams Co. | | | 11,950 |
| 300 | | | | Sigma-Aldrich Corp. | | | 12,672 |
| 700 | | | | Smith International, Inc. | | | 16,023 |
| 500 | | | | Sonoco Products Co. | | | 11,580 |
| 1,600 | | | | Southern Co. | | | 59,200 |
| 700 | | | | Southern Copper Corp. | | | 11,242 |
| 1,300 | | | | Southwest Airlines Co. | | | 11,206 |
| 800 | | @ | | Southwestern Energy Co. | | | 23,176 |
| 1,300 | | | | Spectra Energy Corp. | | | 20,462 |
| 5,100 | | | | Sprint Nextel Corp. | | | 9,333 |
| 300 | | @ | | St. Joe Co. | | | 7,296 |
| 500 | | @ | | St. Jude Medical, Inc. | | | 16,480 |
| 1,100 | | | | Staples, Inc. | | | 19,712 |
| 1,600 | | @ | | Starbucks Corp. | | | 15,136 |
| 600 | | | | State Street Corp. | | | 23,598 |
| 700 | | | | Steel Dynamics, Inc. | | | 7,826 |
| 200 | | @ | | Stericycle, Inc. | | | 10,416 |
| 100 | | | | Strayer Education, Inc. | | | 21,441 |
| 500 | | | | Stryker Corp. | | | 19,975 |
| 2,200 | | @ | | Sun Microsystems, Inc. | | | 8,404 |
| 400 | | | | Sunoco, Inc. | | | 17,384 |
| 109 | | @ | | Sunpower Corp. - Class B | | | 3,318 |
| 500 | | | | SunTrust Bank | | | 14,770 |
| 700 | | | | Supervalu, Inc. | | | 10,220 |
| 1,600 | | @ | | Symantec Corp. | | | 21,632 |
| 1,100 | | | | Synovus Financial Corp. | | | 9,130 |
| 1,000 | | | | Sysco Corp. | | | 22,940 |
| 400 | | | | T. Rowe Price Group, Inc. | | | 14,176 |
| 1,700 | | | | Target Corp. | | | 58,701 |
| 700 | | | | TCF Financial Corp. | | | 9,562 |
| 400 | | @ | | Terex Corp. | | | 6,928 |
| 700 | | | | Tesoro Corp. | | | 9,219 |
| 2,200 | | | | Texas Instruments, Inc. | | | 34,144 |
| 800 | | @ | | Thermo Electron Corp. | | | 27,256 |
| 7,220 | | | | Time Warner, Inc. | | | 72,633 |
| 700 | | | | TJX Cos., Inc. | | | 14,399 |
| 500 | | @ | | Toll Brothers, Inc. | | | 10,715 |
| 300 | | | | Torchmark Corp. | | | 13,410 |
| | | | | | | |
| Shares | | | | | | Value |
| | | | | | | |
| United States: (continued) | | | |
| 200 | | | | Transatlantic Holdings, Inc. | | $ | 8,012 |
| 550 | | @ | | Transocean, Ltd. | | | 25,988 |
| 1,200 | | | | Travelers Cos., Inc. | | | 54,240 |
| 400 | | | | Trinity Industries, Inc. | | | 6,304 |
| 300 | | @ | | Ultra Petroleum Corp. | | | 10,353 |
| 800 | | | | Union Pacific Corp. | | | 38,240 |
| 1,380 | | | | United Parcel Service, Inc. - Class B | | | 76,121 |
| 200 | | | | United States Steel Corp. | | | 7,440 |
| 1,970 | | | | United Technologies Corp. | | | 105,592 |
| 2,200 | | | | UnitedHealth Group, Inc. | | | 58,520 |
| 300 | | | | Universal Health Services, Inc. | | | 11,271 |
| 1,000 | | | | UnumProvident Corp. | | | 18,600 |
| 400 | | @ | | Urban Outfitters, Inc. | | | 5,992 |
| 3,180 | | | | US Bancorp. | | | 79,532 |
| 300 | | | | UST, Inc. | | | 20,814 |
| 1,000 | | | | Valero Energy Corp. | | | 21,640 |
| 600 | | | | Valley National Bancorp. | | | 12,150 |
| 200 | | @ | | Varian Medical Systems, Inc. | | | 7,008 |
| 600 | | @ | | Varian Semiconductor Equipment Associates, Inc. | | | 10,872 |
| 500 | | @ | | VeriSign, Inc. | | | 9,540 |
| 5,250 | | | | Verizon Communications, Inc. | | | 177,975 |
| 400 | | @ | | Vertex Pharmaceuticals, Inc. | | | 12,152 |
| 200 | | | | VF Corp. | | | 10,954 |
| 1,100 | | @ | | Viacom - Class B | | | 20,966 |
| 700 | | | | Visa, Inc. | | | 36,715 |
| 200 | | | | Vulcan Materials Co. | | | 13,916 |
| 300 | | | | WABCO Holdings, Inc. | | | 4,737 |
| 3,400 | | | | Wachovia Corp. | | | 18,836 |
| 1,600 | | | | Walgreen Co. | | | 39,472 |
| 4,140 | | | | Wal-Mart Stores, Inc. | | | 232,088 |
| 3,770 | | | | Walt Disney Co. | | | 85,541 |
| 200 | | | | Walter Industries, Inc. | | | 3,502 |
| 600 | | | | Washington Federal, Inc. | | | 8,976 |
| 1,000 | | | | Waste Management, Inc. | | | 33,140 |
| 1,000 | | @ | | Weatherford International Ltd. | | | 10,820 |
| 500 | | | | Webster Financial Corp. | | | 6,890 |
| 900 | | @ | | WellPoint, Inc. | | | 37,917 |
| 7,040 | | | | Wells Fargo & Co. | | | 207,539 |
| 1,300 | | | | Western Union Co. | | | 18,642 |
| 800 | | | | Weyerhaeuser Co. | | | 24,488 |
| 1,200 | | | | Williams Cos., Inc. | | | 17,376 |
| 400 | | | | Wisconsin Energy Corp. | | | 16,792 |
| 200 | | | | WW Grainger, Inc. | | | 15,768 |
| 2,490 | | | | Wyeth | | | 93,400 |
| 700 | | | | Wyndham Worldwide Corp. | | | 4,585 |
| 1,600 | | | | Xcel Energy, Inc. | | | 29,680 |
| 2,000 | | | | Xerox Corp. | | | 15,940 |
| 700 | | | | Xilinx, Inc. | | | 12,474 |
| 1,000 | | | | XTO Energy, Inc. | | | 35,270 |
| 2,000 | | @ | | Yahoo!, Inc. | | | 24,400 |
| 800 | | | | Yum! Brands, Inc. | | | 25,200 |
| 500 | | @ | | Zimmer Holdings, Inc. | | | 20,210 |
| | | | | | | |
| | | | | | | 16,008,822 |
| | | | | | | |
| | | | Total Common Stock
(Cost $43,238,392) | | | 34,526,129 |
| | | | | | | |
| REAL ESTATE INVESTMENT TRUSTS: 0.8% | | | |
| Australia: 0.1% | | | |
| 7,058 | | | | CFS Retail Property Trust | | | 9,278 |
| 5,600 | | | | Stockland | | | 15,930 |
| 3,498 | | | | Westfield Group | | | 31,757 |
| | | | | | | |
| | | | | | | 56,965 |
| | | | | | | |
See Accompanying Notes to Financial Statements
104
| | |
ING RUSSELL™ GLOBAL LARGE CAP INDEX
85% PORTFOLIO | | PORTFOLIO OF INVESTMENTS ASOF DECEMBER 31, 2008 (CONTINUED) |
| | | | | | | |
| Shares | | | | | | Value |
| | | | | | | |
| France: 0.1% | | | |
| 139 | | | | Unibail | | $ | 20,766 |
| | | | | | | |
| | | | | | | 20,766 |
| | | | | | | |
| Hong Kong: 0.0% | | | |
| 7,500 | | | | Link Real Estate Investment Trust | | | 12,476 |
| | | | | | | |
| | | | | | | 12,476 |
| | | | | | | |
| Netherlands: 0.0% | | | |
| 198 | | | | Wereldhave NV | | | 17,465 |
| | | | | | | |
| | | | | | | 17,465 |
| | | | | | | |
| United Kingdom: 0.1% | | | |
| 756 | | | | Land Securities Group PLC | | | 10,164 |
| 1,398 | | | | Liberty International PLC | | | 9,679 |
| | | | | | | |
| | | | | | | 19,843 |
| | | | | | | |
| United States: 0.5% | | | |
| 900 | | | | Annaly Capital Management, Inc. | | | 14,283 |
| 453 | | | | Apartment Investment & Management Co. | | | 5,232 |
| 100 | | | | AvalonBay Communities, Inc. | | | 6,058 |
| 200 | | | | Boston Properties, Inc. | | | 11,000 |
| 300 | | | | BRE Properties, Inc. | | | 8,394 |
| 300 | | | | Camden Property Trust | | | 9,402 |
| 1,000 | | | | CapitalSource, Inc. | | | 4,620 |
| 600 | | | | Douglas Emmett, Inc. | | | 7,836 |
| 500 | | | | Equity Residential | | | 14,910 |
| 100 | | | | Essex Property Trust, Inc. | | | 7,675 |
| 200 | | | | Federal Realty Investment Trust | | | 12,416 |
| 400 | | | | HCP, Inc. | | | 11,108 |
| 200 | | | | Health Care Real Estate Investment Trust, Inc. | | | 8,440 |
| 1,600 | | | | HRPT Properties Trust | | | 5,392 |
| 300 | | | | Liberty Property Trust | | | 6,849 |
| 300 | | | | Mack-Cali Realty Corp. | | | 7,350 |
| 300 | | | | Plum Creek Timber Co., Inc. | | | 10,422 |
| 200 | | | | Public Storage, Inc. | | | 15,900 |
| 400 | | | | Simon Property Group, Inc. | | | 21,252 |
| 500 | | | | UDR, Inc. | | | 6,895 |
| 300 | | | | Ventas, Inc. | | | 10,071 |
| 200 | | | | Vornado Realty Trust | | | 12,070 |
| 400 | | | | Weingarten Realty Investors | | | 8,276 |
| | | | | | | |
| | | | | | | 225,851 |
| | | | | | | |
| | | | Total Real Estate Investment Trusts
(Cost $509,258) | | | 353,366 |
| | | | | | | |
| EXCHANGE-TRADED FUNDS: 17.8% | | | |
| Developed Markets: 1.0% | | | |
| 9,800 | | | | iShares MSCI EAFE Index Fund | | | 439,726 |
| | | | | | | |
| | | | | | | 439,726 |
| | | | | | | |
| Emerging Markets: 0.4% | | | |
| 6,200 | | | | iShares MSCI Emerging Markets Index Fund | | | 154,814 |
| | | | | | | |
| | | | | | | 154,814 |
| | | | | | | |
| United States: 16.4% | | | |
| 61,800 | | | | iShares Lehman Aggregate Bond Fund | | | 6,419,784 |
| 7,200 | | | | SPDR Trust Series 1 | | | 649,728 |
| | | | | | | |
| | | | | | | 7,069,512 |
| | | | | | | |
| | | | Total Exchange-Traded Funds
(Cost $7,402,824) | | | 7,664,052 |
| | | | | | | |
| | | | | | | |
| Shares | | | | | | Value |
| | | | | | | |
| PREFERRED STOCK: 0.6% | | | |
| Australia: 0.0% | | | |
| 181 | | @ | | Insurance Australia Group | | $ | 12,115 |
| | | | | | | |
| | | | | | | 12,115 |
| | | | | | | |
| Brazil: 0.5% | | | |
| 2,200 | | | | Banco Bradesco S.A. | | | 21,311 |
| 2,000 | | | | Banco Itau Holding Financeira SA | | | 22,384 |
| 300 | | | | Cia de Bebidas das Americas | | | 13,037 |
| 900 | | | | CIA Energetica de Minas Gerais | | | 12,261 |
| 3,100 | | | | Cia Vale do Rio Doce | | | 31,758 |
| 1,500 | | | | Gerdau SA | | | 9,687 |
| 3,900 | | | | Investimentos Itau SA | | | 13,396 |
| 900 | | | | Metalurgica Gerdau SA | | | 7,773 |
| 7,320 | | | | Petroleo Brasileiro SA | | | 71,693 |
| 700 | | | | Usinas Siderurgicas de Minas Gerais SA | | | 7,961 |
| | | | | | | |
| | | | | | | 211,261 |
| | | | | | | |
| Germany: 0.1% | | | |
| 244 | | | | Fresenius AG | | | 14,092 |
| 502 | | | | Henkel KGaA - Vorzug | | | 15,985 |
| 112 | | | | Porsche AG | | | 8,917 |
| 177 | | | | Volkswagen AG | | | 9,752 |
| | | | | | | |
| | | | | | | 48,746 |
| | | | | | | |
| | | | Total Preferred Stock
(Cost $410,105) | | | 272,122 |
| | | | | | | |
| RIGHTS: 0.0% | | | |
| Belgium: 0.0% | | | |
| 3,682 | | | | Fortis | | | — |
| | | | | | | |
| | | | | | | — |
| | | | | | | |
| Hong Kong: 0.0% | | | |
| 320 | | | | China Overseas Land & Investment Ltd. | | | 120 |
| | | | | | | |
| | | | | | | 120 |
| | | | | | | |
| | | | | | | | | | |
| Singapore: 0.0% |
| 1,000 | | | | DBS Group Holdings Ltd. | | | | | | 2,083 |
| | | | | | | | | | |
| | | | | | | | | | 2,083 |
| | | | | | | | | | |
| | | | Total Rights
(Cost $—) | | | | | | 2,203 |
| | | | | | | | | | |
| | | | Total Investments in Securities
(Cost $51,560,579)* | | 99.1 | % | | $ | 42,817,872 |
| | | | Other Assets and Liabilities - Net | | 0.9 | | | | 388,397 |
| | | | | | | | | | |
| | | | Net Assets | | 100.0 | % | | $ | 43,206,269 |
| | | | | | | | | | |
| @ | Non-income producing security |
| ADR | American Depositary Receipt |
| GDR | Global Depositary Receipt |
| ** | Investment in affiliate |
| X | Fair value determined by ING Funds Valuation Committee appointed by the Funds’ Board of Directors/Trustees. |
| * | Cost for federal income tax purposes is $51,926,329. |
| | | | |
Net unrealized depreciation consists of: | | | | |
Gross Unrealized Appreciation | | $ | 799,251 | |
Gross Unrealized Depreciation | | | (9,907,708 | ) |
| | | | |
Net Unrealized Depreciation | | $ | (9,108,457 | ) |
| | | | |
See Accompanying Notes to Financial Statements
105
| | |
ING RUSSELL™ GLOBAL LARGE CAP INDEX
85% PORTFOLIO | | PORTFOLIO OF INVESTMENTS ASOF DECEMBER 31, 2008 (CONTINUED) |
| | | |
Industry | | Percentage of
Net Assets | |
Advertising | | 0.0 | % |
Aerospace/Defense | | 1.2 | |
Agriculture | | 1.3 | |
Airlines | | 0.3 | |
Apartments | | 0.1 | |
Apparel | | 0.3 | |
Auto Manufacturers | | 1.2 | |
Auto Parts & Equipment | | 0.2 | |
Banks | | 8.1 | |
Beverages | | 1.5 | |
Biotechnology | | 1.0 | |
Building Materials | | 0.4 | |
Chemicals | | 1.9 | |
Coal | | 0.2 | |
Commercial Services | | 1.3 | |
Computers | | 2.1 | |
Cosmetics/Personal Care | | 1.2 | |
Distribution/Wholesale | | 0.4 | |
Diversified | | 0.2 | |
Diversified Financial Services | | 1.3 | |
Electric | | 3.5 | |
Electrical Components & Equipment | | 0.5 | |
Electronics | | 0.8 | |
Energy - Alternate Sources | | 0.1 | |
Engineering & Construction | | 0.8 | |
Entertainment | | 0.2 | |
Environmental Control | | 0.2 | |
Food | | 3.1 | |
Food Service | | 0.2 | |
Forest Products & Paper | | 0.3 | |
Forestry | | 0.0 | |
Gas | | 0.7 | |
Hand/Machine Tools | | 0.1 | |
Health Care | | 0.1 | |
Healthcare - Products | | 1.9 | |
Healthcare - Services | | 0.7 | |
Holding Companies - Diversified | | 0.3 | |
Home Builders | | 0.1 | |
Home Furnishings | | 0.2 | |
Household Products/Wares | | 0.3 | |
Housewares | | 0.0 | |
Insurance | | 3.6 | |
Internet | | 0.8 | |
Investment Companies | | 0.1 | |
Iron/Steel | | 0.9 | |
Leisure Time | | 0.1 | |
Lodging | | 0.2 | |
Machinery - Construction & Mining | | 0.3 | |
Machinery - Diversified | | 0.6 | |
Media | | 1.6 | |
Metal Fabricate/Hardware | | 0.1 | |
Mining | | 1.8 | |
Miscellaneous Manufacturing | | 2.0 | |
Mortgage | | 0.0 | |
Office Property | | 0.1 | |
Office/Business Equipment | | 0.3 | |
Oil & Gas | | 8.6 | |
| | | |
Industry | | Percentage of
Net Assets | |
Oil & Gas Services | | 0.6 | % |
Packaging & Containers | | 0.2 | |
Pharmaceuticals | | 5.2 | |
Pipelines | | 0.2 | |
Real Estate | | 0.6 | |
Regional Malls | | 0.1 | |
Retail | | 3.1 | |
Savings & Loans | | 0.1 | |
Semiconductors | | 1.5 | |
Shipbuilding | | 0.1 | |
Shopping Centers | | 0.2 | |
Software | | 1.6 | |
Storage | | 0.0 | |
Telecommunications | | 6.1 | |
Textiles | | 0.0 | |
Toys/Games/Hobbies | | 0.3 | |
Transportation | | 1.8 | |
Water | | 0.2 | |
Other Long-Term Investments | | 17.8 | |
Other Assets and Liabilities - Net | | 0.9 | |
| | | |
Net Assets | | 100.0 | % |
| | | |
The following table summarizes the inputs used as of December 31, 2008 in determining the Portfolio’s investments at fair value for purposes of SFAS 157:
| | | | | | |
| | | Investments in
Securities | | Other Financial
Instruments* |
Level 1 — Quoted Prices | | $ | 26,297,209 | | $ | — |
Level 2 — Other Significant Observable Inputs | | | 16,484,952 | | | — |
Level 3 — Significant Unobservable Inputs | | | 35,711 | | | — |
| | | | | | |
Total | | $ | 42,817,872 | | $ | — |
| | | | | | |
“Fair value” for purposes of SFAS 157 is different from “fair value” as used in the 1940 Act. The former generally implies market value, and can include market quotations as a source of value, and the latter refers to determinations of actual value in absence of available market quotations.
| * | Other financial instruments may include forward foreign currency contracts, futures, swaps, and written options. Forward foreign currency contracts and futures are reported at their unrealized gain/loss at year end. Swaps and written options are reported at their market value at year end. |
See Accompanying Notes to Financial Statements
106
| | |
ING RUSSELL™ GLOBAL LARGE CAP INDEX
85% PORTFOLIO | | PORTFOLIO OF INVESTMENTS ASOF DECEMBER 31, 2008 (CONTINUED) |
A roll forward of fair value measurements using significant unobservable inputs (Level 3) for the year ended December 31, 2008, was as follows:
| | | | | | |
| | | Investments in
Securities | | Other Financial
Instruments* |
Beginning Balance at 12/31/07 | | $ | — | | $ | — |
Net Purchases/(Sales) | | | — | | | — |
Accrued Discounts/(Premiums) | | | — | | | — |
Total Realized Gain/(Loss) | | | — | | | — |
Total Unrealized Appreciation/(Depreciation) | | | — | | | — |
Net Transfers In/(Out) of Level 3 | | | 35,711 | | | — |
| | | | | | |
Ending Balance at 12/31/08 | | $ | 35,711 | | $ | — |
| | | | | | |
| * | Other financial instruments may include forward foreign currency contracts, futures, swaps, and written options. Forward foreign currency contracts and futures are reported at their unrealized gain/loss at year end. Swaps and written options are reported at their market value at year end. |
For the year ended December 31, 2008, total change in unrealized gain (loss) on Level 3 securities included in the change in net assets was $818. Total unrealized gain (loss) for all securities (including Level 1 and Level 2) can be found on the accompanying Statement of Operations.
See Accompanying Notes to Financial Statements
107
| | |
ING WISDOMTREESM GLOBAL
HIGH-YIELDING EQUITY INDEX PORTFOLIO | | PORTFOLIO OF INVESTMENTS ASOF DECEMBER 31, 2008 |
| | | | | | | |
| Shares | | | | | | Value |
| | | | | | | |
| COMMON STOCK: 93.0% |
| Australia: 6.7% |
| 47,127 | | | | Alumina Ltd. | | $ | 47,480 |
| 76,366 | | | | AMP Ltd. | | | 291,167 |
| 5,206 | | | | ASX Ltd. | | | 121,692 |
| 86,385 | | | | Australia & New Zealand Banking Group Ltd. | | | 932,630 |
| 43,795 | | | | AXA Asia Pacific Holdings Ltd. | | | 152,225 |
| 25,676 | | | | BlueScope Steel Ltd. | | | 63,083 |
| 37,828 | | | | Brambles Ltd. | | | 196,537 |
| 23,194 | | | | Coca-Cola Amatil Ltd. | | | 149,047 |
| 53,646 | | | | Commonwealth Bank of Australia | | | 1,103,793 |
| 61,831 | | | | Foster’s Group Ltd. | | | 237,807 |
| 85,840 | | | | Insurance Australia Group | | | 233,942 |
| 64,826 | | | | John Fairfax Holdings Ltd. | | | 74,380 |
| 24,670 | | | | Lion Nathan Ltd. | | | 141,724 |
| 66,313 | | | | Macquarie Airports Management Ltd. | | | 111,625 |
| 10,750 | | | | Macquarie Group Ltd. | | | 218,175 |
| 38,369 | | | | Minara Resources Ltd. | | | 7,723 |
| 70,133 | | | | National Australia Bank Ltd. | | | 1,031,071 |
| 6,652 | | | | Orica Ltd. | | | 65,278 |
| 50,040 | | | | Publishing & Broadcasting Ltd. | | | 65,954 |
| 93,460 | | | | Qantas Airways Ltd. | | | 172,182 |
| 22,146 | | | | QBE Insurance Group Ltd. | | | 400,252 |
| 5,554 | | | | Sims Group Ltd. | | | 67,977 |
| 12,771 | | | | Sonic Healthcare Ltd. | | | 130,111 |
| 41,977 | | | | Suncorp-Metway Ltd. | | | 247,425 |
| 30,551 | | | | TABCORP Holdings Ltd. | | | 149,474 |
| 72,612 | | | | Tattersall’s Ltd. | | | 141,780 |
| 376,671 | | | | Telstra Corp., Ltd. | | | 1,008,362 |
| 20,592 | | | | Toll Holdings Ltd. | | | 88,969 |
| 39,947 | | @ | | Transurban Group | | | 151,105 |
| 23,130 | | | | Wesfarmers Ltd. | | | 291,943 |
| 109,138 | | | | Westpac Banking Corp. | | | 1,308,970 |
| 26,960 | | | | Woolworths Ltd. | | | 502,702 |
| | | | | | | |
| | | | | | | 9,906,585 |
| | | | | | | |
| Austria: 0.1% |
| 1,347 | | | | Bank of Austria - Escrow | | | — |
| 8,422 | | | | Telekom Austria AG | | | 122,541 |
| | | | | | | |
| | | | | | | 122,541 |
| | | | | | | |
| Belgium: 0.8% |
| 19,700 | | @ | | Anheuser-Busch InBev NV | | | 457,497 |
| 19,936 | | @ | | Anheuser-Busch InBev NV - VVPR Share | | | 111 |
| 11,820 | | | | Belgacom SA | | | 451,860 |
| 27,970 | | | | Dexia | | | 126,811 |
| 1,400 | | | | Mobistar SA | | | 100,988 |
| | | | | | | |
| | | | | | | 1,137,267 |
| | | | | | | |
| Brazil: 0.8% |
| 7,840 | | | | AES Tiete SA | | | 42,999 |
| 31,334 | | | | BM&F BOVESPA SA | | | 80,888 |
| 5,900 | | | | Cia de Concessoes Rodoviarias | | | 59,784 |
| 4,238 | | | | Cia Energetica de Minas Gerais | | | 45,524 |
| 17,500 | | | | CPFL Energia SA | | | 226,254 |
| 11,100 | | | | Natura Cosmeticos SA | | | 90,390 |
| 6,500 | | | | Souza Cruz SA | | | 122,920 |
| 16,000 | | | | Telecomunicacoes de Sao Paulo SA | | | 253,859 |
| 19,500 | | | | Tractebel Energia SA | | | 155,114 |
| 20,200 | | | | Uniao de Bancos Brasileiros SA | | | 128,632 |
| | | | | | | |
| | | | | | | 1,206,364 |
| | | | | | | |
| | | | | | | |
| Shares | | | | | | Value |
| | | | | | | |
| Canada: 1.9% |
| 10,850 | | | | Bank of Montreal | | $ | 274,656 |
| 13,600 | | | | Bank of Nova Scotia | | | 366,963 |
| 12,200 | | | | BCE, Inc. | | | 248,348 |
| 8,200 | | | | Canadian Imperial Bank of Commerce | | | 339,358 |
| 12,100 | | | | Great-West Lifeco, Inc. | | | 202,892 |
| 5,050 | | | | IGM Financial, Inc. | | | 145,016 |
| 3,750 | | | | National Bank of Canada | | | 95,079 |
| 9,850 | | | | Power Financial Corp. | | | 190,697 |
| 21,150 | | | | Royal Bank of Canada | | | 618,481 |
| 2,700 | | | | TELUS Corp. | | | 81,295 |
| 8,650 | | | | TransCanada Corp. | | | 232,418 |
| | | | | | | |
| | | | | | | 2,795,203 |
| | | | | | | |
| Chile: 0.2% |
| 2,826,267 | | | | Banco de Chile | | | 148,576 |
| 5,015,448 | | | | Banco Santander Chile SA | | | 161,974 |
| | | | | | | |
| | | | | | | 310,550 |
| | | | | | | |
| China: 0.2% |
| 376,000 | | | | PetroChina Co., Ltd. | | | 334,135 |
| | | | | | | |
| | | | | | | 334,135 |
| | | | | | | |
| Czech Republic: 0.3% |
| 1,000 | | | | Komercni Banka A/S | | | 162,913 |
| 10,600 | | | | Telefonica O2 Czech Republic A/S | | | 243,906 |
| | | | | | | |
| | | | | | | 406,819 |
| | | | | | | |
| Denmark: 0.3% |
| 1,350 | | | | D/S Norden | | | 47,629 |
| 14,750 | | | | Danske Bank A/S | | | 148,591 |
| 3,150 | | | | TrygVesta A/S | | | 198,512 |
| | | | | | | |
| | | | | | | 394,732 |
| | | | | | | |
| Finland: 0.8% |
| 4,513 | | | | Metso OYJ | | | 55,307 |
| 4,275 | | | | Neste Oil OYJ | | | 64,348 |
| 6,333 | | | | Outokumpu OYJ | | | 75,357 |
| 3,171 | | | | Rautaruukki OYJ | | | 55,383 |
| 18,784 | | | | Sampo OYJ | | | 355,532 |
| 12,201 | | | | Sanoma-WSOY OYJ | | | 158,468 |
| 19,000 | | | | Stora Enso OYJ (Euro Denominated Security) | | | 150,509 |
| 10,790 | | | | UPM-Kymmene OYJ | | | 138,314 |
| 3,033 | | | | Wartsila OYJ | | | 91,646 |
| | | | | | | |
| | | | | | | 1,144,864 |
| | | | | | | |
| France: 12.8% |
| 5,303 | | | | Accor SA | | | 261,223 |
| 14,094 | | | | Air France-KLM | | | 181,760 |
| 66,424 | | | | AXA SA | | | 1,490,926 |
| 27,014 | | | | BNP Paribas | | | 1,166,044 |
| 4,736 | | | | Bouygues SA | | | 200,917 |
| 2,038 | | | | Casino Guichard Perrachon SA | | | 155,325 |
| 10,445 | | | | Cie de Saint-Gobain | | | 493,528 |
| 2,698 | | | | CNP Assurances | | | 196,033 |
| 2,673 | | | | Compagnie Generale des Etablissements Michelin | | | 141,224 |
| 84,201 | | | | Credit Agricole SA | | | 945,756 |
| 5,527 | | | | Etablissements Maurel et Prom | | | 63,306 |
| 2,248 | | | | Euler Hermes SA | | | 110,800 |
| 100,554 | | | | France Telecom SA | | | 2,802,708 |
| 35,021 | | | | Gaz de France | | | 1,738,339 |
See Accompanying Notes to Financial Statements
108
| | |
ING WISDOMTREESM GLOBAL
HIGH-YIELDING EQUITY INDEX PORTFOLIO | | PORTFOLIO OF INVESTMENTS ASOF DECEMBER 31, 2008 (CONTINUED) |
| | | | | | | |
| Shares | | | | | | Value |
| | | | | | | |
| France: (continued) |
| 3,726 | | | | Lafarge SA | | $ | 227,887 |
| 5,734 | | | | Legrand SA | | | 109,810 |
| 74,758 | | | | Natixis | | | 132,615 |
| 5,504 | | | | Nexity | | | 86,133 |
| 18,917 | | | | PagesJaunes Groupe SA | | | 186,405 |
| 5,126 | | | | Peugeot SA | | | 87,637 |
| 3,234 | | | | PPR | | | 211,747 |
| 10,637 | | | | Renault SA | | | 277,583 |
| 35,153 | | | | Sanofi-Aventis | | | 2,248,496 |
| 6,212 | | | | Schneider Electric SA | | | 462,507 |
| 6,949 | | | | Scor SA | | | 160,546 |
| 1,600 | | | | Societe Des Autoroutes Paris-Rhin-Rhone | | | 111,595 |
| 10,979 | | | | Societe Television Francaise1 | | | 160,859 |
| 2,600 | | | | Thales SA | | | 108,896 |
| 51,395 | | | | Total SA | | | 2,825,652 |
| 1,006 | | | | Vallourec | | | 114,382 |
| 7,110 | | | | Veolia Environnement | | | 224,270 |
| 7,833 | | | | Vinci SA | | | 330,550 |
| 31,778 | | | | Vivendi | | | 1,035,772 |
| | | | | | | |
| | | | | | | 19,051,231 |
| | | | | | | |
| Germany: 4.7% |
| 8,479 | | | | Allianz AG | | | 900,968 |
| 18,565 | | | | BASF AG | | | 716,375 |
| 12,841 | | | | Commerzbank AG | | | 123,657 |
| 17,542 | | | | DaimlerChrysler AG | | | 660,872 |
| 15,544 | | | | Deutsche Bank AG | | | 619,786 |
| 12,478 | | | | Deutsche Lufthansa AG | | | 207,662 |
| 24,840 | | | | Deutsche Post AG | | | 416,431 |
| 132,065 | | | | Deutsche Telekom AG | | | 1,993,014 |
| 4,107 | | | | Muenchener Rueckversicherungs AG | | | 629,273 |
| 8,833 | | | | RWE AG | | | 779,963 |
| | | | | | | |
| | | | | | | 7,048,001 |
| | | | | | | |
| Greece: 0.4% |
| 7,714 | | | | Alpha Bank AE | | | 72,169 |
| 8,928 | | | | Hellenic Telecommunications Organization SA | | | 148,328 |
| 11,918 | | | | OPAP SA | | | 342,980 |
| 6,306 | | | | Piraeus Bank SA | | | 56,290 |
| | | | | | | |
| | | | | | | 619,767 |
| | | | | | | |
| Hong Kong: 1.1% |
| 44,600 | | | | Bank of East Asia Ltd. | | | 94,078 |
| 240,500 | | | | BOC Hong Kong Holdings Ltd. | | | 275,274 |
| 85,000 | | | | Cathay Pacific Airways Ltd. | | | 96,008 |
| 40,000 | | | | Citic Pacific Ltd. | | | 43,701 |
| 48,000 | | | | CLP Holdings Ltd. | | | 326,339 |
| 35,600 | | | | Hang Seng Bank Ltd. | | | 470,013 |
| 13,000 | | | | Hong Kong Exchanges and Clearing Ltd. | | | 124,812 |
| 49,000 | | | | HongKong Electric Holdings | | | 275,870 |
| | | | | | | |
| | | | | | | 1,706,095 |
| | | | | | | |
| Hungary: 0.1% |
| 29,704 | | | | Magyar Telekom Telecommunications PLC | | | 83,951 |
| | | | | | | |
| | | | | | | 83,951 |
| | | | | | | |
| Indonesia: 0.3% |
| 645,500 | | | | International Nickel Indonesia Tbk PT | | | 114,295 |
| 303,500 | | | | Telekomunikasi Indonesia Tbk PT | | | 192,124 |
| 202,000 | | | | Unilever Indonesia Tbk PT | | | 144,550 |
| | | | | | | |
| | | | | | | 450,969 |
| | | | | | | |
| | | | | | | |
| Shares | | | | | | Value |
| | | | | | | |
| Israel: 0.1% |
| 37,132 | | | | Bank Leumi Le-Israel BM | | $ | 77,666 |
| 71,547 | | | | Bezeq Israeli Telecommunication Corp., Ltd. | | | 117,623 |
| | | | | | | |
| | | | | | | 195,289 |
| | | | | | | |
| Italy: 5.7% |
| 24,137 | | | | Alleanza Assicurazioni S.p.A. | | | 198,399 |
| 18,289 | | | | Assicurazioni Generali S.p.A. | | | 504,949 |
| 289,934 | | | | Banca Monte dei Paschi di Siena S.p.A. | | | 633,111 |
| 10,760 | | | | Banca Popolare di Milano Scrl | | | 64,678 |
| 13,278 | | | | Banche Popolari Unite Scpa | | | 194,739 |
| 177,923 | | | | Enel S.p.A. | | | 1,146,107 |
| 85,896 | | | | ENI S.p.A. | | | 2,066,970 |
| 33,219 | | | | Intesa Sanpaolo S.p.A. - RNC | | | 85,933 |
| 461,746 | | | | Intesa Sanpaolo S.p.A. | | | 1,677,378 |
| 52,009 | | | | Mediaset S.p.A. | | | 299,677 |
| 15,994 | | | | Mediobanca S.p.A. | | | 164,477 |
| 60,902 | | | | Parmalat S.p.A | | | 102,169 |
| 45,015 | | | | Snam Rete Gas S.p.A. | | | 251,454 |
| 333,188 | | | | Telecom Italia S.p.A. | | | 548,151 |
| 209,935 | | | | Telecom Italia S.p.A. RNC | | | 239,024 |
| 67,476 | | | | Terna S.p.A | | | 222,669 |
| 61,835 | | | | Unipol S.p.A. | | | 96,912 |
| | | | | | | |
| | | | | | | 8,496,797 |
| | | | | | | |
| Japan: 0.4% |
| 4,600 | | | | Eisai Co., Ltd. | | | 191,956 |
| 78,700 | | | | Nissan Motor Co., Ltd. | | | 283,134 |
| 2,500 | | | | Oracle Corp. Japan | | | 108,283 |
| | | | | | | |
| | | | | | | 583,373 |
| | | | | | | |
| Malaysia: 0.6% |
| 116,000 | | | | Malayan Banking BHD | | | 171,564 |
| 51,900 | | | | MISC Bhd | | | 128,529 |
| 92,400 | | | | Public Bank BHD | | | 236,819 |
| 199,200 | | | | Telekom Malaysia BHD | | | 177,884 |
| 82,200 | | | | Tenaga Nasional BHD | | | 149,084 |
| | | | | | | |
| | | | | | | 863,880 |
| | | | | | | |
| Mexico: 0.2% |
| 38,100 | | | | Embotelladoras Arca SAB de CV | | | 67,404 |
| 178,674 | | | | Grupo Mexico SA de CV | | | 114,828 |
| 44,000 | | | | Grupo Modelo SA | | | 139,799 |
| | | | | | | |
| | | | | | | 322,031 |
| | | | | | | |
| Netherlands: 3.0% |
| 4,671 | | | | Akzo Nobel NV | | | 192,668 |
| 7,174 | | | | Koninklijke BAM Groep NV | | | 64,698 |
| 13,128 | | | | Reed Elsevier NV | | | 156,084 |
| 58,968 | | | | Royal Dutch Shell PLC - Class A | | | 1,549,272 |
| 46,332 | | | | Royal Dutch Shell PLC - Class B | | | 1,174,444 |
| 43,448 | | | | Royal KPN NV | | | 631,666 |
| 30,472 | | | | Unilever NV | | | 738,579 |
| | | | | | | |
| | | | | | | 4,507,411 |
| | | | | | | |
| New Zealand: 0.2% |
| 37,637 | | | | Fletcher Building Ltd. | | | 126,811 |
| 106,747 | | | | Telecom Corp. of New Zealand Ltd. | | | 143,471 |
| | | | | | | |
| | | | | | | 270,282 |
| | | | | | | |
| Norway: 0.1% |
| 3,020 | | | | Aker ASA | | | 59,088 |
| 43,350 | | | | DnB NOR ASA | | | 171,997 |
| | | | | | | |
| | | | | | | 231,085 |
| | | | | | | |
See Accompanying Notes to Financial Statements
109
| | |
ING WISDOMTREESM GLOBAL
HIGH-YIELDING EQUITY INDEX PORTFOLIO | | PORTFOLIO OF INVESTMENTS ASOF DECEMBER 31, 2008 (CONTINUED) |
| | | | | | | |
| Shares | | | | | | Value |
| | | | | | | |
| Philippines: 0.1% |
| 4,080 | | | | Philippine Long Distance Telephone Co. | | $ | 186,465 |
| | | | | | | |
| | | | | | | 186,465 |
| | | | | | | |
| Poland: 0.5% |
| 3,425 | | | | Bank Handlowy w Warszawie | | | 55,722 |
| 4,783 | | | | Bank Pekao SA | | | 205,179 |
| 7,763 | | | | KGHM Polska Miedz SA | | | 74,070 |
| 112,981 | | | | Polish Oil & Gas | | | 137,615 |
| 39,185 | | | | Telekomunikacja Polska SA | | | 254,503 |
| | | | | | | |
| | | | | | | 727,089 |
| | | | | | | |
| Portugal: 0.2% |
| 36,152 | | | | Portugal Telecom SGPS SA | | | 309,383 |
| | | | | | | |
| | | | | | | 309,383 |
| | | | | | | |
| Russia: 0.1% |
| 27,550 | | | | Surgutneftegaz ADR | | | 141,460 |
| | | | | | | |
| | | | | | | 141,460 |
| | | | | | | |
| Singapore: 1.0% |
| 29,000 | | | | DBS Group Holdings Ltd. | | | 170,821 |
| 35,000 | | | | Singapore Airlines Ltd. | | | 275,273 |
| 27,000 | | | | Singapore Exchange Ltd. | | | 96,179 |
| 375,000 | | | | Singapore Telecommunications Ltd. | | | 668,270 |
| 33,000 | | | | United Overseas Bank Ltd. | | | 298,222 |
| | | | | | | |
| | | | | | | 1,508,765 |
| | | | | | | |
| South Africa: 0.9% |
| 16,415 | | | | ABSA Group Ltd. | | | 193,144 |
| 3,731 | | | | Anglo Platinum Ltd. | | | 210,691 |
| 131,953 | | | | FirstRand Ltd. | | | 232,109 |
| 14,203 | | | | Nedcor Ltd. | | | 146,910 |
| 98,324 | | | | Sanlam Ltd. | | | 180,801 |
| 28,658 | | | | Standard Bank Group Ltd. | | | 258,570 |
| 12,106 | | | | Telkom SA Ltd. | | | 150,324 |
| | | | | | | |
| | | | | | | 1,372,549 |
| | | | | | | |
| South Korea: 0.6% |
| 5,468 | | @ | | KB Financial Group, Inc. | | | 146,300 |
| 11,560 | | | | Korea Exchange Bank | | | 59,525 |
| 7,250 | | | | KT Corp. | | | 216,253 |
| 1,725 | | | | SK Telecom Co., Ltd. | | | 286,724 |
| 3,438 | | | | S-Oil Corp. | | | 169,910 |
| | | | | | | |
| | | | | | | 878,712 |
| | | | | | | |
| Spain: 4.4% |
| 7,446 | | | | ACS Actividades de Construccion y Servicios SA | | | 345,766 |
| 93,000 | | | | Banco Bilbao Vizcaya Argentaria SA | | | 1,152,304 |
| 25,000 | | | | Banco De Sabadell SA | | | 171,145 |
| 15,224 | | | | Banco Espanol de Credito SA (Banesto) | | | 170,990 |
| 28,752 | | | | Banco Popular Espanol SA | | | 249,383 |
| 139,644 | | | | Banco Santander Central Hispano SA | | | 1,349,057 |
| 8,653 | | | | Banco Santander SA | | | 78,443 |
| 38,686 | | | | Corp. Mapfre SA | | | 131,936 |
| 2,251 | | | | Fomento de Construcciones y
Contratas SA | | | 74,858 |
| 19,598 | | | | Gestevision Telecinco SA | | | 211,106 |
| 21,904 | | | | Repsol YPF SA | | | 467,654 |
| 83,477 | | | | Telefonica SA | | | 1,884,215 |
| 11,641 | | | | Union Fenosa SA | | | 291,670 |
| | | | | | | |
| | | | | | | 6,578,527 |
| | | | | | | |
| | | | | | | |
| Shares | | | | | | Value |
| | | | | | | |
| Sweden: 2.0% |
| 13,600 | | | | Hennes & Mauritz AB | | $ | 540,942 |
| 63,500 | | | | Nordea Bank AB | | | 452,608 |
| 20,600 | | | | Sandvik AB | | | 132,320 |
| 15,900 | | | | Scania AB - A Shares | | | 160,608 |
| 12,600 | | | | Scania AB - B Shares | | | 128,209 |
| 8,450 | | | | Skandinaviska Enskilda Banken AB | | | 68,211 |
| 13,400 | | | | Skanska AB | | | 137,440 |
| 11,600 | | | | SKF AB - B Shares | | | 118,043 |
| 13,100 | | | | Svenska Cellulosa AB - B Shares | | | 113,740 |
| 15,000 | | | | Svenska Handelsbanken AB | | | 248,044 |
| 9,589 | | | | Swedbank AB | | | 56,639 |
| 68,100 | | | | TeliaSonera AB | | | 342,953 |
| 35,600 | | | | Volvo AB - Class A | | | 205,337 |
| 44,300 | | | | Volvo AB - Class B | | | 252,103 |
| | | | | | | |
| | | | | | | 2,957,197 |
| | | | | | | |
| Switzerland: 1.5% |
| 26,059 | | | | Credit Suisse Group | | | 730,292 |
| 8,173 | | | | Swiss Reinsurance | | | 400,196 |
| 1,026 | | | | Swisscom AG | | | 332,819 |
| 3,342 | | | | Zurich Financial Services AG | | | 730,163 |
| | | | | | | |
| | | | | | | 2,193,470 |
| | | | | | | |
| Taiwan: 2.4% |
| 131,200 | | | | Chi Mei Optoelectronics Corp. | | | 43,415 |
| 383,950 | | | | China Steel Corp. | | | 271,767 |
| 250,690 | | | | Chunghwa Telecom Co., Ltd. | | | 403,812 |
| 293,160 | | | | Compal Electronics, Inc. | | | 154,995 |
| 44,580 | | | | Delta Electronics, Inc. | | | 86,770 |
| 138,159 | | | | Far EasTone Telecommunications Co., Ltd. | | | 157,439 |
| 134,500 | | | | Formosa Chemicals & Fibre Co. | | | 164,828 |
| 231,000 | | | | Formosa Petrochemical Corp. | | | 479,417 |
| 140,000 | | | | Formosa Plastics Corp. | | | 186,762 |
| 22,150 | | | | MediaTek, Inc. | | | 149,812 |
| 351,000 | | | | Mega Financial Holdings Co., Ltd. | | | 123,798 |
| 290,000 | | | | Nan Ya Plastics Corp. | | | 313,852 |
| 27,000 | | | | Nan Ya Printed Circuit Board Corp. | | | 56,768 |
| 80,560 | | | | Siliconware Precision Industries Co. | | | 70,149 |
| 111,000 | | | | Taiwan Mobile Co., Ltd. | | | 165,171 |
| 489,321 | | | | Taiwan Semiconductor Manufacturing Co., Ltd. | | | 667,669 |
| 55,000 | | | | U-Ming Marine Transport Corp. | | | 66,397 |
| | | | | | | |
| | | | | | | 3,562,821 |
| | | | | | | |
| Thailand: 0.6% |
| 109,500 | | | | Advanced Info Service PCL | | | 252,712 |
| 64,900 | | | | PTT Chemical PCL | | | 60,505 |
| 62,500 | | | | PTT PLC | | | 318,588 |
| 52,200 | | | | Siam Cement PCL | | | 156,012 |
| 107,000 | | | | Thai Oil PCL | | | 73,622 |
| | | | | | | |
| | | | | | | 861,439 |
| | | | | | | |
| Turkey: 0.5% |
| 55,641 | | | | Akbank TAS | | | 175,303 |
| 23,245 | | | | Ford Otomotiv Sanayi A/S | | | 65,698 |
| 15,153 | | | | Tupras Turkiye Petrol Rafine | | | 160,364 |
| 53,581 | | | | Turkiye Halk Bankasi | | | 160,383 |
| 45,724 | | | | Turkiye Is Bankasi | | | 124,512 |
| | | | | | | |
| | | | | | | 686,260 |
| | | | | | | |
| United Kingdom: 12.7% |
| 30,472 | | | | AstraZeneca PLC | | | 1,246,623 |
| 65,878 | | | | Aviva PLC | | | 373,297 |
See Accompanying Notes to Financial Statements
110
| | |
ING WISDOMTREESM GLOBAL
HIGH-YIELDING EQUITY INDEX PORTFOLIO | | PORTFOLIO OF INVESTMENTS ASOF DECEMBER 31, 2008 (CONTINUED) |
| | | | | | | |
| Shares | | | | | | Value |
| | | | | | | |
| United Kingdom: (continued) |
| 363,578 | | | | BP PLC | | $ | 2,806,618 |
| 33,539 | | | | British American Tobacco PLC | | | 874,927 |
| 16,961 | | | | British Energy Group PLC | | | 190,064 |
| 263,846 | | | | BT Group PLC | | | 530,622 |
| 39,703 | | | | Cable & Wireless PLC | | | 89,790 |
| 17,989 | | | | Cadbury PLC | | | 156,605 |
| 106,772 | | | | Centrica PLC | | | 411,052 |
| 46,220 | | | | Diageo PLC | | | 649,431 |
| 121,079 | | | | GlaxoSmithKline PLC | | | 2,251,797 |
| 43,166 | | | | Home Retail Group | | | 133,229 |
| 303,551 | | | | HSBC Holdings PLC | | | 2,970,906 |
| 17,144 | | | | Imperial Tobacco Group PLC | | | 457,934 |
| 15,261 | | | | Inmarsat PLC | | | 104,822 |
| 26,193 | | | | J Sainsbury PLC | | | 124,994 |
| 130,066 | | | | Kingfisher PLC | | | 256,220 |
| 233,732 | | | | Legal & General Group PLC | | | 261,247 |
| 60,113 | | | | LogicaCMG PLC | | | 60,432 |
| 28,400 | | | | Man Group PLC | | | 97,700 |
| 45,657 | | | | Marks & Spencer Group PLC | | | 143,114 |
| 59,737 | | | | National Grid PLC | | | 590,289 |
| 140,125 | | | | Old Mutual PLC | | | 112,625 |
| 17,880 | | | | Pearson PLC | | | 168,525 |
| 29,392 | | | | Persimmon PLC | | | 98,268 |
| 85,585 | | | | Rentokil Initial PLC | | | 54,717 |
| 67,725 | | | | Royal & Sun Alliance Insurance Group | | | 134,957 |
| 18,160 | | | | Scottish & Southern Energy PLC | | | 320,185 |
| 10,402 | | | | Smiths Group PLC | | | 133,665 |
| 33,788 | | | | Standard Life PLC | | | 98,634 |
| 10,683 | | | | Tate & Lyle PLC | | | 62,247 |
| 29,087 | | | | TUI Travel PLC | | | 98,592 |
| 19,611 | | | | Unilever PLC | | | 450,461 |
| 1,183,590 | | | | Vodafone Group PLC | | | 2,423,581 |
| | | | | | | |
| | | | | | | 18,938,170 |
| | | | | | | |
| United States: 23.7% |
| 10,600 | | | | Allied Capital Corp. | | | 28,514 |
| 119,000 | | | | Altria Group, Inc. | | | 1,792,140 |
| 7,500 | | | | Ameren Corp. | | | 249,450 |
| 8,500 | | | | American Electric Power Co., Inc. | | | 282,880 |
| 104,250 | | | | AT&T, Inc. | | | 2,971,125 |
| 166,180 | | | | Bank of America Corp. | | | 2,339,814 |
| 16,400 | | | | BB&T Corp. | | | 450,344 |
| 45,850 | | | | Bristol-Myers Squibb Co. | | | 1,066,013 |
| 8,900 | | | | CBS Corp. - Class B | | | 72,891 |
| 8,200 | | | | CenterPoint Energy, Inc. | | | 103,484 |
| 3,700 | | | | Cincinnati Financial Corp. | | | 107,559 |
| 181,900 | | | | Citigroup, Inc. | | | 1,220,549 |
| 5,000 | | | | Comerica, Inc. | | | 99,250 |
| 6,250 | | | | Consolidated Edison, Inc. | | | 243,313 |
| 6,200 | | | | Dominion Resources, Inc. | | | 222,208 |
| 20,200 | | | | Dow Chemical Co. | | | 304,818 |
| 5,000 | | | | DTE Energy Co. | | | 178,350 |
| 30,150 | | | | Duke Energy Corp. | | | 452,552 |
| 16,800 | | | | EI Du Pont de Nemours & Co. | | | 425,040 |
| 18,400 | | | | Eli Lilly & Co. | | | 740,968 |
| 3,200 | | | | Embarq Corp. | | | 115,072 |
| 9,400 | | | | Fidelity National Title Group, Inc. | | | 166,850 |
| 33,600 | | | | Fifth Third Bancorp. | | | 277,536 |
| 17,050 | | | | Frontier Communications Corp. | | | 149,017 |
| 7,050 | | | | Gannett Co., Inc. | | | 56,400 |
| 169,650 | | | | General Electric Co. | | | 2,748,330 |
| 2,400 | | | | Genuine Parts Co. | | | 90,864 |
| 3,100 | | | | Hershey Co. | | | 107,694 |
| | | | | | | |
| Shares | | | | | | Value |
| | | | | | | |
| United States: (continued) |
| 28,350 | | | | Home Depot, Inc. | | $ | 652,617 |
| 20,150 | | | | Huntington Bancshares, Inc. | | | 154,349 |
| 6,950 | | | | International Paper Co. | | | 82,010 |
| 54,200 | | | | JPMorgan Chase & Co. | | | 1,708,926 |
| 13,100 | | | | Keycorp | | | 111,612 |
| 5,950 | | | | Kimberly-Clark Corp. | | | 313,803 |
| 22,450 | | | | Kraft Foods, Inc. | | | 602,783 |
| 7,300 | | | | Marshall & Ilsley Corp. | | | 99,572 |
| 13,150 | | | | Masco Corp. | | | 146,360 |
| 8,300 | | | | Mattel, Inc. | | | 132,800 |
| 35,900 | | | | Merck & Co., Inc. | | | 1,091,360 |
| 52,350 | | | | National City Corp. | | | 94,754 |
| 15,400 | | | | New York Community Bancorp., Inc. | | | 184,184 |
| 8,500 | | | | Newell Rubbermaid, Inc. | | | 83,130 |
| 9,900 | | | | NiSource, Inc. | | | 108,603 |
| 8,200 | | | | Pacific Gas & Electric Co. | | | 317,422 |
| 5,150 | | | | Paychex, Inc. | | | 135,342 |
| 6,050 | | | | Pepco Holdings, Inc. | | | 107,448 |
| 186,250 | | | | Pfizer, Inc. | | | 3,298,488 |
| 2,500 | | | | Pinnacle West Capital Corp. | | | 80,325 |
| 6,050 | | | | Pitney Bowes, Inc. | | | 154,154 |
| 6,000 | | | | PNC Financial Services Group, Inc. | | | 294,000 |
| 5,850 | | | | Progress Energy, Inc. | | | 233,123 |
| 43,600 | | | | Regions Financial Corp. | | | 347,056 |
| 6,900 | | | | Reynolds American, Inc. | | | 278,139 |
| 13,950 | | | | Southern Co. | | | 516,150 |
| 23,250 | | | | Southern Copper Corp. | | | 373,395 |
| 11,050 | | | | SunTrust Bank | | | 326,417 |
| 37,550 | | | | US Bancorp. | | | 939,126 |
| 3,700 | | | | UST, Inc. | | | 256,706 |
| 54,350 | | | | Verizon Communications, Inc. | | | 1,842,465 |
| 104,300 | | | | Wachovia Corp. | | | 577,822 |
| 68,750 | | | | Wells Fargo & Co. | | | 2,026,750 |
| 6,250 | | | | Weyerhaeuser Co. | | | 191,313 |
| 14,200 | | | | Windstream Corp. | | | 130,640 |
| 13,100 | | | | Xcel Energy, Inc. | | | 243,005 |
| | | | | | | |
| | | | | | | 35,299,174 |
| | | | | | | |
| | | | Total Common Stock
(Cost $207,271,953) | | | 138,390,703 |
| | | | | | | |
| REAL ESTATE INVESTMENT TRUSTS: 1.5% |
| Canada: 0.1% |
| 12,700 | | | | RioCan Real Estate Investment Trust | | | 140,528 |
| | | | | | | |
| | | | | | | 140,528 |
| | | | | | | |
| France: 0.3% |
| 1,500 | | | | Fonciere Des Regions | | | 102,777 |
| 1,124 | | | | ICADE | | | 93,409 |
| 4,119 | | | | Klepierre | | | 101,295 |
| 1,094 | | | | Societe Immobiliere de Location pour l’Industrie et le Commerce | | | 102,205 |
| | | | | | | |
| | | | | | | 399,686 |
| | | | | | | |
| United States: 1.1% |
| 6,450 | | | | Duke Realty Corp. | | | 70,692 |
| 8,100 | | | | Equity Residential | | | 241,542 |
| 8,000 | | | | HCP, Inc. | | | 222,160 |
| 6,250 | | | | Hospitality Properties Trust | | | 92,938 |
| 13,850 | | | | Host Hotels & Resorts, Inc. | | | 104,845 |
| 7,150 | | | | Kimco Realty Corp. | | | 130,702 |
| 4,400 | | | | Liberty Property Trust | | | 100,452 |
| 5,400 | | | | Plum Creek Timber Co., Inc. | | | 187,596 |
See Accompanying Notes to Financial Statements
111
| | |
ING WISDOMTREESM GLOBAL
HIGH-YIELDING EQUITY INDEX PORTFOLIO | | PORTFOLIO OF INVESTMENTS ASOF DECEMBER 31, 2008 (CONTINUED) |
| | | | | | | |
Shares | | | | | | Value |
| | | | | | | |
| United States: (continued) |
| 5,100 | | | | Simon Property Group, Inc. | | $ | 270,963 |
| 3,800 | | | | Vornado Realty Trust | | | 229,330 |
| | | | | | | |
| | | | | | | 1,651,220 |
| | | | | | | |
| | | | Total Real Estate Investment Trusts
(Cost $3,483,128) | | | 2,191,434 |
| | | | | | | |
| EXCHANGE-TRADED FUNDS: 3.6% |
| Developed Markets: 2.4% |
| 78,390 | | | | iShares MSCI EAFE Index Fund | | | 3,517,359 |
| | | | | | | |
| | | | | | | 3,517,359 |
| | | | | | | |
| Emerging Markets: 0.4% |
| 25,695 | | | | iShares MSCI Emerging Markets Index Fund | | | 641,604 |
| | | | | | | |
| | | | | | | 641,604 |
| | | | | | | |
| United States: 0.8% |
| 26,220 | | | | iShares S&P 500 Value Index Fund | | | 1,184,620 |
| | | | | | | |
| | | | | | | 1,184,620 |
| | | | | | | |
| | | | Total Exchange-Traded Funds
(Cost $5,199,387) | | | 5,343,583 |
| | | | | | | |
| RIGHTS: 0.0% |
| Singapore: 0.0% |
| 14,500 | | | | DBS Group Holdings Ltd. | | | 30,210 |
| | | | | | | |
| | | | Total Rights
(Cost $—) | | | 30,210 |
| | | | | | | |
| | | | Total Long-Term Investments
(Cost $215,954,468) | | | 145,955,930 |
| | | | | | | |
| | | | | | | | |
| SHORT-TERM INVESTMENTS: 0.9% |
| Affiliated Mutual Fund: 0.9% |
| 1,323,000 | | ING Institutional Prime Money Market Fund - Class I | | | | | | 1,323,000 |
| | | | | | | | |
| | Total Short-Term Investments
(Cost $1,323,000) | | | | | | 1,323,000 |
| | | | | | | | |
| | Total Investments in Securities
(Cost $217,277,468)* | | 99.0 | % | | $ | 147,278,930 |
| | Other Assets and Liabilities - Net | | 1.0 | | | | 1,467,096 |
| | | | | | | | |
| | Net Assets | | 100.0 | % | | $ | 148,746,026 |
| | | | | | | | |
| @ | Non-income producing security |
| ADR | American Depositary Receipt |
| * | Cost for federal income tax purposes is $221,710,143. |
| | | | |
Net unrealized depreciation consists of: | | | | |
Gross Unrealized Appreciation | | $ | 436,492 | |
Gross Unrealized Depreciation | | | (74,867,705 | ) |
| | | | |
Net Unrealized Depreciation | | $ | (74,431,213 | ) |
| | | | |
| | | |
Industry | | Percentage of
Net Assets | |
Aerospace/Defense | | 0.1 | % |
Agriculture | | 2.5 | |
Airlines | | 0.6 | |
Apartments | | 0.2 | |
Auto Manufacturers | | 1.1 | |
Auto Parts & Equipment | | 0.1 | |
Banks | | 23.7 | |
Beverages | | 1.2 | |
Building Materials | | 0.8 | |
Chemicals | | 1.6 | |
Commercial Services | | 0.5 | |
Computers | | 0.1 | |
Cosmetics/Personal Care | | 0.1 | |
Distribution/Wholesale | | 0.1 | |
Diversified | | 0.4 | |
Diversified Financial Services | | 0.8 | |
Electric | | 5.3 | |
Electrical Components & Equipment | | 0.4 | |
Electronics | | 0.1 | |
Engineering & Construction | | 0.8 | |
Entertainment | | 0.4 | |
Food | | 2.0 | |
Forest Products & Paper | | 0.4 | |
Forestry | | 0.1 | |
Gas | | 1.8 | |
Hand/Machine Tools | | 0.1 | |
Health Care | | 0.2 | |
Healthcare - Services | | 0.1 | |
Holding Companies - Diversified | | 0.1 | |
Home Builders | | 0.1 | |
Hotels | | 0.1 | |
Household Products/Wares | | 0.3 | |
Housewares | | 0.0 | |
Insurance | | 6.1 | |
Investment Companies | | 0.1 | |
Iron/Steel | | 0.3 | |
Leisure Time | | 0.1 | |
Lodging | | 0.2 | |
Machinery - Diversified | | 0.3 | |
Media | | 1.8 | |
Metal Fabricate/Hardware | | 0.2 | |
Mining | | 0.7 | |
Miscellaneous Manufacturing | | 2.0 | |
Office Property | | 0.1 | |
Office/Business Equipment | | 0.1 | |
Oil & Gas | | 8.6 | |
Pharmaceuticals | | 8.2 | |
Pipelines | | 0.2 | |
Real Estate | | 0.1 | |
Regional Malls | | 0.2 | |
Retail | | 1.5 | |
Savings & Loans | | 0.1 | |
Semiconductors | | 0.6 | |
Shopping Centers | | 0.2 | |
Software | | 0.1 | |
Telecommunications | | 15.8 | |
Toys/Games/Hobbies | | 0.1 | |
See Accompanying Notes to Financial Statements
112
| | |
ING WISDOMTREESM GLOBAL
HIGH-YIELDING EQUITY INDEX PORTFOLIO | | PORTFOLIO OF INVESTMENTS ASOF DECEMBER 31, 2008 (CONTINUED) |
| | | |
Industry (continued) | | Percentage of
Net Assets (continued) | |
Transportation | | 0.5 | % |
Water | | 0.1 | |
Other Long-Term Investments | | 3.6 | |
Short-Term Investments | | 0.9 | |
Other Assets and Liabilities - Net | | 1.0 | |
| | | |
Net Assets | | 100.0 | % |
| | | |
The following table summarizes the inputs used as of December 31, 2008 in determining the Portfolio’s investments at fair value for purposes of SFAS 157:
| | | | | | |
| | | Investments in
Securities | | Other Financial
Instruments* |
Level 1 — Quoted Prices | | $ | 49,690,951 | | $ | — |
Level 2 — Other Significant Observable Inputs | | | 97,587,979 | | | — |
Level 3 — Significant Unobservable Inputs | | | — | | | — |
| | | | | | |
Total | | $ | 147,278,930 | | $ | — |
| | | | | | |
“Fair value” for purposes of SFAS 157 is different from “fair value” as used in the 1940 Act. The former generally implies market value, and can include market quotations as a source of value, and the latter refers to determinations of actual value in absence of available market quotations.
| * | Other financial instruments may include forward foreign currency contracts, futures, swaps, and written options. Forward foreign currency contracts and futures are reported at their unrealized gain/loss at year end. Swaps and written options are reported at their market value at year end. |
See Accompanying Notes to Financial Statements
113
TAX INFORMATION (UNAUDITED)
Dividends paid during the year ended December 31, 2008 were as follows:
| | | | | |
Fund Name | | Type | | Per Share Amount |
| | |
ING Russell™ Large Cap Index Portfolio | | | | | |
Class ADV | | NII | | $ | 0.0659 |
Class I | | NII | | $ | 0.0807 |
Class S | | NII | | $ | 0.0747 |
| | |
ING Russell™ Mid Cap Index Portfolio | | | | | |
Class ADV | | NII | | $ | 0.0651 |
Class I | | NII | | $ | 0.0820 |
Class S | | NII | | $ | 0.0764 |
All Classes | | ROC | | $ | 0.0089 |
| | |
ING Russell™ Small Cap Index Portfolio | | | | | |
Class ADV | | NII | | $ | 0.0642 |
Class I | | NII | | $ | 0.0683 |
Class S | | NII | | $ | 0.0615 |
All Classes | | ROC | | $ | 0.0083 |
| | |
ING Lehman Brothers U.S. Aggregate Bond Index® Portfolio | | | | | |
Class ADV | | NII | | $ | 0.1840 |
Class I | | NII | | $ | 0.2180 |
Class S | | NII | | $ | 0.2064 |
All Classes | | STCG | | $ | 0.0169 |
| | |
ING International Index Portfolio | | | | | |
Class ADV | | NII | | $ | 0.0833 |
Class I | | NII | | $ | 0.1145 |
Class S | | NII | | $ | 0.1085 |
| | |
ING Russell Global Large Cap Index 85% Portfolio | | | | | |
Class ADV | | NII | | $ | 0.0854 |
Class I | | NII | | $ | 0.0956 |
Class S | | NII | | $ | 0.0899 |
| | |
ING WisdomTreeSM Global High-Yielding Equity Index Portfolio | | | | | |
Class ADV | | NII | | $ | 0.1719 |
Class I | | NII | | $ | 0.2141 |
Class S | | NII | | $ | 0.2045 |
NII - Net investment income
STCG - Short-term capital gain
ROC - Return of capital
Of the ordinary distributions made during the year ended December 31, 2008, the following percentages qualify for the dividends received deduction (DRD) available to corporate shareholders:
| | | |
| |
ING Russell™ Large Cap Index Portfolio | | 100.00 | % |
| |
ING Russell™ Mid Cap Index Portfolio | | 98.97 | % |
| |
ING Russell™ Small Cap Index Portfolio | | 86.05 | % |
| |
ING Russell Global Large Cap Index 85% Portfolio | | 51.72 | % |
| |
ING WisdomTreeSM Global High-Yielding Equity Index Portfolio | | 30.14 | % |
114
TAX INFORMATION (UNAUDITED) (CONTINUED)
Pursuant to Section 853 of the Internal Revenue Code, the Portfolios designate the following amounts as foreign taxes paid for the year ended December 31, 2008. Foreign taxes paid for purposes of Section 853 may be less than actual foreign taxes paid for financial statement purposes.
| | | | | | | | | |
| | | Creditable Foreign Taxes Paid | | Per Share Amount | | Portion of Ordinary Income Distribution Derived from Foreign Sourced Income* | |
| | | |
ING International Index Portfolio | | $ | 425,031 | | $ | 0.0112 | | 99.39 | % |
| | | |
ING WisdomTreeSM Global High-Yielding Equity Index Portfolio | | $ | 406,620 | | $ | 0.0166 | | 72.06 | % |
| * | None of the Portfolios listed above derived any income from ineligible foreign sources as defined under Section 901(j) of the Internal Revenue Code. |
Foreign taxes paid or withheld should be included in taxable income with an offsetting deduction from gross income or as a credit for taxes paid to foreign governments. Shareholders are strongly advised to consult their own tax advisors regarding the appropriate treatment of foreign taxes paid.
Above figures may differ from those cited elsewhere in this report due to differences in the calculation of income and gains under U.S. generally accepted accounting principles (book) purposes and Internal Revenue Service (tax) purposes.
Shareholders are strongly advised to consult their own tax advisers with respect to the tax consequences of their investments in the Portfolios. In January, shareholders, excluding corporate shareholders, receive an IRS 1099-DIV regarding the federal tax status of the dividends and distributions they received in the calendar year.
115
DIRECTOR AND OFFICER INFORMATION (UNAUDITED)
The business and affairs of the Company are managed under the direction of the Board. A director who is not an interested person of the Company, as defined in the 1940 Act, is an independent director (“Non-Interested Director”). The Directors of the Portfolios are listed below. The Statement of Additional Information includes additional information about Directors of the Company and is available, without charge, upon request at (800) 992-0180.
| | | | | | | | | | |
Name, Address and Age | | Position(s)
held with
the Company | | Term of Office
and Length of
Time Served(1) | | Principal Occupation(s)
during the Past Five Years | | Number of
Portfolios
in Fund
Complex
Overseen
by Director(2) | | Other Directorships held by Director |
| | | | | |
Albert E. DePrince, Jr. 7337 E. Doubletree Ranch Rd. Scottsdale, Arizona 85258 Age: 67 | | Director | | June 1998 - Present | | Professor of Economics and Finance, Middle Tennessee State University (August 1991- Present). | | 39 | | Academy of Economics and Finance (February 2002 - Present). |
| | | | | |
Martin Gavin* 7337 E. Doubletree Ranch Rd. Scottsdale, Arizona 85258 Age: 58 | | Director | | January 2009 - Present | | President, Connecticut Children’s Medical Center (May 2006 - Present). Formerly, Interim President, Connecticut Children’s Medical Center (January 2006 - May 2006). | | 39 | | None |
| | | | | |
Sidney Koch 7337 E. Doubletree Ranch Rd. Scottsdale, Arizona 85258 Age: 73 | | Director | | April 1994 - Present | | Retired. Self-Employed Consultant (June 2000 - Present). | | 39 | | None |
| | | | | |
Dr. Corine T. Norgaard 7337 E. Doubletree Ranch Rd. Scottsdale, Arizona 85258 Age: 71 | | Director | | June 1991 - Present | | Retired. Formerly, Dean of the Barney School of Business, University of Hartford (August 1996 - June 2004). Formerly, President, Thompson Enterprises (September 2004 - September 2005). | | 39 | | Mass Mutual Corporate and Participation Investors (April 1997 - Present); Mass Mutual Premier Series (December 2004 - Present); and Mass Mutual MML Series Investment Funds II (December 2005 - Present). |
| | | | | |
Joseph E. Obermeyer 7337 E. Doubletree Ranch Rd. Scottsdale, Arizona 85258 Age: 51 | | Director | | January 2003 - Present | | President, Obermeyer & Associates, Inc. (November 1999 - Present). | | 39 | | None |
| | | | | |
Russell Jones 7337 E. Doubletree Ranch Rd. Scottsdale, Arizona 85258 Age: 64 | | Director | | December 2007 - Present | | Retired. Formerly, Senior Vice President, Chief Investment Officer and Treasurer Kaman Corporation (1973 - March 2008) | | 39 | | None |
116
DIRECTOR AND OFFICER INFORMATION (UNAUDITED) (CONTINUED)
| | | | | | | | | | |
Name, Address and Age | | Position(s)
held with
the Companies | | Term of Office
and Length of
Time Served(1) | | Principal Occupation(s)
during the Past Five Years | | Number of
Portfolios
in Fund
Complex
Overseen
by Director(2) | | Other Directorships
held by Director |
Directors/Trustee who are “Interested Persons:” | | | | |
| | | | | |
Shaun Mathews(3)(4) 7337 E. Doubletree Ranch Rd. Scottsdale, Arizona 85258 Age: 53 | | Director | | December 2007 - Present | | President and Chief Executive Officer, ING Investments, LLC(5) (November 2006 - Present). Formerly, President, ING Mutual Funds and Investment Products (November 2004 - November 2006); Chief Marketing Officer, ING USFS (April 2002 - October 2004); and Head of Rollover/Payout (October 2001 - December 2003). | | 200 | | ING Services Holding Company, Inc. (May 2000 - Present); Southland Life Insurance Company (June 2002 - Present); and ING Capital Corporation, LLC, ING Funds Distributor, LLC(6), ING Funds Services, LLC(7), ING Investments, LLC(5) and ING Pilgrim Funding, Inc. (December 2006 - Present). |
| | | | | |
Fredric (Rick) A. Nelson III(8) ING Investment Management 230 Park Avenue New York, New York 10169 Age: 52 | | Director | | December 2007 - January 2009 | | Chief Investment Officer, ING (April 2003 - January 2009) | | | | None. |
| * | | Mr. Martin Gavin was appointed to the Board effective January 1, 2009. |
(1) | | Directors/Trustees serve until their successors are duly elected and qualified. |
(2) | | For the purposes of this table (except for Mr. Mathews), “Fund Complex” means the following investment companies: ING Series Fund, Inc.; ING Strategic Allocation Portfolios, Inc.; ING Variable Funds; ING Variable Portfolios, Inc.; ING VP Balanced Portfolio, Inc.; ING VP Intermediate Bond Portfolio; and ING VP Money Market Portfolio. |
(3) | | For Mr. Mathews, the Fund Complex also includes the following investment companies: ING Asia Pacific High Dividend Equity Income Fund, ING Equity Trust; ING Funds Trust; ING Global Equity Dividend and Premium Opportunity Fund; ING Global Advantage and Premium Opportunity Fund; ING International High Dividend Equity Income Fund; ING Investors Trust; ING Mayflower Trust; ING Mutual Funds; ING Prime Rate Trust; ING Risk Managed Natural Resources Fund; ING Senior Income Fund; ING Separate Portfolios Trust; ING Variable Insurance Trust; ING Variable Products Trust; and ING Partners, Inc. |
(4) | | “Interested person,” as defined in the 1940 Act, by virtue of this Director’s/Trustee’s affiliation with any of the Funds, ING or any of ING’s affiliates. |
(5) | | ING Investments, LLC was previously named ING Pilgrim Investments, LLC. ING Pilgrim Investments, LLC is the successor in interest to ING Pilgrim Investments, Inc., which was previously known as Pilgrim Investments, Inc. and before that was known as Pilgrim America Investments, Inc. |
(6) | | ING Funds Distributor, LLC is the successor in interest to ING Funds Distributor, Inc., which was previously known as ING Pilgrim Securities, Inc., and before that was known as Pilgrim Securities, Inc., and before that was known as Pilgrim America Securities, Inc. |
(7) | | ING Funds Services, LLC was previously named ING Pilgrim Group, LLC. ING Pilgrim Group, LLC is the successor in interest to ING Pilgrim Group, Inc., which was previously known as Pilgrim Group, Inc. and before that was known as Pilgrim America Group, Inc. |
(8) | | Mr. Nelson resigned from the Board as of January 15, 2009. |
117
DIRECTOR AND OFFICER INFORMATION (UNAUDITED) (CONTINUED)
| | | | | | |
Name, Address and Age | | Position(s) Held
with the Companies | | Term of Office
and Length of
Time Served(1) | | Principal Occupation(s)
during the Past Five Years |
Officers: | | | | | | |
| | | |
Shaun P. Mathews 7337 East Doubletree Ranch Rd. Scottsdale, Arizona 85258 Age: 53 | | President and Chief Executive Officer | | December 2006 - Present | | President and Chief Executive Officer, ING Investments, LLC (November 2006 - Present). Formerly, President, ING Mutual Funds and Investment Products (November 2004 - November 2006); Chief Marketing Officer, ING USFS (April 2002 - October 2004); and Head of Rollover/Payout (October 2001 - December 2003). |
| | | |
Michael J. Roland 7337 East Doubletree Ranch Rd. Scottsdale, Arizona 85258 Age: 50 | | Executive Vice President | | April 2002 - Present | | Head of Mutual Fund Platform (February 2007 - Present) and Executive Vice President, ING Investments, LLC(2) and ING Funds Services, LLC(3) (December 2001 - Present). Formerly, Executive Vice President, Head of Product Management (January 2005 - January 2007); Chief Compliance Officer, ING Investments, LLC(2) and Directed Services LLC(6) (October 2004 - December 2005); and Chief Financial Officer and Treasurer, ING Investments, LLC(2) (December 2001 - March 2005). |
| | | |
Stanley D. Vyner 230 Park Avenue New York, New York 10169 Age: 58 | | Executive Vice President | | March 2002 - Present | | Executive Vice President, ING Investments, LLC(2) (July 2000 - Present) and Chief Investment Risk Officer, ING Investments, LLC(2) (January 2003 - Present). |
| | | |
Joseph M. O’Donnell 7337 East Doubletree Ranch Rd. Scottsdale, Arizona 85258 Age: 54 | | Executive Vice President and Chief Compliance Officer | | March 2006 - Present November 2004 - Present | | Chief Compliance Officer of the ING Funds (November 2004 - Present) and Executive Vice President of the ING Funds (March 2006 - Present). Formerly, Chief Compliance Officer of ING Investments, LLC(2) (March 2006 - July 2008); Investment Advisor Chief Compliance Officer, Directed Services LLC(6) (March 2006 - July 2008) ING Life Insurance and Annuity Company (March 2006 - December 2006); and Vice President, Chief Legal Counsel, Chief Compliance Officer and Secretary of Atlas Securities, Inc., Atlas Advisers, Inc. and Atlas Funds (October 2001 - October 2004). |
| | | |
Todd Modic 7337 East Doubletree Ranch Rd Scottsdale, Arizona 85258 Age: 41 | | Senior Vice President, Chief/Principle Financial Officer and Assistant Secretary | | March 2005 - Present | | Senior Vice President, ING Funds Services, LLC(3) (March 2005 - Present). Formerly, Vice President, ING Funds Services, LLC(3) (September 2002 - March 2005). |
| | | |
Kimberly A. Anderson 7337 East Doubletree Ranch Rd. Scottsdale, Arizona 85258 Age: 44 | | Senior Vice President | | December 2003 - Present | | Senior Vice President, ING Investments, LLC(2) (October 2003 - Present). |
| | | |
Robert Terris 7337 East Doubletree Ranch Rd. Scottsdale, Arizona 85258 Age: 38 | | Senior Vice President | | June 2006 - Present | | Senior Vice President, Head of Division Operations, ING Funds Services, LLC(3) (May 2006 - Present). Formerly, Vice President of Administration, ING Funds Services, LLC(3) (October 2001 - March 2006). |
| | | |
Ernest J. C’DeBaca 7337 East Doubletree Ranch Rd. Scottsdale, Arizona 85258 Age: 39 | | Senior Vice President | | June 2006 - Present | | Chief Compliance Officer, ING Investments, LLC(2) (July 2008 - Present); Investment Advisor Chief Compliance Officer, Directed Services LLC(6) (July 2008 - Present); Head of Retail Compliance, ING Funds Distributor, LLC(4) and ING Funds Services, LLC(3), (July 2008 - Present); and Senior Vice President, ING Investments, LLC(2) (December 2006 - Present), ING Funds Services, LLC(3) (April 2006 - Present), ING Funds Distributor, LLC(4) (July 2008 - Present), and Directed Services LLC(6) (July 2008 - Present). Formerly, Counsel, ING Americas, U.S. Legal Services (January 2004 - March 2006) and Attorney-Adviser, U.S. Securities and Exchange Commission (May 2001 - December 2003). |
| | | |
Robyn L. Ichilov 7337 East Doubletree Ranch Rd. Scottsdale, Arizona 85258 Age: 41 | | Vice President and Treasurer | | March 2002 - Present | | Vice President and Treasurer, ING Funds Services, LLC(3) (November 1995 - Present) and ING Investments, LLC(2) (August 1997 - Present). |
| | | |
Lauren D. Bensinger 7337 East Doubletree Ranch Rd. Scottsdale, Arizona 85258 Age: 54 | | Vice President | | March 2003 - Present | | Vice President and Chief Compliance Officer, ING Funds Distributor, LLC(4) (August 1995 - Present); Vice President, ING Investments, LLC(2) and ING Funds Services, LLC(3) (February 1996 - Present); and Director of Compliance, ING Investments, LLC(2) (October 2004 - Present). Formerly, Chief Compliance Officer, ING Investments, LLC(2) (October 2001 - October 2004). |
118
DIRECTOR AND OFFICER INFORMATION (UNAUDITED) (CONTINUED)
| | | | | | |
Name, Address and Age | | Position(s) Held
with the Companies | | Term of Office
and Length of
Time Served(1) | | Principal Occupation(s)
during the Past Five Years |
| | | |
William Evans 10 State House Square Hartford, Connecticut 06103 Age: 36 | | Vice President | | September 2007 - Present | | Vice President, Head of Mutual Fund Advisory Group (April 2007 - Present). Formerly, Vice President, U.S. Mutual Funds and Investment Products (May 2005 - April 2007) and Senior Fund Analyst, U.S. Mutual Funds and Investment Products (May 2002 - May 2005). |
| | | |
Maria M. Anderson 7337 East Doubletree Ranch Rd. Scottsdale, Arizona 85258 Age: 50 | | Vice President | | September 2004 - Present | | Vice President, ING Funds Services, LLC(3) (September 2004 - Present). Formerly, Assistant Vice President, ING Funds Services, LLC(3) (October 2001 - September 2004). |
| | | |
Denise Lewis 7337 East Doubletree Ranch Rd. Scottsdale, Arizona 85258 Age: 45 | | Vice President | | April 2007 - Present | | Vice President, ING Funds Services, LLC (December 2006 - Present). Formerly, Senior Vice President, UMB Investment Services Group, LLC (November 2003 - December 2006). |
| | | |
Kimberly K. Springer 7337 East Doubletree Ranch Rd. Scottsdale, Arizona 85258 Age: 51 | | Vice President | | March 2006 - Present | | Vice President, ING Funds Services, LLC(3) (March 2006 - Present). Formerly, Assistant Vice President, ING Funds Services, LLC(3) (August 2004 - March 2006) and Manager, Registration Statements, ING Funds Services, LLC(3) (May 2003 - August 2004). |
| | | |
Susan P. Kinens 7337 East Doubletree Ranch Rd. Scottsdale, Arizona 85258 Age: 32 | | Assistant Vice President | | March 2003 - Present | | Assistant Vice President, ING Funds Services, LLC(3) (December 2002 - Present). |
| | | |
Craig Wheeler 7337 East Doubletree Ranch Rd. Scottsdale, Arizona 85258 Age: 39 | | Assistant Vice President | | June 2008 - Present | | Assistant Vice President - Director of Tax, ING Funds Services (March 2008 - Present). Formerly, Tax Manager, ING Funds Services (March 2005 - March 2008); Tax Senior, ING Funds Services (January 2004 - March 2005); and Tax Senior, KPMG LLP (August 2002 - December 2003). |
| | | |
Theresa K. Kelety 7337 East Doubletree Ranch Rd. Scottsdale, Arizona 85258 Age: 45 | | Secretary | | September 2003 - Present | | Senior Counsel, ING Americas, U.S. Legal Services (April 2008 - Present). Formerly, Counsel, ING Americas, U.S. Legal Services (April 2003 - April 2008). |
| | | |
Huey P. Falgout, Jr. 7337 East Doubletree Ranch Rd. Scottsdale, Arizona 85258 Age: 45 | | Assistant Secretary | | September 2003 - Present | | Chief Counsel, ING Americas, U.S. Legal Services (September 2003 - Present). |
| | | |
Kathleen Nichols 7337 East Doubletree Ranch Rd. Scottsdale, Arizona 85258 Age: 33 | | Assistant Secretary | | June 2008 - Present | | Counsel, ING Americas, U.S. Legal Services (February 2008 - Present). Formerly, Associate, Ropes & Gray LLP (September 2005 - February 2008). |
(1) | | The officers hold office until the next annual meeting of the Directors/Trustees and until their successors shall have been elected and qualified. |
(2) | | ING Investments, LLC was previously named ING Pilgrim Investments, LLC. ING Pilgrim Investments, LLC is the successor in interest to ING Pilgrim Investments, Inc., which was previously known as Pilgrim Investments, Inc. and before that was known as Pilgrim America Investments, Inc. |
(3) | | ING Funds Services, LLC was previously named ING Pilgrim Group, LLC. ING Pilgrim Group, LLC is the successor in interest to ING Pilgrim Group, Inc., which was previously known as Pilgrim Group, Inc. and before that was known as Pilgrim America Group, Inc. |
(4) | | ING Funds Distributor, LLC is the successor in interest to ING Funds Distributor, Inc., which was previously known as ING Pilgrim Securities, Inc., and before that was known as Pilgrim Securities, Inc., and before that was known as Pilgrim America Securities, Inc. |
(5) | | Directed Services, LLC is the successor in interest to Directed Services, Inc. |
119
Investment Adviser
ING Investments, LLC
7337 East Doubletree Ranch Road
Scottsdale, Arizona 85258
Administrator
ING Funds Services, LLC
7337 East Doubletree Ranch Road
Scottsdale, Arizona 85258
Distributor
ING Funds Distributor, LLC
7337 East Doubletree Ranch Road
Scottsdale, Arizona 85258
Transfer Agent
DST Systems, Inc.
P.O. Box 419368
Kansas City, Missouri 64141
Independent Registered Public Accounting Firm
KPMG LLP
99 High Street
Boston, Massachusetts 02110
Custodian
The Bank of New York Mellon
One Wall Street
New York, New York 10286
Legal Counsel
Goodwin Procter LLP
Exchange Place
53 State Street
Boston, Massachusetts 02109
Before investing, carefully consider the investment objectives, risks, charges and expenses of the variable annuity contract and the underlying variable investment options. This and other information is contained in the prospectus for the variable annuity contract and the underlying variable investment options. Obtain these prospectuses from your agent/registered representative and read them carefully before investing.
| | | | |
 | | VPAR-AVIPADVIS | | (1208-022509) |

Annual Report
December 31, 2008
Class S
ING Variable Portfolios, Inc.
| n | ING Global Equity Option Portfolio |
| | |
 | | E-Delivery Sign-up – details inside |
This report is submitted for general information to shareholders of the ING Funds. It is not authorized for distribution to prospective shareholders unless accompanied or preceded by a prospectus which includes details regarding the funds’ investment objectives, risks, charges, expenses and other information. This information should be read carefully.
MUTUAL FUNDS 
| |
TABLE OF CONTENTS
| | | | |
| | | |
| | Go Paperless with E-Delivery! | | |
Sign up now for on-line prospectuses, fund reports, and proxy statements. In less than five minutes, you can help reduce paper mail and lower fund costs. Just go to www.ingfunds.com, click on the E-Delivery icon from the home page, follow the directions and complete the quick 5 Steps to Enroll. You will be notified by e-mail when these communications become available on the internet. Documents that are not available on the internet will continue to be sent by mail. |
PROXY VOTING INFORMATION
A description of the policies and procedures that the Portfolio use to determine how to vote proxies related to portfolio securities is available: (1) without charge, upon request, by calling Shareholder Services toll-free at (800) 992-0180; (2) on the ING Funds’ website at www.ingfunds.com; and (3) on the U.S. Securities and Exchange Commission’s (“SEC”) website at www.sec.gov. Information regarding how the Portfolio voted proxies related to portfolio securities during the most recent 12-month period ended June 30 is available without charge on the ING Funds’ website at www.ingfunds.com and on the SEC’s website at www.sec.gov.
QUARTERLY PORTFOLIO HOLDINGS
The Portfolio file their complete schedule of portfolio holdings with the SEC for the first and third quarters of each fiscal year on Form N-Q. The Portfolio’s Forms N-Q are available on the SEC’s website at www.sec.gov. The Portfolio’s Forms N-Q may be reviewed and copied at the SEC’s Public Reference Room in Washington, DC, and information on the operation of the Public Reference Room may be obtained by calling (800) SEC-0330; and is available upon request from the Portfolio by calling Shareholder Services toll-free at (800) 992-0180.
PRESIDENT’S LETTER

Dear Shareholders,
We are in the midst of one of the most challenging periods ever faced by investors, and we at ING Funds are aware of the anxiety that you may be feeling at this time.
I want to assure you that we are actively engaged in monitoring the situation and are committed to keeping you fully informed of how the rapidly unfolding events around us may impact your investments with our company.
We recognize that the confidence of many investors is being tested, perhaps as never before. It is understandable that some of you may be second guessing your investment strategy due to these recent events. We encourage you to work with your investment professional and seek out their advice about your portfolio in light of the current conditions. But we also urge investors not to make rash decisions. ING Funds still believes that a well-diversified, globally allocated portfolio remains the most effective
investment strategy of all. We ask that investors not lose sight of their commitment to the long-term.
We thank you for your support and confidence and we look forward to continuing to do business with you in the future.
Sincerely,

Shaun Mathews
President & Chief Executive Officer
ING Funds
January 23, 2009
The views expressed in the President’s Letter reflect those of the President as of the date of the letter. Any such views are subject to change at any time based upon market or other conditions and ING Funds disclaims any responsibility to update such views. These views may not be relied on as investment advice and because investment decisions for an ING Fund are based on numerous factors, may not be relied on as an indication of investment intent on behalf of any ING Fund. Reference to specific company securities should not be construed as recommendations or investment advice. Consider the fund’s investment objectives, risks, and charges and expenses carefully before investing. The prospectus contains this information and other information about the fund.
International investing poses special risks including currency fluctuation, economic and political risks not found in investments that are solely domestic.
1
MARKET PERSPECTIVE: YEAR ENDED DECEMBER 31, 2008
In our semi-annual report, we described a failed second quarter rally that fizzled when investors realized that borderline recessionary conditions and a credit crunch had not gone away. By year-end, governments were committing previously unimaginable sums of taxpayer money to prevent systemic collapse. Global equities in the form of the MSCI World® Index(1) measured in local currencies, including net reinvested dividends (“MSCI” for regions discussed below) plunged 29.7% in the six months ended December 31, 2008 (down 38.7% for the entire fiscal year). (The MSCI World® Index plunged 40.71% for the entire fiscal year, measured in U.S. dollars.) In currencies, the dollar at first drifted near record lows against the euro. But the tide turned in mid-July and for the six months ended December 31, 2008, the dollar strengthened by 12.10% (4.50% for the entire fiscal year). The dollar also soared 37.8% against the pound for the six months ended December 31, 2008 (37.90% for the entire fiscal year). But the yen advanced as carry trades (essentially short yen positions) were unwound and the dollar fell 14.90% for the six months ended December 31, 2008 (down 19.60% for the entire fiscal year).
Even more dramatic was the price of oil which marched to an all-time high of around $147 per barrel in mid-July, only to lose more than two thirds of that price by December 31, 2008.
The economic statistics remained bleak. By the end of October, the Standard & Poor’s (“S&P”)/Case-Shiller National U.S. Home Price Index(2) of house prices had fallen a record 18% over the year. New home sales were at 1991 levels. Some 45% of existing home sales were distressed.
Payrolls declined in every month of 2008, as the number of people claiming unemployment reached 4.1 million, a 26-year high. Gross domestic product (“GDP”) fell at an annualized rate of 0.50% in the third quarter, and the National Bureau of Economic Research announced that the recession had actually started in December 2007.
Yet these were side-shows to the fireworks display in the financial sector, where major institutions—hanging by a thread through problems rooted in unwise mortgage borrowing, lending and investment—met different fates in September 2008 at the hands of the U.S. government.
The Federal National Mortgage Association (“Fannie Mae”) and the Federal Home Loan Mortgage
Corporation (“Freddie Mac”) were taken into “conservatorship.” Merrill Lynch was acquired by the Bank of America with a wink from the authorities. AIG received an $85 billion loan from a reluctant government, which also took a 79.90% equity stake in AIG. But Lehman Brothers having sought capital, then a buyer, found neither and was left to file for Chapter 11 bankruptcy protection.
The U.S. government was now in the position of choosing winners and losers among financial institutions: none too successfully, for it quickly became obvious that by pointedly leaving Lehman Brothers to go under, a credit crisis had become a credit market collapse. Lending all but seized up.
Policy response was huge but at least initially muddled. A Troubled Asset Relief Plan (“TARP”) would set up a $700 billion fund to buy illiquid mortgage securities from financial institutions. But on November 12, 2008 with half of the money already used to recapitalize banks, Treasury Secretary Paulson announced that the rest of the funds would not be used to buy illiquid mortgage securities after all. This merely renewed the pressure on the holders of such securities like Citigroup, which within two weeks received guarantees from the government against losses and another $20 billion in capital.
Other programs were of more practical use, like support for the commercial paper market and a guarantee facility for money market funds. Arguably the most effective measure was the announced intention to buy vast quantities of agency mortgage-backed securities and debentures. This had the effect of driving down rates on the 30-year mortgage towards 5.00%, a record low. In the meantime, the newly-elected president promised a stimulus package worth approximately $1 trillion. And by year end, the Federal Open Market Committee (“FOMC”) reduced interest rates to a range of between 0% and 0.25%.
2008 ended with much gloom and bad news still to come, but the platform for recovery was perhaps taking shape.
In U.S. fixed-income markets, yields on the 90-day Treasury Bills briefly turned negative in December 2008, while the yield on the ten-year Treasury Note fell below 2.50%, something we had not seen in 50 years. The Barclays Capital U.S. Aggregate Bond Index(3), formerly known as the Lehman Brothers U.S. Aggregate Bond Index, of investment grade bonds returned 4.10% for the six months ended December 31, 2008, (5.20% for the entire fiscal year).
2
MARKET PERSPECTIVE: YEAR ENDED DECEMBER 31, 2008
By contrast, high yield bonds, represented by the Barclays Capital High Yield Bond—2% Issuer Constrained Composite Index(4), formerly known as the Lehman Brothers High Yield Bond—2% Issuer Constrained Composite Index, behaved more like a stock index and returned (25.10)% for the six months ended December 31, 2008 (down 25.90% for the entire fiscal year).
U.S. equities, represented by the S&P 500® Composite Stock Price (“S&P 500®”) Index(5), including dividends, returned (28.50)% for the six months ended December 31, 2008, (down 37.00% for the entire fiscal year), increasingly unimpressed by sharply falling oil prices. Profits for S&P 500® Index companies suffered their fifth straight quarter of decline, led again by the financials sector, although taxpayer money was also potentially committed to save the big three auto makers from bankruptcy. On November 20, 2008, the S&P 500® Index plumbed a level not seen since April 1997, before a December recovery.
In international markets, plainly entering recession, the MSCI Japan® Index(6) slumped 35.9% for the six months ended December 31, 2008, (down 42.60% for the entire fiscal year). The strengthening yen hit exports in an export-dependent economy even as global demand slowed for other reasons. The MSCI Europe ex UK® Index(7) sagged 29.40% for the six months ended December 31, 2008 (down 43.20% for the entire fiscal year), beset by sharply falling economic activity and a European Central Bank in denial that inflation was falling fast. Finally, rates were reduced by an unprecedented 175 basis points (or 1.75%) in two months near the end of the year while governments, one after the other, proposed large stimulus packages. In the UK, the MSCI UK® Index(8) fell 19.4% for the six months ended December 31, 2008 (down 28.5% for the entire fiscal year). The UK had allowed a bigger housing bubble than the United States and deeper personal indebtedness in an economy more dependent on the financial sector. Rates were reduced to 1951 levels as venerable banks ceased to exist as independent entities.
(1) The MSCI World® Index is an unmanaged index that measures the performance of over 1,400 securities listed on exchanges in the U.S., Europe, Canada, Australia, New Zealand and the Far East.
(2) The S&P/Case-Shiller National U.S. Home Price Index tracks the value of single-family housing within the United States. The index is a composite of single-family home price indices for the nine U.S. Census divisions and is calculated quarterly.
(3) The Barclays Capital U.S. Aggregate Bond Index is an unmanaged index of publicly issued investment grade U.S. Government, mortgage-backed, asset-backed and corporate debt securities.
(4) The Barclays Capital High Yield Bond—2% Issuer Constrained Composite Index is an unmanaged index that measures the performance of non-investment grade fixed-income securities.
(5) The S&P 500® Index is an unmanaged index that measures the performance of securities of approximately 500 of the largest companies in the United States.
(6) The MSCI Japan® Index is a free float-adjusted market capitalization index that is designed to measure developed market equity performance in Japan.
(7) The MSCI Europe ex UK® Index is a free float-adjusted market capitalization index that is designed to measure developed market equity performance in Europe, excluding the UK.
(8) The MSCI UK® Index is a free float-adjusted market capitalization index that is designed to measure developed market equity performance in the UK.
All indices are unmanaged and investors cannot invest directly in an index.
Past performance does not guarantee future results. The performance quoted represents past performance. Investment return and principal value of an investment will fluctuate, and shares, when redeemed, may be worth more or less than their original cost. The Portfolio’s performance is subject to change since the period’s end and may be lower or higher than the performance data shown. Please call (800) 992-0180 or log on to www.ingfunds.com to obtain performance data current to the most recent month end.
Market Perspective reflects the views of ING’s Chief Investment Risk Officer only through the end of the period, and is subject to change based on market and other conditions.
3
| | |
| ING GLOBAL EQUITY OPTION PORTFOLIO | | PORTFOLIO MANAGERS’ REPORT |
Asset Allocation
as of December 31, 2008
(as a percent of net assets)
| | |
| Underlying Affiliated Funds | | |
ING International Growth Opportunities Portfolio — Class I | | 16.7% |
ING VP Growth and Income Portfolio — Class I | | 49.8% |
ING VP International Value Portfolio — Class I | | 22.7% |
ING VP MidCap Opportunities Portfolio — Class I | | 5.0% |
ING VP Small Company Portfolio — Class I | | 5.0% |
Other assets and liabilities — Net | | 0.8% |
| | |
Net Assets | | 100.0% |
| | |
Portfolio holdings are subject to change.
ING Global Equity Option Portfolio (the “Portfolio”) seeks long-term growth of capital. The Portfolio invests in a combination of other ING Funds (“Underlying Funds”) according to target allocations determined by ING Investments, LLC (the “Investment Adviser”) and utilizes a covered-call writing strategy to seek to secure gains and enhance the stability of returns. The Fund is managed by Paul Zemsky, Portfolio Manager of ING Investment Management Co. — the Sub-Adviser.
Portfolio Specifics: The Portfolio’s current approximate target investment allocations (expressed as a percentage of its net assets) among the Underlying Funds are set out below. As these are target allocations, the actual allocations of the Portfolio’s assets may deviate from the percentages shown.
Assets will be allocated among the Underlying Funds and markets based on judgments made by the Sub-Adviser. The performance of the Portfolio reflects the performance of the Underlying Funds in which it invests.
The target investment allocations may not sum to 100%, as cash holdings and short options may comprise the balance. There is a risk that the Portfolio may allocate assets to an Underlying Fund or market that underperforms other asset classes. For example, the Portfolio may be underweighted in assets or a market that is experiencing significant gains or overweighted in assets or a market with significant declines.
Performance: Since the Portfolio’s inception on September 17, 2008 through December 31, 2008, the Portfolio’s Class S shares provided a total return of (21.15)% compared to the Dow Jones (“DJ”) Moderately Aggressive Index(1) and a Composite Index(2) consisting of 80% the Standard & Poor’s 500® Composite Stock Price Index (“S&P 500®”) and 20% the Barclays Capital U.S. Aggregate Bond Index*, which returned (18.62)% and (19.60)%, respectively, for the period of October 1, 2008 through December 31, 2008.
The Portfolio’s relative underperformance to the Dow Jones Moderately Aggressive Index is due to the Underlying Funds underperforming their respective benchmarks in September. Thereafter, performance improved, and the relative outperformance in the fourth quarter can be attributed to the positive returns garnered by the option writing overlay strategy. With the equity and credit markets having experienced unprecedented volatility since the Portfolio launched, the vast majority of the options written, on the S&P 500® Index, S&P MidCap 400 Index and MSCI Europe, Australasia and Far East® (“MSCI EAFE®”) Index, expired worthless, allowing the Portfolio to retain the premiums received.
Most of the underlying domestic equity funds outperformed relative to their benchmarks. The international funds underperformed the MSCI EAFE® index during the period. ING VP Mid Cap Opportunities Portfolio benefited from stock selection, especially in the consumer discretionary and healthcare sectors. Similarly, ING VP Small Company Portfolio’s outperformance was the result of stock-picking, mainly in the consumer discretionary and information technology sectors. ING VP International Value Portfolio underperformed, due mainly to stock selection in the materials and consumer discretionary sectors. ING International Growth Opportunities Portfolio underperformed due to non-benchmark holdings in emerging markets. Detracting most from the result was selection effect in consumer staples and information technology stocks.
Current Strategy and Outlook: The Portfolio was launched during a period characterized by unprecedented market turmoil and company failures. The National Bureau of Economic Research determined that the United States has been in a recession since December 2007. While it may be the most severe since the recession of 1981–82, we believe that most of the extreme market movements in October and November reflected deleveraging by hedge funds and other investors, rather than selling based on fundamentals.
Economic news has been bleak from all sides: continued weakness in housing, declining new orders for durable goods, lower than expected consumption figures and higher unemployment rates. The credit crunch continued through the period, with spreads widening sharply in the second half of November across all credit sectors. Intervention from the Federal Reserve Board and the U.S. Department of the Treasury appears to have slowed but not yet halted the negative news. We believe the recession will continue for the next two quarters, with growth resuming in the second half of 2009.
Target Allocations
as of December 31, 2008
(as a percentage of net assets)
| | |
Large Cap Domestic | | 50% |
Mid Cap Domestic | | 5% |
Small Cap Domestic | | 5% |
Developed Markets International | | 40% |
| | |
| | 100.0% |
| | |
Portfolio holdings are subject to change daily.
We believe headline inflation will decline, and perhaps turn negative, but we don’t believe we are in the midst of a deflationary spiral. Finally, we believe a large fiscal stimulus program will be enacted by Congress early in 2009. We have maintained the Portfolio at neutral weights, although during the fourth quarter we began to implement a value bias in the international equity allocation.
| * | | Formerly known as the Lehman Brothers U.S. Aggregate Bond Index. As of October 31, 2008, all Lehman Brothers indices were renamed: the words “Lehman Brothers” changed to “Barclays Capital.” |
Portfolio holdings and characteristics are subject to change and may not be representative of current holdings and characteristics. The outlook for this Portfolio may differ from that presented for other ING Funds. Performance for the different classes of shares will vary based on differences in fees associated with each class.
4
| | |
| PORTFOLIO MANAGERS’ REPORT | | ING GLOBAL EQUITY OPTION PORTFOLIO |
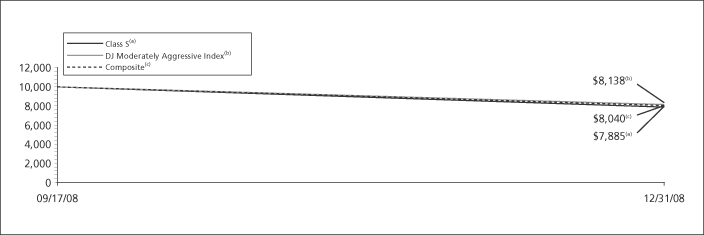
| | | | | | | |
| | | |
| | | Cumulative Total Returns for the Periods Ended December 31, 2008 | | | |
| | | | | Since
Inception
of Class S
September 17,
2008 | | | |
| | | Class S | | (21.15 | )% | | |
| | | DJ Moderately Aggressive Index(1) | | (18.62 | )%(3) | | |
| | | Composite Index(2) | | (19.60 | )%(3) | | |
Based on a $10,000 initial investment, the graph and table above illustrate the total return of ING Global Equity Option Portfolio against the indices indicated. An index is unmanaged and has no cash in its portfolio, imposes no sales charges and incurs no operating expenses. An investor cannot invest directly in an index. The Portfolio’s performance is shown without the imposition of any expenses or charges which are, or may be, imposed under your annuity contract. Total returns would have been lower if such expenses or charges were included.
The performance graph and table do not reflect the deduction of taxes that a shareholder will pay on Portfolio distributions or the redemption of Portfolio shares.
The performance shown may include the effect of fee waivers and/or expense reimbursements by the Investment Adviser and/or other service providers, which have the effect of increasing total return. Had all fees and expenses been considered, the total returns would have been lower.
The performance update illustrates performance for a variable investment option available through a variable annuity contract. The performance shown indicates past performance and is not a projection or prediction of future results. Actual investment returns and principal value will fluctuate so that shares and/or units, at redemption, may be worth more or less than their original cost. Please call (800) 992-0180 to get performance through the most recent month end.
It is important to note that the Portfolio has a limited operating history. Performance over a longer period of time may be more meaningful than short-term performance.
This report contains statements that may be “forward-looking” statements. Actual results may differ materially from those projected in the “forward-looking” statements.
The views expressed in this report reflect those of the portfolio managers, only through the end of the period as stated on the cover. The portfolio managers’ views are subject to change at any time based on market and other conditions.
Portfolio holdings are subject to change daily.
(1) | | The Dow Jones Moderately Aggressive Index is comprised of a set of equity, bond and cash sub-idexes. |
(2) | | The Composite Index is comprised of 80% S&P 500® Index/20% Barclays Capital U.S. Aggregate Bond Index. |
(3) | | Since inception performance of the indices is shown from October 1, 2008. |
5
SHAREHOLDER EXPENSE EXAMPLES (UNAUDITED)
As a shareholder of a Portfolio, you incur two types of costs: (1) transaction costs, including redemption fees and exchange fees; and (2) ongoing costs, including management fees, distribution and/or service (12b-1) fees, and other Portfolio expenses. These Examples are intended to help you understand your ongoing costs (in dollars) of investing in a Portfolio and to compare these costs with the ongoing costs of investing in other mutual funds.
The Examples are based on an investment of $1,000 invested at the beginning of the period and held for the
entire period from July 1, 2008 to December 31, 2008. The Portfolio’s expenses are shown without the imposition of any charges which are, or may be, imposed under your annuity contract. Expenses would have been higher if such charges were included.
Actual Expenses
The first section of the table shown, “Actual Portfolio Return,” provides information about actual account values and actual expenses. You may use the information in this section, together with the amount you invested, to estimate the expenses that you paid over the period. Simply divide your account value by $1,000 (for example, an $8,600 account value divided by $1,000 = 8.6), then multiply the result by the number in the first section under the heading entitled “Expenses Paid During the Period” to estimate the expenses you paid on your account during this period.
Hypothetical Example for Comparison Purposes
The second section of the table shown, “Hypothetical (5% return before expenses),” provides information about hypothetical account values and hypothetical expenses based on the Portfolio’s actual expense ratio and an assumed rate of return of 5% per year before expenses, which is not the Portfolio’s actual return. The hypothetical account values and expenses may not be used to estimate the actual ending account balance or expenses you paid for the period. You may use this information to compare the ongoing costs of investing in the Portfolio and other mutual funds. To do so, compare this 5% hypothetical example with the 5% hypothetical examples that appear in the shareholder reports of the other mutual funds.
Please note that the expenses shown in the table are meant to highlight your ongoing costs only and do not reflect any transactional costs, such as redemption fees or exchange fees. Therefore, the hypothetical lines of the table are useful in comparing ongoing costs only, and will not help you determine the relative total costs of owning different mutual funds. In addition, if these transactional costs were included, your costs would have been higher.
| | | | | | | | | | | | | | | | | | | | | | | | |
| | | Actual Portfolio Return | | Hypothetical (5% return before expenses) |
| | | Beginning
Account
Value
July 1, 2008 | | Ending
Account Value
December 31, 2008 | | Annualized
Expense
Ratio* | | | Expenses Paid
During the
Period Ended
December 31, 2008** | | Beginning
Account
Value
July 1, 2008 | | Ending
Account Value
December 31, 2008 | | Annualized
Expense
Ratio* | | | Expenses Paid
During the
Period Ended
December 31, 2008** |
ING Global Equity Option Portfolio |
Class S(1) | | $ | 1,000.00 | | $ | 788.50 | | 0.50 | % | | $ | 1.29 | | $ | 1,000.00 | | $ | 1,022.62 | | 0.50 | % | | $ | 2.54 |
| * | | The annualized expense ratio does not include expenses of Underlying Funds. |
| ** | | Expenses are equal to the Portfolio’s respective annualized expense ratios multiplied by the average account value over the period, multiplied by 184/366 to reflect the most recent fiscal half-year. |
(1) | | Commencement of operations was September 17, 2008. Expenses paid for the Actual Portfolio Return reflect the 106-day period ended December 31, 2008. |
6
REPORT OF INDEPENDENT REGISTERED PUBLIC ACCOUNTING FIRM
The Shareholders and Board of Directors
ING Variable Portfolios, Inc.
We have audited the accompanying statement of assets and liabilities, including the portfolio of investments, of ING Global Equity Option Portfolio, a series of ING Variable Portfolios, Inc., as of December 31, 2008, and the related statements of operations, changes in net assets and financial highlights for the period from September 17, 2008 (commencement of operations) to December 31, 2008. These financial statements and financial highlights are the responsibility of management. Our responsibility is to express an opinion on these financial statements and financial highlights based on our audit.
We conducted our audit in accordance with the standards of the Public Company Accounting Oversight Board (United States). Those standards require that we plan and perform the audit to obtain reasonable assurance about whether the financial statements and financial highlights are free of material misstatement. An audit includes examining, on a test basis, evidence supporting the amounts and disclosures in the financial statements. Our procedures included confirmation of securities owned as of December 31, 2008, by correspondence with the transfer agent. An audit also includes assessing the accounting principles used and significant estimates made by management, as well as evaluating the overall financial statement presentation. We believe that our audit provides a reasonable basis for our opinion.
In our opinion, the financial statements and financial highlights referred to above present fairly, in all material respects, the financial position of the aforementioned portfolio of ING Variable Portfolios, Inc., as of December 31, 2008, and the results of its operations, the changes in its net assets, and the financial highlights for the period specified in the first paragraph above, in conformity with U.S. generally accepted accounting principles.

Boston, Massachusetts
February 27, 2009
7
STATEMENT OF ASSETS AND LIABILITIESASOF DECEMBER 31, 2008
| | | | |
ASSETS: | | | | |
Investments in affiliated underlying funds* | | $ | 5,891,311 | |
Cash | | | 188,617 | |
Dividends and interest receivables | | | 7 | |
Prepaid expenses | | | 10,120 | |
Reimbursement due from manager | | | 6,158 | |
| | | | |
Total assets | | | 6,096,213 | |
| | | | |
LIABILITIES: | | | | |
Payable for fund shares redeemed | | | 48,978 | |
Payable to affiliates | | | 2,039 | |
Payable for directors fees | | | 123 | |
Other accrued expenses and liabilities | | | 8,253 | |
Written options^ | | | 99,418 | |
| | | | |
Total liabilities | | | 158,811 | |
| | | | |
NET ASSETS | | $ | 5,937,402 | |
| | | | |
NET ASSETS WERE COMPRISED OF: | | | | |
Paid-in capital | | $ | 6,950,417 | |
Accumulated net realized gain on investments and written options | | | 221,987 | |
Net unrealized depreciation on investments and written options | | | (1,235,002 | ) |
| | | | |
NET ASSETS | | $ | 5,937,402 | |
| | | | |
| | | | |
* Cost of investments in affiliated underlying funds | | $ | 7,162,345 | |
^ Premiums received for options written | | $ | 135,450 | |
| |
Class S: | | | | |
Net assets | | $ | 5,937,402 | |
Shares authorized | | | 100,000,000 | |
Par value | | $ | 0.001 | |
Shares outstanding | | | 762,444 | |
Net assets value and redemption price per share | | $ | 7.79 | |
See Accompanying Notes to Financial Statements
8
STATEMENT OF OPERATIONS
| | | | |
| | | September 17, 2008(1)
to
December 31, 2008 | |
INVESTMENT INCOME: | | | | |
Dividends from affiliated underlying funds | | $ | 74,365 | |
Interest | | | 16 | |
| | | | |
Total investment income | | | 74,381 | |
| | | | |
EXPENSES: | | | | |
Investment management fees | | | 1,318 | |
Distribution and service fees | | | 3,296 | |
Transfer agent fees | | | 136 | |
Administrative service fees | | | 1,318 | |
Shareholder reporting expense | | | 413 | |
Registration fees | | | 105 | |
Professional fees | | | 4,532 | |
Custody and accounting expense | | | 595 | |
Directors fees | | | 161 | |
Offering expense | | | 4,028 | |
Miscellaneous expense | | | 745 | |
| | | | |
Total expenses | | | 16,647 | |
Net waived and reimbursed fees | | | (10,056 | ) |
| | | | |
Net expenses | | | 6,591 | |
| | | | |
Net investment income | | | 67,790 | |
| | | | |
REALIZED AND UNREALIZED GAIN (LOSS) ON AFFILIATED UNDERLYING FUNDS
AND WRITTEN OPTIONS: | | | | |
Net realized gain (loss) on: | | | | |
Sale of affiliated underlying funds | | | (7,641 | ) |
Written options | | | 230,696 | |
| | | | |
Net realized gain on affiliated underlying funds and written options | | | 223,055 | |
| | | | |
Net change in unrealized appreciation or depreciation on: | | | | |
Affiliated underlying funds | | | (1,271,034 | ) |
Written options | | | 36,032 | |
| | | | |
Net change in unrealized appreciation or depreciation on affiliated underlying funds
and written options | | | (1,235,002 | ) |
| | | | |
Net realized and unrealized loss on affiliated underlying funds and written options | | | (1,011,947 | ) |
| | | | |
Decrease in net assets resulting from operations | | $ | (944,157 | ) |
| | | | |
(1) | | Commencement of operations |
See Accompanying Notes to Financial Statements
9
STATEMENT OF CHANGES IN NET ASSETS
| | | | |
| | | September 17, 2008(1)
to
December 31, 2008 | |
FROM OPERATIONS: | | | | |
Net investment income | | $ | 67,790 | |
Net realized gain on affiliated underlying funds and written options | | | 223,055 | |
Net change in unrealized appreciation or depreciation on affiliated underlying funds and written options | | | (1,235,002 | ) |
| | | | |
Decrease in net assets resulting from operations | | | (944,157 | ) |
| | | | |
FROM DISTRIBUTIONS TO SHAREHOLDERS: | | | | |
Net investment income | | | (71,893 | ) |
| | | | |
Total distributions | | | (71,893 | ) |
| | | | |
FROM CAPITAL SHARE TRANSACTIONS: | | | | |
Net proceeds from sale of shares | | | 6,959,779 | |
Reinvestment of distributions | | | 69,693 | |
| | | | |
| | | 7,029,472 | |
Cost of shares redeemed | | | (76,020 | ) |
| | | | |
Net increase in net assets resulting from capital share transactions | | | 6,953,452 | |
| | | | |
Net increase in net assets | | | 5,937,402 | |
| | | | |
NET ASSETS: | | | | |
Beginning of period | | | — | |
| | | | |
End of period | | $ | 5,937,402 | |
| | | | |
(1) | | Commencement of operations |
See Accompanying Notes to Financial Statements
10
FINANCIAL HIGHLIGHTS
Selected data for a share of beneficial interest outstanding throughout each year or period.
| | | | | | | | | | | | | | | | | | | | | | | | | | | | | | | | | | | | |
| | | | | Income (loss)
from
investment
operations | | | | | | Less distributions | | | | | | | | | Ratios to average net assets | | Supplemental
data |
| | | | | | | | | | | | | | | | | | | | | | | | | | | | | | | | | | | | | |
| | | Net asset value, beginning of year or period | | Net investment income (loss) | | | Net realized and unrealized gain (loss) | | | Total from investment operations | | | From net investment income | | From net realized gains | | From return of capital | | Total distributions | | Net asset value, end of year or period | | Total return(1) | | | Expenses before reductions/additions(2)(3)(4) | | Expenses net of fee waivers and/or recoupments, if any(2)(3)(4) | | Expenses net of all reductions/additions(2)(3)(4) | | Net investment income (loss)(2)(3)(4) | | Net assets, end of year or period | | Portfolio turnover rate |
| | | | | | | | | | | | | | | | | | | | | | | | | | | | | | | | | | | | |
Year or period ended | | ($) | | ($) | | | ($) | | | ($) | | | ($) | | ($) | | ($) | | ($) | | ($) | | (%) | | | (%) | | (%) | | (%) | | (%) | | ($000's) | | (%) |
ING Global Equity Option Portfolio | | | | | | | | | | | | | | | | | | | | | | | | | | | | | | | | | | | | |
Class S | | | | | | | | | | | | | | | | | | | | | | | | | | | | | | | | | | | | |
09-17-08(5) - 12-31-08 | | 10.00 | | 0.12 | Ÿ | | (2.24 | ) | | (2.12 | ) | | 0.09 | | — | | — | | 0.09 | | 7.79 | | (21.15 | ) | | 1.25 | | 0.50 | | 0.50 | | 5.09 | | 5,937 | | 1 |
(1) | | Total return is calculated assuming reinvestment of dividends and capital gain distributions at net asset value and does not reflect the effect of insurance contract charges. Total return for less than one year is not annualized. |
(2) | | Annualized for periods less than one year. |
(3) | | Expense ratios do not include expenses of Underlying Funds and do not include fees and expenses charged under the variable annuity contract or variable life insurance policy. |
(4) | | Expense ratios reflect operating expenses of a Portfolio. Expenses before reductions do not reflect amounts reimbursed by the Investment Adviser and/or Distributor or reductions from brokerage commission recapture arrangements or other expense offset arrangements and do not represent the amount paid by a Portfolio during periods when reimbursements or reductions occur. Expenses net of fee waivers reflect expenses after reimbursement by the Investment Adviser and/or Distributor but prior to reductions from brokerage commission recapture arrangements or other expense offset arrangements. Expenses net of all reductions represent the net expenses paid by a Portfolio. Net investment income (loss) is net of all such additions or reductions. |
(5) | | Commencement of operations. |
| Ÿ | | Calculated using average number of shares outstanding throughout the period. |
See Accompanying Notes to Financial Statements
11
NOTES TO FINANCIAL STATEMENTSASOF DECEMBER 31, 2008
NOTE 1 — ORGANIZATION
Organization. ING Variable Portfolios, Inc. (the “Company” or the “Registrant”) is registered under the Investment Company Act of 1940, as amended (“1940 Act”) as an open-end management company. The Registrant is a company incorporated under the laws of Maryland on June 4, 1996 and has fifteen active separate portfolios. The Portfolio included in this report is ING Global Equity Option Portfolio (“Global Equity Option”) which is a diversified series of the Company.
The Portfolio offers Class S shares.
Shares of the Portfolio may be offered to separate accounts of insurance companies as investment options under variable annuity contracts and variable life insurance policies. Shares may also be offered to qualified pension and retirement plans outside the variable contract and to certain investment advisers and their affiliates.
Participating insurance companies and other designated organizations are authorized to receive purchase orders on the Portfolio’s behalf. ING Investments, LLC (“ING Investments” or the “Investment Adviser”), an Arizona limited liability company, serves as the investment adviser to the Portfolio. ING Investments has engaged ING Investment Management Co. (“ING IM”), a Connecticut corporation, to serve as the sub-adviser to the Portfolio. ING Funds Distributor, LLC (“IFD” or the “Distributor”) is the principal underwriter of the Portfolio. ING Investments, ING IM and the Distributor are indirect, wholly-owned subsidiaries of ING Groep N.V. (“ING Groep”). ING Groep is a global financial institution of Dutch origin offering banking, investments, life insurance and retirement services to over 75 million private, corporate and institutional clients in more than 50 countries. With a diverse workforce of about 125,000 people, ING Groep comprises a broad spectrum of prominent companies that increasingly serve their clients under the ING brand.
On October 19, 2008, ING Groep announced that it reached an agreement with the Dutch government to strengthen its capital position, creating a strong buffer to navigate the current market and economic environment. ING Groep will issue non-voting core Tier-1 securities for a total consideration of EUR 10 billion to the Dutch State. The transaction boosts ING Bank’s core Tier-1 ratio, strengthens the insurance balance sheet and reduces ING Groep’s Debt/Equity ratio.
The Portfolio seeks long-term growth of capital by investing in other ING Funds (“Underlying Funds”) and uses an asset allocation strategy to determine how much to invest in the Underlying Funds. The Underlying Funds, in turn, invest in equity securities located in a number of different countries, one of which is the United States.
NOTE 2 — SIGNIFICANT ACCOUNTING POLICIES
The following significant accounting policies are consistently followed by the Portfolio in the preparation of its financial statements. Such policies are in conformity with U.S. generally accepted accounting principles for investment companies.
| A. | Security Valuation. The valuation of the Portfolio’s investments in its Underlying Funds is based on the net asset value of the Underlying Funds each business day. |
Effective for fiscal years beginning after November 15, 2007, Financial Accounting Standards Board (“FASB”) Statement of Financial Accounting Standards No. 157, “Fair Value Measurements”, establishes a hierarchy for measuring fair value of assets and liabilities. As required by the standard, each investment asset or liability of the Portfolio is assigned a level at measurement date based on the significance and source of the inputs to its valuation.
Quoted prices in active markets for identical securities are classified as “Level 1”, inputs other than quoted prices for an asset that are observable are classified as “Level 2” and unobservable inputs, including the sub-adviser’s judgment about the assumptions that a market participant would use in pricing an asset or liability are classified as “Level 3”. The inputs used for valuing securities are not necessarily an indication of the risks associated with investing in those securities. A table summarizing the Portfolio’s investments under these levels of classification is included following the Portfolio of Investments.
Effective for fiscal years and interim periods ending after November 15, 2008, the FASB issued FASB Staff Position (“FSP”) No. FAS 133-1 and FASB Interpretation Number (“FIN”) 45-4, “Disclosures about Credit Derivatives and Certain Guarantees: An Amendment of FASB Statement No. 133 and FASB Interpretation No. 45; and Clarification of the Effective Date of FASB Statement No. 161.” The amendments to FAS 133 require enhanced
12
NOTES TO FINANCIAL STATEMENTSASOF DECEMBER 31, 2008 (CONTINUED)
NOTE 2 — SIGNIFICANT ACCOUNTING POLICIES
(continued)
disclosure regarding credit derivatives sold, including (1) the nature and terms of the credit derivative, reasons for entering into the credit derivative, the events or circumstances that would require the seller to perform under the credit derivative, and the current status of the payment/performance risk of the credit derivative, (2) the maximum potential amount of future payments (undiscounted) the seller could be required to make under the credit derivative, (3) the fair value of the credit derivative, and (4) the nature of any recourse provisions and assets held either as collateral or by third parties. The amendments to FIN 45 require additional disclosures about the current status of the payment/performance risk of a guarantee. All changes to accounting policies have been made in accordance with the FSP and incorporated for the current period as part of the Notes to Financial Statements and Portfolio of Investments.
| B. | Security Transactions and Revenue Recognition. Security transactions are accounted for on trade date. Dividend income received from the affiliated funds is recognized on the ex-dividend date and is recorded as income distributions in the Statement of Operations. Capital gain distributions received from the affiliated funds are recognized on ex-dividend date and are recorded on the Statement of Operations as such. Costs used in determining realized gains and losses on the sales of investment securities are on the basis of specific identification. |
| C. | Distributions to Shareholders. The Portfolio records distributions to its shareholders on the ex-dividend date. The Portfolio distributes dividends and capital gains, if any, annually. The Portfolio may make distributions on a more frequent basis to comply with the distribution requirements of the Internal Revenue Code. The characteristics of income and gains to be distributed are determined in accordance with income tax regulations, which may differ from U.S. generally accepted accounting principles for investment companies. |
| D. | Federal Income Taxes. It is the policy of the Portfolio to comply with subchapter M of the Internal Revenue Code and related excise tax provisions applicable to regulated investment companies and to distribute substantially all of its net investment income and any net realized capital gains to its shareholders. Therefore, no federal income tax |
| | provision is required. Management has considered the sustainability of the Portfolio’s tax position taken on federal income tax returns for all open tax years in making this determination. No capital gain distributions shall be made until any capital loss carryforwards have been fully utilized or expired. |
| E. | Use of Estimates. The preparation of financial statements in conformity with U.S. generally accepted accounting principles requires management to make estimates and assumptions that affect the reported amounts of assets and liabilities and disclosure of contingent assets and liabilities at the date of the financial statements and the reported amounts of increases and decreases in net assets from operations during the reporting period. Actual results could differ from those estimates. |
| F. | Repurchase Agreements. Certain Underlying Funds may invest in repurchase agreements only with government securities dealers recognized by the Board of Governors of the Federal Reserve System. Under such agreements, the seller of the security agrees to repurchase it at a mutually agreed upon time and price. The resale price is in excess of the purchase price and reflects an agreed upon interest rate for the period of time the agreement is outstanding. The period of the repurchase agreements is usually short, from overnight to one week, while the underlying securities generally have longer maturities. An Underlying Fund will always receive as collateral securities acceptable to it whose market value is equal to at least 100% of the carrying amount of the repurchase agreements, plus accrued interest, being invested by the Underlying Fund. The underlying collateral is valued daily on a mark to market basis to assure that the value, including accrued interest is at least equal to the repurchase price. There would be potential loss to the Underlying Fund in the event the Underlying Fund is delayed or prevented from exercising its right to dispose of the collateral, and it might incur disposition costs in liquidating the collateral. |
| G. | Options Contracts. The Portfolio and/or certain Underlying Funds may purchase put and call options and may write (sell) put options and covered call options. The Portfolio and certain Underlying Funds may engage in option transactions as a hedge against adverse movements in the value of portfolio holdings or to generate gains from options premiums. Option |
13
NOTES TO FINANCIAL STATEMENTSASOF DECEMBER 31, 2008 (CONTINUED)
NOTE 2 — SIGNIFICANT ACCOUNTING POLICIES (continued)
| | contracts are valued daily and unrealized gains or losses are recorded based upon the last sales price on the principal exchange on which the options are traded. The Portfolio and certain Underlying Funds will realize a gain or loss upon the expiration or closing of the option contract. When an option is exercised, the proceeds on sale of the underlying security for a written call option, the purchase cost of the security for a written put option, or the cost of the security for a purchased put or call option is adjusted by the amount of premium received or paid. Realized and unrealized gains or losses on option contracts are reflected in the accompanying financial statements. The risk in writing a call option is that the Portfolio or an Underlying Fund gives up the opportunity for profit if the market price of the security increases and the option is exercised. The risk in writing a put option is that the Portfolio or an Underlying Fund may incur a loss if the market price of the security decreases and the option is exercised. The risk in buying an option is that the Portfolio or an Underlying Fund pays a premium whether or not the option is exercised. Risks may also arise from an illiquid secondary market or from the inability of counterparties to meet the terms of the contract. |
Certain Portfolios are party to International Swap Dealers Association, Inc. Master Agreements (“ISDA Master Agreements”). These agreements are with select counterparties and they govern transactions, including certain over-the-counter derivative and foreign exchange contracts, entered into by the Portfolios and the counterparty. The ISDA Master Agreements maintain provisions for general obligations, representations, agreements, collateral, and events of default or termination. The occurrence of a specified event of termination may give a counterparty the right to terminate all of its contracts and affect settlement of all outstanding transactions under the applicable ISDA Master Agreement.
| H. | Organization Expenses and Offering Costs. Costs incurred with the organization of the Portfolio were expensed as incurred. Costs incurred with the offering of shares of the Portfolio are deferred and amortized over a twelve-month period on a straight-line basis starting at the commencement of operations. |
| I. | Indemnifications. In the normal course of business, the Company may enter into contracts that provide certain indemnifications. The Company’s maximum exposure under these arrangements is dependent on future claims that may be made against the Portfolio and, therefore, cannot be estimated; however, based on experience, the risk of loss from such claims is considered remote. |
NOTE 3 — INVESTMENT MANAGEMENT AND ADMINISTRATIVE FEES
The Portfolio entered into an investment management agreement (“Investment Management Agreement”) with ING Investments, an indirect, wholly-owned subsidiary of ING Groep. The Investment Management Agreement compensates the Investment Adviser with a fee, computed daily and payable monthly, in an amount equal to 0.10% of Portfolio’s average daily net assets.
The Investment Adviser entered into a sub-advisory agreement with ING IM. ING IM acts as sub-adviser to the Portfolio. Subject to such policies as the Board or the Investment Adviser may determine, ING IM manages the Portfolios’ assets in accordance with the Portfolio’s investment objectives, policies, and limitations.
ING Funds Services, LLC (the “Administrator”), an indirect, wholly-owned subsidiary of ING Groep, acts as administrator and provides certain administrative and shareholder services necessary for the Portfolio’s operations and is responsible for the supervision of other service providers. The Administrator receives compensation in the amount equal to 0.10% of the Portfolio’s average daily net assets.
NOTE 4 — INVESTMENTS IN AFFILIATED UNDERLYING FUNDS
For the period from September 17, 2008 to December 31, 2008, the cost of purchases and the proceeds from the sales of the Underlying Funds were $7,197,055 and $27,069, respectively.
NOTE 5 — DISTRIBUTION AND SERVICE FEES
Class S shares of the Portfolio have adopted a Distribution Plan pursuant to Rule 12b-1 under the 1940 Act (the “12b-1 Plans”), whereby the Distributor is compensated by the Portfolio for expenses incurred in the distribution of the Portfolio’s shares (“Distribution Fees”). Pursuant to the 12b-1 Plan, the Distributor is entitled to a payment each month to compensate for expenses incurred in the distribution and promotion of the Portfolio’s shares, including expenses incurred in
14
NOTES TO FINANCIAL STATEMENTSASOF DECEMBER 31, 2008 (CONTINUED)
NOTE 5 — DISTRIBUTION AND SERVICE FEES (continued)
printing prospectuses and reports used for sales purposes, expenses incurred in preparing and printing sales literature and other such distribution related expenses, including any distribution or shareholder servicing fees (“Service Fees”) paid to securities dealers who have executed a distribution agreement with the Distributor. Under the 12b-1 Plan, Class S shares of the Portfolio pay the Distributor a fee calculated at an annual rate of 0.25% of average daily net assets.
NOTE 6 — OTHER TRANSACTIONS WITH AFFILIATES AND RELATED PARTIES
At December 31, 2008, the Portfolio had the following amounts recorded in payable to affiliates on the accompanying Statement of Assets and Liabilities:
| | | | | | | | | | |
Accrued
Investment
Management
Fees | | Accrued Administrative Fees | | Accrued Shareholder Service and Distribution Fees | | Total |
| $ | 453 | | $ | 453 | | $ | 1,133 | | $ | 2,039 |
At December 31, 2008, the following indirect, wholly-owned subsidiary of ING Groep owned more than 5% of the Portfolio:
ING USA Annuity and Life Insurance Company — 34.20%.
ING USA Life and Annuity Company — 65.80%.
Control is defined by the 1940 Act as the beneficial ownership, either directly or through one or more controlled companies, of more than 25% of the voting securities of a company. The 1940 Act defines affiliates as companies that are under common control. Investment activities of these shareholders could have a material impact on the Portfolio.
The Registrant has adopted a Deferred Compensation Plan (the “Policy”), which allows eligible non-affiliated directors as described in the Policy to defer the receipt of all or a portion of the directors’ fees payable. Deferred fees are invested in various funds advised by ING Investments until distribution in accordance with the Policy.
NOTE 7 — EXPENSE LIMITATIONS
The Investment Adviser has agreed to limit expenses, excluding interest, taxes, brokerage commissions,
extraordinary expenses and acquired fund fees and expenses to the levels listed below:
(1) | The operating expense limit applies only at the Portfolio level and does not limit fees payable by the underlying investment companies in which the Portfolio invests. |
The Investment Adviser may at a later date recoup from the Portfolio management fees waived and other expenses assumed by the Investment Adviser during the previous 36 months, but only if, after such recoupment, that Portfolio’s expense ratio does not exceed the percentage described above. Waived and reimbursed fees net of any recoupment by the Investment Adviser of such waived and reimbursed fees are reflected on the accompanying Statement of Operations for the Portfolio. Outstanding reimbursement balances due to the Portfolio, if any, under its respective expense limitation agreements are reflected in Reimbursement Due from Investment Adviser on the accompanying Statement of Assets and Liabilities.
As of December 31, 2008, the amounts of waived and reimbursed fees that are subject to possible recoupment by the Investment Adviser, and the related expiration dates are as follows:
| | | | | | | | | | |
| December 31, | | Total |
2009 | | 2010 | | 2011 | |
| $ | — | | $ | — | | $ | 10,056 | | $ | 10,056 |
The expense limitation agreement is contractual and shall renew automatically for one-year terms unless DSL provides written termination of the expense limitation agreement within 90 days of the end of the then current term.
NOTE 8 — WRITTEN OPTIONS
Transactions in written options for the period ended December 31, 2008 were as follows:
| | | | | | | |
| | | Number of
Contracts | | | Premium | |
Balance at 9/17/08 | | — | | | $ | — | |
Options Written | | 62,931 | | | | 372,007 | |
Options Terminated in Closing Purchase Transactions | | (1,216 | ) | | | (68,777 | ) |
Options Expired | | (37,704 | ) | | | (167,780 | ) |
| | | | | | | |
Balance at 12/31/08 | | 24,011 | | | $ | 135,450 | |
| | | | | | | |
15
NOTES TO FINANCIAL STATEMENTSASOF DECEMBER 31, 2008 (CONTINUED)
NOTE 9 — CAPITAL SHARES
Transactions in capital shares and dollars were as follows:
| | | | | | | | | | | | | | | | | | | | |
| Year or period ended | | Shares
sold | | Reinvestment
of
distributions | | Shares
redeemed | | | Net increase
(decrease) in
shares
outstanding | | | | Shares
sold | | Reinvestment
of
distributions | | Shares
redeemed | | | Net increase
(decrease) in
shares
outstanding |
| | | # | | # | | # | | | # | | | | ($) | | ($) | | ($) | | | ($) |
Global Equity Option | | | | | | | | | | | | | | |
Class S | | | | | | | | | | | | | | | | | | | | |
09-17-08(1)-12-31-08 | | 763,230 | | 8,948 | | (9,734 | ) | | 762,444 | | | | 6,959,779 | | 69,693 | | (76,020 | ) | | 6,953,452 |
(1) | | Commencement of operations. |
NOTE 10 — FEDERAL INCOME TAXES
The amount of distributions from net investment income and net realized capital gains are determined in accordance with federal income tax regulations, which may differ from U.S. generally accepted accounting principles for investment companies. These book/tax differences may be either temporary or permanent. Permanent differences are reclassified within the capital accounts based on their federal tax-basis treatment; temporary differences are not reclassified. Key differences include the treatment of short-term capital gains, foreign currency transactions, and wash sale deferrals. Distributions in excess of net investment income and/or net realized capital gains for tax purposes are reported as return of capital.
The following permanent tax differences have been reclassified as of December 31, 2008:
| | | | | | | | | |
Paid-in
Capital | | | Undistributed Net
Investment Income | | Accumulated
Net Realized
Gains / (Losses) | |
| $ | (3,035 | ) | | $ | 4,103 | | $ | (1,068 | ) |
Dividends paid by the Portfolio from net investment income and distributions of net realized short-term capital gains are, for federal income tax purposes, taxable as ordinary income to shareholders.
The Portfolio paid an ordinary income dividend of $71,893 for the period ended December 31, 2008.
The tax-basis components of distributable earnings as of December 31, 2008 were:
| | | | | |
Undistributed
Ordinary
Income | | Unrealized
Appreciation/
(Depreciation) | |
| $ | 229,628 | | $ | (1,242,643 | ) |
The Portfolio's major tax jurisdictions are federal and Arizona. The earliest tax year that remains subject to examination by these jurisdictions is 2008.
NOTE 11 — CONCENTRATION OF INVESTMENT RISKS
The Portfolio is also affected by other kinds of risks, depending on the types of securities held or strategies used by an Underlying Fund.
Investment by Funds-of-Funds. Each of the Underlying Funds’ shares may be purchased by other investment companies. In some cases, an Underlying Fund may experience large inflows or redemptions due to allocations or rebalancing. While it is impossible to predict the overall impact of these transactions over time, there could be adverse effects on portfolio management. The Investment Adviser will monitor transactions by each Underlying Fund and will attempt to minimize any adverse effects on the Underlying Funds and the Fund as a result of these transactions. So long as an Underlying Fund accepts investments by other investment companies, it will not purchase securities of other investment companies, except to the extent permitted by the 1940 Act or under the terms of an exemptive order granted by the SEC.
Asset Allocation. Although asset allocation seeks to optimize returns given various levels of risk tolerance, you still may lose money and experience volatility. Market and asset class performance may differ in the future from the historical performance and the assumptions used to form the asset allocations for the Portfolio. Furthermore, the Investment Adviser’s allocation of the Portfolio’s assets may not anticipate market trends successfully. Assets will be allocated among Underlying Funds and markets based on judgments made by the Investment Adviser. There is a risk that the Portfolio may allocate assets to an asset class or market that underperforms other Underlying Funds. For example, the Portfolio may be underweighted in assets or a market that is experiencing significant returns or overweighted in assets or a market with significant declines.
16
NOTES TO FINANCIAL STATEMENTSASOF DECEMBER 31, 2008 (CONTINUED)
NOTE 11 — CONCENTRATION OF INVESTMENT RISKS (continued)
Foreign Securities. Investments in foreign securities may entail risks not present in domestic investments. Since securities in which an Underlying Fund may invest are denominated in foreign currencies, changes in the relationship of these foreign currencies to the U.S. dollar can significantly affect the value of the investments and earnings of the Underlying Funds. Foreign investments may also subject the Underlying Funds to foreign government exchange restrictions, expropriation, taxation or other political, social or economic developments, as well as changes vis-a-vis the U.S. dollar from movements in currency, and changes in security value and interest rate, all of which could affect the market and/or credit risk of the Underlying Funds’ investments.
Emerging Markets Investments. Because of less developed markets and economies and, in some countries, less mature governments and governmental institutions, the risks of investing in foreign securities can be intensified in the case of investments in issuers
domiciled or doing substantial business in emerging market countries.
NOTE 12 — OTHER ACCOUNTING PRONOUNCEMENTS
On March 19, 2008, the FASB issued Statement of Financial Accounting Standards No. 161 (“SFAS No. 161”), “Disclosure about Derivative Instruments and Hedging Activities.” This new accounting statement requires enhanced disclosures about an entity’s derivative and hedging activities. Entities are required to provide enhanced disclosures about (a) how and why an entity invests in derivatives, (b) how derivatives are accounted for under SFAS No. 133, and (c) how derivatives affect an entity’s financial position, financial performance, and cash flows. SFAS No. 161 also requires enhanced disclosures regarding credit-risk-related contingent features of derivative instruments. SFAS No. 161 is effective for financial statements issued for fiscal years and interim periods beginning after November 15, 2008. As of December 31, 2008, management of the Portfolio is currently assessing the impact of the expanded financial statement disclosures that will result from adopting SFAS No. 161.
17
| | |
| ING GLOBAL EQUITY OPTION PORTFOLIO | | PORTFOLIO OF INVESTMENTS ASOF DECEMBER 31, 2008 |
| | | | | | | | |
| Shares | | | | | | | Value |
| |
AFFILIATED INVESTMENT COMPANIES: 99.2%
|
| | | |
| 288,662 | | ING International Growth Opportunities Portfolio - Class I | | | | | $ | 990,110 |
| 195,704 | | ING VP Growth and Income Portfolio - Class I | | | | | | 2,957,087 |
| 199,420 | | ING VP International Value Portfolio - Class I | | | | | | 1,350,072 |
| 45,998 | | ING VP MidCap Opportunities Portfolio - Class I | | | | | | 294,389 |
| 25,611 | | ING VP Small Company Portfolio - Class I | | | | | | 299,653 |
| | | | | | | | |
| | Total Investments in Securities (Cost $7,162,345)* | | 99.2 | % | | $ | 5,891,311 |
| | Other Assets and Liabilities - Net | | 0.8 | | | | 46,091 |
| | | | | | | | |
| | Net Assets | | 100.0 | % | | $ | 5,937,402 |
| | | | | | | | |
| * | Cost for federal income tax purposes is $7,169,986. |
| | | | |
Net unrealized depreciation consists of: | | | | |
Gross Unrealized Appreciation | | $ | — | |
Gross Unrealized Depreciation | | | (1,278,675 | ) |
| | | | |
Net Unrealized Depreciation | | $ | (1,278,675 | ) |
| | | | |
The following table summarizes the inputs used as of December 31, 2008 in determining the Portfolio’s investments at fair value for purposes of SFAS 157:
| | | | | | | |
| | | Investments
in Securities | | Other Financial
Instruments* | |
Level 1 — Quoted Prices | | $ | 5,891,311 | | $ | — | |
Level 2 — Other Significant Observable Inputs | | | — | | | (99,418 | ) |
Level 3 — Significant Unobservable Inputs | | | — | | | — | |
| | | | | | | |
Total | | $ | 5,891,311 | | $ | (99,418 | ) |
| | | | | | | |
“Fair value” for purposes of SFAS 157 is different from “fair value” as used in the 1940 Act. The former generally implies market value, and can include market quotations as a source of value, and the latter refers to determinations of actual value in absence of available market quotations.
| * | Other financial instruments may include forward foreign currency contracts, futures, swaps, and written options. Forward foreign currency contracts and futures are reported at their unrealized gain/loss at year end. Swaps and written options are reported at their market value at year end. |
Written OTC Call Options
| | | | | | | | | | | | | | | | | | |
# of
Contracts | | Counterparty | | Description | | Expiration
Date | | Strike Price | | Premiums
Received | | Value | |
| 22,222 | | Citigroup Global Markets Inc. | | iShares MSCI EAFE Index | | | 01/08/09 | | USD | | 42.07 | | $ | 48,613 | | $ | (65,649 | ) |
| 464 | | Citigroup Global Markets Inc. | | S&P 400 MidCap Index | | | 01/08/09 | | USD | | 517.09 | | | 14,996 | | | (12,146 | ) |
| 1,325 | | UBS AG | | S&P 500® Index | | | 01/08/09 | | USD | | 909.70 | | | 71,841 | | | (21,623 | ) |
| | | | | | | | | | | | | | | | | | |
| | | | | | | | | | | | | $ | 135,450 | | $ | (99,418 | ) |
| | | | | | | | | | | | | | | | | | |
| | | | Total Premiums Received: | | $ | 135,450 | | | | | | | | | | | |
| | | | Total Liabilities for Call Options Written: | | $ | 99,418 | | | | | | | | | | | |
See Accompanying Notes to Financial Statements
18
TAX INFORMATION (UNAUDITED)
Dividends paid during the year ended December 31, 2008 were as follows:
| | | | | |
Fund Name | | Type | | Per Share Amount |
| | |
ING Global Equity Option Portfolio Class S | | NII | | $ | 0.0947 |
| NII | | - Net investment income |
Of the ordinary distributions made during the year ended December 31, 2008, 19.82% qualifies for the dividends received deduction (DRD) available to corporate shareholders.
Above figures may differ from those cited elsewhere in this report due to differences in the calculation of income and gains under U.S. generally accepted accounting principles (book) purposes and Internal Revenue Service (tax) purposes.
Shareholders are strongly advised to consult their own tax advisers with respect to the tax consequences of their investments in the Portfolio. In January, shareholders, excluding corporate shareholders, receive an IRS 1099-DIV regarding the federal tax status of the dividends and distributions they received in the calendar year.
19
DIRECTOR AND OFFICER INFORMATION (UNAUDITED)
The business and affairs of the Company are managed under the direction of the Board. A director who is not an interested person of the Company, as defined in the 1940 Act, is an independent director (“Non-Interested Director”). The Directors of the Portfolios are listed below. The Statement of Additional Information includes additional information about Directors of the Company and is available, without charge, upon request at (800) 992-0180.
| | | | | | | | | | |
Name, Address and Age | | Position(s) held with the Company | | Term of Office and Length of Time Served(1) | | Principal Occupation(s) during the Past Five Years | | Number of Portfolios in Fund Complex Overseen by Director(2) | | Other Directorships held by Director |
| | | | | |
Albert E. DePrince, Jr. 7337 E. Doubletree Ranch Rd. Scottsdale, Arizona 85258 Age: 67 | | Director | | June 1998 - Present | | Professor of Economics and Finance, Middle Tennessee State University (August 1991 - Present). | | 39 | | Academy of Economics and Finance (February 2002 - Present). |
| | | | | |
Martin Gavin* 7337 E. Doubletree Ranch Rd. Scottsdale, Arizona 85258 Age: 58 | | Director | | January 2009 - Present | | President, Connecticut Children’s Medical Center (May 2006 - Present). Formerly, Interim President, Connecticut Children’s Medical Center (January 2006 - May 2006). | | 39 | | None |
| | | | | |
Sidney Koch 7337 E. Doubletree Ranch Rd. Scottsdale, Arizona 85258 Age: 73 | | Director | | April 1994 - Present | | Retired. Self-Employed Consultant (June 2000 - Present). | | 39 | | None |
| | | | | |
Dr. Corine T. Norgaard 7337 E. Doubletree Ranch Rd. Scottsdale, Arizona 85258 Age: 71 | | Director | | June 1991 - Present | | Retired. Formerly, Dean of the Barney School of Business, University of Hartford (August 1996 - June 2004). Formerly, President, Thompson Enterprises (September 2004 - September 2005). | | 39 | | Mass Mutual Corporate and Participation Investors (April 1997 - Present); Mass Mutual Premier Series (December 2004 - Present); and Mass Mutual MML Series Investment Funds II (December 2005 - Present). |
| | | | | |
Joseph E. Obermeyer 7337 E. Doubletree Ranch Rd. Scottsdale, Arizona 85258 Age: 51 | | Director | | January 2003 - Present | | President, Obermeyer & Associates, Inc. (November 1999 - Present). | | 39 | | None |
| | | | | |
Russell Jones 7337 E. Doubletree Ranch Rd. Scottsdale, Arizona 85258 Age: 64 | | Director | | December 2007 - Present | | Retired. Formerly, Senior Vice President, Chief Investment Officer and Treasurer Kaman Corporation (1973 - March 2008) | | 39 | | None |
20
DIRECTOR AND OFFICER INFORMATION (UNAUDITED) (CONTINUED)
| | | | | | | | | | |
Name, Address and Age | | Position(s) held with the Companies | | Term of Office and Length of Time Served(1) | | Principal Occupation(s) during the Past Five Years | | Number of Portfolios in Fund Complex Overseen by Director(2) | | Other Directorships held by Director |
Directors/Trustee who are “Interested Persons:” | | | | |
| | | | | |
Shaun Mathews(3)(4) 7337 E. Doubletree Ranch Rd. Scottsdale, Arizona 85258 Age: 53 | | Director | | December 2007 - Present | | President and Chief Executive Officer, ING Investments, LLC(5) (November 2006 - Present). Formerly, President, ING Mutual Funds and Investment Products (November 2004 - November 2006); Chief Marketing Officer, ING USFS (April 2002 - October 2004); and Head of Rollover/Payout (October 2001 - December 2003). | | 200 | | ING Services Holding Company, Inc. (May 2000 - Present); Southland Life Insurance Company (June 2002 - Present); and ING Capital Corporation, LLC, ING Funds Distributor, LLC(6), ING Funds Services, LLC(7), ING Investments, LLC(5) and ING Pilgrim Funding, Inc. (December 2006 - Present). |
| | | | | |
Fredric (Rick) A. Nelson III(8) ING Investment Management 230 Park Avenue New York, New York 10169 Age: 52 | | Director | | December 2007 - January 2009 | | Chief Investment Officer, ING (April 2003 - January 2009) | | | | None. |
| * | | Mr. Martin Gavin was appointed to the Board effective January 1, 2009. |
(1) | | Directors/Trustees serve until their successors are duly elected and qualified. |
(2) | | For the purposes of this table (except for Mr. Mathews), “Fund Complex” means the following investment companies: ING Series Fund, Inc.; ING Strategic Allocation Portfolios, Inc.; ING Variable Funds; ING Variable Portfolios, Inc.; ING VP Balanced Portfolio, Inc.; ING VP Intermediate Bond Portfolio; and ING VP Money Market Portfolio. |
(3) | | For Mr. Mathews, the Fund Complex also includes the following investment companies: ING Asia Pacific High Dividend Equity Income Fund, ING Equity Trust; ING Funds Trust; ING Global Equity Dividend and Premium Opportunity Fund; ING Global Advantage and Premium Opportunity Fund; ING International High Dividend Equity Income Fund; ING Investors Trust; ING Mayflower Trust; ING Mutual Funds; ING Prime Rate Trust; ING Risk Managed Natural Resources Fund; ING Senior Income Fund; ING Separate Portfolios Trust; ING Variable Insurance Trust; ING Variable Products Trust; and ING Partners, Inc. |
(4) | | “Interested person,” as defined in the 1940 Act, by virtue of this Director’s/Trustee’s affiliation with any of the Funds, ING or any of ING’s affiliates. |
(5) | | ING Investments, LLC was previously named ING Pilgrim Investments, LLC. ING Pilgrim Investments, LLC is the successor in interest to ING Pilgrim Investments, Inc., which was previously known as Pilgrim Investments, Inc. and before that was known as Pilgrim America Investments, Inc. |
(6) | | ING Funds Distributor, LLC is the successor in interest to ING Funds Distributor, Inc., which was previously known as ING Pilgrim Securities, Inc., and before that was known as Pilgrim Securities, Inc., and before that was known as Pilgrim America Securities, Inc. |
(7) | | ING Funds Services, LLC was previously named ING Pilgrim Group, LLC. ING Pilgrim Group, LLC is the successor in interest to ING Pilgrim Group, Inc., which was previously known as Pilgrim Group, Inc. and before that was known as Pilgrim America Group, Inc. |
(8) | | Mr. Nelson resigned from the Board as of January 15, 2009. |
21
DIRECTOR AND OFFICER INFORMATION (UNAUDITED) (CONTINUED)
| | | | | | |
Name, Address and Age | | Position(s) held with the Companies | | Term of Office
and Length of
Time Served(1) | | Principal Occupation(s)
during the Past Five Years |
Officers: | | | | | | |
| | | |
Shaun P. Mathews 7337 East Doubletree Ranch Rd. Scottsdale, Arizona 85258 Age: 53 | | President and Chief Executive Officer | | December 2006 - Present | | President and Chief Executive Officer, ING Investments, LLC (November 2006 - Present). Formerly, President, ING Mutual Funds and Investment Products (November 2004 - November 2006); Chief Marketing Officer, ING USFS (April 2002 - October 2004); and Head of Rollover/Payout (October 2001 - December 2003). |
| | | |
Michael J. Roland 7337 East Doubletree Ranch Rd. Scottsdale, Arizona 85258 Age: 50 | | Executive Vice President | | April 2002 - Present | | Head of Mutual Fund Platform (February 2007 - Present) and Executive Vice President, ING Investments, LLC(2) and ING Funds Services, LLC(3) (December 2001 - Present). Formerly, Executive Vice President, Head of Product Management (January 2005 - January 2007); Chief Compliance Officer, ING Investments, LLC(2) and Directed Services LLC(6) (October 2004 - December 2005); and Chief Financial Officer and Treasurer, ING Investments, LLC(2) (December 2001 - March 2005). |
| | | |
Stanley D. Vyner 230 Park Avenue New York, New York 10169 Age: 58 | | Executive Vice President | | March 2002 - Present | | Executive Vice President, ING Investments, LLC(2) (July 2000 - Present) and Chief Investment Risk Officer, ING Investments, LLC(2) (January 2003 - Present). |
| | | |
Joseph M. O’Donnell 7337 East Doubletree Ranch Rd. Scottsdale, Arizona 85258 Age: 54 | | Executive Vice President and Chief Compliance Officer | | March 2006 - Present November 2004 - Present | | Chief Compliance Officer of the ING Funds (November 2004 - Present) and Executive Vice President of the ING Funds (March 2006 - Present). Formerly, Chief Compliance Officer of ING Investments, LLC(2) (March 2006 - July 2008); Investment Advisor Chief Compliance Officer, Directed Services LLC(6) (March 2006 - July 2008) ING Life Insurance and Annuity Company (March 2006 - December 2006); and Vice President, Chief Legal Counsel, Chief Compliance Officer and Secretary of Atlas Securities, Inc., Atlas Advisers, Inc. and Atlas Funds (October 2001 - October 2004). |
| | | |
Todd Modic 7337 East Doubletree Ranch Rd Scottsdale, Arizona 85258 Age: 41 | | Senior Vice President, Chief/Principle Financial Officer and Assistant Secretary | | March 2005 - Present | | Senior Vice President, ING Funds Services, LLC(3) (March 2005 - Present). Formerly, Vice President, ING Funds Services, LLC(3) (September 2002 - March 2005). |
| | | |
Kimberly A. Anderson 7337 East Doubletree Ranch Rd. Scottsdale, Arizona 85258 Age: 44 | | Senior Vice President | | December 2003 - Present | | Senior Vice President, ING Investments, LLC(2) (October 2003 - Present). |
| | | |
Robert Terris 7337 East Doubletree Ranch Rd. Scottsdale, Arizona 85258 Age: 38 | | Senior Vice President | | June 2006 - Present | | Senior Vice President, Head of Division Operations, ING Funds Services, LLC(3) (May 2006 - Present). Formerly, Vice President of Administration, ING Funds Services, LLC(3) (October 2001 - March 2006). |
| | | |
Ernest J. C’DeBaca 7337 East Doubletree Ranch Rd. Scottsdale, Arizona 85258 Age: 39 | | Senior Vice President | | June 2006 - Present | | Chief Compliance Officer, ING Investments, LLC(2) (July 2008 - Present); Investment Advisor Chief Compliance Officer, Directed Services LLC(6) (July 2008 - Present); Head of Retail Compliance, ING Funds Distributor, LLC(4) and ING Funds Services, LLC(3), (July 2008 - Present); and Senior Vice President, ING Investments, LLC(2) (December 2006 - Present), ING Funds Services, LLC(3) (April 2006 - Present), ING Funds Distributor, LLC(4) (July 2008 - Present), and Directed Services LLC(6) (July 2008 - Present). Formerly, Counsel, ING Americas, U.S. Legal Services (January 2004 - March 2006) and Attorney - Adviser, U.S. Securities and Exchange Commission (May 2001 - December 2003). |
| | | |
Robyn L. Ichilov 7337 East Doubletree Ranch Rd. Scottsdale, Arizona 85258 Age: 41 | | Vice President and Treasurer | | March 2002 - Present | | Vice President and Treasurer, ING Funds Services, LLC(3) (November 1995 - Present) and ING Investments, LLC(2) (August 1997 - Present). |
| | | |
Lauren D. Bensinger 7337 East Doubletree Ranch Rd. Scottsdale, Arizona 85258 Age: 54 | | Vice President | | March 2003 - Present | | Vice President and Chief Compliance Officer, ING Funds Distributor, LLC(4) (August 1995 - Present); Vice President, ING Investments, LLC(2) and ING Funds Services, LLC(3) (February 1996 - Present); and Director of Compliance, ING Investments, LLC(2) (October 2004 - Present). Formerly, Chief Compliance Officer, ING Investments, LLC(2) (October 2001 - October 2004). |
22
DIRECTOR AND OFFICER INFORMATION (UNAUDITED) (CONTINUED)
| | | | | | |
Name, Address and Age | | Position(s) Held
with the Companies | | Term of Office
and Length of
Time Served(1) | | Principal Occupation(s)
during the Past Five Years |
| | | |
William Evans 10 State House Square Hartford, Connecticut 06103 Age: 36 | | Vice President | | September 2007 - Present | | Vice President, Head of Mutual Fund Advisory Group (April 2007 - Present). Formerly, Vice President, U.S. Mutual Funds and Investment Products (May 2005 - April 2007) and Senior Fund Analyst, U.S. Mutual Funds and Investment Products (May 2002 - May 2005). |
| | | |
Maria M. Anderson 7337 East Doubletree Ranch Rd. Scottsdale, Arizona 85258 Age: 50 | | Vice President | | September 2004 - Present | | Vice President, ING Funds Services, LLC(3) (September 2004 - Present). Formerly, Assistant Vice President, ING Funds Services, LLC(3) (October 2001 - September 2004). |
| | | |
Denise Lewis 7337 East Doubletree Ranch Rd. Scottsdale, Arizona 85258 Age: 45 | | Vice President | | April 2007 - Present | | Vice President, ING Funds Services, LLC (December 2006 - Present). Formerly, Senior Vice President, UMB Investment Services Group, LLC (November 2003 - December 2006). |
| | | |
Kimberly K. Springer 7337 East Doubletree Ranch Rd. Scottsdale, Arizona 85258 Age: 51 | | Vice President | | March 2006 - Present | | Vice President, ING Funds Services, LLC(3) (March 2006 - Present). Formerly, Assistant Vice President, ING Funds Services, LLC(3) (August 2004 - March 2006) and Manager, Registration Statements, ING Funds Services, LLC(3) (May 2003 - August 2004). |
| | | |
Susan P. Kinens 7337 East Doubletree Ranch Rd. Scottsdale, Arizona 85258 Age: 32 | | Assistant Vice President | | March 2003 - Present | | Assistant Vice President, ING Funds Services, LLC(3) (December 2002 - Present). |
| | | |
Craig Wheeler 7337 East Doubletree Ranch Rd. Scottsdale, Arizona 85258 Age: 39 | | Assistant Vice President | | June 2008 - Present | | Assistant Vice President - Director of Tax, ING Funds Services (March 2008 - Present). Formerly, Tax Manager, ING Funds Services (March 2005 - March 2008); Tax Senior, ING Funds Services (January 2004 - March 2005); and Tax Senior, KPMG LLP (August 2002 - December 2003). |
| | | |
Theresa K. Kelety 7337 East Doubletree Ranch Rd. Scottsdale, Arizona 85258 Age: 45 | | Secretary | | September 2003 - Present | | Senior Counsel, ING Americas, U.S. Legal Services (April 2008 - Present). Formerly, Counsel, ING Americas, U.S. Legal Services (April 2003 - April 2008). |
| | | |
Huey P. Falgout, Jr. 7337 East Doubletree Ranch Rd. Scottsdale, Arizona 85258 Age: 45 | | Assistant Secretary | | September 2003 - Present | | Chief Counsel, ING Americas, U.S. Legal Services (September 2003 - Present). |
| | | |
Kathleen Nichols 7337 East Doubletree Ranch Rd. Scottsdale, Arizona 85258 Age: 33 | | Assistant Secretary | | June 2008 - Present | | Counsel, ING Americas, U.S. Legal Services (February 2008 - Present). Formerly, Associate, Ropes & Gray LLP (September 2005 - February 2008). |
(1) | | The officers hold office until the next annual meeting of the Directors/Trustees and until their successors shall have been elected and qualified. |
(2) | | ING Investments, LLC was previously named ING Pilgrim Investments, LLC. ING Pilgrim Investments, LLC is the successor in interest to ING Pilgrim Investments, Inc., which was previously known as Pilgrim Investments, Inc. and before that was known as Pilgrim America Investments, Inc. |
(3) | | ING Funds Services, LLC was previously named ING Pilgrim Group, LLC. ING Pilgrim Group, LLC is the successor in interest to ING Pilgrim Group, Inc., which was previously known as Pilgrim Group, Inc. and before that was known as Pilgrim America Group, Inc. |
(4) | | ING Funds Distributor, LLC is the successor in interest to ING Funds Distributor, Inc., which was previously known as ING Pilgrim Securities, Inc., and before that was known as Pilgrim Securities, Inc., and before that was known as Pilgrim America Securities, Inc. |
(5) | | Directed Services, LLC is the successor in interest to Directed Services, Inc. |
23
ADVISORY CONTRACT APPROVAL DISCUSSION (UNAUDITED)
BOARD CONSIDERATIONS IN APPROVING THE INVESTMENT ADVISORY AND SUB-ADVISORY AGREEMENTS FOR THE ING GLOBAL EQUITY OPTION PORTFOLIO
Section 15 of The Investment Company Act of 1940, as amended (the “1940 Act”) provides, in substance, that, each new investment advisory agreement and sub-advisory agreement for a mutual fund must be approved by the board of directors of the fund, including a majority of the directors who have no direct or indirect interest in the agreement and who are not “interested persons” of the fund. Consistent with this requirement of the 1940 Act, the Board of Directors of ING Variable Portfolios, Inc. (the “Company”) has established a process for considering the advisory and sub-advisory arrangements for any new series of the Company prior to the commencement of its operations.
Overview of the Review Process
At its meeting held on June 4, 2008, the board of directors (the “Directors” or the “Board”) of the Company, including all of the independent directors who are not “interested persons” of the Company (the “Independent Directors”), authorized the establishment of the ING Global Equity Option Portfolio (the “Global Equity Option Portfolio”), as a portfolio series of the Company, to operate within the ING complex of mutual funds (the “ING Funds”).
In connection with the establishment of the Global Equity Option Portfolio, the Board, including all of the Independent Directors, voted to approve (i) an investment advisory agreement (the “Advisory Agreement”) for the Global Equity Option Portfolio with ING Investments, LLC (the “Adviser”), (ii) a sub-advisory agreement (the “Sub-Advisory Agreement” and collectively with the Advisory Agreement, the “Agreements”) between the Adviser and ING Investment Management Co. (“IIM” or “Sub-Adviser”) with respect to the Global Equity Option Portfolio. Prior to voting such approvals, the Board received the affirmative recommendation of the Contracts Committee of the Board, which is a Committee of the Board comprised of all of the Independent Directors and exclusively of the Independent Directors.
The Contracts Committee recommended approval of each of the Agreements after completing an extensive review of information received from the Adviser and the Sub-Adviser in connection with the establishment of the Global Equity Option Portfolio and as part of the annual contract approval process for other ING Funds
advised and sub-advised by the Adviser and the Sub-Adviser, respectively. Such information included the following: (1) comparative data regarding management fees, including data regarding the fees charged by the Adviser and the Sub-Adviser for managing other mutual funds and institutional accounts using investment strategies and techniques similar to those to be used in managing the Global Equity Option Portfolio; (2) comparative data regarding the proposed expense ratio of the Global Equity Option Portfolio and the expense ratio of a selected peer group of similar funds (the “Selected Peer Group”); (3) copies of the form of advisory agreement and the form of sub-advisory agreement; (4) copies of the codes of ethics of the Adviser and of the Sub-Adviser, together with information relating to the manner in which each code is administered; (5) financial statements of the Adviser and of the Sub-Adviser; (6) profitability analyses for the Adviser and its affiliated companies with respect to the Global Equity Option Portfolio; (7) descriptions of the qualifications of the investment personnel expected to be responsible for managing the Global Equity Option Portfolio and their responsibilities with respect to managing other accounts or mutual funds; (8) descriptions of the services expected to be provided to the Global Equity Option Portfolio, including the investment strategies and techniques used by the Sub-Adviser in managing the Global Equity Option Portfolio; (9) data relating to brokerage practices, including practices with respect to the acquisition of research through “soft dollar” benefits received in connection with the Global Equity Option Portfolio’s brokerage; (10) descriptions of the business continuity and disaster recovery plans of the Adviser and the Sub-Adviser; (11) descriptions of various compliance programs of the Adviser and the Sub-Adviser, including the Adviser’s programs for monitoring and enforcing compliance with the ING Funds’ policies with respect to market-timing, late trading and selective portfolio disclosure; and (12) other information relevant to an evaluation of the nature, extent and quality of the services expected to be provided by the Adviser and the Sub-Adviser in response to a series of detailed questions presented by independent legal counsel on behalf of the Independent Directors. The Contracts Committee relied upon this information in evaluating the qualifications of the Adviser and Sub-Adviser to manage the Global Equity Option Portfolio.
In addition, the Contracts Committee considered information relating specifically to the investment objective and investment policies of the Global Equity
24
ADVISORY CONTRACT APPROVAL DISCUSSION (UNAUDITED) (CONTINUED)
Option Portfolio and the ability of the Adviser and Sub-Adviser to pursue the Global Equity Option Portfolio’s investment objective by implementing these investment policies. Prior to voting to recommend approval of the Advisory Agreement and the Sub-Advisory Agreement for the Global Equity Option Portfolio, the Contracts Committee and/or the Board received presentations from the Adviser and the Sub-Adviser regarding the investment strategies to be used in pursuing the Global Equity Option Portfolio’s investment objective.
The Independent Directors were assisted by Goodwin Procter LLP, their independent legal counsel, throughout this process. The Independent Directors relied upon the advice of such counsel and their own business judgment in determining the material factors to be considered in evaluating the Advisory Agreement and the Sub-Advisory Agreement and the weight to be given to each such factor. The conclusions reached by the Independent Directors were based on a comprehensive evaluation of all of the information provided and was not the result of any one factor. Moreover, each Independent Director may have afforded different weight to the various factors in reaching his or her conclusions with respect to the Advisory Agreement and the Sub-Advisory Agreement.
Nature, Extent and Quality of Services
In considering whether to approve the Advisory Agreement and the Sub-Advisory Agreement, the Board evaluated the nature, extent and quality of services that will be provided to the Global Equity Option Portfolio by the Adviser and the Sub-Adviser. Specifically, the Board considered the quantity and quality of the resources available to provide such services and the qualifications of the individuals that will be responsible for performing various investment services for the Global Equity Option Portfolio. The Board also considered the quality of the compliance programs of the Adviser and of the Sub-Adviser, including the manner in which the Adviser and the Sub-Adviser will monitor for compliance with the investment policies and restrictions of the Global Equity Option Portfolio, the Codes of Ethics of the Adviser and of the Sub-Adviser with respect to personal trading by employees with access to portfolio information, and other compliance related matters. The Board also considered the actions taken by the Adviser and the Sub-Adviser to establish and maintain effective disaster recovery and business continuity plans.
The Board noted that, in connection with its annual contract review process, it had considered a variety of
other matters bearing on the nature, extent and quality of the services provided to all of the ING Funds, including the actions taken by the Adviser and its affiliated companies to administer the ING Funds’ policies and procedures for valuing the Funds’ assets, selective disclosure of portfolio holdings and preventing late-trading and frequent trading of Fund shares. With respect to these and related compliance matters, the Board had also considered the responsiveness of the Adviser and its affiliated companies over the course of the past several years to the inquiries of various regulatory authorities, including the U.S. Securities and Exchange Commission. The Board also took into account the efforts of the Adviser and its affiliated companies to reduce the expenses of the ING Funds, including fees and expenses for transfer agency, custody and audit services. The Board specifically noted that the Adviser and its affiliated companies have significantly reduced the brokerage costs of the ING Funds and their portfolio turnover rates, as well as the quantity of research acquired through the use of soft dollars from the ING Funds’ brokerage. The Board also noted the efforts of the Adviser to optimize the number of mutual funds in the ING complex of funds and to standardize the asset management characteristics and policies across the ING mutual fund platform. Consideration was also given to the benefits that shareholders of the Global Equity Option Portfolio may realize because the Global Equity Option Portfolio is part of a larger ING family of mutual funds, including, in most cases, the ability of shareholders to exchange or transfer investments within the same class of shares among a wide variety of mutual funds without incurring additional sales charges.
The Board concluded that the nature, extent and quality of advisory and related services to be provided by the Adviser and the Sub-Adviser for the Global Equity Option Portfolio, taken as a whole, can be expected to be consistent with the terms of the Advisory Agreement and Sub-Advisory Agreement and that the fees to be paid for such services are fair and reasonable.
The Board noted that the Global Equity Option Portfolio has no prior performance record. The Board considered the performance achieved by the Sub-Adviser in operating a “model portfolio” using substantially the same investment strategies as the Sub-Adviser will use in managing the Global Equity Option Portfolio. Based on this information, the Board concluded that the Sub-Adviser can be expected to achieve satisfactory performance in managing the portfolio of the Global Equity Option Portfolio.
25
ADVISORY CONTRACT APPROVAL DISCUSSION (UNAUDITED) (CONTINUED)
Management Fee, Sub-Advisory Fee and Expenses
Consideration was given to the proposed contractual investment advisory fee rates, inclusive of administrative fee rates, payable by the Global Equity Option Portfolio to the Adviser and its affiliated companies (referred to collectively as “management fees”) and the contractual sub-advisory fee rates payable by the Adviser to the Sub-Adviser for sub-advisory services. As part of its review, the Board considered the Global Equity Option Portfolio’s proposed management fee and total expense ratio, as compared to its proposed Selected Peer Group. In addition, the Directors received information regarding the fees charged by the Sub-Adviser to similarly-managed institutional accounts and other mutual funds, if any, and the comparability (or lack thereof) of the services provided by the Sub-Adviser in managing such accounts and other mutual funds to the services to be provided in managing the Global Equity Option Portfolio. The Board evaluated the reasonableness of the total fees to be received by the Adviser and its affiliate in the aggregate under the Advisory Agreement and Sub-Advisory Agreement. After reviewing the foregoing information, and in light of the nature, extent and quality of the services to be provided by the Adviser and the Sub-Adviser, the Board concluded that the management fee to be charged to the Global Equity Option Portfolio for advisory, sub-advisory and related services is fair and reasonable and that the total expense ratio of the Global Equity Option Portfolio is reasonable.
Profitability
The Board considered information relating to the revenues, expenses, and profits expected to be realized by the Adviser and its affiliated companies attributable to performing advisory, sub-advisory and administrative services for the Funds. With respect to the Adviser and its affiliated companies, such information was prepared in accordance with a methodology approved by the Contracts Committee. The Board considered the expected profitability of the Adviser and its affiliated companies attributable to managing and operating the Global Equity Option Portfolio both with and without the profitability of the distributor of the Global Equity Option Portfolio and both before and after giving effect to any expenses expected to be incurred by the Adviser or any affiliated company in making revenue sharing or other payments to third parties, including
affiliated insurance companies, for distribution and administrative services. The Board considered the total profits to be derived by the Adviser and the affiliated Sub-Adviser in the aggregate attributable to managing and operating the Global Equity Option Portfolio. The Board also considered other direct or indirect benefits that the Adviser and Sub-Adviser, and any affiliated companies thereof, will derive from their relationships with the Global Equity Option Portfolio, including the receipt by ING U.S. Financial Services, an affiliate of the Adviser, of fees relating to the offering of bundled financial products, such as annuity contracts, and the receipt by the Sub-Adviser of “soft dollar” benefits from the Global Equity Option Portfolio’s brokerage. The Board concluded that, in light of the nature, extent and quality of the services to be provided, the profits expected to be realized by the Adviser and its affiliated companies, taken as a whole, with respect to providing advisory, sub-advisory and administrative services for the Global Equity Option Portfolio are reasonable.
In considering the reasonableness of the management fee of the Global Equity Option Portfolio, the Board considered the extent to which economies of scale can be expected to be realized by the Global Equity Option Portfolio’s Adviser and its affiliated companies, on the one hand, and by the Global Equity Option Portfolio, on the other hand, as the assets of the Global Equity Option Portfolio increase. The Board recognized the inherent difficulties in measuring precisely the impact of any economies of scale being realized by the Adviser and its affiliated companies with respect to their management of any one or more other new funds, along with the Global Equity Option Portfolio. The Board also reviewed information regarding the projected expense ratio of the Global Equity Option Portfolio in light of projected changes in the assets of the Global Equity Option Portfolio, noting that, as the assets of the Global Equity Option Portfolio increase, the fixed expenses of the Global Equity Option Portfolio, as a percentage of the total assets of the Global Equity Option Portfolio, can be expected to decrease. The Board considered such expense information in light of projections provided by the Adviser with respect to the future growth of assets of the Global Equity Option Portfolio. Based upon the foregoing, the Board concluded that the fee schedule for the Global Equity Option Portfolio can be expected to result in an equitable sharing among the Global Equity Option Portfolio, the Adviser and the Sub-Adviser of the benefits from economies of scale as assets grow.
26
Investment Adviser
ING Investments, LLC
7337 East Doubletree Ranch Road
Scottsdale, Arizona 85258
Distributor
ING Funds Distributor, LLC
7337 East Doubletree Ranch Road
Scottsdale, Arizona 85258
Administrator
ING Funds Services, LLC
7337 East Doubletree Ranch Road
Scottsdale, Arizona 85258
Transfer Agent
DST Systems, Inc.
P.O. Box 419368
Kansas City, Missouri 64141
Independent Registered Public Accounting Firm
KPMG LLP
99 High Street
Boston, Massachusetts 02110
Custodian
The Bank of New York Mellon
One Wall Street
New York, New York 10286
Legal Counsel
Goodwin Procter LLP
Exchange Place
53 State Street
Boston, Massachusetts 02109
Before investing, carefully consider the investment objectives, risks, charges and expenses of the variable universal life insurance policy or variable annuity contract and the underlying variable investment options. This and other information is contained in the prospectus for the variable universal life policy or variable annuity contract and the underlying variable investment options. Obtain these prospectuses from your agent/registered representative and read them carefully before investing.
| | | | |
 | | VPAR-AFOFGEOS | | (1208-022709) |
Item 2. Code of Ethics.
As of the end of the period covered by this report, Registrant had adopted a code of ethics, as defined in Item 2 of Form N-CSR, that applies to the Registrant’s principal executive officer and principal financial officer. There were no amendments to the Code during the period covered by the report. The Registrant did not grant any waivers, including implicit waivers, from any provisions of the Code during the period covered by this report. The code of ethics is filed herewith pursuant to Item 10(a)(1), Exhibit 99.CODE ETH.
Item 3. Audit Committee Financial Expert.
The Board of Trustees has determined that Corine Norgaard and Joseph Obermeyer are each audit committee financial experts, as defined in Item 3 of Form N-CSR. Ms. Norgaard and Mr. Obermeyer are both “independent” for purposes of Item 3 of Form N-CSR.
Item 4. Principal Accountant Fees and Services.
(a) Audit Fees: The aggregate fees billed for each of the last two fiscal years for professional services rendered by KPMG LLP (“KPMG”), the principal accountant for the audit of the registrant’s annual financial statements, for services that are normally provided by the accountant in connection with statutory and regulatory filings or engagements for those fiscal years were $197,841 for year ended December 31, 2008 and $109,931 for year ended December 31, 2007.
(b) Audit-Related Fees: The aggregate fees billed in each of the last two fiscal years for assurance and related services by KPMG that are reasonably related to the performance of the audit of the registrant’s financial statements and are not reported under paragraph (a) of this Item were $27,950 for year ended December 31, 2008 and $12,986 for year ended December 31, 2007.
(c) Tax Fees: The aggregate fees billed in each of the last two fiscal years for professional services rendered by KPMG for tax compliance, tax advice, and tax planning were $64,924 in the year ended December 31, 2008 and $24,181 in the year ended December 31, 2007. Such services included review of excise distribution calculations (if applicable), preparation of the Funds’ federal, state and excise tax returns, tax services related to mergers and routine consulting.
(d) All Other Fees: The aggregate fees billed in each of the last two fiscal years for products and services provided by KPMG, other than the services reported in paragraphs (a) through (c) of this Item were $5,000 in the year ended December 31, 2008 and $0 in the year ended December 31, 2007.
(e) (1) Audit Committee Pre-Approval Policies and Procedures
2
AUDIT AND NON-AUDIT SERVICES
PRE-APPROVAL POLICY
I. Statement of Principles
Under the Sarbanes-Oxley Act of 2002 (the “Act”), the Audit Committee of the Board of Directors or Trustees (the “Committee”) of the ING Funds (each a “Fund,” collectively, the “Funds”) set out under Paragraph I on Exhibit A to this Audit and Non-Audit Services Pre-Approval Policy (“Policy”) is responsible for the oversight of the work of the Funds’ independent auditors. As part of its responsibilities, the Committee must pre-approve the audit and non-audit services performed by the auditors in order to assure that the provision of these services does not impair the auditors’ independence from the Funds. The Committee has adopted, and the Board has ratified, this Policy, which sets out the procedures and conditions under which the services of the independent auditors may be pre-approved.
Under Securities and Exchange Commission (“SEC”) rules promulgated in accordance with the Act, the Funds’ may establish two different approaches to pre-approving audit and non-audit services. The Committee may approve services without consideration of specific case-by-case services (“general pre-approval”) or it may pre-approve specific services (“specific pre-approval”). The Committee believes that the combination of these approaches contemplated in this Policy results in an effective and efficient method for pre-approving audit and non-audit services to be performed by the Funds’ independent auditors. Under this Policy, services that are not of a type that may receive general pre-approval require specific pre-approval by the Committee. Any proposed services that exceed pre-approved cost levels or budgeted amounts will also require the Committee’s specific pre-approval.
For both types of approval, the Committee considers whether the subject services are consistent with the SEC’s rules on auditor independence and that such services are compatible with maintaining the auditors’ independence. The Committee also considers whether a particular audit firm is in the best position to provide effective and efficient services to the Funds. Reasons that the auditors are in the best position include the auditors’ familiarity with the Funds’ business, personnel, culture, accounting systems, risk profile, and other factors, and whether the services will enhance the Funds’ ability to manage and control risk or improve audit quality. Such factors will be considered as a whole, with no one factor being determinative.
The appendices attached to this Policy describe the audit, audit-related, tax-related, and other services that have the Committee’s general pre-approval. For any service that has been approved through general pre-approval, the general pre-approval will remain in place for a period 12 months from the date of pre-approval, unless the Committee determines that a different period is appropriate. The Committee will annually review and pre-approve the services that may be provided by the independent auditors without specific pre-approval. The Committee will revise the list of services subject to general pre-approval as appropriate. This Policy does not serve as a delegation to Fund management of the Committee’s duty to pre-approve services performed by the Funds’ independent auditors.
3
II. Audit Services
The annual audit services engagement terms and fees are subject to the Committee’s specific pre-approval. Audit services are those services that are normally provided by auditors in connection with statutory and regulatory filings or engagements or those that generally only independent auditors can reasonably provide. They include the Funds’ annual financial statement audit and procedures that the independent auditors must perform in order to form an opinion on the Funds’ financial statements (e.g., information systems and procedural reviews and testing). The Committee will monitor the audit services engagement and approve any changes in terms, conditions or fees deemed by the Committee to be necessary or appropriate.
The Committee may grant general pre-approval to other audit services, such as statutory audits and services associated with SEC registration statements, periodic reports and other documents filed with the SEC or issued in connection with securities offerings.
The Committee has pre-approved the audit services listed on Appendix A. The Committee must specifically approve all audit services not listed on Appendix A.
III. Audit-related Services
Audit-related services are assurance and related services that are reasonably related to the performance of the audit or the review of the Funds’ financial statements or are traditionally performed by the independent auditors. The Committee believes that the provision of audit-related services will not impair the independent auditors’ independence, and therefore may grant pre-approval to audit-related services. Audit-related services include accounting consultations related to accounting, financial reporting or disclosure matters not classified as “audit services;” assistance with understanding and implementing new accounting and financial reporting guidance from rulemaking authorities; agreed-upon or expanded audit procedures relating to accounting and/or billing records required to respond to or comply with financial, accounting or regulatory reporting matters; and assistance with internal control reporting requirements under Form N-SAR or Form N-CSR.
The Committee has pre-approved the audit-related services listed on Appendix B. The Committee must specifically approve all audit-related services not listed on Appendix B.
IV. Tax Services
The Committee believes the independent auditors can provide tax services to the Funds, including tax compliance, tax planning, and tax advice, without compromising the auditors’ independence. Therefore, the Committee may grant general pre-approval with respect to tax services historically provided by the Funds’ independent auditors that do not, in the Committee’s view, impair auditor independence and that are consistent with the SEC’s rules on auditor independence.
The Committee will not grant pre-approval if the independent auditors initially recommends a transaction the sole business purpose of which is tax avoidance and the tax treatment of which may
4
not be supported in the Internal Revenue Code and related regulations. The Committee may consult outside counsel to determine that tax planning and reporting positions are consistent with this Policy.
The Committee has pre-approved the tax-related services listed on Appendix C. The Committee must specifically approve all tax-related services not listed on Appendix C.
V. Other Services
The Committee believes it may grant approval of non-audit services that are permissible services for independent auditors to a Fund. The Committee has determined to grant general pre-approval to other services that it believes are routine and recurring, do not impair auditor independence, and are consistent with SEC rules on auditor independence.
The Committee has pre-approved the non-audit services listed on Appendix D. The Committee must specifically approve all non-audit services not listed on Appendix D.
A list of the SEC’s prohibited non-audit services is attached to this Policy as Appendix E. The SEC’s rules and relevant guidance should be consulted to determine the precise definitions of these impermissible services and the applicability of exceptions to certain of the SEC’s prohibitions.
VI. Pre-approval of Fee levels and Budgeted Amounts
The Committee will annually establish pre-approval fee levels or budgeted amounts for audit, audit-related, tax and non-audit services to be provided to the Funds by the independent auditors. Any proposed services exceeding these levels or amounts require the Committee’s specific pre-approval. The Committee considers fees for audit and non-audit services when deciding whether to pre-approve services. The Committee may determine, for a pre-approval period of 12 months, the appropriate ratio between the total amount of fees for the Fund’s audit, audit-related, and tax services (including fees for services provided to Fund affiliates that are subject to pre-approval), and the total amount of fees for certain permissible non-audit services for the Fund classified as other services (including any such services provided to Fund affiliates that are subject to pre-approval).
VII. Procedures
Requests or applications for services to be provided by the independent auditors will be submitted to management. If management determines that the services do not fall within those services generally pre-approved by the Committee and set out in the appendices to these procedures, management will submit the services to the Committee or its delagee. Any such submission will include a detailed description of the services to be rendered.
Notwithstanding this paragraph, the Committee will, on quarterly basis, receive from the independent auditors a list of services provided to date by the auditors during Pre-Approval Period.
5
VIII. Delegation
The Committee may delegate pre-approval authority to one or more of the Committee’s members. Any member or members to whom such pre-approval authority is delegated must report any pre-approval decisions, including any pre-approved services, to the Committee at its next scheduled meeting. The Committee will identify any member to whom pre-approval authority is delegated in writing. The member will retain such authority for a period of 12 months from the date of pre-approval unless the Committee determines that a different period is appropriate. The period of delegated authority may be terminated by the Committee or at the option of the member.
IX. Additional Requirements
The Committee will take any measures the Committee deems necessary or appropriate to oversee the work of the independent auditors and to assure the auditors’ independence from the Funds. This may include reviewing a formal written statement from the independent auditors delineating all relationships between the auditors and the Funds, consistent with Independence Standards Board No. 1, and discussing with the auditors their methods and procedures for ensuring independence.
Date last approved:December 18, 2007
6
Appendix A
Pre-Approved Audit Services for the Pre-Approval Period January 1, 2008 through December 31, 2008
Service
| | The Fund(s) | | Fee Range |
| | | | |
Statutory audits or financial audits (including tax services associated with audit services) | | x | | As presented to Audit Committee (1) |
| | | | |
Services associated with SEC registration statements, periodic reports and other documents filed with the SEC or other documents issued in connection with securities offerings (e.g., consents), and assistance in responding to SEC comment letters. | | x | | Not to exceed $9,750 per filing |
| | | | |
Consultations by Fund management with respect to accounting or disclosure treatment of transactions or events and/or the actual or potential effect of final or proposed rules, standards or interpretations by the SEC, Financial Accounting Standards Board, or other regulatory or standard setting bodies. | | x | | Not to exceed $8,000 during the Pre-Approval Period |
(1) For new Funds launched during the Pre-Approval Period, the fee ranges pre-approved will be the same as those for existing Funds, pro-rated in accordance with inception dates as provided in KPMG’s Proposal or any Engagement Letter covering the period at issue. Fees in the Engagement Letter will be controlling.
7
Appendix B
Pre-Approved Audit-Related Services for the Pre-Approval Period January 1, 2008 through December 31, 2008
Service
| | The
Fund(s) | | Fund Affiliates | | Fee Range |
| | | | | | |
Services related to Fund mergers (Excluding tax services – See Appendix C for tax services associated with fund mergers) | | x | | x | | Not to exceed $10,000 per merger |
| | | | | | |
Consultations by Fund management with respect to accounting or disclosure treatment of transactions or events and/or the actual or potential effect of final or proposed rules, standards or interpretations by the SEC, Financial Accounting Standards Board, or other regulatory or standard setting bodies. [Note: Under SEC rules some consultations may be “audit” services and others may be “audit-related” services.] | | x | | | | Not to exceed $5,000 per occurrence during the Pre-Approval Period |
| | | | | | |
Review of the Funds’ semi-annual financial statements | | x | | | | Not to exceed $2,200 per set of financial statements per fund |
| | | | | | |
Reports to regulatory or government agencies related to the annual engagement | | x | | | | Up to $5,000 per occurrence during the Pre-Approval Period |
| | | | | | |
Regulatory compliance assistance | | x | | x | | Not to exceed $5,000 per quarter |
| | | | | | |
Training courses | | | | x | | Not to exceed $2,000 per course |
8
Appendix C
Pre-Approved Tax Services for the Pre-Approval Period January 1, 2008 through December 31, 2008
Service
| | The Fund(s) | | Fund
Affiliates | | Fee Range |
| | | | | | |
Preparation of federal and state income tax returns and federal excise tax returns for the Funds including assistance and review with excise tax distributions. | | x | | | | As presented to Audit Committee(2) |
| | | | | | |
Review of IRC Sections 851(b) and 817(h) diversification testing on a real-time basis | | x | | | | As presented to Audit Committee(2) |
| | | | | | |
Assistance and advice regarding year-end reporting for 1099’s | | x | | | | As presented to Audit Committee(2) |
| | | | | | |
Tax assistance and advice regarding statutory, regulatory or administrative developments | | x | | x | | Not to exceed $5,000 in aggregate for the Funds or for the Funds’ investment adviser during the Pre-Approval Period |
| | | | | | |
Tax training courses | | | | x | | Not to exceed $2,000 per course during the Pre-Approval Period |
(2) For new Funds launched during the Pre-Approval Period, the fee ranges pre-approved will be the same as those for existing Funds, as provided in KPMG’s Proposal or any Engagement Letter covering the period at issue. Fees in the Engagement Letter will be controlling.
9
Service
| | The Fund(s) | | Fund
Affiliates | | Fee Range |
| | | | | | |
Tax services associated with Fund mergers | | x | | x | | Not to exceed $4,000 per fund per merger during the Pre-Approval Period |
| | | | | | |
Other tax-related assistance and consultation, including, without limitation, assistance in evaluating derivative financial instruments and international tax issues, qualification and distribution issues, and similar routine tax consultations | | x | | | | Not to exceed $50,000 during the Pre-Approval Period |
10
Appendix D
Pre-Approved Other Services for the Pre-Approval Period January 1, 2008 through December 31, 2008
Service
| | The Fund(s) | | Fund Affiliates | | Fee Range |
| | | | | | |
Agreed-upon procedures for Class B share 12b-1 programs | | | | x | | Not to exceed $50,000 during the Pre-Approval Period |
| | | | | | |
Security counts performed pursuant to Rule 17f-2 of the 1940 Act (i.e., counts for Funds holding securities with affiliated sub-custodians) (Cost to be split 50% the funds and 50% ING Investments, LLC) | | x | | x | | Not to exceed $5,000 per Fund during the Pre-Approval Period |
11
Appendix E
Prohibited Non-Audit Services
Dated: 2008
· Bookkeeping or other services related to the accounting records or financial statements of the Funds
· Financial information systems design and implementation
· Appraisal or valuation services, fairness opinions, or contribution-in-kind reports
· Actuarial services
· Internal audit outsourcing services
· Management functions
· Human resources
· Broker-dealer, investment adviser, or investment banking services
· Legal services
· Expert services unrelated to the audit
· Any other service that the Public Company Accounting Oversight Board determines, by regulation, is impermissible
12
EXHIBIT A
ING VP BALANCED PORTFOLIO, INC.
ING STRATEGIC ALLOCATION PORTFOLIOS, INC.
ING GET FUND
ING VP INTERMEDIATE BOND PORTFOLIO
ING VP MONEY MARKET PORTFOLIO
ING VARIABLE FUNDS
ING VARIABLE PORTFOLIOS, INC.
ING SERIES FUND, INC.
13
(e) (2) Percentage of services referred to in 4(b) — (4)(d) that were approved by the audit committee
100% of the services were approved by the audit committee.
(f) Percentage of hours expended attributable to work performed by other than full time employees of KPMG if greater than 50%.
Not applicable.
(g) Non-Audit Fees: The non-audit fees billed by the registrant’s accountant for services rendered to the registrant, and rendered to the registrant’s investment adviser, and any entity controlling, controlled by, or under common control with the adviser that provides ongoing services to the registrant for each of the last two fiscal years of the registrant were $1,826,535 for year ended December 31, 2008 and $239,281 for year ended December 31, 2007.
(h) Principal Accountants Independence: The Registrant’s Audit committee has considered whether the provision of non-audit services that were rendered to the registrant’s investment adviser and any entity controlling, controlled by, or under common control with the investment adviser that provides ongoing services to the registrant that were not pre-approved pursuant to Rule 2-01(c)(7)(ii) of Regulation S-X is compatible with maintaining KPMG’s independence.
Item 5. Audit Committee of Listed Registrants.
Not applicable.
Item 6. Schedule of Investments
Schedule is included as part of the report to shareholders filed under Item 1 of this Form.
Item 7. Disclosure of Proxy Voting Policies and Procedures for Closed-End Management Investment Companies.
Not applicable.
Item 8. Portfolio Managers of Closed-End Management Investment Companies.
Not applicable.
Item 9. Purchases of Equity Securities by Closed-End Management Investment Company and Affiliated Purchasers
Not applicable.
Item 10. Submission of Matters to a Vote of Security Holders.
The Nominating Committee operates pursuant to a Charter approved by the Board. The primary purpose of the Nominating Committee is to consider, evaluate and make recommendations to the Board with respect to the nomination and selection of Independent Trustees. In evaluating candidates, the Nominating Committee may consider a variety of factors, but specific qualifications of candidates for Board membership will be based on the needs of the Board at the time of nomination.
The Nominating Committee is willing to consider nominations received from shareholders and shall assess shareholder nominees in the same manner as it reviews nominees it identifies. A shareholder nominee for director should be submitted in writing to the Fund’s Secretary. Any such shareholder nomination should include sufficient background information concerning the candidate and should be received in a timely manner. At a minimum, the following information as to each individual proposed for nomination as director should be included: the individual’s written consent to be named in the proxy statement as a nominee (if nominated) and to serve as a director (if elected), and all information relating to such individual that is required to be disclosed in a solicitation of proxies for election of directors, or is otherwise required, in each case under applicable federal securities laws, rules and regulations.
The Secretary shall submit all nominations received in a timely manner to the Nominating Committee. To be timely, any such submission must be delivered to the Fund’s Secretary not earlier than the 90th day prior to such meeting and not later than the close of business on the later of the 60th day prior to such meeting or the 10th day following the day on which public announcement of the date of the meeting is first made, by either disclosure in a press release or in a document publicly filed by the Fund with the SEC.
In evaluating a candidate for the position of Independent Trustee, including any candidate recommended by shareholders of the Fund, the Nominating Committee shall consider the following: (i) the candidate’s knowledge in matters relating to the mutual fund industry; (ii) any experience possessed by the candidate as a director or senior officer of other public companies; (iii) the candidate’s educational background, reputation for high ethical standards and professional integrity; (iv) any specific financial, technical or other expertise possessed by the candidate, and the extent to which such expertise would complement the Board’s existing mix of skills, core competencies and qualifications; (v) the candidate’s perceived ability to contribute to the ongoing functions of the Board, including the candidate’s ability and commitment to attend meetings regularly and work collaboratively with other members of the Board; (vi) the candidate’s ability to qualify as an Independent Trustee for purposes of the 1940 Act; and (vii) such other factors as the Committee determines to be relevant in light of the existing composition of the Board and any anticipated vacancies. Prior to making a final recommendation to the Board, the Committee shall conduct personal interviews with those candidates it concludes are the most qualified candidates.
14
Item 11. Controls and Procedures.
(a) Based on our evaluation conducted within 90 days of the filing date, hereof, the design and operation of the registrant’s disclosure controls and procedures are effective to ensure that material information relating to the registrant is made known to the certifying officers by others within the appropriate entities, particularly during the period in which Forms N-CSR are being prepared, and the registrant’s disclosure controls and procedures allow timely preparation and review of the information for the registrant’s Form N-CSR and the officer certifications of such Form N-CSR.
(b) There were no significant changes in the registrant’s internal controls that occurred during the second fiscal quarter of the period covered by this report that has materially affected, or is reasonably likely to materially affect, the registrant’s internal control over financial reporting.
Item 12. Exhibits.
(a)(1) | | Code of Ethics pursuant to Item 2 of Form N-CSR is filed and attached hereto as EX-99.CODE ETH. |
| | |
(a)(2) | | A separate certification for each principal executive officer and principal financial officer of the registrant as required by Rule 30a-2 under the Act (17 CFR 270.30a-2) is attached hereto as EX-99.CERT. |
| | |
(b) | | The officer certifications required by Section 906 of the Sarbanes-Oxley Act of 2002 are attached hereto as EX-99.906CERT |
| | |
(3) | | Not applicable. |
15
SIGNATURES
Pursuant to the requirements of the Securities Exchange Act of 1934 and the Investment Company Act of 1940, the registrant has duly caused this report to be signed on its behalf by the undersigned, thereunto duly authorized.
(Registrant): ING VP Variable Portfolios, Inc.
By | /s/ Shaun P. Mathews | |
| Shaun P. Mathews | |
| President and Chief Executive Officer | |
Date: March 6, 2009
Pursuant to the requirements of the Securities Exchange Act of 1934 and the Investment Company Act of 1940, this report has been signed below by the following persons on behalf of the registrant and in the capacities and on the dates indicated.
By | /s/ Shaun P. Mathews | |
| Shaun P. Mathews | |
| President and Chief Executive Officer | |
Date: March 6, 2009
By | /s/ Todd Modic | |
| Todd Modic | |
| Senior Vice President and Chief Financial Officer | |
Date: March 6, 2009
16